Embed Size (px)
Citation preview


2
Table of Contents
List of Acronyms and Terms .......................................................................................................................................5Acknowledgements ......................................................................................................................................................6Introduction ....................................................................................................................................................................7
i. Purpose of Study .............................................................................................................................................7ii. Scope of Work .................................................................................................................................................7
Executive Summary .....................................................................................................................................................8i. Overview ...........................................................................................................................................................8ii. Eastern Oyster Summary ............................................................................................................................10iii. Blue Mussel Summary .............................................................................................................................11iv. Sea Scallop Summary .............................................................................................................................12v. Opportunity Summary and Strategic Implications ...................................................................................13
Eastern Oyster ............................................................................................................................................................14vi. Species Overview .....................................................................................................................................14vii. Market Size and Growth ..........................................................................................................................15viii. Sourcing .....................................................................................................................................................16ix. Seasonality ................................................................................................................................................20x. Value chain ....................................................................................................................................................23xi. Growth Projections - National .................................................................................................................24xii. Growth Projections - Maine .....................................................................................................................30
Blue Mussel .................................................................................................................................................................35i. Species Overview .........................................................................................................................................35ii. Market Size and Growth ..............................................................................................................................35iii. Impact of Canadian Imports on Maine ..................................................................................................41iv. Whole Versus Shucked / Further Processed Formats .......................................................................42v. Seasonality .....................................................................................................................................................42vi. Growth Projections - National .................................................................................................................42vii. Growth Projections - Maine .....................................................................................................................49
Sea Scallop .................................................................................................................................................................53i. Species Overview .........................................................................................................................................53ii. Market Size and Growth ..............................................................................................................................53iii. Imports – All Formats ...............................................................................................................................54iv. Seasonality ................................................................................................................................................56v. Quota Projections ..........................................................................................................................................56vi. Growth Projections - National .................................................................................................................56vii. Growth Projections - Maine .....................................................................................................................61
Total Economic Benefit of Maine’s Farmed Oyster and Mussel Sectors ..........................................................64Opportunity Summary and Strategic Implications .................................................................................................65

3
List of Figures Figure 1. Current and projected new acreage requirements to meet projected shellfish growth. ..................9Figure 2. Volume % change vs. prior year in pounds for 2008 – 2015 ......................................................16Figure 3. 2015 U.S. Oyster in number of pieces ..........................................................................................16Figure 4. 2015 Oyster landed value in $USD (000) ....................................................................................17Figure 5. Oyster format shares by region in 2015 ......................................................................................18Figure 6. Oyster volumes by region (000 pieces) in 2015 ..........................................................................18Figure 7. Whole oyster value ($000) in 2015 .............................................................................................19Figure 8. U.S. restaurant seasonality indices: (2011 – 2015) .....................................................................21Figure 9. Top 10 U.S. metropolitan areas within 500 and 1,000 miles of Portland Maine ........................22Figure 10. Top 11 – 20 U.S. metropolitan areas within 2,000 miles of Portland Maine. ...........................22Figure 11. Oyster Value Chain ...................................................................................................................23Figure 12. Projected U.S. oyster supply and demand (000 pieces) ............................................................26Figure 13. Projected U.S. oyster volume growth (000 pieces) ...................................................................26Figure 14. Projected average total U.S. oyster price per piece (ex-vessel) ................................................29Figure 15. Projected oyster total U.S. landed value ($USD). .....................................................................29Figure 16. Projected Maine oyster volume growth (000 pieces) ................................................................31Figure 17. Projected Average Maine Price per Oyster (Ex Vessel Value) .................................................32Figure 18. Projected Maine total landed value ($USD - 000) ....................................................................33Figure 19. Maine historical oyster growth—DMR .....................................................................................33Figure 20. Maine historical oyster growth—DMR and ACCSP. ...............................................................34Figure 21. US Live mussel supply (wild & farmed) from 2008 – 2015 (000 lbs). .....................................37Figure 22. US live mussel supply (wild & farmed) volume (000 lbs.) and shares in 2015 .........................38Figure 23. Maine live mussel farmed vs. wild volume trends 2011 – 2015 (000 lbs.) ...............................40Figure 24. Mussel imports (lbs.) in 2015. ....................................................................................................40Figure 25. Live mussel supply and demand projections for the total U.S. marketplace. ...........................44Figure 26. Projected live mussel volume growth (000 lbs.) .......................................................................45Figure 27. Projected farmed mussel volume growth in US Marketplace (000 lbs.) ...................................45Figure 28. Projected average U.S. mussel price per pound (ex-vessel) ......................................................47Figure 29. Projected total U.S. marketplace live mussel landed value (000 $USD). .................................48Figure 30. Projected growth volume of Maine farmed mussels (000 lbs.) 2015 - 2030 ............................49Figure 31. Projected growth volume of Maine farmed mussels – Rope-grown vs. bottom-culture ...........50Figure 32. Projected average Maine mussel price per pound (ex-vessel value) .........................................51Figure 33. Projected total landed value of Maine farmed mussels ($USD) 2015 - 2030. ..........................51Figure 34. Projected total Maine mussel revenue 2015 - 2030. (best estimate scenario) ...........................52Figure 35. Projected Maine farmed mussel revenue 2015 - 2030 (best estimate scenario) ........................52Figure 36. US scallop supply volume trends in whole pounds (000) 2008 - 2015 .....................................54Figure 37. US marketplace scallop imports for 2015 in meat pounds (000) ..............................................55Figure 38. Value of imported scallops in the US marketplace for 2015 (000$) .........................................55Figure 39. US marketplace scallop supply and demand projections 2015 – 2030 .....................................58Figure 40. Projected domestic-sourced scallop volume growth in meat pounds (000) 2015 - 2030 ..........58Figure 41. Projected U.S. scallop price per meat pound (ex-vessel value) 2015 - 2030. ...........................60Figure 42. Projected scallop total landed value ($USD) 2015 - 2030 ........................................................60Figure 43. Projected Maine scallop volume growth in meat lbs. (000) 2015 - 2030 ..................................62Figure 44. Projected average Maine scallop price per meat pound (ex-vessel) ..........................................62Figure 45. Projected Maine scallop total landed value ($USD) 2015 - 2030 .............................................63

4
List of Tables Table 1. New acreage requirements to meet projected shellfish growth. ......................................................9 Table 2. 2015 Total U.S. Oyster Supply .....................................................................................................15 Table 3. Oyster whole & shucked regional dynamics in 2015 ....................................................................17 Table 4. Northeast total oyster (whole and shucked) harvest in 2015 ........................................................19 Table 5. Northeast whole format oyster harvest in 2015 ............................................................................20 Table 6. Value Chain definitions. ................................................................................................................24 Table 7. US oyster supply growth projections ............................................................................................25 Table 8. US oyster supply growth assumptions ..........................................................................................25 Table 9. Oyster regional volume growth projections (pieces). ...................................................................27 Table 10. Historical regression analysis output: meat volume vs. pricing. Total U.S. ...............................28 Table 11. Future Regression Analysis Output: Projected Pieces vs. Pricing. Total U.S. ..........................30 Table 12. Total U.S. mussel supply in 2015. ...............................................................................................36 Table 13. Mussel Regional Supply Dynamics (Wild and Farmed) – 2015. ...............................................37 Table 14. Farmed vs. wild mussel volumes in 2015 (000 lbs.) ..................................................................38 Table 15. Farmed vs. wild mussel volumes and values in 2015. ................................................................39 Table 16. Maine volume estimate (000 lbs.) for rope-grown, bottom culture, and wild mussels in 2015. 39 Table 17. Maine mussel pricing dynamics in 2015. ...................................................................................39 Table 18. 2015 US mussel marketplace origin summary data ....................................................................41 Table 19. Estimated Canadian mussel regional distribution within the US marketplace (2015) ...............41 Table 20. Mussel regional supply growth projections. ...............................................................................43 Table 21. Mussel supply growth assumptions ............................................................................................44 Table 22. Projected volume growth of U.S. farmed mussel supply (000 lbs.) ...........................................46 Table 23. Historical mussel regression analysis: meat pounds vs. pricing .................................................47 Table 24. Mussel future regression analysis: projected pounds vs. pricing. Total U.S. .............................48 Table 25. Scallop regional supply dynamics in 2015 .................................................................................54 Table 26. Scallop Regional Growth Rate Projections. ...............................................................................57 Table 27. Scallop Supply Growth Assumptions .........................................................................................57 Table 28. Regional scallop growth projections ...........................................................................................59 Table 29. Historical scallop regression analysis output, meat lbs. vs. pricing, 2005 – 2015. ....................59 Table 30. Future scallop regression analysis output: projected pounds vs pricing for total U.S. ................61 Table 31. Estimated Maine farmed shellfish economic benefit ..................................................................64 Table 32: Projected Maine farmed shellfish volume & revenue potential .................................................65

5
LIST OF ACRONYMS AND TERMS
ACCSP = Atlantic Coastal Cooperative Statistics Program Bottom Culture = Culture technique where mussels are grown directly on the seabed Dayboat Scallop = Wild-caught scallops that were harvested in Maine state waters and landed within a 24-hour period. DMR = Maine Department of Marine Resources ECSGA = East Coast Shellfish Growers Association Farmed = Grown on a marine aquaculture farm Gulf = Gulf of Mexico MAA = The Maine Aquaculture Association Mussel = Blue mussel (Mytilus edulis) unless noted otherwise. NMFS = National Marine Fisheries Service Oyster = Eastern oyster (Crassostrea virginica) unless noted otherwise. Half shell oyster = Live oyster that has been shucked for raw consumption. Planning Horizon = 15-year timeline of this analysis, from 2015 – 2030. Rope Grown = Culture technique where mussels are grown on ropes that are suspended in the water column. Scallop = Sea scallop (Placopecten magellanicus) unless noted otherwise. Shucked oyster = Oyster meat that has been removed from the shell. Spat on Shell = Culture technique where several baby oysters (called spat) are grown on an old oyster shell resulting in a clump of several oysters. THG = The Hale Group Whole oyster = Live oyster in its shell. Wild = Caught in a wild fishery.

6
ACKNOWLEDGEMENTS The Maine Farmed Shellfish Market Analysis was a true team effort that would not have been possible without help from the following organizations and individuals. The Gulf of Maine Research Institute (GMRI) is particularly grateful to the Sudbury Foundation for the grant that funded this project. We thank The Hale Group for its high-quality research and analysis, strategic insight, and responsiveness to GMRI and industry advisory committee feedback. GMRI is deeply appreciative for the hard work of the following team of advisors, whose guidance and oversight ensured the market analysis asked the right questions, utilized the best available data, and accounted for key nuances with aquaculture data and shellfish markets. The importance of their contribution to this effort cannot be overstated.
• Sebastian Belle (Maine Aquaculture Association) • Nick Branchina (Branchina.Maine) • Dick Clime (Coastal Enterprises, Incorporated) • Eric Horne (Flying Point Oyster Farm) • Bill Mook (Mook Sea Farm) • Gary Moretti (Bangs Island Mussels) • Dana Morse (Maine Sea Grant) • Barb Scully (Glidden Point Oyster Sea Farm) • Peter Stocks (Calendar Island Mussels) • Briana Warner and Nick Battista (The Island Institute) • Fiona de Koning (Hollander & de Koning Mussels)
We thank the Maine Department of Marine Resources, East Coast Shellfish Growers Association, Atlantic Coastal Cooperative Statistics Program, and National Marine Fisheries Service for providing data. Finally, we appreciate the dozens of stakeholders who participated in one-on-one interviews with The Hale Group, which enabled us to understand the nuances of the data and analysis.

7
INTRODUCTION
i. Purpose of Study There is great enthusiasm for expanding aquaculture in Maine as an economic opportunity for coastal communities. Yet very little is known about existing and potential markets for the products, particularly farmed shellfish, that a growing industry would produce. GMRI embarked on this project to produce a data-driven, quantitative market assessment that informs industry leaders and business owners about the potential scale and scope of markets for farmed shellfish and to facilitate strategic growth in the industry.
ii. Scope of Work This report provides The Hale Group’s market opportunity analysis for Maine farmed shellfish, with oversight from GMRI and the industry advisory committee. This initiative had the following objectives:
1. Conduct a comprehensive market analysis of the shellfish aquaculture industry, including supply and demand elements for Eastern oysters (Crassostrea virginica), blue mussels (Mytilus edulis) and sea scallops (Placopecten magellanicus), with particular emphasis on the implications for Maine’s aquaculture industry.
2. Evaluate the scale and scope of the opportunity for Maine’s aquaculture industry participants.
3. Recommend strategies that will enable Maine to build its aquaculture industry while
reducing internal Maine competition.
4. Incorporate a planning horizon of 15 years, until 2030, to provide long-range context to support capital investment decisions while balancing the diminished accuracy of data projections and research insights beyond 10 – 15 years.

8
EXECUTIVE SUMMARY
i. Overview Maine is uniquely positioned to leverage and expand its aquaculture industry to capture a greater share of the shellfish marketplace for oysters, mussels and scallops. Maine’s competitive advantages include:
• High quality products, • Available space for aquaculture expansion, • Strong consumer brand affinity to Maine products, • Strategic location near distribution centers, • Proximity to large population centers with high shellfish consumption (the Northeast
region consumes approximately 20% of all U.S. shellfish), and • Experience with, and commitment to, best aquaculture practices.
In 2015, the landed value of oysters, mussels, and scallops in the U.S. was roughly $700 million. Maine accounted for approximately 4% of that total, delivering $24 million to harvesters. Of the Maine cultured shellfish total, aquaculture accounted for 25%, producing a landed value of approximately $6.5 million. The Hale Group conducted a preliminary total economic benefit analysis (incorporating supply chain value add and economic multiplier) to the $6.5 million landed value and estimated that Maine’s existing shellfish aquaculture industry may generate a total economic benefit of over $15 million. Maine’s current farmed shellfish capacity, at approximately 600 leased acres with another 75+ acres in the lease application process, is not sufficient to meet the projected demand over the planning horizon. Based on current farmed shellfish yields per acre, the Maine shellfish aquaculture industry will need to add an additional 550–600 acres of capacity by 2030. Oyster production would represent roughly 480 of those new acres, while mussel production would account for 90 additional acres if new farms use rope cultivation techniques (Table 1). This equates to an average of 35–40 total new acres annually through 2030, including current lease applications. Based on growth requirements to meet the projected demand outlined in this report, farmed oysters and mussels would likely utilize 0.1% of Maine’s state waters by 2030 (Figure 1). Even if the majority of the incremental mussel acreage utilizes uses the more space-intensive bottom culture technique, the projected acreage requirement is no more than 0.3%.

9
Table 1. New acreage requirements to meet projected shellfish growth.
Figure 1. Current and projected new acreage requirements to meet projected shellfish growth. In order to capitalize on the opportunity, Maine’s aquaculture industry will need to evaluate and prioritize its opportunities, determine how best to leverage the Maine brand’s strong consumer appeal to create demand, and identify where and how it wishes to compete to build its market presence.
¹ Best estimate scenario: Assumes incremental Mussel capacity is primarily Rope Grown technique at 100,000 lbs. per acre (3 rafts at 30,000+ lbs. per raft)
² At current Mussel yield average of 3,650 lbs. / acre (approximately 60% Bottom Culture)
Source: The Hale Group research, Maine DMR
Current Projected 2030
Volume (000)
Lease Acres
Volume (000)
Best Est.
Acres ¹
High Est.
Acres ²Mussels 1,350 lbs. 315 10,500 lbs. 405 2,815
Oysters 7,104 pc. 293 18,629 pc. 770 770
Total 608 1,175 3,585
% ME Shore Line Utilization 0.06% 0.1% 0.3%

10
ii. Eastern Oyster Summary Maine is positioned to be a growth leader in farmed oyster production, but needs to plan for long-term price moderations as supply increases over the next 3–5 years. Currently, Maine oysters command a price premium due to the high-quality perception of cold water oysters. To realize its full potential, the sector will need to employ the following strategies to moderate price declines:
• Build brand equity to help differentiate Maine oysters from the rest of the supply in order to justify a price premium
• Pursue operational efficiencies • Expand distribution networks • Invest in winter harvesting capabilities.
The vast majority of U.S. oysters are sourced via aquaculture (~95%). Approximately 900 million oysters are consumed annually in the U.S., of which approximately 60% are whole (consumed in half-shell format) and 40% are shucked. The overall U.S. oyster supply has experienced erratic growth performance in recent years as strong capacity in the Northeast and Mid-Atlantic have been offset by declines in the Gulf of Mexico and Southeast regions. Consensus is that consumer demand remains greater than supply, so positive growth trends are expected to continue in regions with capacity — particularly along the Eastern Seaboard from Virginia to Maine. There is significant variability in the value of oyster harvest by region. The Northeast commands the highest relative premium among U.S. Regions, driven by the perceived higher quality of their oysters, which are sold primarily in the whole format. Maine accounted for approximately 14% (7.1 MM) of the Northeast’s total oyster supply in 2015. Within the Northeast, Maine harvesters receive a premium for their oysters with the Hale Group estimating an average price of $0.58 per oyster. Only Rhode Island growers, by selling their oysters through the Ocean State Shellfish Cooperative, receive a higher average price ($0.68/piece). Many Maine oyster farmers report a drop-off in demand in late-fall, when orders decrease significantly or stop altogether. Research uncovered that the “Fall Drop Off” is a local, rather than national, phenomenon. Local demand declines when the summer Maine tourist season ends, and Northeast supply increases as some growers bring inventory to market in advance of the winter ice-over. National consumer demand for oysters mirrors restaurant seasonality cycles. Low demand periods (still within 10% of average sales) occur in January and February, with another small decline in September due to the “back-to-school” season. These dynamics underscore the need for Maine’s oyster farmers to expand distribution networks to the major metropolitan areas in the Northeast and beyond. Portland is within 500 miles of four of the Top 10 metropolitan areas (Boston, New York, Philadelphia, & Baltimore/Washington) in the U.S.; within 1,000 miles of six of the Top 10 (+Chicago & Atlanta); within 2,000 miles of eleven of the top 20 (+Detroit, Orlando, Tampa, Minnesota, Denver); within 300 miles of Montreal; and 700 miles of Toronto Canada. All of these markets have significant numbers of restaurants that serve shellfish.

11
Maine is projected to be a growth leader in oyster supply, driven by increased capacity and continued demand for high-quality, cold water whole oysters. Best estimates find that Maine capacity will almost triple over the 15-year planning horizon, generating an incremental 10+ million oysters. Pricing for Maine oysters will moderate as supply grows — mirroring projected nationwide trends as total U.S. supply grows — but is predicted to remain relatively high. Maine’s reliance on whole (half-shell) formats should provide some insulation from the anticipated growth in lower cost Gulf and Mid-Atlantic oysters, but the sector must plan for this scenario over the next decade.
iii. Blue Mussel Summary Maine is positioned to be a growth leader in farmed mussel production, given its available capacity for growth, high quality growing environment, brand equity (cited repeatedly by supply chain participants across the country during the research), and opportunity to displace Canadian product in close-proximity markets. Live mussels are an approximately $70 million ex-vessel value industry in the U.S. The U.S. live mussel marketplace is sourced primarily from the Northeast (37%), the Pacific Northwest (20%) and Canada (43%). Maine and Massachusetts are the major Northeast producers. Research indicates that aquaculture accounts for approximately 15% of the U.S. supply and the majority of the Canadian supply. The Hale Group research indicates that aquaculture accounts for approximately 9% of Maine’s volume (1.35MM lbs.). The U.S. live mussel supply, including Canadian imports, has grown at approximately a +4% annual rate since the 2008 recession, driven largely by Massachusetts, who made additional wild volume available in 2015. Canadian supply has increased moderately, although Canadian mussel exports to the U.S. have declined in recent years due to the harsh 2014-2015 winter. Maine’s mussel supply has remained relatively stable in recent years after a decline in the early 2000s. Farmed mussels command a price premium in the marketplace, driven by their higher meat content and perceived higher quality (cleaner, better shell structure, etc.). Within Maine aquaculture, mussels are cultured using rope-grown or bottom culture techniques. Rope grown command the highest price ($2.10/lb) compared to bottom culture ($1.55/lb) or wild ($0.90/lb). Given its close proximity to New England, PEI mussels are a significant competitor for Maine mussels, and have been viewed as the standard for a long time. Canadian mussels are distributed across the U.S. with penetration highest in the northern half of the country. Over-crowding in PEI mussel areas as well as growing recognition of Northeast mussels’ quality, have diminished PEI’s quality perception and image among some customers — although PEI mussels remain the industry standard for many. The estimated 9-million pounds of PEI mussels consumed annually in the Northeast and Mid-Atlantic represent an opportunity for Maine mussels to further penetrate close proximity market. Wholesalers and foodservice operators report minimal seasonality with mussel demand or supply. Seasonality in Maine is tied to the ability of a sea farmers to access their product in

12
winter, rather than a demand-driven issue. In general, consumer demand is at its peak during the summer months and holidays. The total live mussel marketplace is projected to continue to expand at a modest pace, with moderate growth from imports, and is expected to approach 80 million whole pounds by the end of the planning horizon. Northeast mussels, including Maine, are projected to grow faster than the industry average given their high quality perception and expected capacity increases. Overall mussel demand is projected to continue to grow modestly over the planning horizon. While overall species growth may be moderate, buyers believe that there is significant growth potential for high quality, premium mussels. Supply and demand projections indicate that total U.S. mussel supply will marginally outpace demand over the planning horizon, with farmed mussels accounting for almost 90% of the 16 million pound projected total growth, and Maine accounting for more than ½ of the farmed mussel volume growth. Over the planning horizon, it is projected that the Northeast farmed mussels will capture approximately 20 share points from Canada and the Pac NW. Seizing on the opportunity to capture Canadian market share will require Maine’s mussel farmers to:
• Ensure consistency of supply from Maine • Define the value proposition and branding strategy, as Maine harvesters will be
competing against a well-entrenched competitor • Consider the potential impact of exchange rate and subsidy levels on pricing.
Growth projections estimate that Maine’s farmed mussel industry will grow approximately six-fold over the planning horizon, from 1.35MM in 2015 to 10.5MM in 2030, delivering approximately $20 million in landed value to the state. During this time, the overall market is expected to expand modestly, while wild supply is constrained, and Maine farmed mussels compete with PEI for market share. Pricing is estimated to moderate by approximately -10% by 2030 under this scenario.
iv. Sea Scallop Summary Maine is particularly well-suited for scallop aquaculture growth, given the significant room for new sites and existing perception that Maine’s wild scallops are high quality. Achieving sufficient scale will require Maine to invest in development of scallop aquaculture capabilities. The total U.S. scallop marketplace is estimated to be approximately 250 million whole pounds and 30 million meat pounds, with a landed value of approximately $380 million. In the U.S., the majority of scallops are sourced from Massachusetts and New Jersey. Total U.S. scallop supply has declined recently, as federal quotas have restricted offshore access and larger dayboat scallops are reportedly becoming scarcer. Maine accounts for less than 2% of U.S. scallop volume, yet commands the highest average price per meat pound. According to the Maine DMR, the vast majority (90+) of Maine scallops are from inshore fisheries harvested via day-boat operations.

13
Projections estimate that domestic supply will lag demand by roughly 50% over the planning horizon under all growth scenarios. Demand above what the U.S. can produce is being met by typically smaller, frozen scallops that are imported from Asia and South America. Current imports totaling 40-million pounds with a value of $350 MM (nearly equals to U.S.-produced volume) represent an opportunity for Maine. Demand for scallops remains strong year-round, while supply tends to peak during the early periods of the harvest season: Maine (December – April), Massachusetts (November – March), and Federal (March – February). Research suggests that there is an opportunity for farmed scallops to support the wild harvest by providing year-round inventory after wild scallop quotas have been diminished. Given the strong demand for Maine’s inshore scallops and accompanying high prices, this suggests that Maine farmed scallops could be a viable source for high-quality scallops during lulls in the wild fishery. Over the 15-year planning horizon, overall U.S. scallop supply is projected to remain flat to slightly down. Best estimate growth projections assumed development of an aquaculture infrastructure that enables Maine to double its overall scallop volume (wild & farmed) over the horizon from 453,000 to 1.18 MM lbs. by 2030. Under this assumed growth, pricing scenarios find that overall scallop pricing will decline moderately over the planning horizon, but Maine scallops will continue to command a price premium given their high perceived quality. Despite strong consumer demand and shrinking supply, aquaculture initiatives have not yet gained scale in the scallop market. There is broad consensus that the scallop market is well suited for aquaculture. There is also recognition that farmed scallop techniques need to be tested and optimized before sufficient scale can be achieved.
v. Opportunity Summary and Strategic Implications The Farmed Shellfish Market Analysis identifies a significant opportunity for Maine to expand its farmed shellfish industry. Based on the “best estimate” projections, the Maine farmed shellfish industry could achieve landed revenues in excess of $30 million by 2030. Achieving the business potential will require:
• Expansion of leased shellfish acreage from 608 to approximately 1,200 acres • Development of efficient distribution capabilities beyond New England to achieve scale
and capture year-round demand for farmed shellfish in the top U.S. markets • Investment in scallop aquaculture infrastructure and cold-water shellfish harvesting
capabilities to extend the shellfish seasons • Leveraging Maine’s brand equity, either through “from Maine” positioning, or by
developing specific farm/regional brands linked to Maine to communicate high quality and differentiate Maine’s products from competitors’
• A continual focus on achieving operational efficiencies, as pricing is projected to moderate over the planning horizon

14
EASTERN OYSTER
(Crassostrea virginica)
i. Species Overview The vast majority of U.S. oysters are sourced via aquaculture from numerous coastal regions across the United States. Aquaculture makes up an estimated 95%+ of all oyster production in the U.S. In total, approximately 900 million oysters are consumed annually in the U.S. Of this supply, an estimated 525+ million, or approximately 60% are whole (half-shell) and the remaining 370+ million are shucked. Given that the vast majority of Northeast oysters are sold whole for the half-shell market, this report evaluates whole versus shucked dynamics. Given the strong consumer demand for oysters, supported by a surge in oyster bars and oyster menu listings, consumer demand is projected to continue to outpace supply over the next 3 – 5 years, and will remain strong over the 15-year planning horizon. At the same time, overall supply will remain constrained as the Gulf of Mexico (Gulf) struggles to reestablish its oyster infrastructure in the aftermath of the BP spill and decreasing volume trends prior to the spill. The East Coast supply, particularly for whole oysters, is projected to continue to grow as additional capacity is added from the Mid-Atlantic to the Northeast. Given these dynamics, pricing is expected to moderate slightly, but remain at relatively high levels over the next 3 – 5 years as capacity lags demand. Longer term price projection models indicate that pricing will continue to soften moderately as capacity begins to catch up with demand. Maine oysters are considered to be high quality and the most expensive. Some buyers / customers feel that Maine oysters are worth the premium, while others caution that there are numerous other high quality oyster producers with lower prices (Chesapeake, Long Island Sound, etc.). While the Mid-Atlantic and Southern regions may offer lower prices, numerous buyers stated that they will not purchase any oysters south of Virginia due to quality concerns, including more brittle shells, lower quality meat and lack of flavor. In the summer, buyers tend to migrate north with their purchases, as the spawning seasons and Vibrio risks have less impact on the cold water oysters. The vast majority of oyster consumption is at restaurants, which account for over 80% of total volume. Within restaurants, there is a trend toward smaller, cocktail sized oysters (<3”), which creates an opportunity for aquaculture operations to harvest their oysters sooner. Note: Some states stipulate a minimum size limit for harvested and imported oysters. While the Chesapeake area has rebounded; it could take years for the Gulf to regain momentum and there is uncertainty whether the Gulf will return to the production levels of the early 2000’s.

15
There is some concern that, as warmer water locations increase supply, the market may be inundated with a large inventory of lower quality, cheaper oysters. Maine oyster growers should be somewhat insulated from this dynamic, as over 90% of Northeast oysters are sold whole for consumption on the half-shell, and Northeast oysters are perceived to be the quality leaders. This is particularly the case if oyster farmers can extend the harvesting season via investment in indoor wet storage facilities, etc. Additionally, the consumer movement to smaller sized oysters should enable Maine oyster farmers to bring their oysters to market faster.
ii. Market Size and Growth The total U.S. supply of oysters is estimated to exceed 900 million oysters, and represents a landed value of approximately $230 million (Table 2). The vast majority of whole and shucked oysters consumed in the U.S. are sourced domestically. Canadian imports are primarily whole oysters, and their value represents the average price per unit entering the U.S., not ex-vessel. Table 2. 2015 Total U.S. Oyster Supply
The U.S. oyster market supply has experienced erratic growth performance in recent years as strong capacity gains in the Northeast and Mid-Atlantic have been offset by declines in the Gulf and Southeast regions (Figure 2). In total, overall U.S. oyster supply has been flat since 2008. Consensus is that consumer demand remains greater than supply, so positive growth trends are expected to continue in regions with capacity; particularly along the Eastern Seaboard from Virginia to Maine.
Source Volume - Pieces (000) Value - $USD (000)United States 895,320 $214,740Canada 20,192 $18,133Total 915,512 $232,873Source: The Hale Group research, ECSGA, Statistics Canada
16
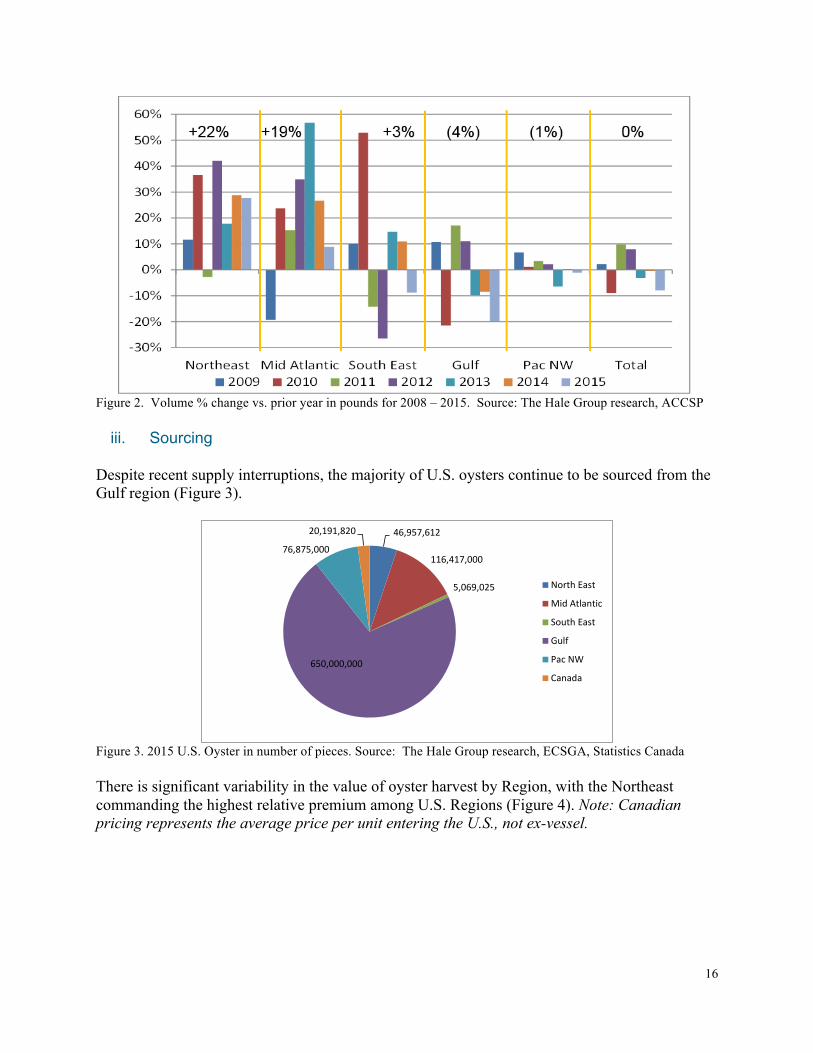
Figure 2. Volume % change vs. prior year in pounds for 2008 – 2015. Source: The Hale Group research, ACCSP
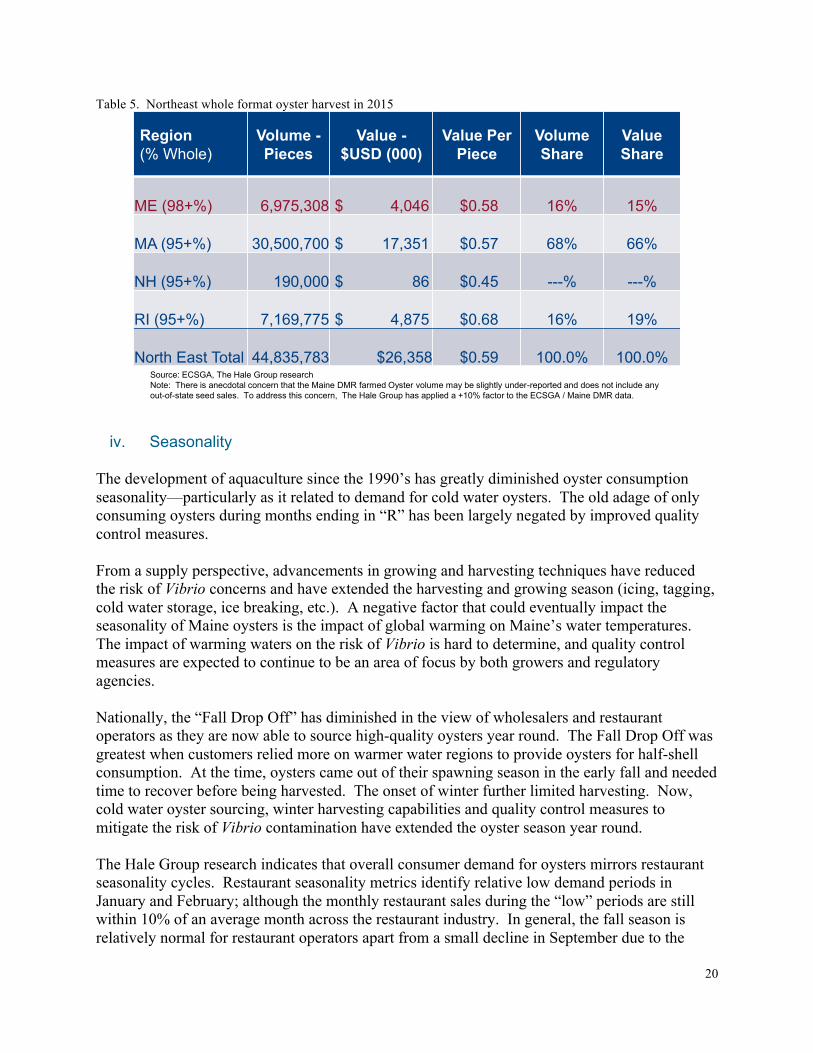
iii. Sourcing Despite recent supply interruptions, the majority of U.S. oysters continue to be sourced from the Gulf region (Figure 3).
Figure 3. 2015 U.S. Oyster in number of pieces. Source: The Hale Group research, ECSGA, Statistics Canada There is significant variability in the value of oyster harvest by Region, with the Northeast commanding the highest relative premium among U.S. Regions (Figure 4). Note: Canadian pricing represents the average price per unit entering the U.S., not ex-vessel.
46,957,612
116,417,000
5,069,025
650,000,000
76,875,000
20,191,820
NorthEast
MidAtlantic
SouthEast
Gulf
PacNW
Canada

17
Figure 4. 2015 Oyster landed value in $USD (000). Source: The Hale Group research, ECSGA, Statistics Canada When evaluated by format, whole oysters account for almost 60% of the volume and over 70% of the value of U.S. oyster production (Table 3). The Northern producing regions command a price premium driven by the perceived higher quality of their oysters, which are primarily sold in the whole format. Table 3. Oyster whole & shucked regional dynamics in 2015
In the Northeast, whole oysters account for over 95% of the total oyster supply (Figure 5). The Pacific Northwest also remains a primarily whole oyster producing region. The majority of shucked oysters are sourced from the Gulf. The Mid-Atlantic has recently added spat-on-shell capacity for additional shucked supply, although the majority of Mid-Atlantic oysters remain whole.
$27,607
$38,711
$1,521
$104,000
$42,942
$18,133
NorthEast
MidAtlantic
SouthEast
Gulf
PacNW
Canada
Region
Whole (Half Shell) ShuckedVolume –
Pieces (000)
Value -$USD (000)
Value Per Piece
Volume -Pieces (000)
Value -$USD (000)
Value Per Piece
North East 44,642 $ 26,333 $ 0.59 2,316 $ 1,230 $ 0.53
Mid Atlantic¹ 94,615 $ 35,008 $ 0.37 21,803 $ 3,707 $ 0.17
South East 2,535 $ 1,014 $ 0.40 2,535 $ 507 $ 0.20
Gulf 325,000 $ 55,250 $ 0.17 325,000 $ 48,750 $ 0.15
Pacific NW 61,500 $ 35,055 $ 0.57 15,375 $ 7,887 $ 0.51
Total U.S. 528,292 $ 152,659 $ 0.29 367,028 $ 62,080 $ 0.17
Share 59% Volume 71% Value 41% Volume 29% Value¹IncludesConnecticutSource: The Hale Group research, ECSGA, Washington Sea Grant, ACCSP,

18
Figure 5. Oyster format shares by region in 2015. Source: The Hale Group research While the Gulf remains the whole volume share leader, the Northeast and other non-Gulf harvesting areas account for the majority of the whole value share given the higher prices realized for their whole oysters (Figure 6, Figure 7).
Figure 6. Oyster volumes by region (000 pieces) in 2015. Source: The Hale Group research, ECSGA, Washington Sea Grant, ACCSP
95%
85%81%
50% 50%
5%
15%19%
50% 50%
0%
10%
20%
30%
40%
50%
60%
70%
80%
90%
100%
Northeast PacNW Mid-Atlantic SouthEast Gulf
Whole
Shucked
44,642
94,615
2,535
325,000
61,500
Northeast
Mid-Atlantic
SouthEast
Gulf
PacNW

19
Figure 7. Whole oyster value ($000) in 2015. Source: The Hale Group research, ECSGA, Washington Sea Grant, ACCSP Within the Northeast, Maine accounts for approximately 14% of the region’s total oyster supply (Table 4). Table 4. Northeast total oyster (whole and shucked) harvest in 2015
Note: Rhode Island oyster farmers, through the Ocean State Shellfish Coop, sell a significant percentage of their oysters directly to wholesale distributors, which enables them to receive the higher value. An equivalent landed value in Rhode Island would be comparable to Maine’s $0.58 / piece. When evaluating the whole format only, there is no significant shift in the Northeast’s share dynamics given the region’s high incidence of whole oyster harvesting (Table 5).
$26,333
$35,008
$1,014
$55,250
$35,055 Northeast
Mid-Atlantic
SouthEast
Gulf
PacNW
Region Volume -Pieces
Value -$USD (000)
Value Per Piece
Volume Share
Value Share
ME 7,104,480 $4,121 $0.58 15.1% 14.9%
MA 32,106,000 $18,264 $0.57 68.4% 66.2%
NH 200,000 $90 $0.45 0.4% 0.3%
RI 7,547,132 $5,132 $0.68 16.1% 18.6%
North East Total 46,957,612 $27,607 $0.59 100.0% 100.0%Source: ECSGA, Maine DMR, The Hale Group research
Note: There is anecdotal concern that the Maine DMR farmed Oyster volume may be slightly under-reported and does not include any out-of-state seed sales. To address this concern, The Hale Group has applied a +10% factor to the ECSGA / Maine DMR data at the recommendation of the industry advisory committee.
20
Table 5. Northeast whole format oyster harvest in 2015
iv. Seasonality The development of aquaculture since the 1990’s has greatly diminished oyster consumption seasonality—particularly as it related to demand for cold water oysters. The old adage of only consuming oysters during months ending in “R” has been largely negated by improved quality control measures. From a supply perspective, advancements in growing and harvesting techniques have reduced the risk of Vibrio concerns and have extended the harvesting and growing season (icing, tagging, cold water storage, ice breaking, etc.). A negative factor that could eventually impact the seasonality of Maine oysters is the impact of global warming on Maine’s water temperatures. The impact of warming waters on the risk of Vibrio is hard to determine, and quality control measures are expected to continue to be an area of focus by both growers and regulatory agencies. Nationally, the “Fall Drop Off” has diminished in the view of wholesalers and restaurant operators as they are now able to source high-quality oysters year round. The Fall Drop Off was greatest when customers relied more on warmer water regions to provide oysters for half-shell consumption. At the time, oysters came out of their spawning season in the early fall and needed time to recover before being harvested. The onset of winter further limited harvesting. Now, cold water oyster sourcing, winter harvesting capabilities and quality control measures to mitigate the risk of Vibrio contamination have extended the oyster season year round. The Hale Group research indicates that overall consumer demand for oysters mirrors restaurant seasonality cycles. Restaurant seasonality metrics identify relative low demand periods in January and February; although the monthly restaurant sales during the “low” periods are still within 10% of an average month across the restaurant industry. In general, the fall season is relatively normal for restaurant operators apart from a small decline in September due to the
Region (% Whole)
Volume -Pieces
Value -$USD (000)
Value Per Piece
Volume Share
Value Share
ME (98+%) 6,975,308 $ 4,046 $0.58 16% 15%
MA (95+%) 30,500,700 $ 17,351 $0.57 68% 66%
NH (95+%) 190,000 $ 86 $0.45 ---% ---%
RI (95+%) 7,169,775 $ 4,875 $0.68 16% 19%
North East Total 44,835,783 $26,358 $0.59 100.0% 100.0%Source: ECSGA, The Hale Group researchNote: There is anecdotal concern that the Maine DMR farmed Oyster volume may be slightly under-reported and does not include any out-of-state seed sales. To address this concern, The Hale Group has applied a +10% factor to the ECSGA / Maine DMR data.

21
“back-to-school” season and the end of the traditional summer vacation period. On a national basis, restaurant seasonality by itself does not indicate a significant fall oyster drop off in demand (Figure 8). In areas where restaurant demand is highly seasonal, including Maine, demand can decrease significantly after the primary tourist seasons, indicating that the Fall Drop Off is a local, rather than a national, phenomenon.
Figure 8. U.S. restaurant seasonality indices: (2011 – 2015). Source: U.S. Census Bureau For Maine oysters, there are some dynamics that negatively impact Fall demand including:
• Reduction in local demand after the summer Maine tourist season. • Increased local supply from some New England oyster farmers that are interested in
bringing inventory to market in advance of the winter ice-over. These dynamics underscore the need to expand distribution networks to the major metropolitan areas in the Northeast and beyond. Portland is within 500 miles of four of the Top 10 metropolitan areas in the U.S.; within 1,000 miles of six of the Top 10 (Figure 9); within 2,000 miles of eleven of the top 20; within 300 miles of Montreal; and within 700 miles of Toronto Canada. All of these markets have significant numbers of restaurants that serve shellfish. All of the U.S. markets within 1,000 miles can be reached by interline refrigerated transfer through Boston within 24 - 48 hours of their departure from Maine. Four of five markets within 2,000 miles (Florida cities, Detroit, and Denver) can also be reached by the same interline transfer from Boston, but refrigerated travel times are likely longer, perhaps 12 additional hours from the Maine departure to Denver. Two Boston interline transfer points are Araho Transfer and Peninsula of Boston which are commonly accessed by refrigerated seafood truck departures from Maine.
91 91
103 100105 101 102 103
98103
98104
0
20
40
60
80
100
120
Jan Feb Mar Apr May Jun Jul Aug Sep Oct Nov Dec

22
Figure 9. Top 10 U.S. metropolitan areas within 500 and 1,000 miles of Portland Maine. Source: U.S. Census Bureau Metropolitan Statistical Areas 2015.
Figure 10. Top 11 – 20 U.S. metropolitan areas within 2,000 miles of Portland Maine. Source: U.S. Census Bureau Metropolitan Statistical Areas 2015. From a demand perspective, the growth of raw bars and the addition of oysters to menus as a relatively low cost, high margin item that is well-suited for sharing has led to a significant increase in demand for oysters. This explosion of menu occasions has coincided with a greater consumer interest in smaller oysters, which creates an opportunity for Maine oyster farmers to better compete with warmer water competitors that benefit from faster growth cycles.
1. New York
2. Los Angeles
3. Chicago
5. Dallas
6. Houston
4. Balt / Wash7. Philadelphia
8. Miami
9. Atlanta
10. Boston500 Miles
1,000 Miles
23
v. Value chain
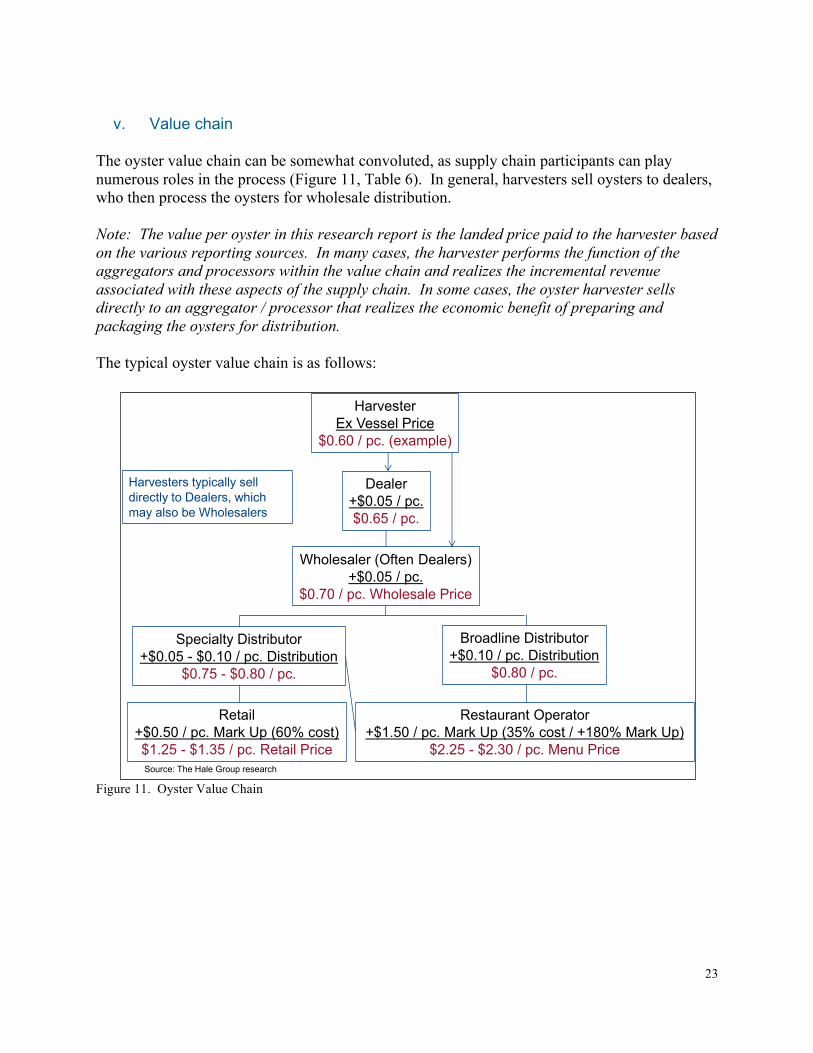
The oyster value chain can be somewhat convoluted, as supply chain participants can play numerous roles in the process (Figure 11, Table 6). In general, harvesters sell oysters to dealers, who then process the oysters for wholesale distribution. Note: The value per oyster in this research report is the landed price paid to the harvester based on the various reporting sources. In many cases, the harvester performs the function of the aggregators and processors within the value chain and realizes the incremental revenue associated with these aspects of the supply chain. In some cases, the oyster harvester sells directly to an aggregator / processor that realizes the economic benefit of preparing and packaging the oysters for distribution. The typical oyster value chain is as follows:
Figure 11. Oyster Value Chain
Source: The Hale Group research
HarvesterEx Vessel Price
$0.60 / pc. (example)
Dealer+$0.05 / pc.$0.65 / pc.
Wholesaler (Often Dealers)+$0.05 / pc.
$0.70 / pc. Wholesale Price
Specialty Distributor+$0.05 - $0.10 / pc. Distribution
$0.75 - $0.80 / pc.
Broadline Distributor+$0.10 / pc. Distribution
$0.80 / pc.
Restaurant Operator+$1.50 / pc. Mark Up (35% cost / +180% Mark Up)
$2.25 - $2.30 / pc. Menu Price
Retail+$0.50 / pc. Mark Up (60% cost)$1.25 - $1.35 / pc. Retail Price
Harvesters typically sell directly to Dealers, which may also be Wholesalers

24
Table 6. Value Chain definitions.
Participant Definition Harvester Oyster farmer that grows and retrieves oysters from
the sea farm for sale. Dealer A person or business to whom certification is issued
for the activities of shellstock shipper, shucker-packer, repacker, reshipper, or depuration processor. Dealers may also be harvesters, wholesalers or distributors.
Wholesaler Business entity that purchases and distributes shellfish from dealers either to distributors for further transportation or directly to retail and foodservice customers.
Specialty Distributor Seafood distributors that purchase shellfish from dealers or wholesalers for distribution to retail and foodservice customers.
Broadline Distributor Foodservice distributor that carries a wide variety of products, including seafood, for distribution to foodservice customers.
Retail Grocery and seafood stores that sell directly to consumers.
Restaurant Operator Restaurant locations that prepare and sell meals to consumers.
vi. Growth Projections - National Nationally, the oyster marketplace is projected to continue to expand, with the Northeast and Mid-Atlantic adding capacity over the planning horizon and a projected ultimate recovery in the Gulf region. In total, oyster supply is projected to grow an incremental +350 million pieces over the planning horizon. Based on The Hale Groups best estimates, this equates to approximately +2.2% average annual growth (Table 7, Figure 12 & 13). Oyster growth is projected to be driven by a combination of both increased supply and continued growth in demand. Demand drivers include:
• Population growth of approximately 0.8% annually • Modest increase in per capita oyster consumption; with a planning assumption of
returning to 2000 per capita levels (3.3 oysters) driven by increased supply and continued interest in half-shell oysters
• Restaurant unit expansion of approximately 0.5% - 1% annually. Over the next 3 – 5 years, it is projected that oyster menu placement growth will exceed overall industry growth by 2 – 3 times (Source: THG operator interviews, Seafood Business, Datassential).

25
Based on best estimate supply and demand projections, US oyster supply will lag demand until the final years of the strategic planning horizon. The primary Supply & Demand assumptions include supply growth in all primary markets at the following levels (Table 7). Table 7. US oyster supply growth projections
Note: Growth projections are based on analysis of anticipated future demand and supply growth dynamics; not derived from past growth trends.
Table 8. US oyster supply growth assumptions
Demand: To estimate true demand The Hale Group utilized per capita demand from 2000 of 3.3 oysters, which represents a benchmark prior to the Gulf issues and other supply disruptions, and projected future demand based on U.S. Census population growth projections. Note: Current supply equates to 2.85 oysters per person, and 1990 per capita consumption was approximately 4.0 oysters per person.
RegionCurrentSupplyPieces(000) 2015-2020 2021-2025 2026-2030
Proj.2030SupplyPieces(000)
Maine 7,104 10.0% 6.0% 4.0% 18,629RestNorthEast 39,853 4.0% 2.0% 1.0% 56,265MidAtlantic 116,417 7.0% 4.0% 2.0% 217,131SouthEast 5,069 3.0% 3.0% 3.0% 7,897Gulf 650,000 1.0% 2.0% 2.5% 853,376PacNW 76,875 2.0% 1.5% 1.0% 91,481Canada 20,192 1.0% 1.0% 1.0% 23,442Total 915,510 2.0% 2.2% 2.6% 1,268,221Source:TheHaleGroupresearch
AnnualCapacityGrowth
AssumptionsMaine: Currentapplicationsfor75newleaseacres=+25%capacity(approx.1,600,000+Oystersby2020)
Increasedbuild-outofexistingleasesites=+3%-5%annuallythrough2020ExpandedleasesitesbeyondcurrentDamariscottalocationsforlongtermgrowth
RestNorthEast ModestsiteexpansioninshorttermRelativelylowgrowthinmid-to-longtermduetolocationexpansionconstraints(+1%-2%)
MidAtlantic VAAquacultureShellfishReportprojects+30%growthinshorttermsupply(+7%annualaverage)Assumemoderategrowthafterinitial3-5yearperiod(+2%-4%)
Gulf AssumeeventualmodestrecoveryofOysterbedsPacNW Assumecontinuedcapacityconstraints;limitedgrowth(+1%-2%)Canada AssumeLowgrowthduetopreferenceforNorthEastU.S.Oysters;currencyratescouldimpactgrowth

26
Figure 12. Projected U.S. oyster supply and demand (000 pieces). Source: The Hale Group Research
Figure 13. Projected U.S. oyster volume growth (000 pieces). Source: The Hale Group research, ECSGA, ACCSP, GSMFC
The Northeast, and Maine in particular are projected to be growth leaders as capacity is added and demand continues for high quality cold-water oysters (Table 9). Regionally, the rate of growth in the Northeast and Mid-Atlantic is projected to moderate as capacity is built out; while the Gulf is projected to expand as capacity is rebuilt. The Pacific Northwest is projected to maintain a moderate, but steady growth rate.
400,000
500,000
600,000
700,000
800,000
900,000
1,000,000
1,100,000
1,200,000
1,300,000
Supply-Pieces Demand
915,510971,726
1,025,9761,084,370
1,014,6431,135,926
1,268,2211,092,439
1,283,577
1,512,721
600,000700,000800,000900,000
1,000,0001,100,0001,200,0001,300,0001,400,0001,500,0001,600,000
2015 2016 2017 2018 2019 2020 2021 2022 2023 2024 2025 2026 2027 2028 2029 2030
Base Low Best High

27
Table 9. Oyster regional volume growth projections (pieces).
Note: Connecticut data was included in the Mid-Atlantic Region to reflect the state’s geographic and economic alignment with the Metro New York metropolitan area, which is included in the Mid-Atlantic Region. As additional capacity is added in most regions, the expectation is that pricing will begin to moderate, particularly for lower priced southern oysters as Gulf capacity is expected to recover. While pricing is expected to recede moderately over the planning horizon, regression analysis indicates that there has been minimal correlation between price and volume (consumption) over the past decade. When comparing ACCSP data for landed meat pounds relative to the value per pound of the oyster landings, the R Square correlation metric of .62 indicates minimal correlation between volume and price (Table 10).
Region
2015 Volume
(000)
Proj. Annual %
Chg. ’15 – ‘20
Best Proj.
2020 Vol. (000)
Proj. Annual %
Chg. ’20 – ‘25
Best Proj.
2025 Vol. (000)
Proj. Annual %
Chg. ’25 – ‘30
Best Proj.
2030 Vol. (000)
Maine 7,104 10.0% 11,442 6.0% 15,312 4.0% 18,629 Rest North East 39,853 4.0% 48,487 2.0% 53,534 1.0% 56,265 Mid Atlantic¹ 116,417 7.0% 161,642 4.0% 196,663 2.0% 217,131
South East 5,069 3.0% 5,876 3.0% 6,812 3.0% 7,897
Gulf 650,000 1.0% 683,157 2.0% 754,260 2.5% 853,376
Pacific NW 76,875 2.0% 82,816 1.5% 87,041 1.0% 91,481 Total U.S. Regions 895,318 2.1% 993,420 2.3% 1,113,622 2.3% 1,244,779
Canada 20,192 1.0% 21,221 1.0% 22,304 1.0% 23,442
Grand Total 915,510 2.0% 1,014,641 2.2% 1,135,926 2.6% 1,268,221
¹IncludesConnecticutSource: The Hale Group research, ECSGA, Washington Sea Grant, ACCSP, GSMFC, Statistics Canada

28
Table 10. Historical regression analysis output: meat volume vs. pricing. Total U.S. Includes all oyster formats and landings.
This dynamic underscores the fact that demand has outstripped supply in recent years and suggests that oyster pricing may not experience a significant decline as capacity is created, particularly if whole oyster farmers continue to build brand equity for their products. Northeast pricing, while expected to recede moderately, will remain among the highest nationally. While oyster pricing cannot be statistically linked to volume changes based on historical patterns, The Hale Group’s research indicates that oyster pricing may continue to rise slightly over the next 3-5 years as demand continues to outstrip supply (Figure 14 & 15). As supply begins to catch up to demand, the assumption is that pricing will begin to moderate. Projected best estimate pricing changes are as follows:
• 2016 – 2020: +0.5% annual increases as demand for whole oysters continues to grow and shucked oyster supply is constrained due to Gulf capacity issues.
• 2021 – 2025: -1.0% annual decreases as additional capacity is added to the supply system
• 2026 – 2030: -2.0% annual decreases as total oyster supply is projected to finally catch up with demand
LandedYear MeatLbs. $/Lb SUMMARYOUTPUT2005 3,498,616 4.97$2006 4,371,775 5.38$ RegressionStatistics2007 6,309,601 4.06$ MultipleR 0.7941289032008 5,368,016 5.52$ RSquare 0.6306407152009 5,488,183 5.61$ AdjustedRSquare 0.5896007942010 5,700,866 6.68$ StandardError 1027728.7612011 6,762,623 6.12$ Observations 112012 7,490,479 6.96$2013 7,631,717 9.12$2014 8,078,372 11.59$2015 8,691,126 12.75$
Source:ACCSPdata

29
Figure 14. Projected average total U.S. oyster price per piece (ex-vessel). Source: The Hale Group research, ECSGA, ACCSP, GSMFC. Based on the research findings, the total landed value of the U.S. oyster harvest is projected to reach approximately $270 million by 2030 (Figure 15). Canadian live imports contribute an additional $20+ million in supply.
Figure 15. Projected oyster total U.S. landed value ($USD). Source: The Hale Group research, ECSGA, ACCSP, GSMFC. When evaluating the projected future relationship between supply and pricing, there is a tighter correlation between volume (supply) and pricing as supply is eventually projected to catch up to demand (Table 11).
$0.24
$0.24
$0.22
$0.19
$0.25$0.23
$0.21
$0.26$0.25
$0.24
$0.10
$0.12
$0.14
$0.16
$0.18
$0.20
$0.22
$0.24
$0.26
$0.28
2015 2016 2017 2018 2019 2020 2021 2022 2023 2024 2025 2026 2027 2028 2029 2030
Base Low Best High
$219,567,503
$233,018,789$222,374,878
$201,823,270
$249,407,316$265,481,940
$267,893,796
$289,157,308
$323,035,172
$362,012,176
$150,000,000
$200,000,000
$250,000,000
$300,000,000
$350,000,000
$400,000,000
2015
2016
2017
2018
2019
2020
2021
2022
2023
2024
2025
2026
2027
2028
2029
2030
Base Low Best High

30
Table 11. Future Regression Analysis Output: Projected Pieces vs. Pricing. Total U.S. All Oyster Formats and Landings.
vii. Growth Projections - Maine As noted earlier, Maine is projected to be a growth leader in oyster supply, driven by increased capacity and continued demand for high-quality, cold water whole oysters. The best, or mid-point, projection estimates that Maine capacity will almost triple over the 15-year planning horizon, generating an incremental 10+ million oysters (Figure 16).
Proj.Year Pieces $/100 SUMMARYOUTPUT2015 915,510,457 24.00$2016 937,463,844 24.00$ RegressionStatistics2017 956,963,328 24.00$ MultipleR 0.8732292018 977,324,710 24.00$ RSquare 0.7625292019 995,671,173 24.00$ AdjustedRSquare 0.7442622020 1,014,642,582 25.00$ StandardError 537915012021 1,037,644,339 24.00$ Observations 152022 1,061,254,264 24.00$2023 1,085,491,290 24.00$2024 1,110,375,034 24.00$2025 1,135,925,827 23.00$2026 1,161,161,212 23.00$2027 1,186,993,592 22.00$2028 1,213,437,653 22.00$2029 1,240,508,453 22.00$2030 1,268,221,431 21.00$
Source:TheHaleGroupresearch

31
Figure 16. Projected Maine oyster volume growth (000 pieces). Source: The Hale Group research, ECSGA, ACCSP, GSMFC Key assumptions behind the Maine oyster growth projections include:
Best Estimate:
• 75 current new lease acre applications = + 25% capacity (approx. 1.8 million incremental oysters by 2020)
• The addition of approximately 30 new oyster lease acres per year to meet projected demand
• Increased build-out of existing lease sites = + 3% - 5% annually through 2020 • Expanded lease sites beyond current Damariscotta locations for long term growth • Expansion of Maine oysters to Top 10 markets within 1,000 miles
Low Estimate:
• Only one-half of current new lease applications are commercialized • Minimal site expansion beyond the Damariscotta river • Distribution focus on New England only
High Estimate:
• Accelerated growth in new lease applications • Investment in Maine / Harvester brand development • Growth in per capita consumption beyond 2000 levels • Geographic expansion beyond New England
In order to meet this projected best estimate volume growth, Maine farmed oyster capacity will need to grow at an average of approximately 30 new acres annually though the planning horizon. This equates to an additional 400 lease acres beyond the current 75 acres under review. This assumes that current oyster lease sites are near capacity.
7,1049,964
12,717 14,04111,442
15,312
18,62913,090
20,140
26,952
-
5,000
10,000
15,000
20,000
25,000
30,000
2015201620172018201920202021202220232024202520262027202820292030
Base Low Best High

32
The average landed price for Maine oysters is projected to remain relatively high, although the research indicates that all pricing will moderate as nationwide capacity increases (Figure 17). Maine’s reliance on whole, or half-shell, formats should provide some insulation from the anticipated growth in lower cost Gulf and Mid-Atlantic oysters, which have a greater mix of shucked oysters; but pricing projections assume that Maine pricing will be impacted by the expansion of whole supply, particularly from the Mid-Atlantic. As noted earlier, the research indicates that Maine pricing may decline below $0.50 / oyster (2016 equivalent $USD) by the end of the planning horizon as projected supply catches up with demand. The Hale Group believes that Maine oyster farmers will need to plan for this scenario over the next decade, both by pursuing operational efficiencies and by investing to develop their brands to help differentiate Maine oysters from the rest of the supply in order to justify a price premium.
Figure 17. Projected Average Maine Price per Oyster (Ex Vessel Value). Source: The Hale Group research, ECSGA, ACCSP, GSMFC The Hale Group’s research indicates that Maine oyster pricing trends should generally mirror overall national oyster pricing trends, although Maine will continue to command a premium price for its oysters. Projected best estimate pricing changes are as follows:
• 2016 – 2020: +0.5% annual increases as demand for whole oysters continues to grow. • 2021 – 2030: -2.0% annual decreases as additional lower price whole capacity is added
to the East Coast supply system and total oyster supply is projected to finally catch up with demand
Based on the volume and landed pricing research, the total value of Maine oysters is projected to more than double to $8 - $10 million by 2030 (Figure 18).
$0.58$0.58
$0.50
$0.41
$0.59
$0.54
$0.49
$0.67$0.64
$0.61
$0.30
$0.35
$0.40
$0.45
$0.50
$0.55
$0.60
$0.65
$0.70
2015201620172018201920202021202220232024202520262027202820292030
Base Low Best High

33
Figure 18. Projected Maine total landed value ($USD - 000) A review of historical growth shows that Maine’s oyster production has more than doubled over the past decade (Figure 19).
Figure 19. Maine historical oyster growth—DMR. Source: Maine DMR Maine’s growth trends are similar when using either DMR or ACCSP data (Figure 20).
$4,121$5,779 $6,334
$5,702$6,804
$8,230 $9,051$8,801
$12,878
$16,389
$-
$2,000
$4,000
$6,000
$8,000
$10,000
$12,000
$14,000
$16,000
$18,000
Base Low Best High
526706 722 758 803
1,098
603701
966
1,179
1,542
$2.00$2.04$2.17$2.17$2.16$1.91$2.09$2.36$2.50
$2.62$2.62
$-$0.50$1.00$1.50$2.00$2.50$3.00$3.50$4.00$4.50$5.00
-
200
400
600
800
1,000
1,200
1,400
1,600
1,800
2005 2006 2007 2008 2009 2010 2011 2012 2013 2014 2015
WholePounds(000) Price/Lb.

34
Figure 20. Maine historical oyster growth—DMR and ACCSP. Source: Maine DMR, ACCSP
[This space intentionally blank]
526706 722 758 803
1,098
603701
966
1,179
1,542
34.541.1 43.2 42.0 44.2
61.6
34.740.4
55.0
68.4
102.8
-
20.0
40.0
60.0
80.0
100.0
120.0
-
200
400
600
800
1,000
1,200
1,400
1,600
1,800
2005 2006 2007 2008 2009 2010 2011 2012 2013 2014 2015
WholePounds-000(DMR) MeatPounds-000(ACCSP)

35
BLUE MUSSEL (Mytilus edulis)
i. Species Overview Live mussels represent a 60 million pound, and approximately $70 million ex-vessel value industry in the U.S. Research indicates that aquaculture products account for approximately 15% of the U.S. supply and the majority of the Canadian supply. Maine DMR data indicates that aquaculture accounts for 7% of Maine’s volume, which THG research indicates may be somewhat under-reported. U.S. live, fresh mussel demand is primarily sourced from the Northeast (37%), the Pacific Northwest (20%) and Canada (43%). Maine and Massachusetts are the major Northeast producers. Given its close proximity to New England, PEI mussels are a significant competitor for Maine mussels, and have been viewed as an industry standard for a long time. Over-crowding in PEI mussel areas as well as growing recognition of Northeast mussels’ quality, have diminished PEI’s quality perception and image among some customers; although PEI mussels remain the industry standard for many. Overall mussel demand is projected to continue to grow modestly over the planning horizon. Part of this growth is driven by a halo effect from oysters where the interest in trying mussels from various farms and areas has a similar appeal as with oysters. Also, mussels are a relatively low cost protein offering for restaurants and consumers. While overall species growth may be moderate, buyers believe that there is significant growth potential for high quality, premium mussels. Maine, and Northeast mussels in general, are projected to grow at faster rates than Canadian imports given the quality differences. There is a significant U.S. import market for frozen mussels from New Zealand and Chile. The New Zealand mussels have a reputation for high quality, and Chile produces pre-cooked mussels at a low cost. These products do not have a high level of penetration in New England given the availability of fresh mussels.
ii. Market Size and Growth The total U.S. live mussels marketplace is estimated to be approximately 60 million whole pounds, with a landed value of approximately $70 million (Table 12). In the U.S., the majority of mussels are sourced from Maine, Washington, and Massachusetts. Close to one-half of the U.S. supply is sourced from Canada.

36
Table 12. Total U.S. mussel supply in 2015.
Note: Whole mussel pounds were estimated based on the following research findings / assumptions:
• Maine: Maine DMR landings data, with farmed adjusted from 958,000 lbs. to 1,350,000 lbs. to adjust for projected under-reporting.
• Massachusetts: DMF input and ACCSP meat weight data converted to whole pounds. Meat weight conversion factor of 40% of total whole mussel weight.
• Pacific NW: Washington Sea Grant research and THG research • Canadian whole weight and value ($1.29 / lb. USD) is from Statistics Canada data. • US value is estimated using an average $0.90 per pound price for wild mussels; $1.60
/ lb. for farmed outside of Maine and $1.77 / lb. for Maine farmed (blended average of bottom culture and rope grown). Note: Maine DMR data suggests $0.09 / wild pound and $1.31 / farmed pound.
The U.S. live mussel supply, including Canadian imports, has grown at approximately a +4% annual rate since the 2008 recession (Figure 21, Table 13). Recently, Massachusetts has driven much of the growth, particularly in 2015 when additional wild capacity became available. In total since 2008, Canadian supply has increased moderately, although Canadian mussel exports to the U.S. have declined in recent years. Canada’s 2015 decline was primarily attributed to the harsh 2014/2015 winter. Maine’s mussels supply has remained relatively stable in recent years after a decline in the early 2000s.
SourceVolume – Whole
Pounds (000) Value - $USD (000)United States 34,577 $35,155Canada 25,915 $33,138Total 60,492 $68,293Source: The Hale Group research, Statistics Canada, Maine DMR, Washington Sea Grant, ACCSP

37
Figure 21. US Live mussel supply (wild & farmed) from 2008 – 2015 (000 lbs). Source: The Hale Group research, Statistics Canada, Maine DMR (unadjusted), Washington Sea Grant, ACCSP In total, Maine accounts for almost one-quarter of domestic live mussel supply (Table 13, Figure 22). Table 13. Mussel Regional Supply Dynamics (Wild and Farmed) – 2015. Source: The Hale Group research, Statistics Canada, Maine DMR, Washington Sea Grant, ACCSP
46,70949,218
53,59555,82657,91459,72457,502
60,492
-
10,000
20,000
30,000
40,000
50,000
60,000
70,000
2008 2009 2010 2011 2012 2013 2014 2015
ME
MA
PacNW
Canada
Total
Region Volume –Lbs. (000)
Value - $USD (000)
Volume Share
ME 14,460 $14,194 24%
MA 8,230 $7,463 14%
Pac NW 11,887 $13,498 20%
Canada 25,915 $33,138 42%
Total Live 60,492 $68,293 100.0%

38
Figure 22. US live mussel supply (wild & farmed) volume (000 lbs.) and shares in 2015. Source: The Hale Group research, Statistics Canada, Maine DMR, Washington Sea Grant, ACCSP In total, approximately one-half of U.S. mussel supply is sourced via aquaculture (Table 14 & 15). THG research indicates that aquaculture accounts for less than 20% of U.S. mussel supply and the vast majority of Canadian supply. In Maine, aquaculture accounts for an estimated 9% of total mussel supply. Table 14. Farmed vs. wild mussel volumes in 2015 (000 lbs.)
Farmed mussels command a price premium in the marketplace (Table 15), driven by their higher meat content and perceived higher quality (cleaner, better shell structure, etc.).
14,460
8,230
11,887
25,915ME
MA
PacNW
Canada
24%
14%
42%
20%
Region
Est. Farmed Volume –Lbs. (000)
Wild Volume– Lbs. (000)
Total Volume –Lbs. (000)
Farmed % Total Volume
ME 1,350 13,110 14,460 9%
MA 80 8,150 8,230 <1%
Pac NW 4,000 7,887 11,887 34%
Total U.S. 5,430 29,147 34,577 16%
Canada 23,300 2,615 25,915 90%
Total Live 28,730 31,762 60,492 47%Source: The Hale Group research, Statistics Canada, Maine DMR, Washington Sea Grant, ACCSP, MA Marine Fisheries

39
Table 15. Farmed vs. wild mussel volumes and values in 2015.
The research indicates that the Maine farmed mussel harvest appears to be under-reported in the Maine DMR landings data. Based on research findings and discussions with growers, THG developed the following projection for the 2015 Maine mussel harvest: Table 16. Maine volume estimate (000 lbs.) for rope-grown, bottom culture, and wild mussels in 2015.
Within Maine mussel aquaculture, rope-grown mussels achieve a greater price premium relative to bottom-culture mussels (Table 17). Table 17. Maine mussel pricing dynamics in 2015.
Farmed Wild Total
Region
Est. Lbs. (000)
Est. $ / Lb.
Est. Value ($000)
Est. Lbs. (000)
Est. $ / Lb.
Est. Value ($000)
Est. Lbs. (000)
Est. $ / Lb.
Est. Value ($000)
ME 1,350 $1.77 $2,395 13,110 $0.90 $11,799 14,460 $0.98 $14,194MA 80 $1.60 $128 8,150 $0.90 $7,335 8,230 $0.91 $7,463Pac NW 4,000 $1.60 $6,400 7,887 $0.90 $7,098 11,887 $1.14 $13,498Total U.S. 5,230 $1.65 $8,923 29,147 $0.90 $26,232 34,577 $1.02 $35,155Canada 23,300 $1.31 $30,523 2,615 $1.00 $2,615 25,915 $1.28 $33,138Total 28,530 $1.37 $39,446 31,762 $0.91 $28,847 60,492 $1.13 $68,293
Source: Maine DMR, The Hale Group research, ACCSP, Washington Sea Grant
Harvest Process Maine DMR Data THG Est. Range Mid-Point Used
for Estimates
Farmed – Rope Grown --- 500 - 600 550
Farmed – Bottom Culture --- 700 - 900 800
Total Farmed 958 1,200 – 1,500 1,350
Wild 13,110 13,110 13,110
Maine Total 14,069 14,310 – 14,610 14,460Source: Maine DMR, The Hale Group research
Harvest Process Est. Lbs. – 000(Mid Point Est.)
Est. Landed $ / Lb.
Est. Value ($000)
Farmed – Rope Grown 550 $2.10 $1,155
Farmed – Bottom Culture 800 $1.55 $1,240
Total Farmed 1,350 $1.77 $2,395
Wild 13,110 $0.90 $11,799
Maine Total 14,460 $0.98 $14,194Source: Maine DMR, The Hale Group research

40
Maine mussel volume trends indicate that supply has been relatively stable in recent years, although overall volume is less that the early 2000s. Based on Maine DMR data, Maine farmed mussel volume has been somewhat erratic in recent years (Figure 23).
Figure 23. Maine live mussel farmed vs. wild volume trends 2011 – 2015 (000 lbs.). Source: Maine DMR and THG research (Maine Farmed adjusted +40% for under-reporting) The vast majority of live mussels are sourced from the Northeast and Canada. Frozen and pre-cooked mussels are also sourced from New Zealand and Chile (Figure 24).
Figure 24. Mussel imports (lbs.) in 2015. Source: The Hale Group research, ACCSP, Maine DMR When all mussel formats and sources are accounted for, the U.S. mussels category is approximately 100 million pounds and is valued at approximately $150 million. U.S. live mussels represent one-third of the overall U.S. market. Live mussels in total represent almost 60% of U.S. mussel volume (Table 18).
15,121
13,136 12,152 12,876 13,110
9941,142
1,658
594
1,350
0
200
400
600
800
1,000
1,200
1,400
1,600
1,800
0
2,000
4,000
6,000
8,000
10,000
12,000
14,000
16,000
2011 2012 2013 2014 2015
WildPounds AquaculturePounds
25,915,286
18,768,600
11,372,563
9,538,639
5,242,578
CanadianLive
NZFrozen
ChileNSPF(Pre-Cook)
ChileFrozen
AllOther

41
Table 18. 2015 US mussel marketplace origin summary data
iii. Impact of Canadian Imports on Maine THG’s research indicates that Canadian mussels are distributed across the United States, although penetration is highest in the Northern half of the country, which is closest to the source. Frozen mussels imported from New Zealand and Chile tend to have higher consumption patterns in the Southern and Western states. Estimates for the regional penetration of Canadian live mussel imports are as follows (Table 19): Table 19. Estimated Canadian mussel regional distribution within the US marketplace (2015)
Origin FormatVolume –
Lbs. (000)
Value$(000)
Avg. $ / Lb.
Volume Share
Domestic Live 34,577 $35,155 $1.02 33%
Canada Live 25,915 $33,138 $1.28 25%
Total Live Mussels 60,492 $68,293 $1.13 58%
New Zealand Frozen 18,768 $46,347 $2.47 18%
Chile Frozen Frozen 9,539 $11,745 $1.23 9%
Total Frozen Mussels 28,307 $58,092 $2.05 27%Chile NSPF (Pre-Cooked)
Frozen / Canned? 11,373 $13,534 $1.19 11%
All Other Misc. 5,243 $8,815 $1.68 5%
Total Mussels 105,415 $148,734 $1.41 100.0%Source: NMFS, The Hale Group research
Region% U.S.
Population% Shellfish
Consumption
Est. % Canadian
Mussel Consumption
Est. Canadian Mussel Whole
Lbs. (000)North East / Mid Atl. 18% 20% 35% 9,070
Central 21% 19% 23% 5,960
South 37% 43% 20% 5,183
West 24% 18% 22% 5,701
Total 100% 100% 100% 25,915Source: The Hale Group research, Agriculture and Agri-Food Canada

42
The estimated 9 million pounds of PEI mussels consumed in the Northeast and Mid-Atlantic states represent an opportunity for Maine mussels to further penetrate close proximity markets.
iv. Whole Versus Shucked / Further Processed Formats As noted in the Imports – All formats section, whole mussels, either live or frozen represent approximately 85% of total U.S. consumption. Much of the shucked / further processed product is typically sourced from Chile, which has low cost operations and dominates this market niche.
v. Seasonality Wholesalers and foodservice operators report minimal seasonality with mussel demand, nor do they experience significant supply seasonality. As with oysters, seasonality is primarily a harvest-related issue in cold water climates rather than a demand-driven issue. On the west coast, mussel farmers often produce two different mussels to mitigate the impact of spawning, as the mussels spawn at different times of the year; Mediterranean (Mytilus galloprovincialis) in the winter and Blue in the summer. In general, consumer demand is at its peak during the summer months and Holidays.
vi. Growth Projections - National The total live mussel marketplace is projected to continue to expand at a modest pace, with moderate growth from imports, and is expected to approach 80 million whole pounds by the end of the planning horizon. Northeast mussels, including Maine, are projected to grow faster than the industry average given their high quality perception and expected capacity increases. The key assumption for Northeast mussel growth is that sufficient Maine farmed capacity will be added to offset projected declines in wild stock and enable overall growth. Also within the Northeast, Massachusetts wild production is projected to increase in the short term as new growth areas are brought to market. Mussel growth is projected to be driven by a combination of both increased supply and continued growth in demand. Demand drivers include:
• Population growth of approximately 0.8% annually • “Halo” effect benefit of oyster growth on restaurant menus and the corresponding
increased interest in shellfish; which was reported by numerous chefs and foodservice operators during the research
• Superior quality of Northeast mussels relative to PEI product

43
Based on best estimate supply and demand projections, total mussel supply will marginally outpace demand over the planning horizon (Figure 25). The primary supply & demand assumptions include supply growth in all primary markets at the following levels (Table 20): Table 20. Mussel regional supply growth projections. Source: The Hale Group research, ACCSP, Maine DMR
Note: Growth projections are based on analysis of anticipated future demand and supply growth dynamics; not derived from past growth trends.
RegionCurrentSupplyPounds(000) 2015-2020 2021-2025 2026-2030
Proj.2030SupplyPounds(000)
Farmed 1,350 14.0% 17.0% 13.0% 10,500Wild 13,110 -0.5% -0.5% -0.5% 12,160Total 14,460 1.0% 2.9% 4.0% 21,105
Farmed 80 10.0% 9.9% 5.1% 265Wild 8,150 4.0% 1.0% 0.0% 10,396Total 8,230 4.0% 1.1% 0.1% 10,661
Farmed 4,000 3.0% 2.5% 1.0% 5,514Wild 7,887 0.5% 0.3% 0.0% 8,208Total 11,887 1.4% 1.1% 0.4% 13,722
Farmed 5,430 5.9% 8.1% 7.4% 14,723Wild 29,147 1.1% 0.2% -0.2% 30,765Total 34,577 1.9% 1.9% 1.9% 45,488
Farmed 23,300 1.9% 1.0% 0.5% 27,556Wild 2,615 0.0% 0.8% 0.5% 3,074Total 25,915 1.9% 1.0% 0.5% 30,630
Farmed 28,730 2.7% 2.7% 2.6% 42,279Wild 31,762 1.2% 0.3% -0.1% 33,839Total 60,492 1.9% 1.5% 1.3% 76,118
AnnualCapacityGrowth
TotalU.S.LiveSupply
Maine
Massachusetts
PacNW
U.S.Total
Canada

44
Table 21. Mussel supply growth assumptions
Demand assumptions: Marginal increase in demand from 0.19 lbs. / per capita to 0.21 lbs. / capita based on anticipated continued expanded consumer interest in shellfish and the growth of high quality Northeast mussels.
Figure 25. Live mussel supply and demand projections for the total U.S. marketplace. Source. The Hale Group research. Note: The total U.S. supply includes Canadian-sourced live mussels. In total, the supply of mussels including both wild and farmed sourcing is projected to grow by approximately 16 million pounds over the planning horizon (Figure 26). Farmed mussels are projected to account for almost 90% of the total growth, with over one-half of the incremental farmed mussel volume sourced from Maine assuming that farmed capacity is added in the state (Figure 27).
AssumptionsMaine: Minimalnewleaseapplicationsinprocess(7+acres),yetincrementalcapacityatexistingleasesites
Assume-0.5%annualdeclineinWildsupplyStrongAquaculturegrowthoffrelativelysmallbase(+14%/yr.'15-'20;+17%/yr.'20-'25;+13%/yr.'25-'30
Massachusetts ShorttermcapacitygainfromnewWildsitesRelativelylowgrowthinmid-to-longtermduetolocationexpansionconstraints
PacNW Assumecontinuedcapacityconstraints;limitedgrowth(+1%-2%)Canada Shorttermrecoveryfromwinterof2014/2015
Capacityconstraintsoverlongterm
-
10,000
20,000
30,000
40,000
50,000
60,000
70,000
80,000
90,000
2015 2016 2017 2018 2019 2020 2021 2022 2023 2024 2025 2026 2027 2028 2029 2030
Supply-Lbs. Demand

45
Figure 26. Projected live mussel volume growth (000 lbs.). Source. The Hale Group research, ACCSP, Maine DMR, Statistics Canada. Note: The total U.S. supply includes Canadian-sourced live mussels.
Figure 27. Projected farmed mussel volume growth in US Marketplace (000 lbs.). Note: The total U.S. supply includes Canadian-sourced live mussels. Given its cold water environment and available capacity, Maine is projected to be a growth leader in farmed mussel production assuming that the aquaculture base is expanded (Table 22). Over the planning horizon, it is projected that the Northeast farmed mussels will capture approximately 20 share points from Canada and the Pac NW. Canadian mussels are expected to realize only moderate growth given capacity constraints in PEI and the relatively under-developed mussel aquaculture industry in adjoining areas. Should the adjoining Canadian provinces (Nova Scotia, Newfoundland, etc.) develop a logistics infrastructure to cost-effectively
60,49264,527 67,819 70,575
66,62872,102
77,674
68,441 76,682 85,079
-
10,000
20,000
30,000
40,000
50,000
60,000
70,000
80,000
90,000
2015 2016 2017 2018 2019 2020 2021 2022 2023 2024 2025 2026 2027 2028 2029 2030
Base Low Best High
28,73031,720
35,02238,47832,989
38,030
43,83534,453
40,330
46,527
-5,000
10,00015,00020,00025,00030,00035,00040,00045,00050,000
Base Low Best High

46
and efficiently support shellfish aquaculture exports to the U.S., then the supply of lower priced Canadian mussels could expand. To-date, this infrastructure is lacking in Canada. The research indicates that there is an opportunity for Maine’s mussel farmers to take market share from Canada. Accomplishing this will require:
• Ensuring consistency of supply from Maine • Defining the value proposition and branding strategy, as Maine harvesters will be
competing against a well-entrenched competitor • Consideration of the potential impact on pricing; potentially impacted by both exchange
rates and subsidy levels Table 22. Projected volume growth of U.S. farmed mussel supply (000 lbs.). Source. The Hale Group research, ACCSP, Maine DMR
In total, mussel pricing is projected to remain essentially flat as supply and demand are projected to remain relatively well balanced. When comparing ACCSP data for landed meat pounds relative to the value per pound of mussel landings, the R Square correlation metric of .32 indicates negligible correlation between volume and price (Table 23).
Region
2015 Volume
(000)
Proj. Annual %
Chg. ’15 – ‘20
Best Proj.
2020 Vol. (000)
Proj. Annual %
Chg. ’20 – ‘25
Best Proj.
2025 Vol. (000)
Proj. Annual %
Chg. ’25 – ‘30
Best Proj.
2030 Vol. (000)
Maine 1,350 14.0% 2,599 17.0% 5,699 13.0% 10,500
Mass. 80 10.0% 129 9.9% 207 5.1% 265
PacNW 4,000 3.0% 4,637 2.5% 5,246 1.0% 5,514Total U.S. Regions 5,430 6.3% 7,365 8.7% 11,153 7.9% 16,279
Canada 23,300 1.9% 25,624 1.0% 26,877 0.5% 27,556
Total Farmed 28,730 2.8% 32,989 2.9% 38,030 2.9% 43,835

47
Table 23. Historical mussel regression analysis: meat pounds vs. pricing
Mussel pricing is expected to remain relatively consistent (Figure 28). It is expected that, in the short term, Maine’s average mussel pricing will increase as the higher priced aquaculture mussel industry expands. Pricing scenarios assume that pricing will begin to moderate at the end of the planning horizon, as domestic farmed mussels compete with PEI mussels for market share.
Figure 28. Projected average U.S. mussel price per pound (ex-vessel). Source: The Hale Group research Based on the research findings, the total landed value of the live mussel marketplace in the U.S. is projected to approach $90 million by 2030 (Figure 29).
LandedYear MeatLbs. $/Lb SummaryOutput2005 6,393,581 0.42$ RegressionStatistics2006 6,627,344 0.45$ MultipleR 0.5675387182007 2,948,461 0.76$ RSquare 0.3221001972008 3,241,089 0.74$ AdjustedRSquare 0.2373627212009 3,379,811 0.76$ StandardError 1109666.2152010 3,163,157 0.82$ Observations 102011 3,460,367 0.73$2012 2,845,534 0.89$2013 3,436,193 1.12$2014 3,404,180 1.08$2015 5,699,154 0.79$
Source:ACCSPdata
$1.13
$1.13
$1.02$0.88
$1.19 $1.19$1.13
$1.25 $1.30 $1.30
$-
$0.20
$0.40
$0.60
$0.80
$1.00
$1.20
$1.40
2015 2016 2017 2018 2019 2020 2021 2022 2023 2024 2025 2026 2027 2028 2029 2030
Base Low Best High

48
Figure 29. Projected total U.S. marketplace live mussel landed value (000 $USD). Source: The Hale Group research, ECSGA, ACCSP, GSMFC. Note: Includes Canadian-sourced live mussels. When evaluating the projected future relationship between mussel supply and pricing, there is minimal correlation between volume (supply) and pricing as supply is eventually projected to catch up to demand (Table 24). Table 24. Mussel future regression analysis: projected pounds vs. pricing. Total U.S. supply (including Canadian imports). All Mussel formats and landings. Source: The Hale Group research
$68,293
$72,916$69,272
$61,904
$79,130$85,631
$87,727
$85,388$100,052
$111,008
$-
$20,000
$40,000
$60,000
$80,000
$100,000
$120,000
Base Low Best High
Proj.Year Pounds $/Lb. SUMMARYOUTPUT2015 60,492 1.15$2016 62,018 1.16$ RegressionStatistics2017 63,288 1.17$ MultipleR 0.2029389712018 64,285 1.18$ RSquare 0.0411842262019 65,329 1.20$ AdjustedRSquare -0.0325708332020 66,243 1.21$ StandardError 4458.0498042021 67,092 1.21$ Observations 152022 68,008 1.21$2023 69,008 1.21$2024 70,104 1.21$2025 71,258 1.21$2026 72,039 1.20$2027 72,904 1.18$2028 73,864 1.17$2029 74,931 1.16$2030 76,118 1.15$

49
vii. Growth Projections - Maine Assuming that Maine expands its aquaculture capacity, the state is positioned to be a growth leader in the live mussel industry given its available capacity, high quality growing environment and brand equity. Maine’s strong brand equity and positive imagery were cited repeatedly during the research by supply chain participants across the country. There appears to be a clear opportunity to leverage this brand equity to support any expansion of the Maine farmed shellfish industry. Mid-point estimates project that Maine’s farmed mussel industry can grow approximately six-fold over the planning horizon as the overall market expands modestly, wild supply is constrained and Maine farmed competes with PEI for market share (Figure 30). To meet the projected increase in demand, Maine mussel aquaculture will need to add an additional 90 – 100 acres over the planning horizon, assuming that current leases are capacity constrained. This equates to approximately 6 – 7 additional lease acres annually over the planning horizon.
Figure 30. Projected growth volume of Maine farmed mussels (000 lbs.) 2015 - 2030. Source: The Hale Group research Given that rope-grown mussel harvesting has greater yield per acre and commands a higher price than bottom-culture, the assumption is that rope-grown will account for approximately 80% of Maine’s farmed mussel growth over the planning horizon (Figure 31).
1,350
1,9843,195
4,6942,599
5,699
10,500
2,960
7,365
14,814
-
2,000
4,000
6,000
8,000
10,000
12,000
14,000
16,000
Base Low Best High

50
Figure 31. Projected growth volume of Maine farmed mussels – Rope-grown vs. bottom-culture (000 lbs.) 2015 - 2030. Source: The Hale Group research Pricing scenarios assume that the Maine farmed mussel volume mix will evolve with the previously referenced volumetric growth projections for rope-grown and bottom-culture techniques. Pricing projections assume that Maine farmed mussels will continue to command a price premium relative to PEI mussels given their higher perceived quality. The pricing projections also assume that Maine farmed mussel pricing will moderate approximately -10% (in 2015 real dollars) over the planning horizon as farmed capacity expands and Maine mussel farmers compete directly with Canadian imports for market share. While the average price per pound within each Maine mussel harvest format (rope-grown, bottom culture, wild caught) is projected to decline over the planning horizon, the average price per pound is projected to increase, as higher price farmed mussels build share while lower value wild mussels decline (Figure 32).
1,350
2,599
5,699
10,500
5501,549
4,029
7,870
800 1,050 1,6702,630
-
2,000
4,000
6,000
8,000
10,000
12,000
Total RopeGrown BottomCulture

51
Figure 32. Projected average Maine mussel price per pound (ex-vessel value) under the best estimate scenario 2015 - 2030. Source: The Hale Group research Based on the volume and landed pricing research, the total value of Maine farmed mussels is projected to reach approximately $20 million by 2030 (Figure 33).
Figure 33. Projected total landed value of Maine farmed mussels ($USD) 2015 - 2030. Source: The Hale Group research In total, including both farmed and wild sourcing, Maine’s mussel harvest is projected to approximately double in landed value to almost $30 million by 2030. Based on growth projections, Maine’s farmed mussel value will surpass wild during the last five years of the planning horizon (Figure 34).
$0.98 $1.07 $1.17 $1.26
$2.10 $2.10 $2.00 $1.90
$1.55 $1.55 $1.47 $1.40
$0.90 $0.90 $0.86 $0.81
$-
$0.50
$1.00
$1.50
$2.00
$2.50
Average RopeGrown BottomCulture Wild
$2,395
$3,619$5,428
$7,509$4,881
$10,508
$18,633
$5,740
$14,006
$27,063
$-
$5,000
$10,000
$15,000
$20,000
$25,000
$30,000
Base Low Best High

52
Figure 34. Projected total Maine mussel revenue 2015 - 2030. (best estimate scenario). Source: The Hale Group research By the end of the planning horizon, Maine farmed rope-grown mussels are projected to deliver approximately $15 million in landed value, while farmed bottom-culture mussels are projected to account for almost $4 million (Figure 35).
Figure 35. Projected Maine farmed mussel revenue 2015 - 2030 (best estimate scenario). Source: The Hale Group research
$14,194$16,388
$21,180
$28,531
$2,395$4,881
$10,508
$18,633
$11,799 $11,507$10,672 $9,898
$-
$5,000
$10,000
$15,000
$20,000
$25,000
$30,000
Total Farmed Wild
$2,395
$4,881
$10,508
$18,633
$1,155$3,254
$8,046
$14,946
$1,240 $1,627 $2,461 $3,687$-
$2,000$4,000$6,000$8,000
$10,000$12,000$14,000$16,000$18,000$20,000
Total RopeGrown BottomCulture

53
SEA SCALLOP (Placopecten magellanicus)
i. Species Overview
The U.S. scallop industry has a much less developed aquaculture infrastructure and less data than exists for the oyster and mussel sectors; so this section relies more on qualitative research and assumptions, which are identified throughout. The scallop growth projections identified in the report assume development of a scallop aquaculture infrastructure in Maine. Without which, the supply projections will be difficult to attain. The U.S. scallop market, which represents an approximately $380 million landed value, has declined in recent years due to reductions in the Federal quotas that are used to manage the scallop biomass at sustainable levels. The reduction in offshore supply has led to an increased interest in local day-boat scallops, which may serve as a proxy for potential interest in farmed scallops. Per the Maine DMR, the large majority (90+%) of Maine scallop landings are day-boat, or in-shore. Given the imbalance between supply and demand, scallop prices have been at or near record levels recently. While pricing is anticipated to remain relatively high based on historical levels, prices are expected to begin to moderate over the planning horizon. Despite strong consumer demand and shrinking supply, aquaculture initiatives have not yet gained scale in the scallop market. There is broad consensus that the scallop market is well suited for aquaculture. There is also recognition that farmed scallop techniques need to be tested and optimized before sufficient scale can be achieved. Developing these capabilities and supporting the testing requirements for Scallops, will require an investment in time and resources to achieve sufficient scale. There is a large import market for smaller scallops, primarily from China, Japan and Argentina. These frozen products represent an additional $350 million in value. Similar to the other shellfish species, there is broad consensus that Maine-branded scallops command a premium due to their high quality and the positive associations with Maine. Additionally, since the majority of Maine scallops are day-boat sourced, there is a perception of higher quality among some restaurant operators and wholesalers / distributors relative to some of the off-shore scallops that are landed at other New England states.
ii. Market Size and Growth The total U.S. scallop marketplace is estimated to be approximately 250 million whole pounds and 30 million meat pounds (Figure 36), with a landed value of approximately $380 million (Table 25). In the U.S., the majority of scallops are sourced from Massachusetts and New Jersey.

54
The U.S. scallop supply has declined as federal quotas have restricted offshore access and larger day boat scallops are reportedly becoming scarcer.
Figure 36. US scallop supply volume trends in whole pounds (000) 2008 - 2015. Source: The Hale Group research, Maine DMR, ACCSP In total, Maine accounts for less than 2% of scallop volume, yet commands the highest average price per meat pound (Table 25). Per the Maine DMR, the vast majority (90+%) of Maine scallops are from inshore fisheries harvested via day-boat operations. Table 25. Scallop regional supply dynamics in 2015
iii. Imports – All Formats A significant volume of smaller, frozen scallops are imported, primarily from Asia and South America (Figure 37). China is the volume leader, while Japan imports have the greatest value. In total, U.S. scallop imports exceed 40 million pounds with a value of $350 MM, almost equaling U.S.-produced value (Figure 38).
348,455
377,341389,872
409,426413,594
300,605
247,818
253,254
-
50,000
100,000
150,000
200,000
250,000
300,000
350,000
400,000
450,000
2008 2009 2010 2011 2012 2013 2014 2015
ME MA NJ CT USTotal
State Volume –Whole Lbs.
(000)
Volume –Meat Lbs.
(000)
Value -$USD (000)
Value Per Meat Pound
Maine 3,772 452 $5,749 $12.70Massachusetts 179,297 21,522 $264,941 $12.31New Jersey 65,393 7,847 $97,856 $12.47Connecticut 4,803 576 $7,032 $12.20Grand Total 253,266 30,397 $375,579 $12.36
Source: The Hale Group research, Maine DMR, ACCSP

55
Figure 37. US marketplace scallop imports for 2015 in meat pounds (000). Source: The Hale Group research, NMFS
Figure 38. Value of imported scallops in the US marketplace for 2015 (000$). Source: The Hale Group research, NMFS
5,962,926
19,758,67110,366,694
2,110,011 5,715,660
Canada
China
Japan
Peru
Argentina
$67,940
$77,177$119,067
$12,934 $30,914
Canada
China
Japan
Peru
Argentina

56
iv. Seasonality Scallop demand remains strong year-round, while supply tends to peak during the early periods of the harvesting seasons
• Maine: December – April • Massachusetts: November - March • Federal: March - February
All research findings support the hypothesis that there is an opportunity for farmed scallops to support wild harvest by providing year-round inventory after wild scallop harvest inventory has been diminished. Given the strong demand for Maine’s in-shore scallops and accompanying high pricing, this suggests that Maine farmed scallops could be a viable source for high-quality scallops during lulls in the wild fishery.
v. Quota Projections The marine resource agencies in Massachusetts and Maine believe that Federal quotas, while difficult to predict, will remain essentially flat for the next few years as the biomass is carefully managed. There is no expectation that overall scallop capacity will increase significantly in the near-to-medium term. Research respondents were not able to provide long term projections given the uncertainty of the scallop biomass status. It is The Hale Group’s position that scallop demand will continue to outstrip supply until either an aquaculture infrastructure is developed to significantly increase supply, or pricing reaches a point where restaurant operators and consumers switch to other seafood proteins and demand falls to levels below supply capacity. There is no evidence of scallop demand beginning to soften from current levels.
vi. Growth Projections - National Unless there are unforeseen increases in scallop quotas or rapid development of an aquaculture infrastructure, the scallop supply is projected to remain flat to slightly down (Low growth scenario). Given the demand for scallops and high market prices, the mid-point and high growth scenarios assume that a scallop aquaculture industry will be developed over the next 3 – 5 years, and will begin to gain market share over the mid and end stages of the planning horizon. Given its growing environment and theoretical capacity, it is assumed that Maine will be the leader in scallop aquaculture if it is to be developed in the U.S. Based on best estimate supply and demand projections, scallop supply is projected to significantly lag demand over the planning horizon. As a benchmark of recent demand, U.S. per capita scallop consumption was 19 lbs. / 100 people in 2011 and dropped to 11 lbs. / 100 people

57
by 2015 due to supply constraints. The primary Supply & Demand assumptions include supply growth in all primary markets at the following levels (Table 26). Table 26. Scallop Regional Growth Rate Projections. Source: The Hale Group research, ACCSP, Maine DMR
Note: Growth projections are based on analysis of anticipated future demand and supply growth dynamics; not derived from past growth trends. Table 27. Scallop Supply Growth Assumptions
• Demand: If base demand is set at 2011 per capita consumption levels, and federal quotas increase at a modest +0.5% annually, then domestic supply will not catch up to demand over the planning horizon. Imported scallops will continue to be required to meet overall demand. The majority of imported scallops lack the size, quality, flavor and consistency of domestically-sourced scallops, so demand for domestic scallops is projected to remain strong throughout the planning horizon. Total domestic supply will need to more than double to meet projected demand (Figure 39 & 40).
Region
CurrentSupplyMeatPounds
(000) 2015-2020 2021-2025 2026-2030Proj.2030SupplyPounds(000)
Maine 453 2.0% 8.0% 10.0% 1,183Massachusetts 21,522 0.5% 0.5% 0.5% 23,194NewJersey 7,847 0.5% 0.5% 0.5% 8,456Connecticut 576 0.5% 0.5% 0.5% 621Total 30,398 2.0% 2.2% 2.6% 33,454
AnnualCapacityGrowth
AssumptionsMaine: Developmentofaquaculturecapabilitiesbymid-pointofplanninghorizon
Modest+0.5%annualgrowthincurrentsupplybiomass(primarilyin-shorelocations)RestNorthEast Modest+0.5%annualgrowthincurrentoff-shorebiomassandfederalquotas
Minimalaquaculturedevelopmentduetowarmerwaterandlackofcapacity

58
Figure 39. US marketplace scallop supply and demand projections 2015 – 2030. Source: The Hale Group research, ACCSP, Maine DMR
Figure 40. Projected domestic-sourced scallop volume growth in meat pounds (000) 2015 - 2030. Source: The Hale Group research, ACCSP, Maine DMR Maine is particularly well-suited for scallop aquaculture growth, given the significant room for new sites and existing perception that Maine’s wild scallops are high quality. The mid-point (best) scenario assumes that Maine will be a participant in the development of a scallop aquaculture industry. The mid-point scenario, with the assumption of an aquaculture infrastructure, will enable Maine to more than double its scallop volume over the planning horizon, with rapid acceleration at the end of the planning cycle as farmed scallop capacity is expanded (Table 28). This scenario will return Maine scallop production to levels comparable to the early 1990’s.
-
10,000
20,000
30,000
40,000
50,000
60,000
70,000
80,000
DomesticSupply Imported Demand
30,398
28,908 28,908 28,908
31,201
32,211
33,454
33,562 39,133 45,851
-5,000
10,00015,00020,00025,00030,00035,00040,00045,00050,000
2015 2016 2017 2018 2019 2020 2021 2022 2023 2024 2025 2026 2027 2028 2029 2030
Base Low Best High

59
Table 28. Regional scallop growth projections
When comparing ACCSP data for landed meat pounds relative to the value per pound of scallop landings, the R Square correlation metric of .72 indicates that there is moderate correlation between supply and pricing (Table 29). This is not surprising given the fact that pricing has increased as volume (supply) declined in recent years. Table 29. Historical scallop regression analysis output, meat lbs. vs. pricing, 2005 – 2015.
Scallop pricing is projected to decline moderately over the planning horizon. The higher quality Maine scallops should be able to maintain a premium, but all prices are expected to soften from current levels (Figure 41).
Region
2015 Volume
Meat Lbs. (000)
Proj. Annual %
Chg. ’15 – ‘20
Best Proj.
2020 Vol. (000)
Proj. Annual %
Chg. ’20 – ‘25
Best Proj.
2025 Vol. (000)
Proj. Annual %
Chg. ’25 – ‘30
Best Proj.
2030 Vol. (000)
Maine 453 2% 500 8% 734 10% 1,183
Mass. 21,522 0.5% 22,065 0.5% 22,623 0.5% 23,194
New Jersey 7,847 0.5% 8,045 0.5% 8,248 0.5% 8,457
Conn. 576 0.5% 591 0.5% 605 0.5% 621Grand Total 30,398 0.5% 31,201 0.6% 32,211 0.8% 33,454
Source: The Hale Group research, Maine DMR, ACCSP
LandedYear MeatLbs. $/Lb SUMMARYOUTPUT2005 57,166,354 7.51$2006 60,308,277 6.43$ RegressionStatistics2007 58,312,844 6.61$ MultipleR 0.8470713492008 53,306,094 6.93$ RSquare 0.7175298712009 57,517,297 6.48$ AdjustedRSquare 0.6822211052010 56,962,729 7.91$ StandardError 5804805.2182011 58,719,355 9.89$ Observations 102012 56,836,993 9.83$2013 40,989,144 11.39$2014 33,677,973 12.52$2015 35,591,778 12.32$
Source:ACCSPdata RegressionStatistics

60
Figure 41. Projected U.S. scallop price per meat pound (ex-vessel value) 2015 - 2030. Source: The Hale Group research, Maine DMR, ACCSP. Based on the research findings, the total landed value of the U.S. produced scallop marketplace in the U.S. is projected to fall to less than $350 million by 2030, assuming a softening in pricing and that federal quotas are not increased more than 0.5% per year (Figure 42). This projection assumes that Maine will develop a farmed scallop infrastructure over the planning horizon to offset some of the offshore capacity constraints. Without new aquaculture capacity, there is a risk of continued declines in total value if quotas remain flat-to-down and pricing moderates.
Figure 42. Projected scallop total landed value ($USD) 2015 - 2030. Source: The Hale Group research, ECSGA, ACCSP, GSMFC
$12.36
$11.28$10.73
$9.22
$12.05$11.46
$10.36
$12.36$11.75 $11.18
$-
$2.00
$4.00
$6.00
$8.00
$10.00
$12.00
$14.00
2015 2016 2017 2018 2019 2020 2021 2022 2023 2024 2025 2026 2027 2028 2029 2030
Base Low Best High
$375,579
$326,150$310,165
$266,349
$375,962 $369,108
$346,521
$414,670$459,806
$512,340
$-
$100,000
$200,000
$300,000
$400,000
$500,000
$600,000
Base Low Best High

61
When evaluating the projected future relationship between scallop supply and pricing, there a significant correlation between volume (supply) and pricing as pricing is eventually projected to soften as domestic supply recovers modestly (Table 30). As noted earlier, domestic supply is not projected to catch up with demand for the perceived higher quality domestic scallops over the planning horizon. The U.S. scallop marketplace will remain heavily dependent on imports. Table 30. Future scallop regression analysis output: projected pounds vs pricing for total U.S 2015 - 2030. All Scallop Formats and Landings.
vii. Growth Projections - Maine As with other shellfish species, Maine is well positioned for growth within the scallop marketplace, if an aquaculture infrastructure is developed. As noted previously, mid-point estimates project that Maine’s scallop industry can almost triple over the planning horizon (Figure 43). The low growth scenario assumes minimal aquaculture infrastructure and continued supply constraints.
DomesticYear Pounds $/Lb. SUMMARYOUTPUT2015 30,398 12.36$2016 30,557 12.29$ RegressionStatistics2017 30,717 12.23$ MultipleR 0.989756692018 30,877 12.17$ RSquare 0.9796183062019 31,039 12.11$ AdjustedRSquare 0.9780504832020 31,201 12.05$ StandardError 136.98466752021 31,395 11.93$ Observations 152022 31,592 11.81$2023 31,794 11.69$2024 32,000 11.57$2025 32,211 11.46$2026 32,442 11.23$2027 32,681 11.01$2028 32,929 10.79$2029 33,186 10.57$2030 33,454 10.36$

62
Figure 43. Projected Maine scallop volume growth in meat lbs. (000) 2015 - 2030. Source: The Hale Group research, Maine DMR Pricing scenarios assume that Maine will continue to realize a price premium for Maine scallops, given their high perceived quality (Figure 44).
Figure 44. Projected average Maine scallop price per meat pound (ex-vessel). Source: The Hale Group research, Maine DMR Based on the volume and landed pricing research, the total value of Maine scallops is projected to more than double to $12+ million by 2030 (Figure 45).
453
430 430 430
500
734
1,183
500805
1,419
-
200
400
600
800
1,000
1,200
1,400
1,600
Base Low Best High
$12.70
$11.60 $11.03
$9.47
$12.39 $11.78$10.65
$12.70$12.08
$11.49
$-
$2.00
$4.00
$6.00
$8.00
$10.00
$12.00
$14.00
Base Low Best High

63
Figure 45. Projected Maine scallop total landed value ($USD) 2015 - 2030. Source: The Hale Group research, Maine DMR
[This space intentionally blank]
$5,749
$4,993 $4,748$4,077
$6,190
$8,650
$12,593
$6,348$9,722
$16,294
$-
$2,000
$4,000
$6,000
$8,000
$10,000
$12,000
$14,000
$16,000
$18,000
Base Low Best High

64
TOTAL ECONOMIC BENEFIT OF MAINE’S FARMED
OYSTER AND MUSSEL SECTORS At the request of the industry advisory committee, THG conducted a preliminary analysis of the economic benefit that the Maine farmed oysters and mussels bring to the state. The economic benefit analysis attempts to estimate the total value of Maine’s farmed shellfish industry beyond just the landed product value. The broader economic benefit includes value that is added throughout the supply chain (wholesalers, distributors, restaurants, retailers, etc.) as well as ancillary value generated by the industry through capital expenditures, wages, operating expenses, insurance, etc. The in-depth, Massachusetts Shellfish Aquaculture Economic Impact Study found that MA shellfish aquaculture generated an overall economic benefit to the state that was 1.8 X greater than the aquaculture output value. The broader economic value was generated by the ancillary elements of the aquaculture industry including:
• Employee compensation • Equipment purchases and maintenance • Supplies • Insurance • Leases • Etc.
In the absence of a more detailed analysis in Maine similar to the Massachusetts analysis, THG evaluated the potential economic value generated by Maine farmed shellfish in the supply chain-only, which was not a focus of the Massachusetts study. The supply chain-only economic benefit to Maine is estimated to be approximately $10 million (Table 31). Table 31. Estimated Maine farmed shellfish economic benefit
If the Massachusetts 1.8X factor for the other economic elements is applicable for Maine, then the non-supply chain economic benefit would be approximately $12 million (including the $6.5 million landed value). When combined with the supply chain economic benefits, the total current economic benefit of farmed shellfish in Maine is estimated to exceed $15 million.
EconomicValueEstimate $Value%inMaine
MaineIncrementalEconomicBenefit
Ex-VesselOutputValue(Allspecies) 6,500,000$Processing/Aggregating(approx.18%) 1,170,000$ 100% 1,170,000$Wholesale/DistributorPurchases 7,670,000$Wholesale/DistributorMargin(approx.12%) 920,400$ 33% 303,732$Restaurant/RetailerPurchases 8,590,400$Restaurant/RetailerMarkUp(80%FS@35%cost;20%Retail@60%cost) 21,476,000$ 10% 2,147,600$TotalIncrementalEconomicValue(Consumption/SupplyChain) 3,621,332$TotalEconomicBenefit 10,121,332$

65
OPPORTUNITY SUMMARY AND STRATEGIC
IMPLICATIONS The Farmed Shellfish Market Analysis identifies that there is significant opportunity for Maine to expand its farmed shellfish industry. Based on the “best estimate” projections, the Maine farmed shellfish industry could achieve landed revenues in excess of $30 million by 2030. Table 32: Projected Maine farmed shellfish volume & revenue potential
Achieving the business potential will require:
• Expansion of leased shellfish acreage from 608 to approximately 1,200 acres, which represents less than 0.3% of Maine’s coast territorial waters, assuming that the majority of incremental mussel acreage utilizes rope-grown techniques
• Development of efficient distribution capabilities beyond New England to achieve scale and capture year-round demand for farmed shellfish in the top U.S. markets
• Investment in scallop aquaculture infrastructure and cold-water shellfish harvesting capabilities to extend the shellfish seasons
• Leveraging Maine’s brand equity, either through “from Maine” positioning; or by developing specific farm/regional brands linked to Maine to communicate high quality and differentiate Maine’s products from competitors’
• A continual focus on achieving operational efficiencies, as pricing is projected to moderate over the planning horizon
Source: The Hale Group research
Species
2015 2030 Proj.
Volume(000)
LandedValue (000)
Volume(000)
LandedValue (000)
Oysters 7,104 pc. $4,121 18,629 pc. $9,051Mussels 1,350 lbs. $2,395 10,500 lbs. $18,633Scallops ---- ---- 500+ meat lbs. $5,000Total ME Farmed Shellfish --- $6,516 --- $32,684