Embed Size (px)
Citation preview
International Journal of Plant Production 8 (1), January 2014 ISSN: 1735-6814 (Print), 1735-8043 (Online)
www.ijpp.info GUASNR
Maize response to water, salinity and nitrogen levels: physiological growth parameters and gas exchange A. Azizian*, A.R. Sepaskhah Irrigation Department, Shiraz University, Shiraz, I.R of Iran. *Corresponding author. E-mail: [email protected] Received 16 May 2013; Accepted after revision 18 October 2013; Published online 25 November 2013
Abstract
A split-split-plot design with three replications in two years of 2009 and 2010 was conducted to investigate the effect of different levels of irrigation water (main plot), salinity of irrigation water (sub-plot) and nitrogen fertilizer rate (sub-sub-plot) on maize growth rate and gas exchange. Irrigation treatments were I1 (1.0 crop evapotranspiration (ETc)+0.25ETc as leaching), I2 (0.75I1) and I3 (0.5I1) applied at 7-day intervals. The salinity treatments of irrigation were 0.6 (fresh water), 2.0 and 4.0 dS m-1. There were also three nitrogen (N) treatments including 0, 150 and 300 kg N ha-1. Results showed that vegetative growth stage of maize in salinity stress lasted 5% more than that in water stress. The most sensitive trait under water, salinity and nitrogen stress was grain yield (GY). The optimum treatment for maize production is full fresh water application by 150 kg N ha-1. Results also showed that crop growth rate (CGR) was statistically higher in I1 and I2 as 58 and 34% relative to I3 treatment, respectively. Furthermore, CGR was statistically lower in S2 and S3 as 10 and 18% relative to S1, respectively. Besides, N application significantly increased CGR by an average of 15% as compared with no N rate. The net assimilation rate (NAR) reached its maximum value in I2, S2 and N2 relative to other treatments indicating that NAR did not necessarily occurred at maximum LAI conditions. In general, maize had statistically greater NAR in pollination and filling stages relative to other growth stages. Results of gas exchange for maize as a sensitive crop to water deficit, showed that photosynthesis rate (An) and stomatal conductance (gs) were statistically decreased in water deficit by an average of 30 and 43% as compared to full irrigation treatment, respectively. However, reduction in An and gs in salinity conditions was the same as 13% compared to no salinity treatment. Transpiration rate (T) was statistically lower under water and salinity stress by an average of 75 and 26% as compared to no water and salinity stress, respectively. The ratio of An/gs in I2 and I3 was
132 A. Azizian & A.R. Sepaskhah / International Journal of Plant Production (2014) 8(1): 131-162
statistically higher as 23% than that obtained in I1 treatment indicating that maximum amount of intrinsic water use efficiency could be achieved by water saving strategies. This result confirmed by transpiration efficiency (An/T) which was statistically higher as 40 and 14% in I3 and S3 relative to full and fresh water irrigation treatment, respectively. In general, there was a decreasing trend in An and gs toward the end of growing season, mainly due to leaves ageing. Similar pattern also occurred in measurements during a day from morning to afternoon. Furthermore, An and gs decreased as vapor pressure deficit (VPD) increased. The relationships between An and gs vs VPD in different growth stages implied that the plant ability to regulate An and gs in response to VPD at leaf level declined in the last growth stages. This indicated that the water saving strategies during last growth stage for maize is more desirable. Keywords: Gas exchange; Growth analysis; Maize; Water; Salinity and nitrogen stress. Introduction
Analysis of plant growth provides an explanatory and integrative approach to interpret the productivity of crop canopy. It uses simple primary data such as weights, areas and content of plants and plant components to investigate the processes within the whole plants and crops. Depending on the available technologies, crop canopy growth may be analyzed in term of weigh, weight distribution, leaf area, photosynthesis and gas exchange analysis.
Maize (Zea mays L.) is one of the most important cereals for human and animal consumption that is grown for grain and forage. Water and nitrogen (N) are two important resources for crop production. Maize yield responds positively to an increase in the amount of water and N applied until their optimum level (Liua and Zhang, 2007; Zand-Parsa and Sepaskhah, 2001).
Drought stress reduces plant height (Soler et al., 2007), leaf area (Pandey et al., 2000), leaf photosynthesis rate (An, Shangguan et al., 2000), shoot growth and grain yield (Zand-Parsa et al., 2006). In addition, the level of N supply affects leaf area index (LAI) and chlorophyll content (Majnooni-Heris et al., 2011). It has been reported that grain yield of maize (Tafteh and Sepaskhah, 2012) was increased by N application. Furthermore, an interaction between N and water supply has been demonstrated in crop production (Ercoli et al., 2008).
Salinity of irrigation water is also a major parameter that influences crop production. Salinity causes osmotic stress and reduction in plant growth and crop productivity in irrigated area. Salinity always affected yield,
A. Azizian & A.R. Sepaskhah / International Journal of Plant Production (2014) 8(1): 131-162 133
evapotranspiration, pre-dawn leaf water potential, stomatal conductance (gs) and leaf area of plants (Katerji et al., 2003).
Salinity and water stress reduce the ability of plant to take up water and decrease growth rate, An and gs of plants (Jensen et al., 1996; Huang and Redmann, 1995). Photosynthesis rate is reduced by increase in salinity level as a result of lower stomatal conductance, depression in specific metabolic processes in carbon uptake, inhibition in photochemical capacity, or a combination of these phenomena (Ashraf, 2001). There was positive relationship between An and gs (Ahmadi et al., 2010). In addition, genetic variation for An and gs among crop cultivars and highly significant correlation between An and gs emphasizes that An and gs could be used as effective selection criteria for salt tolerance variety (Ulfat et al., 2007). Effect of deficit irrigation and salinity on An and gs are not similar so that gs declined more rapidly than An under water and salinity stresses (Ahmadi et al., 2010; Flexas and Medrano, 2002). Furthermore, environmental conditions such as vapor pressure deficit (VPD) can affect An and gs (Tafteh and Sepaskhah, 2012; Sepaskhah and Tafteh, 2012; Ahmadi et al., 2010; Addington et al., 2004). The decline in leaf growth occurred as earliest response to salinity and water stress in plant that resulted in reduction of growth rate and dry matter production (Cramer, 2002). Deficit irrigation and salinity reduced dry matter production and leaf area index of maize (Amer, 2010). This is important since maize is cultivated as forage crop for livestock (Gheysari et al., 2009). Interaction effect of irrigation and salinity levels on maize was studied by Amer (2010). He reported that leaf temperature, transpiration rate and stomatal resistance of maize were significantly affected by irrigation and salinity levels and their interaction.
Most salinity and N interaction studies in the field were conducted on soils deficient in N. Therefore, additions of N improved growth and/or maize yield when the degree of salinity was not severe. Grattan and Grieve (1999) stated that N-fertilization did not increase crop salt-tolerance. In other words, N application above an optimum level under non-saline conditions did not increase crop yield. They also pointed out that the interactive nature of salinity and other stresses affected nutrient availability, uptake and distribution. These topics are highly complex in the absence of salinity while, the presence of salinity stress adds a new level of complexity to the mineral nutrition of crops.
However, information about the interaction effect of irrigation water, salinity and N on maize growth, yield production, photosynthesis and leaf
134 A. Azizian & A.R. Sepaskhah / International Journal of Plant Production (2014) 8(1): 131-162
gas exchange and their relationships are limited and needs to be known in the management of crop production. This approach of growth analysis provides a holistic, explanatory and integrative method to interpret the plant functions. The objectives of this study were to evaluate the effect of salinity, irrigation and N levels on some aspects of maize physiological growth parameters and its photosynthesis including: dry matter production, growth rate indices, leaf area index, photosynthesis rate and gas exchange, grown in a semi-arid region of Iran in a silty clay loam soil. Materials and Methods Site description
This study was conducted in 2009 and 2010 at the Bajgah Agricultural Experiment Station located at 29°56’ N, 52°02’ E and 1810 m above the mean sea level, in southwest of Iran with a semi-arid climate. Long-term mean air temperature, precipitation and relative humidity of the region are 13.4 °C, 387 mm and 52.2%, respectively. Soil of the experimental site was classified as silty clay loam for 0.60 m of soil profile. Physico-chemical properties of the soil are presented in Table 1. Chemical analysis of the fresh and saline irrigation water is also shown in Table 2. Table 1. Physico-chemical properties of the soil used in the experiment (average of two years).
Characteristic Amount Depth (cm) 0-30 30-60 Texture SCL* SCL % Caly 52.5 53.8 %Silt 34.0 35.5 Field capasity (-0.03 Mpa) (%) 31 30 Permanent wilting point (-1.5 Mpa) (%) 18 19 Bulk density (Mg m-3) 1460 1560 EC (dS m-1) 0.65 0.55 pH (sturated past) 7.50 7.45 Organic matter (%) 0.7 0.5 Total Nitrogen (%) 0.021 0.009 NO3-N (mg L-1) 4.6 6.0 Available P (mg L-1) 21.0 11.0 Available K (mg L-1) 343.0 315.0
* Silty clay loam.
A. Azizian & A.R. Sepaskhah / International Journal of Plant Production (2014) 8(1): 131-162 135
Table 2. Chemical analysis of the fresh and saline irrigation water used in the experiment (average of two years).
Characteristic Fresh water Saline water EC (dS m-1) 0.60 2.00 4.00 pH 7.80 7.70 7.80 Cl-1 (meq L-1) 1.81 17.27 40.37 Na+ (meq L-1) 1.74 18.9 30.3 Ca2+ (meq L-1) 2.15 16.17 39.41 Mg2+ (meq L-1) 2.00 2.00 2.00 HCO3
- (meq L-1) 1.97 4.99 4.64
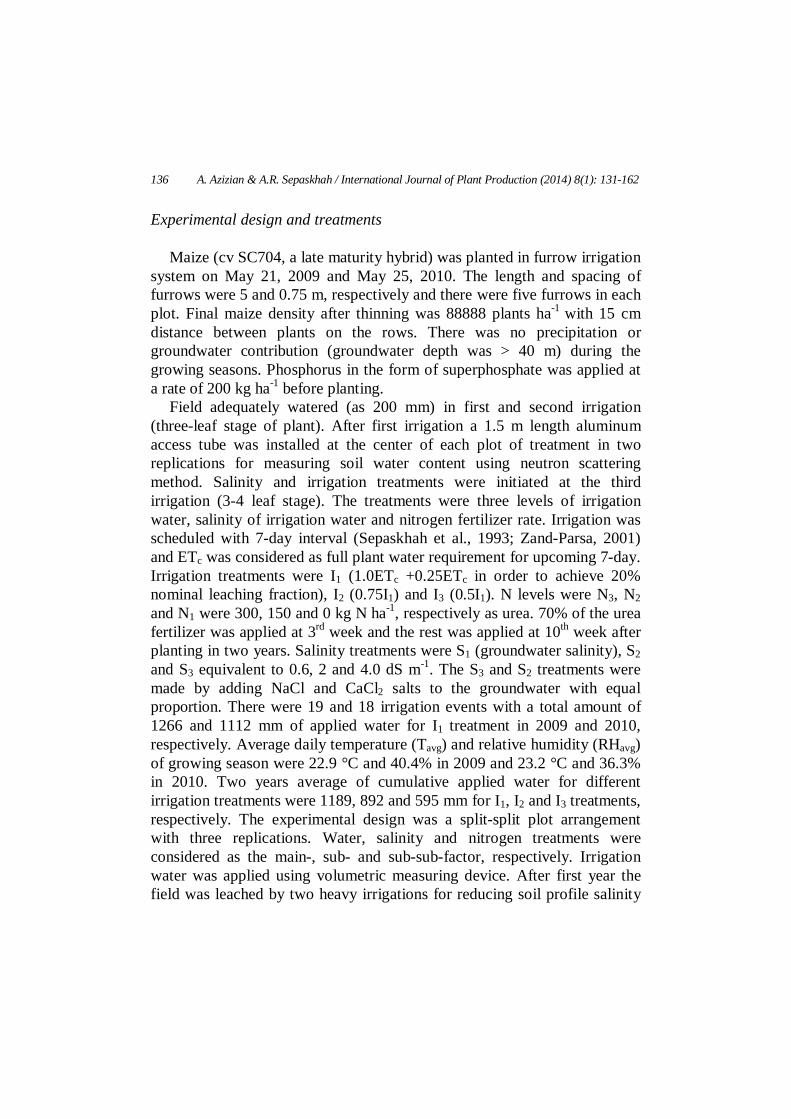
Reference evapotranspiration (ETo) in the study area is calculated using modified FAO-Penman-Monteith method (Razzaghi and Sepaskhah, 2012) with collected meteorological data in a standard weather station at the Agricultural College located nearby the experimental field. Mean daily air temperature (Tavg), relative humidity (RHavg) and ETo during growing period in 2009 and 2010 are shown in Figure 1. Crop evapotranspiration of maize (ETc) calculated by multiplying ETo and modified crop coefficient (Kc) in the study area (Shahrokhnia and Sepaskhah, 2013).
Figure 1. Daily mean air temperature (Tavg), relative humidity (RHavg) and reference evapotranspiration (ETo) during growing period in 2009 (a) and 2010 (c); cumulative applied water for different irrigation treatments (1.25ETc: I1, 0.75I1: I2, 0.5I1: I3) and cumulative growing degree day (GDD) in 2009 (b) and 2010 (d).
136 A. Azizian & A.R. Sepaskhah / International Journal of Plant Production (2014) 8(1): 131-162
Experimental design and treatments
Maize (cv SC704, a late maturity hybrid) was planted in furrow irrigation system on May 21, 2009 and May 25, 2010. The length and spacing of furrows were 5 and 0.75 m, respectively and there were five furrows in each plot. Final maize density after thinning was 88888 plants ha-1 with 15 cm distance between plants on the rows. There was no precipitation or groundwater contribution (groundwater depth was > 40 m) during the growing seasons. Phosphorus in the form of superphosphate was applied at a rate of 200 kg ha-1 before planting.
Field adequately watered (as 200 mm) in first and second irrigation (three-leaf stage of plant). After first irrigation a 1.5 m length aluminum access tube was installed at the center of each plot of treatment in two replications for measuring soil water content using neutron scattering method. Salinity and irrigation treatments were initiated at the third irrigation (3-4 leaf stage). The treatments were three levels of irrigation water, salinity of irrigation water and nitrogen fertilizer rate. Irrigation was scheduled with 7-day interval (Sepaskhah et al., 1993; Zand-Parsa, 2001) and ETc was considered as full plant water requirement for upcoming 7-day. Irrigation treatments were I1 (1.0ETc +0.25ETc in order to achieve 20% nominal leaching fraction), I2 (0.75I1) and I3 (0.5I1). N levels were N3, N2 and N1 were 300, 150 and 0 kg N ha-1, respectively as urea. 70% of the urea fertilizer was applied at 3rd week and the rest was applied at 10th week after planting in two years. Salinity treatments were S1 (groundwater salinity), S2 and S3 equivalent to 0.6, 2 and 4.0 dS m-1. The S3 and S2 treatments were made by adding NaCl and CaCl2 salts to the groundwater with equal proportion. There were 19 and 18 irrigation events with a total amount of 1266 and 1112 mm of applied water for I1 treatment in 2009 and 2010, respectively. Average daily temperature (Tavg) and relative humidity (RHavg) of growing season were 22.9 °C and 40.4% in 2009 and 23.2 °C and 36.3% in 2010. Two years average of cumulative applied water for different irrigation treatments were 1189, 892 and 595 mm for I1, I2 and I3 treatments, respectively. The experimental design was a split-split plot arrangement with three replications. Water, salinity and nitrogen treatments were considered as the main-, sub- and sub-sub-factor, respectively. Irrigation water was applied using volumetric measuring device. After first year the field was leached by two heavy irrigations for reducing soil profile salinity
A. Azizian & A.R. Sepaskhah / International Journal of Plant Production (2014) 8(1): 131-162 137
during winter season. The arrangement of the experimental treatments in the field in second year (2010) was the same as that in first year. Measurements and calculations Growth
Leaf area index (LAI), dry matter and grain yield (DM/GY, oven dried at 70 °C until constant weight) production were measured from 3-6 plants during the growing season at 30-day intervals. Development stages of plant in each treatments were also recorded using a standardized maize development stage system (Ritchie et al., 1992) and the date was recorded at which 50% or more of the maize plants in each plot reached the vegetative (VS) and reproductive (RS) stages as: planting time (PT), emergence stage (VE), tasseling stage (VT), silking stage (R1) and physiological maturity stage (R6). Relative chlorophyll concentration of maize leaves was measured using a SPAD-502 (Minolta, Japan) portable chlorophyll meter. Measurements were started at 6-leaf stage (V6) of maize growth, one week before second part of N application and continued in the reproductive period with about 2 week interval. Chlorophyll meter readings were obtained on the latest fully developed leaf of 5 plants in each plot.
On the basis of dry matter accumulation, the values for crop growth rate (CGR, g crop m-2 d-1), relative growth rate (RGR, d-1) and net assimilation rate (NAR, g crop m-2 leaf d-1) were calculated by the following equations (Zhao et al., 2007): CGR = (W2 - W1)/(T2 - T1) (1) RGR = (lnW2 - lnW1)/(T2 - T1) (2)
NAR=CGR*[ln(LA2)-ln(LA1)]/(LA2-LA1) (3)
Where W, LA and T are shoot dry matter (g m-2), leaf area (cm2) and measuring time (day), respectively. The numbers 1 and 2 refer to two successive measuring times.
Plants were harvested on October 11 in two years from three middle rows of each plot with 4 m length and oven dried at 70 °C (until constant weight). Total DM and grain yield (GY, at 15% moisture content) were measured.
138 A. Azizian & A.R. Sepaskhah / International Journal of Plant Production (2014) 8(1): 131-162
Gas exchange
Leaf gas exchange measurements including leaf surface temperature (Tl), net photosynthesis (An), stomatal conductance (gs), transpiration rate (T) and intercellular CO2 concentration (Ci) were made in one replication under clear sky, three times per day (8:30 am, 10:30 am and 12:30 pm) at the middle of the four stage of the plant growth (vegetative, pollination, filling and ripening). Within each plot, two fully expanded leaves from the top of the plant were chosen for measurement using a LCi analyzer (Li-Cor Inc, Nebraska, USA).
Vapor pressure deficit (VPD) between leaf and air was calculated by the following equation: VPD = es- ea (4)
Where es is the saturation vapor pressure (kPa) at the leaf temperature and ea is the actual water vapor pressure (kPa) at the outside air. In Eq. (4), it is assumed that air is saturated within stomata. Saturated vapor pressure at the leaf and air was calculated by the following equation (Allen, 2005):
3.23727.17exp611.0
TTes (5)
Where T is the air temperature (°C) in and out of the leaf. Actual vapor
pressure at the outside air was calculated by the following equation:
sa eRHe (6)
where RH is the outside air relative humidity. Results and Discussion
There was no significant effect of year on measured parameters. Therefore, mean values of the parameters between two years were considered in the analysis. The planting date in 2010 was 4 days later than 2009. As a result, the length of growing season was 138 days in 2009 and 134 days in 2010. Soil profile of the field in 2010 was slightly more saline than 2009; however, it was still below the maize threshold (ECthreshold=1.7 dS m-1, Mass and Hoffman, 1977). The plants treated with saline water were
A. Azizian & A.R. Sepaskhah / International Journal of Plant Production (2014) 8(1): 131-162 139
shorter and showed old leaf chlorosis symptoms especially at later period of the growing season. Crop development stages
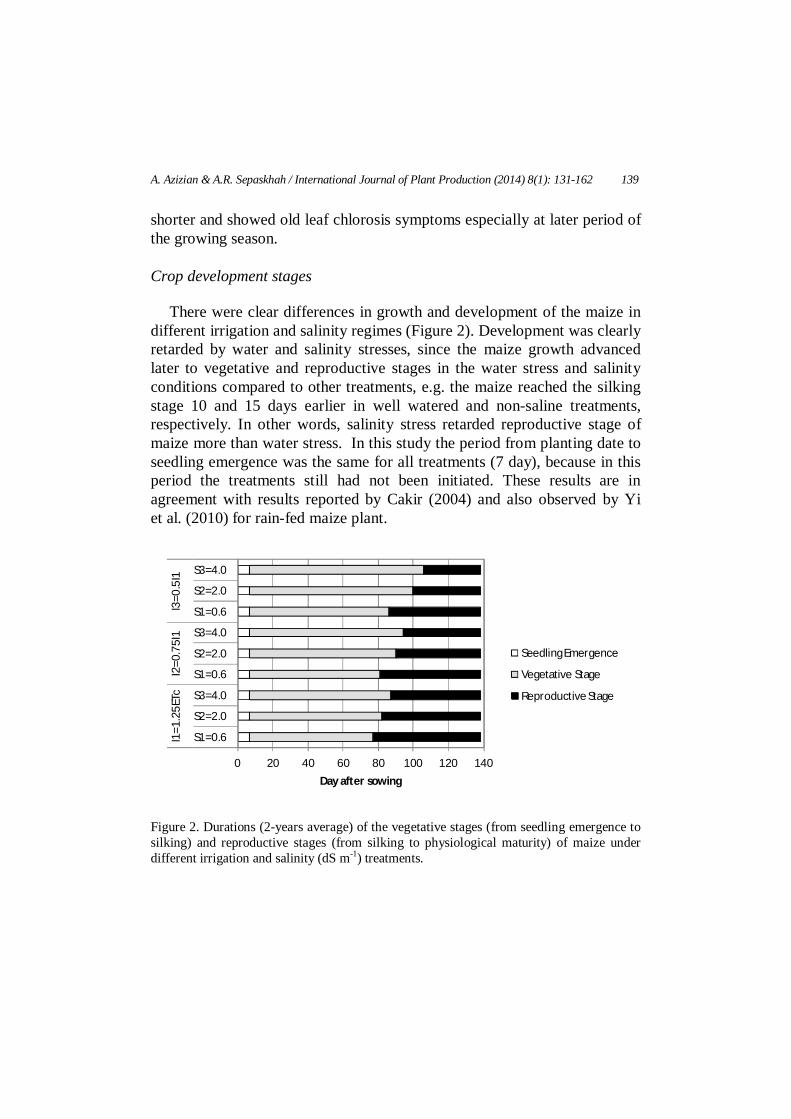
There were clear differences in growth and development of the maize in different irrigation and salinity regimes (Figure 2). Development was clearly retarded by water and salinity stresses, since the maize growth advanced later to vegetative and reproductive stages in the water stress and salinity conditions compared to other treatments, e.g. the maize reached the silking stage 10 and 15 days earlier in well watered and non-saline treatments, respectively. In other words, salinity stress retarded reproductive stage of maize more than water stress. In this study the period from planting date to seedling emergence was the same for all treatments (7 day), because in this period the treatments still had not been initiated. These results are in agreement with results reported by Cakir (2004) and also observed by Yi et al. (2010) for rain-fed maize plant.
0 20 40 60 80 100 120 140
S1=0.6
S2=2.0
S3=4.0
S1=0.6
S2=2.0
S3=4.0
S1=0.6
S2=2.0
S3=4.0
I1=1
.25E
TcI2
=0.7
5I1
I3=0
.5I1
Day after sowing
Seedling Emergence
Vegetative Stage
Reproductive Stage
Figure 2. Durations (2-years average) of the vegetative stages (from seedling emergence to silking) and reproductive stages (from silking to physiological maturity) of maize under different irrigation and salinity (dS m-1) treatments.
140 A. Azizian & A.R. Sepaskhah / International Journal of Plant Production (2014) 8(1): 131-162
Growth parameters
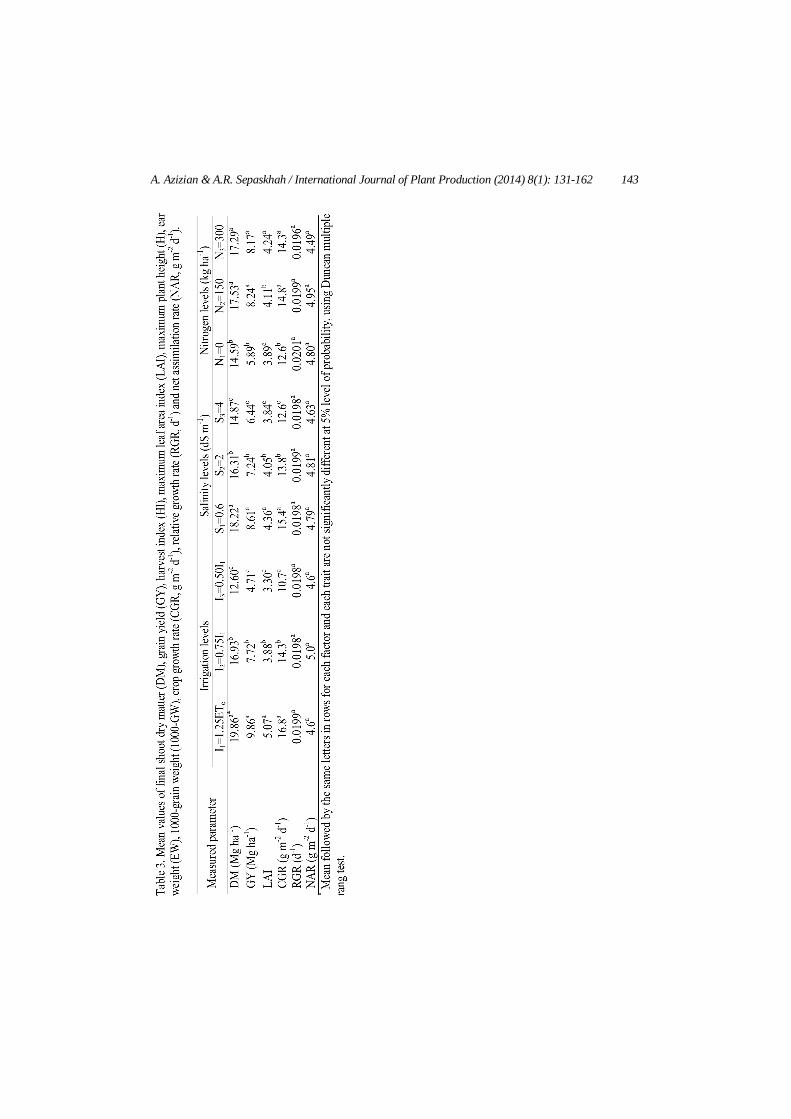
Main growth parameters under different experimental treatments are shown in Table 3. Dry matter and GY statistically increased with increasing water levels and with nitrogen application, whereas, increasing salinity levels of irrigation water statistically decreased DM and GY (P<0.05, Table 3). Maize produced less DM (57.6%) and GY (52.3%) at water stress conditions (I3=0.5I1 treatment) compared to the no water stress treatment (I1=1.25ETc). The corresponding values for the highest salinity stress treatment (S3=4.0 dS m-1) were 22.5 and 18.5%, respectively relative to non-saline treatment (S1=0.6 dS m-1). While, the reduction percent in DM and GY in nitrogen stress treatment (N1=0 kg ha-1) were 33.7 and 38.7%, respectively as compared to the highest N application rate (N3=300 kg ha-1). GY reduction of maize under N stress was also reported by Tafteh and Sepaskhah (2012).
Maximum plant LAI statistically increased and decreased with increasing irrigation and salinity levels, respectively (Table 3). This growth parameter of maize was more affected by drought relative to salinity and N stress conditions, since, the LAI of maize reduced 34.9, 11.9 and 8.3% under water (0.5I1), salinity (4.0 dS m-1) and nitrogen (0 kg ha-1) stress, respectively.
In general, based on presented results, the optimum treatment for maize production is full fresh water application by 150 kg N ha-1. Dry matter accumulation and leaf area index variation
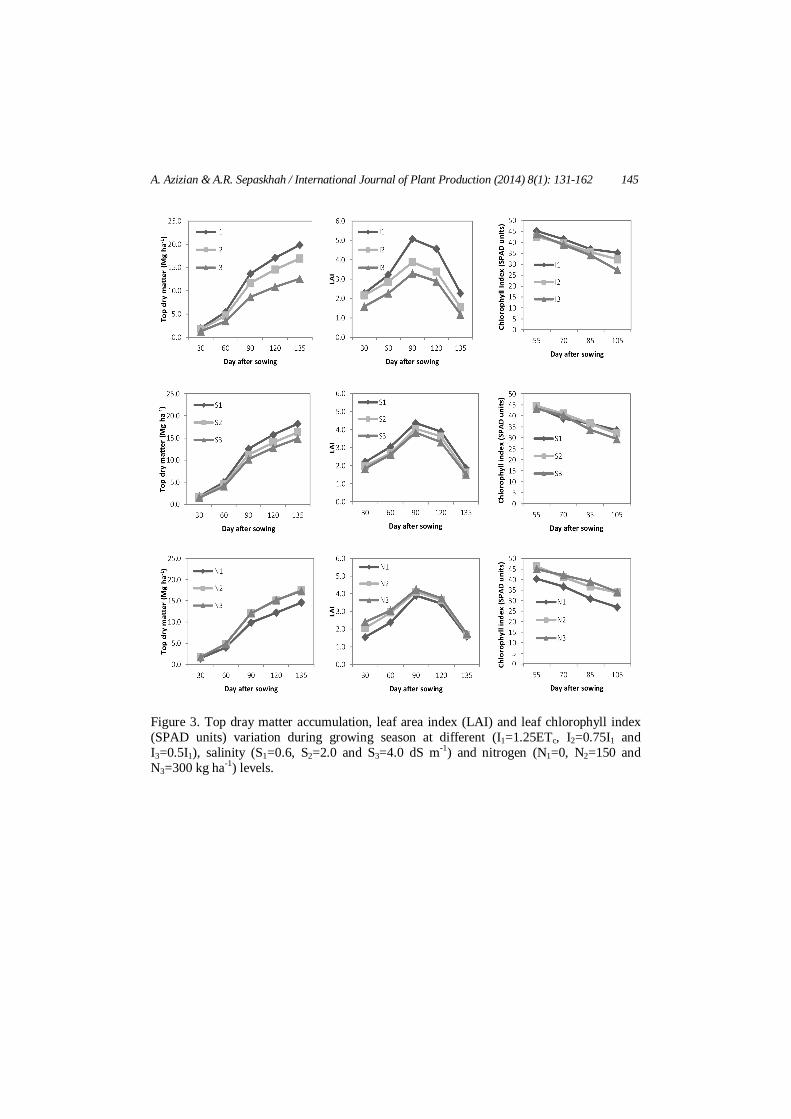
Total crop dry matter is the spatial and temporal integration of all plant processes and therefore, crop dry matter is the most relevant parameter in the study of crop canopies. Rate of dry matter accumulation varies across the life cycle of a crop and dry matter and leaf area are sampled at intervals ranging from days to weeks to quantify effects of environmental influences or to analyze genotypic differences between crop cultivars. In growth analysis two basic measurements are made, dry weight and leaf area and a large number of parameters are derived from these measurements such as LAI, CGR, RGR and NAR. Figure 3 shows DM accumulation and LAI variation at different water, salinity and nitrogen levels. Top DM and LAI were greater at full irrigation (I1=1.25ETc) and fresh water treatment (S1=0.6 dS m-1) during growing season. Top DM accumulation and LAI were
A. Azizian & A.R. Sepaskhah / International Journal of Plant Production (2014) 8(1): 131-162 141
markedly higher by N application; however there was no clear difference between DM and LAI in 150 and 300 kg N ha-1. LAI reached its maximum value at 90 days after planting and then decreased toward the end of season. The pattern of rate of dry matter accumulation of maize canopy is similar to a sigmoid curve (Figure 3). Three distinct phases can be distinguished: (i) a period of exponential growth during early development (from planting until 60 days after planting), followed by (ii) a period of fairly constant rate (like linear pattern) DM accumulation (between 60 and 90 days after planting), and (iii) a period of declining crop growth rates during the final phase of development when green leaf area declines (Figure 3) due to leaf senescence and leaf photosynthesis decline (which is discussed later and showed in Figure 6) due to leaf ageing (from 90 days after planting to end of growing season). The pattern of DM accumulation under different water, salinity and nitrogen treatments were similar and concrescent with LAI variation. Irrespective to the experimental treatments, maize accumulated approximately 27 and 42% of total seasonal DM during the first and second phase of growth, respectively, whereas it accumulated about 30% of the total seasonal DM in third phase of growth. Rates of dry matter accumulation started to decline due to plant ageing during the final phase of development. The decline in the rate of dry matter accumulation during this phase is associated with functional and visual leaf senescence. Functional leaf senescence is the decline in photosynthesis per unit leaf area due to aging (showed in Figure 6 and is discussed later). Visible leaf senescence is the loss of chlorophyll (SPAD units) in the leaf (Figure 3). Whereas no photosynthesis will occur in a leaf that has lost all its chlorophyll, a leaf that has retained all its chlorophyll does not necessarily maintain its rate of photosynthesis. Figures 3 and 6 shows this fact that leaf photosynthesis (An) declines during the grain-filling period of maize, even if chlorophyll content remain still high under a high N fertilizer level (150 and 300 kg ha-1). These results are in accordance to those reported by Echarte et al. (2008) for maize in North America. Growth rate indices
Growth rate indices including CGR, RGR and NAR under different experimental treatments were calculated using Eqs. (1) to (3) (Table 3). Variations of these indices during growing season are dependent on
142 A. Azizian & A.R. Sepaskhah / International Journal of Plant Production (2014) 8(1): 131-162
environmental factors such as soil, water and weather conditions and also on plant growth stage. Results showed that CGR was significantly higher at I1 and I2 treatments as 58 and 34% relative to deficit irrigating treatment (I3), respectively. Furthermore, this index was statistically lower by saline water application as 10 and 18% in S2 and S3 relative to fresh (S1) water treatment, respectively. N application statistically increased maize CGR by an average of 15% as compared with no N application rate, however there was no statistically difference between CGR in these two N rates. Results also confirmed that maize had greatest CGR by N rate of 150 kg ha-1. There was also no statistically difference among RGR and NAR values in different water, salinity and nitrogen levels, however the NAR index had its maximum value under I2, S2 and N2 levels relative to other water, salinity and nitrogen treatments. In other words, DM production per unit of leaf area was slightly higher under moderate water, salinity and nitrogen stresses and confirmed this fact that NAR did not necessarily occurred at maximum LAI conditions.
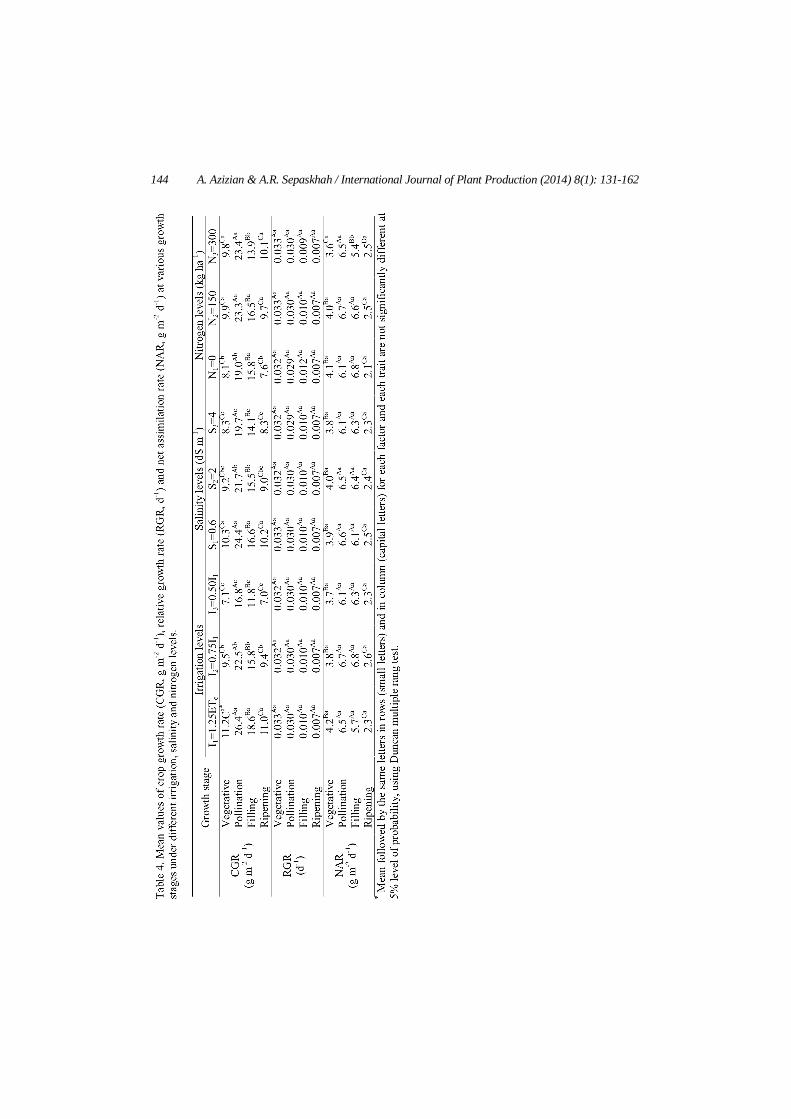
Growth rate indices in different growth stages under different water, salinity and N levels are presented in Table 4. A significant increase in maize CGR was observed with increasing irrigation levels in different growth stages with an average increase of 57% relative to deficit irrigation (I3); while CGR statistically decreased with increasing salinity levels of irrigation water in different growth stages. The reduction in CGR due to salinity varied from 15% in filling stage to 19% in ripening and vegetative stages in S3 relative to S1 treatment. Furthermore, CGR was statistically higher by N fertilizer application relative to no N fertilization in vegetative, pollination and ripening stages; however maize had statistically lower CGR with 300 kg N ha-1 in the filling stage as compared to other N rates. The RGR index had no significant difference among water, salinity and nitrogen levels in different growth stages (Table 4). There was also no significant difference among NAR of maize in various growth stages under water, salinity and nitrogen levels. In general, maize had statistically greater NAR in pollination and filling stages relative to other growth stages in different water, salinity and nitrogen levels. In other words, the amount of dry matter produced by photosynthesis per unit of leaf area was statistically higher in pollination and grain filling stages.
A. Azizian & A.R. Sepaskhah / International Journal of Plant Production (2014) 8(1): 131-162 143
144 A. Azizian & A.R. Sepaskhah / International Journal of Plant Production (2014) 8(1): 131-162
A. Azizian & A.R. Sepaskhah / International Journal of Plant Production (2014) 8(1): 131-162 145
Figure 3. Top dray matter accumulation, leaf area index (LAI) and leaf chlorophyll index (SPAD units) variation during growing season at different (I1=1.25ETc, I2=0.75I1 and I3=0.5I1), salinity (S1=0.6, S2=2.0 and S3=4.0 dS m-1) and nitrogen (N1=0, N2=150 and N3=300 kg ha-1) levels.
146 A. Azizian & A.R. Sepaskhah / International Journal of Plant Production (2014) 8(1): 131-162
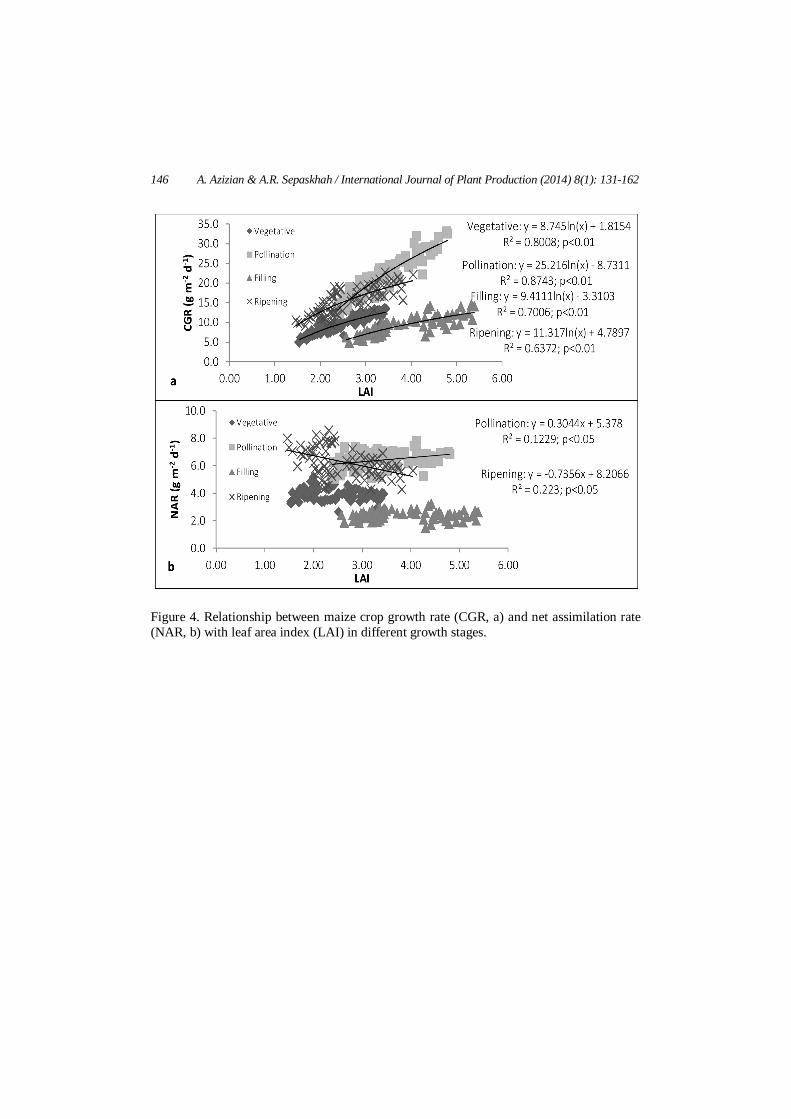
Figure 4. Relationship between maize crop growth rate (CGR, a) and net assimilation rate (NAR, b) with leaf area index (LAI) in different growth stages.
A. Azizian & A.R. Sepaskhah / International Journal of Plant Production (2014) 8(1): 131-162 147
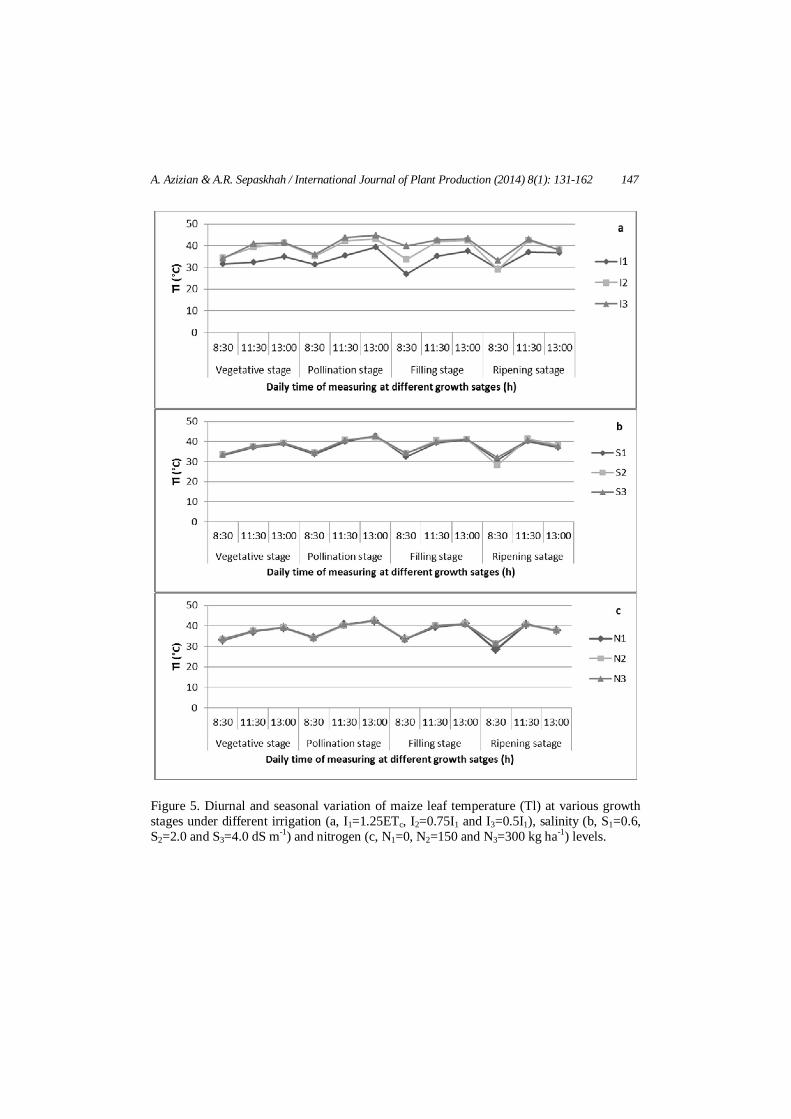
Figure 5. Diurnal and seasonal variation of maize leaf temperature (Tl) at various growth stages under different irrigation (a, I1=1.25ETc, I2=0.75I1 and I3=0.5I1), salinity (b, S1=0.6, S2=2.0 and S3=4.0 dS m-1) and nitrogen (c, N1=0, N2=150 and N3=300 kg ha-1) levels.
148 A. Azizian & A.R. Sepaskhah / International Journal of Plant Production (2014) 8(1): 131-162
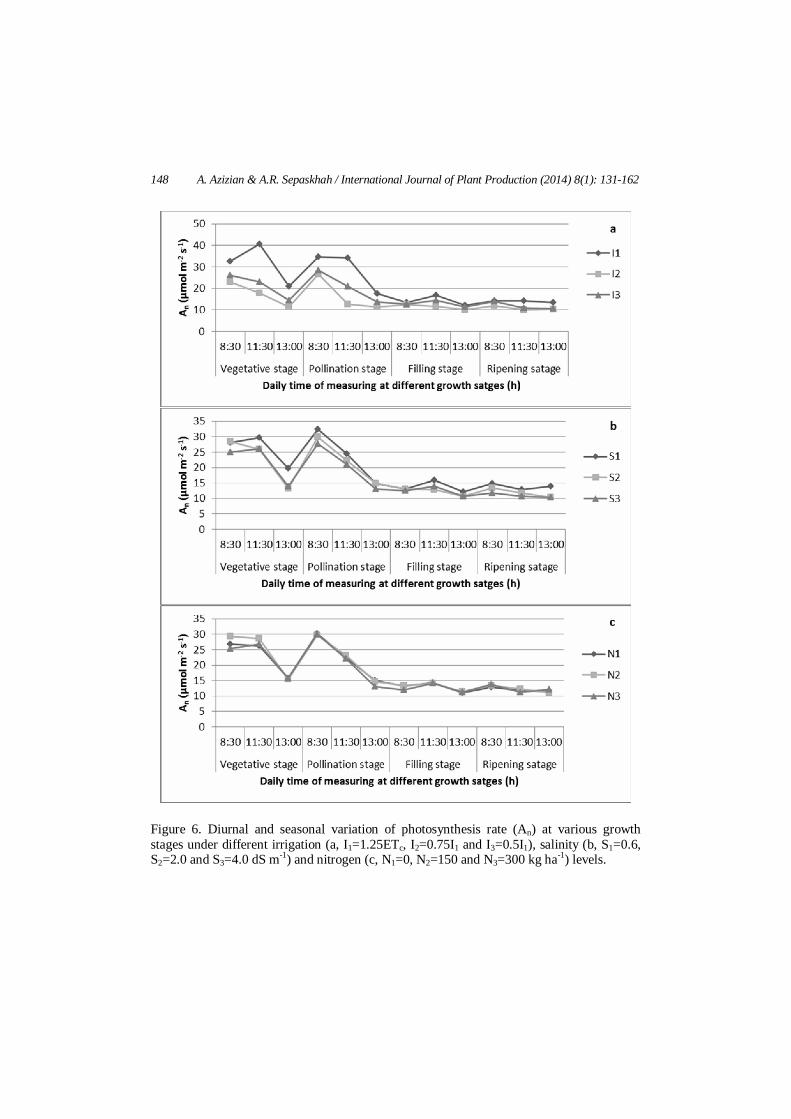
Figure 6. Diurnal and seasonal variation of photosynthesis rate (An) at various growth stages under different irrigation (a, I1=1.25ETc, I2=0.75I1 and I3=0.5I1), salinity (b, S1=0.6, S2=2.0 and S3=4.0 dS m-1) and nitrogen (c, N1=0, N2=150 and N3=300 kg ha-1) levels.
A. Azizian & A.R. Sepaskhah / International Journal of Plant Production (2014) 8(1): 131-162 149
Growth rate and leaf area index relationship
Figure 4 shows the relationship (best fit) between CGR/NAR and LAI in different growth stages. These relationships were not markedly different under various water, salinity and nitrogen levels. Maize CGR showed an increasing trend by raising its LAI in each growing stages (Figure 4a). Maize CGR increased more rapidly in the pollination stage with increasing LAI relative to other growth stages to a maximum of 33.2 g m-2 d-1 at the LAI of 4.8. A maximum value of 13.6, 22.8 and 14.5 g m-2 d-1 for CGR occurred at the LAI of 3.4, 5.4 and 4.0 in vegetative, filling and ripening stages, respectively. Dry matter accumulation and consequently CGR, depends on photosynthesis rate. Shabani et al. (2013) reported similar results for rapeseed irrespective to water, salinity treatment and planting methods. The close relationship between CGR and LAI is due to the fact that photosynthesis and dry matter accumulation is strongly dependent on leaf area.
Similar to CGR, the relationship between NAR and LAI was not markedly different under various water, salinity and nitrogen levels. There was a decline in NAR as LAI increased in ripening stages. However, NAR was raised when LAI increased in pollination stage. A decreasing trend in maize NAR vs its LAI over growing season reported by Adelana and Milbourn (1976). Higher NAR at a given LAI would explain higher CGR of maize. The mean NAR was 3.9, 6.42, 6.27 and 2.38 g m-2 d-1 in vegetative, pollination, filling and repining stages, respectively. These values suggested that from pollination to filling stages in the hybrid SC 704 cultivar leaf disposition and arrangement might be more efficient for light interception. If NAR declined indefinitely as LAI increased then an optimum LAI should exist for CGR. This optimum LAI has not been demonstrated for maize in our study; likely due to low plant population used and the resulted LAI was not as much as high to establish the optimum. This optimum value is also dependent on other factors such as cultivar and solar radiation intercepted by leaves. Gas exchange under different stresses
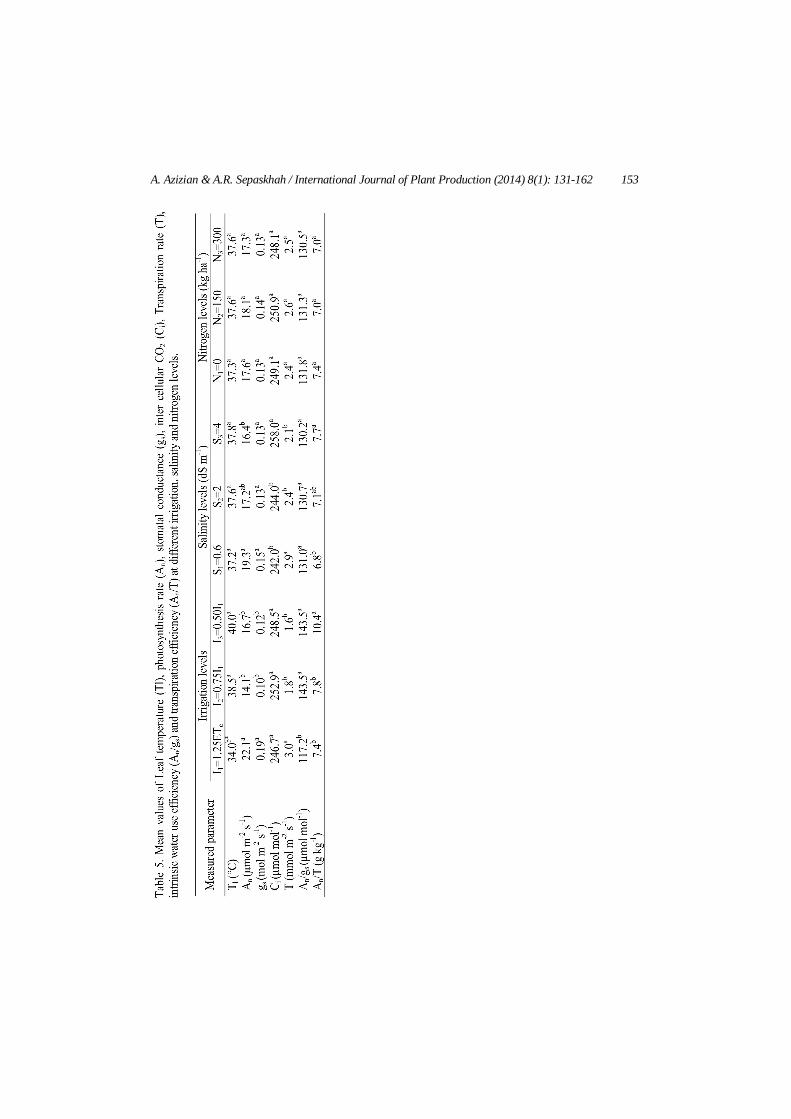
Mean values of different gas exchange parameters [Leaf temperature (Tl), photosynthesis rate (An), stomatal conductance (gs), inter cellular CO2 (Ci), transpiration rate (T)] under water, salinity and nitrogen levels are shown in Table 5. There was no statistical difference among the values of these parameters in different N application rates, though N supply at a rate of 150 kg ha-1 increased non-statistically the values of An and gs for maize. Maize
150 A. Azizian & A.R. Sepaskhah / International Journal of Plant Production (2014) 8(1): 131-162
leaves were statistically warmer in deficit irrigation (I2 and I3) relative to full irrigation treatment (I1). Photosynthesis rate and gs were statistically higher in full irrigation treatment as compared to other irrigation levels by an average of 44 and 76%, respectively. Furthermore, An was significantly higher as 18% in fresh water treatment relative to the highest salinity level (S3); while, gs was not statistically different among salinity levels of irrigation water. Overall, An and stomatal gs were statistically decreased in water deficit by an average of 30 and 43% as compared to full irrigation treatment, respectively. However, reduction in An and gs in salinity conditions was the same as 13% compared to no salinity treatment indicating that ABA signaling in water stress conditions might be more pronounced compared to salinity stress conditions. Similar results of deficit irrigation effect on An was observed by Shabani et al. (2013) for rapeseed. They also reported no effect of salinity on gs of rapeseed which is in agreement with our findings for maize. It is reported by other investigators that An could be an indicator of salinity-alkalinity stress as it is sensitive to environmental stresses (Xu et al., 2008). In our study An responded more clear to water than salinity stress. It might be concluded that inhibition of plant growth can be attributed to the reduction of carbon assimilation (An) under stress.
Intercellular CO2 concentration did not statistically change among irrigation treatments; however it increased by 7% at the highest salinity level of irrigation water relative to fresh water treatment. Similar results were reported by Deng et al. (2011) for reed under salinity-alkalinity stress. It has been mentioned that lower An accompanied by lower gs and Ci might be mainly ascribed to stomatal closure, which restricts entry of CO2 into leaves. However, lower An accompanied by lower gs and higher Ci may be attributed to non-stomatal limitation, including changes in leaf biochemistry that results in inhibition or down-regulation of photosynthesis and the reduction of the chlorophyll content (Farquhar et al., 1989). Previous studies confirmed that stomatal limitation is more significant at medium salinities and non-stomatal restriction is more pronounced at high salinity levels (Deng et al., 2011; Netondo et al., 2004). A similar pattern in response to salinity stress was found in this study. So, it might be concluded that the stomatal closure is likely the first defense mechanism of plant against salinity stress. However, non-stomatal limitation increases progressively under high salinity stress.
Transpiration rate was statistically lower under water and salinity stress by an average of 75 and 26% as compared to no water and salinity stress,
A. Azizian & A.R. Sepaskhah / International Journal of Plant Production (2014) 8(1): 131-162 151
respectively (Table 5). However, T rates were not statistically different between two water (I2 and I3) and salinity (S2 and S3) stresses. Similar results have been reported by Ghaderi et al. (2011).
It has been suggested that intrinsic water use efficiency (An/gs) can be used a management tool for optimizing irrigation strategies in water limiting conditions (Ahmadi et al., 2010). In our study An/gs in deficit irrigation (I2 and I3) was the same and statistically higher as 23% than that obtained in full irrigation treatment (I1, Table 5). This result indicates that maximum amount of An/gs could be achieved by water saving strategies. These results are in agreement with the results of water productivity for DM and evapotranspiration/transpiration based water use efficiency for DM which was reported by Azizian and Sepaskhah (2013). Furthermore, the values of An/gs were not statistically different among salinity and also N treatments. The transpiration efficiency (An/T) was also statistically higher as 40 and 14% at I3 and S3 treatment relative to full and fresh water irrigation treatment, respectively (Table 5). There was also no significant difference among An/T in various N application rates. Diurnal and seasonal gas exchange parameters under different stresses
Figures 5 to 9 present seasonal and also diurnal variation of leaf temperature (Tl), An, gs, Ci and T under different water, salinity and N levels. Maize leaves were clearly warmer at deficit irrigation (I3 and I2 treatments) relative to full irrigation level (I1 treatment) during growing season (Figure 5a). There was also no clear difference between Tl at different salinity and N levels (Figure 4b and c). Maize leaves also became warmer during a day from 8.30 am to 13.00 pm.
There was generally a decreasing trend in An toward the end of growing season, mainly due to leaves ageing, and also its value decreased in daily measurement from morning toward afternoon in different growth stages (Figure 6). A decreasing trend in An from beginning to the end of the growing season was observed for rapeseed (Shabani et al., 2013) and for potato (Ahmadi et al., 2010). An values were clearly higher at full (I1) and fresh (S1) water treatments compared to other water and salinity levels (Figure 5a and b). This difference was more clear at vegetative and pollination stages. There was no clear difference among An values under different N application rates (Figure 5c). Maximum values of An was generally recorded at pollination stages at the beginning of daily measurement (8:30 am).
152 A. Azizian & A.R. Sepaskhah / International Journal of Plant Production (2014) 8(1): 131-162
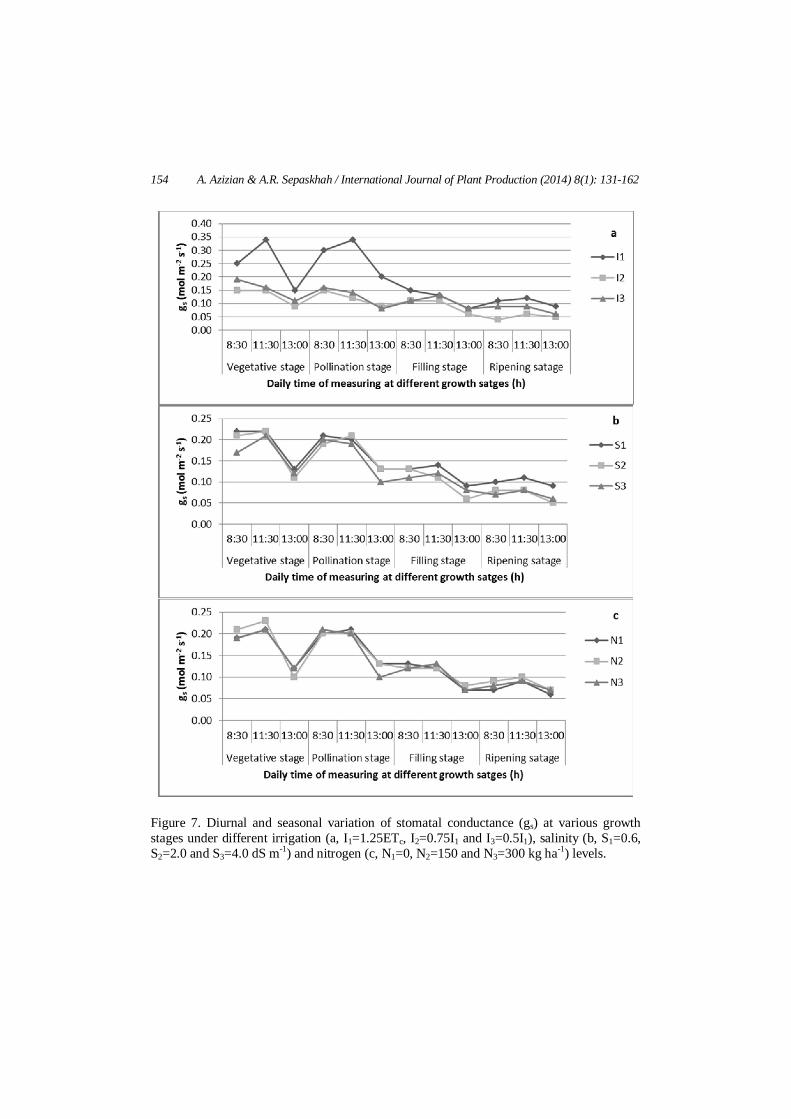
Figure 7 shows that gs decreased toward the end of growing season in different water, salinity and N levels. However, in daily measurement, gs increased or remain nearly constant from 8:30 to 11:30 am and then decreased to 13.00 pm. It is obvious from Figures 7a and b that gs values in water deficit (I2 ad I3) and salinity (S2 and S3) treatments were generally less than those values in full (I1) and fresh (S1) irrigation water treatments.
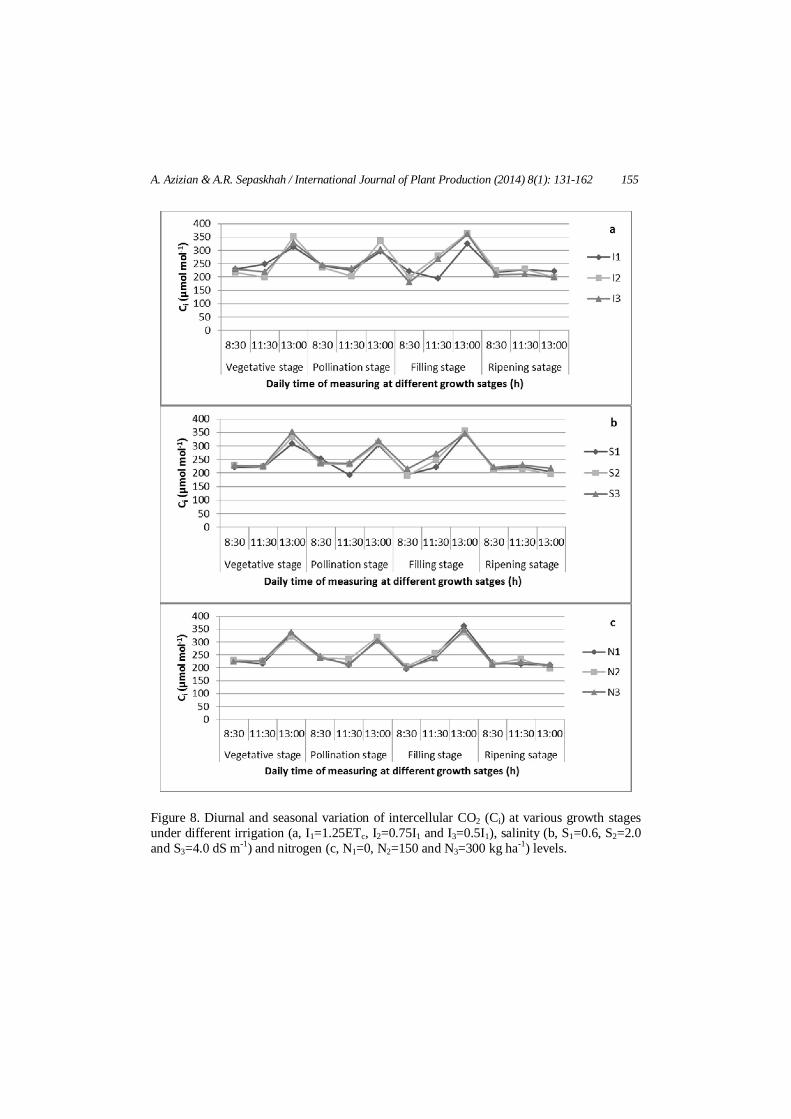
According to Figure 8, Ci remained nearly constant over growing season in different water, salinity and N treatments. However, in daily measurement in different growth stages, Ci generally increased from beginning of the day (8:30 am) to the afternoon (13.00 pm) except at ripening stages which leaves had approximately constant Ci during the day of measurements.
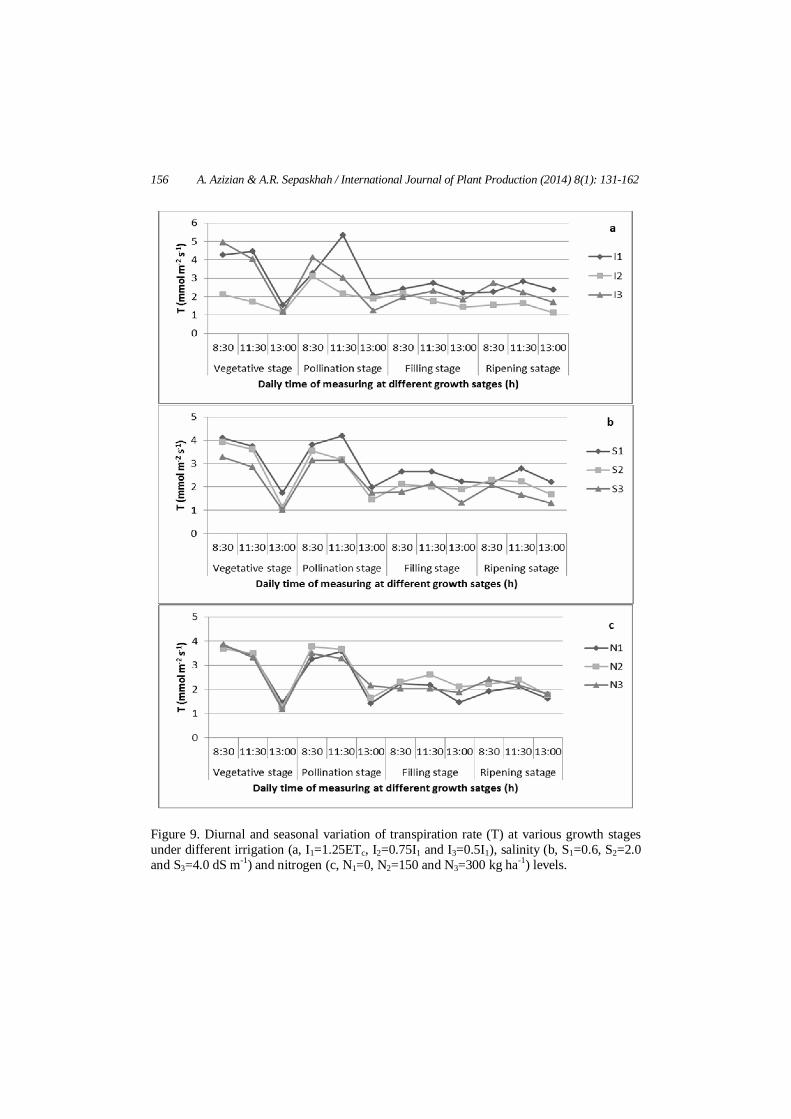
Figure 9 shows the variation of T occurred for maize leaves. There was a decreasing trend in T toward the end of growing season at different water, salinity and N levels. T values were distinctly higher in full (I1) and fresh (S1) irrigation water treatments compared with other water (I2 and I3) and salinity (S2 and S3) levels (Figure 9a and b). However, different N rates did not result in a clear difference in T at a given time of its measurement (Figure 9c). Relationships between An and gs
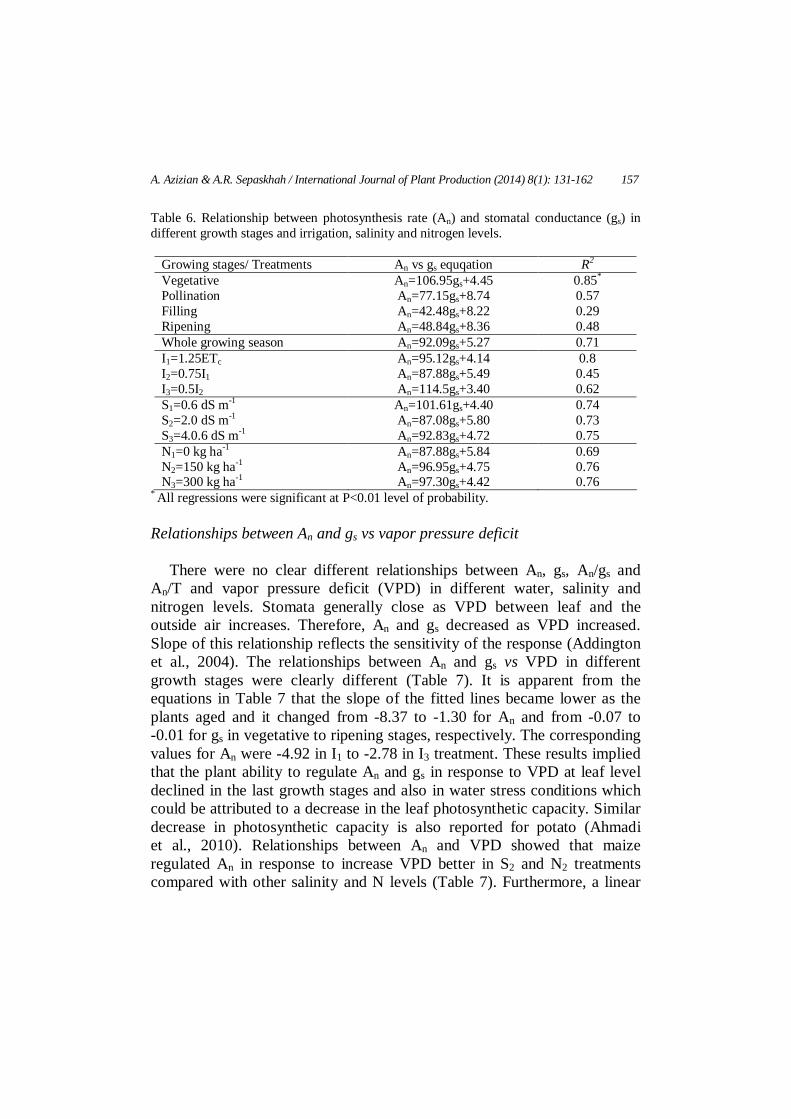
A linear relationship between An and gs observed in different growth stages and irrigation, salinity and nitrogen levels (Table 6). A nonlinear relationship was documented between An and gs for rapeseed (Shabani et al., 2013). According to Chaves (1991) the relationship is a common feature of drought-adapted plant species. Use of gs as an indicator of the intensity of water stress has revealed a general pattern of photosynthetic response to progressive stress that is somewhat independent of stress imposition, the environmental conditions and the genotype. In fact gs responded to many internal and external factors involved in hormonal signaling which makes gs as an integrative parameter of all the signals associated with the plant responding to water stress (Flexas et al., 2004). In our study a distinct difference in relationship between An and gs was observed in I3 and S1 compared with other water and salinity levels, respectively. The slope of the line indicated that vegetative growth stage followed by pollination was more sensitive to all stresses imposed to the plant; since decline of An per unit decrease in gs is greater than that in other two growth stages.
A. Azizian & A.R. Sepaskhah / International Journal of Plant Production (2014) 8(1): 131-162 153
154 A. Azizian & A.R. Sepaskhah / International Journal of Plant Production (2014) 8(1): 131-162
Figure 7. Diurnal and seasonal variation of stomatal conductance (gs) at various growth stages under different irrigation (a, I1=1.25ETc, I2=0.75I1 and I3=0.5I1), salinity (b, S1=0.6, S2=2.0 and S3=4.0 dS m-1) and nitrogen (c, N1=0, N2=150 and N3=300 kg ha-1) levels.
A. Azizian & A.R. Sepaskhah / International Journal of Plant Production (2014) 8(1): 131-162 155
Figure 8. Diurnal and seasonal variation of intercellular CO2 (Ci) at various growth stages under different irrigation (a, I1=1.25ETc, I2=0.75I1 and I3=0.5I1), salinity (b, S1=0.6, S2=2.0 and S3=4.0 dS m-1) and nitrogen (c, N1=0, N2=150 and N3=300 kg ha-1) levels.
156 A. Azizian & A.R. Sepaskhah / International Journal of Plant Production (2014) 8(1): 131-162
Figure 9. Diurnal and seasonal variation of transpiration rate (T) at various growth stages under different irrigation (a, I1=1.25ETc, I2=0.75I1 and I3=0.5I1), salinity (b, S1=0.6, S2=2.0 and S3=4.0 dS m-1) and nitrogen (c, N1=0, N2=150 and N3=300 kg ha-1) levels.
A. Azizian & A.R. Sepaskhah / International Journal of Plant Production (2014) 8(1): 131-162 157
Table 6. Relationship between photosynthesis rate (An) and stomatal conductance (gs) in different growth stages and irrigation, salinity and nitrogen levels.
Growing stages/ Treatments An vs gs equqation R2 Vegetative An=106.95gs+4.45 0.85*
Pollination An=77.15gs+8.74 0.57 Filling An=42.48gs+8.22 0.29 Ripening An=48.84gs+8.36 0.48 Whole growing season An=92.09gs+5.27 0.71 I1=1.25ETc An=95.12gs+4.14 0.8 I2=0.75I1 An=87.88gs+5.49 0.45 I3=0.5I2 An=114.5gs+3.40 0.62 S1=0.6 dS m-1 An=101.61gs+4.40 0.74 S2=2.0 dS m-1 An=87.08gs+5.80 0.73 S3=4.0.6 dS m-1 An=92.83gs+4.72 0.75 N1=0 kg ha-1 An=87.88gs+5.84 0.69 N2=150 kg ha-1 An=96.95gs+4.75 0.76 N3=300 kg ha-1 An=97.30gs+4.42 0.76
* All regressions were significant at P<0.01 level of probability. Relationships between An and gs vs vapor pressure deficit
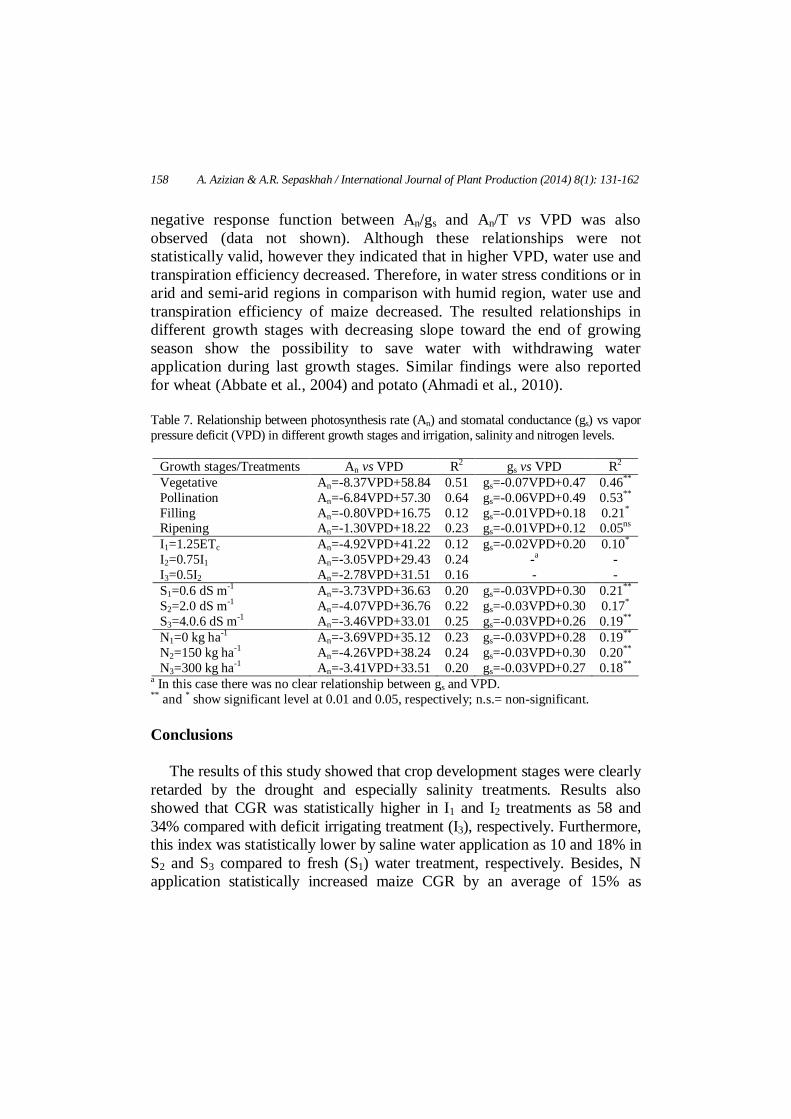
There were no clear different relationships between An, gs, An/gs and An/T and vapor pressure deficit (VPD) in different water, salinity and nitrogen levels. Stomata generally close as VPD between leaf and the outside air increases. Therefore, An and gs decreased as VPD increased. Slope of this relationship reflects the sensitivity of the response (Addington et al., 2004). The relationships between An and gs vs VPD in different growth stages were clearly different (Table 7). It is apparent from the equations in Table 7 that the slope of the fitted lines became lower as the plants aged and it changed from -8.37 to -1.30 for An and from -0.07 to -0.01 for gs in vegetative to ripening stages, respectively. The corresponding values for An were -4.92 in I1 to -2.78 in I3 treatment. These results implied that the plant ability to regulate An and gs in response to VPD at leaf level declined in the last growth stages and also in water stress conditions which could be attributed to a decrease in the leaf photosynthetic capacity. Similar decrease in photosynthetic capacity is also reported for potato (Ahmadi et al., 2010). Relationships between An and VPD showed that maize regulated An in response to increase VPD better in S2 and N2 treatments compared with other salinity and N levels (Table 7). Furthermore, a linear
158 A. Azizian & A.R. Sepaskhah / International Journal of Plant Production (2014) 8(1): 131-162
negative response function between An/gs and An/T vs VPD was also observed (data not shown). Although these relationships were not statistically valid, however they indicated that in higher VPD, water use and transpiration efficiency decreased. Therefore, in water stress conditions or in arid and semi-arid regions in comparison with humid region, water use and transpiration efficiency of maize decreased. The resulted relationships in different growth stages with decreasing slope toward the end of growing season show the possibility to save water with withdrawing water application during last growth stages. Similar findings were also reported for wheat (Abbate et al., 2004) and potato (Ahmadi et al., 2010). Table 7. Relationship between photosynthesis rate (An) and stomatal conductance (gs) vs vapor pressure deficit (VPD) in different growth stages and irrigation, salinity and nitrogen levels.
Growth stages/Treatments An vs VPD R2 gs vs VPD R2 Vegetative An=-8.37VPD+58.84 0.51 gs=-0.07VPD+0.47 0.46**
Pollination An=-6.84VPD+57.30 0.64 gs=-0.06VPD+0.49 0.53**
Filling An=-0.80VPD+16.75 0.12 gs=-0.01VPD+0.18 0.21*
Ripening An=-1.30VPD+18.22 0.23 gs=-0.01VPD+0.12 0.05ns
I1=1.25ETc An=-4.92VPD+41.22 0.12 gs=-0.02VPD+0.20 0.10*
I2=0.75I1 An=-3.05VPD+29.43 0.24 -a - I3=0.5I2 An=-2.78VPD+31.51 0.16 - - S1=0.6 dS m-1 An=-3.73VPD+36.63 0.20 gs=-0.03VPD+0.30 0.21**
S2=2.0 dS m-1 An=-4.07VPD+36.76 0.22 gs=-0.03VPD+0.30 0.17*
S3=4.0.6 dS m-1 An=-3.46VPD+33.01 0.25 gs=-0.03VPD+0.26 0.19**
N1=0 kg ha-1 An=-3.69VPD+35.12 0.23 gs=-0.03VPD+0.28 0.19**
N2=150 kg ha-1 An=-4.26VPD+38.24 0.24 gs=-0.03VPD+0.30 0.20**
N3=300 kg ha-1 An=-3.41VPD+33.51 0.20 gs=-0.03VPD+0.27 0.18**
a In this case there was no clear relationship between gs and VPD. ** and * show significant level at 0.01 and 0.05, respectively; n.s.= non-significant. Conclusions
The results of this study showed that crop development stages were clearly retarded by the drought and especially salinity treatments. Results also showed that CGR was statistically higher in I1 and I2 treatments as 58 and 34% compared with deficit irrigating treatment (I3), respectively. Furthermore, this index was statistically lower by saline water application as 10 and 18% in S2 and S3 compared to fresh (S1) water treatment, respectively. Besides, N application statistically increased maize CGR by an average of 15% as
A. Azizian & A.R. Sepaskhah / International Journal of Plant Production (2014) 8(1): 131-162 159
compared with no N application rate. The NAR index reached its maximum value under I2, S2 and N2 treatments compared with other water, salinity and nitrogen treatments. Maize had also generally greater NAR in pollination and filling stages compared to other growth stages at different water, salinity and nitrogen levels. There was an increasing and decreasing trend in maize CGR and NAR, respectively by raising its LAI irrespective of different water, salinity and N levels. Furthermore, no optimum value of LAI was established for CGR in this study.
Results of gas exchange showed that An and gs were statistically higher in full irrigation treatment as compared with other irrigation levels by an average of 44 and 76%, respectively. Furthermore, An was statistically higher as 18% in fresh water treatment compared with the highest salinity level (S3). T was statistically lower under water and salinity stress by an average of 75 and 26% compared with no water and salinity stress, respectively. An/gs in deficit irrigation (I2 and I3) was statistically higher as 23% than that obtained in full irrigation treatment (I1) indicating that maximum amount of intrinsic water use efficiency could be achieved by water saving strategies. This result confirmed by An/T which was statistically higher as 40 and 14% at I3 and S3 treatment compared with full and fresh water irrigation treatment, respectively. There was generally a decreasing trend in An and gs toward the end of growing season, mainly due to leaves ageing. Similar pattern also occurred from the morning toward afternoon. A linear relationship between An and gs observed in this study for all data and especially in vegetative and pollination growth stages (with higher R2 and greater slope) indicating that maize is more sensitive to all stresses imposed to the plant. Furthermore, An and gs decreased as VPD increased. The relationships between An and gs vs VPD in different growth stages implied that the plant ability to regulate An and gs in response to VPD at leaf level declined in the last growth stages. It is indicated that saving irrigation water by withdrawing water application during the last growth stages is possible. Acknowledgment
This research supported partly by a research project funded by Grant no. 92-GR-AGR 42 of Shiraz University Research Council, Drought National Research Institute, and Center of Excellence for On-Farm Water Management. Further, scholarship granted to the first author by Higher Education Ministry of I.R. of Iran is acknowledged.
160 A. Azizian & A.R. Sepaskhah / International Journal of Plant Production (2014) 8(1): 131-162
References Abbate, P.E., Dardanelli, J.L., Cantarero, M.G., Maturano, M., Melchiori, R.J.M., Suero,
E.E., 2004. Climatic and water availability effects on water-use efficiency in wheat. Crop Sci. 44, 474-483.
Addington, R.N., Mitchell, R.J., Oren, R., Donavan, L.A., 2004. Stomatal sensitivity to vapor pressure deficit and its relationship to hydraulic conductance in Pinus palustris. Tree Physiol. 24, 561-569.
Adelana, B.O., Milbourn, G.M., 1976. Relationship between leaf area and crop rate in maize. Chand, J. Agric. Sci. 9, 175-178.
Ahmadi, S.H., Anderses, M.N., Plauborg, F., Poulsen, R.T., Jensen, C.R., Sepaskhah, A.R., Hansen, S., 2010. Effect of irrigation strategies and soils on field-grown potatoes: Gas exchange and xylem [ABA]. Agric. Water Manage. 97, 1486-1469.
Allen, R.G., 2005. The ASCE standardized reference evapotranspiration equation. ASCE Publications, 216p.
Amer, K.H., 2010. Corn crop response under managing different irrigation and salinity levels. Agric. Water Manage. 97, 1553-1563.
Ashraf, M., 2001. Relationships between growth and gas exchange characteristics in some salt-tolerant amphidiploid Brassica species in relation to their diploid parents. Environmental and Experimental Botany. 45, 155-163.
Azizian, A., Sepaskhah, A.R., 2013. Maize response to different water, salinity and nitrogen levels: yield-water relation, water-use and water uptake reduction function. Int. J. Plant Prod. (Pending Publication)
Cakir, R., 2004. Effect of water stress at different development stages on vegetative and reproductive growth of maize. Field Crops Res. 89, 1-16.
Chaves, M.M., 1991. Effect of water deficits on carbon assimilation. J. Expt. Bot. 42, 1-16. Cramer, G.R., 2002. Deferential effects of salinity on leaf elongation kinetics of three grass
species. Plant Soil. 253, 233-244. Deng. Ch., Zhang, G., Pan, X., 2011. Photosynthetic responses in reed (Phragmites
australis (CAV.) TRIN. ex Steud.) seedlings induced by different salinity-alkalinity and nitrogen levels. J. Agric. Sci. Tech. 13, 687-699.
Echarte, L., Rothstein, S., Tollenaar, M., 2008. The response of leaf photosynthesis and dry matter accumulation to nitrogen supply in an older and a newer maize hybrid. Crop Sci. 48, 656-665.
Ercoli, L., Lulli, L., Mariotti, M., Masoni, A., Arduini, I., 2008. Post-anthesis dry matter and nitrogen dynamics in durum wheat as affected by nitrogen supply and soil water availability. Eur. J. Agron. 28, 138-147.
Farquhar, G.D., Ehleringer, J.R., Hubick, K.T., 1989. Carbon Isotope Discrimination and Photosynthesis. Ann. Rev. Plant Physiol. Plant Mol. Biol. 40, 503-537.
Flexas, J., Josefina, B., Josep, C., Jose, M.E., Jeroni, G., Javier, G., El-Kadri, L., Sara, F.M.C., Maria, T.M., Miquel, R.C., Diego, R., Bartolome, S., Hipolito, M., 2004. Understanding down-regulation of photosynthesis under water stress: future prospects and searching for physiology tools for irrigation management. Ann. Appl. Biol. 144, 273-283.
A. Azizian & A.R. Sepaskhah / International Journal of Plant Production (2014) 8(1): 131-162 161
Flexas, J., Medrano, H., 2002. Drought inhibition of photosynthesis in C3 plants: stomatal and nonstomatal limitations revisited. Ann. Bot. 89, 183-189.
Huang, J., Redmann, R.E., 1995. Physiological responses of canola and weld mustard to salinity and contrasting calcium supply. J. Plant Nutr. 18, 1931-1949.
Ghaderi, N., Talaei, A.R., Ebadi, A., Lessani, H., 2011. The physiological response of three Iranian grape cultivars to progressive drought stress. J. Agric. Sci. Tech. 13, 601-610.
Gheysari, M., Mirlatifi, S.M., Bannayan, M., Homaee, M., Hoogenboom, G., 2009. Interaction of water and nitrogen on maize growth for silage. Agric. Water Manag. 96, 809-821.
Grattan, S.R., Grieve, C.M., 1999. Salinity-mineral nutrient relations in horticultural crops. Scientia Horticulturae. 78, 127-157.
Jensen, C.R., Mogensen, V.O., Mortensen, G., Andersen, M.N., Schjoerring, J.K., Thage, J.H., Koribidis, J., 1996. Leaf photosynthesis and drought adaptation in field-grown oilseed rape (Brassica napus L.). Aust. J. Plant Physiol. 23, 631-644.
Katerji, N., Van Hoorn, J.W., Hamdy, A., Mastrorilli, M., 2003. Salinity effect on crop development and yield, analysis of salt tolerance according to several classification methods. Agric. Water Manage. 62, 37-66.
Liua, W.Z., Zhang, X., 2007. Optimizing water and fertilizer input using an elasticity index: a case study with maize in the loess plateau of china. Field Crops Res. 100, 302-310.
Majnooni-Heris, A., Zand-Parsa, Sh., Sepaskhah, A.R., Kamgar-Haghighi, A.A., Yasrebi, J., 2011. Modification and validation of maize simulation model (MSM) at different applied water and nitrogen levels under furrow irrigation. Arch. Agron. Soil Sci. 57 (4), 401-420.
Maas, E.V., Hoffman, G.J., 1977. Crop salt tolerance, current assessment. J. Irrig. Drain. Div. ASCE. 103, 115-134.
Netondo, G.W., Onyango, J.C., Beck, E., 2004. Sorghum and Salinity: II. Gas Exchange and Chlorophyll Fuorescence of Sorghum under Salt Stress. Crop Sci. 44, 806-811.
Pandey, R.K., Maranville, J.W., Admou, A., 2000. Deficit irrigation and nitrogen effects on maize in a Sahelian environment. I. Grain yield and yield components. Agric. Water Manage. 46, 1-13.
Razzaghi, F., Sepaskhah, A.R., 2012. Calibration and validation of four common ETo estimation equations by lysimeter data in a semi-arid environment. Arch. Agron. Soil Sci. 58, 303-319.
Ritchie, S.W., Hanway, J.J., Benson, G.O., 1992. How a maize plant develops. Special Report No. 48. Iowa State University, Cooperative Extension Service, Ames, IA, http://maize.agron.iastate.edu/maizegrows.html.
Shabani A., Sepaskhah, A.R., Kamgar-Haghighi, A.A., 2013. Growth and physiologic response of rapeseed (Brassica napus L.) to deficit irrigation, water salinity and planting method. Int. J. Plant Prod. 7, 569-596.
Shahrokhnia, M.H., Sepaskhah, A.R., 2013. Single and dual crop coefficient and crop evapotranspiration for wheat and maize in a semi-arid region. Theoretical and Applied Climatology, 114, 495-510.
Sepaskhah, A.R., Kamgar-Haghighi, A.A., Nazemossaddat, S.M.J., Illampour, S., 1993. Crop production function and irrigation scheduling for wheat, sugar beet, cowpea and maize. Research Project Final Tale, Shiraz University, I.R. Iran. 42p. (In Persian)
162 A. Azizian & A.R. Sepaskhah / International Journal of Plant Production (2014) 8(1): 131-162
Sepaskhah, A.R., Tafteh, A., 2012. Yield and nitrogen leaching in rapeseed field under different nitrogen rates and water saving irrigation. Agric. Water Manage. 112, 55-62.
Shangguan, Z.P., Shao, M.A., Dyckmans, J., 2000. Nitrogen nutrition and water stress effects on leaf photosynthetic gas exchange and water use efficiency in winter wheat. Environ. Exp. Bot. 44, 141–149.
Soler, C.M.T., Hoogenboom, G., Sentelhas, P.C., Duarte, A.P., 2007. Impact of water stress on maize grown off-season in a subtropical environment. J. Agron. Crop Sci. 193, 247-261.
Tafteh, A., Sepaskhah, A.R., 2012. Yield and nitrogen leaching in maize field under different nitrogen rates and partial root drying irrigation. Int. J. Plant Prod. 6, 93-114.
Ulfat, M., Athar, H., Ashraf, M., Akram, N.A., Jamil, A., 2007. Appraisal of physiological and biochemical selection criteria for evaluation of salt tolerance in canola (Brassica napus L.). Pakistan J. Bot. 39 (5), 1593-1608.
Xu, Z.Z., Zhou, G.S., Wang, Y.L., Han, G.X., Li, Y.J., 2008. Changes in Chlorophyll Fluorescence in Maize Plants with Imposed Rapid Dehydration at Different Leaf Ages. J. Plant Growth Regul. 27 (1), 83-92.
Yi, L., Shenjiao, Y., Shiqing, L., Xinping, Ch., Fang, Ch., 2010. Growth and development of maize (Zea mays L.) in response to different field water management practices: Resource capture and use efficiency. Agric. Forest Meteorol. 150, 606-613.
Zand-Parsa, S., Sepaskhah, A.R., 2001. Optimal applied water and nitrogen for maize. Agric Water Manage. 52 (1), 73-85.
Zand-Parsa, S., Sepaskhah, A.R., Rownaghi, A., 2006. Development and evaluation of integrated water and nitrogen model for maize. Agric Water Manage. 81, 227-256.
Zhao, G.Q., Ma, B.L., Ren, C.Z., 2007. Growth, gas exchange, chlorophyll fluorescence, and ion content of naked oat in response to salinity. Crop Sci. 47, 123-131.


