Embed Size (px)
Citation preview

1001
Conservation Biology, Pages 1001–1013Volume 14, No. 4, August 2000
Making Consistent IUCN Classifications under Uncertainty
H. RE T AKÇAKAYA,*†† SCOTT FERSON,* MARK A. BURGMAN,† DAVID A. KEITH,‡ GEORGINA M. MACE,§ AND CHARLES R. TODD**
*Applied Biomathematics, 100 North Country Road, Setauket, NY 11733, U.S.A.†Schools of Botany and Forestry, University of Melbourne, Parkville 3052, Australia‡New South Wales National Parks and Wildlife Service, Hurtsville, New South Wales 2220, Australia§Institute of Zoology, Zoological Society of London, London NW1 4RY, United Kingdom**Arthur Rylah Institute for Environmental Research, 123 Brown Street, Heidelberg, Victoria 3084, Australia
Abstract:
The World Conservation Union (IUCN) defined a set of categories for conservation status sup-ported by decision rules based on thresholds of parameters such as distributional range, population size, pop-ulation history, and risk of extinction. These rules have received international acceptance and have becomeone of the most important decision tools in conservation biology because of their wide applicability, objectiv-ity, and simplicity of use. The input data for these rules are often estimated with considerable uncertaintydue to measurement error, natural variation, and vagueness in definitions of parameters used in the rules.Currently, no specific guidelines exist for dealing with uncertainty. Interpretation of uncertain data by differ-ent assessors may lead to inconsistent classifications because attitudes toward uncertainty and risk mayhave an important influence on the classification of threatened species. We propose a method of dealing withuncertainty that can be applied to the current IUCN criteria without altering the rules, thresholds, or intent ofthese criteria. Our method propagates the uncertainty in the input parameters and assigns the evaluated spe-cies either to a single category (as the current criteria do) or to a range of plausible categories, depending onthe nature and extent of uncertainties.
Establecimiento de Clasificaciones Consistentes de IUCN bajo Incertidumbre
Resumen:
La Unión Mundial para la Conservación (IUCN) definió un grupo de categorías referentes a esta-dos de conservación sustentadas en reglas de decisión basadas en umbrales de parámetros como son el rangode distribución, el tamaño poblacional, la historia poblacional y el riesgo de extinción. Estas reglas han reci-bido aceptación internacional y se han convertido en una de las herramientas más importantes para latoma de decisiones en biología de la conservación debido a su amplia aplicabilidad, objetividad y simpli-cidad de uso. Los datos requeridos para estas reglas son frecuentemente estimados con una incertidumbreconsiderable debido a errores de medición, variación natural y vaguedad en la definición de los parámetrosusados en las reglas. Actualmente no existen lineamientos específicos para enfrentar la incertidumbre. La in-terpretación de datos inciertos por diferentes estimadores puede conducir a clasificaciones inconsistentes de-bido a que ciertas actitudes hacia la incertidumbre y el riesgo pueden tener una influencia importante en laclasificación de especies amenazadas. Proponemos un método para enfrentar a la incertidumbre que puedeser aplicado a los criterios actuales de IUCN sin alterar las reglas, los umbrales, o la intención de estos crite-rios. Nuestro método propaga la incertidumbre en los parámetros usados y asigna a la especie evaluada auna sola categoría (a como lo hace el criterio actual) o a un rango de categorías plausibles, dependiendo de
la naturaleza y la extensión de las incertidumbres.
SI·
††
email: [email protected] submitted December 1, 1999; revised manuscript accepted March 3, 2000.

1002
IUCN Classifications under Uncertainty Akçakaya et al.
Conservation BiologyVolume 14, No. 4, August 2000
Introduction
When resources for conservation are limited, there is animperative to rank species according to the risks theyface. These ranks are used to set priorities for manage-ment action at local and national scales (e.g., Czech &Krausman 1997; Breininger et al. 1998), and they are animportant part of national and international reporting onthe state of the environment. Through legislative and ad-ministrative mechanisms, many countries have devel-oped approaches to setting priorities within a context ofpolitical and social constraints.
Some threat assessment schemes make use of thresh-olds to assign scores and sum these scores over a num-ber of attributes to indicate overall conservation statusor priority (e.g., Millsap et al. 1990; Lunney et al. 1996).Other schemes use qualitative criteria (e.g., U.S. Fishand Wildlife Service 1983) or a mixture of qualitativeand quantitative criteria (e.g., Master 1991; The NatureConservancy 1994). In the early 1970s, The World Con-servation Union (IUCN) adopted a set of qualitative cri-teria for the classification of conservation status (Fitter &Fitter 1987). Mace and Lande (1991) suggested that sta-tus should be assessed quantitatively, and they definedcritically endangered species as those facing a 50% prob-ability of extinction within 5 years. The classification ofrisk involves three parameters: time, probability of de-cline, and amount of decline (Akçakaya 1992). Threatmay then be seen as a combination of the magnitude ofthe impending decline within some time frame and theprobability that a decline of that magnitude will occur.Assessing the threat level is the main goal of the IUCNcriteria, which are necessary but probably not sufficientfor setting conservation priorities.
The IUCN (1994) defined a set of categories for con-servation status supported by decision rules based onthresholds of parameters such as distributional range,population size, and population history, as well as risk ofextinction. The IUCN (1994) rules have received inter-national acceptance and have become one of the mostimportant decision tools in conservation biology. Deci-sion rules are attractive because of their wide applicabil-ity, objectivity, and simplicity of use (Mace & Lande1991). By necessity, the choices of thresholds that de-limit categories of risk are somewhat arbitrary (Regan etal. 2000).
Existing methods do not explicitly consider theamount and quality of the data, despite the fact the datafor different species vary markedly. Like the choice of amethod, the choice of the way in which uncertainty ishandled can change the resulting classification of threat(Burgman et al. 1999). Moreover, despite differences inthe kinds and quality of information from which infer-ences may be drawn, there is no guidance on how to in-terpret such variation, although the IUCN (1994) ex-
presses the intent of precaution in the face ofuncertainty. This is especially important because our at-titude to this uncertainty may have an important influ-ence on the ranks assigned to different species. In par-ticular, there is no consensus regarding the problem ofhow to rank species when data are missing (Mace 1995).Some methods ignore the issue, effectively relegatingthe species to a “safe” category whenever data are ab-sent (e.g., Millsap et al. 1990), whereas others let miss-ing data induce a conservation status toward the middleof the range of threat (e.g., Lunney et al. 1996). Our goalis to describe how a new method of dealing with uncer-tainty can be applied to the current IUCN criteria with-out altering the rules, thresholds, or intent of the criteria.
Sources of Uncertainty
Any method for classification of conservation status in-volves several kinds of uncertainty, which may be cate-gorized as semantic uncertainty, measurement error,and natural variability. For example, the IUCN (1994) de-cision rules require the user to specify the number ofadult individuals, the area of occupancy, and the level offluctuations in these parameters. Each of these parame-ters is affected to an extent by at least one of thesesources of uncertainty.
Semantic uncertainty arises from the use of inexactdefinitions. For example, the IUCN (1994) asks whetherthere have been extreme fluctuations in the number ofindividuals of a species.
Extreme
is defined as the situa-tion in which “population size or distribution area varieswidely, rapidly and frequently, typically with variationgreater than one order of magnitude . . ..” The definitionis such that variation in reporting among different peo-ple will not be eliminated, even if they are providedwith exact information about past fluctuations. Theterms
widely
,
rapidly
, and
frequently
may mean differ-ent things to different people, and the time horizon overwhich to evaluate changes of an order of magnitude isnot specified. It might be possible to reduce or eliminatevariation in responses to this question by making thedefinition more exact, but only with some loss of gener-ality. This means replacing a vague but inclusive defini-tion by a somewhat arbitrary numerical threshold(Regan et al. 2000).
Some definitions may defy any arbitrary attempt tomake them precise. For example, the IUCN (1994) rec-ommends that extent of occurrence be measured by aminimum convex polygon that encloses all known, in-ferred, or projected occurrences. Different definitionsof the minimum convex polygon are possible, however,if different attributes are used to define occurrences.For example, people may choose to include or excludeold records, records that are not substantiated by a mu-

Conservation BiologyVolume 14, No. 4, August 2000
Akçakaya et al. IUCN Classifications under Uncertainty
1003
seum or herbarium voucher, records made by “unreli-able” collectors, the results of one or another statisticalmethod for extrapolating or interpolating distributions,records that include only juveniles, records of the rangesof floaters in bird populations, records that include onlysingle individuals, records from unusual vegetationtypes, outliers, and so on. Each of these subjective deci-sions will affect the estimate of extent of occurrence,and different people will produce different results fromthe same data. It would be impossible to create a sensi-ble set of rules that would apply to all taxa and thatcould be interpreted unambiguously. We must concludethat some components of semantic uncertainty are irre-ducible and that we must learn to live with them. Butthis does not mean that we should ignore them.
A more fundamental and common type of uncertaintyarises from measurement error, the lack of precise infor-mation for some or most of the variables used in therules. It is unlikely, for instance, that the exact numberof mature individuals and the exact rate of decline overthe past 10 years are known for any species. All numeri-cal data, as well as qualitative information such aswhether there are extreme fluctuations, are uncertain.
Measurement error is distinguished from semantic un-certainty by the fact that it may be reduced or elimi-nated, at least in theory, by acquiring additional data. Es-timates of population size rest on the assumption thatthere is a fact of the matter, a true number of adult indi-viduals, but because we cannot count them all, samplingtheory provides the means to estimate the parameterand its error. Taylor (1995) suggested that we interpretuncertainty in the parameters cautiously. Burgman et al.(1999) suggested dealing with this kind of uncertaintywithin the IUCN (1994) rules by using percentiles otherthan the median to rank species, depending on the atti-tude of the interpreter to the risk. Like semantic uncer-tainty, measurement error can strongly affect the finalclassification.
Natural temporal and spatial variation in populationsize and distribution affects our ability to report on theseparameters with certainty. Natural variation exists be-cause populations vary in space and time in response toenvironmental variation and the vagaries of demo-graphic processes (Burgman et al. 1993). For this rea-son, our expectation of population size over the nextfew years cannot ever be entirely certain, even in the ab-sence of measurement error or knowledge of the exactdetails of deterministic trends because chance birth anddeath events will determine the exact outcome. This un-certainty requires that viability be expressed in probabi-listic terms, such as the risk of extinction. In some of theIUCN criteria, natural temporal and spatial variation arenot relevant because, for example, population sizes arespecified for a particular point in time. In other IUCNcriteria, natural variation is accounted for explicitly by
the use of variables that refer to extreme fluctuations,fragmentation, and risk of extinction.
Characterizing Uncertainty
The IUCN rules for classification of threatened speciesconsist of three sets, which define the classes criticallyendangered (CR), endangered (EN), and vulnerable(VU). The evaluation of a given taxon under each ofthese sets of rules results in a boolean (true or false) out-come. The rule sets are nested, so that there are onlyfour possible classifications (Table 1).
Each boolean (Table 1) is evaluated based on five cri-teria, as follows: A or B or C or D or E (expression 1).The five criteria consider population decline (A), re-stricted distribution and decline, fluctuation, and/orfragmentation (B), small population size and decline (C),very small population size (D), and high risk of extinc-tion (E). Each criterion (A to E) is, in turn, evaluated bycomparing the data for the taxon to threshold values.For example, criterion D for CR is number of mature in-dividuals
,
50 (expression 2). Several such comparisonsmay be combined with logical operators
AND
and
OR
within each criterion. For example, criterion A for CRcan be summarized as (past reduction
$
80%) or (futurereduction
$
80%) (expression 3), where both past andfuture reductions are measured over a time period of 10years or three generations, whichever is longer.
Specifying Uncertain Data
There are various ways to specify uncertainty in a quan-tity such as number of mature individuals. When naturalvariability is the main source of uncertainty and the sam-pling program has been sufficiently rigorous, we mayspecify confidence intervals. Most of the criteria in theIUCN (1994) rules include at least some semantic uncer-tainty. Even those variables amenable to measurementsometimes are not measured but are the subject of ex-pert opinion or guesswork informed by a few samples.
Table 1. Possible outcomes of evaluation of a given taxon under IUCN rules to classify the taxon into a threat category.
Rule sets
*
Classification ofthe taxonVU EN CR
true true true critically endangeredtrue true false endangeredtrue false false vulnerablefalse false false lower risk
*
Three rules sets of IUCN (1994): VU, vulnerable; EN, endangered;and CR, critically endangered.

1004
IUCN Classifications under Uncertainty Akçakaya et al.
Conservation BiologyVolume 14, No. 4, August 2000
When different kinds of uncertainty are confounded,one of the simplest ways to represent uncertainty is tospecify a best estimate and a range of plausible values.For example, we may represent an adult population sizewith a best estimate of 90 and bounds of 70 and 120.The bounds may be based on a variety of measures rang-ing from statistically estimated likelihood distributionsto the various opinions of a group of experts.
The resulting information can be represented as a tri-angular fuzzy number (Kaufmann & Gupta 1985; Fersonet al. 1998), as in Fig. 1a. The
x
-axis is the number of ma-ture individuals. The
y
-axis of this and all other fuzzynumbers we use in this paper gives the possibility level.At each possibility level, there is an interval defined bythe left and right sides of the fuzzy number. This level in-versely measures the surety that the parameter is withinthe interval at that level: as the scale on the y-axis in-creases, the surety decreases that the parameter is withinthe corresponding interval.
In cases when consensus about the best estimate isnot possible, it may be necessary to pool different esti-mates from different experts or from several assessmentmethods. In such cases the best estimate itself may be aninterval such as 85–95 instead of a point estimate. In thiscase, the resulting object can be represented as a trape-zoidal fuzzy number (Fig. 1b). This number implies thatthe true value of the parameter is around 85 to 95 (theinterval at the top of the fuzzy number) and that it issurely within the range of 70–120 (at the bottom of thefuzzy number). If it was obtained by pooling expertopinion, it may imply that everyone agrees that the val-ues 85–95 are plausible, whereas the interval [70, 120] isthe sum (union) of all opinions about plausible values.
In some cases, the data to be pooled may be contradic-tory (for example, [70, 90] and [100, 120]). In suchcases, automatic rules for pooling are not appropriate. Abetter approach to the problem would be communica-tion between the experts who produced the contradic-tory data, with the purpose of understanding where thedisagreement is coming from. It is most likely that thecause of the difference is use of different information.When such information is shared, the problem may dis-appear.
When data are very uncertain, the range for the bestestimate may coincide with the range of plausible val-ues. In this case, the resulting object can be representedas a rectangular fuzzy number (i.e., an interval; Fig. 1c).
Some of the data for the IUCN rules are required in theform of yes/no or true/false—for example, whetherthere are extreme fluctuations in numbers and whetherall individuals are in a single population. It is not alwayspossible to be certain about responses to these ques-tions for the same reasons it is not possible to be certainabout quantitative information. Measurement error maymake the response to questions about the magnitude offluctuations or the number of populations unreliable.
Different people may hold different opinions. In addi-tion, semantic uncertainty may make the uncertainty ir-reducible. For example, estimate of the number of popu-lations depends on the interpretation of the termpopulation, a concept fraught with subjectivity (Wells &Richmond 1995).
When the information about these aspects of the sta-tus of a taxon are uncertain, the answer can be ex-
Figure 1. Examples of (a) triangular, (b) trapezoidal, and (c) rectangular fuzzy numbers for the number of mature individuals of a species.

Conservation BiologyVolume 14, No. 4, August 2000
Akçakaya et al. IUCN Classifications under Uncertainty
1005
pressed as a number between 0 (false) and 1 (true), rep-resenting the truth value of the statement. In somecases, this number may represent the frequency withwhich the statement is true. More generally, it repre-sents the degree of plausibility of the statement or thereliability of the information about that aspect of thepopulation (Fig. 2a). When assessments made by a num-ber of experts are pooled, the result can be expressed asan interval (Fig. 2b). If the procedure for pooling expertopinion includes assigning different weights to differentopinions (based on expertise, experience, or perfor-mance), the result may be expressed as a triangular ortrapezoidal fuzzy number (Fig. 2c).
It is important to note that fuzzy numbers are notprobability distributions; they are simply stacks of inter-vals nested so that those below include those above.The calculations described here are extensions of simpleinterval arithmetic and can be applied to the two inter-vals (the best estimate at the top and the plausible rangeat the bottom) and to any other interval in between(Kaufmann & Gupta 1985; for a synopsis of fuzzy calcu-lations, see the Appendix).
Using Uncertain Data in IUCN Rules
When the parameters are uncertain and are specified asdescribed above, expressions 1, 2, and 3 must be gener-alized to allow fuzzy numbers. With uncertain input dataspecified as fuzzy numbers (e.g., as in Figs. 1 & 2), theresults of expressions 1, 2, and 3 are themselves fuzzylogical values ranging between 0 and 1 that are derivedfrom methods discussed in the Appendix (these meth-ods generalize operators such as
AND
,
OR
,
.
,
,
,
$
,
#
,and others).
Similarly, the result of the three rule sets, CR, EN, andVU, are also fuzzy numbers between 0 and 1, represent-ing the truth values for membership of a taxon to eachrule set. Thus, a taxon has a separate truth value formembership to each category. In this case, the possibleoutcomes (Table 2 lists some) are no longer limited tothe four cases listed in Table 1.
True
is represented bythe graph with a spike at the right end, which corre-sponds to the logical value of 1;
false
is represented bythe graph with a spike at the left end, which corre-sponds to the logical value of 0; and
unknown
is repre-sented by a solid rectangle, which corresponds to thelogical interval of [0, 1] (Table 2). Other fuzzy numbersrepresent gradations among these cases.
Once the three fuzzy numbers representing CR, EN,and VU are calculated for a taxon, based on uncertain in-put data and the calculations described in the Appendix,the next step is to combine these into a single classifica-tion of threat. Several word descriptions of classificationof threat are given as examples in Table 2; the same setof uncertainties may be described in different ways bydifferent people. The step of combining the three fuzzy
Figure 2. Examples of fuzzy numbers representing a logical value, such as whether there are extreme fluc-tuations in a population. A value of 0 represents false; 1 represents true. Intermediate values, such as 0.6 (a) represent uncertainty and can be estimated, for exam-ple, as the proportion of cases (such as populations) for which the statement is true. Further uncertainty (e.g., due to range of opinion) can be represented us-ing (b) an interval or (c) a trapezoidal fuzzy number.

1006
IUCN Classifications under Uncertainty Akçakaya et al.
Conservation BiologyVolume 14, No. 4, August 2000
numbers into a single classification of threat can be donein different ways, because it depends on preferencesand attitudes toward risk and uncertainty.
Attitudes toward Risk and Uncertainty
Uncertain data may lead to inconsistent classificationsbecause different people emphasize different parts of arange or different aspects of the uncertainty. Theseemphases can be summarized as differences in attitudetoward risk and uncertainty. Different attitudes are un-avoidable, but this need not make rule-based classifications(such as the IUCN criteria) inconsistent as long as theunderlying attitude is explicitly stated. We recognizetwo fundamental aspects of attitude about risk and un-certainty: dispute tolerance and risk tolerance.
Dispute Tolerance
When input data are certain, the three logical values forCR, EN, and VU are either 0 (false) or 1 (true). In otherwords, they are booleans. When the input data are uncer-tain, each of these may be a fuzzy number (as in Table 2).
The gray polygons in Fig. 3 are examples of the threefuzzy numbers for CR, EN, and VU, calculated accordingto the IUCN rules with methods described in the Appen-dix (each cell of Table 2 contains one such fuzzy number).
The x-axis represents the truth value (e.g., the truthvalue of the rule set EN). The y-axis represents the possi-bility levels, as in all other fuzzy numbers. The uncer-tainty in the data is reflected in the width of the fuzzynumber. For example, the bottom of the fuzzy number
Table 2. Sample outcomes of evaluation of a given taxon with uncertain data under IUCN rules.
Rule sets
*
Classification of the taxonVU EN CR
critically endangeredendangeredvulnerablelower riskat least endangered, maybe criticallyat least vulnerable, maybeendangered, but not criticallyat least vulnerable, likelyendangered, possibly critically
*
Three rules sets of IUCN (1994): VU, vulnerable; EN, endangered;and CR, critically endangered.
Figure 3. An example of the three fuzzy numbers, which are the result of the rule sets for classifications of critically endangered (CR), endangered (EN), and vulnerable (VU), calculated according to the IUCN rules and methods described in the Appendix. Dispute tolerance (DT) determines the level (represented by the horizontal line) to be used in determining the degree of threat. The bottom of each fuzzy number represents the case that includes all possibilities (DT
5
0). The top of each fuzzy number represents the case when dis-pute tolerance is highest (DT
5
1). The points of inter-section (e.g.,
a
and
c
for CR) with the DT line and the middle point (e.g.,
b
for CR) are used in Fig. 4.

Conservation BiologyVolume 14, No. 4, August 2000
Akçakaya et al. IUCN Classifications under Uncertainty
1007
might enclose the result of the rule set EN using the fullrange of opinions from a number of experts. The top ofthe fuzzy number might represent the result of the samerule set based on the best estimates for each parameterfrom these same experts.
Dispute tolerance (DT) determines the level (repre-sented by the horizontal line) to use in determining thedegree of threat. The bottom of the fuzzy number repre-sents the case that includes all possibilities (DT
5
0).The top of the fuzzy number represents the case whendispute tolerance is highest (consensus; DT
5
1). Dis-pute tolerance represents how those interpreting thedata feel about uncertainty. If the interpreters want tobe sure of encompassing all possibilities, thus avoidingdisagreements and dispute, they would use a DT close to0. If they want to be restrictive in data use and rely onlyon the experts’ best estimates, they would use a DT closeto 1. A high DT would mean disregarding the more ex-treme opinions, which might lead to dispute. If the tailsof the distribution seem too extreme but the best esti-mates are too small to bound uncertainty, the interpretermay choose an intermediate value of, say, DT
5
0.5.
Risk Tolerance
Risk tolerance (RT) ranges from 0 for risk-averse, precau-tionary; through 0.5 for risk neutral; to 1 for risk prone,evidentiary. A precautionary attitude would accept thata species is safer than endangered only if it is certainlynot endangered, and RT would be closer to 0 than to 1.An evidentiary attitude would demand substantial evi-dence of endangerment before allowing such a classifi-cation, and RT would be closer to 1. As when dealingwith dispute tolerance, interpreters may choose to takean intermediate stance with, say, RT = 0.5 or to vary risktolerance from case to case, depending on what may belost or gained by a classification that might be either toohigh (risk overestimated) or too low (risk underesti-mated). Of course, mistakes of both kinds carry conse-quences in terms of the inefficient use of scarce conser-vation resources, and the possibility of inappropriatepriorities for action that lead to a species’ demise thatmight otherwise have been avoided.
Combining Attitudes with Uncertain Data
A given level of dispute tolerance reduces the threefuzzy numbers for CR, EN, and VU to three intervalswith midpoints, such as those in Fig. 3:
These intervals can be ordered as in Fig. 4. The catego-ries corresponding to CR, EN, and VU are on the x-axis,
CR: a, b, c[ ] 0.10, 0.25, 0.40[ ] ;=
EN: d, e, f[ ] 0.30, 0.55, 0.80[ ] ;=
VU: g, h, i[ ] 0.70, 0.85, 1.00[ ] .=
and the lower, mid, and upper values of the intervals areplotted on the y-axis. Thus, each interval is representedby a vertical stack of up to three points (square for CR,triangle for EN, and circle for VU). The width of these in-tervals is a function of dispute tolerance attitude. Themiddle points
b
,
e
, and
h
are needed for making a “mostplausible” classification under uncertain data. If they areomitted, and only the lower (
a
,
d
,
g
) and upper (
c
,
f
,
i
)values are used, some species with uncertain data willbe classified in a range of categories (such as EN toVU) and will not be assigned to a single most plausiblecategory. These ranges need not be in the middle, how-ever. Their location can be defined as a third attitude op-tion.
Fig. 4 shows three lines, each starting at the lower leftcorner of the graph and ending in the upper right cor-ner. The lower line connects the lower bounds of thethree intervals, the mid line (dotted) connects the mid-points of the three intervals, and the upper line con-nects the upper bounds of the three intervals.
Figure 4. Graphical representation of the method for combining attitudes and uncertain results to obtain threat status based on IUCN criteria. The set of three numbers for each category is derived from Fig. 3: squares mark points [a, b, c] for critically endangered (CR), triangles mark points [d, e, f] for endangered (EN), and circles mark points [g, h, i] for vulnerable (VU). These points correspond to the points in Fig. 3. The LR represents the nonthreatened category of “lower risk.” The intersection of the middle curve with the horizontal lines (RT, risk tolerance) gives the threat status (marked with a diamond). The intersec-tion of upper and lower curves with RT gives the range of plausible categories (thick line). This threat status and the range of plausible categories are used to clas-sify the species in Fig. 5.

1008
IUCN Classifications under Uncertainty Akçakaya et al.
Conservation BiologyVolume 14, No. 4, August 2000
These three lines are intersected by horizontal linesthat represent the risk tolerance attitude. This intersec-tion (the thick horizontal line) is the range of categoriesthat describes the threat status of this taxon, and the in-tersection with the dotted middle line (diamond-shapedmarkers) gives the threat status of this taxon. Thus, thistaxon is classified as VU if RT
5
0.8, EN if RT
5
0.5, andCR if RT
5
0.2. The status of the taxon under thesethree RT values is given in Fig. 5, which is similar to Fig.4 but with less detail. The range of plausible categoriesare CR to EN with RT
5
0.2, EN to VU with RT
5
0.5,and EN to LR with RT
5
0.8. Thus, the effect of lowerrisk tolerance is a higher threat category.
Grevillea caleyi
: a Case Study
We demonstrate our proposed method of propagatinguncertainty in IUCN rules with a case study of
Grevilleacaleyi
, a shrub that grows to about 2.5 m in dry sclero-phyll Eucalypt forest on the northern outskirts of Syd-ney, Australia. A few scattered populations remain, andthey face changed fire regimes and the pressures of landclearance and changes in seed predation.
The population size of
Grevillea caleyi
is estimated asa triangular fuzzy number, [800, 2000, 3000]. This esti-mate is based on field samples and extrapolations overall potential habitat and over known and suspected pop-ulations. We take the lower bound to be the lower esti-mates of population size and apply them to known pop-ulations. We take the upper bound to be high estimatesof population size based on field samples and applythem to known populations as well as potential popula-tions in unexplored habitat.
For extreme fluctuations in population size, area, ex-tent, and number of populations, we specified point es-timates of 1 (true). The populations experience extremefluctuations because they are periodically burned andstanding plants killed. Seedlings regenerate after fire, butthe seed store is depleted until the new germinantsgrow to maturity and replenish it. Populations are at riskbecause there is a possibility of repeated fires at inter-vals that preclude the development of adult plants (Brad-stock et al. 1998). Area and extent fluctuate for the samereasons that populations fluctuate in size at any given lo-cation, because periodic planned and unplanned fireskill adult plants. Populations may be eliminated andranges changed when fire frequencies become too high.In addition, there may be trends in area and extent thatresult from habitat loss from urban development.
For continuing declines in population size, extent,area, and quality of habitat, we specified a value of 0.5(midpoint between true and false; suspected). This re-flects the fact that we are uncertain about whether, infact, there is a continuing decline. Any deterministictrends are masked by natural variation and sampling er-ror, making any such judgements uncertain, no matterhow reliable the data. Maximum uncertainty could bespecified by a uniform distribution between 0 and 1 (noknowledge).
Past population reduction (specified as [0, 5, 25]%) isuncertain because no exact records of population sizesexist for the last 20 years. Future population reduction(specified as [5, 10, 30]%) is uncertain because it de-pends on natural variation and on how fire regimes aremanaged. These parameters were determined in part byeconomic and property risks and by risks to human life(Gill & McCarthy 1998), and they are inherently unpre-dictable. The bounds were derived from expert judge-ment of the plausible extremes.
The extent of occurrence of [4, 6, 7] km
2
was basedon minimum convex polygons of known locations. Theextent is uncertain because of the concern for the ap-propriateness of including a small outlying populationthat might have been introduced. Area of occupancy of[0.15, 0.25, 1.00] km
2
was based on field surveys ofknown populations and extrapolation to potential habi-tat. The bounds were derived from expert judgement ofthe plausible extremes, supported by maps of potentialhabitat.
The number of populations and locations was esti-mated as [3, 5, 7]. Populations are more or less isolatedfrom one another by roads and other human infrastruc-ture. There are no obvious dispersal mechanisms tocarry seeds between patches. Thus, we conclude thatthe species’ populations might be severely fragmented,and we specified the truth value as [0.5, 1.0]. The size ofthe largest population is [200, 700, 900], based on fieldsampling and the assumption that the known popula-tions include the largest.
Figure 5. Threat classification based on Fig. 4. Each line indicates the range of plausible categories, and the diamond marker indicates the most plausible threat status. The lines and markers are determinedin Fig. 4. With RT 5 0.2, the status is CR, with theplausible range of CR to EN; with RT 5 0.5, the status is EN, with the plausible range of EN to VU; withRT 5 0.8, the status is VU, with the plausible range of EN to LR.

Conservation BiologyVolume 14, No. 4, August 2000
Akçakaya et al. IUCN Classifications under Uncertainty
1009
An individual-based model was written to calculatethe likelihood of extinction of populations, taking intoaccount the dynamics of fires within patches, the dy-namics of seed banks, local competition for space be-tween plants, predation of seeds by small mammals, andseveral other factors (Regan et al. 1998). If we assumethat all individuals of a species are in a single population,thus, the probability of extinction ranges from [0.1, 0.5,1.0] in 100 years to [0, 0.1, 0.5] in 21 years. The upperand lower bounds depend on the level of optimism se-lected for the parameters and structures in the model.The model was designed to predict extinction risks insingle populations. The probability of extinction of thespecies as a whole is not the primary focus of this mod-eling exercise. The integration of the single-populationresults to estimate extinction risks for the entire speciesinvolves assumptions about the spatial distribution offire events, creating a degree of subjective uncertainty inthe predictions.
When we used point estimates for each of the parame-ters,
G. caleyi
was classified as CR. Criterion B deter-mined this status because the extent of occurrence is
,
100 km2, the area of occupancy is ,10 km2, decline iscontinuing, and several population attributes show ex-treme fluctuations.
We are uncertain about the fact that there is a continu-ing decline. If we had decided instead that there was nocontinuing decline, the species would have been classi-fied as EN, again on the basis of criterion B, not for thereasons listed above but because it exists at five or fewerlocations (criterion B1) and populations are fluctuating(B3) rather than exhibiting a continuing decline (B2).This emphasizes the importance of dealing explicitlywith uncertainty. In this case, the classification of thespecies as CR or EN rests on the belief that there is acontinuing decline. Continuing declines are masked bynatural variation, sampling error, and uncertainty in thedefinition of terms and parameters. We are reasonably cer-tain, however, that the species is at least endangered (atleast, if we ignore uncertainty in the other parameters).
With the methods described above, and with attitudeoptions DT 5 0.5 and RT 5 0.5, the species is again clas-sified as CR, with plausible categories including EN andVU. This classification depends on attitude to risk (Fig.
6). In this case, if those classifying the species demandthat evidence be presented to establish that a higherclassification is warranted (RT 5 0.8), then the specieswould be classified as VU. In this case, the classificationwas not very sensitive to different attitudes toward un-certainty (compare middle three lines with different val-ues of dispute tolerance, DT). Figures like this one canbe used as sensitivity analyses to reveal the weight ofchoices about attitude.
Discussion
Types of Uncertainty
Our proposed approach provides a general frameworkfor incorporating all three types of uncertainty we de-scribed in the introduction. Nevertheless, it is most ap-propriate to interpret the uncertainties in terms of mea-surement error. Some types of semantic uncertainty,such as vagueness, can also be represented with fuzzynumbers for input data. A more efficient way to dealwith these uncertainties might be to make the defini-tions more explicit and to describe the method of mea-surement of each variable in detail. As we discussedabove, it might be possible to reduce or eliminate se-mantic uncertainty in some cases, but only at some costof loss of generality. In other cases, it may not be possi-ble to reduce it. When it is not desirable or possible toreduce semantic uncertainty, as when flexibility is a de-sired characteristic of rule sets, the approach we haveoutlined can incorporate such uncertainties.
Natural variation in input variables can also be repre-sented with fuzzy numbers, but two better ways of incor-porating natural variability are the use of probability distri-butions and the inclusion of information on naturalvariation in the input data. Using probability distributionsinstead of fuzzy numbers is a more efficient way to incor-porate natural variability. This is because probability distri-butions make it easier to add more information about thevariable, including the shape and variance of the distribu-tion and the exact dependencies, when these are known.
We believe the most efficient method of accountingfor natural variability in rule sets is to explicitly add in-
Figure 6. Threat classification of Grevillea caleyi according to IUCN rules under uncertainty and with different attitudes toward dispute tolerance and risk tolerance. Each line indicates the range of plausi-ble categories, and the diamond marker indicates the threat status.

1010 IUCN Classifications under Uncertainty Akçakaya et al.
Conservation BiologyVolume 14, No. 4, August 2000
formation on natural variability. This is already (partly)done in the IUCN rules. For example, the rules ask forinformation about current total abundance (thus explic-itly excluding spatial and temporal variability) and forother information on temporal variability (e.g., whetherthere are fluctuations in the number of populations andlocations and the risk of extinction) and spatial variabil-ity (e.g., whether all individuals are in the same popula-tion).
Meaning of Unknown
One of the problems with using uncertain data in classi-fications relates to quantities for which there are no dataat all. As the IUCN rules are applied now, one is allowedto omit a criterion for which there are no data. Thus, ifdata for one or more of the criteria A to E are unknown,that criterion is omitted from expression 1. Operation-ally, this is equivalent to answering the question for thatcriterion as “no.” For example, if the number of matureindividuals is unknown, criterion D (expression 2) wouldbe assumed to be unmet, which gives the same result asassuming it to be false. There are three problems withthis approach. First, when uncertainty is considered ex-plicitly, “no” and “don’t know” should be distinct an-swers. In this example, the answer (to the question “Isthe number of mature individuals ,50?)” should be theinterval [0, 1], representing complete ignorance aboutthis logical value. Second, setting D equal to false givesthe least conservative answer because it is equivalent toassuming that the number of mature individuals is $1000(the threshold for VU, the least threatened category).Third, setting D equal to false gives the narrowest boundson the answer. If the data had suggested that the num-ber of mature individuals was, for example, [40, 60] theclassification would have been both more threatened(including CR) and more uncertain (including more thanone category). Thus, assuming that “unknown” is thesame as “false” rewards those with the least amount ofdata. Those that have more data are punished, in thesense that they receive a more uncertain classificationthan those who did not even try to collect the necessaryinformation.
One solution to the problem is to set “unknown” tothe total range of possible and relevant answers. For ex-ample, if the number of mature individuals is unknown,it can be set to the interval [0,`]. If it is not knownwhether the taxon experiences extreme fluctuations,the answer can be set to the interval [0, 1]. The methodswe describe will then propagate the uncertainty in aproper and consistent way. The results will be truthful,and the procedure will encourage collection of data.The problem with this approach is that the classificationof many species may include the category CR. Althoughthis may well be justified based on the available data, itmay also be rejected on practical grounds. Our sugges-
tion is to leave this decision to the interpreters of dataand ask them to explicitly state whether any criterionshould be ignored (omitted from calculations).
Advantages of the Proposed Approach
There may be various ways of using uncertain data inthe classification of species, according to the IUCN crite-ria. The particular approach we propose has a numberof advantages:
• It does not alter the rules, thresholds, or intent of theIUCN criteria.
• When there is no uncertainty, the classification is thesame as the current application of the IUCN criteria.
• When there is only minimal uncertainty, the classifica-tion does not change substantially or qualitativelyfrom the classification without uncertainty.
• The classification does not change when the uncer-tainty is irrelevant—for example, when the range fornumber of mature individuals does not include thethreshold for any of the categories.
• In other cases, the width of the range of resulting cat-egories, such as CR to EN, increases with increasinguncertainty.
• The proposed method is simpler than many alterna-tives. Asking for only a best estimate and an interval (arange of plausible values) is much simpler than askingfor probability distributions or other representationsof uncertainty.
• The method is based on intervals, which, unlike prob-ability distributions, make minimal assumptions aboutmass; they are only bounds. This approach uses themost elementary method of uncertainty propagation.
• The method discourages ignoring any of the criteria.
• It recognizes that different people may have differentattitudes to risk and uncertainty.
• It leaves arbitrary decisions, such as those about atti-tude, to the interpreters, but it requires an explicitstatement of these decisions. When different inter-preters reach different conclusions based on the samedata, the differences may be traced to specific deci-sions. Given a certain and explicitly stated set of atti-tudes, the classifications are consistent.
• When the effect of uncertainty on the listing is madetransparent, it becomes impossible to use uncertaintyas an excuse for promoting a certain agenda of eitherunder- or overprotecting species. If parties disagreewith the listing, they have the option of either arguingfor different priorities through the choice of the atti-tude parameters or reducing the range of plausible list-ing categories by gathering better data.
• It distinguishes between and provides acceptable so-
Conservation BiologyVolume 14, No. 4, August 2000
Akçakaya et al. IUCN Classifications under Uncertainty 1011
lutions in circumstances in which (1) we are ignorantof required information, (2) we wish to ignore a pieceof information, or (3) we are indifferent to the risksposed by a particular circumstance.
These benefits are not achieved without some costs.Decisions about where to set DT and RT levels need tobe made by some process that links them to values thatpeople have for biodiversity conservation. It may be thatconservation biologists and resource managers typicallyhave contrasting attitudes (e.g., Mace & Hudson 1999),and the setting of these levels will become the focus fordisagreements rather than the status of particular spe-cies. Unfortunately, despite the fact that it is preciselythese attitudes and values that underlie many disagree-ments, few biologists are trained to tackle such debates.
Despite such difficulties, our approach can provide abasis for constructive methods to resolve disputes overspecies listings. For example, most of the difficulty andcontroversy involved in listing decisions at present is theresult of uncertainty of various kinds. Commonly, a spe-cies might change from one category to another depend-ing upon how the evaluator chooses to extrapolate in-formation from one part of a species range to the entirespecies, or whether or not the evaluator believes naturalfluctuations can explain current trends. Without addi-tional data, such issues are essentially unresolvable, andso the debate becomes a polarized one based on differ-ent attitudes to risk and uncertainty. A procedure suchas the one we have described can formalize and struc-ture such a debate. In addition, if the operational levelsfor DT and RT are determined beforehand, a conclusioncan be reached based on accepted principles rather thanpersonal perspectives.
Our approach also clarifies the different threat pro-cesses that evaluators may wish to represent in prospec-tive classifications. For example, under criterion A in theIUCN system, species may be listed as threatened if thepopulation is expected to decline by a specified rate inthe future. This expected decline may be deduced fromquite deterministic processes, such as continuing habitatloss from commercial harvesting that proceeds at a pre-dictable rate. Alternatively, future declines may be ex-pected as a result of stochastic events of high impact butlow predictability, such as changes in the area that mayinfluence key breeding sites and affect juvenile survivalrates. In the former case, there is a decline rate that canbe measured more or less precisely, whereas in the lat-ter the expected decline rate has more uncertainty asso-ciated with it. Under the simple implementation of theIUCN system, these two cases might be given the sameexpected decline rate. Under the system we have de-scribed, the larger uncertainty of the second case con-tributes differently to the outcome. The transparency ofdealing with these difficult listing decisions is an impor-tant byproduct of this system.
Acknowledgments
Discussions with H. Regan and M. Colyvan helped clarifyour ideas. We also thank B. Taylor, A. Punt, and twoother reviewers for helpful comments and B. Root forimplementing the proposed method as computer soft-ware. H.R.A. and S.F. were supported by grants from theNational Science Foundation, the National Institutes ofHealth, and the Electric Power Research Institute.
Literature Cited
Akçakaya, H. R. 1992. Population viability analysis and risk assessment.Pages 148–157 in D. R. McCullough and R. H. Barrett, editors. Wild-life 2001: populations. Elsevier, Amsterdam.
Akçakaya, H. R., and S. Ferson. 1999. RAMAS red list: threatened spe-cies classifications under uncertainty. User manual for Version 1.0.Applied Biomathematics, Setauket, New York.
Bradstock, R. A., M. Bedward, B. J. Kenny, and J. Scott. 1998. Spatially-explicit simulation of the effect of prescribed burning on fire re-gimes and plant extinctions in shrublands typical of south-easternAustralia. Biological Conservation 86:83–95.
Breininger, D. R., M. J. Barkaszi, R. B. Smith, D. M. Oddy, and J. A.Provancha. 1998. Prioritizing wildlife taxa for biological diversityconservation at the local scale. Environmental Management 22:315–321.
Burgman, M. A., S. Ferson, and H. R. Akçakaya. 1993. Risk assessmentin conservation biology. Chapman and Hall, London.
Burgman, M.A., D.A. Keith, and T.V. Walshe. 1999. Uncertainty incomparative risk analysis of threatened Australian plant species.Risk Analysis 19:585–598.
Czech, B., and P. R. Krausman. 1997. Distribution and causation of spe-cies endangerment in the United States. Science 277:1116–1117.
Ferson, S., W. Root, and R. Kuhn. 1998. RAMAS risk calc: risk assess-ment with uncertain numbers. Applied Biomathematics, Setauket,New York.
Fitter, R., and M. Fitter, editors. 1987. The road to extinction. WorldConservation Union and United Nations Environmental Pro-gramme, Gland, Switzerland.
Fréchet, M. 1935. Généralisations du théorème des probabilités to-tales. Fundamenta Mathematica 25:379–387.
Gill, A. M. and M. A. McCarthy. 1998. Intervals between prescribedfires in Australia: what intrinsic variation should apply? BiologicalConservation 85:161–169.
Hailperin, T. 1986. Boole’s logic and probability. North-Holland, Am-sterdam.
IUCN (Species Survival Commission). 1994. International Union for theConservation of Nature Red List Categories. Gland, Switzerland.Also available from http://www.iucn.org/themes/ssc/redlists/ssc-rl-c.htm.
Kaufmann, A., and M. M. Gupta. 1985. Introduction to fuzzy arith-metic: theory and applications. Van Nostrand Reinhold, New York.
Klir, G. J., and B. Yuan. 1995. Fuzzy sets and fuzzy logic: theory and ap-plications. Prentice Hall PTR, Saddle River, New Jersey.
Lunney, D., A. Curtin, D. Ayers, H. G. Cogger, and C. R. Dickman.1996. An ecological approach to identifying the endangered faunaof New South Wales. Pacific Conservation Biology 2:212–231.
Mace, G. M., 1995. Classification of threatened species and its role inconservation planning. Pages 197–213 in J. H. Lawton and R. M.May, editors. Extinction rates. Oxford University Press, Oxford,United Kingdom.
Mace, G. M., and E. J. Hudson. 1999. Attitudes toward sustainabilityand extinction. Conservation Biology 13:1–6.
Mace, G. M., and R. Lande. 1991. Assessing extinction threats: towards

1012 IUCN Classifications under Uncertainty Akçakaya et al.
Conservation BiologyVolume 14, No. 4, August 2000
a re-evaluation of IUCN threatened species categories. Conserva-tion Biology 5:148–157.
Master, L. L. 1991. Assessing threats and setting priorities for conserva-tion. Conservation Biology 5:559–563.
Millsap, B. A., J. A. Gore, D. E. Runde, and S. I. Cerulean. 1990. Settingthe priorities for the conservation of fish and wildlife species inFlorida. Wildlife Monographs. Supplement Journal of Wildlife Man-agement 54:5–57.
Regan, H. M., A. Rawlinson, D. A. Keith, T. Auld, and M. Burgman.1998. Population viability analysis for Grevillea caleyi, Epacris stu-artii and E. barbata. Pages 53–71 in Plant population viability anal-ysis and case studies. Project FN–37. Environment Australia, Uni-versity of Melbourne, Melbourne.
Regan, H. M., M. Colyvan, and M. A. Burgman. 2000. A proposal forfuzzy IUCN categories and criteria. Biological Conservation 92:101–108.
Taylor, B. L. 1995. The reliability of using population viability analysisfor risk classification of species. Conservation Biology 9:551–558.
The Nature Conservancy. 1994. The conservation of biodiversity in theGreat Lakes ecosystem: issues and opportunities. Great Lakes Pro-gram, Chicago.
U.S. Fish and Wildlife Service. 1983. Endangered and threatened specieslisting and recovery priority guidelines. Federal Register 43(184):43098–43105.
Wells, J. V., and M. E. Richmond. 1995. Populations, metapopulationsand species populations: what are they and who should care? Wild-life Society Bulletin 23:458–462.
Wise, B. P., and M. Henrion. 1986. A framework for comparing uncer-tain inference systems to probability. Pages 69–83 in L. N. Kanaland J. F. Lemmer, editors. Uncertainty in artificial intelligence.Elsevier Science Publishers, Amsterdam.
Appendix
Uncertainty Propagation
A fuzzy number can be considered a set of nested intervals [ali, ari]at each of many levels i from zero (bottom of the fuzzy number) to 1(top). These levels correspond to the vertical axes in Figures 1 and 2.The subscripts l and r refer to left (lower) and right (upper) bounds ofeach interval, so that ali # ari for all i. The intervals are nested so thatthose below are included in those above: ali # alj and arj # ari when-ever i # j.
An ordinary scalar number is a special case of a fuzzy number forwhich ali 5 ari for all i. A fuzzy number is an interval if ali 5 al and ari 5ar for all i. All the arithmetic operations we use on fuzzy numbers aredefined as level-wise operations on the intervals that comprise thefuzzy numbers. In the definitions below, we omit the subscripted isfor the sake of simplicity, but that the interval operations are repeatedat all levels to define the fuzzy operations.
Going from fuzzy numbers that represent particular parameters(Figs. 1 & 2) to a fuzzy number representing a risk category (Fig. 3) re-quires a logical system that includes comparison of the numericalvalue of these parameters (e.g., expression 2 in discussion of charac-terizing uncertainty). In the proposed system, numerical magnitudecomparisons are defined according to the following four rules:
a b<1 if ar bl,<
0 if br al,≤
0, 1[ ] otherwise.
a b>1 if al br,>
0 if bl ar,≥
0, 1[ ] otherwise.
a b≤1 if ar bl,≤
0 if br al,<
0, 1[ ] otherwise.
a b≥1 if al br,≥
0 if bl ar,>
0, 1[ ] otherwise.
==
==
The IUCN criteria also utilize AND and OR operations (e.g., expres-sion 3 in discussion of characterizing uncertainty). Many generaliza-tions of the AND and OR operations have been proposed in the litera-ture on uncertainty propagation, and fuzzy interpretations of thelogical operations have been debated throughout the history of fuzzylogic (Klir and Yuan 1995). Originally, the min and max functions wereproposed to model conjunction (AND) and disjunction (OR). Thismeant, for instance, that when a had the value 0.3 and b had the value0.6, the conjunction (a AND b) would have the value 0.3. These func-tions generalize the traditional Boolean operators, but they are not theonly possible functions that do. In the last three decades, many differ-ent operators have been suggested for fuzzy logic, although each is ar-bitrary in its own way. The difference among these operators reducesto an assumption each makes about the dependence between a and b.
As Wise and Henrion (1986) explain, the original min and max func-tions effectively assume that the operands are perfectly dependent.This is a rather strong assumption, yet it seems better than assumingindependence among the quantities mentioned in the IUCN criteria,which we believe will rarely if ever be a tenable assumption. As an in-clusive compromise, we follow Wise and Henrion and computebounds on the conjunction and disjunction without making any as-sumption about the dependence between the operands except that itis positive. We use the operations
In these two operations, there are three functions (env, min, max)and two operators (2 and 3). These are defined as follows:
The a and b are two intervals, and the subscripts l and r refer to theleft and right (lower and upper) ends of these intervals. The definitionsare demonstrated as follows, with the following two fuzzy numbers asexamples: A 5 [0.35, 0.6, 0.7, 0.95] and B 5 [0.15, 0.4, 0.525].
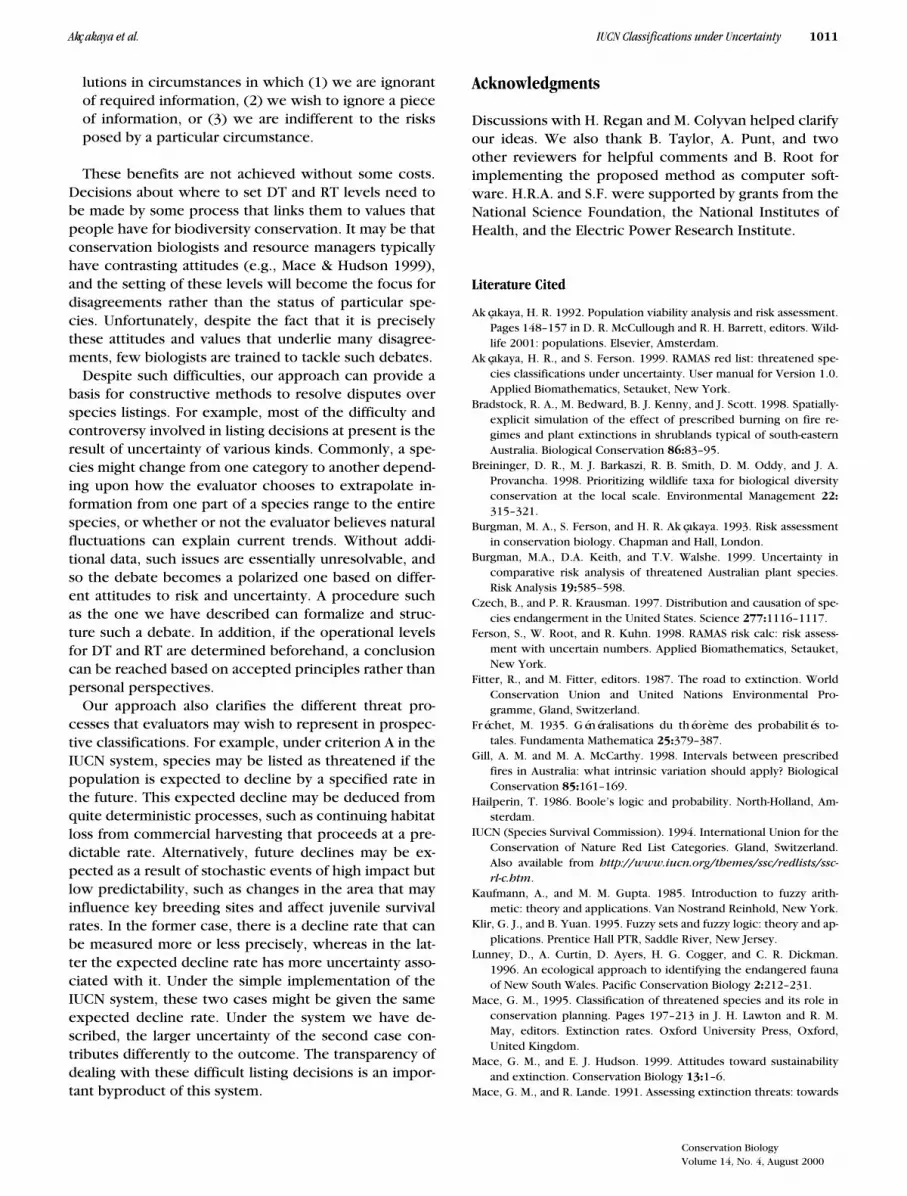
The result of the operation A or B is given in Fig. 7. The result is ob-tained by repeating the OR operation defined above for each level ofthe two fuzzy numbers A and B. Thus, there are many calculations,which correspond to levels of possibility. The following numerical ex-ample demonstrates the operations defined above for one level ofthese two fuzzy numbers. At possibility 5 0.2, we have the intervals a 5[0.2, 0.5] and b 5 [0.4, 0.9]. With this level as an example, the opera-tions min, max, 12 a, a 3 b, a AND b, a OR b are as follows:
These definitions of AND and OR are implemented in the softwareused for the calculations in this paper (Akçakaya and Ferson 1999).They account for the fact that it is often unclear what kind of depen-
a AND b env a b, × min a,b( )( ),a OR b env max a, b( ),1 1 a–( ) 1 b–( )×–( ).=
=
min a, b( ) min al, bl( ),min ar, br( )[ ] ,max a, b( ) max a( l, bl ),max ar, br( )[ ] ,env a, b( ) min a( l, bl ),max ar, br( )[ ] ,a b+ al bl+ ,ar br+[ ] ,a b– al br– ,ar bl–[ ] ,a b× al bl× ,ar br×[ ] .=
==
===
min a, b( ) min 0.2, 0.4( ), min 0.5, 0.9( )[ ] 0.2, 0.5[ ]==
max a, b( ) max 0.2, 0.4( ) max, 0.5, 0.9( )[ ] 0.4, 0.9[ ]==
1 a– 1 ar– ,1 al–[ ] 1 0.5–( ), 1 0.2–( )[ ] 0.5, 0.8[ ]= = =
1 b– 1 br– ,1 bl–[ ] 1 0.9–( ), 1 0.4–( )[ ] 0.1, 0.6[ ]= = =
a b× al bl× ,ar br×[ ] 0.2 0.4× , 0.5 0.9×[ ] 0.08, 0.45[ ]= = =
a AND b env a b× , min a, b( )( )=
env 0.08, 0.45[ ] , 0.2, 0.5[ ]( )=
0.08, 0.5[ ]=
a OR b env max a, b( ),1 1 a–( ) 1 b–( )×–( )=
env 0.4, 0.9[ ] ,1 0.5, 0.8[ ]( 0.1, 0.6[ ]×–( )=
env 0.4, 0.9[ ] ,1 0.05, 0.48[ ](–( )=
env 0.4, 0.9[ ] , 0.52, 0.95[ ]( )=
0.4, 0.95[ ] .=
Conservation BiologyVolume 14, No. 4, August 2000
Akçakaya et al. IUCN Classifications under Uncertainty 1013
dence assumption should be made among the variables when empiri-cal information is lacking. It would also be possible to computebounds on the conjunction and disjunction that make no assumption
whatever about the dependence between a and b (Fréchet 1935; Hail-perin 1986; Ferson et al. 1998). The resulting bounds would beroughly twice as wide as those we compute.
Figure 7. Demonstrations of the fuzzy arithmetic rule we used for disjunction (OR) operation: A 5 [0.35, 0.6, 0.7, 0.95], B 5 [0.15, 0.4, 0.525], C 5 A or B 5 [0.35, 0.6, 0.82, 0.97625]. The numerical example in the text corresponds to the level indicated by the horizontal dashed line.


