Embed Size (px)
Citation preview

FEBRUARY 2022Authors: Gabriela Rubio-Domingo and Amit HaleviContributors: Charles Cannon, Suzanne Greene, and Marc Johnson
Making Plastics Emissions Transparent

2
About
The Coalition on Materials Emissions Transparency (COMET) is an initiative between the Columbia Center on Sustainable Investment (CCSI), the Payne Institute for Public Policy at the Colorado School of Mines, RMI, and the United Nations Framework Convention on Climate Change (UNFCCC).
COMET accelerates supply chain decarbonization by enabling producers, consumer-facing companies, investors, and policy makers to better account for greenhouse gas (GHG) emissions throughout materials supply chains, in harmony with existing GHG accounting and disclosure methods and platforms.

3
Introduction
What’s in a Plastic Carbon Footprint?
1. Feedstock and Resin Production 1.1 Extraction and Production1.2 Choice of Feedstock
2. Conversion from Resin to Plastic Products: Variation across Materials and Studies
3. Transportation
4. End-of-Life Considerations
Conclusions
Endnotes
4
5
7
7 8
10
11
11
14
15
Table of Contents

Making Plastics Emissions Transparent
4
equally. Many companies rely on industry average values to estimate the climate impacts of their plastic products, but this practice can easily result in an overrepresentation or underestimation of the real impact. In fact, we find that variations along the life cycle of plastic can significantly affect the ultimate carbon footprint of a plastic product.
This paper will explain some of these variations across the different stages in plastic’s life cycle, which we hope will be useful in a few ways. First, we hope to provide a pathway for companies to employ tailored information to gain more resolution on the material’s carbon footprint, increasing the accuracy of scope 3 carbon emissions accounting for plastic. Second, we hope to shed light on how companies can use carbon emissions data in the procurement process, gathering information on the key supply chain steps that have the biggest effect on the final carbon footprint value. Third, we hope to propagate a mechanism by which sourcing based on life-cycle carbon emissions can serve to grow the market for more sustainably produced plastics circumventing the predicted four-fold growth in emissions by 2050.4
Plastics represent one of the biggest environmental challenges to society. Ubiquitous in our daily lives, from food packaging to clothing, from healthcare to homes and beyond, plastic is the most common human-made material. Its widespread use has enabled many aspects of modern life but has also created an unprecedented pollution crisis—nearly 80% of the 8,300 million tons of plastic made since 1950 remains intact in our landfills, rivers, and oceans.1
Further, because more than 99% of plastic is made from, and produced using energy derived from, fossil fuels, it is implicated as a large and growing contributor to global climate change.2 Plastic was responsible for 1.7 gigatons (Gt) of CO2 equivalent (CO2e) in 2015, a number that is expected to grow to 3.5 Gt by 2050 if we continue producing plastic as we do today.3
For companies and consumers that rely on plastics, there is a growing imperative to source options with a lower climate impact, higher post-consumer content, and widespread recyclability. In this study, we focus on climate impact, aiming to show that not all plastics are created
Introduction

5
Making Plastics Emissions Transparent
What’s in a Plastic Carbon Footprint?
Plastic refers to a broad range of synthetic or semisynthetic polymers that can take many forms. The most common plastics, in order of tons produced annually, are low-density polyethylene (LDPE), high-density polyethylene (HDPE), polyphthalamide (PPA), polypropylene (PP), polystyrene (PS), polyethylene terephthalate (PET), polycarbonate (PC), and polyurethane (PU).
The carbon footprints of different types of plastics vary based on their ingredients and how and where they were produced. But the methods and data that are used in the carbon footprint analysis also contribute to the variation. Exhibit 1 shows a simplified representation of a plastic life cycle. Carbon footprints are typically based on either a top-down approach, where emissions are estimated based on high-level assumptions about materials and activities, or a bottom-up approach, based on data on fuel and energy used in the production process. Sometimes a combination of the two is employed.
We looked at 38 studies from governments and academic sources published between 2011 and 2021 and extracted the published carbon footprint values for plastics in each. We found that the carbon footprint of the same materials can vary widely, based on the approach used, the accounting methods employed, and the life cycle of the plastic being studied. For example, different studies assigned a number of different values to PET (Exhibit 2). Taking those values into account, the ultimate carbon footprint of PET could range by upward of 100% depending on how it’s made, between 1.5 kg and 3.6 kg CO2e per kilogram.
This variability is common across the major plastics. One exception was polycarbonate, where only one carbon footprint value was found in the literature, which was relatively higher than all other plastics.
Exhibit 1: A simplified diagram of the plastic life cycle
Source: Prepared by the authors based on 2006 IPCC Guidelines for National Greenhouse Gas Inventories (IPCC 2008)

Making Plastics Emissions Transparent
6
Exhibit 2: Emissions factors for different types of plastic from various sources
Sources: Center for International Environmental Law;5 Carbon Tracker,6 A. Dormer et al.;7 Franklin Associates;8 Y. Aryan, P. Yadav, and S. R. Samadder;9 Peter Shonfield;10 T. A. Hottle, M. M. Bilec, and A. E. Landis;11 PlasticsEurope;12 and J. Philp.13

7
Making Plastics Emissions Transparent
Exhibit 3: Emissions from the production of feedstock and resin manufactured with fossil and renewable energy.
Source: Adapted from Zheng, J. & Suh, S.16
This study demonstrates that simply taking an average value does not necessarily give you an accurate carbon footprint value. The following sections shed light on the areas that contribute most to the variability in product carbon emissions, and where companies can focus their data collection efforts and carbon reduction strategies. We will focus primarily on plastic production and recycling, but leave out any emissions that take place during the use of the product, due to the wide variety of applications of plastic.
1. Feedstock and Resin Production
The extraction of raw material, or feedstock, and the transformation of feedstock into resin, the primary ingredient of plastic, made up 61% of global plastic
sector emissions in 2015.14 Assessing resin production is therefore key to understanding a plastic’s carbon footprint. Two main areas of differentiation occur in this phase: the feedstock used to make resin and the energy source used for production.
1.1 Extraction and ProductionOne key differentiator is the increasing use of renewable energy for the electricity needs of the extraction and production phases. Even if the feedstock remains fossil fuel-based, the emissions intensity (in kg CO2e per kg of plastic) can be reduced significantly if the energy mix is gradually decarbonized and becomes 100% renewable by 2050 (Exhibit 3).15 For example, the emissions of a common PET bottle can be cut by 56% if it is made with renewable energy, and they can drop by up to 75% for PVC.

Making Plastics Emissions Transparent
8
Exhibit 4: The range in emissions of ethylene production for NG and naphtha feedstocks
Sources: Intergovernmental Panel on Climate Change;18 M. Neelis, M. Patel, and M. De Feber;19 National Environment Agency;20 and I. D. Posen et al.21
While these numbers are presented as an average, we know renewable energy adoption throughout the production process is not as straightforward as it may seem. In reality, there will be additional variations within these values based on different producers and energy sources. We expect that these variations will only continue to become more complex along the supply chain, as different regions or producers transition to renewable energy at varying speeds.
1.2 Choice of FeedstockThe most common feedstocks for plastics include oil, natural gas, coal, cellulose, and other materials. Emissions from plastic production can vary widely based on how and where the feedstock is produced, as well as the type of plastic in which it is ultimately used.
Fossil fuel-based feedstock: Ethylene is the feedstock used in most of the most common plastics in the world.17 It is obtained by steam cracking from natural gas or naphtha (a derivative of oil), depending on local economics.
Natural gas is common in North America, South America, and Australia (where it is relatively cheap), and naphtha is common in Europe, Asia, and Africa. This has a very significant effect on emissions: ethylene derived from natural gas has lower emissions than ethylene made from naphtha, with variation within the feedstock’s footprint tied to the country of production (Exhibit 4).
While these values provide a baseline, they have uncertainties of more than 40%, depending on local production conditions, according to the US Environmental Protection Agency. Cracking takes a large amount of energy, and the source of this energy has a large effect on total emissions. Power from coal typically has about twice the emissions as power from natural gas, and renewables or nuclear power carry negligible carbon emissions, which could cut emissions from production by almost half. Emissions derived from other feedstocks, such as propylene and benzene, are difficult to estimate, as they are produced primarily as side-products of ethylene production.
kg CO2e/kg feedstock

9
Making Plastics Emissions Transparent
Exhibit 5: PET feedstock and resin production for PET from different feedstocks under a fossil and renewable-based energy system
Source: Adapted from Zheng et al.28
Bio-based plastics: Plastics can be made from materials other than fossil fuels, such as corn and sugarcane. These materials can be used to make plastics like PET and PE, as well as other chemical configurations that can be used as a substitute to conventional plastics. For PET, bioplastics can lead to lower emissions in the production stage, especially if produced using renewable energy (Exhibit 5). As previously mentioned, emissions could be cut by 62% just by using renewable energy sources however, a 93% reduction from the baseline could be achieved by 2050 if renewables are combined with the use of bioplastics.22
However, while their climate impacts may be lower, bioplastics can lead to significant negative impacts on water resources, as well as a high demand for agricultural land.23 Because of this, the use of bioplastics generally represents a shifting of the burdens associated with production of plastics, rather than solving the issues associated with the conventional plastics. Bioplastics have great potential to become more environmentally friendly in the future if issues related to their production are solved.
Several good practices are mentioned in the literature as possible ways to optimize the production and use of bioplastics, and thus convert them into a good substitute for conventional plastics. Some of these alternative practices include:
• Improvement of agriculture practices and reduction of pesticides
• Optimization of energy use and decarbonization of energy sources24
• Use of fallow lands25
• Use of waste as feedstock26
• Incorporation of bioplastics into a circular economy with mechanical recycling27
Making Plastics Emissions Transparent
10
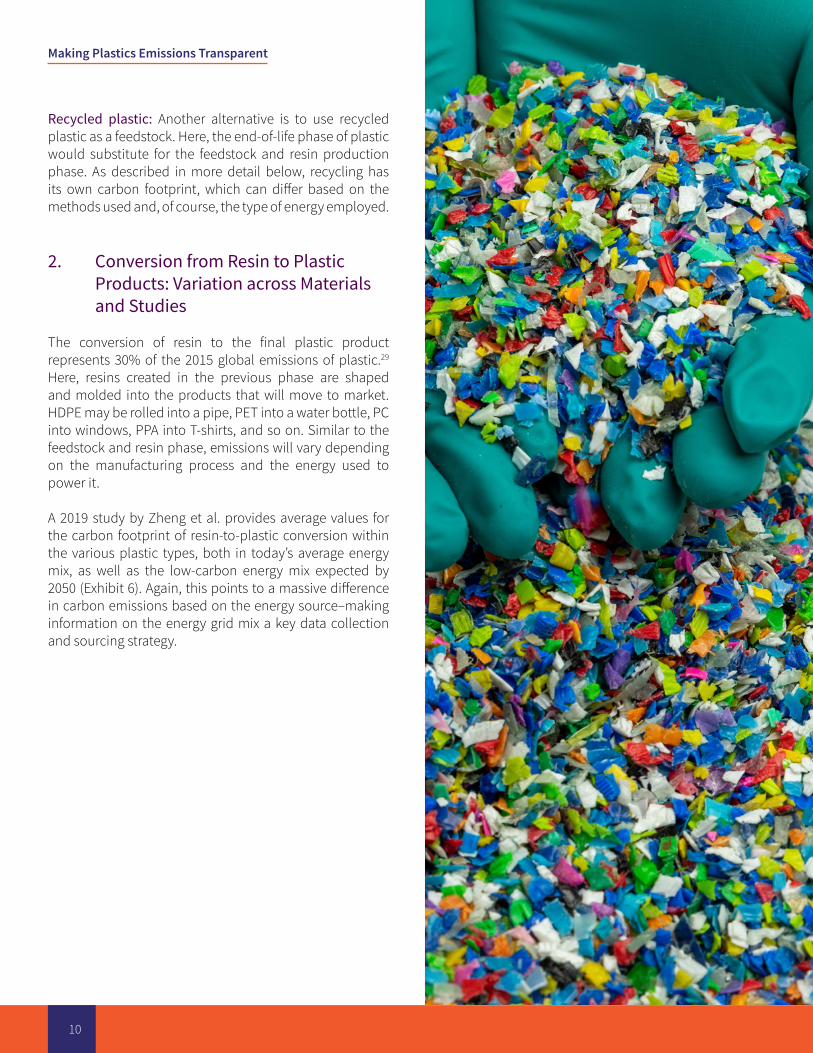
Recycled plastic: Another alternative is to use recycled plastic as a feedstock. Here, the end-of-life phase of plastic would substitute for the feedstock and resin production phase. As described in more detail below, recycling has its own carbon footprint, which can differ based on the methods used and, of course, the type of energy employed.
2. Conversion from Resin to Plastic Products: Variation across Materials and Studies
The conversion of resin to the final plastic product represents 30% of the 2015 global emissions of plastic.29
Here, resins created in the previous phase are shaped and molded into the products that will move to market. HDPE may be rolled into a pipe, PET into a water bottle, PC into windows, PPA into T-shirts, and so on. Similar to the feedstock and resin phase, emissions will vary depending on the manufacturing process and the energy used to power it.
A 2019 study by Zheng et al. provides average values for the carbon footprint of resin-to-plastic conversion within the various plastic types, both in today’s average energy mix, as well as the low-carbon energy mix expected by 2050 (Exhibit 6). Again, this points to a massive difference in carbon emissions based on the energy source–making information on the energy grid mix a key data collection and sourcing strategy.

11
Making Plastics Emissions Transparent
Exhibit 6: Emissions from the conversion life cycle phase, based on the energy mix of today and 2050
Source: Adapted from Zheng et al.30
3. Transportation
Transportation links all aspects of the plastic supply chain: ships, trains, and trucks move the feedstock, resin, and product from the point of extraction to disposal. Emissions derived from transportation present great variability depending on many factors, such as distance covered, mode of transport, vehicle type, and so on. At present there is not enough research on transportation emissions in relation to plastic production, as its effect on total emissions is considered by many authors to be negligible (about 3% of total emissions).31 More work is needed to better understand the impact of carbon emissions from plastics transport, and how they might shift over time as alternative fuels and efficiency measures are adopted.
4. End-of-Life Considerations
Finally, the plastic’s end of life is also an important stage in terms of both the sustainability of the plastics industry in general, as well as its carbon emissions. End of life processes made up 9% of the global plastic carbon footprint in 2015.32 The majority of these emissions come from the incineration of plastic, although recycling and landfilling contribute to global emissions as well.
As with all carbon footprint values, there is variability in emissions estimates based on the process being analyzed, as well as the methodology that guided the study. We found numerous studies on end-of-life plastic emissions that showed a range of values based on end-of-life management options (Exhibit 7).

Making Plastics Emissions Transparent
12
Exhibit 7: Average greenhouse gas emissions for different plastic end-of-life options
Sources: Y. Aryan, P. Yadav, and S. R. Samadder;33 Peter Shonfield;34 Yates;35 O. Eriksson and G. Finnveden;36 H. H. Khoo;37 R. Cossu et al.;38 M. Morandin et al.;39 “ M. Gear et al.;40 I. D. Posen, P. Jaramillo, and W. M. Griffin;41 CIEL;42 A. Antelava et al.;43 F. Gu et al.;44 D. Lazarevic et al.;45 S. Huysveld et al.46

13
Making Plastics Emissions Transparent
Although there are nuances, the main insights that can be derived from these results and the study of the current literature include:47
• Landfilling is considered a nearly zero-emissions option. However, other issues associated with landfilling include possible contamination of groundwater, dissemination of microplastics, use of land, etc.
• Besides landfilling, mechanical recycling is the end-of-life option with the lowest GHG emissions. Mechanical recycling avoids the emissions derived from the production of virgin polymer, which is the most polluting process across the plastics life cycle. In contrast to chemical recycling, which involves breaking chemical bonds to produce new polymers, mechanical recycling entails processing plastic waste to produce new feedstock or products, without altering the chemical structure of the material. Although the recycling process involves energy consumption and emissions, the emissions avoided are typically higher.
• Incineration presents the highest emissions overall, even with waste-to-energy conversion (WTE). Gasification and pyrolysis are alternative processes that involve chemical transformation of the waste in order to
produce synthetic gas and fuels that can be later used for other uses (including energy generation). Gasification in particular has poor adaptability to plastic due to the low thermal conductivity of many plastics and their tendency to form tar. Gasification and pyrolysis are considered waste-to-fuel technologies and are assumed to have better results in terms of emissions than incineration. However, the novelty and high cost of these processes, as well as their questionable environmental benefits, make them less attractive alternatives.
• WTE and mechanical recycling prevent the need for energy and production processes. Thus, though WTE and mechanical recycling incur their own emissions, they also eliminate the emissions for the conventional processes that they replace. Accordingly, the net reduction in emissions from using these techniques is greater if the energy used in the original processes comes from highly polluting energy sources like coal. In contrast, when the energy mix includes a high share of renewables, the reduction of emissions is less significant. In a low-emissions energy mix, use of WTE could even lead to a net increase in emissions.48

Making Plastics Emissions Transparent
14
In each step of the plastics supply chain, the range of emissions intensities illustrates the need for more robust measurement and a chain of custody to reliably estimate carbon emissions and procure low-carbon plastic. Advancing supply chain transparency and direct measurement of process steps will be critical to aligning the plastics sector with the goals of the Paris Agreement; one report1 suggests that a 40% emissions reduction from 2015 levels will be needed by 2050. Feedstock substitution and fossil-free manufacturing will play a significant role in meeting these goals, but bioplastics is a nascent technology that can have other implications in terms of social or environmental impacts. That said, there are a number of choices that manufacturers and purchasers can make today to create and use plastic with a noticeably smaller carbon footprint:
1. Understand the energy mix used in feedstock production and manufacturing processes. In general, electrified manufacturing processes aligned with lower-CO2 electrical grids will produce lower-CO2 plastic products.
2. Use the lowest-carbon feedstock available. Recycled and bio-feedstocks present opportunities to lower life-cycle emissions for plastic. The use of naphtha is approximately twice as emissions-intensive as natural gas. However, the availability of natural gas is highly dependent on local economics and geography, so this factor is not always easily controlled.
3. Support the use of mechanical recycling. Mechanically recycling plastic into pellets avoids energy use during chemical recycling and production of virgin feedstock.
Consider a common daily product like a plastic water bottle, usually made from PET. When the above measures are taken—using a low-carbon feedstock, powering production with renewable energy, and recycling products responsibly—the carbon footprint of that bottle could be more than four times lower than that of a bottle produced with naphtha feedstock on a carbon-intensive grid. Many of these supply chain decisions are complex to navigate and rarely pique the interest of the consumer. However, industry leaders taking bold action in this space will have the advantage of being first to market as policy pressures and consumer preferences converge to make emissions reductions a business imperative.
Conclusions
Photo credit: Friends of the Earth
15
Making Plastics Emissions Transparent
1. R. Geyer, J. R. Jambeck, and K. L. Law, “Production, Use, and Fate of All Plastics Ever Made,” Science Advances 3 (2017), https://dx.doi.org/10.1126/sciadv.1700782.
2. Center for International Environmental Law, Plastic & Climate: The Hidden Costs of a Plastic Planet, 2019.
3. Carbon Tracker, The Future’s Not in Plastics: Why Plastics Demand Won’t Rescue the Oil Sector, 2020.
4. Ibid.
5. Center for International Environmental Law, Plastic & Climate: The Hidden Costs of a Plastic Planet, 2019.
6. Carbon Tracker, The Future’s Not in Plastics, 2020.
7. A. Dormer et al., “Carbon Footprint Analysis in Plastics Manufacturing,” Journal of Cleaner Production 51 (2013): 133–141.
8. Franklin Associates, Cradle-to-Gate Life Cycle Inventory of Nine Plastic Resins, American Chemistry Council, 2011.
9. Y. Aryan, P. Yadav, and S. R. Samadder, “Life Cycle Assessment of the Existing and Proposed Plastic Waste Management Options in India: A Case Study,” Journal of Cleaner Production 211 (2019): 1268–1283.
10. Peter Shonfield, LCA of Management Options for Mixed Waste Plastics, Waste Resource Action Programme (WRAP), 2008.
11. T. A. Hottle, M. M. Bilec, and A. E. Landis, “Sustainability Assessments of Bio-Based Polymers,” Polymer Degradation and Stability 98 (2013): 1898–1907.
12. PlasticsEurope, “Eco-Profiles,” accessed November 20, 2020, https://www.plasticseurope.org/en/resources/eco-profiles.
13. J. Philp, “OECD Policies for Bioplastics in the Context of a Bioeconomy, 2013,” Industrial Biotechnology 10 (2014): 19–21.
14. Carbon Tracker, The Future’s Not in Plastics, 2020.
15. Ibid.
16. Zheng, J. & Suh, S., “Strategies to Reduce the Global Carbon Footprint of Plastics,” Nat. Clim. Chang. 9, 374–378 (2019).
17. Climate Policy Watcher, “Choice of Emission Factors,” accessed November 20, 2020, https://www.climate-policy-watcher.org/emission-factors/choice-of-emission-factors-aaf.html.
18. Intergovernmental Panel on Climate Change, “EFDB: Emission Factor Database,” accessed November 20, 2020, https://www.ipcc-nggip.iges.or.jp/EFDB/main.php.
19. M. Neelis, M. Patel, and M. De Feber, “Improvement of CO2 Emission Estimates from the Non-Energy Use Of Fossil Fuels in the Netherlands,” 2003.
20. National Environment Agency, Greenhouse Gas (GHG) Emissions Measurement and Reporting Guidelines, 101, 2018.
21. I. D. Posen et al., “Greenhouse Gas Mitigation for U.S. Plastics Production: Energy First, Feedstocks Later,” Environmental Research Letters 12 (2017).
22. Carbon Tracker, The Future’s Not in Plastics, 2020.
23. M. R. Yates and C. Y. Barlow, “Life Cycle Assessments of Biodegradable, Commercial Biopolymers—A Critical Review,” Resources, Conservation and Recycling 78 (2013): 54–66; D. Koch and B. Mihalyi, “Assessing the Change in Environmental Impact Categories When Replacing Conventional Plastic with Bioplastic in Chosen Application Fields,” Chemical Engineering Transactions 70 (2018): 853–858; J. M. Bier, C. J. R.
Endnotes

Making Plastics Emissions Transparent
16
Verbeek, and M. C. Lay, “Life Cycle Assessments of Bioplastics: Applications and Issues,” International Journal of Environmental, Cultural, Economic, and Social Sustainability 7 (2011): 145–157; M. Shen et al., “(Micro)plastic Crisis: Un-Ignorable Contribution to Global Greenhouse Gas Emissions and Climate Change,” Journal of Cleaner Production 254 (2020): 120138.
24. Carbon Tracker, The Future’s Not in Plastics, 2020; I. D. Posen et al., “Greenhouse Gas Mitigation for U.S. Plastics Production: Energy First, Feedstocks Later,” Environmental Research Letters 12 (2017).
25. Carbon Tracker, The Future’s Not in Plastics, 2020.
26. Carbon Tracker, The Future’s Not in Plastics, 2020; Posen, “Greenhouse Gas Mitigation for U.S. Plastics Production,” 2017.
27. Carbon Tracker, The Future’s Not in Plastics, 2020; Yates, “Life Cycle Assessments of Biodegradable, Commercial Biopolymers,” 2013; Koch, “Assessing the Change in Environmental Impact Categories When Replacing Conventional Plastic with Bioplastic in Chosen Application Fields,” 2018; K. Changwichan, T. Silalertruksa, and S. H. Gheewala, “Eco-Efficiency Assessment of Bioplastics Production Systems and End-of-Life Options,” Sustainability 10 (2018): 1–15.
28. Zheng, et al., “Strategies to Reduce the Global Carbon Footprint of Plastics. Nat. Clim. Chang., 2019.
29. Carbon Tracker, The Future’s Not in Plastics, 2020.
30. Zheng, et al., “Strategies to Reduce the Global Carbon Footprint of Plastics.” Nat. Clim. Chang., 2019.
31. A. Dormer et al., “Carbon Footprint Analysis in Plastics Manufacturing,” Journal of Cleaner Production 51 (2013): 133–141.
32. Carbon Tracker, The Future’s Not in Plastics, 2020.
33. Y. Aryan, P. Yadav, and S. R. Samadder, “Life Cycle Assessment of the Existing and Proposed Plastic Waste Management Options in India: A Case Study,” Journal of Cleaner Production 211 (2019).
34. Peter Shonfield, LCA of Management Options for Mixed Waste Plastics, Waste Resource Action Programme (WRAP), 2008.
35. Yates, “Life Cycle Assessments of Biodegradable, Commercial Biopolymers,” 2013.
36. O. Eriksson and G. Finnveden, “Plastic Waste as a Fuel—CO2-Neutral or Not?” Energy & Environmental Science, 2 (2009): 907–914.
37. H. H. Khoo, “LCA of Plastic Waste Recovery into Recycled Materials, Energy and Fuels in Singapore,” Resources, Conservation & Recycling 145 (2019): 67–77.
38. R. Cossu et al., “PLASMIX Management: LCA of Six Possible Scenarios,” Waste Management 69 (2017): 567–576.
39. M. Morandin et al., “Thermochemical Recycling Of Plastics for Production of Chemical Intermediates at a Swedish Chemical Complex Site,” Proceedings of ECOS 2016, 2016.
40. M. Gear et al., “A Life Cycle Assessment Data Analysis Toolkit for the Design of Novel Processes—A Case Study for a Thermal Cracking Process for Mixed Plastic Waste,” Journal of Cleaner Production 180 (2018): 735–747.
41. I. D. Posen, P. Jaramillo, and W. M. Griffin, “Uncertainty in the Life Cycle Greenhouse Gas Emissions from U.S. Production of Three Biobased Polymer Families,” Environmental Science & Technology 50 (2016): 2846–2858
42. CIEL, Plastic & Climate: The Hidden Costs of a Plastic Planet, 2019.

17
Making Plastics Emissions Transparent
43. A. Antelava et al., “Plastic Solid Waste (PSW) in the Context of Life Cycle Assessment (LCA) and Sustainable Management,” Environmental Management 64 (2019): 230–244.
44. F. Gu et al., “From Waste Plastics to Industrial Raw Materials: A Life Cycle Assessment of Mechanical Plastic Recycling Practice Based on a Real-World Case Study,” Science of the Total Environment 601–602 (2017): 1192–1207.
45. D. Lazarevic et al., “Plastic Waste Management in the Context of a European Recycling Society: Comparing Results and Uncertainties in a Life Cycle Perspective,” Resources, Conservation and Recycling 55 (2010): 246–259.
46. S. Huysveld et al., “Advancing Circular Economy Benefit Indicators and Application on Open-Loop Recycling of Mixed and Contaminated Plastic Waste Fractions,” Journal of Cleaner Production 211 (2019): 1–13.
47. Center for International Environmental Law, Plastic & Climate, 2019; Y. Aryan, P. Yadav, and S. R. Samadder, “Life Cycle Assessment of the Existing and Proposed Plastic Waste Management Options in India: A Case Study,” Journal of Cleaner Production 211 (2019); Peter Shonfield, LCA of Management Options for Mixed Waste Plastics, Waste Resource Action Programme (WRAP), 2008; R. Cossu et al., “PLASMIX Management: LCA of Six Possible Scenarios,” Waste Management 69 (2017): 567–576; I. D. Posen, P. Jaramillo, and W. M. Griffin, “Uncertainty in the Life Cycle Greenhouse Gas Emissions from U.S. Production of Three Biobased Polymer Families,” Environmental Science & Technology 50 (2016): 2846–2858; A. Antelava et al., “Plastic Solid Waste (PSW) in the Context of Life Cycle Assessment (LCA) and Sustainable Management,” Environmental Management 64 (2019): 230–244; Changwichan, “Eco-Efficiency Assessment of Bioplastics Production Systems and End-of-Life Options,” 2018.
48. Huysveld, S., Hubo, S., Ragaert, K. & Dewulf, J. “Advancing circular economy benefit indicators and application on open-loop recycling of mixed and contaminated plastic waste fractions,” Journal of Cleaner Production, 211, 1–13 (2019).

The Coalition on Materials Emissions Transparency (COMET) is an initiative between the Columbia Center on Sustainable Investment (CCSI), the Payne Institute for Public Policy at the Colorado School of Mines, the United Nations Framework Convention on Climate Change (UNFCCC), and RMI. cometframework.org
COMET accelerates supply chain decarbonization by enabling producers, consumer-facing companies, investors, and policy makers to better account for greenhouse gas (GHG) emissions throughout materials supply chains, in harmony with existing GHG accounting and disclosure methods and platforms.