Embed Size (px)
Citation preview

Source: Jansma E, Bräuning A, Gärtner H, Schleser G (eds.) (2004) TRACE - Tree Rings in Archaeology, Climatology and Ecology, Vol. 2: Proceedings of the DENDROSYMPOSIUM 2003, May 1st – 3rd 2003, Utrecht, the Netherlands. Schriften des Forschungszentrums Jülich, Reihe Umwelt Vol. 44, p. 160 - 170.
Malacochronology, the application of dendrochronological
methods on marine bivalve (shell) growth
R. Witbaard1, E, Jansma2,3 & U. Sass-Klaassen3,4.
1. Royal Netherlands Institute for Sea Research, PO Box 59 1790 AB den Burg, Texel, The Netherlands;
e-mail: [email protected]
2. National Service for Archaeological Heritage Management (ROB), PO BOX 1600 3800 BP, Amersfoort, The
Netherlands;
3. Netherlands Centre for Dendrochronology (RING), PO BOX 1600 3600 BP, Amersfoort, The Netherlands;
4. Wageningen University, Environmental Sciences, Forest Ecology and Forest Management PO Box 342 6700
AH Wageningen, The Netherlands
Introduction
In the temperate marine environment the seasonality in water temperature and primary
production results in a strong seasonality of biological processes, both in the water column
and at the sea floor. For bivalves living at the seafloor and growing by accretion of calcium
carbonate, this results in the deposition of annual growth layers (Jones, 1980; Witbaard et
al., 1994) comparable to those in trees (Fig. 1). Like for trees, it is assumed that
environmental conditions during the period of shell growth manifest themselves in the
deposited material, as a result of which both the compositional differences and the ring width
itself contain information.
While for short-lived species the growth lines are often visible on the external shell surface,
for long lived species the growth lines are - especially during the later phases of life - too
narrow to be recognised on the external shell surface. By application of the acetate peel
method (Kennish et al; 1980, Ropes, 1985) this problem can be overcome.
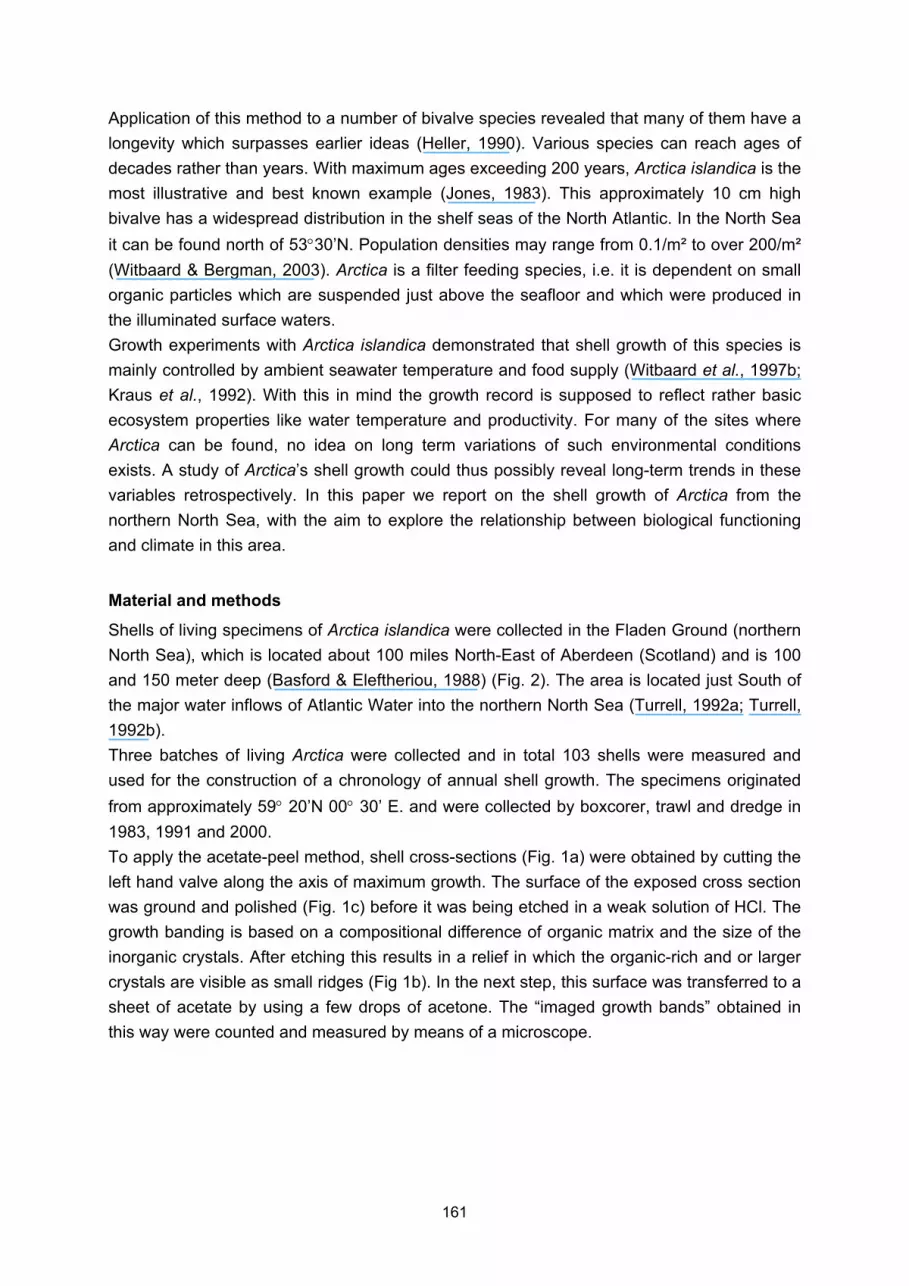
Figure 1: Schematic drawing of Arctica islandica. Line X indicates direction of sectioning and line of
maximum growth. Photo insets show internal growth lines in the etched hinge section (b) as well as in
a polished section of the valve (c).
a b
c
X
161
Application of this method to a number of bivalve species revealed that many of them have a
longevity which surpasses earlier ideas (Heller, 1990). Various species can reach ages of
decades rather than years. With maximum ages exceeding 200 years, Arctica islandica is the
most illustrative and best known example (Jones, 1983). This approximately 10 cm high
bivalve has a widespread distribution in the shelf seas of the North Atlantic. In the North Sea
it can be found north of 53°30’N. Population densities may range from 0.1/m² to over 200/m²
(Witbaard & Bergman, 2003). Arctica is a filter feeding species, i.e. it is dependent on small
organic particles which are suspended just above the seafloor and which were produced in
the illuminated surface waters.
Growth experiments with Arctica islandica demonstrated that shell growth of this species is
mainly controlled by ambient seawater temperature and food supply (Witbaard et al., 1997b;
Kraus et al., 1992). With this in mind the growth record is supposed to reflect rather basic
ecosystem properties like water temperature and productivity. For many of the sites where
Arctica can be found, no idea on long term variations of such environmental conditions
exists. A study of Arctica’s shell growth could thus possibly reveal long-term trends in these
variables retrospectively. In this paper we report on the shell growth of Arctica from the
northern North Sea, with the aim to explore the relationship between biological functioning
and climate in this area.
Material and methods
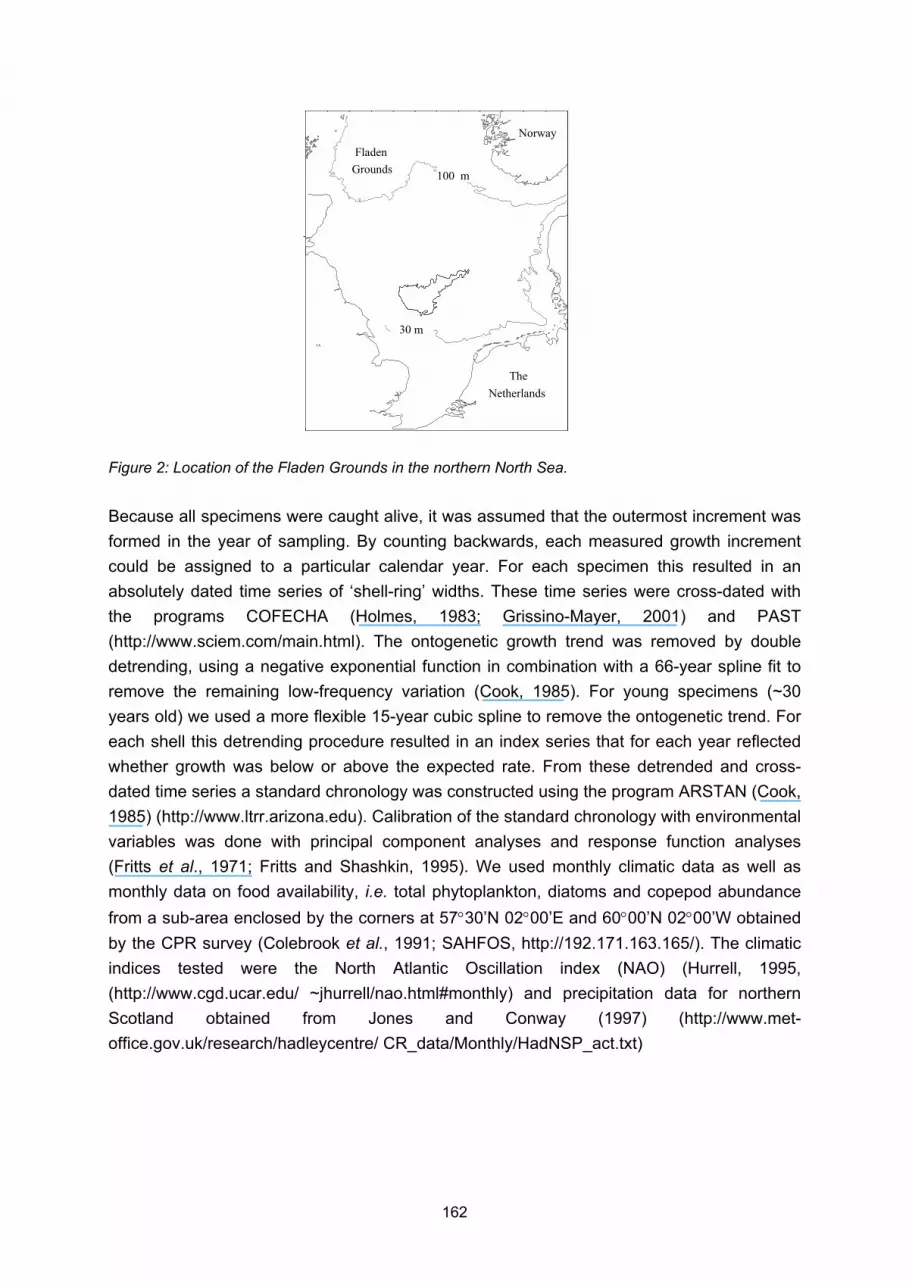
Shells of living specimens of Arctica islandica were collected in the Fladen Ground (northern
North Sea), which is located about 100 miles North-East of Aberdeen (Scotland) and is 100
and 150 meter deep (Basford & Eleftheriou, 1988) (Fig. 2). The area is located just South of
the major water inflows of Atlantic Water into the northern North Sea (Turrell, 1992a; Turrell,
1992b).
Three batches of living Arctica were collected and in total 103 shells were measured and
used for the construction of a chronology of annual shell growth. The specimens originated
from approximately 59° 20’N 00° 30’ E. and were collected by boxcorer, trawl and dredge in
1983, 1991 and 2000.
To apply the acetate-peel method, shell cross-sections (Fig. 1a) were obtained by cutting the
left hand valve along the axis of maximum growth. The surface of the exposed cross section
was ground and polished (Fig. 1c) before it was being etched in a weak solution of HCl. The
growth banding is based on a compositional difference of organic matrix and the size of the
inorganic crystals. After etching this results in a relief in which the organic-rich and or larger
crystals are visible as small ridges (Fig 1b). In the next step, this surface was transferred to a
sheet of acetate by using a few drops of acetone. The “imaged growth bands” obtained in
this way were counted and measured by means of a microscope.
162
Figure 2: Location of the Fladen Grounds in the northern North Sea.
Because all specimens were caught alive, it was assumed that the outermost increment was
formed in the year of sampling. By counting backwards, each measured growth increment
could be assigned to a particular calendar year. For each specimen this resulted in an
absolutely dated time series of ‘shell-ring’ widths. These time series were cross-dated with
the programs COFECHA (Holmes, 1983; Grissino-Mayer, 2001) and PAST
(http://www.sciem.com/main.html). The ontogenetic growth trend was removed by double
detrending, using a negative exponential function in combination with a 66-year spline fit to
remove the remaining low-frequency variation (Cook, 1985). For young specimens (~30
years old) we used a more flexible 15-year cubic spline to remove the ontogenetic trend. For
each shell this detrending procedure resulted in an index series that for each year reflected
whether growth was below or above the expected rate. From these detrended and cross-
dated time series a standard chronology was constructed using the program ARSTAN (Cook,
1985) (http://www.ltrr.arizona.edu). Calibration of the standard chronology with environmental
variables was done with principal component analyses and response function analyses
(Fritts et al., 1971; Fritts and Shashkin, 1995). We used monthly climatic data as well as
monthly data on food availability, i.e. total phytoplankton, diatoms and copepod abundance
from a sub-area enclosed by the corners at 57°30’N 02°00’E and 60°00’N 02°00’W obtained
by the CPR survey (Colebrook et al., 1991; SAHFOS, http://192.171.163.165/). The climatic
indices tested were the North Atlantic Oscillation index (NAO) (Hurrell, 1995,
(http://www.cgd.ucar.edu/ ~jhurrell/nao.html#monthly) and precipitation data for northern
Scotland obtained from Jones and Conway (1997) (http://www.met-
office.gov.uk/research/hadleycentre/ CR_data/Monthly/HadNSP_act.txt)
UK
The
Netherlands
Fladen
Grounds
Norway
30 m
100 m

163
Figure 3: Chronologies of shell growth in Arctica islandica from the northern North Sea. Grey dotted
line is the spline-fitted average chronology with superimposed the chronologies obtained from one of
the subsamples. (a) young shells collected in 1983, (b) old shells collected in 1983, (c) young shells
collected in 1991, (d) old shells collected in 1991, (e) young shells collected in 2000. Horizontal lines
denote expected growth. Chronologies for young shells are displaced in upward direction for clarity.
Results
The average chronology of shell-growth variations in Arctica islandica is characterised by
alternating periods in which growth is above or below expected growth. All different sub-
samples, of both old and young shells as well as of the samples collected in the different
years, show statistically similar patterns, which supports the idea that shell growth is the
result of a common forcing factor (Fig. 3). Because the bottom water temperature in the area
is almost constant, the attempts to explain the observed growth-rate variations focus on data
indicative of food supply and food availability to the benthos community. These are the spring
bloom production (diatom abundance), total algal production (phytoplankton colour) and
copepod abundance, since the latter might compete for the same food source by intercepting
food particles from the surface waters on their descent to the sea floor.
The response functions expressing the relationship between shell growth and the abundance
of diatoms or total phytoplankton (expressed as phytoplankton colour units) explained only
minor parts of the total variance in the average chronology (14% and 24%, respectively). The
results, however, suggest the existence of a time lag between phytoplankton abundance and
shell growth. The phytoplankton colour index of the autumn preceding growth correlated
1880 1900 1920 1940 1960 1980 2000
rela
tive
gro
wth
e
d.
c.
b.
a.
1880 1900 1920 1940 1960 1980 2000

164
higher with the chronology of growth rate variations than the spring phytoplankton colour
values of the calendar year in which the growth increment was terminated.
Figure 4: Lagged correlations of monthly variables and the average annual shell growth indices for the
period 1949-1999. Dotted lines indicate the significance level (p<0.05). (a) Correlation with monthly
average phytoplankton colour and total diatoms, (b) correlation with monthly precipitation over
northern Scotland and total copepod abundance in the northern North Sea, (c) comparison of the
actual shell growth rate variations and predicted variations on the basis of a response function model
with copepod abundance and precipitation as predictor variables.
While the correlations between shell growth and phytoplankton data were insignificant, shell
growth was significant negatively correlated with the lagged copepod abundance (Fig. 4b).
The response function based on copepod abundance in the prior autumn and the following
spring period could explain about 48% of the variance of the inter-annual variation in shell
growth. Copepod abundance in the northern and central North Sea has been shown to be
related to the NAO index (Fromentin and Planque, 1996). During the wintermonths of studied
period (1949-1999) the shell growth showed a positive correlation to the NAO index altough
that correlation never reached significance. Alternatively, we used the average monthly
J J A S O N D J F M A M
-0.8 -0.6 -0.4 -0.2 0.0 0.2 0.4 0.6 0.8
correlation coefficient
Month
phytoplanktoncolor
diatomabundance
-0.84
-0.56
-0.28
0.00
0.28
0.56
0.84
J J A S O N D J F M A M
-0.8 -0.6 -0.4 -0.2 0.0 0.2 0.4 0.6 0.8
correlation coefficient
Month
Precipitation
copepodabundance
-0.84
-0.56
-0.28
0.00
0.28
0.56
0.84
1950 1960 1970 1980 1990 2000
0.6
0.8
1.0
1.2
1.4 actual estimated
growth index
year
a
b
c
Month

165
precipitation over northern Scotland as a descriptor for more local hydrographical conditions
in the Fladen Ground because it most likely reflects factors that are important in the
determination of benthic food supply such as wind stress, stratification, river run-off and the
start and length of the spring-bloom. We found a positive relationship between shell-growth
and the amount of rainfall in the preceding winter and an negative correlation with
precipitation during spring (April-May) (Fig. 4b).
The combination of copepod abundance and the precipitation over Scotland for a 12 month
period explained 66% of the variance in the growth rate chronology of Arctica (Fig. 4c). A
reduction of the number of months to the winter period exclusively, did not lead to a great
loss of explained variance in the response function. The combination of precipitation and
copepod abundance for the period between November and May still explains 61% of the total
variance, suggesting that conditions during autumn and following spring are important for
shell growth.
Discussion
With the exception of temperature, climate will affect shell growth indirectly by changing
ecosystem properties like primary production, sedimentation and the length of the period in
which primary production takes place. The documented inter-annual variations in bottom-
water temperature in the Fladen Ground (Ellet and Blindheim, 1992) as well as the recently
reported anomalies in Sea Surface Temperature (SST) for the northern North Sea (Reid et
al., 1998) seem to be too small to explain the observed in situ shell growth variations in view
of the results obtained from experiments (Witbaard et al., 1997b). Therefore, the most likely
remaining factor to explain these growth rate differences would be the supply of food.
A significant relationship between shell growth and phytoplankton colour or diatom
abundance was however absent (see also; Witbaard, 1996; Witbaard et al., 1997a).
Apparently there is only a weak direct link between primary production in the surface waters
and shell growth 140 meters below. One possible reason could be the rapid development of
a dense copepod population in early spring.
Particle-flux measurements in the Fladen Ground indeed show that in spring only small
amounts (10–25%) of the primary production sink to the seafloor (Davies & Payne, 1984).
Cadee (1986) even estimated that most of the primary produced material ended up in the
pool of dissolved organic matter. Hence benthic food availability seems to be depressed.

166
1940 1950 1960 1970 1980 1990 2000
60
80
100
120
140
year
gro
wth
in
de
x
1200
1000
800
600
400
200
0
co
pe
po
d a
bu
nd
an
ce
Figure 5: Observed correspondence between shell-growth indices (continue line) and 6-month lagged
copepod abundance (dotted line) as obtained from the CPR data base. Copepod abundance scale
(righ side) is reversed.
In the northern North Sea the downward particle flux seems to be controlled by the cold
water copepod Calanus finmarchicus. In early spring, a seed population of this species is
advected into the northern North Sea from its deep overwintering sites in the neighbouring
Atlantic (Bryant et al., 1998; Gallego et al., 1999; Madden et al., 1999). The population
develops rapidly in March and peaks in April-May (Planque and Fromentin, 1996) i.e. the
period of the spring bloom. This timing together with a grazing capacity of 40-90% of the
daily primary production (Radach et al, 1984), not only controls the magnitude of the spring
phytoplankton bloom but also the subsequent export flux towards the bottom. Therefore the
observed negative correlation between shell growth and copepod abundance reflects a
competition for the same food source which is depicted in Figure 6.
Weather conditions have a large influence on the advection and population development of
C. finmarchicus in the northern North Sea (Gallego et al., 1999; Harms et al., 2000; Madden
et al., 1999). To explain the interannual variations in the abundance of C. finmarchicus,
Fromentin and Planque (1996) summarised a possible climate-foodweb structure which
explains the interannual variation in shell-growth rates of Arctica as well.

167
High NAO
Sea surface
temperature
Phytoplankton
production
C. finmarchicus
abundance
+ +
+ -
- -
+
Export flux +
Westwind stress
Shell growth
Low NAO
Sea surface
temperature
Phytoplankton
production
C. finmarchicus
abundance
-
+-
Export flux
Westwind stress
Shell growth
-
+
-
-
+
Air temperatureAir temperature
Figure 6: Graphical representation of the model as proposed by Fromentin and Planque (1996). The
two extreme states of the NAO are given. “+” sign indicates a positive and “-“ indicates a negative
feedback to the controlling factor.
During winters with a predominant high NAO index, west-wind stress and precipitation
increases over north-west Europe and Scotland. As a consequence, stratification of the
water column is delayed and phytoplankton production will start late and is low (see Dickson
et al, 1988 for a discussion of the mechanism). The subsequent development of the copepod
population is depressed which leads to high fluxes of phytoplankton to the seafloor resulting
in high shell growth rates. In winters with a low NAO index; lower temperatures, less wind
and early stratification promotes the rapid development of C. finmarchicus populations which
matches the onset of the spring bloom and therefore depresses the downward flux of
phytoplankton material which ultimately results in low rates of shell growth.
This is in line with our observations which show a significant positive relationship between
shell growth and rainfall amounts and the NAO index. However, although precipitation rates
in northern Europe strongly depend on the NAO index, thepositive relationship between the
NAO index and growth record remained statistically weak. This does not exclude the NAO as

168
an underlying mechanism but demonstrates that local conditions have a larger impact on
shell growth and modify the NAO signal to such an extent that it cannot always be
recognised clearly.
Acknowledgements
This study has been made possible by NWO/ALW grant 750.700.02 within the clivarnet
program. The crew of RV Pelagia , S. van Steenpaal and J. v/d Weele are thanked for their
practical assistance in collection and processing the shell samples. SAHFOS is
acknowledged for their CPR plankton data supply.
References
Basford, D. & A. Eleftheriou (1988): The benthic environment of the North Sea (56° to 61°N).
J. Mar. Biol. Ass. U.K. 68: 125-141
Bryant, A. D., Hainbucher, D. & M. Heath (1998): Basin-scale advection an population
persitence of Calanus finmarchicus. Fish. Oceanogr. 7: 235-244
Cadee, G.C. (1986): Organic carbon in the water column and its sedimentation, Fladen
Ground (North Sea), May 1983. Neth. J. Sea Res. 20: 347-358
Colebrook, J.M., Warner, A.J., Proctor, C.A., Hunt, H.G., Pritchard, P., John, A.W.G., Joyce,
D. & R. Barnard (1991): 60 years of the continuous plankton recorder survey: a
celebration. Sir Alistar Hardy foundation for Ocean Science. Plymouth: 24 p.
Cook, E.R. (1985): A time series analysis approach to tree ring standardization. Thesis of the
University of Arizona: 171 p.
Davies, J.M. & R. Payne (1984): Supply of organic matter to the sediment in the northern
North Sea during a spring phytoplankton bloom. Mar. Biol. 78: 315-324
Dickson, R.R., Kelly, P.M., Colebrook, J.M., Wooster, W.S. & D.H. Cushing (1988): North
winds and production in the eastern North Atlantic. J. Plankton Res. 10: 151-169
Ellet, D.J. & J. Blindheim (1992): Climate and hydrogrpahic variability in the ICES area during
the 1980s. ICES Mar. Sci. Symp.195 : 11-31
Fritts, H.C., Blasing, T.J., Hayden, B.P. & J.E. Kutzbach (1971): Multivariate techniques for
specifying tree-growth and climate relationships and for reconstructing anomalies in
paleoclimate. J. Applied Meteor.10: 845-864
Fritts, H.C. & A.V. Shashkin (1995): Modelling tree-ring structure as related to temperature,
precipitation, and day length. In: Lewes, T.E. (ed), Tree rings as indicators of ecosystem
health. CRC Press London: 17-57
Fromentin, J.-M. & B. Planque (1996): Calanus and environment in the eastern North
Atlantic. II. Influence fo the North Atlantic Oscillation on C. finmarchicus and C.
helgolandicus. Mar. Ecol. Prog. Ser.134: 111-118
Gallego, A., Mardaljevic, J., Heath, M.R., Hainbucher, D. & D. Slagstad (1999): A model of
the spring migration into the North Sea by Calanus finmarchicus overwintering off the
Scottish continental shelf. Fish. Oceanogr. 8: 107-125
Grissino-Mayer, H.D. (2001): Evaluating cross-dating accuracy: a manual and tutorial for the
computer program COFECHA. Tree-ring Res. 57: 205-221

169
Harms, I.H., Heath, M.R., Bryant, A.D., Backhaus, J.O. & D.A. Hainbucher (2000): Modelling
the Northeast Atlantic circulation: implications for the spring invasion of shelf regions by
Calanus finmarchicus. ICES J. Mar. Sci. 57: 1694-1707
Heller, J. (1990): Longevity in molluscs. Malacologia 31: 259-295
Holmes, R.L. (1983): Computer-assisted quality control in tree-ring dating and measurement.
Tree-ring Bull. 43: 69-78
Hurrell, J.W. (1995): Decadal trends in the north Atlantic Occilation: Regional temperatures
and precipitation. Science 269: 676-679
Jones, D.S. (1983): Sclerochronology: Reading the record of the molluscan shell. American
Scientist 71: 384-391
Jones, D.S. (1980): Annual cycle of shell growth increment formation in two continental shelf
bivalves and its paleoecologic significance. Paleobiology 6(3): 331-340
Jones, P.D. & D. Conway (1997): Precipitation in the British Isles: an Analysis of area-
average data updated to 1995. Int. J. Climatol. 17: 427-438
Kennish, M. J., Lutz, R.A. & D.C. Rhoads (1980): Preparation of acetate peels and fractured
sections for observation of grwoth patterns within the bivalve shell. In Skeletal growth of
aquatic organisms. Biological records of environmental change. (eds. D. C. Rhoads and
R. A. Lutz), pp. 597-601. New York / London: Plenum Press.
Kraus, M.G., Beal, B.F., Chapman, S.R. & L. McMartin (1992): A comparison of growth rates
in Arctica islandica (Linnaeus, 1767) between field and laboratory populations. Journal of
shellfish research 11: 289-294
Madden, H., Beare, D., Heath, M.R., Fraser, J.G. & A. Gallego (1999): The spring/early
summer distribution of Calanus spp. in the northern North Sea and adjacent waters. Fish.
Oceanogr. 8: 138-152
Planque, B. & J.-M. Fromentin (1996): Calanus and environment in the eastern North
Atlantic. I. Spatial and temporal patterns of C. finmarchicus and C. helgolandicus. Mar.
Ecol. Prog. Ser.134: 101-109
Radach, G., Berg, J., Heinemann, B. & M. Krause (1984): On the relation of primary
production to grazing during the Fladen Ground Experiment 1976 (Flex'76). In: Fasham,
M.J.R., (ed). Flows of energy and material in marine ecosystems. Theory and practice.
NATO conference series, Plenum Press, New York: 597-628
Reid, P.C., Planque, B. & M. Edwards (1998): Is observed variability in the long-term results
of the continuous plankton recorder survey a response to climate change? Fish.
Oceanogr. 7: 282-288
Ropes, J.W. (1985): Modern methods used to age oceanic bivalves. The Nautilus 99: 53-57
Turrell, W.R. (1992a): The east Shetland Atlanctic Inflow. ICES Mar. Sci. Symp 195: 127-143
Turrell, W.R. (1992b): New hypotheses concerning the circulation of the northern North Sea
and its relation to North Sea fish stock recruitment. ICES J. Mar. Sci. 49: 107-123
Witbaard, R., Jenness, M.I., Van der Borg, K. & G. Ganssen (1994): Verification of annual
growth increments in Arctica islandica L. from the North Sea by means of oxygen and
carbon isotopes. Neth. J. Sea Res. 33: 91-101

170
Witbaard, R. (1996): Growth variation in Arctica islandica L. (Mollusca): a reflection of
hydrography-related food supply. ICES J. Mar. Sci. 53: 891-987
Witbaard, R. & M. Bergman (2003): The distribution of Arctica islandica in the North Sea.
What possible factors are involved? Neth. J Sea . Res. accepted.
Witbaard, R., Duineveld, G.C.A. & P.A.W.J. deWilde (1997a): A long-term growth record
derived from Arctica islandica (Mollusca, Bivalvia) from the Fladen Ground (northern North
Sea). J. Mar. Biol. Ass. U.K. 77: 801-816
Witbaard, R., Franken, R. & B. Visser (1997b): Growth of juvenile Arctica islandica under
experimental conditions. Helgoländer meeresunters. 51: 417-431


