Embed Size (px)
Citation preview
Management of scoring sessions in alternative assessment:the computer-assisted scoring approach
Guillermo Solano-Flores*, Bruce Raymond, Steven A. Schneider,Michael Timms
WestEd, 935 El Camino Real, Menlo Park, CA 94025, USA
Received 1 March 1999; accepted 1 July 1999
Abstract
We describe a computer-assisted scoring approach in educational assessment. In this approach, scoresare captured and analyzed as scoring takes place; information on scoring quality is used to provideimmediate feedback to raters and make timely re-calibration and dismissal decisions. We present aconceptual model for computer-assisted scoring and describe how we used this approach to manage thescoring sessions of an assessment for teacher certi®cation. We found that computer-assisted scoring: (a)allowed us to provide immediate feedback to raters about their scoring quality and make accurate re-calibration and dismissal decisions; and (b) did not a�ect the dependability of the scores or the ¯ow ofthe scoring sessions. We also con®rmed that, with appropriate software, raters can be trained readily toscore complex performance with the aid of computers even when they have no prior experience withcomputers. The conceptual model allowed us to identify how close our scoring sessions were to optimale�ciency. # 1999 Elsevier Science Ltd. All rights reserved.
As hands-on tasks, portfolios, and other alternative forms of assessment, gain acceptanceamong teachers and educators (e.g., Baratz-Snowden, 1991; Haertel, 1990; Shulman, 1989;Wolf, 1991), the challenges of scoring complex performance become evident. In addition toaddressing the viability of judging complex performance (Fitzpatrick & Morrison, 1971;Koretz, Stecher, Klein & McCa�rey, 1994) scoring must be cost-e�cient (see Baratz-Snowden,1991; Picus, 1994; Reckase, 1995).In a typical scoring session, raters make independent judgments of examinee responses on
Computers & Education 33 (1999) 47±63
0360-1315/99/$ - see front matter # 1999 Elsevier Science Ltd. All rights reserved.PII: S0360-1315(99)00018-4
www.elsevier.com/locate/compedu
* Corresponding author. Tel.: +1-650-470-0413; fax: +1-650-470-0401.E-mail address: [email protected] (G. Solano-Flores)
certain tasks based on scoring rubrics that specify levels of performance quality. Each responseis scored by a minimum of two independent raters. A third rater is used if the initial ratersdi�er considerably (e.g., Wolf, 1994). A scoring leader continuously reviews the performance ofeach rater by examining how much his or her scoring di�ers from other raters' scoring. Thescoring leader must decide when certain raters must be re-calibrated (re-trained) or dismissedbecause they introduce too much measurement error and because too many `third readings' arecostly (Wigdor & Green, 1991).Despite being, to a great extent, the core of e�ective scoring session management,
monitoring and re-calibration and dismissal decisions are often made in a subjective andunsystematic manner. For example, scoring leaders are expected to `read behind' the responsesscored by raters and judge whether their scoring is reasonable. However, under the pressure ofa rapid, high-volume scoring situation, they may not have the time to `read behind' all theresponses or to read them carefully.In this paper we describe a computer-assisted scoring approach in which raters enter data as
they score and scores are captured and analyzed in a timely manner, so that scoring leaderscan be continuously provided with precise information on the quality of their raters' scoring.First, we present a conceptual model that addresses the technical, logistical, and conceptualissues that must be considered to implement computer-assisted scoring sessions. Then wedescribe our experience using a computer-assisted scoring approach to manage the scoringsessions of portfolios for a teacher certi®cation assessment (Schneider, et al., 1999; Solano-Flores, Raymond & Schneider, 1997; Timms & O'Neill, 1997). Finally, we use the conceptualmodel to evaluate the e�ciency and e�ectiveness of those scoring sessions.Both the conceptual model and our experience should be useful to a wide range of
organizations, from school districts with small budgets and limited computer resources to large,complex organizations specialized in assessment with computer equipment.
1. A conceptual model for computer-assisted scoring sessions
1.1. Design stages
We identify four stages in the design of computer-assisted scoring sessions: development of ascoring model; design of a software package; selection of a con®guration of equipment, logisticsand procedures that supports the functioning of the software; and implementation. In each ofthese stages, the speci®c set of contextual factors in which assessment occurs must beconsidered properly. For example, the scoring model should re¯ect the organization's needsand scoring policies; the software should capture and process the information properly; and thesoftware's design should take into account the computer skills of the users.
1.2. The optimal e�ciency line
Critical to successful computer-assisted scoring is a good match between con®guration andinfrastructure. Since each con®guration has a speci®c set of features (e.g., availability ofinformation on raters' scoring) and poses a speci®c set of requirements for proper functioning
G. Solano-Flores et al. / Computers & Education 33 (1999) 47±6348
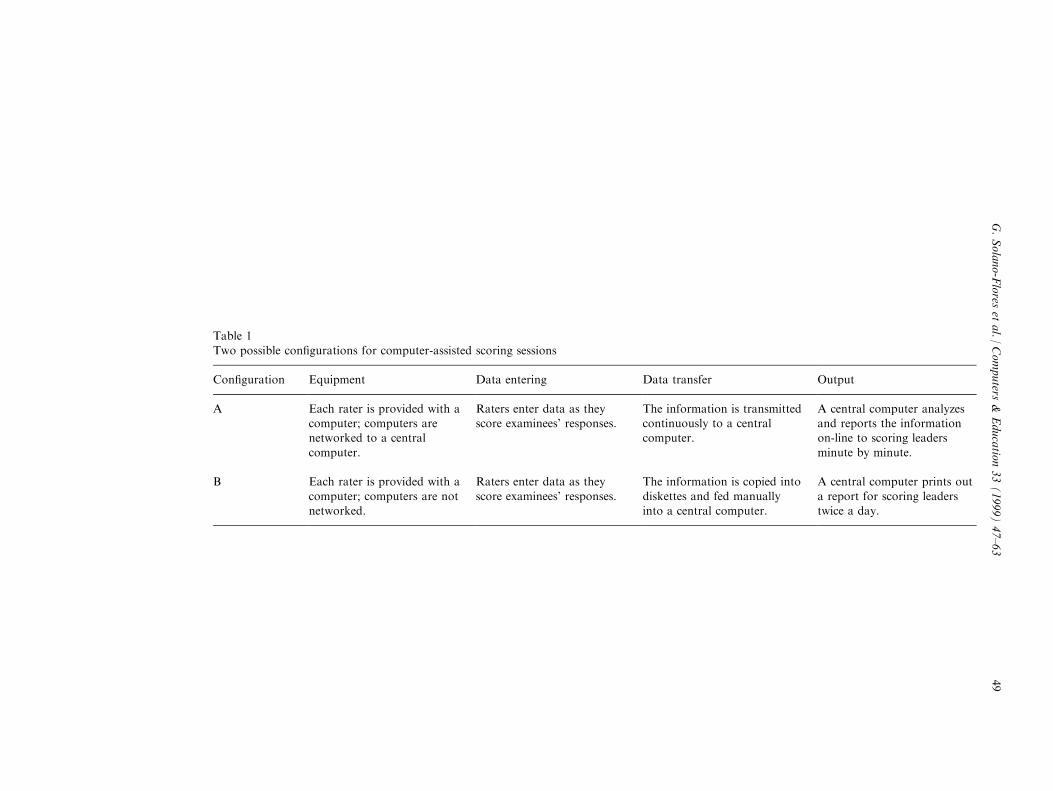
Table 1
Two possible con®gurations for computer-assisted scoring sessions
Con®guration Equipment Data entering Data transfer Output
A Each rater is provided with acomputer; computers arenetworked to a central
computer.
Raters enter data as theyscore examinees' responses.
The information is transmittedcontinuously to a centralcomputer.
A central computer analyzesand reports the informationon-line to scoring leaders
minute by minute.
B Each rater is provided with a
computer; computers are notnetworked.
Raters enter data as they
score examinees' responses.
The information is copied into
diskettes and fed manuallyinto a central computer.
A central computer prints out
a report for scoring leaderstwice a day.
G.Solano-Flores
etal./
Computers
&Educatio
n33(1999)47±63
49
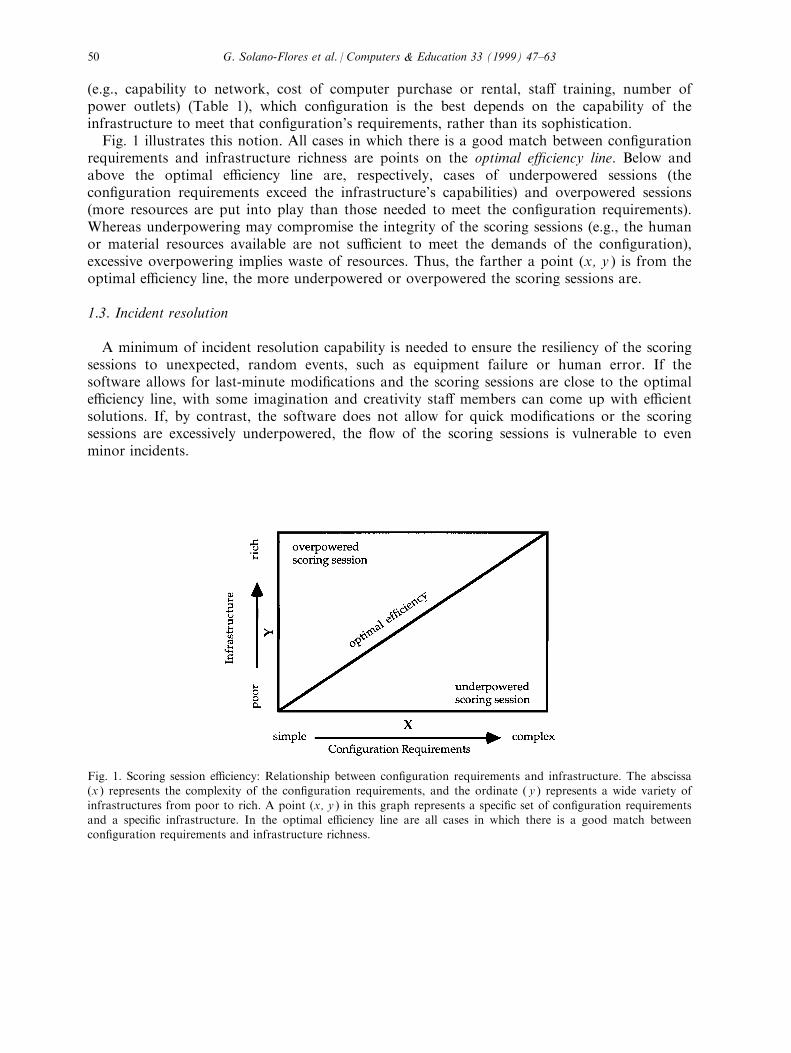
(e.g., capability to network, cost of computer purchase or rental, sta� training, number ofpower outlets) (Table 1), which con®guration is the best depends on the capability of theinfrastructure to meet that con®guration's requirements, rather than its sophistication.Fig. 1 illustrates this notion. All cases in which there is a good match between con®guration
requirements and infrastructure richness are points on the optimal e�ciency line. Below andabove the optimal e�ciency line are, respectively, cases of underpowered sessions (thecon®guration requirements exceed the infrastructure's capabilities) and overpowered sessions(more resources are put into play than those needed to meet the con®guration requirements).Whereas underpowering may compromise the integrity of the scoring sessions (e.g., the humanor material resources available are not su�cient to meet the demands of the con®guration),excessive overpowering implies waste of resources. Thus, the farther a point (x, y ) is from theoptimal e�ciency line, the more underpowered or overpowered the scoring sessions are.
1.3. Incident resolution
A minimum of incident resolution capability is needed to ensure the resiliency of the scoringsessions to unexpected, random events, such as equipment failure or human error. If thesoftware allows for last-minute modi®cations and the scoring sessions are close to the optimale�ciency line, with some imagination and creativity sta� members can come up with e�cientsolutions. If, by contrast, the software does not allow for quick modi®cations or the scoringsessions are excessively underpowered, the ¯ow of the scoring sessions is vulnerable to evenminor incidents.
Fig. 1. Scoring session e�ciency: Relationship between con®guration requirements and infrastructure. The abscissa(x ) represents the complexity of the con®guration requirements, and the ordinate ( y ) represents a wide variety of
infrastructures from poor to rich. A point (x, y ) in this graph represents a speci®c set of con®guration requirementsand a speci®c infrastructure. In the optimal e�ciency line are all cases in which there is a good match betweencon®guration requirements and infrastructure richness.
G. Solano-Flores et al. / Computers & Education 33 (1999) 47±6350
2. Computer-assisted scoring of portfolios for teacher certi®cation
2.1. Assessment context
The National Board of Professional Teaching Standards (NBPTS) was formed in 1986 tocreate a national system for the voluntary certi®cation of teachers. Its goal is to establishadvanced professional standards for teaching (Baratz-Snowden, 1990; National Board forProfessional Teaching Standards, 1989) and move away from sole reliance on traditionalpaper-and-pencil tests of teaching toward new, more complex forms of assessment. These newforms of assessments include portfolios that intend to capture the interactive and adaptivenature of teaching (Crocker, 1997).The costs of these assessments should be a�ordable for teachers and supporting institutions
(Baratz-Snowden, 1991; Gullickson & Nyirenda, 1994). Since food and lodging are among thehighest costs associated with scoring sessions (Linn & Herman, 1997; Monk, 1993), wereasoned that a computer-assisted scoring approach could contribute to reducing the numberof rater/scoring days by continuously providing scoring leaders with accurate information ontheir raters' scoring quality, thus allowing scoring leaders to make timely re-calibration anddismissal decisions. An additional bene®t of this approach has to do with the fact thatfeedback to raters has an intrinsic value as an aspect of professional development when it ishighly speci®c and provided without delay (Duke & Stiggins, 1990).We designed the exercises, the scoring system and a computer-assisted scoring approach for
the ®eld test version of the assessment for the Early Adolescence Through Young Adulthood(ages 11±18+) Art certi®cate (National Board for Professional Teaching Standards, 1994a,b;Peterson, 1996). This assessment consisted of eight portfolio entries and four assessment centerexercises. The portfolio entries had been completed by the examinees over a period of sixmonths and addressed art teaching skills; and the types of products submitted by theexaminees included videotapes of their own teaching, narratives of their work, and samples ofstudent work. The assessment center exercises, not discussed in this paper, were essay exercisescompleted in one day and addressed art content knowledge and art pedagogical contentknowledge.
2.2. Organization's needs and scoring model
The development of the scoring model was the result of two con¯icting facts. On the onehand, we needed to meet the NBPTS' scoring policy, whose operational decisions (e.g., whichresponses needed to be scored by a third reader) and certi®cation decisions are based onholistic scores. On the other hand, available evidence (CedenÄ o & Ruiz-Primo, 1982) indicatesthat, in order to develop software for scoring performance on complex tasks, their componentsmust be clearly identi®ed.Consistent with the observation that scoring should neither be too fragmentary nor global
(see Haertel, 1990), we developed a scoring model we call, structural. The structural scoringmodel allows for detailed judgments on performance without giving up the capability ofevaluating performance as a whole. As with other approaches (e.g., Danielson, 1997), it
G. Solano-Flores et al. / Computers & Education 33 (1999) 47±63 51
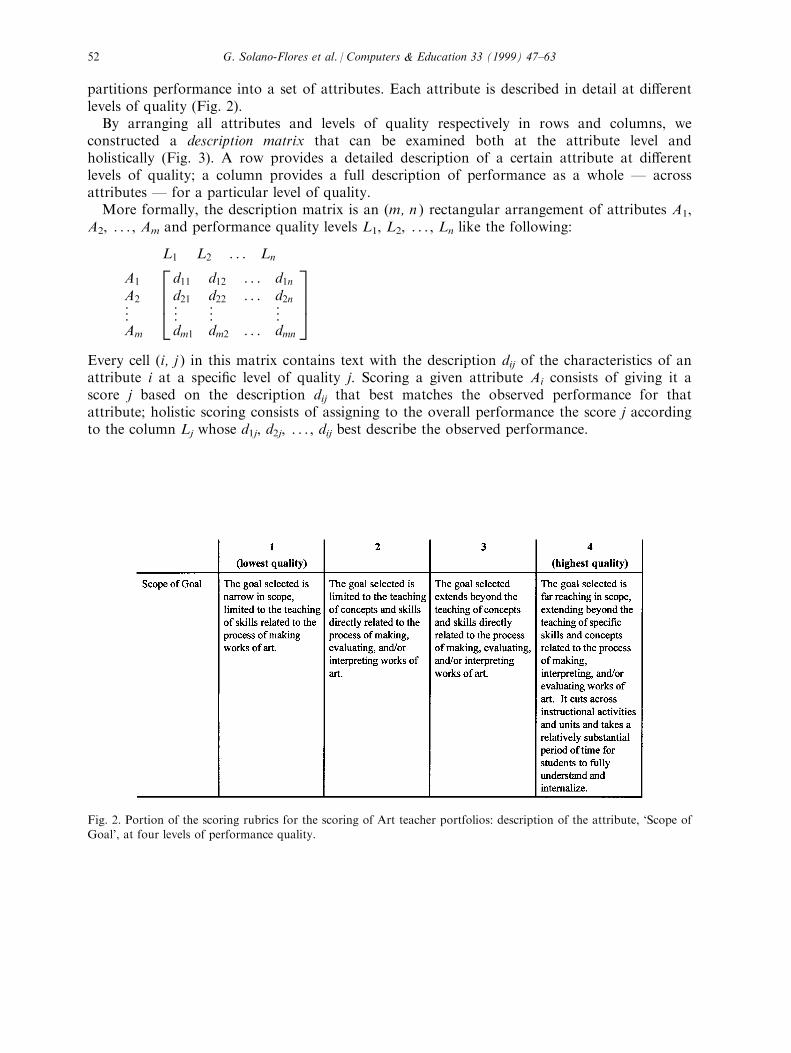
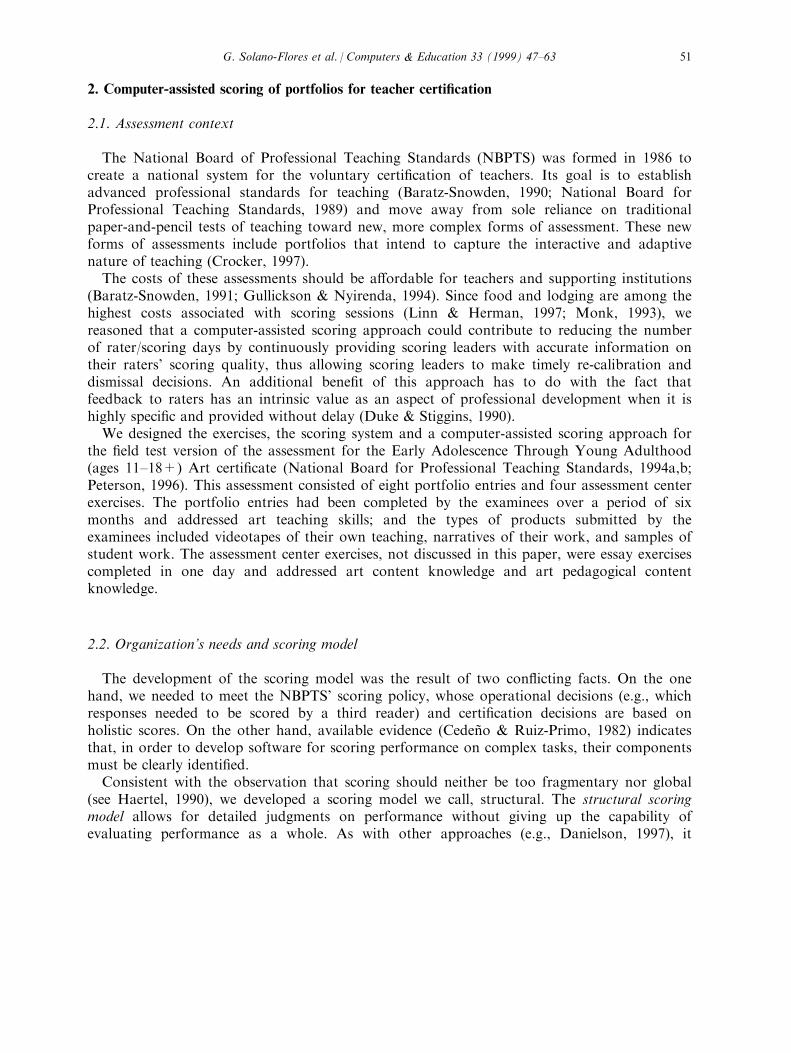
partitions performance into a set of attributes. Each attribute is described in detail at di�erentlevels of quality (Fig. 2).By arranging all attributes and levels of quality respectively in rows and columns, we
constructed a description matrix that can be examined both at the attribute level andholistically (Fig. 3). A row provides a detailed description of a certain attribute at di�erentlevels of quality; a column provides a full description of performance as a whole Ð acrossattributes Ð for a particular level of quality.More formally, the description matrix is an (m, n ) rectangular arrangement of attributes A1,
A2, . . . , Am and performance quality levels L1, L2, . . . , Ln like the following:
L1 L2 . . . Ln
A1
A2
*Am
2664d11 d12 . . . d1nd21 d22 . . . d2n* * *dm1 dm2 . . . dmn
3775Every cell (i, j ) in this matrix contains text with the description dij of the characteristics of anattribute i at a speci®c level of quality j. Scoring a given attribute Ai consists of giving it ascore j based on the description dij that best matches the observed performance for thatattribute; holistic scoring consists of assigning to the overall performance the score j accordingto the column Lj whose d1j, d2j, . . . , dij best describe the observed performance.
Fig. 2. Portion of the scoring rubrics for the scoring of Art teacher portfolios: description of the attribute, `Scope ofGoal', at four levels of performance quality.
G. Solano-Flores et al. / Computers & Education 33 (1999) 47±6352
2.3. Design of the software package
To develop the software we used a PC computer-based database program. The softwareconsisted of an electronic scoring form and a central program.Electronic scoring form Ð The electronic scoring form displayed on the computer screen
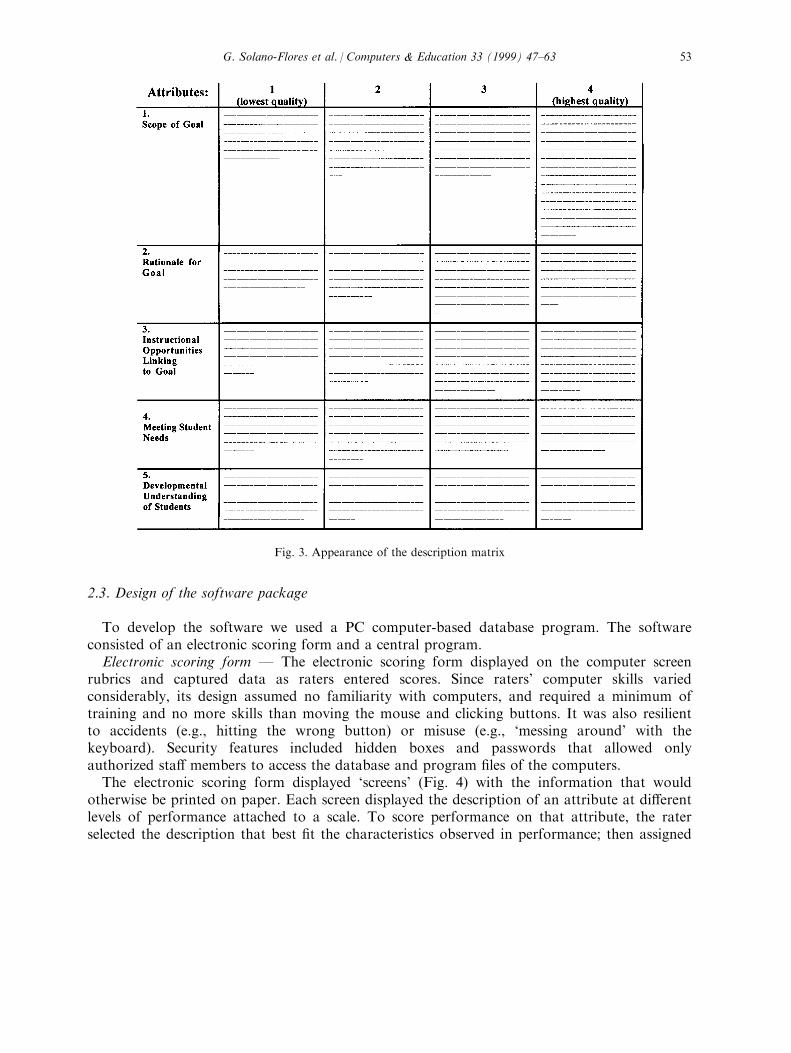
rubrics and captured data as raters entered scores. Since raters' computer skills variedconsiderably, its design assumed no familiarity with computers, and required a minimum oftraining and no more skills than moving the mouse and clicking buttons. It was also resilientto accidents (e.g., hitting the wrong button) or misuse (e.g., `messing around' with thekeyboard). Security features included hidden boxes and passwords that allowed onlyauthorized sta� members to access the database and program ®les of the computers.The electronic scoring form displayed `screens' (Fig. 4) with the information that would
otherwise be printed on paper. Each screen displayed the description of an attribute at di�erentlevels of performance attached to a scale. To score performance on that attribute, the raterselected the description that best ®t the characteristics observed in performance; then assigned
Fig. 3. Appearance of the description matrix
G. Solano-Flores et al. / Computers & Education 33 (1999) 47±63 53
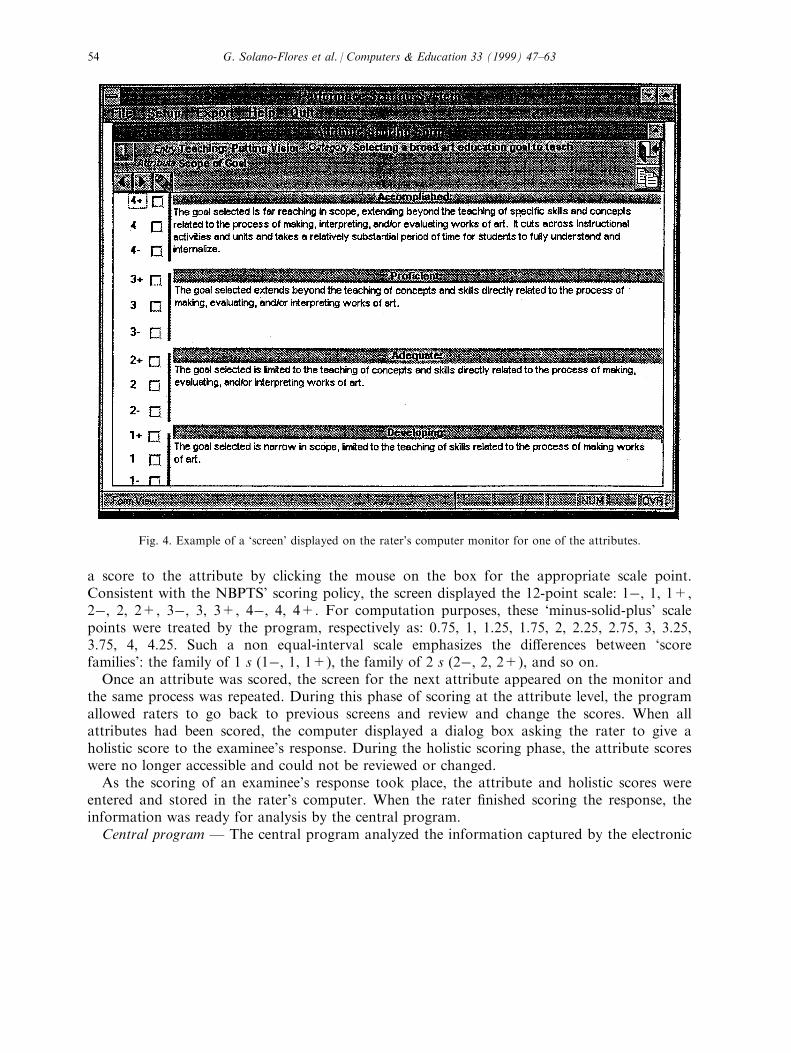
a score to the attribute by clicking the mouse on the box for the appropriate scale point.Consistent with the NBPTS' scoring policy, the screen displayed the 12-point scale: 1ÿ, 1, 1+,2ÿ, 2, 2+, 3ÿ, 3, 3+, 4ÿ, 4, 4+. For computation purposes, these `minus-solid-plus' scalepoints were treated by the program, respectively as: 0.75, 1, 1.25, 1.75, 2, 2.25, 2.75, 3, 3.25,3.75, 4, 4.25. Such a non equal-interval scale emphasizes the di�erences between `scorefamilies': the family of 1 s (1ÿ, 1, 1+), the family of 2 s (2ÿ, 2, 2+), and so on.Once an attribute was scored, the screen for the next attribute appeared on the monitor and
the same process was repeated. During this phase of scoring at the attribute level, the programallowed raters to go back to previous screens and review and change the scores. When allattributes had been scored, the computer displayed a dialog box asking the rater to give aholistic score to the examinee's response. During the holistic scoring phase, the attribute scoreswere no longer accessible and could not be reviewed or changed.As the scoring of an examinee's response took place, the attribute and holistic scores were
entered and stored in the rater's computer. When the rater ®nished scoring the response, theinformation was ready for analysis by the central program.Central program Ð The central program analyzed the information captured by the electronic
Fig. 4. Example of a `screen' displayed on the rater's computer monitor for one of the attributes.
G. Solano-Flores et al. / Computers & Education 33 (1999) 47±6354
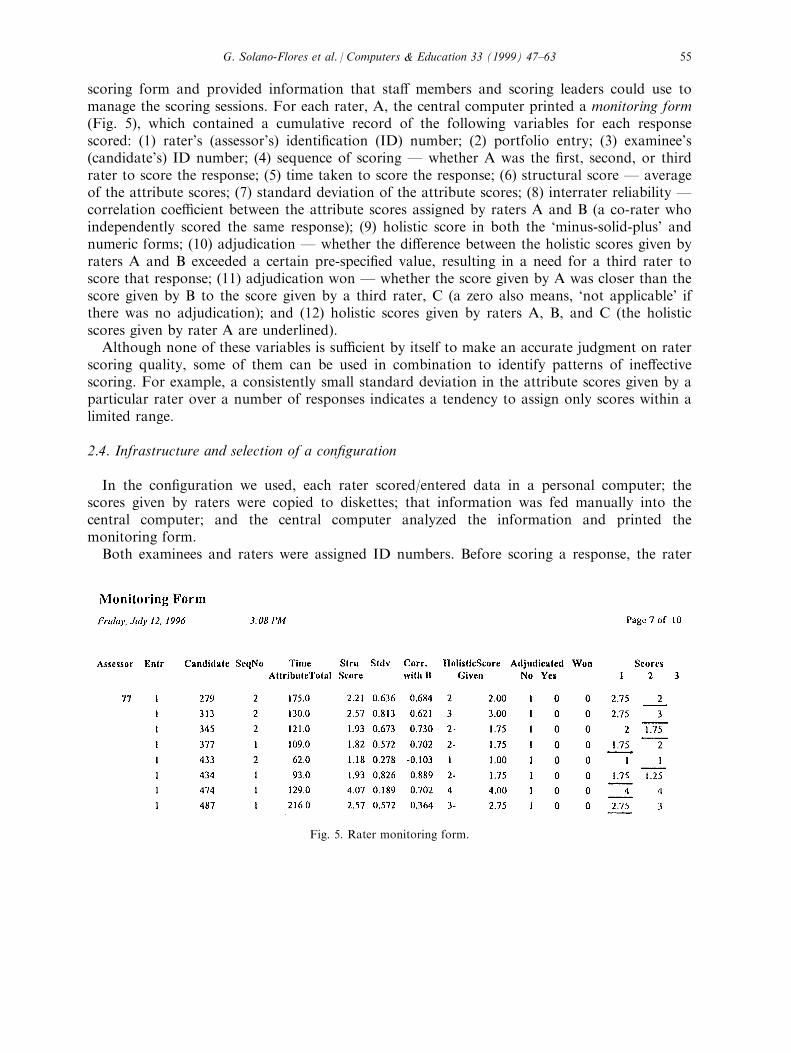
scoring form and provided information that sta� members and scoring leaders could use tomanage the scoring sessions. For each rater, A, the central computer printed a monitoring form(Fig. 5), which contained a cumulative record of the following variables for each responsescored: (1) rater's (assessor's) identi®cation (ID) number; (2) portfolio entry; (3) examinee's(candidate's) ID number; (4) sequence of scoring Ð whether A was the ®rst, second, or thirdrater to score the response; (5) time taken to score the response; (6) structural score Ð averageof the attribute scores; (7) standard deviation of the attribute scores; (8) interrater reliability Ðcorrelation coe�cient between the attribute scores assigned by raters A and B (a co-rater whoindependently scored the same response); (9) holistic score in both the `minus-solid-plus' andnumeric forms; (10) adjudication Ð whether the di�erence between the holistic scores given byraters A and B exceeded a certain pre-speci®ed value, resulting in a need for a third rater toscore that response; (11) adjudication won Ð whether the score given by A was closer than thescore given by B to the score given by a third rater, C (a zero also means, `not applicable' ifthere was no adjudication); and (12) holistic scores given by raters A, B, and C (the holisticscores given by rater A are underlined).Although none of these variables is su�cient by itself to make an accurate judgment on rater
scoring quality, some of them can be used in combination to identify patterns of ine�ectivescoring. For example, a consistently small standard deviation in the attribute scores given by aparticular rater over a number of responses indicates a tendency to assign only scores within alimited range.
2.4. Infrastructure and selection of a con®guration
In the con®guration we used, each rater scored/entered data in a personal computer; thescores given by raters were copied to diskettes; that information was fed manually into thecentral computer; and the central computer analyzed the information and printed themonitoring form.Both examinees and raters were assigned ID numbers. Before scoring a response, the rater
Fig. 5. Rater monitoring form.
G. Solano-Flores et al. / Computers & Education 33 (1999) 47±63 55
had to enter the examinee's ID number. Since each rater consistently used the same computer,raters did not have to enter their ID numbers. The scores for a given response were thus storedalong with the examinee's and rater's ID numbers.Facilities Ð Scoring took place in a large hotel with extensive conference facilities, including
a modern power system with wiring capable of carrying the voltage loads required to supplythe eight scoring rooms where the scoring took place. Each scoring room had power for up to24 computers and television/videotape players in some instances.In addition to the computers for the raters, we rented ®ve spare computers in anticipation of
possible equipment failure. Although the computer rental company dealt with computer set-up,for test security reasons software installation was undertaken by our own sta�, and wasachieved by making several copies of an installation disk so that the software could be installedsimultaneously in di�erent rooms. For an o�-site scoring session lasting six days, security is animportant issue. The presence of personal computers makes it doubly important. To preventloss of data or equipment we had password protection on the computer software and physicalsecurity on all rooms. The equipment was also insured.Although the computers could have been networked to the central computer Ð thus making
information on rater scoring continuously available, that feature would have overpowered thescoring sessions and would have increased their cost: the facilities used were not designed forcomputer installation and had no computer cabling linking rooms. Also, any problem in thenetwork (for example, a system breakdown) could jeopardize the ¯ow of the entire scoringsessions and the integrity of information captured. We considered that a con®guration in whichthe computers were not networked was closer to the optimal e�ciency line (see Fig. 2) than acon®guration in which the computers were networked. By copying the information to diskettesfrom each computer, then feeding it manually into the central computer, we were able toupdate the information on each rater's performance and print the monitoring form twice aday.
2.5. Scoring procedures and implementation of the scoring sessions
One hundred and twenty-seven art teachers participated as raters of the portfolio responsesÐ an average of 16 raters for each of the eight portfolio entries. Each was trained to score oneentry. Since 116 examinees submitted their responses, and the portfolio consisted of eightentries, a total of 928 portfolio entry responses were scored.The scoring session was six days long with two stages comprised of training and live scoring.
For each portfolio entry, there was: (a) a scoring leader (also an art teacher), who trained theraters in the process of scoring, oversaw their performance, provided them with feedback onthe quality of their scoring, and made re-calibration and dismissal decisions; (b) an assistant tothe scoring leader; and (c) a data manager, whose functions included allocating examinees'responses to raters, receiving the responses that had been scored, keeping a scoring log torecord, and periodically transferring the information stored in the hard disk of each computeronto a ¯oppy disk. All scoring leaders and scoring leader assistants had previous experience inportfolio scoring and had taken part in scoring sessions in which `reading behind' theresponses scored by some raters was used as a procedure to ensure scoring quality.Training Ð During the ®rst one and a half days of the scoring sessions, the raters were
G. Solano-Flores et al. / Computers & Education 33 (1999) 47±6356
trained on the scoring process, the NBPTS' standards Ð whose content ultimately determinedthe content of the assessment, and the use of the scoring rubrics. The raters were instructed toscore all cases at both the attribute and holistic level. As a part of this training, they scored`training samples' that had been selected and scored previously.The raters were also trained for no longer than 30 min in the use of the electronic scoring
form. Since allowing raters to enter practice data into the live scoring database and thendeleting it could lead to a corruption of the real data, we used a training version of theelectronic scoring form that did not produce data in the main database records. For someraters who had never used a computer, the training included the use of the computer's mouse.Three sta� members with previous experience in managing scoring sessions were trained as
scoring advisors. Their role was to interpret the information printed in the monitoring formand communicate that information to the scoring leaders and scoring leader assistants insimple language.Live scoring Ð During the last three and a half days of the scoring sessions, each of the
responses was scored independently by two raters. According to the NBPTS' scoring policy, ifthe di�erence between the holistic scores assigned by these raters was equal to or greater thanone point, the response was scored by a third rater.We required the raters to record the attribute and holistic scores in both the electronic
soring form and conventional, paper scoring forms. Although the `screens' displayed by theelectronic scoring form contained the same text as the scoring rubrics printed on paper, thisconservative strategy was necessary because this was the ®rst time computer-assisted scoringsessions were implemented.At the middle of the ®rst live scoring day, we began printing a monitoring form from the
central computer for each rater. Using the updated information provided by these monitoringforms, the scoring advisors met individually with the scoring leaders twice a day to providethem with speci®c information on their raters' quality of scoring. This information was givenin plain English. For example: ``From the last six responses that Rater 4 has scored, andcomparing her scores with scores given by other raters to the same responses, it looks likeRater 4 tends to assign only high scores''. The scoring leaders could use this information incombination with their own observations to provide feedback to the raters and to determinewhen a rater needed re-calibration or had to be dismissed.The examinees' responses were scored independently by two raters. Consistent with the
NBPTS' scoring policy, the responses were scored holistically. The holistic scores were used tomake operational decisions (e.g., which responses needed to be scored by a third rater) andpass±fail decisions. In addition, the responses were scored at an attribute level.During the ®rst day of live scoring we realized that three variables included in the
monitoring form were useless or di�cult to interpret (see Fig. 5). First, the scoring time, whichthe computer started to count right after the rater entered the examinee's ID number, wasuseless because some raters entered the examinees' ID numbers when they started to review theresponses, whereas others entered those ID numbers after they had reviewed the responses andscored them on the paper scoring form. Secondly, the layout of the variable `Adjudicated' wasconfusing; for example, a zero under the heading `No' is a double negation (`it is not true thatthe response was not adjudicated'). Third, the variable `Adjudication won?' was not alwaysprinted in the monitoring form due to a limitation in the program used by the central
G. Solano-Flores et al. / Computers & Education 33 (1999) 47±63 57
computer. We decided to ask the scoring advisors to ignore those variables. In a revisedversion of the program, these problems can be readily addressed with some small butmeaningful modi®cations.
2.6. Evaluation of the computer-assisted scoring approach
We evaluated the computer-assisted scoring approach with two criteria: (a) e�ectiveness Ðability to accomplish the intended scoring goals; and (b) e�ciency Ð ability to accomplish thescoring goals with ease and at a low cost.E�ectiveness Ð We used the information provided by the NBPTS' Technical Analysis
Group, which was responsible for examining the psychometric soundness of the assessmentsdeveloped for the NBPTS, to determine whether using computers in the process of scoring hada negative impact on the overall assessment's reliability. The estimate of the overall reliabilityof the assessment (based on indirect estimates of measurement error due to di�erences in thejudgments rendered by di�erent raters, di�erences in the examinees' performance on alternateforms of exercises, and di�erences in candidates' performances on di�erent occasions) was 0.81,among the highest obtained for any NBPTS assessment (Jaeger, 1996). The overall reliabilitywas at a level that is typically considered as appropriate for use in making selection decisionsthat a�ect individuals. Thus, using computers in the process of scoring did not a�ect theassessment's reliability.
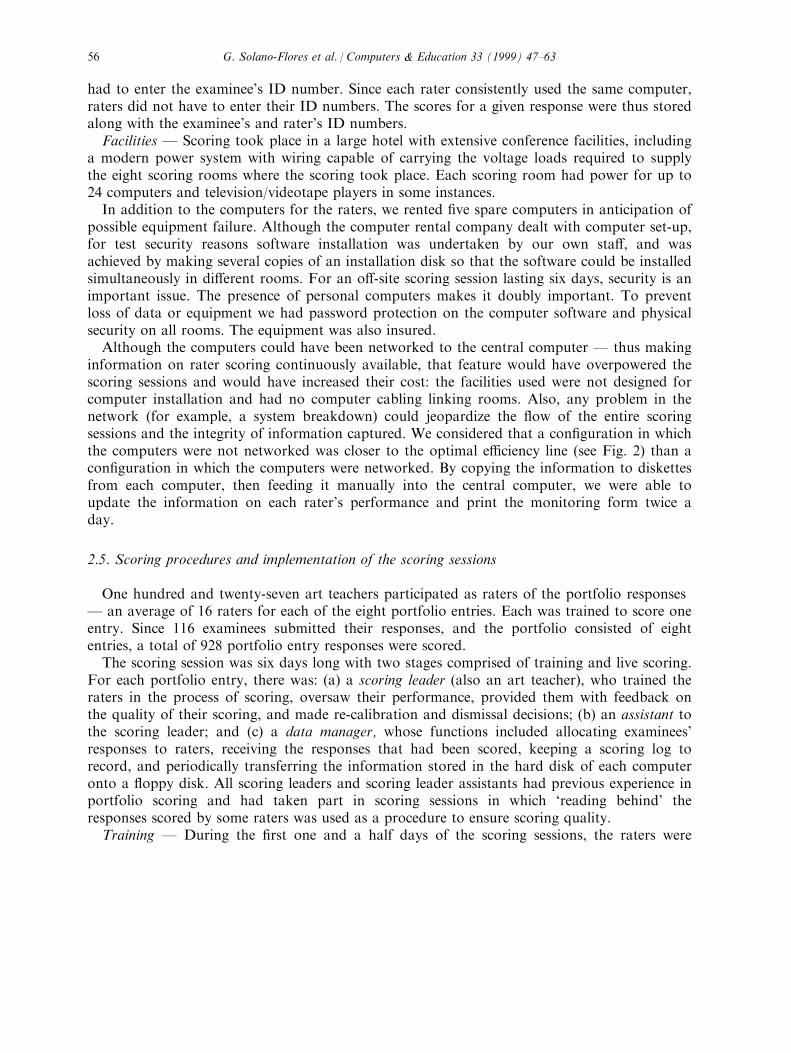
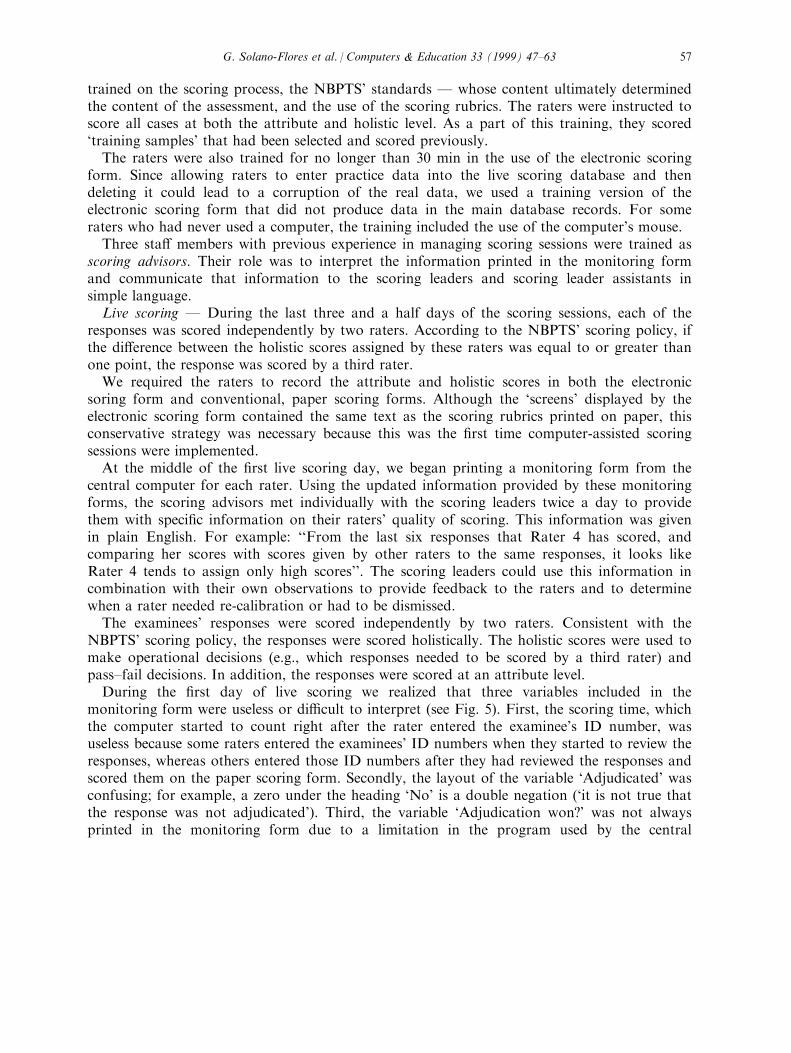
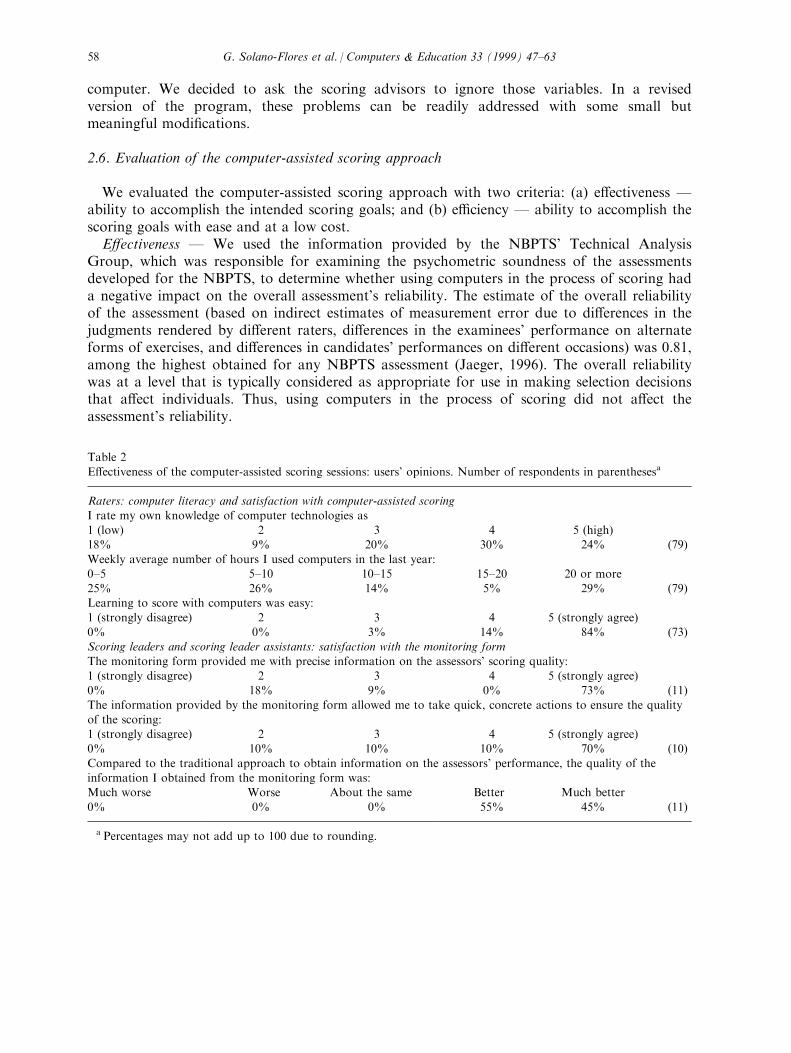
Table 2
E�ectiveness of the computer-assisted scoring sessions: users' opinions. Number of respondents in parenthesesa
Raters: computer literacy and satisfaction with computer-assisted scoring
I rate my own knowledge of computer technologies as1 (low) 2 3 4 5 (high)18% 9% 20% 30% 24% (79)
Weekly average number of hours I used computers in the last year:0±5 5±10 10±15 15±20 20 or more25% 26% 14% 5% 29% (79)Learning to score with computers was easy:
1 (strongly disagree) 2 3 4 5 (strongly agree)0% 0% 3% 14% 84% (73)Scoring leaders and scoring leader assistants: satisfaction with the monitoring form
The monitoring form provided me with precise information on the assessors' scoring quality:1 (strongly disagree) 2 3 4 5 (strongly agree)0% 18% 9% 0% 73% (11)
The information provided by the monitoring form allowed me to take quick, concrete actions to ensure the qualityof the scoring:1 (strongly disagree) 2 3 4 5 (strongly agree)0% 10% 10% 10% 70% (10)
Compared to the traditional approach to obtain information on the assessors' performance, the quality of theinformation I obtained from the monitoring form was:Much worse Worse About the same Better Much better
0% 0% 0% 55% 45% (11)
a Percentages may not add up to 100 due to rounding.
G. Solano-Flores et al. / Computers & Education 33 (1999) 47±6358
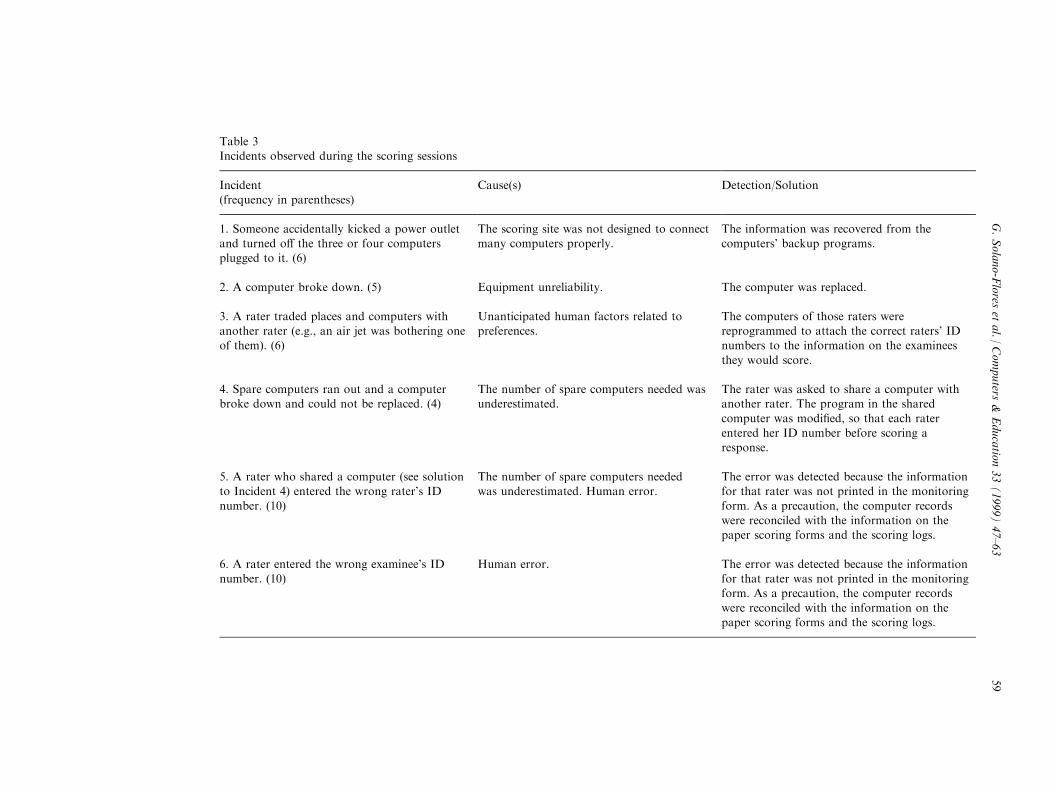
Table 3Incidents observed during the scoring sessions
Incident(frequency in parentheses)
Cause(s) Detection/Solution
1. Someone accidentally kicked a power outletand turned o� the three or four computersplugged to it. (6)
The scoring site was not designed to connectmany computers properly.
The information was recovered from thecomputers' backup programs.
2. A computer broke down. (5) Equipment unreliability. The computer was replaced.
3. A rater traded places and computers withanother rater (e.g., an air jet was bothering oneof them). (6)
Unanticipated human factors related topreferences.
The computers of those raters werereprogrammed to attach the correct raters' IDnumbers to the information on the examinees
they would score.
4. Spare computers ran out and a computerbroke down and could not be replaced. (4)
The number of spare computers needed wasunderestimated.
The rater was asked to share a computer withanother rater. The program in the shared
computer was modi®ed, so that each raterentered her ID number before scoring aresponse.
5. A rater who shared a computer (see solutionto Incident 4) entered the wrong rater's ID
number. (10)
The number of spare computers neededwas underestimated. Human error.
The error was detected because the informationfor that rater was not printed in the monitoring
form. As a precaution, the computer recordswere reconciled with the information on thepaper scoring forms and the scoring logs.
6. A rater entered the wrong examinee's IDnumber. (10)
Human error. The error was detected because the informationfor that rater was not printed in the monitoringform. As a precaution, the computer records
were reconciled with the information on thepaper scoring forms and the scoring logs.
G.Solano-Flores
etal./
Computers
&Educatio
n33(1999)47±63
59
We also examined the responses to two Likert-type questionnaires administered at the end ofthe scoring sessions. One was given to a sample of the raters (N= 81) and addressedfamiliarity with computers and satisfaction with the scoring software; it allowed us to seewhether unfamiliarity with computers a�ected learning to score with computers. The otherquestionnaire was given to a sample of the scoring leaders and scoring leader assistants(N= 11) and addressed their satisfaction with the information on the quality of their raters'scoring based on the monitoring form.Despite the fact that raters varied considerably on their self-rated knowledge of computers
and the number of hours they had used computers in the last year, 98% of them had noproblem learning to score with computers (the rest of them were undecided). How familiarraters were with computers did not seem to a�ect their learning of scoring with a computer(Table 2).All the scoring leaders considered that using the information provided by the monitoring
form was a `better' or `much better' approach to evaluating scoring quality than other,traditional approaches. In addition, 73% of the scoring leaders agreed that the informationobtained from the scoring advisors allowed them to take speci®c and e�ective actions to ensurethe quality of the scoring. In future computer-assisted scoring sessions, two actions can betaken to ensure a better guidance to scoring leaders: (a) include in the training for scoringadvisors strategies to e�ectively communicate the information of the monitoring form to thescoring leaders; and (b) improve the layout of the monitoring form.E�ciency Ð We examined the costs of renting computers in relation to the cost of the total
assessment and the available information on scoring time.The cost of renting the computers did not exceed 1% of the total development cost of the
assessment, a cost that can be considered as low, given the magnitude of the project.Despite the extra work involved with scoring in both the paper scoring forms and the
computers, the scoring sessions ended on time. However, we cannot know the extent to whichthe scoring time would have been reduced had the scoring been carried out only withcomputers.We also examined the incidents that hampered the ¯ow of the scoring sessions. All these
incidents were detected at a time in which they could be properly taken care of by sta�members and none of them threatened the completion or integrity of the scoring sessions.Considering the number of scoring events, those incidents were not frequent (Table 3).However, tackling some of them was time consuming and diverted some of the sta� time thatcould have been better used otherwise.Six types of incidents were observed. Types 1, 2, 4, and 5 involved the adequacy of the
infrastructure to maintain the ¯ow of the scoring sessions. Whereas Type 2 occurred as a resultof simple equipment unreliability Ð which we anticipated and addressed by renting sparecomputers, Types 4 and 5 occurred, respectively, as a direct and indirect consequence of thefact that we underestimated the number of spare computers needed. Finally, Type 1 occurredbecause there were not enough power outlets to connect many computers properly, despite thefact that the facilities used had wiring capable of carrying the required heavy voltage loads. Wehad to use extension cables to transfer power to where we wanted to locate the computers,which produced a potentially hazardous network of cables that had to be taped to the ¯oor.Types 3, 5, and 6 involved unanticipated human factors or human error; they could readily
G. Solano-Flores et al. / Computers & Education 33 (1999) 47±6360
be detected and tackled by modifying the software. Types 5 and 6 did not a�ect the ¯ow of thescoring sessions. However, in some cases the monitoring form did not print any data for someof the raters who shared computers. To deal with Types 5 and 6 we reconciled the computerrecords with the information on the paper scoring forms and the scoring logs in which thescoring managers kept a record of the responses scored by each rater. These incidents did notcorrupt the data.
3. Summary and conclusions
From examining the incidents that involved the capability of the infrastructure to meet thecon®guration requirements, we can conclude that the scoring sessions were somewhatoverpowered. The point (x, y ) Ð which represents the speci®c requirements of thecon®guration we used and the resources provided by the infrastructure Ð was above theoptimal e�ciency line but not very far from it.In light of these results, we can now see a way in which the scoring sessions could have been
even closer to the optimal e�ciency line and could have probably rendered the same goodresults from monitoring rater scoring in real-time. This alternative con®guration would use justtwo computers in each scoring room: one for batch entry of the paper scoring forms producedby individual raters; another to record an electronic version of the handwritten monitoringform maintained by each of the room leaders and to provide each room with its own `just-in-time' monitoring statistics. Although the overall result would have been less stressful, it wouldnot have necessarily been less costly. For example, the money saved on computer rentals wouldhave to be used to pay additional, specialized data entry sta�.Two additional lessons learned have to do with the expectations people have about
computers and with the design of scoring software. First, we realized that what people thinkautomation should be, may play a key role in the support given to using a computer-assistedscoring approach. For example, a number of people criticized the decision not to use anetwork because it seemed, technically, to be the right way to automate the scoring sessions.However, because hotel conference rooms are not a controlled environment, such anoverpowered con®guration would have been far above the optimal e�ciency line, making thescoring sessions vulnerable to catastrophic damage.In a related vein, another myth about a computer-automated process surfaced after the
scoring sessions. In this instance, the turn-around time allowed for producing the ®nal datasets was extremely short, just two days. The perception was that since the data had been`produced' with computers, they should be immediately clean and ready-to-use Ð anunfortunate assumption that led to many desperate hours of frantic error checking by anextremely dedicated sta� to make up for a truly false viewpoint of computer automation.Educating the public about the advantages and what can reasonably be expected fromcomputers is, then, part of planning and implementing computer-assisted scoring sessions.Secondly, the ¯exibility of the software to accommodate unexpected events is critical to
designing e�cient computer-assisted scoring sessions. It was because of this ¯exibility that wewere able to deal with incident Type 3 (see Table 3). By reprogramming some computers, wecould have raters share computers when we ran out of spare computers. (Of course, having
G. Solano-Flores et al. / Computers & Education 33 (1999) 47±63 61
raters sharing computers opened the possibility for incident Type 5 to occur!) Especially incases where scoring is carried out in uncontrolled environments, the software and thecon®guration should allow for quick changes and adaptations by sta� members.In summary, a computer-assisted approach can provide scoring leaders with valuable
information on the raters' scoring quality that could not possibly be obtained with traditionalapproaches to managing scoring sessions. By using this information to provide feedback toraters and to make re-calibration and dismissal decisions, the management of scoring sessionscan potentially be improved Ð which ultimately can reduce the costs associated with scoring.Using and setting up computer equipment can add to the intrinsic complexity of setting upscoring sessions. The closer the scoring process is to the optimal e�ciency line, the greater thebene®ts obtained from using a computer-assisted scoring approach.
Acknowledgements
Funding for the development of the software used in the investigation was provided byWestEd. This investigation was carried out with support and funding from the National Boardfor Professional Teaching Standards. We wish to thank Dean Nafziger, Don Bar®eld, PhilKearney, Jim Smith, and Blair Gibb for the di�erent kinds of support they provided; LloydBond, Dick Jaeger, Lee Cronbach, Ed Haertel, Rich Shavelson, and Mari Pearlman for theircomments on the scoring approach and the computer software; Sue Austin, Kirsten Daehler,Jerome Shaw, and Wanda Baker for their comments on the usability of the software; andMarnie Thompson for her participation in the project. We especially wish to thank JoanPeterson, Jody McCarthy, Kirsten Daehler, Kim O'Neill, and Harriet Kossman for their fullsupport, commitment, and creativity which made possible the use of the scoring approach andthe software. Finally, we wish to thank the art teachers who enthusiastically participated asassessment developers or raters. The ideas presented in this article are not necessarily endorsedby the supporting or funding organizations or our colleagues.
References
Baratz-Snowden, J. (1990). The NBPTS begins its research and development program. Educational Researcher,19(6), 19±24.
Baratz-Snowden, J. (1991). Performance assessment for identifying excellent teachers. The National Board forProfessional Teaching Standards charts its research and development course. Journal of Personnel Evaluation inEducation, 5, 133±145.
CedenÄ o, M. L., & Ruiz-Primo, M. A. (1982). A strategy for assessing methodological and conceptual skills.Unpublished thesis. Mexico: National University of Mexico.
Crocker, L. (1997). Assessing content representativeness of performance assessment exercises. Applied Measurementin Education, 10(1), 83±95.
Danielson, C. (1997). A collection of performance tasks and rubrics: Middle school mathematics. Larchmont, NY: Eyeon Education.
Duke, D. L., & Stiggins, R. J. (1990). Beyond minimum competence: evaluation for professional development. In J.
Millman, & L. Darling-Hammond, The new handbook of teacher evaluation. Assessing elementary and secondaryteachers (pp. 116±132). Newbury Park: Sage Publications.
G. Solano-Flores et al. / Computers & Education 33 (1999) 47±6362
Fitzpatrick, R., & Morrison, E. J. (1971). Performance and product evaluation. In R. L. Thorndike, EducationalMeasurement (pp. 237±270). Washington, DC: American Council on Education.
Gullickson, A. R., & Nyirenda, S. (1994). Evaluation criteria framework for teacher assessment systems: A guide forthe National Board for Professional Teaching Standards' Assessment Development Laboratories. Detroit, MI:National Board for Professional Teaching Standards.
Haertel, E. H. (1990). Performance tests, simulations, and other methods. In J. Millman, & L. Darling-Hammond,The new handbook of teacher evaluation. Assessing elementary and secondary teachers (pp. 278±294). NewburyPark, CA: Sage Publications.
Jaeger, R. (1996). Conclusions on the Technical Measurement Quality of the 1995±1996 Field Test Version of theNational Board for Professional Teaching Standards' Early Adolescence Through Young Adulthood/Art Assessment.Technical Analysis Group, Center for Educational Research and Evaluation, University Of North Carolina,
Greensboro. September.Koretz, D., Stecher, B., Klein, S., & McCa�rey, D. (1994). The Vermont portfolio assessment program: Findings
and implications. Educational Measurement: Issues and Practice, 13(3), 5±16.Linn, R. L., & Herman, J. L. (1997). A policymaker's guide to standards-led assessment. Los Angeles: National
Center for Research on Evaluation, Standards and Student Testing (CRESST).Monk, D. H. (1993). The costs of systemic education reform: conceptual issues and preliminary estimates. New York:
Cornell University Department of Education.
National Board for Professional Teaching Standards (1989). Toward high and rigorous standards for the teachingprofession. In Initial policies and perspectives of the National Board for Professional Teaching Standards. Detroit,MI: National Board for Professional Teaching Standards.
National Board for Professional Teaching Standards (1994a). How we plan to achieve our vision. Detroit, MI:National Board for Professional Teaching Standards.
National Board for Professional Teaching Standards (1994b). Early adolescence through young adulthood/art stan-
dards for National Board certi®cation. Detroit, MI: National Board for Professional Teaching Standards.Peterson, J. (1996). Assessing art teachers. Arts Education Policy Review, 8(1), 22±26.Picus, L. O. (1994). A conceptual framework for analyzing the costs of alternative assessment. CSE Technical Report
384. National Center for Research on Evaluation, Standards, and Student Testing.
Reckase, M. D. (1995). Portfolio assessment: a theoretical estimate of score reliability. Educational Measurement:Issues and Practice, 14(1), 12±14.
Schneider, S., Daehler, K. R., Hershbell, K., McCarthy, J., Shaw, J., & Solano-Flores, G. (1999). Developing a
national science assessment for teacher certi®cation: Practical lessons learned. In L. Ingvarson, Assessing teachersfor professional certi®cation: The ®rst ten years of the National Board for Professional Teaching Standards.Greenewich, Connecticut: JAI Press, Inc [In press].
Shulman, L. (1989). The paradox of teaching assessment. In Educational Testing Service, New directions for teacherassessment: Proceedings of the 1988 ETS Invitational Conference (pp. 13±27). Princeton, NJ: Educational TestingService.
Solano-Flores, G., Raymond, B., & Schneider, S. A. (1997). Computer assisted scoring: Can technology not enhance
the process of scoring portfolios? Paper presented at the Annual Meeting of the American Educational ResearchAssociation. Chicago, March 24±28.
Timms, M., & O'Neill, K. (1997). Organizing a computer-aided scoring session. In Paper presented at the Annual
Meeting of the American Educational Research Association. Chicago, March 24±28.Wigdor, A. K., & Green Jr, B. F. (1991). In Performance assessment for the workplace, 1. Washington, DC:
National Academy Press.
Wolf, K. P. (1991). The schoolteacher's portfolio: Issues in design, implementation, and evaluation. Phi DeltaKappan, 73(2), 129±136.
Wolf, K. P. (1994). Teaching portfolios: Capturing the complexities of teaching. In L. Ingvarson, & R. Chadbourne,
Valuing teachers' work. New directions in teacher appraisal (pp. 112±136). ACER.
G. Solano-Flores et al. / Computers & Education 33 (1999) 47±63 63


