Embed Size (px)
Citation preview
Fire Technology, 37, 219–234, 2001© 2001 Kluwer Academic Publishers. Manufactured in The United States.
Manpower Deployment inEmergency Services
Richard Church, Department of Geography, University of California atSanta Barbara, Santa Barbara, CA 93106-4060
Paul Sorensen and William Corrigan, ISERA Group, Inc., 135 E. Ortega,Santa Barbara, CA 93101
Abstract. In order to adequately respond to emergencies, it is necessary to maintain asufficient level of personnel as well as geographic coverage. Planning for geographic andmanpower coverage can involve a wide variety of factors, including union restrictions, fre-quency and spatial distribution of calls, and road network accessibility. The focus of thispaper is on manpower deployment across such agencies as police, fire, and EMS. Since thecost of manpower is the single largest cost factor in providing such services, it is also one ofthe central elements in efficient service provision. This paper discusses some of the differ-ences in manpower planning among the different emergency services. It also presents detailsassociated with several special models that have been developed in police and EMS planningin order to efficiently deploy manpower throughout each week. We conclude with commentson future needs for research and development in deployment planning and operations.
Key words: deployment, emergency services, optimization, integer programming
1. Introduction
Providing emergency services is expensive. Cities such as Los Angeles spend more than$250 million a year just in the fire department alone. If we add to that the cost ofparamedic response and the costs of police (in terms of emergency response issues), it iseasy to understand that such services are far from being small items in a city budget. Thisdoesn’t even take into account the emergency transport provided by private ambulancecompanies in Los Angeles. As an another example, the Toronto Metropolitan Governmentoversees a public agency that provides ambulance transport and emergency response,which requires posting over 120 ambulances at various locations each day. In Torontoas in many metropolitan areas, ambulance dispatch is coordinated with the dispatchof fire equipment from one of the cities within the Toronto Metropolitan Government.Even though equipment and facility costs can be high, labor costs tend to be the singlehighest cost element of providing fire, EMS, and police emergency response services.Consequently, manpower planning is one of the central elements in efficient emergencyservices provision.
The focus of this paper is on manpower planning. Even though fire, EMS and policeemergency response all require geographical coverage and appropriate levels of staffing,personnel deployment across the three different services do vary. One of our objectivesis to discuss both the similarities and differences in manpower deployment in emergency
220 Fire Technology Third Quarter 2001
response services. We will also present details as to how such deployment problems havebeen modeled, especially in police and EMS. We begin with a short history of labor issuesand emergency services. We then discuss deployment planning in general, the complex-ities of the deployment planning problem, recent deployment planning and operationsimprovements, and finally examples of new models and promising applications.
2. Historical Issues in Manpower Deployment
With the exception of volunteer fire brigades, labor costs have played a major role inthe evolution of emergency services such as fire protection. Fire protection first becamepopular in the US as a service in eastern cities such as Baltimore and Philadelphia.Such services were provided by private insurance companies, each trying to protect theproperty that they insured. In the event of a fire, several fire companies would respond,but only the fire company representing the homeowner’s insurance company would fightthe fire. Even with higher rates of fire, such duplicated services were expensive. Obvi-ously, one consolidated fire department in a city meant an opportunity for reducingduplicated equipment and crews provided by competing fire insurance companies. Themajor impetus for such consolidations was the potential to reduce costs, especially labor.The provision of fire services soon became the obligation of most moderate to large citygovernments. To protect themselves in underwriting fire insurance policies, insurancecompanies took on a role of rating the level of service provision. Because of the costof manpower, many areas still rely on the use of volunteers for the bulk of their firefighting force.
Just as in the evolution of fire services, labor costs have played a major role inemergency medical response. Historically, EMS was unregulated and pre-hospital careinvolved just transportation. To keep labor and vehicle costs to a minimum it wasn’tsurprising that such services were often provided by funeral homes in many areas. Thismade sense from a labor perspective, as many funeral homes had employees either oncall or available around the clock. Funeral homes could also use their vehicles for trans-port if they didn’t have a vehicle devoted to ambulance services. The level of care andpersonnel training was minimal if not nonexistent. Federal regulation in the early 1970sestablished standards on training requirements for paramedics and emergency medicaltechnicians. Regulation was necessary to improve services, but this was at a substan-tially increased labor cost. Requirements to provide trained personnel, and the push tomeet response time standards (especially in terms of trauma) meant that EMS became aprimary activity instead of a secondary income source.
In earlier times, the number of police officers either walking a beat or driving apatrol car per thousand people was greater than that of today. Labor pressures haveforced many cities to reduce patrol units to one person from two. Even the time devotedto specific tasks has changed dramatically. More time is now spent in responding toproblems than performing routine patrols. Over time many cities have kept the growthof police officers to less than historical trends in order to keep costs down. Some citieshave even experimented with integrating police and fire departments in order to seeksavings on needed personnel �1�2�3�. Many companies have begun to rely on securityservices, special patrols and alarm systems in order to minimize insurance costs and
Manpower Deployment in Emergency Services 221
losses from theft. Such private sector ventures provide services that were once part oftypical police patrols.
It is easy to see that a common trend in all types of emergency services is an attemptto contain costs. Since labor is the highest single cost factor in any one of these services,there is continued pressure in most cities to keep the number of full time emergencyservices personnel as low as possible.
3. Defining the Manpower Deployment Problem
Since labor is the single largest cost factor in providing emergency services, it is logicalto ask just what should it take to maintain a certain level of service. This is the essenceof the deployment problem. We can define the deployment problem as:
• To determine the best combination of staffing and equipment over time and space inorder to meet demand.
There are two main components of this problem:
• Personnel component:To identify the appropriate level of staffing by crew-shifs over hours of the week
• Location-allocation component:Locate & allocate the appropriate type of equipment to meet service demands over
space and time
The deployment problem is associated with identifying just what is needed in termsof equipment and personnel in order to meet some desired set of standards. For example,the standard may be able to respond to 90% of the calls of EMS within 8 minutes.Given this standard for service and given the geographical distribution of the potentialdemands, it is necessary to solve both a spatial and temporal allocation problem. The firstmajor research project involving emergency deployment is the now famous New YorkCity Rand project which was funded by the federal government during the 1970s [4].
The historical approach is to handle the two problem components as separate issues.For example, in police departments it is common to start with a given manning levelor target. As the first step officers are allocated to specific divisions or stations usingestimates of workload or some model like the parametric allocation model of Rider [4].Then, the schedules of individual officers are often determined at each station. Policedepartments have the flexibility to make changes on a frequent basis, although this isoften not done. In fire departments, it is common to locate stations for spatial coverage.The location decisions are usually the result of a long-term planning process. Suchmodels as the location set covering model are typically used [5]. Given station locations,equipment is then allocated in order to provide adequate first and second due response[6]. Simple models like the square-root law have been used to estimate response timesin an urban area [7]. Colner and Gilsinn [8] provide one of the first comprehensivelocation modeling frameworks for fire department deployment analysis. Then, personnelare usually assigned 24 hour shifts to staff equipment to appropriate levels. Changesin equipment allocation and staffing plans are seldom made except when new stations
222 Fire Technology Third Quarter 2001
are added, moved or closed. In operation, equipment may be moved in order to shoreup problems in spatial coverage due to some stations responding to active incidents.Workload imbalances across stations can often become a management and labor problem.
For EMS services, it is common to estimate demand temporally, by hours of the week[9]. Thus, for each hour of the week there is a desired number of ambulances to be oper-ated. Demand normally fluctuates significantly, from low levels in early morning hoursto relatively high levels in afternoon and evening hours. The next task is to identifywhen certain shifts should start during the week in such a manner that operating vehi-cles match as closely as possible the demand or need for operating vehicles. Next, spatialdeployment plans are generated. Spatial deployment plans specify how various levels ofavailable units in specific hours of the week should be distributed. For example, if 15ambulances are scheduled for operation in a given hour and six are busy, how shouldthe remaining nine units be scattered across the region in such a manner as to keepresponse time compliance as high as possible. This operation plan is called a systemsstatus management plan. Finally, individual crews are assigned shifts to cover. Someresearchers have developed specialized queuing models which address both demand andspatial allocation in order to estimate both numbers of ambulances needed and postingpatterns [10]. A number of location models have been developed to address the staticposting problem. These models include such approaches as maximizing expected cov-erage [11], minimizing the resources needed to provide a level of pre-specified level ofreliability [12], optimizing combined services like basic life support and advanced lifesupport in a two-tiered model [13], hypercube queueing [14], and providing accessibletrauma care [15].
4. The complexity of the Deployment PlanningProblem Components
Depending upon the application, the complexity of the deployment problem may vary.For example, if the problem is to operate one fire station with two pieces of equipment,then both the station location problem and the scheduling problem can be consideredrelatively simple. We recognize that the station location decision may be a difficultchoice due to possible property owners and opposition, but there are usually a small butcountable number of location alternatives with which to deal. On the opposite end ofthe spectrum, planners face problems like developing an ambulance posting plan for 10ambulances, involving 100 potential sites across a city. The number of alternative plansthat are possible is no longer a small easy to enumerate example, but a situation wherethe number of alternatives equals:
(10010
)= 100!
10!90!
which evaluates as 17,310,309,456,440 possibilities. The point is that the complexity ofsuch a problem can grow exponentially. It is literally impossible to generate and evaluateall 17 trillion solutions. What is needed is a way to identify the best solution withoutenumerating all possibilities.
Manpower Deployment in Emergency Services 223
The same types of complexity examples hold true for the personnel scheduling com-ponent of the deployment planning problem. On the simple side of the spectrum is the24 hour shift patterns used in many fire departments. The constant shift pattern of 24hours-on and 48 hours-off, yields a simple scheduling solution providing a constant unitmanning 24 hours a day, seven days a week. If demand fluctuates widely throughout theweek, it may be desirable to schedule crews to vary according to that demand. This iswhat typically happens with ambulance companies. When shifts are allowed to vary inlength of days, duration of working hours, and starting times, the resulting schedulingproblem can then become rather complex. Just as the number of distinct alternatives tothe posting problem grows with problem size (i.e., number of potential posting pointsand number of vehicles) the number of potential solutions to the personnel deploymentproblem grows with increasing number of shift types and starting times. Since both post-ing/location problems and personnel scheduling problems can be complex, the combineddeployment problem can be difficult to solve optimally as well.
5. Making Improvements in DeploymentPlanning and Execution
Because the deployment planning problem is relatively complex, is important to developgood planning models and techniques to aid decision makers and operations person-nel. Even though advancements in both planning and execution have been made, suchadvancements have evolved over time as developments in computers, software, databasesystems, etc. have made new technological approaches possible. We can easily classifythese improvements into two main areas: execution/operation, and planning. For the exe-cution/operations area, a number of developments have helped improved deployment.They are:
1. The capability to track vehicles dynamically using AVL and GPS technology to bettermonitor system status.
2. Improved Computer Aided Dispatch (CAD) systems that contain map databases, andcan aid in helping dispatching closest vehicles, monitoring response coverage, etc.
In long-term deployment planning, many areas now employ one or more of the fol-lowing approaches:
1. Use CAD data• to better assess demand over space and time rather than only keeping track of the
number of calls in a given time period• to assess system performance criteria
2. Use GIS for mapping• crime locations, EMS calls, etc.• visualize system during operations• exploratory data and trend analysis
3. Use optimization models• for fire station location• for equipment allocation to stations
224 Fire Technology Third Quarter 2001
Unfortunately, many of these techniques have only recently been adopted. Their valuein providing gains in service provision or system efficiency has been substantial in somecases (see for example [16]). In order to make substantial gains in system efficiency, itis important to generate optimal or near optimal solutions for deployment planning andexecution problems. This requires capabilities that can:
1. solve each component of the deployment planning problem optimally,2. handle both components of the deployment planning problem in a coordinated opti-
mizing model,3. seek solutions which are robust: solutions that can perform well in a variety of
situations,4. model for persistence: generate solutions which are not short-sighted,5. support integration with CAD data, GIS, and decision support technology, and6. monitor plans easily and efficiently.
The above capabilities are important needs in the emergency services arena. If tech-niques and software are developed which can provide such capabilities to fire, police,and EMS departments, then it is possible that better solutions to the deployment planningproblem can be developed and supported. In fact many of these elements are the subjectof current research and development. To demonstrate this, we will give two examplesof models developed to solve the personnel scheduling components of the deploymentplanning problem in the next section.
6. Model Developments in PoliceDeployment Planning
There have been a number of deployment planning models that have been developedin the last decade. Some of these models deal with the manpower component of thedeployment problem �17�18�. To illustrate the promise that such modeling may have forthe emergency services arena, we will provide two examples, one for police and one forEMS. In this section we give details on a police deployment planning model that hasbeen developed for the San Francisco Police Department. In Section 7, we describe asimilar type of model that has been developed for the pre-hospital care industry.
The following model, called the Police Patrol Scheduling System (PPSS), was pro-duced in order to provide better manpower personnel deployment in terms of workloaddemand over the hours of the week [19]. The model that was developed is an integerprogramming problem. It is necessary to define the following notation for the modelpresentation:
i = index for hour,
j = index for day,
h= hours in shift,
d = days in shift,
TA= set of start time indices i� j� that are acceptable,
Manpower Deployment in Emergency Services 225
Sij = set of start times that contribute personnel to the coverage of i� j�given h�d�,
NOij = the number of officers starting the work week at i� j ,
T = the set of selected start times,
K = the number of officers on duty at any i� j ,
NA= the number of officers available,
NP = the number of patrol groups,
Rij = the number of officers required each hour and day,
�= a value greater than or equal to one, where higher values reflect a highdegree of management concern for large hourly shortages,
�= a value that balances the relative importance of total shortageminimization to minimization of maximum hourly shortage,
Pij = officers on duty at i� j ,
Uij = shortage of officers at i� j ,
Oij = surplus of officers at i� j .
We can now define the PPSS model as:
Minimize Z =∑i�j
U�ij +�
∑i�j
Uij �
1. Definition of officers on duty at a given time as a function of number starting certainshifts
Pij =∑kl∈Sij
NOkl ∀ i� j�
2. Definition of shortage and surplus officers scheduled
Pij +Uij −Oij = Rij ∀ i� j�
3. Number of starting times/groups is limited to the number of supervisors
NumberT �≤ NO�
4. Starting times are feasible
T ∈ TA�
226 Fire Technology Third Quarter 2001
5. Cannot schedule any more patrol officers than available
∑ij∈TNOij ≤ NA�
6. Must schedule at least a minimum number of patrol officers in a given time period
Pij ≥ K ∀ i� j
7. If anyone is assigned a given starting time, then a minimum number of others mustbe scheduled as well
NOij ≥M ∀ NOij > 0 and ∀ ij
8. Non-negativity conditions for the decision variables
NOij ≥ 0 ∀ i� j� Pij ≥ 0 ∀ i� j� Uij ≥ 0 ∀ i� j�Oij ≥ 0 ∀ i� j� Rij ≥ 0 ∀ i� j�
This model was developed by Taylor and Huxley [19]. The model was imbedded ina decision support system and utilized a heuristic solution procedure. The informationflows that supported the use of this system are given in Figure 1. Notice that the maininformation source in the PPSS is the CAD (computer aided dispatch) data base. Theforecasting step results in the number of officers needed by hour by day. The heuristic“Integheuristic” produces efficient scheduling solutions to the above model given thedemand scenario. An expert rule based system helps fine tune the results of the heuristicand helps produce schedules with desired properties. One of the important features ofthe model is that, when officers are scheduled to begin a shift, a group of officers beginsat the same time. This fits the typical operations model where a group starting on a shiftmeet together and are briefed by a group leader on current situations and needs, as wellas giving out assignments. This type of property appears to be the exact opposite of whatis desired in EMS deployment. The number of shifts that start at a given time should belimited in number as it is desirable to minimize the disruption in service caused by shiftchanges occurring in any short period of time.
The application of this model to San Francisco yielded very encouraging results. First,the system provided solutions that provided higher levels of officers on the street duringperiods of high demand. Solutions provided up to 25% more patrol units in times ofneed, equivalent to adding 200 officers at a cost of $11 million a year. Second, responsetimes improved by an average of 20%. Third, revenues from traffic violations increasedby $3 million per year. Consequently, the costs of patrol were effectively lowered withhigher revenues and service improved with better temporal deployment. This is a sterlingexample of the power provided by using a discrete optimization model in deploymentplanning.

Manpower Deployment in Emergency Services 227
Figure 1. Information flows for the Police Patrol Scheduling System.
7. Model Developments in EMS Deployment Planning
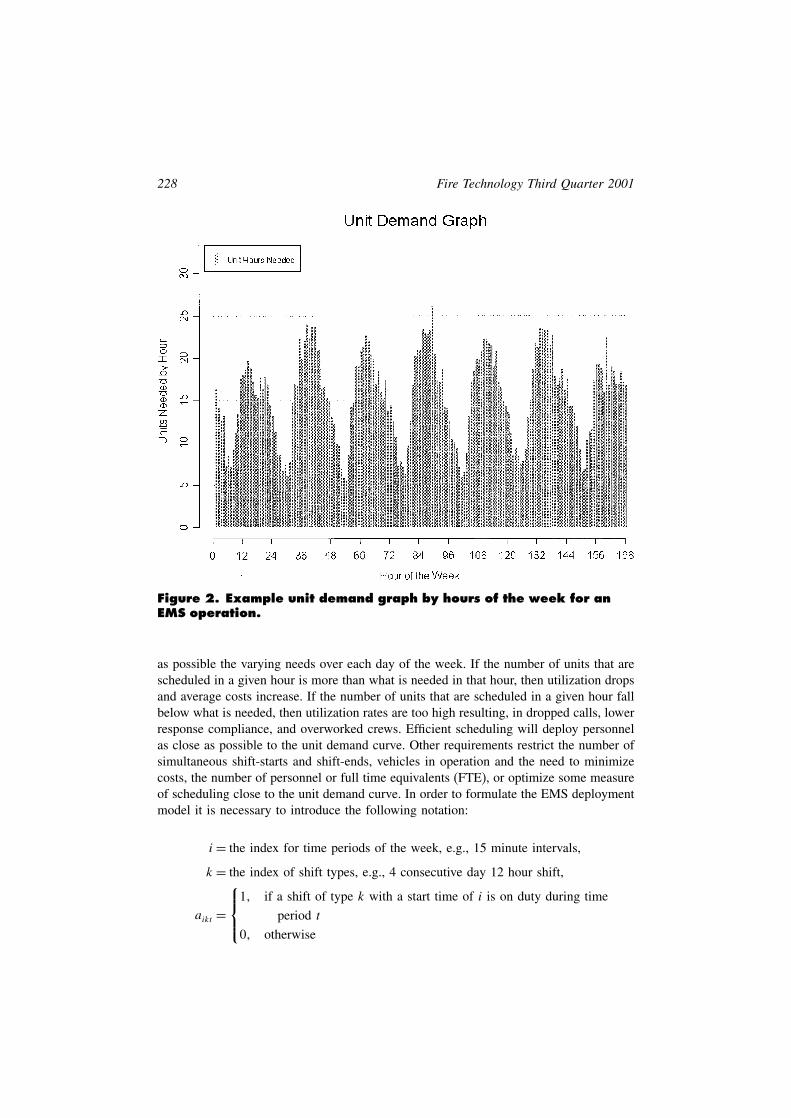
The second example deals with a model that has been developed for use in EMS servicesby the authors. Figure 2 gives an example of how demand for unit (vehicle) coveragevaries over the hours of a week. The figure shows approximately how many operatingunits are needed in each hour. A vertical gray bar is given for each of the 168 hours ofthe week. The height of each bar represents the needed number of active crews duringthat hour. The basic goal is to schedule shifts in such a manner as to match as closely
228 Fire Technology Third Quarter 2001
Figure 2. Example unit demand graph by hours of the week for anEMS operation.
as possible the varying needs over each day of the week. If the number of units that arescheduled in a given hour is more than what is needed in that hour, then utilization dropsand average costs increase. If the number of units that are scheduled in a given hour fallbelow what is needed, then utilization rates are too high resulting, in dropped calls, lowerresponse compliance, and overworked crews. Efficient scheduling will deploy personnelas close as possible to the unit demand curve. Other requirements restrict the number ofsimultaneous shift-starts and shift-ends, vehicles in operation and the need to minimizecosts, the number of personnel or full time equivalents (FTE), or optimize some measureof scheduling close to the unit demand curve. In order to formulate the EMS deploymentmodel it is necessary to introduce the following notation:
i = the index for time periods of the week, e.g., 15 minute intervals,
k = the index of shift types, e.g., 4 consecutive day 12 hour shift,
aikt =
1� if a shift of type k with a start time of i is on duty during time
period t
0� otherwise

Manpower Deployment in Emergency Services 229
bikt ={1� if a shift of type k with a start time of i, starts at time period t
0� otherwise
cikt ={1� if a shift of type k with a start time of i, ends in time period t
0� otherwise
mi = the minimum number of crews that should work during time period i,
ti = the highest target for crew assignments in time period i,
mps = the maximum number of simultaneous shift starts,
mpe = the maximum number of simultaneous shift endings,
v = the maximum number of available vehicles,
E = the maximum limit of full-time-equivalent employees to be used,
xik = the number of shifts of type k that start in time period i,
nt = the shortfall in the maximum desired staffing target for time period t.
Using the above notation we can formulate a version of the EMS deployment planningproblem. The model that we present here is based upon the assumption that daily starttimes for a specific crew shift do not vary. Varying such start times can also be accom-plished but requires an extended formulation. The objective formulated below involvesminimizing unit shortages as measured against the demand target in each time period.
Minimize Z =∑t
nt
1. Meet the minimum staffing requirements for time period t
∑i�k∈S
aiktxik ≥mt for each time period t�
2. Define the shortfall in unit-hours provision from the desired target in time period t
∑i�k∈S
aiktxik+nt ≥ tt for each time period t�
3. Ensure that no more than a certain number begin a shift in the same time period
∑i�k∈S
biktxik ≤mps for each time period t�
4. Ensure that no more than a given number end a shift in the same time period
∑i�k∈S
ciktxik ≤mpe for each time period t�
230 Fire Technology Third Quarter 2001
5. Use no more than a maximum level of vehicle deployment
∑i�k∈S
aiktxik ≤ v for each time period t�
6. Use no more than a certain limit of FTE of employees (or cost or UHs)
∑i�k∈S
fi�kxi�k ≤ E�
7. Non-negativity of decision variables
xik ≥ 0� integer for each i� k ∈ Snt ≥ 0 for each time period t�
The above model is another example of a discrete integer programming problem. Justas in the San Francisco Police Patrol Scheduling System, this model can be solved withgeneral purpose integer-linear programming software. Unfortunately, realistic problemsizes can tax the ability of current off-the-shelf software to the extent that solution timesare unacceptably large. This has led to the development of a heuristic solver for theabove model. The solver is based upon a TABU search process and involves a techniquecalled strategic oscillation. The solver can solve two related problems: minimizing shifts(or total cost of scheduled shifts) needed to cover all workloads; or minimizing shortfallsto target needs in each hour subject to a constraint on total number of shifts (or totalcost of scheduled shifts).
The above model and solver has been embedded into a decision support systemdesigned under support provided by the National Science Foundation. This model hasnow been tested in several major metropolitan areas and has resulted in deployment planswhich reduced needed manpower by up to 8–10%, increased compliance, and aided inshift negotiation with employees. As an example, in Kansas City, Missouri and KansasCity, Kansas, the ambulance services authority, theMetropolitan Ambulance Services Trust(MAST), has used this model to study the deployment of EMS shifts. MAST contracts withEmergency Providers Incorporated (EPI), an ambulance company, to provide and managean EMS staff.
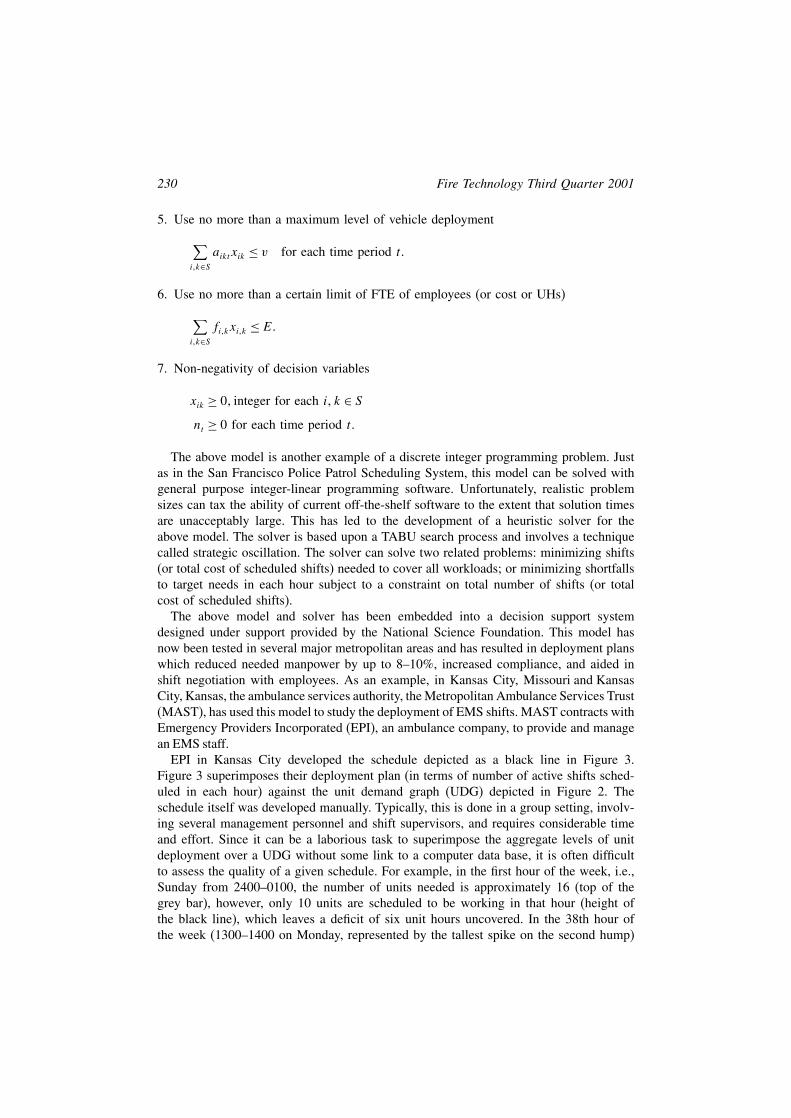
EPI in Kansas City developed the schedule depicted as a black line in Figure 3.Figure 3 superimposes their deployment plan (in terms of number of active shifts sched-uled in each hour) against the unit demand graph (UDG) depicted in Figure 2. Theschedule itself was developed manually. Typically, this is done in a group setting, involv-ing several management personnel and shift supervisors, and requires considerable timeand effort. Since it can be a laborious task to superimpose the aggregate levels of unitdeployment over a UDG without some link to a computer data base, it is often difficultto assess the quality of a given schedule. For example, in the first hour of the week, i.e.,Sunday from 2400–0100, the number of units needed is approximately 16 (top of thegrey bar), however, only 10 units are scheduled to be working in that hour (height ofthe black line), which leaves a deficit of six unit hours uncovered. In the 38th hour ofthe week (1300–1400 on Monday, represented by the tallest spike on the second hump)
Manpower Deployment in Emergency Services 231
Figure 3. Current deployment plan superimposed on the unit demandgraph for Kansas City Metropolitan area.
about 24 units are desired but 28 are scheduled, a surplus of four unit hours. The pos-sible consequences of the current plan in these two hours are: (1) in the former hour,delays responding to calls and difficulties meeting response time compliance standardsand (2) in the latter hour, a low unit hour utilization value or crews with a dearth of work.
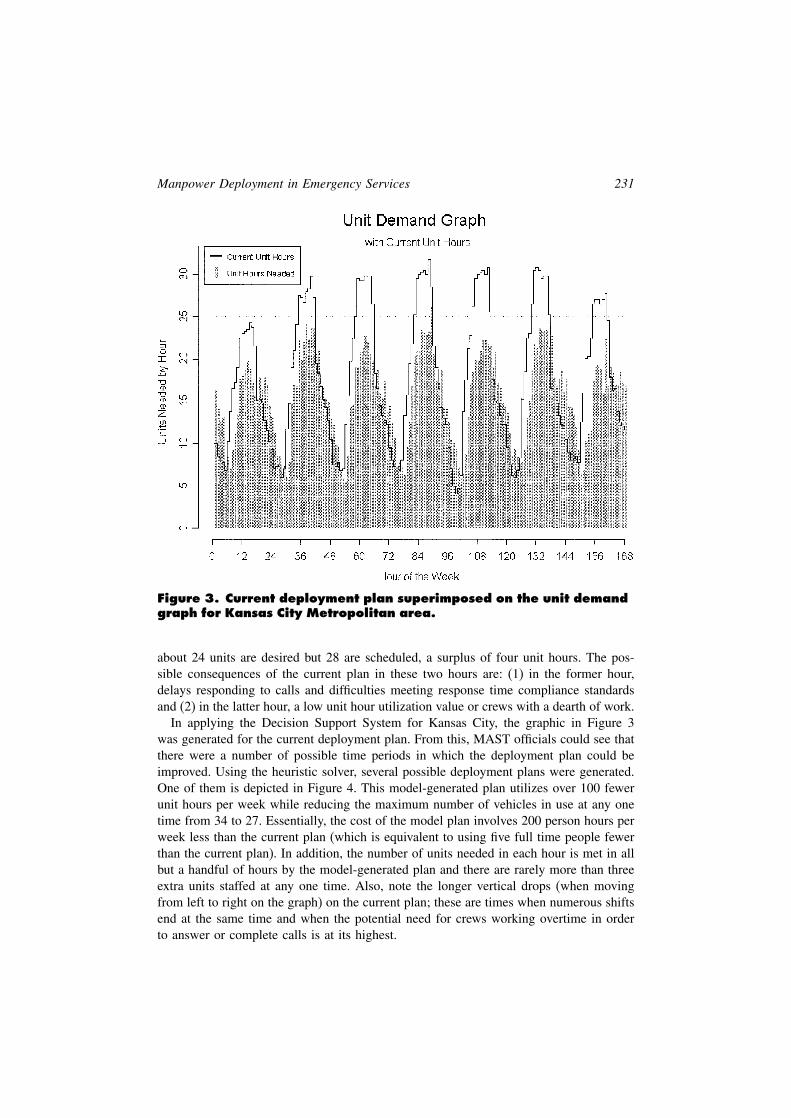
In applying the Decision Support System for Kansas City, the graphic in Figure 3was generated for the current deployment plan. From this, MAST officials could see thatthere were a number of possible time periods in which the deployment plan could beimproved. Using the heuristic solver, several possible deployment plans were generated.One of them is depicted in Figure 4. This model-generated plan utilizes over 100 fewerunit hours per week while reducing the maximum number of vehicles in use at any onetime from 34 to 27. Essentially, the cost of the model plan involves 200 person hours perweek less than the current plan (which is equivalent to using five full time people fewerthan the current plan). In addition, the number of units needed in each hour is met in allbut a handful of hours by the model-generated plan and there are rarely more than threeextra units staffed at any one time. Also, note the longer vertical drops (when movingfrom left to right on the graph) on the current plan; these are times when numerous shiftsend at the same time and when the potential need for crews working overtime in orderto answer or complete calls is at its highest.
232 Fire Technology Third Quarter 2001
Figure 4. An example model deployment plan superimposed on theunit demand graph for Kansas City Metropolitan area.
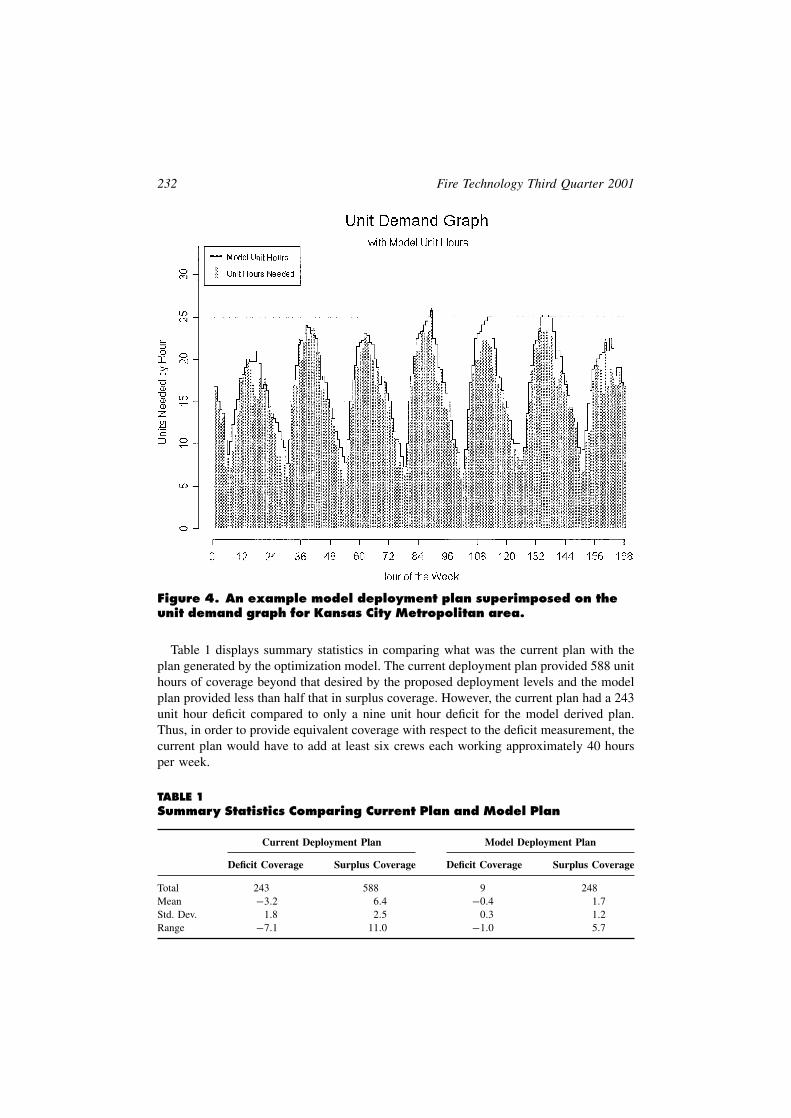
Table 1 displays summary statistics in comparing what was the current plan with theplan generated by the optimization model. The current deployment plan provided 588 unithours of coverage beyond that desired by the proposed deployment levels and the modelplan provided less than half that in surplus coverage. However, the current plan had a 243unit hour deficit compared to only a nine unit hour deficit for the model derived plan.Thus, in order to provide equivalent coverage with respect to the deficit measurement, thecurrent plan would have to add at least six crews each working approximately 40 hoursper week.
TABLE 1Summary Statistics Comparing Current Plan and Model Plan
Current Deployment Plan Model Deployment Plan
Deficit Coverage Surplus Coverage Deficit Coverage Surplus Coverage
Total 243 588 9 248Mean −3�2 6�4 −0�4 1�7Std. Dev. 1�8 2�5 0�3 1�2Range −7�1 11�0 −1�0 5�7
Manpower Deployment in Emergency Services 233
The benefits of the model include reducing the number of unit hours staffed duringeach week, avoiding cyclic times of high call volume compared to staffing levels, ensur-ing a more evenly spread work distribution, the possibility of minimizing mandatoryovertime, and worker participation in the deployment process. When the model was firstapplied it coincided with a request by EPI to add three more units to help improve thecurrent schedule. By using the model, MAST was able to effectively evaluate the EPIplan. Without considering other issues, it was clear that three additional units would notbe needed to improve the schedule. In fact, better deployment may yield reductions inneeded staff and vehicles. Now, both EPI and MAST have installed the model for use infuture planning.
8. Summary
The deployment planning problem deals with determining the best times and locationsin which to deploy emergency response assets. In order to solve this problem one needsto characterize the demand across space and time, solve an integrated scheduling andlocation model, negotiate with unions and potential crews, and manage dynamically overtime so deployment is adjusted accordingly to changing system status. This planning andoperation problem is important to fire, police and EMS services. Inefficient solutions canmean poor performance, wasted money, and lost lives and property.
New technologies have been utilized in helping to improve systems status monitoringand readjustment. Digital-based CAD systems have been used to monitor unit availability,GPS technology has been utilized to track spatial distributions of available equipment,and new models have been developed to prescribe equipment repositioning. Advance-ments have also helped improve advanced planning using CAD data to characterizedemand by space and time as well as using GIS to map and analyze demand patterns,response times, and changing demographics. Finally, emphasis has also been placed indesigning new models that can be used to optimally deploy assets over time. Examplesof such models have been presented in this paper and applications suggest that improve-ments in both compliance and costs can be made.
Emergency services deployment planning is an important problem, involving a laborintensive and expensive service. Even though many improvements in the planning processhave been provided by the use of computer aided dispatch systems, status monitoring,Geographical Information Systems, GPS, and simulation and optimization models, thereexists a substantial need for deployment models with greater capabilities. These includethe development of truly integrated deployment planning models for simultaneous equip-ment scheduling and posting, better models of demand and travel time estimation, andbetter spatial simulation models for emergency services.
9. Acknowledgements
Some of this work was supported by a National Science Foundation Grant (DMI-9529706titled “Design and development for a decision support system for emergency services”).This grant was administered as a part of the Small Business Innovative Research GrantProgram at NSF. We wish to acknowledge this support and to acknowledge as wellthe input that we received in this work from many individuals from numerous cities
234 Fire Technology Third Quarter 2001
and ambulance companies throughout the US and Canada. We appreciate the sincereinterest and cooperation of Judd Palmer of EPI and Jim Jones from MAST. We wouldalso like to express our appreciation for helpful comments made during the reviewprocess.
References[1] K. Chelst, “A Public Safety Merger in Grosse Point Park, Michigan—A Short and Sweet
Study,” INTERFACES, vol. 18, 1988, pp. l–l1.[2] K.R. Chelst, “Quantitative Analysis of Police and Fire Mergers and a Study of a Medium
Sized City,” Final Report to the National Institute of Justice, 81-IJ-CX-0076.[3] A.J. Swersey, L. Goldring, and E.D. Geyer “Improving Fire Department Productivity—
Merging Fire and Emergency Medical Units in New-Haven,” INTERFACES, vol. 23, 1993,pp. 109–129.
[4] W.E. Walker, J.M. Chaiken, and E.J. Ignall, Fire Department Deployment Analysis: A PublicPolicy Analysis Case Study (The Rand Fire Project), New York, NY: North Holland, 1979.
[5] C. Toregas, R. Swain, C. ReVelle, and L. Bergman, “The Location of Emergency Services,”Operations Research, vol. 19, 1971, pp. 1363–1373.
[6] D.A. Schilling, C. ReVelle, J. Cohon, and J. Elzinga, “Some Models for Fire Pro-tection Location Services,” European Journal of Operational Research, vol. 5, 1980,pp. l–7.
[7] P. Kolesar, and E.H. Blum, “Square-root Laws for the Fire Engine Response Distances,”Management Science, vol. 19, 1973, pp. 1368–1378.
[8] D. Colner, and J.F. Gilsinn, “Fire Service Location-Allocation Models,” NBS Technical Note774, U.S. Department of Commerce, National Bureau of Standards, Washington, DC, 1973.
[9] J. Stout, “System Status Management: The Strategy of Ambulance Placement,” The Journalof Emergency Medical Services, May 1983.
[10] R.C. Larson, “A Hypercube Queuing Model for Facility Location and Redistricting in UrbanEmergency Services,” Computers and Operations Research, vol. 1, 1974, pp. 67–95.
[11] M. Daskin, “A Maximum Expected Covering Location Model: Formulation, Properties, andHeuristic Solution,” Transportation Science, vol. 17, 1983, pp. 48–70.
[12] V. Marianov, and C.S. ReVelle, “The Queueing Maximal Availability Location Problem: AModel for Siting Emergency Vehicles,” European Journal of Operational Research, vol. 93,1996, pp. 110–120.
[13] M.B. Mandell, “Covering Models for Two-tiered Emergency Medical Service Systems,”Location Science, vol. 6, 1998, pp. 355–368.
[14] F.C. Mendonca, and R. Morabito, “Analysing Emergency Medical Service AmbulanceDeployment on a Brazilian Highway Using the Hypercube Model,” Journal of the Oper-ational Research Society, vol. 52, 2001, pp. 261–270.
[15] C.C. Branas, E.J. MacKenzie, and C.S. ReVelle, “A Trauma Resource Allocation Model forAmbulances and Hospitals,” Health Services Research, vol. 35, 2000, pp. 489–507.
[16] D.J. Eaton, M.S. Daskin, D. Simmons, Bulloch, and G. Jansma, “Determining EmergencyMedical Service Deployment in Austin, Texas,” INTERFACES, vol. 15, 1985, pp. 96–108.
[17] A.J. Mason, D.M. Ryan, and D.M. Panton, “Integrated Simulation, Heuristic, and Optimiza-tion Approaches to Staff Scheduling,” Operations Research, vol. 46, 1998, pp. 161–175.
[18] R.G.J. Mills, and D.M. Panton, “Scheduling of Casino Security Officers,” OMEGA Interna-tional Journal of Management Science, vol. 20, no. 2, 1992, pp. 183–191.
[19] P.E. Taylor, and S.J. Huxley, “A Break from Tradition for the San Francisco Police: PatrolOfficer Scheduling Using an Optimization-based Decision Support System,” INTERFACES,vol. 19, 1989, pp. 4–24.


