Embed Size (px)
Citation preview

Map of Differential Transcript Expression in the Normal Large Intestine Lawrence C. LaPointe1,2,3,*, Robert Dunne2, Glenn S. Brown3, Daniel L. Worthley1, Peter L. Molloy3, David Wattchow4 and Graeme P. Young1 1Department of Medicine, Flinders University of South Australia, Adelaide, S.A. Australia. 2Preventative Health National Research Flagship, CSIRO Mathematical and Information Sciences, Sydney NSW, Australia. 3Preventative Health National Research Flagship, CSIRO Molecular and Health Technologies, Sydney NSW, Australia. 4Department of Surgery, Flinders University of South Australia, Adelaide, S.A. Australia. Running head: Gene expression map of the large intestine author for correspondence:
Lawrence LaPointe 4 Plymouth Crescent Kings Langley, NSW 2147 Australia [email protected] tel: (612) 9674 7797 fax: (612) 9475 1163
keywords: colorectal gene expression word count (excl. abstract & bibliography) : approx 5,300
Page 1 of 43Articles in PresS. Physiol Genomics (December 4, 2007). doi:10.1152/physiolgenomics.00185.2006
Copyright © 2007 by the American Physiological Society.

2 - LaPointe
Abstract
Background & Aims: While there is considerable research related to using differential
gene expression to predict disease phenotype classification, e.g. neoplastic tissue from
non-neoplastic controls, there is little understanding of the range of expression in normal
tissues. Understanding patterns of gene expression in non-neoplastic tissue, including
regional anatomic expression changes within an organ, is vital to understanding gene
expression changes in diseased tissue. Methods: To explore the gene expression change
along the proximal-distal axis of the large intestine, we analyzed microarray data in 184
normal human specimens using univariate and multivariate techniques. Results: We
found 219 probesets that were differentially expressed between the proximal and distal
colorectal regions and 115 probesets that were differentially expressed between the
terminal segments, i.e. the cecum and rectum. We did not observe any probesets that
were statistically different between any two contiguous colorectal segments. The
dominant expression pattern (65 probesets) follows a dichotomous expression pattern
consistent with the midgut-hindgut embryonic origins of the gut while a second pattern
(50 probesets) depicts a gradual change in transcript levels from the cecum to the rectum.
While the dichotomous pattern includes roughly equal numbers of probesets that are
elevated proximally and distally, nearly all probesets that show a gradual change
demonstrate increasing expression levels moving from proximal to distal segments.
Conclusions: These patterns describe an expression map of individual transcript
variation as well as multigene expression patterns along the large intestine. This is the
first gene expression map of an entire human organ.
Page 2 of 43
3 - LaPointe
INTRODUCTION
The advent of gene expression profiling has led to an improved understanding of
intestinal mucosa development. For example, the regulation of transcription factors
involved in producing and maintaining the radial-axis balance from the crypt base to the
lumen and those giving rise to epithelial cell differentiation are now better understood as
a result of microarray gene expression analysis. (43)(48) Similarly, understanding of the
developmentally programmed genetic events within the embryonic gut has improved,
especially those molecular control mechanisms responsible for regional epithelium
differences between the small intestine and colon. (17)(42) On the other hand, little is
known about the proximal-distal gene expression variation along the longitudinal axis of
the colorectum(6). Epidemiologic studies of colorectal adenocarcinoma suggest support
for variable incidence, histopathology, and prognosis between proximal and distal
tumors. (8)(9)(18)(19) Thus an understanding of location-specific variation could
provide valuable insight into those diseases that have characteristic distribution patterns
along the colorectum, including colorectal cancer (7) (12) (22)
The large intestine is often divided for clinical convenience into six anatomical regions
starting from the terminal region of the ileum: the cecum; the ascending colon; the
transverse colon; the descending colon; the sigmoid colon; and the rectum. Alternatively,
these segments may be grouped to divide the large intestine into a two region model
comprising the proximal and distal large intestine. The proximal ("right") region is
generally taken to include the cecum, ascending colon, and the transverse colon while the
Page 3 of 43

4 - LaPointe
distal ("left") region includes the splenic flexure, the descending colon, the sigmoid colon
and the rectum. This division is supported by the distinct embryonic ontogenesis of these
regions whose junction is two thirds along the transverse colon and also by the distinct
arterial supply to each region. While the proximal large intestine develops from the
embryonic midgut and is supplied by the superior mesenteric artery, the distal large
intestine forms from the embryonic hindgut and is supplied by the inferior mesenteric
artery(3). A comprehensive of review of proximal/distal differences are provided in (29).
The longitudinal nature of the large intestine along the proximal-distal axis provides a
relatively unique opportunity for constructing a whole organ map of gene expression.
Previous research suggests that there is a clear distinction between the gene expression
patterns of proximal colonic tissues and distal colorectal tissues. (25) (7)(33) While these
findings support a broad model of gene expression difference, there have been no studies
to explore the detailed nature of expression gradients of such genes. Given the
interesting embryology related to the midgut and hindgut junction near the splenic flexure
during embryogenesis, the question is raised: Do differentially-expressed genes exhibit
an abrupt expression schism between the midgut and hindgut derived tissues or does
expression follow a gentle gradient along the proximal-distal axis?
To explore this question, this work investigates the gene expression patterns observed
along the proximal-distal axis of the large intestine. We have built expression profile
'maps' that identify individual genes whose expression appears to be location dependent
and we have described the nature of multigene expression variance longitudinally along
Page 4 of 43

5 - LaPointe
the colon. We apply linear models to these maps to compare the embryology-consistent
proximal vs. distal two-region model with a more gradual model based on continuously
variable expression between the cecum proximally and rectum distally. Such gene
expression maps of the normal adult colon will provide a foundation for improved
understanding of gene expression variation in both the normal and diseased state.
Page 5 of 43

6 - LaPointe
MATERIALS & METHODS
GENE EXPRESSION DATA The data for this study are oligonucleotide microarrays hybridized to labeled cRNA
synthesized from poly-A mRNA transcripts isolated from colorectal tissue specimens.
'Discovery' data set
Gene expression and clinical descriptions for 184 colorectal tissue specimens were
purchased from GeneLogic Inc. (Gaithersburg, MD, USA). Individual tissue microarray
data were selected with the following characteristics: non-neoplastic colorectal mucosa
(confirmed by histology) from otherwise healthy tissue specimen (i.e. no evidence of
inflammation or other disease at specimen site) with an anatomically-identifiable site of
resection designated as one of: cecum, ascending colon, descending colon, sigmoid
colon, or rectum.
For each tissue selected from the GeneLogic database, we received electronic files of raw
data containing a total of 44,928 probesets (Affymetrix HGU133A and HGU133B,
combined), experimental and clinical descriptors for each tissue, and digitally archived
microscopy images of the histology preparations. Each data record was manually
assessed for clinical consistency and a sample of records was randomly chosen for
histopathology audit using digitally archived histology images. A quality control analysis
was performed to identify and remove arrays not meeting essential quality control
measures as defined by the manufacturer (1) (50).
Page 6 of 43

7 - LaPointe
Gene expression levels were calculated by both Microarray Suite (MAS) 5.0
(Affymetrix) and the Robust Multichip Average (RMA) normalization techniques (1)
(28) (30). MAS normalized data was used for performing standard quality control
routines and the final data set was normalized with RMA for all subsequent analyses. A
list of GeneLogic sample ID's for the commercial microarray data used in this study is
included as supplemental material.
'Validation' Data Set
The colorectal specimens in the 'validation' set were collected from a tertiary referral
hospital tissue bank in metropolitan Adelaide, Australia (Repatriation General Hospital
and Flinders Medical Centre). The tissue bank and this project were approved by the
Research and Ethics Committee of the Repatriation General Hospital and patient consent
was received for each tissue studied. Following surgical resection, specimens were
placed in a sterile receptacle and collected from theatre. The time from operative
resection to collection from theatre was variable but not more than 30 minutes. Samples,
approximately 125mm3 (5x5x5mm) in size, were taken from the macroscopically normal
tissue as far from pathology as possible, defined both by colonic region as well as by
distance either proximal or distal to the pathology. Tissues were placed in cryovials, then
immediately immersed in liquid nitrogen and stored at -150°C until processing.
Frozen samples were processed by the authors using standard protocols and
commercially available kits. Briefly, frozen tissues were homogenized using a carbide
bead mill (Mixer Mill MM 300, Qiagen, Melbourne, Australia) in the presence of chilled
Page 7 of 43

8 - LaPointe
Promega SV RNA Lysis Buffer (Promega, Sydney, Australia) to neutralize RNase
activity. Homogenized tissue lysates for each tissue were aliquoted to convenient
volumes and stored -80°C. Total RNA was extracted from tissue lysates using the
Promega SV Total RNA system according to manufacturer’s instructions and integrity
was assessed visually by gel electrophoresis.
To measure relative expression of mRNA transcripts, tissue RNA samples were analyzed
using Affymetrix HG U133 Plus 2.0 GeneChips (Affymetrix, Santa Clara, CA USA)
according to the manufacturer’s protocols (2). Biotin labeled cRNA was prepared using
5µg (1.0 µg/µL) total RNA (approx. 1 µg mRNA) with the “One-Cycle cDNA” kit
(incorporating a T7-oligo(dT) primer) and the GeneChip IVT labeling kit. In vitro
transcribed cRNA was fragmented (20 µg) and analyzed for quality control purposes by
spectrophotometry and gel electrophoresis prior to hybridization. Finally, an
hybridization cocktail was prepared with 15µg of cRNA (0.5 µg/µL) and hybridized to
HG U133 Plus 2.0 microarrays for 16h at 45˚C in an Affymetrix Hybridization Chamber
640. Each cRNA sample was spiked with standard prokaryotic hybridization controls for
quality monitoring.
Hybridized microarrays were stained with streptavidin phycoerytherin and washed with a
solution containing biotinylated anti-streptavidin antibodies using the Affymetrix Fluidics
Station 450. Finally, the stained and washed microarrays were scanned with the
Affymetrix Scanner 3000.
Page 8 of 43

9 - LaPointe
The Affymetrix software package was used to transform raw microarray image files to
digitized format. As for the Discovery set above, gene expression levels for the
validation data set were calculated using MAS 5.0 (Affymetrix) for quality control
purposes and with the RMA normalization algorithm for expression data. Finally, the
data for the 19 microarrays used for validation in this publication have been deposited in
NCBI's Gene Expression Omnibus (GEO, http://www.ncbi.nlm.nih.gov/geo/) and are
accessible through GEO Series accession number GSE9254.
STATISTICAL ANALYSIS
For all statistical analysis, we used open source software available from BioConductor
for the R statistics environment (BioConductor, www.bioconductor.org) (23) (24).
Gene expression gradients were analyzed using three analytical techniques. First, we
compared the gene expression variation of individual genes along the colon using
univariate tests. Next, we further explored those particular genes exhibiting statistically
significant expression differences with linear models to compare dichotomous (proximal
vs. distal) expression change with a gradual (multi-segment) model of change. Finally,
we applied multivariate techniques to understand subtle genome-wide expression
variance along the proximal-distal axis.
Page 9 of 43

10 - LaPointe
INDIVIDUAL GENE EXPRESSION MAPS
Univariate differential expression
Differentially expressed gene transcripts between the proximal and distal colon were
identified using a moderated t-test implemented in the 'limma' Bioconductor library (47).
Significance estimates (p-values) were corrected to adjust for multiple hypothesis testing
using the conservative Bonferroni correction. The subset of tissues limited to the cecum
vs. the rectum were similarly tested.
Gene transcripts identified to be differentially expressed were also evaluated in the
'Validation' specimens on a probeset-by-probeset basis using modified t-tests. To assess
the significance of the total number of differential probesets that were likewise
differential in the validation data, the number of 'validated' probesets were compared to a
null distribution estimated using a Monte Carlo simulation.
Multi-segment colon vs. two-segment colon model comparison
To evaluate the nature of inter-segment gene expression variation we analyzed
differentially expressed probesets for relative fit to linear models in a multi-segment vs. a
two segment framework. The goal of this analysis is to explore whether the inter-
segment expression of probesets that are known to be differentially expressed between
the terminal ends of the large intestine are better modeled by a five-segment linear model
that approximates a continual gradation or by a simpler, dichotomous 'proximal' vs.
'distal' gradient. As our data are only identified by colorectal segment designation and
Page 10 of 43

11 - LaPointe
not by a continuous measurement along the length of the colon, we approximate the
continuous model using the tissue segment location. We chose probesets that are
differentially expressed between the most terminal segments (cecum and rectum) in order
to maximize the likelihood of identifying transcripts that vary along the proximal-distal
axis of the colon.
We first modeled the expression of these probesets along the proximal-distal axis of the
colon using a five factor robust linear model according to an indicator matrix defined by
the colorectal segment for each tissue. For this model each tissue was assigned by biopsy
location to one of: cecum, ascending, descending, sigmoid, or rectum. (For reasons
described below, transverse tissues were not included in this analysis.) This five segment
model was then compared to a two-factor robust linear model with a design matrix
corresponding to the theoretical proximal and distal regions of the colon. The same data
were used for both model comparisons, however for the two segment model, the first
factor (corresponding to the proximal tissues) included all of the tissues from the cecum
and ascending colon while the second factor (corresponding to the distal colon) included
all tissues from the descending, sigmoid and rectum segments.
When comparing these distinct models for each probeset, we used an F-test to evaluate
the alternative hypothesis that the improved fit (reduced regression residual) provided by
the more complex five-segment model was significantly better than the simpler two
segment model. A non-significant residual reduction indicates a failure to reject the null-
Page 11 of 43

12 - LaPointe
hypothesis: that there is no inherent value to adopting a more complex five segment
model over the simpler alternative.
MULTIVARIATE GENE EXPRESSION PATTERN MAPPING
Supervised principal components analysis
To visualize and explore the structure of expression variability at an organ level, we
applied principal component analysis (PCA) and Supervised PCA. (4). All software for
implementing supervised PCA was developed by us and are available on request. The
algorithms for supervised PCA is coded in R.
Page 12 of 43

13 - LaPointe
RESULTS
GENE EXPRESSION DATA COLLECTION
To explore variation of human gene expression along the non-neoplastic colon, we used
gene expression data collected using the Affymetrix (Santa Clara, CA USA) GeneChip®
oligonucleotide microarray system described in (36). The data are two independent
Affymetrix (Santa Clara, CA USA) Human Genome 133 GeneChip data sets: a large
commercial microarray database of HGU-133 A&B chip data for 'discovery', and a
smaller HGU-133 Plus 2.0 microarray data set generated by us for 'validation'.
The larger data set was analyzed to identify gene expression patterns and the
independently derived second expression set was used to validate these patterns. Thus,
the first data set was mined for hypothesis generation while the second set was used for
hypothesis testing.
Discovery and Validation Data Sets
To construct the discovery set, 184 GeneChips hybridized to cRNA from non-diseased
tissues meeting inclusion and quality assurance criteria were used for hypothesis
generation. The tissues comprised segment subsets as follows: 29 cecum, 45 ascending,
13 descending, 54 sigmoid, and 43 rectum. For each tissue, 44,928 probe sets were
background corrected and normalized using RMA pre-processing. The theoretical
juncture between the proximal and distal colon is approximately two-thirds the length of
the transverse colon measured from the hepatic flexure (3). As sample data were not
Page 13 of 43

14 - LaPointe
specific for distance along the transverse colon, these tissues were excluded from the
discovery analysis.
To construct the ‘validation’ data set, 19 HG U133 Plus2.0 GeneChips were hybridized
to labeled cRNA prepared from 8 proximal tissue specimens and 11 distal specimens
from the hospital tissue bank. Due to stringent quality control parameters for tissue and
GeneChip acceptability, this validation data set did not include sufficient tissues to
explore multiple segment models. Each microarray measured transcript expression for
54,675 probe sets.
GENE VARIATION ALONG THE COLON
INDIVIDUAL GENE EXPRESSION CHANGES
Univariate differential expression
To explore the 'natural' dividing point between the anatomical segments of the colon, we
measured the absolute number of significant probeset expression differences by modified
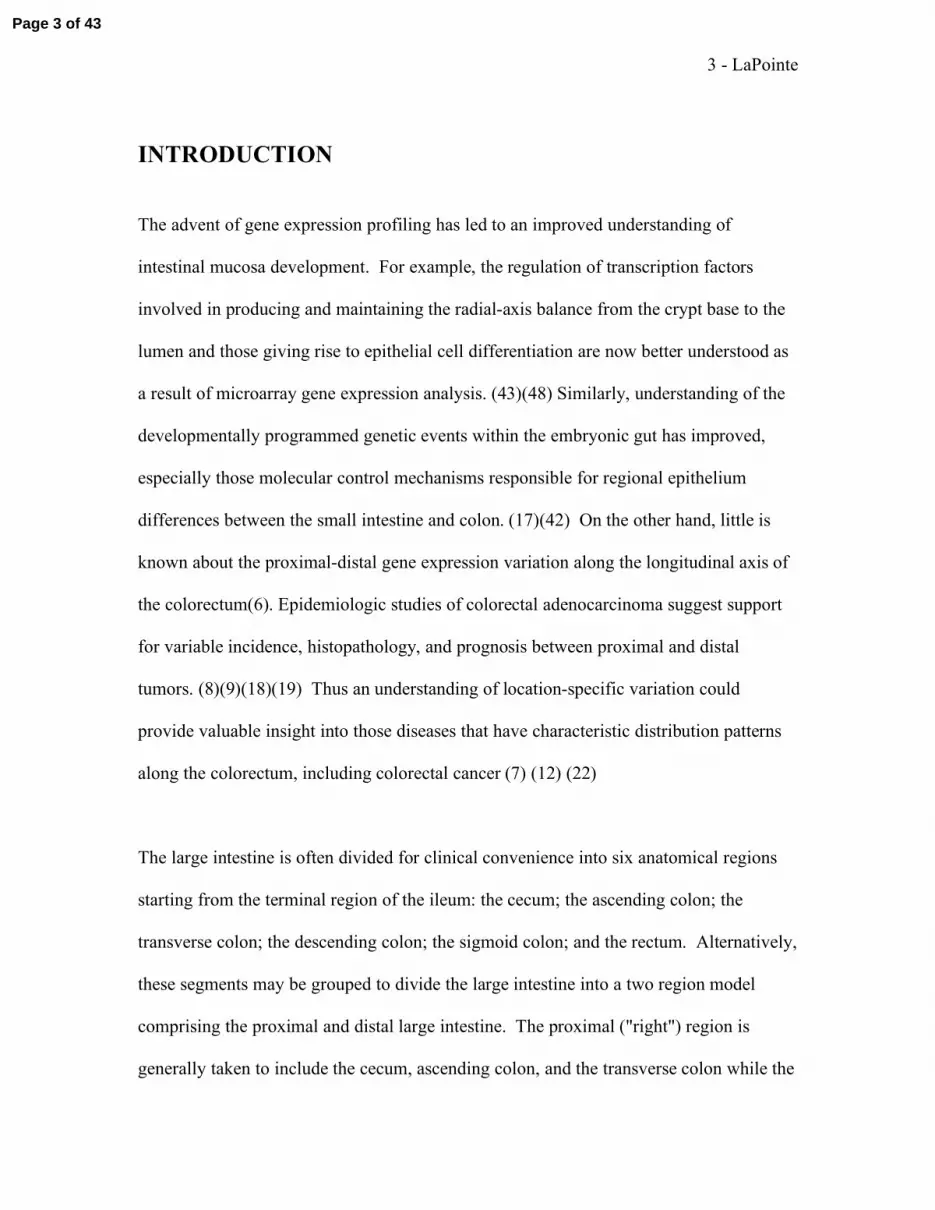
t test when the hypothetical 'divide' was moved stepwise from cecum to rectum. Figure 1
shows the number of probesets that were differentially expressed for each inter-segment
divide. The maximum number of probeset differences, 206, occurs when the proximal
and distal regions are divided between the ascending and descending segments. As this
dividing point is consistent with both our understanding of embryonic development and
the usual separation of the proximal and distal segments, the following comparison of
proximal and distal tissues were based on this division.
Page 14 of 43
15 - LaPointe
A total of 206 probesets, corresponding to approximately 154 known gene targets, were
differentially expressed higher in the proximal or distal colorectal samples compared to
the complementary region (Bonferroni corrected p<0.05). Of these 206 probesets, 31
(16.5 %) were also differentially expressed in the validation data with a significant
difference (31/206, p << 10-5 by Monte Carlo estimation).
To further explore differential expression in the discovery set, we identified those
transcripts that were different between the most terminal ends of the large bowel. A total
of 115 probesets were differentially expressed between tissues selected only from the
cecum (n=29) and the rectum (n=43). 102 (89%) of these probesets were included in the
206 probesets differing between proximal and distal colon described above. In this
subset, 28 probesets (24.3 %) were likewise differentially expressed in the rectum vs. the
cecum in the validation data (28/115, p<<10-5 by Monte Carlo estimation). All 28 of
these consistent probesets were included in the 31 consistent probesets between the distal
and proximal regions.
Differentially expressed probesets and difference statistics for probesets with elevated
expression in proximal (94) and distal (126) tissues are shown in Tables 1 and 2,
respectively.
Page 15 of 43

16 - LaPointe
Multi-segment gene expression models
An analysis for differential expression was also made for all five inter-segment
transitions in order from the cecum to the rectum (i.e. cecum vs. ascending, ascending vs.
descending, etc.). No transcript was statistically differentially expressed between any
two adjoining segments (moderated t-test; p < 0.05).
To explore the nature of these gene transcript expression changes, we built and compared
robust linear models fitted to the expression data based on location for each tissue
sample. Two robust linear models of univariate probeset expression were compared for
each of the 115 probesets differentially expressed between the two terminal segments of
the large intestine, the cecum and rectum. In particular, we queried whether the
expression of those transcripts that were differentially expressed between these terminal
segments were better explained (in terms of residual fit) by a simple two-segment model
or by the more descriptive five-segment model.
Of the 115 differentially expressed probesets, the analysis failed to reject the null
hypothesis that a complex model does not significantly improve model fit to the observed
gene expression data for 65 (57%) of cases (F-test, p > 0.05). Thus, more than half of
these differentially expressed transcripts along the colon are satisfactorily modeled by the
two segment expression model whereby expression is dichotomous and defined by either
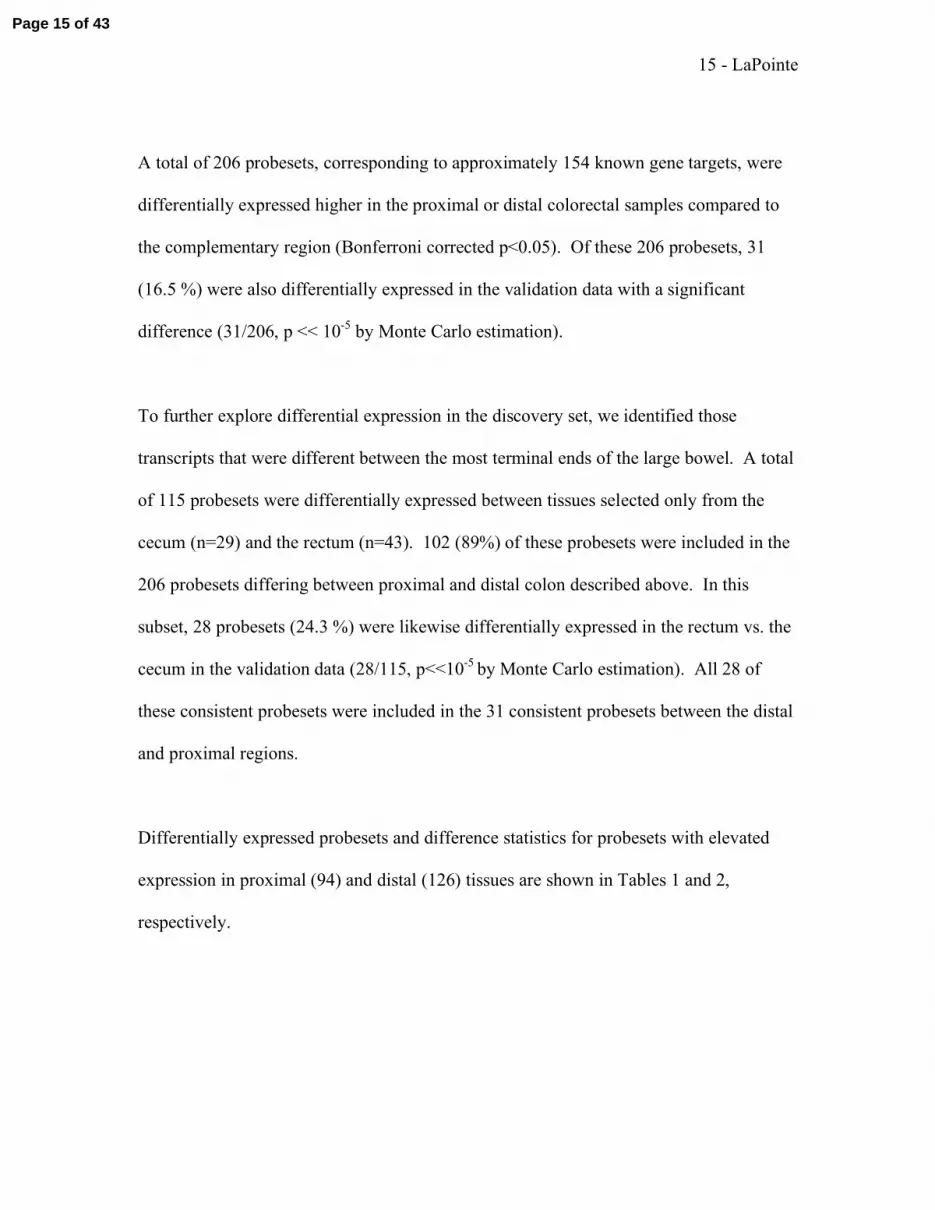
proximal vs. distal location. The most differentially expressed probeset between the
cecum and rectum is the transcript for PRAC. A comparison of the two-segment and
Page 16 of 43

17 - LaPointe
multi-segment models for this transcript are shown in Figure 2, which is typical of other
genes in this category (data not shown.)
For the remaining 50 (43%) probesets, the null hypothesis was rejected (p<0.05) which
suggested that a five factor model dependent on segment location in fact improves the
predictive effectiveness of such transcripts' expression along the proximal-distal axis in a
significant manner. Inspection of these models confirms that most probeset levels are
monotonic-increasing or monotonic-decreasing in tissues progressing along the large
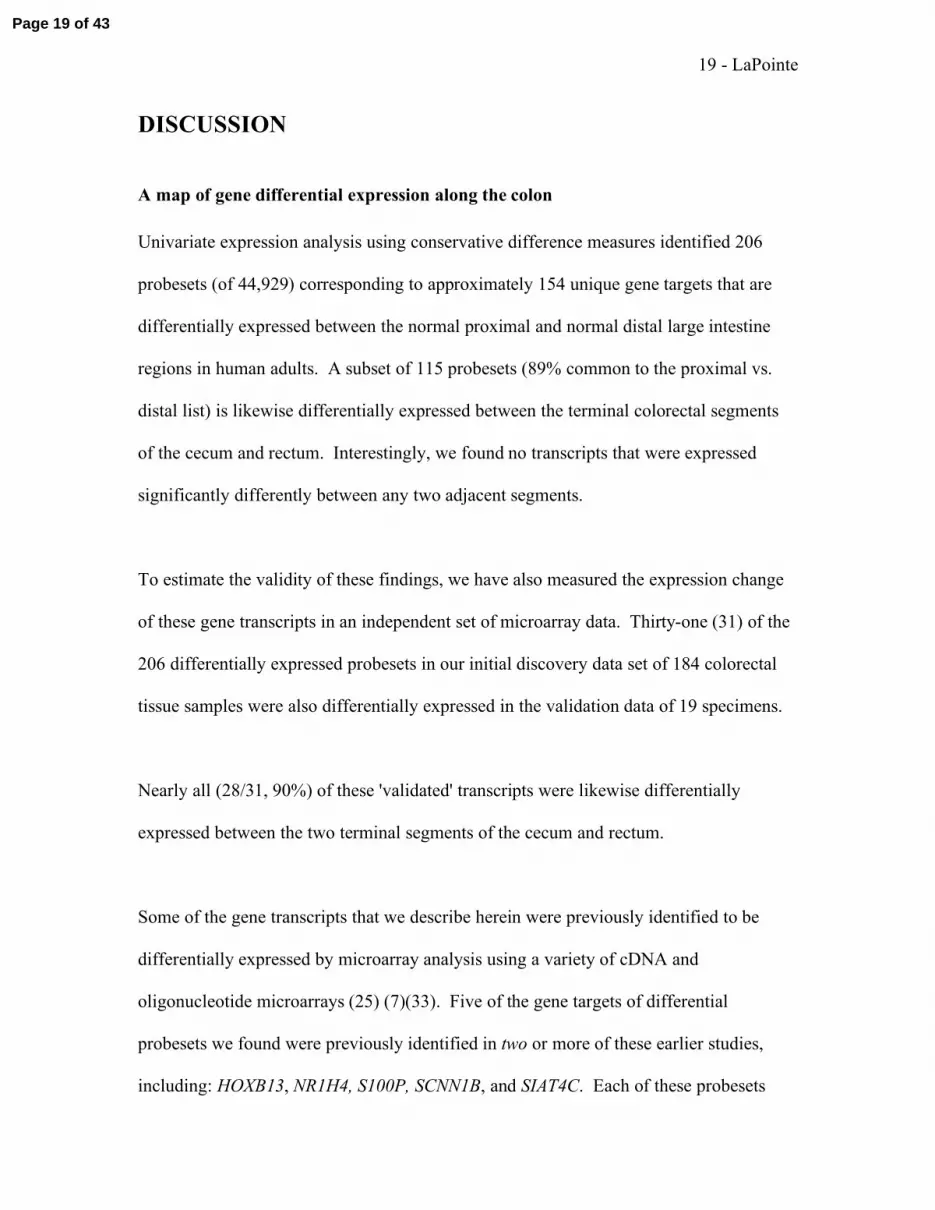
intestine. 41 (82%) of the 50 multi-segment models showed a gradual transcript level
increase across the colon while only 9 models (18%) indicate a gradual decrease from
proximal to distal expression. The model for homeobox gene B13 (HOXB13) is
significantly improved with the five segment model compared to the two segment model
as illustrated in Figure 3.
PATTERNS OF GENE EXPRESSION ALONG THE COLON
In addition to analyses of individual gene changes along the colon, we used multivariate
analytical techniques to explore patterns of gene changes along the proximal-distal axis.
Principal Components Analysis (PCA) and Supervised PCA
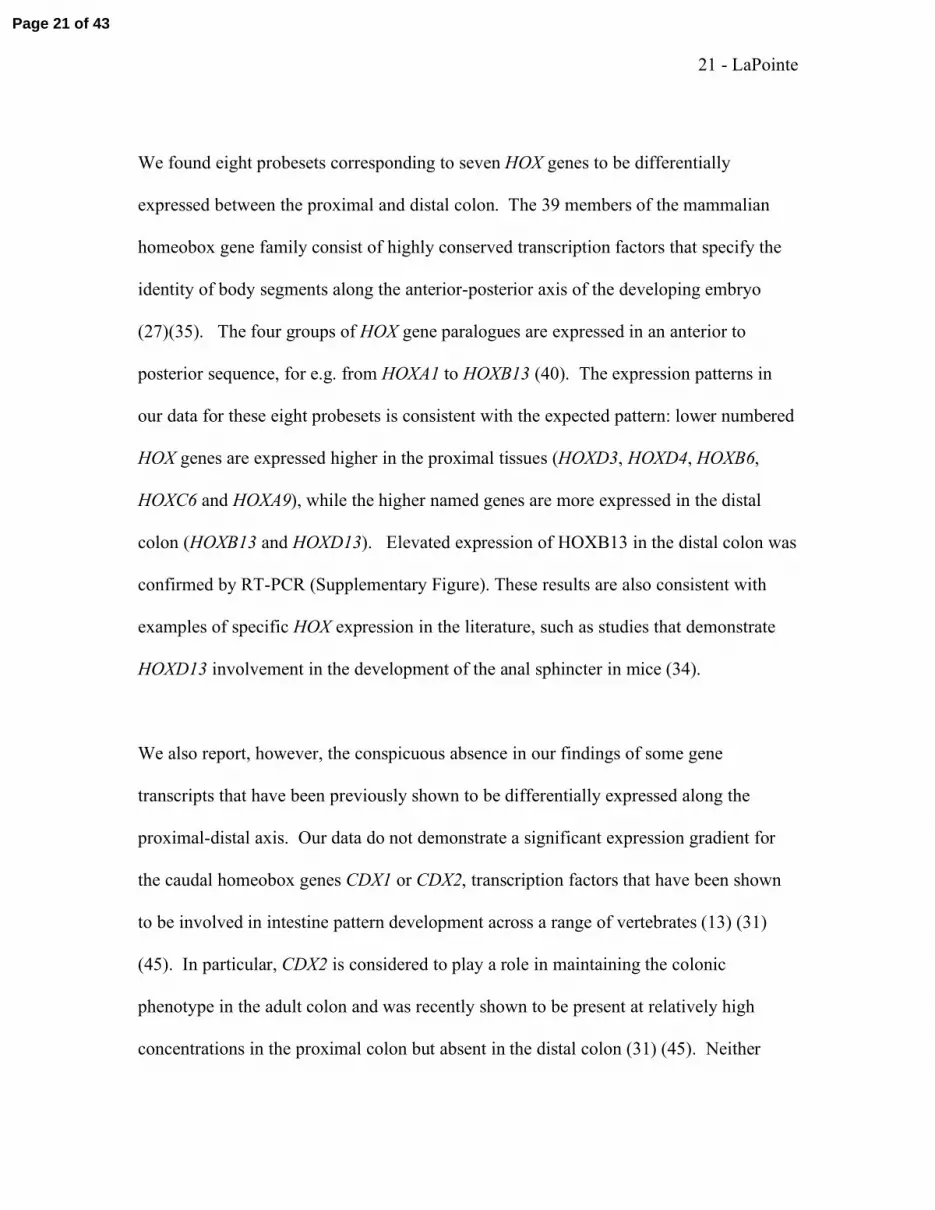
We analyzed the full 44,928 probesets of the 'Discovery' data set using PCA. The first
two dimensions of this analysis are shown in Figure 4A. Inspection of this low
dimension perspective yields no obvious structure within the data that are consistent with
Page 17 of 43

18 - LaPointe
tissue segment. This analysis suggests that the major sources of gene expression
variation (i.e. the first two principal components) measured across all genes is not
dependent on tissue location.
We also applied a supervised PCA to the data. Supervised PCA is similar to traditional
principal components analysis but uses only a subset of the features/genes (usually
selected by some univariate means) to derive the principal components. We used the set
of genes differentially expressed between the cecum and rectum as described above. For
this analysis, a reduced data matrix of all 184 normal tissues was constructed with just the
top 115 probesets differentially expressed between the cecum and rectum. PCA was then
performed using this feature specific data and the 184 tissues were again visualized along
just the first two principal components, shown in Figure 4B. Inspection of Figure 4B
indicates that there are two broad populations within these tissues corresponding
approximately to the proximal vs. distal divide. By reducing the dimensionality of this
projection to just a single first component as shown in Figures 5A and 5B, the proximal
vs. distal relationship became clear. There is strong overlap between the sigmoid colon
and rectum segments distally and between the segments of cecum and ascending colon
proximally.
Page 18 of 43
19 - LaPointe
DISCUSSION
A map of gene differential expression along the colon
Univariate expression analysis using conservative difference measures identified 206
probesets (of 44,929) corresponding to approximately 154 unique gene targets that are
differentially expressed between the normal proximal and normal distal large intestine
regions in human adults. A subset of 115 probesets (89% common to the proximal vs.
distal list) is likewise differentially expressed between the terminal colorectal segments
of the cecum and rectum. Interestingly, we found no transcripts that were expressed
significantly differently between any two adjacent segments.
To estimate the validity of these findings, we have also measured the expression change
of these gene transcripts in an independent set of microarray data. Thirty-one (31) of the
206 differentially expressed probesets in our initial discovery data set of 184 colorectal
tissue samples were also differentially expressed in the validation data of 19 specimens.
Nearly all (28/31, 90%) of these 'validated' transcripts were likewise differentially
expressed between the two terminal segments of the cecum and rectum.
Some of the gene transcripts that we describe herein were previously identified to be
differentially expressed by microarray analysis using a variety of cDNA and
oligonucleotide microarrays (25) (7)(33). Five of the gene targets of differential
probesets we found were previously identified in two or more of these earlier studies,
including: HOXB13, NR1H4, S100P, SCNN1B, and SIAT4C. Each of these probesets
Page 19 of 43

20 - LaPointe
were also shown to be statistically different, or nearly so (i.e. HOXB13, SIAT4C: p <
0.065), in our validation data set. An additional 33 probeset target genes of the 206
probesets we present here were previously identified to be differentially expressed along
the colon in at least one of these earlier studies.
We identified an additional 28 probesets that were differential in both our discovery data
and our independent validation data but were not reported in the previous reports. In
total, 57 of 154 (37%) gene targets corresponding to the 206 probesets were confirmed to
be differentially expressed between the proximal and distal from the validation set. The
agreement of our work with earlier studies and with the independent validation set adds
credibility to the results, especially given the potential for concern about microarray
reproducibility between and within data collection platforms.(39). Our analysis has also
identified 28 new probesets of relevance to mapping.
Differential transcript expression for individual genes
The most significantly differential probeset we observed in our discovery data was
against the gene transcript for PRAC, previously described as specifically expressed in
prostate, the distal colon and rectum (37). Our data agree with the earlier findings that
the probeset for PRAC is highly expressed in the distal colon relative to the proximal
tissues. This observation was confirmed by RT-PCR (Supplementary Fig), where
essentially no expression was seen in proximal tissues. Further, PRAC appears to be
expressed in a low-high pattern along the colon with a sharp expression change occurring
between the ascending and descending colorectal specimens.
Page 20 of 43
21 - LaPointe
We found eight probesets corresponding to seven HOX genes to be differentially
expressed between the proximal and distal colon. The 39 members of the mammalian
homeobox gene family consist of highly conserved transcription factors that specify the
identity of body segments along the anterior-posterior axis of the developing embryo
(27)(35). The four groups of HOX gene paralogues are expressed in an anterior to
posterior sequence, for e.g. from HOXA1 to HOXB13 (40). The expression patterns in
our data for these eight probesets is consistent with the expected pattern: lower numbered
HOX genes are expressed higher in the proximal tissues (HOXD3, HOXD4, HOXB6,
HOXC6 and HOXA9), while the higher named genes are more expressed in the distal
colon (HOXB13 and HOXD13). Elevated expression of HOXB13 in the distal colon was
confirmed by RT-PCR (Supplementary Figure). These results are also consistent with
examples of specific HOX expression in the literature, such as studies that demonstrate
HOXD13 involvement in the development of the anal sphincter in mice (34).
We also report, however, the conspicuous absence in our findings of some gene
transcripts that have been previously shown to be differentially expressed along the
proximal-distal axis. Our data do not demonstrate a significant expression gradient for
the caudal homeobox genes CDX1 or CDX2, transcription factors that have been shown
to be involved in intestine pattern development across a range of vertebrates (13) (31)
(45). In particular, CDX2 is considered to play a role in maintaining the colonic
phenotype in the adult colon and was recently shown to be present at relatively high
concentrations in the proximal colon but absent in the distal colon (31) (45). Neither
Page 21 of 43

22 - LaPointe
statistical analysis nor visual inspection of probeset expression for this gene suggest
differential expression along the colon in our data (data not shown). Analysis by RT-PCR
of a subset of RNA samples from the validation set supported the array data in that
expression of CDX2 in the distal colon was equivalent to or greater than in proximal
samples (Supp FigX).
We observed significant differential transcript expression for a number of the solute-
carrier transport genes that can be rationalized based on our current understanding of
colorectal physiology. While probeset expression for SLC2A10, SLC13A2, and SLC28A2
are higher in the distal colon, the solute carrier family members SLC9A3, SLC14A2,
SLC16A1, SLC20A1, SCL23A3, and SLC37A2 are higher in the proximal tissues. These
data support the findings of Glebov et al., including for the Na-dependent dicarboxylic
acid transporter member 2 (SLC13A2) which is expressed higher distally and for the
monocarboxylic acid transporter family member 1 (SLC16A1, alias MCT1) which is
higher in the proximal tissues. This expression of SLC16A1/MCT1 is consistent with
evidence that the short chain fatty acid butyrate, which is most abundant in the proximal
gut (38), may regulate SLC16A1/MCT1 expression by both transcriptional control and by
transcript stabilization. (16)
Our results show that probesets against all three of the five members of the chromosome
7q22 cluster of membrane-bound mucins previously believed to be expressed in colon,
MUC11, MUC12 and MUC17, are differentially expressed at higher levels in the distal
gut (10)(49)(26). We also confirmed this differential expression pattern for MUC12 and
Page 22 of 43

23 - LaPointe
MUC17 in the independent validation data. Previous reports have raised the question
about whether the genomic sequences for MUC11 and MUC12 are from closely related
or perhaps even the same gene. (10) Correlation analysis of MUC11 and MUC12
probesets show a strong, positive correlation at the lower end of the probeset expression
range with a weaker correlation as expression increases (data not shown). This
correlation profile could be due to increased variability at higher expression levels or,
possibly, because the expression levels in the distal colon (where they are higher) reflect
a distinct transcriptional control. Differences in mucin glycoprotein characteristics
between the proximal and distal gut, including the degree of sulfation, were demonstrated
thirty years ago(20)(5).
In addition, while previous research has suggested that the secreted, gel-forming mucin
MUC5B is only weakly expressed in the colon(10), our results show that probesets
reactive to this transcript are expressed higher in the distal colon as for the membrane-
bound mucins. Our data also support earlier reports that transcripts for the estrogen
responsive element known as trefoil factor 1 (TFF1, alias: pS2) is differentially expressed
higher in the distal colon(46).
Many of the expression patterns we report here for humans have been shown to be
similarly patterned in the gastrointestinal tracts of rodent models. However, a number of
specific genes previously shown to be differentially expressed along the large intestines
of mice and rats were not found to be so expressed by us. Such gene transcript
targets,include solute carrier family 4 member 1 (alias AE1) (44), and toll-like receptor 4
Page 23 of 43

24 - LaPointe
(41). For TLR4 no significant difference in expression between proximal and distal
human samples was seen by RT-PCR in agreement with the microarray data ()Supp fig).
Using a commercially available RT-PCR assay we were unable to detect SLC4A1 mRNA
in any of our validation set. include, carbonic anhydrase IV (21). On the other hand, our
data are in agreement with earlier studies of expression of aquaporin-8 (AQP8), a gene
whose expression product is suspected to be involved in water absorption in the normal
rat colon (11). We observe that AQP8 is significantly expressed to a higher level in the
proximal human colon compared to the distal tissues (p<0.006, data not shown.)
The family of claudin tight junction proteins may also play a role in maintaining the
water barrier integrity in the colon (32). We found claudin-8 (CLDN8) is more highly
expressed in the distal colorectal tissues and this observation was supported by RT-PCR
analysis (Supp Fig ). Conversely, claudin-15 (CLDN15), which is also believed to be
localized in the tight junction fibrils was expressed at a higher level in the proximal
colorectal tissues (15).
The nature of gene expression change along the colon
While one goal of this work was to understand which gene transcripts are differentially
expressed along the colon, a second aim was to explore the nature of these expression
changes along the proximal-distal axis in region or segment-specific detail.
We observed two broad patterns of statistically significant transcript expression change
along the colorectum. The major pattern is described by those 65 probesets that were
Page 24 of 43

25 - LaPointe
well fitted by a two-segment expression model. We suggest that the expression of these
transcripts is dichotomous in nature – elevated in the proximal segments and decreased in
distal segments, or vice-versa.
Such data are consistent with the conventional anatomical view that the 'natural' divide
between the proximal and distal colon occurs between the ascending and descending
colon. This finding is contrary to a recent report by Komuro et al. that a breakpoint
between the descending and sigmoid colon yields the largest differential expression(33).
However, we note that in addition to analysing this pattern in colorectal cancer specimens
(we used non-diseased tissues only), Komuro et al. also chose to include the transverse
colon in their analysis. We intentionally exclude tissues from that segment to avoid the
possible confounding affect related to the predicted midgut-hindgut junction point
approximately two-thirds the length of the transverse colon.
A second set of 50 probesets do not display a dichotomous change, but rather show a
significant improvement in fit by applying the expression data to a five-segment model
supporting a more gradual expression gradient moving along the colon from the cecum to
the rectum.
These two characteristic expression patterns hint that gene expression along the
proximal-distal axis is perhaps coordinated by two underlying systems of organization.
Page 25 of 43

26 - LaPointe
The majority of differentially expressed transcripts in the adult normal tissues measured
here are expressed in a pattern that is consistent with a midgut vs. hindgut pattern of
embryonic development. Further, multivariate methods including supervised PCA and
canonical variate analysis (data not shown) also suggest that the primary source of
variation among these data are explained by the proximal vs. distal divide. In a recent
study Glebov et al. found that the number of genes differentially expressed between the
ascending and descending colon in the adult is substantially larger than the number of
genes likewise identified in 17-24 week old fetal colons. Glebov et al. hypothesize that
the gene expression pattern of the adult colon is possibly set concurrently with expression
of the adult colonic phenotype at ~30 weeks gestation or perhaps even in response to
post-natal luminal contents of the gastrointestinal tract. While we did not explore gene
expression in the fetal colon, we observe patterns of expression in the adult that support a
proximal-distal expression model consistent with the midgut-hindgut embryonic origins.
Most (41 of 50) of those transcripts that exhibit a gradual expression change between the
cecum and rectum exhibit a prototypical pattern of increased expression increasing from
the cecum to the rectum. This pattern is not observed in the midgut-hindgut differential
transcripts where the number of transcripts elevated proximally is approximately equal to
the number elevated in the distal region. We propose that the characteristic distally
increasing pattern in those transcripts could be a function of extrinsic factors in
comparison to the intrinsically defined midgut-hindgut pattern. Such factors could
include the effect of luminal contents that move in a unidirectional manner from the
cecum to the rectum and/or the regional changes in microflora along the large intestine.
Page 26 of 43

27 - LaPointe
Further work will be required to investigate whether such extrinsic controls are working
in a positive manner of inducing transcriptional activity or through a reduced
transcriptional silencing.
Gene expression changes in concert along the colon
To explore the expression of genes in concert along the colon, we also apply principal
component analysis to these expression data. There is strong evidence for a proximal
versus distal gene expression pattern with these multivariate visualization techniques.
Though multivariate results do not exclude a subtle proximal-distal gradient, the apparent
bimodal nature of the multivariate plots suggests that the major source of expression
variation in these tissues is consistent with a midgut- vs. hindgut-derived pattern.
Page 27 of 43

28 - LaPointe
Conclusions
Our work indicates that transcript abundance, and perhaps transcriptional regulation,
follows two broad patterns along the proximal-distal axis of the large intestine. The
dominant pattern is a dichotomous expression pattern consistent with the midgut-hindgut
embryonic origins of the proximal and distal gut. Transcripts that follow this pattern are
roughly equally split into those that are elevated distally and those elevated proximally.
The second pattern we observe is characterised by a gradual change in transcript levels
from the cecum to the rectum, nearly all of which exhibit increasing expression toward
the distal tissues. We propose that tissues that exhibit the dichotomous midgut-hindgut
patterns are likely to reflect the intrinsic embryonic origins of the large intestine while
those that exhibit a gradual change reflect extrinsic factors such as luminal flow and
microflora changes. Taken together, these patterns constitute a gene expression map of
the large intestine. This is the first such map of an entire human organ.
Page 28 of 43
29 - LaPointe
Acknowledgements
We thank Glenn Brown and Thu Ho for assistance with tissue RNA extraction and
microarray analysis. We also thank Glenn Stone for statistical advice related to model
comparisons. We are grateful to David Mitchell, Trevor Lockett, and Howard Chandler
for reading earlier versions of this manuscript and for providing helpful comments.
Lawrence LaPointe is grateful for financial support from an Enterix Research Scholarship
from Enterix Pty Ltd.
Page 29 of 43

30 - LaPointe
REFERENCES 1. Affymetrix, GeneChip Expression Analysis Data Analysis Fundamentals. Santa
Clara, CA USA: Affymetrix Inc, 2001
2. Affymetrix, Gene Expression Analysis: Technical Manual. Santa Clara, CA:
Affymetrix Inc, 2004
3. Babyatsky, M. W., and Podolsky, D. K. Growth and Development of the
Gastrointestinal Tract. In: Textbook of Gastroenterology, 4th Ed, edited by Yamada,
T., Alpers, D. H., Kaplowitz, N., Laine, L., Owyang, C., and Powell, D. W.
Philadelphia: Lippincott Williams & Wilkins, 2003, 521-556.
4. Bair, E., T. Hastie, P. Debashis, and R. Tibshirani. Prediction by supervised
principal components. Stanford University 2004.
5. Bara, J., J. Nardelli, C. Gadenne, M. Prade, and P. Burtin. Differences in the
expression of mucus-associated antigens between proximal and distal human colon
adenocarcinomas. Br J Cancer 49:495-501,1984.
6. Bates, M. D., C. R. Erwin, L. P. Sanford, D. Wiginton, J. A. Bezerra, L. C.
Schatzman, A. G. Jegga, C. Ley-Ebert, S. S. Williams, K. A. Steinbrecher, B.
W. Warner, M. B. Cohen, and B. J. Aronow. Novel genes and functional
relationships in the adult mouse gastrointestinal tract identified by microarray
analysis. Gastroenterology 122:1467-1482,2002.
7. Birkenkamp-Demtroder, K., S. H. Olesen, F. B. Sorensen, S. Laurberg, P.
Laiho, L. A. Aaltonen, and T. F. Orntoft. Differential gene expression in colon
cancer of the caecum versus the sigmoid and rectosigmoid. Gut 54:374-384,2005.
8. Bonithon-Kopp, C., and A. M. Benhamiche. Are there several colorectal cancers?
Epidemiological data. Eur J Cancer Prev 8 Suppl 1:S3-12,1999.
Page 30 of 43

31 - LaPointe
9. Bufill, J. A. Colorectal cancer: evidence for distinct genetic categories based on
proximal or distal tumor location. Ann Intern Med 113:779-788,1990.
10. Byrd, J. C., and R. S. Bresalier. Mucins and mucin binding proteins in colorectal
cancer. Cancer Metastasis Rev 23:77-99,2004.
11. Calamita, G., A. Mazzone, A. Bizzoca, A. Cavalier, G. Cassano, D. Thomas,
and M. Svelto. Expression and immunolocalization of the aquaporin-8 water
channel in rat gastrointestinal tract. Eur J Cell Biol 80:711-719,2001.
12. Caldero, J., E. Campo, C. Ascaso, J. Ramos, M. J. Panades, and J. M. Rene.
Regional distribution of glycoconjugates in normal, transitional and neoplastic
human colonic mucosa. A histochemical study using lectins. Virchows Arch A
Pathol Anat Histopathol 415:347-356,1989.
13. Chalmers, A. D., J. M. Slack, and C. W. Beck. Regional gene expression in the
epithelia of the Xenopus tadpole gut. Mech Dev 96:125-128,2000.
14. Chen, M., Y. Yang, E. Braunstein, K. E. Georgeson, and C. M. Harmon. Gut
expression and regulation of FAT/CD36: possible role in fatty acid transport in rat
enterocytes. Am J Physiol Endocrinol Metab 281:E916-23,2001.
15. Colegio, O. R., C. M. Van Itallie, H. J. McCrea, C. Rahner, and J. M.
Anderson. Claudins create charge-selective channels in the paracellular pathway
between epithelial cells. Am J Physiol Cell Physiol 283:C142-7,2002.
16. Cuff, M. A., D. W. Lambert, and S. P. Shirazi-Beechey. Substrate-induced
regulation of the human colonic monocarboxylate transporter, MCT1. J Physiol
539:361-371,2002.
17. de Santa Barbara, P., G. R. van den Brink, and D. J. Roberts. Development and
differentiation of the intestinal epithelium. Cell Mol Life Sci 60:1322-1332,2003.
Page 31 of 43

32 - LaPointe
18. Deng, G., E. Peng, J. Gum, J. Terdiman, M. Sleisenger, and Y. S. Kim.
Methylation of hMLH1 promoter correlates with the gene silencing with a region-
specific manner in colorectal cancer. Br J Cancer 86:574-579,2002.
19. Distler, P., and P. R. Holt. Are right- and left-sided colon neoplasms distinct
tumors? Dig Dis 15:302-311,1997.
20. Filipe, M. I., and A. C. Branfoot. Mucin histochemistry of the colon. Curr Top
Pathol 63:143-178,1976.
21. Fleming, R. E., S. Parkkila, A. K. Parkkila, H. Rajaniemi, A. Waheed, and W.
S. Sly. Carbonic anhydrase IV expression in rat and human gastrointestinal tract
regional, cellular, and subcellular localization. J Clin Invest 96:2907-2913,1995.
22. Garcia-Hirschfeld Garcia, J., A. Blanes Berenguel, L. Vicioso Recio, A.
Marquez Moreno, J. Rubio Garrido, and A. Matilla Vicente. Colon cancer: p53
expression and DNA ploidy. Their relation to proximal or distal tumor site. Rev Esp
Enferm Dig 91:481-488,1999.
23. Gautier, L., L. Cope, B. M. Bolstad, and R. A. Irizarry. affy--analysis of
Affymetrix GeneChip data at the probe level. Bioinformatics 20:307-315,2004.
24. Gentleman, R. C., V. J. Carey, D. M. Bates, B. Bolstad, M. Dettling, S. Dudoit,
B. Ellis, L. Gautier, Y. Ge, J. Gentry, K. Hornik, T. Hothorn, W. Huber, S.
Iacus, R. Irizarry, F. Leisch, C. Li, M. Maechler, A. J. Rossini, G. Sawitzki, C.
Smith, G. Smyth, L. Tierney, J. Y. Yang, and J. Zhang. Bioconductor: open
software development for computational biology and bioinformatics. Genome Biol
5:R80,2004.
25. Glebov, O. K., L. M. Rodriguez, K. Nakahara, J. Jenkins, J. Cliatt, C. J.
Humbyrd, J. DeNobile, P. Soballe, R. Simon, G. Wright, P. Lynch, S.
Patterson, H. Lynch, S. Gallinger, A. Buchbinder, G. Gordon, E. Hawk, and I.
R. Kirsch. Distinguishing right from left colon by the pattern of gene expression.
Cancer Epidemiol Biomarkers Prev 12:755-762,2003.
Page 32 of 43

33 - LaPointe
26. Gum, J. R. J., S. C. Crawley, J. W. Hicks, D. E. Szymkowski, and Y. S. Kim.
MUC17, a novel membrane-tethered mucin. Biochem Biophys Res Commun
291:466-475,2002.
27. Hostikka, S. L., and M. R. Capecchi. The mouse Hoxc11 gene: genomic structure
and expression pattern. Mech Dev 70:133-145,1998.
28. Hubbell, E., W. M. Liu, and R. Mei. Robust estimators for expression analysis.
Bioinformatics 18:1585-1592,2002.
29. Iacopetta, B. Are there two sides to colorectal cancer? Int J Cancer 101:403-
408,2002.
30. Irizarry, R. A., B. M. Bolstad, F. Collin, L. M. Cope, B. Hobbs, and T. P.
Speed. Summaries of Affymetrix GeneChip probe level data. Nucleic Acids Res
31:e15,2003.
31. James, R., T. Erler, and J. Kazenwadel. Structure of the murine homeobox gene
cdx-2. Expression in embryonic and adult intestinal epithelium. J Biol Chem
269:15229-15237,1994.
32. Jeansonne, B., Q. Lu, D. A. Goodenough, and Y. H. Chen. Claudin-8 interacts
with multi-PDZ domain protein 1 (MUPP1) and reduces paracellular conductance
in epithelial cells. Cell Mol Biol (Noisy-le-grand) 49:13-21,2003.
33. Komuro, K., M. Tada, E. Tamoto, A. Kawakami, A. Matsunaga, K. Teramoto,
G. Shindoh, M. Takada, K. Murakawa, M. Kanai, N. Kobayashi, Y. Fujiwara,
N. Nishimura, J. Hamada, A. Ishizu, H. Ikeda, S. Kondo, H. Katoh, T.
Moriuchi, and T. Yoshiki. Right- and left-sided colorectal cancers display distinct
expression profiles and the anatomical stratification allows a high accuracy
prediction of lymph node metastasis. J Surg Res 124:216-224,2005.
Page 33 of 43

34 - LaPointe
34. Kondo, T., P. Dolle, J. Zakany, and D. Duboule. Function of posterior HoxD
genes in the morphogenesis of the anal sphincter. Development 122:2651-
2659,1996.
35. Kosaki, K., R. Kosaki, T. Suzuki, H. Yoshihashi, T. Takahashi, K. Sasaki, M.
Tomita, W. McGinnis, and N. Matsuo. Complete mutation analysis panel of the
39 human HOX genes. Teratology 65:50-62,2002.
36. Lipshutz, R. J., S. P. Fodor, T. R. Gingeras, and D. J. Lockhart. High density
synthetic oligonucleotide arrays. Nat Genet 21:20-24,1999.
37. Liu, X. F., P. Olsson, C. D. Wolfgang, T. K. Bera, P. Duray, B. Lee, and I.
Pastan. PRAC: A novel small nuclear protein that is specifically expressed in
human prostate and colon. Prostate 47:125-131,2001.
38. Macfarlane, G. T., G. R. Gibson, and J. H. Cummings. Comparison of
fermentation reactions in different regions of the human colon. J Appl Bacteriol
72:57-64,1992.
39. Miklos, G. L., and R. Maleszka. Microarray reality checks in the context of a
complex disease. Nat Biotechnol 22:615-621,2004.
40. Montgomery, R. K., A. E. Mulberg, and R. J. Grand. Development of the human
gastrointestinal tract: twenty years of progress. Gastroenterology 116:702-
731,1999.
41. Ortega-Cava, C. F., S. Ishihara, M. A. Rumi, K. Kawashima, N. Ishimura, H.
Kazumori, J. Udagawa, Y. Kadowaki, and Y. Kinoshita. Strategic
compartmentalization of Toll-like receptor 4 in the mouse gut. J Immunol
170:3977-3985,2003.
42. Park, Y. K., J. L. Franklin, S. H. Settle, S. E. Levy, E. Chung, L. H.
Jeyakumar, Y. Shyr, M. K. Washington, R. H. Whitehead, B. J. Aronow, and
Page 34 of 43

35 - LaPointe
R. J. Coffey. Gene expression profile analysis of mouse colon embryonic
development. Genesis 41:1-12,2005.
43. Peifer, M. Developmental biology: colon construction. Nature 420:274-5,
277,2002.
44. Rajendran, V. M., J. Black, T. A. Ardito, P. Sangan, S. L. Alper, C.
Schweinfest, M. Kashgarian, and H. J. Binder. Regulation of DRA and AE1 in
rat colon by dietary Na depletion. Am J Physiol Gastrointest Liver Physiol
279:G931-42,2000.
45. Silberg, D. G., G. P. Swain, E. R. Suh, and P. G. Traber. Cdx1 and cdx2
expression during intestinal development. Gastroenterology 119:961-971,2000.
46. Singh, S., R. Poulsom, A. M. Hanby, L. A. Rogers, N. A. Wright, M. C.
Sheppard, and M. J. Langman. Expression of oestrogen receptor and oestrogen-
inducible genes pS2 and ERD5 in large bowel mucosa and cancer. J Pathol
184:153-160,1998.
47. Smyth, G. Limma: linear models for microarray data. In: Bioinformatics and
Computational Biology Solutions using R and Bioconductor, edited by Gentleman,
R., Carey, V., Dudoit, S., Irizarray, R., and Huber, W. New York: Springer, 2005,
397-420.
48. Traber, P. G. Transcriptional regulation in intestinal development. Implications for
colorectal cancer. Adv Exp Med Biol 470:1-14,1999.
49. Williams, S. J., M. A. McGuckin, D. C. Gotley, H. J. Eyre, G. R. Sutherland,
and T. M. Antalis. Two novel mucin genes down-regulated in colorectal cancer
identified by differential display. Cancer Res 59:4083-4089,1999.
50. Wilson, C., and C. J. Miller. Simpleaffy: a BioConductor package for Affymetrix
quality control and data analysis. Bioinformatics 2005.
Page 35 of 43

36 - LaPointe
Figures and Tables
Figure 1. Comparison of the number of differential probesets when the divide between proximal and distal regions is moved between different segments: (C)ecum, (A)scending, (D)escending, (S)igmoid, (R)ectum.
Page 36 of 43

37 - LaPointe
Figure 2. Typical example of the dichotomous model: PRAC illustrates the dichotomous/binary pattern that is the dominant pattern of transcript expression
along proximal-distal axis of the colorectum. Shown in RED is a two segment model while the five segment model is shown in BLUE. Note: the tissue ordering within each segment is essentially random and no further data are available regarding
position within the segment.
Page 37 of 43

38 - LaPointe
Figure 3. HOXB13 illustrates the second pattern that we observe along the proximal-distal axis: a gradual change from segment to segment – in this case increasing distally. Shown in RED is a two segment model while the five segment model is shown in BLUE. Note: the tissue ordering within each segment is essentially random
and no further data are available regarding position within the segment.
Page 38 of 43
39 - LaPointe
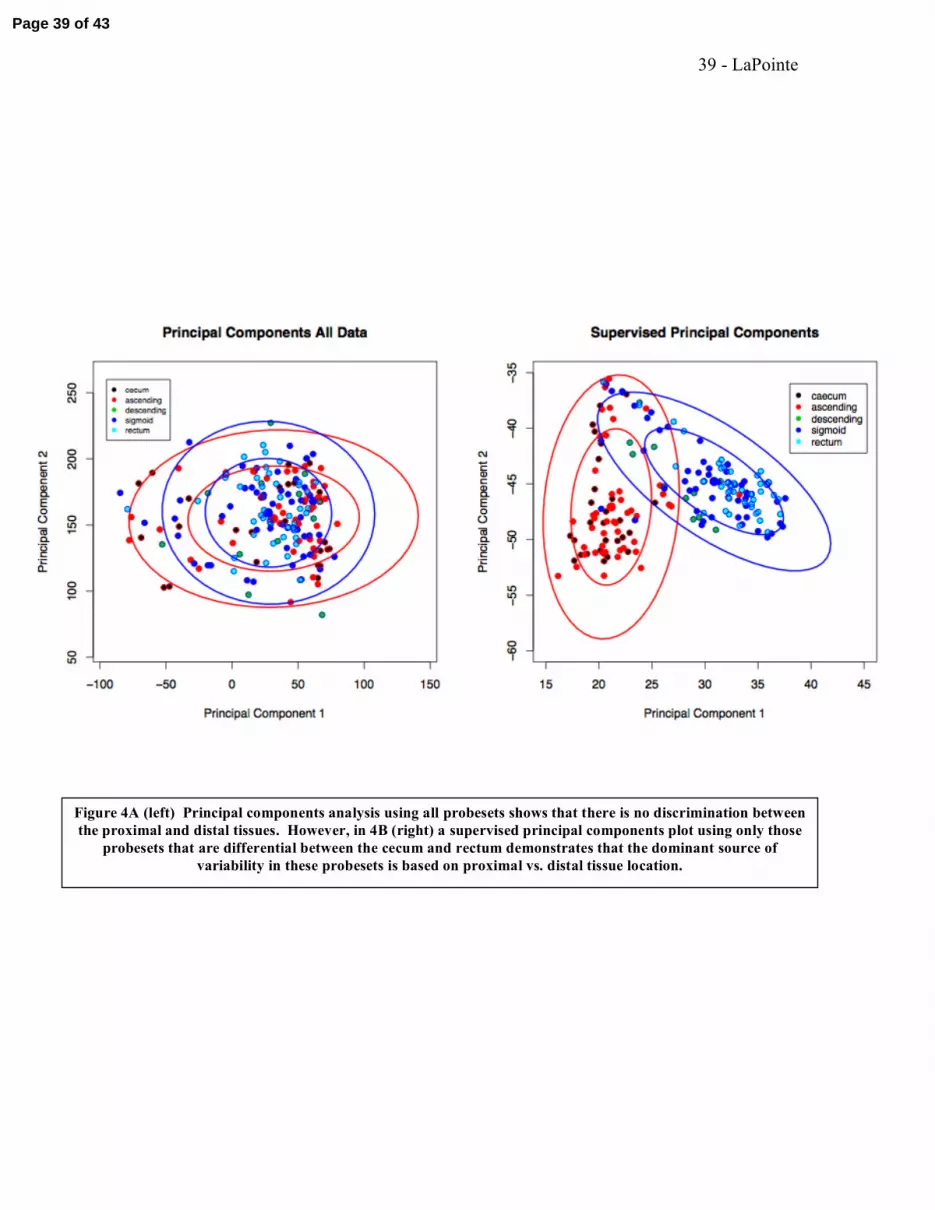
Figure 4A (left) Principal components analysis using all probesets shows that there is no discrimination between the proximal and distal tissues. However, in 4B (right) a supervised principal components plot using only those
probesets that are differential between the cecum and rectum demonstrates that the dominant source of variability in these probesets is based on proximal vs. distal tissue location.
Page 39 of 43

40 - LaPointe
Figure 5A (left). A box plot of each tissue's value for the first principal component using all probesets on the GeneChip, and Figure 5B (Right) the first principal component value from a supervised PCA probesets using only probesets that are differentially expressed between caecum and rectum . As with the data projections shown above, there is an obvious proximal vs. distal class structure.
C A D S R C A D S R
Page 40 of 43

41 - LaPointe
Rank Probeset ID Symbol Description Expr. ! t P-Value Expr. ! t P-Value P-Value t CI Low CI High
1 222262_s_at ETNK1 ethanolamine kinase 1 3.3492 -12.9258 5.27E-23 3.5741 -9.0521 6.53E-09 1.37E-01 1.5891 -0.3764 2.4320
2 225458_at SEC6L1 SEC6-like 1 (S. cerevisiae) 5.4422 -12.5937 5.10E-22 6.2917 -9.2685 2.57E-09 1.75E-01 1.4370 -0.7340 3.6253
3 225457_s_at SEC6L1 SEC6-like 1 (S. cerevisiae) 4.2221 -12.5347 7.62E-22 4.9764 -9.7261 3.59E-10 2.19E-01 1.2930 -0.8902 3.5413
4 219017_at ETNK1 ethanolamine kinase 1 4.0801 -12.3947 1.98E-21 4.1238 -8.1023 3.99E-07 2.63E-01 1.1704 -1.0423 3.4942
5 207558_s_at PITX2 paired-like homeodomain transcription factor 2 1.6252 -12.3516 2.66E-21 1.7549 -8.5481 5.79E-08 5.20E-01 0.6582 -0.6362 1.2099
6 224453_s_at ETNK1 ethanolamine kinase 1 2.0637 -11.5429 6.45E-19 2.1692 -8.0763 4.47E-07 2.07E-01 1.3638 -0.1907 0.7586
7 229230_at OSTalpha organic solute transporter alpha 2.4793 -10.8011 9.47E-17 2.7768 -8.6246 4.15E-08 1.95E-01 1.3510 -0.4902 2.2212
8 206340_at NR1H4 nuclear receptor subfamily 1, group H, member 4 2.0505 -10.3266 2.22E-15 2.4066 -9.1541 4.20E-09 3.55E-02 2.3580 0.0394 0.9527
9 226432_at ** no description ** 2.3181 -10.0408 1.46E-14 2.5744 -7.2261 1.76E-05 2.49E-01 1.2193 -0.5313 1.8442
10 209869_at ADRA2A adrenergic, alpha-2A-, receptor 1.6585 -9.8367 5.55E-14 1.7705 -8.0507 4.99E-07 2.45E-01 1.2272 -0.4738 1.6677
11 227194_at FAM3B family with sequence similarity 3, member B 2.8282 -9.8079 6.70E-14 3.4326 -6.9816 5.00E-05 2.04E-01 1.3699 -0.6662 2.7145
12 207251_at MEP1B meprin A, beta 1.7581 -9.7239 1.16E-13 1.8022 -6.5673 2.91E-04 1.52E-01 1.5371 -0.2025 1.1482
13 219954_s_at GBA3 glucosidase, beta, acid 3 (cytosolic) 1.7033 -9.6737 1.60E-13 1.9800 -8.3619 1.30E-07 1.76E-01 1.4742 -0.2567 1.1929
14 219955_at FLJ10884 hypothetical protein FLJ10884 1.8400 -9.1831 3.77E-12 1.9031 -5.9016 4.66E-03 2.78E-01 1.1257 -0.0917 0.2976
15 225290_at ** no description ** 2.2680 -9.1191 5.68E-12 2.4516 -6.2630 1.04E-03 3.30E-01 1.0125 -0.8929 2.4715
16 201920_at SLC20A1 solute carrier family 20 (phosphate transporter),
member 12.1030 -8.5555 1.97E-10 2.3428 -7.0466 3.79E-05 3.68E-01 0.9338 -1.0459 2.6359
17 206294_at HSD3B2 hydroxy-delta-5-steroid dehydrogenase, 3 beta- and
steroid delta-isomerase 21.8455 -8.2334 1.43E-09 2.0613 -6.6283 2.25E-04 3.68E-01 0.9331 -0.9742 2.4564
18 231576_at ** no description ** 2.1646 -8.0045 5.75E-09 1.0000 0.0000 0.00E+00 1.89E-01 1.4363 -0.3026 1.3050
19 222943_at GBA3 glucosidase, beta, acid 3 (cytosolic) 2.0596 -7.9083 1.03E-08 2.5806 -6.9404 5.96E-05 3.62E-01 0.9560 -0.7354 1.8413
20 202236_s_at SLC16A1 solute carrier family 16 (monocarboxylic acid
transporters), member 11.6747 -7.6989 3.58E-08 1.8552 -6.9860 4.91E-05 7.30E-01 -0.3520 -1.4137 1.0142
21 205366_s_at HOXB6 homeo box B6 1.4861 -7.6727 4.18E-08 1.6332 -6.0387 2.65E-03 3.75E-01 0.9368 -0.3720 0.8890
22 222774_s_at NETO2 neuropilin (NRP) and tolloid (TLL)-like 2 1.6919 -7.5826 7.11E-08 1.0000 0.0000 0.00E+00 6.56E-01 0.4551 -0.5353 0.8246
23 235733_at ** no description ** 1.1776 -7.4926 1.21E-07 1.2384 -6.0872 2.17E-03 7.99E-02 1.8733 -0.0196 0.3111
24 202235_at AFARP1 AKR7 family pseudogene 1.2859 -7.3793 2.33E-07 1.3698 -6.6895 1.73E-04 5.44E-01 -0.6204 -0.9183 0.5044
25 224476_s_at MESP1 mesoderm posterior 1 1.2840 -7.2589 4.68E-07 1.0000 0.0000 0.00E+00 2.16E-01 1.2876 -0.0855 0.3497
26 206858_s_at HOXC6 homeo box C6 1.2640 -7.1875 7.05E-07 1.3672 -6.2775 9.82E-04 1.49E-01 1.5380 -0.1110 0.6535
27 208126_s_at CYP2C18 cytochrome P450, family 2, subfamily C, polypeptide 18 1.5721 -7.0842 1.27E-06 1.0000 0.0000 0.00E+00 7.70E-01 0.2970 -0.8071 1.0692
28 207529_at DEFA5 defensin, alpha 5, Paneth cell-specific 2.8342 -7.0313 1.71E-06 3.8363 -5.9701 3.51E-03 1.76E-01 1.5002 -0.4189 1.8957
29 209692_at EYA2 eyes absent homolog 2 (Drosophila) 1.3808 -6.9744 2.36E-06 1.4435 -5.9334 4.09E-03 2.40E-02 2.5104 0.0383 0.4702
30 214595_at KCNG1 potassium voltage-gated channel, subfamily G, member
11.1633 -6.9706 2.41E-06 1.2868 -6.4306 5.17E-04 9.41E-02 -1.7744 -0.5220 0.0453
31 202888_s_at ANPEP alanyl (membrane) aminopeptidase (aminopeptidase N,
aminopeptidase M, microsomal aminopeptidase, CD13,
p150)
2.6011 -6.8676 4.30E-06 3.3179 -5.7250 9.58E-03 2.63E-01 1.1662 -0.9121 3.0790
32 202718_at IGFBP2 insulin-like growth factor binding protein 2, 36kDa 1.8892 -6.8559 4.59E-06 1.0000 0.0000 0.00E+00 7.97E-01 0.2631 -1.0565 1.3500
33 221804_s_at FAM45A family with sequence similarity 45, member A 1.3071 -6.8456 4.86E-06 1.0000 0.0000 0.00E+00 6.85E-01 -0.4156 -1.7005 1.1551
34 207158_at APOBEC1 apolipoprotein B mRNA editing enzyme, catalytic
polypeptide 11.4298 -6.7384 8.81E-06 1.0000 0.0000 0.00E+00 8.55E-01 0.1857 -0.5250 0.6260
35 230949_at SLC23A3 solute carrier family 23 (nucleobase transporters),
member 31.1622 -6.5961 1.92E-05 1.0000 0.0000 0.00E+00 6.05E-02 2.0879 -0.0267 1.0424
36 205541_s_at GSPT2 G1 to S phase transition 2 1.3378 -6.5339 2.70E-05 1.4485 -5.7155 9.96E-03 1.91E-01 1.4047 -0.2567 1.1282
37 207212_at SLC9A3 solute carrier family 9 (sodium/hydrogen exchanger),
isoform 31.2571 -6.5310 2.74E-05 1.0000 0.0000 0.00E+00 9.52E-01 0.0608 -0.2994 0.3171
38 215103_at CYP2C18 cytochrome P450, family 2, subfamily C, polypeptide 18 1.3638 -6.5193 2.92E-05 1.4312 -5.9261 4.21E-03 9.81E-01 0.0248 -0.6717 0.6874
39 206755_at CYP2B6 cytochrome P450, family 2, subfamily B, polypeptide 6 1.2980 -6.4787 3.64E-05 1.3244 -5.5367 2.05E-02 7.86E-03 3.3120 0.1017 0.5198
40 239656_at ** no description ** 1.1506 -6.4761 3.69E-05 1.0000 0.0000 0.00E+00 5.91E-01 0.5545 -0.3367 0.5611
41 222955_s_at FAM45A family with sequence similarity 45, member A 1.2688 -6.4573 4.09E-05 1.0000 0.0000 0.00E+00 8.98E-01 0.1300 -0.2480 0.2802
42 213181_s_at MOCS1 molybdenum cofactor synthesis 1 1.1617 -6.4528 4.19E-05 1.2410 -6.4040 5.78E-04 8.98E-01 0.1300 -0.2891 0.3268
43 205522_at HOXD4 homeo box D4 1.2966 -6.4496 4.26E-05 1.4206 -5.6334 1.39E-02 1.70E-02 2.7802 0.0674 0.5621
44 221304_at UGT1A8 UDP glycosyltransferase 1 family, polypeptide A8 1.3599 -6.4054 5.40E-05 1.0000 0.0000 0.00E+00 3.32E-02 2.4124 0.0157 0.3156
45 205660_at OASL 2'-5'-oligoadenylate synthetase-like 1.5483 -6.3676 6.61E-05 1.0000 0.0000 0.00E+00 9.13E-02 1.8836 -0.1619 1.8170
46 218888_s_at ** no description ** 1.6234 -6.3647 6.71E-05 1.0000 0.0000 0.00E+00 8.65E-01 0.1729 -0.7162 0.8440
47 209900_s_at SLC16A1 solute carrier family 16 (monocarboxylic acid
transporters), member 11.4721 -6.3225 8.41E-05 1.6899 -6.0457 2.57E-03 7.73E-01 -0.2938 -1.3553 1.0276
48 242059_at ** no description ** 1.6676 -6.3073 9.12E-05 1.0000 0.0000 0.00E+00 1.58E-01 1.5283 -0.3359 1.7837
49 221305_s_at UGT1A8 UDP glycosyltransferase 1 family, polypeptide A8 1.6300 -6.3057 9.20E-05 1.0000 0.0000 0.00E+00 1.16E-01 1.7472 -0.0934 0.7101
50 219197_s_at SCUBE2 signal peptide, CUB domain, EGF-like 2 1.2723 -6.2538 1.21E-04 1.5426 -7.2700 1.45E-05 1.51E-01 1.5707 -0.0850 0.4708
51 236860_at NPY6R neuropeptide Y receptor Y6 (pseudogene) 1.1988 -6.2070 1.55E-04 1.0000 0.0000 0.00E+00 1.50E-01 1.5108 -0.0514 0.3088
52 218739_at ABHD5 abhydrolase domain containing 5 1.2190 -6.2061 1.56E-04 1.0000 0.0000 0.00E+00 8.25E-01 0.2256 -0.4494 0.5557
53 210797_s_at OASL 2'-5'-oligoadenylate synthetase-like 1.4082 -6.1890 1.70E-04 1.0000 0.0000 0.00E+00 2.62E-01 1.1791 -0.1607 0.5374
54 206754_s_at CYP2B6 cytochrome P450, family 2, subfamily B, polypeptide 6 1.5418 -6.1369 2.24E-04 1.0000 0.0000 0.00E+00 2.00E-01 1.3404 -0.3312 1.4532
55 203333_at KIFAP3 kinesin-associated protein 3 1.2568 -6.1317 2.30E-04 1.0000 0.0000 0.00E+00 5.92E-01 0.5550 -0.6324 1.0488
56 224454_at ETNK1 ethanolamine kinase 1 1.1406 -6.1181 2.47E-04 1.0000 0.0000 0.00E+00 3.33E-01 0.9980 -0.1088 0.3037
57 214651_s_at HOXA9 homeo box A9 1.4981 -6.0474 3.57E-04 1.6730 -5.8388 6.02E-03 7.54E-01 0.3192 -0.9026 1.2175
58 242683_at na hypothetical gene supported by AK095347 1.2426 -5.9201 6.86E-04 1.0000 0.0000 0.00E+00 3.97E-02 2.3200 0.0201 0.6997
59 236894_at ** no description ** 1.3679 -5.8885 8.07E-04 1.0000 0.0000 0.00E+00 6.22E-01 0.5028 -0.1866 0.3029
60 218136_s_at MSCP mitochondrial solute carrier protein 1.2016 -5.8872 8.12E-04 1.0000 0.0000 0.00E+00 3.93E-01 0.8820 -0.1419 0.3403
61 210153_s_at ME2 malic enzyme 2, NAD(+)-dependent, mitochondrial 1.2047 -5.8498 9.82E-04 1.0000 0.0000 0.00E+00 6.28E-01 0.5001 -0.4716 0.7442
62 209752_at REG1A regenerating islet-derived 1 alpha (pancreatic stone
protein, pancreatic thread protein)2.7216 -5.8414 1.02E-03 1.0000 0.0000 0.00E+00 5.62E-01 -0.5914 -0.3380 0.1901
63 238638_at SLC37A2 solute carrier family 37 (glycerol-3-phosphate
transporter), member 21.3919 -5.8351 1.06E-03 1.0000 0.0000 0.00E+00 5.80E-01 0.5732 -0.5148 0.8685
64 214421_x_at CYP2C9 cytochrome P450, family 2, subfamily C, polypeptide 9 1.0000 0.0000 6.79E-03 1.3877 -5.8095 6.79E-03 8.26E-02 1.8529 -0.0292 0.4316
65 205815_at PAP pancreatitis-associated protein 2.0272 -5.7979 1.28E-03 2.7965 -5.5114 2.27E-02 1.36E-01 1.6661 -0.1684 1.0163
66 225351_at FAM45A family with sequence similarity 45, member A 1.2592 -5.6944 2.14E-03 1.0000 0.0000 0.00E+00 8.22E-01 -0.2296 -0.9944 0.8026
67 243669_s_at PRAP1 proline-rich acidic protein 1 1.4986 -5.6740 2.37E-03 1.0000 0.0000 0.00E+00 4.66E-01 0.7466 -0.7334 1.5338
68 228564_at LOC375295 hypothetical gene supported by BC013438 1.1976 -5.6664 2.47E-03 1.0000 0.0000 0.00E+00 5.38E-02 2.1149 -0.0035 0.3785
69 223541_at HAS3 hyaluronan synthase 3 1.4178 -5.6557 2.60E-03 1.0000 0.0000 0.00E+00 3.82E-01 -0.8990 -1.3977 0.5637
70 202234_s_at AFARP1 AKR7 family pseudogene 1.4304 -5.6464 2.72E-03 1.0000 0.0000 0.00E+00 7.49E-01 0.3259 -1.0571 1.4355
71 203920_at NR1H3 nuclear receptor subfamily 1, group H, member 3 1.0000 0.0000 1.87E-02 1.3409 -5.5600 1.87E-02 4.58E-01 0.7617 -0.3137 0.6637
72 231897_at ZNF483 zinc finger protein 483 1.3192 -5.5272 4.90E-03 1.0000 0.0000 0.00E+00 9.53E-01 0.0602 -1.1123 1.1762
73 228155_at C10orf58 chromosome 10 open reading frame 58 1.4264 -5.5143 5.21E-03 1.0000 0.0000 0.00E+00 8.53E-01 0.1888 -1.3883 1.6572
74 206601_s_at HOXD3 homeo box D3 1.1325 -5.5056 5.44E-03 1.2135 -5.5679 1.81E-02 3.90E-01 0.8826 -0.1434 0.3488
75 215913_s_at GULP1 GULP, engulfment adaptor PTB domain containing 1 1.0000 0.0000 2.39E-02 1.4578 -5.4985 2.39E-02 2.46E-02 2.4689 0.0299 0.3831
76 208596_s_at UGT1A3 UDP glycosyltransferase 1 family, polypeptide A3 1.6580 -5.3741 1.03E-02 1.0000 0.0000 0.00E+00 3.94E-01 0.8810 -0.5799 1.3851
77 202495_at TBCC tubulin-specific chaperone c 1.1465 -5.3411 1.20E-02 1.0000 0.0000 0.00E+00 8.85E-01 0.1471 -0.3784 0.4337
78 221920_s_at MSCP mitochondrial solute carrier protein 1.1893 -5.3370 1.23E-02 1.0000 0.0000 0.00E+00 3.19E-01 1.0688 -0.2442 0.6546
79 223058_at C10orf45 chromosome 10 open reading frame 45 1.3829 -5.3188 1.34E-02 1.0000 0.0000 0.00E+00 9.93E-01 0.0092 -1.2206 1.2307
80 219926_at POPDC3 popeye domain containing 3 1.1296 -5.2863 1.56E-02 1.0000 0.0000 0.00E+00 1.73E-01 1.4622 -0.0737 0.3604
81 210154_at ME2 malic enzyme 2, NAD(+)-dependent, mitochondrial 1.3016 -5.2581 1.78E-02 1.0000 0.0000 0.00E+00 4.06E-01 0.8804 -0.4040 0.8951
82 220753_s_at CRYL1 crystallin, lambda 1 1.2752 -5.2392 1.95E-02 1.0000 0.0000 0.00E+00 9.42E-01 0.0735 -0.9931 1.0643
83 205505_at GCNT1 glucosaminyl (N-acetyl) transferase 1, core 2 (beta-1,6-
N-acetylglucosaminyltransferase)1.1227 -5.2361 1.98E-02 1.0000 0.0000 0.00E+00 1.91E-01 1.3736 -0.0833 0.3805
84 219640_at CLDN15 claudin 15 1.1692 -5.2276 2.06E-02 1.0000 0.0000 0.00E+00 3.03E-01 1.0642 -0.1625 0.4894
85 214038_at CCL8 chemokine (C-C motif) ligand 8 1.6140 -5.2067 2.27E-02 1.0000 0.0000 0.00E+00 1.29E-01 1.7169 -0.2431 1.5559
86 220017_x_at CYP2C9 cytochrome P450, family 2, subfamily C, polypeptide 9 1.3983 -5.1902 2.46E-02 1.5251 -5.4185 3.29E-02 1.56E-03 3.8998 0.1592 0.5472
87 206407_s_at CCL13 chemokine (C-C motif) ligand 13 1.4448 -5.1730 2.66E-02 1.0000 0.0000 0.00E+00 9.06E-02 1.8234 -0.0265 0.3189
88 220585_at FLJ22761 hypothetical protein FLJ22761 1.1558 -5.1501 2.96E-02 1.0000 0.0000 0.00E+00 7.05E-01 0.3868 -0.1662 0.2388
89 217085_at SLC14A2 solute carrier family 14 (urea transporter), member 2 1.2940 -5.1161 3.47E-02 1.0000 0.0000 0.00E+00 1.69E-01 1.5324 -0.3248 1.5282
90 205208_at FTHFD formyltetrahydrofolate dehydrogenase 1.2531 -5.1123 3.53E-02 1.0000 0.0000 0.00E+00 7.99E-01 0.2585 -0.3126 0.3997
91 203639_s_at FGFR2 fibroblast growth factor receptor 2 (bacteria-expressed
kinase, keratinocyte growth factor receptor, craniofacial
dysostosis 1, Crouzon syndrome, Pfeiffer syndrome,
Jackson-Weiss syndrome)
1.2760 -5.0917 3.89E-02 1.0000 0.0000 0.00E+00 3.02E-01 1.0705 -0.1918 0.5747
92 204663_at ME3 malic enzyme 3, NADP(+)-dependent, mitochondrial 1.1447 -5.0447 4.83E-02 1.0000 0.0000 0.00E+00 5.46E-01 0.6203 -0.3844 0.6922
93 211776_s_at EPB41L3 erythrocyte membrane protein band 4.1-like 3 1.2553 -5.0391 4.95E-02 1.0000 0.0000 0.00E+00 5.81E-01 0.5706 -0.4283 0.7236
Proxima-Distal Cecum-Rectum Validation
Table 1. List of genes differentially expressed higher in proximal tissues relative to distal tissues. (p<0.05). The last four columns report the evaluation of each probeset in the validation data, including the low and high estimates of 95th confidence interval
Page 41 of 43

42 - LaPointe
Rank Probeset ID Symbol Description Expr. ! t P-Value Expr. ! t P-Value P-Value t CI Low CI High
1 230784_at PRAC small nuclear protein PRAC 10.3887 16.6750 4.56E-34 15.5666 18.2177 2.94E-24 1.22E-03 -3.8956 -3.4130 -1.0114
2 230105_at ** no description ** 2.2919 12.3536 2.62E-21 2.9669 11.1548 8.54E-13 3.09E-03 -3.6184 -2.1466 -0.5423
3 209844_at HOXB13 homeo box B13 2.4103 12.1639 9.54E-21 3.1342 10.6863 6.07E-12 6.44E-02 -1.9822 -1.0329 0.0336
4 222571_at SIAT7F sialytransferase 7 ((alpha-N-acetylneuraminyl 2,3-
betagalactosyl-1,3)-N-acetyl galactosaminide alpha-2,6-
sialytransferase) F
1.7332 12.0297 2.38E-20 1.9083 9.5206 8.68E-10 1.74E-02 -2.6361 -1.5450 -0.1712
5 203892_at WFDC2 WAP four-disulfide core domain 2 2.0622 11.7522 1.56E-19 2.3090 9.5105 9.06E-10 7.58E-02 -1.9010 -0.9904 0.0547
6 214598_at CLDN8 claudin 8 4.4296 10.9279 4.05E-17 5.9352 9.2485 2.80E-09 2.97E-05 -5.8917 -3.8620 -1.8099
7 230360_at COLM collomin 2.1190 10.9209 4.25E-17 2.7368 10.0265 9.94E-11 8.76E-03 -3.1862 -2.8211 -0.5144
8 221091_at INSL5 insulin-like 5 3.3289 10.2037 5.00E-15 5.0245 9.2341 2.98E-09 2.96E-01 -1.0788 -1.7982 0.5831
9 221164_x_at CHST5 carbohydrate (N-acetylglucosamine 6-O) sulfotransferase 5 1.5826 9.8032 6.90E-14 1.7349 8.1540 3.19E-07 7.03E-02 -1.9631 -1.2320 0.0559
10 229254_at DKFZp761N1114hypothetical protein DKFZp761N1114 2.3718 9.5776 2.99E-13 3.0443 9.2865 2.38E-09 1.74E-02 -2.6380 -2.2971 -0.2546
11 230269_at ** no description ** 1.8860 9.5192 4.36E-13 2.1495 7.9354 8.23E-07 1.84E-03 -3.7893 -3.0771 -0.8590
12 223942_x_at CHST5 carbohydrate (N-acetylglucosamine 6-O) sulfotransferase 5 1.5910 9.3437 1.35E-12 1.7763 8.2351 2.25E-07 1.56E-02 -2.7784 -1.2593 -0.1582
13 230845_at PRAC2 prostate/rectrum and colon protein no. 2 1.2645 9.1328 5.20E-12 1.2799 6.5300 3.40E-04 7.34E-01 -0.3473 -0.4016 0.2897
14 239994_at ** no description ** 1.7691 8.9650 1.51E-11 2.1086 7.9228 8.69E-07 3.77E-02 -2.3472 -0.9050 -0.0315
15 40284_at FOXA2 forkhead box A2 1.3520 8.5397 2.17E-10 1.4577 7.3722 9.37E-06 2.71E-01 -1.1395 -0.6620 0.1987
16 207249_s_at SLC28A2 solute carrier family 28 (sodium-coupled nucleoside
transporter), member 22.0334 8.5384 2.19E-10 2.6495 6.8463 8.90E-05 2.60E-01 -1.1847 -0.9239 0.2760
17 242372_s_at DKFZp761N1114hypothetical protein DKFZp761N1114 1.5715 8.4149 4.70E-10 1.8751 7.5943 3.60E-06 5.96E-02 -2.0524 -0.4335 0.0098
18 213994_s_at SPON1 spondin 1, extracellular matrix protein 1.6341 8.3820 5.75E-10 1.8277 7.5849 3.75E-06 8.11E-02 -1.8548 -1.3333 0.0858
19 205185_at SPINK5 serine protease inhibitor, Kazal type 5 2.4067 8.2883 1.02E-09 3.6532 9.5241 8.54E-10 1.77E-02 -2.7425 -2.9703 -0.3414
20 203759_at SIAT4C sialyltransferase 4C (beta-galactoside alpha-2,3-
sialyltransferase)1.5035 8.2782 1.09E-09 1.0000 0.0000 0.00E+00 6.50E-02 -2.0018 -0.9961 0.0342
21 240856_at ** no description ** 1.7989 8.2080 1.67E-09 2.0481 7.7313 1.99E-06 2.82E-01 -1.1147 -0.6355 0.1982
22 226654_at MUC12 mucin 12 3.0988 8.0394 4.66E-09 4.2406 7.1298 2.65E-05 4.95E-03 -3.3015 -3.8841 -0.8334
23 229499_at CAPN13 calpain 13 1.2187 7.8466 1.49E-08 1.2837 6.4588 4.59E-04 5.49E-01 -0.6115 -0.6903 0.3801
24 206422_at GCG glucagon 3.5394 7.8128 1.82E-08 6.0957 7.7872 1.56E-06 5.68E-01 -0.5848 -0.9049 0.5168
25 236681_at HOXD13 homeo box D13 1.4419 7.5188 1.03E-07 1.6533 6.3341 7.75E-04 2.01E-01 -1.3466 -0.6199 0.1437
26 221024_s_at SLC2A10 solute carrier family 2 (facilitated glucose transporter),
member 101.5552 7.4735 1.35E-07 1.6304 5.6695 1.20E-02 7.86E-01 -0.2784 -0.5100 0.3951
27 238862_at DKFZp761N1114hypothetical protein DKFZp761N1114 1.3657 7.4657 1.41E-07 1.5027 7.1762 2.17E-05 2.42E-01 -1.2275 -0.2082 0.0577
28 201482_at QSCN6 quiescin Q6 1.3243 7.4495 1.55E-07 1.4197 7.2690 1.46E-05 2.20E-01 -1.2733 -0.9080 0.2246
29 210103_s_at FOXA2 forkhead box A2 1.3894 7.4289 1.75E-07 1.4913 6.2272 1.21E-03 1.13E-01 -1.6815 -0.9156 0.1081
30 213993_at SPON1 spondin 1, extracellular matrix protein 1.4348 7.4099 1.95E-07 1.6082 6.6934 1.71E-04 1.19E-01 -1.6442 -0.7080 0.0878
31 209436_at SPON1 spondin 1, extracellular matrix protein 1.5394 7.1992 6.59E-07 1.7567 6.6098 2.43E-04 1.11E-01 -1.6837 -1.5765 0.1771
32 234994_at KIAA1913 KIAA1913 2.0243 7.1920 6.87E-07 2.3745 6.1586 1.61E-03 4.51E-02 -2.1685 -2.3949 -0.0299
33 204519_s_at TM4SF11 transmembrane 4 superfamily member 11 (plasmolipin) 1.5123 7.1801 7.35E-07 1.7330 6.4681 4.42E-04 1.52E-02 -2.7824 -1.6258 -0.2071
34 213134_x_at BTG3 BTG family, member 3 1.3761 7.1419 9.14E-07 1.4909 6.1257 1.85E-03 4.03E-01 -0.8587 -1.0225 0.4315
35 206070_s_at EPHA3 EPH receptor A3 1.3440 7.0592 1.46E-06 1.0000 0.0000 0.00E+00 7.16E-01 0.3698 -0.1398 0.1992
36 201889_at FAM3C family with sequence similarity 3, member C 1.5846 6.9954 2.10E-06 1.8871 7.1044 2.96E-05 1.77E-01 -1.4134 -2.1726 0.4361
37 239805_at SLC13A2 solute carrier family 13 (sodium-dependent dicarboxylate
transporter), member 21.4052 6.9691 2.43E-06 1.0000 0.0000 0.00E+00 3.14E-01 -1.0401 -0.7317 0.2496
38 218187_s_at FLJ20989 hypothetical protein FLJ20989 1.3131 6.9597 2.57E-06 1.0000 0.0000 0.00E+00 2.67E-03 -3.5484 -1.9436 -0.4900
39 201798_s_at FER1L3 fer-1-like 3, myoferlin (C. elegans) 1.4386 6.9150 3.30E-06 1.5077 5.8090 6.80E-03 6.52E-02 -1.9885 -2.4341 0.0839
40 207397_s_at HOXD13 homeo box D13 1.2156 6.8953 3.68E-06 1.3278 5.4274 3.18E-02 3.01E-01 -1.0705 -0.1530 0.0507
41 205548_s_at BTG3 BTG family, member 3 1.3727 6.8644 4.38E-06 1.4636 5.5270 2.13E-02 5.93E-01 -0.5445 -0.6543 0.3860
42 207080_s_at PYY peptide YY 2.9642 6.8281 5.36E-06 4.4363 6.1558 1.63E-03 8.57E-01 0.1831 -0.5225 0.6204
43 206104_at ISL1 ISL1 transcription factor, LIM/homeodomain, (islet-1) 1.2491 6.7817 6.93E-06 1.3294 5.3926 3.65E-02 2.53E-01 -1.1876 -0.6539 0.1853
44 203961_at NEBL nebulette 1.5345 6.6278 1.62E-05 1.8643 7.7938 1.52E-06 2.30E-01 -1.2620 -1.2328 0.3265
45 208121_s_at PTPRO protein tyrosine phosphatase, receptor type, O 1.5772 6.6010 1.87E-05 1.7949 6.6295 2.23E-04 2.18E-01 1.2917 -0.0552 0.2220
46 236129_at GALNT5 UDP-N-acetyl-alpha-D-galactosamine 1.3923 6.5855 2.04E-05 1.5111 6.1059 2.00E-03 2.44E-02 -2.4706 -0.5979 -0.0471
47 203698_s_at FRZB frizzled-related protein 1.0000 0.0000 2.08E-05 1.6958 7.1867 2.08E-05 2.48E-01 1.1964 -0.0771 0.2782
48 204351_at S100P S100 calcium binding protein P 2.5316 6.5625 2.31E-05 3.2208 6.0619 2.40E-03 4.68E-02 -2.1574 -3.6312 -0.0295
49 205042_at GNE glucosamine (UDP-N-acetyl)-2-epimerase/N-
acetylmannosamine kinase1.6163 6.4563 4.11E-05 2.0082 6.7357 1.43E-04 9.31E-03 -2.9329 -2.2337 -0.3643
50 205979_at SCGB2A1 secretoglobin, family 2A, member 1 1.7328 6.4027 5.48E-05 2.0193 5.5811 1.72E-02 1.14E-01 -1.6938 -0.6383 0.0771
51 205927_s_at CTSE cathepsin E 1.4237 6.3675 6.62E-05 1.5846 6.0712 2.31E-03 5.49E-02 -2.0671 -1.2770 0.0147
52 229893_at FRMD3 FERM domain containing 3 1.2730 6.3194 8.55E-05 1.0000 0.0000 0.00E+00 1.83E-01 -1.3901 -1.1336 0.2342
53 228004_at C20orf56 chromosome 20 open reading frame 56 1.7141 6.2459 1.26E-04 1.0000 0.0000 0.00E+00 6.93E-01 -0.4040 -0.4126 0.2826
54 208450_at LGALS2 lectin, galactoside-binding, soluble, 2 (galectin 2) 2.0310 6.2396 1.31E-04 2.4773 5.3780 3.87E-02 7.57E-02 -1.9311 -1.7705 0.0999
55 211253_x_at PYY peptide YY 1.3778 6.1703 1.88E-04 1.5825 5.5802 1.72E-02 3.08E-01 -1.0510 -0.7604 0.2555
56 228821_at SIAT2 sialyltransferase 2 (monosialoganglioside sialyltransferase) 1.2800 6.1437 2.16E-04 1.0000 0.0000 0.00E+00 1.80E-01 -1.4124 -0.1647 0.0341
57 214601_at TPH1 tryptophan hydroxylase 1 (tryptophan 5-monooxygenase) 1.4092 6.0972 2.75E-04 1.6272 5.3527 4.27E-02 6.10E-01 0.5265 -0.1518 0.2462
58 213369_at PCDH21 protocadherin 21 1.4794 6.0159 4.20E-04 1.7538 6.0814 2.22E-03 1.50E-01 -1.5266 -0.9169 0.1555
59 204686_at IRS1 insulin receptor substrate 1 1.4809 6.0115 4.29E-04 1.0000 0.0000 0.00E+00 2.47E-01 -1.2000 -1.1810 0.3247
60 202709_at FMOD fibromodulin 1.2559 5.9660 5.43E-04 1.0000 0.0000 0.00E+00 9.98E-01 0.0024 -0.3258 0.3265
61 234709_at CAPN13 calpain 13 1.2740 5.9574 5.67E-04 1.2837 5.5315 2.09E-02 2.69E-01 -1.1440 -0.4154 0.1239
62 218692_at FLJ20366 hypothetical protein FLJ20366 1.2335 5.9139 7.08E-04 1.0000 0.0000 0.00E+00 9.13E-01 -0.1113 -0.5029 0.4540
63 218532_s_at FLJ20152 hypothetical protein FLJ20152 1.5696 5.8952 7.79E-04 1.8512 5.6880 1.11E-02 8.96E-02 -1.8034 -2.5468 0.2020
64 242414_at ** no description ** 1.1722 5.8510 9.76E-04 1.0000 0.0000 0.00E+00 9.69E-01 -0.0401 -0.2909 0.2801
65 212935_at MCF2L MCF.2 cell line derived transforming sequence-like 1.2007 5.8489 9.86E-04 1.0000 0.0000 0.00E+00 6.83E-01 -0.4164 -0.5219 0.3506
66 218510_x_at FLJ20152 hypothetical protein FLJ20152 1.4942 5.8115 1.19E-03 1.7263 5.4431 2.98E-02 1.77E-01 -1.4185 -2.5309 0.5086
67 213921_at SST somatostatin 1.7335 5.8030 1.24E-03 1.0000 0.0000 0.00E+00 5.61E-01 -0.5941 -0.5395 0.3039
68 232321_at MUC17 mucin 17 1.5373 5.7650 1.51E-03 1.6719 5.7561 8.44E-03 3.94E-02 -2.2843 -1.2222 -0.0353
69 205464_at SCNN1B sodium channel, nonvoltage-gated 1, beta (Liddle syndrome) 1.5884 5.7391 1.72E-03 1.0000 0.0000 0.00E+00 3.00E-02 -2.3775 -2.0960 -0.1218
70 212098_at LOC151162 hypothetical protein LOC151162 1.2162 5.7307 1.79E-03 1.3275 6.0706 2.32E-03 8.25E-02 -1.8581 -1.2610 0.0853
71 219973_at FLJ23548 hypothetical protein FLJ23548 1.0946 5.6928 2.16E-03 1.0000 0.0000 0.00E+00 2.63E-01 -1.1632 -0.0764 0.0225
72 203769_s_at STS steroid sulfatase (microsomal), arylsulfatase C, isozyme S 1.1896 5.6677 2.45E-03 1.0000 0.0000 0.00E+00 6.13E-01 0.5151 -0.2235 0.3673
73 230645_at FRMD3 FERM domain containing 3 1.2643 5.6646 2.49E-03 1.0000 0.0000 0.00E+00 3.38E-01 -0.9874 -0.8492 0.3083
74 213432_at MUC5B mucin 5, subtype B, tracheobronchial 1.0000 0.0000 3.09E-03 2.3060 6.0011 3.09E-03 1.72E-01 -1.4427 -1.2975 0.2553
75 204781_s_at FAS Fas (TNF receptor superfamily member) 1.2457 5.5988 3.44E-03 1.0000 0.0000 0.00E+00 9.60E-01 -0.0515 -0.5923 0.5646
76 203021_at SLPI secretory leukocyte protease inhibitor (antileukoproteinase) 1.6300 5.5982 3.46E-03 2.2457 7.0224 4.20E-05 9.88E-03 -2.9491 -3.1941 -0.5152
77 204044_at QPRT quinolinate phosphoribosyltransferase (nicotinate-nucleotide
pyrophosphorylase (carboxylating))1.2874 5.5770 3.84E-03 1.0000 0.0000 0.00E+00 1.01E-01 -1.8025 -0.6642 0.0689
78 228256_s_at EPB41L4A erythrocyte membrane protein band 4.1 like 4A 1.2835 5.5607 4.15E-03 1.0000 0.0000 0.00E+00 3.17E-01 -1.0324 -0.5961 0.2054
79 219033_at PARP8 poly (ADP-ribose) polymerase family, member 8 1.0000 0.0000 4.48E-03 1.2434 5.9109 4.48E-03 8.29E-01 0.2199 -0.2334 0.2877
80 235004_at RBM24 RNA binding motif protein 24 1.3389 5.5145 5.21E-03 1.0000 0.0000 0.00E+00 2.33E-01 -1.2599 -0.5129 0.1390
81 205009_at TFF1 trefoil factor 1 (breast cancer, estrogen-inducible sequence
expressed in)2.2026 5.5133 5.24E-03 1.0000 0.0000 0.00E+00 8.36E-02 -1.8608 -2.7462 0.1932
82 212959_s_at MGC4170 MGC4170 protein 1.0000 0.0000 5.56E-03 1.5719 5.8581 5.56E-03 2.94E-01 -1.0880 -1.8811 0.6093
83 213423_x_at TUSC3 tumor suppressor candidate 3 1.4004 5.4510 7.09E-03 1.0000 0.0000 0.00E+00 7.01E-01 -0.3902 -0.3242 0.2231
84 211719_x_at FN1 fibronectin 1 1.8475 5.4506 7.11E-03 1.0000 0.0000 0.00E+00 2.60E-01 1.1686 -0.8995 3.1093
85 213280_at GARNL4 GTPase activating Rap/RanGAP domain-like 4 1.2152 5.4296 7.86E-03 1.0000 0.0000 0.00E+00 4.51E-02 -2.1642 -0.8856 -0.0110
86 222258_s_at SH3BP4 SH3-domain binding protein 4 1.2523 5.4281 7.92E-03 1.3838 5.6336 1.39E-02 7.24E-01 -0.3598 -0.7497 0.5342
87 205221_at HGD homogentisate 1,2-dioxygenase (homogentisate oxidase) 1.3595 5.4277 7.94E-03 1.0000 0.0000 0.00E+00 1.74E-01 -1.4227 -0.8949 0.1761
88 226050_at C13orf11 chromosome 13 open reading frame 11 1.2961 5.4095 8.67E-03 1.0000 0.0000 0.00E+00 2.65E-01 -1.1581 -1.2866 0.3803
89 225591_at FBXO25 F-box protein 25 1.1734 5.3977 9.18E-03 1.0000 0.0000 0.00E+00 3.52E-01 -0.9692 -0.5157 0.1986
90 209228_x_at TUSC3 tumor suppressor candidate 3 1.3320 5.3700 1.05E-02 1.0000 0.0000 0.00E+00 2.11E-01 1.3517 -0.1411 0.5509
91 214798_at KIAA0703 KIAA0703 gene product 1.2832 5.3679 1.06E-02 1.0000 0.0000 0.00E+00 9.82E-01 0.0230 -0.5970 0.6096
92 212573_at KIAA0830 KIAA0830 protein 1.0000 0.0000 1.09E-02 1.4028 5.6938 1.09E-02 2.89E-02 -2.4389 -3.0784 -0.1956
93 220136_s_at CRYBA2 crystallin, beta A2 1.1975 5.3523 1.14E-02 1.0000 0.0000 0.00E+00 5.55E-01 -0.6017 -0.3532 0.1966
94 41469_at PI3 protease inhibitor 3, skin-derived (SKALP) 1.5984 5.3485 1.16E-02 2.1561 5.8717 5.26E-03 4.36E-02 -2.1967 -3.1937 -0.0531
95 210643_at TNFSF11 tumor necrosis factor (ligand) superfamily, member 11 1.0847 5.3372 1.23E-02 1.0000 0.0000 0.00E+00 9.40E-01 -0.0779 -0.2315 0.2159
96 203697_at FRZB frizzled-related protein 1.0000 0.0000 1.38E-02 1.6734 5.6350 1.38E-02 7.36E-01 0.3430 -0.3287 0.4560
97 205081_at CRIP1 cysteine-rich protein 1 (intestinal) 1.4710 5.3107 1.39E-02 1.7786 5.5089 2.29E-02 9.96E-02 -1.7726 -2.4028 0.2364
98 212448_at NEDD4L neural precursor cell expressed, developmentally down-
regulated 4-like1.2048 5.3009 1.46E-02 1.0000 0.0000 0.00E+00 1.90E-02 -2.5972 -1.0089 -0.1038
99 210495_x_at FN1 fibronectin 1 1.7618 5.2865 1.56E-02 1.0000 0.0000 0.00E+00 2.53E-01 1.1889 -0.7749 2.7368
100 212464_s_at FN1 fibronectin 1 1.8202 5.2855 1.57E-02 1.0000 0.0000 0.00E+00 2.72E-01 1.1408 -0.8472 2.8050
101 219734_at SIDT1 SID1 transmembrane family, member 1 1.2674 5.2552 1.81E-02 1.0000 0.0000 0.00E+00 5.73E-01 -0.5770 -0.4726 0.2719
102 227048_at LAMA1 laminin, alpha 1 1.0000 0.0000 1.94E-02 1.9692 5.5506 1.94E-02 4.30E-02 -2.2108 -2.5885 -0.0476
103 216442_x_at FN1 fibronectin 1 1.7670 5.2217 2.12E-02 1.0000 0.0000 0.00E+00 2.67E-01 1.1493 -0.8418 2.8321
104 209437_s_at SPON1 spondin 1, extracellular matrix protein 1.2281 5.2215 2.12E-02 1.0000 0.0000 0.00E+00 4.36E-01 0.8127 -0.1527 0.3266
105 206502_s_at INSM1 insulinoma-associated 1 1.2440 5.2145 2.19E-02 1.4613 5.5757 1.75E-02 5.49E-01 0.6123 -0.0582 0.1057
106 201097_s_at ARF4 ADP-ribosylation factor 4 1.2820 5.2132 2.21E-02 1.0000 0.0000 0.00E+00 1.56E-01 -1.5017 -2.7260 0.4863
107 203649_s_at PLA2G2A phospholipase A2, group IIA (platelets, synovial fluid) 1.9975 5.2082 2.26E-02 1.0000 0.0000 0.00E+00 2.57E-01 -1.1727 -3.1818 0.9107
108 218976_at DNAJC12 DnaJ (Hsp40) homolog, subfamily C, member 12 1.3074 5.2059 2.28E-02 1.0000 0.0000 0.00E+00 4.86E-01 -0.7120 -0.2867 0.1421
109 218211_s_at MLPH melanophilin 1.3781 5.1857 2.51E-02 1.0000 0.0000 0.00E+00 6.65E-01 -0.4411 -1.1438 0.7489
110 203962_s_at NEBL nebulette 1.4431 5.1725 2.67E-02 1.6869 5.5034 2.34E-02 2.88E-01 -1.1152 -0.8238 0.2690
111 229555_at GALNT5 UDP-N-acetyl-alpha-D-galactosamine 1.1612 5.1681 2.72E-02 1.0000 0.0000 0.00E+00 9.63E-01 0.0469 -0.4312 0.4503
112 237183_at GALNT5 UDP-N-acetyl-alpha-D-galactosamine 1.1999 5.1605 2.82E-02 1.0000 0.0000 0.00E+00 5.07E-01 -0.6779 -0.2433 0.1249
113 211864_s_at FER1L3 fer-1-like 3, myoferlin (C. elegans) 1.3242 5.1576 2.86E-02 1.0000 0.0000 0.00E+00 2.60E-01 -1.1717 -0.9109 0.2648
114 212186_at ACACA acetyl-Coenzyme A carboxylase alpha 1.1447 5.1422 3.07E-02 1.0000 0.0000 0.00E+00 4.68E-01 0.7418 -0.2308 0.4809
115 239814_at ** no description ** 1.0000 0.0000 3.21E-02 1.2166 5.4248 3.21E-02 5.39E-01 0.6303 -0.1514 0.2763
116 219909_at MMP28 matrix metalloproteinase 28 1.2335 5.1262 3.31E-02 1.0000 0.0000 0.00E+00 9.59E-02 -1.7646 -0.9624 0.0864
117 213308_at SHANK2 SH3 and multiple ankyrin repeat domains 2 1.2366 5.1150 3.49E-02 1.0000 0.0000 0.00E+00 6.25E-01 0.4985 -0.1723 0.2789
118 200677_at PTTG1IP pituitary tumor-transforming 1 interacting protein 1.0000 0.0000 3.52E-02 1.2472 5.4015 3.52E-02 6.80E-02 -1.9938 -1.9492 0.0799
119 221577_x_at GDF15 growth differentiation factor 15 1.7442 5.1093 3.58E-02 1.0000 0.0000 0.00E+00 1.17E-01 -1.6687 -0.7535 0.0942
120 205490_x_at GJB3 gap junction protein, beta 3, 31kDa (connexin 31) 1.2239 5.0952 3.82E-02 1.0000 0.0000 0.00E+00 9.12E-02 -1.8032 -1.1368 0.0942
121 231814_at MUC11 mucin 11 1.7000 5.0934 3.86E-02 2.3413 5.4097 3.41E-02 1.48E-01 -1.5371 -0.5833 0.0979
122 205518_s_at CMAH cytidine monophosphate-N-acetylneuraminic acid hydroxylase
(CMP-N-acetylneuraminate monooxygenase)1.3496 5.0848 4.01E-02 1.0000 0.0000 0.00E+00 6.00E-01 0.5344 -0.2306 0.3865
123 203691_at PI3 protease inhibitor 3, skin-derived (SKALP) 1.7037 5.0784 4.13E-02 2.3708 5.4493 2.91E-02 7.84E-03 -3.0135 -3.5761 -0.6304
124 238378_at ** no description ** 1.1627 5.0641 4.41E-02 1.0000 0.0000 0.00E+00 9.94E-01 0.0083 -0.1082 0.1090
125 212570_at KIAA0830 KIAA0830 protein 1.0000 0.0000 4.49E-02 1.2827 5.3405 4.49E-02 3.02E-01 -1.0690 -0.6966 0.2309
126 244553_at ** no description ** 1.1397 5.0518 4.67E-02 1.2518 6.4213 5.37E-04 3.56E-01 -0.9510 -0.1984 0.0756
Proxima-Distal Cecum-Rectum Validation
Table 2. List of probesets differentially expressed lower in proximal tissues relative to distal tissues in the discovery set. The last four columns report the evaluation of each probeset in the validation data, including the low and high estimates of 95th confidence interval.
Page 42 of 43

43 - LaPointe
END OF DOCUMENT
Page 43 of 43


