Embed Size (px)
Citation preview
RESEARCH ARTICLE
Mapping Isoflavone QTL with Main, Epistaticand QTL × Environment Effects inRecombinant Inbred Lines of SoybeanYanWang1‡, Yingpeng Han1‡, Xue Zhao1, Yongguang Li1, Weili Teng1, Dongmei Li1,Yong Zhan2*, Wenbin Li1*
1 Key Laboratory of Soybean Biology in Chinese Ministry of Education, Northeast Agricultural University,Harbin, Heilongjiang Province, People’s Republic of China; Key Laboratory of Soybean Biology andBreeding/Genetics of Chinese Agriculture Ministry, Northeast Agricultural University, Harbin, HeilongjiangProvince, People’s Republic of China, 2 Agricultural Science Academy of Shi He Zi, Xinjiang Province,People’s Republic of China
‡ These authors contributed equally to this work.* [email protected] (WL); [email protected] (YZ)
AbstractSoybean (Glycine max (L.) Merr.) isoflavone is important for human health and plant de-
fense system. To identify novel quantitative trait loci (QTL) and epistatic QTL underlying iso-
flavone content in soybean, F5:6, F5:7 and F5:8 populations of 130 recombinant inbred (RI)
lines, derived from the cross of soybean cultivar ‘Zhong Dou 270 (high isoflavone) and ‘Jiu
Nong 200 (low isoflavone), were analyzed with 95 new SSRmarkers. A new linkage map in-
cluding 194 SSR markers and covering 2,312 cM with mean distance of about 12 cM be-
tween markers was constructed. Thirty four QTL for both individual and total seed
isoflavone contents of soybean were identified. Six, seven, ten and eleven QTL were asso-
ciated with daidzein (DZ), glycitein (GC), genistein (GT) and total isoflavone (TI), respective-
ly. Of them 23 QTL were newly identified. The qTIF_1 between Satt423 and Satt569 shared
the same marker Satt569 with qDZF_2, qGTF_1 and qTIF_2. The qGTD2_1 between
Satt186 and Satt226 was detected in four environments and explained 3.41%-10.98% of
the phenotypic variation. The qGTA2_1, overlapped with qGCA2_1 and detected in four en-
vironments, was close to the previously identified major QTL for GT, which were responsible
for large a effects. QTL (qDZF_2, qGTF_1 and qTIF_2) between Satt144-Satt569 were ei-
ther clustered or pleiotropic. The qGCM_1, qGTM_1 and qTIM_1 between Satt540-
Sat_244 explained 2.02%–9.12% of the phenotypic variation over six environments. More-
over, the qGCE_1 overlapped with qGTE_1 and qTIE_1, the qTIH_2 overlapped with
qGTH_1, qGCI_1 overlapped with qDZI_1, qTIL_1 overlapped with qGTL_1, and qTIO_1
overlapped with qGTO_1. In this study, some of unstable QTL were detected in different en-
vironments, which were due to weak expression of QTL, QTL by environment interaction in
the opposite direction to a effects, and/or epistasis. The markers identified in multi-
environments in this study could be applied in the selection of soybean cultivars for higher
isoflavone content and in the map-based gene cloning.
PLOS ONE | DOI:10.1371/journal.pone.0118447 March 4, 2015 1 / 15
OPEN ACCESS
Citation:Wang Y, Han Y, Zhao X, Li Y, Teng W, Li D,et al. (2015) Mapping Isoflavone QTL with Main,Epistatic and QTL × Environment Effects inRecombinant Inbred Lines of Soybean. PLoS ONE10(3): e0118447. doi:10.1371/journal.pone.0118447
Academic Editor: David A Lightfoot, College ofAgricultural Sciences, UNITED STATES
Received: October 1, 2014
Accepted: January 16, 2015
Published: March 4, 2015
Copyright: © 2015 Wang et al. This is an openaccess article distributed under the terms of theCreative Commons Attribution License, which permitsunrestricted use, distribution, and reproduction in anymedium, provided the original author and source arecredited.
Data Availability Statement: All relevant data arewithin the paper.
Funding: This study was financially supported byNational Key Project (2014BAD22B01). The funderhad no role in study design, data collection andanalysis, decision to publish, or preparation of themanuscript.
Competing Interests: The authors have declaredthat no competing interests exist.

IntroductionSoy food is considered as the functional food because it contains health beneficial moleculessuch as isoflavone [1–2]. Human nutrition studies have shown that isoflavone plays an impor-tant role in preventing a number of chronic diseases [3–5]. Meanwhile, isoflavone has been ap-proved to be a critical factor in defending against plant pests [6–9], in promoting nodulationby rhizobia [10–12], and in changing or adjusting the microorganisms found around plantroots [13]. Soybean isoflavone include daidzein (DZ), genistein (GT), glycitein (GC), daidzin,genistin, glycitin, 6-o-acetyldaidzin, 6-o-acetylgenistin, 6-o-acetylglycitin, 6-o-malonyldaidzin,6-o-malonylgenistin and 6-o-malonylglycitin. Among them, DZ, GT and GC are the majorbioactive components in human nutrition. Soybean isoflavone concentrations are heritable butbehave as complex quantitative traits [14–18] regulated by multiple environmental and geneticfactors [1, 19–23]. Hence, selection for soybean cultivars with varied seed isoflavone contentsrequired evaluation in multiple environments over several years, which is expensive, time-consuming and labor intensive.
Traditional methods of genetic improvement of quantitative traits were mainly dependenton phenotypic information [24], which was readily affected by environmental factors. Molecu-lar markers offered a faster and more accurate approach for breeding, because selection couldbe based on genotype rather than solely on phenotype. The use of molecular markers in the se-lection of important agronomic traits, or marker-assisted selection (MAS) could improve theefficiency of traditional plant breeding [25–27]. However, the use of MAS requires knowledgeof reliable marker-trait associations that are relatively stable over multiple environments, be-cause constant QTL over multiple environments might contribute to a consistent phenotypebeneath changing conditions.
An individual QTL is described as ‘major’ or ‘minor’ is based on the proportion of the phe-notypic variation explained by a QTL (based on the R2 value). Major QTL will account for arelatively large amount of R2 value (R2 > 10%), while minor QTL will usually account for a rel-atively small amount of R2 value (R2 < 10%) [28]. Sometimes, major QTL may refer to QTLthat is stable across environments whereas minor QTL may refer to QTL that is environmen-tally sensitive [28]. Because soybean seed isoflavone accumulation is mainly dominated byminor-effect QTL that are often influenced by environment, discovering a stable QTL has beenhindered. Therefore, it is imperative to identify some stable loci associated with isoflavone con-tent in different environments.
To boost QTL detection, appropriate crosses need to be selected to generate sufficient genet-ic variations in genomic level [29]. Although a linkage map is not strictly required for MAS, adense marker genetic map greatly facilitates strong marker—gene correlations by permittingthe utilization of improved QTL mapping approaches [30].
Over fifty QTLs underlying individual and/or individual and total isoflavone content havebeen reported [14–17, 31–37]. Among them, two QTL with main effects, located in Gm05 (soy-bean chromosome 5, LGA1) and Gm08 (LGA2), respectively, consistently affected isoflavonecontent across multi-environments [30, 35]. Striking eQTL hotspots associated with soybeanseed-specific expression on Gm 20, 7, and 13 were discovered by Bolon et al. [38]. Wang et al.[39] identified seven candidate genes on Gm13 (LG F) and assumed Gm13 could be a hotspotof gene cluster that regulated seed isoflavone content.
Epitasis is also thought to contribute to isoflavone variation [17]. The result of some studiesindicated that significant QTL epistatic interactions influenced isoflavone content in soybeanseed [17, 32]. Hence, the isoflavone content in soybean seed is considered as complex quantita-tive trait because their levels are highly variable and regulated by multiple genetic and environ-mental factors [1, 19–23].
Mapping Isoflavone QTL in Soybean RI Lines
PLOS ONE | DOI:10.1371/journal.pone.0118447 March 4, 2015 2 / 15

Zeng et al. [31] identified fifteen QTL underlying seed isoflavone contents of soybean basedon a RI line population derived from a cross between ‘Zhong Dou 270 and ‘Jiu Nong 200
through a genetic linkage map including 99 SSR markers. In the present work, 95 additionalSSR markers were added to the map of Zeng et al. [31] to identify novel QTL with main, epi-static or QTL × environment effects that associated with seed isoflavone contents of soybean.
Materials and Methods
Plant materials and growing conditionsThe mapping populations of 130 F5:6, F5:7, F5:8 recombinant inbred lines (RIL) that were ad-vanced by single-seed-descent from the cross between ‘Zhong Dou 270 (developed by the Chi-nese Academy of Agricultural Sciences, Beijing, China) and ‘Jiu Nong 200 (developed by JilinAcademy of Agricultural Sciences, Jilin, China). ‘Zhong Dou 270 contained high individual andtotal isoflavone (TI) contents (daidzein, DZ, 1,865 μg/g; genistein, GT, 1,614 μg/g; glycitein,GC, 311 μg/g and total isoflavone, TI, 3,791 μg/g), whereas ‘Jiu Nong 200 had low individualand TI contents (DZ, 844 μg/g; GT, 1,046 μg/g; GC, 193 μg/g and TI, 2,061 μg/g). The 130 RILsof F5:6, F5:7, F5:8 and parents were planted at Harbin, Hulan and Suihua in 2005, 2006 and 2007,respectively [31]. Randomized complete block designs were used for all experiments with rows3 m long, 0.65 m apart, and a space of 6 cm between plants.
The screening of simple sequence repeats (SSR) markersTotal DNA of the parents and each RI line were isolated from dried leaf tissues by CTABmeth-od [40]. A total of 500 additional SSR markers, covering the whole genome of soybean (availableat http://www.soybease.org), were used to detect polymorphisms. The PCR reactions were 94°Cfor 2 min, followed by 35 cycles of 30 s at 94°C, 30 s at 52°C, 30 s at 72°C and 5 min at 72°Cafter the last cycle. The amplified PCR products were mixed with loading buffer and denaturedfor 5 min at 94°C and then kept on ice for 5 min. The denatured PCR products were separatedon 6% (w/v) denaturing polyacrylamide gel and visualized by silver staining [41]. The polymor-phic SSR markers were integrated into the map constructed by Zeng et al. [31].
QTL analysesPolymorphic markers were identified and mapped on the 20 linkage groups by Mapmaker 3.0bwith the Kosambi mapping function [42]. WinQTLCart2.1 [43] was used to detect QTL be-tween marker intervals by 1,000 permutations at significance (P� 0.05). The genetic linkagemap was constructed using Mapchart 2.1 [44]. QTL genetic effects including additive, additive× additive epistatic effects and their environmental interaction effects were analyzed accordingto the method of Wang et al. [45]. The nomenclature of the QTL included four parts followingthe recommendations of the Soybean Germplasm Coordination Committee. For example,qDZI_1, q, DZ, I and 1 represent QTL, trait (daidzein, DZ), linkage group name and QTLorder in the linkage group, respectively.
GGE Bioplot methodology [46] was employed to analyze the interaction between QTL andenvironments, based on the formula: Tij − Tj / Sj = λ1zi1τj1 + λ2zi2τj2 + εij, where Tij was themean value of QTL i for environment j; Tj was the mean value of environment j over all QTL,Sj was the standard deviation of environment j among QTL mean; zi1 and zi2 were the PC1(first principle component) and PC2 (second principle component) scores respectively, forQTL mean i; τj1 and τj2 were the PC1 and PC2 scores respectively, for environment j; and εijwas the residual of the model associated with QTL i, challenged with environment j.
Mapping Isoflavone QTL in Soybean RI Lines
PLOS ONE | DOI:10.1371/journal.pone.0118447 March 4, 2015 3 / 15

Results
Linkage analysesIn this study, a total of 500 new SSR markers were used to detect polymorphisms between thetwo parents, 95 of which were integrated into the linkage map constructed by Zeng et al [31].This linkage map included 194 SSR markers and covered 2,312.16 cM with mean distance of11.92 cM between markers.
Identification of QTL for total and individual isoflavone contentsIn this study, the identification of QTL was based on multi-environmental phenotypic data ofZeng et al. [31]. Thirty four QTL underlying individual and total isoflavone contents were iden-tified on thirteen LGs in seven environments over three years (Table 1, Fig. 1). Among them,six, seven, ten and eleven QTL were associated with DZ, GC, GT and TI, respectively.
Three QTL (qDZF_2, qGTF_1, qTIF_2) associated with DZ, GT and TI were located onGm13 (LG F) between Satt144-Satt569. They explained 1.87%–17.03% of the phenotypic varia-tion in seven environments over three years. Another three QTL associated with GC, GT andTI were located on GM07 (LGM) between Satt540-Sat_244. They explained 2.02%–9.12% ofthe phenotypic variation across seven environments.
Among the 34 QTL, 23 QTL were newly identified. Most of them were detected in one ortwo environments and explained 1.43%-17.05% of the phenotypic variation. The qTIF_1 in theinterval between Satt423 and Satt569 shared the same marker Satt569 with qDZF_2, qGTF_1and qTIF_2. The qGTD2_1 between Satt186 and Satt226 was detected in four environmentsand explained 3.41%–10.98% of the phenotypic variation. The qGTA2_1 was detected in fourenvironments, which shared the same marker interval of Sat_040-Satt233 with qGCA2_1.
Interestingly, six pairs of QTL overlapped with each other and shared the same marker in-terval (Table 1, Fig. 1). For example, the qGCE_1 overlapped with qGTE_1 and qTIE_1 in theinterval between Sat_112 and Sat_380, the qGTO_1 overlapped with qTIO_1 in the interval be-tween Sat_221 and Satt241, the qDZI_2 overlapped with qGCI_1 in the interval betweenSatt330 and Satt239, the qGCA2_1 overlapped with GTA2_1 in the interval between Sat_040and Satt233, the qGTH_1 overlapped with qTIH_2 in the interval between Sat_334 andSatt253 and the qGTL_1 overlapped with qTIL_1 in the interval between Sat_113 and Sat_320.
QTL × environment interactionSix, seven, ten and eleven QTL associated with DZ, GC, GT and TI respectively, had additivemain effect (a) and/or additive × environment interaction effect (ae) at certain environments(Table 2). Two QTL (qDZI_2, qDZF_2) associated with DZ, two QTL (qGCE_1, qGCM_1) as-sociated with GC, four QTL (qGTD2_1, qGTF_1, qGTM_1, qGTA2_1) associated with GTand four QTL (qTIE_1, qTIL_1, qTIM_1, qTIF_2) associated with TI, contributed to the allelethat increased individual and total isoflavone through significant a effects. Three QTL(qDZC2_1, qDZI_1, qDZK_1) associated with DZ, one QTL (qGCI_1) associated with GC,two QTL (qGTL_1, qGTF_2) associated with GT and three QTL (qTIA2_1, qTID2_1,qTIO_1) associated with TI, contributed to the allele that decreased individual and total isofla-vone through significant a effects, respectively.
The impact of QTL ae effects was different across seven environments and three years. Forexample, the qDZF_2 increased DZ at Hulan in 2006, at Harbin in 2007 and at Suihua in 2007,but decreased DZ at Harbin in 2006, at Suihua in 2006 and at Hulan in 2007. One QTL(qDZF_1) associated with DZ, four QTL (qGCA2_1, qGCD1b_1, qGCN_1, qGCM_2) associ-ated with GC, four QTL (qGTC2_1, qGTE_1, qGTH_1, qGTO_1) associated with GC and
Mapping Isoflavone QTL in Soybean RI Lines
PLOS ONE | DOI:10.1371/journal.pone.0118447 March 4, 2015 4 / 15

Table 1. QTLs for individual and total isoflavone content.
Traitsa QTLb Gm (LG) Marker Marker interval Position c Environment g LOD score R2(%) d
DZ eqDZC2_1 06(C2) Sat_252 Sat_252-Sat_062 77.67 E1 2.09 5.60
E3 2.45 6.41
qDZF_1 13(F) Sat_103 Sat_103-Sat_262 188.34 E2 2.00 10.57
qDZI_2 20(I) Satt330 Satt330-Satt239 32.87 E1 3.49 7.82
E2 3.74 7.62
E7 2.24 9.93fqDZF_2 13(F) Satt144 Satt144-Satt569 14.15 E2 4.15 8.01
E3 4.68 9.00
E4 2.76 2.98
E5 2.17 3.01
E6 4.73 10.32
E7 2.78 8.75
qDZI_1 20(I) Satt587 Satt587-Satt623 55.38 E3 4.90 9.23
E5 2.80 6.52
E6 2.04 8.78
E7 2.38 5.03
qDZK_1 09(K) Satt124 Satt124-Satt725 60.35 E2 2.46 1.64
E6 3.68 4.82
E7 2.05 6.43
GC eqGCA2_1 08(A2) Sat_040 Sat_040-Satt233 38.46 E3 2.65 6.01
qGCD1b_1 02(Dlb) Satt546 Satt546-Sat_459 215.67 E2 2.38 3.12
E5 2.21 4.17
qGCE_1 15(E) Sat_124 Sat_124-Sat_380 16.21 E1 2.34 2.33
E4 2.02 8.49
E7 2.03 1.43
qGCN_1 03(N) Satt530 Satt530-Sat_304 34.57 E4 2.41 5.21
qGCM_2 07(M) Sct_147 Sct_147-Satt323 30.66 E1 3.20 7.01
E4 4.44 2.87f qGCI_1 20(I) Satt330 Satt330-Satt239 32.92 E1 3.89 5.01
E3 2.33 6.67
E4 2.43 5.32
E5 2.26 2.16
qGCM_1 07(M) Satt540 Satt540-Sat_244 2.37 E2 2.77 2.02
E4 2.11 6.42
E5 3.48 4.45
E7 3.56 4.21
GT e qGTC2_1 06(C2) Satt307 Satt307-Sat_336 5.86 E6 2.48 15.16
qGTD2_1 17(D2) Satt186 Satt186-Satt226 50.81 E1 2.00 3.41
E2 2.36 5.23
E3 5.76 10.98
E5 3.09 8.23
qGTE_1 15(E) Sat_124 Sat_124-Sat_380 15.61 E7 2.58 5.37
qGTF_2 13(F) Satt149 Satt149-Sat_234 41.23 E1 2.00 1.56
E3 2.49 4.17
E7 4.03 5.47
qGTH_1 12(H) Sat_334 Sat_334-Satt253 37.65 E4 2.97 17.05
(Continued)
Mapping Isoflavone QTL in Soybean RI Lines
PLOS ONE | DOI:10.1371/journal.pone.0118447 March 4, 2015 5 / 15
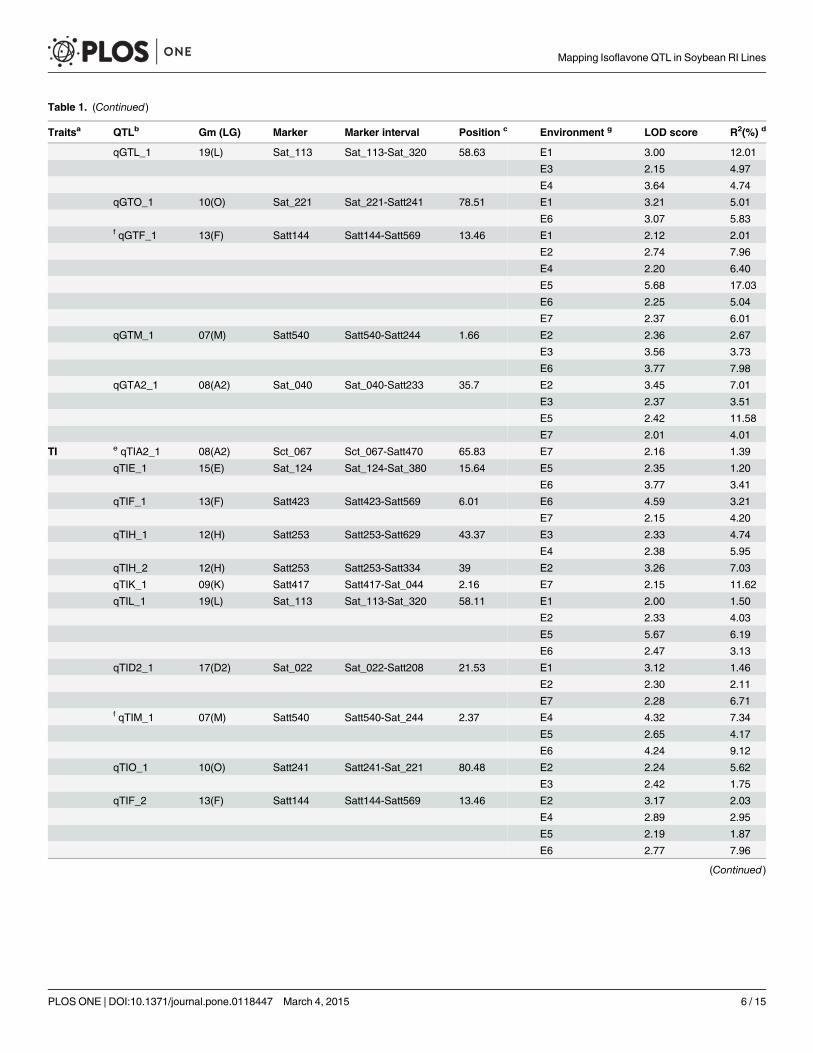
Table 1. (Continued)
Traitsa QTLb Gm (LG) Marker Marker interval Position c Environment g LOD score R2(%) d
qGTL_1 19(L) Sat_113 Sat_113-Sat_320 58.63 E1 3.00 12.01
E3 2.15 4.97
E4 3.64 4.74
qGTO_1 10(O) Sat_221 Sat_221-Satt241 78.51 E1 3.21 5.01
E6 3.07 5.83f qGTF_1 13(F) Satt144 Satt144-Satt569 13.46 E1 2.12 2.01
E2 2.74 7.96
E4 2.20 6.40
E5 5.68 17.03
E6 2.25 5.04
E7 2.37 6.01
qGTM_1 07(M) Satt540 Satt540-Satt244 1.66 E2 2.36 2.67
E3 3.56 3.73
E6 3.77 7.98
qGTA2_1 08(A2) Sat_040 Sat_040-Satt233 35.7 E2 3.45 7.01
E3 2.37 3.51
E5 2.42 11.58
E7 2.01 4.01
TI e qTIA2_1 08(A2) Sct_067 Sct_067-Satt470 65.83 E7 2.16 1.39
qTIE_1 15(E) Sat_124 Sat_124-Sat_380 15.64 E5 2.35 1.20
E6 3.77 3.41
qTIF_1 13(F) Satt423 Satt423-Satt569 6.01 E6 4.59 3.21
E7 2.15 4.20
qTIH_1 12(H) Satt253 Satt253-Satt629 43.37 E3 2.33 4.74
E4 2.38 5.95
qTIH_2 12(H) Satt253 Satt253-Satt334 39 E2 3.26 7.03
qTIK_1 09(K) Satt417 Satt417-Sat_044 2.16 E7 2.15 11.62
qTIL_1 19(L) Sat_113 Sat_113-Sat_320 58.11 E1 2.00 1.50
E2 2.33 4.03
E5 5.67 6.19
E6 2.47 3.13
qTID2_1 17(D2) Sat_022 Sat_022-Satt208 21.53 E1 3.12 1.46
E2 2.30 2.11
E7 2.28 6.71f qTIM_1 07(M) Satt540 Satt540-Sat_244 2.37 E4 4.32 7.34
E5 2.65 4.17
E6 4.24 9.12
qTIO_1 10(O) Satt241 Satt241-Sat_221 80.48 E2 2.24 5.62
E3 2.42 1.75
qTIF_2 13(F) Satt144 Satt144-Satt569 13.46 E2 3.17 2.03
E4 2.89 2.95
E5 2.19 1.87
E6 2.77 7.96
(Continued)
Mapping Isoflavone QTL in Soybean RI Lines
PLOS ONE | DOI:10.1371/journal.pone.0118447 March 4, 2015 6 / 15

four QTL (qTIF_1, qTIH_1, qTIH_2, qTIK_1) associated with TI, had only significant ae ef-fects rather than significant a effects. Other QTL in seven environments had both significant aeffects and significant ae effects.
Epistatic analyses of QTL across multi-environmentsSix, seven, six and nine epistatic pairwise QTL were associated with DZ, GC, GT and TI con-tent, respectively, in different environments (Table 3). Of them, three, one, three and three epi-static pairs of QTL positively increased DZ, GC, GT and TI content through significant aaeffects in different environments, respectively. One, one, one and two epistatic pairs of QTL de-creased DZ, GC, GT and TI content, respectively, through significant aa effects in different en-vironments (Table 3).
The epistasis × environment interaction effect (aae) was an important component of QTL ×environment (QE) interaction effects. One QTL and one pairs of QTL were found with onlyepistatic effects (aa), which was associated with DZ and TI content. Two, four, two and fourpairs of QTL were found with only epistatic effects (aa), which was associated with DZ, GC,GT and TI content, respectively.
Stability evaluation of QTL associated with individual and total isoflavonecontents across mutli-environmentsGGE Biplot analysis [46] of seven novel main QTL for individual and total isoflavone contentsagainst seven environments showed that these QTL explained 59% of the total variation of seedisoflavone (Fig. 2). The performance of QTL at each environment was evaluated. When QTL(qTIL_1, qGTD2_1, qDZI_2, qGCE_1 and qTID2_1) were set as the corner QTL, seven differ-ent environments fell in the sector in which the QTL qGTD2_1 was the best QTL for two envi-ronments (at Harbin in 2005 and at Hulan in 2006, Fig. 2). The qTIL_1 was the best QTL atHarbin in 2006 and at Suihua in 2007, and the qTID2_1 was the best one at Hulan in 2007.
DiscussionSoybean isoflavones have multiple uses in food, medicine, cosmetics and animal husbandry[47]. Improving seed isoflavone content, therefore, should be appeared to be a useful target ofsoybean breeding. MAS based on genotype selection rather than solely on phenotype providedan outstanding perspective in soybean breeding [30].
‘Zhong Dou 270 was proved to have high-isoflavone content (3,791 μg/g isoflavone in seed)among seven environments in our previous report [31]. Meng et al. [34] identified two QTL
Table 1. (Continued)
Traitsa QTLb Gm (LG) Marker Marker interval Position c Environment g LOD score R2(%) d
E7 2.45 3.87
a DZ: Daidzein; GC:Glycitein; GT: Genistein; TI: Total isoflavoneb The nomenclature of the QTL included four parts: QTL, trait, linkage group name and QTL order in the linkage group, respectivelyc Position from the left marker of the interval on each linkage groupd Proportion of phenotypic variance (R2) explained by a QTLe Additional QTL for individual and total isoflavone contentf QTL in accordance with Zeng et al. [30]g E1: at Harbin in 2005, E2: at Harbin in 2006, E3: at Hulan in 2006, E4:at Suihua in 2006, E5: at Harbin in 2007, E6: at Hulan in 2007, E7: at Suihua in
2007
doi:10.1371/journal.pone.0118447.t001
Mapping Isoflavone QTL in Soybean RI Lines
PLOS ONE | DOI:10.1371/journal.pone.0118447 March 4, 2015 7 / 15
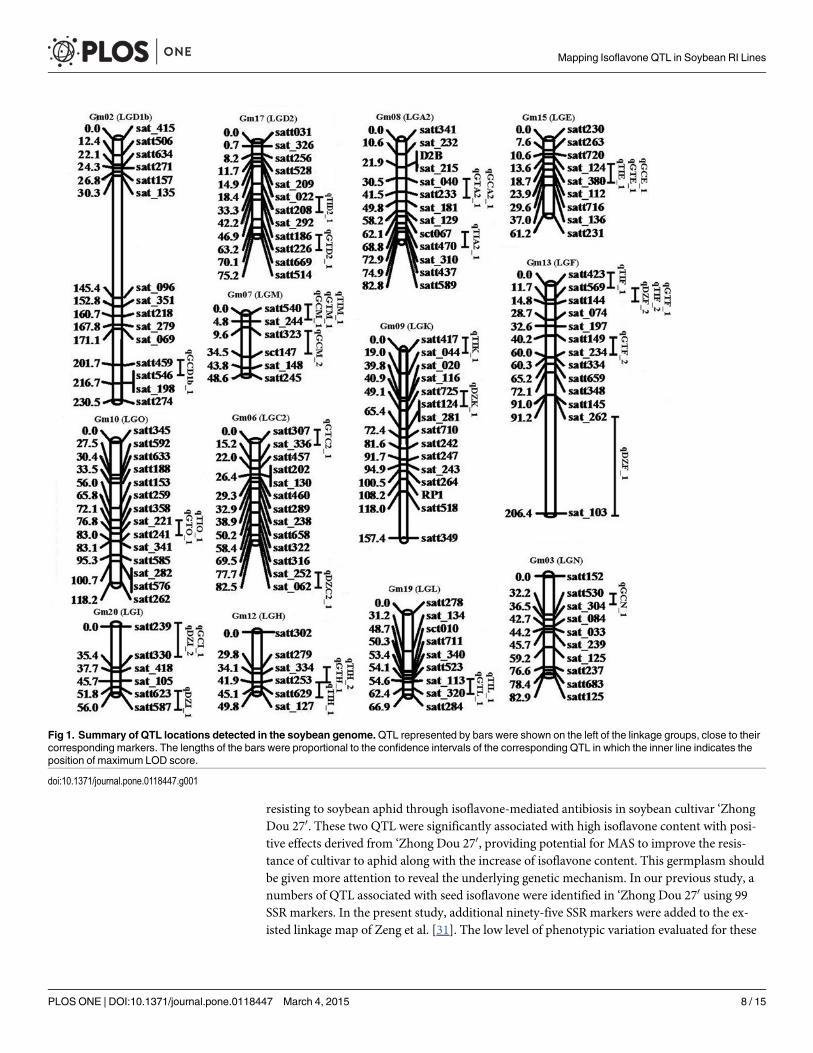
resisting to soybean aphid through isoflavone-mediated antibiosis in soybean cultivar ‘ZhongDou 270. These two QTL were significantly associated with high isoflavone content with posi-tive effects derived from ‘Zhong Dou 270, providing potential for MAS to improve the resis-tance of cultivar to aphid along with the increase of isoflavone content. This germplasm shouldbe given more attention to reveal the underlying genetic mechanism. In our previous study, anumbers of QTL associated with seed isoflavone were identified in ‘Zhong Dou 270 using 99SSR markers. In the present study, additional ninety-five SSR markers were added to the ex-isted linkage map of Zeng et al. [31]. The low level of phenotypic variation evaluated for these
Fig 1. Summary of QTL locations detected in the soybean genome.QTL represented by bars were shown on the left of the linkage groups, close to theircorresponding markers. The lengths of the bars were proportional to the confidence intervals of the corresponding QTL in which the inner line indicates theposition of maximum LOD score.
doi:10.1371/journal.pone.0118447.g001
Mapping Isoflavone QTL in Soybean RI Lines
PLOS ONE | DOI:10.1371/journal.pone.0118447 March 4, 2015 8 / 15

Table 2. Additive and additive × environment interaction effect of QTL associated with individual and total isoflavone at RIL population.
Traita QTLb Gm (LG) Marker Marker interval ac a×E1d, e a×E2 a×E3 a×E4 a×E5 a×E6 a×E7
DZ qDZC2_1 06(C2) Sat_252 Sat_252-Sat_062 -0.27* 0.23* -0.19*
qDZF_1 13(F) Sat_103 Sat_103-Sat_262 -0.10*
qDZI_2 20(I) Satt330 Satt330-Satt239 1.00** 0.30* 0.70** -0.98**
qDZF_2 13(F) Satt144 Satt144-Satt569 1.01** -0.61** 0.21* -0.20* 0.59** -0.92** 0.90**
qDZI_1 20(I) Satt587 Satt587-Satt623 -0.32* 0.74** 0.21* -0.19* -0.78**
qDZK_1 09(K) Satt124 Satt124-Satt725 -0.17* 0.34* -0.65** 0.30*
GC qGCA2_1 08(A2) Sat_040 Sat_040-Satt233 -0.08**
qGCD1b_1 02(Dlb) Satt546 Satt546-Sat_459 -0.40* 0.67** -0.26*
qGCE_1 15(E) Sat_124 Sat_124-Sat_380 1.00** 0.15* -0.96** 0.79**
qGCN_1 03(N) Satt530 Satt530-Sat_304 0.12*
qGCM_2 07(M) Sct_147 Sct_147-Satt323 0.57** -0.54**
qGCI_1 20(I) Satt330 Satt330-Satt239 -0.24* 0.97** 0.86** -1.24** -0.58*
qGCM_1 07(M) Satt540 Satt540-Sat_244 0.74** 0.60** -0.59** -0.98** 1.00**
GT qGTC2_1 06(C2) Satt307 Satt307-Sat_336 0.12* -0.13*
qGTD2_1 17(D2) Satt186 Satt186-Satt226 0.98** -0.98* 0.14* 0.71**
qGTE_1 15(E) Sat_124 Sat_124-Sat_380 0.09*
qGTF_2 13(F) Satt149 Satt149-Sat_234 -0.34* 0.18* -0.09* -0.09*
qGTH_1 12(H) Sat_334 Sat_334-Satt253 -0.10*
qGTL_1 19(L) Sat_113 Sat_113-Sat_320 -0.13* -0.36* 0.20* 0.15*
qGTO_1 10(O) Sat_221 Sat_221-Satt241 -0.18* 0.17*
qGTF_1 13(F) Satt144 Satt144-Satt569 1.00** 0.98* -0.84** -0.12* -1.00** 0.53** 0.49**
qGTM_1 07(M) Satt540 Satt540-Satt244 0.56** -1 0.83** 0.18*
qGTA2_1 08(A2) Sat_040 Sat_040-Satt233 0.67** 0.87* -0.42* -1.00** 0.57**
TI qTIA2_1 08(A2) Sct_067 Sct_067-Satt470 -0.12* -0.32* 0.30* -0.13*
qTIE_1 15(E) Sat_124 Sat_124-Sat_380 0.39* 0.21* 0.19*
qTIF_1 13(F) Satt423 Satt423-Satt569 1.08** -1.00**
qTIH_1 12(H) Satt253 Satt253-Satt629 0.67** -0.68**
qTIH_2 12(H) Satt253 Satt253-Satt334 0.07*
qTIK_1 09(K) Satt417 Satt417-Sat_044 -0.14*
qTIL_1 19(L) Sat_113 Sat_113-Sat_320 0.78** 0.18* -0.21* 1.00* -0.97**
qTID2_1 17(D2) Sat_022 Sat_022-Satt208 -0.34* 0.58** -0.23* -0.36*
qTIM_1 07(M) Satt540 Satt540-Sat_244 0.54** 0.12* 0.67** -0.80**
qTIO_1 10(O) Satt241 Satt241-Sat_221 -0.19* -0.76** 0.78**
qTIF_2 13(F) Satt144 Satt144-Satt569 1.21** 0.31* -0.55* 0.26* 0.76* -0.71*
*Significant at P = 0.05,
**Significant at P = 0.01, respectively.a DZ: Daidzein; GC:Glycitein; GT: Genistein; TI: Total isoflavone.b The nomenclature of the QTL included four parts: QTL, trait, linkage group name and QTL order in the linkage group, respectively.c a: additive effect.d a×E: additive × environment effect.e E1: at Harbin in 2005, E2: at Harbin in 2006, E3: at Hulan in 2006, E4: at Suihua in 2006, E5: at Harbin in 2007, E6: at Hulan in 2007, E7: at Suihua in
2007.
doi:10.1371/journal.pone.0118447.t002
Mapping Isoflavone QTL in Soybean RI Lines
PLOS ONE | DOI:10.1371/journal.pone.0118447 March 4, 2015 9 / 15

Tab
le3.
Additive
×ad
ditive
epistatic
effect
andtheiren
vironmen
talinteractioneffect
ofQTLas
sociated
withindividual
andtotaliso
flav
oneat
RIL
population.
Traitsa
QTLib
Gm
(LG)
Marke
rMarke
rinterval
QTLJb
Gm
(LG)
Marke
rMarke
rinterval
aac
aa×E
1d,e
aa×E
2aa
×E3
aa×E
4aa
×E5
aa×E
6aa
×E7
DZ
qDZC2_
106
(C2)
Sat_2
52Sat_2
52-
Sat_0
62qD
ZI_2
20(I)
Satt330
Satt330
-Satt239
-0.29*
qDZF_2
13(F)
Sat_1
03Sat_1
03-
Sat_2
620.98
**0.17
*-0.92*
*
qDZI_2
20(I)
Satt330
Satt330
-Satt239
qDZF_2
13(F)
Satt144
Satt144
-Satt569
0.98
**0.88
**0.23
*-0.19*
-0.32*
qDZI_1
20(I)
Satt587
Satt587
-Satt623
0.34
*-0.56*
*
qDZK_1
09(K)
Satt124
Satt124
-Satt725
0.45
*-0.31*
qDZF_2
13(F)
Satt144
Satt144
-Satt569
qDZI_1
20(I)
Satt587
Satt587
-Satt623
1.00
**0.98
**-1.01*
*0.41
*-0.31*
0.17
*
GC
qGCD1b
_102
(Dlb)
Satt546
Satt546
-Sat_45
9qG
CE_1
15(E)
Sat_1
24Sat_1
24-
Sat_3
80-0.21*
qGCI_1
20(I)
Satt330
Satt330
-Satt239
0.33
*
qGCE_1
15(E)
Sat_1
24Sat_1
24-
Sat_3
80qG
CN_1
03(N
)Satt530
Satt530
-Sat_3
04-0.54*
*1.00
**
qGCM_1
07(M
)Satt540
Satt540
-Sat_2
440.34
*-0.28*
-0.17*
qGCN_1
03(N
)Satt530
Satt530
-Sat_30
4qG
CI_1
20(I)
Satt330
Satt330
-Satt239
0.78
**
qGCM_2
07(M
)Sct_1
47Sct_1
47-Satt323
qGCI_1
20(I)
Satt330
Satt330
-Satt239
0.98
**
qGCI_1
20(I)
Satt330
Satt330
-Satt239
qGCM_1
07(M
)Satt540
Satt540
-Sat_2
44-0.12*
-0.68*
*-0.99*
*0.25
*
GT
qGTD2_
117
(D2)
Satt186
Satt186
-Satt226
qGTL_
119
(L)
Sat_1
13Sat_1
13-
Sat_3
20-0.17*
0.23
*-0.67*
*0.98
**-0.12*
qGTF_1
13(F)
Satt144
Satt144
-Satt569
0.78
**-0.28*
0.43
*-0.12*
0.67
**
qGTF_2
13(F)
Satt149
Satt149
-Sat_23
4qG
TM_1
07(M
)Satt540
Satt540
-Satt244
0.18
*0.09
*
qGTO_1
10(O
)Sat_2
21Sat_2
21-Satt241
qGTA2_
108
(A2)
Sat_0
40Sat_0
40-Satt233
0.09
*
qGTF_1
13(F)
Satt144
Satt144
-Satt569
qGTM_1
07(M
)Satt540
Satt540
-Satt244
0.54
**0.12
*0.48
**0.99
**-0.16*
qGTA2_
108
(A2)
Sat_0
40Sat_0
40-Satt233
0.23
*0.30
*0.17
*-0.25*
TI
qTIA2_
108
(A2)
Sct_0
67Sct_0
67-Satt470
qTIE_1
15(E)
Sat_1
24Sat_1
24-
Sat_3
80-0.23*
-0.18*
0.65
**
qTIL_1
19(L)
Sat_1
13Sat_1
13-
Sat_3
200.67
**-0.45*
*0.20
*1.00
**
qTID2_
117
(D2)
Sat_0
22Sat_0
22-Satt208
0.11
*
qTIE_1
15(E)
Sat_1
24Sat_1
24-
Sat_3
80qT
IL_1
19(L)
Sat_1
13Sat_1
13-
Sat_3
20-0.27*
0.18
*
qTIH_1
12(H
)Satt253
Satt253
-Satt629
qTIO
_110
(O)
Satt241
Satt241
-Sat_2
21-0.09*
qTIF_2
13(F)
Satt144
Satt144
-Satt569
0.18
*
qTIL_1
19(L)
Sat_1
13Sat_1
13-
Sat_3
20qT
ID2_
117
(D2)
Sat_0
22Sat_0
22-Satt208
-0.09*
0.07
*0.34
*0.31
*
qTIO
_110
(O)
Satt241
Satt241
-Sat_2
210.18
*
qTIM
_107
(M)
Satt540
Satt540
-Sat_24
4qT
IO_1
10(O
)Satt241
Satt241
-Sat_2
210.17
*0.12
*0.06
*-0.76*
*Significa
ntat
P=0.05
,
**Significa
ntat
P=0.01
,res
pectively.
aDZ:D
aidz
ein;
GC:G
lycitein;G
T:G
enistein;T
I:Total
isofl
avon
e.bThe
nomen
clatureof
theQTLinclud
edfour
parts:
QTL,
trait,linka
gegrou
pna
mean
dQTLorde
rin
thelinka
gegrou
p,resp
ectively.
caa
:add
itive
×ad
ditiveeffect.
daa
×E:a
a×en
vironm
ente
ffect.
eE1:
atHarbinin
2005
,E2:
atHarbinin
2006
,E3:
atHulan
in20
06,E
4:at
Suihu
ain
2006
,E5:
atHarbinin
2007
,E6:
atHulan
in20
07,E
7:at
Suihu
ain
2007
.
doi:10.1371/journal.pone.0118447.t003
Mapping Isoflavone QTL in Soybean RI Lines
PLOS ONE | DOI:10.1371/journal.pone.0118447 March 4, 2015 10 / 15

QTL in this study (<10%) was indicative of the quantitative nature of individual and total iso-flavone, which was similar to the other studies [14–17, 31–36].
qDZF_2, qGTF_1 and qTIF_2 between Satt144-Satt569, and qGCM_1, qGTM_1 andqTIM_1 between Satt540-Sat_244, were identified in multiple environments (Fig. 1). TheseQTL detected by Satt540 and QTL detected by Satt144 on LGM and on LG F in this studywere the same or similar to that of our previous studies [31–34, 39], which provided a valuableresource for MAS to develop soybean varieties with high seed isoflavone content. Previously,two major QTL consistently affected isoflavone content across multiple environments weremapped on Gm05 (LG A1) and Gm08 (LG A2) by Gutierrez et al. [30] and Yang et al. [35], re-spectively. Here, we mapped three new QTL (qTIA2_1 located in Sct_067-Satt470; qGCA2_1and qGTA2_1 located in Sat_040-Satt233) associated with individual and total isoflavone. TheqGTA2_1 was detected in four environments and explained 3.51%-11.58% of the phenotypicvariation. This QTL was near to the major locus identified by Yang et al. [35] that controlledthe same trait GT, suggesting that qGTA2_1 might be an enzyme-related locus. The qGCA2_1and qGTA2_1 were identified between the same marker interval of Sat_040-Satt233, implyingthat there could be some genetic factors regulating the accumulation of GC and GT. These sta-ble QTL were responsible for large a effects (Table 2). As suggested by Tanksley [48], QTL withhigher a effects are more likely to be stable across multiple environments. Most of the QTL dis-cussed above with higher a effects (Significant at P = 0.01) were stable across at least three envi-ronments (Tables 1 and 2). These seven novel major QTL were selected to do the GGE Bioplotanalysis, and only explaineding 59% of the G and G × E variation of seed isoflavone, which waslower than other’s studies [23, 31]. This could be caused by few QTL involved. The contribu-tion of G and G × E to seed isoflavone phenotypic variation could be increased to 79% after the
Fig 2. GT biplot analysis for the relatedness of QTL and environment. PC1: first principle component,PC2: second principle component.
doi:10.1371/journal.pone.0118447.g002
Mapping Isoflavone QTL in Soybean RI Lines
PLOS ONE | DOI:10.1371/journal.pone.0118447 March 4, 2015 11 / 15

excluding of E4 (maybe a mega environment), indicating that E4 had significant influence onisoflavone content (S1 Fig.). Moreover, in order to examine the accuracy of the results by GGEBiplot analysis, QTLNetwork 2.0 software [49] was used to analyze the interaction betweenQTL and environments, and the result was similar to GGE Biplot results (S1 Table), indicatingthat QTL detected in multiple environments were more stable.
Among the newly identified QTL, the qTIF_1 shared the same marker Satt569 withqDZF_2, qGTF_1 and qTIF_2 in multi-environments, suggesting that there are some geneticelements, such as genes or factors could affect the accumulation of DZ, GT and TI (Table 1,Fig. 1). Additionally, six pairs of QTL overlapped with each other and shared the samemarker interval, inferring that some genetic elements could regulate the accumulation of differ-ent isoflavone components in these intervals (Table 1). Among the 23 newly identified QTL,five QTL intervals were completely overlapped with our previously reported eQTL and a totalof eleven candidate genes within the overlapped eQTL and QTL were identified [39]. For ex-ample, the newly identified QTL (qGCE_1, qGTE_1 and qTIE_1) located in the interval ofSat_124- Sat_380 shared the same marker Sat_380 with the eQTL qF3HE_1, implying the F3Hgene in the phenylpropanoid pathway could affect the accumulation of GC, GT and TI.
In this study, many unstable QTL were detected in different environments (Table 1, Fig. 1),which were due to the weak expression of the QTL, QTL by environment interaction in the op-posite direction to a effects, and/or epistasis (Tables 2 and 3). Therefore, the information ofQTL by environment interaction should be considered if MAS was applied to the manipulationof quantitative traits. Since the 194 markers were not uniformly distributed, large gaps ap-peared with low marker density on chromosomes Gm02, 13 and 20, implying that more mark-ers should be developed among these gaps and the authenticity of QTL should befurther clarified.
The precise estimate of individual and total isoflavone content of soybean seed based onphenotype was difficult due to environment effect. Markers tightly linked to the QTL underly-ing isoflavone content would help to identify soybean lines containing higher isoflavone on thebasis of genotype, to maximize the effectiveness of selection. Identification of stable QTL inmulti-environments and fine mapping those loci could be desirable for identifying the underly-ing candidate genes or factors.
Supporting InformationS1 Fig. GGE Biplot analysis for the interaction of QTL and environment excluding E4.PC1: first principle component, PC2: second principle component.(TIF)
S1 Table. Additive × additive epistatic effect and their environmental interaction effect ofQTL associated with individual and total isoflavone at RIL population using QTLNetwork2.0 software.(DOCX)
AcknowledgmentsThis study was conducted in the Key Laboratory of Soybean Biology of Chinese EducationMinistry, Soybean Research & Development Center, CARS and the key Laboratory of North-eastern Soybean Biology and Breeding/Genetics of Chinese Agriculture Ministry.
Mapping Isoflavone QTL in Soybean RI Lines
PLOS ONE | DOI:10.1371/journal.pone.0118447 March 4, 2015 12 / 15

Author ContributionsConceived and designed the experiments: W. Li. Performed the experiments: YW XZ Y. Li D.Li. Analyzed the data: YW YHWT YZ. Contributed reagents/materials/analysis tools: W. Li.Wrote the paper: YW YH.
References1. Tsukamoto C, Shimada S, Igita K, Kudou S, Kokubun M, Okubo K, et al. Factors affecting isoflavone
content in soybean seeds: Changes in isoflavones, saponins, and composition of fatty acids at differenttemperatures during seed development. J Agric Food Chem. 1995; 43: 1184–1192.
2. Chen KI, Erh MH, Su NW, Liu WH, Chou CC, Cheng KC. Soyfoods and soybean products: from tradi-tional use to modern applications. Applied microbiology and biotechnology. 2012; 96(1): 9–22. doi: 10.1007/s00253-012-4330-7 PMID: 22872103
3. Munro IC, Harwood M, Hlywka JJ, Stephen AM, Doull J, FlammWG, et al. Soy isoflavones: a safety re-view. Nutr Rev. 2003; 61(1): 1–33. PMID: 12638461
4. Cederroth CR, Nef S. Soy, phytoestrogens and metabolism: A review. Mol Cell Endocrinol. 2009; 304(1–2): 30–42. doi: 10.1016/j.mce.2009.02.021 PMID: 19433254
5. Rochfort S, Panozzo J. Phytochemicals for health, the role of pulses. J Agric Food Chem. 2007; 55:7981–7994. PMID: 17784726
6. Helen A Stafford. Roles of Flavonoids in Symbiotic and Defense Functions in Legume Roots. TheBotan Rev. 1997; 63(1): 27–39.
7. Benhamou N, Nicole M. Cell biology of plant immunization against microbial infection: the potential ofinduced resistance in controlling plant diseases. Plant Physiol Biochem. 1999; 37(10): 703–719.
8. Subramanian S, Hu X, Lu G, Odelland JT, Yu O. The promoters of two isoflavone synthase genes re-spond differentially to nodulation and defense signals in transgenic soybean roots. Plant Mol Biol.2004; 54: 623–639. PMID: 15356384
9. Subramanian S, GrahamMY, Yu O, Graham TL. RNA interference of soybean isoflavone synthasegenes leads to silencing in tissues distal to the transformation site and to enhanced susceptibility toPhytophthora sojae. Plant Physiol. 2005; 137: 1345–1353. PMID: 15778457
10. Kosslak RM, Bookland R, Barkei J, Paaren H, Appelbaum ER. Induction of Bradyhizobium japonicumcommon nod genes by isolated fromGlycine max. Proc Natl Acad Sci USA. 1987; 84: 7428–7432.PMID: 16593884
11. Subramanian S, Stacey G, Yu O. Endogenous isoflavones are essential for the establishment of symbi-osis between soybean and Bradyrhizobium japonicum. Plant J. 2006; 48: 261–273. PMID: 17018035
12. Subramanian S, Stacey G, Yu O. Distinct, crucial roles of flavonoids during legume nodulation. TrendsPlant Sci. 2007; 12: 282–285. PMID: 17591456
13. Lozovaya VV, Lygin AV, Zernova OV, Li SX, Hartman GL,Widholm JM. Isoflavonoid accumulation insoybean hairy roots upon treatment with Fusarium solani. Plant Physiol Bioch. 2004; 42(7–8): 671–679.
14. Meksem K, Njiti VN, BanzWJ, Iqbal MJ, KassemMM, Hyten DL, et al. Genomic regions that underliesoybean seed isoflavone content. J Biomed Biotechnol. 2001; 1(1): 38–44. PMID: 12488625
15. KassemMA, Meksem K, Iqbal MJ, Njiti VN, BanzWJ, Winters TA, et al. Definition of soybean genomicregions that control seed phytoestrogen amounts. J Biomed Biotech. 2001; 1: 52–60.
16. KassemMA, Shultz J, Meksem K, Cho Y, Wood AJ, Iqbal MJ, et al. An updated ‘Essex’by‘Forrest’ link-age map and first composite interval map of QTL underlying six soybean traits. Theor Appl Genet.2006; 113: 1015–1026. PMID: 16953420
17. Primomo VS, Poysa V, Ablett GR, Jackson CJ, Gijzen M, Rajcan I. Mapping QTL for individual andtotal isoflavone content in soybean seeds. Crop Sci. 2005; 45: 2454–2462.
18. Gutierrez-Gonzalez JJ, Wu XL, Gillman JD, Lee JD, Zhong R, Yu O, et al. Intricate environment-modu-lated genetic networks control isoflavone accumulation in soybean seeds. BMC Plant Biology. 2010;10: 105–120. doi: 10.1186/1471-2229-10-105 PMID: 20540761
19. Hoeck JA, Fehr WR, Murphy PA, Welke GA. Influence of genotype and environment on isoflavone con-tents of soybean. Crop Sci. 2000; 40: 48–51.
20. Dhaubhadel S, McGarvey BD, Williams R, Gijzen M. Isoflavonoid biosynthesis and accumulation in de-veloping soybean seeds. Plant Mol Biol. 2003; 53: 733–743. PMID: 15082922
21. Mebrahtu T, Mohamed A, Wang CY, Andebrhan T. Analysis of isoflavone contents in vegetable soy-beans. Plant Foods HumNutrit. 2004; 59: 55–61. PMID: 15678752
Mapping Isoflavone QTL in Soybean RI Lines
PLOS ONE | DOI:10.1371/journal.pone.0118447 March 4, 2015 13 / 15

22. Lozovaya VV, Lygin AV, Ulanov AV, Nelson RL, Dayde J, Widhohm JM. Effect of temperature and soilmoisture status during seed development on soybean seed isoflavone concentration and composition.Crop Sci. 2005; 45: 1934–1940.
23. Murphy SE, Lee EA, Woodrow L, Seguin P, Kumar J, Rajcan I, et al. Genotype × Environment interac-tion and stability for isoflavone content in soybean. Crop Sci. 2005; 49:1313–1321.
24. Falconer DS, Mackay TFC, Frankham R. Introduction to quantitative genetics. Trends Genet 4. 1996;12(7): 280.
25. Varshney RK, Tuberosa R. Genomics-assisted Crop Improvement: Genomics applications in crops.Trend in Plant Science. 2005; 12(10): 621–630 PMID: 16290213
26. Wang CM, Bai ZY, He XP, Lin G, Xia JH, Sun F, et al. A high-resolution linkagemap for comparative ge-nome analysis and QTL fine mapping in Asian seabass, Lates calcarifer. BMCGenom. 2011; 12(1):174–191.
27. Janila P, Nigam SN, Pandey MK, Nagesh P, Varshney RK. Groundnut improvement: use of geneticand genomic tools. Frontiers in plant science. 2013; 4(23): 1–16.
28. Collard BCY, Jahufer MZZ, Brouwer JB, Pang ECK. An introduction to markers, quantitative trait loci(QTL) mapping and marker-assisted selection for crop improvement: The basic concepts. Euphytica.2005; 142: 169–196.
29. Liu P, Wang CM, Li L, Sun F, Yue GH. Mapping QTL for oil traits and eQTL for oleosin genes in jatro-pha. BMC Plant Biol. 2011; 11: 132–140. doi: 10.1186/1471-2229-11-132 PMID: 21958236
30. Gutierrez G JJ, Vuong TD, Zhong R, Yu O, Lee JD, Shannon G, et al. Major locus and other novel addi-tive and epistatic loci involved in modulation of isoflavone concentration in soybean seeds. Theor ApplGenet. 2011; 123: 1375–1385. doi: 10.1007/s00122-011-1673-x PMID: 21850478
31. Zeng G, Li D, Han Y, TengW, Wang J, Qiu L, et al. Identification of QTL underlying isoflavone contentsin soybean seeds among multiple environments. Theor Appl Genet. 2009; 118: 1455–1463. doi: 10.1007/s00122-009-0994-5 PMID: 19266178
32. Gutierrez G JJ, Wu X, Zhang J, Lee JD, Ellersieck M, Shannon JG, et al. Genetic control of soybeanseed isoflavone content: Importance of statistical model and epistasis in complex traits. Theor ApplGenet. 2009; 119(6): 1069–1083. doi: 10.1007/s00122-009-1109-z PMID: 19626310
33. Liang HZ, Yu YL, Wang SF, Lian Y, Wang TF, Wei YL, et al. QTL Mapping of isoflavone, oil and proteincontents in soybean (Glycine max L. Merr.). Agric Sci China. 2010; 9(8): 1108–1116.
34. Meng FL, Han YP TengWL, Li YG, Li WB. QTL underlying the resistance to soybean aphid (Aphis gly-cinesMatsumura) through isoflavone-mediated antibiosis in soybean cultivar ‘Zhongdou 270. TheorAppl Genet. 2011; 123: 1459–1465. doi: 10.1007/s00122-011-1680-y PMID: 21858470
35. Yang K, Moon JK, Jeong N, Chun HK, Kang ST, Back K, et al. Novel major quantitative trait loci regulat-ing the content of isoflavone in soybean seeds. Genes Genom. 2011; 33: 685–692.
36. Zhang JY, Ge YN, Sun JM, Han FX, Yu FK, Yan SR, et al. Identification of QTLs for major isoflavonecomponents among multiple environments in soybean seeds. Scientia Agricultura Sinica. 2012; 45(19): 3909–3920.
37. Akond M, Richard B, Ragin B, Herrera H, Kaodi U, Akbay C, et al. Additional quantitative trait loci andcandidate genes for seed isoflavone content in soybean. Journal of Agricultural Science. 2013; 5(11):20–33.
38. Bolon YT, Hyten DL, Orf JH, Vance CP, Muehlbauer GJ. eQTL networks reveal complex genetic archi-tecture in the immature soybean seed. Plant Genom 2. 2014; 7: 1–14.
39. Wang Y, Han Y, TengW, Zhao X, Li Y, Wu L, et al. Expression quantitative trait loci infer the regulationof isoflavone accumulation in soybean (Glycine max L.Merr.) seed. BMCGenomics. 2014; 15: 680.doi: 10.1186/1471-2164-15-680 PMID: 25124843
40. Doyle JJ. Isolation of plant DNA from fresh tissue. Focus. 1990; 12: 13–15.
41. Trigizano RN, Caetano-Anolles G. Laboratory exercises on DNA amplification fingerprinting for evaluat-ing the molecular diversity of horticultural species. Hort Technol. 1998; 8: 413–423.
42. Lander ES, Green P, Abrahamson J, Barlow A, Daly M, Lincoln S, et al. Mapmaker: an interactive com-puter package for constructing primary genetic linkage maps of experimental and natural populations.Genomics. 1987; 1: 174–181. PMID: 3692487
43. Zeng Z. Theoretical basis of separation of multiple linked gene effects on mapping quantitative trait loci.Proc Natl Acad Sci USA. 1993; 90: 10972–10976. PMID: 8248199
44. Voorrips R. MapChart: software for the graphical presentation of linkage maps and QTL. J Hered.2002; 93(1): 77–78. PMID: 12011185
45. Wang DL, Zhu J, Li ZK, Paterson AH. Mapping QTLs with epistatic effects and QTL × environment in-teractions by mixed linear model approaches. Theor App Genet. 1999; 99: 1255–1264.
Mapping Isoflavone QTL in Soybean RI Lines
PLOS ONE | DOI:10.1371/journal.pone.0118447 March 4, 2015 14 / 15

46. YanW. GGEbiplot-a windows application for graphical analysis of multi environment trial data andother types of two way data. Agron J. 2001; 93: 1111–1117.
47. Brouns F. Soya isoflavones a new and promising ingredient for the health food sector. Food Res Int.2002; 35(2–3): 187–193.
48. Tanksley SD. Mapping polygenes. Annu Rev Genet. 1993; 27: 205–233. PMID: 8122902
49. Yang J, Hu C, Hu H, Yu R, Xia Z, Ye XY, et al. QTLNetwork: Mapping and visualizing genetic architec-ture of complex traits in experimental populations. Bioinformatics. 2008; 24(5): 721–723. doi: 10.1093/bioinformatics/btm494 PMID: 18202029
Mapping Isoflavone QTL in Soybean RI Lines
PLOS ONE | DOI:10.1371/journal.pone.0118447 March 4, 2015 15 / 15


