Embed Size (px)
Citation preview

Ecological Economics xxx (2012) xxx–xxx
ECOLEC-04290; No of Pages 10
Contents lists available at SciVerse ScienceDirect
Ecological Economics
j ourna l homepage: www.e lsev ie r .com/ locate /eco lecon
Analysis
Navigating coastal values: Participatory mapping of ecosystem services forspatial planning
Sarah C. Klain ⁎, Kai M.A. Chan 1
Institute for Resources, Environment and Sustainability, University of British Columbia, 2202 Main Mall, Vancouver, Canada V6T 1Z4
⁎ Corresponding author. Tel.: +1 778 227 8190.E-mail address: [email protected] (S.C. Klain).
1 Tel.: +1 604 882 9250.
0921-8009/$ – see front matter © 2012 Elsevier B.V. Alldoi:10.1016/j.ecolecon.2012.07.008
Please cite this article as: Klain, S.C., Chan, KEcol. Econ. (2012), doi:10.1016/j.ecolecon.2
a b s t r a c t
a r t i c l e i n f oArticle history:Received 27 October 2011Received in revised form 25 June 2012Accepted 6 July 2012Available online xxxx
Keywords:Cultural ecosystem servicesMarine spatial planning
Monetary values and biophysical features tend to dominate spatial planning data, yet intangible cultural valueshave a large role to play in decision-making. If left implicit, such considerationsmay be represented poorly in plan-ning. To foster explicit inclusion of intangible values alongside material values connected to ecosystems, we elic-ited verbal articulation, spatial identification and quantifiedmarine-related values and threats across the seascapeof northern Vancouver Island, Canada. We address: (1) how do our spatial interviews—involving maps andsemi-structured interviews—enable and/or impede the elicitation of intangible values? (2)What categories of eco-system benefits do participants identify as most important? (3) Are spatial distributions of monetary values cor-related with non-monetary values and threats? Our findings indicate that (1) while maps were provocative,sizable minorities of interviewees refused to assign different numerical non-monetary values to specific locations(30%), or refused to identify locations of non-monetary importance (16%); (2) people allocated the highestnon-monetary values to places notable for wildlife, outdoor recreation, then cultural heritage; and (3) significantpair-wise overlap occurred, but also sizable deviations, among monetary, non-monetary and threat distributions.Despite limitations to representing non-monetary values spatially and quantitatively, these methods offer astraightforward approach to catalog and map ecosystem services to inform spatial planning.
© 2012 Elsevier B.V. All rights reserved.
1. Introduction
Around the world, marine ecosystems show signs of distress,including drastically diminished fish stocks, habitat destruction andpollution (Worm et al., 2006). In order to address these and othermarine environmental issues, many countries are conducting marinespatial planning (MSP) (Ehler and Douvere, 2009). A central goal ofMSP is to improve and sustain the provision of ecosystem services(ES) (Foley et al., 2010), the ecological processes through which natureprovides benefits to people (Levine and Chan, 2011). SeveralMSP initia-tives and toolkits have adopted ES frameworks tomore fully account forthe costs and benefits of different zoning options (Carr, 2011; Guerry,2011). One strength of the ES framework is that it provides a commonlanguage and set of metrics for evaluating the flow of benefits andtrade-offs associated with natural resource decisions (Daily et al.,2009). Ecologists and economists have made substantial progress toaccount for the monetary value of ES, particularly regarding provi-sioning, supporting and regulating services (Boyd and Banzhaf, 2007;Daily and Ellison, 2002; TEEB, 2009).
Major branches of ecological and environmental economics havefocused on non-market valuation, assigning dollar values to environ-mental benefits not typically traded in markets. Common quantitative
rights reserved.
.M.A., Navigating coastal valu012.07.008
techniques for non-market valuation include hedonic pricing methods,travel cost methods, damage cost avoided/replacement cost/substitutecost, contingent valuation, contingent choice method and benefit trans-fer methods (Daly and Farley, 2010). These methods might potentiallyfeed into cost–benefit analyses (CBA) but valuating many intangiblebenefits including cultural ecosystem services (CES) is fraught withchallenges (Chan et al., 2012). These valuation methods generally at-tempt to express consumer or individual preferences without explicitlyaddressing linked citizen or societal preferences,which yields numerousproblems and inconsistencies (Daly and Farley, 2010; Sagoff, 1998;Spash, 2008). The reliance of such methods on dollar metrics—withoutthe flexibility often needed to express moral and ethical concerns—compromises their ability to express ‘cultural’ values. CBA assumesthat ES or ES bundles can be valuated in monetary terms that representthe values of all people (Pearce et al., 2006) despite the likelihood thatseveral ES, particularly CES, may be inextricably linked to provisioningand other ES inways specific to individual people or stakeholder groups.
We investigated the possibility that social value mapping of ESmight help better account for CES to informdecision-making. Accordingto the Millennium Ecosystem Assessment, CES are “the non-materialbenefits people obtain from ecosystems through spiritual enrichment,cognitive development, reflection, recreation and esthetic experiences”(MA, 2003). CES can also be defined as “ecosystems' contributions tothe non-material benefits (e.g., capabilities and experiences) that arisefromhuman–ecosystem relationships” (Chan et al., 2012). These largelyintangible CES, such as sense of place, stewardship obligations and
es: Participatory mapping of ecosystem services for spatial planning,

2 S.C. Klain, K.M.A. Chan / Ecological Economics xxx (2012) xxx–xxx
spiritual value linked to nature, are worthy of additional research atten-tion since they can contribute substantially to well-being (Chan et al.,2011; Chan et al., 2012; Chiesura and de Groot, 2003; WHO, 2005).These intangible benefits, often linked fundamentally to moral con-cerns, also motivate people to protect and restore ecosystems (Butlerand Oluoch-Kosura, 2006; Safina, 2005).
Several participatory mapping initiatives to inform marine plan-ning have focused on select commercial and recreational activities,mainly fishing (Scholz et al., 2011; St Martin and Hall-Arber, 2008).We used social value mapping methods, including prompts withlocally appropriate non-technical language, to facilitate the articula-tion of not only where important activities occur but also the tangibleand intangible values associated with particular locations, in part tohighlight potentially underappreciated ways in which ecosystemsare important to people.
Our research builds on landscape values methodology and publicparticipation GIS literature (Brown, 2005b; Brown and Raymond,2007; Brown and Reed, 2012; Gunderson andWatson, 2007). By linkinglandscape valuesmethodswith ES frameworks, researchers have begunto investigate mapping social and cultural ES values (Bryan et al., 2010;Donovan et al., 2009; Raymond et al., 2009; Sherrouse et al., 2011).These studies have mapped various categories of services, but wehome in on three major categories: monetary, non-monetary andthreats. We chose these categories to concisely communicate distinctsets of values to resourcemanagers and stakeholders whomay be unfa-miliarwith ES terminology.We emphasize this value distinction tomapimportant places that may be overlooked if spatial planning focuses onmonetary values with little explicit consideration of non-monetaryvalues, which tends to be common in planning efforts.
Another important issue is the extent to which these values arequantifiable andmappable, which is a crucial issue given our goal to in-form spatial planning. We investigate (1) the extent to which it is pos-sible for people to assign spatial locations to these kinds of values andthreats, and if not, why not?We seek to understand precisely why peo-ple might refuse to map or quantify these values because many par-ticipatory mapping studies do not explore participant justificationsfor refusing to map areas of importance (e.g., Donovan et al., 2009;Raymond et al., 2009; Ruiz-Frau et al., 2011; Sherrouse et al., 2011). Fur-thermore, are interviewees able to assign relative importance to quan-tify non-monetary values, in a manner similar to the quantification ofmonetary values? Understanding such refusals is crucial for improvingmethods to elicit such values and inform MSP (Ruiz-Frau et al., 2011).
We also investigate (2) which categories of non-monetary benefitswere deemed most important by participants? Lastly, we assessed(3) howwell correlated non-monetary values are with monetary valuesand threats. The investigation of this correlation sheds light on theextentto which monetary values could serve as a proxy for non-monetary orthreat values. The strength of the correlation may indicate whether thespatial distributions of monetary values could serve as proxies fornon-monetary or threat values.
Our central purpose was to assess the utility of a protocol that isboth compatible with a marine spatial planning process and feasibleto employ on a relatively short time line with a modest budget.We field-test methods intended to enable people to articulate, andwhere possible, spatially identify and quantify the relative monetaryand non-monetary value of ES and environmental threats. Weemployed our interview-based mapping protocol in the RegionalDistrict of Mount Waddington (RDMW), a sub-region of the PacificNorth Coast Integrated Management Area (PNCIMA).
2. Methods
2.1. Study Area
In collaboration with the NGO Living Oceans Society (LOS) and theRDMW government, we tested this ES value elicitation and mapping
Please cite this article as: Klain, S.C., Chan, K.M.A., Navigating coastal valuEcol. Econ. (2012), doi:10.1016/j.ecolecon.2012.07.008
method within the RDMW, the northern region of Vancouver Islandin British Columbia, Canada (Fig. 1). The RDMW spans 20,288 km2
of land and 9880 km2 of ocean. In 2006, the population was 11,651,of whom 23.4% are First Nation (Aboriginal), 73.5% are Caucasianand 3.1% are other visible minorities (BCStats, 2011). Between 2001and 2006, the population declined by 11.1%. The average family in-come was $65,683 as compared to the average BC family income of$80,511 (BCStats, 2011). Several communities in the RDMW, particu-larly Alert Bay and Sointula, relied historically on timber and fishingindustries. Declines in forestry combined with a substantial reductionin fishing fleets have created economic challenges in the RDMW andmuch of rural, coastal BC (Young, 2008).
The BC fishing industry has undergone drastic change since themid 1980s. In an effort to reduce pressure on fish stocks, much ofthe BC fishing fleet was consolidated. The activity of fishing fleetsbased in the RDMW and many other communities in BC has declinedsharply in the past two decades (Brown, 2005a). Fleet reductionshave been accompanied by some fisheries-related spatial manage-ment efforts, including Rockfish Conservation Areas (RCAs) intendedto rebuild populations of rockfish by prohibiting gear that disturbsbenthic habitat (Yamanaka and Logan, 2010).
Net-pen salmon aquaculture is Canada's biggest and most profit-able type of aquaculture (Young and Matthews, 2010). As of 2007, atotal of 42 finfish farm tenures exist in the RDMW. Of these, 26farms are located in the Broughton Archipelago (LOS, 2007; MAL,2007), part of our study area. Salmon net-pen aquaculture is amajor source of employment in this region (LOS, 2011). The expan-sion of this industry has been accompanied by controversy over theenvironmental, social and economic ramifications of this industry'soperations (Young and Matthews, 2010).
2.2. Interview Sample
We sought people whose profession and/or means of livelihoodare linked to the marine environment. Using non-proportionalquota sampling (Tashakkori and Teddlie, 2003), our sample includedthose who play an active role in marine resource management as wellas others whose income indirectly or directly relies on the ocean. Thesampling method was used to solicit a range of values from engagedand knowledgeable community members, targeting those whoare involved with and/or have a vested stake in marine resourcedecision-making. Project partners at the regional district governmentand a local marine conservation NGO (LOS) provided recommenda-tions on whom to invite for the in-depth interviews.
In-person interviews with narrative-based methods and appro-priate probes can be well-suited for exploring subjective and experi-ential topics (Lindlof and Taylor, 2002), arguably helping peoplereflect on their values more deeply than paper or web-based surveys.We effectively chose quality over quantity, engaging a smaller samplein an in-depth exploration.
When conducting in-depth interviews, the number of new conceptsassociated with each additional interview generally tends to diminishbetween 20 and 30 interviews (Morgan 2002). Accordingly, this re-search used a sample size of 30 since the goal was to identify the diver-sity of ways in which marine ecosystems are important to people. The30 peoplewe interviewed represent awide range of employment activ-ities (17 types of marine-related professions) and live in several com-munities across the RDMW (Fig. 1). A total of seven women and 23menwere interviewed; two interviewees were of First Nations descent,and 28 were Caucasian. Participants had lived in the RDMW from 8 toover 65 years with an average duration of 30 years.
2.3. Interview Design
We created a semi-structured interview protocol to enable inter-viewees to verbalize why the ocean is important to them. Several
es: Participatory mapping of ecosystem services for spatial planning,

Fig. 1. Hometown and number of interviewees (n=30) in the Regional District of Mount Waddington. Population data was not available for other small communities in the RDMW.
3S.C. Klain, K.M.A. Chan / Ecological Economics xxx (2012) xxx–xxx
prompts were designed to enable people to articulate non-monetaryvalues associated with the marine environment (Klain, 2010; Supple-mentary Information, A. Interview Protocol).
Author SK conducted 30 interviews between April 9 and June 7,2010. After 45 potential interviewees were sent a contact letter invit-ing them to participate, interviews were scheduled in locationsconvenient and comfortable for the interviewees. A total of 15 wereunresponsive or unavailable for interviewing. Two interviews wereconducted in boats belonging to the interviewees, three were donein quiet cafes, eight took place in the interviewees' offices, and 17occurred in interviewees' homes. Interviews began with signing aconsent form and confidentiality agreement along with a brief projectdescription, both in writing and verbalized by the interviewer. Inter-views lasted from 54 min to 3 h and 30 min. A total of 56 h of inter-views were transcribed. Our interview protocol (see SupplementaryInformation A) involved five parts.
Part 1 Each interview began with open-ended questions to gaininsight into how the individual came to have a profession re-lated to the ocean. This was followed with questionspertaining to possible links between the ocean's health andpersonal as well as community well-being. Each intervieweewas asked questions about what he/she values from theocean. We framed questions about non-monetary valuesbased on the cultural ES identified in the Millennium Ecosys-tem Assessment (MA, 2003). The subject was also asked what,if anything, threatens the physical things (e.g., fish and shell-fish harvests) or experiences (e.g., recreational boating andfishing) that he/she values in association with the ocean. Foran analysis of the verbal content of the in-depth interviewsrefer to Klain (2010).
Part 2 The interviewer unrolled a 1 m×2 m laminated compilation ofnautical charts, covering the RDMW at a scale of 1:400,000.Interviewees, all of whom were familiar with local nautical
Please cite this article as: Klain, S.C., Chan, K.M.A., Navigating coastal valuEcol. Econ. (2012), doi:10.1016/j.ecolecon.2012.07.008
charts due to their marine-related profession, were asked toidentify areas in the ocean that they rely on for their incomeby drawing green polygons around these locations. Each inter-viewee was asked why each area is important to him/her. Rela-tive importance was assessed by asking interviewees to allocatea set number of units symbolizing relative value (Raymondet al.,2009). Following methods used in other marine planning pro-cesses (Scholz et al., 2006), the intervieweewas asked to distrib-ute 100 tokens according to the relativemonetary importance ofeach area to him/her.
Part 3 The interviewer asked open-ended questions on cultural ES. Wedesigned the protocol to encourage people to think about theconnection between values associated with place and heritage,identity, activities including subsistence food collection, spiritu-ality, art, education and intergenerational bequests.
Part 4 Interviewees were asked to identify regions important fornon-monetary reasons with a blue pen. Once the locationswere marked, he/she was asked to distribute 100 tokens thatrepresented non-monetary value. No specific metric ofnon-monetary valuewas provided to the interviewees. Each in-dividual decided how to allocate relative non-monetary valuebased on a wide range of experiences, benefits, and emotionsassociated with natural elements of particular places.
Part 5 The interview concluded with questions about threats to themarine ES that people value. Interviewees were asked to drawred polygons around areas that are threatened and/or sourcesof threat, then allocate 100 tokens across these polygons. Insome cases, the threats were not spatially explicit (e.g., oceanacidification, marine debris, and PCB and heavy metal contami-nation). These non-localized threats were recorded, but notmapped.A D-SLR Nikon D70s was used to photograph the chart markedwith each interviewee's monetary, non-monetary and threatpolygons with notes on associated types of values and threats
es: Participatory mapping of ecosystem services for spatial planning,

4 S.C. Klain, K.M.A. Chan / Ecological Economics xxx (2012) xxx–xxx
as well as numerical relative values (Fig. 2). The nautical chartwas erased after the photos were taken. These photos weregeoreferenced in ArcGIS 9.3. Shapefiles were created by tracinginterviewees' polygons from the georeferenced photo. The in-terviewer recorded the quantitative value and value descriptionsfor all shapes. For each interview with spatial information, atotal of three shapefiles were created, each with polygons associ-ated with monetary, non-monetary or threat values.
2.4. Spatial Analysis
2.4.1. Trimming Spatial Data to the Study AreaWe bounded our study to the waters of the RDMW. This ignores
ecological boundaries and does not include the full extent of manyocean activities and threats. Despite the focus on the waters of theRDMW, some interviewees identified areas of importance and threatoutside of the boundaries. These shapes were trimmed to fit withinthe RDMW boundaries and the associated relative value or relativethreat was concentrated in the smaller shape to consistently allocate100 units of monetary, non-monetary and threat values within thestudy area.
2.4.2. Calculating Relative ValueThe relative value by area was calculated by dividing the number
of monetary, non-monetary or threat tokens associated with theshape by the area of the polygon. Each shapefile was overlaid with agrid of 500×500 m cells. This cell size (0.25 km2) was chosen afterthe polygons were digitized because it was slightly larger than thesmallest polygon drawn by an interviewee (0.2 km2), which we as-sumed to indicate roughly the resolution at which interviewees rep-resented areas of value and threat (such that finer resolutions ofanalysis would be assuming a higher than justified spatial accuracyof the hand-drawn boundaries). The 0.25-km2 cell size provideda reasonable level of detail given the extent of the study region
Fig. 2. Example of interview data collected. Green polygons denote areas where the interInterviewees drew red polygons in places associated with an environmental threat.
Please cite this article as: Klain, S.C., Chan, K.M.A., Navigating coastal valuEcol. Econ. (2012), doi:10.1016/j.ecolecon.2012.07.008
(9880 km2 of ocean). A coarser cell resolution would have dimin-ished the level of spatial detail to which the relative values and threatscores were summed across interviewees.
Each grid cell was assigned a unique numerical identificationnumber. We intersected the shapes drawn by interviewees with thegrid to spatially summarize the monetary, non-monetary or threat in-tensity for each cell. For each value/threat type, the total value/threatof each cell was the sum of the value/threat associated with each cellacross all interviewees. For each interviewee, the relative value/threatwas derived from the number of tokens each interviewee assignedto his/her polygon divided by the area of the polygon. Polygonsrepresenting monetary, non-monetary and threat values were over-laid separately. For detailed methods, see Supplementary InformationB. Methods to Summarize Value Across Interviewees.
After the relative value/threat of each cell was calculated, the cellsin each layer (monetary, non-monetary and threat) were dissolvedaccording to their relative value. This approximately restored thepolygon boundaries while preventing pseudo replication: the unit ofanalysis is not the cell, which was crucial for summarizing valueacross interviewees, but rather the polygons associated with differentlevels of relative value/threat. These three layers were intersected,then the monetary, non-monetary and threat values associated witheach polygon were used to calculate bivariate correlations.
2.4.3. Spatial Correlation of Monetary, Non-Monetary and Threat ValuesFor each type of value (monetary, non-monetary and threat), we
calculated the distance at which spatial autocorrelation is minimizedbased on empirical semivariograms of each layer (see SupportingInformation, Section C. Semivariograms). The monetary and threatlayer semivariograms (Moran's I=0.291 andMoran's I=0.202, respec-tively) showed weak spatial autocorrelation, but the semivariogramfor the non-monetary layer (Moran's I=0.350) showed that spatialautocorrelation diminished after a separation distance of 2.729 km.Accordingly, we applied a bootstrap sampling technique to select 100
viewee derived his/her income. Blue areas are important for non-monetary reasons.
es: Participatory mapping of ecosystem services for spatial planning,

5S.C. Klain, K.M.A. Chan / Ecological Economics xxx (2012) xxx–xxx
sets of 80 random polygons with centroids sufficiently far apart to min-imize spatial autocorrelation (80 was the highest number of polygonsthat could be selected with centroids separated by ≥2.729 km).
Since the values were not normally distributed across the poly-gons, we calculated the nonparametric Spearman's rank correlationcoefficient for each pair (monetary, non-monetary; monetary, threat;and non-monetary, threat) for 100 sets of random samples. We calcu-lated correlations as well as the mean and standard deviation to esti-mate the uncertainty in the correlation statistic.
3. Results and Discussion
3.1. General Refusals to Identify Locations
A minority of respondents refused to assign relative value to par-ticular locations. Two out of the 30 interviewees did not answer anyspatial questions (Fig. 3). Their refusals can be classified as (1) a rejec-tion of hard boundaries; (2) concern for the sovereignty over localknowledge; and (3) a rejection of particular places being of greatervalue than others. The first of these interviewees, who has a back-ground in community planning, said, “as soon as you start isolatingthings and say this is important to me, you lose the rest… that's therisk… we start drawing lines, suddenly what's outside of the linebecomes available for development.” He also said, “the only way wehave here to prevent open access to fishing grounds … for food, forrecreational, even for commercial purposes, is by … keeping yourknowledge private…. [Sharing this knowledge] is like handing some-body a key to your food, to your house, to your front door.” These per-ceptions may be based on past negative experiences with spatialplanning processes. After commenting on the dynamic nature of eco-logical and social systems, this interviewee also refused to draw poly-gons because he rejects assigning hard boundaries around places thatare important to him. He believes that gradients offer a better repre-sentation of human values and ecological characteristics of the ocean.
3.1.1. Refusals to Specific Spatial QuestionsA total of 23 out of 30 people interviewed drew polygons over the
areas that are monetarily important to their work and distributedtokens to represent relative values (Fig. 3). The remaining sevenhad income that did not rely on specific locations (e.g., an artistwhose work was inspired by the region, but not specific places and
Fig. 3. Interviewee responses to verbal, spatial and quantitative interview components. *Outvalue to mapped locations.
Please cite this article as: Klain, S.C., Chan, K.M.A., Navigating coastal valuEcol. Econ. (2012), doi:10.1016/j.ecolecon.2012.07.008
managers concerned with fisheries governance issues related to theregion as a whole, not particular locales).
Out of the 30 interviewees, 25 identified areas important fornon-monetary reasons—two more than those who spatially identifiedareas for monetary reasons (Fig. 3). Justifications for not identifyingareas of non-monetary importance ranged widely. One intervieweedid not want to identify culturally sensitive locations (e.g., a shellmidden or a setting from a culturally important First Nation myth)or other areas of non-monetary importance out of fear that the infor-mation would be misused. The three others chose not to identifyareas of personal significance because they felt this importance wasbased on places where they had memorable experiences with friendsand family in certain natural areas, but the natural area itself was notparticularly unique, special or valuable. These interviewees seemed tointerpret the spatial prompting as asking for values of areas to thecommunity, not only to themselves as individuals. Every intervieweewas encouraged to share areas of personal importance even if theyfelt geographically limited by their own experiences. Despite thisencouragement, these three interviewees refrained from identifyingareas of non-monetary importance.
Of the 25 who identified areas of non-monetary importance, 16allocated tokens of relative non-monetary importance, whereas theremaining nine interviewees said that no single place that they iden-tified was any more important than any other place (Fig. 3).
A total of 17 interviewees drew polygons around areas that areunder threat (Fig. 3). Several people who did not identify threatenedareas explained that the major threats they perceive, including pollu-tion, toxins, acoustic concerns, and marine debris, are not spatiallyexplicit threats. Some said they lacked the expertise to identifyareas under threats. Six interviewees, four of whom worked in salm-on aquaculture, did not think that there are threats to their localmarine ecosystems.
3.2. Intensity of Values and Threats
The resulting maps reflect the responses of 28 individuals with ex-pertise related to the ocean, since two out of 30 participants refusedto spatially identify values and threats. The Value by Number of Inter-viewees column (Fig. 4) maps the number of interviewees whoassigned value across the study region. This does not consider relativevalue but does convey the spatial extent of the values and how
of the 25 interviewees who allocated relative non-monetary value, 9 assigned identical
es: Participatory mapping of ecosystem services for spatial planning,

6 S.C. Klain, K.M.A. Chan / Ecological Economics xxx (2012) xxx–xxx
many interviewees assigned value to the same location. The Value byQuantile column (Fig. 4), in which relative values are coloredaccording to eight value-ranges that each span approximately 12.5%of the spatial area, illustrates the variation in value intensity acrossthe seascape using a logic analogous to ranks and percentiles. Someinterviewees drew small shapes and attributed high relative valueto these small areas. Consequently, the relative value of the cellswithin these small polygons was sometimes orders of magnitudehigher than cells overlaid on larger polygons in which the relativevalue was spread over a bigger area. This concentration of valuesis apparent in the Absolute Aggregated Value column (Fig. 4), inwhich compact and/or concentrated values are privileged over diffuseand/or diluted values. Areas where people assigned high values tosmall areas are associated with far higher relative value scores thanareas where people had drawn large polygons.
The methods used to ask people to identify particularly importantor threatened areas may have biased respondents towards repre-senting fewer, high-value places. Interviewees tended to identifylocations important to them for specific provisioning and culturalES, but they did not explicitly identify areas valued for the supportingrole that those locations or habitat types play in providing productsand experiences. Also, some interviewees may have responded stra-tegically by assigning high value to only a few distinct places to call
Value by Number of Interviewees
Mon
etar
yN
on-M
onet
ary
Thr
eat
Value by
Fig. 4. Stakeholder perspectives on marine ecosystem service values and threats. These mviewees column, each cell is colored according to the number of respondents who identifiedan equal fraction of the total number of values. In the Value by Quantile column, each colorlighter colors indicate greater aggregate monetary, non-monetary or threat value. For aggre
Please cite this article as: Klain, S.C., Chan, K.M.A., Navigating coastal valuEcol. Econ. (2012), doi:10.1016/j.ecolecon.2012.07.008
attention to the places and issues that are most important to thempersonally.
3.3. Spatial Correlation of Non-Monetary, Monetary and Threat Values
All three pair-wise comparisons were significantly (αb0.001) andpositively correlated (Table 1). These correlations likely reflect acombination of factors. Many of the most highly valued places, forboth monetary and non-monetary reasons, are close to towns. Conse-quently, perceptions of importance may reflect how these locationsare more accessible and potentially more frequently visited. Also, insuch places, the environmental threats are likely better-known andpossibly more acute due to greater human impact than locations farfrom inhabited regions.
Although we found significant spatial correlations, somewhatanalogous to the positive correlations that Ruiz-Frau et al. (2011)found between specific monetary (i.e., fisheries and industry) andnon-monetary (e.g., leisure and heritage) values, monetary valuesshould not be interpreted as proxies for non-monetary or threatvalues due to the relatively low Mean Spearman's Rank correlationcoefficients associated with pairwise comparisons (all are below 0.6as shown in Table 1). There are substantial overlaps but also
Quantile Absolute Aggregated Value
aps reflect aggregate values across all interviewees. In the Value by Number of Inter-monetary value, non-monetary or threat value. Quantiles are sets of values that containincludes 12.5% of the cells associated with a set range of values or threats. For all maps,gation methods, see Section 2.4.1 Calculating Relative Value.
es: Participatory mapping of ecosystem services for spatial planning,

Table 1Correlation between pairwise comparisons of monetary, non-monetary and threat value.The sample units are polygons associatedwith three values:monetary, non-monetary andthreat values, each summed across all interviewees.
Mean Spearman's Rankcorrelation coefficient
SD
Monetary vs. non-monetary 0.2673a 0.09773Monetary vs. threat 0.5541a 0.0708Non-monetary vs. threat 0.3615a 0.1001
a Using the p-values associated with each correlation, we calculated the test statisticfor each pair-wise correlation using Fisher's combined probability test. This was subjectto a chi-square test to determine that the overall p-value for each set of pairwise com-parisons was b0.001.
Table 2Activities and values associated with marine ecosystems across all participants. Thenumber of polygons represents the total number of each type of polygon drawn duringthe interviews. The relative value is the sum of the monetary, non-monetary or threatunits assigned to the corresponding type of polygon (monetary, non-monetary, andthreat) per interviewee. The number of participants is the number of intervieweeswho drew a particular type of polygon.
Category No. ofpolygons
Relativevalue
Area(km2)
No. ofparticipants
Economic activityCommercial fishing 32 570 5411 6Sportfishing 25 415 4383 5Marine transport 19 297 3774 4Eco-tourism 20 524 10,762 7Science and biologicalmonitoring
9 314 2683 4
Artistic 4 100 217 1Fisheries management 2 115 2148 2Education 1 30 88 1
Tangible non-monetary benefitBiodiversity/wildlife 61 839 6151 18Natural beauty 59 318 2144 9Cultural heritage site 37 505 727 10Outdoor recreation,unspecified
30 44 663 2
Recreation, fishing 24 421 2516 11Safe anchorage 14 126 24 4Recreation, coastal hiking 12 52 93 3Unique natural feature 10 118 246 9Recreation, boating 7 223 227 5Ceremonial site 4 8 25 1Recreation, exploring 3 56 923 2Dive site 3 21 9 2Stewardship activities 2 11 7 2Scientific study site 2 85 129 2
Intangible non-monetary benefitSpiritual/inspiration/awe 28 417 1320 9Education 8 72 2434 5Peace 5 10 49 2Sense of place/home 4 121 465 4Transformational 3 72 811 2Intergenerational 3 170 143 2Community identity 2 53 6 1Existence 1 77 880 1
Threat activitySalmon aquaculture 53 1442 13,190 17Commercial development 5 51 9 3Logging 5 23 77 3Pollution (from woodor sewage)
4 74 377 3
Boat traffic congestion 2 20 12 1Fish processing plant 2 6 4 1Overfishing 2 107 1001 2Pulp mill 2 105 3 2Potential dam 2 22 28 2Dragging 1 80 591 1Dredging 1 80 591 1Fisheries mismanagement 1 10 28 1Gravel mining 1 1 6 1Poaching 1 7 22 1
7S.C. Klain, K.M.A. Chan / Ecological Economics xxx (2012) xxx–xxx
differences in the location and intensity of these values across theseascape (Fig. 3).
3.4. Relative Importance of Types of ES and Threats
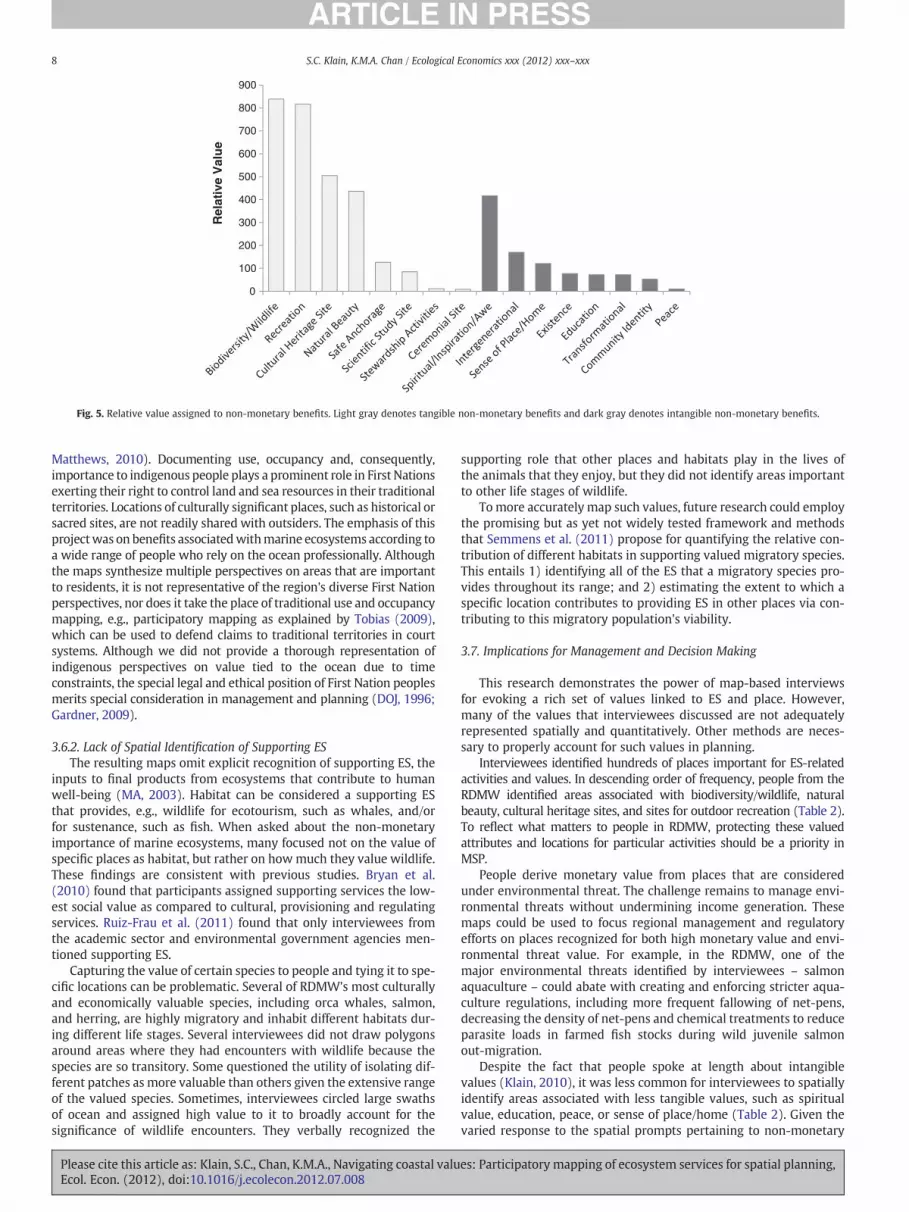
Based on the 28 interviewees who provided spatial information,interviewee responses were categorized by activity or associatedvalue. The categories of monetary activity reflect the variety of profes-sions of the interviewees. The relative value associated with each typeof activity reflects the relative intensity of value or threat across theinterviewees (Table 2). Value ascribed to biodiversity/wildlife washigher than value assigned to other non-monetary values (Table 2and Fig. 5). Biodiversity/wildlife was summarized as one categoryrather than species by species because interviewees tended to mentionmultiple species associated with the same location. People with differ-ent recreational and other activity preferences (e.g., sport-fishing,boating, hiking, and stewardship activities) tended to identify locationsassociated with wildlife in addition to places where they recreate out-doors or enjoy other tangible non-monetary benefits from the ocean.
One interviewee expressed existence value for a region where hehad never been that has a high density of nesting seabirds. Manyother interviewees assigned relative value associated with wildlifebased on personal experiences on the water with marine animalsand plants, often associated with seeing large congregations of wild-life or awe-inspiring wildlife behavior (e.g., orca whales rubbingthemselves on pebble beaches). Wildlife is clearly a prominent andvalued feature in the RDMW (Table 2).
Despite the personal and sensitive nature of spiritual value, somepeople identified numerous areas associated with spiritual value, in-spiration and/or awe (Table 2). Respondents also assigned more rela-tive value to areas associated with spirituality, inspiration or awethan any other intangible non-monetary benefit (Fig. 5). These resultsprovide indication of the success of the interview protocol in elicitinga wide array of reasons why nature is important to locals.
According to the 17 interviewees who identified threats, salmonaquaculture was associated with the highest number of threat poly-gons, greatest area (km2) under threat, and highest relative threatvalue (Table 2). The four people whose employment was associatedwith the salmon aquaculture industry did not consider the industryas an environmental threat. Commercial development, logging andpollution were considered threats by 4 or more interviewees.
3.5. Limited Representation
In order to better assess community values, representative sur-veys are needed (Brown, 2005b). Our study targeted people with avariety of marine-related professions rather than aiming for propor-tional representation. In particular, this study did not include the di-versity of indigenous perspectives on ES values and threats withinthe study site. First Nations represent 23.4% of the region's population(BCStats, 2011) but they were only 6.6% of the interviewees (2 out of30). Also, we requested the participation of representatives from two
Please cite this article as: Klain, S.C., Chan, K.M.A., Navigating coastal valuEcol. Econ. (2012), doi:10.1016/j.ecolecon.2012.07.008
aquaculture companies. One representative did not respond and theother refused to be part of the study.
3.6. Limitations of Mapping Marine ES
3.6.1. Indigenous People, Power and MappingThe results of these mapping methods need to be understood
in the context of the study region where indigenous people, throughprotest or partnership, aremore capable than ever before in influencingdevelopment in their traditional territories. Aboriginal claims in BC toocean resources and marine areas are heatedly disputed (Young and
es: Participatory mapping of ecosystem services for spatial planning,
0
100
200
300
400
500
600
700
800
900
Rel
ativ
e V
alu
e
Fig. 5. Relative value assigned to non-monetary benefits. Light gray denotes tangible non-monetary benefits and dark gray denotes intangible non-monetary benefits.
8 S.C. Klain, K.M.A. Chan / Ecological Economics xxx (2012) xxx–xxx
Matthews, 2010). Documenting use, occupancy and, consequently,importance to indigenous people plays a prominent role in First Nationsexerting their right to control land and sea resources in their traditionalterritories. Locations of culturally significant places, such as historical orsacred sites, are not readily shared with outsiders. The emphasis of thisprojectwas on benefits associatedwithmarine ecosystems according toa wide range of people who rely on the ocean professionally. Althoughthe maps synthesize multiple perspectives on areas that are importantto residents, it is not representative of the region's diverse First Nationperspectives, nor does it take the place of traditional use and occupancymapping, e.g., participatory mapping as explained by Tobias (2009),which can be used to defend claims to traditional territories in courtsystems. Although we did not provide a thorough representation ofindigenous perspectives on value tied to the ocean due to timeconstraints, the special legal and ethical position of First Nation peoplesmerits special consideration in management and planning (DOJ, 1996;Gardner, 2009).
3.6.2. Lack of Spatial Identification of Supporting ESThe resulting maps omit explicit recognition of supporting ES, the
inputs to final products from ecosystems that contribute to humanwell-being (MA, 2003). Habitat can be considered a supporting ESthat provides, e.g., wildlife for ecotourism, such as whales, and/orfor sustenance, such as fish. When asked about the non-monetaryimportance of marine ecosystems, many focused not on the value ofspecific places as habitat, but rather on howmuch they value wildlife.These findings are consistent with previous studies. Bryan et al.(2010) found that participants assigned supporting services the low-est social value as compared to cultural, provisioning and regulatingservices. Ruiz-Frau et al. (2011) found that only interviewees fromthe academic sector and environmental government agencies men-tioned supporting ES.
Capturing the value of certain species to people and tying it to spe-cific locations can be problematic. Several of RDMW's most culturallyand economically valuable species, including orca whales, salmon,and herring, are highly migratory and inhabit different habitats dur-ing different life stages. Several interviewees did not draw polygonsaround areas where they had encounters with wildlife because thespecies are so transitory. Some questioned the utility of isolating dif-ferent patches as more valuable than others given the extensive rangeof the valued species. Sometimes, interviewees circled large swathsof ocean and assigned high value to it to broadly account for thesignificance of wildlife encounters. They verbally recognized the
Please cite this article as: Klain, S.C., Chan, K.M.A., Navigating coastal valuEcol. Econ. (2012), doi:10.1016/j.ecolecon.2012.07.008
supporting role that other places and habitats play in the lives ofthe animals that they enjoy, but they did not identify areas importantto other life stages of wildlife.
To more accurately map such values, future research could employthe promising but as yet not widely tested framework and methodsthat Semmens et al. (2011) propose for quantifying the relative con-tribution of different habitats in supporting valued migratory species.This entails 1) identifying all of the ES that a migratory species pro-vides throughout its range; and 2) estimating the extent to which aspecific location contributes to providing ES in other places via con-tributing to this migratory population's viability.
3.7. Implications for Management and Decision Making
This research demonstrates the power of map-based interviewsfor evoking a rich set of values linked to ES and place. However,many of the values that interviewees discussed are not adequatelyrepresented spatially and quantitatively. Other methods are neces-sary to properly account for such values in planning.
Interviewees identified hundreds of places important for ES-relatedactivities and values. In descending order of frequency, people from theRDMW identified areas associated with biodiversity/wildlife, naturalbeauty, cultural heritage sites, and sites for outdoor recreation (Table 2).To reflect what matters to people in RDMW, protecting these valuedattributes and locations for particular activities should be a priority inMSP.
People derive monetary value from places that are consideredunder environmental threat. The challenge remains to manage envi-ronmental threats without undermining income generation. Thesemaps could be used to focus regional management and regulatoryefforts on places recognized for both high monetary value and envi-ronmental threat value. For example, in the RDMW, one of themajor environmental threats identified by interviewees – salmonaquaculture – could abate with creating and enforcing stricter aqua-culture regulations, including more frequent fallowing of net-pens,decreasing the density of net-pens and chemical treatments to reduceparasite loads in farmed fish stocks during wild juvenile salmonout-migration.
Despite the fact that people spoke at length about intangiblevalues (Klain, 2010), it was less common for interviewees to spatiallyidentify areas associated with less tangible values, such as spiritualvalue, education, peace, or sense of place/home (Table 2). Given thevaried response to the spatial prompts pertaining to non-monetary
es: Participatory mapping of ecosystem services for spatial planning,

9S.C. Klain, K.M.A. Chan / Ecological Economics xxx (2012) xxx–xxx
values, including refusals (Table 2), isolating non-monetary valuesshould not be the only method to solicit information pertaining tosuch values. Based on survey respondents assigning lower spiritualand intrinsic value scores on maps, Brown and Raymond (2007) sug-gest that people have difficulty assigning intangible qualities to fea-tures of the landscape. Our research supports this contention. Thisrelative infrequency of spatially identifying areas associated with in-tangible values signals that the intangibles are difficult to map, notthat they are less important. If a MSP process was based on a similarmapping and valuation process, it would be incomplete becausesuch aggregate maps and correlation analyses do not fully representintangible values.
Spatial prompting and, in the words of an interviewee, “quantify-ing the unquantifiable” are a starting point, but additional methodsare required to explicitly recognize, respect and accommodate intan-gible values associated with ecosystems when development choicesare made. The results from this research could launch discussions ina deliberative process that involves stakeholders sharing informationand learning from each other as values and options are carefullyconsidered and discussed (Sagoff, 1998; Spash, 2008). Similar toCutts et al. (2011), stakeholders and policy-makers could review theexisting aggregate spatial data, identify potential gaps in the informa-tion and discuss and prioritize the non-spatial values articulatedduring the research process (see Klain, 2010, Chapter 1 for a qualita-tive assessment of the interviews). This review could make the out-puts from combined individual responses more salient, legitimateand credible for informing policy.
Another option for moving forward is using these research out-puts to inform a deliberative multi-criteria evaluation (Bryan andKandulu, 2011), or multi-criteria (or multi-objective) decision analy-sis (Gregory et al., 2012; Linkov et al., 2006; Mendoza and Martins,2006). This type of research could be structured in such a way as toresult in a list of priority ES considerations that reflects not only theincome-related value of activities in particular places but also themeaning and importance that people associate with the marine envi-ronment. Embedding this type of research in a Participatory ActionResearch (PAR) framework with ongoing community collaboration(such as those outlined in Kindon et al., 2007) could also contributeto better consideration of values that are not appropriately expressedquantitatively or spatially.
4. Conclusion
From this pilot application of an interview protocol for elicitingstakeholder perceptions of ES in a spatial context, we conclude thefollowing: 1) The protocol was successful at eliciting many people'sperceptions of monetary (income-related) value, non-monetaryvalue and environmental threat, although an important minority ofrespondents refused to quantify these, or represent them spatially.2) Respondents identified many distinct justifications for valuingsites for reasons other than income generation. Most notably, peopleassigned high value to areas associated with prominent wildlife,natural beauty and cultural heritage. 3) Aggregated across individ-uals, monetary and non-monetary values are spatially correlatedwith each other, and also with perceived threats. These are likelyplaces that people visit most frequently and with which they aremost familiar.
Many existing planning processes do not explicitly assess thekinds of strong non-monetary values tied to ecosystems that partici-pants in our research expressed verbally, spatially and/or quantita-tively. Our study in the context of the growing field of landscapevalues research reveals that there is considerable impetus—and alsoopportunity—for better integrating CES values into planning throughmethods like our proposed interview protocol. We found that manypeople attach strong and diverse values to nature, but that spatiallyidentifying and quantifying the importance of particular places is
Please cite this article as: Klain, S.C., Chan, K.M.A., Navigating coastal valuEcol. Econ. (2012), doi:10.1016/j.ecolecon.2012.07.008
only possible for some people and values. This suggests that planningand decision-making will be most effective and appropriate whenthey include a deliberative component.
Acknowledgments
We are thankful to the residents of the Regional District of MountWaddington who generously donated their time as interviewees forthis project. Canada's Social Science and Humanities Research Council(ORSIL # F08-05565), The Nature Conservancy (FAS # 08‐0687), theCanada Research Chairs Program, and the Canadian Foundation forInnovation (ORSIL # F07-0010) provided funding for this research.We appreciate the support of the Regional District Government ofMount Waddington and Living Oceans Society. Thomas Sisk, TerreSatterfield, Sarah Gergel and Robin Naidoo provided useful input onthis analysis.
Appendix A. Supplementary Data
Supplementary data to this article can be found online at http://dx.doi.org/10.1016/j.ecolecon.2012.07.008.
References
BCStats, 2011. Regional District 43 — Mount Waddington, Statistical Profile. ProvincialGovernment of British Columbia, Victoria, BC.
Boyd, J., Banzhaf, S., 2007. What are ecosystem services? The need for standardizedenvironmental accounting units. Ecological Economics 63, 616–626.
Brown, D., 2005a. SalmonWars: The Battle for the West Coast Salmon Fishery. HarbourPublishing, Madeira Park.
Brown, G., 2005b. Mapping spatial attributes in survey research for natural resourcemanagement: methods and applications. Society and Natural Resources 18, 17–39.
Brown, G., Raymond, C., 2007. The relationship between place attachment and land-scape values: toward mapping place attachment. Applied Geography 27, 89–111.
Brown, G.G., Reed, P., 2012. Social landscape metrics: measures for understandingplace values from Public Participation Geographic Information Systems (PPGIS).Landscape Research 37, 73–90.
Bryan, B.A., Kandulu, J.M., 2011. Designing a policy mix and sequence for mitigatingagricultural non-point source pollution in a water supply catchment. WaterResources Management 25, 875–892.
Bryan, B.A., Raymond, C.M., Crossman, N.D., Macdonald, D.H., 2010. Targeting themanagement of ecosystem services based on social values: where, what, andhow? Landscape and Urban Planning 97, 111–122.
Butler, C.D., Oluoch-Kosura, W., 2006. Linking future ecosystem services and futurehuman well-being. Ecology and Society 11.
Carr, S., 2011. Coastal and Marine Spatial Planning Tools. In: E.-B.M.T. Network (Ed.),NatureServe, Arlington, VA.
Chan, K.M.A., Hoshizaki, L., Klinkenberg, B., 2011. Ecosystem services in conservationplanning: targeted benefits vs. co-benefits or costs? PloS One 6, e24378.
Chan, K.M.A., Satterfield, T., Goldstein, J., 2012. Rethinking ecosystem services to betteraddress and navigate cultural values. Ecological Economics 74, 8–18.
Chiesura, A., de Groot, R., 2003. Critical natural capital: a socio-cultural perspective.Ecological Economics 44, 219–231.
Cutts, B.B., White, D.D., Kinzig, A.P., 2011. Participatory geographic information systemsfor the co-production of science and policy in an emerging boundary organization.Environmental Science & Policy 14, 977–985.
Daily, G.C., Ellison, K., 2002. The New Economy of Nature: The Quest to Make Conser-vation Profitable. Island Press, Washington, D.C.
Daily, G.C., Polasky, S., Goldstein, J., Kareiva, P.M., Mooney, H.A., Pejchar, L., Ricketts,T.H., Salzman, J., Shallenberger, R., 2009. Ecosystem services in decision making:time to deliver. Frontiers in Ecology and the Environment 7, 21–28.
Daly, H.E., Farley, J., 2010. Ecological Economics: Principles and Applications. IslandPress, Washington, DC.
DOJ, 1996. Oceans Act. In: Justice, D.O. (Ed.), (Ottawa, Canada.).Donovan, S.M., Looney, C., Hanson, T., León, Y.S.D., Wulfhorst, J.D., Eigenbrode, S.D.,
Jennings, M., Johnson-Maynard, J., Pérez, N.A.B., 2009. Reconciling social and bio-logical needs in an endangered ecosystem: the Palouse as a model for bioregionalplanning. Ecology and Society 14 (art. 9.).
Ehler, C., Douvere, F., 2009. Marine spatial planning: a step-by-step approach towardecosystem-based management. IOC Manual and Guides No. 53, ICAM Dossier No.6. Intergovernmental Oceanographic Commission and Man and the BiosphereProgramme. UNESCO, Paris.
Foley, M.M., Halpern, B.S., Micheli, F., Armsby, M.H., Caldwell, M.R., Crain, C.M., Prahler,E., Rohr, N., Sivas, D., Beck, M.W., Carr, M.H., Crowder, L.B., Duffy, J.E., Hacker, S.D.,McLeod, K.L., Palumbi, S.R., Peterson, C.H., Regan, H.M., Ruckelshaus, M.H., Sandifer,P.A., Steneck, R.S., 2010. Guiding ecological principles for marine spatial planning.Marine Policy 34, 955–966.
Gardner, J., 2009. First Nations and Marine Protected Areas. Canadian Parks andWilderness Society (CPAWS), BC Chapter, Vancouver, BC, pp. 1–90.
es: Participatory mapping of ecosystem services for spatial planning,

10 S.C. Klain, K.M.A. Chan / Ecological Economics xxx (2012) xxx–xxx
Gregory, R., Failing, L., Harstone, M., Long, G., McDaniels, T., Ohlson, D., 2012. StructuredDecision Making: A Practical Guide to Environmental Management Choices. Wiley-Blackwell, West Sussex, UK.
Guerry, A., 2011. From Practice to Theory and Back: Ecosystem Services and MarineSpatial Planning AAAS Annual Meeting. AAAS, Washington, D.C.
Gunderson, K., Watson, A., 2007. Understanding place meanings on the BitterrootNational Forest, Montana. Society and Natural Resources 20, 705–721.
Kindon, S., Pain, R., Kesby, M., 2007. Participatory action research approaches andmethods: connecting people, participation, and place. Routledge, New York.
Klain, S., 2010. Navigating marine ecosystem services and values. Resource Managementand Environmental Studies. University of British Columbia, Vancouver, p. 104.
Levine, J., Chan, K.M.A., 2011. Global Human Dependence on Ecosystem Services, In:Köllner, T. (Ed.), Ecosystem Services and Global Trade of Natural Resources: Ecology,Economics and Policies. Routelage, New York.
Lindlof, T., Taylor, B.C., 2002. Qualitative Communication Research Methods, 2ndedition. Sage Publications, Thousand Oaks, CA.
Linkov, I., Satterstrom, F.K., Kiker, G., Batchelor, C., Bridges, T., Ferguson, E., 2006. Fromcomparative risk assessment to multi-criteria decision analysis and adaptive man-agement: recent developments and applications. Environment International 32,1072–1093.
LOS, 2007. British Columbia Salmon Farm Licences and Applications. Living OceansSociety, Vancouver, BC.
LOS, 2011. The marine economy and the regional district of Mt. Waddington in BC.Living Oceans Society. prepared by GSGilason & Associates Ltd, Sointula, BC.
MA, 2003. Millennium Ecosystem Assessment, Ecosystems and Human Well-being: AFramework for Assessment. Island Press, Washington, DC, p. 245.
MAL, 2007. Marine Water Farm Sites, December 31, 2007. Ministry of Agriculture andLands.
Mendoza, G.A., Martins, H., 2006. Multi-criteria decision analysis in natural resourcemanagement: a critical review of methods and new modelling paradigms. ForestEcology and Management 230, 1–22.
Morgan,M.G., 2002. Risk communication: amentalmodels approach.CambridgeUniversityPress, Cambridge; New York, p. 76.
Pearce, D.W., Atkinson, G., Mourato, S., 2006. Cost–Benefit Analysis and the Environ-ment: Recent Developments. Organisation for Economic Co-operation and Devel-opment Publishing, Paris.
Raymond, C.M., Bryan, B.A., MacDonald, D.H., Cast, A., Strathearn, S., Grandgirard, A.,Kalivas, T., 2009. Mapping community values for natural capital and ecosystemservices. Ecological Economics 68, 1301–1315.
Please cite this article as: Klain, S.C., Chan, K.M.A., Navigating coastal valuEcol. Econ. (2012), doi:10.1016/j.ecolecon.2012.07.008
Ruiz-Frau, A., Edwards-Jones, G., Kaiser, M.J., 2011. Mapping stakeholder values forcoastal zone management. Marine Ecology Progress Series 434, 239–249.
Safina, C., 2005. A Sea Ethic: Floating the Ark.Sagoff, M., 1998. Aggregation and deliberation in valuing environmental public goods:
a look beyond contingent pricing. Ecological Economics 24, 213–230.Scholz, A.J., Steinback, C., Kruse, S.A., Mertens, M., Silverman, H., 2011. Incorporation of
spatial and economic analyses of human-use data in the design of marineprotected areas. Conservation Biology 25, 485–492.
Scholz, A.J., Steinback, C., Mertens, M., Birney, K., 2006. Commercial Fishing Groundsand their Relative Importance off the Central Coast of California. Ecotrust.
Semmens, D.J., Diffendorfer, J.E., López-Hoffman, L., Shapiro, C.D., 2011. Accounting forthe ecosystem services of migratory species: quantifying migration support andspatial subsidies. Ecological Economics 70, 2236–2242.
Sherrouse, B.C., Clement, J.M., Semmens, D.J., 2011. A GIS application for assessing,mapping, and quantifying the social values of ecosystem services. Applied Geogra-phy 31, 748–760.
Spash, C.L., 2008. How much is that ecosystem in the window? The one with the bio-diverse trail. Environmental Values 17, 259–284.
St Martin, K., Hall-Arber, M., 2008. The missing layer: geo-technologies, communities,and implications for marine spatial planning. Marine Policy 32, 779–786.
Tashakkori, A., Teddlie, C., 2003. Handbook of Mixed Methods Sampling in Social andBehavioural Research. Sage Publications, London, UK.
TEEB, 2009. The Economics of Ecosystems and Biodiversity for National and Interna-tional Policy Makers — Summary: Responding to the Value of Nature. Wesseling,Germany.
Tobias, T., 2009. Living Proof. Ecotrust Canada, Vancouver.WHO, 2005. Ecosystems and Human Well-Being, Health Synthesis. World Health
Organization, Geneva, Switzerland.Worm, B., Barbier, E.B., Beaumont, N., Duffy, J.E., Folke, C., 2006. Impacts of biodiversity
loss on ocean ecosystem services. Science 314, 787–790.Yamanaka, K., Logan, G., 2010. Developing British Columbia's inshore rockfish conser-
vation strategy. Marine and Coastal Fisheries: Dynamics, Management, and Ecosys-tem Science 2, 28–46.
Young, N., 2008. Radical neoliberalism in British Columbia: remaking rural geogra-phies. The Canadian Journal of Sociology 33, 1–36.
Young, N., Matthews, R., 2010. The Aquaculture Controversy in Canada: Activism,Policy, and Contested Science. UBC Press, Vancouver, Toronto.
es: Participatory mapping of ecosystem services for spatial planning,


