Embed Size (px)
Citation preview

This article appeared in a journal published by Elsevier. The attachedcopy is furnished to the author for internal non-commercial researchand education use, including for instruction at the authors institution
and sharing with colleagues.
Other uses, including reproduction and distribution, or selling orlicensing copies, or posting to personal, institutional or third party
websites are prohibited.
In most cases authors are permitted to post their version of thearticle (e.g. in Word or Tex form) to their personal website orinstitutional repository. Authors requiring further information
regarding Elsevier’s archiving and manuscript policies areencouraged to visit:
http://www.elsevier.com/copyright

Author's personal copy
Mapping of environmental and technological performance of food and beveragesector in Bosnia and Herzegovina
Sanda Mid�zi�c-Kurtagi�c, Irem Silajd�zi�c*, Tarik Kupusovi�cHydro-Engineering Institute Sarajevo, Stjepana Tomi�ca 1, 71000 Sarajevo, Bosnia and Herzegovina
a r t i c l e i n f o
Article history:Received 17 December 2008Received in revised form15 June 2010Accepted 18 June 2010Available online 26 June 2010
Keywords:BATBAT candidateMapping methodologyEnvironmental performance indicatorsFood and beverage sector
a b s t r a c t
The objective of this paper is to discuss the mapping methodology implemented in the selection of BATcandidates and to present the results of the mapping of B&H food and beverage sector, prepared asa baseline for the development of national reference documents on Best Available Techniques. Thesubsectors subject to analysis were: dairy, fish farming, fish processing, fruit and vegetable processing,meat processing, breweries, and slaughterhouses.
The sector was mapped from several aspects, including socio-economic, legal, and environmentalpoint of view. The socio-economic aspect focused on understanding the sector’s structure and financialcapabilities, pricing for water, energy, and solid waste consumption, as well as employee profiles, in orderto better assess the sustainability of decisions taken. Legal mapping focused on relevant regulations,including policies from the following sectors: environment, water use and protection, food safety,agriculture, and veterinary, in order to determine legal requirements from an environmental protectionaspect set in the various sector policies. Environmental performance indicators were calculated in orderto assess present resource efficiencies and relevant environmental impacts. In addition, the mappingprocess also addressed the existing level of BAT implementation in the subsectors under consideration.
The paper presents a rationale for methodology selection, offers a review of the mapping methodologyused, discusses mapping results and provides conclusions in regards to that methodology used anddiscusses issues that need to be considered in the selection of BAT candidates.
� 2010 Elsevier Ltd. All rights reserved.
1. Introduction
Similar to other countries with economies in transition, indus-trial companies in Bosnia and Herzegovina (B&H), are facingnumerous challenges and changes on their road to a marketeconomy. The current national environmental legislation, whichdefines the relationship between industrial activity and the envi-ronment, requires industries to obtain an environmental permitbased on the integrated pollution prevention and control conceptpresented in the EU Directive 2008/1/EC (Directive 2008/1/EC ofthe European Parliament, 2008). The permit is to include emis-sion limit values, equivalent parameters or technical measuresbased on Best Available Techniques, taking into account the tech-nical characteristics of the installation, its geographical location,and the local conditions. Operators with the permit are legallyobliged to use Best Available Techniques (BAT) to prevent orminimize the negative impact on the environment.
In order to be able to enforce the environmental law, theministries are required to develop a number of bylaws and tools forthe successful implementation and monitoring of legal provisionson integrated pollution prevention and control. One of the basicrequirements is the development of national reference documentson Best Available Techniques (Articles 6, 71, 86) for the majority ofthe industrial sectors (Law on Environmental Protection).
The European Union Best Reference Documents (EU BREFs)were mainly developed based on the exchange of information onmedium to large size companies having capacity thresholds cor-responding to those of Annex I of the EU Directive 2008/1/EC. Forcountries whose economy depends on small and medium sizecompanies, EU BREF documents do not provide adequate infor-mation that can aid both the industry and the regulating bodies inimplementing integrated pollution prevention and control. Thereis a need to develop national reference documents on Best Avail-able Techniques using EU BREF documents; however they need totake into consideration local conditions, further taking intoaccount environmental performance and technology employed bylocal industries as well as the country’s economic and socialsituation.
* Corresponding author. Tel./fax: þ387 33 212 466.E-mail address: [email protected] (I. Silajd�zi�c).
Contents lists available at ScienceDirect
Journal of Cleaner Production
journal homepage: www.elsevier .com/locate/ jc lepro
0959-6526/$ e see front matter � 2010 Elsevier Ltd. All rights reserved.doi:10.1016/j.jclepro.2010.06.014
Journal of Cleaner Production 18 (2010) 1533e1542

Author's personal copy
The purpose of this paper is to discuss the mapping method-ology used for the selection of BATcandidates and to present resultsof the mapping process of B&H food and beverage sector, preparedas a baseline for the development of national reference documentson BATs.
2. Rationale for methodology selection
The basic criteria for the selection of BAT candidate requires theBAT to be “developed in scale which allows implementation inrelevant industrial sector under economically and technicallyviable conditions, taking in considerations costs and advantages”(Directive 2008/1/EC of the European Parliament, 2008).
Dijkmans (2000) presented the first methodological approach toBAT selection. Various BAT candidates were evaluated with respectto their technical feasibility, environmental benefits, and economicaspects, leading to the proposal of BAT. The author introduceda term “average or typical enterprise” whereby a certain BATcandidate can be applied with reasonable costs. The methodologywas tested in fruit and vegetable processing industry and resultswere published in 2002 (Derden et al., 2002). His recommendationto map the sector from a technical and economic point of view inorder to understand its structure and financial capabilities, as wellas to be able to assess sustainability of decisions taken, was used inthis study.
Having in mind differences in the technological structure andthe environmental priorities between countries, Schollenbergeret al. (2008) propose a consistent and flexible assessment methodfor the evaluation of process improvements based on resourceefficiency. They suggest that determination of candidate BATsrequires the assessment of parameters from the three pillars ofsustainability: economic, ecological, and social. The logical appli-cation of the three pillars of sustainability indicates that BATcandidate selection should be performed based on ecologic,economic, and social criteria. In this context, a concept of sustain-able development can be understood as proposed by Strange andBaley (2008):
� a conceptual framework: a way of changing the predominantworld view to one that is more holistic and balanced,
� a process: away of applying the principles of integration, acrossspace and time and to all decisions,
� a goal: identifying and solving specific problems of resourcedepletion, healthcare, social exclusion, poverty, etc.
Therefore, in order to be able to assess the sustainability of BATselected, the selectedmethodology for determination of BAT shouldoffer the criteria for analysis of relations between different issues inorder to propose adequate solutions. Problems related to theoverexploitation of resources, environment, and human health areinterconnected from the cause and effect point of view, and thesolutions should be pursued in technical, institutional, economic,and legal measures. This is evidently the multi-criteria method.
In 2005, Gelderman et al. (2003) stated that, at the time, nospecific method for supporting these important decisions wasbeing applied taking into account economic, technical, and espe-cially ecological criteria.
Gelderman and Rentz (2004) proposed a basic procedure for thetechno-economic assessment of emissions and determination ofBATs, called “reference installation approach”. Due to the varietyand heterogeneity of emission sources, the assessment is notprepared based on a single installation but rather based on cate-gories of installations, which are to be defined, each category beingrepresented by a reference installation. For installations of onecategory, the same abatement options apply while applicability,
pollution reduction efficiency, and cost for a given emissionreduction option are similar. Following their recommendations, themethodology used in this study was revised with specification ofemission sources that, together with all other criteria, could lead tocategorisation of installations.
According to the Annex IV of the IPPC Directive, selection of BATmust take into account twelve considerations. In order to clarify themeaning of each consideration and to evaluate better technologies,the French researchers of SITE (Sciences, Information and Tech-nology for the Environment Division) carried out a study thatresulted in defining BAT selection methodology. LaForest andBertheas, (2004) reported that this study revealed a great numberof redundancies and heterogeneity in the considerations. Theyproposed a set of six objectives to which a technology must complyif selected as BAT. Those were: i) limitation of environmentalimpact, ii) economy of raw materials and energy, iii) improvementof safety and risk minimization, iv) valorisation, v) benchmarking,and vi) innovation. Regardless of the objectives, the indicators of anexisting state must be set up first. Thus, in accordance with Guid-ance on the Selection and Use of Environmental PerformanceIndicators 2003/532/EC (Commission Recommendation (EC),2003), and Practical Guide for the Implementation of an Environ-mental Management Scheme (Masoliver Jordana, 2001), the indi-cators of environmental performance, particularly input-outputoperational performance indicators were selected as the mostsuitable set of indicators for the purpose of development of nationalreference documents on BATs.
3. Methodological approach used
The mapping methodology used in this work consisted offollowing steps:
� selection of indicators and collection of data to describestructure and socio-economic status of industrial sector;
� review and analyses of national legislation, environmentalstandards, and international obligations related to industrialsector;
� selection of indicators and collection of data to describe envi-ronmental performance of industrial sector;
� collection, review, and analyses of Best Available Techniques.
Following the recommendation to categorise installations, thefirst step of the methodological approach was to identify charac-teristics of installations from food and beverage sector, in terms ofprocesses and capacities. This enabled their comparison with thereference installations in the EU and other countries, as well as theassessment of BATs already presented in different guidelines onBest Available Techniques and opportunities to apply them in B&H.
The economic status of the food and beverage sector wasanalyzed from the aspect of economic stability and the potential ofinvesting in improvements. In that sense, the share in overall sale ofindustrial products, exporteimport ratio, market competitiveness,and number of employees were analyzed, making them also theindicators of the sector’s societal importance. Having in mind thatthe Polluters Register had not been established yet, informationregarding companies, including their type and capacity ofproduction was collected from existing registries from the Cham-bers of Commerce and questionnaires directed to the companies.Moreover, current pricing in water, energy, and solid waste sectorwas analyzed in order to determine its possible influence on effi-cient use of resources.
Besides the sector’s societal importance, structure and level ofeducation of the employees in the sector was also analyzed in orderto determine employees’ capacities to implement BATs. The
S. Mid�zi�c-Kurtagi�c et al. / Journal of Cleaner Production 18 (2010) 1533e15421534

Author's personal copy
companies’ mangers and process engineers were questionedregarding their level of education, previous experience, whetherthey were up-to-date with recent technological innovations,whether they were flexible to adjust to changes, their awareness ofenvironmental problems, and alike.
Mapping of the legal framework and legal requirementsprovided important background information for selection of BestAvailable Techniques. A comprehensive legal framework thataddresses the food and beverage sector and regulates specifictechnical and technological requirements, including pollutionprevention and control as well as food and health safety exists.Besides the legal framework, policy papers such as Strategy forEnvironmental Protection and its objectives and targets, as well asobligations included in international treaties that Bosnia and Her-zegovina ratified, were also subject to analysis.
The environmental performance of food and beverage compa-nies was assessed using inputeoutput operational performanceindicators (Strange and Baley, 2008; Gelderman et al.; MasoliverJordana, 2001), focusing on resource consumption and emissionsgenerated. The available sources of information were: (i) environ-mental monitoring reports for individual companies, and(ii) Activity Plans for Reduction of Emissions and Compliance withBest Available Techniques for individual companies, prepared forthe purpose of environmental permitting procedure.
Since available environmental monitoring reports and ActivityPlans could not provide sufficient information for all sectorscovered, environmental audits in a number of selected companieswere conducted. An effort was made to cover both small andmedium size companies as well as significant subsectors in theaudit sample. Twenty-two companies from seven subsectorsincluding; brewery, dairy, fish farming, fish processing, fruit andvegetable processing, meat processing, and slaughterhousesexpressed their willingness to voluntarily participate in the studyand become subject to an environmental audit.
The audits were performed in accordance with a checklist-guided walk-through inspection and lasted for approximately a dayper company audited. The information gathering, analysis andprocessing were carried out in close cooperation with companymanagement and employees. The auditing material preparedconsisted of (i) environmental auditing questionnaire, and(ii) summary list of BATs available for each subsector. The envi-ronmental auditing questionnaire was developed using structuredworking tables for data collection previously developed forimplementation of Minimization Opportunities EnvironmentalDiagnosis (MOED) methodology (Kupusovi�c et al., 2007). MOED isa tool used for assessment of companies’ activity to detect potentialopportunities for preventing and reducing pollution at the sourceand was used in a number of cleaner production projects imple-mented in B&H (Mid�zi�c and Silajd�zi�c, 2006).
The information asked in the environmental auditing ques-tionnaire included:
1. Basic data on facility including name of the company/facilityoperator and legal status, company address, name of thesettlement/municipality/canton where the company is located,annual production capacity per product, number of employees,etc.
2. Description of the facility including list of all structures (instal-lations) at the facility sitewith brief description, information onequipment for pollution control, methods of maintenance andcleaning of the equipment and facility, and description ofactivities and production process.
3. Data on consumption of raw materials, water, and energy. Aneffort was made to describe the main and secondary rawmaterials used in the production process using their technical
names, quantities and, most importantly, environmentalcharacteristics.
4. Current environmental status at the facility site includingwastewater, solid waste, and air emissions. For each waste flowa study was made of i) the quantity generated, ii) the processwhere it is generated, iii) the environmental impact, andmanagement of the waste flows.
The questionnaire also included description of environmentalmonitoring program in place.
A set of basic indicators of environmental performancewas usedfor comparison with the best practice (Table 1). For companieswhose production capacity was available at the time of the audit,selected indicators were recalculated and expressed per unit ofproduct (t or hl). The comparison was prepared against indicatorsprovided mainly in Reference Document on Best Available Tech-niques in the Food, Drink and Milk Industries (BREF FDM),Reference Document on Best Available Techniques in the Slaugh-terhouses and Animal By-products Industries, but also otherguidelines for fish farming and fish processing, dairies, meatprocessors, and breweries (European Integrated Pollution Preventionand Control Bureau, 2006; European Integrated Pollution Preventionand Control Bureau, 2003; Environmental, Health, and SafetyGuidelines for Aquaculture, 2007; Cleaner Production Assessmentin Fish Processing, 2000; Cleaner Production Assessment in DairyProcessing, 2000; Cleaner Production Assessment in MeatProcessing, 2000; Environmental Management in the BrewingIndustry, 1996). The quantity of pollution emitted to water and air,if available, was compared against emission limit values given bynational legislation. The conclusions drawn discuss the rationalityof rawmaterial, water, and energy consumption as well as the levelof pollution generated in the food and beverage facilities.
In order to assess the level of general prevention measures andBAT used, the summary list of BATs available for each subsector wascompiled using the above-mentioned guidelines. The pollutionprevention measures applied in the companies were assessedagainst those proposed in the relevant documents, and conclusionsabout current use of BATs in the sector were drawn.
4. Review of the mapping of environmental performance andcompliance with BAT in food and beverage sector
The mapping activities revealed some important findings aboutthe production and environmental performance in the food andbeverage sector in B&H, as well as the suitability of the method-ology applied.
Socio-economic status of the sector. The review of basic infor-mation about the seven subsectors analyzed in this paper is given inTable 2. The data presented in Table 2 indicates that the productioncapacities are significantly lower comparing to similar EU compa-nies that are subject to environmental permitting under the IPPCDirective.
The mapping of economic potential showed that food andbeverage sector has become the fastest growing industrial branchthat currently accounts for approx. 20% of the gross nationalincome while the rate of investment in this sector is growing(Statistical Yearbook of FB&H, 2008; Institute of Statistics of theRepublic of Srpska). According to data published by the Agencyfor Statistics of B&H, value of industrial production in 2007 (mostrecent data available) was 2.5 billion EURO, where the food andtobacco sector accounts for 24% or 0.6 billion EURO. Theexporteimport ratio is unfavourable. The import is two times largerthan export. The trade deficit for 2007 amounted to 0.769 billionEURO in the food, beverage, and tobacco sector. A negative tradebalance was recorded despite the export increase of approximately
S. Mid�zi�c-Kurtagi�c et al. / Journal of Cleaner Production 18 (2010) 1533e1542 1535

Author's personal copy
15%. The whole sector employs only 4% of total number ofemployees in the country (Agency for Statistics of B&H, 2008).
The current pricing in the water and solid waste sector does notmotivate companies to use resources more efficiently. Water pricesrange between 0.6 EURO and 1.3 EURO, which is rather low and do
not encourage companies to reduce consumption, reuse or recyclewater. The companies that have their ownwater well usually do notpay for water at all since the Water Law that enforces waterconcession is still not fully implemented. As far as solid wastemanagement is concerned, companies pay a symbolic fix rate for
Table 2Basic information about food and beverage subsectors.
Industrysubsector
Number ofcompanies
Total numberof employees
Min and max productioncapacity available in thecountry
Main products produced Activities according toAnnex I of the IPPC Directive
Brewery 6 1.240 50 000e1 000 000 hl y�1 Beer and soft drinks Vegetable raw materials with afinished product productioncapacity greater than 300 tonnes perday (average value on a quarterly basis).
Dairy 100 1.364 0.18e10 t milk/d Milk, yogurt, sour cream,butter, etc.
Treatment and processing of milk,the quantity of milk received beinggreater than 200 tonnes per day(average value on an annual basis).
Fish farming 41 203 10e530 t/g Salmonide fish, cyprinidefish, marine fish and shells
N/A
Fish processing 2 61 1e4 t/d Rainbow trout(Oncorhynchus mykiss),carp (Cyprinus carpio),grass carp(Ctenopharyngodon idella)and European anchovy(Engraulis encrasicolus)
Animal raw materials (other than milk)with a finished product productioncapacity greater than 75 tonnes per day
Fruit andvegetableprocessing
30 N/A (seasonalproduction)
3e270 t/d Jarred fruits, jarredvegetables, pickled andsalted vegetables, fruitjuices, jams, marmalade
Vegetable raw materials with a finishedproduct production capacity greater than300 tonnes per day (average value on aquarterly basis).
Meat processing 30 1020 0,8 (traditional)-206t/d (industrial)
Smoked meat, salami,ham, sausages, pate, etc.
Animal raw materials (other than milk)with a finished product productioncapacity greater than 75 tonnes per day
Slaughterhouses Medium size ¼ 13 2.000e2.500 15e30 t/d beef or 2e5t/d mutton or 8e11 t/d pig
Beef, veal, lamb, muttonand pork
Slaughterhouses with a carcase productioncapacity greater than 50 tonnes per daySmall size
(traditional) ¼ 308
Table 1Indicators of environmental performance.
Indicator Unit Source of data
Consumption of natural resourcesWater use Water consumption m3/upa Invoices
Energy use Electricity consumption kWh/up InvoicesFuel consumption T/up InvoicesNatural gas consumption M3/up Invoices
EmissionsWastewater Wastewater quantity m3/up Monitoring reports e reporting to Water Agency
BOD mg/l/up Monitoring reports e reporting to Water AgencyCOD mg/l/up Monitoring reports e reporting to Water AgencyTotal nitrogen mg/l/up Monitoring reports e reporting to Water AgencyTotal phosphorus mg/l/up Monitoring reports e reporting to Water AgencySuspended solids mg/l/up Monitoring reports e reporting to Water Agency
Waste Waste quantity t/up Invoices, assessmentCategories of waste e Waste Management Plan, assessment
Air emission NOx g/Nm3/up The Company Activity Plan for Reduction of Emissions andCompliance with Best Available Techniques
NO2 g/Nm3/up The Company Activity Plan for Reduction of Emissions andCompliance with Best Available Techniques
SO2 g/Nm3/up The Company Activity Plan for Reduction of Emissions andCompliance with Best Available Techniques
CO g/Nm3/up The Company Activity Plan for Reduction of Emissions andCompliance with Best Available Techniques
CO2 g/Nm3/up The Company Activity Plan for Reduction of Emissions andCompliance with Best Available Techniques
a up ¼ unit of product.
S. Mid�zi�c-Kurtagi�c et al. / Journal of Cleaner Production 18 (2010) 1533e15421536
Author's personal copy
the disposal of solid waste to municipal dumping sites that are notdependent on quantity of waste disposed. This is why companiesmay not be interested to put additional effort to prevent and/orrecycle waste. On the other hand, the price of energy is consideredrather high (3.7e9.7 euroecent/kWh for sector of services) and itcan be a motivating factor for the implementation of the energyconsumption reduction measures.
The interviews with process engineers, from companies whereaudits were performed, revealed that the main obstacles toimplementation of certain, even very simple, pollution preventionmeasures and techniques are inadequate education of theemployees, lack of training, fear of changes and lack of awarenessabout environmental problems. In some companies, managers orowners are identified as posing a threat to improvements andchanges due to lack of their environmental awareness and educa-tion. On the other hand, company managers judged some processengineers to be inflexible to changes and innovations.
National regulations, environmental standards and internationalobligations applied in the sector. A review of national regulations indifferent sectors, including environmental law, law treating wateruse and protection, food safety, agriculture, and veterinary showedthat they all set clear environmental objectives and requirementsfor companies to implement measures or certain techniques forpollution reduction, whichever are technically feasible and/oracceptable at reasonable costs. However, a brief assessment of thetechnical aspect in some companies’ shows that, even in caseswhere financial resources are available, construction of watertreatment plants, although specifically required by law, is impos-sible due to lack of available space. Moreover, even though theregulations set very clear requirements for inspection and regularmonitoring of emissions to the environment they are still notimplemented to the fullest extent, due to inadequate number ofinspectors.
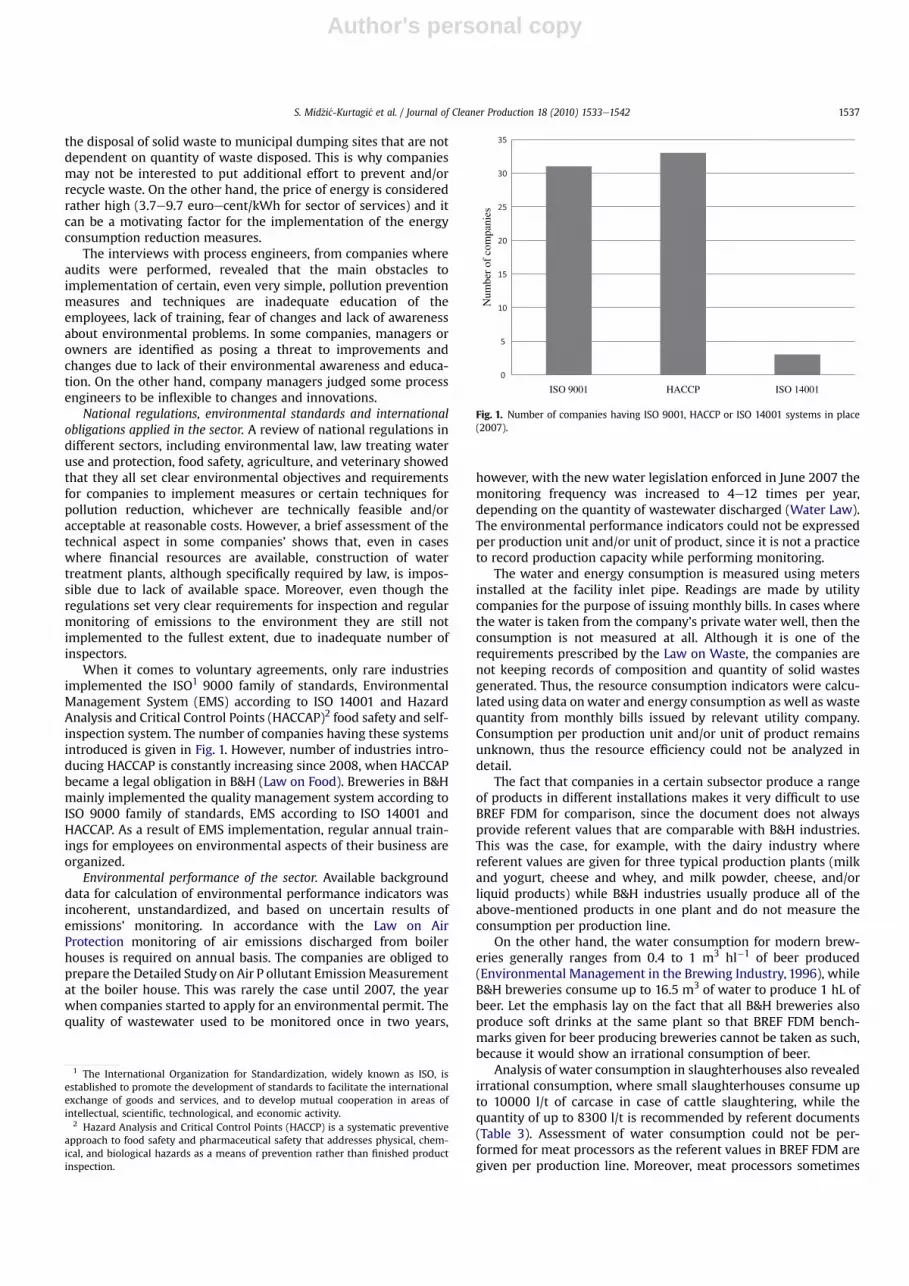
When it comes to voluntary agreements, only rare industriesimplemented the ISO1 9000 family of standards, EnvironmentalManagement System (EMS) according to ISO 14001 and HazardAnalysis and Critical Control Points (HACCAP)2 food safety and self-inspection system. The number of companies having these systemsintroduced is given in Fig. 1. However, number of industries intro-ducing HACCAP is constantly increasing since 2008, when HACCAPbecame a legal obligation in B&H (Law on Food). Breweries in B&Hmainly implemented the quality management system according toISO 9000 family of standards, EMS according to ISO 14001 andHACCAP. As a result of EMS implementation, regular annual train-ings for employees on environmental aspects of their business areorganized.
Environmental performance of the sector. Available backgrounddata for calculation of environmental performance indicators wasincoherent, unstandardized, and based on uncertain results ofemissions’ monitoring. In accordance with the Law on AirProtection monitoring of air emissions discharged from boilerhouses is required on annual basis. The companies are obliged toprepare the Detailed Study on Air P ollutant EmissionMeasurementat the boiler house. This was rarely the case until 2007, the yearwhen companies started to apply for an environmental permit. Thequality of wastewater used to be monitored once in two years,
however, with the new water legislation enforced in June 2007 themonitoring frequency was increased to 4e12 times per year,depending on the quantity of wastewater discharged (Water Law).The environmental performance indicators could not be expressedper production unit and/or unit of product, since it is not a practiceto record production capacity while performing monitoring.
The water and energy consumption is measured using metersinstalled at the facility inlet pipe. Readings are made by utilitycompanies for the purpose of issuing monthly bills. In cases wherethe water is taken from the company’s private water well, then theconsumption is not measured at all. Although it is one of therequirements prescribed by the Law on Waste, the companies arenot keeping records of composition and quantity of solid wastesgenerated. Thus, the resource consumption indicators were calcu-lated using data onwater and energy consumption as well as wastequantity from monthly bills issued by relevant utility company.Consumption per production unit and/or unit of product remainsunknown, thus the resource efficiency could not be analyzed indetail.
The fact that companies in a certain subsector produce a rangeof products in different installations makes it very difficult to useBREF FDM for comparison, since the document does not alwaysprovide referent values that are comparable with B&H industries.This was the case, for example, with the dairy industry wherereferent values are given for three typical production plants (milkand yogurt, cheese and whey, and milk powder, cheese, and/orliquid products) while B&H industries usually produce all of theabove-mentioned products in one plant and do not measure theconsumption per production line.
On the other hand, the water consumption for modern brew-eries generally ranges from 0.4 to 1 m3 hl�1 of beer produced(Environmental Management in the Brewing Industry, 1996), whileB&H breweries consume up to 16.5 m3 of water to produce 1 hL ofbeer. Let the emphasis lay on the fact that all B&H breweries alsoproduce soft drinks at the same plant so that BREF FDM bench-marks given for beer producing breweries cannot be taken as such,because it would show an irrational consumption of beer.
Analysis of water consumption in slaughterhouses also revealedirrational consumption, where small slaughterhouses consume upto 10000 l/t of carcase in case of cattle slaughtering, while thequantity of up to 8300 l/t is recommended by referent documents(Table 3). Assessment of water consumption could not be per-formed for meat processors as the referent values in BREF FDM aregiven per production line. Moreover, meat processors sometimes
ISO 9001 HACCP ISO 14001
seinapmoc
foreb
muN
Fig. 1. Number of companies having ISO 9001, HACCP or ISO 14001 systems in place(2007).
1 The International Organization for Standardization, widely known as ISO, isestablished to promote the development of standards to facilitate the internationalexchange of goods and services, and to develop mutual cooperation in areas ofintellectual, scientific, technological, and economic activity.
2 Hazard Analysis and Critical Control Points (HACCP) is a systematic preventiveapproach to food safety and pharmaceutical safety that addresses physical, chem-ical, and biological hazards as a means of prevention rather than finished productinspection.
S. Mid�zi�c-Kurtagi�c et al. / Journal of Cleaner Production 18 (2010) 1533e1542 1537

Author's personal copy
Table
3Dataab
outen
vironmen
talperform
ance
infood
andbe
verage
sector
inB&H.
Indicator
Brewery
Dairy
Fish
farm
ing
Fish
processing
Fruitan
dve
getable
processing
Mea
tprocessing
Slau
ghterh
ouse
Water
consu
mption
1.09
e16
.50
m3hl�
1
(0.32e
1m
3hl�
1)a
0.96
e5.6m
3/t
(milk
andyo
ghurt
0.8e
25m
3/t,c
hee
sean
dwhey
1e60
m3/t,
milk
pow
der,c
hee
sean
d/orliq
uid
products
1.2e
6m
3/t)
Not
available
(N/A)
10,39e
30m
3/t
(5e11
m3/t)
Largesize
(20e
100
t/d)¼
4.4e
16.2
m3/t
Smallsize
(<20
t/d)¼
4.4m
3/t
(7e15
m3/t)
7.9e
12.62m
3/t
(coo
kedproducts
4e18
m3/t,d
ried
andco
oked
products,
3e10
m3/t,p
reserved
products10
e20
m3/t,
canned
products
2e20
m3/t)
8000
to10
000l/tcarcase
(cattle16
23e90
00l/t,
pig
1600
e83
00l/t,
shee
p55
56e83
33l/tcarcase)
Electricity
consu
mption
16.1e24
.9kW
h/hl(10.4e
10.6
kWh/hl)
0.01
9e0.32
kWh/t
(milk
andyo
gurt
¼0.25
e2.5kW
h/t,
chee
seproduction¼
0.08
e2.9kW
h/t)
0.01
e0.1
kWkg
�1
N/A
Largesize
(20e
100
t/d)¼
100e
200kW
h/t
Smallsize
(<20
t/d)
¼>20
0kW
h/t
(ref.
val.av
ailableon
lyper
productionlin
e)
485e
5120
kWh/t
offinal
product
(dried
andco
oked
products75
0e13
00kW
h/t,
preserved
products
2500
e40
00kW
h/t,
canned
products
2500
e40
00kW
h/t)
3e30
kWh/hea
d(70e
250kW
h/t
cattle,7
0e30
0kW
h/t)
Wastewater
quan
tity
0.8e
12.4
m3hl�
1
(0.24e
0.9m
3hl�
1)
N/A
N/A
10,39e
30m
3/t
(100
%of
water
used)
Assumption
:90
%of
water
consu
med
(fruits¼
10.86m
3/t
raw
material,
vege
tables
¼22
.91
m3/t
raw
material)
N/A
N/A
BOD
50e15
22mgl�
1
(100
0e15
00mgl�
1)
362e
5680
mgl�
1
(450
e47
90mgl�
1)
N/A
101e
384mgl�
1
(200
0e60
00mgl�
1)
10e28
00mgl�
1
(300
0mgl�
1)
160e
977mgl�
1(15)
68e41
23mgl�
1
(cattle20
00mgl�
1,
pig
1250
mgl�
1)
COD
161e
2637
mgl�
1
(180
0e30
00mgl�
1)
383e
1145
1mgl�
1
(500
e45
00mgl�
1)
N/A
198e
583mgl�
140
e34
00mgl�
1
(500
0mgl�
1)
208e
2430
mgl�
112
0e11
756mgl�
1
(cattle40
00mgl�
1,
pig
2500
mgl�
1,
mix
1000
e30
00mgl�
1)
Total
nitroge
n6.2e
67.10mgl�
1
(30e
100mgl�
1)
0.02
5e52
.64mgl�
1
(15e
180mgl�
1)
N/A
N/A
4e24
mgl�
1
(150
mgl�
1)
N/A
23.5e16
7.2mgl�
1
(cattle18
0mgl�
1,
pig
150mgl�
1)
Total
phosphorus
0.19
e82
mgl�
1
(30e
100mgl�
1)
0.00
2e19
.02mgl�
1
(25e
250mgl�
1)
N/A
N/A
0.2e
1.8mgl�
1
(30mgl�
1)
N/A
3.0e
11.40mgl�
1
(cattle27
mgl�
1,
pig
25mgl�
1)
Susp
ended
solid
s30
.6e20
28mgl�
1
(10e
60mgl�
1)
17e55
2mgl�
1
(24e
5700
mgl�
1)
N/A
131e
288mgl�
110
e50
0mgl�
1
(700
mgl�
1)
50e98
3mgl�
140
e98
3mgl�
1
(cattle16
00mgl�
1,
pig
700mgl�
1)
Waste
quan
tity
25kg
hl�
10.56
e1.46
kg/t
(milk
andyo
gurt
¼1.7e
45,c
hee
seproduction¼
1e20
)
N/A
N/A
(40e
50kg
skin/t
210e
250kg
hea
ds/t
240e
340kg
bones/t)
Largesize
(20e
100
t/d)¼
20e20
0t/y
Smallsize
(<20
t/d)¼
20t/y(7e15
m3/t)
(ref.v
al.a
vaila
ble
only
per
product
produced)
N/A
50%of
live
weigh
tforcattle
10e20
%forpigs
S. Mid�zi�c-Kurtagi�c et al. / Journal of Cleaner Production 18 (2010) 1533e15421538

Author's personal copy
have slaughtering as part of their production processes whichmakes use of benchmarks even more difficult.
For the same reason comparison with BREF FDM benchmarkswas not possible for fruit and vegetable processing subsector, butover-consumption of energy has been recognized by other studies(Subsector Profiles) as a major threat to the competitiveness of thisindustrial sector.
The data on consumption of electrical energy in B&H breweriesreveals irrational consumption (16.1e24.9 kWh/hl) in comparisonwith referent values of electricity consumption (10.4e10.6 kWh/hl)for European breweries (European Integrated Pollution Preventionand Control Bureau, 2006; Environmental Management in theBrewing Industry, 1996).
Use of BATs in the sector. Concerning the BATs applied in thesector, most of the audited companies apply some of the generalprevention measures for control of water consumption andreduction of wastewater load proposed by BREF FDM. These aremainly limited to:
� installation of automatic nozzles on hoses that stop running ofwater during the process of cleaning and washing,
� installation of automatic washbasins,� use of automatic high pressure machines, foam machines, andnozzles for washing of plants and yards,
� installation of screens over floor drains to prevent solid parti-cles from entering wastewater, and
� dry cleaning of equipment and installations as well as drycleaning of spillages prior to the wet cleaning.
The overview of general BATs, with regard tominimizing the useof water, the amount and the load of wastewater, the amount ofwaste and the use of energy applied in seven audited subsectors isgiven in Table 4.
Separation of waste streams is implemented in most sectors.The companies usually apply low-cost good house keepingmeasures such as installation of screens over the floor drains anddry cleaning prior to washing with water as techniques to reducethe wastewater load. Small, manual slaughterhouses do not prac-tice blood separation, while larger slaughtering plants usuallyapply techniques for separate blood collection, although it is thenmixed with other solid waste and disposed of at municipal landfills.Composting of manure and contents of rumen and intestines isa common practice. The quality of wastewater discharged bya company that is not implementing blood separation systemregistered a Chemical Oxygen Demand (COD) of 11.756 mg l�1
which is much higher than the maximum concentrations of1.000e3.000 mg l�1 for mixed slaughterhouses specified in refer-ence document (Cleaner Production Assessment in MeatProcessing, 2000).
The breweries, fish processing, and some fruit and vegetableprocessing companies are implementing raw material and storagemanagement in order to prevent waste generation in thoseprocesses. Solid organic waste associated with technologicalprocess in breweries is mainly sold to subcontractors as animalfeed. One out of the six existing breweries in the country isdiverting diatomaceous earth (i.e. kieselguhr) and parts of breweryyeast into a separate settling basin in order not to discharge it intowastewater, and it has flotation tanks for discharges from thewashing machine. In cases when this is not done, the wastewaterhas a high concentration of suspended solids, COD, and BOD(Table 3).
The fish processing companies adapt production schedules tomarket needs and apply quality control of fish to minimize asso-ciated waste production. There is also no fresh fish storage sincethey use fish directly from the water basins/cages. During fish
Typeof
waste
Spen
tgrains,
kiselguhrsludge
,ye
astsu
rplus,
waste
labe
ls,
brok
englass,
plastic
Pack
agingwaste,o
ilan
dgrea
sesludge
,whey
residues,n
on-
conform
ingproducts,
product
loss
N/A
Dea
dfish
,fish
waste
(skin,h
ead,b
ones,
intestines),
packa
gingwaste
Fruitan
dve
getables
discarded
,packa
ging
material
Bon
es,fat,skin,
pea
cesof
mea
t,packa
gingmaterial
Anim
alby
-produ
cts
NOx
0.18
e0.27
g/Nm
30.01
40g/Nm
3N/A
N/A
N/A
0.00
6e0.16
8g/Nm
3N/A
NO2
0.01
5e0.2
g/Nm
30.01
1e0.02
0g/Nm
3N/A
N/A
N/A
N/A
N/A
SO2
1.61
1e2.73
5g/Nm
30.02
8e0.6g/Nm
3N/A
N/A
N/A
0.00
4e0.32
2g/Nm
3N/A
CO
0.00
2e1.25
g/Nm
30.00
6e3.06
7g/Nm
3N/A
N/A
N/A
0.00
5e0.35
1g/Nm
3N/A
CO2
127.28
e22
1.9
g/Nm
386
.43e
157.1g/Nm
3N/A
N/A
N/A
N/A
N/A
aValues
inbracke
tsarereferentva
lues
take
nfrom
Europea
nIntegrated
Pollu
tion
Prev
ention
andCon
trol
Bureau
(200
6),E
uropea
nIntegrated
Pollu
tion
Prev
ention
andCon
trol
Bureau
(200
3),E
nvironmen
tal,Hea
lth,a
nd
Safety
Guidelines
forAqu
aculture
(200
7),C
lean
erProd
uctionAssessm
entin
Dairy
Proc
essing(200
0),C
lean
erProd
uctionAssessm
entin
Mea
tProc
essing(200
0),E
nvironmen
talMan
agem
entin
theBrewingIndustry
(199
6),
whereav
ailableforco
mparison
.
S. Mid�zi�c-Kurtagi�c et al. / Journal of Cleaner Production 18 (2010) 1533e1542 1539

Author's personal copy
processing, most of the viscera is removed manually and separatedwithin the production plant. Nevertheless, the effluent containshigh organic pollution load (Table 3). The viscera are milled fordisposal to the solid waste tanks within the plants. Waste utilitycompanies empty the tanks and waste is finally disposed of at themunicipal dumping sites.
The dairies close to rural areas separate whey and sell it tofarmers as animal feed. Two large-scale dairies separate whey andmake a new range of natural and aromatized whey products.
Only one fruit and vegetable processing industry implementedcleaner production measures aimed at separating the organic solidwaste and recycling of packaging waste. Organic waste is given tofarmers for composting while a small amount is used for animalfeed. Implementation of cleaner production measures reduced thequantity of solid waste being disposed for 534 ton of organic and51 ton of packagingwaste per year. The investment pay-back periodwas 12-month with total saving of V 9963 per year (Silvenius andGrönroos, 2003).
Audit of the fish farming sector revealed that fish farms applythe best feeding techniques. Most of the farms use automatic orsemi-automatic feeding machines that allow optimal feedingpractices and prevent unnecessary waste. The size and quantity ofthe food is determined according to fish weight, as well as watertemperature. This minimizes waste production but also improveseffluent quality. The amount of food used for growth of trout isapproximately 1.1 kg or less to obtain 1 kg of fish. This feeding ratiois completely in line with the best available practices in troutfarming which suggests the use of 1.255 kg of fish food/kg of trout(Mid�zi�c and Bjelavac, 2005).
Besides general measures for water consumption control,dairies, and breweries are using Cleaning in Place (CIP) system. Inbreweries, water used for tank cooling in the processes offermentation and pasteurization is recycled. In one of the auditedcompanies that implemented the cleaner production project,installation of a system for cooling water recirculation reducedwater consumption by 24% and energy consumption by 18%(Silvenius and Grönroos, 2003). Reuse of cooling water from theCO2 injection plant in air compressors for cooling of compressorswas achieved by installation of a small run-off vessel and a pump.Reuse of water from bottle pasteurization is also practiced. Inmedium and large size dairies, coolingwater is recycled and used inthe process of pasteurization.
Slaughterhouses are using water extensively; there is little useof pressured hoses or triggers especially in small traditionalslaughterhouses and meat processing companies. There is no re-use or recirculation of water. The relevant literature indicates thata combination of simple process and equipment modifications,good house keeping and cleaning practices can improve resourceefficiency and reduce the pollution load even in cases of smalltraditional slaughterhouses (European Integrated PollutionPrevention and Control Bureau, 2006).
Although some of the food and beverage plants have separatewastewater streams for process and sanitary wastewater, the twostreams usually end up in the same discharge pipe. At present, noneof the existing food and beverage industries has an efficientwastewater treatment plant.
In order to optimize energy consumption most of the brew-eries, fruit and vegetable processors, and large-scale dairies useseparate temperature control devices in cooling chambers.Production processes are almost completely automated andheating and cooling processes automatically programmed.However, there are a large number of small-scale dairies that usesequipment including milk pumps, motors, heating, and coolingequipment (pasteurization and drying equipment, refrigerators)that is not optimized to use energy rationally. Experience hasshown that energy consumption in dairies can be reduced by10e30% by employing and improving equipment and procedureswith optimal energy efficiency and less heat waste with dryingair, speed control pumps etc (Puhan, 2000). Large-scale dairiesuse pasteurizers in form of plate heat exchangers with high heatrecovery. In the milk drying process, the energy consumption isreduced in the vaporisation processes, by use of secondaryvapour. Large-scale dairies also apply pipeline and equipmentinsulation.
Cooling chambers in fish processing plants have separatetemperature control devices, which are considered to reduceenergy consumption. The products stay 5 days in the freezers atmost. The products are frozen in the chilling tunnels. Application ofthese measures allows the companies to avoid using more energythan needed for heating and cooling processes without influencingthe product quality.
Regarding the reduction of air emissions, companies practiceregular equipment control and optimization of combustionprocess.
Table 4General BATs with regards to minimize the use of water, the amount and the load of wastewater, the amount of waste and the use of energy applied in food and beveragesubsectors.
Selection of applied BATs Food and beverage subsector
Brewery Slaughterhouses Meatprocessing
Fruit andvegetableprocessing
Dairy Fishfarming
Fishprocessing
Management tools implemented (EMS and HACCP) X O O O X O XOptimization of work through trainings X O O O O O OEquipment selection and design to minimize consumption of
raw materials and natural resourcesX O X O O X X
Procedures for cleaning of plant and equipment to minimizewater and detergent consumption (e.g. CIP cleaning)
X O O O X N/A O
Separation of waste streams X X X X O N/A OMeasurement of raw material and natural resources consumption O O O O O X OSimple techniques for minimization of water consumption
(automatic nozzles, automatic high pressure machines,washbasins with automatic setting)
X X X X X N/A X
Water recycling X O O O O O OSimple techniques for reducing the wastewater load (installation
of the screens over floor drains, dry cleaning prior to cleaningwith water)
X X X X X N/A X
Solid waste recycling X X O X O O OProcess control to reduce energy consumption X O X X X N/A X
S. Mid�zi�c-Kurtagi�c et al. / Journal of Cleaner Production 18 (2010) 1533e15421540

Author's personal copy
5. Conclusions
The analysis of the mapping results has shed light on someimportant issues that have to be taken into account during theprocess of selecting between BAT candidates and the developmentof national reference documents on BATs.
The four-step mapping procedure proved to be a reasonable andimportant foundation for the decision making process in selectingBAT in B&H. Economic, legal, and social aspects are importantfactors that must be taken into account when making a decision onBAT candidates.
The mapping of socio-economic status revealed that theeconomic potential of the sector is a very important backgroundindicator for assessing the investment potential and time needed tobegin the implementation of BATs on company and sector level. Itwill also play an important role in the negotiation process with theEuropean Commission during the accession process.
Economic instruments are an important motivating factor forthe implementation of BAT. Therefore, policies on pricing of waterand waste disposal will require serious reform.
Lack of capacities for adoption and implementation of certaintechniques among employees should not be viewed upon asa constraint to selection of BATcandidates. This should be overcomeby planning capacity building programmes for companies and theiremployees at all levels.
The sector is heterogenic in terms of capacities, installations,and emission sources. Production capacities vary from company tocompany and subsector to subsector. Number of companies withthe same type of processes, same capacities, and sources of emis-sion was rather small, making installations’ categorisation andselection of reference installation rather difficult. This will requirecreating a long list of BAT candidates, upon which decision can bemade on a case-by-case basis, rather than on sector basis.
The mapping of legal requirements revealed that nationalenvironmental legislation would impose those BATs who certainlyare not the “best available” on basis of their technical and/oreconomic feasibility. In the long term, this can alter the companies’production patterns or force their total reconstruction, even forcethem out of business. The latest will have political and socialconsequences, thus economic indicators used for mapping of thesector should help in making the right decisions.
The mapping of environmental performance revealed that thebeer production subsector is more environmentally advanced thanother subsectors analyzed (Table 3). The reason may lay in the factthat major beer production companies have EMS system in place,which puts obligation to prevent pollution as well as to introduceenvironmental friendly procedures and train employees to actresponsibly in the production process. On the other hand, theslaughtering subsector, which in fact has the highest environ-mental impacts concerning type of solid waste produced andwastewater loads that can be expected, seems to be the leastenvironmentally friendly and requires significant improvement inthat sense.
Themapping of BAT’s use in the sector has also revealed that thepossibility to use EU BREF FDM directly is limited since this docu-ment provides benchmarks for the industry with significantlylarger production capacities than those in B&H. As it has also beenobserved by Honkasalo et al. (2005), EU BREF FDM is quiteimpractical to use, especially for dairy industry. It does not providereferent values for complex dairies producing milk, yogurt andcheese, thus making comparison with referent values impossible.Moreover, they can hardly be implemented directly in industriesfrom countries in transition such as B&H, having in mind differenteconomic, environmental, technological, technical, and socialsurroundings compared to the EU countries.
Relying on the information gathered and conclusions drawn, thefollowing step will be to develop national reference documents onBest Available Techniques in sectors covered by this analysis.
National monitoring methodology should be changed andimproved in terms of adequacy for calculation of performanceindicators, and should allow comparison with benchmarksexpressed per production unit. This objective ultimately bringsinstallation of meters on BAT list in order to be able to monitorresource consumption per production unit.
The production capacity of installation must be registered at thetime of monitoring in order to allow calculation of environmentalperformance indicators. A good monitoring system should providereliable and valuable data on an annual basis that will allowassessment of BAT implementation efficiency through time.
The Best Available Techniques that will certainly get on the BATcandidate list will include wastewater stream separation, includingeconomically feasible pollution prevention measures.
Strong enforcement on Law on Waste, in terms of keepingrecord on waste generation and waste selection and separation atsource must be a priority. This will in the long-run result in animprovement in waste recycling system and decrease of wastequantities to be disposed of at municipal landfills.
Role of the funding source
This paper has been prepared in the framework of research workconducted within the project “Capacity Building in Integrated Pollu-tion Prevention and Control in Bosnia and Herzegovina” financed byLIFE Third Countries Programme of the European Commission.
References
Agency for Statistics of B&H, 2008. Industrial Production in B&H 2007. In: ThematicBulletin 5 Sarajevo.
Cleaner Production Assessment in Dairy Processing, 2000. COWI Consulting Engi-neers and Planners AS, Denmark for UNEP DTIE and Danish EnvironmentalProtection Agency.
Cleaner Production Assessment in Fish Processing, 2000. COWI Consulting Engi-neers and Planners AS, Denmark for UNEP DTIE and Danish EnvironmentalProtection Agency.
Cleaner Production Assessment in Meat Processing, 2000. COWI Consulting Engi-neers and Planners AS, Denmark for UNEP DTIE and Danish EnvironmentalProtection Agency.
Commission recommendation (EC) No 2003/532/EC of 10 July 2003 on guidance inthe selection and use of environmental performance indicators in EMAS. Offi-cial Journal of the European Union 184, 25.6.2003, 19.
Derden, A., Vercaemst, P., Dijkmans, R., 2002. Best Available Techniques (BAT) forthe fruit and vegetable processing industry. Resources Conservation andRecycling 34 (4), 261e271.
Dijkmans, R., 2000. Methodology for selection of Best Available Techniques (BAT) atsector level. Journal of Cleaner Production 8 (1), 11e21.
Directive 2008/1/EC of the European Parliament and of the Council of 15 January2008 concerning integrated pollution prevention and control. Official Journal ofthe European Union 24, 29.1.2008, 8e29.
Environmental Management in the Brewing Industry. In: Technical Report No. 33,1996. UNEP Industry and Environment.
Environmental, Health, and Safety Guidelines for Aquaculture, April 30, 2007.International Finance Corporation (IFC), The World Bank Group.
European Integrated Pollution Prevention and Control Bureau, November 2003.Reference Document on Best Available Techniques in the Slaughterhouses andAnima By-products Industries.
European Integrated PollutionPreventionandControl Bureau, August 2006. ReferenceDocument on Best Available Techniques in the Food, Drink and Milk Industries.
Gelderman, J., Rentz, O., 2004. The reference installation approach for the techno-economic assessmentof emission abetmentoptions and thedetermination of BATaccording to the IPPC directive. Journal of Cleaner Production 12 (4), 389e402.
Gelderman, J., Zhang, K., Rentz, O. Multicriteria Group Decision support for inte-grated technique assessment. Proceedings of the 57th Meeting of the EuropeanWorking Group “Multiple Criteria Decision Aiding”, Viterbo, 2003.
Honkasalo, N., Rodhe, H., Dalhammar, C., 2005. Environmental permitting asa driver for eco-efficiency in the dairy industry: a closer look at the IPPCDirective. Journal of Cleaner Production 13 (10e11), 1049e1060.
Institute of Statistics of the Republic of Srpska. Yearly Statistical Review for 2004and 2005: Monthly Statistical Review of the RS for 2006-Production of SelectedIndustrial Products.
S. Mid�zi�c-Kurtagi�c et al. / Journal of Cleaner Production 18 (2010) 1533e1542 1541

Author's personal copy
Kupusovi�c, T., Mid�zi�c, S., Silajd�zi�c, I., Bjelavac, J., 2007. Cleaner production measuresin small-scale slaughterhouse industry e case study in Bosnia and Herzegovina.Journal of Cleaner Production 15 (4), 378e383.
LaForest, V., Bertheas, R. Integrated environmental regulation e how to define BestAvailable Techniques? 9th European Roundtable on Sustainable Consumptionand Production, Bilbao 12e14 May, 2004.
Law on Air Protection. Official Gazette of the Federation of B&H No 33/03; OfficialGazette of the Republic of Srpska No. 53/02.
Law on Environmental Protection. Official Gazette of the Federation of B&H No33/03; Official Gazette of the Republic of Srpska No. 28/07 (refined text).
Law on Food. Official Gazette of B&H No 50/04.Law on Waste. Official Gazette of the Federation of B&H No. 70/06; Official Gazette
of the Republic of Srpska No. 50/06.Masoliver Jordana, D., 2001. Practical Guide for the Implementation of an Envi-
ronmental Management Scheme, Ecomanagement Manuals: 2. Generalitat deCatalunya Departament de Medi Ambient.
Mid�zi�c, S., Bjelavac, J., 2005. Capacity Building in Cleaner Production in Bosnia andHerzegovina: Part II e CP in Implementation in B&H Industrial Enterprises.RAC/CP Annual Technical Publication, pp. 39e46.
Mid�zi�c S, Silajd�zi�c I. Possibilities for Application of Cleaner Production in TransitionCountries e Experiences from the LIFE project Capacity Building in CleanerProduction in Bosnia and Herzegovina. Proceedings from the InternationalScientific Conference, Brno, 2006, pp. 133e140.
Puhan, Z., 2000. Dairy technology on the turn of the millennium. Zb. Biotehni�skefak. Univ. v Ljubljani. Ketijstvo. Zootehnika 76, 31e40.
Schollenberger, H., Treiza, M., Geldermann, J., 2008. Adapting the Europeanapproach of Best Available Techniques: case studies from Chile and China.Journal of Cleaner Production 16 (17), 1856e1864.
Silvenius, F., Grönroos, J., 2003. Fish Farming and the Environment, Results ofInventory Analysis. Finnish Environment Institute, Helsinki. Finland.
Statistical Yearbook of FB&H, 2008. Institute of Statistics of the Federation of B&H.Strange, T., Baley, A., 2008. Sustainable Development, Linking Economy Society and
Environment. OECD, Paris.Subsector Profiles e Market Profiles & Competitiveness Inventory Report e Beef
and Veal Subsector (2004), Dairy Production Subsector (2005), Processed FruitsSubsector (2004).
Water Law. Official Gazette of the Federation of B&H No. 70/06; Official Gazette ofthe Republic of Srpska No. 50/06.
S. Mid�zi�c-Kurtagi�c et al. / Journal of Cleaner Production 18 (2010) 1533e15421542


