Embed Size (px)
Citation preview
MATERNAL EFFECTS ON OOCYTE QUALITY IN FARMEDATLANTIC HALIBUT (HIPPOGLOSSUS HIPPOGLOSSUS L.)
Maren Mommens
A Thesis Submitted for the Degree of PhDat the
University of St Andrews
2012
Full metadata for this item is available inResearch@StAndrews:FullText
at:http://research-repository.st-andrews.ac.uk/
Please use this identifier to cite or link to this item:http://hdl.handle.net/10023/3661
This item is protected by original copyright
Maternal effects on oocyte quality in farmed Atlantic
halibut (Hippoglossus hippoglossus L.)
Maren Mommens
This thesis is submitted in partial fulfilment for the degree of PhD at the
University of St Andrews
September 2011

2
This thesis is dedicated to my parents.

3
Acknowledgements
First of all, I would like to express my gratitude to my supervisors Professor Ian A. Johnston,
Professor Igor Babiak and Dr. Jorge M.O. Fernandes for their invaluable support, advice and
constructive feedback. My thanks go to Risør Fisk AS and especially Kjell E. Naas and
Yngve Attramadal for their cooperation and help during sampling. The microarray
collaboration with Dr. Knut Erik Tollefsen from the Norwegian Institute for Water Research
(NIVA) was much appreciated and I would like to thank You Song for his excellent training
in microarray preparation.
The members of the Fish Muscle Research Group at the University of St. Andrews introduced
me to molecular biology and I would especially like to thank Dr. Hung-Tai Lee and Dr.
Sitheswarab Nainamalai for help and support in the lab. Dr. Neil Bower arrived at the same
time as me in St.Andrews and together with his family we shared our Scotland experience.
Special thanks go to Dr. Lara Meischke for including me in her group of friends which
contributed to many memorable experiences during my stay.
I would like to thank all members of the Reproductive Biology Group at the University of
Nordland for their support and encouragement during my PhD. Special thanks goes to Dr.
Sylvie L. Bolla for invaluable help during sampling and sharing her experience and
enthusiasm on Atlantic halibut production and fish nutrition with me. Carlos F.C. Lanes and
Teshome Bizuayehu contributed to part of this study with samples and help during lab work.
I would like to thank Professor Christel Solberg and Dr. Ørjan Hagen from the Seafood
Quality Research Group for their contribution to the reference gene analysis. Thanks go to
Bjørnar Eggen and Tormod Skålsvik from the Research Station at the University of Nordland
for their help during Atlantic halibut stripping. Friends and colleagues at the Faculty of

4
Bioscience and Aquaculture at the University of Nordland helped out by hiring me during the
last part of my PhD to make sure that I could finish.
During my PhD I was lucky to get to know many lovely people from all over the world,
making this time not only a scientific, but also a cultural experience. Their friendships and
never ending encouragements are much appreciated.
Finally, my greatest gratitude goes to my parents and family for their love, encouragement
and support.

5
Table of contents
Acknowledgement……………………………………...……………………………………...3
Table of contents…………………………...………………………………………………......5
List of figures…………………………………………………………………………………10
List of tables……………………………….………………………………………………….12
Declaration…………………………………...……………………………………………….14
List of abbreviations…………………..……………………………………………..………..15
Thesis abstract……………………………….……………………………………….……….19
1 General Introduction ........................................................................................................ 21
1.1 Atlantic halibut .......................................................................................................... 21
1.1.1 Atlantic halibut farming and its challenges ........................................................ 22
1.1.2 Atlantic halibut embryonic development ........................................................... 25
1.2 Oocyte quality in teleosts .......................................................................................... 30
1.2.1 Broodstock husbandry ........................................................................................ 30
1.2.2 Oocyte fertilisation and incubation .................................................................... 33
1.2.3 Markers for oocyte quality ................................................................................. 33
1.3 Gene regulation of embryonic development ............................................................. 35
1.3.1 Maternal mRNAs ............................................................................................... 35
1.4 Teleosts genomic resources ....................................................................................... 40
1.4.1 Introduction to teleosts genomes ........................................................................ 40
6
1.4.2 Applications for commercial farming ................................................................ 45
1.4.3 Molecular markers for oocyte quality ................................................................ 48
1.5 Objectives of the present study .................................................................................. 49
2 Construction of a maternal EST library by suppressive subtractive hybridisation (SSH) in
Atlantic halibut ......................................................................................................................... 50
2.1 Abstract ...................................................................................................................... 50
2.2 Introduction ............................................................................................................... 51
2.3 Material and Methods ................................................................................................ 53
2.3.1 Fish husbandry and sample collection................................................................ 53
2.3.2 RNA extraction and cDNA synthesis ................................................................. 53
2.3.3 Suppressive subtractive hybridisation ................................................................ 54
2.3.4 Sequence processing and bioinformatics analysis.............................................. 57
2.3.5 Relative gene expression by quantitative real-time PCR (qPCR) ...................... 59
2.3.6 Data analysis and statistics ................................................................................. 60
2.4 Results ....................................................................................................................... 67
2.4.1 Characterization of EST library ......................................................................... 67
2.4.2 Screening of relative gene expression during embryonic development ............. 72
2.5 Discussion .................................................................................................................. 76
2.5.1 Characterization of the EST library.................................................................... 76
2.5.2 Screening of relative gene expression through embryonic development ........... 77
3 Selection of suitable reference genes for quantitative real-time (qPCR) studies of Atlantic
halibut development ................................................................................................................. 80
7
3.1 Abstract ...................................................................................................................... 80
3.2 Introduction ............................................................................................................... 81
3.3 Material and Methods ................................................................................................ 85
3.3.1 Fish husbandry and sample collection................................................................ 85
3.3.2 RNA extraction and cDNA synthesis ................................................................. 87
3.3.3 Primer design ...................................................................................................... 87
3.3.4 Quantitative real-time PCR (qPCR) ................................................................... 90
3.3.5 Statistical analysis .............................................................................................. 91
3.3.6 Evaluation of expression stability ...................................................................... 91
3.4 Results ....................................................................................................................... 93
3.4.1 Developmental expression profiles of candidate reference genes ..................... 93
3.4.2 Analysis of expression stability .......................................................................... 93
3.5 Discussion ................................................................................................................ 103
4 Maternal transcripts in Atlantic halibut during embryonic development ...................... 107
4.1 Abstract .................................................................................................................... 107
4.1.1 Fish husbandry and sample collection.............................................................. 111
4.1.2 RNA extraction and cDNA synthesis ............................................................... 112
4.1.3 Relative gene expression by quantitative-real time PCR (qPCR) .................... 112
4.1.4 Data analysis and Statistics .............................................................................. 114
4.2 Results ..................................................................................................................... 124
4.3 Discussion ................................................................................................................ 126

8
5 Relation between oocyte fatty acid, amino acid, and folate concentrations and Atlantic
halibut oocyte quality. ............................................................................................................ 129
5.1 Abstract .................................................................................................................... 129
5.2 Introduction ............................................................................................................. 131
5.3 Material and Methods .............................................................................................. 135
5.3.1 Fish husbandry and sampling collection .......................................................... 135
5.3.2 Egg composition analysis ................................................................................. 140
5.4 Results ..................................................................................................................... 143
5.5 Discussion ................................................................................................................ 150
6 Microarray-based identification of maternal gene expression and its relation to Atlantic
halibut oocyte quality ............................................................................................................. 158
6.1 Abstract .................................................................................................................... 158
6.2 Introduction ............................................................................................................. 160
6.3 Material and Methods .............................................................................................. 163
6.3.1 Fish husbandry and sample collection.............................................................. 163
6.3.2 Microarray construction and probe design ....................................................... 167
6.3.3 RNA extraction, sample labelling and microarray hybridization..................... 168
6.3.4 Sample labelling and hybridization .................................................................. 168
6.3.5 Microarray design ............................................................................................ 169
6.3.6 Microarray validation by quantitative real-time PCR (qPCR) ......................... 169
6.3.7 Data analysis .................................................................................................... 170
6.4 Results ..................................................................................................................... 177
9
6.4.1 Gene ontology .................................................................................................. 177
6.4.2 Maternal gene expression profiling during embryonic development ............... 177
6.4.3 Differential gene expression in high and low quality eggs .............................. 178
6.4.4 Microarray validation ....................................................................................... 179
6.5 Discussion ................................................................................................................ 193
6.5.1 Maternal gene expression profiling .................................................................. 193
6.5.2 Differential gene expression in high and low quality eggs .............................. 193
6.5.3 Microarray validation ....................................................................................... 196
7 General discussion .......................................................................................................... 198
7.1 Atlantic halibut genomic resources ......................................................................... 198
7.2 Maternal effects on oocyte quality .......................................................................... 201
7.3 Concluding remarks and future perspectives ........................................................... 206
8 Publications .................................................................................................................... 209
9 Appendix ........................................................................................................................ 210
10 References ...................................................................................................................... 222
10
List of figures
Figure 1.1 European wild catch and aquaculture production of Atlantic halibut..................... 23
Figure 1.2 Atlantic halibut embryonic development. ............................................................... 29
Figure 1.3 Factors influencing fish oocyte quality in aquaculture. .......................................... 32
Figure 1.4 Schematic representation of maternal-zygotic transition (MTZ)............................ 37
Figure 2.1 Principle of suppressive subtractive hybridisation (SSH). ..................................... 56
Figure 2.2 Overview over sequence processing and bioinformatics analysis. ......................... 58
Figure 2.3 Reference gene stability values throughout early Atlantic halibut embryonic
development. ............................................................................................................................ 66
Figure 2.4 Gene classification based on Gene Ontology (GO). ............................................... 70
Figure 2.5 Clustering of genes, according to their relative gene expression during early
embryonic development. .......................................................................................................... 74
Figure 2.6 Relative gene expressions of selected Atlantic halibut genes from 8C to 10SS
stage. ......................................................................................................................................... 75
Figure 3.1 Overview over Atlantic halibut developmental stages. .......................................... 86
Figure 3.2 Overall expression patterns of potential reference genes during early development
of Atlantic halibut. .................................................................................................................... 96
Figure 3.3 Individual developmental expression profiles of potential reference genes. .......... 97
Figure 3.4 Ranking of reference genes according to their expression stability during Atlantic
halibut development. .............................................................................................................. 101
Figure 3.5 Ranking of reference genes according to their expression stability during Atlantic
halibut development. .............................................................................................................. 102
Figure 4.1 Blastomere morphology in 8-cell stage Atlantic halibut embryos........................ 115
Figure 4.2 Reference gene stability values. ............................................................................ 123
11
Figure 4.3 Correlations between gene expression and Atlantic halibut oocyte quality (r ≥ 0.5).
................................................................................................................................................ 125
Figure 5.1 n-3 and n-6 metabolism. ....................................................................................... 157
Figure 6.1 Atlantic halibut embryonic developmental stages. ............................................... 165
Figure 6.2 Flow chart of the microarray design. .................................................................... 172
Figure 6.3 Flow chart showing microarray data processing and main results. ...................... 173
Figure 6.4 Raw cycle threshold (CT) levels (mean ± S.E.) of reference genes for qPCR
normalization. ......................................................................................................................... 176
Figure 6.5 GO annotations for 4x44k Atlantic halibut microarray. ....................................... 181
Figure 6.6 Hierarchical clustering of gene expression during embryonic development. ....... 182
Figure 6.7 Hierarchical clustering of differentially expressed genes in high (H) and low (L)
quality oocytes. ....................................................................................................................... 189
Figure 6.8 Validation of expression patterns by quantitative PCR (qPCR). .......................... 191
Figure 6.9 Microarray validation. .......................................................................................... 192
12
List of tables
Table 1.1 Overview over the 20 teleost species with most expressed sequence tags (ESTs). . 43
Table 1.2 Overview over number of sequence tags (ESTs) available on dbEST database for
the twenty most valuable aquaculture teleost species. ............................................................. 44
Table 2.1 List of selected genes, with significant BLASTX results, used for gene expression
quantification of maternal library from Atlantic halibut. ......................................................... 61
Table 2.2 List of selected genes, with conserved domain hits, used for gene expression
quantification of maternal library from Atlantic halibut. ......................................................... 62
Table 2.3 Primer information of selected genes, with significant BLASTX results. ............... 63
Table 2.4 Primer information of selected genes, with conserved domain hits. ........................ 64
Table 2.5 Primer information of reference genes. .................................................................... 65
Table 2.6 Most commonly abundant EST clones of maternal EST library. ............................ 69
Table 2.7 The most commonly represented KEGG pathways of maternal sequences............. 71
Table 3.1: Reference gene and primer information. ................................................................. 89
Table 3.2 Inter-gene relations and correlations between the reference genes and the
BestKeeper index. ..................................................................................................................... 98
Table 3.3 Indices of expression stability of six reference genes during early development of
Atlantic halibut determined with the geNorm. ......................................................................... 99
Table 3.4 Indices of expression stability of six reference genes during early development of
Atlantic halibut. ...................................................................................................................... 100
Table 4.1 Sample overview. ................................................................................................... 116
Table 4.2 List of selected genes used for quantification of gene expression in 29 Atlantic
halibut oocyte batches. ........................................................................................................... 119
Table 4.3 List of random genes used for quantification of gene expression in 29 Atlantic
halibut oocyte batches. ........................................................................................................... 120
13
Table 4.4 Primer information of selected genes. .................................................................... 121
Table 5.1 Sample overview. ................................................................................................... 137
Table 5.2 Fatty acid (FA) concentration in Atlantic halibut oocytes (n = 34). ...................... 145
Table 5.3 Multiple regression analysis. .................................................................................. 147
Table 5.4 Amino acid (AA) concentration in Atlantic halibut oocytes (n = 34). ................... 148
Table 5.5 Folate concentration in 19 Atlantic halibut oocyte batches (n = 2). ...................... 149
Table 6.1 Sample overview. ................................................................................................... 166
Table 6.2: Primer information for microarray validation ....................................................... 174
Table 6.3 Gene ontology enrichment in gene clusters. .......................................................... 183
Table 6.4 List of maternal genes (CL6) with significant BLASTX hits. ............................... 184
Table 6.5 Differentially expressed genes in high and low quality Atlatnic halibut oocytes. . 190
Supplementary table A Fatty acid concentration in Atlantic halibut oocytes. ....................... 210
Supplementary table B Amino acid concentration in Atlantic halibut oocytes. .................... 212
Supplementary table C Biological prosess (BP) gene ontology annotations (GOs) for Atlantic
halibut micoroarray probes. .................................................................................................... 213
Supplementary table D Molecular function (MF) gene ontology annotations (GOs) for
Atlantic halibut micoroarray probes. ...................................................................................... 215
Supplementary table E Cellular component (CC) gene ontology annotations (GOs) for
Atlantic halibut micoroarray probes. ...................................................................................... 217
Supplementary table F Uncharacterized maternal genes present in CL6. .............................. 219
14
Declaration
I, Maren Mommens, hereby certify that this thesis, which is approximately 45,000 words in
length, has been written by me, that it is the record of work carried out by me and that it has
not been submitted in any previous application for a higher degree.
I was admitted as a part-time research student in October 2006 and as a candidate for the
degree of PhD in October 2006; the higher study for which this is a record was carried out in
the University of St Andrews between 2006 and 2011.
Date ……..... Signature of candidate ………
I hereby certify that the candidate has fulfilled the conditions of the Resolution and
Regulations appropriate for the degree of ……… in the University of St Andrews and that the
candidate is qualified to submit this thesis in application for that degree.
Date …… Signature of supervisor ………
In submitting this thesis to the University of St Andrews I understand that I am giving
permission for it to be made available for use in accordance with the regulations of the
University Library for the time being in force, subject to any copyright vested in the work not
being affected thereby. I also understand that the title and the abstract will be published, and
that a copy of the work may be made and supplied to any bona fide library or research worker,
that my thesis will be electronically accessible for personal or research use unless exempt by
award of an embargo as requested below, and that the library has the right to migrate my
thesis into new electronic forms as required to ensure continued access to the thesis. I have
obtained any third-party copyright permissions that may be required in order to allow such
access and migration, or have requested the appropriate embargo below.
The following is an agreed request by candidate and supervisor regarding the electronic
publication of this thesis:
Embargo on Chapter 5 and 6 both of printed copy and electronic copy for the same fixed
period of 1 year on the following ground: publication would preclude future publication.
Date ..................
Signature of candidate …… ...............Signature of supervisor ........................
15
List of abbreviations
18k Gold 18K hypothetical goldfish protein
18S rRNA 18S ribosomal RNA
8CS 8-cell stage
16CS 16-cell stage
25EP 25% epiboly
50EP 50% epiboly
20-HETE 20-hydroxyeicosatetraenoic acid
10SS 10-somoite stage
30SS 30-somite stage
µg Micro gram
µm Micrometer
µM Micro molar
ϱ Spearman’s Rho
A Adenosine
AA Amino acid
Actb β-Actin
ANOVA Analysis of variance
AP Advanced photoperiod
ARA Arachidonic acid (20:4n6)
Bah Betaine aldehyde dehydrogenase
BL Blastula
BLAST Basic Local Alignement Tool
BTB Bric-a-brack, Tramtrack and Broad-complex
Buc Bucky ball
BP Biological processes
bp Base pair
Bsd Blistered
cAMP Cyclic adenosine monophosphate
CC Cellular component
cDNA Complementary DNA
Cea Cellular atoll
Cei Cellular island
Chk1 Checkpoint 1
CL Cluster
cm Centimeter
CRL Cullin-RING ubiquitin ligases
cRNA Complimentary RNA
CUL2 Cullin 2
Cy3 Cyanine 3
cyp2n Cytochrome p450
cycB Cyclin B
dbEST Expressed Sequence Tags database
DGLA Dihomo-γ-linolenic acid (20:3n6)
DHA Decosahexaenonic acid (20:5n3)
DNA Deoxyribonucleic acid
dNTP Deoxyribonucleotide triphosphate
DPA Docosapentaenoic acid (22:5n3)
E PCR efficiency (E)
16
eef2 Eucaryotic translation elongation factor 2
eef1a2bp Eukaryotic translation elongation factor 1A2 binding protein,
EET Epoxyeicosatrienoic acids
EFA Essential fatty acid
EP Epiboly
EPA Eicosapentaenoic acid (20:5n3)
ESA Eicosatetraenoic acid (20:4n3)
ESCL Embryonic stem cell lines
EST Expressed sequence tag
E E-value
FA Fatty acid
FAA Free amino acid
FAME Fatty acid methyl esters
fau 40S ribosomal protein S30
FAO Food and Agriculture Organization of the United Nations
FDR False discovery rate
FF First-feeding
FSH Follicle-stimulating hormone
FSH-R Follicle-stimulating hormone-receptor
g Gram
gapdh Glyceraldehyde-3-phosphate dehydrogenase
GBP British Pound
GEPAS Gene Expression Pattern Suit
gDNA Genomic DNA
GnRHa Gonadotrophin-releasing hormone agonist
GO Gene Ontology
GR Germ ring
GTP Guanosine triphosphate
Gv Germinal vesicle
h Hours
H High
HB High blastula
HIRRV Hirame Rhabdovirus
hpf Hours past fertilisation
HSP Highest scoring pair
HT Hatched larvae
hr6a Ubiquitin carrier protein
IEA Inferred by Electronic Annotation
IFN Interferon
IHNV Infectious Haematopoietic Necrosis Virus
IPN Infectious pancreatic necrosis
irf7 interferon regulatory factor 7
KEGG Kyoto Encyclopedia of Genes and Genomes
k Kilo
kg Kilogram
kop Askopos
l Liters
L Low
LA Linnoleic acid (18:2n6)
LH Luteinizing hormone
17
LH-R Luteinizing hormone receptor
lhβ Luteinizing hormone β-subunit
LNA Linolenic acid (18:3n3)
LS Larval stage
lux Luciferase
M Million
M Gene expression stability value
mM Millimolar
m Metres
m3 Qubic metres
Mb Mega bases
MBT Mid-blastula transition
MF Molecular function
MHC Major histocompatibility complex
mhc1dab mhc class i antigen alpha chain
mhc2dab mhc class ii antigen alpha chain
min Minute
ml Milliliters
miRNA Micro RNA
MRF Myogenic regulating factor
mRNA Messenger RNA
ms4a8a Membrane-spanning 4-domains subfamily a member 8a
MUFA Monounsaturated fatty acid
MyHC Myosin Heavy Chain
MyLC2 Myosin Light Chain 2
MyoD Myogenic determination factor
myod1a Myogenic determination factor subunit 1a
myod1b Myogenic determination factor subunit 1b
myod2 Myogenic determination factor 2
MZT Maternal-zygotic transition
N Number
NCBI National Centre for Biotechnology Information
NERC-EGTDC Natural Environment Research Council-Environmental Genomics Thematic
Programme Data Centre
NL Neutral lipids
nm Nanometer
NP Natural photoperiod
nr non-redundant
OA oleic acid (18:1n9)
ORF Open reading frame
PA Palmitic acid (16:00)
pd-1l Programmed cell death 1 ligand 1
PDPK1 3-phosphoinositide-dependent protein kinase-1
pg Pico gram
phb1 Prohibitin 1
phb2 Prohibitin 2
PINV Infectious pancreatic necrosis virus
PL Polar lipids
POA Palmitoleic acid (16:1n7)
ppt Parts per thousand
18
psmb9 Proteasome subunit beta type-9 precursor
psq pipsueak
PUFA Polyunsaturated fatty acid
Pwg Pollywog
qC quantification cycles
qPCR Quantitative real-time PCR
QTL Quantitative trait loci
r Pearson’s correlation coefficient
RIN RNA integrity number
RNA Ribonucleic acid
rnf213 Ring finger protein 213
rpm Rounds per minute
Rsa I Restriction endonuclease I
SAM S-adenosyl methionine
SD Standard deviation
Sec Seconds
sGnRH Salmon gonadotropin-releasing hormone
SSH Suppressive subtractive hybridisation
SSR Single sequence repeats
stmn2 Stathmin 2
Stx4 Syntaxin 4
t Tonn
T Total
Tdrd5 Tudor 5 protein
tRNA Transfer RNA
Tubb2 β2-Tubulin
UFA Unsaturated fatty acids
UK United Kingdom
UPGMA Un-weighted pair-group method with arithmetic averages
UTR Untranslated Region
VHSV Viral Hemorrhagic Septicemia Virus
WPGMA Weighted pair group method
XPO1 Exportin-1
zDazl. Deleted in azoospermia-like
19
Thesis abstract
Atlantic halibut (Hippoglossus hippoglossus) oocyte quality is highly variable and one of the
major bottlenecks during fry-production for on-growth in commercial Atlantic halibut
farming. In this study, the effect of maternally derived oocyte constituents (i.e. yolk
components and mRNAs) on oocyte quality (i.e fertilisation, embryonic hatching and normal
blastomere symmetry) in farmed Atlantic halibut has been investigated.
Atlantic halibut embryos and larvae depend on nutritional yolk components until larval first
feeding. The importance of yolk n-3 fatty acids for oocyte quality was confirmed. However,
highest positive correlations with oocyte quality were found for the less studied fatty acids
dihomo-γ-linolenic acid (DGLA, 20:3n6) and docosapentaenoic acid (DHA, 20:5n3) that are
known to compete with two of the most abundant fatty acids, arachidonic acid (ARA, 20:4n6)
and docosahexaenoic acid (DPA, 22:5n3), respectively during fatty acid metabolism. High
methionine and aspartic concentrations, amino acids essential to eukaryotic protein synthesis,
were found to influence oocyte quality positively while no significant correlations were found
between oocyte folate concentrations and oocyte quality.
Before activation of zygotic transcription, maternal mRNAs control cell divisions and
embryonic patterning. Due to the limited available genomic information on Atlantic halibut
maternal transcripts, an expressed sequence tag (EST) maternal library containing 2,341high
quality ESTs was created by suppressive subtractive hybridization (SSH). The maternal
library constitutes an EST pool to identify suitable Atlantic halibut reference genes and
identify differentially expressed maternal genes in high and low quality Atlantic halibut
oocytes.
To perform reliable quantification of gene expression by qPCR, stable reference genes have to
be used to normalize target gene expression. Tubb2/Actb and Tbb2/Fau were identified as the
20
best two-gene normalization factors during Atlantic halibut embryonic and larval
development. Either of these normalization factors can be used for future developmental gene
expression studies in Atlantic halibut. Tubb2/Actb was further used as reference gene during
this study.
Poor embryonic hatching success was found to not be correlated with a general decrease in
oocyte maternal transcript abundance but with low transcript levels of specific maternal
transcripts by qPCR. The majority of genes showed either no or very minor correlations
between their transcript levels and oocyte quality parameters (Fertilisation: 13-93 %,
embryonic hatching: 1-94 %). However, maternal transcript levels of three genes, most likely
involved in nuclear protein and mRNA transport, growth factor regulation, and embryonic
patterning, correlated with oocyte quality.
Further, a new Atlantic halibut 4x44k oligonucleotide microarray was constructed and used to
identify 192 strictly maternal genes during Atlantic halibut embryonic development and 20
differentially expressed genes between high and low quality oocytes, involved in immune
response, metabolism, RNA transcription, protein degradation, cell signalling and the
cytoskeleton. Microarray validation confirmed its suitability for future gene expression
studies during Atlantic halibut embryonic development.
The identified maternal genes in this study can serve as a pool for future in-depth studies of
embryonic gene expression to advance the knowledge of important developmental processes
such as germ cell development, growth and immune response in Atlantic halibut. Some of
these may serve as possible markers for Atlantic halibut oocyte quality due to their high
expression differences between high and low quality oocytes. Future nutritional studies on
Atlantic halibut broodstock should focus on the identified yolk constituents acting positively
on oocyte quality.
21
1 General Introduction
1.1 Atlantic halibut
Atlantic halibut (Hippoglossus hippoglossus) belongs to the subfamily Pleuronectinae within
the family Pleuronectiformes and is the largest known flatfish. It is a cold-water species and
its natural habitat is mainly in the Northern Atlantic Ocean. In western parts of the North
Atlantic its range is from the waters outside Virginia and New Jersey up to Greenland. On the
European side its habitat spreads from the Bay of Biscay up to the Barents Sea. Atlantic
halibut can reach a size over 300 kg and live for 50 years and more. Juvenile Atlantic halibut
(> 30cm) feed mainly on crustaceans but as they grow bigger switch gradually to other fish
species such as Atlantic cod (Gadus morhua), haddock (Melanogrammus aeglefinus), and
redfish (Sebastes marinus). Halibut males reach considerably smaller size than females
seldom exceeding 50 kg (Haug, 1990). Little is known about the reproductive pattern of wild
Atlantic halibut but it seems to be under the control of a circannual (seasonal) endogenous
mechanism (Björnsson et al., 1998 ; Migaud et al., 2010). Atlantic halibut gametogenesis is
initiated by increasing day length and spawning takes place between December to April at
300-700 m depth where temperature and salinity are stable within narrow ranges of 5-7 °C
and 34.5-34.9 ppt, respectively (Kjorsvik et al., 1987). Total female annual fecundity varies
from 0.5 to 7 million oocytes, depending on age and size of the female. Oocytes are released
within approximately one month in several batches in intervals of 3-4 days (Haug &
Gulliksen, 1988 ; Norberg et al., 1991). Males produce sperm throughout the whole spawning
season (Haug, 1990 ; Babiak et al., 2006).
22
1.1.1 Atlantic halibut farming and its challenges
Atlantic halibut is farmed in Canada, Scotland, Norway and Iceland and achieves high marked
prices (e.g ~8 GBP kg-1
in 2010, www.intrafish.com). European production peaked in 2007
but has decreased and flattened out since then (Food and Agriculture Organization of the
United Nations: http://www.fao.org/fishery/statistics/en, Figure 1.1).
Seasonally independent oocyte and juvenile production has been achieved for Atlantic halibut
by photoperiod manipulation (Næss et al., 2001 ; Björnsson et al., 1998). Although natural
spawning may occur in captivity, the usual method entails hand-stripping as collection of
gametes by gentle pressuring the broodstock abdomen, followed by artificial fertilisation
(Mangor-Jensen et al., 1998). Eggs are normally reared in 250 l upwelling incubators at 5-
7 °C and 32-34 ppt (Harboe et al., 1998). Atlantic halibut eggs are buoyant and daylight can
trigger increased water permeability of the chorion leading to a reduction in volume and
buoyancy. Therefore, eggs are routinely incubated in darkness (Mangor-Jensen & Waiwood,
1995). At 6 ºC, larvae hatch after approximately 16 days (Rollefsen, 1934). Compared to
other marine teleosts, the duration of the yolk-sac stage, that is the time from hatching until
start of exogenous feeding, is relatively long in Atlantic halibut, taking from 30 to 50 days,
depending on temperature (Pittman et al., 1990a). Due to the length of the yolk-sac stage,
specialized incubators for larval rearing have been developed. They are typically reared in
cylindrical tanks with conical bottom up to 6 m high, so-called upwelling silos. Temperature
is typically kept at 5 to 6 °C, but often gradually increased towards the onset of feeding
(Harboe & Adoff, 2005). Yolk-sac larvae are relatively sensitive to changes in salinity, as
their normal condition is to be neutrally buoyant.
23
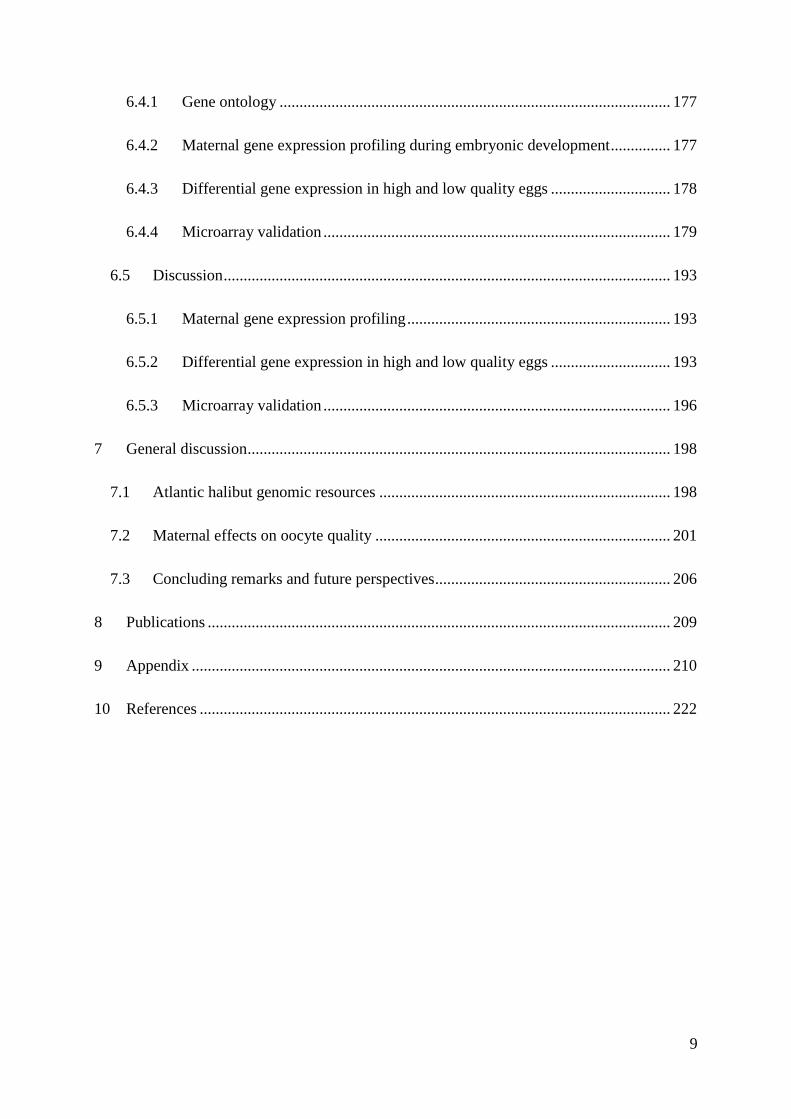
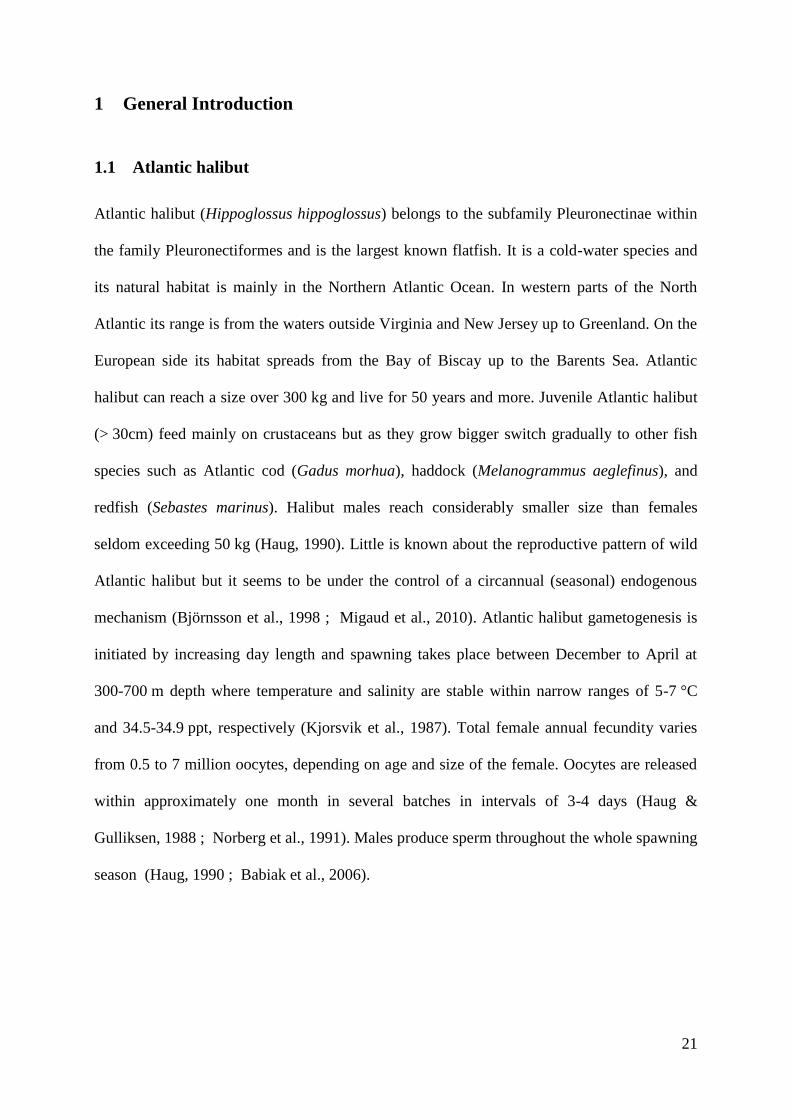
Figure 2.1 European wild catch and aquaculture production of Atlantic halibut.
Wild catch and aquaculture production in tons (t) from 1990 to 2008 (Food and Agriculture
Organization of the United Nations: http://www.fao.org/fishery/statistics/en).
24
Common practice is therefore to alter inlet water salinity if necessary (Mangor-Jensen et al.,
1998). Intensive start-feeding of halibut is based on Artemia and lasts up to two month (Olsen
et al., 1999 ; Hamre et al., 2002). Larvae are usually weaned onto a formulated diet after
completion of metamorphosis, at approximately 0.25 g (Rosenlund et al., 1997).
Commercial Atlantic halibut farming strives with challenges in several production stages.
Atlantic halibut is stenothermal and broodstock kept at temperatures above 6 C during the
reproductive season produce oocytes of reduced quantities and quality (Brown et al., 2006).
However, temperature control for broodstock demands high energy costs and is not always
used. Atlantic halibut stripping is labor intensive due to the large size of the broodstock,
typically 30-100 kg. Oocyte quality decreases 4-6 h after ovulation which requires careful
monitoring of individual females for indication of ovulation (Norberg et al., 1991 ; Bromage
et al., 1994). However, in commercial production, females are routinely stripped every 3-4
days independent of their ovulation rhythm (Norberg et al., 1991). Early embryonic mortality
in commercially farmed marine teleosts is generally high and Atlantic halibut hatching can be
as low as 1 % (Kjorsvik et al., 1990 ; Norberg et al., 1991). Larvae reared under suboptimal
conditions develop jaw deformities and yolk-sac oedema (Pittman et al., 1989 ; Lein et al.,
1997a ; Lein et al., 1997b). Other types of common malformations include incomplete eye
migration during metamorphosis, malpigmentation, and skeletal deformities leading to
increased mortality or fry of poor commercial value (Lewis & Lall, 2006 ; Lewis et al., 2004
; Sæle et al., 2006 ; Hamre et al., 2007 ; Lewis-McCrea & Lall, 2007). Relatively slow
growth of Atlantic halibut and its sex-depended dimorphism are the main obstacles in Atlantic
halibut production during the on-growing phase (Hendry et al., 2002 ; Foss et al., 2009 ;
Imsland et al., 2009).
25
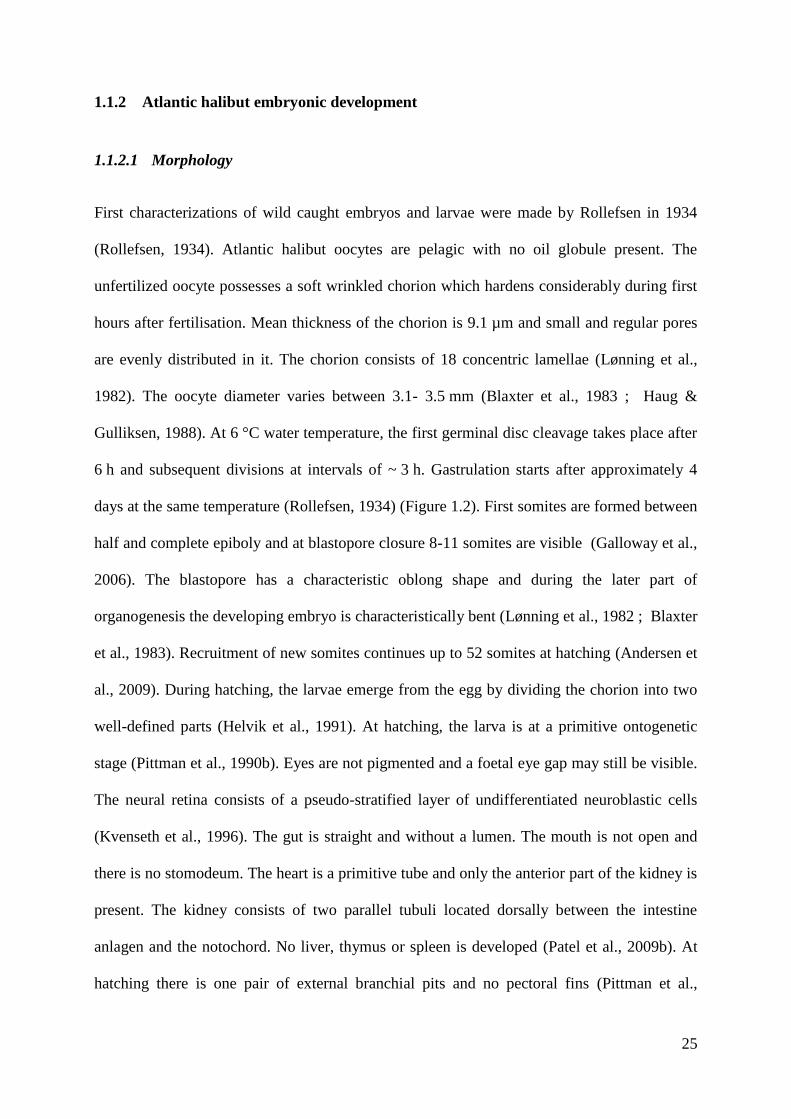
1.1.2 Atlantic halibut embryonic development
1.1.2.1 Morphology
First characterizations of wild caught embryos and larvae were made by Rollefsen in 1934
(Rollefsen, 1934). Atlantic halibut oocytes are pelagic with no oil globule present. The
unfertilized oocyte possesses a soft wrinkled chorion which hardens considerably during first
hours after fertilisation. Mean thickness of the chorion is 9.1 µm and small and regular pores
are evenly distributed in it. The chorion consists of 18 concentric lamellae (Lønning et al.,
1982). The oocyte diameter varies between 3.1- 3.5 mm (Blaxter et al., 1983 ; Haug &
Gulliksen, 1988). At 6 °C water temperature, the first germinal disc cleavage takes place after
6 h and subsequent divisions at intervals of ~ 3 h. Gastrulation starts after approximately 4
days at the same temperature (Rollefsen, 1934) (Figure 1.2). First somites are formed between
half and complete epiboly and at blastopore closure 8-11 somites are visible (Galloway et al.,
2006). The blastopore has a characteristic oblong shape and during the later part of
organogenesis the developing embryo is characteristically bent (Lønning et al., 1982 ; Blaxter
et al., 1983). Recruitment of new somites continues up to 52 somites at hatching (Andersen et
al., 2009). During hatching, the larvae emerge from the egg by dividing the chorion into two
well-defined parts (Helvik et al., 1991). At hatching, the larva is at a primitive ontogenetic
stage (Pittman et al., 1990b). Eyes are not pigmented and a foetal eye gap may still be visible.
The neural retina consists of a pseudo-stratified layer of undifferentiated neuroblastic cells
(Kvenseth et al., 1996). The gut is straight and without a lumen. The mouth is not open and
there is no stomodeum. The heart is a primitive tube and only the anterior part of the kidney is
present. The kidney consists of two parallel tubuli located dorsally between the intestine
anlagen and the notochord. No liver, thymus or spleen is developed (Patel et al., 2009b). At
hatching there is one pair of external branchial pits and no pectoral fins (Pittman et al.,
26
1990b). Atlantic halibut larval development has been categorized into different stages from
hatching to metamorphosis (Stage 1-4) (Pittman et al., 1990a) and through metamorphosis
(Stage 5-9) (Sæle et al., 2004).
1.1.2.2 Egg composition and embryonic metabolism
The proximate Atlantic halibut oocyte composition (% of dry mass) is 55 % yolk protein,
18 % free amino acid (FAA), 15 % lipids, 8 % ions, and 0.5 % glycogen (Finn & Fyhn,
2010). In Atlantic halibut embryos, the dominant portion of energy metabolism switches from
lipid/carbohydrate based to FAA as hatching approaches. Subsequently, metabolism switches
to yolk protein-bound amino acids (AA), before larvae start exogenous feeding (Finn et al.,
1991 ; Finn et al., 1995 ; Zhu et al., 2003).
Oocyte lipid profiles have been studied in egg from wild caught females (Falk-Petersen et al.,
1986), between first-time and repeated spawners (Daniel et al., 1993 ; Evans et al., 1996) and
through the natural spawning season (Parrish et al., 1993). Of total lipids, polar lipids (PL)
represent between 62-80 % and neutral lipids (NL) between 24-29 %. PLs are predominantly
phosohatidylcholine (44-62 %), phosphatidylethanolamine (7 %), and sphingomyelin (2 %)
while NLs are dominated by triacylglycerols (8-19 %) and cholesterol (7-10 %). The most
abundant FAs are palmitic acid (PA, 16:00), oleic acid (OA, 18:1n9), eicosapentaenoic acid
(EPA, 20:5n3), and docosahexaenoic acid (DHA, 20:5n3) (Falk-Petersen et al., 1986 ; Bruce
et al., 1993). Like in many other marine teleosts, it is assumed that Atlantic halibut has only a
reduced ability of converting short-chain polyunsaturated FAs (PUFAs) to long-chain PUFAs,
due to limited Δ5 and Δ
6 desaturase and elongase activity (Tocher, 2003). Hence, in addition
to linoleic acid (LA, 18:2n6) and linolenic acid (LNA, 18:3n3), the long-chain PUFAs
arachidonic acid (20:4n6, ARA), eicosapentaenoic acid (12.5 %, EPA, 20:5n3), and
docosahexaenoic acid (31.2 %, DHA, 22:6n3) are considered essential FAs (EFAs) for
27
Atlantic halibut. Concentrations of total lipid, triacylglycerols, and sterols were found to be
lower in first-time spawners and DHA and ARA significantly higher in repeated spawners
(Evans et al., 1996). Cholesterol concentration was found to be significantly higher in oocytes
that did not show any signs of successful fertilisation 12 h after fertilisation (Bruce et al.,
1993).
The oocyte FAA pool is derived from hydrolysis of yolk proteins during final oocyte
maturation and results in an osmotic water influx and rapid oocyte volume increase (Finn et
al., 1991 ; Finn et al., 2002 ; Zhu et al., 2003). Serine, alanine, leucine, and lysine have been
identified as the most abundant FAAs in Atlantic halibut oocytes and alanine, leucine,
glutamine, and lysine as being the most abundant yolk protein-bound AAs in hatched larvae
(3.9 dph, Finn et al., 1995 ; Evans et al., 1996 ; Finn et al., 2002). Evans et al. studied FAA
concentration in oocytes from first-time and repeated spawners but did not find any
significant differences (Evans et al., 1996).
Folate metabolism and its relation to fertilisation success has been studied by Mæland et al.
(Mæland et al., 2003). Their data suggests a need for folate for metabolic and growth
purposes during embryogenesis of approximately 2 µg g-1
embryonic weight gain.
1.1.2.3 Gene regulation of Atlantic halibut oogenesis and embryonic development
The pituitary gonadotropic hormones: follicle-stimulating hormone (FSH) and luteinizing
hormone (LH), play pivotal roles in vertebrate reproduction by regulating cell differentiation,
proliferation and steroidogenesis in gonadal tissues (Richards, 1994). They exert their
hormonal actions on the target cells by binding to the G protein-coupled receptors FSH-R and
LH-R. In Atlantic halibut females, a sequential gonadotropic activation of ovarian follicle
growth and maturation was found to be regulated by modulating the temporal expression of
28
fsh-r and lh-r in the follicle membrane. Transcripts of LH-β-subunit (lhβ) were found to be
expressed in ovulated oocytes (Kobayashi & Takeda, 2008).
Studies of gene regulation in Atlantic halibut embryonic development have focused on muscle
development focusing on myogenic regulating factors (MRFs): Myoblast determination factor
1 and 2 (myod1 and myod2) and myogenin (myog), and genes coding the structural muscle
proteins: Myosin light chain 2 (mylc2) and myosin heavy chain (myhc). Myod1, myod2 and
myhc follows the cranial-to-caudal somite formation in Atlantic halibut embryos (Galloway et
al., 2006). Myod1a, and the alternatively spliced myod1b, transcripts are expressed in 4-8 cell
stage embryos. Myod2 is not expressed prior to gastrulation. First somites are formed between
half and complete epiboly and myod1a, myod1b and myod2 transcript expression increases
together with an abrupt myog expression increase at the 20-somite stage. A second peak in
myod1 expression around the 40-somite stage coincides with the myog expression peak. At
this time, myog expression is required for myoblast differentiation to myotubes and
subsequently to mature muscle cells (Rescan, 2001). Gene expression of the MRFs decreases
from about the 45-somite stage and corresponds to the time of first movement and the
activation of myhc expression followed by the synthesis of contractile myofilaments before
final somite formation (Andersen et al., 2009).
29
Figure 2.2 Atlantic halibut embryonic development.
A: 2 cells (2C), 6 hours past fertilisation (hpf), B: 8 cell (8C), 8 hpf; C: 128-cells,
26.5 hpf; D: Germ-ring (GR), 82 hpf; E: 25 % Epiboly (25EP), 96 hpf; F: 50 %
Epiboly (50EP), 117 hpf; G: 75 % Epiboly, 125 hpf; H: 100 % Epiboly, 142 hpf; I: 20
somites, 194 hpf; J: 30 somites, 250 hpf, K: 40 somites, 315 hpf; L: Hatching,
340 hpf. A – D and I -K: Dorsal view, E – H and L: Ventral view. Development at
6.2 -6.4 ºC. Scale bare 1cm. Photographs were taken under a Stemi SV 11 stereoscope
(Carl Zeiss Vision, City, Norway) with an AxioCam HRc camera (Carl Zeiss Vision,
City, Norway). Stages based on Rollefsen (1934).
30
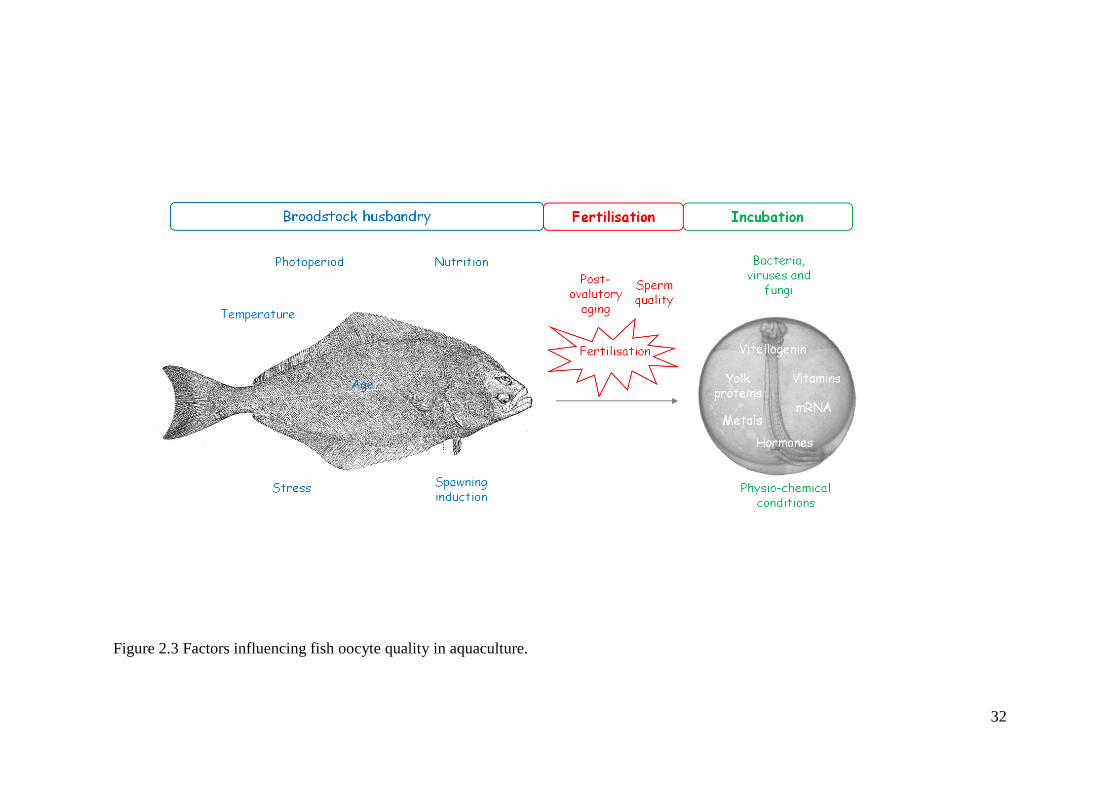
1.2 Oocyte quality in teleosts
Oocytes are the female haploid reproductive cells prior to fertilisation by spermatozoa.
Fertilisation results in a diploid zygote developing into a multi-cellular embryo. Good-quality
teleost oocytes can be defined as those developing into embryos exhibiting low mortalities at
fertilisation and hatching, and normal developing larvae with high survival. Teleost oocyte
quality can be affected by a variety of factors (Kjorsvik et al., 1990 ; Brooks et al., 1997 ;
Bobe & Labbe, 2009). Factors such as broodstock nutrition, endocrine control, and stress
through handling affect oocyte quality indirectly. After ovulation and/or stripping, oocyte
quality is not longer under parental influence but under the control of extrinsic factors (e.g
water quality) and intrinsic factors of the oocyte itself (e.g yolk constituents, hormones,
mRNAs, Figure 1.3).
1.2.1 Broodstock husbandry
The effect of broodstock nutrition on oocyte quality is one of the most studied reproductive
factors in aquaculture today (Izquierdo et al., 2001). In many teleosts a positive relation
between female size and fecundity, oocyte size, and offspring size has been found (Kamler,
2008). Studies on the specific effects of broodstock nutrition on oocyte quality are limited and
sometimes contradicting (Bobe & Labbe, 2009). In Atlantic halibut, only Mazorra et al.
(2003) have performed a broodstock nutrition experiment testing the influence of arachidonic
acid (ARA) in broodstock diet on oocyte quality (Mazorra et al., 2003). High ARA (1.8 %)
levels resulted in significantly higher fertilisation rates, blastomere morphology scores and
embryonic hatching rates compared to low ARA levels (0.4 %) (Mazorra et al., 2003).
Broodstock holding temperatures can affect gamete quantity and quality (Devauchelle et al.,
1988 ; Tveiten & Johnsen, 1999 ; Anguis & Cañavate, 2005). In Atlantic halibut, high
holding temperature during vitellogenesis can cause a delay in spawning and reduction of
31
oocyte quality (Brown et al., 2006). Endocrine regulation and photoperiod treatment are used
to ensure constant gamete production outside the natural spawning period (Migaud et al.,
2010)). Gonadotrophin-releasing hormone agonist (GnRHa) implants have been shown to
stimulate spermiation but did not affect fertilisation rates in Atlantic halibut males
(Vermeirssen et al., 2004). Photoperiod treatment of Atlantic halibut broodstock is
successfully used to ensure constant gamete production, but does decrease gamete quality
compared to natural spawning (Næss et al., 1996 ; Björnsson et al., 1998 ; Babiak et al.,
2006). Hand-stripping is commonly used for species that do not release their ovulated oocytes
spontaneously when reared in captivity and can be stressful for broodstock fish, resulting in
low oocyte quality (Brooks et al., 1997). Hand-stripping also increases the risk for over-
ripening, also called post-ovulatory aging (POA), in teleost species where ovulation rhythms
are difficult to estimate. POA reduces the fertilisation ability of oocytes and their subsequent
development into normal embryos (McEvoy, 1984 ; Kjorsvik et al., 1990 ; Bromage et al.,
1994 ; Lahnsteiner, 2000).
32
Figure 2.3 Factors influencing fish oocyte quality in aquaculture.
33
1.2.2 Oocyte fertilisation and incubation
Successful fertilisation requires both oocytes and spermatozoans of high quality. In
Atlantic halibut, spermatozoa concentration increases in a linear-like mode from the
beginning of the spawning season in February towards the end of the spawning season
in May. The concentration increase correlates with a decrease in spermatozoa motility
and fertilisation ability. Because of the increasing spermatozoa quality reduction, an
asynchrony can occur between spermatozoa and oocyte production towards the end of
the reproductive season when high quality oocytes are still produced by females
(Babiak et al., 2006). To overcome this problem, Atlantic halibut spermatozoa have also
been cryopreserved successfully and larval survival did not differ significantly between
larvae produced with cryopreserved spermatozoa and freshly collected spermatozoa
(Babiak et al., 2008).
Husbandry practices need to provide a healthy environment during egg incubation.
Water quality control is important to control potential pathogens (viruses, bacteria and
fungi) that adhend and colonize teleost eggs within hours after fertilisation (Brock &
Bullis, 2001). Water flow-rates, temperature, salinity, and pH have to be species-
specific optimised and standardised protocols have been established for Atlantic halibut
(Mangor-Jensen et al., 1998 ; Olsen et al., 1999).
1.2.3 Markers for oocyte quality
Estimation of oocyte quality before or just after fertilisation is important to avoid costly
and unnecessary incubation of low quality oocytes. Accurate methods to identifying
poor quality oocytes are therefore of high importance to hatcheries. In salmonids, lipid
droplet distribution has been tested as a marker for oocyte quality but has resulted in
34
inconsistent results (Mansour et al., 2007 ; Ciereszko et al., 2009). Low pH values of
ovarian fluid have been associated with reduced oocyte quality due to POA in turbot
(Fauvel et al., 1993). The symmetry of the first visible cells after fertilisation has been
considered as a useful predictive tool for oocyte quality assessment in commercially
farmed marine teleosts (Kjorsvik et al., 1990 ; Brooks et al., 1997). After fertilisation,
a series of mitotic cell divisions takes place that divides the cytoplasm into numerous
cells called blastomers. In teleosts, the large oocyte yolk volume restricts cleavage to a
small area of cytoplasm at the animal pole, so-called discoidal meroblastic cleavage.
Many marine teleosts, including Atlantic halibut, produce non-pigmented eggs where
blastomers are easily visible. Therefore it has been possible to routinely use early
blastomere symmetry at the 8-16 cell stage for oocyte quality assessment during
Atlantic halibut farming (Shields et al., 1997). During studies in zebrafish (Danio
rerio), turbot (Scophthalmus maximus), haddock, and Atlantic halibut a positive
correlation between early blastomere symmetry and high oocyte quality characteristics
like high embryonic hatching and larval survival rates were found (Strehlow et al., 1994
; Shields et al., 1997 ; Kjorsvik et al., 2003 ; Rideout et al., 2004). Studies on
yellowtail flounder (Limanda ferruginea) and Atlantic cod support these findings but
state that blastomere symmetry corrections may occur during later divisions (Vallin &
Nissling, 1998 ; Avery & Brown, 2005 ; Avery et al., 2009). All of these studies
exclusively look at the correlation between blastomere symmetry and oocyte quality
without explaining the underlying reasons which may be related to biochemistry and/or
genetics (Kjorsvik et al., 1990 ; Brooks et al., 1997).
35
1.3 Gene regulation of embryonic development
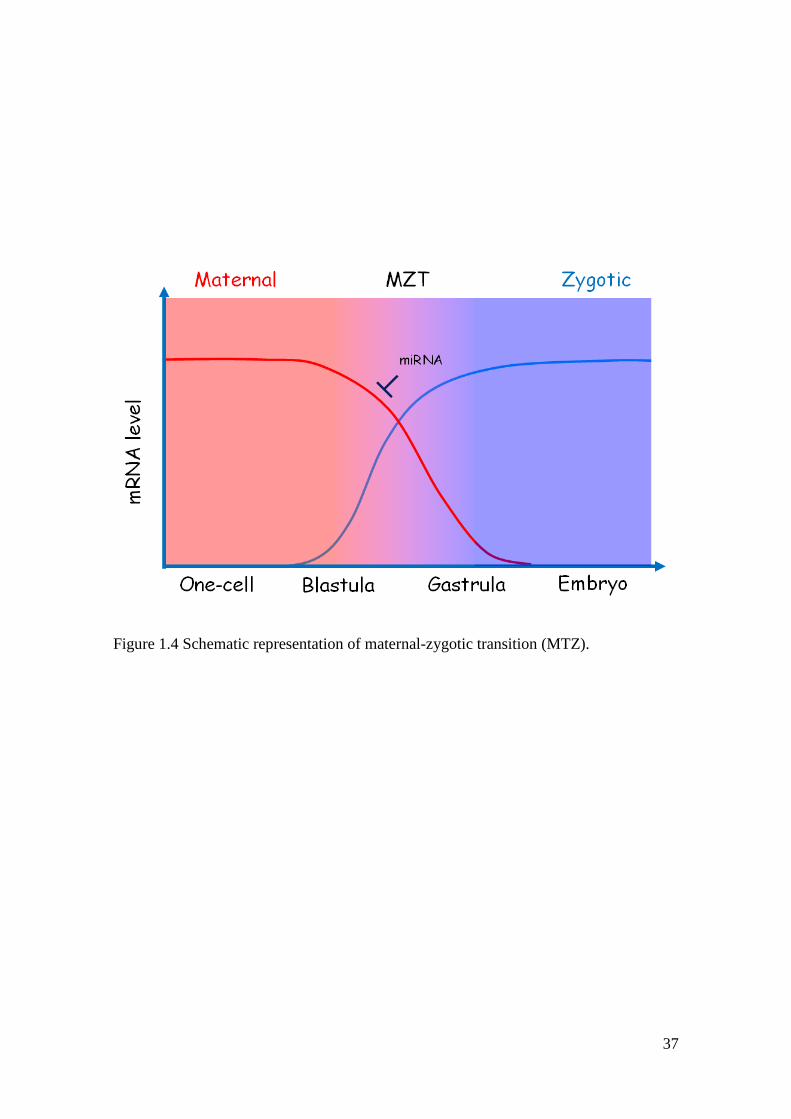
1.3.1 Maternal mRNAs
Maternally synthesized mRNAs and proteins control virtually all aspects of early
embryonic development. Loaded into oocytes during oogenesis they implement basic
biosynthetic processes, direct first mitotic divisions and specify initial cell fate and
patterning (Dworkin & Dworkin-Rastl, 1990). When the zygotic genome becomes
activated, the embryo begins to utilize products derived from its own genome. This
change from maternal to zygotic transcription is called maternal-zygotic transition
(MZT, Figure 1.4).
The genes necessary to generate maternally synthesized mRNAs and proteins are so-
called maternal genes. They have been classified as strictly maternal or maternal-
zygotic genes (Pelegri, 2003). Strictly maternal genes are expressed only during
oogenesis and early embryonic development before the MZT. Maternal-zygotic genes
are expressed both before and after the MZT. Disruption of strictly maternal gene
expression, for example due to mutations, can be fatal for embryonic development.
Maternal genes have been extensively studied using classical genetics in invertebrate
model organisms like the common fruit fly (Drosophila melanogaster), nematodes
(Caenorhabditis elegans), and in vertebrate species such as African clawed frog
(Xenopus laevis), zebrafish, and mouse (Mus musculus) (Kemphues et al., 1988 ;
St.Johnston & Nüsslein-Volhard, 1992 ; Dosch & Niehrs, 2000 ; Roy & Matzuk,
2006). A precise temporal and spatial control of maternal gene expression is important
during early embryonic development. Translation of mRNAs during early development
can be potentially controlled by polyadenylation dependent activation, localization

36
dependent activation and by regulated repression (Seydoux, 1996). During
polyadenylation dependent activation the dormant form of maternal mRNAs with short
poly (A) tails (20-40 adenosines) are elongated to several hundreds of adenosines (Hake
& Richter, 1997).
37
Figure 1.4 Schematic representation of maternal-zygotic transition (MTZ).
38
This poly (A) lengthening can stabilize and activate mRNAs for translation where as
poly (A) removal can trigger degradation and translation repression.
In zebrafish, early detectable effects of maternal genes have been found during
oogenesis, egg activation, fertilisation, and cytokinesis (Dosch et al., 2004). During later
embryonic development they have been found to affect cell fate determination,
morphogenesis, and cell viability (Pelegri, 2003). For example, in teleosts, the
establishment of the animal-vegetal polarity is made through the formation of the
Balbani body at the vegetal pole in stage I oocytes (Abrams & Mullins, 2009). In
absences of strictly maternal bucky ball transcripts (Buc) the Balbani body is not form
(Marlow & Mullins, 2008 ; Abrams & Mullins, 2009). Buc is also involved in the
positioning of several mRNAs that control primordial germ cell differentiation and
other mRNAs (Howley & Ho, 2000 ; Abrams & Mullins, 2009). Mutation of the
strictly maternal genes cellular island (Cei) and cellular atoll (Cea) affects early
cleavage division in zebrafish (Yabe et al., 2007 ; Yabe et al., 2009). Deficiencies of
maternal-zygotic genes such as blistered (Bsd) and pollywog (Pwg) can lead to the
disruption of the organization of the body plan during embryogenesis (Wagner et al.,
2004).
As the embryo continues to develop, the zygotic genome is activated during the MZT.
Some major features characterize the MZT, including loss or decay of mRNA
molecules of maternal origin, activation of transcription of the zygotic genome,
developmental arrest in the presence of transcriptional inhibitors, and marked
qualitative changes in protein synthetic (Telford et al., 1990). The MZT has been most
extensively studied in model species such as California purple sea urchin
(Strongylocentrotus purpuratus), C. elegans, D. melanogaster, X. leavis, zebrafish, and
39
mouse. Throughout these different groups of metazoans, the MZT takes place at
different developmental stages (Tadros & Lipshitz, 2009). Experiments conducted with
transcription inhibitors in the two cyprinids, zebrafish and carp (Cyprinus carpio), and
in salmonid rainbow trout (Oncorhynchus mykiss) implied a species-specific timing of
activation of transcription of zygotic mRNA. In cyprinids it takes place during the
blastula stage and in rainbow trout later, at the start of epiboly (Baumann & Sander,
1984 ; Stroband et al., 1992 ; Nagler, 2000 ; O'Boyle et al., 2007). The MZT consists
of two steps. First, a subset of maternal mRNAs is degraded, followed by the start of
zygotic transcription. However, pre-MZT accumulation of some zygotic transcripts has
been found in zebrafish (Mathavan et al., 2005). The degradation of maternal mRNAs is
regulated by both maternally encoded proteins and zygotically encoded proteins, and
microRNAs (miRNAs). With the start of zygotic transcription, zygotically encoded
proteins and miRNAs provide a positive feedback which enhances the efficiency of
maternal mRNA degradation. miRNAs are short non-coding RNAs (20-22 bp) that
negatively control the target mRNAs by binding to the 3´untranslated region (UTR). In
zebrafish, the predominantly expressed miR430 family facilitates deadenylation and
clearance of maternal mRNAs (Figure 1.4; Giraldez et al., 2006).
40
1.4 Teleosts genomic resources
1.4.1 Introduction to teleosts genomes
Teleosts are the largest group of vertebrates and comprise ~23,600 species. Teleost
genomes vary widely in size, from 0.39 pg to > 5 pg of DNA per haploid cell, with a
modal value of ~ 1 pg (equivalent to ~ 1000 Mb) (Smith & Gregory, 2009). Most of the
large genomes (> 2 pg) are polyploid. Among the vertebrates, polyploidization is
common only in fishes, amphibians, and reptiles. In teleosts, polyploidization has
occurred independently in cyprinids (carps), cyprinodontiformes (live bearers),
catostomids (suckers), and salmonids (Taylor et al., 2001). Teleost genomes seem to be
more 'plastic' in comparison with other vertebrate genomes because genetic changes,
such as polyploidization, gene duplication, gain of spliceosomal introns and speciation,
are more frequent in fishes (Venkatesh, 2003). The study of the teleost genomes has
been closely connected to the sequencing of the human genome and the need to identify
the sequences structure and function. The work on teleost genomes was intensified with
the start of the Human Genome Project in 1990 when the main species studied for
genome information at that time where invertebrates like C. elegans and
D. melanogaster. Compared to these invertebrates, teleosts share many similarities in
developmental pathways, organ systems, and physiological mechanisms with humans
(Clark, 2003). The two main teleosts investigated during the early 1990s were the
zebrafish, the marine Tiger puffer (Takifugu rubripes), and its freshwater relative, the
Green spotted puffer (Tetradon nigrovirdis). The zebrafish is a popular tropical
aquarium fish with short generation time (about three month), large egg batches all year
round, easy maintenance, and external development of a transparent embryo. Large-
41
scale mutagenesis screens in zebrafish filled a gaping hole in vertebrate developmental
biology (Haffter et al., 1996 ; Stainier et al., 1996). Until then, the ability to study genes
via their mutant phenotypes on large scales had only been possible in D. melanogaster
and C. elegans. T. nigrovirdis has the smallest known vertebrate genome with 350 Mb,
closely followed by T. rubripes with 380 Mb. Their small genome size, approximately
eight times smaller than the human or mouse genome made them useful model
vertebrate genomes (Brenner et al., 1993 ; Crnogorac-Jurcevic et al., 1997).
Today there are 34 entries for teleosts in the Genome Project database of the National
Center for Biotechnology Information (NCBI: http://www.ncbi.nlm.nhi.gov). With the
increase in worldwide aquaculture production genomic work on commercially farmed
teleosts has increased (Canario et al., 2008). While the genomes of model teleosts have
been sequenced totally or to the draft level, the genetic data available on commercial
interesting teleosts consists mainly of expressed sequence tags (ESTs; Table 1.1). ESTs
are short, single pass cDNA sequences generated from randomly selected library clones
and are a quick and easy way to generate data from any species (Clark, 2003). ESTs
also provide the raw data for probe design of oligonucleotide microarrays. Zebrafish is
the seventh species with the highest number of entries in the dbEST database (1.5 M,
release 100209) after human (8.3 M), mouse (4.8 M), maize (2.0 M), cattle (1.6 M), pig
(1.5 M) and thale cress (1.5 M) (http://www.ncbi.nlm.nih.gov/dbEST). For the twenty
most valuable farmed teleosts, genomic information is manly available for
salmoniformes and perciformes (Table 1.2.).
There are 22,864 Atlantic halibut ESTs currently available at the EST database dbEST
(Table 1.2). The first Atlantic halibut EST libraries resulting in 1,072 ESTs were
constructed from liver, kidney, and spleen to investigate the immune response of
42
vaccination against Vibrio anguillarum and Aeromonas salmonicida (Park et al., 2005).
In addition, six EST libraries (51,117 ESTs) were constructed from liver, kidney,
spleen, peripheral blood, and thymus from Atlantic halibut injected with nodavirus,
infectious pancreatic necrosis virus (PINV), or vibriosis vaccine at various time points
(Patel et al., 2009a). The highest number of Atlantic halibut ESTs (12,675 ESTs) were
created during the Pleurogene project, a Canadian and Spanish collaboration, focusing
on the genomics of two flatfishes, Atlantic halibut and Senegal sole (Solea
senegalensis) (http://pleurogene.ca/index.php). Libraries were constructed from five
different larval stages (hatched, mouth-opening, midway to metamorphosis, and post-
metamorphosis) and eight different tissues (testis, ovary, liver, head kidney, spleen,
skin, gill, and intestine) (Douglas et al., 2007). Over 4,000 ESTs were obtained from
Atlantic halibut two cell stage embryos, 1 day-old yolk-sac larvae, and fast skeletal
muscle of juveniles (Bai et al., 2007).
43
Table 2.1 Overview of the 20 teleost species with most expressed sequence tags (ESTs).
ESTs are sorted by the number of ESTs available (N) and their relative percentage of
total number (% T; dbEST database: http://www.ncbi.nlm.nih.gov/projects/dbEST/,
release 100209, October 2, 2009). Species with fully sequenced genomes are written in
bold.
ESTs
Common name Latin name N % T
Zebrafish Danio rerio 1,481,930 32.2
Japanese medaka Orytrzias latipes 616,739 13.4
Atlantic salmon Salmo salar 494,152 10.7
Channel catfish Ictalurus punctatus 354,434 7.7
Rainbow trout Oncorhynchus mykiss 287,923 6.3
Three-spined stickleback Gasterosteus aculeatus 276,992 6.0
Fathead minnow Pimephales promelas 249,941 5.4
Atlantic cod Gadus morhua 206,507 4.5
Catfish Ictalurus furcatus 139,475 3.0
Nile tilapia Oreochromis niloticus 177,222 2.1
Common mummichog Fundulus heteroclitus 74,755 1.6
Gilthead seabream Sparus aurata 67,232 1.5
European seabass Dicentrarchus labrax 54,200 1.2
Rainbow smelt Osmerus mordax 36,028 0.8
Common carp Cyprinus carpio 32,046 0.7
Japanese pufferfish Takifugu rubripes 26,069 0.6
Inshore hagfish Eptatretus burgeri 23,884 0.5
European perch Perca flavescens 21,968 0.5
Atlantic halibut Hippoglossus hippoglossus 22,834 0.5
Roach Rutilus rutilus 18,470 0.4
Guppy Poecilia reticulata 16,215 0.4
44
Table 2.2 Overview of number of sequence tags (ESTs) available on dbEST database
for the twenty most valuable aquaculture teleost species.
Values are given in million $ and relative percentage of total value (%T). ESTs are
given in number of ESTs (N) and relative percentage of total number (%T, Food and
Agriculture Organization of the United Nations (FAO),
http://www.fao.org/fishery/statistics/en, release 100209, October 2, 2009).
Common name Latin name Value (M) Value %T N % T
Atlantic salmon Salmo salar 7.5 19.4 494,152 50.1
Silver carp Hypophthalmichthys molitrix 3.5 9.2 0 0.0
Grass carp Ctenopharyngodon idellus 3.5 9.0 640 0.1
Common carp Cyprinus carpio 3.1 7.9 32,046 3.3
Catla Catla catla 3.0 7.6 1 0.0
Nile tilapia Oreochromis niloticus 2.6 6.7 177,222 0.0
Rainbow trout Oncorhynchus mykiss 2.6 6.6 287,795 29.2
Bighead carp Hypophthalmichthys nobilis 2.1 5.5 0 0.0
Crucian carp Carassius carassius 1.6 4.1 0 0.0
Mandarin fish Siniperca chuatsi 1.5 3.9 32 0.0
Japanese amberjack Seriola quinqueradiata 1.3 3.4 1,381 0.1
Japanese eel Anguilla japonica 1.1 2.8 198 0.0
Milkfish Chanos chanos 0.8 2.0 0 0.0
Gilthead seabream Sparus aurata 0.7 1.8 67,232 6.8
Flathead grey mullet Mugil cephalus 0.6 1.7 5 0.0
Olive flounder Paralichthys olivaceus 0.5 1.4 9,983 1.0
Silver seabream Pagrus auratus 0.5 1.2 0 0.0
Coho salmon Oncorhynchus kisutch 0.5 1.2 2,325 0.2
European seabass Dicentrarchus labrax 0.4 1.1 54,200 5.5
Japanese seabass Lateolabrax japonicas 0.3 0.8 75 0.0
45
1.4.2 Applications for commercial farming
Teleosts represent a major worldwide source for food. Aquaculture, is the fastest
growing food-producing sector, accounts for nearly 50 % of the world's food fish
(FAO). Some of today’s challenges in aquaculture are to ensure a stable supply of fry
for on-growth in marine species, to reduce production time by increasing growth rates,
to overcome feed limitations by looking for alternative feed sources such as plants, to
avoid uncontrolled reproduction of farmed species with wild populations, and to
improve stress tolerance and disease resistance. Increasingly, genomic research and
biotechnology is used to deal with these challenges to improve aquaculture production
and to ensure a stable and increasing production.
A range of genetic tools have been applied to commercially farmed teleost. Selective
breeding programs where individual and family performance is assessed for a range of
commercial traits (e.g. growth, sexual maturation, body conformation, and disease
resistance) have lead to increased gains between generations in for example catfish,
common carp, rainbow trout, Atlantic cod, Atlantic salmon (Salmo salar), and Nile
tilapia (Oreochromis niloticus, Eknath et al., 2007 ; Weber & Silverstein, 2007 ;
Robinson & Hayes, 2008 ; Antonello et al., 2009 ; Wachirachaikarn et al., 2009 ;
Garber et al., 2010 ; Nielsen et al., 2010).
Chromosome set manipulations like triploidy leads to sterility and are used in the
production of larger rainbow trout, common carp, and channel catfish
(Ictalurus punctatus) (Dunham, 2004). Triploids can also be used to avoid interbreeding
between escaped farmed strains and wild populations (Cnaani & Levavi-Sivan, 2009).
Gynogenesis has been induced in some fish species to obtain mono-sex offspring
46
(Komen & Thorgaard, 2007). Techniques to produce all-male strains has been
established in common carp and Nile tilapia (Mair et al., 1997 ; Bongers et al., 1999 ;
Ezaz et al., 2004 ; Müller-Belecke & Hörstgen-Schwark, 2007) while all-females
strains are preferred in flatfishes, for example turbot and Atlantic halibut (Piferrer et al.,
2004 ; Cal et al., 2006 ; Tvedt et al., 2006).
Gene transfer technologies have mainly been used to improve growth performance.
Growth hormone transgenic lines have been developed for Atlantic salmon (Du et al.,
1992 ; Cook et al., 2000), rainbow trout (Devlin et al., 2001), Nile tilapia (Maclean et
al., 2002), channel catfish (Dunham et al., 1992), and common carp (Fu et al., 2007).
Transgenic lines with increased disease resistance and sterility are under development
(Dunham, 2009).
Teleost ESTs have been found to be a rich source of genetic markers called single
sequence repeats (SSR) loci, also called microsatellites (Coulibaly et al., 2005 ; Ju et
al., 2005). SSRs consist of a variable number of short sequence repeats (2-
6 nucleotides). In aquaculture, SSRs are efficiently used for individual identification,
paternity analysis, and relatedness estimation in the management of hatchery
bloodstocks (Chistiakov et al., 2006). In Atlantic halibut SSRs have been used for
population studies of wild and farmed fish, for ploidy determination studies during
gynogensis experiments and construction of a genetic linkage map (McGowan & Keith,
1999 ; Coughlan et al., 2000 ; Jackson et al., 2003 ; Reid et al., 2005 ; Ding et al.,
2009). Genetic linkage maps provide a likely position of its known genes and/or genetic
markers relative to each other in terms of relative distances (recombination frequency)
between them. Genetic linkage maps are prepared to scan for quantitative trait loci
(QTL). QTLs refer to phenotypes, such as growth or disease resistance, that are
47
inherited in various degrees and can be credited to the interactions between two or more
genes and their environment (Ohtsuka et al., 1999). In Atlantic salmon, a QTL has been
identified for infectious pancreatic necrosis (IPN) resistance and has been incorporated
into a commercial Atlantic salmon breeding program (Moen et al., 2009) After the
creation of a genetic linkage map in Atlantic halibut, the identification of markers for
several traits, including body weight, length, width, myotome height, pigmentation, and
eye migration, has been used in a Canadian breeding program (Reid et al., 2007)
(http://pleurogene.ca).
The availability of numerous ESTs and the corresponding cDNA libraries has enabled a
rapid production of microarrays in a number of commercial teleosts, but mainly
salmonids (Douglas, 2006 ; Canario et al., 2008). Microarray technology, through
simultaneous analysis of the expression of thousands of genes, allows the identification
of candidate genes involved in the function of multiple physiological, morphological,
and behavioural traits of interests. In salmonids, gene microarray studies have been used
to study important topics in aquaculture such as immune response, nutrition, growth,
smoltification, and reproduction (Jordal et al., 2005 ; Gahr et al., 2008 ; Leaver et al.,
2008 ; Von Schalburg et al., 2008 ; Bobe & Labbe, 2009 ; Seear et al., 2009). For
Atlantic halibut, a first generation oligonucleotide microarray (50-mer) comprising
9,277 genes has been designed during the Pleurogene project (http://pleurogene.ca)
(Douglas et al., 2008). This microarray has been used to study differential gene
expression between five larval stages, from hatching to post-metamorphosis, during a
weaning experiment of larvae to microencapsulated diet and to study the effect of
replacing fish meal with soybean meal in diets for juveniles (Aluru & Vijayan, 2009 ;
Murray et al., 2009 ; Murray et al., 2010).
48
1.4.3 Molecular markers for oocyte quality
Molecular markers can be defined as Type I or actual genes of known function and
Type 2 or anonymous DNA segments like microsatellites. While Type 2 markers have
been successfully applied to improve aquaculture production as described above, the use
of Type 1 markers is still rare. Potential molecular markers for oocyte quality have been
identified in rainbow trout. Oocytes with high maternal mRNA levels of prohibitin 2
(phb2) experienced low developmental potential, i.e percentage of normal alevins at
yolk-sac resorption (Bonnet et al., 2007). Salmonids can retain their ovulated oocytes in
the body cavity for several days. Depending on the female, this leads to a decrease in
oocyte quality due to over-ripening (post-ovulatory aging, POA) (Aegerter and Jalabert,
2004). A number of maternal mRNAs have been identified to be differentially
expressed in high and low quality rainbow trout oocytes, induced by POA (Aegerter et
al., 2005). In marine teleosts no potential molecular markers for oocyte quality have
been identified. Maternal transcripts in commercially farmed marine teleosts have not
been studied previously, even so high embryonic mortalities are often observed within
several days after fertilisation, around the MZT (Blaxter et al., 1983 ; Kimmel, 1989).
Reliable molecular quality markers could increase hatchery production efficiency and
provide a potential tool to improve broodstock husbandry.
49
1.5 Objectives of the present study
The overall objective of this study is to study the effect of maternal factors on Atlantic
halibut oocyte quality. The specific objectives are:
-To increase the genomic information in Atlantic halibut by creating a maternal EST
library and identifying strictly maternal genes by studying gene expression during
embryonic development.
-To select suitable Atlantic halibut reference genes for gene expression studies during
embryonic and larval development.
-To study the relation between maternal mRNA levels and Atlantic halibut oocyte
quality.
-To study the relation between oocyte fatty acid, amino acid, and folate concentrations
and Atlantic halibut oocyte quality.
-To create a new Atlantic halibut microarray to identify maternal genes and analyse
differential gene expression during embryonic development and between high and low
quality oocytes.
50
2 Construction of a maternal EST library by suppressive subtractive
hybridisation (SSH) in Atlantic halibut
2.1 Abstract
The commercial production of Atlantic halibut suffers from a major bottleneck during
juvenile production for on-growing. Early embryonic development is under the control
of maternally provided transcripts and proteins and has been studied in only few
commercially important teleosts. The present study aimed to create an Atlantic halibut
maternal expressed sequence tag (EST) library by suppressive subtractive hybridisation
(SSH) to increase the information of maternal genes during early Atlantic halibut
embryonic development. Gene expression of selected genes was screened during early
embryonic development to identify strictly maternal transcripts as potential molecular
markers for Atlantic halibut oocyte quality. A maternal EST library containing
2,341 high quality sequences was constructed. Putative genes consisted of 73.5 %
unknown genes. The expressions of twenty-one selected genes were measured by qPCR
from fertilisation to the 10-somite stage. Transcripts of three strictly maternal genes
were identified as they were only detectable before the start of gastrulation: askopos
(Kop), si:dkey-30j22.9 (Tudor family member), and tudor 5 protein (Tdrd5). They are
candidate genes to be tested for their potential as molecular markers for Atlantic halibut
oocyte quality.
51
2.2 Introduction
Genomic technologies are expected to improve aquaculture production and solve
present bottlenecks and problems. Studies so far have concentrated on the teleost
immune system, control of growth, and reproduction (De-Santis & Jerry, 2007 ; Cerdà
et al., 2008 ; Dios et al., 2008). One of the major bottlenecks in commercial farming of
marine teleosts is variable qualities and quantities during fry-production for on-growing.
Variable oocyte quality, high larval mortality, and body malformations during larval
development reduce production efficiency and keeps production costs high. Little
attention has been paid to the molecular and intracellular events that occur during
gametogenesis and early embryonic development in teleosts (Bobe & Labbe, 2009).
Early embryonic development is controlled by maternal factors, mRNAs and proteins,
produced during oogenesis by the female and stored in the mature oocyte. Loaded into
the oocyte during oogenesis, maternal mRNAs implement basic biosynthetic processes,
direct first mitotic divisions and specify initial cell fate and patterning (Dworkin &
Dworkin-Rastl, 1990). The teleost embryo starts to utilize products derived from its
own genome during the maternal-zygotic transition (MZT), when the zygotic genome
becomes activated. The MZT is a progressive process and some maternal-zygotic genes
are expressed both before and after the MZT (Mathavan et al. 2005). Maternal-zygotic
and finally zygotic gene expression regulates the later parts of axis formation and
organogenesis during fish embryonic development (Schier et al 2001).
Experiments conducted with transcription inhibitors in two cyprinids, zebrafish (Danio
rerio) and common carp (Cyprinus carpio), and in the salmonid rainbow trout
(Oncorhynchus mykiss) implied a species-specific timing of zygotic genome activation.
In the cyprinids, the MZT was found to take place during the blastula stage while in
52
rainbow trout the MZT took place later, at the start of epiboly (Baumann & Sander,
1984 ; Stroband et al., 1992 ; Nagler, 2000 ; O'Boyle et al., 2007). In Atlantic halibut
the exact timing of the MTZ has not been previously estimated. Genomic information
of maternal genes in commercially farmed teleosts has only been available for rainbow
trout (Aegerter et al., 2004 ; Aegerter et al., 2005 ; Bonnet et al., 2007) but has
recently been extended to Atlantic halibut (Bai et al., 2007).
Atlantic halibut is considered a valuable species for cold water marine fish farming, but
current production suffers from typical problems during fry production as described
above (Chapter 1.1.1) (Kjorsvik et al., 1990 ; Olsen et al., 1999 ; Hamre et al., 2007).
Genomic studies of early developmental stages of Atlantic halibut have concentrated on
embryonic muscle development and larval development and metamorphosis (Galloway
et al., 2006 ; Douglas et al., 2007). Recently, an unbiased 2-cell EST library has been
created providing first information about maternal transcripts in Atlantic halibut (Bai et
al., 2007)
The aim of this study was to increase the genomic information on maternal gene
expression in Atlantic halibut. A maternal EST library was created by suppressive
subtractive hybridisation (SSH) between 8-cell stage embryos (8C) and embryos at the
10-somite stage (10SS). Genes with known functions during embryonic development
and random genes were selected from the EST library. Their relative gene expression
was screened during early embryonic development to identify strictly maternal
transcripts.
53
2.3 Material and Methods
2.3.1 Fish husbandry and sample collection
From four females, high quality oocyte batches were collected at a commercial Atlantic
halibut farm (Risørfisk AS, Risør, Norway) in 2007. All oocytes were fertilised in vitro
with pooled sperm from two random males. The female broodstock consisted of fish
between 30-40 kg, fed EWOS Premix (EWOS, Bergen, Norway) and kept under natural
photoperiod conditions. Eggs were incubated in large scale in 280 l incubators at
salinity between 33-35 ‰ and temperature between 6.2 -6.4 ºC. Normally developing
embryos (n = 100) were collected at the following stages based on the embryonic
staging of Atlantic halibut after Rollefsen (1934, Figure 1.2): 8cell-stage (8C), 8 hours
post fertilisation (hpf); 16-cell stage (16CS), 12 hpf; blastula (BL), 45 hpf; germ ring
(GR), 82 hpf; 25 % epiboly (25EP) 96 hpf; 50 % epiboly (50EP), 117 hpf; and 10
somite stage (10SS), 142 hpf. Samples were wrapped in tinfoil and snap-frozen in liquid
nitrogen.
2.3.2 RNA extraction and cDNA synthesis
Total RNA for all samples were extracted according to the Tri reagent method
(Sigma, St-Louise, MO USA) using QIAazol (Qiagen, Nydalen, Sweden). Total RNA
was treated with the gDNA wipe-out buffer supplied with the QuantiTect reverse
transcription kit (Qiagen) to remove traces of genomic DNA contamination. RNA
concentration was quantified using the Nanodrop spectrophotometer
(Nanodrop Technologies/Saven Werner, Kristiansand, Norway).
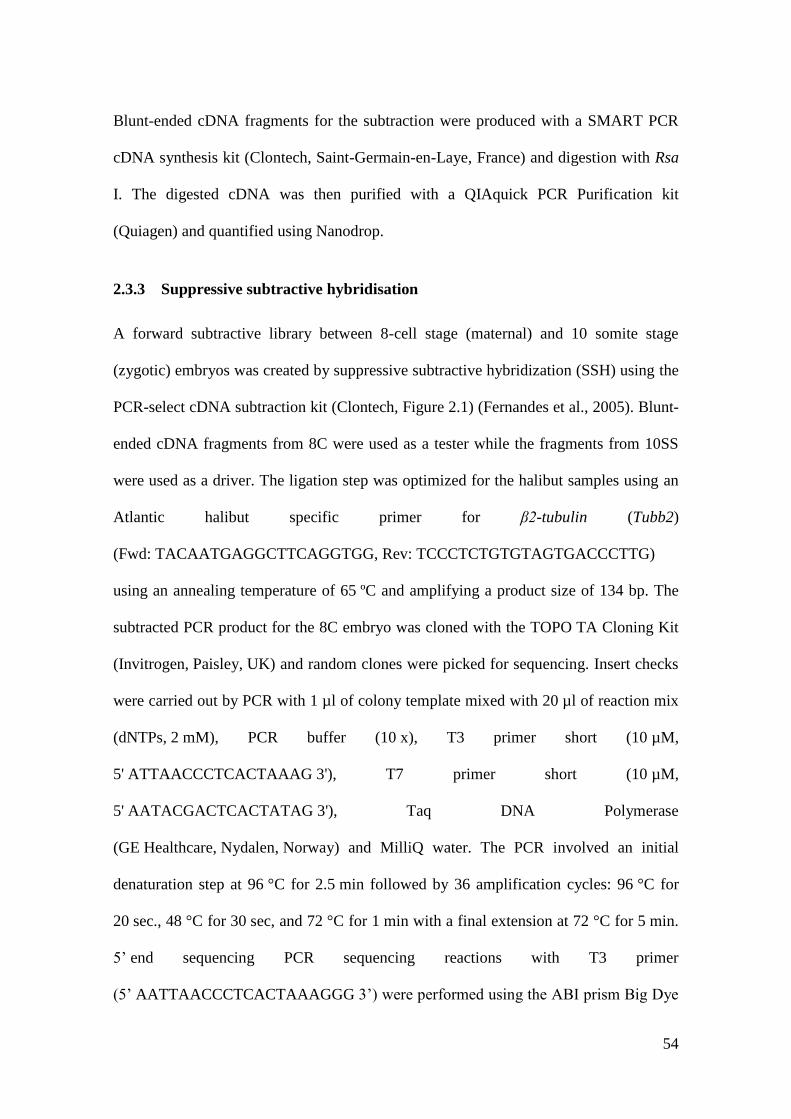
54
Blunt-ended cDNA fragments for the subtraction were produced with a SMART PCR
cDNA synthesis kit (Clontech, Saint-Germain-en-Laye, France) and digestion with Rsa
I. The digested cDNA was then purified with a QIAquick PCR Purification kit
(Quiagen) and quantified using Nanodrop.
2.3.3 Suppressive subtractive hybridisation
A forward subtractive library between 8-cell stage (maternal) and 10 somite stage
(zygotic) embryos was created by suppressive subtractive hybridization (SSH) using the
PCR-select cDNA subtraction kit (Clontech, Figure 2.1) (Fernandes et al., 2005). Blunt-
ended cDNA fragments from 8C were used as a tester while the fragments from 10SS
were used as a driver. The ligation step was optimized for the halibut samples using an
Atlantic halibut specific primer for β2-tubulin (Tubb2)
(Fwd: TACAATGAGGCTTCAGGTGG, Rev: TCCCTCTGTGTAGTGACCCTTG)
using an annealing temperature of 65 ºC and amplifying a product size of 134 bp. The
subtracted PCR product for the 8C embryo was cloned with the TOPO TA Cloning Kit
(Invitrogen, Paisley, UK) and random clones were picked for sequencing. Insert checks
were carried out by PCR with 1 µl of colony template mixed with 20 µl of reaction mix
(dNTPs, 2 mM), PCR buffer (10 x), T3 primer short (10 µM,
5' ATTAACCCTCACTAAAG 3'), T7 primer short (10 µM,
5' AATACGACTCACTATAG 3'), Taq DNA Polymerase
(GE Healthcare, Nydalen, Norway) and MilliQ water. The PCR involved an initial
denaturation step at 96 °C for 2.5 min followed by 36 amplification cycles: 96 °C for
20 sec., 48 °C for 30 sec, and 72 °C for 1 min with a final extension at 72 °C for 5 min.
5’ end sequencing PCR sequencing reactions with T3 primer
(5’ AATTAACCCTCACTAAAGGG 3’) were performed using the ABI prism Big Dye

55
Terminator Sequencing Kit (PE Applied Biosystems, USA) added BetterBase (1:5;
Web Scientific, Crewe, UK). The sequencing reaction comprised an initial denaturation
at 96 °C for 1 min and 25 cycles at 96 °C for 10 sec and 60 °C for 3 min and DNA was
send for sequencing at the Oxford University sequencing facility with an ABI 3700
capillary sequencer (PE Applied Biosystems, USA).
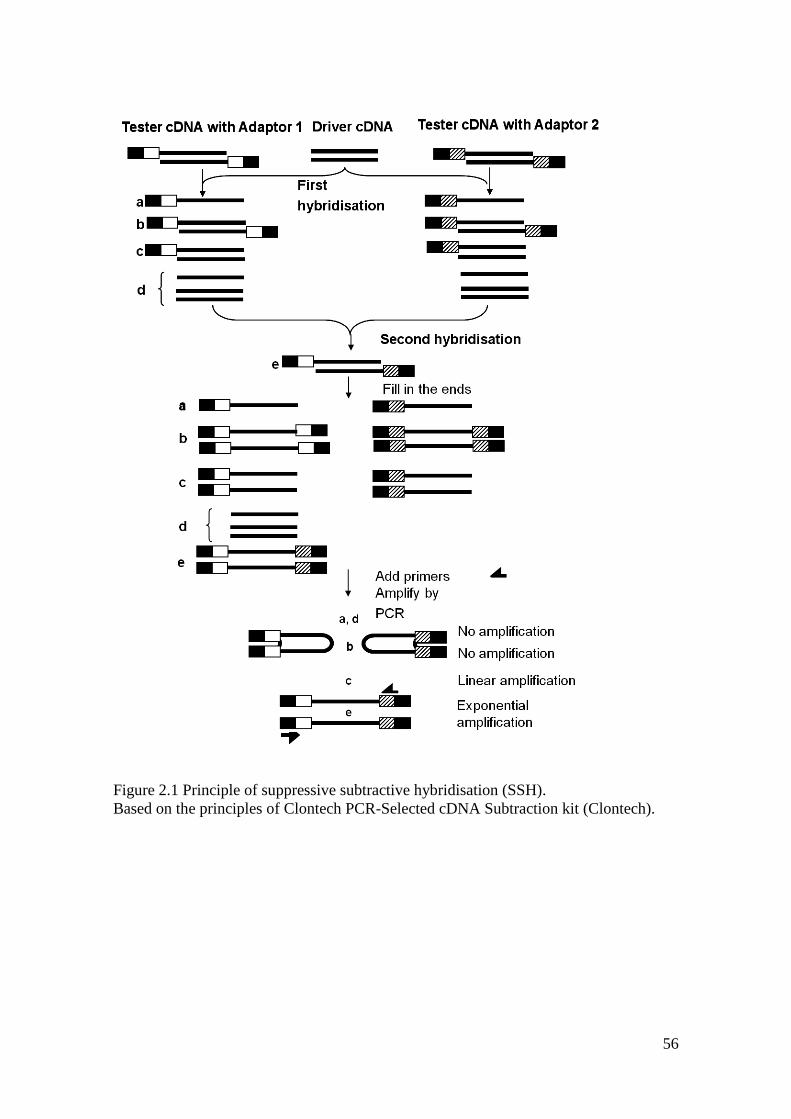
56
Figure 2.1 Principle of suppressive subtractive hybridisation (SSH).
Based on the principles of Clontech PCR-Selected cDNA Subtraction kit (Clontech).
57
2.3.4 Sequence processing and bioinformatics analysis
The raw sequence trace data were processed by the EST analysis pipeline developed by
the Natural Environment Research Council-Environmental Genomics Thematic
Programme Data Centre (NERC-EGTDC; University of Edinburgh, UK; Figure 2.2).
The electrophoregrams were first analyzed by trace2dbEST
(accessible through http://envgen.nox.ac.uk/est.html) which processes raw sequencing
chromatograph trace files from EST projects into quality-checked sequences. High
quality sequences required > 150 high quality bases, based on signal strength, peak
shape and peak local environment (Ewing et al., 1998). Sequences were submitted to
dbEST (http://www.ncbi/nlm/nih.gov/dbEST) jointly with their BLAST-based
preliminary annotation. PartiGene (Parkinson et al., 2004) was then used to cluster the
sequences and contig assembly. The non-redundant clusters were submitted to
BLASTX similarity searches against the non-redundant (nr) protein database at the
National Center for Biotechnology Information
(NCBI, http://blast.ncbi.nlm.nih.gov/Blast.cgi). The EST annotation tool Blast2GO
(Gotz et al., 2008) was employed for gene ontology (Gene Ontology, 2004), enzyme
code annotation and pathway mapping with the Kyoto Encyclopedia of Genes and
Genomes (KEGG; Kanehisa et al., 2008). Non-annotated cluster were translated using
EMBOSS Transeq (http://www.ebi.ac.uk/Tools/emboss/transeq/) and searched for
conserved domains (http://www.ncbi.nlm.nih.gov/Structure/cdd/cdd.shtml).
58
Figure 2.2 Overview of sequence processing and bioinformatics analysis.
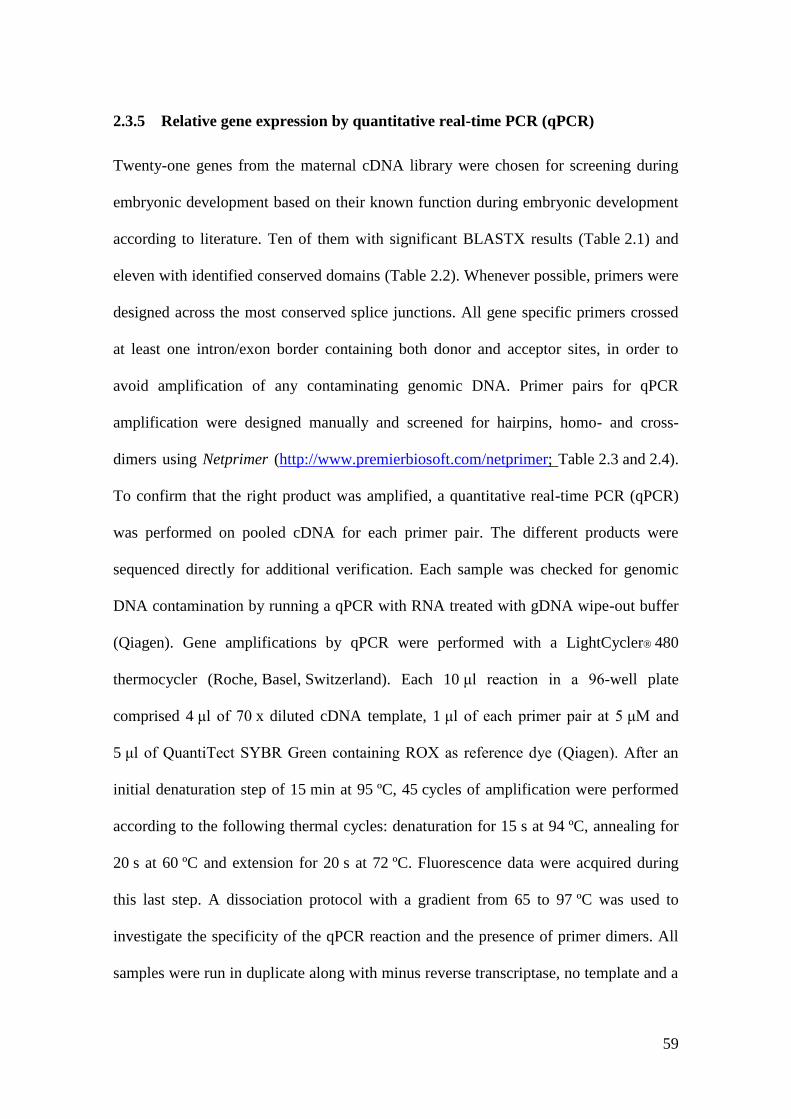
59
2.3.5 Relative gene expression by quantitative real-time PCR (qPCR)
Twenty-one genes from the maternal cDNA library were chosen for screening during
embryonic development based on their known function during embryonic development
according to literature. Ten of them with significant BLASTX results (Table 2.1) and
eleven with identified conserved domains (Table 2.2). Whenever possible, primers were
designed across the most conserved splice junctions. All gene specific primers crossed
at least one intron/exon border containing both donor and acceptor sites, in order to
avoid amplification of any contaminating genomic DNA. Primer pairs for qPCR
amplification were designed manually and screened for hairpins, homo- and cross-
dimers using Netprimer (http://www.premierbiosoft.com/netprimer; Table 2.3 and 2.4).
To confirm that the right product was amplified, a quantitative real-time PCR (qPCR)
was performed on pooled cDNA for each primer pair. The different products were
sequenced directly for additional verification. Each sample was checked for genomic
DNA contamination by running a qPCR with RNA treated with gDNA wipe-out buffer
(Qiagen). Gene amplifications by qPCR were performed with a LightCycler 480
thermocycler (Roche, Basel, Switzerland). Each 10 μl reaction in a 96-well plate
comprised 4 μl of 70 x diluted cDNA template, 1 μl of each primer pair at 5 μM and
5 μl of QuantiTect SYBR Green containing ROX as reference dye (Qiagen). After an
initial denaturation step of 15 min at 95 ºC, 45 cycles of amplification were performed
according to the following thermal cycles: denaturation for 15 s at 94 ºC, annealing for
20 s at 60 ºC and extension for 20 s at 72 ºC. Fluorescence data were acquired during
this last step. A dissociation protocol with a gradient from 65 to 97 ºC was used to
investigate the specificity of the qPCR reaction and the presence of primer dimers. All
samples were run in duplicate along with minus reverse transcriptase, no template and a
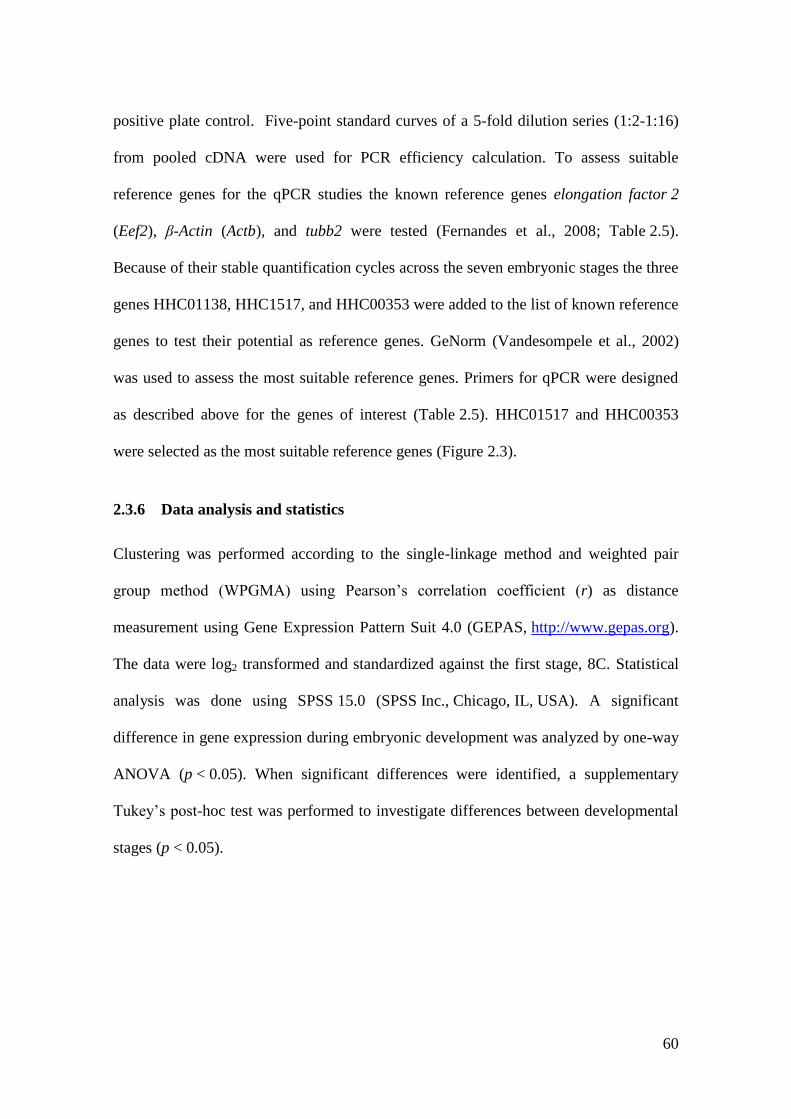
60
positive plate control. Five-point standard curves of a 5-fold dilution series (1:2-1:16)
from pooled cDNA were used for PCR efficiency calculation. To assess suitable
reference genes for the qPCR studies the known reference genes elongation factor 2
(Eef2), β-Actin (Actb), and tubb2 were tested (Fernandes et al., 2008; Table 2.5).
Because of their stable quantification cycles across the seven embryonic stages the three
genes HHC01138, HHC1517, and HHC00353 were added to the list of known reference
genes to test their potential as reference genes. GeNorm (Vandesompele et al., 2002)
was used to assess the most suitable reference genes. Primers for qPCR were designed
as described above for the genes of interest (Table 2.5). HHC01517 and HHC00353
were selected as the most suitable reference genes (Figure 2.3).
2.3.6 Data analysis and statistics
Clustering was performed according to the single-linkage method and weighted pair
group method (WPGMA) using Pearson’s correlation coefficient (r) as distance
measurement using Gene Expression Pattern Suit 4.0 (GEPAS, http://www.gepas.org).
The data were log2 transformed and standardized against the first stage, 8C. Statistical
analysis was done using SPSS 15.0 (SPSS Inc., Chicago, IL, USA). A significant
difference in gene expression during embryonic development was analyzed by one-way
ANOVA (p < 0.05). When significant differences were identified, a supplementary
Tukey’s post-hoc test was performed to investigate differences between developmental
stages (p < 0.05).
61
Table 2.1 List of selected genes, with significant BLASTX results, used for gene expression quantification of maternal library from
Atlantic halibut.
The name, symbol, BLASTX result with species, and E-value, GenBank accession number, and function of each gene are shown.
Gene name
(Gene symbol)
BLASTX results (Species) E-
value
Accession
number
Function
References
Askopos (Kop) Askopos (D. rerio) 6e-14 Q5YCX2 Primordial germ cells Blaser et al., 2005
Si:dkey-30j22.9 Si:dkey-30j22.9 (D. rerio) 6e-37 XM_688932.3 Uncharacterized Travis Thomson, 2004
Betaine aldehyde
dehydrogenase (Bah)
Betaine aldehyde dehydrogenase
(O.latipes)
2e-32 NM_001104848.1 Metabolism Wang et al., 2007
Checkpoint 1(Chk1) CHK1 checkpoint homolog
(X.tropicalis)
3e-17 CR848200.2 Mitosis Kappas et al., 2000
Prohibitin 2 (Phb2) Prohibitin-2 (S.salar) 5e-30 NM_001141404.1 Transcription regulation Bonnet et al., 2007
Syntaxin 4 (Stx4) Syntaxin 4 (L. japonicus) 1e-38 EF513752.1 Transport Wyman et al., 2003
18K hypothetical goldfish
protein (18k Gold)
Hypothetical 18K protein goldfish
mitochondrion (O. australis)
2e-17 JC1348 Uncharacterized Tingaud-Sequeira et al.,
2009
Ubiquitin carrier protein
(Hr6a)
Predicted similar to ubiquitin-
conjugating enzyme HR6A (O.
anatinus)
1e-31 XM_001511341.1 DNA damage Roest et al., 2004
Tudor 5 protein (Tdrd5) Tdrd5 protein (D. rerio) 1e-12 BC134985.1 Primordial germ cells and
abdominal segmentation
Boswell & Mahowald, 1985
; Travis Thomson, 2004
62
Table 2.2 List of selected genes, with conserved domain hits, used for gene expression quantification of maternal library from Atlantic
halibut.
The name, symbol, conserved domain search results, and E-value, and function of each gene are shown.
Gene name Conserved domain search results E-value Function References
HHC00057 Cullin 7e-04 Cell division Maniatis, 1999
HHC00068 Elongin subunit A 2e-10 Transcription regulation Gerber et al., 2004
HHC00130 Stathmin family 9e-16 Cytoskeleton Koppel et al., 1999
HHC00222 SET domain 1e-12 Methyltransferase Sun et al., 2008
HHC00255 Phosphoinositide-dependent kinase 1 5e-50 Cytokinesis Belham et al., 1999
HHC00309 JmjC domain 2e-28 Histone modification Takeuchi et al., 2006
HHC00334 CDC45-like protein 4e-60 DNA replication Yoshida et al., 2001
HHC01010 Dynamin family 1e-05 GTPases Seugnet et al., 1997
HHC01032 SET domain. 2e-21 Methyltransferase Sun et al., 2008
HHC01194 Geminin 2e-10 DNA replication Kroll, 2007
HHC01310 Tetratricopeptide repeat domain 2e-4 Protein binding Schlegel et al., 2007
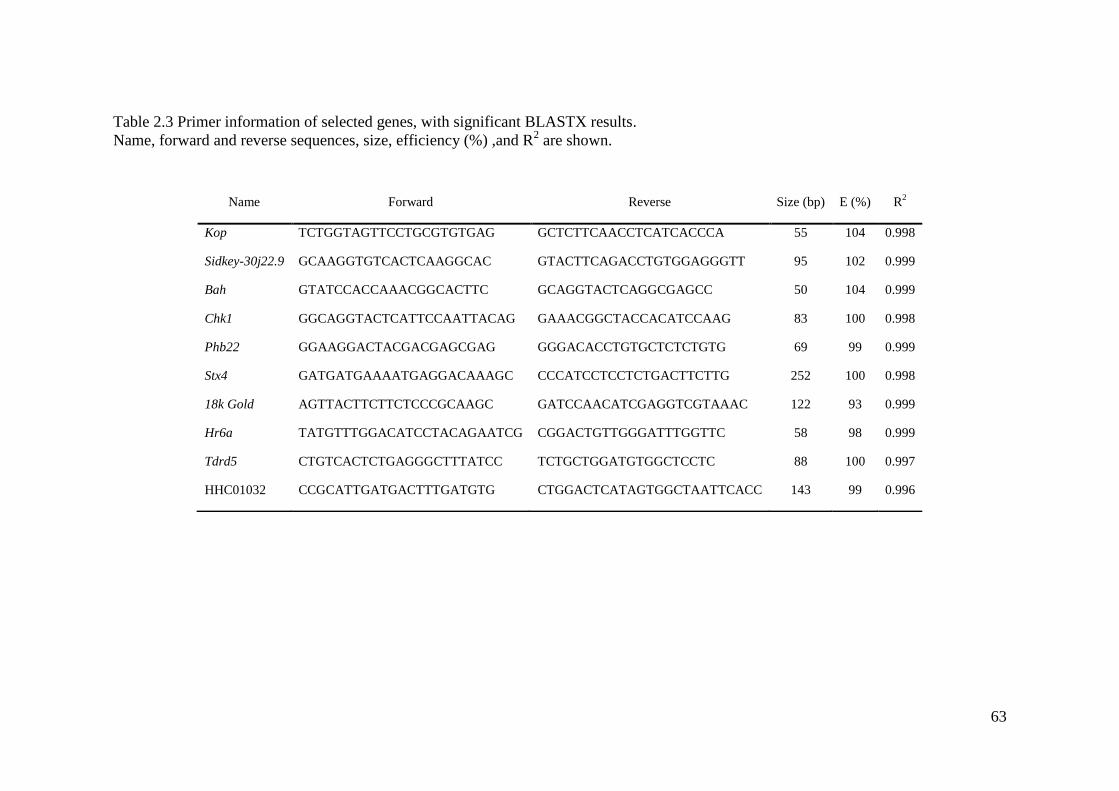
63
Table 2.3 Primer information of selected genes, with significant BLASTX results.
Name, forward and reverse sequences, size, efficiency (%) ,and R2 are shown.
Name Forward Reverse Size (bp) E (%) R2
Kop TCTGGTAGTTCCTGCGTGTGAG GCTCTTCAACCTCATCACCCA 55 104 0.998
Sidkey-30j22.9 GCAAGGTGTCACTCAAGGCAC GTACTTCAGACCTGTGGAGGGTT 95 102 0.999
Bah GTATCCACCAAACGGCACTTC GCAGGTACTCAGGCGAGCC 50 104 0.999
Chk1 GGCAGGTACTCATTCCAATTACAG GAAACGGCTACCACATCCAAG 83 100 0.998
Phb22 GGAAGGACTACGACGAGCGAG GGGACACCTGTGCTCTCTGTG 69 99 0.999
Stx4 GATGATGAAAATGAGGACAAAGC CCCATCCTCCTCTGACTTCTTG 252 100 0.998
18k Gold AGTTACTTCTTCTCCCGCAAGC GATCCAACATCGAGGTCGTAAAC 122 93 0.999
Hr6a TATGTTTGGACATCCTACAGAATCG CGGACTGTTGGGATTTGGTTC 58 98 0.999
Tdrd5 CTGTCACTCTGAGGGCTTTATCC TCTGCTGGATGTGGCTCCTC 88 100 0.997
HHC01032 CCGCATTGATGACTTTGATGTG CTGGACTCATAGTGGCTAATTCACC 143 99 0.996
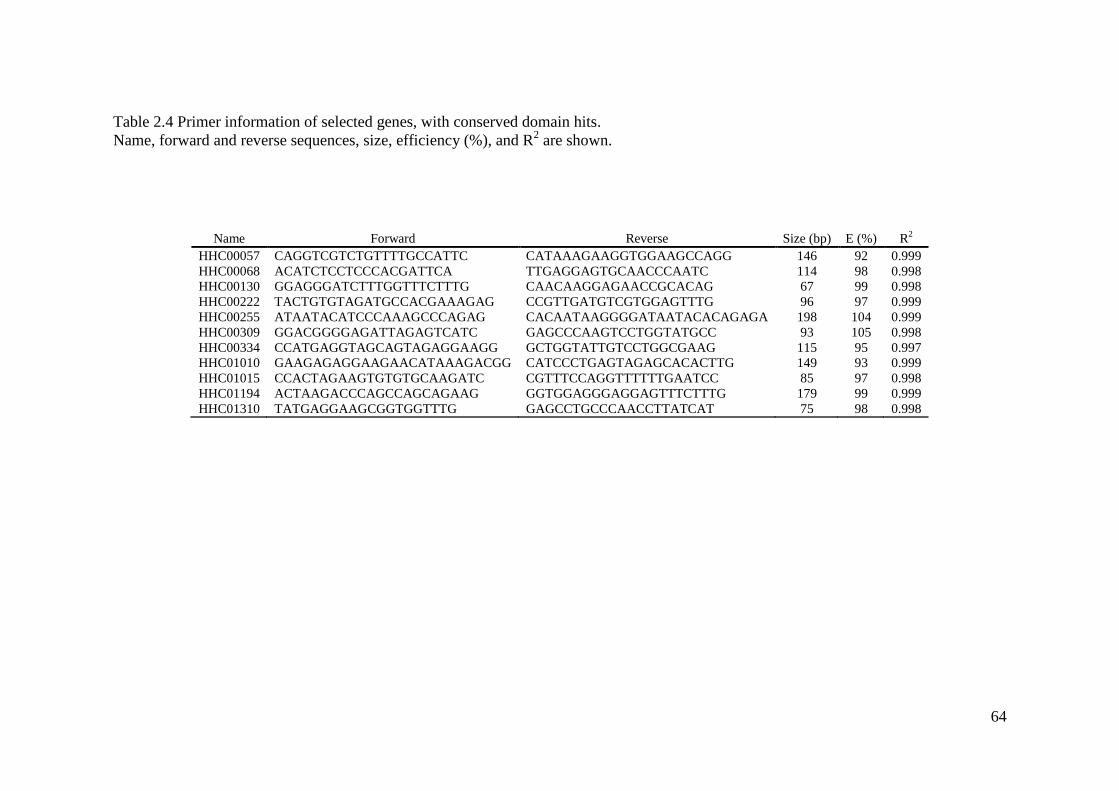
64
Table 2.4 Primer information of selected genes, with conserved domain hits.
Name, forward and reverse sequences, size, efficiency (%), and R2 are shown.
Name Forward Reverse Size (bp) E (%) R
2
HHC00057 CAGGTCGTCTGTTTTGCCATTC CATAAAGAAGGTGGAAGCCAGG 146 92 0.999
HHC00068 ACATCTCCTCCCACGATTCA TTGAGGAGTGCAACCCAATC 114 98 0.998
HHC00130 GGAGGGATCTTTGGTTTCTTTG CAACAAGGAGAACCGCACAG 67 99 0.998
HHC00222 TACTGTGTAGATGCCACGAAAGAG CCGTTGATGTCGTGGAGTTTG 96 97 0.999
HHC00255 ATAATACATCCCAAAGCCCAGAG CACAATAAGGGGATAATACACAGAGA 198 104 0.999
HHC00309 GGACGGGGAGATTAGAGTCATC GAGCCCAAGTCCTGGTATGCC 93 105 0.998
HHC00334 CCATGAGGTAGCAGTAGAGGAAGG GCTGGTATTGTCCTGGCGAAG 115 95 0.997
HHC01010 GAAGAGAGGAAGAACATAAAGACGG CATCCCTGAGTAGAGCACACTTG 149 93 0.999
HHC01015 CCACTAGAAGTGTGTGCAAGATC CGTTTCCAGGTTTTTTGAATCC 85 97 0.998
HHC01194 ACTAAGACCCAGCCAGCAGAAG GGTGGAGGGAGGAGTTTCTTTG 179 99 0.999
HHC01310 TATGAGGAAGCGGTGGTTTG GAGCCTGCCCAACCTTATCAT 75 98 0.998
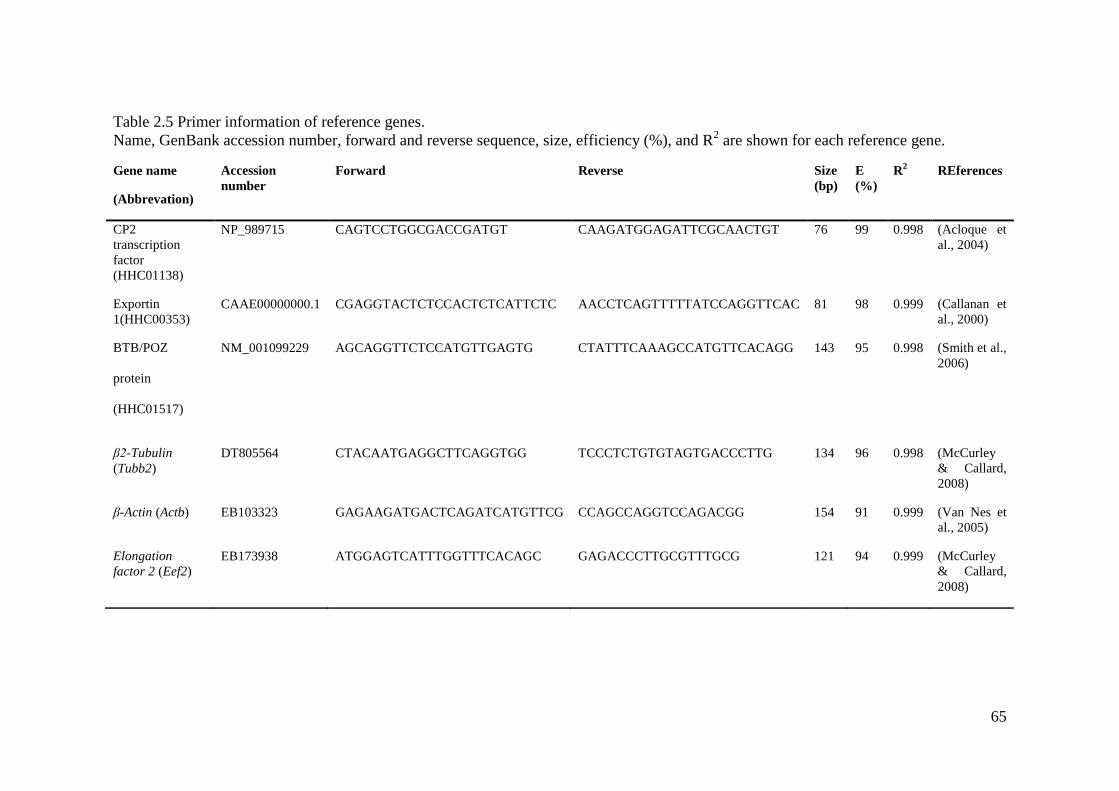
65
Table 2.5 Primer information of reference genes.
Name, GenBank accession number, forward and reverse sequence, size, efficiency (%), and R2 are shown for each reference gene.
Gene name
(Abbrevation)
Accession
number
Forward Reverse Size
(bp)
E
(%)
R2 REferences
CP2
transcription
factor
(HHC01138)
NP_989715 CAGTCCTGGCGACCGATGT CAAGATGGAGATTCGCAACTGT 76 99 0.998 (Acloque et
al., 2004)
Exportin
1(HHC00353)
CAAE00000000.1 CGAGGTACTCTCCACTCTCATTCTC AACCTCAGTTTTTATCCAGGTTCAC 81 98 0.999 (Callanan et
al., 2000)
BTB/POZ
protein
(HHC01517)
NM_001099229 AGCAGGTTCTCCATGTTGAGTG CTATTTCAAAGCCATGTTCACAGG 143 95 0.998 (Smith et al.,
2006)
β2-Tubulin
(Tubb2)
DT805564 CTACAATGAGGCTTCAGGTGG TCCCTCTGTGTAGTGACCCTTG 134 96 0.998 (McCurley
& Callard,
2008)
β-Actin (Actb) EB103323 GAGAAGATGACTCAGATCATGTTCG CCAGCCAGGTCCAGACGG 154 91 0.999 (Van Nes et
al., 2005)
Elongation
factor 2 (Eef2)
EB173938 ATGGAGTCATTTGGTTTCACAGC GAGACCCTTGCGTTTGCG 121 94 0.999 (McCurley
& Callard,
2008)
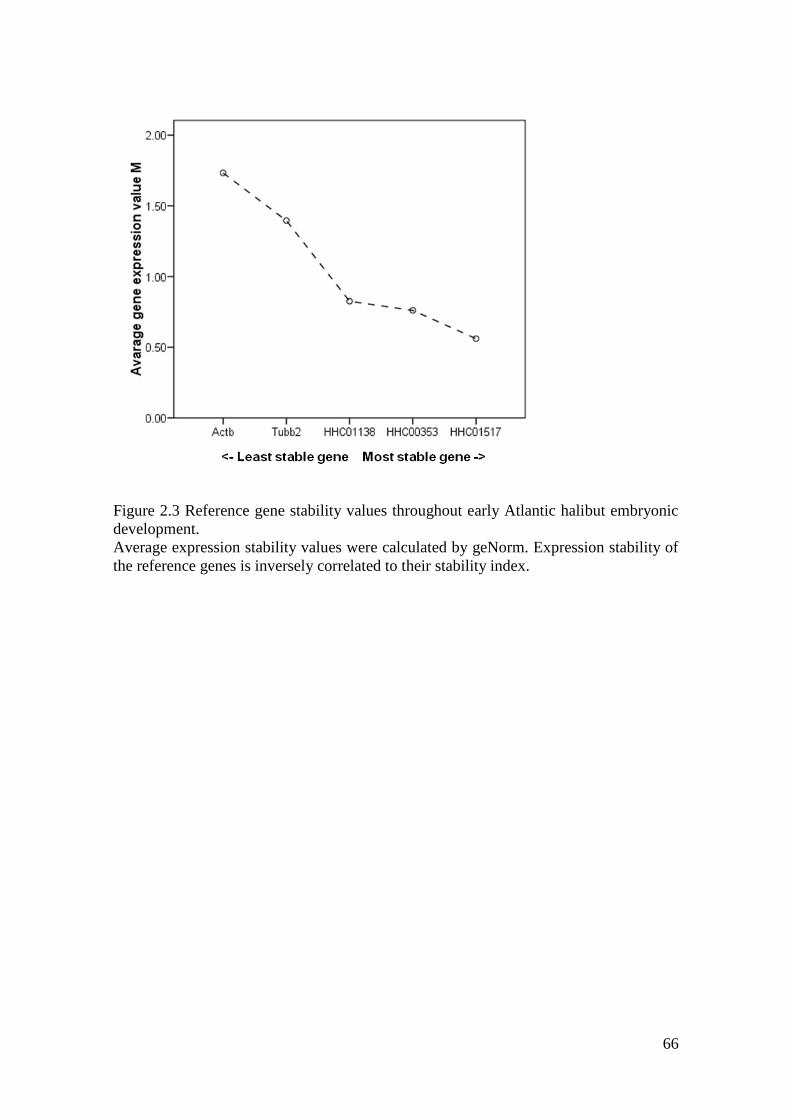
66
Figure 2.3 Reference gene stability values throughout early Atlantic halibut embryonic
development.
Average expression stability values were calculated by geNorm. Expression stability of
the reference genes is inversely correlated to their stability index.
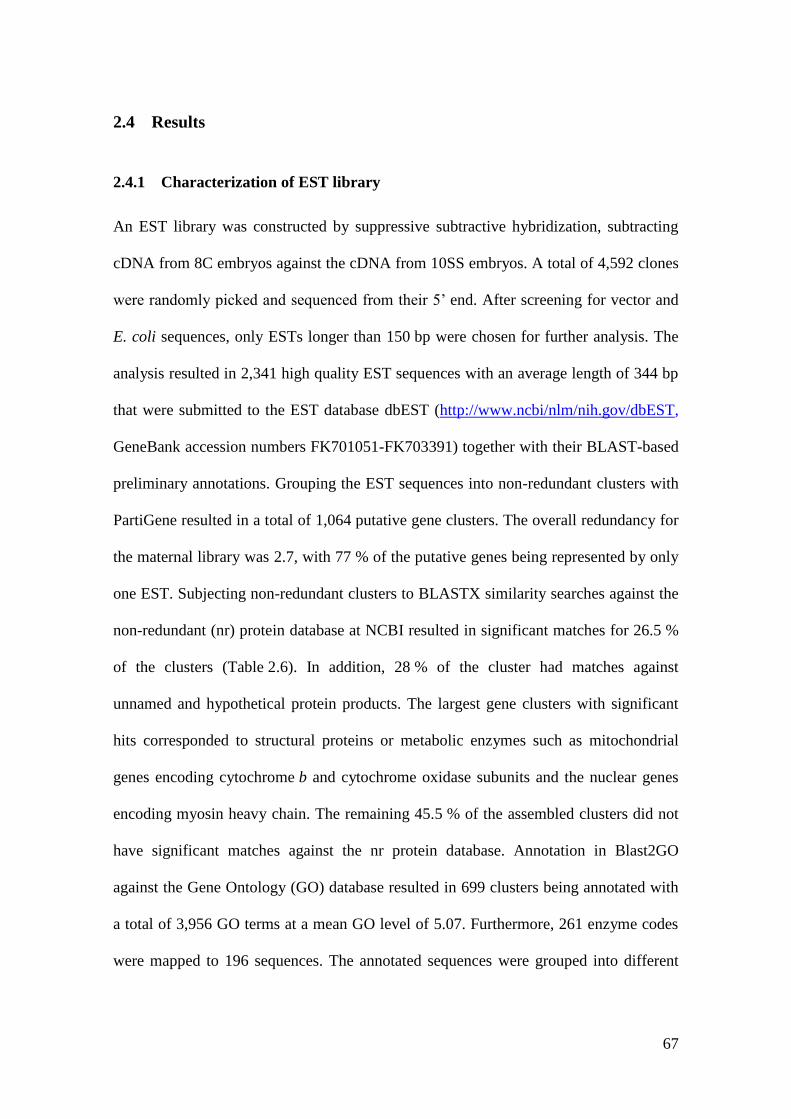
67
2.4 Results
2.4.1 Characterization of EST library
An EST library was constructed by suppressive subtractive hybridization, subtracting
cDNA from 8C embryos against the cDNA from 10SS embryos. A total of 4,592 clones
were randomly picked and sequenced from their 5’ end. After screening for vector and
E. coli sequences, only ESTs longer than 150 bp were chosen for further analysis. The
analysis resulted in 2,341 high quality EST sequences with an average length of 344 bp
that were submitted to the EST database dbEST (http://www.ncbi/nlm/nih.gov/dbEST,
GeneBank accession numbers FK701051-FK703391) together with their BLAST-based
preliminary annotations. Grouping the EST sequences into non-redundant clusters with
PartiGene resulted in a total of 1,064 putative gene clusters. The overall redundancy for
the maternal library was 2.7, with 77 % of the putative genes being represented by only
one EST. Subjecting non-redundant clusters to BLASTX similarity searches against the
non-redundant (nr) protein database at NCBI resulted in significant matches for 26.5 %
of the clusters (Table 2.6). In addition, 28 % of the cluster had matches against
unnamed and hypothetical protein products. The largest gene clusters with significant
hits corresponded to structural proteins or metabolic enzymes such as mitochondrial
genes encoding cytochrome b and cytochrome oxidase subunits and the nuclear genes
encoding myosin heavy chain. The remaining 45.5 % of the assembled clusters did not
have significant matches against the nr protein database. Annotation in Blast2GO
against the Gene Ontology (GO) database resulted in 699 clusters being annotated with
a total of 3,956 GO terms at a mean GO level of 5.07. Furthermore, 261 enzyme codes
were mapped to 196 sequences. The annotated sequences were grouped into different

68
classes of ontology according to the GO terms, as shown in Figure 2.4. Most of the
genes involved in biological processes were part of metabolic and cellular processes.
Half of the annotated genes were classified as genes with the function of binding,
followed by the function of catalytic activity. Searching against the Kyoto
Encyclopaedia of Genes and Genomes (KEGG) pathways resulted in the annotation of
169 of the clusters representing 83 different pathways
(http://www.genome.jp/kegg/pathway.html). The thirteen most represented pathways
are shown in Table 2.7.
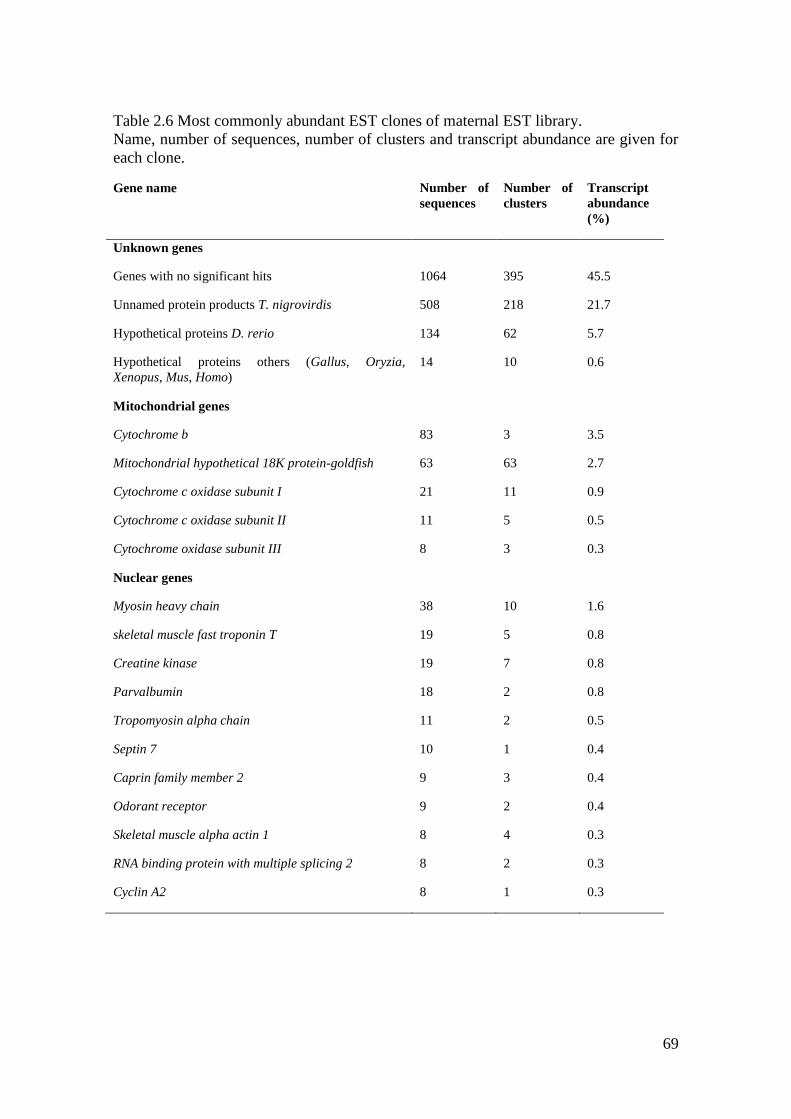
69
Table 2.6 Most commonly abundant EST clones of maternal EST library.
Name, number of sequences, number of clusters and transcript abundance are given for
each clone.
Gene name Number of
sequences
Number of
clusters
Transcript
abundance
(%)
Unknown genes
Genes with no significant hits 1064 395 45.5
Unnamed protein products T. nigrovirdis 508 218 21.7
Hypothetical proteins D. rerio 134 62 5.7
Hypothetical proteins others (Gallus, Oryzia,
Xenopus, Mus, Homo)
14 10 0.6
Mitochondrial genes
Cytochrome b 83 3 3.5
Mitochondrial hypothetical 18K protein-goldfish 63 63 2.7
Cytochrome c oxidase subunit I 21 11 0.9
Cytochrome c oxidase subunit II 11 5 0.5
Cytochrome oxidase subunit III 8 3 0.3
Nuclear genes
Myosin heavy chain 38 10 1.6
skeletal muscle fast troponin T 19 5 0.8
Creatine kinase 19 7 0.8
Parvalbumin 18 2 0.8
Tropomyosin alpha chain 11 2 0.5
Septin 7 10 1 0.4
Caprin family member 2 9 3 0.4
Odorant receptor 9 2 0.4
Skeletal muscle alpha actin 1 8 4 0.3
RNA binding protein with multiple splicing 2 8 2 0.3
Cyclin A2 8 1 0.3
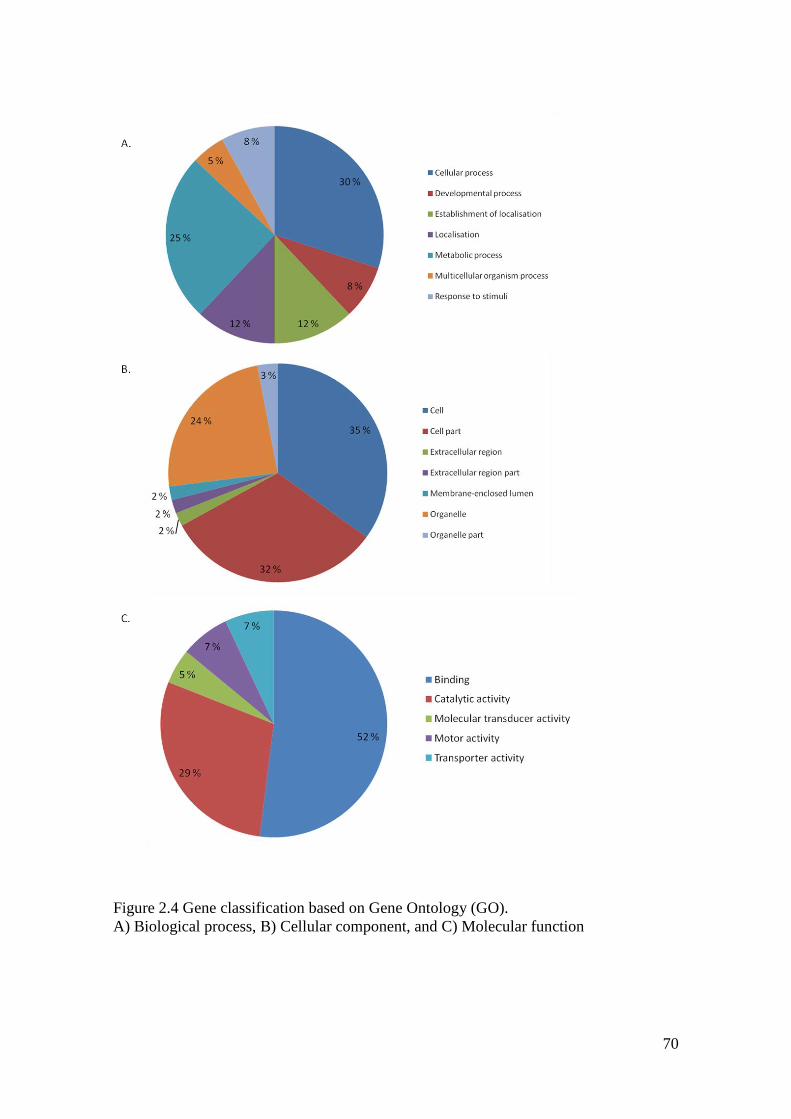
70
Figure 2.4 Gene classification based on Gene Ontology (GO).
A) Biological process, B) Cellular component, and C) Molecular function
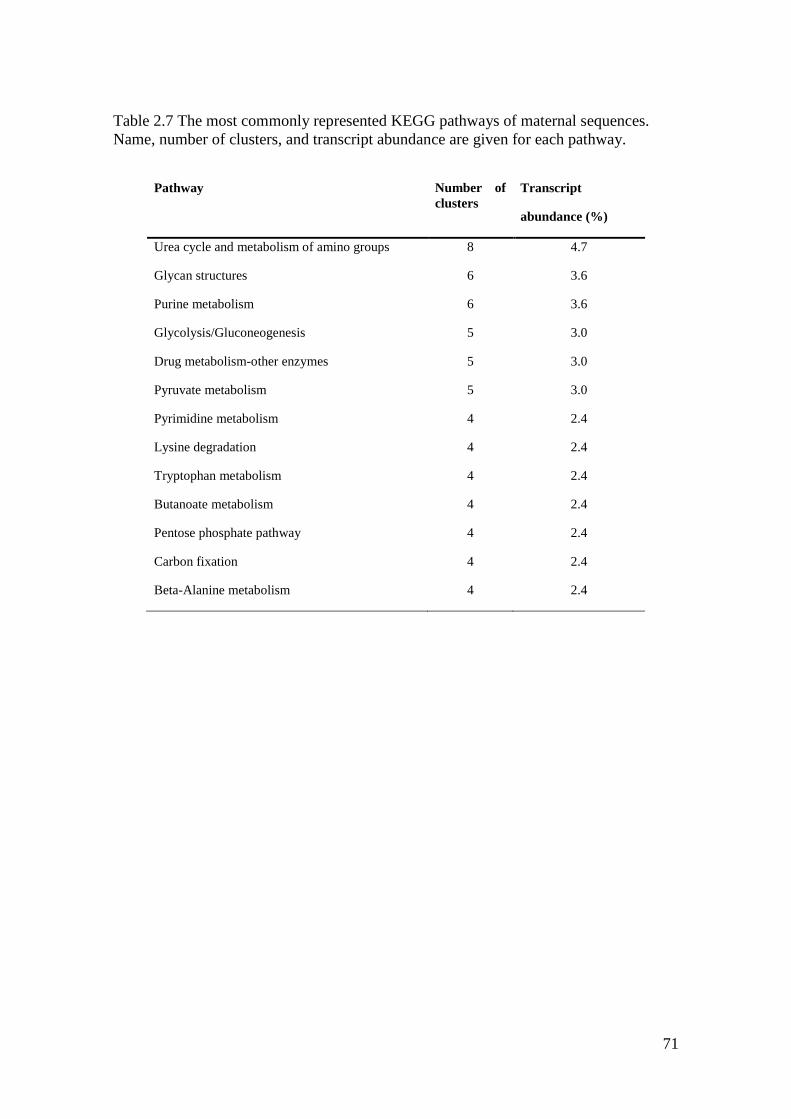
71
Table 2.7 The most commonly represented KEGG pathways of maternal sequences.
Name, number of clusters, and transcript abundance are given for each pathway.
Pathway Number of
clusters
Transcript
abundance (%)
Urea cycle and metabolism of amino groups 8 4.7
Glycan structures 6 3.6
Purine metabolism 6 3.6
Glycolysis/Gluconeogenesis 5 3.0
Drug metabolism-other enzymes 5 3.0
Pyruvate metabolism 5 3.0
Pyrimidine metabolism 4 2.4
Lysine degradation 4 2.4
Tryptophan metabolism 4 2.4
Butanoate metabolism 4 2.4
Pentose phosphate pathway 4 2.4
Carbon fixation 4 2.4
Beta-Alanine metabolism 4 2.4
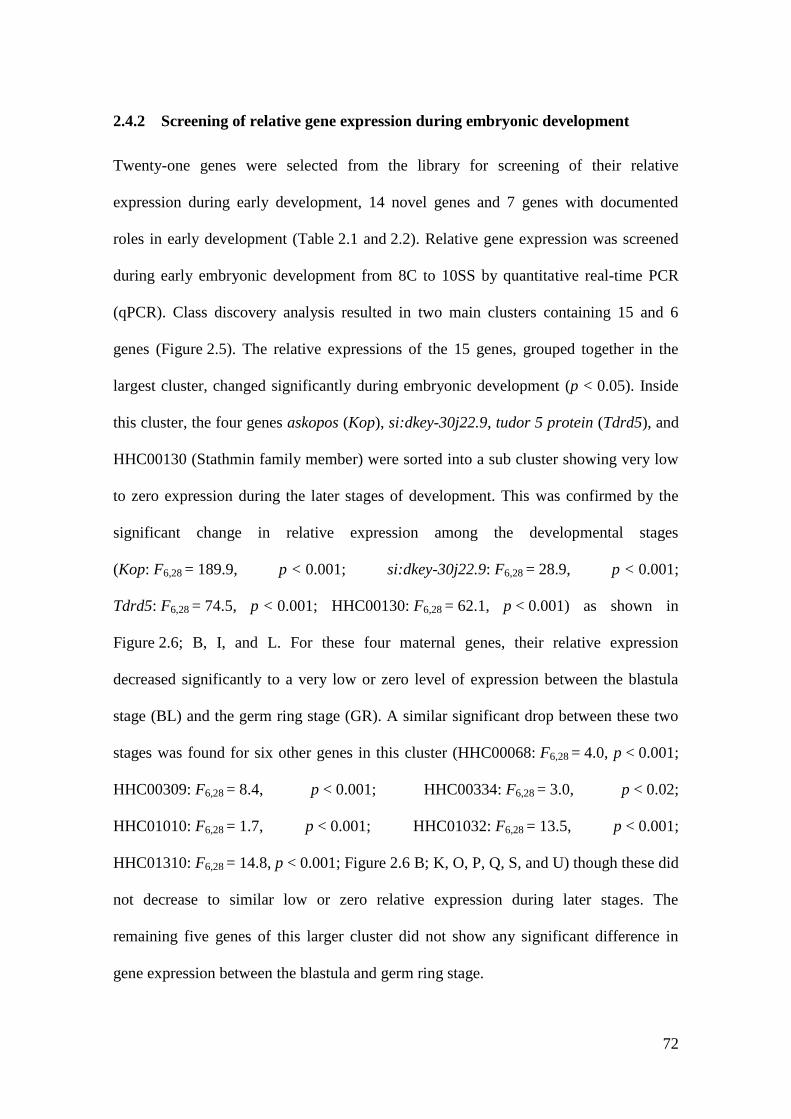
72
2.4.2 Screening of relative gene expression during embryonic development
Twenty-one genes were selected from the library for screening of their relative
expression during early development, 14 novel genes and 7 genes with documented
roles in early development (Table 2.1 and 2.2). Relative gene expression was screened
during early embryonic development from 8C to 10SS by quantitative real-time PCR
(qPCR). Class discovery analysis resulted in two main clusters containing 15 and 6
genes (Figure 2.5). The relative expressions of the 15 genes, grouped together in the
largest cluster, changed significantly during embryonic development (p < 0.05). Inside
this cluster, the four genes askopos (Kop), si:dkey-30j22.9, tudor 5 protein (Tdrd5), and
HHC00130 (Stathmin family member) were sorted into a sub cluster showing very low
to zero expression during the later stages of development. This was confirmed by the
significant change in relative expression among the developmental stages
(Kop: F6,28 = 189.9, p < 0.001; si:dkey-30j22.9: F6,28 = 28.9, p < 0.001;
Tdrd5: F6,28 = 74.5, p < 0.001; HHC00130: F6,28 = 62.1, p < 0.001) as shown in
Figure 2.6; B, I, and L. For these four maternal genes, their relative expression
decreased significantly to a very low or zero level of expression between the blastula
stage (BL) and the germ ring stage (GR). A similar significant drop between these two
stages was found for six other genes in this cluster (HHC00068: F6,28 = 4.0, p < 0.001;
HHC00309: F6,28 = 8.4, p < 0.001; HHC00334: F6,28 = 3.0, p < 0.02;
HHC01010: F6,28 = 1.7, p < 0.001; HHC01032: F6,28 = 13.5, p < 0.001;
HHC01310: F6,28 = 14.8, p < 0.001; Figure 2.6 B; K, O, P, Q, S, and U) though these did
not decrease to similar low or zero relative expression during later stages. The
remaining five genes of this larger cluster did not show any significant difference in
gene expression between the blastula and germ ring stage.
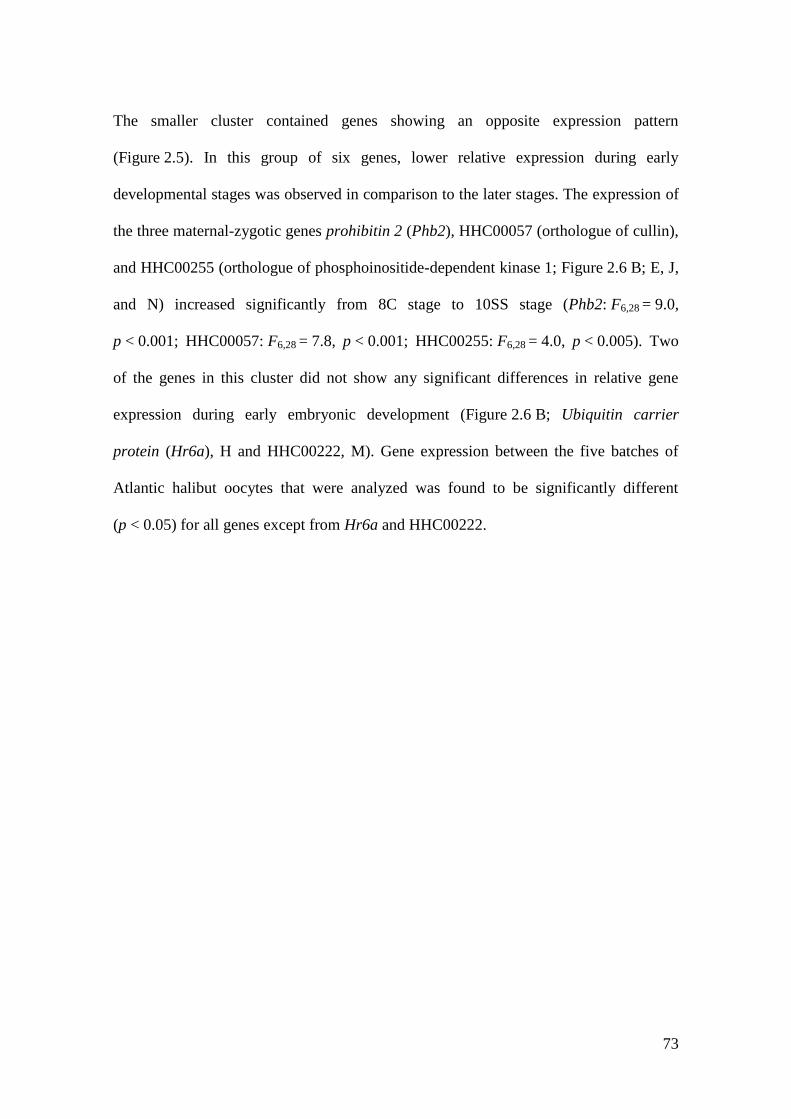
73
The smaller cluster contained genes showing an opposite expression pattern
(Figure 2.5). In this group of six genes, lower relative expression during early
developmental stages was observed in comparison to the later stages. The expression of
the three maternal-zygotic genes prohibitin 2 (Phb2), HHC00057 (orthologue of cullin),
and HHC00255 (orthologue of phosphoinositide-dependent kinase 1; Figure 2.6 B; E, J,
and N) increased significantly from 8C stage to 10SS stage (Phb2: F6,28 = 9.0,
p < 0.001; HHC00057: F6,28 = 7.8, p < 0.001; HHC00255: F6,28 = 4.0, p < 0.005). Two
of the genes in this cluster did not show any significant differences in relative gene
expression during early embryonic development (Figure 2.6 B; Ubiquitin carrier
protein (Hr6a), H and HHC00222, M). Gene expression between the five batches of
Atlantic halibut oocytes that were analyzed was found to be significantly different
(p < 0.05) for all genes except from Hr6a and HHC00222.
74
Figure 2.5 Clustering of genes, according to their relative gene expression during early embryonic
development.
Genes were clustered using the single-linkage method with Pearson correlation coefficient as distance
measurement. The developmental stages were 8-cell stage (8C), 8 hours past fertilisation (hpf); 16 cell stage
(16CS), 12 hpf; blastula (BL), 45 hpf; germ ring (GR), 82 hpf; 25 % epiboly (25EP) 96 hpf; 50 % epiboly
(50EP), 117 hpf; and 10 somite stage (10SS), 142 hpf (n = 5). Data was standardized against the first stage,
8C. Colour bar indicates relative gene expression in relation to 8C. Red colour shows up-regulation and blue
colour down-regulation in relation to 8C. Reference genes are not included.
75
Figure 2.6 Relative gene expressions of selected Atlantic halibut genes from 8C to 10SS stage.
Expression pattern of A: Askopos, B: Si:dkey-30j22.9, C: BAH, D: Checkpoint 1, E: Prohibitin 2, F: Syntaxin 4, G: 18k hypothetical
goldfish protein, H:HR6A, I: Tudor 5 protein, J: HHC00057, K: HHC00068, L: HHC00130, M: HHC00222,N: HHC00255, O: HHC00309,
P: HHC00334,Q: HHC01010,R: HHC01015, S: HHC01032, T: HHC01194, U: HHC01310. Error bars indicate the standard deviation
(n=5). The developmental stages were 8-cell stage (8C), 8 hours past fertilisation (hpf); 16 cell stage (16CS), 12 hpf; blastula (BL), 45 hpf;
germ ring (GR), 82 hpf; 25 % epiboly (25EP) 96 hpf; 50 % epiboly (50EP), 117 hpf; and 10 somite stage (10SS), 142 hpf (n = 5).
76
2.5 Discussion
2.5.1 Characterization of the EST library
1,419 maternal ESTs were previously reported in Atlantic halibut from sequencing an
unbiased cDNA library obtained from 2-cell stage embryos (Bai et al., 2007). In the
present study we used suppressive subtractive hybridization (SSH) to subtract the
transcripts expressed both before and after the switch from maternal to zygotic
expression. The analysis resulted in a library containing 2,341EST sequences. Due to
the relatively short size of the ESTs, the default cut-off < 10-3, recommended by the
software PartiGene, was chosen for the BLASTX analysis (Parkinson et al., 2004). This
decreased the stringency of the search, decreasing the possibility that significant
matches would be overlooked. The low redundancy of the library of 2.7 suggests that
the SSH worked efficiently since 77 % of the putative genes were singletons containing
only one EST, representing rare mRNAs. However, the largest gene clusters encoded
for common genes such as cytochrome b and cytochrome oxidase subunits (Table 2.6).
Although SSH greatly enriches for differentially expressed genes the subtracted sample
will still contain some cDNAs that correspond to mRNAs common to both the tracer
and driver samples, depending somewhat on the quality of RNA purification and the
performance of the particular subtraction (Lukyanov et al., 2007). However, it mainly
arises when very few mRNA species are differentially expressed in tracer and driver.
The number of strictly maternal genes is generally lower compared to maternal-zygotic
genes (Mathavan et al., 2005). In general, fewer differentially expressed mRNAs and
less quantitative difference in expression lead to higher background – even if one
obtains a good enrichment for differentially expressed cDNAs.
77
Annotated genes in the previous study contained almost twice as many genes classified
as involved in metabolic processes compared to our library. In addition, genes involved
in developmental processes were almost absent representing only 0.1 % of the total
genes compared to this studie’s library with 8 % (Figure 2.4) (Bai et al., 2007)
2.5.2 Screening of relative gene expression through embryonic development
Among the 21 selected genes only three showed strictly maternal expression patterns
(Figure 2.6). Only annotated genes with known functions during embryonic
development were selected, not all of them known to be strictly maternal in other
organisms. Choosing randomly picked genes from the EST library may have increased
the number of strictly maternal genes. The three genes: Kop, si:dkey-30j22.9, and Tdrd5
showed an expression pattern typical for strictly maternal genes (Figure 2.6; A, B, and
I). By stage 25 % epiboly (25EB), their expression was no longer detectable anymore,
possibly due to the degradation of their transcripts. This could indicate that the MZT in
Atlantic halibut takes place between the BL and GR stage. Kop mRNA is continuously
expressed in the zebrafish primordial germ cells (PGCs) during migration towards the
putative gonads (Blaser et al., 2005). Si:dkey-30j22.9 and Tdrd5 encode proteins
containing several Tudor domains. Tudor domains were identified as common protein
motifs found in the D. melanogaster Tud protein which plays a dual role in abdomen
development and germ cell formation (Boswell & Mahowald, 1985 ; Travis Thomson,
2004). Si:dkey-30j22.9 encodes an uncharacterized protein found in the zebrafish
containing 6 tudor domains. Tdrd5 has been found to be expressed exclusively in mouse
testis, implying that expression of this gene is restricted to the male germ line
throughout development to adulthood (Smith et al., 2004). It is unknown how Kop,
si:dkey-30j22.9, and Tdrd5 may influence embryonic development.
78
Three genes Phb2, HHC00057, and HHC00225 were significantly up-regulated during
the later embryonic stages, representing maternal-zygotic genes (Figure 2.6 B; E, J, and
N). Phb2, together with prohibitin 1 (Phb1), codes for highly conserved proteins in
eukaryotic cells that are present in multiple cellular compartments. In rainbow trout,
Phb2 mRNA abundance was found to correlate negatively with developmental success
(Bonnet et al., 2007). HHC00057 codes for a Cullin protein orthologue which are RING
H2 finger proteins that are part of a protein complex which forms the largest known
class of ubiquitin ligases, the cullin-RING ubiquitin ligases (CRLs). In zebrafish, CUL2
has been found to be required for normal embryonic development and vasculogenesis
(Maeda et al., 2008). HHC00255 codes for an orthologue of 3-phosphoinositide-
dependent protein kinase-1 (PDPK1) which mediates the cellular effect of insulin and
growth factors by activating a group of kinases (Belham et al., 1999 ; Mora et al.,
2004). It also plays a role in cell cycle resumption during oocyte maturation in starfish
(Hiraoka et al., 2004). Lawlor et al. showed that PDPK1-deficient mice embryos
displayed multiple abnormalities including lack of somites; forebrain and neural crest
derived tissues and died after a few days. Mice embryos with reduced PDPK1 activity
were 40-50 % smaller than normal animals. The volume of a number of PDPK1-
deficient cells was reduced by 35-60 %, but not their cell number, nuclear size or
proliferation (Lawlor et al., 2002). How PDPK1 influences teleost embryonic
development has not been studied.
The genomic information created in this study provides the base for future studies on
maternal genes expression in Atlantic halibut. The identified strictly maternal and
maternal-zygotic genes will be tested for their potential as molecular markers for

79
Atlantic halibut oocyte quality by correlating their transcript abundance to fertilisation
and embryonic hatching rates.
Picked only a small number of EST, are they respective? It is expected that the number
of true maternal EST is small compared to maternal-zygotic genes. Makes SSH
challengeing.
80
3 Selection of suitable reference genes for quantitative real-time
(qPCR) studies of Atlantic halibut development
3.1 Abstract
Gene expression studies are an essential tool to identify the factors that control normal
development and growth in teleost embryos and larvae. High embryonic mortality and
larval malformations are common during juvenile production for on-growth in
aquaculture. Quantitative real-time PCR (qPCR) is the most accurate method of
quantifying gene expression, provided that suitable endogenous controls are used to
normalize the data. To date, no reference genes have been validated for developmental
gene expression studies in Atlantic halibut. In this study the expression profiles of 6
commonly used reference genes were determined (Actb, Eef2, Fau, Gapdh, Tubb2, and
18S rRNA) in 6 embryonic and 5 larval stages of Atlantic halibut development. There
were significant changes in expression levels throughout development, which stress the
importance and complexity of finding appropriate reference genes. The three software
applications (BestKeeper, geNorm, and NormFinder) used to evaluate the stability of
potential reference genes produced comparable results. Tubb2 and Actb were the most
stable genes across the different developmental stages, whereas 18S rRNA and Gapdh
were the most variable genes and thus inappropriate to use as reference genes.
According to geNorm and NormFinder, the best two-gene normalization factors
corresponded to the geometric average of Tubb2/Actb and Tbb2/Fau, respectively.
Either of these normalization factors can be used for future developmental gene
expression studies in Atlantic halibut.
81
3.2 Introduction
Gene expression studies are an essential tool to identify the factors that control normal
early development and its complex molecular pathways. Microarrays and quantitative
real-time PCR (qPCR) are the methods of choice for quantification of gene expression.
In particular, qPCR is commonly used in human diagnostics and expression studies in
various biological systems (Bustin et al., 2005). The accuracy of qPCR results depends
on several factors, including the RNA integrity of the starting material, enzyme and
primer performance, reference gene used, and method chosen for data analysis (Pfaffl &
Hageleit, 2001 ; Bustin & Nolan, 2004 ; Skern et al., 2005). Relative quantification of
gene expression by qPCR is based on the expression ratio of a target gene versus a
reference gene (Pfaffl, 2001 ). A vast number of reference genes have been proposed as
references for gene expression analysis (Warrington et al., 2000 ; Olsvik et al., 2005 ;
Ingerslev et al., 2006 ; Tang et al., 2007). Reference genes are typically genes that are
transcribed at a relatively constant level across various conditions, such as
developmental stage or tissue type, and their expression is assumed to be unaffected by
experimental parameters. It is unlikely that an ideal universal reference gene exists.
Many studies have used reference genes without proper validation of their presumed
stability of expression, even though transcript levels of reference genes can vary
considerably. For example, two of the most commonly used reference genes in qPCR
studies, glyceraldehyde-3-phosphate dehydrogenase (Gapdh) and β-actin (Actb), have
been found to vary in expression by 8-fold and 7- to 22-fold, respectively, during a
survey of 535 human reference genes (Warrington et al., 2000). The use of a single
reference gene has been shown to lead to erroneous normalization of up to 3- and 6-fold
in expression studies in various human tissues (Vandesompele et al., 2002). Hence, the
82
use of only one reference gene for normalization of gene expression studies should not
be considered sufficient (Bustin et al., 2005). The choice of suitable reference genes for
normalization of qPCR data during development is by no means trivial, since they must
be relatively unaffected by marked changes in transcriptional activity, particularly
before and after the start of zygotic transcription. Nevertheless, this task can be
achieved by computational methods recently developed to assess the expression
stability of candidate reference genes, namely geNorm (Vandesompele et al., 2002),
NormFinder (Andersen et al., 2004), and BestKeeper (Pfaffl et al., 2004).
The Atlantic halibut is considered a valuable candidate for commercial marine cold
water fish farming but the current production outcome suffers from a major bottleneck
during larval production. During this early production stage, the major problems are
high embryonic and larval mortality (Pittman et al., 1990a) as well as body
malformations during larval development and metamorphosis (Lewis & Lall, 2006 ;
Sæle et al., 2006). The most serious disorder during larval development is termed
“gaping” and it is associated with the locking of the jaw cartilage. Hence, larvae are not
able to close their mouth and cannot eat, which leads inevitably to death by starvation.
The amount of “gapers” in a batch increases at suboptimal rearing temperatures (Lein
et al., 1997a) and salinity conditions (Lein et al., 1997b). Gaping has also been
correlated with mechanical stress and bacterial invasion (Morrison & Macdonald, 1995)
in the rearing tanks. Other skeletal malformations during metamorphosis include
scoliosis in the vertebral column (Lewis & Lall, 2006) and arrested eye migration (Sæle
et al., 2004). Juveniles with skeletal malformations can represent up to 30% of a total
production batch and are routinely discarded during fry production. Despite their
significant economical importance, the molecular basis of such abnormalities is not
83
known. Gene expression studies, particularly qPCR, are essential to improve the
understanding of this as well as other fundamental issues regarding aquaculture species.
In fact, some recent studies have been conducted to investigate gene expression changes
during development of Atlantic halibut, albeit using a single reference gene. Actb has
been used as the reference gene in expression studies on aromatases (Van Nes et al.,
2005), estrogen receptors (Van Nes & Andersen, 2006), and myogenic regulation
factors (Galloway et al., 2006) in Atlantic halibut embryos and larvae. In spite of being
a suitable reference gene in cattle (Robinson et al., 2007) and zebrafish (Tang et al.,
2007), Actb transcript levels have been shown to vary as a response to biochemical
stimuli, as well as during growth and differentiation in other mammalian systems (Ruan
& Lai, 2007). 18S ribosomal RNA (18S rRNA) has been used during expression studies
of insulin growth factor receptors (Hildahl et al., 2007a) and type I keratin genes
(Campinho et al., 2007) in Atlantic halibut. The use of 18S rRNA should be considered
carefully in studies where the target genes are expected to show low expression levels.
In cattle, 18S rRNA has been considered unsuitable because of the vast difference in
abundance between rRNA and target genes (Robinson et al., 2007), which results in
different amplification kinetics that may generate misleading quantification data
(Bustin et al., 2005).
The aim of this work was to identify optimal reference genes for qPCR studies of early
embryonic and larval development in Atlantic halibut. No systematic survey of
appropriate qPCR references for such developmental stages has been conducted to date
in any aquaculture species. The selected genes comprised some ‘classical’ reference
genes used as qPCR references (Actb, 18S rRNA, and Gapdh) and three genes that have
recently been acknowledged as potential reference genes for qPCR: 40S ribosomal

84
protein S30 (Fau), eukaryotic translation elongation factor 2 (Eef2), and β2-tubulin
(Tubb2). The identification of the most suitable genes for normalization of qPCR data
will be an essential tool for future developmental gene expression studies in Atlantic
halibut.
85
3.3 Material and Methods
3.3.1 Fish husbandry and sample collection
The Atlantic halibut used in this experiment were sampled between May 18th
and July
23rd
at Risørfisk AS hatchery (Risør, Norway). Oocytes were obtained by stripping the
females and fertilised in vitro with pooled sperm from two males. Eggs and larvae were
reared at 6.2 ± 0.1 °C (range). The developmental stages examined were the following:
two-cell (2C), high blastula (HB), germ ring (GR), 10-somite (10SS), 30-somite (30SS),
50-somite (50SS), hatching/ larval stage 1 (LS1), larval stage 2 (LS2), larval stage 3
(LS3), larval stage 4 (LS4), and first feeding (FF; Figure 3.1). A total of 5 batches were
followed from fertilisation to first feeding and approximately 50 embryos and larvae at
each developmental stage were sampled from each of the batches. Samples were
wrapped in tinfoil and snap-frozen in liquid nitrogen until analysis.
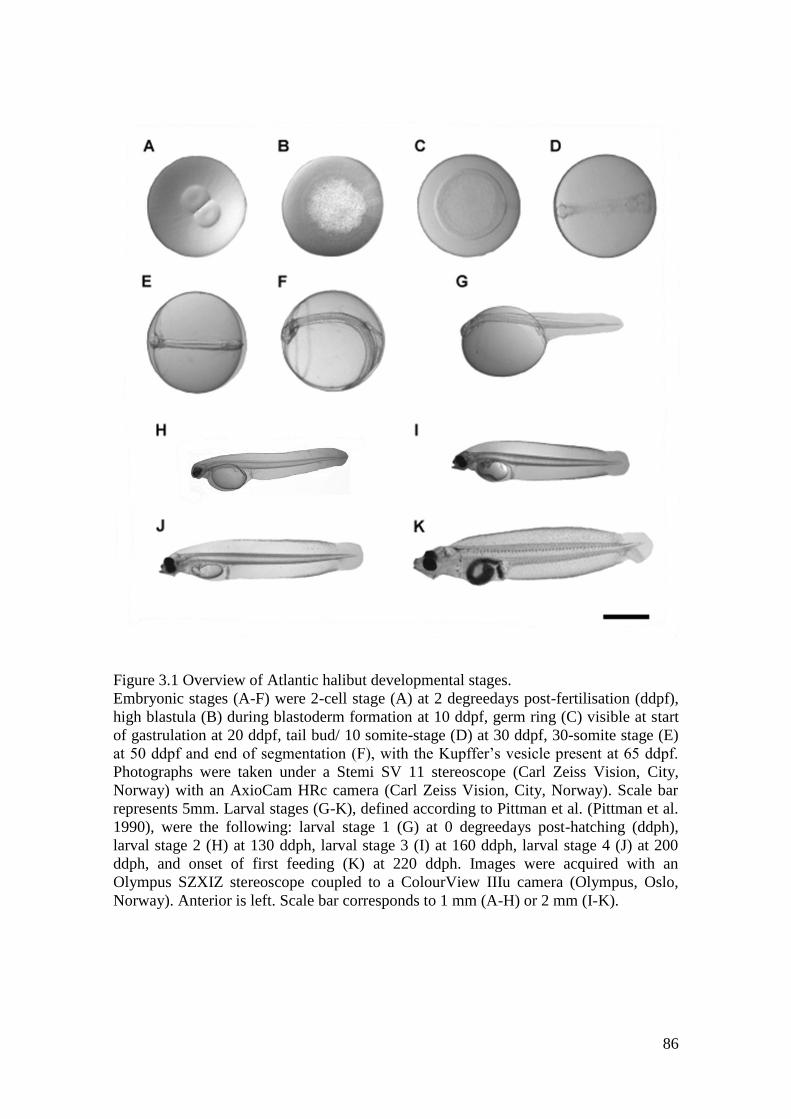
86
Figure 3.1 Overview of Atlantic halibut developmental stages.
Embryonic stages (A-F) were 2-cell stage (A) at 2 degreedays post-fertilisation (ddpf),
high blastula (B) during blastoderm formation at 10 ddpf, germ ring (C) visible at start
of gastrulation at 20 ddpf, tail bud/ 10 somite-stage (D) at 30 ddpf, 30-somite stage (E)
at 50 ddpf and end of segmentation (F), with the Kupffer’s vesicle present at 65 ddpf.
Photographs were taken under a Stemi SV 11 stereoscope (Carl Zeiss Vision, City,
Norway) with an AxioCam HRc camera (Carl Zeiss Vision, City, Norway). Scale bar
represents 5mm. Larval stages (G-K), defined according to Pittman et al. (Pittman et al.
1990), were the following: larval stage 1 (G) at 0 degreedays post-hatching (ddph),
larval stage 2 (H) at 130 ddph, larval stage 3 (I) at 160 ddph, larval stage 4 (J) at 200
ddph, and onset of first feeding (K) at 220 ddph. Images were acquired with an
Olympus SZXIZ stereoscope coupled to a ColourView IIIu camera (Olympus, Oslo,
Norway). Anterior is left. Scale bar corresponds to 1 mm (A-H) or 2 mm (I-K).
87
3.3.2 RNA extraction and cDNA synthesis
Circa 100 mg of Atlantic halibut embryos (10-15 eggs) or larvae (4-5) were placed into
a Lysing Matrix D tube (QBiogene/Medinor, Oslo, Norway) containing QIAzol
(Qiagen, Nydalen, Sweden) and homogenized for 40 s at 6000 rpm using the MagNA
Lyser instrument (Roche, Mannheim, Germany), according to the Tri reagent method
(Sigma, Oslo, Norway). Total RNA was treated with the gDNA wipeout buffer supplied
with the QuantiTect reverse transcription kit (Qiagen) to remove traces of genomic
DNA contamination. Assessment of RNA quality was performed on a 1.2 % (w/v)
agarose gel containing SYBR safe DNA gel stain (Invitrogen/VWR, Tromsø, Norway)
and photographed with the Gel logic 200 imaging system (Kodiac/Perderson & Sønn,
Oslo, Norway). RNA samples were then quantified using a Nanodrop
spectrophotometer (Nanodrop Technologies/Saven Werner, Kristiansand, Norway). All
samples had absorbance ratios 260/280 nm greater than 1.9, indicative of high purity
RNA. cDNA was synthesized with the QuantiTect reverse transcription kit (Qiagen)
using a 96 well PCR from Techne (Barloworld Ltd, Stone, USA). The resulting single-
stranded cDNA products were quantified using the Nanodrop spectrophotometer and
then diluted 50-fold with deionized water, prior to using them as templates for the qPCR
reactions.
3.3.3 Primer design
The primers for Gapdh, Actb, Eef2, Fau, and Tubb2 were based on high-quality
expressed sequence tags (ESTs) derived from three Atlantic halibut cDNA libraries
(Bai et al., 2007). BLAST similarity searches at the National Center for Biotechnology
Information (NCBI, http://www.ncbi.nlm.nih.gov/BLAST) were performed to confirm
88
the identity of the genes. It is noteworthy that the halibut Actb gene used in this study is
the orthologue of zebrafish β-actin 1 (also known as bactin1), which is located on
chromosome 1 of the zebrafish genome. The genomic sequences of orthologous genes
from D, rerio, G. aculeatus, O. latipes, T. rubripes, and T. nigroviridis were retrieved
from Ensembl (http://www.ensembl.org). Intron/exon borders within the Atlantic
halibut EST sequences were then predicted using the Spidey software
(http://www.ncbi.nlm.nih.gov/spidey) by aligning the halibut ESTs with the
corresponding genomic sequences from the other teleost species. Whenever possible,
primers were designed across the most conserved splice junctions. All gene specific
primers crossed at last one intron/exon border containing both donor and acceptor sites,
in order to avoid amplification of any contaminating genomic DNA. Primer pairs for
qPCR amplification were designed manually and screened for hairpins, homo- and
cross-dimers using Netprimer (http://www.premierbiosoft.com/netprimer). The
18S rRNA primers from Atlantic halibut have been recently reported (Hildahl et al.,
2007b). The primer sequences used to amplify all reference genes are listed on
Table 3.1, as are the corresponding amplicon sizes and PCR efficiencies.
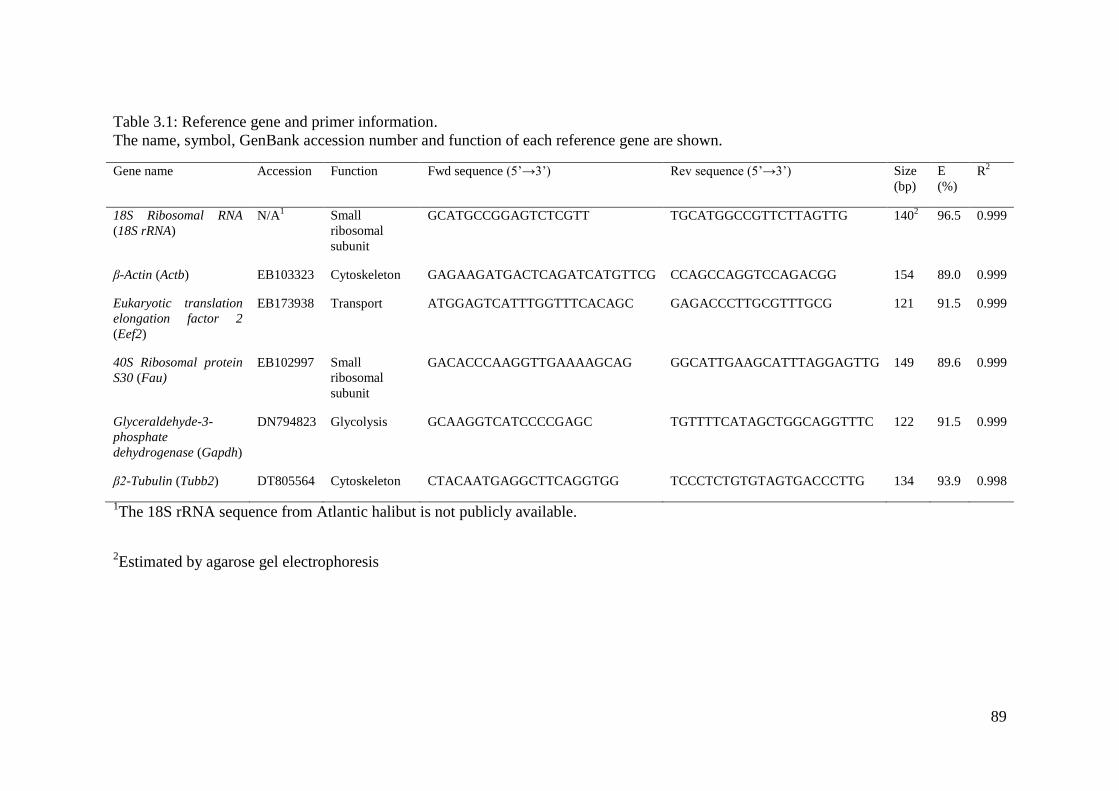
89
Table 3.1: Reference gene and primer information.
The name, symbol, GenBank accession number and function of each reference gene are shown.
Gene name Accession Function Fwd sequence (5’→3’) Rev sequence (5’→3’) Size
(bp)
E
(%)
R2
18S Ribosomal RNA
(18S rRNA)
N/A1 Small
ribosomal
subunit
GCATGCCGGAGTCTCGTT TGCATGGCCGTTCTTAGTTG 1402 96.5 0.999
β-Actin (Actb) EB103323 Cytoskeleton GAGAAGATGACTCAGATCATGTTCG CCAGCCAGGTCCAGACGG 154 89.0 0.999
Eukaryotic translation
elongation factor 2
(Eef2)
EB173938 Transport ATGGAGTCATTTGGTTTCACAGC GAGACCCTTGCGTTTGCG 121 91.5 0.999
40S Ribosomal protein
S30 (Fau)
EB102997 Small
ribosomal
subunit
GACACCCAAGGTTGAAAAGCAG GGCATTGAAGCATTTAGGAGTTG 149 89.6 0.999
Glyceraldehyde-3-
phosphate
dehydrogenase (Gapdh)
DN794823 Glycolysis GCAAGGTCATCCCCGAGC TGTTTTCATAGCTGGCAGGTTTC 122 91.5 0.999
β2-Tubulin (Tubb2) DT805564 Cytoskeleton CTACAATGAGGCTTCAGGTGG TCCCTCTGTGTAGTGACCCTTG 134 93.9 0.998
1The 18S rRNA sequence from Atlantic halibut is not publicly available.
2Estimated by agarose gel electrophoresis
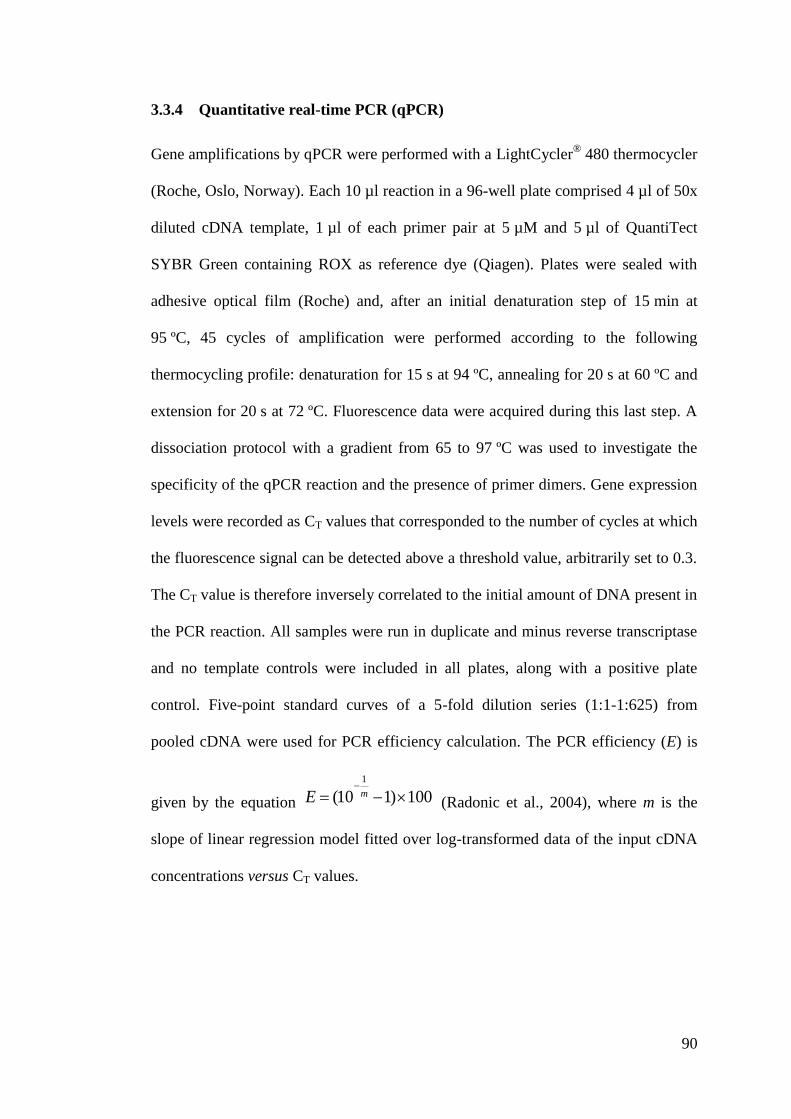
90
3.3.4 Quantitative real-time PCR (qPCR)
Gene amplifications by qPCR were performed with a LightCycler® 480 thermocycler
(Roche, Oslo, Norway). Each 10 µl reaction in a 96-well plate comprised 4 µl of 50x
diluted cDNA template, 1 µl of each primer pair at 5 µM and 5 µl of QuantiTect
SYBR Green containing ROX as reference dye (Qiagen). Plates were sealed with
adhesive optical film (Roche) and, after an initial denaturation step of 15 min at
95 ºC, 45 cycles of amplification were performed according to the following
thermocycling profile: denaturation for 15 s at 94 ºC, annealing for 20 s at 60 ºC and
extension for 20 s at 72 ºC. Fluorescence data were acquired during this last step. A
dissociation protocol with a gradient from 65 to 97 ºC was used to investigate the
specificity of the qPCR reaction and the presence of primer dimers. Gene expression
levels were recorded as CT values that corresponded to the number of cycles at which
the fluorescence signal can be detected above a threshold value, arbitrarily set to 0.3.
The CT value is therefore inversely correlated to the initial amount of DNA present in
the PCR reaction. All samples were run in duplicate and minus reverse transcriptase
and no template controls were included in all plates, along with a positive plate
control. Five-point standard curves of a 5-fold dilution series (1:1-1:625) from
pooled cDNA were used for PCR efficiency calculation. The PCR efficiency (E) is
given by the equation 100)110(
1
mE (Radonic et al., 2004), where m is the
slope of linear regression model fitted over log-transformed data of the input cDNA
concentrations versus CT values.
91
3.3.5 Statistical analysis
Differences in expression levels of Gapdh, Actb, Eef2, Fau, Tubb2, and 18S rRNA
with developmental stage were examined by one-way ANOVA with Holm-Sidak
post-hoc tests. When the data did not meet the normality and/or equal variance
requirements, a Kruskal-Wallis one-way ANOVA on ranks with a Dunn’s test for
post-hoc comparisons was performed instead. The SigmaStat statistical package
(Systat software, London, UK) was used for all analyses. Significance levels were set
at p < 0.05.
3.3.6 Evaluation of expression stability
Evaluation of expression stability was performed using three independent statistical
applications: geNorm (Vandesompele et al., 2002), NormFinder (Andersen et al.,
2004), and BestKeeper (Pfaffl et al., 2004). GeNorm (Vandesompele et al., 2002) is
a Microsoft Excel application that determines the expression stability of reference
genes based on overall pairwise comparisons between them. In brief, the principle
behind this algorithm is that expression ratio of two ideal reference genes is identical
in all samples, regardless of the experimental conditions or cell type. The software
calculates a stability value (M), which is inversely correlated to gene expression
stability, and ranks the reference genes accordingly. Stepwise exclusion of the gene
with the highest stability index, assuming that the genes are not co-regulated, results
in a combination of two reference genes that have the most stable expression across
the tested samples. The identification of stable reference genes with BestKeeper
(Pfaffl et al., 2004) is based on pair wise comparisons of raw cycle threshold (CT)
values of each gene. The genes showing least variation are incorporated into a
BestKeeper index, which can be used in very much the same way as a single
92
reference gene in normalization of gene expression. Stable reference genes show a
strong correlation with the BestKeeper index. NormFinder (Andersen et al., 2004) is
also an application for Excel but, unlike GeNorm and BestKeeper, it uses a model-
based approach to determine the optimal reference genes. In this mathematical model
a separate analysis of the sample subgroups and estimation of both intra- and inter-
group variation in expression levels are included into the calculation of a gene
stability value. Normfinder also calculates the best combination of two genes for a
two-gene normalization factor and its corresponding stability value.
93
3.4 Results
3.4.1 Developmental expression profiles of candidate reference genes
Analysis of the raw expression levels across all eleven developmental stages
identified some variation amongst candidate reference genes (Figure 3.2). Tubb2
showed the lowest global variability, whereas Gapdh had the highest variation in
expression levels. Except for 18S rRNA, which was highly expressed
(Mean CT = 10.09), the other candidate reference genes were expressed at moderate
levels, with mean CT values of 18.61, 19.02, 19.51, 20.16, and 22.61 for Fau, Actb,
Eef2, Tubb2, and Gapdh, respectively (Figure 3.2). All genes were expressed
throughout the different embryonic and larval stages, but with different expression
patterns (Figure 3.3). Apart from 18S rRNA (p > 0.05), all other candidate reference
genes showed significant overall changes in expression with developmental stage
(p < 0.05). Despite its relatively stable expression throughout development, 18S
rRNA had the highest intra-group variation (Figure 3.3). Expression profiles were
generally characterized by low transcript levels (i.e., higher CT values) at the 2-cell
and high blastula stages, gradually increasing levels during gastrulation (GR and
10SS) and reaching a plateau by the end of somitogenesis. From hatching until first
feeding, expression remained relatively stable.
3.4.2 Analysis of expression stability
The BestKeeper descriptive statistics, based on the raw CT values for each gene,
ranked the candidate reference genes in the following preliminary order, from most
to least stable: Tubb2 > 18S rRNA > Eef2 > Fau > Actb > Gapdh (Table 3.2).
Generally, the six reference genes correlated well with each other. Particularly strong
inter-gene correlations (p > 0.05) were found for Eef2/Gapdh (r = 0.855), Eef2/Fau
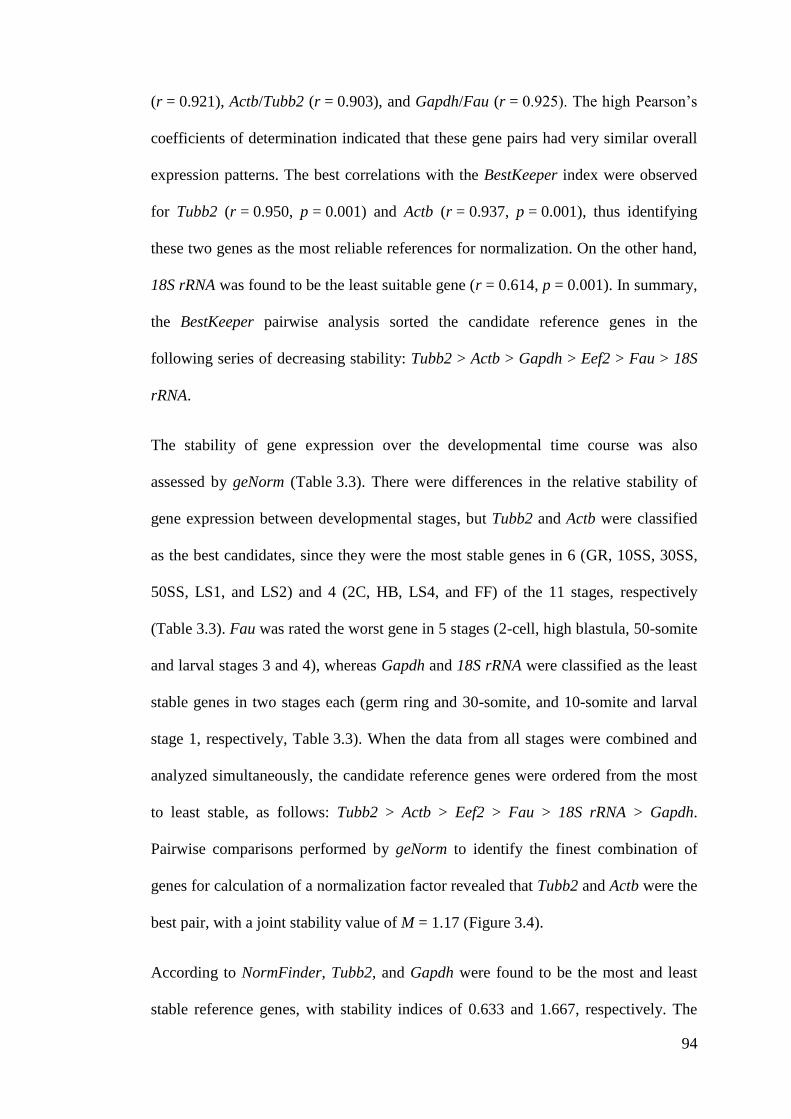
94
(r = 0.921), Actb/Tubb2 (r = 0.903), and Gapdh/Fau (r = 0.925). The high Pearson’s
coefficients of determination indicated that these gene pairs had very similar overall
expression patterns. The best correlations with the BestKeeper index were observed
for Tubb2 (r = 0.950, p = 0.001) and Actb (r = 0.937, p = 0.001), thus identifying
these two genes as the most reliable references for normalization. On the other hand,
18S rRNA was found to be the least suitable gene (r = 0.614, p = 0.001). In summary,
the BestKeeper pairwise analysis sorted the candidate reference genes in the
following series of decreasing stability: Tubb2 > Actb > Gapdh > Eef2 > Fau > 18S
rRNA.
The stability of gene expression over the developmental time course was also
assessed by geNorm (Table 3.3). There were differences in the relative stability of
gene expression between developmental stages, but Tubb2 and Actb were classified
as the best candidates, since they were the most stable genes in 6 (GR, 10SS, 30SS,
50SS, LS1, and LS2) and 4 (2C, HB, LS4, and FF) of the 11 stages, respectively
(Table 3.3). Fau was rated the worst gene in 5 stages (2-cell, high blastula, 50-somite
and larval stages 3 and 4), whereas Gapdh and 18S rRNA were classified as the least
stable genes in two stages each (germ ring and 30-somite, and 10-somite and larval
stage 1, respectively, Table 3.3). When the data from all stages were combined and
analyzed simultaneously, the candidate reference genes were ordered from the most
to least stable, as follows: Tubb2 > Actb > Eef2 > Fau > 18S rRNA > Gapdh.
Pairwise comparisons performed by geNorm to identify the finest combination of
genes for calculation of a normalization factor revealed that Tubb2 and Actb were the
best pair, with a joint stability value of M = 1.17 (Figure 3.4).
According to NormFinder, Tubb2, and Gapdh were found to be the most and least
stable reference genes, with stability indices of 0.633 and 1.667, respectively. The
95
overall ranking of the candidate reference genes was Tubb2 > Eef2 > Actb > Fau >
18S rRNA > Gapdh. The most stable genes were found to be Tubb2 (germ ring, 10-
and 50-somite and larval stage 1) and Actb (2-cell, high blastula and first feeding).
The genes that showed the greatest variability were 18S rRNA (10-somite, larval
stages 1 and 3) and Fau (2-cell, high blastula, 50-somite and larval stage 4)
(Table 3.4). Nevertheless, with a stability index of 0.467, Fau and Tubb2 were
selected as the best combination of genes for a two-gene normalization factor
(Figure 3.5). The NormFinder analysis of individual developmental stages was
broadly similar to the corresponding geNorm output (Table 3.3 and 3.4).
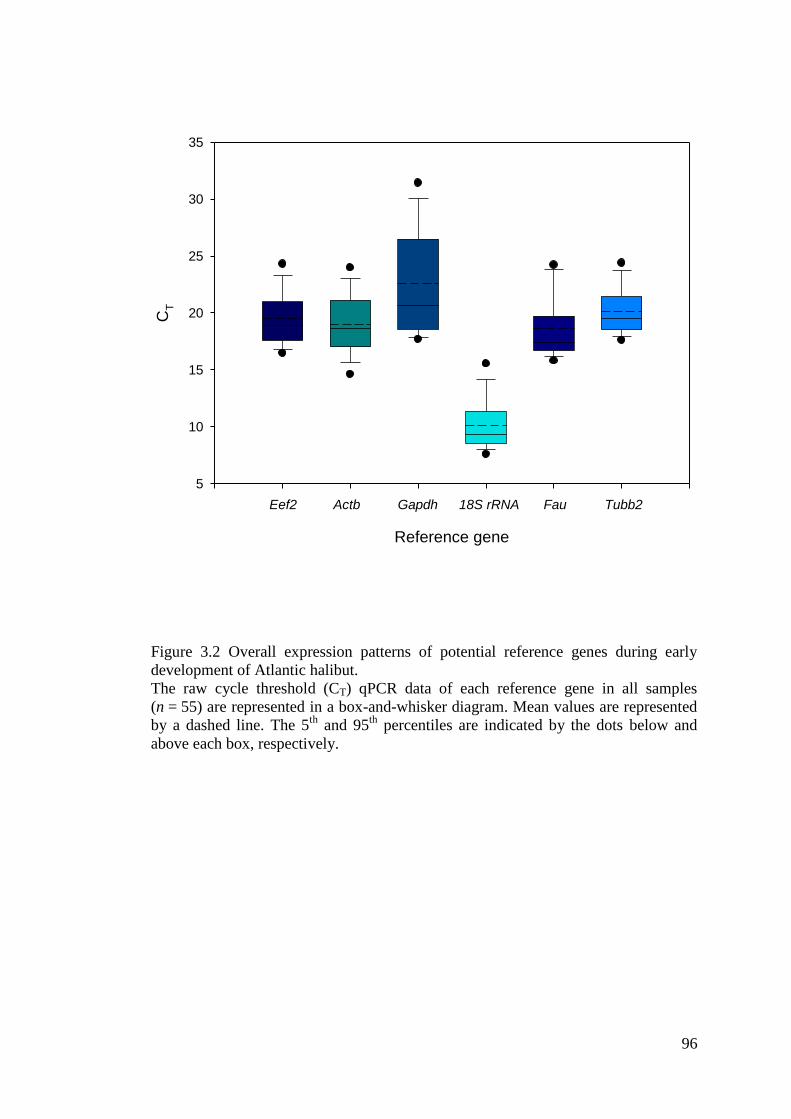
96
Reference gene
CT
5
10
15
20
25
30
35
Eef2 Actb Gapdh 18S rRNA Tubb2Fau
Figure 3.2 Overall expression patterns of potential reference genes during early
development of Atlantic halibut.
The raw cycle threshold (CT) qPCR data of each reference gene in all samples
(n = 55) are represented in a box-and-whisker diagram. Mean values are represented
by a dashed line. The 5th
and 95th
percentiles are indicated by the dots below and
above each box, respectively.
97
CT
12
14
16
18
20
22
24
26
28
12
14
16
18
20
22
24
26
28
CT
16
18
20
22
24
26
28
30
32
4
6
8
10
12
14
16
18
Developmental Stage
2C HB
GR
10SS
30SS
50SS
LS1
LS2
LS3
LS4 FF
CT
12
14
16
18
20
22
24
26
Developmental Stage
2C HB
GR
10SS
30SS
50SS
LS1
LS2
LS3
LS4 FF
14
16
18
20
22
24
26
28
Eef2 Actb
Gapdh 18S rRNA
Fau Tubb2
A B
C D
E F
Figure 3.3 Individual developmental expression profiles of potential reference genes.
Transcript levels of Eef2 (A), Actb (B), Gapdh (C), 18S rRNA (D), Fau (E), and
Tubb2 (F) during early development of Atlantic halibut were determined by qPCR.
Data are shown as raw cycle threshold (CT) values and represented as mean ± S.E.
(n = 5). Abbreviations: 2-cell (2C), high blastula (HB), germ ring (GR), tail bud/ 10-
somite (10SS), 30-somite (30SS), 50-somite (SS), larval stage 1 (LS1), larval stage 2
(LS2), larval stage 3 (LS3), larval stage 4 (LS4), and first feeding (FF).
.
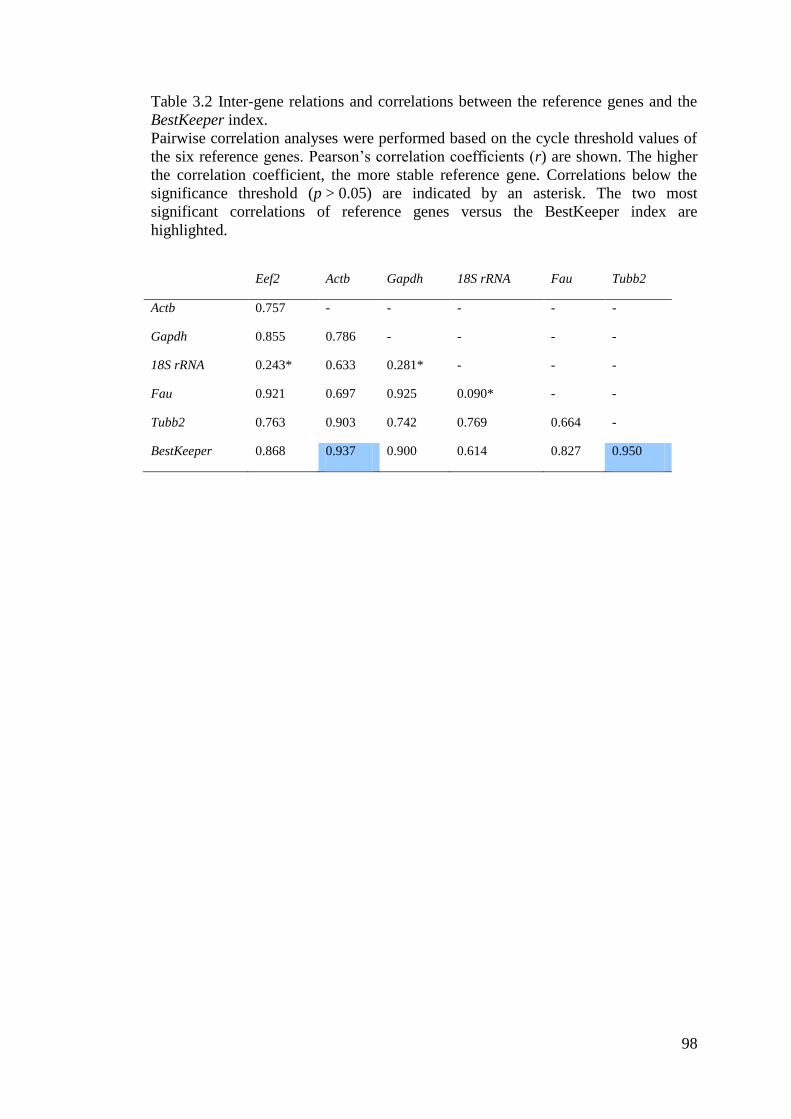
98
Table 3.2 Inter-gene relations and correlations between the reference genes and the
BestKeeper index.
Pairwise correlation analyses were performed based on the cycle threshold values of
the six reference genes. Pearson’s correlation coefficients (r) are shown. The higher
the correlation coefficient, the more stable reference gene. Correlations below the
significance threshold (p > 0.05) are indicated by an asterisk. The two most
significant correlations of reference genes versus the BestKeeper index are
highlighted.
Eef2 Actb Gapdh 18S rRNA Fau Tubb2
Actb 0.757 - - - - -
Gapdh 0.855 0.786 - - - -
18S rRNA 0.243* 0.633 0.281* - - -
Fau 0.921 0.697 0.925 0.090* - -
Tubb2 0.763 0.903 0.742 0.769 0.664 -
BestKeeper 0.868 0.937 0.900 0.614 0.827 0.950
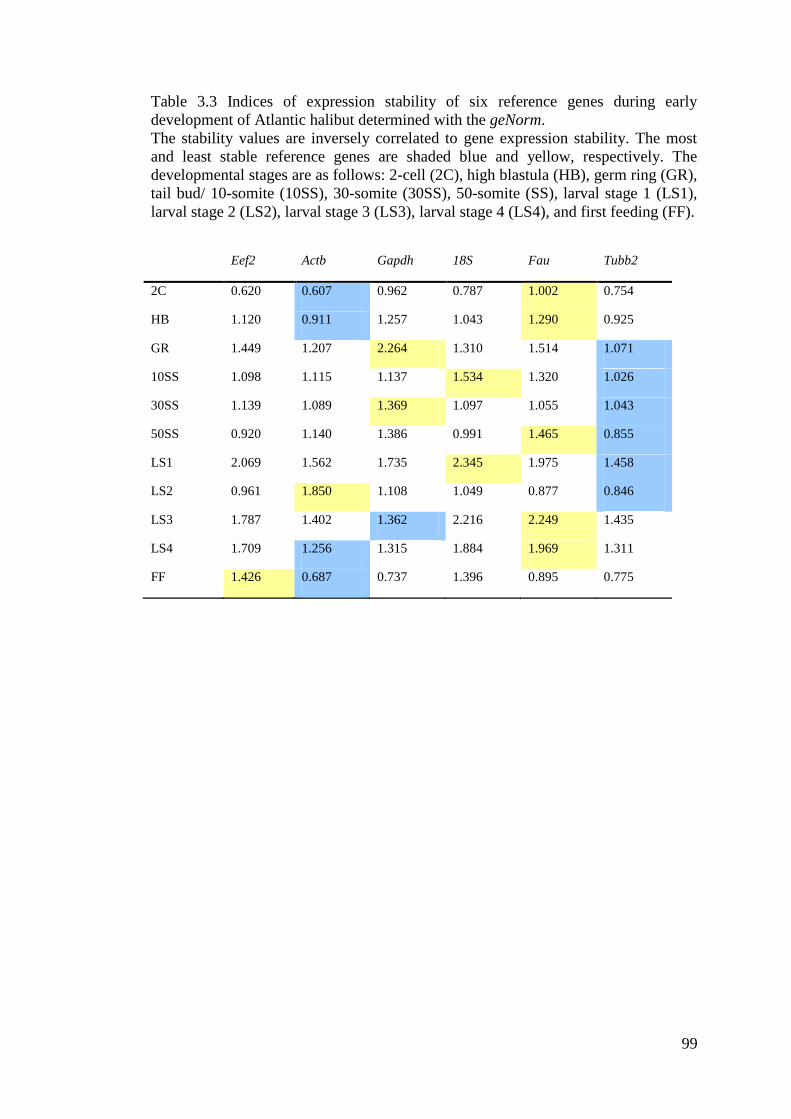
99
Table 3.3 Indices of expression stability of six reference genes during early
development of Atlantic halibut determined with the geNorm.
The stability values are inversely correlated to gene expression stability. The most
and least stable reference genes are shaded blue and yellow, respectively. The
developmental stages are as follows: 2-cell (2C), high blastula (HB), germ ring (GR),
tail bud/ 10-somite (10SS), 30-somite (30SS), 50-somite (SS), larval stage 1 (LS1),
larval stage 2 (LS2), larval stage 3 (LS3), larval stage 4 (LS4), and first feeding (FF).
Eef2 Actb Gapdh 18S Fau Tubb2
2C 0.620 0.607 0.962 0.787 1.002 0.754
HB 1.120 0.911 1.257 1.043 1.290 0.925
GR 1.449 1.207 2.264 1.310 1.514 1.071
10SS 1.098 1.115 1.137 1.534 1.320 1.026
30SS 1.139 1.089 1.369 1.097 1.055 1.043
50SS 0.920 1.140 1.386 0.991 1.465 0.855
LS1 2.069 1.562 1.735 2.345 1.975 1.458
LS2 0.961 1.850 1.108 1.049 0.877 0.846
LS3 1.787 1.402 1.362 2.216 2.249 1.435
LS4 1.709 1.256 1.315 1.884 1.969 1.311
FF 1.426 0.687 0.737 1.396 0.895 0.775
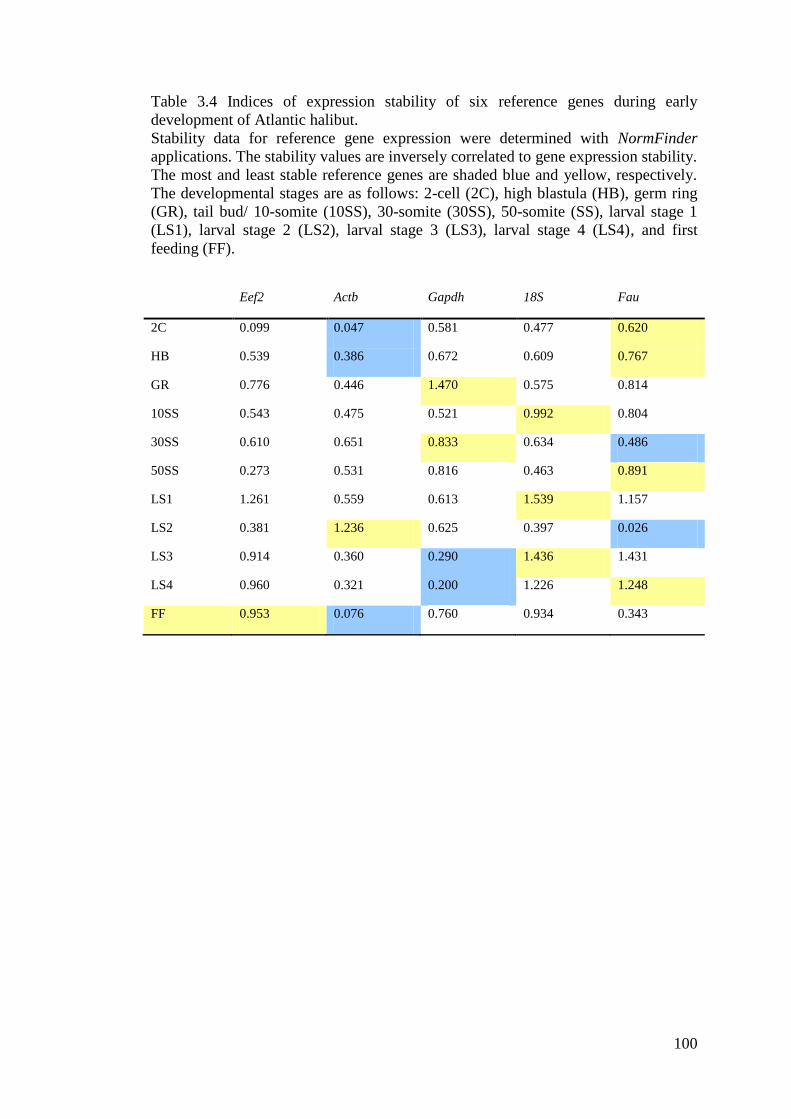
100
Table 3.4 Indices of expression stability of six reference genes during early
development of Atlantic halibut.
Stability data for reference gene expression were determined with NormFinder
applications. The stability values are inversely correlated to gene expression stability.
The most and least stable reference genes are shaded blue and yellow, respectively.
The developmental stages are as follows: 2-cell (2C), high blastula (HB), germ ring
(GR), tail bud/ 10-somite (10SS), 30-somite (30SS), 50-somite (SS), larval stage 1
(LS1), larval stage 2 (LS2), larval stage 3 (LS3), larval stage 4 (LS4), and first
feeding (FF).
Eef2 Actb Gapdh 18S Fau
2C 0.099 0.047 0.581 0.477 0.620
HB 0.539 0.386 0.672 0.609 0.767
GR 0.776 0.446 1.470 0.575 0.814
10SS 0.543 0.475 0.521 0.992 0.804
30SS 0.610 0.651 0.833 0.634 0.486
50SS 0.273 0.531 0.816 0.463 0.891
LS1 1.261 0.559 0.613 1.539 1.157
LS2 0.381 1.236 0.625 0.397 0.026
LS3 0.914 0.360 0.290 1.436 1.431
LS4 0.960 0.321 0.200 1.226 1.248
FF 0.953 0.076 0.760 0.934 0.343
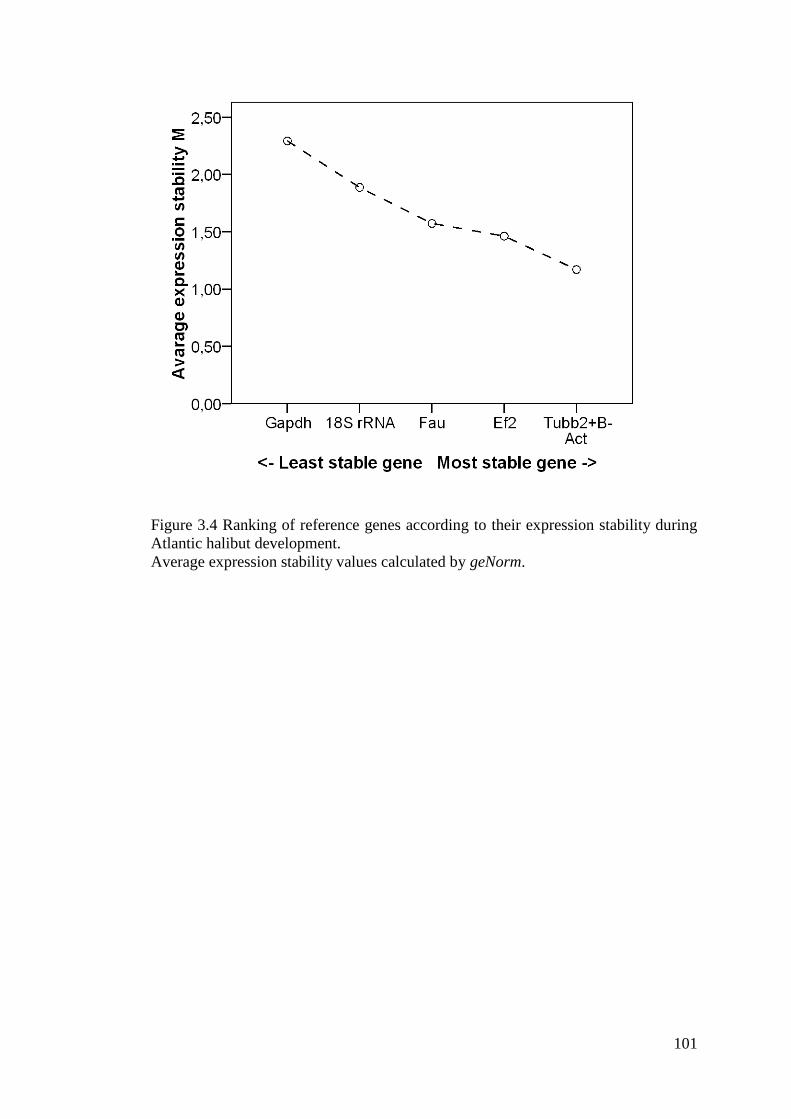
101
Figure 3.4 Ranking of reference genes according to their expression stability during
Atlantic halibut development.
Average expression stability values calculated by geNorm.
102
Figure 3.5 Ranking of reference genes according to their expression stability during
Atlantic halibut development.
Average expression stability values calculated by NormFinder.
103
3.5 Discussion
Apart from 18S rRNA, all other candidate reference genes showed significant overall
changes in expression throughout the developmental stages (Figure 3.3, D). The
observed expression profiles, characterized by lower transcript levels slowly
increasing until gastrulation and reaching a plateau by the end of somitogenesis, are
likely to correspond to activation of zygotic transcription. This transition from the
maternal to the zygotic transcript is known as the midblastula transition (MBT) in
zebrafish (Kane & Kimmel, 1993). Since transcriptional activity varies dramatically
during development, it is evident that a straightforward statistical analysis of raw CT
values is not suitable to select the best reference genes for normalization of these
qPCR data. The largest increase in expression levels throughout development was
detected for Gapdh. This regulation of Gapdh during Atlantic halibut embryogenesis
contrasts sharply to the pattern observed in zebrafish. Gapdh expression in zebrafish
embryos is negligible during gastrulation and somatogenesis, increasing only during
the pharyngula period and at hatching (Tang et al., 2007).
The qPCR data set was analyzed with BestKeeper (Pfaffl et al., 2004), geNorm
(Vandesompele et al., 2002), and Normfinder (Andersen et al., 2004) since there is
no single accepted method to examine gene expression stability. In addition, different
statistical methods can potentially yield discrepant results. Validating the reference
genes using several applications and identifying differences and similarities between
the outputs of alternative software, makes the consensus conclusions more reliable.
BestKeeper defined 18S rRNA to be the least suitable gene (r = 0.614, p = 0.001),
despite showing a regular mean expression level throughout development
(Figure 3.3, D). This apparent discrepancy is due to the different expression pattern
104
of 18S rRNA when compared to the other potential reference genes, since the
BestKeeper (Pfaffl et al., 2004) and geNorm (Vandesompele et al., 2002) algorithms
assume that the expression ratio of two ideal reference genes is identical in all
samples.
There was a statistically significant correlation between Gapdh and the BestKeeper
index (r = 0.900, Table 3.2), since Gapdh expression levels correlated well with all
other reference genes except 18S rRNA. This result is inconsistent with the geNorm
or NormFinder conclusions. The latter identified Gapdh as the least suitable
reference gene based on its unstable expression pattern during embryonic
development and large intra-group variation, respectively. Gapdh seems to be
inappropriate for normalization of these qPCR data, in accordance to the marked
changes observed in Gapdh transcript levels during Atlantic halibut development
(Figure 3.3, C). The instability of Gapdh has been reported in numerous other
systems, including Atlantic salmon smoltification (Olsvik et al., 2005) and zebrafish
embryonic development (Tang et al., 2007). The differential regulation of Gapdh is
probably connected to its direct role in S phase-dependent histone H2B transcription
(Zheng et al., 2003). 18S rRNA was also classified as one of the worst candidate
reference genes for developmental studies in Atlantic halibut, despite showing a
relatively low variation across all samples (Figure 3.3, D). Since rRNA molecules are
the major constituents of total RNA, it is unsurprising that they correlate well with
the total RNA mass. However, the use of rRNA as endogenous controls for qPCR
has been criticized (Vandesompele et al., 2002), since they do not always represent
the mRNA fraction (Solanas et al., 2001) and their high abundance makes it difficult
to accurately subtract the baseline value for qPCR data analysis.
105
The use of a normalization factor based on the geometric average of the best
reference genes is generally recommended, since the variation in the average of
multiple genes tends to be smaller than the variation in individual genes
(Vandesompele et al., 2002 ; Andersen et al., 2004). According to geNorm, the best
gene pair for calculation of a normalization factor is Tubb2/Actb (Figure 3.4),
whereas NormFinder indicates that Tubb2/Fau are the best genes for computation of
the two-gene normalization factor (Figure 3.5). Fau, which codes for the ribosomal
protein S30 fused to a ubiquitin-like protein (Kas et al., 1992), shows an overall
stability similar to Actb and less intra-group variation (Figure 3.3, E). As a
consequence, the geometric mean of Tubb2 and Fau might be more appropriate,
since these two genes belong to distinct functional classes (Table 3.1) and are thus
less likely to be co-regulated. geNorm tends to select for genes with most similar
expression profiles across the whole data set (Vandesompele et al., 2002), making
this pairwise method sensitive to co-regulation of reference genes (Andersen et al.,
2004).
The general consensus from BestKeeper, geNorm, and NormFinder is that the most
adequate reference gene for developmental studies in Atlantic halibut is Tubb2, an
isoform of the β2-Tubulin subunit, which is a major constituent of microtubule
polymers (Cleveland & Sullivan, 1985). Microtubule arrays are vital to many
developmental processes, including the epibolic movements that occur during
gastrulation (Solnica-Krezel & Driever, 1994) and the cohesion of post-cytokinesis
blastomeres in zebrafish (Jesuthasan, 1998). BestKeeper and geNorm analyses
classified Actb as being the second most stable reference gene in this study. This
result is in agreement with a previous report (Tang et al., 2007), which showed that
Actb is one of the most suitable reference genes for qPCR expression studies during

106
zebrafish development. However, this paper by Tang et al. (2007) did not examine
the potential of tubulin as a reference gene, since the primers used were not specific
enough.
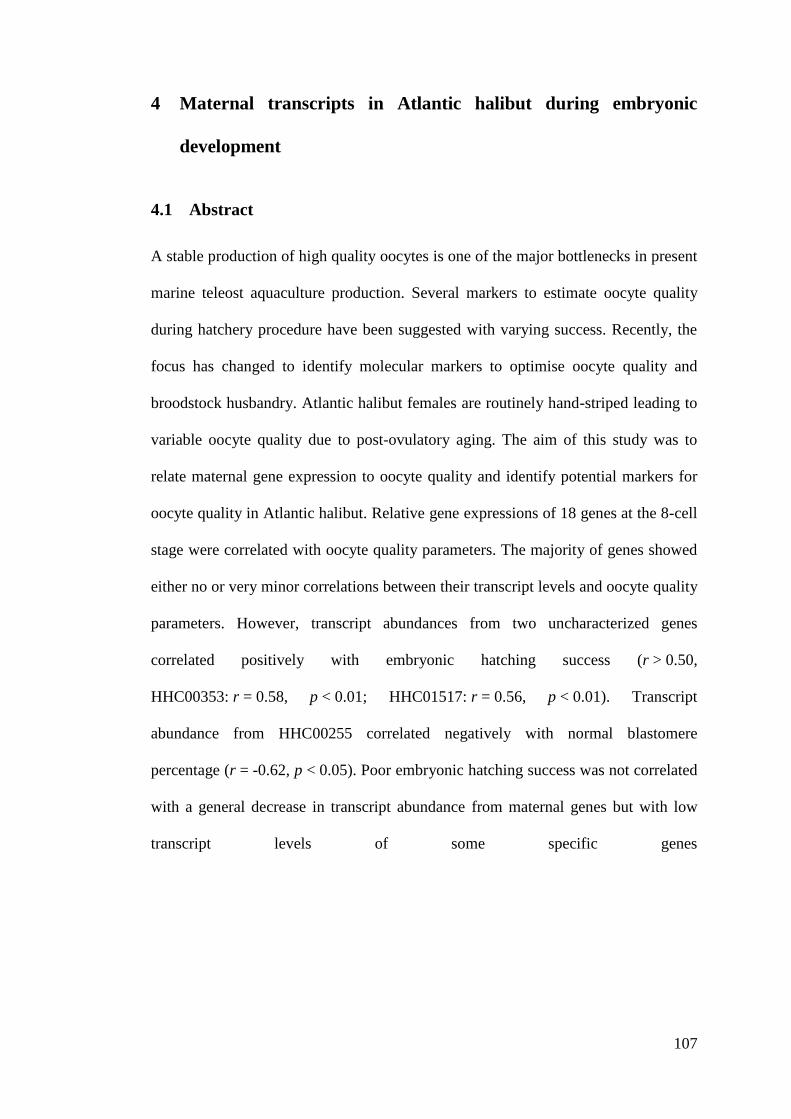
107
4 Maternal transcripts in Atlantic halibut during embryonic
development
4.1 Abstract
A stable production of high quality oocytes is one of the major bottlenecks in present
marine teleost aquaculture production. Several markers to estimate oocyte quality
during hatchery procedure have been suggested with varying success. Recently, the
focus has changed to identify molecular markers to optimise oocyte quality and
broodstock husbandry. Atlantic halibut females are routinely hand-striped leading to
variable oocyte quality due to post-ovulatory aging. The aim of this study was to
relate maternal gene expression to oocyte quality and identify potential markers for
oocyte quality in Atlantic halibut. Relative gene expressions of 18 genes at the 8-cell
stage were correlated with oocyte quality parameters. The majority of genes showed
either no or very minor correlations between their transcript levels and oocyte quality
parameters. However, transcript abundances from two uncharacterized genes
correlated positively with embryonic hatching success (r > 0.50,
HHC00353: r = 0.58, p < 0.01; HHC01517: r = 0.56, p < 0.01). Transcript
abundance from HHC00255 correlated negatively with normal blastomere
percentage (r = -0.62, p < 0.05). Poor embryonic hatching success was not correlated
with a general decrease in transcript abundance from maternal genes but with low
transcript levels of some specific genes
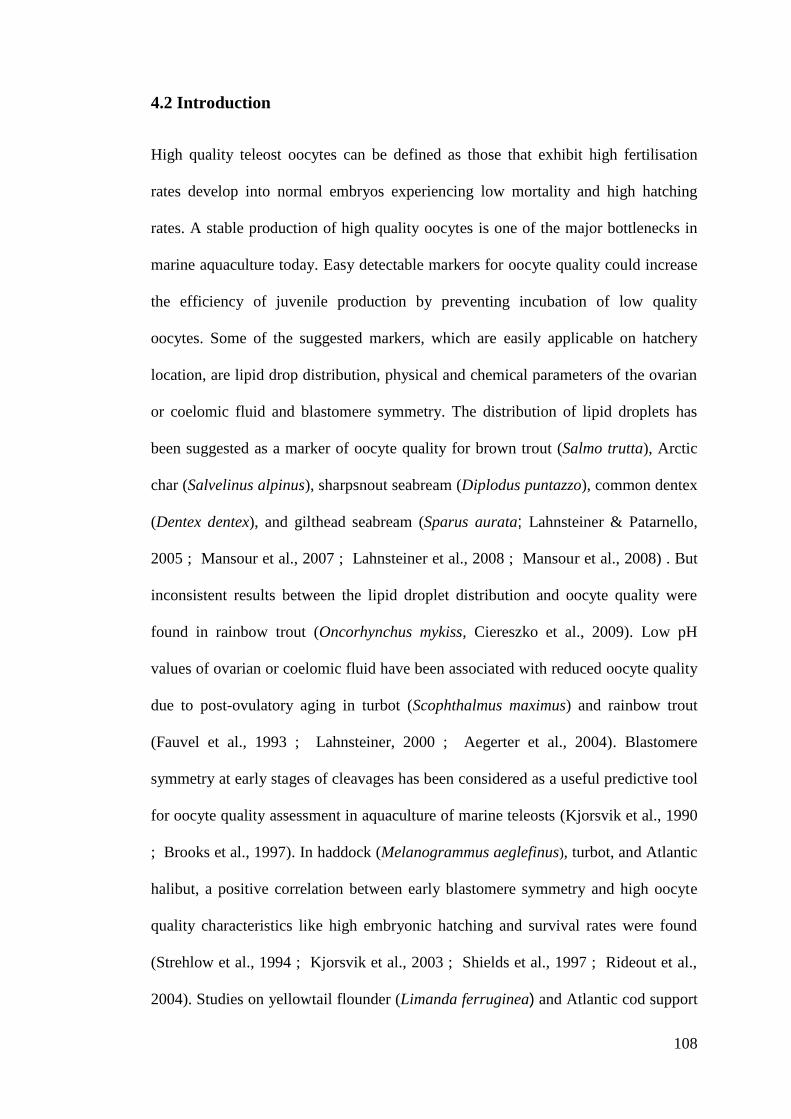
108
4.2 Introduction
High quality teleost oocytes can be defined as those that exhibit high fertilisation
rates develop into normal embryos experiencing low mortality and high hatching
rates. A stable production of high quality oocytes is one of the major bottlenecks in
marine aquaculture today. Easy detectable markers for oocyte quality could increase
the efficiency of juvenile production by preventing incubation of low quality
oocytes. Some of the suggested markers, which are easily applicable on hatchery
location, are lipid drop distribution, physical and chemical parameters of the ovarian
or coelomic fluid and blastomere symmetry. The distribution of lipid droplets has
been suggested as a marker of oocyte quality for brown trout (Salmo trutta), Arctic
char (Salvelinus alpinus), sharpsnout seabream (Diplodus puntazzo), common dentex
(Dentex dentex), and gilthead seabream (Sparus aurata; Lahnsteiner & Patarnello,
2005 ; Mansour et al., 2007 ; Lahnsteiner et al., 2008 ; Mansour et al., 2008) . But
inconsistent results between the lipid droplet distribution and oocyte quality were
found in rainbow trout (Oncorhynchus mykiss, Ciereszko et al., 2009). Low pH
values of ovarian or coelomic fluid have been associated with reduced oocyte quality
due to post-ovulatory aging in turbot (Scophthalmus maximus) and rainbow trout
(Fauvel et al., 1993 ; Lahnsteiner, 2000 ; Aegerter et al., 2004). Blastomere
symmetry at early stages of cleavages has been considered as a useful predictive tool
for oocyte quality assessment in aquaculture of marine teleosts (Kjorsvik et al., 1990
; Brooks et al., 1997). In haddock (Melanogrammus aeglefinus), turbot, and Atlantic
halibut, a positive correlation between early blastomere symmetry and high oocyte
quality characteristics like high embryonic hatching and survival rates were found
(Strehlow et al., 1994 ; Kjorsvik et al., 2003 ; Shields et al., 1997 ; Rideout et al.,
2004). Studies on yellowtail flounder (Limanda ferruginea) and Atlantic cod support
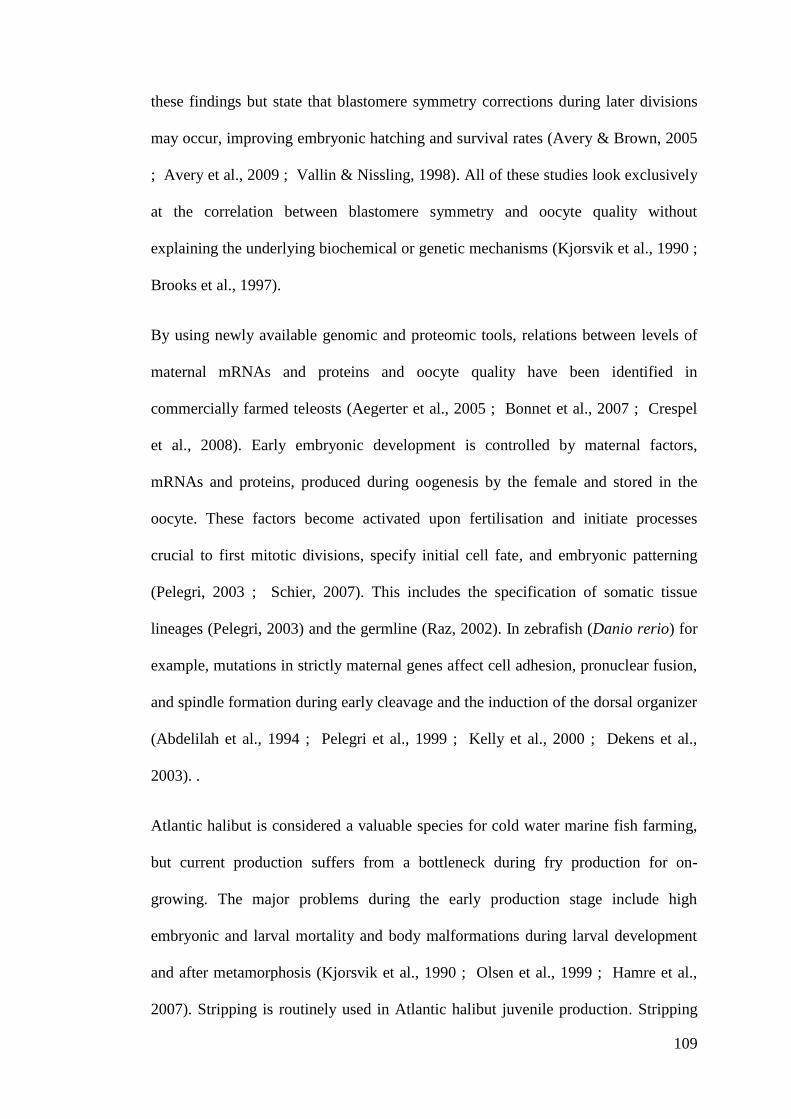
109
these findings but state that blastomere symmetry corrections during later divisions
may occur, improving embryonic hatching and survival rates (Avery & Brown, 2005
; Avery et al., 2009 ; Vallin & Nissling, 1998). All of these studies look exclusively
at the correlation between blastomere symmetry and oocyte quality without
explaining the underlying biochemical or genetic mechanisms (Kjorsvik et al., 1990 ;
Brooks et al., 1997).
By using newly available genomic and proteomic tools, relations between levels of
maternal mRNAs and proteins and oocyte quality have been identified in
commercially farmed teleosts (Aegerter et al., 2005 ; Bonnet et al., 2007 ; Crespel
et al., 2008). Early embryonic development is controlled by maternal factors,
mRNAs and proteins, produced during oogenesis by the female and stored in the
oocyte. These factors become activated upon fertilisation and initiate processes
crucial to first mitotic divisions, specify initial cell fate, and embryonic patterning
(Pelegri, 2003 ; Schier, 2007). This includes the specification of somatic tissue
lineages (Pelegri, 2003) and the germline (Raz, 2002). In zebrafish (Danio rerio) for
example, mutations in strictly maternal genes affect cell adhesion, pronuclear fusion,
and spindle formation during early cleavage and the induction of the dorsal organizer
(Abdelilah et al., 1994 ; Pelegri et al., 1999 ; Kelly et al., 2000 ; Dekens et al.,
2003). .
Atlantic halibut is considered a valuable species for cold water marine fish farming,
but current production suffers from a bottleneck during fry production for on-
growing. The major problems during the early production stage include high
embryonic and larval mortality and body malformations during larval development
and after metamorphosis (Kjorsvik et al., 1990 ; Olsen et al., 1999 ; Hamre et al.,
2007). Stripping is routinely used in Atlantic halibut juvenile production. Stripping
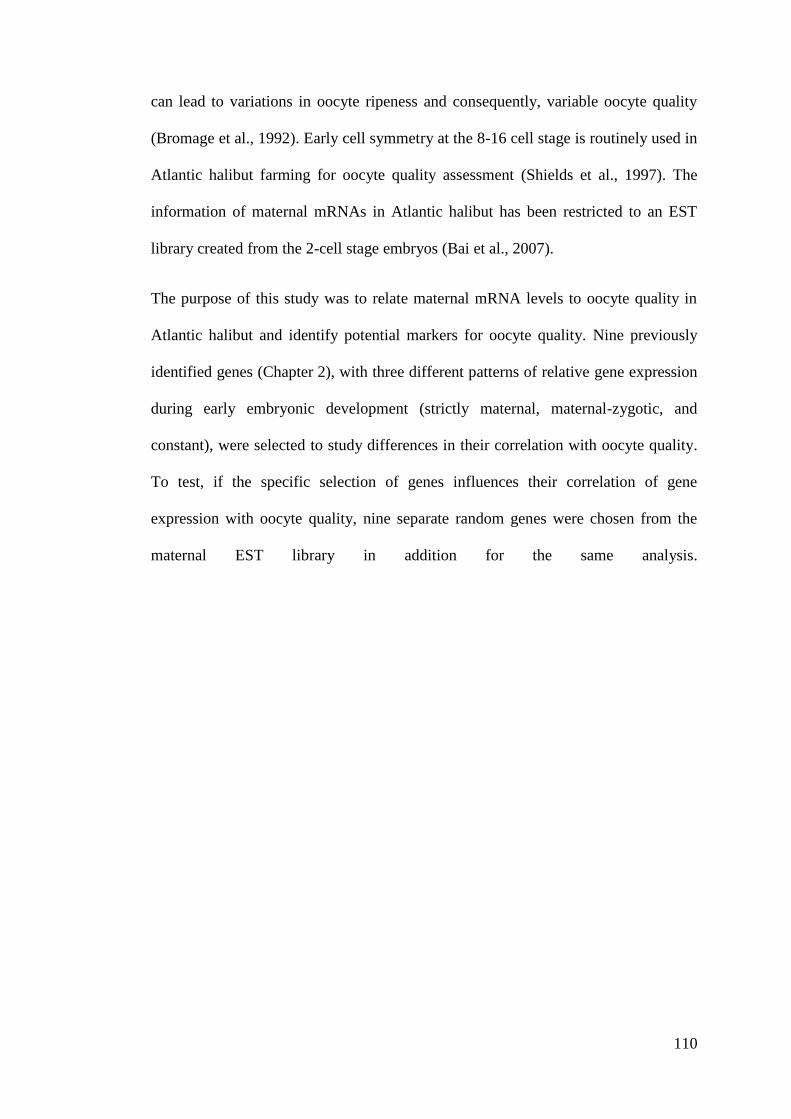
110
can lead to variations in oocyte ripeness and consequently, variable oocyte quality
(Bromage et al., 1992). Early cell symmetry at the 8-16 cell stage is routinely used in
Atlantic halibut farming for oocyte quality assessment (Shields et al., 1997). The
information of maternal mRNAs in Atlantic halibut has been restricted to an EST
library created from the 2-cell stage embryos (Bai et al., 2007).
The purpose of this study was to relate maternal mRNA levels to oocyte quality in
Atlantic halibut and identify potential markers for oocyte quality. Nine previously
identified genes (Chapter 2), with three different patterns of relative gene expression
during early embryonic development (strictly maternal, maternal-zygotic, and
constant), were selected to study differences in their correlation with oocyte quality.
To test, if the specific selection of genes influences their correlation of gene
expression with oocyte quality, nine separate random genes were chosen from the
maternal EST library in addition for the same analysis.
111
Material and methods
4.1.1 Fish husbandry and sample collection
Oocytes samples were collected from Atlantic halibut females at two different
locations in Norway. Four batches were sampled from a commercial farm
(Risørfisk AS, Risør, Norway) in 2007 and 25 batches at Bodø University College,
Bodø, Norway in 2006, 2008, and 2009 (Table 4.1). All oocytes were fertilised in
vitro with pooled sperm from two random males. At 8-cell stage, samples (n = 100)
from each batch were wrapped in tinfoil and snap-frozen in liquid nitrogen until
further analysis. In 2006, some females were kept under natural photoperiod
conditions and fed herring for human consumption (winter herring) stuffed with Fish
Breed-M (1:1, INVE Aquaculture NV, Dendermonde, Belgium). Other females, kept
under photoperiod advanced of approximately 1 month, were fed Fish Breed-M.
Eight batches were incubated in large scale incubators (250 l). Relative fertilisation
(%) was estimated by incubating egg samples in triplicates (approximately 100
oocytes per replicate) in Petri dishes at temperature between 5.0 -5.4 ºC overnight to
estimate relative fertilisation (%) at the 8-cell stage. Relative embryonic hatching
(%) was estimated by daily volumetric measurements of dead embryos from
incubators from fertilisation until hatching. In 2008 and 2009, all females were kept
under natural photoperiod and fed Fish Breed-M. Seventeen batches were incubated
in Petri dishes, at 5.5 ± 0.5 °C in 33 ‰ filtered seawater, added Penicillin-
Streptomycin-Neomycin solution (5000 Units Penicillin, 5 mg Streptomycin, and
10 mg Neomycin per ml, Sigma, St. Louise, Mo, USA). Relative fertilisation was
estimated at 8-cell stage. The water in the Petri dishes was changed after GR stage.
To estimate relative hatching, dead embryos were counted and removed every
second day until hatching. For 14 batches, blastomere symmetry was estimated at the
112
8-cell stage (n = 39). Regular blastomere cleavage and abnormalities in blastomeres
were estimated according to Shields et al. (1997, Figure 4.1).
4.1.2 RNA extraction and cDNA synthesis
Total RNA for all samples were extracted according to the Tri reagent method
(Sigma, St-Louise, MO USA) using QIAazol (Qiagen, Nydalen, Sweden). Total
RNA was treated with the gDNA wipeout buffer supplied with the QuantiTect
reverse transcription kit (Qiagen) to remove traces of genomic DNA contamination.
RNA concentration was quantified using the Nanodrop spectrophotometer
(Nanodrop Technologies/Saven Werner, Kristiansand, Norway). All samples had
absorbance ratios 260/280 nm greater than 1.9, indicative of high purity RNA. cDNA
was synthesized with the QuantiTect reverse transcription kit (Qiagen).
4.1.3 Relative gene expression by quantitative-real time PCR (qPCR)
Nine previously identified genes (Chapter 2) with three different patterns of relative
gene expression, strictly maternal, maternal-zygotic, and constant, were selected to
test if their gene expression was related to Atlantic halibut oocyte quality (Table 4.2).
Their gene expression was estimated in twenty-nine Atlantic halibut batches at the 8-
cell stage. In addition, 9 separate random genes from the maternal EST library were
chosen for the same analysis (Table 4.3). Whenever possible, primers were designed
across the most conserved splice junctions. All gene specific primers crossed at least
one intron/exon border containing both donor and acceptor sites, in order to avoid
amplification of any contaminating genomic DNA. Primer pairs for qPCR
amplification were designed manually and screened for hairpins, homo- and cross-
dimers using Netprimer (http://www.premierbiosoft.com/netprimer/; (Table 4.4). To
113
confirm that the right product was amplified, a qPCR was performed on pooled
cDNA for each primer pair. The different products were sequenced directly for
additional verification. Each sample was checked for genomic DNA contamination
by running a qPCR with RNA treated with gDNA whipeout buffer (Qiagen). Gene
amplifications by qPCR were performed with a LightCycler 480 thermocycler
(Roche, Basel, Switzerland). Each 10 μl reaction in a 96-well plate comprised 4 μl of
70 x diluted cDNA template, 1 μl of each primer pair at 5 μM and 5 μl of QuantiTect
SYBR Green containing ROX as reference dye (Qiagen). After an initial
denaturation step of 15 min at 95 ºC, 45 cycles of amplification were performed
according to the following thermal cycles: denaturation for 15 s at 94 ºC, annealing
for 20 s at 60 ºC and extension for 20 s at 72 ºC. Fluorescence data were acquired
during this last step. A dissociation protocol with a gradient from 65 to 97 ºC was
used to investigate the specificity of the qPCR reaction and the presence of primer
dimers. All samples were run in duplicate along with minus reverse transcriptase, no
template and a positive plate controls. Five-point standard curves of a 5-fold dilution
series (1:2-1:16) from pooled cDNA were used for PCR efficiency calculation. To
assess suitable reference genes for the qPCR studies the known reference genes
elongation factor 2 (Eef2), β2-tubulin (Tubb2), β-Actin (Actb), HHC01138,
HHC1517, and HHC00353 were tested as described in Chapter 2.2.5. Tubb2 and
Actb were selected for normalisation (Figure 4.2). According to GeNorm these genes
were rather stable and, therefore, expression profiles were normalized assuming a
similar quantity of total RNA for all studied stages. Nevertheless, there might be
some variation in total RNA levels per embryo during early development.
114
4.1.4 Data analysis and Statistics
Statistical analysis was performed using SPSS 15.0 (SPSS Inc., Chicago, IL, USA).
Pearson’s correlation coefficient was estimated between gene expression and egg
batch performance parameters. Fertilisation, embryonic hatching, and blastomere
symmetry percentages were arc sin square roots transformed before correlation
analysis (Zar, 1999). Statistical significance was established at p < 0.05.
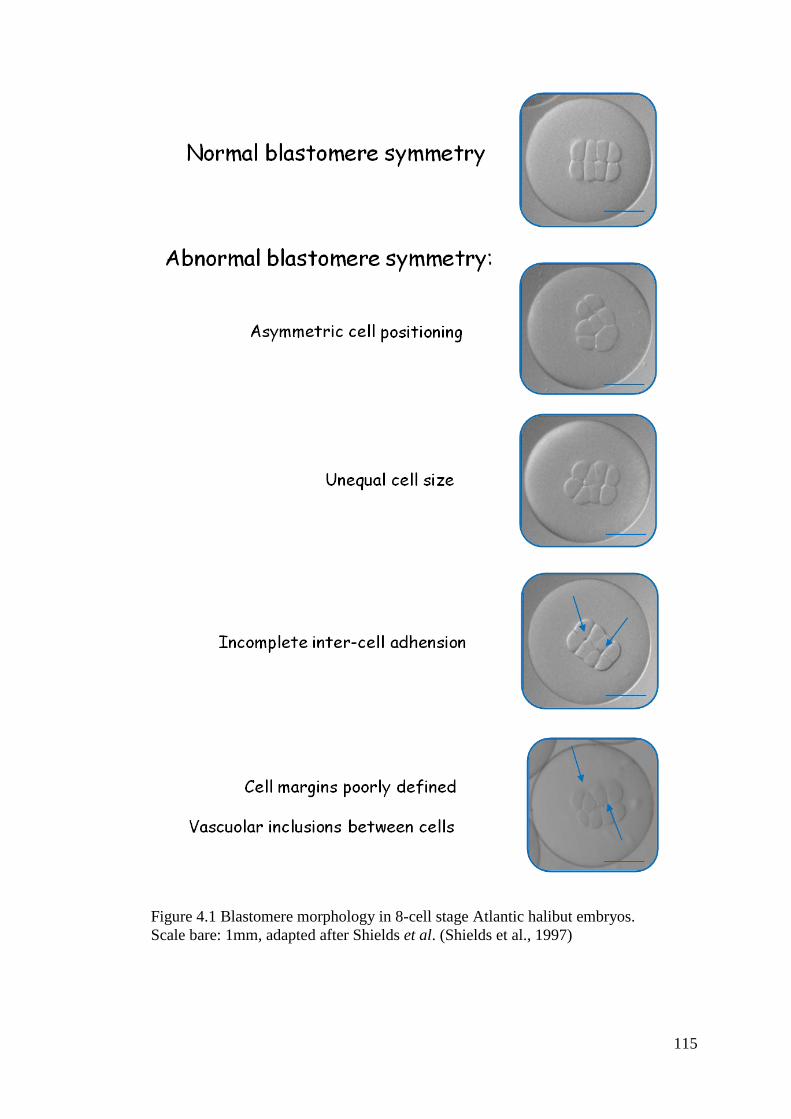
115
Figure 4.1 Blastomere morphology in 8-cell stage Atlantic halibut embryos.
Scale bare: 1mm, adapted after Shields et al. (Shields et al., 1997)
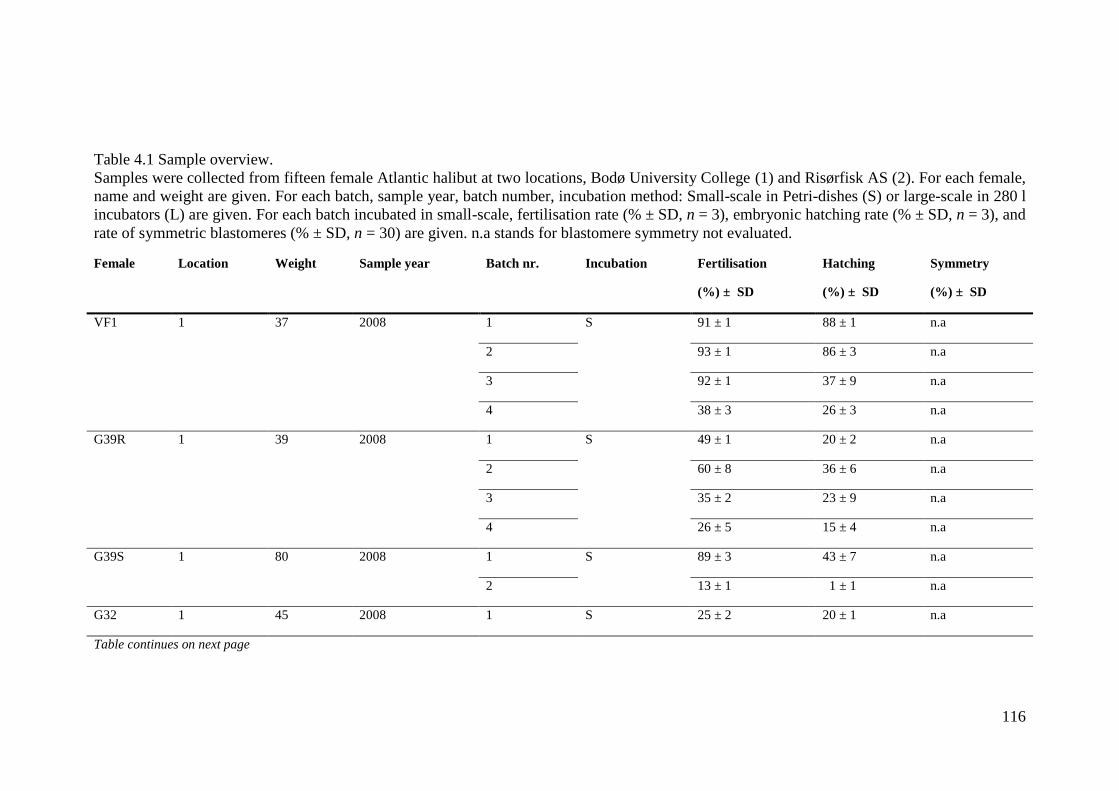
116
Table 4.1 Sample overview.
Samples were collected from fifteen female Atlantic halibut at two locations, Bodø University College (1) and Risørfisk AS (2). For each female,
name and weight are given. For each batch, sample year, batch number, incubation method: Small-scale in Petri-dishes (S) or large-scale in 280 l
incubators (L) are given. For each batch incubated in small-scale, fertilisation rate (% ± SD, n = 3), embryonic hatching rate (% ± SD, n = 3), and
rate of symmetric blastomeres (% ± SD, n = 30) are given. n.a stands for blastomere symmetry not evaluated.
Female Location Weight Sample year Batch nr. Incubation Fertilisation
(%) ± SD
Hatching
(%) ± SD
Symmetry
(%) ± SD
VF1 1 37 2008 1 S 91 ± 1 88 ± 1 n.a
2 93 ± 1 86 ± 3 n.a
3 92 ± 1 37 ± 9 n.a
4 38 ± 3 26 ± 3 n.a
G39R 1 39 2008 1 S 49 ± 1 20 ± 2 n.a
2 60 ± 8 36 ± 6 n.a
3 35 ± 2 23 ± 9 n.a
4 26 ± 5 15 ± 4 n.a
G39S 1 80 2008 1 S 89 ± 3 43 ± 7 n.a
2 13 ± 1 1 ± 1 n.a
G32 1 45 2008 1 S 25 ± 2 20 ± 1 n.a
Table continues on next page
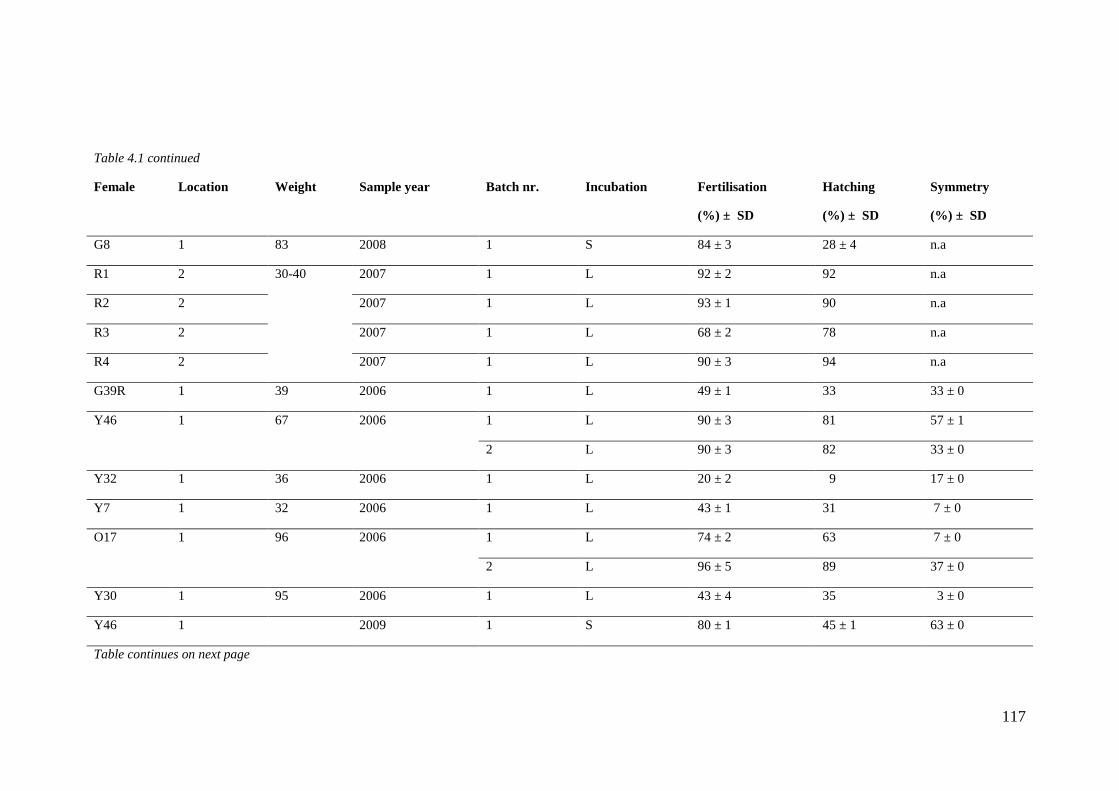
117
Table 4.1 continued
Female Location Weight Sample year Batch nr. Incubation Fertilisation
(%) ± SD
Hatching
(%) ± SD
Symmetry
(%) ± SD
G8 1 83 2008 1 S 84 ± 3 28 ± 4 n.a
R1 2 30-40 2007 1 L 92 ± 2 92 n.a
R2 2 2007 1 L 93 ± 1 90 n.a
R3 2 2007 1 L 68 ± 2 78 n.a
R4 2 2007 1 L 90 ± 3 94 n.a
G39R 1 39 2006 1 L 49 ± 1 33 33 ± 0
Y46
1 67 2006 1 L 90 ± 3 81 57 ± 1
2 L 90 ± 3 82 33 ± 0
Y32 1 36 2006 1 L 20 ± 2 9 17 ± 0
Y7 1 32 2006 1 L 43 ± 1 31 7 ± 0
O17 1 96 2006 1 L 74 ± 2 63 7 ± 0
2 L 96 ± 5 89 37 ± 0
Y30 1 95 2006 1 L 43 ± 4 35 3 ± 0
Y46 1 2009 1 S 80 ± 1 45 ± 1 63 ± 0
Table continues on next page
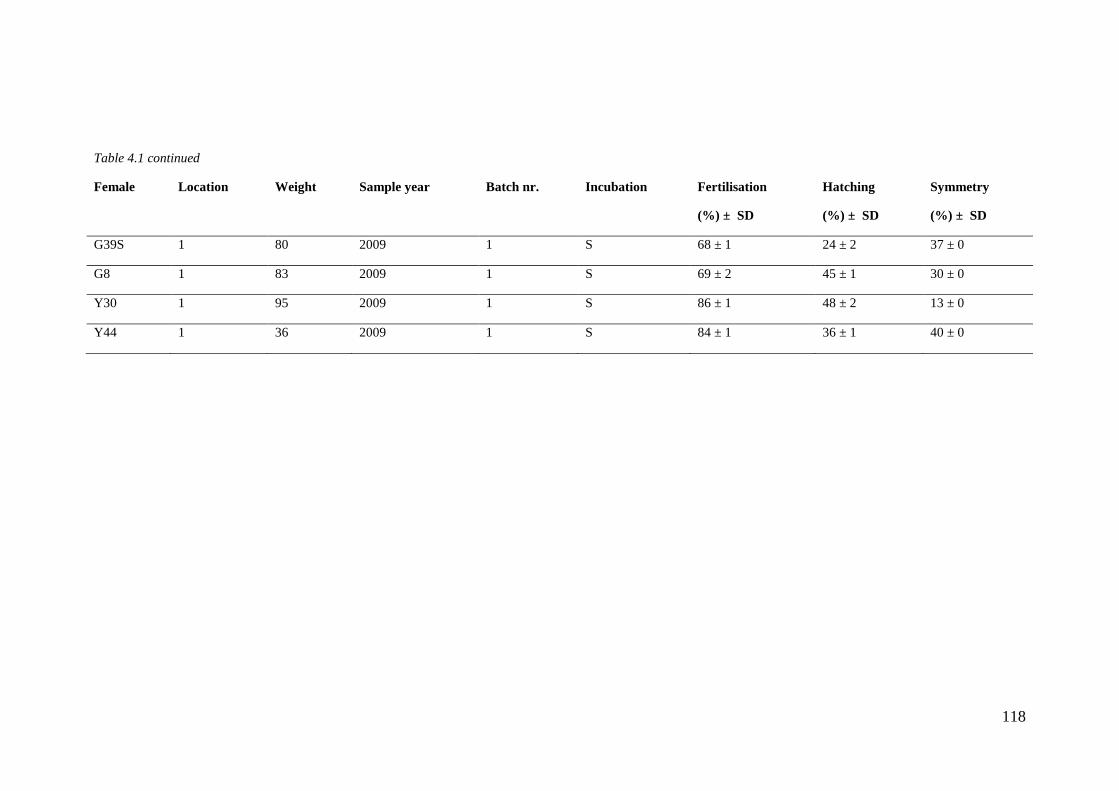
118
Table 4.1 continued
Female Location Weight Sample year Batch nr. Incubation Fertilisation
(%) ± SD
Hatching
(%) ± SD
Symmetry
(%) ± SD
G39S 1 80 2009 1 S 68 ± 1 24 ± 2 37 ± 0
G8 1 83 2009 1 S 69 ± 2 45 ± 1 30 ± 0
Y30 1 95 2009 1 S 86 ± 1 48 ± 2 13 ± 0
Y44 1 36 2009 1 S 84 ± 1 36 ± 1 40 ± 0
119
Table 4.2 List of selected genes used for quantification of gene expression in 29 Atlantic halibut oocyte batches.
The genes have been selected form an initial screening of a maternal EST library. Gene name, BLASTX results, gene accession nr, E-value from
BLASTX search, and function.
Name Accession E-value Function
Askopos Q5YCX2 6e-14 Primordial germ cells
si:dkey-30j22.9 XM_688932.3 6e-37 Uncharacterized protein
Tudor 5 protein BC134985.1 1e-12 Primordial germ cells and normal abdominal segmentation
Prohibitin 2 NM_001141404.1 5e-30 Transcription regulation
HHC00057 7e-04 Cell division
HHC00130 9e-16 Cytoskeleton
HHC00255 5e-50 Cytokinesis
HHC00353 XP_870795 1e-11 Transport
HHC01517 NM_001099229 8e-14 Protein-protein interaction
120
Table 4.3 List of random genes used for quantification of gene expression in 29 Atlantic halibut oocyte batches.
The genes have been randomly selected form the same maternal EST library as genes in table 4.1. Gene name, BLASTX results, gene accession
nr, E-value from BLASTX search, and function are given.
Name BLASTX results (Species) Accession E-value Function
HHC00005 profilin 2 like protein (Danio rerio) CAN88191 3e-06 Cytoskeleton
HHC00036 unnamed protein product (Tetraodon nigroviridis) CAF92632 7.2 Uncharacterized
HHC00106 creatine kinase 1 (Paralichthys olivaceus) ABU42561 2e-102 Metabolism
HHC00223 RNA binding protein with multiple splicing 2 (Danio rerio) NP_956553 1e-59 RNA binding
HHC00189 similar to Lamina-associated polypeptide 2 isoform alpha (Danio rerio) XP_001921942 3e-16 Cell division
HHC01032 unnamed protein product (Tetraodon nigroviridis) CAG12058 5e-53 Uncharacterized
HHC01306 SH3-domain GRB2-like endophilin B2 (Danio rerio) CAM15470 1e-73 Apoptosis
HHC01385 caprin family member 2 (Danio rerio) NP_001013291 4e-20 RNA translation
HHC01481 hypothetical protein LOC561007 (Danio rerio) NP_001122176 8e-70 Uncharacterized
121
Table 4.4 Primer information of selected genes.
For each reference gene, primer sequences, amplicon sizes, reaction efficiencies (E), and Pearson’s coefficients of determination (R2) are shown.
Name Forward Reverse Size (bp) E (%) R
2
Askopos TCTGGTAGTTCCTGCGTGTGAG GCTCTTCAACCTCATCACCCA 55 104 0.998
Sidkey-30j22.9 GCAAGGTGTCACTCAAGGCAC GTACTTCAGACCTGTGGAGGGTT 95 102 0.999
Betaine aldehyde
dehydrogenase
GTATCCACCAAACGGCACTTC GCAGGTACTCAGGCGAGCC 50 104 0.999
Checkpoint 1 GGCAGGTACTCATTCCAATTACAG GAAACGGCTACCACATCCAAG 83 100 0.998
Prohibitin 2 GGAAGGACTACGACGAGCGAG GGGACACCTGTGCTCTCTGTG 69 99 0.999
Synthaxin 4 GATGATGAAAATGAGGACAAAGC CCCATCCTCCTCTGACTTCTTG 252 100 0.998
18K hypothetical goldfish
protein
AGTTACTTCTTCTCCCGCAAGC GATCCAACATCGAGGTCGTAAAC 122 93 0.999
HR6A TATGTTTGGACATCCTACAGAATCG CGGACTGTTGGGATTTGGTTC 58 98 0.999
Tudor 5 protein CTGTCACTCTGAGGGCTTTATCC TCTGCTGGATGTGGCTCCTC 88 100 0.997
HHC00057 CAGGTCGTCTGTTTTGCCATTC CATAAAGAAGGTGGAAGCCAGG 146 92 0.999
HHC00068 ACATCTCCTCCCACGATTCA TTGAGGAGTGCAACCCAATC 114 98 0.998
HHC00130 GGAGGGATCTTTGGTTTCTTTG CAACAAGGAGAACCGCACAG 67 99 0.998
HHC00222 TACTGTGTAGATGCCACGAAAGAG CCGTTGATGTCGTGGAGTTTG 96 97 0.999
Table 4.4 continues on next page
122
Table 4.4 continued
Name Forward Reverse Size (bp) E (%) R2
HHC00255 ATAATACATCCCAAAGCCCAGAG CACAATAAGGGGATAATACACAGAGA 198 104 0.999
HHC00309 GGACGGGGAGATTAGAGTCATC GAGCCCAAGTCCTGGTATGCC 93 105 0.998
HHC00334 CCATGAGGTAGCAGTAGAGGAAGG GCTGGTATTGTCCTGGCGAAG 115 95 0.997
HHC01010 GAAGAGAGGAAGAACATAAAGACGG CATCCCTGAGTAGAGCACACTTG 149 93 0.999
HHC01015 CCACTAGAAGTGTGTGCAAGATC CGTTTCCAGGTTTTTTGAATCC 85 97 0.998
HHC01032 CCGCATTGATGACTTTGATGTG CTGGACTCATAGTGGCTAATTCACC 143 99 0.996
HHC01194 ACTAAGACCCAGCCAGCAGAAG GGTGGAGGGAGGAGTTTCTTTG 179 99 0.999
HHC01310 TATGAGGAAGCGGTGGTTTG GAGCCTGCCCAACCTTATCAT 75 98 0.998
HHC00005 CCGAGCGGAGGGATTTAGC CAGCCATCAGGTTGTCCACG 229 99 0.998
HHC00036 TAAACGGCTCTGTTGTCCCAT GTACACGCTGTCGCTTCCAG 284 92 0.999
HHC00106 AGGCATCTGGCACAATGAGAAC CTCTCTACTTCTGGGCAGGGAT 462 89 0.999
HHC00189 GGGTGGCTTCATCTCACTTC GTTTGAACCCGTGTCGGAG 313 95 0.998
HHC00233 AACAGCCTGTCGGGTTTGTAAC GATGCTGGGATCAGTGCTGC 211 92 0.997
HHC01306 TCGGCTTTTTCCACTTCCTC GGTGGGGGAATGTGAGAGAAG 262 98 0.999
HHC01032 CTATGATGGCAAGGGTATCGG TTAGGGCTTACTAGCGAACGGG 297 99 0.998
HHC01385 GAACTACCAGAGGAGAGGGCAATC CTTACCCAAAGACCCCATCCTG 127 98 0.997
HHC01481 GGGACTCATCTCGTGGGTCT AGCAGTATTACTTGACCTCGCC 125 98 0.999
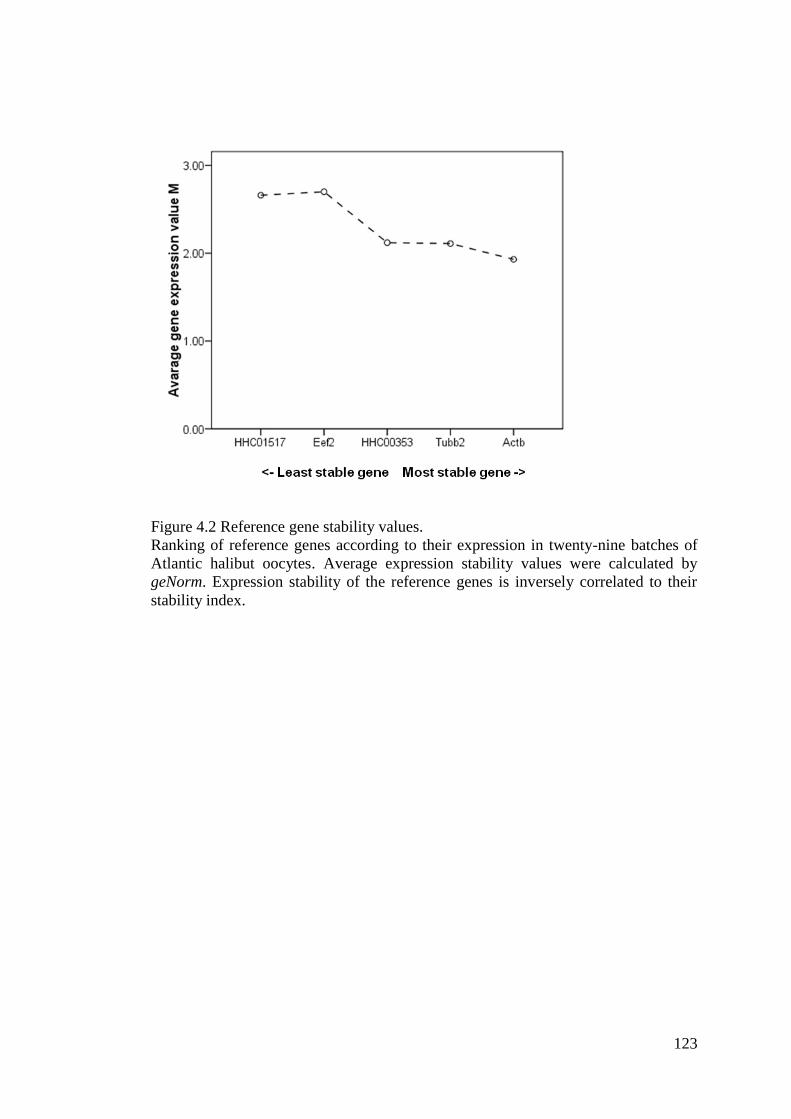
123
Figure 4.2 Reference gene stability values.
Ranking of reference genes according to their expression in twenty-nine batches of
Atlantic halibut oocytes. Average expression stability values were calculated by
geNorm. Expression stability of the reference genes is inversely correlated to their
stability index.
124
4.2 Results
The relative gene expression of 18 genes was measured in 29 different batches of 8-
cell stage Atlantic halibut embryos (Table 4.1). No significant correlations between
gene expression and fertilisation rates were found. The expression of seven genes
(39 % of total) correlated positively with embryonic hatching rates. Expressions of
the two uncharacterized genes HHC00353 and HHC01517 correlated stronger with
embryonic hatching (r > 0.5, HHC00353: r = 0.58, p < 0.01 and
HHC01517: r = 0.56, p < 0.01; Figure .4.3, A and B), compared to the other five
genes (r ≤ 0.5, kop: r = 0.38, p < 0.05; si:dkey-30j22.9: r = 0.50, p < 0.05; HHC0057:
r = 0.41, p < 0.05; HHC00130: r = 0.43, p < 0.05; HHC00255: r = 0.41, p < 0.05).
The expression of HHC00255 negatively correlated with the percentage of
symmetric blastomeres (r = -0.62, p < 0.05; Figure 4.3, C).
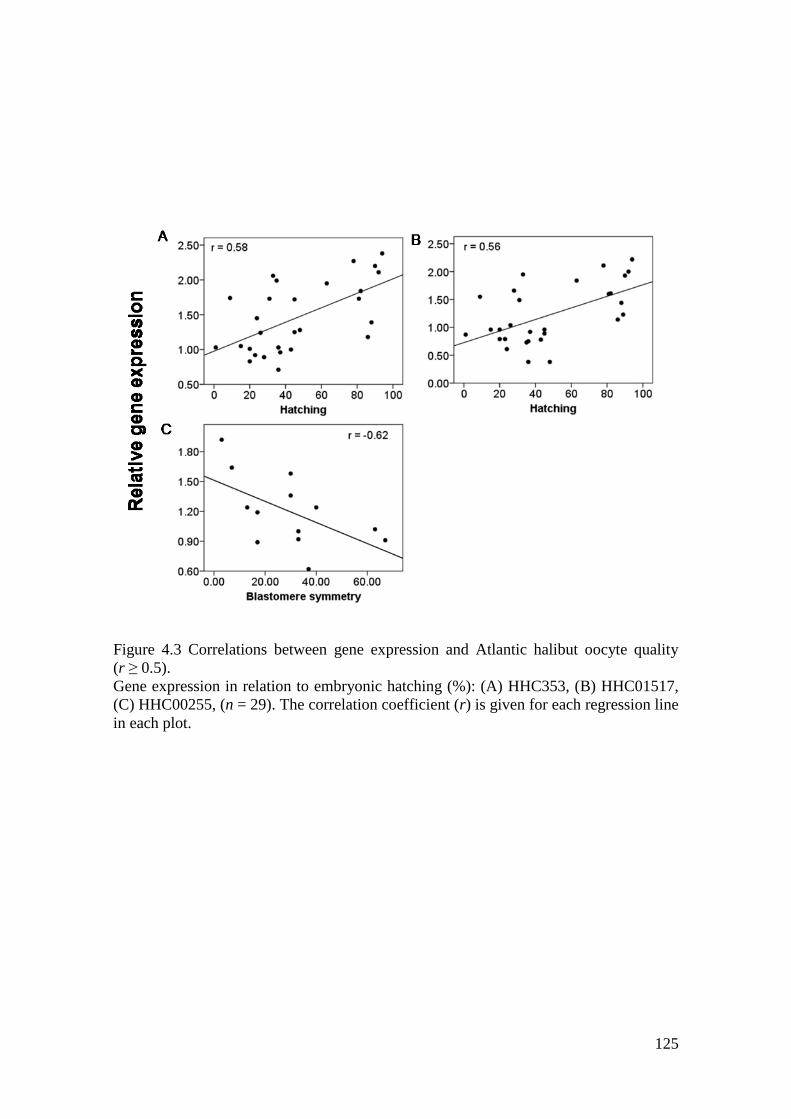
125
Figure 4.3 Correlations between gene expression and Atlantic halibut oocyte quality
(r ≥ 0.5).
Gene expression in relation to embryonic hatching (%): (A) HHC353, (B) HHC01517,
(C) HHC00255, (n = 29). The correlation coefficient (r) is given for each regression line
in each plot.
126
4.3 Discussion
In this study maternal transcript levels were related to embryonic hatching success and
normal blastomere symmetry. Acquiring a standardized experimental set-up has been
challenging due to different broodstock husbandry and incubation methods at the two
locations, as well as the change from industrial to experimental incubation at the
facilities at the University of Nordland. Hence the final heterogeneous final material
consisted of oocyte batches from different breeders, held under different feeding
conditions and photoperiods. Despite the oocyte heterogeneity significant correlations
between transcript levels and oocyte quality could be identified. The two
uncharacterized genes HHC00353 and HHC01517 correlated stronger with embryonic
hatching (r > 0.5, p < 0.01; Figure 4.3, A and B), compared to five other genes, kop,
si:dkey-30j22.9, HHC00057, HHC00130, and HHC00255 which showed statistically
significant but very minor correlations. The expression of HHC00255 negatively
correlated with the percentage of symmetric blastomeres (r > -0.5, p < 0.05;
Figure 4.3 C).
HHC00353 codes for an orthologue of an exportin 1-like protein. It is a member of the
importin β superfamily of nuclear transport receptors. Exportin 1 (XPO1) is a major
receptor for the export of proteins and RNAs out of the nucleus. XPO1 is also
implicated in various steps during mitosis (Hutten & Kehlenbach, 2007). In X. laevis
inhibitions of XPO1 activity was leading to a developmental arrest during neurulation
(Callanan et al., 2000). The role of XPO1 in embryonic development in teleosts has not
been studied. HHC01517 encodes a protein with Bric-a-brack, Tramtrack and Broad-
complex (BTB) domains. In D. melanogaster, the maternally expressed gene pipsueak
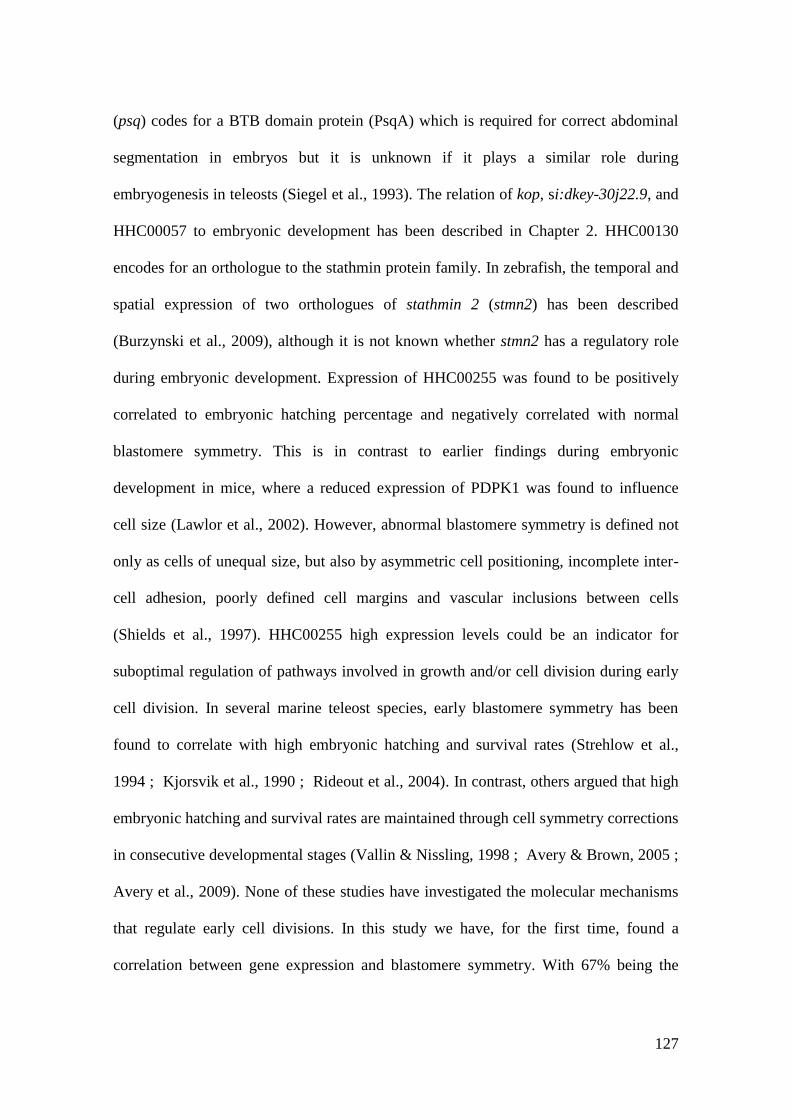
127
(psq) codes for a BTB domain protein (PsqA) which is required for correct abdominal
segmentation in embryos but it is unknown if it plays a similar role during
embryogenesis in teleosts (Siegel et al., 1993). The relation of kop, si:dkey-30j22.9, and
HHC00057 to embryonic development has been described in Chapter 2. HHC00130
encodes for an orthologue to the stathmin protein family. In zebrafish, the temporal and
spatial expression of two orthologues of stathmin 2 (stmn2) has been described
(Burzynski et al., 2009), although it is not known whether stmn2 has a regulatory role
during embryonic development. Expression of HHC00255 was found to be positively
correlated to embryonic hatching percentage and negatively correlated with normal
blastomere symmetry. This is in contrast to earlier findings during embryonic
development in mice, where a reduced expression of PDPK1 was found to influence
cell size (Lawlor et al., 2002). However, abnormal blastomere symmetry is defined not
only as cells of unequal size, but also by asymmetric cell positioning, incomplete inter-
cell adhesion, poorly defined cell margins and vascular inclusions between cells
(Shields et al., 1997). HHC00255 high expression levels could be an indicator for
suboptimal regulation of pathways involved in growth and/or cell division during early
cell division. In several marine teleost species, early blastomere symmetry has been
found to correlate with high embryonic hatching and survival rates (Strehlow et al.,
1994 ; Kjorsvik et al., 1990 ; Rideout et al., 2004). In contrast, others argued that high
embryonic hatching and survival rates are maintained through cell symmetry corrections
in consecutive developmental stages (Vallin & Nissling, 1998 ; Avery & Brown, 2005 ;
Avery et al., 2009). None of these studies have investigated the molecular mechanisms
that regulate early cell divisions. In this study we have, for the first time, found a
correlation between gene expression and blastomere symmetry. With 67% being the
128
highest percentage of oocytes with normal blastomere symmetry, symmetry was
generally low in this study. Even though Shields et al. (1997) established a score system
for blastomere symmetry, the method suffers from its subjectivity. It is unclear if the
estimated low blastomere symmetry in this study were true or due to a too strict
estimation of symmetry. In this study, only correlations between general abnormal
blastomere symmetry was analysed. Distinguishing between different types of abnormal
symmetry (i.e asymmetric cell positioning, unequal cell size and incomplete inter-cell
adhension; Shields et al., 1997) could have provided this study with additional
information about gene expression and early cell divisions. Phb2 has earlier been shown
to be differentially expressed in oocytes with low and high developmental potential in
rainbow trout (Bonnet et al., 2007). In the present study, expression levels of phb2 did
differ significantly in oocytes with low and high embryonic hatching rates and did not
correlate with embryonic hatching success.
Poor embryonic hatching success was not correlated with a general decrease in
transcript abundance, but with low transcript levels for specific genes. Similar gene
specific relations have been found by Aegerter et al. (2003) studying post-ovulatory
aging in rainbow trout. Out of the seven studied genes, three genes were found to be
down-regulated and four to be up-regulated in oocytes with low larval survival
compared to oocytes with high larval survival. In the same study, similar variations in
gene expression were found in post-ovulatory oocytes. The mechanisms inducing
differential maternal transcript abundances in teleost oocytes are unknown. A possible
explanation could be a reduced incorporation of specific maternal mRNAs into the
oocyte during oogenesis.
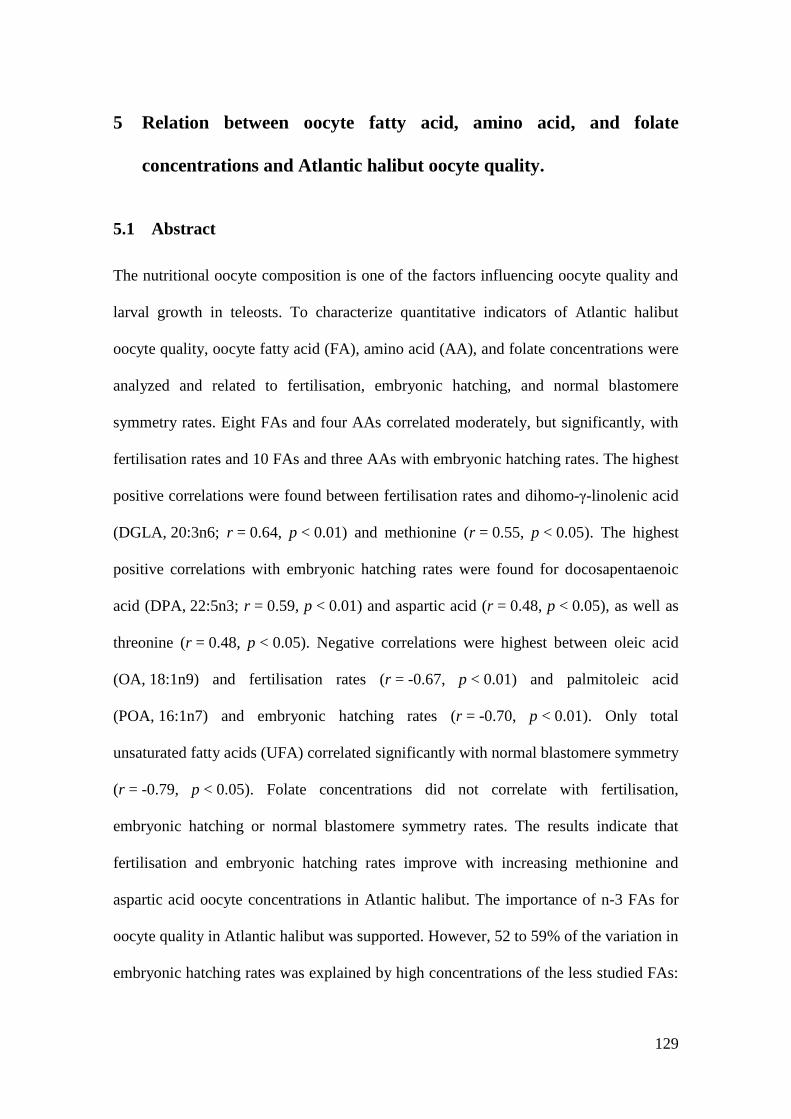
129
5 Relation between oocyte fatty acid, amino acid, and folate
concentrations and Atlantic halibut oocyte quality.
5.1 Abstract
The nutritional oocyte composition is one of the factors influencing oocyte quality and
larval growth in teleosts. To characterize quantitative indicators of Atlantic halibut
oocyte quality, oocyte fatty acid (FA), amino acid (AA), and folate concentrations were
analyzed and related to fertilisation, embryonic hatching, and normal blastomere
symmetry rates. Eight FAs and four AAs correlated moderately, but significantly, with
fertilisation rates and 10 FAs and three AAs with embryonic hatching rates. The highest
positive correlations were found between fertilisation rates and dihomo-γ-linolenic acid
(DGLA, 20:3n6; r = 0.64, p < 0.01) and methionine (r = 0.55, p < 0.05). The highest
positive correlations with embryonic hatching rates were found for docosapentaenoic
acid (DPA, 22:5n3; r = 0.59, p < 0.01) and aspartic acid (r = 0.48, p < 0.05), as well as
threonine (r = 0.48, p < 0.05). Negative correlations were highest between oleic acid
(OA, 18:1n9) and fertilisation rates (r = -0.67, p < 0.01) and palmitoleic acid
(POA, 16:1n7) and embryonic hatching rates (r = -0.70, p < 0.01). Only total
unsaturated fatty acids (UFA) correlated significantly with normal blastomere symmetry
(r = -0.79, p < 0.05). Folate concentrations did not correlate with fertilisation,
embryonic hatching or normal blastomere symmetry rates. The results indicate that
fertilisation and embryonic hatching rates improve with increasing methionine and
aspartic acid oocyte concentrations in Atlantic halibut. The importance of n-3 FAs for
oocyte quality in Atlantic halibut was supported. However, 52 to 59% of the variation in
embryonic hatching rates was explained by high concentrations of the less studied FAs:

130
DGLA, DPA, OA, and POA. These should not be neglected during future nutritional
studies on Atlantic halibut broodstock and could act, together with methionine and
aspartic acid, as possible indicators for Atlantic halibut oocyte quality.
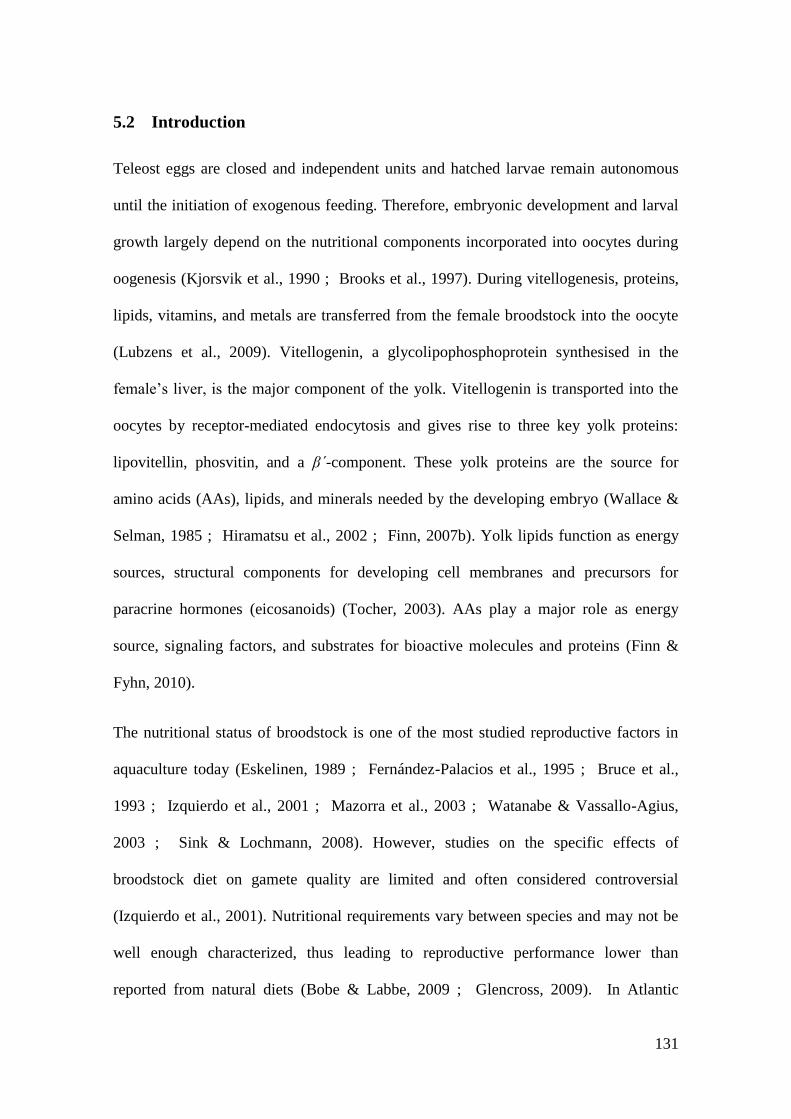
131
5.2 Introduction
Teleost eggs are closed and independent units and hatched larvae remain autonomous
until the initiation of exogenous feeding. Therefore, embryonic development and larval
growth largely depend on the nutritional components incorporated into oocytes during
oogenesis (Kjorsvik et al., 1990 ; Brooks et al., 1997). During vitellogenesis, proteins,
lipids, vitamins, and metals are transferred from the female broodstock into the oocyte
(Lubzens et al., 2009). Vitellogenin, a glycolipophosphoprotein synthesised in the
female’s liver, is the major component of the yolk. Vitellogenin is transported into the
oocytes by receptor-mediated endocytosis and gives rise to three key yolk proteins:
lipovitellin, phosvitin, and a β´-component. These yolk proteins are the source for
amino acids (AAs), lipids, and minerals needed by the developing embryo (Wallace &
Selman, 1985 ; Hiramatsu et al., 2002 ; Finn, 2007b). Yolk lipids function as energy
sources, structural components for developing cell membranes and precursors for
paracrine hormones (eicosanoids) (Tocher, 2003). AAs play a major role as energy
source, signaling factors, and substrates for bioactive molecules and proteins (Finn &
Fyhn, 2010).
The nutritional status of broodstock is one of the most studied reproductive factors in
aquaculture today (Eskelinen, 1989 ; Fernández-Palacios et al., 1995 ; Bruce et al.,
1993 ; Izquierdo et al., 2001 ; Mazorra et al., 2003 ; Watanabe & Vassallo-Agius,
2003 ; Sink & Lochmann, 2008). However, studies on the specific effects of
broodstock diet on gamete quality are limited and often considered controversial
(Izquierdo et al., 2001). Nutritional requirements vary between species and may not be
well enough characterized, thus leading to reproductive performance lower than
reported from natural diets (Bobe & Labbe, 2009 ; Glencross, 2009). In Atlantic

132
halibut, one broodstock nutrition experiment has been performed finding high n-6
concentration in formulated and pelleted feed in significant positive relationship with
fertilisation rates, normal blastomere symmetry, and embryonic hatching rates
(Mazorra et al., 2003). Other studies have concentrated on changes of nutritional
constituents in Atlantic halibut embryonic and larval development or in oocytes from
first and repeated spawning females. Studies on farmed Atlantic halibut have mainly
been based on oocyte samples from a small number of individual females (1-8 females)
(Finn et al., 1991 ; Bruce et al., 1993 ; Daniel et al., 1993 ; Parrish et al., 1993 ;
Parrish et al., 1994 ; Finn et al., 1995 ; Evans et al., 1996 ; Finn et al., 2002), with two
exceptions analysing oocytes from 15-30 individual females (Mæland et al., 2003 ; Zhu
et al., 2003). In three of the studies, females were fed a mixture of herring, squid,
mackerel, and vitamin supplement (Daniel et al., 1993 ; Evans et al., 1996 ; Zhu et al.,
2003) . In the remaining studies, the type of broodstock feed was not given. Lipid and
fatty acid (FA) concentration has been analysed in oocytes from wild-caught Atlantic
halibut females (Falk-Petersen et al., 1986 ; Falk-Petersen et al., 1989). Oocyte lipid,
FAs, and folate concentrations have been related to oocyte and larval quality previously,
but not AA concentrations (Bruce et al., 1993 ; Parrish et al., 1993 ; Parrish et al., 1994
; Evans et al., 1996). Atlantic halibut oocytes are pelagic with no oil globule present
(Rollefsen, 1934). Embryos hatch relatively early in their development, compared to
other teleost species. Exogenous feeding does not start until 45-55 days post hatch (dph)
at 4.5 ºC and the larvae depend solely on the nutrition provided through the yolk sac
until then (Lein & Holmefjord, 1992 ; Pittman et al., 1990a). The proximate Atlantic
halibut oocyte composition (% of dry mass) has been estimated to 55 % yolk protein,
18 % free AA (FAA), 15 % lipids, 8 % ions, and 0.5 % glycogen (Finn & Fyhn, 2010).
133
In Atlantic halibut embryos, the dominant portion of energy metabolism switches from
lipid/carbohydrate based to FAA as hatching approaches. Subsequently, metabolism
switches to yolk protein-bound AA, before larvae start exogenous feeding (Finn et al.,
1991 ; Finn et al., 1995 ; Zhu et al., 2003). Serine, alanine, leucine, and lysine have
been identified as the most abundant FAAs in ovulated Atlantic halibut oocytes and
alanine, leucine, glutamine, and lysine as being the most abundant yolk protein-bound
AAs in hatched larvae (3.9 dph; Finn et al., 1995 ; Evans et al., 1996 ; Finn et al.,
2002). In general, the FAA egg profile in marine pelagic spawning teleosts is conserved
while the lipid composition varies according to species (Finn et al., 1995 ; Tocher,
2003 ; Finn & Fyhn, 2010).
Atlantic halibut oocytes contain 12-14 % of total lipid with polar lipids representing 62-
80 % and neutral lipids 4-29 % of total lipids. Polar lipids are predominantly
phosphatidylcholine, phosphatidylethanolamine, and sphingomyelin while
triacylglycerols and cholesterols are the main constituents of the neutral lipid classes.
The most abundant FAs are palmitic acid (PA, 16:00), oleic acid (OA, 18:1n9),
eicosapentaenoic acid (EPA, 20:5n3), and docosahexaenoic acid (DHA, 20:5n3: Falk-
Petersen et al., 1986 ; Bruce et al., 1993). Like in many other marine teleost species, it
is assumed that Atlantic halibut has only a reduced ability of converting short-chain
polyunsaturated FAs (PUFAs) to long-chain PUFAs, due to limited Δ5 and Δ
6
desaturase and elongase activity (Tocher, 2003). Hence, in addition to linoleic acid
(LA, 18:2n6) and linolenic acid (LNA, 18:3n3), the long-chain PUFAs arachidonic acid
(20:4n6, ARA), eicosapentaenoic acid (12.5 %, EPA, 20:5n3), and docosahexaenoic
acid (31.2 %, DHA, 22:6n3) are considered essential FAs (EFAs) for Atlantic halibut.
134
Folate is an essential B9 vitamin that is closely associated with mammalian embryonic
development and growth, including foetal neural tube defects (Copp & Greene, 2010).
Folate acts as a coenzyme during intracellular one-carbon metabolism that produces
pyrimidines and purines for DNA syntheses and s-adenosyl methionine (SAM) (Blom,
2009). SAM is a universal methyl group donor for DNA, protein or lipid methylation.
DNA methylation is a major epigenetic process during embryonic development (Kim et
al., 2009). Therefore, folate deficiencies negatively influence embryonic development
by affecting cell proliferation and/or cell survival, which depends on continuous DNA
synthesis, as well as embryonic development and growth through DNA methylation
(Kim et al., 2009 ; Laanpere et al., 2010). In Atlantic halibut no significant correlations
between folate concentrations and fertilisation success have been found (Mæland et al.,
2003).
The aim of this study was to perform a comprehensive study of Atlantic halibut oocyte
composition in relation to oocyte quality and to identify possible indicators for oocyte
quality. For this AA, FA, and folate concentration in batches collected from various
females over several years and from females held under various photoperiods and
feeding conditions were analysed. FA and AA concentration was correlated to
fertilisation and embryonic hatching success and normal blastomere symmetry in 21
batches of oocytes from 10 females. Folate concentration was analysed in 19 batches
from eight females. Multiple regression analysis was performed to study the combined
effect of several FAs and AAs on oocyte quality.
135
5.3 Material and Methods
5.3.1 Fish husbandry and sampling collection
Oocyte samples were collected from Atlantic halibut females kept at the University of
Nordland, Bodø, Norway in 2006, 2008, and 2009 (Table 5.1). Each of 34 batches of
oocytes was fertilised with sperm pooled from two males and then incubated in
upwelling incubators in 2006 and in Petri-dishes in 2008 and 2009 (Babiak et al., 2006).
To estimate relative fertilisation (%), approximately 100 eggs from each batch were
incubated over-night in Petri-dishes (n = 3) at 5 ± 0.4oC in 2 µm-filtrated seawater.
Seawater salinity was adjusted to 33 ‰ by adding deionized tap water. Samples were
taken at the 8-cell stage. Samples were stored at -40 ºC and freeze-dried prior to
analysis. In 2006, females kept under natural photoperiod conditions were fed
decapitated and gutted herring for human consumption (winter herring) stuffed with
Fish Breed-M (2:1, INVE Aquaculture NV, Dendermonde, Belgia). Females kept under
the advanced photoperiod were fed Fish Breed-M. In advanced photoperiod group,
ovulation started approximately 1 month earlier than in the natural photoperiod group.
Relative embryonic hatching (%) was estimated by daily volumetric measurements of
dead embryos from the upwelling incubators. In 2008 and 2009, females kept under
natural and advanced photoperiods were fed Fish Breed-M. Relative embryonic
hatching (% ± SD) was estimated by incubating approximately 100 eggs in Petri dishes
(n = 3) at 5 ± 0.5oC in 2 µm filtrated seawater added 0.5 % (v/v) Penicillin-
Streptomycin-Neomycin solution (5000 Units Penicillin, 5 mg Streptomycin, and 10 mg
Neomycin per ml, Sigma-Aldrich Co., St. Louis, Mo, USA). Salinity was adjusted as
described above. The water in the Petri dishes was changed after the start of

136
gastrulation. Dead embryos were counted and removed every second day until hatching.
For 13 batches, blastomere symmetry was estimated in embryos at the 8-cell stage
(n = 30). Blastomere symmetry was estimated according to Shields et al. (1997).
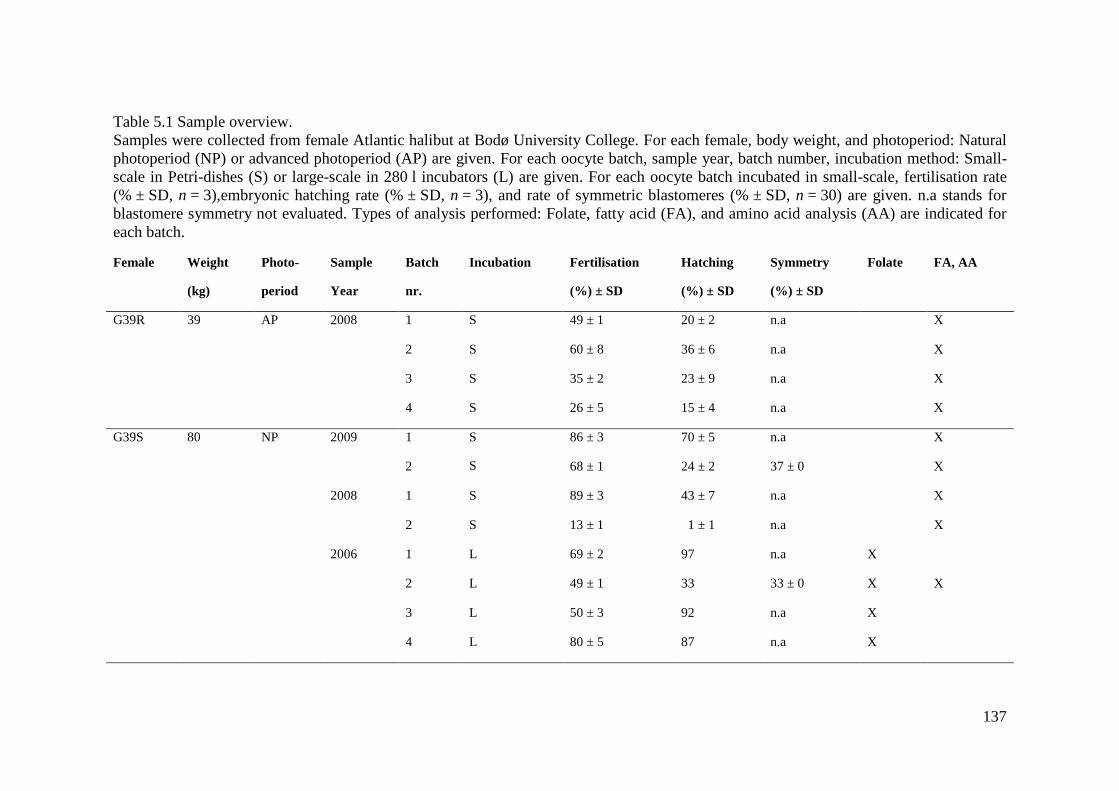
137
Table 5.1 Sample overview.
Samples were collected from female Atlantic halibut at Bodø University College. For each female, body weight, and photoperiod: Natural
photoperiod (NP) or advanced photoperiod (AP) are given. For each oocyte batch, sample year, batch number, incubation method: Small-
scale in Petri-dishes (S) or large-scale in 280 l incubators (L) are given. For each oocyte batch incubated in small-scale, fertilisation rate
(% ± SD, n = 3),embryonic hatching rate (% ± SD, n = 3), and rate of symmetric blastomeres (% ± SD, n = 30) are given. n.a stands for
blastomere symmetry not evaluated. Types of analysis performed: Folate, fatty acid (FA), and amino acid analysis (AA) are indicated for
each batch.
Female Weight
(kg)
Photo-
period
Sample
Year
Batch
nr.
Incubation Fertilisation
(%) ± SD
Hatching
(%) ± SD
Symmetry
(%) ± SD
Folate FA, AA
G39R 39 AP 2008 1 S 49 ± 1 20 ± 2 n.a X
2 S 60 ± 8 36 ± 6 n.a X
3 S 35 ± 2 23 ± 9 n.a X
4 S 26 ± 5 15 ± 4 n.a X
G39S 80 NP 2009 1 S
S
86 ± 3 70 ± 5 n.a X
2 68 ± 1 24 ± 2 37 ± 0 X
2008 1 S 89 ± 3 43 ± 7 n.a X
2 S 13 ± 1 1 ± 1 n.a X
2006 1 L 69 ± 2 97 n.a X
2 L 49 ± 1 33 33 ± 0 X X
3 L 50 ± 3 92 n.a X
4 L 80 ± 5 87 n.a X
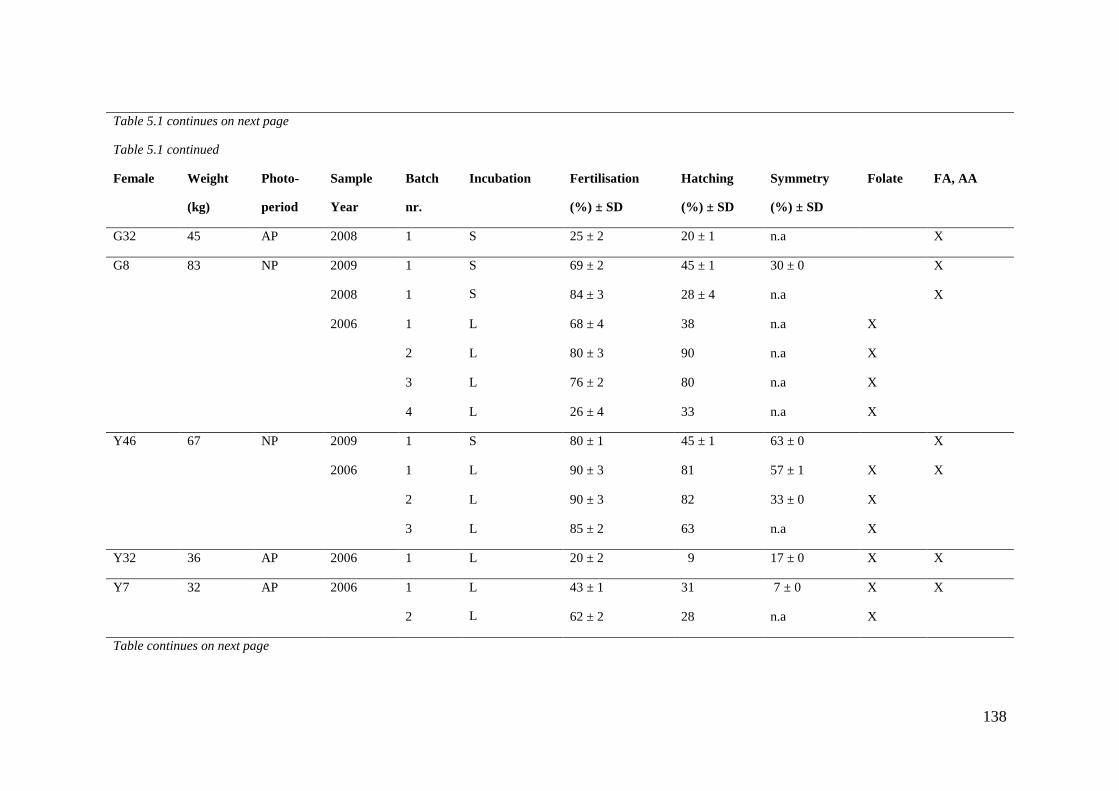
138
Table 5.1 continues on next page
Table 5.1 continued
Female Weight
(kg)
Photo-
period
Sample
Year
Batch
nr.
Incubation Fertilisation
(%) ± SD
Hatching
(%) ± SD
Symmetry
(%) ± SD
Folate FA, AA
G32 45 AP 2008 1 S 25 ± 2 20 ± 1 n.a X
G8 83 NP 2009 1 S
S
69 ± 2 45 ± 1 30 ± 0 X
2008 1 84 ± 3 28 ± 4 n.a X
2006 1 L 68 ± 4 38 n.a X
2 L 80 ± 3 90 n.a X
3 L 76 ± 2 80 n.a X
4 L 26 ± 4 33 n.a X
Y46 67 NP 2009 1 S 80 ± 1 45 ± 1 63 ± 0 X
2006
1 L 90 ± 3 81 57 ± 1 X X
2 L 90 ± 3 82 33 ± 0 X
3 L 85 ± 2 63 n.a X
Y32 36 AP 2006 1 L 20 ± 2 9 17 ± 0 X X
Y7 32 AP 2006 1 L
L
43 ± 1 31 7 ± 0 X X
2 62 ± 2 28 n.a X
Table continues on next page
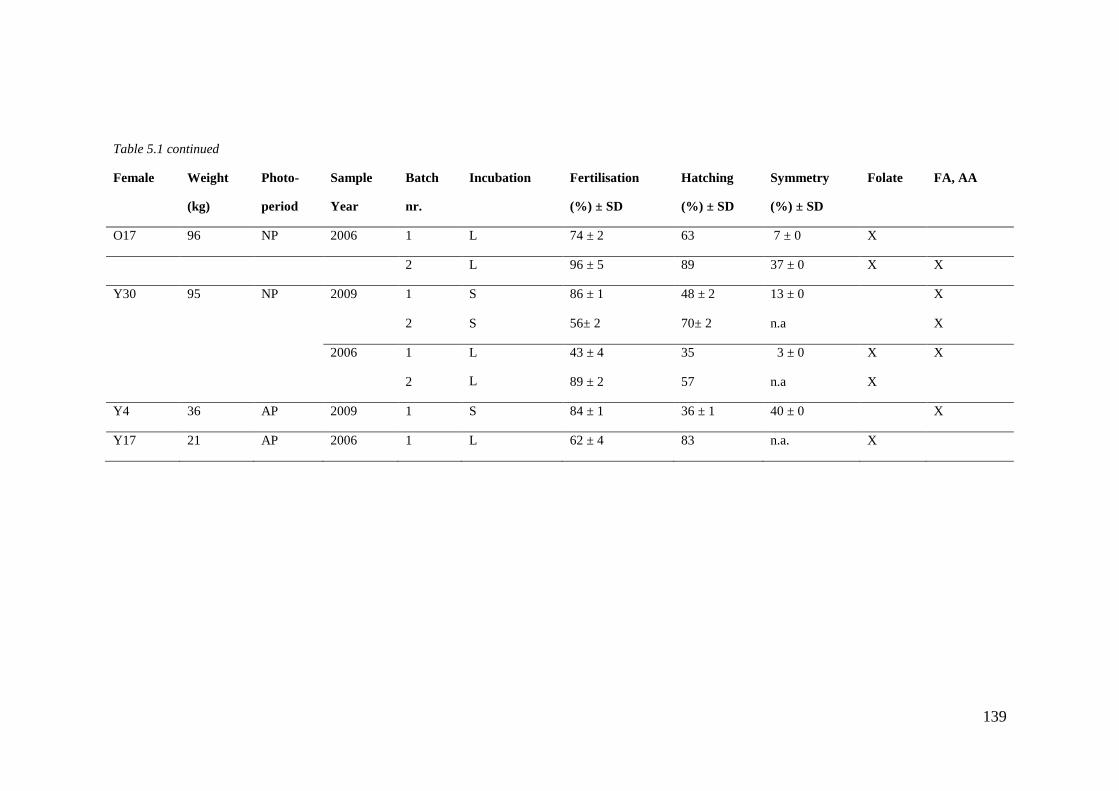
139
Table 5.1 continued
Female Weight
(kg)
Photo-
period
Sample
Year
Batch
nr.
Incubation Fertilisation
(%) ± SD
Hatching
(%) ± SD
Symmetry
(%) ± SD
Folate FA, AA
O17 96 NP 2006 1 L 74 ± 2 63 7 ± 0 X
2 L 96 ± 5 89 37 ± 0 X X
Y30 95 NP 2009 1 S 86 ± 1 48 ± 2 13 ± 0 X
2 S 56± 2 70± 2 n.a X
2006 1 L
L
43 ± 4 35 3 ± 0 X X
2 89 ± 2 57 n.a X
Y4 36 AP 2009 1 S 84 ± 1 36 ± 1 40 ± 0 X
Y17 21 AP 2006 1 L 62 ± 4 83 n.a. X
140
5.3.2 Egg composition analysis
5.3.2.1 Fatty acid analysis
Total lipids were extracted according to Folch et al. (1957) and Blight and Dyer (1959)
and FA methyl esters (FAMEs) prepared after Metcalfe et al. (1966), modified for
Atlantic halibut oocytes. For each sample, duplicates of 50 mg dry frozen oocytes were
homogenized with ultrasound in three steps. Consecutively, deionized water and
MeOH/CHCl3 (2:1; Sigma-Aldrich Co., MeOH: 65543, CHCl3: 34854) with an internal
standard (C21:0, Nu-check prep, Elysian, US), CHCl3, and deionized H2O were added
and homogenized between each step. Samples were centrifuged and the lower phase
was transferred into Kimax tubes. After drying by N2 gas evaporation, NaOH (0.5 M) in
MeOH (2 % w/v) was added and heated for 15 min at 100 °C. ~1.3M BF3 (Sigma-
Aldrich Co., 15716) was added before an additional heating for 5 min. FAMEs were
extracted with C6H14 (VWR, West Chester, PA, USA, 21499-25). H2O-free Na2SO4
(Sigma-Aldrich Co., R06203) was added to remove possible remains of H2O. FAs were
analyzed on a GLC 6890 N Network GC system Autosampler (Agilent Technologies,
Santa Clara, US) Samples were run in duplicates. C6H14 was used as blank and cod liver
oil (Petter Møller, Oslo, Norway) was used as a standard.
5.3.2.2 Total amino acid analysis
Total AA analysis was performed after Malmer & Schroeder, 1990. For each sample,
25 mg of dry frozen eggs were analyzed in duplicate. Samples were hydrolyzed in
CH3SO3H (4 M) with 0.2 % tryptamine at 110 ºC for 22 hours. During this reaction, all
aspargine and glutamine present in the samples were hydrolyzed to aspartic acid and
141
glutamic acid, respectively and were not represented in the final results. The pH was
adjusted to 8.0 and the solution filtered through 0.45 µm syringe filters. AA analysis
was performed on an Agilent HP1200 HPLC (Agilent Technologies, Santa Clara, US)
with DAD and FLD using AA standards (Sigma, Oslo, Norway) as a standard.
5.3.2.3 Folate analysis
Folate analysis was performed with a Quantitative Folate assay kit (Tecra International,
Frenchs Forest, Australia). For each sample, 1 g of dry-frozen samples was diluted
1:100 in sample buffer (Tris base, Sodium chloride) and heated at 100 ºC for 10 min in
duplicates. Samples were then diluted to approximately 1 ng g-1
. Before adding the
samples, a folate-antibody conjugate provided with the kit was added to the folate pre-
coated wells (96-well plate). The plate was thoroughly horizontally shaken before
incubation at 37 ºC for 1 hour. The wells were washed and substrate was added,
followed by further incubation at room temperature for 15 min. Results were read in a
Sunrise remote ELISA plate reader at 414 ± 10 nm (TECAN, Männedorf, Switzerland).
The provided folate standard solutions were used as standards. When the zero standard
was > 1.5, a stop solution was added.
5.3.2.4 Statistical analysis
Statistical analysis was carried out using SPSS 15.0 (SPSS Inc., Chicago, IL, USA).
Fertilisation, embryonic hatching, and normal blastomere symmetry percentage were
arc sin square root transformed. Principal component analysis (PCA) was performed on
using Unscrambler (v.9.2 (Camo Precess AS, Oslo, Norway) but due to the high
heterogeneity of parameters and low sample number no clear component separation was

142
achieved. Pearson’s correlation coefficient (r) was used to estimate linear relationships
between FA, AA, and folate concentration and egg fertilisation, embryonic hatching and
symmetric blastomere percentage. Multiple linear regression analysis was applied for
FA and AA concentrations to estimate the coefficient of determination (R2). For this
model, FA and AA concentration were used as predictors and fertilisation and
embryonic hatching as dependent variables (Zar, 1999).
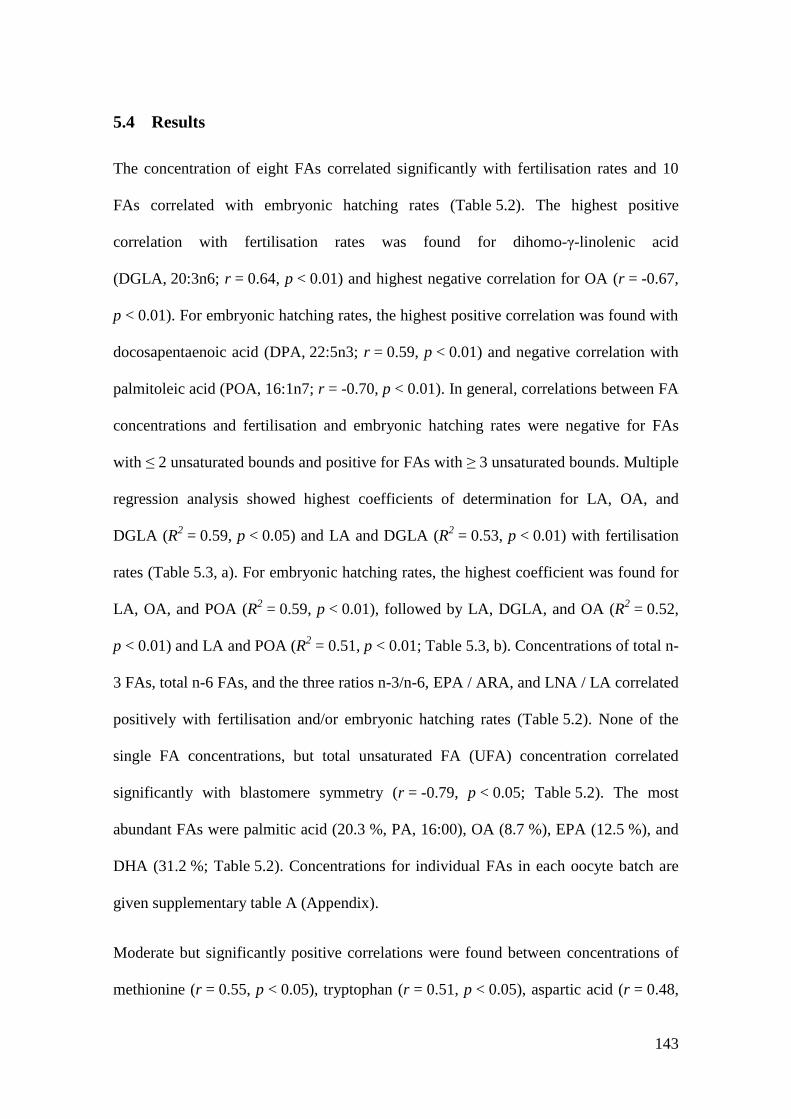
143
5.4 Results
The concentration of eight FAs correlated significantly with fertilisation rates and 10
FAs correlated with embryonic hatching rates (Table 5.2). The highest positive
correlation with fertilisation rates was found for dihomo-γ-linolenic acid
(DGLA, 20:3n6; r = 0.64, p < 0.01) and highest negative correlation for OA (r = -0.67,
p < 0.01). For embryonic hatching rates, the highest positive correlation was found with
docosapentaenoic acid (DPA, 22:5n3; r = 0.59, p < 0.01) and negative correlation with
palmitoleic acid (POA, 16:1n7; r = -0.70, p < 0.01). In general, correlations between FA
concentrations and fertilisation and embryonic hatching rates were negative for FAs
with ≤ 2 unsaturated bounds and positive for FAs with ≥ 3 unsaturated bounds. Multiple
regression analysis showed highest coefficients of determination for LA, OA, and
DGLA (R2 = 0.59, p < 0.05) and LA and DGLA (R
2 = 0.53, p < 0.01) with fertilisation
rates (Table 5.3, a). For embryonic hatching rates, the highest coefficient was found for
LA, OA, and POA (R2 = 0.59, p < 0.01), followed by LA, DGLA, and OA (R
2 = 0.52,
p < 0.01) and LA and POA (R2 = 0.51, p < 0.01; Table 5.3, b). Concentrations of total n-
3 FAs, total n-6 FAs, and the three ratios n-3/n-6, EPA / ARA, and LNA / LA correlated
positively with fertilisation and/or embryonic hatching rates (Table 5.2). None of the
single FA concentrations, but total unsaturated FA (UFA) concentration correlated
significantly with blastomere symmetry (r = -0.79, p < 0.05; Table 5.2). The most
abundant FAs were palmitic acid (20.3 %, PA, 16:00), OA (8.7 %), EPA (12.5 %), and
DHA (31.2 %; Table 5.2). Concentrations for individual FAs in each oocyte batch are
given supplementary table A (Appendix).
Moderate but significantly positive correlations were found between concentrations of
methionine (r = 0.55, p < 0.05), tryptophan (r = 0.51, p < 0.05), aspartic acid (r = 0.48,
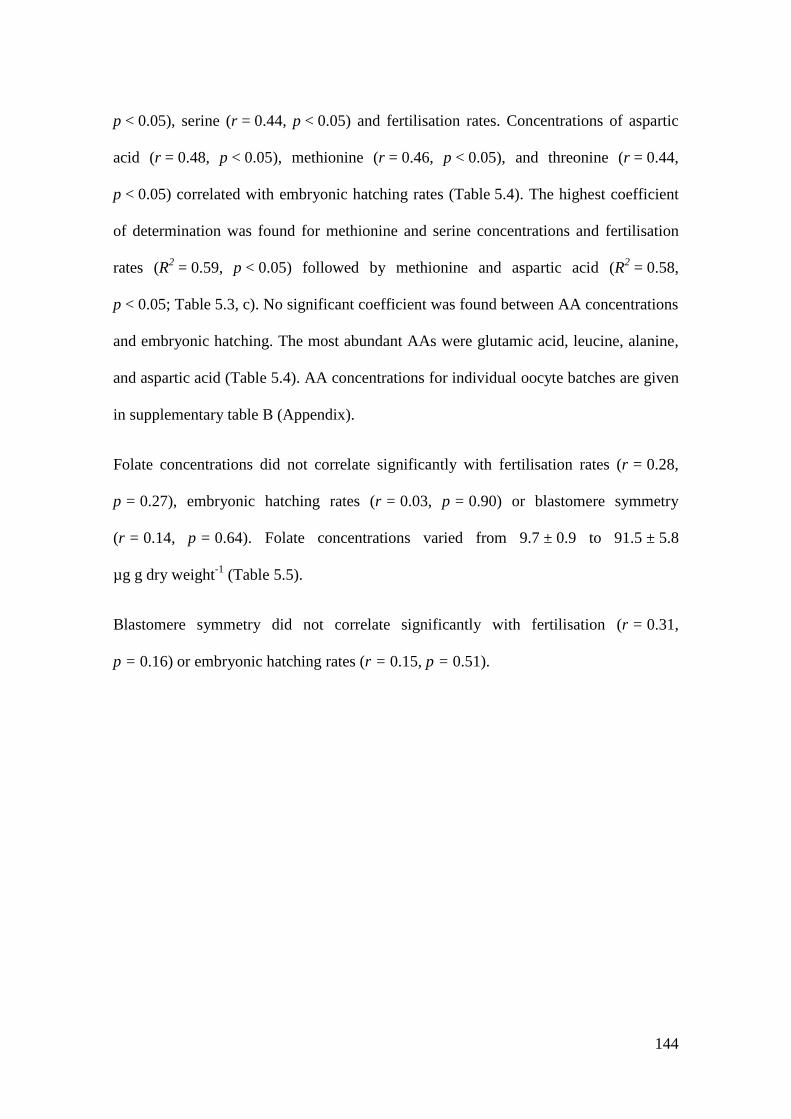
144
p < 0.05), serine (r = 0.44, p < 0.05) and fertilisation rates. Concentrations of aspartic
acid (r = 0.48, p < 0.05), methionine (r = 0.46, p < 0.05), and threonine (r = 0.44,
p < 0.05) correlated with embryonic hatching rates (Table 5.4). The highest coefficient
of determination was found for methionine and serine concentrations and fertilisation
rates (R2 = 0.59, p < 0.05) followed by methionine and aspartic acid (R
2 = 0.58,
p < 0.05; Table 5.3, c). No significant coefficient was found between AA concentrations
and embryonic hatching. The most abundant AAs were glutamic acid, leucine, alanine,
and aspartic acid (Table 5.4). AA concentrations for individual oocyte batches are given
in supplementary table B (Appendix).
Folate concentrations did not correlate significantly with fertilisation rates (r = 0.28,
p = 0.27), embryonic hatching rates (r = 0.03, p = 0.90) or blastomere symmetry
(r = 0.14, p = 0.64). Folate concentrations varied from 9.7 ± 0.9 to 91.5 ± 5.8
µg g dry weight-1
(Table 5.5).
Blastomere symmetry did not correlate significantly with fertilisation (r = 0.31,
p = 0.16) or embryonic hatching rates (r = 0.15, p = 0.51).
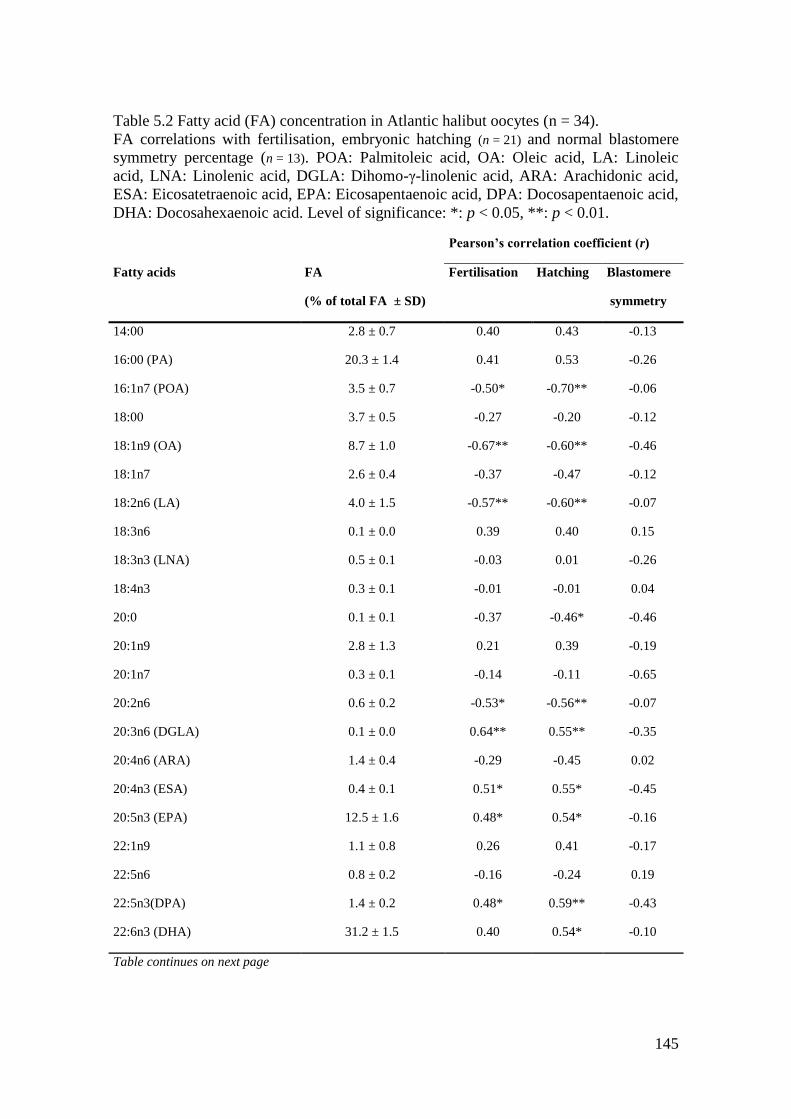
145
Table 5.2 Fatty acid (FA) concentration in Atlantic halibut oocytes (n = 34).
FA correlations with fertilisation, embryonic hatching (n = 21) and normal blastomere
symmetry percentage (n = 13). POA: Palmitoleic acid, OA: Oleic acid, LA: Linoleic
acid, LNA: Linolenic acid, DGLA: Dihomo-γ-linolenic acid, ARA: Arachidonic acid,
ESA: Eicosatetraenoic acid, EPA: Eicosapentaenoic acid, DPA: Docosapentaenoic acid,
DHA: Docosahexaenoic acid. Level of significance: *: p < 0.05, **: p < 0.01.
Pearson’s correlation coefficient (r)
Fatty acids
FA
(% of total FA ± SD)
Fertilisation
Hatching Blastomere
symmetry
14:00 2.8 ± 0.7 0.40 0.43 -0.13
16:00 (PA) 20.3 ± 1.4 0.41 0.53 -0.26
16:1n7 (POA) 3.5 ± 0.7 -0.50* -0.70** -0.06
18:00 3.7 ± 0.5 -0.27 -0.20 -0.12
18:1n9 (OA) 8.7 ± 1.0 -0.67** -0.60** -0.46
18:1n7 2.6 ± 0.4 -0.37 -0.47 -0.12
18:2n6 (LA) 4.0 ± 1.5 -0.57** -0.60** -0.07
18:3n6 0.1 ± 0.0 0.39 0.40 0.15
18:3n3 (LNA) 0.5 ± 0.1 -0.03 0.01 -0.26
18:4n3 0.3 ± 0.1 -0.01 -0.01 0.04
20:0 0.1 ± 0.1 -0.37 -0.46* -0.46
20:1n9 2.8 ± 1.3 0.21 0.39 -0.19
20:1n7 0.3 ± 0.1 -0.14 -0.11 -0.65
20:2n6 0.6 ± 0.2 -0.53* -0.56** -0.07
20:3n6 (DGLA) 0.1 ± 0.0 0.64** 0.55** -0.35
20:4n6 (ARA) 1.4 ± 0.4 -0.29 -0.45 0.02
20:4n3 (ESA) 0.4 ± 0.1 0.51* 0.55* -0.45
20:5n3 (EPA) 12.5 ± 1.6 0.48* 0.54* -0.16
22:1n9 1.1 ± 0.8 0.26 0.41 -0.17
22:5n6 0.8 ± 0.2 -0.16 -0.24 0.19
22:5n3(DPA) 1.4 ± 0.2 0.48* 0.59** -0.43
22:6n3 (DHA) 31.2 ± 1.5 0.40 0.54* -0.10
Table continues on next page
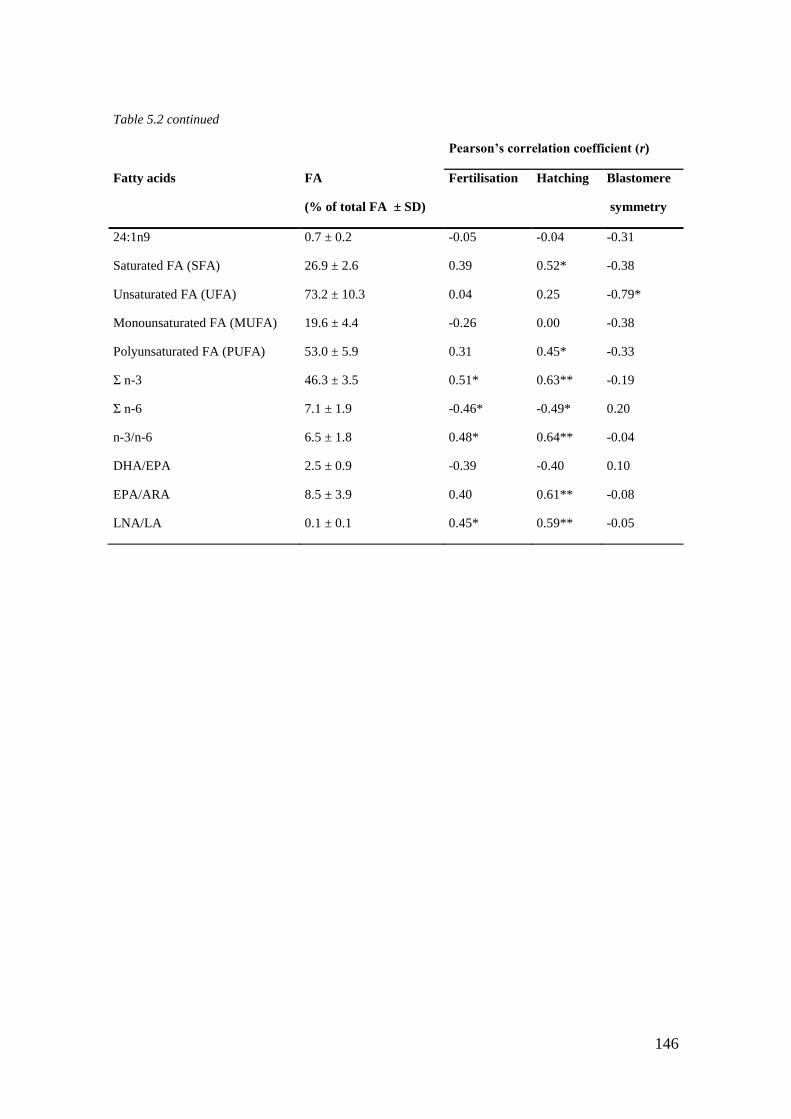
146
Table 5.2 continued
Pearson’s correlation coefficient (r)
Fatty acids
FA
(% of total FA ± SD)
Fertilisation
Hatching Blastomere
symmetry
24:1n9 0.7 ± 0.2 -0.05 -0.04 -0.31
Saturated FA (SFA) 26.9 ± 2.6 0.39 0.52* -0.38
Unsaturated FA (UFA) 73.2 ± 10.3 0.04 0.25 -0.79*
Monounsaturated FA (MUFA) 19.6 ± 4.4 -0.26 0.00 -0.38
Polyunsaturated FA (PUFA) 53.0 ± 5.9 0.31 0.45* -0.33
Σ n-3 46.3 ± 3.5 0.51* 0.63** -0.19
Σ n-6 7.1 ± 1.9 -0.46* -0.49* 0.20
n-3/n-6 6.5 ± 1.8 0.48* 0.64** -0.04
DHA/EPA 2.5 ± 0.9 -0.39 -0.40 0.10
EPA/ARA 8.5 ± 3.9 0.40 0.61** -0.08
LNA/LA 0.1 ± 0.1 0.45* 0.59** -0.05
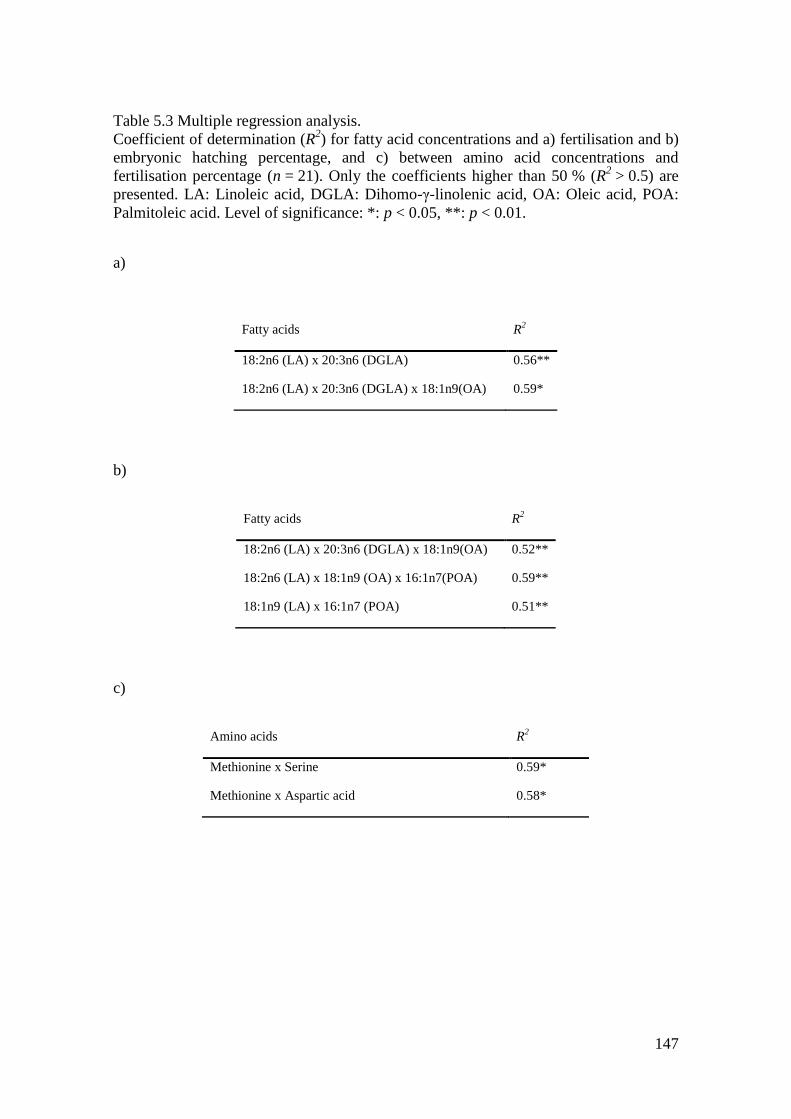
147
Table 5.3 Multiple regression analysis.
Coefficient of determination (R2) for fatty acid concentrations and a) fertilisation and b)
embryonic hatching percentage, and c) between amino acid concentrations and
fertilisation percentage (n = 21). Only the coefficients higher than 50 % (R2 > 0.5) are
presented. LA: Linoleic acid, DGLA: Dihomo-γ-linolenic acid, OA: Oleic acid, POA:
Palmitoleic acid. Level of significance: *: p < 0.05, **: p < 0.01.
a)
Fatty acids R
2
18:2n6 (LA) x 20:3n6 (DGLA) 0.56**
18:2n6 (LA) x 20:3n6 (DGLA) x 18:1n9(OA) 0.59*
b)
Fatty acids R2
18:2n6 (LA) x 20:3n6 (DGLA) x 18:1n9(OA) 0.52**
18:2n6 (LA) x 18:1n9 (OA) x 16:1n7(POA) 0.59**
18:1n9 (LA) x 16:1n7 (POA) 0.51**
c)
Amino acids R2
Methionine x Serine 0.59*
Methionine x Aspartic acid 0.58*
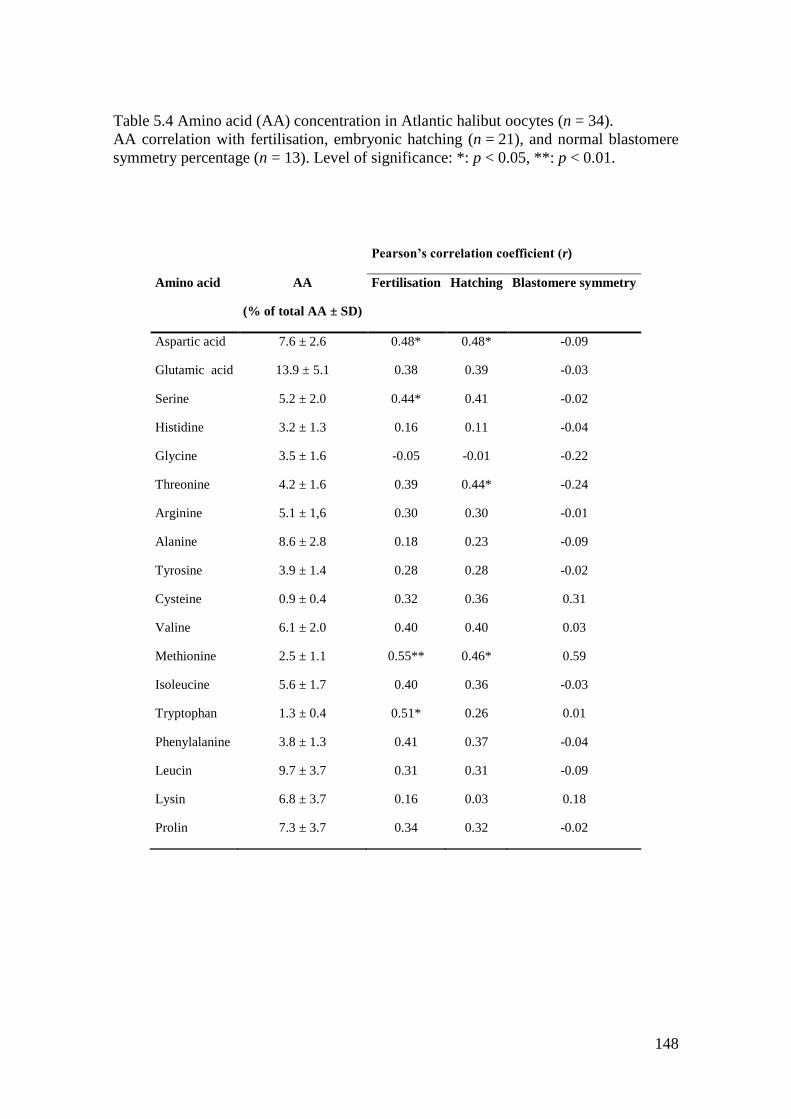
148
Table 5.4 Amino acid (AA) concentration in Atlantic halibut oocytes (n = 34).
AA correlation with fertilisation, embryonic hatching (n = 21), and normal blastomere
symmetry percentage (n = 13). Level of significance: *: p < 0.05, **: p < 0.01.
Pearson’s correlation coefficient (r)
Amino acid AA
(% of total AA ± SD)
Fertilisation
Hatching Blastomere symmetry
Aspartic acid 7.6 ± 2.6 0.48* 0.48* -0.09
Glutamic acid 13.9 ± 5.1 0.38 0.39 -0.03
Serine 5.2 ± 2.0 0.44* 0.41 -0.02
Histidine 3.2 ± 1.3 0.16 0.11 -0.04
Glycine 3.5 ± 1.6 -0.05 -0.01 -0.22
Threonine 4.2 ± 1.6 0.39 0.44* -0.24
Arginine 5.1 ± 1,6 0.30 0.30 -0.01
Alanine 8.6 ± 2.8 0.18 0.23 -0.09
Tyrosine 3.9 ± 1.4 0.28 0.28 -0.02
Cysteine 0.9 ± 0.4 0.32 0.36 0.31
Valine 6.1 ± 2.0 0.40 0.40 0.03
Methionine 2.5 ± 1.1 0.55** 0.46* 0.59
Isoleucine 5.6 ± 1.7 0.40 0.36 -0.03
Tryptophan 1.3 ± 0.4 0.51* 0.26 0.01
Phenylalanine 3.8 ± 1.3 0.41 0.37 -0.04
Leucin 9.7 ± 3.7 0.31 0.31 -0.09
Lysin 6.8 ± 3.7 0.16 0.03 0.18
Prolin 7.3 ± 3.7 0.34 0.32 -0.02
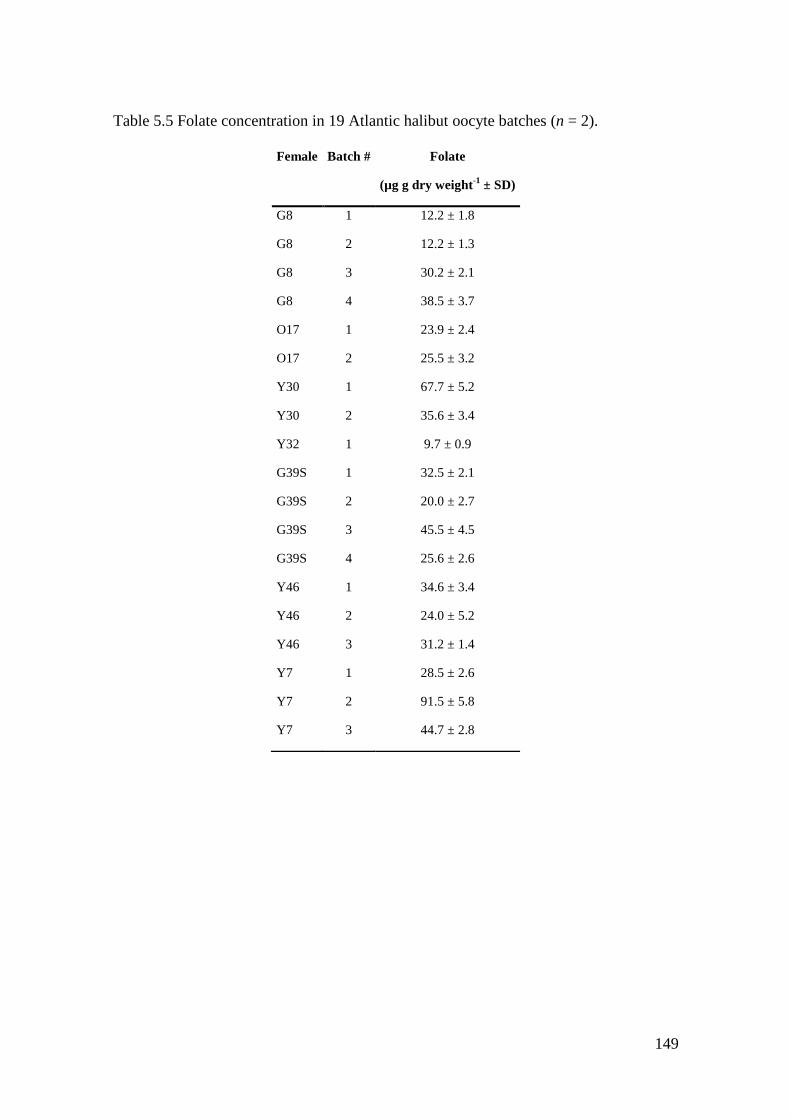
149
Table 5.5 Folate concentration in 19 Atlantic halibut oocyte batches (n = 2).
Female
Batch # Folate
(µg g dry weight-1
± SD)
G8 1 12.2 ± 1.8
G8 2 12.2 ± 1.3
G8 3 30.2 ± 2.1
G8 4 38.5 ± 3.7
O17 1 23.9 ± 2.4
O17 2 25.5 ± 3.2
Y30 1 67.7 ± 5.2
Y30 2 35.6 ± 3.4
Y32 1 9.7 ± 0.9
G39S 1 32.5 ± 2.1
G39S 2 20.0 ± 2.7
G39S 3 45.5 ± 4.5
G39S 4 25.6 ± 2.6
Y46 1 34.6 ± 3.4
Y46 2 24.0 ± 5.2
Y46 3 31.2 ± 1.4
Y7 1 28.5 ± 2.6
Y7 2 91.5 ± 5.8
Y7 3 44.7 ± 2.8
150
5.5 Discussion
Oocyte composition determines the successful development and growth of teleost
embryos and larvae until exogenous feeding starts at first feeding. Deficiencies or
unbalanced broodstock diets generally result in low embryonic and larval survival and
increased occurrence of embryonic and larval malformations (Sargent et al., 2002).
FA concentrations estimated in this study were in accordance with previously findings
in farmed and wild Atlantic halibut oocytes (Falk-Petersen et al., 1986 ; Bruce et al.,
1993). EFAs are as important during embryonic and larval growth as in juvenile and
adult fish, since they play an important role in for example the development of
embryonic and larval neural tissues and as precursors of prostaglandins, an eicosanoid
sub-class required for gastrulation movements and segmentation during embryonic
zebrafish development (Salem et al., 2001 ; Cha et al., 2006 ; Speirs et al., 2010). In
addition, FAs and their derivates are known to directly regulate the activities of a
variety of transcription factors whose functions are in the control of genes responsible
for FA, cholesterol, and carbohydrate metabolism (Jump, 2004).
High n-3 PUFAs concentrations in oocytes have been found to increase fertilisation,
embryonic hatching, and survival rates in gilthead sea bream (Harel et al., 1994 ;
Fernández-Palacios et al., 1995 ; Bruce et al., 1999), Atlantic cod (Pickova et al., 1997 ;
Salze et al., 2005), Japanese flounder (Furuita et al., 2000 ; Furuita et al., 2002), and
European seabass (Bruce et al., 1999). In accordance with the previous findings, the
concentration of total n-3 FAs, EPA, and DHA in Atlantic halibut oocyte correlated
positive with fertilisation and embryonic hatching rates in this study. However, the
highest positive correlations between FA concentrations and fertilisation and embryonic
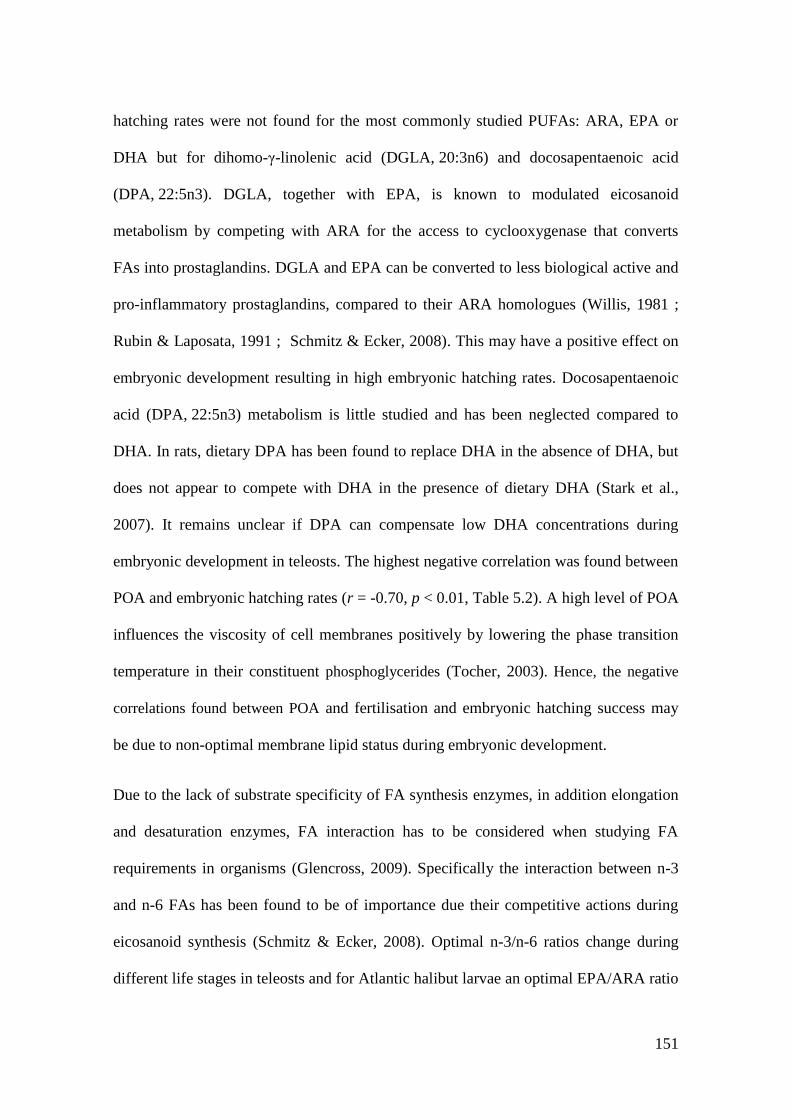
151
hatching rates were not found for the most commonly studied PUFAs: ARA, EPA or
DHA but for dihomo-γ-linolenic acid (DGLA, 20:3n6) and docosapentaenoic acid
(DPA, 22:5n3). DGLA, together with EPA, is known to modulated eicosanoid
metabolism by competing with ARA for the access to cyclooxygenase that converts
FAs into prostaglandins. DGLA and EPA can be converted to less biological active and
pro-inflammatory prostaglandins, compared to their ARA homologues (Willis, 1981 ;
Rubin & Laposata, 1991 ; Schmitz & Ecker, 2008). This may have a positive effect on
embryonic development resulting in high embryonic hatching rates. Docosapentaenoic
acid (DPA, 22:5n3) metabolism is little studied and has been neglected compared to
DHA. In rats, dietary DPA has been found to replace DHA in the absence of DHA, but
does not appear to compete with DHA in the presence of dietary DHA (Stark et al.,
2007). It remains unclear if DPA can compensate low DHA concentrations during
embryonic development in teleosts. The highest negative correlation was found between
POA and embryonic hatching rates (r = -0.70, p < 0.01, Table 5.2). A high level of POA
influences the viscosity of cell membranes positively by lowering the phase transition
temperature in their constituent phosphoglycerides (Tocher, 2003). Hence, the negative
correlations found between POA and fertilisation and embryonic hatching success may
be due to non-optimal membrane lipid status during embryonic development.
Due to the lack of substrate specificity of FA synthesis enzymes, in addition elongation
and desaturation enzymes, FA interaction has to be considered when studying FA
requirements in organisms (Glencross, 2009). Specifically the interaction between n-3
and n-6 FAs has been found to be of importance due their competitive actions during
eicosanoid synthesis (Schmitz & Ecker, 2008). Optimal n-3/n-6 ratios change during
different life stages in teleosts and for Atlantic halibut larvae an optimal EPA/ARA ratio
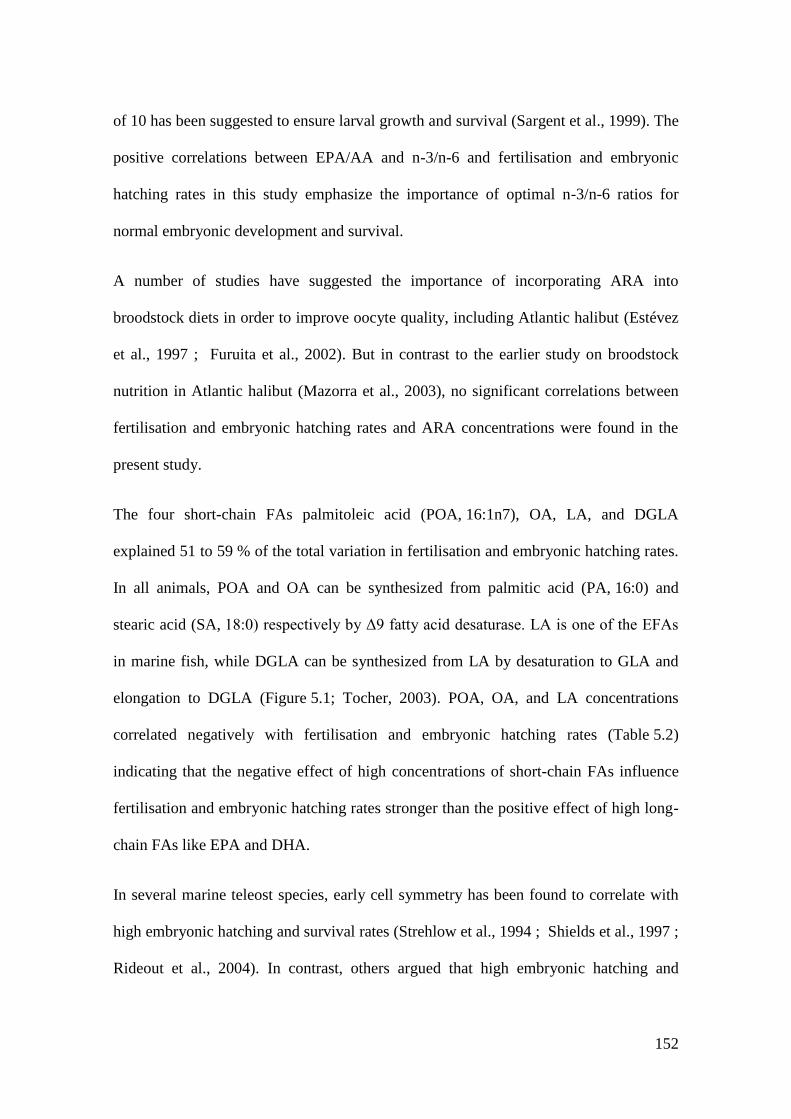
152
of 10 has been suggested to ensure larval growth and survival (Sargent et al., 1999). The
positive correlations between EPA/AA and n-3/n-6 and fertilisation and embryonic
hatching rates in this study emphasize the importance of optimal n-3/n-6 ratios for
normal embryonic development and survival.
A number of studies have suggested the importance of incorporating ARA into
broodstock diets in order to improve oocyte quality, including Atlantic halibut (Estévez
et al., 1997 ; Furuita et al., 2002). But in contrast to the earlier study on broodstock
nutrition in Atlantic halibut (Mazorra et al., 2003), no significant correlations between
fertilisation and embryonic hatching rates and ARA concentrations were found in the
present study.
The four short-chain FAs palmitoleic acid (POA, 16:1n7), OA, LA, and DGLA
explained 51 to 59 % of the total variation in fertilisation and embryonic hatching rates.
In all animals, POA and OA can be synthesized from palmitic acid (PA, 16:0) and
stearic acid (SA, 18:0) respectively by Δ9 fatty acid desaturase. LA is one of the EFAs
in marine fish, while DGLA can be synthesized from LA by desaturation to GLA and
elongation to DGLA (Figure 5.1; Tocher, 2003). POA, OA, and LA concentrations
correlated negatively with fertilisation and embryonic hatching rates (Table 5.2)
indicating that the negative effect of high concentrations of short-chain FAs influence
fertilisation and embryonic hatching rates stronger than the positive effect of high long-
chain FAs like EPA and DHA.
In several marine teleost species, early cell symmetry has been found to correlate with
high embryonic hatching and survival rates (Strehlow et al., 1994 ; Shields et al., 1997 ;
Rideout et al., 2004). In contrast, others argued that high embryonic hatching and
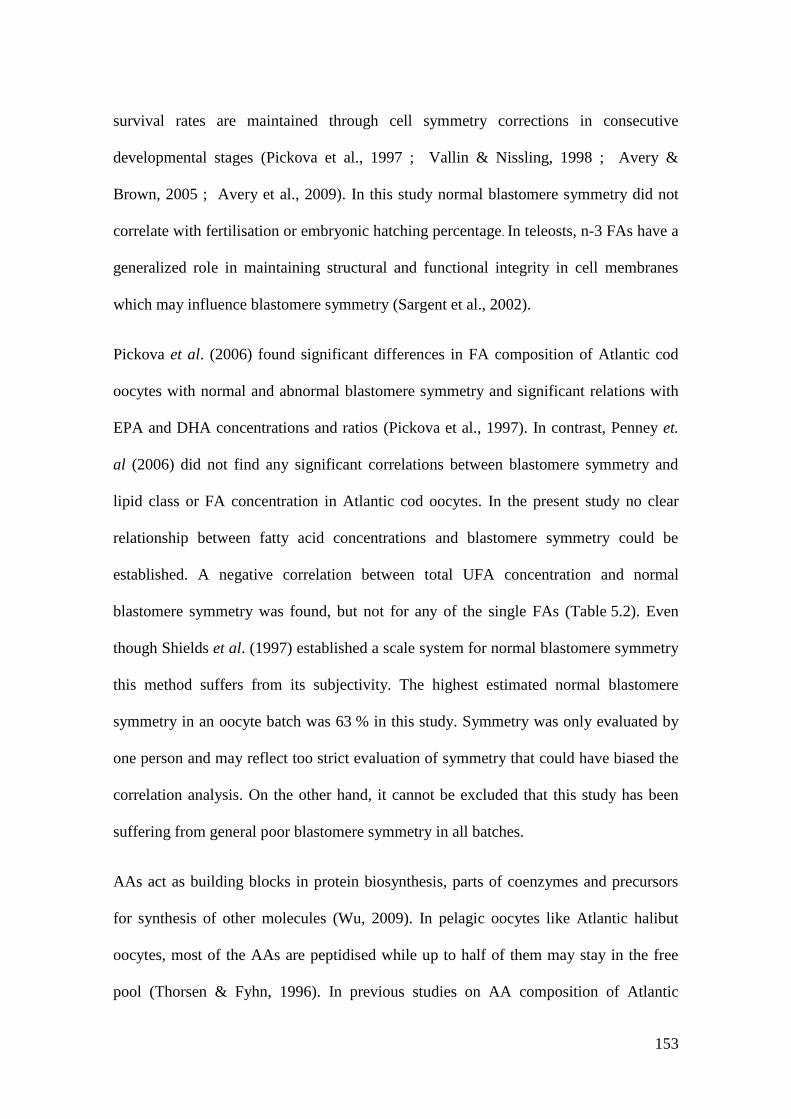
153
survival rates are maintained through cell symmetry corrections in consecutive
developmental stages (Pickova et al., 1997 ; Vallin & Nissling, 1998 ; Avery &
Brown, 2005 ; Avery et al., 2009). In this study normal blastomere symmetry did not
correlate with fertilisation or embryonic hatching percentage. In teleosts, n-3 FAs have a
generalized role in maintaining structural and functional integrity in cell membranes
which may influence blastomere symmetry (Sargent et al., 2002).
Pickova et al. (2006) found significant differences in FA composition of Atlantic cod
oocytes with normal and abnormal blastomere symmetry and significant relations with
EPA and DHA concentrations and ratios (Pickova et al., 1997). In contrast, Penney et.
al (2006) did not find any significant correlations between blastomere symmetry and
lipid class or FA concentration in Atlantic cod oocytes. In the present study no clear
relationship between fatty acid concentrations and blastomere symmetry could be
established. A negative correlation between total UFA concentration and normal
blastomere symmetry was found, but not for any of the single FAs (Table 5.2). Even
though Shields et al. (1997) established a scale system for normal blastomere symmetry
this method suffers from its subjectivity. The highest estimated normal blastomere
symmetry in an oocyte batch was 63 % in this study. Symmetry was only evaluated by
one person and may reflect too strict evaluation of symmetry that could have biased the
correlation analysis. On the other hand, it cannot be excluded that this study has been
suffering from general poor blastomere symmetry in all batches.
AAs act as building blocks in protein biosynthesis, parts of coenzymes and precursors
for synthesis of other molecules (Wu, 2009). In pelagic oocytes like Atlantic halibut
oocytes, most of the AAs are peptidised while up to half of them may stay in the free
pool (Thorsen & Fyhn, 1996). In previous studies on AA composition of Atlantic
154
halibut oocytes the emphasis has been put on free AAs or yolk-bound AAs (Finn et al.,
1991 ; Evans et al., 1996 ; Finn et al., 2002 ; Finn, 2007a). Because of technical
constraints total AA concentrations have been estimated which makes the comparison
with previous studies challenging. Since AA concentrations in animals are more
conserved than lipid and fatty acid concentrations, strong negative correlations would
indicate a serious nutritional deficiency. Only moderate positive correlations between
AA concentration and fertilisation and embryonic hatching rates were found
(Table 5.4). The AAs which positively correlated with fertilisation and embryonic
hatching are involved in important biosynthesis and metabolic pathways during
fertilisation and embryonic development. Methionine concentration correlated highest
with fertilisation rates, compared to other AAs (Table 5.4). Methionine is an essential
AA that serves as the initiating AA acid in eukaryotic protein synthesis and in the form
of SAM it is a principal donor of methyl groups in animals (Wu, 2009). These are
essential mechanisms for oocyte activation and first cell divisions after fertilisation and
may explain the positive correlation of methionine with fertilisation. Methionine is also
known to be a limiting factor in larval nutrition in aquaculture (Brosnan et al., 2007).
Artemia, the major live feed for fish larvae is low on methionine, compared to natural
zooplankton, and needs to be enriched (Tonheim et al., 2000). Aspartic acid
concentration correlated highest with embryonic hatching rates (Table 5.4). Aspartic
acid is a non-essential AA that is involved in the synthesis of purine, pyrimidine,
asparagine, and arginine. Aspartic acid is manly known to promote the synthesis of
proteins involved in the development of the vertebrate nervous system and acts also as a
neurotransmitter/neuromodulator at synapses (Neidle & Dunlop, 1990 ; Hashimoto et
al., 1995). Together with serine and aspartic acid, methionine concentrations explained
155
up to 59 % of the variation in fertilisation success (Table 5.3, c). Serine is a non-
essential AA that plays an important part in the catalytic function of many enzymes. It
participates in the one-carbon unit metabolism and syntheses of purine and pyrimidine
(Wu, 2009). The correlation between methionine and aspartic acid concentrations and
fertilisation and embryonic hatching rates reported in this study emphasises the
importance of optimal concentrations of these AAs for successful embryonic
development.
Folate deficiencies are known to lead to major embryonic deformities in higher
vertebrates (Tamura & Picciano, 2006 ; Gray & Ross, 2009) and reduced growth in
teleosts (Cowey & Woodward, 1993 ; Duncan et al., 1993). In a previous study
Mæland et al. (2003) studied folate metabolism in Atlantic halibut larval before
exogenous feeding but did not find a significant correlation between oocyte folate
concentrations and fertilisation rates. In the present study no significant correlations
between oocyte folate concentrations and fertilisation or embryonic hatching rates and
normal blastomere symmetry were found either. Embryonic hatching rates were
obtained by volumetric measurements during large scale incubation of the respective
oocyte batches collected for folate analysis. This may have led to imprecise embryonic
hatching rates, influencing correlations. It remains unclear if oocyte folate
concentrations affect embryonic development and successful embryonic hatching in
Atlantic halibut.
Selected FAs or AAs explained most of the variation in fertilisation or embryonic
hatching success providing a useful indicator of oocyte quality. However, 52 to 59 % of
the variation in hatching rates was explained by high concentrations of FAs that have
previously not been focussed on: DGLA, DPA, OA, and POA. In addition, the

156
significant correlation between total methionine and aspartic acid and oocyte quality
indicates a potential to increase Atlantic halibut oocyte quality through broodstock
nutrition. These should not be neglected during future nutritional studies on Atlantic
halibut broodstock and could act, together with methionine and aspartic acid, as
possible indicators for Atlantic halibut egg quality.
157
Figure 5.1 n-3 and n-6 metabolism.
After Schmitz & Ecker (Schmitz and Ecker, 2008).
158
6 Microarray-based identification of maternal gene expression and
its relation to Atlantic halibut oocyte quality
6.1 Abstract
Embryonic developmental success is highly variable in commercially farmed marine
teleosts. Early embryonic development is regulated by maternal transcripts, deposited
into oocytes during oogenesis. Variations in maternal transcript abundance may induce
variable oocyte quality, leading to uneven embryonic developmental success. Using a
new 44k Atlantic halibut (Hippoglossus hippoglossus) microarray, maternal gene
expression was profiled during embryonic development from fertilisation (8-cell stage)
to embryonic hatching. In addition, differential gene expression between Atlantic
halibut oocytes, developing into embryos experiencing high (≥ 86 ± 3%) and low
hatching rates (≤ 9 ± 3%), was analyzed. Of 192 identified maternal transcripts, 127
(66 %) had significant BLAST hits against the NCBI non-redundant database. Most of
these transcripts coded for proteins involved in the cell cycle (GO:0007049), cell
signalling (GO:0007267), RNA transcription (GO:0009299), cell differentiation
(GO:0030154), and metabolic processes (GO:0008152). Of 20 differentially expressed
genes between high and low quality oocytes, 12 (57 %) had significant BLAST hits
against genes involved in immune response, metabolism, RNA transcription, protein
degradation, cell signalling and the cytoskeleton. The highest expression differences
were found for interferon regulatory factor 7 (irf7, ↓8.0 ± 0.3-fold) and mhc class II
alpha antigen (mhc2dab, ↑7.8 ± 0.7-fold) in low quality oocytes. Microarray validation
by quantitative real-time PCR (qPCR) confirmed its suitability for future gene
expression studies during Atlantic halibut embryonic development. The identified

159
maternal genes can serve a pool for future in-depth studies of embryonic gene
expression to advance the knowledge of important developmental processes such as
germ cell development, growth and immune response. Irf7 and mhc2dab were identified
as potential markers for Atlantic oocytes quality.
160
6.2 Introduction
Teleost fish are the largest and most diverse group among vertebrates, comprising
approximately 27,000 species (www.fishbase.org). They present a remarkable diversity
in their morphology, behaviour and adaptations (Nelson, 2006). Teleost genomes are
more 'plastic' in comparison with other vertebrate genomes due to genetic evolutionary
changes such as polyploidization, gene duplication, gain of spliceosomal introns and
speciation (Taylor et al., 2001 ; Venkatesh, 2003). One major motivation to study
teleosts genomes is their high commercial value as aquaculture species. Microarray
technology allows a simultaneous analysis of thousands of genes and candidate gene
identification in multiple physiological and morphological mechanisms. In
commercially farmed teleosts, microarrays have been applied to study differential gene
expression involved in immunity, reproduction, nutrition, and stress (Douglas, 2006 ;
Cerdà et al., 2008 ; Goetz & MacKenzie, 2008 ; Martin et al., 2008 ; Miller &
Maclean, 2008 ; Aoki et al., 2010). In flatfish (Pleuronectiformes), species-specific
microarrays are available for five species: Atlantic halibut (Hippoglossus hippoglossus),
European flounder (Platichthys flesus), olive flounder (Paralichthys olivaceus),
Senegalese sole (Solea senegalensis), and turbot (Scophthalmus maximus) (Matsuyama
et al., 2007 ; Yasuike et al., 2007 ; Cerdà et al., 2008 ; Diab et al., 2008 ; Douglas et
al., 2008 ; Nakayama et al., 2008 ; Park et al., 2009 ; Millán et al., 2010). For Atlantic
halibut, a microarray created by Douglas et al. (2006) has been used to study differential
gene expression between five larval stages (hatched to post-metamorphosis), in larvae
introduced to microencapsulated diet and in juveniles fed with fish meal replacement
diets (Douglas et al., 2008 ; Murray et al., 2009 ; Murray et al., 2010). Since the
creation of the first Atlantic halibut microarray by Douglas et al. (2006) the number of
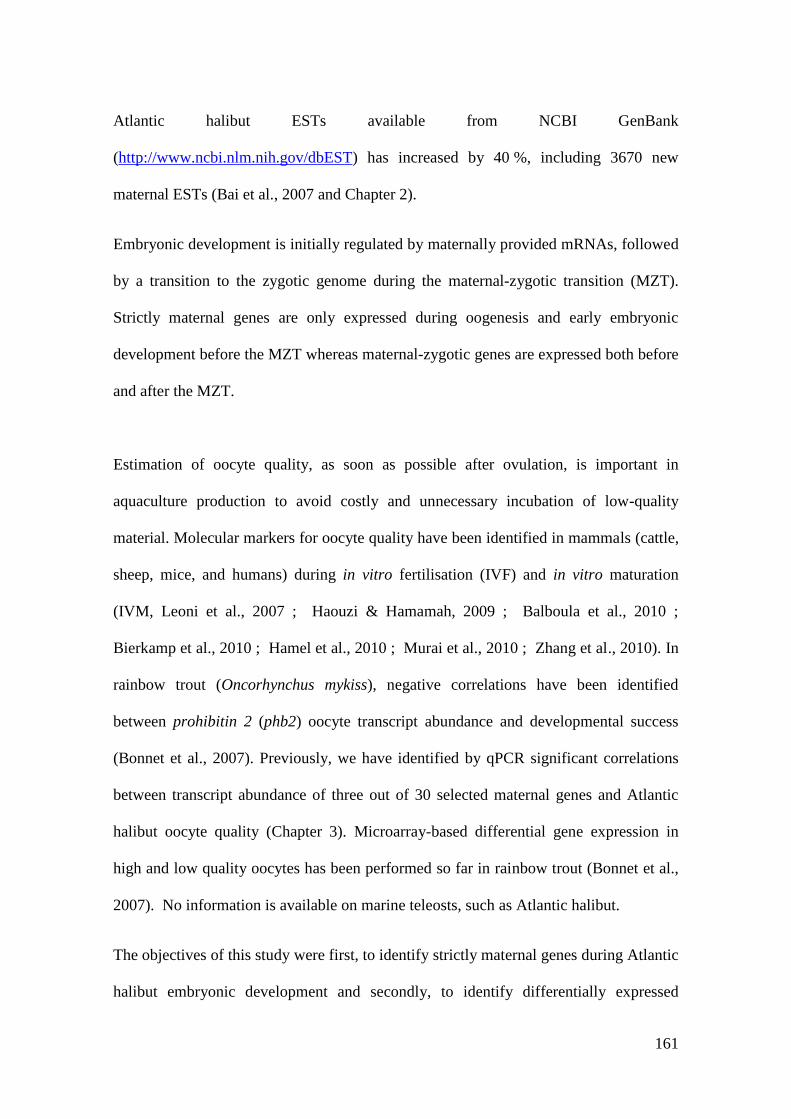
161
Atlantic halibut ESTs available from NCBI GenBank
(http://www.ncbi.nlm.nih.gov/dbEST) has increased by 40 %, including 3670 new
maternal ESTs (Bai et al., 2007 and Chapter 2).
Embryonic development is initially regulated by maternally provided mRNAs, followed
by a transition to the zygotic genome during the maternal-zygotic transition (MZT).
Strictly maternal genes are only expressed during oogenesis and early embryonic
development before the MZT whereas maternal-zygotic genes are expressed both before
and after the MZT.
Estimation of oocyte quality, as soon as possible after ovulation, is important in
aquaculture production to avoid costly and unnecessary incubation of low-quality
material. Molecular markers for oocyte quality have been identified in mammals (cattle,
sheep, mice, and humans) during in vitro fertilisation (IVF) and in vitro maturation
(IVM, Leoni et al., 2007 ; Haouzi & Hamamah, 2009 ; Balboula et al., 2010 ;
Bierkamp et al., 2010 ; Hamel et al., 2010 ; Murai et al., 2010 ; Zhang et al., 2010). In
rainbow trout (Oncorhynchus mykiss), negative correlations have been identified
between prohibitin 2 (phb2) oocyte transcript abundance and developmental success
(Bonnet et al., 2007). Previously, we have identified by qPCR significant correlations
between transcript abundance of three out of 30 selected maternal genes and Atlantic
halibut oocyte quality (Chapter 3). Microarray-based differential gene expression in
high and low quality oocytes has been performed so far in rainbow trout (Bonnet et al.,
2007). No information is available on marine teleosts, such as Atlantic halibut.
The objectives of this study were first, to identify strictly maternal genes during Atlantic
halibut embryonic development and secondly, to identify differentially expressed
162
maternal genes in high and low quality Atlantic halibut oocytes. For this, a new 4x44k
Atlantic halibut microarray suitable for gene expression studies during Atlantic halibut
embryonic development was created. Maternal gene expression profiling was performed
by identifying expression changes in four Atlantic halibut developmental stages: 8-cell
stage (8C), germ ring (GR), 10-somite stage or blastopore closure (10SS), and hatched
larvae (HT). Differential maternal gene expression was analysed between fertilized
Atlantic halibut oocytes (8C) who developed into embryos with high hatching rates
(≥ 86 ± 3% ) and low hatching rates (≤ 9 ± 3%). For both experiments, microarray data
were validated by quantitative real-time PCR (qPCR).
163
6.3 Material and Methods
6.3.1 Fish husbandry and sample collection
To screen strictly maternal genes during Atlantic halibut embryonic development,
normal developing embryos at different developmental stages and newly hatched larvae
were collected at a commercial Atlantic halibut farm (Risørfisk AS, Risør, Norway) in
2007 from four females. All oocytes were fertilized in vitro with pooled sperm from two
random males. The females weighed 30-40 kg, were fed EWOS Premix (EWOS,
Bergen, Norway) and kept under natural photoperiod conditions. At Risørfisk AS, eggs
were incubated in large scale 280 l incubators at salinity 34 ± 1 ‰ and temperature
6.3 ± 0.1 ºC. Relative embryonic hatching (%) was estimated by daily volumetric
measurements of dead embryos from incubators. From three oocyte batches, developing
into normal embryos and larvae, samples were taken at the 8-cell stage, 8 hours post
fertilisation (hpf, 8C); germ ring stage (GR), 82 hpf; 10-somite stage (10SS) 142 hpf;
and hatched larvae (HT) 340 hpf (Figure 6.1). Samples were snap-frozen in liquid
nitrogen.
To identify differentially expressed genes between high and low quality oocytes,
oocytes were collected at the University of Nordland (Bodø, Norway) from six females
(40-60 kg) kept under natural photoperiod conditions and fed Fish Breed-M (INVE
Aquaculture NV, Dendermonde, Belgium). All oocytes were fertilized in vitro with
pooled sperm from two random males. Eggs were incubated in Petri dishes at
5.5 ± 0.5 ºC in 33 ± 1 ‰ filtered seawater, added 0.5 % (v/v) penicillin-streptomycin-
neomycin solution (5000 U penicillin, 5 mg streptomycin, and 10 mg neomycin per ml,
Sigma, St. Louis, Mo, USA) until hatching. Samples were collected 8 hpf (8-cell stage)

164
to ensure that only fertilized oocytes were collected. Water in the Petri dishes was
changed at the germ ring stage, 3 days after fertilisation. Samples were snap-frozen in
liquid nitrogen. To estimate embryonic hatching rates, dead embryos were counted and
removed every second day until hatching. In total, three batches of high quality oocytes
(≥ 86 ± 3 % embryonic hatching) and low quality oocytes (≤ 9 ± 3 % embryonic
hatching) were used for further analysis (Table 6.1).
165
Figure 6.1 Atlantic halibut embryonic developmental stages.
A: 8-cell stage, 8 hours post fertilisation (hpf, 8C), B: germ ring stage (GR), 82 hpf, C:
10-somite stage (10SS) 142 hpf, and D: hatched larvae (HT) 340 hpf.
166
Table 6.1 Sample overview.
High (H) and low (L) quality oocytes collected from different Atlantic halibut females
at the University of Nordland, Norway. For each sample fertilisation and embryonic
hatching rates are given (% ± SD, n = 3).
Female Oocyte quality Fertilisation (% ± SD) Hatching (% ± SD)
Y30 H 96 ± 3
89 ± 1
Y46 H 91 ± 2
88 ± 1
G8 H 93 ± 1
86 ± 3
G39S L 13 ± 1
1 ± 0
O17 L 15 ± 2
3 ± 1
Y32 L 20 ± 4
9 ± 3
167
6.3.2 Microarray construction and probe design
Approximately 22,000 ESTs were obtained from the NCBI GenBank and subjected to
EST pre-processing, clustering and contig assembly using a local installation of
ESTExplorer (http://estexplorer.biolinfo.org) according to the workflow presented in
Figure 6.2. In essence, vectors were removed, low quality sequence repeats were
masked and the resulting sequences subjected to clustering and contig assembly using
semi-rigid parameters (CAP3 = 80 %, 50 ORFs). The resulting 3,105 consensus
sequences (contigs) and 7,174 single ESTs (singletons) were subjected to blasting,
mapping and annotation by a local installation of Blast2Go (http://www.blast2go.org/)
using default parameters with minor modifications. In short, sequences were blasted
against the NCBI non-redundant database using BLASTX (E = 10E-3
). These results
were complemented with a BLASTX against Uniprot. Sequences with blast hits were
then mapped against the Blast2Go database and resulting mapped sequences annotated
in a sequential manner according to decreasing cut-off values (1: E = 10E-6
, cut-off: 55,
HSP coverage cut-off: 75; 2: E = 10E-6
, cut-off: 55, HSP coverage cut-off: 0 and 3:
E = 10E-6
, cut-off: 60, HSP coverage cut-off: 0, Evidence code weight: ISS = 1.0,
IEA = 1.0). Gene ontology (GO) results were enriched by merging Interpro annotations
to existing GOs and the GOs augmented by ANNEX. GO distributions of array probes
were displayed after reducing GO complexity using GOslim (generic, Conesa & Götz,
2008). Redundant sequences were removed on the basis of sequence similarity (> 70 %
similarity) and array probe cross-hybridization potential. The resulting sequences were
subjected to 60-mer probe production by eArray
(https://earray.chem.agilent.com/earray/). Probes were printed in quadruples on a 4x44k
Agilent custom oligoarray (Agilent Technologies, Santa Clara, US).
168
6.3.3 RNA extraction, sample labelling and microarray hybridization
Total RNA for all samples was extracted according to the Tri reagent method (Sigma,
St-Louis, MO, USA) using QIAazol (Qiagen, Nydalen, Sweden). RNA quality was
preliminary checked by gel electrophoresis on a 1 % (v/w) agarose gel containing
SYBR safeTM
DNA gel stain (Invitrogen, Paisley, UK). Genomic DNA was removed by
DNAse treatment by Ambion Turbo DNA-free kit (Applied Biosystems, Austin, TX,
USA). RNA quality was controlled by photometric analyses (260/230 > 1.8,
260/280 > 1.5) using NanoDrop spectrophotometer (Nanodrop Technologies,
Wilmington, DE, USA). RNA integrity and quality was then estimated on Agilent 2100
Bioanalyzer and RNA integrity number (RIN) index was calculated for each sample
using the Agilent 2100 Expert software. RIN provides a numerical assessment of the
integrity of RNA that facilitates the standardization of the quality interpretation; for
microarray processing, only RNAs with RIN number > 8.0 were further processed to
reduce experimental biases due to poor RNA quality.
6.3.4 Sample labelling and hybridization
For each sample total RNA (200 ng µl-1
) was labelled and amplified with Cy3-dCTP in
duplicates using the Agilent Low Input Quick Amp Labelling kit according to the
manufacturer’s protocol. Samples were spiked with Agilent One-Color Spike-Mix
(1:10). The labelled and amplified cRNA was purified using the Qiagen RNease mini
spin kit. Cleaned cRNA was quantified using NanoDrop spectrophotometer. All
samples had cRNA yields > 1.65 and Cy3 specific activity > 6.0. Samples were
hybridized to the 4x44k custom made Atlantic halibut oligonucleotide microarrays at
65 ºC for 17 h. After hybridization, all arrays were washed according to manufacturer’s
169
protocol followed by a final acetonitrile wash. Slides were immediately scanned using
an Agilent High density microarray scanner at 5 µm resolution (Agilent Technologies).
6.3.5 Microarray design
In total 20 samples were randomly hybridized onto five 4x44k custom microarray
slides. For each of the four embryonic stages (8C, GR, 10SS and HT) and high and low
quality oocytes three samples were hybridized.
6.3.6 Microarray validation by quantitative real-time PCR (qPCR)
To confirm gene expression results obtained from microarray analysis, primers were
designed for 20 genes that were found to be differentially expressed between high and
low quality oocytes (Table 6.2). RNA was extracted and cDNA synthesized as
described in Chapter 3 from high (≥ 80 ± 2 % embryonic hatching, n = 8) and low
(≤ 30 ± 3 % embryonic hatching, n = 8) quality oocytes at 8C and from normal
developing oocytes, at 8C, GR, 10SS, and HT (n = 5). Before cDNA synthesis, 1 pg
luciferase (Luc) RNA (Promega, Madison, WI, US) was added to the total RNA
extracted from normal developing eggs as external standard. Primers were selected as
close to the 3’ end of the respective EST’s for each gene. Whenever possible, primers
were designed to cross at least one intron/exon border containing both donor and
acceptor sites, in order to avoid amplification of any contaminating genomic DNA.
Primer pairs for qPCR amplification were designed manually and screened for hairpins,
homo- and cross-dimers using Netprimer (http://www.premierbiosoft.com/netprimer/).
qPCR was performed as described in Chapter 3. Relative gene expression in high and
low quality eggs was normalized using β-Actin (Actb) and β2-tubulin (Tubb2).
Luciferase (Luc) was used as an external reference gene during embryonic development
170
(Figure 6.4). Expression data of mhc2dab and HHC_90596347 during embryonic
development was filtered out during microarray data analysis and were not validated by
qPCR in this set of samples.
6.3.7 Data analysis
Scanned images were analyzed with Agilent feature extraction Software Version 7.2
(Figure 6.3). Resulting raw data were normalized (25 Quantile, median to baseline of all
samples). Features were filtered based on their signal intensity values by satisfying the
upper and lower percentile cut-offs 20-100 % and outlier removed with GeneSpring GX
10.0.2 (Agilent Technologies). All data were filtered for missing values and replaced by
row mean imputation. Gene expression analysis (limma) and functional profiling
(FatiGO) was performed using the Babelomics 4.0 analysis suite
(http://babelomics.bioinfo.cipf.es). A cut-off of ≥ 0.5 was applied in addition to standard
background correction to remove features close to the mean low intensity threshold
across all arrays (0.38 ± 0.19). Hierarchical clustering of differentially expressed genes
during embryonic development was performed using the un-weighted pair-group
method with arithmetic averages (UPGMA) using normal Euclidian distance as distance
measurement and a ≥ 2 cut-off on average expression of each stage. Data were
standardized against the first stage, 8C. Functional enrichment analysis of gene
ontology terms (GO), associated with resulting gene clusters, was performed using
FatiGO with FDR multiple-test correction (p < 0.05, Al-Shahrour et al., 2004).
Differentially expressed genes between low and high quality eggs and four embryonic
developmental stages were estimated using limma with Benjamin and Hochberg false
discovery rate (FDR) multiple-test correction (p < 0.05, (Benjamini & Hochberg, 1995 ;
Smyth, 2004). Gene set enrichment analysis in differentially expressed genes was
171
performed using FatiGO with FDR multiple-test correction (p < 0.05, Al-Shahrour et
al., 2004). Differentially expressed gene ESTs with no significant BLAST hits were
translated using EMBOSS Transeq (http://www.ebi.ac.uk/Tools/emboss/transeq) and
searched for conserved domains
(http://www.ncbi.nlm.nih.gov/Structure/cdd/cdd.shtml). For microarray validation,
qPCR data were log2 transformed to be comparable with microarray results. Correlation
between qPCR and microarray data were estimated by Spearman’s Rho (ϱ). Significant
fold-change differences in relative gene expression between high and low quality
oocytes estimated by qPCR were estimated by Mann-Whitney U (p < 0.05).
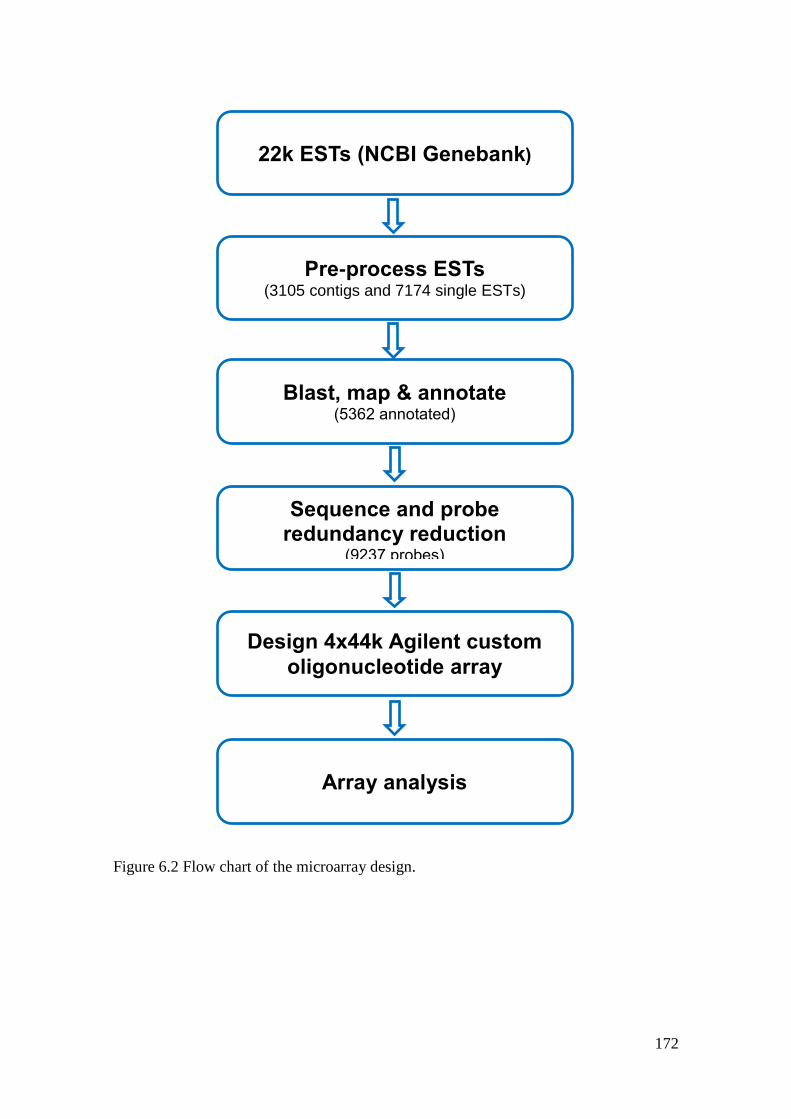
172
Figure 6.2 Flow chart of the microarray design.
22k ESTs (NCBI Genebank)
Pre-process ESTs (3105 contigs and 7174 single ESTs)
Design 4x44k Agilent custom
oligonucleotide array
Blast, map & annotate (5362 annotated)
Sequence and probe redundancy reduction
(9237 probes)
Array analysis
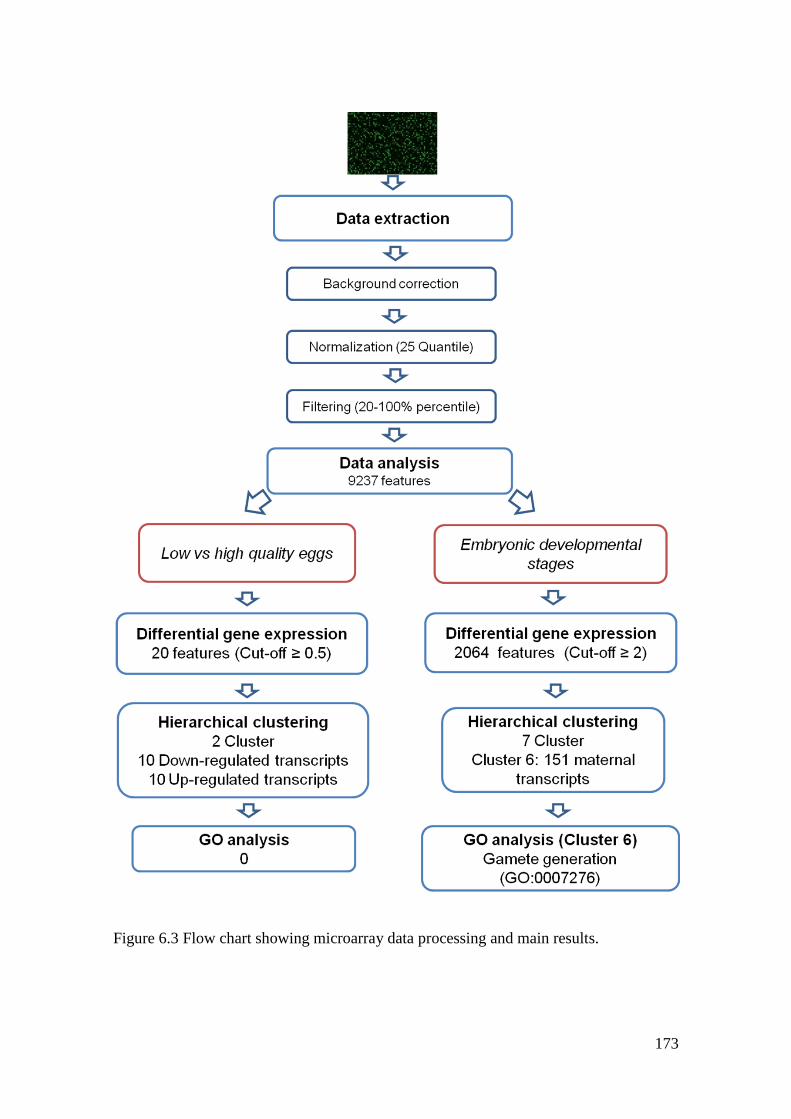
173
Figure 6.3 Flow chart showing microarray data processing and main results.
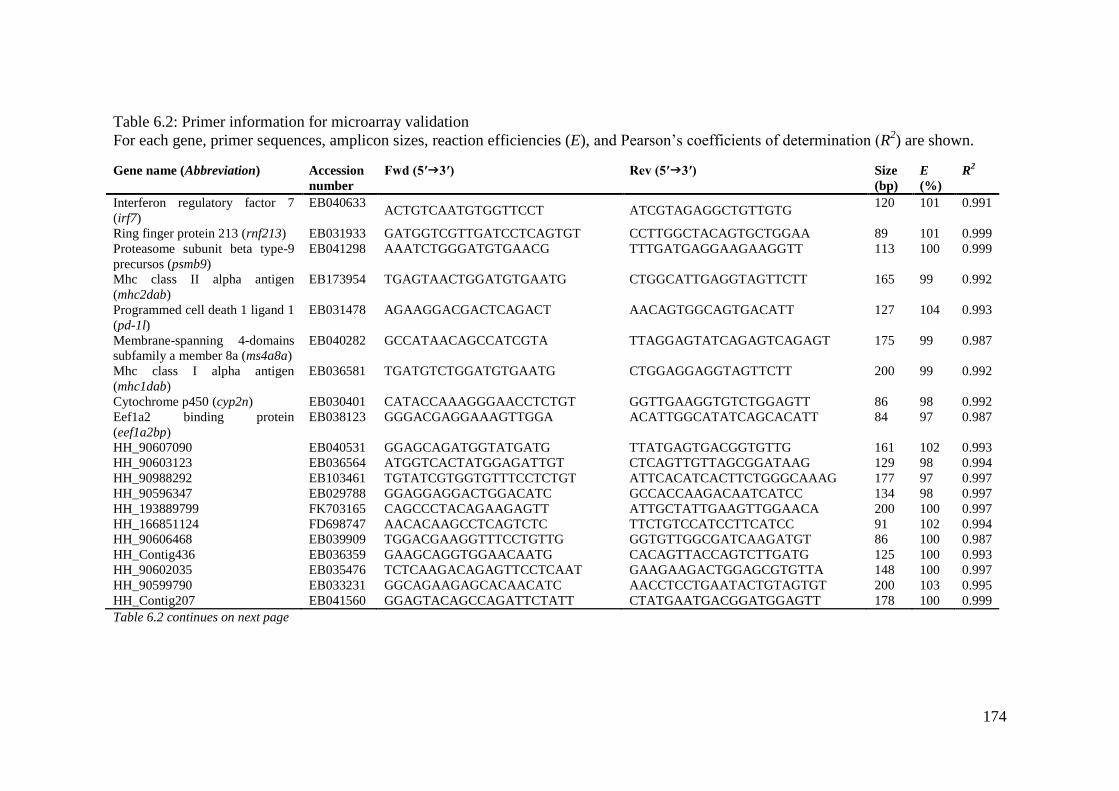
174
Table 6.2: Primer information for microarray validation
For each gene, primer sequences, amplicon sizes, reaction efficiencies (E), and Pearson’s coefficients of determination (R2) are shown.
Gene name (Abbreviation) Accession
number
Fwd (5ʹ3ʹ) Rev (5ʹ3ʹ) Size
(bp)
E
(%)
R2
Interferon regulatory factor 7
(irf7)
EB040633 ACTGTCAATGTGGTTCCT ATCGTAGAGGCTGTTGTG
120 101 0.991
Ring finger protein 213 (rnf213) EB031933 GATGGTCGTTGATCCTCAGTGT CCTTGGCTACAGTGCTGGAA 89 101 0.999
Proteasome subunit beta type-9
precursos (psmb9)
EB041298 AAATCTGGGATGTGAACG
TTTGATGAGGAAGAAGGTT
113 100 0.999
Mhc class II alpha antigen
(mhc2dab)
EB173954 TGAGTAACTGGATGTGAATG CTGGCATTGAGGTAGTTCTT 165 99 0.992
Programmed cell death 1 ligand 1
(pd-1l)
EB031478 AGAAGGACGACTCAGACT AACAGTGGCAGTGACATT 127 104 0.993
Membrane-spanning 4-domains
subfamily a member 8a (ms4a8a)
EB040282 GCCATAACAGCCATCGTA
TTAGGAGTATCAGAGTCAGAGT
175 99 0.987
Mhc class I alpha antigen
(mhc1dab)
EB036581 TGATGTCTGGATGTGAATG CTGGAGGAGGTAGTTCTT 200 99 0.992
Cytochrome p450 (cyp2n) EB030401 CATACCAAAGGGAACCTCTGT GGTTGAAGGTGTCTGGAGTT 86 98 0.992
Eef1a2 binding protein
(eef1a2bp)
EB038123 GGGACGAGGAAAGTTGGA ACATTGGCATATCAGCACATT 84 97 0.987
HH_90607090 EB040531 GGAGCAGATGGTATGATG TTATGAGTGACGGTGTTG 161 102 0.993
HH_90603123 EB036564 ATGGTCACTATGGAGATTGT CTCAGTTGTTAGCGGATAAG 129 98 0.994
HH_90988292 EB103461 TGTATCGTGGTGTTTCCTCTGT ATTCACATCACTTCTGGGCAAAG 177 97 0.997
HH_90596347 EB029788 GGAGGAGGACTGGACATC GCCACCAAGACAATCATCC 134 98 0.997
HH_193889799 FK703165 CAGCCCTACAGAAGAGTT ATTGCTATTGAAGTTGGAACA 200 100 0.997
HH_166851124 FD698747 AACACAAGCCTCAGTCTC TTCTGTCCATCCTTCATCC 91 102 0.994
HH_90606468 EB039909 TGGACGAAGGTTTCCTGTTG GGTGTTGGCGATCAAGATGT 86 100 0.987
HH_Contig436 EB036359 GAAGCAGGTGGAACAATG CACAGTTACCAGTCTTGATG 125 100 0.993
HH_90602035 EB035476 TCTCAAGACAGAGTTCCTCAAT GAAGAAGACTGGAGCGTGTTA 148 100 0.997
HH_90599790 EB033231 GGCAGAAGAGCACAACATC AACCTCCTGAATACTGTAGTGT 200 103 0.995
HH_Contig207 EB041560 GGAGTACAGCCAGATTCTATT CTATGAATGACGGATGGAGTT 178 100 0.999
Table 6.2 continues on next page
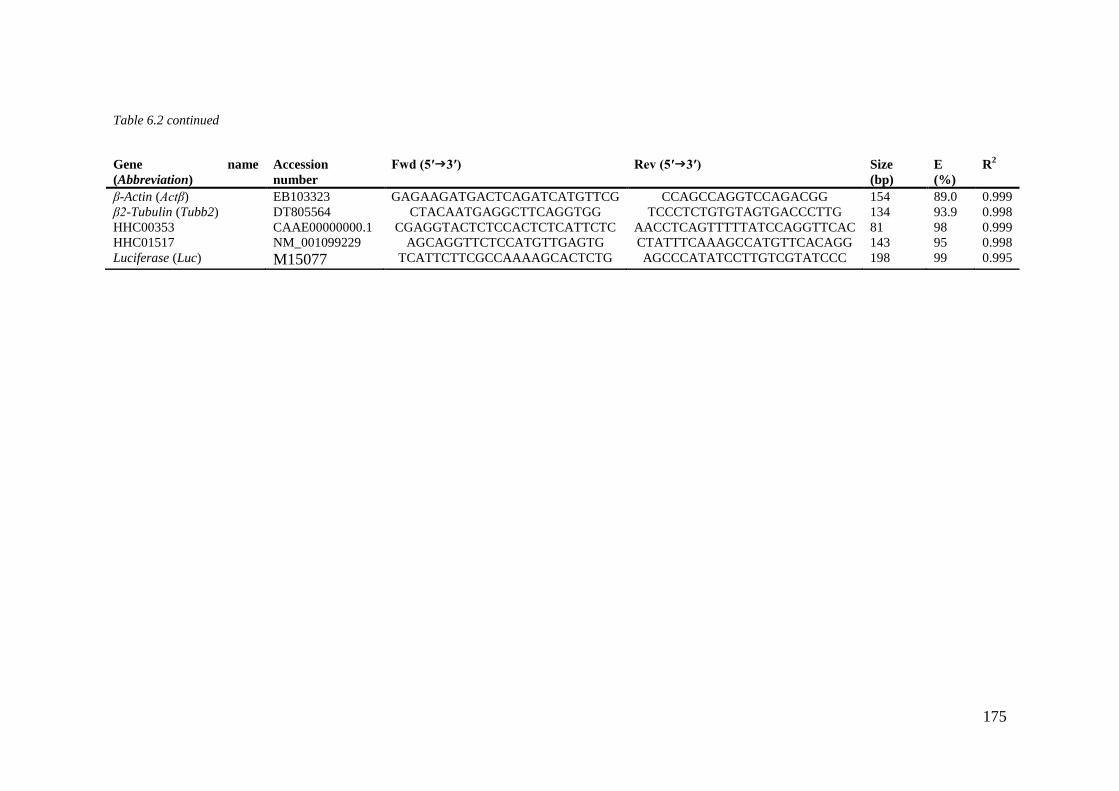
175
Table 6.2 continued
Gene name
(Abbreviation)
Accession
number
Fwd (5ʹ3ʹ) Rev (5ʹ3ʹ) Size
(bp)
E
(%)
R2
β-Actin (Actβ) EB103323 GAGAAGATGACTCAGATCATGTTCG CCAGCCAGGTCCAGACGG 154 89.0 0.999
β2-Tubulin (Tubb2) DT805564 CTACAATGAGGCTTCAGGTGG TCCCTCTGTGTAGTGACCCTTG 134 93.9 0.998
HHC00353 CAAE00000000.1 CGAGGTACTCTCCACTCTCATTCTC AACCTCAGTTTTTATCCAGGTTCAC 81 98 0.999
HHC01517 NM_001099229 AGCAGGTTCTCCATGTTGAGTG CTATTTCAAAGCCATGTTCACAGG 143 95 0.998
Luciferase (Luc)
M15077 TCATTCTTCGCCAAAAGCACTCTG AGCCCATATCCTTGTCGTATCCC 198
99 0.995
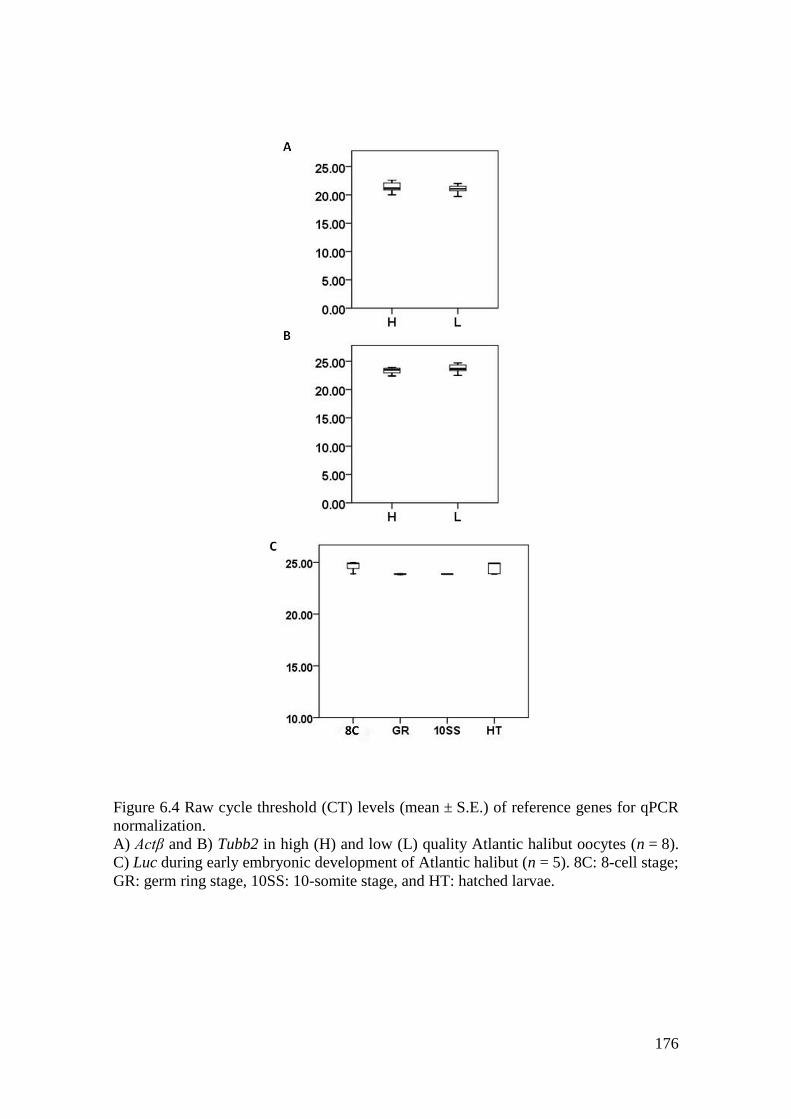
176
Figure 6.4 Raw cycle threshold (CT) levels (mean ± S.E.) of reference genes for qPCR
normalization.
A) Actβ and B) Tubb2 in high (H) and low (L) quality Atlantic halibut oocytes (n = 8).
C) Luc during early embryonic development of Atlantic halibut (n = 5). 8C: 8-cell stage;
GR: germ ring stage, 10SS: 10-somite stage, and HT: hatched larvae.
177
6.4 Results
6.4.1 Gene ontology
Of the 9237 probes designed and printed onto the microarray, 5364 (58 %) represented
genes with putative identification based on sequence similarity by BLASTX searches
(cut-off E = 1E-6
). GO annotations were obtained for 5009 (54 %) probes (Figure 6.5).
Most probes (61 %) were classified as representing genes involved in cellular (24 %),
metabolic (23 %), and regulatory processes (14 %). Their molecular function was
dominated by binding (50 %) and catalytic activities (31 %) and cellular compartments
were cell (43 %) and organelle (31 %). A full list of GO annotation for the three
domains is presented in supplementary tables C-E.
6.4.2 Maternal gene expression profiling during embryonic development
Changes in gene expression between embryonic developmental stages were analyzed by
limma at a 5 % FDR. In total, 2,064 genes being differentially expressed between at
least two developmental stages (Cut-off: ≥ 2; Figure 6.6) were found. Hierarchical
clustering of the differentially expressed genes resulted in seven clusters (CL1-7,
Figure 6.6). GO analysis identified no significantly enriched GOs in CL1 (29 genes) and
CL5 (65 genes). Genes in CL3 (494 genes), CL4 (276 genes), and CL7 (21 genes) were
significantly enriched with GOs for biological processes (Table 6.3, p < 0.05). CL3 and
CL4 were enriched with zygotic genes involved in cellular metabolic processes, such as
oxidative phosphorylation (GO:0006119) and RNA processing (GO:0006396). CL7
was enriched with maternal-zygotic genes involved in multi-cellular organismal
processes, such as muscle contraction (GO:0006936).
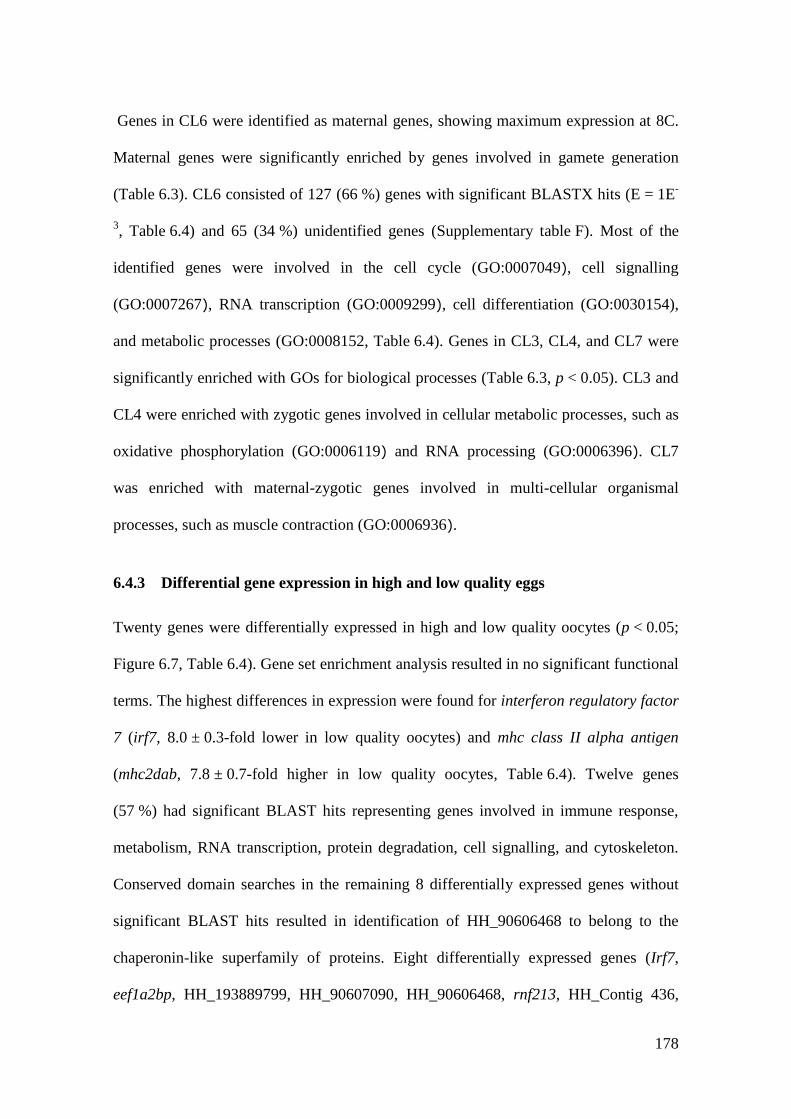
178
Genes in CL6 were identified as maternal genes, showing maximum expression at 8C.
Maternal genes were significantly enriched by genes involved in gamete generation
(Table 6.3). CL6 consisted of 127 (66 %) genes with significant BLASTX hits (E = 1E-
3, Table 6.4) and 65 (34 %) unidentified genes (Supplementary table F). Most of the
identified genes were involved in the cell cycle (GO:0007049), cell signalling
(GO:0007267), RNA transcription (GO:0009299), cell differentiation (GO:0030154),
and metabolic processes (GO:0008152, Table 6.4). Genes in CL3, CL4, and CL7 were
significantly enriched with GOs for biological processes (Table 6.3, p < 0.05). CL3 and
CL4 were enriched with zygotic genes involved in cellular metabolic processes, such as
oxidative phosphorylation (GO:0006119) and RNA processing (GO:0006396). CL7
was enriched with maternal-zygotic genes involved in multi-cellular organismal
processes, such as muscle contraction (GO:0006936).
6.4.3 Differential gene expression in high and low quality eggs
Twenty genes were differentially expressed in high and low quality oocytes (p < 0.05;
Figure 6.7, Table 6.4). Gene set enrichment analysis resulted in no significant functional
terms. The highest differences in expression were found for interferon regulatory factor
7 (irf7, 8.0 ± 0.3-fold lower in low quality oocytes) and mhc class II alpha antigen
(mhc2dab, 7.8 ± 0.7-fold higher in low quality oocytes, Table 6.4). Twelve genes
(57 %) had significant BLAST hits representing genes involved in immune response,
metabolism, RNA transcription, protein degradation, cell signalling, and cytoskeleton.
Conserved domain searches in the remaining 8 differentially expressed genes without
significant BLAST hits resulted in identification of HH_90606468 to belong to the
chaperonin-like superfamily of proteins. Eight differentially expressed genes (Irf7,
eef1a2bp, HH_193889799, HH_90607090, HH_90606468, rnf213, HH_Contig 436,
179
and pd-l1) showed strictly maternal gene expression (no expression at 10SS and HT)
according the microarray expression results (Figure 6.8: A, D, F, G, I, J, K, O).
6.4.4 Microarray validation
A significant correlation was found between qPCR and microarray results (ϱ = 0.88,
p < 0.0001, n = 276; Figure 6.9). Significant levels of gene expression in high and low
quality oocytes were confirmed for the 20 differentially expressed genes by qPCR
(Table 6.5). High differences of irf7 and mhc2dab expression levels in high and low
quality oocytes were confirmed, but were higher for irf7 (0.9-fold) and lower for
mhc2dab (1.7-fold), compared to microarray results. Differential gene expression was
estimated to be higher (0.1-0.9-fold change difference) for 14 and lower for 6 genes
(0.2-1.7-fold change difference), compared to microarray results (Table 6.5). Expression
patterns of the differentially expressed genes during embryonic development followed
the same general trend when estimated by qPCR with a few exceptions. Microarray
relative expression data revealed strictly maternal expression (no expression at 10SS
and HT) of eight genes (Figure 6.8: A, D, F, G, I, J, K, O) while according to qPCR
data, five genes were strictly maternally expressed (Figure 6.8: D, F, G, K O).
Membrane-spanning 4-domains subfamily a member 8a (ms4a8a) was strictly
zygotically expressed (no expression before stage 10SS) according to microarray
results, but showed maternal-zygotic expression (expressed at all four developmental
stages) according to qPCR expression results (Figure 6.8: P). HH_Contig207 expression
was detected at 8C and HT by microarray and addition in GR by qPCR (Figure 6.8: Q).
Mhc class I alpha antigen (mhc1dab) expression was estimated in GR and HT by
microarray, but only in GR by qPCR (Figure 6.8: R). For 14, out of 20 tested genes,

180
qPCR expression levels were up to 1.5 times higher in one or more developmental
stages, compared to microarray results (Figure 6.8).
181
Figure 6.5 GO annotations for 4x44k Atlantic halibut microarray.
A: Biological processes, B: Molecular functions, C: Cell components.
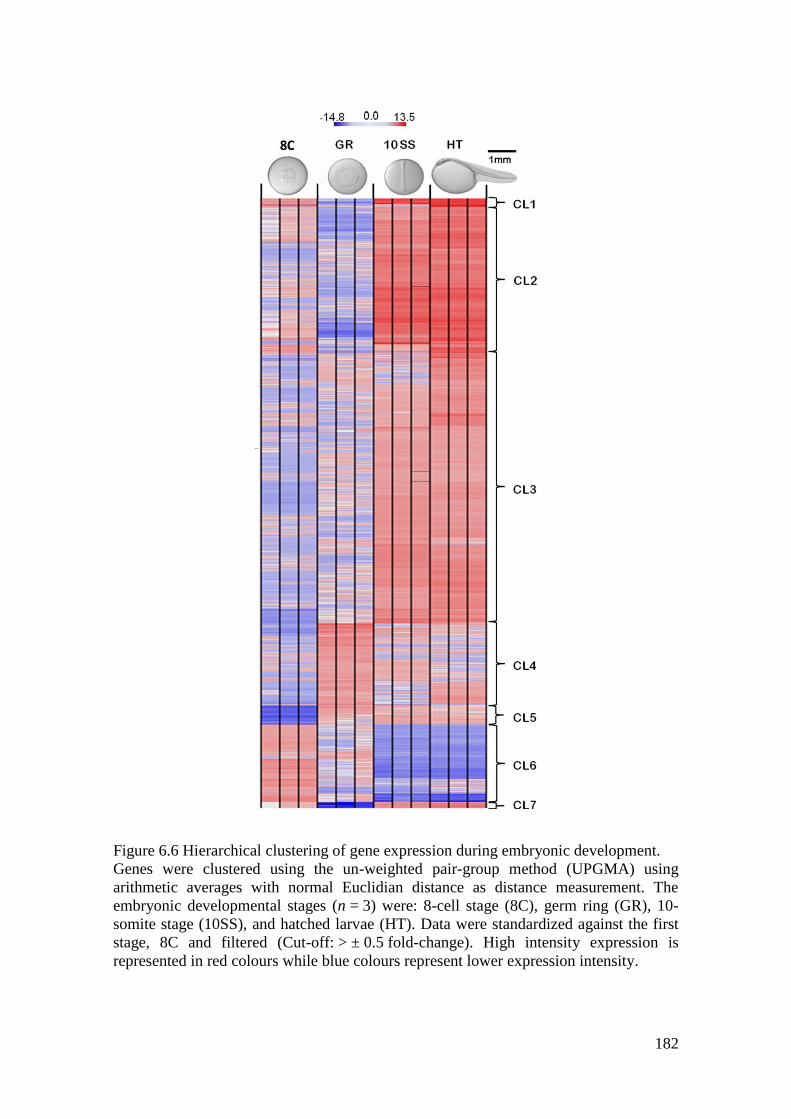
182
Figure 6.6 Hierarchical clustering of gene expression during embryonic development.
Genes were clustered using the un-weighted pair-group method (UPGMA) using
arithmetic averages with normal Euclidian distance as distance measurement. The
embryonic developmental stages (n = 3) were: 8-cell stage (8C), germ ring (GR), 10-
somite stage (10SS), and hatched larvae (HT). Data were standardized against the first
stage, 8C and filtered (Cut-off: > ± 0.5 fold-change). High intensity expression is
represented in red colours while blue colours represent lower expression intensity.
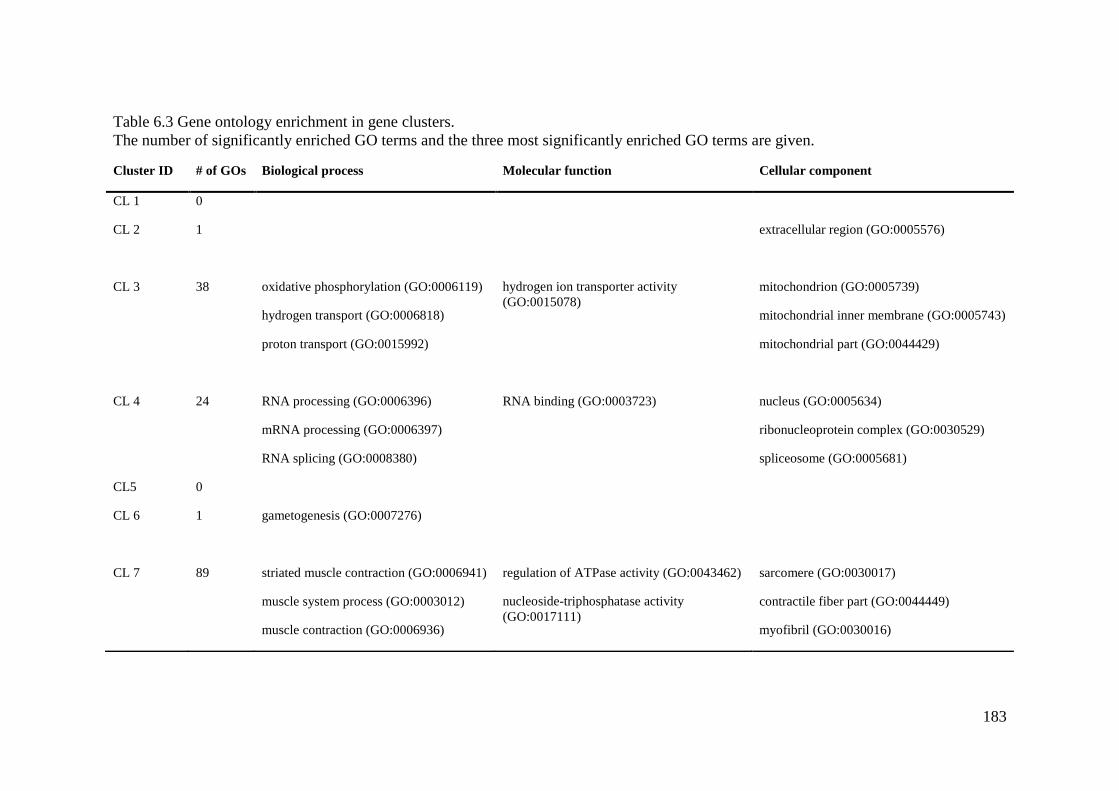
183
Table 6.3 Gene ontology enrichment in gene clusters.
The number of significantly enriched GO terms and the three most significantly enriched GO terms are given.
Cluster ID # of GOs Biological process Molecular function Cellular component
CL 1 0
CL 2 1 extracellular region (GO:0005576)
CL 3 38 oxidative phosphorylation (GO:0006119)
hydrogen transport (GO:0006818)
proton transport (GO:0015992)
hydrogen ion transporter activity
(GO:0015078)
mitochondrion (GO:0005739)
mitochondrial inner membrane (GO:0005743)
mitochondrial part (GO:0044429)
CL 4 24 RNA processing (GO:0006396)
mRNA processing (GO:0006397)
RNA splicing (GO:0008380)
RNA binding (GO:0003723)
nucleus (GO:0005634)
ribonucleoprotein complex (GO:0030529)
spliceosome (GO:0005681)
CL5 0
CL 6 1 gametogenesis (GO:0007276)
CL 7 89 striated muscle contraction (GO:0006941)
muscle system process (GO:0003012)
muscle contraction (GO:0006936)
regulation of ATPase activity (GO:0043462)
nucleoside-triphosphatase activity
(GO:0017111)
sarcomere (GO:0030017)
contractile fiber part (GO:0044449)
myofibril (GO:0030016)
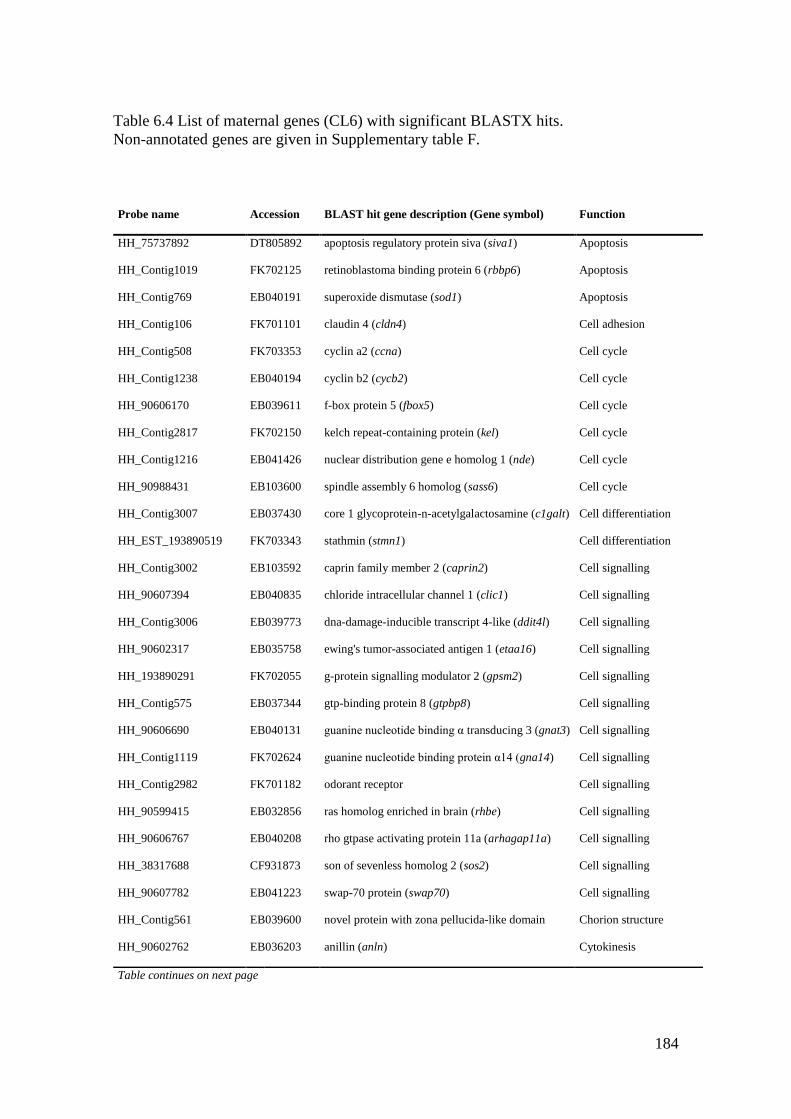
184
Table 6.4 List of maternal genes (CL6) with significant BLASTX hits.
Non-annotated genes are given in Supplementary table F.
Probe name Accession BLAST hit gene description (Gene symbol) Function
HH_75737892 DT805892 apoptosis regulatory protein siva (siva1) Apoptosis
HH_Contig1019 FK702125 retinoblastoma binding protein 6 (rbbp6) Apoptosis
HH_Contig769 EB040191 superoxide dismutase (sod1) Apoptosis
HH_Contig106 FK701101 claudin 4 (cldn4) Cell adhesion
HH_Contig508 FK703353 cyclin a2 (ccna) Cell cycle
HH_Contig1238 EB040194 cyclin b2 (cycb2) Cell cycle
HH_90606170 EB039611 f-box protein 5 (fbox5) Cell cycle
HH_Contig2817 FK702150 kelch repeat-containing protein (kel) Cell cycle
HH_Contig1216 EB041426 nuclear distribution gene e homolog 1 (nde) Cell cycle
HH_90988431 EB103600 spindle assembly 6 homolog (sass6) Cell cycle
HH_Contig3007 EB037430 core 1 glycoprotein-n-acetylgalactosamine (c1galt) Cell differentiation
HH_EST_193890519 FK703343 stathmin (stmn1) Cell differentiation
HH_Contig3002 EB103592 caprin family member 2 (caprin2) Cell signalling
HH_90607394 EB040835 chloride intracellular channel 1 (clic1) Cell signalling
HH_Contig3006 EB039773 dna-damage-inducible transcript 4-like (ddit4l) Cell signalling
HH_90602317 EB035758 ewing's tumor-associated antigen 1 (etaa16) Cell signalling
HH_193890291 FK702055 g-protein signalling modulator 2 (gpsm2) Cell signalling
HH_Contig575 EB037344 gtp-binding protein 8 (gtpbp8) Cell signalling
HH_90606690 EB040131 guanine nucleotide binding α transducing 3 (gnat3) Cell signalling
HH_Contig1119 FK702624 guanine nucleotide binding protein α14 (gna14) Cell signalling
HH_Contig2982 FK701182 odorant receptor Cell signalling
HH_90599415 EB032856 ras homolog enriched in brain (rhbe) Cell signalling
HH_90606767 EB040208 rho gtpase activating protein 11a (arhagap11a) Cell signalling
HH_38317688 CF931873 son of sevenless homolog 2 (sos2) Cell signalling
HH_90607782 EB041223 swap-70 protein (swap70) Cell signalling
HH_Contig561 EB039600 novel protein with zona pellucida-like domain Chorion structure
HH_90602762 EB036203 anillin (anln) Cytokinesis
Table continues on next page
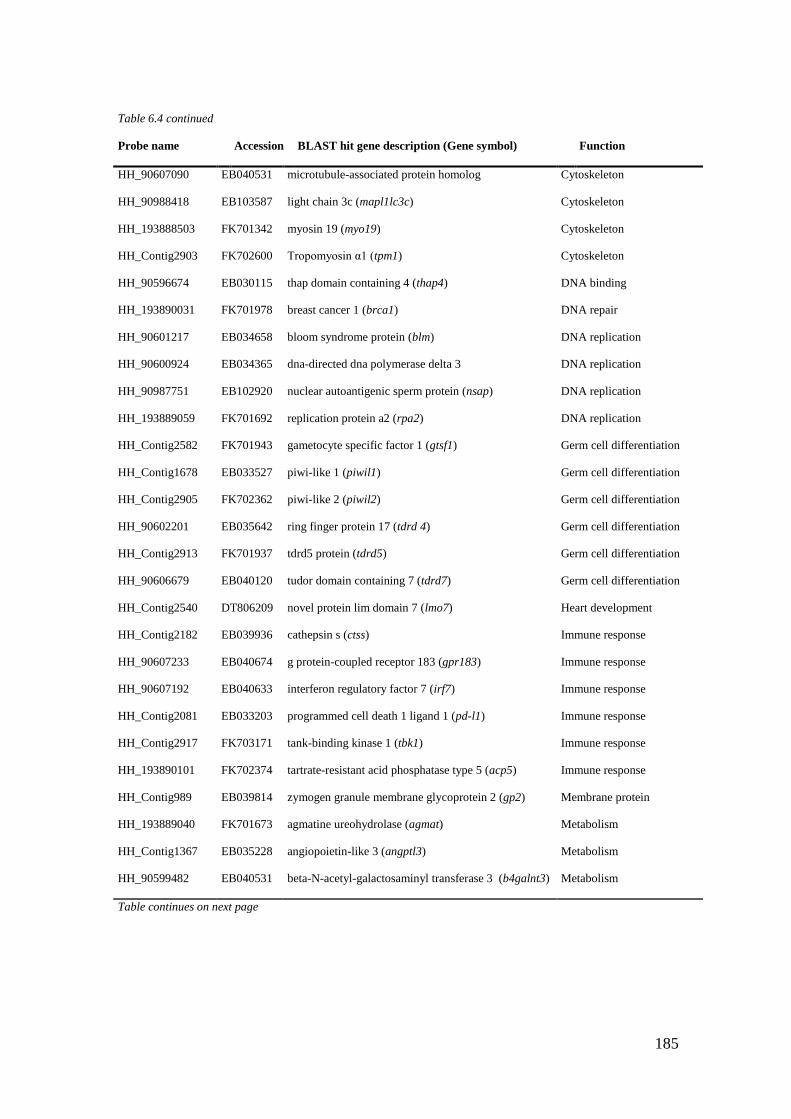
185
Table 6.4 continued
Probe name Accession BLAST hit gene description (Gene symbol) Function
HH_90607090 EB040531 microtubule-associated protein homolog Cytoskeleton
HH_90988418 EB103587 light chain 3c (mapl1lc3c) Cytoskeleton
HH_193888503 FK701342 myosin 19 (myo19) Cytoskeleton
HH_Contig2903 FK702600 Tropomyosin α1 (tpm1) Cytoskeleton
HH_90596674 EB030115 thap domain containing 4 (thap4) DNA binding
HH_193890031 FK701978 breast cancer 1 (brca1) DNA repair
HH_90601217 EB034658 bloom syndrome protein (blm) DNA replication
HH_90600924 EB034365 dna-directed dna polymerase delta 3 DNA replication
HH_90987751 EB102920 nuclear autoantigenic sperm protein (nsap) DNA replication
HH_193889059 FK701692 replication protein a2 (rpa2) DNA replication
HH_Contig2582 FK701943 gametocyte specific factor 1 (gtsf1) Germ cell differentiation
HH_Contig1678 EB033527 piwi-like 1 (piwil1) Germ cell differentiation
HH_Contig2905 FK702362 piwi-like 2 (piwil2) Germ cell differentiation
HH_90602201 EB035642 ring finger protein 17 (tdrd 4) Germ cell differentiation
HH_Contig2913 FK701937 tdrd5 protein (tdrd5) Germ cell differentiation
HH_90606679 EB040120 tudor domain containing 7 (tdrd7) Germ cell differentiation
HH_Contig2540 DT806209 novel protein lim domain 7 (lmo7) Heart development
HH_Contig2182 EB039936 cathepsin s (ctss) Immune response
HH_90607233 EB040674 g protein-coupled receptor 183 (gpr183) Immune response
HH_90607192 EB040633 interferon regulatory factor 7 (irf7) Immune response
HH_Contig2081 EB033203 programmed cell death 1 ligand 1 (pd-l1) Immune response
HH_Contig2917 FK703171 tank-binding kinase 1 (tbk1) Immune response
HH_193890101 FK702374 tartrate-resistant acid phosphatase type 5 (acp5) Immune response
HH_Contig989 EB039814 zymogen granule membrane glycoprotein 2 (gp2) Membrane protein
HH_193889040 FK701673 agmatine ureohydrolase (agmat) Metabolism
HH_Contig1367 EB035228 angiopoietin-like 3 (angptl3) Metabolism
HH_90599482 EB040531 beta-N-acetyl-galactosaminyl transferase 3 (b4galnt3) Metabolism
Table continues on next page
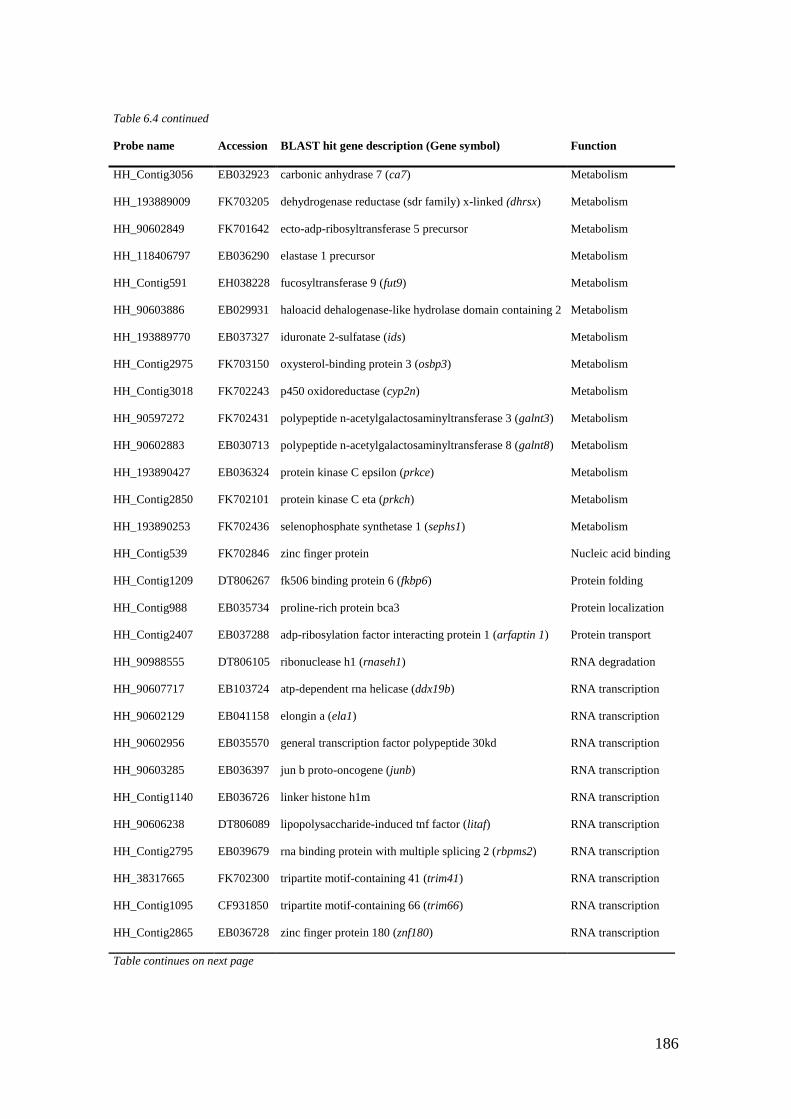
186
Table 6.4 continued
Probe name Accession BLAST hit gene description (Gene symbol) Function
HH_Contig3056 EB032923 carbonic anhydrase 7 (ca7) Metabolism
HH_193889009 FK703205 dehydrogenase reductase (sdr family) x-linked (dhrsx) Metabolism
HH_90602849 FK701642 ecto-adp-ribosyltransferase 5 precursor Metabolism
HH_118406797 EB036290 elastase 1 precursor Metabolism
HH_Contig591 EH038228 fucosyltransferase 9 (fut9) Metabolism
HH_90603886 EB029931 haloacid dehalogenase-like hydrolase domain containing 2 Metabolism
HH_193889770 EB037327 iduronate 2-sulfatase (ids) Metabolism
HH_Contig2975 FK703150 oxysterol-binding protein 3 (osbp3) Metabolism
HH_Contig3018 FK702243 p450 oxidoreductase (cyp2n) Metabolism
HH_90597272 FK702431 polypeptide n-acetylgalactosaminyltransferase 3 (galnt3) Metabolism
HH_90602883 EB030713 polypeptide n-acetylgalactosaminyltransferase 8 (galnt8) Metabolism
HH_193890427 EB036324 protein kinase C epsilon (prkce) Metabolism
HH_Contig2850 FK702101 protein kinase C eta (prkch) Metabolism
HH_193890253 FK702436 selenophosphate synthetase 1 (sephs1) Metabolism
HH_Contig539 FK702846 zinc finger protein Nucleic acid binding
HH_Contig1209 DT806267 fk506 binding protein 6 (fkbp6) Protein folding
HH_Contig988 EB035734 proline-rich protein bca3 Protein localization
HH_Contig2407 EB037288 adp-ribosylation factor interacting protein 1 (arfaptin 1) Protein transport
HH_90988555 DT806105 ribonuclease h1 (rnaseh1) RNA degradation
HH_90607717 EB103724 atp-dependent rna helicase (ddx19b) RNA transcription
HH_90602129 EB041158 elongin a (ela1) RNA transcription
HH_90602956 EB035570 general transcription factor polypeptide 30kd RNA transcription
HH_90603285 EB036397 jun b proto-oncogene (junb) RNA transcription
HH_Contig1140 EB036726 linker histone h1m RNA transcription
HH_90606238 DT806089 lipopolysaccharide-induced tnf factor (litaf) RNA transcription
HH_Contig2795 EB039679 rna binding protein with multiple splicing 2 (rbpms2) RNA transcription
HH_38317665 FK702300 tripartite motif-containing 41 (trim41) RNA transcription
HH_Contig1095 CF931850 tripartite motif-containing 66 (trim66) RNA transcription
HH_Contig2865 EB036728 zinc finger protein 180 (znf180) RNA transcription
Table continues on next page
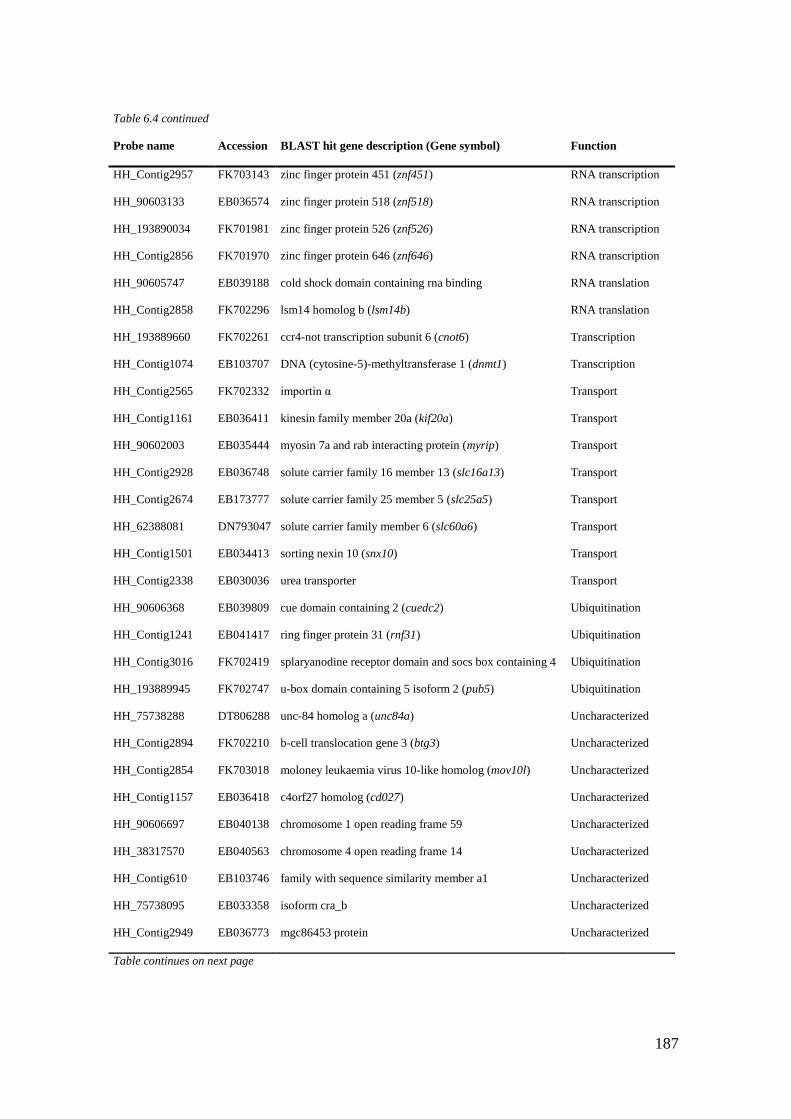
187
Table 6.4 continued
Probe name Accession BLAST hit gene description (Gene symbol) Function
HH_Contig2957 FK703143 zinc finger protein 451 (znf451) RNA transcription
HH_90603133 EB036574 zinc finger protein 518 (znf518) RNA transcription
HH_193890034 FK701981 zinc finger protein 526 (znf526) RNA transcription
HH_Contig2856 FK701970 zinc finger protein 646 (znf646) RNA transcription
HH_90605747 EB039188 cold shock domain containing rna binding RNA translation
HH_Contig2858 FK702296 lsm14 homolog b (lsm14b) RNA translation
HH_193889660 FK702261 ccr4-not transcription subunit 6 (cnot6) Transcription
HH_Contig1074 EB103707 DNA (cytosine-5)-methyltransferase 1 (dnmt1) Transcription
HH_Contig2565 FK702332 importin α Transport
HH_Contig1161 EB036411 kinesin family member 20a (kif20a) Transport
HH_90602003 EB035444 myosin 7a and rab interacting protein (myrip) Transport
HH_Contig2928 EB036748 solute carrier family 16 member 13 (slc16a13) Transport
HH_Contig2674 EB173777 solute carrier family 25 member 5 (slc25a5) Transport
HH_62388081 DN793047 solute carrier family member 6 (slc60a6) Transport
HH_Contig1501 EB034413 sorting nexin 10 (snx10) Transport
HH_Contig2338 EB030036 urea transporter Transport
HH_90606368 EB039809 cue domain containing 2 (cuedc2) Ubiquitination
HH_Contig1241 EB041417 ring finger protein 31 (rnf31) Ubiquitination
HH_Contig3016 FK702419 splaryanodine receptor domain and socs box containing 4 Ubiquitination
HH_193889945 FK702747 u-box domain containing 5 isoform 2 (pub5) Ubiquitination
HH_75738288 DT806288 unc-84 homolog a (unc84a) Uncharacterized
HH_Contig2894 FK702210 b-cell translocation gene 3 (btg3) Uncharacterized
HH_Contig2854 FK703018 moloney leukaemia virus 10-like homolog (mov10l) Uncharacterized
HH_Contig1157 EB036418 c4orf27 homolog (cd027) Uncharacterized
HH_90606697 EB040138 chromosome 1 open reading frame 59 Uncharacterized
HH_38317570 EB040563 chromosome 4 open reading frame 14 Uncharacterized
HH_Contig610 EB103746 family with sequence similarity member a1 Uncharacterized
HH_75738095 EB033358 isoform cra_b Uncharacterized
HH_Contig2949 EB036773 mgc86453 protein Uncharacterized
Table continues on next page
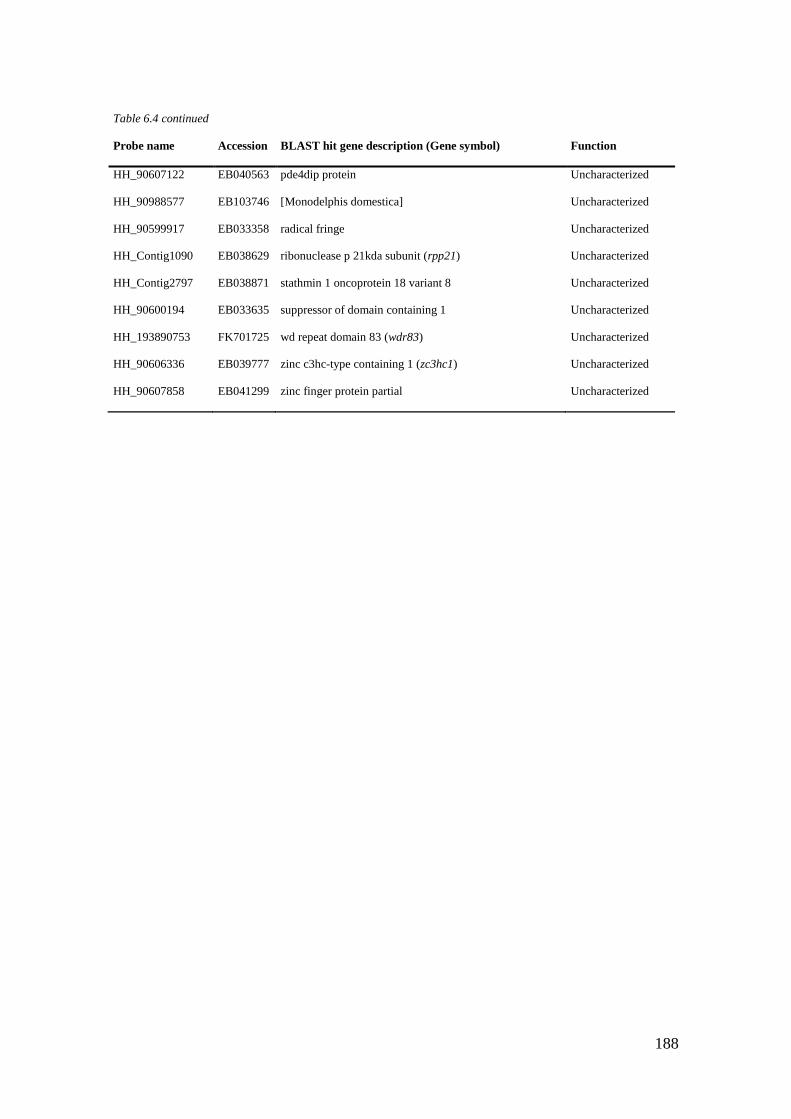
188
Table 6.4 continued
Probe name Accession BLAST hit gene description (Gene symbol) Function
HH_90607122 EB040563 pde4dip protein Uncharacterized
HH_90988577 EB103746 [Monodelphis domestica] Uncharacterized
HH_90599917 EB033358 radical fringe Uncharacterized
HH_Contig1090 EB038629 ribonuclease p 21kda subunit (rpp21) Uncharacterized
HH_Contig2797 EB038871 stathmin 1 oncoprotein 18 variant 8 Uncharacterized
HH_90600194 EB033635 suppressor of domain containing 1 Uncharacterized
HH_193890753 FK701725 wd repeat domain 83 (wdr83) Uncharacterized
HH_90606336 EB039777 zinc c3hc-type containing 1 (zc3hc1) Uncharacterized
HH_90607858 EB041299 zinc finger protein partial Uncharacterized
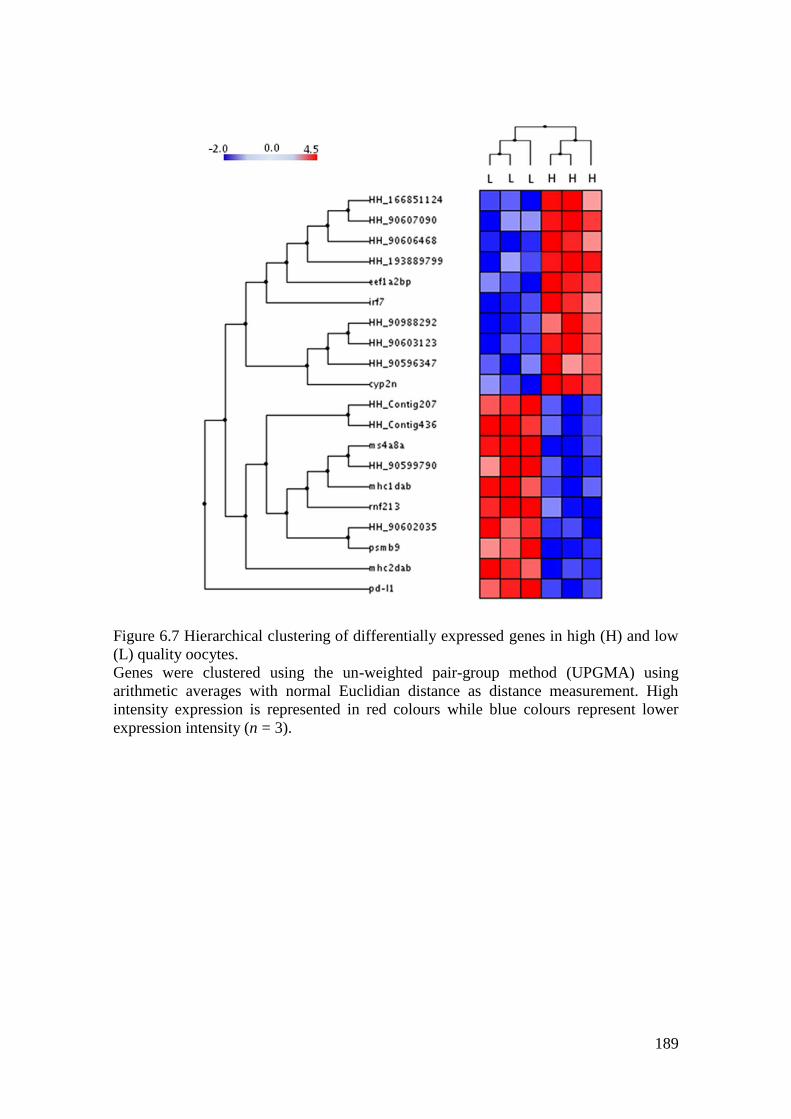
189
Figure 6.7 Hierarchical clustering of differentially expressed genes in high (H) and low
(L) quality oocytes.
Genes were clustered using the un-weighted pair-group method (UPGMA) using
arithmetic averages with normal Euclidian distance as distance measurement. High
intensity expression is represented in red colours while blue colours represent lower
expression intensity (n = 3).
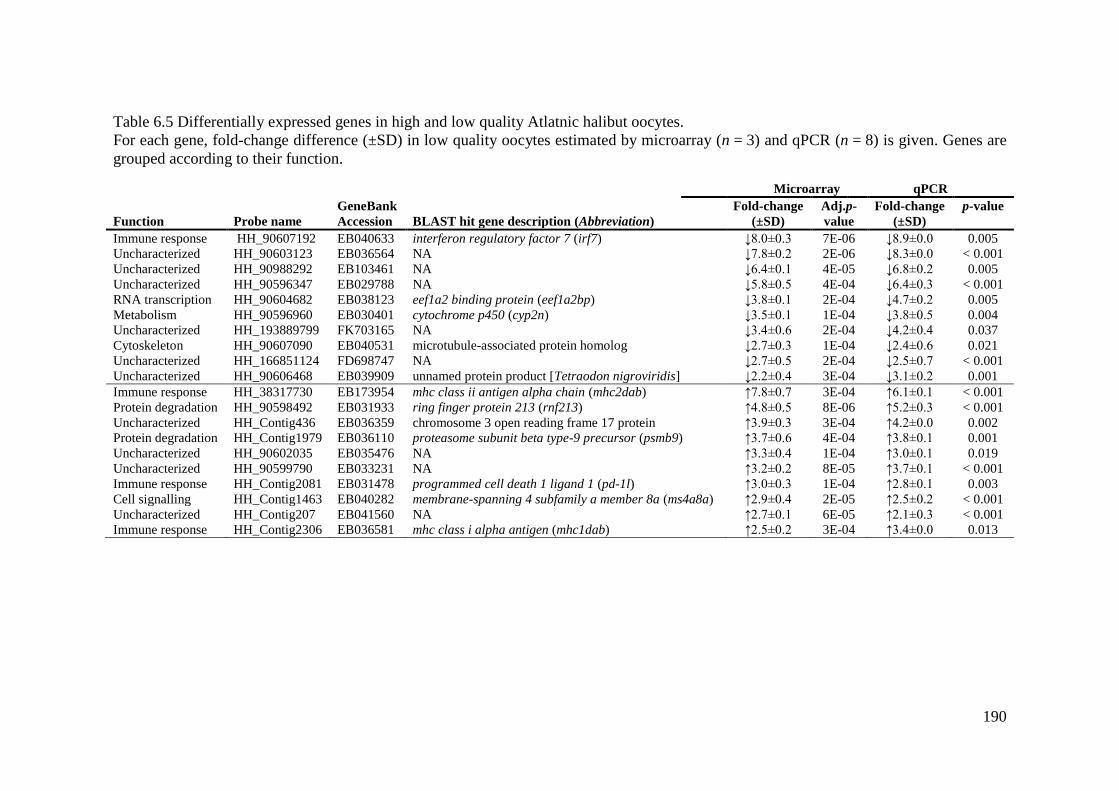
190
Table 6.5 Differentially expressed genes in high and low quality Atlatnic halibut oocytes.
For each gene, fold-change difference (±SD) in low quality oocytes estimated by microarray (n = 3) and qPCR (n = 8) is given. Genes are
grouped according to their function.
Microarray qPCR
Function Probe name
GeneBank
Accession BLAST hit gene description (Abbreviation)
Fold-change
(±SD)
Adj.p-
value
Fold-change
(±SD)
p-value
Immune response HH_90607192 EB040633 interferon regulatory factor 7 (irf7) ↓8.0±0.3 7E-06 ↓8.9±0.0 0.005
Uncharacterized HH_90603123 EB036564 NA ↓7.8±0.2 2E-06 ↓8.3±0.0 < 0.001
Uncharacterized HH_90988292 EB103461 NA ↓6.4±0.1 4E-05 ↓6.8±0.2 0.005
Uncharacterized HH_90596347 EB029788 NA ↓5.8±0.5 4E-04 ↓6.4±0.3 < 0.001
RNA transcription HH_90604682 EB038123 eef1a2 binding protein (eef1a2bp) ↓3.8±0.1 2E-04 ↓4.7±0.2 0.005
Metabolism HH_90596960 EB030401 cytochrome p450 (cyp2n) ↓3.5±0.1 1E-04 ↓3.8±0.5 0.004
Uncharacterized HH_193889799 FK703165 NA ↓3.4±0.6 2E-04 ↓4.2±0.4 0.037
Cytoskeleton HH_90607090 EB040531 microtubule-associated protein homolog ↓2.7±0.3 1E-04 ↓2.4±0.6 0.021
Uncharacterized HH_166851124 FD698747 NA ↓2.7±0.5 2E-04 ↓2.5±0.7 < 0.001
Uncharacterized HH_90606468 EB039909 unnamed protein product [Tetraodon nigroviridis] ↓2.2±0.4 3E-04 ↓3.1±0.2 0.001
Immune response HH_38317730 EB173954 mhc class ii antigen alpha chain (mhc2dab) ↑7.8±0.7 3E-04 ↑6.1±0.1 < 0.001
Protein degradation HH_90598492 EB031933 ring finger protein 213 (rnf213) ↑4.8±0.5 8E-06 ↑5.2±0.3 < 0.001
Uncharacterized HH_Contig436 EB036359 chromosome 3 open reading frame 17 protein ↑3.9±0.3 3E-04 ↑4.2±0.0 0.002
Protein degradation HH_Contig1979 EB036110 proteasome subunit beta type-9 precursor (psmb9) ↑3.7±0.6 4E-04 ↑3.8±0.1 0.001
Uncharacterized HH_90602035 EB035476 NA ↑3.3±0.4 1E-04 ↑3.0±0.1 0.019
Uncharacterized HH_90599790 EB033231 NA ↑3.2±0.2 8E-05 ↑3.7±0.1 < 0.001
Immune response HH_Contig2081 EB031478 programmed cell death 1 ligand 1 (pd-1l) ↑3.0±0.3 1E-04 ↑2.8±0.1 0.003
Cell signalling HH_Contig1463 EB040282 membrane-spanning 4 subfamily a member 8a (ms4a8a) ↑2.9±0.4 2E-05 ↑2.5±0.2 < 0.001
Uncharacterized HH_Contig207 EB041560 NA ↑2.7±0.1 6E-05 ↑2.1±0.3 < 0.001
Immune response HH_Contig2306 EB036581 mhc class i alpha antigen (mhc1dab) ↑2.5±0.2 3E-04 ↑3.4±0.0 0.013
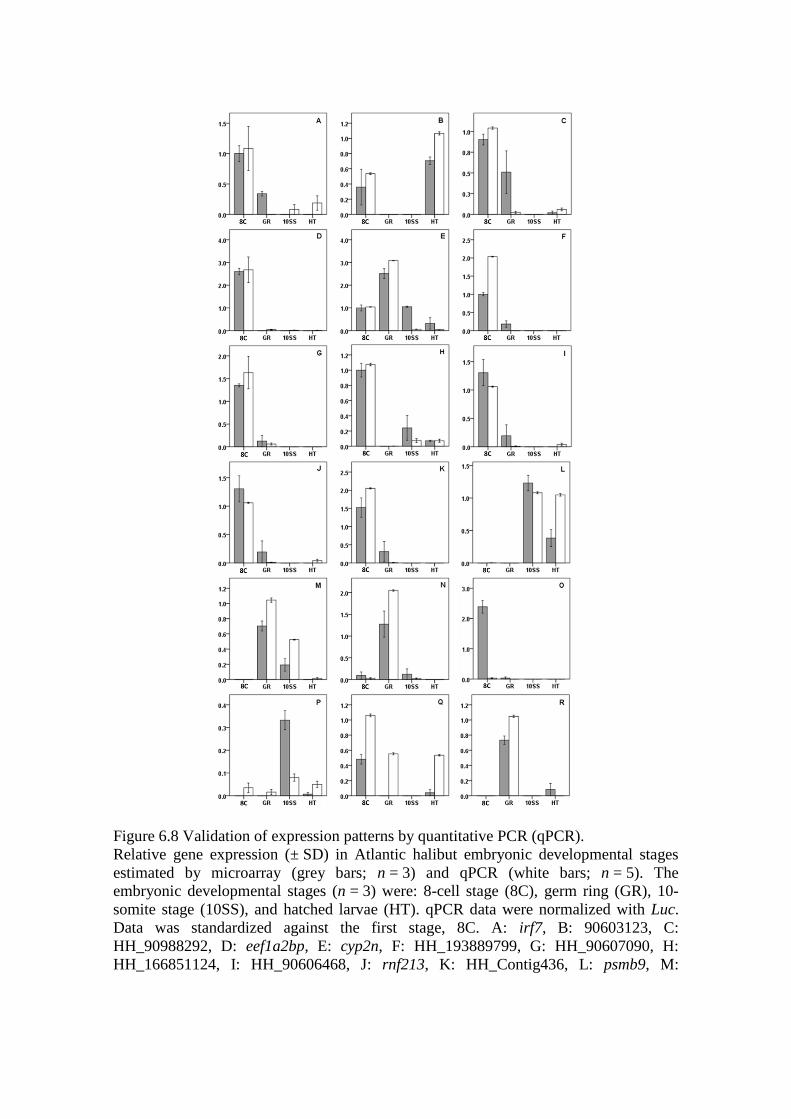
Figure 6.8 Validation of expression patterns by quantitative PCR (qPCR).
Relative gene expression (± SD) in Atlantic halibut embryonic developmental stages
estimated by microarray (grey bars; n = 3) and qPCR (white bars; n = 5). The
embryonic developmental stages (n = 3) were: 8-cell stage (8C), germ ring (GR), 10-
somite stage (10SS), and hatched larvae (HT). qPCR data were normalized with Luc.
Data was standardized against the first stage, 8C. A: irf7, B: 90603123, C:
HH_90988292, D: eef1a2bp, E: cyp2n, F: HH_193889799, G: HH_90607090, H:
HH_166851124, I: HH_90606468, J: rnf213, K: HH_Contig436, L: psmb9, M:
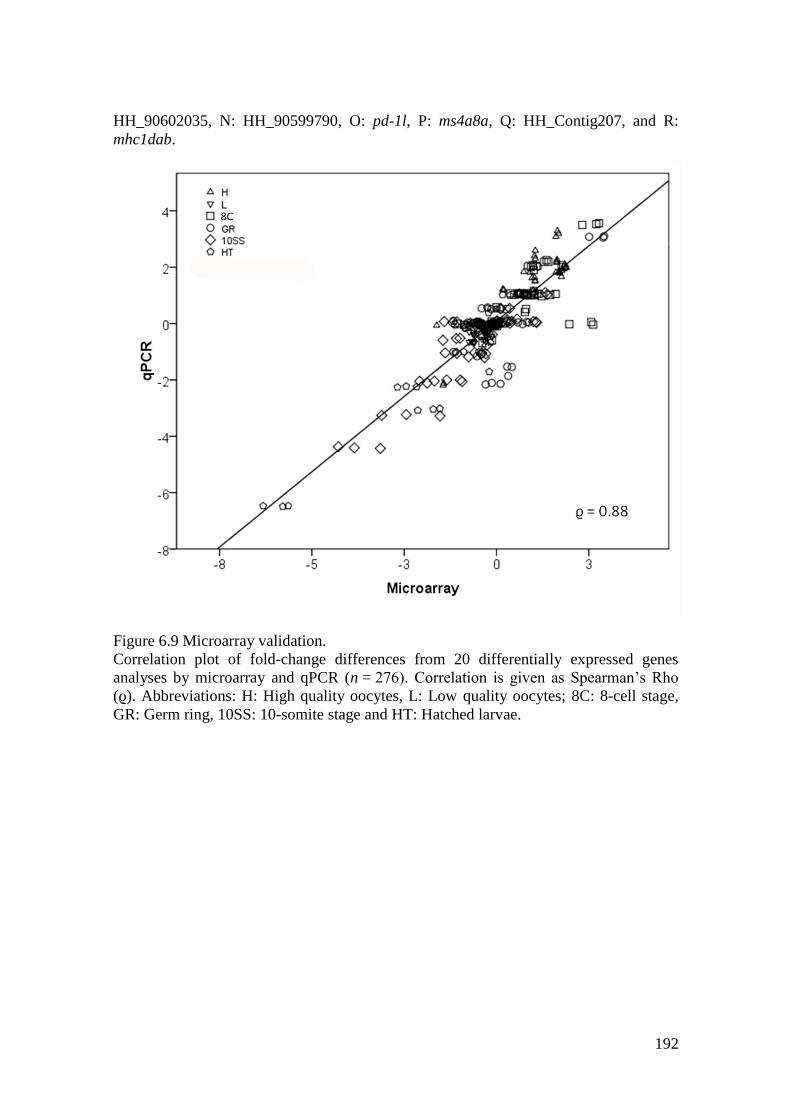
192
HH_90602035, N: HH_90599790, O: pd-1l, P: ms4a8a, Q: HH_Contig207, and R:
mhc1dab.
Figure 6.9 Microarray validation.
Correlation plot of fold-change differences from 20 differentially expressed genes
analyses by microarray and qPCR (n = 276). Correlation is given as Spearman’s Rho
(ϱ). Abbreviations: H: High quality oocytes, L: Low quality oocytes; 8C: 8-cell stage,
GR: Germ ring, 10SS: 10-somite stage and HT: Hatched larvae.
193
6.5 Discussion
6.5.1 Maternal gene expression profiling
Maternal genes constituted 9.5 % of the total number of genes differentially expressed
during Atlantic halibut embryonic development (Mathavan et al., 2005). In zebrafish,
~16 % of total differentially expressed genes represented maternal genes in two
comparable expression studies (Mathavan et al., 2005 ; Aanes et al., 2011). Among
these, 15 and 17 genes were identical with maternal Atlantic halibut genes respectively
(Supplementary Table G). Maternal transcripts in oocytes have been found to be highly
conserved (74 %) among Mus musculus, Bos taurus, and Xenopus laevis (Vallée et al.,
2008). The low number of common maternal genes between zebrafish and Atlantic
halibut is most likely due to differences in gene selection during microarray design but
can also reflect the long evolutionary distance between Ostariophysii (zebrafish) and
Acanthopterygii (Atlantic halibut, Nelson, 2006). Oocyte maturation and developmental
competence acquisition remains poorly understood in teleosts and information on
maternal genes is limited (Bobe & Labbe, 2009 ; Lubzens et al., 2009). We have
identified 192 maternal Atlantic halibut genes that can serve as a pool for future in-
depth studies of gene expression during cell cycling, cell differentiation, immune
response and metabolism.
6.5.2 Differential gene expression in high and low quality eggs
The two maternal genes, irf7 and mhc2dab, were identified as potential markers for
Atlantic halibut due to their high level of expression differences in high and low quality
oocytes. The three uncharacterized genes (HH_90603123, HH_90988292,
194
HH_90596347) show the same potential but their function has to be further
characterized.
Irf7 encodes interferon regulatory factor 7 (IRF7), which is the primary regulator of
type I interferon (IFN) production as response to pathogens in the innate immune
response in vertebrates, including teleosts (Zhang et al., 2003 ; Holland et al., 2008 ;
Bergan et al., 2010 ; Xiang et al., 2010 ; Cui et al., 2011). Absence of IRF7 or failure
to induce its expression reduces IFN mRNA transcription and impairs antiviral innate
immunity (Ning et al., 2011). The significantly low levels of irf7 transcripts in low
quality oocytes may result in reduced immune response capacity leading to poor
embryonic hatching rates. Mhc2dab, and the less expressed mhc1dab, encode major
histocompatibility (MHC) complex proteins that are fundamental components of the
adaptive immune response. MHC class I proteins are expressed on nearly all nucleated
cells while class II proteins are restricted to antigen-presenting cells (APCs): dendric
cells, macrophages, and B cells (Dijkstra et al., 2003 ; Moulana et al., 2008). Maternal
transcripts of two MHC class II genes have been previously found in half-smooth
tongue sole (Cyngolossus semilaevis) fertilized eggs to mid-gastrulation, but their actual
function is not known (Li et al., 2010). In addition to Mhc2dab, higher levels of
transcripts coding two proteins (Ringfinger protein 213 and proteasome subunit beta
type-9 precursor) involved in protein degradation were detected in low quality oocytes.
This implies an elevated breakdown of cell constituents in low quality oocytes that
could cause cell death and impaired embryonic development.
Causes of differential maternal transcript expression in Atlantic halibut oocytes of high
and low quality are not known. Polyadenylation of maternal mRNAs during oocyte
maturation usually protects mRNAs from degradation and activates the translation
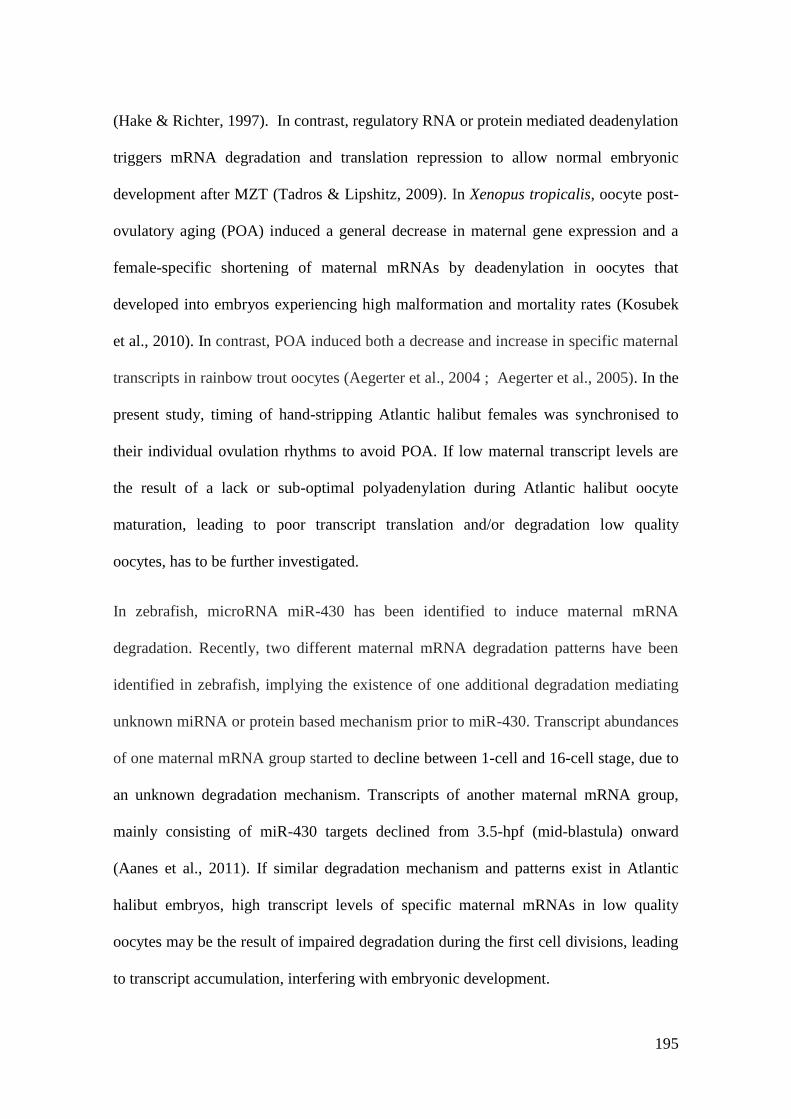
195
(Hake & Richter, 1997). In contrast, regulatory RNA or protein mediated deadenylation
triggers mRNA degradation and translation repression to allow normal embryonic
development after MZT (Tadros & Lipshitz, 2009). In Xenopus tropicalis, oocyte post-
ovulatory aging (POA) induced a general decrease in maternal gene expression and a
female-specific shortening of maternal mRNAs by deadenylation in oocytes that
developed into embryos experiencing high malformation and mortality rates (Kosubek
et al., 2010). In contrast, POA induced both a decrease and increase in specific maternal
transcripts in rainbow trout oocytes (Aegerter et al., 2004 ; Aegerter et al., 2005). In the
present study, timing of hand-stripping Atlantic halibut females was synchronised to
their individual ovulation rhythms to avoid POA. If low maternal transcript levels are
the result of a lack or sub-optimal polyadenylation during Atlantic halibut oocyte
maturation, leading to poor transcript translation and/or degradation low quality
oocytes, has to be further investigated.
In zebrafish, microRNA miR-430 has been identified to induce maternal mRNA
degradation. Recently, two different maternal mRNA degradation patterns have been
identified in zebrafish, implying the existence of one additional degradation mediating
unknown miRNA or protein based mechanism prior to miR-430. Transcript abundances
of one maternal mRNA group started to decline between 1-cell and 16-cell stage, due to
an unknown degradation mechanism. Transcripts of another maternal mRNA group,
mainly consisting of miR-430 targets declined from 3.5-hpf (mid-blastula) onward
(Aanes et al., 2011). If similar degradation mechanism and patterns exist in Atlantic
halibut embryos, high transcript levels of specific maternal mRNAs in low quality
oocytes may be the result of impaired degradation during the first cell divisions, leading
to transcript accumulation, interfering with embryonic development.
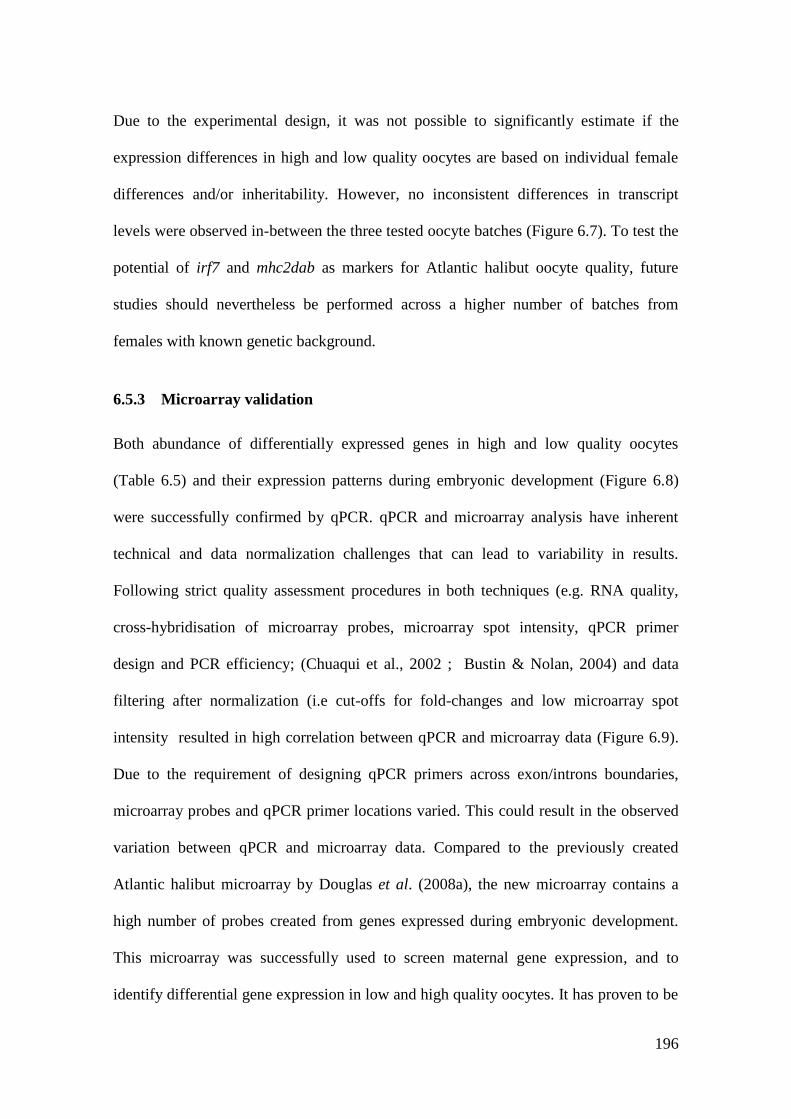
196
Due to the experimental design, it was not possible to significantly estimate if the
expression differences in high and low quality oocytes are based on individual female
differences and/or inheritability. However, no inconsistent differences in transcript
levels were observed in-between the three tested oocyte batches (Figure 6.7). To test the
potential of irf7 and mhc2dab as markers for Atlantic halibut oocyte quality, future
studies should nevertheless be performed across a higher number of batches from
females with known genetic background.
6.5.3 Microarray validation
Both abundance of differentially expressed genes in high and low quality oocytes
(Table 6.5) and their expression patterns during embryonic development (Figure 6.8)
were successfully confirmed by qPCR. qPCR and microarray analysis have inherent
technical and data normalization challenges that can lead to variability in results.
Following strict quality assessment procedures in both techniques (e.g. RNA quality,
cross-hybridisation of microarray probes, microarray spot intensity, qPCR primer
design and PCR efficiency; (Chuaqui et al., 2002 ; Bustin & Nolan, 2004) and data
filtering after normalization (i.e cut-offs for fold-changes and low microarray spot
intensity resulted in high correlation between qPCR and microarray data (Figure 6.9).
Due to the requirement of designing qPCR primers across exon/introns boundaries,
microarray probes and qPCR primer locations varied. This could result in the observed
variation between qPCR and microarray data. Compared to the previously created
Atlantic halibut microarray by Douglas et al. (2008a), the new microarray contains a
high number of probes created from genes expressed during embryonic development.
This microarray was successfully used to screen maternal gene expression, and to
identify differential gene expression in low and high quality oocytes. It has proven to be

197
suitable for future analysis of Atlantic halibut embryonic gene expression which is
likely to advance our understanding of important developmental processes such as germ
cell development, growth and immune response.
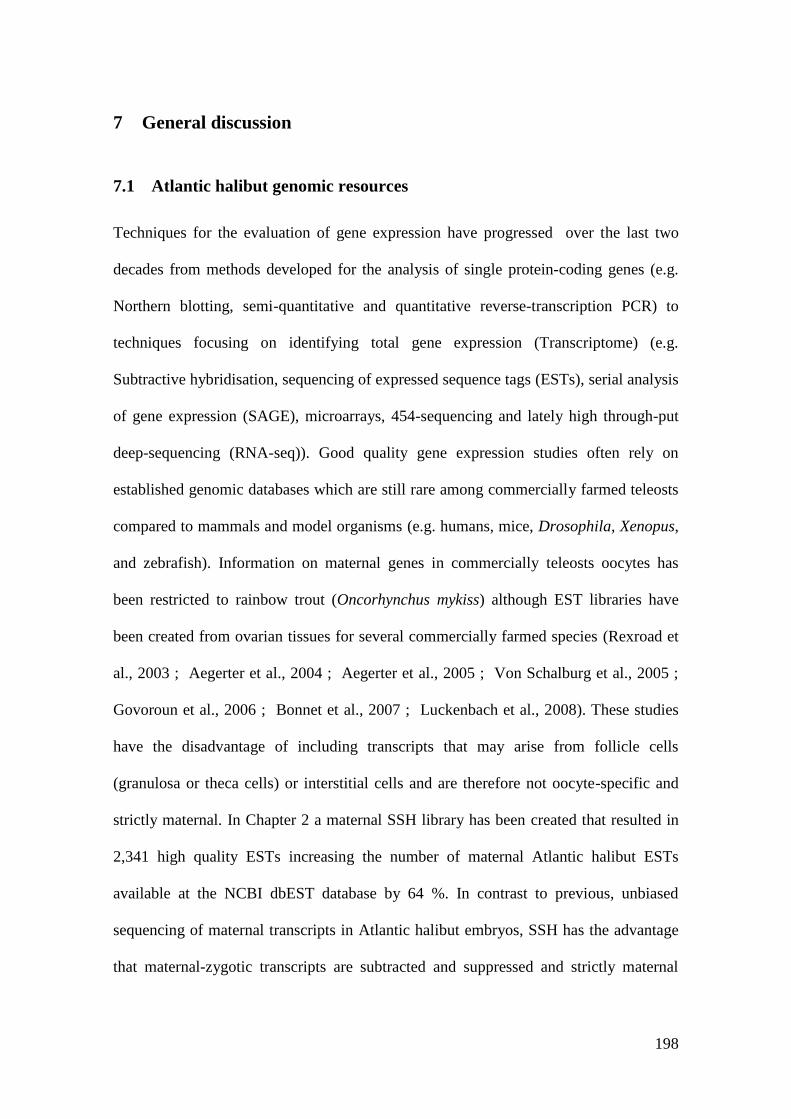
198
7 General discussion
7.1 Atlantic halibut genomic resources
Techniques for the evaluation of gene expression have progressed over the last two
decades from methods developed for the analysis of single protein-coding genes (e.g.
Northern blotting, semi-quantitative and quantitative reverse-transcription PCR) to
techniques focusing on identifying total gene expression (Transcriptome) (e.g.
Subtractive hybridisation, sequencing of expressed sequence tags (ESTs), serial analysis
of gene expression (SAGE), microarrays, 454-sequencing and lately high through-put
deep-sequencing (RNA-seq)). Good quality gene expression studies often rely on
established genomic databases which are still rare among commercially farmed teleosts
compared to mammals and model organisms (e.g. humans, mice, Drosophila, Xenopus,
and zebrafish). Information on maternal genes in commercially teleosts oocytes has
been restricted to rainbow trout (Oncorhynchus mykiss) although EST libraries have
been created from ovarian tissues for several commercially farmed species (Rexroad et
al., 2003 ; Aegerter et al., 2004 ; Aegerter et al., 2005 ; Von Schalburg et al., 2005 ;
Govoroun et al., 2006 ; Bonnet et al., 2007 ; Luckenbach et al., 2008). These studies
have the disadvantage of including transcripts that may arise from follicle cells
(granulosa or theca cells) or interstitial cells and are therefore not oocyte-specific and
strictly maternal. In Chapter 2 a maternal SSH library has been created that resulted in
2,341 high quality ESTs increasing the number of maternal Atlantic halibut ESTs
available at the NCBI dbEST database by 64 %. In contrast to previous, unbiased
sequencing of maternal transcripts in Atlantic halibut embryos, SSH has the advantage
that maternal-zygotic transcripts are subtracted and suppressed and strictly maternal
199
transcripts are amplified (Bai et al., 2007). The maternal EST database produced will
serve as a resource for future in-depth studies of maternal gene expression and was used
to provide sequence information for gene expression studies in Chapter 3, 4 and 6.
qPCR is considered an accurate, sensitive and fast quantification method of gene
expression with multiple applications (i.e. qantification of miRNA, siRNA, SNP, copy
number variant, and single cell quantification (Elbashir et al., 2002 ; Benes & Castoldi,
2010 ; D'Haene et al., 2010 ; Erali & Wittwer, 2010 ; Ståhlberg & Bengtsson, 2010).
In addition, qPCR is routinely used to validate microarray expression data and has also
been used to confirm next generation sequencing results (Bettencourt et al., 2010 ;
Raha et al., 2010 ; Aanes et al., 2011 ; Roberts et al., 2011 ; Zhang et al., 2011). To
perform reliable gene expression quantification by qPCR, stable reference genes have to
be used to normalize target gene expression. To identify one universal reference gene
has been unsuccessful and it is recommended to validate several possible reference
genes for each new experimental setup (Thellin et al., 2009). In previous Atlantic
halibut gene expression studies, single reference genes commonly used in humans and
model species, (Actb and 18SrRNA) have been used (Van Nes et al., 2005 ; Galloway
et al., 2006 ; Van Nes & Andersen, 2006 ; Hildahl et al., 2007a). In Chapter 3 a
systematic survey of commonly used reference genes during embryonic and larvae
developmental stages was performed, not previously carried out in a commercially
farmed teleost. Tubb2 and actb were identified as the most stable gene-pair across
embryonic and larval stages. However, separate testes of reference genes were
performed in Chapter 2 and 3, following the general conclusion from chapter 3 that
experiment- specific tests of reference genes should be performed for each new study.
Since then, suitable reference genes for gene expression studies during embryonic and
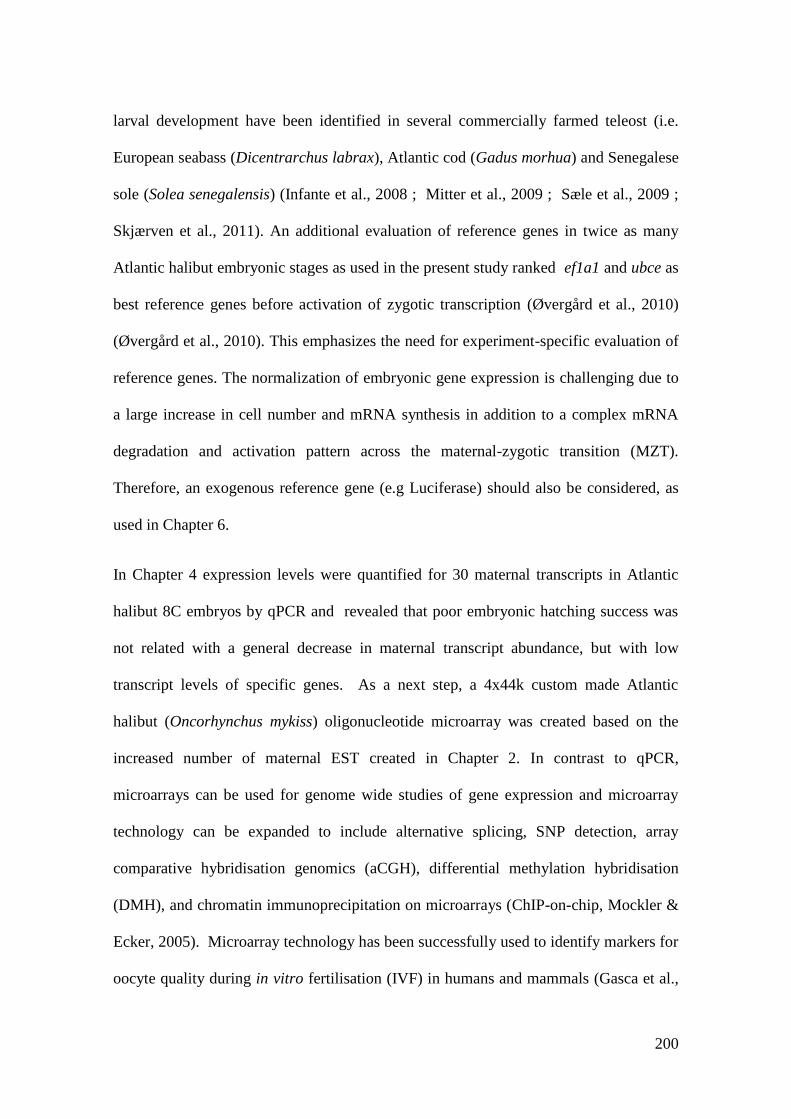
200
larval development have been identified in several commercially farmed teleost (i.e.
European seabass (Dicentrarchus labrax), Atlantic cod (Gadus morhua) and Senegalese
sole (Solea senegalensis) (Infante et al., 2008 ; Mitter et al., 2009 ; Sæle et al., 2009 ;
Skjærven et al., 2011). An additional evaluation of reference genes in twice as many
Atlantic halibut embryonic stages as used in the present study ranked ef1a1 and ubce as
best reference genes before activation of zygotic transcription (Øvergård et al., 2010)
(Øvergård et al., 2010). This emphasizes the need for experiment-specific evaluation of
reference genes. The normalization of embryonic gene expression is challenging due to
a large increase in cell number and mRNA synthesis in addition to a complex mRNA
degradation and activation pattern across the maternal-zygotic transition (MZT).
Therefore, an exogenous reference gene (e.g Luciferase) should also be considered, as
used in Chapter 6.
In Chapter 4 expression levels were quantified for 30 maternal transcripts in Atlantic
halibut 8C embryos by qPCR and revealed that poor embryonic hatching success was
not related with a general decrease in maternal transcript abundance, but with low
transcript levels of specific genes. As a next step, a 4x44k custom made Atlantic
halibut (Oncorhynchus mykiss) oligonucleotide microarray was created based on the
increased number of maternal EST created in Chapter 2. In contrast to qPCR,
microarrays can be used for genome wide studies of gene expression and microarray
technology can be expanded to include alternative splicing, SNP detection, array
comparative hybridisation genomics (aCGH), differential methylation hybridisation
(DMH), and chromatin immunoprecipitation on microarrays (ChIP-on-chip, Mockler &
Ecker, 2005). Microarray technology has been successfully used to identify markers for
oocyte quality during in vitro fertilisation (IVF) in humans and mammals (Gasca et al.,
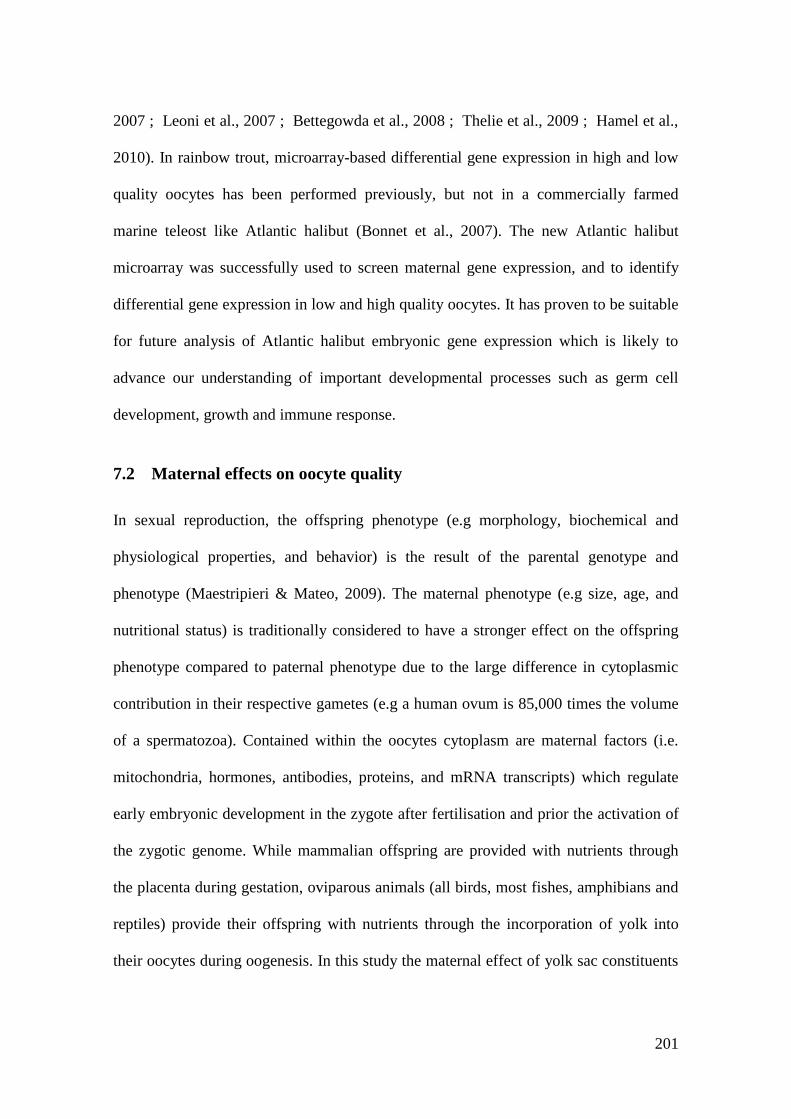
201
2007 ; Leoni et al., 2007 ; Bettegowda et al., 2008 ; Thelie et al., 2009 ; Hamel et al.,
2010). In rainbow trout, microarray-based differential gene expression in high and low
quality oocytes has been performed previously, but not in a commercially farmed
marine teleost like Atlantic halibut (Bonnet et al., 2007). The new Atlantic halibut
microarray was successfully used to screen maternal gene expression, and to identify
differential gene expression in low and high quality oocytes. It has proven to be suitable
for future analysis of Atlantic halibut embryonic gene expression which is likely to
advance our understanding of important developmental processes such as germ cell
development, growth and immune response.
7.2 Maternal effects on oocyte quality
In sexual reproduction, the offspring phenotype (e.g morphology, biochemical and
physiological properties, and behavior) is the result of the parental genotype and
phenotype (Maestripieri & Mateo, 2009). The maternal phenotype (e.g size, age, and
nutritional status) is traditionally considered to have a stronger effect on the offspring
phenotype compared to paternal phenotype due to the large difference in cytoplasmic
contribution in their respective gametes (e.g a human ovum is 85,000 times the volume
of a spermatozoa). Contained within the oocytes cytoplasm are maternal factors (i.e.
mitochondria, hormones, antibodies, proteins, and mRNA transcripts) which regulate
early embryonic development in the zygote after fertilisation and prior the activation of
the zygotic genome. While mammalian offspring are provided with nutrients through
the placenta during gestation, oviparous animals (all birds, most fishes, amphibians and
reptiles) provide their offspring with nutrients through the incorporation of yolk into
their oocytes during oogenesis. In this study the maternal effect of yolk sac constituents
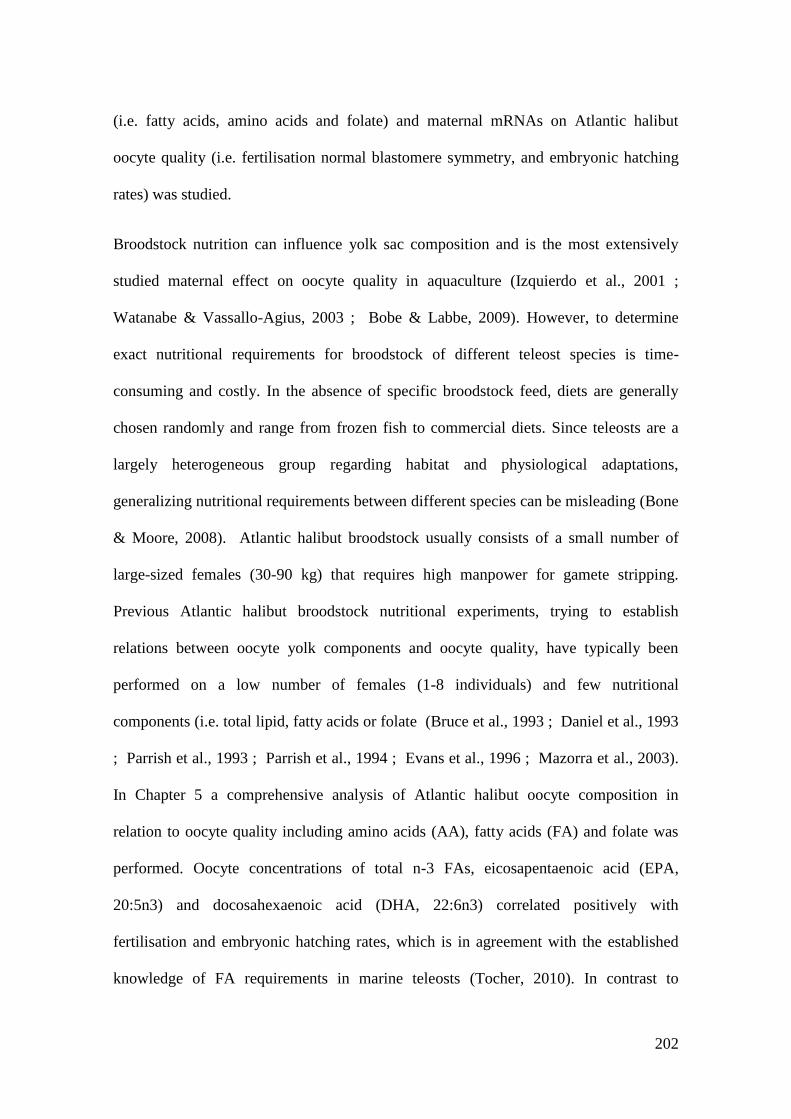
202
(i.e. fatty acids, amino acids and folate) and maternal mRNAs on Atlantic halibut
oocyte quality (i.e. fertilisation normal blastomere symmetry, and embryonic hatching
rates) was studied.
Broodstock nutrition can influence yolk sac composition and is the most extensively
studied maternal effect on oocyte quality in aquaculture (Izquierdo et al., 2001 ;
Watanabe & Vassallo-Agius, 2003 ; Bobe & Labbe, 2009). However, to determine
exact nutritional requirements for broodstock of different teleost species is time-
consuming and costly. In the absence of specific broodstock feed, diets are generally
chosen randomly and range from frozen fish to commercial diets. Since teleosts are a
largely heterogeneous group regarding habitat and physiological adaptations,
generalizing nutritional requirements between different species can be misleading (Bone
& Moore, 2008). Atlantic halibut broodstock usually consists of a small number of
large-sized females (30-90 kg) that requires high manpower for gamete stripping.
Previous Atlantic halibut broodstock nutritional experiments, trying to establish
relations between oocyte yolk components and oocyte quality, have typically been
performed on a low number of females (1-8 individuals) and few nutritional
components (i.e. total lipid, fatty acids or folate (Bruce et al., 1993 ; Daniel et al., 1993
; Parrish et al., 1993 ; Parrish et al., 1994 ; Evans et al., 1996 ; Mazorra et al., 2003).
In Chapter 5 a comprehensive analysis of Atlantic halibut oocyte composition in
relation to oocyte quality including amino acids (AA), fatty acids (FA) and folate was
performed. Oocyte concentrations of total n-3 FAs, eicosapentaenoic acid (EPA,
20:5n3) and docosahexaenoic acid (DHA, 22:6n3) correlated positively with
fertilisation and embryonic hatching rates, which is in agreement with the established
knowledge of FA requirements in marine teleosts (Tocher, 2010). In contrast to
203
previous studies, the highest positive correlations between FA concentrations and
fertilisation and embryonic hatching rates were not found for the most commonly
studied PUFAs: EPA, DHA, or arachidonic acid (ARA, 20:4n6), but for dihomo-γ-
linolenic acid (DGLA, 20:3n6) and docosapentaenoic acid (DPA, 22:5n3). DGLA and
DPA are known competitors to ARA and DHA respectively during FA metabolism
(Willis, 1981 ; Rubin & Laposata, 1991 ; Stark et al., 2007 ; Schmitz & Ecker, 2008).
Dietary ARA and DHA requirements are usually considered well-covered through
marine broodstock feed and it remains unclear how DGLA and DPA contributes to
higher fertilisation and embryonic hatching rates in Atlantic halibut oocytes (Tocher,
2010). Methionine and aspartic acid are essential to eukaryotic protein synthesis and
their oocyte concentrations were found to correlate positively with fertilisation and
embryonic hatching rates respectively (Neidle & Dunlop, 1990 ; Hashimoto et al., 1995
; Wu, 2009). Folate deficiencies are known to lead to major embryonic deformities in
higher vertebrates and reduced growth in teleosts (Cowey & Woodward, 1993 ;
Duncan et al., 1993 ; Tamura & Picciano, 2006 ; Gray & Ross, 2009). In the present
study, no significant correlations between oocyte folate concentrations and oocyte
quality were found.
In contrast to the yolk nutritional components, the possible role of non-yolky
cytoplasmic components such as hormones, antibodies, structural and regulatory
proteins and mRNAs have received far less attention in farmed teleosts. Nevertheless,
maternal mRNAs are essential for early embryonic development before the start of
zygotic transcription. They control important aspects of early embryonic development
like the first mitotic divisions, specification of initial cell fate and embryonic patterning
(Dworkin & Dworkin-Rastl, 1990). The influence of maternal mRNAs on oocyte
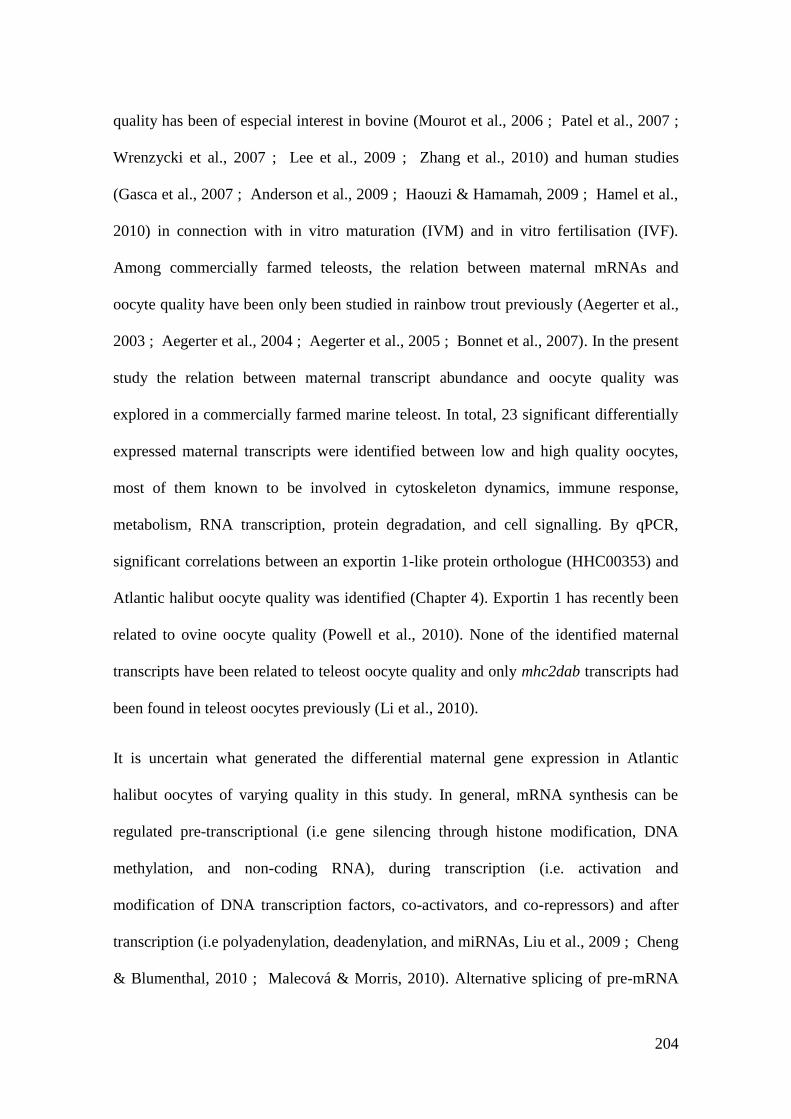
204
quality has been of especial interest in bovine (Mourot et al., 2006 ; Patel et al., 2007 ;
Wrenzycki et al., 2007 ; Lee et al., 2009 ; Zhang et al., 2010) and human studies
(Gasca et al., 2007 ; Anderson et al., 2009 ; Haouzi & Hamamah, 2009 ; Hamel et al.,
2010) in connection with in vitro maturation (IVM) and in vitro fertilisation (IVF).
Among commercially farmed teleosts, the relation between maternal mRNAs and
oocyte quality have been only been studied in rainbow trout previously (Aegerter et al.,
2003 ; Aegerter et al., 2004 ; Aegerter et al., 2005 ; Bonnet et al., 2007). In the present
study the relation between maternal transcript abundance and oocyte quality was
explored in a commercially farmed marine teleost. In total, 23 significant differentially
expressed maternal transcripts were identified between low and high quality oocytes,
most of them known to be involved in cytoskeleton dynamics, immune response,
metabolism, RNA transcription, protein degradation, and cell signalling. By qPCR,
significant correlations between an exportin 1-like protein orthologue (HHC00353) and
Atlantic halibut oocyte quality was identified (Chapter 4). Exportin 1 has recently been
related to ovine oocyte quality (Powell et al., 2010). None of the identified maternal
transcripts have been related to teleost oocyte quality and only mhc2dab transcripts had
been found in teleost oocytes previously (Li et al., 2010).
It is uncertain what generated the differential maternal gene expression in Atlantic
halibut oocytes of varying quality in this study. In general, mRNA synthesis can be
regulated pre-transcriptional (i.e gene silencing through histone modification, DNA
methylation, and non-coding RNA), during transcription (i.e. activation and
modification of DNA transcription factors, co-activators, and co-repressors) and after
transcription (i.e polyadenylation, deadenylation, and miRNAs, Liu et al., 2009 ; Cheng
& Blumenthal, 2010 ; Malecová & Morris, 2010). Alternative splicing of pre-mRNA
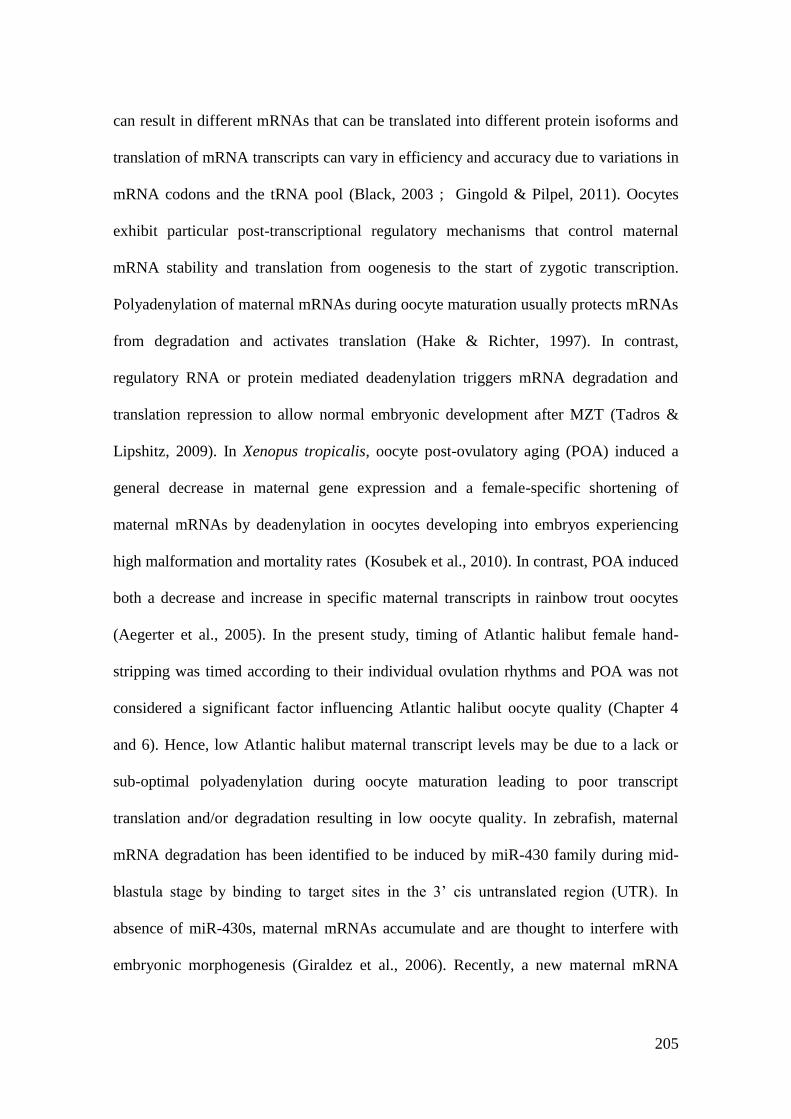
205
can result in different mRNAs that can be translated into different protein isoforms and
translation of mRNA transcripts can vary in efficiency and accuracy due to variations in
mRNA codons and the tRNA pool (Black, 2003 ; Gingold & Pilpel, 2011). Oocytes
exhibit particular post-transcriptional regulatory mechanisms that control maternal
mRNA stability and translation from oogenesis to the start of zygotic transcription.
Polyadenylation of maternal mRNAs during oocyte maturation usually protects mRNAs
from degradation and activates translation (Hake & Richter, 1997). In contrast,
regulatory RNA or protein mediated deadenylation triggers mRNA degradation and
translation repression to allow normal embryonic development after MZT (Tadros &
Lipshitz, 2009). In Xenopus tropicalis, oocyte post-ovulatory aging (POA) induced a
general decrease in maternal gene expression and a female-specific shortening of
maternal mRNAs by deadenylation in oocytes developing into embryos experiencing
high malformation and mortality rates (Kosubek et al., 2010). In contrast, POA induced
both a decrease and increase in specific maternal transcripts in rainbow trout oocytes
(Aegerter et al., 2005). In the present study, timing of Atlantic halibut female hand-
stripping was timed according to their individual ovulation rhythms and POA was not
considered a significant factor influencing Atlantic halibut oocyte quality (Chapter 4
and 6). Hence, low Atlantic halibut maternal transcript levels may be due to a lack or
sub-optimal polyadenylation during oocyte maturation leading to poor transcript
translation and/or degradation resulting in low oocyte quality. In zebrafish, maternal
mRNA degradation has been identified to be induced by miR-430 family during mid-
blastula stage by binding to target sites in the 3’ cis untranslated region (UTR). In
absence of miR-430s, maternal mRNAs accumulate and are thought to interfere with
embryonic morphogenesis (Giraldez et al., 2006). Recently, a new maternal mRNA
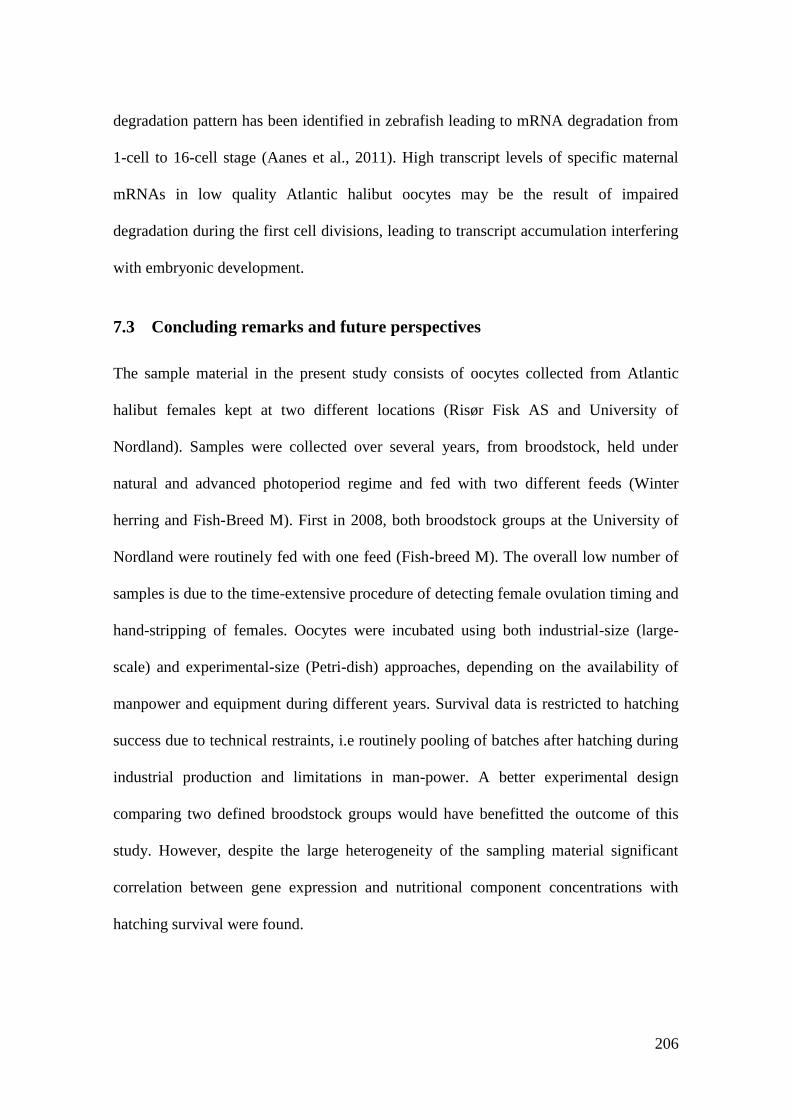
206
degradation pattern has been identified in zebrafish leading to mRNA degradation from
1-cell to 16-cell stage (Aanes et al., 2011). High transcript levels of specific maternal
mRNAs in low quality Atlantic halibut oocytes may be the result of impaired
degradation during the first cell divisions, leading to transcript accumulation interfering
with embryonic development.
7.3 Concluding remarks and future perspectives
The sample material in the present study consists of oocytes collected from Atlantic
halibut females kept at two different locations (Risør Fisk AS and University of
Nordland). Samples were collected over several years, from broodstock, held under
natural and advanced photoperiod regime and fed with two different feeds (Winter
herring and Fish-Breed M). First in 2008, both broodstock groups at the University of
Nordland were routinely fed with one feed (Fish-breed M). The overall low number of
samples is due to the time-extensive procedure of detecting female ovulation timing and
hand-stripping of females. Oocytes were incubated using both industrial-size (large-
scale) and experimental-size (Petri-dish) approaches, depending on the availability of
manpower and equipment during different years. Survival data is restricted to hatching
success due to technical restraints, i.e routinely pooling of batches after hatching during
industrial production and limitations in man-power. A better experimental design
comparing two defined broodstock groups would have benefitted the outcome of this
study. However, despite the large heterogeneity of the sampling material significant
correlation between gene expression and nutritional component concentrations with
hatching survival were found.
207
In this thesis, genomic tools (i.e. maternal EST database, qPCR reference genes, and
microarray) were produced that are applicable for future gene expression studies during
Atlantic halibut embryonic and larval development to increase knowledge about
Atlantic halibut reproduction, metabolism, immune response and growth (Chapter 3,4
and 6).
In this study an influences of yolk constituents and maternal mRNAs on Atlantic halibut
oocyte quality has been shown. The importance of n-3 FAs for oocyte quality in
Atlantic halibut was supported but less studied FAs (e.g. DGLA, DPA, OA, and POA)
should not be neglected during future nutritional studies on Atlantic halibut broodstock.
Together with methionine and aspartic acid they could act as possible indicators to
improve Atlantic halibut broodstock nutrition and oocyte quality (Chapter 5). The
differentially expressed maternal mRNAs in high and low quality oocytes are possible
markers for Atlantic oocyte quality and could be useful for marker-assisted selection
during selective Atlantic halibut breeding (Chapter 4 and 6). Their exact function during
embryonic development need to be further characterized through functional studies
(e.g.in situ hybridisation, loss-of-function analysis, and functional annotation) and will
increase our knowledge of how Atlantic halibut embryonic development is regulated
through these transcripts. Performing comparative polyadenylation and 3’UTR assays
could reveal how their transcript levels are regulated (Kosubek et al., 2010 ; Aanes et
al., 2011).
Oocyte maturation and developmental competence acquisition remains poorly
understood, especially in non-mammalian vertebrates. In addition, follicular recruitment
in teleosts is highly variable in comparison to mammals, complicating the
understandability of underlying processes (Jalabert, 2005). Recently, essential roles for

208
other maternal oocyte constituents (i.e. mitochondria, nucleolus and imprinted control
regions (ICRs)) have been identified during mammalian embryonic development and
could most likely influence teleost oocyte quality (Bourc'his & Proudhon, 2008 ;
Ogushi et al., 2008 ; Schulz et al., 2010 ; Wai et al., 2010).
209
8 Publications
I. Mommens M, Fernandes JMO, Bizuayehu TT, Bolla SL, Johnston IA and I
Babiak. 2010. Maternal mRNAs as molecular markers for egg quality in
Atlantic halibut (Hippoglossus hippoglossus L.). BMC Research Notes
3:138.
II. Fernandes JMO, Mommens M, Hagen Ø, Babiak I and C Solberg. 2008.
Selection of suitable reference genes for real-time PCR studies of Atlantic
halibut development. Comparative Biochemistry and Physiology – Part B:
Biochemistry and Molecular Biology 150 (1), pp.23-32.
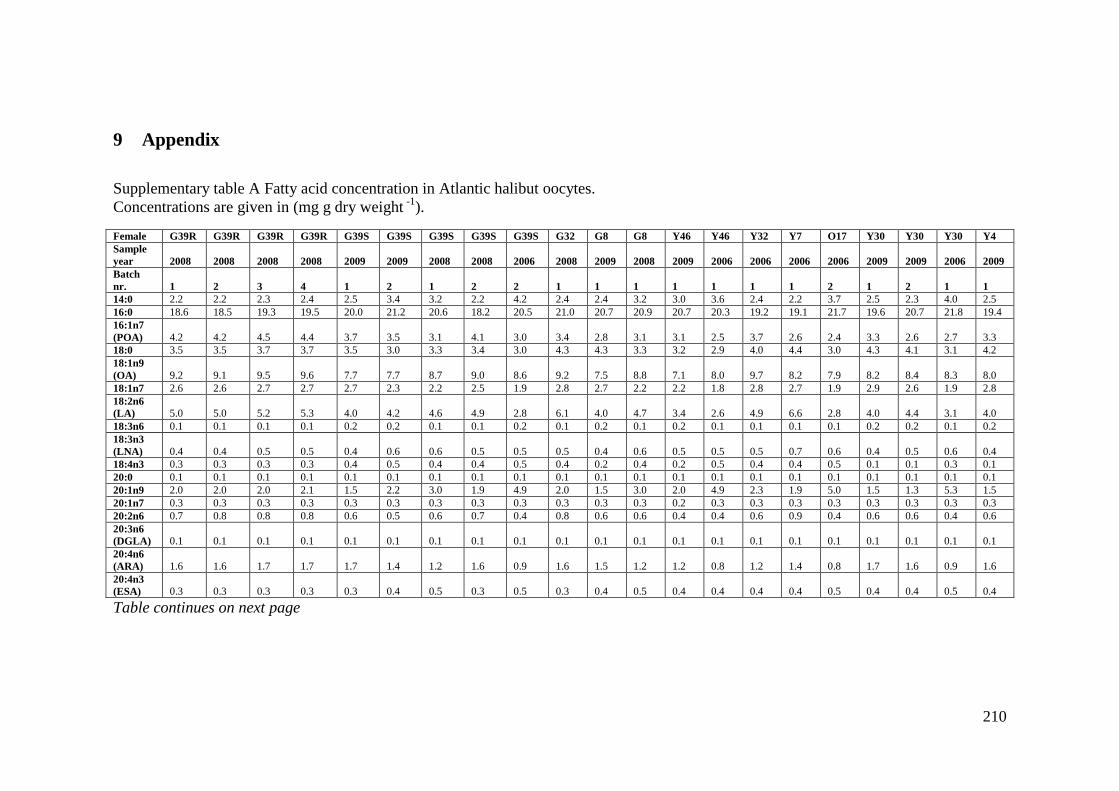
210
9 Appendix
Supplementary table A Fatty acid concentration in Atlantic halibut oocytes.
Concentrations are given in (mg g dry weight -1
).
Female G39R G39R G39R G39R G39S G39S G39S G39S G39S G32 G8 G8 Y46 Y46 Y32 Y7 O17 Y30 Y30 Y30 Y4
Sample
year 2008 2008 2008 2008 2009 2009 2008 2008 2006 2008 2009 2008 2009 2006 2006 2006 2006 2009 2009 2006 2009
Batch
nr. 1 2 3 4 1 2 1 2 2 1 1 1 1 1 1 1 2 1 2 1 1
14:0 2.2 2.2 2.3 2.4 2.5 3.4 3.2 2.2 4.2 2.4 2.4 3.2 3.0 3.6 2.4 2.2 3.7 2.5 2.3 4.0 2.5
16:0 18.6 18.5 19.3 19.5 20.0 21.2 20.6 18.2 20.5 21.0 20.7 20.9 20.7 20.3 19.2 19.1 21.7 19.6 20.7 21.8 19.4
16:1n7
(POA) 4.2 4.2 4.5 4.4 3.7 3.5 3.1 4.1 3.0 3.4 2.8 3.1 3.1 2.5 3.7 2.6 2.4 3.3 2.6 2.7 3.3
18:0 3.5 3.5 3.7 3.7 3.5 3.0 3.3 3.4 3.0 4.3 4.3 3.3 3.2 2.9 4.0 4.4 3.0 4.3 4.1 3.1 4.2
18:1n9
(OA) 9.2 9.1 9.5 9.6 7.7 7.7 8.7 9.0 8.6 9.2 7.5 8.8 7.1 8.0 9.7 8.2 7.9 8.2 8.4 8.3 8.0
18:1n7 2.6 2.6 2.7 2.7 2.7 2.3 2.2 2.5 1.9 2.8 2.7 2.2 2.2 1.8 2.8 2.7 1.9 2.9 2.6 1.9 2.8
18:2n6
(LA) 5.0 5.0 5.2 5.3 4.0 4.2 4.6 4.9 2.8 6.1 4.0 4.7 3.4 2.6 4.9 6.6 2.8 4.0 4.4 3.1 4.0
18:3n6 0.1 0.1 0.1 0.1 0.2 0.2 0.1 0.1 0.2 0.1 0.2 0.1 0.2 0.1 0.1 0.1 0.1 0.2 0.2 0.1 0.2
18:3n3
(LNA) 0.4 0.4 0.5 0.5 0.4 0.6 0.6 0.5 0.5 0.5 0.4 0.6 0.5 0.5 0.5 0.7 0.6 0.4 0.5 0.6 0.4
18:4n3 0.3 0.3 0.3 0.3 0.4 0.5 0.4 0.4 0.5 0.4 0.2 0.4 0.2 0.5 0.4 0.4 0.5 0.1 0.1 0.3 0.1
20:0 0.1 0.1 0.1 0.1 0.1 0.1 0.1 0.1 0.1 0.1 0.1 0.1 0.1 0.1 0.1 0.1 0.1 0.1 0.1 0.1 0.1
20:1n9 2.0 2.0 2.0 2.1 1.5 2.2 3.0 1.9 4.9 2.0 1.5 3.0 2.0 4.9 2.3 1.9 5.0 1.5 1.3 5.3 1.5
20:1n7 0.3 0.3 0.3 0.3 0.3 0.3 0.3 0.3 0.3 0.3 0.3 0.3 0.2 0.3 0.3 0.3 0.3 0.3 0.3 0.3 0.3
20:2n6 0.7 0.8 0.8 0.8 0.6 0.5 0.6 0.7 0.4 0.8 0.6 0.6 0.4 0.4 0.6 0.9 0.4 0.6 0.6 0.4 0.6
20:3n6
(DGLA) 0.1 0.1 0.1 0.1 0.1 0.1 0.1 0.1 0.1 0.1 0.1 0.1 0.1 0.1 0.1 0.1 0.1 0.1 0.1 0.1 0.1
20:4n6
(ARA) 1.6 1.6 1.7 1.7 1.7 1.4 1.2 1.6 0.9 1.6 1.5 1.2 1.2 0.8 1.2 1.4 0.8 1.7 1.6 0.9 1.6
20:4n3
(ESA) 0.3 0.3 0.3 0.3 0.3 0.4 0.5 0.3 0.5 0.3 0.4 0.5 0.4 0.4 0.4 0.4 0.5 0.4 0.4 0.5 0.4
Table continues on next page
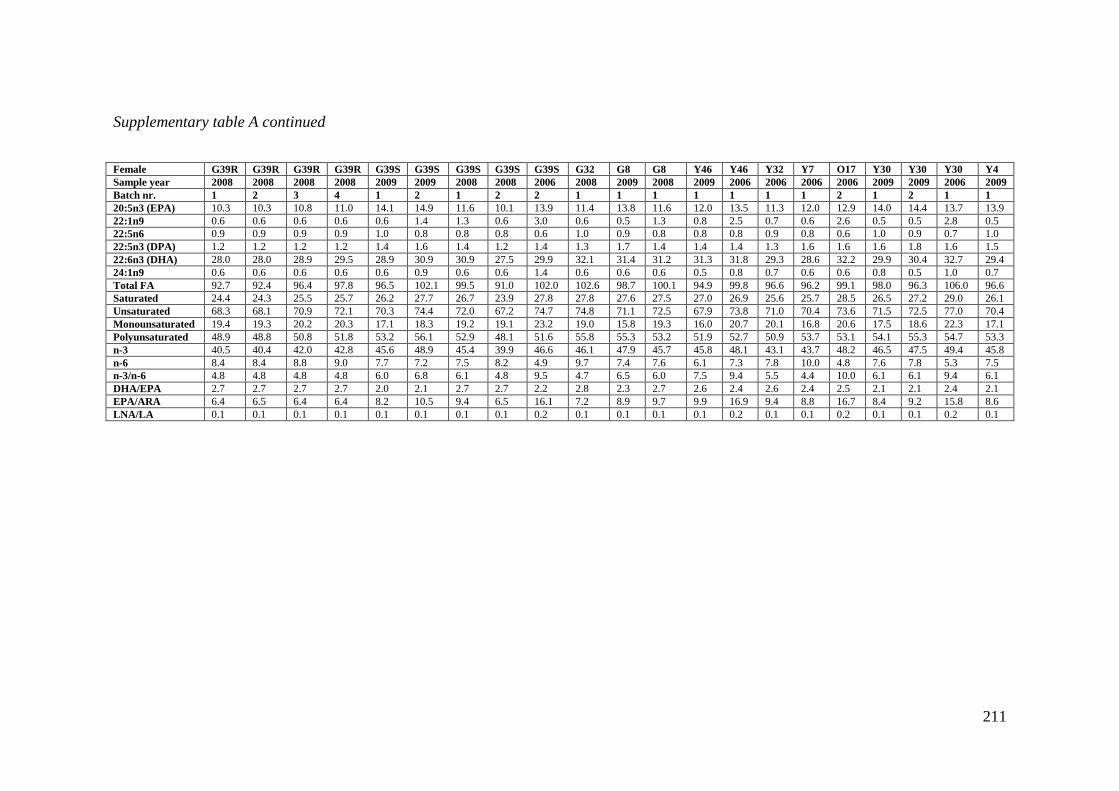
211
Supplementary table A continued
Female G39R G39R G39R G39R G39S G39S G39S G39S G39S G32 G8 G8 Y46 Y46 Y32 Y7 O17 Y30 Y30 Y30 Y4
Sample year 2008 2008 2008 2008 2009 2009 2008 2008 2006 2008 2009 2008 2009 2006 2006 2006 2006 2009 2009 2006 2009
Batch nr. 1 2 3 4 1 2 1 2 2 1 1 1 1 1 1 1 2 1 2 1 1
20:5n3 (EPA) 10.3 10.3 10.8 11.0 14.1 14.9 11.6 10.1 13.9 11.4 13.8 11.6 12.0 13.5 11.3 12.0 12.9 14.0 14.4 13.7 13.9
22:1n9 0.6 0.6 0.6 0.6 0.6 1.4 1.3 0.6 3.0 0.6 0.5 1.3 0.8 2.5 0.7 0.6 2.6 0.5 0.5 2.8 0.5
22:5n6 0.9 0.9 0.9 0.9 1.0 0.8 0.8 0.8 0.6 1.0 0.9 0.8 0.8 0.8 0.9 0.8 0.6 1.0 0.9 0.7 1.0
22:5n3 (DPA) 1.2 1.2 1.2 1.2 1.4 1.6 1.4 1.2 1.4 1.3 1.7 1.4 1.4 1.4 1.3 1.6 1.6 1.6 1.8 1.6 1.5
22:6n3 (DHA) 28.0 28.0 28.9 29.5 28.9 30.9 30.9 27.5 29.9 32.1 31.4 31.2 31.3 31.8 29.3 28.6 32.2 29.9 30.4 32.7 29.4
24:1n9 0.6 0.6 0.6 0.6 0.6 0.9 0.6 0.6 1.4 0.6 0.6 0.6 0.5 0.8 0.7 0.6 0.6 0.8 0.5 1.0 0.7
Total FA 92.7 92.4 96.4 97.8 96.5 102.1 99.5 91.0 102.0 102.6 98.7 100.1 94.9 99.8 96.6 96.2 99.1 98.0 96.3 106.0 96.6
Saturated 24.4 24.3 25.5 25.7 26.2 27.7 26.7 23.9 27.8 27.8 27.6 27.5 27.0 26.9 25.6 25.7 28.5 26.5 27.2 29.0 26.1
Unsaturated 68.3 68.1 70.9 72.1 70.3 74.4 72.0 67.2 74.7 74.8 71.1 72.5 67.9 73.8 71.0 70.4 73.6 71.5 72.5 77.0 70.4
Monounsaturated 19.4 19.3 20.2 20.3 17.1 18.3 19.2 19.1 23.2 19.0 15.8 19.3 16.0 20.7 20.1 16.8 20.6 17.5 18.6 22.3 17.1
Polyunsaturated 48.9 48.8 50.8 51.8 53.2 56.1 52.9 48.1 51.6 55.8 55.3 53.2 51.9 52.7 50.9 53.7 53.1 54.1 55.3 54.7 53.3
n-3 40.5 40.4 42.0 42.8 45.6 48.9 45.4 39.9 46.6 46.1 47.9 45.7 45.8 48.1 43.1 43.7 48.2 46.5 47.5 49.4 45.8
n-6 8.4 8.4 8.8 9.0 7.7 7.2 7.5 8.2 4.9 9.7 7.4 7.6 6.1 7.3 7.8 10.0 4.8 7.6 7.8 5.3 7.5
n-3/n-6 4.8 4.8 4.8 4.8 6.0 6.8 6.1 4.8 9.5 4.7 6.5 6.0 7.5 9.4 5.5 4.4 10.0 6.1 6.1 9.4 6.1
DHA/EPA 2.7 2.7 2.7 2.7 2.0 2.1 2.7 2.7 2.2 2.8 2.3 2.7 2.6 2.4 2.6 2.4 2.5 2.1 2.1 2.4 2.1
EPA/ARA 6.4 6.5 6.4 6.4 8.2 10.5 9.4 6.5 16.1 7.2 8.9 9.7 9.9 16.9 9.4 8.8 16.7 8.4 9.2 15.8 8.6
LNA/LA 0.1 0.1 0.1 0.1 0.1 0.1 0.1 0.1 0.2 0.1 0.1 0.1 0.1 0.2 0.1 0.1 0.2 0.1 0.1 0.2 0.1
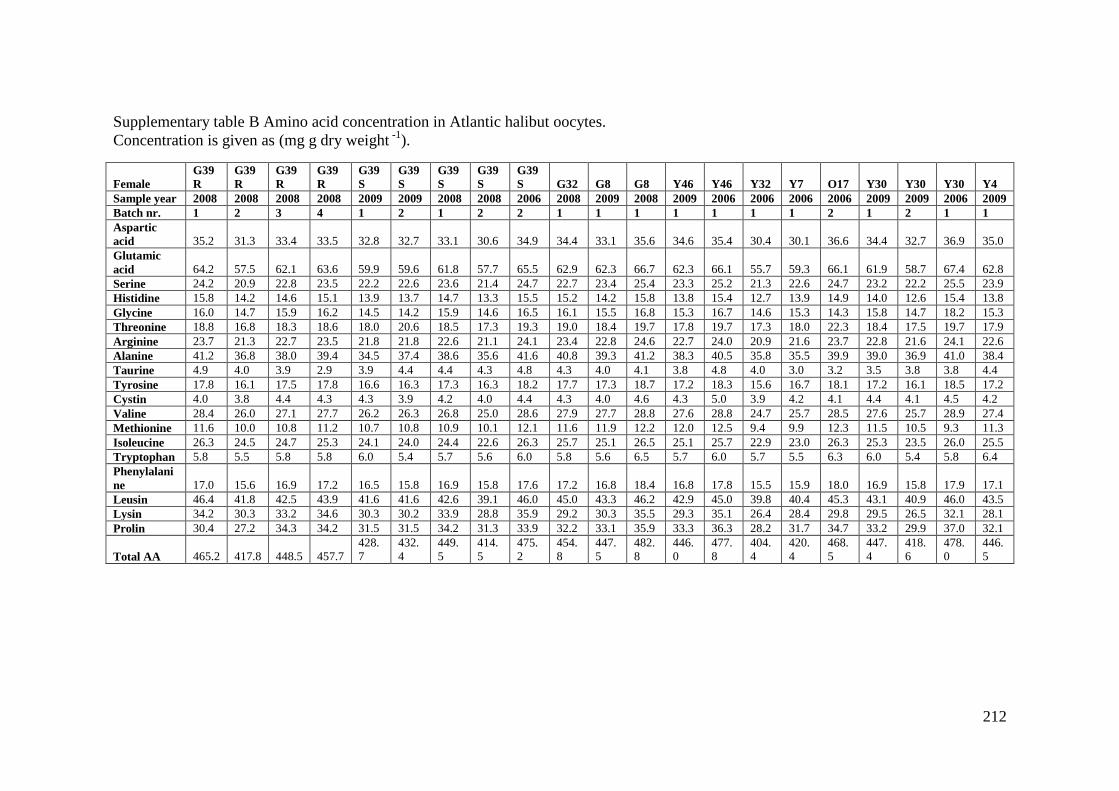
212
Supplementary table B Amino acid concentration in Atlantic halibut oocytes.
Concentration is given as (mg g dry weight -1
).
Female
G39
R
G39
R
G39
R
G39
R
G39
S
G39
S
G39
S
G39
S
G39
S G32 G8 G8 Y46 Y46 Y32 Y7 O17 Y30 Y30 Y30 Y4
Sample year 2008 2008 2008 2008 2009 2009 2008 2008 2006 2008 2009 2008 2009 2006 2006 2006 2006 2009 2009 2006 2009
Batch nr. 1 2 3 4 1 2 1 2 2 1 1 1 1 1 1 1 2 1 2 1 1
Aspartic
acid 35.2 31.3 33.4 33.5 32.8 32.7 33.1 30.6 34.9 34.4 33.1 35.6 34.6 35.4 30.4 30.1 36.6 34.4 32.7 36.9 35.0
Glutamic
acid 64.2 57.5 62.1 63.6 59.9 59.6 61.8 57.7 65.5 62.9 62.3 66.7 62.3 66.1 55.7 59.3 66.1 61.9 58.7 67.4 62.8
Serine 24.2 20.9 22.8 23.5 22.2 22.6 23.6 21.4 24.7 22.7 23.4 25.4 23.3 25.2 21.3 22.6 24.7 23.2 22.2 25.5 23.9
Histidine 15.8 14.2 14.6 15.1 13.9 13.7 14.7 13.3 15.5 15.2 14.2 15.8 13.8 15.4 12.7 13.9 14.9 14.0 12.6 15.4 13.8
Glycine 16.0 14.7 15.9 16.2 14.5 14.2 15.9 14.6 16.5 16.1 15.5 16.8 15.3 16.7 14.6 15.3 14.3 15.8 14.7 18.2 15.3
Threonine 18.8 16.8 18.3 18.6 18.0 20.6 18.5 17.3 19.3 19.0 18.4 19.7 17.8 19.7 17.3 18.0 22.3 18.4 17.5 19.7 17.9
Arginine 23.7 21.3 22.7 23.5 21.8 21.8 22.6 21.1 24.1 23.4 22.8 24.6 22.7 24.0 20.9 21.6 23.7 22.8 21.6 24.1 22.6
Alanine 41.2 36.8 38.0 39.4 34.5 37.4 38.6 35.6 41.6 40.8 39.3 41.2 38.3 40.5 35.8 35.5 39.9 39.0 36.9 41.0 38.4
Taurine 4.9 4.0 3.9 2.9 3.9 4.4 4.4 4.3 4.8 4.3 4.0 4.1 3.8 4.8 4.0 3.0 3.2 3.5 3.8 3.8 4.4
Tyrosine 17.8 16.1 17.5 17.8 16.6 16.3 17.3 16.3 18.2 17.7 17.3 18.7 17.2 18.3 15.6 16.7 18.1 17.2 16.1 18.5 17.2
Cystin 4.0 3.8 4.4 4.3 4.3 3.9 4.2 4.0 4.4 4.3 4.0 4.6 4.3 5.0 3.9 4.2 4.1 4.4 4.1 4.5 4.2
Valine 28.4 26.0 27.1 27.7 26.2 26.3 26.8 25.0 28.6 27.9 27.7 28.8 27.6 28.8 24.7 25.7 28.5 27.6 25.7 28.9 27.4
Methionine 11.6 10.0 10.8 11.2 10.7 10.8 10.9 10.1 12.1 11.6 11.9 12.2 12.0 12.5 9.4 9.9 12.3 11.5 10.5 9.3 11.3
Isoleucine 26.3 24.5 24.7 25.3 24.1 24.0 24.4 22.6 26.3 25.7 25.1 26.5 25.1 25.7 22.9 23.0 26.3 25.3 23.5 26.0 25.5
Tryptophan 5.8 5.5 5.8 5.8 6.0 5.4 5.7 5.6 6.0 5.8 5.6 6.5 5.7 6.0 5.7 5.5 6.3 6.0 5.4 5.8 6.4
Phenylalani
ne 17.0 15.6 16.9 17.2 16.5 15.8 16.9 15.8 17.6 17.2 16.8 18.4 16.8 17.8 15.5 15.9 18.0 16.9 15.8 17.9 17.1
Leusin 46.4 41.8 42.5 43.9 41.6 41.6 42.6 39.1 46.0 45.0 43.3 46.2 42.9 45.0 39.8 40.4 45.3 43.1 40.9 46.0 43.5
Lysin 34.2 30.3 33.2 34.6 30.3 30.2 33.9 28.8 35.9 29.2 30.3 35.5 29.3 35.1 26.4 28.4 29.8 29.5 26.5 32.1 28.1
Prolin 30.4 27.2 34.3 34.2 31.5 31.5 34.2 31.3 33.9 32.2 33.1 35.9 33.3 36.3 28.2 31.7 34.7 33.2 29.9 37.0 32.1
Total AA 465.2 417.8 448.5 457.7
428.
7
432.
4
449.
5
414.
5
475.
2
454.
8
447.
5
482.
8
446.
0
477.
8
404.
4
420.
4
468.
5
447.
4
418.
6
478.
0
446.
5
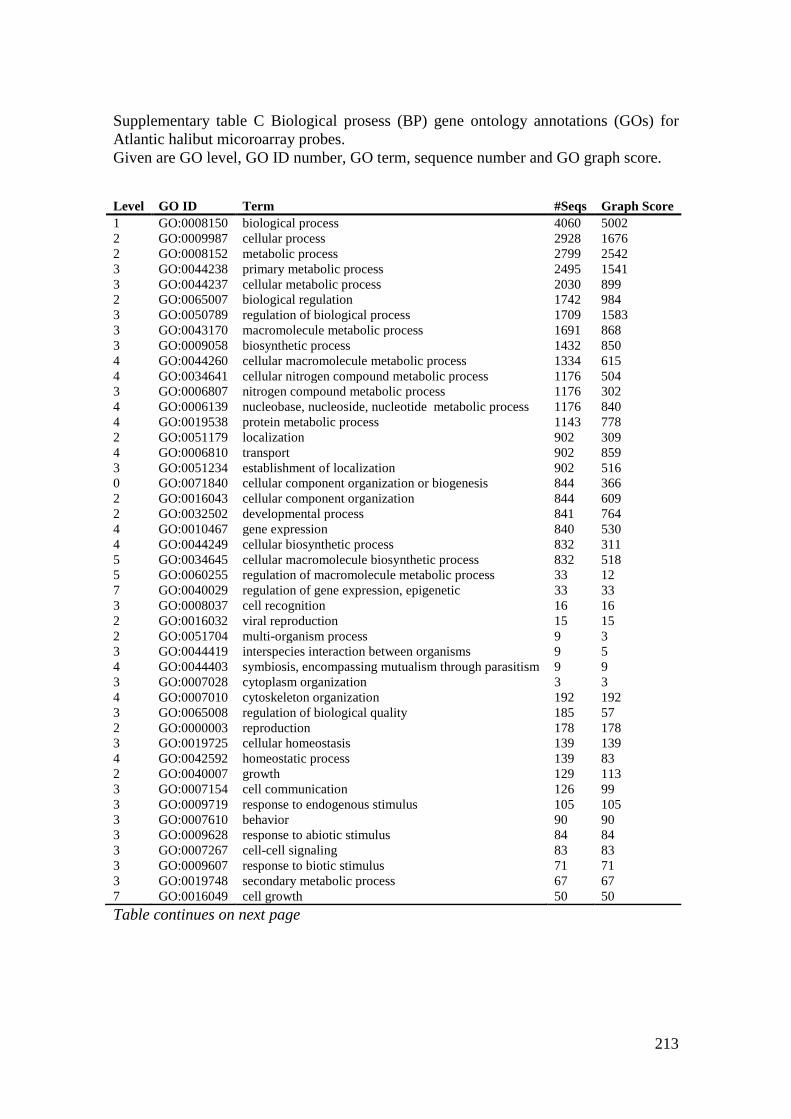
213
Supplementary table C Biological prosess (BP) gene ontology annotations (GOs) for
Atlantic halibut micoroarray probes.
Given are GO level, GO ID number, GO term, sequence number and GO graph score.
Level GO ID Term #Seqs Graph Score
1 GO:0008150 biological process 4060 5002
2 GO:0009987 cellular process 2928 1676
2 GO:0008152 metabolic process 2799 2542
3 GO:0044238 primary metabolic process 2495 1541
3 GO:0044237 cellular metabolic process 2030 899
2 GO:0065007 biological regulation 1742 984
3 GO:0050789 regulation of biological process 1709 1583
3 GO:0043170 macromolecule metabolic process 1691 868
3 GO:0009058 biosynthetic process 1432 850
4 GO:0044260 cellular macromolecule metabolic process 1334 615
4 GO:0034641 cellular nitrogen compound metabolic process 1176 504
3 GO:0006807 nitrogen compound metabolic process 1176 302
4 GO:0006139 nucleobase, nucleoside, nucleotide metabolic process 1176 840
4 GO:0019538 protein metabolic process 1143 778
2 GO:0051179 localization 902 309
4 GO:0006810 transport 902 859
3 GO:0051234 establishment of localization 902 516
0 GO:0071840 cellular component organization or biogenesis 844 366
2 GO:0016043 cellular component organization 844 609
2 GO:0032502 developmental process 841 764
4 GO:0010467 gene expression 840 530
4 GO:0044249 cellular biosynthetic process 832 311
5 GO:0034645 cellular macromolecule biosynthetic process 832 518
5 GO:0060255 regulation of macromolecule metabolic process 33 12
7 GO:0040029 regulation of gene expression, epigenetic 33 33
3 GO:0008037 cell recognition 16 16
2 GO:0016032 viral reproduction 15 15
2 GO:0051704 multi-organism process 9 3
3 GO:0044419 interspecies interaction between organisms 9 5
4 GO:0044403 symbiosis, encompassing mutualism through parasitism 9 9
3 GO:0007028 cytoplasm organization 3 3
4 GO:0007010 cytoskeleton organization 192 192
3 GO:0065008 regulation of biological quality 185 57
2 GO:0000003 reproduction 178 178
3 GO:0019725 cellular homeostasis 139 139
4 GO:0042592 homeostatic process 139 83
2 GO:0040007 growth 129 113
3 GO:0007154 cell communication 126 99
3 GO:0009719 response to endogenous stimulus 105 105
3 GO:0007610 behavior 90 90
3 GO:0009628 response to abiotic stimulus 84 84
3 GO:0007267 cell-cell signaling 83 83
3 GO:0009607 response to biotic stimulus 71 71
3 GO:0019748 secondary metabolic process 67 67
7 GO:0016049 cell growth 50 50
Table continues on next page
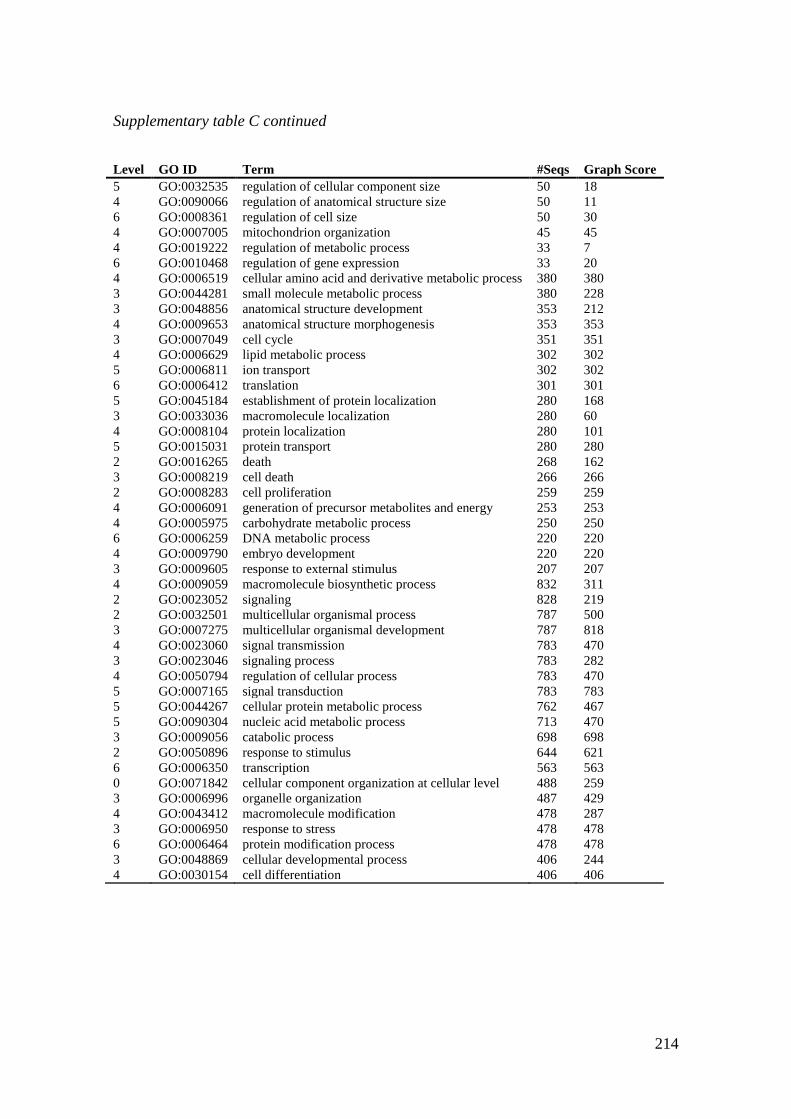
214
Supplementary table C continued
Level GO ID Term #Seqs Graph Score
5 GO:0032535 regulation of cellular component size 50 18
4 GO:0090066 regulation of anatomical structure size 50 11
6 GO:0008361 regulation of cell size 50 30
4 GO:0007005 mitochondrion organization 45 45
4 GO:0019222 regulation of metabolic process 33 7
6 GO:0010468 regulation of gene expression 33 20
4 GO:0006519 cellular amino acid and derivative metabolic process 380 380
3 GO:0044281 small molecule metabolic process 380 228
3 GO:0048856 anatomical structure development 353 212
4 GO:0009653 anatomical structure morphogenesis 353 353
3 GO:0007049 cell cycle 351 351
4 GO:0006629 lipid metabolic process 302 302
5 GO:0006811 ion transport 302 302
6 GO:0006412 translation 301 301
5 GO:0045184 establishment of protein localization 280 168
3 GO:0033036 macromolecule localization 280 60
4 GO:0008104 protein localization 280 101
5 GO:0015031 protein transport 280 280
2 GO:0016265 death 268 162
3 GO:0008219 cell death 266 266
2 GO:0008283 cell proliferation 259 259
4 GO:0006091 generation of precursor metabolites and energy 253 253
4 GO:0005975 carbohydrate metabolic process 250 250
6 GO:0006259 DNA metabolic process 220 220
4 GO:0009790 embryo development 220 220
3 GO:0009605 response to external stimulus 207 207
4 GO:0009059 macromolecule biosynthetic process 832 311
2 GO:0023052 signaling 828 219
2 GO:0032501 multicellular organismal process 787 500
3 GO:0007275 multicellular organismal development 787 818
4 GO:0023060 signal transmission 783 470
3 GO:0023046 signaling process 783 282
4 GO:0050794 regulation of cellular process 783 470
5 GO:0007165 signal transduction 783 783
5 GO:0044267 cellular protein metabolic process 762 467
5 GO:0090304 nucleic acid metabolic process 713 470
3 GO:0009056 catabolic process 698 698
2 GO:0050896 response to stimulus 644 621
6 GO:0006350 transcription 563 563
0 GO:0071842 cellular component organization at cellular level 488 259
3 GO:0006996 organelle organization 487 429
4 GO:0043412 macromolecule modification 478 287
3 GO:0006950 response to stress 478 478
6 GO:0006464 protein modification process 478 478
3 GO:0048869 cellular developmental process 406 244
4 GO:0030154 cell differentiation 406 406
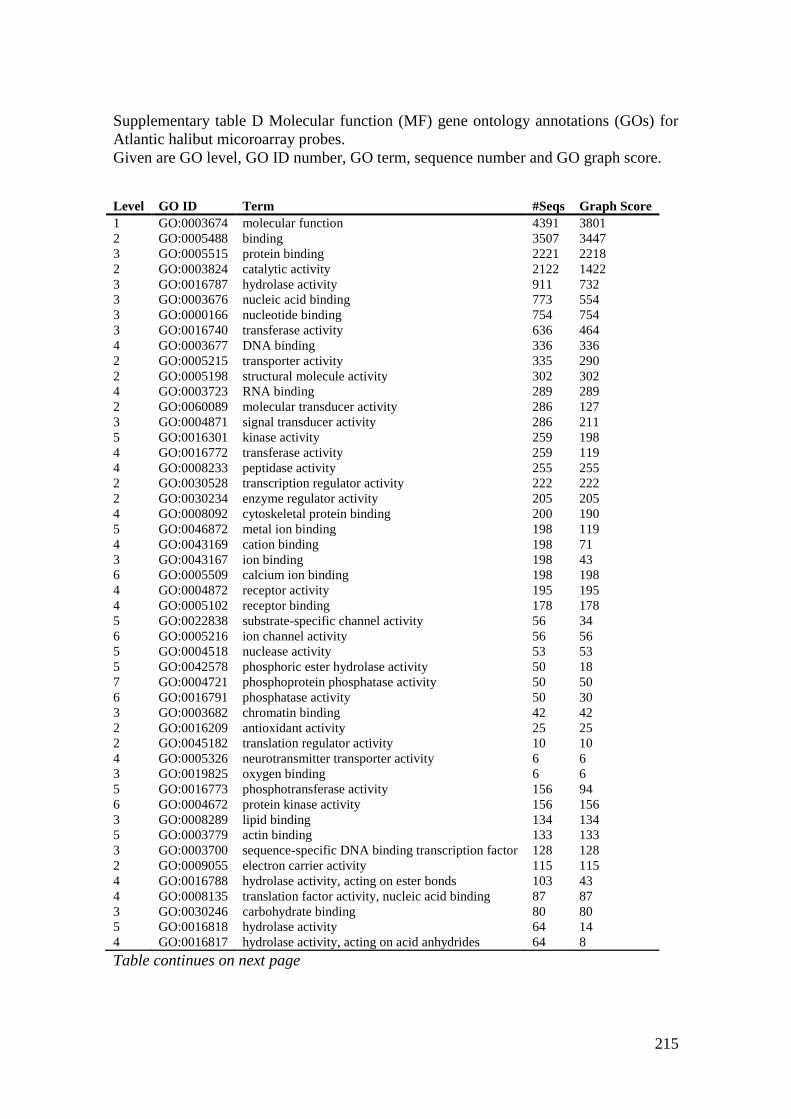
215
Supplementary table D Molecular function (MF) gene ontology annotations (GOs) for
Atlantic halibut micoroarray probes.
Given are GO level, GO ID number, GO term, sequence number and GO graph score.
Level GO ID Term #Seqs Graph Score
1 GO:0003674 molecular function 4391 3801
2 GO:0005488 binding 3507 3447
3 GO:0005515 protein binding 2221 2218
2 GO:0003824 catalytic activity 2122 1422
3 GO:0016787 hydrolase activity 911 732
3 GO:0003676 nucleic acid binding 773 554
3 GO:0000166 nucleotide binding 754 754
3 GO:0016740 transferase activity 636 464
4 GO:0003677 DNA binding 336 336
2 GO:0005215 transporter activity 335 290
2 GO:0005198 structural molecule activity 302 302
4 GO:0003723 RNA binding 289 289
2 GO:0060089 molecular transducer activity 286 127
3 GO:0004871 signal transducer activity 286 211
5 GO:0016301 kinase activity 259 198
4 GO:0016772 transferase activity 259 119
4 GO:0008233 peptidase activity 255 255
2 GO:0030528 transcription regulator activity 222 222
2 GO:0030234 enzyme regulator activity 205 205
4 GO:0008092 cytoskeletal protein binding 200 190
5 GO:0046872 metal ion binding 198 119
4 GO:0043169 cation binding 198 71
3 GO:0043167 ion binding 198 43
6 GO:0005509 calcium ion binding 198 198
4 GO:0004872 receptor activity 195 195
4 GO:0005102 receptor binding 178 178
5 GO:0022838 substrate-specific channel activity 56 34
6 GO:0005216 ion channel activity 56 56
5 GO:0004518 nuclease activity 53 53
5 GO:0042578 phosphoric ester hydrolase activity 50 18
7 GO:0004721 phosphoprotein phosphatase activity 50 50
6 GO:0016791 phosphatase activity 50 30
3 GO:0003682 chromatin binding 42 42
2 GO:0016209 antioxidant activity 25 25
2 GO:0045182 translation regulator activity 10 10
4 GO:0005326 neurotransmitter transporter activity 6 6
3 GO:0019825 oxygen binding 6 6
5 GO:0016773 phosphotransferase activity 156 94
6 GO:0004672 protein kinase activity 156 156
3 GO:0008289 lipid binding 134 134
5 GO:0003779 actin binding 133 133
3 GO:0003700 sequence-specific DNA binding transcription factor 128 128
2 GO:0009055 electron carrier activity 115 115
4 GO:0016788 hydrolase activity, acting on ester bonds 103 43
4 GO:0008135 translation factor activity, nucleic acid binding 87 87
3 GO:0030246 carbohydrate binding 80 80
5 GO:0016818 hydrolase activity 64 14
4 GO:0016817 hydrolase activity, acting on acid anhydrides 64 8
Table continues on next page
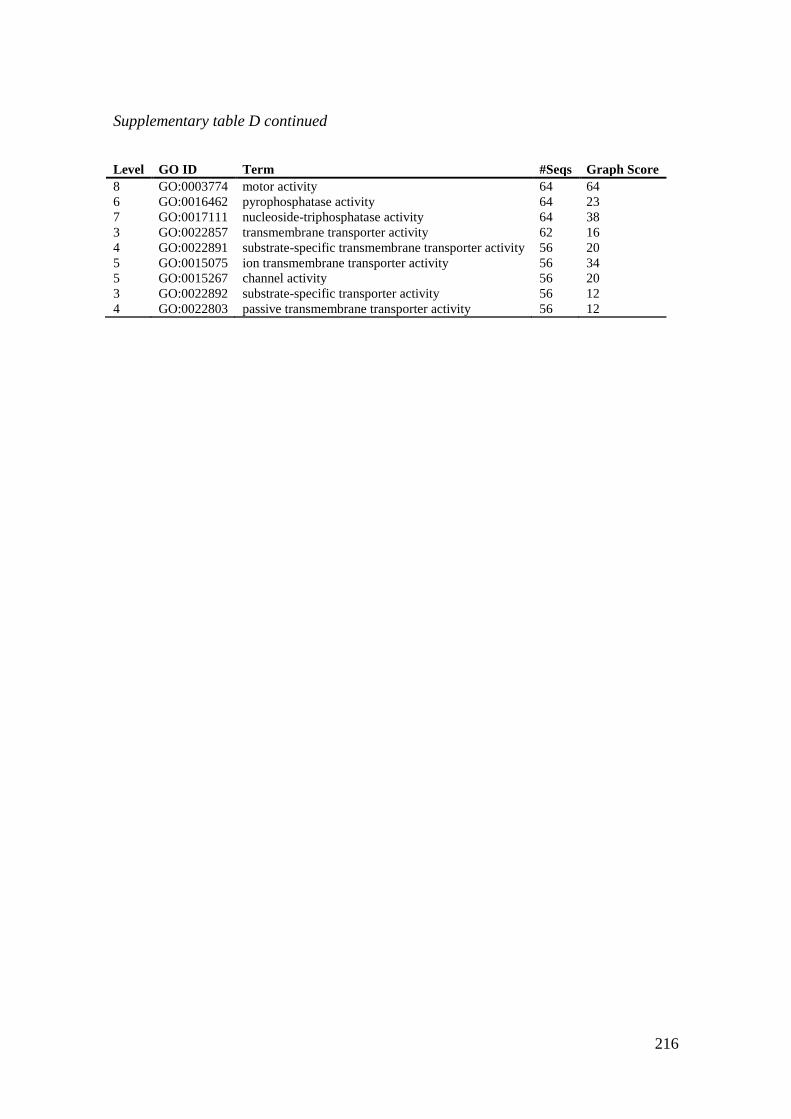
216
Supplementary table D continued
Level GO ID Term #Seqs Graph Score
8 GO:0003774 motor activity 64 64
6 GO:0016462 pyrophosphatase activity 64 23
7 GO:0017111 nucleoside-triphosphatase activity 64 38
3 GO:0022857 transmembrane transporter activity 62 16
4 GO:0022891 substrate-specific transmembrane transporter activity 56 20
5 GO:0015075 ion transmembrane transporter activity 56 34
5 GO:0015267 channel activity 56 20
3 GO:0022892 substrate-specific transporter activity 56 12
4 GO:0022803 passive transmembrane transporter activity 56 12
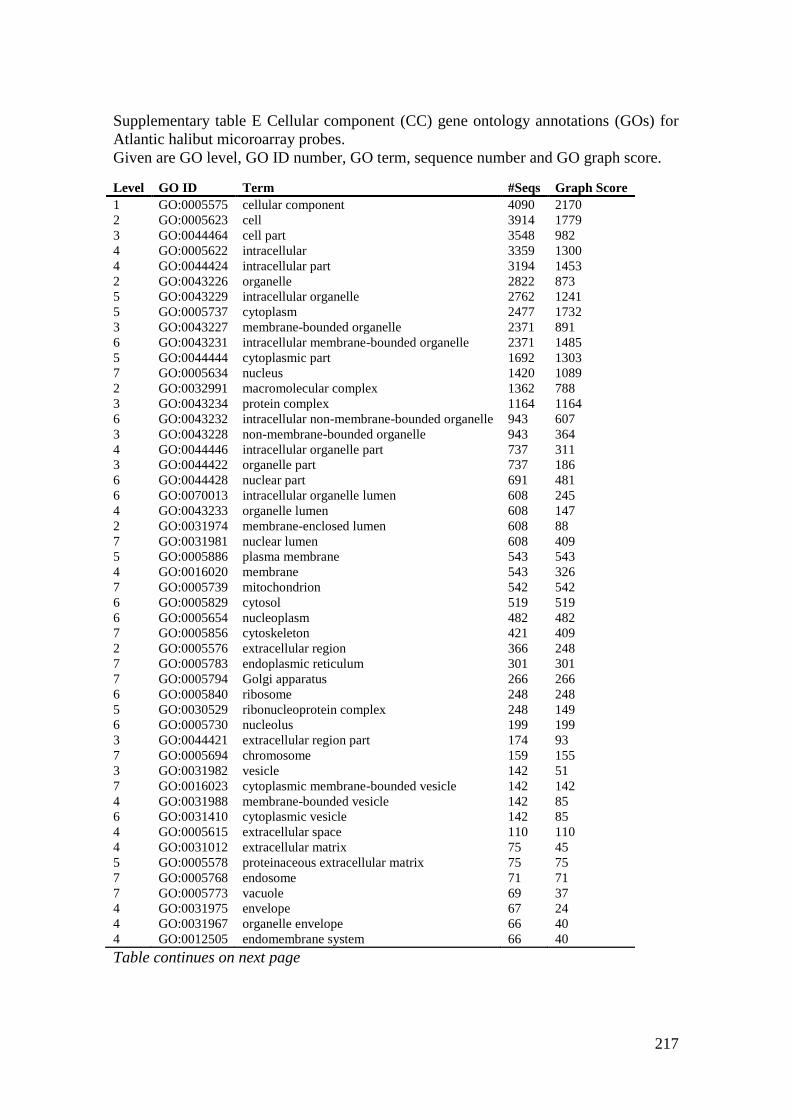
217
Supplementary table E Cellular component (CC) gene ontology annotations (GOs) for
Atlantic halibut micoroarray probes.
Given are GO level, GO ID number, GO term, sequence number and GO graph score.
Level GO ID Term #Seqs Graph Score
1 GO:0005575 cellular component 4090 2170
2 GO:0005623 cell 3914 1779
3 GO:0044464 cell part 3548 982
4 GO:0005622 intracellular 3359 1300
4 GO:0044424 intracellular part 3194 1453
2 GO:0043226 organelle 2822 873
5 GO:0043229 intracellular organelle 2762 1241
5 GO:0005737 cytoplasm 2477 1732
3 GO:0043227 membrane-bounded organelle 2371 891
6 GO:0043231 intracellular membrane-bounded organelle 2371 1485
5 GO:0044444 cytoplasmic part 1692 1303
7 GO:0005634 nucleus 1420 1089
2 GO:0032991 macromolecular complex 1362 788
3 GO:0043234 protein complex 1164 1164
6 GO:0043232 intracellular non-membrane-bounded organelle 943 607
3 GO:0043228 non-membrane-bounded organelle 943 364
4 GO:0044446 intracellular organelle part 737 311
3 GO:0044422 organelle part 737 186
6 GO:0044428 nuclear part 691 481
6 GO:0070013 intracellular organelle lumen 608 245
4 GO:0043233 organelle lumen 608 147
2 GO:0031974 membrane-enclosed lumen 608 88
7 GO:0031981 nuclear lumen 608 409
5 GO:0005886 plasma membrane 543 543
4 GO:0016020 membrane 543 326
7 GO:0005739 mitochondrion 542 542
6 GO:0005829 cytosol 519 519
6 GO:0005654 nucleoplasm 482 482
7 GO:0005856 cytoskeleton 421 409
2 GO:0005576 extracellular region 366 248
7 GO:0005783 endoplasmic reticulum 301 301
7 GO:0005794 Golgi apparatus 266 266
6 GO:0005840 ribosome 248 248
5 GO:0030529 ribonucleoprotein complex 248 149
6 GO:0005730 nucleolus 199 199
3 GO:0044421 extracellular region part 174 93
7 GO:0005694 chromosome 159 155
3 GO:0031982 vesicle 142 51
7 GO:0016023 cytoplasmic membrane-bounded vesicle 142 142
4 GO:0031988 membrane-bounded vesicle 142 85
6 GO:0031410 cytoplasmic vesicle 142 85
4 GO:0005615 extracellular space 110 110
4 GO:0031012 extracellular matrix 75 45
5 GO:0005578 proteinaceous extracellular matrix 75 75
7 GO:0005768 endosome 71 71
7 GO:0005773 vacuole 69 37
4 GO:0031975 envelope 67 24
4 GO:0031967 organelle envelope 66 40
4 GO:0012505 endomembrane system 66 40
Table continues on next page
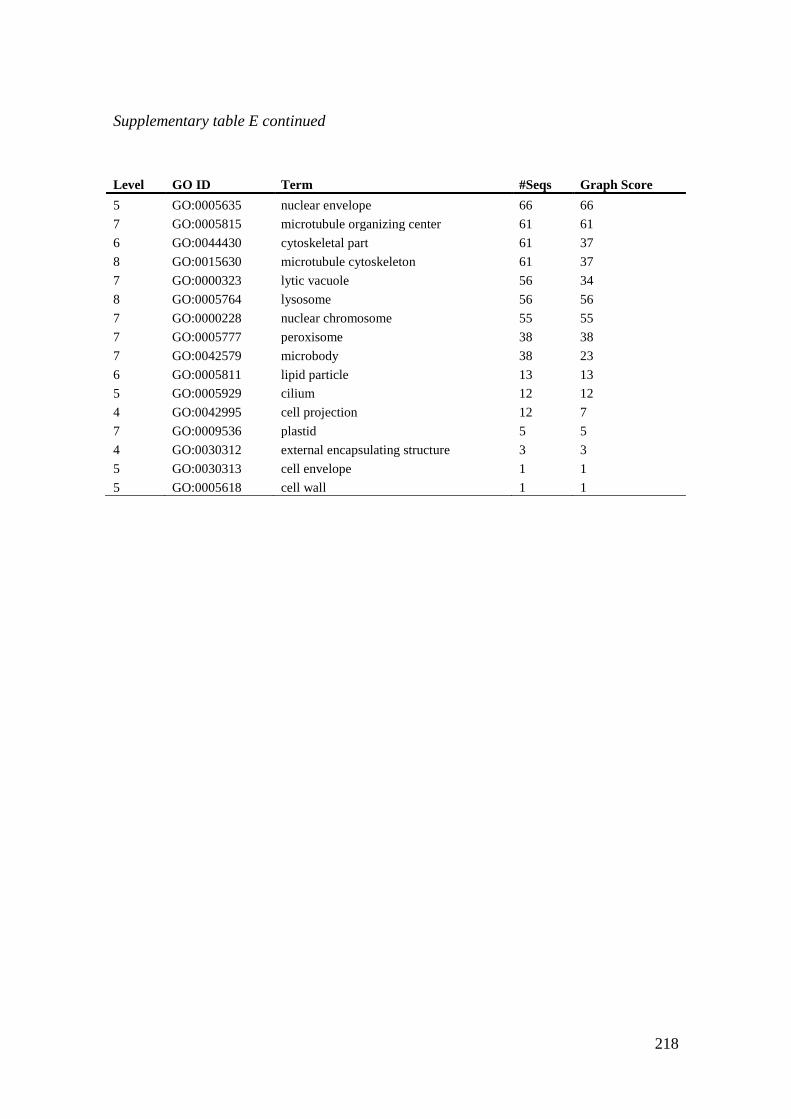
218
Supplementary table E continued
Level GO ID Term #Seqs Graph Score
5 GO:0005635 nuclear envelope 66 66
7 GO:0005815 microtubule organizing center 61 61
6 GO:0044430 cytoskeletal part 61 37
8 GO:0015630 microtubule cytoskeleton 61 37
7 GO:0000323 lytic vacuole 56 34
8 GO:0005764 lysosome 56 56
7 GO:0000228 nuclear chromosome 55 55
7 GO:0005777 peroxisome 38 38
7 GO:0042579 microbody 38 23
6 GO:0005811 lipid particle 13 13
5 GO:0005929 cilium 12 12
4 GO:0042995 cell projection 12 7
7 GO:0009536 plastid 5 5
4 GO:0030312 external encapsulating structure 3 3
5 GO:0030313 cell envelope 1 1
5 GO:0005618 cell wall 1 1
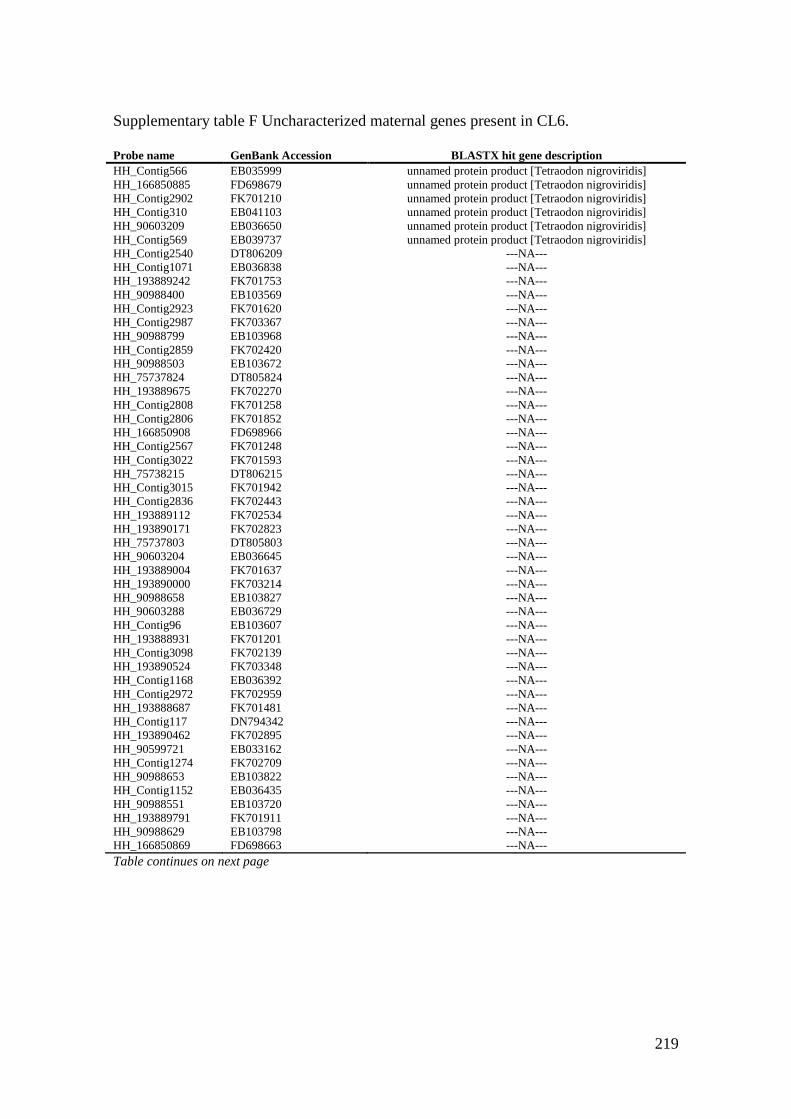
219
Supplementary table F Uncharacterized maternal genes present in CL6.
Probe name GenBank Accession BLASTX hit gene description
HH_Contig566 EB035999 unnamed protein product [Tetraodon nigroviridis]
HH_166850885 FD698679 unnamed protein product [Tetraodon nigroviridis]
HH_Contig2902 FK701210 unnamed protein product [Tetraodon nigroviridis]
HH_Contig310 EB041103 unnamed protein product [Tetraodon nigroviridis]
HH_90603209 EB036650 unnamed protein product [Tetraodon nigroviridis]
HH_Contig569 EB039737 unnamed protein product [Tetraodon nigroviridis]
HH_Contig2540 DT806209 ---NA---
HH_Contig1071 EB036838 ---NA---
HH_193889242 FK701753 ---NA---
HH_90988400 EB103569 ---NA---
HH_Contig2923 FK701620 ---NA---
HH_Contig2987 FK703367 ---NA---
HH_90988799 EB103968 ---NA---
HH_Contig2859 FK702420 ---NA---
HH_90988503 EB103672 ---NA---
HH_75737824 DT805824 ---NA---
HH_193889675 FK702270 ---NA---
HH_Contig2808 FK701258 ---NA---
HH_Contig2806 FK701852 ---NA---
HH_166850908 FD698966 ---NA---
HH_Contig2567 FK701248 ---NA---
HH_Contig3022 FK701593 ---NA---
HH_75738215 DT806215 ---NA---
HH_Contig3015 FK701942 ---NA---
HH_Contig2836 FK702443 ---NA---
HH_193889112 FK702534 ---NA---
HH_193890171 FK702823 ---NA---
HH_75737803 DT805803 ---NA---
HH_90603204 EB036645 ---NA---
HH_193889004 FK701637 ---NA---
HH_193890000 FK703214 ---NA---
HH_90988658 EB103827 ---NA---
HH_90603288 EB036729 ---NA---
HH_Contig96 EB103607 ---NA---
HH_193888931 FK701201 ---NA---
HH_Contig3098 FK702139 ---NA---
HH_193890524 FK703348 ---NA---
HH_Contig1168 EB036392 ---NA---
HH_Contig2972 FK702959 ---NA---
HH_193888687 FK701481 ---NA---
HH_Contig117 DN794342 ---NA---
HH_193890462 FK702895 ---NA---
HH_90599721 EB033162 ---NA---
HH_Contig1274 FK702709 ---NA---
HH_90988653 EB103822 ---NA---
HH_Contig1152 EB036435 ---NA---
HH_90988551 EB103720 ---NA---
HH_193889791 FK701911 ---NA---
HH_90988629 EB103798 ---NA---
HH_166850869 FD698663 ---NA---
Table continues on next page
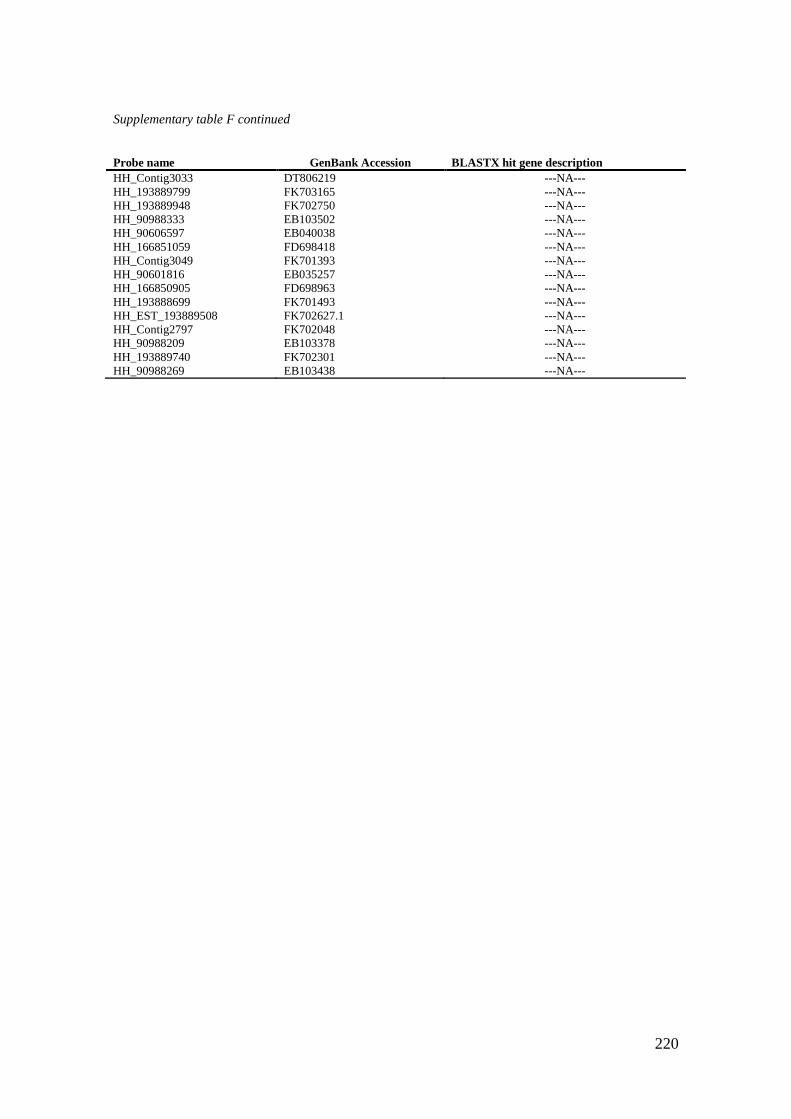
220
Supplementary table F continued
Probe name GenBank Accession BLASTX hit gene description
HH_Contig3033 DT806219 ---NA---
HH_193889799 FK703165 ---NA---
HH_193889948 FK702750 ---NA---
HH_90988333 EB103502 ---NA---
HH_90606597 EB040038 ---NA---
HH_166851059 FD698418 ---NA---
HH_Contig3049 FK701393 ---NA---
HH_90601816 EB035257 ---NA---
HH_166850905 FD698963 ---NA---
HH_193888699 FK701493 ---NA---
HH_EST_193889508 FK702627.1 ---NA---
HH_Contig2797 FK702048 ---NA---
HH_90988209 EB103378 ---NA---
HH_193889740 FK702301 ---NA---
HH_90988269 EB103438 ---NA---
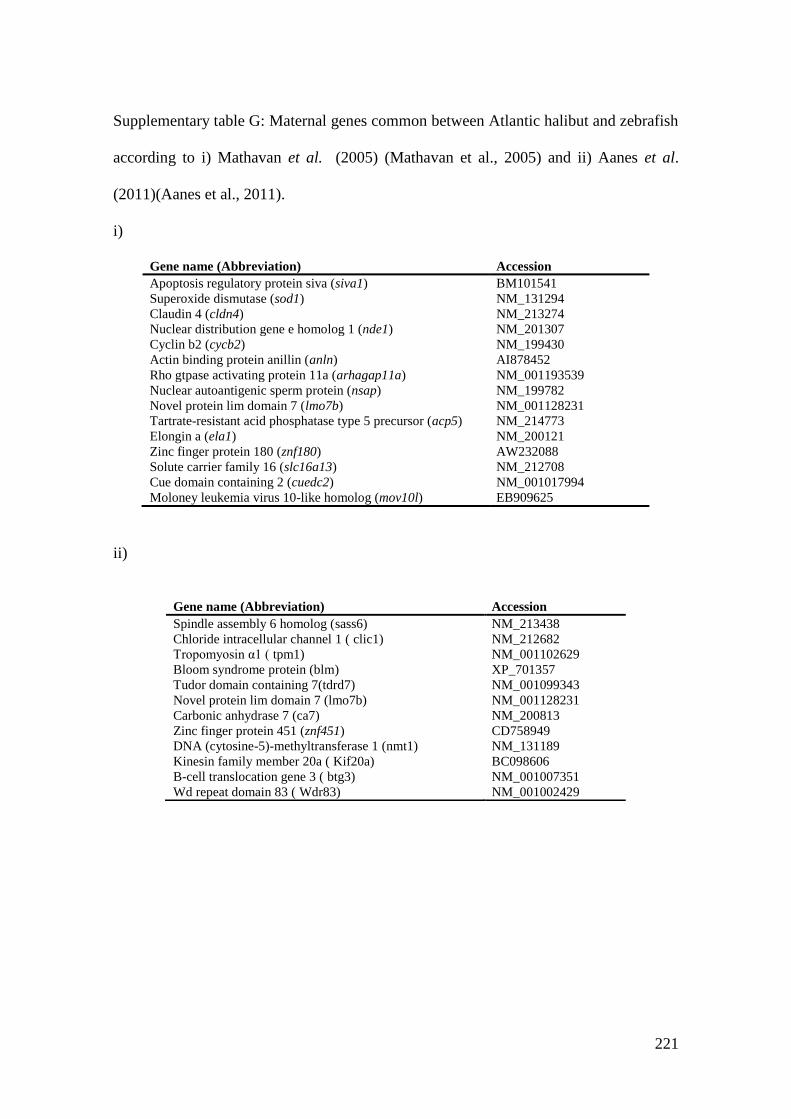
221
Supplementary table G: Maternal genes common between Atlantic halibut and zebrafish
according to i) Mathavan et al. (2005) (Mathavan et al., 2005) and ii) Aanes et al.
(2011)(Aanes et al., 2011).
i)
Gene name (Abbreviation) Accession
Apoptosis regulatory protein siva (siva1) BM101541
Superoxide dismutase (sod1) NM_131294
Claudin 4 (cldn4) NM_213274
Nuclear distribution gene e homolog 1 (nde1) NM_201307
Cyclin b2 (cycb2) NM_199430
Actin binding protein anillin (anln) AI878452
Rho gtpase activating protein 11a (arhagap11a) NM_001193539
Nuclear autoantigenic sperm protein (nsap) NM_199782
Novel protein lim domain 7 (lmo7b) NM_001128231
Tartrate-resistant acid phosphatase type 5 precursor (acp5) NM_214773
Elongin a (ela1) NM_200121
Zinc finger protein 180 (znf180) AW232088
Solute carrier family 16 (slc16a13) NM_212708
Cue domain containing 2 (cuedc2) NM_001017994
Moloney leukemia virus 10-like homolog (mov10l) EB909625
ii)
Gene name (Abbreviation) Accession
Spindle assembly 6 homolog (sass6) NM_213438
Chloride intracellular channel 1 ( clic1) NM_212682
Tropomyosin α1 ( tpm1) NM_001102629
Bloom syndrome protein (blm) XP_701357
Tudor domain containing 7(tdrd7) NM_001099343
Novel protein lim domain 7 (lmo7b) NM_001128231
Carbonic anhydrase 7 (ca7) NM_200813
Zinc finger protein 451 (znf451) CD758949
DNA (cytosine-5)-methyltransferase 1 (nmt1) NM_131189
Kinesin family member 20a ( Kif20a) BC098606
B-cell translocation gene 3 ( btg3) NM_001007351
Wd repeat domain 83 ( Wdr83) NM_001002429
222
10 References
Aanes H, Winata CL, Lin CH, Chen JP, Srinivasan KG, Lee SGP, Lim AYM, Hajan
HS, Collas P, Bourque G, Gong Z, Korzh V, Aleström P, Mathavan S (2011)
Zebrafish mRNA sequencing decipher novelties in transcriptome dynamics
during maternal to zygotic transition. Genome Res., 21, 1328-1338.
Abdelilah S, Solnica-Krezel L, Stainier DY, Driver W (1994) Implications for
dorsoventral axis determination from the zebrafish mutation janus. Nature, 370,
468.
Abrams EW, Mullins MC (2009) Early zebrafish development: It's in the maternal
genes. Curr. Opin. Genet. Dev., 19, 396-403.
Acloque H, Mey A, Birot AM, Gruffat H, Pain B, Samarut J (2004) Transcription factor
cCP2 controls gene expression in chicken embryonic stem cells. Nucleic Acids
Res, 32, 2259-2271.
Aegerter S, Jalabert B, Bobe J (2003) mRNA stockpile and egg quality in rainbow trout
(Oncorhynchus mykiss). Fish Physiol. Biochem., 28, 317-318.
Aegerter S, Jalabert B, Bobe J (2004) Messenger RNA stockpile of cyclin B, insulin-
like growth factor I, insulin-like growth factor II, insulin-like growth factor
receptor Ib, and p53 in the rainbow trout oocyte in relation with developmental
competence. Mol. Reprod. Dev., 67, 127-135.
Aegerter S, Jalabert B, Bobe J (2005) Large scale real-time PCR analysis of mRNA
abundance in rainbow trout eggs in relationship with egg quality and post-
ovulatory ageing. Mol. Reprod. Dev., 72, 377-385.
223
Al-Shahrour F, Díaz-Uriarte R, Dopazo J (2004) FatiGO: A web tool for finding
significant associations of Gene Ontology terms with groups of genes.
Bioinformatics, 20, 578-580.
Aluru N, Vijayan MM (2009) Stress transcriptomics in fish: A role for genomic cortisol
signaling. Gen. Comp. Endocr., 164, 142-150.
Andersen CL, Jensen JL, Orntoft TF (2004) Normalization of real-time quantitative
reverse transcription-PCR data: A model-based variance estimation approach to
identify genes suited for normalization, applied to bladder and colon cancer sata
sets. Cancer Res., 64, 5245-5250.
Andersen Ø, Dahle SW, van Nes S, Bardal T, Tooming-Klunderud A, Kjørsvik E,
Galloway TF (2009) Differential spatio-temporal expression and functional
diversification of the myogenic regulatory factors MyoD1 and MyoD2 in
Atlantic halibut (Hippoglossus hippoglossus). Comp. Biochem. Physiol. B 154,
93-101.
Anderson RA, Sciorio R, Kinnell H, Bayne RAL, Thong KJ, de Sousa PA, Pickering S
(2009) Cumulus gene expression as a predictor of human oocyte fertilisation,
embryo development and competence to establish a pregnancy. Reproduction,
138, 629-637.
Anguis V, Cañavate JP (2005) Spawning of captive Senegal sole (Solea senegalensis)
under a naturally fluctuating temperature regime. Aquaculture, 243, 133-145.
Antonello J, Massault C, Franch R, Haley C, Pellizzari C, Bovo G, Patarnello T, de
Koning DJ, Bargelloni L (2009) Estimates of heritability and genetic correlation
for body length and resistance to fish pasteurellosis in the gilthead sea bream
(Sparus aurata L.). Aquaculture, 298, 29-35.
224
Aoki T, Hirono I, Kondo H, Hikima Ji, Jung TS (2010) Microarray technology is an
effective tool for identifying genes related to the aquacultural improvement of
Japanese flounder, Paralichthys olivaceus. Comp. Biochem. Physiol. D., 6, 39-
43.
Avery TS, Brown JA (2005) Investigating the relationship among abnormal patterns of
cell cleavage, egg mortality and early larval condition in Limanda ferruginea. J.
Fish. Biol., 67, 890-896.
Avery TS, Killen SS, Hollinger TR (2009) The relationship of embryonic development,
mortality, hatching success, and larval quality to normal or abnormal early
embryonic cleavage in Atlantic cod, Gadus morhua. Aquaculture, 289, 265-273.
Babiak I, Bolla S, Ottesen O (2008) Suitable methods for cryopreservation of semen
from Atlantic halibut, Hippoglossus hippoglossus L. Aquacult. Int., 16, 561-572.
Babiak I, Ottesen O, Rudolfsen G, Johnsen S (2006) Quantitative characteristics of
Atlantic halibut, Hippoglossus hippoglossus L., semen throughout the
reproductive season. Theriogenology, 65, 1587-1604.
Bai J, Solberg C, Fernandes JMO, Johnston IA (2007) Profiling of maternal and
developmental-stage specific mRNA transcripts in Atlantic halibut Hippoglossus
hippoglossus. Gene, 386, 202-210.
Balboula AZ, Yamanaka K, Sakatani M, Hegab AO, Zaabel SM, Takahashi M (2010)
Intracellular cathepsin B activity is inversely correlated with the quality and
developmental competence of bovine preimplantation embryos. Mol. Reprod.
Dev., 77, 1031-1039.
225
Baumann M, Sander K (1984) Bipartite axiation follows incomplete epiboly in
zebrafish embryos treated with chemical teratogenes. J. Exp. Zool., 230, 363-
376.
Belham C, Shilan W, Avruch J (1999) Intracellular signalling: PDK1 - A kinase at the
hub of things. Curr. Biol., 9, R93-96.
Benes V, Castoldi M (2010) Expression profiling of microRNA using real-time
quantitative PCR, how to use it and what is available. Methods, 50, 244-249.
Benjamini Y, Hochberg Y (1995) Controlling the False Discovery Rate: A Practical and
Powerful Approach to Multiple Testing. J. R. Stat. Soc. Series B, 57, 289-300.
Bergan V, Kileng T, Sun B, Robertsen B (2010) Regulation and function of interferon
regulatory factors of Atlantic salmon. Mol. Immunol., 47, 2005-2014.
Bettegowda A, Patel OV, Lee KB, Park KE, Salem M, Yao J, Ireland JJ, Smith GW
(2008) Identification of novel bovine cumulus cell molecular markers predictive
of oocyte competence: Functional and diagnostic implications. Biol. Reprod.,
79, 301-309.
Bettencourt R, Pinheiro M, Egas C, Gomes P, Afonso M, Shank T, Santos R (2010)
High-throughput sequencing and analysis of the gill tissue transcriptome from
the deep-sea hydrothermal vent mussel Bathymodiolus azoricus. BMC
Genomics, 11, 559.
Bierkamp C, Luxey M, Metchat A, Audouard C, Dumollard R, Christians E (2010)
Lack of maternal Heat Shock Factor 1 results in multiple cellular and
developmental defects, including mitochondrial damage and altered redox
homeostasis, and leads to reduced survival of mammalian oocytes and embryos.
Dev. Biol., 339, 338-353.
226
Björnsson B, Halldórsson Ó, Haux C, Norberg B, Brown C (1998) Photoperiod control
of sexual maturation of the Atlantic halibut (Hippoglossus hippoglossus):
plasma thyroid hormone and calcium levels. Aquaculture, 166, 117-140.
Black DL (2003) Mechanisms of alternative pre-messenger RNA splicing. Annu. Rev.
Biochem., 72, 291-336.
Blaser H, Eisenbeiss S, Neumann M, Reichman-Fried M, Thisse B, Thisse C, Raz E
(2005) Transition from non-motile behaviour to directed migration during early
PGC development in zebrafish. J. Cell. Sci., 118, 4027-4038.
Blaxter JHS, Danielssen D, Moksness E, Oiestad V (1983) Description of the early
development of the halibut Hippoglossus hippoglossus and attempts to rear the
larvae past 1st feeding. Mar. Biol., 73, 99-107.
Bligh EG, Dyer WJ (1959) A rapid method of total lipid extraction and purification.
Can. J. Biochem. Physiol., 37, 911-917.
Blom HJ (2009) Folic acid, methylation and neural tube closure in humans. Birth
Defects Res. A, 85, 295-302.
Bobe J, Labbe C (2009) Egg and sperm quality in fish. Gen. Comp. Endocr., 165, 535-
548.
Bone Q, Moore R (2008) Biology of Fishes, Taylor & Francis, Abingdon, UK.
Bongers ABJ, Zandieh-Doulabi B, Richter CJJ, Komen J (1999) Viable androgenetic
YY genotypes of common carp (Cyprinus carpio L.). J. Hered., 90, 195-198.
Bonnet E, Fostier A, Bobe J (2007) Microarray-based analysis of fish egg quality after
natural or controlled ovulation. BMC Genomics, 8.
Boswell RE, Mahowald AP (1985) Tudor, a gene required for assembly of the germ
plasm in Drosophila melanogaster. Cell, 43, 97-104.
227
Bourc'his D, Proudhon C (2008) Sexual dimorphism in parental imprint ontogeny and
contribution to embryonic development. Mol. Cell. Endocrinol., 282, 87-94.
Brenner S, Elgar G, Sandford R, Macrae A, Venkatesh B, Aparicio S (1993)
Characterization of the Pufferfish genome as a compact model vertebrate
genome. Nature, 366, 265-268.
Brock JA, Bullis R (2001) Disease prevention and control for gametes and embryos of
fish and marine shrimp. Aquaculture, 197, 137-159.
Bromage N, Bruce M, Basavaraja N, Rana K, Shields R, Young C, Dye J, Smith P,
Gillespie M, Gamble J (1994) Egg quality determinants in finfish., therRole of
overripening with special reference to the timing of stripping in the Atlantic
halibut Hippoglossus hippoglossus. J. World Aquacult. Soc., 25, 13-21.
Bromage N, Jones J, Randall C, Thrush M, Davies B, Springate J, Duston J, Barker G
(1992) Broodstock management, fecundity, egg quality and the timing of egg
production in the rainbow trout (Oncorhynchus mykiss). Aquaculture, 100, 141-
166.
Brooks S, Tyler C, Sumpter J (1997) Egg quality in fish: what makes a good egg? Rev.
Fish Biol. Fisher., V7, 387-416.
Brosnan JT, Brosnan ME, Bertolo RFP, Brunton JA (2007) Methionine: A
metabolically unique amino acid. Livest. Sci., 112, 2-7.
Brown NP, Shields RJ, Bromage NR (2006) The influence of water temperature on
spawning patterns and egg quality in the Atlantic halibut (Hippoglossus
hippoglossus L.). Aquaculture, 261, 993-1002.
Bruce M, Oyen F, Bell G, Asturiano JF, Farndale B, Carrillo M, Zanuy S, Ramos J,
Bromage N (1999) Development of broodstock diets for the European Sea Bass
228
(Dicentrarchus labrax) with special emphasis on the importance of n - 3 and n -
6 highly unsaturated fatty acid to reproductive performance. Aquaculture, 177,
85-97.
Bruce M, Shields R, Bell M, Bromage N (1993) Lipid class and fatty acid composition
of eggs of Atlantic halibut, Hippoglossus hippoglossus (L.), in relation to egg
quality in captive broodstock. Aquacult. Res., 24, 417-422.
Burzynski GM, Delalande JM, Shepherd I (2009) Characterization of spatial and
temporal expression pattern of SCG10 during zebrafish development. Gene
Expr. Patterns, 9, 231-237.
Bustin SA, Benes V, Nolan T, Pfaffl MW (2005) Quantitative real-time RT-PCR - a
perspective. J. Mol. Endocrinol., 34, 597-601.
Bustin SA, Nolan T (2004) Pitfalls of quantitative real-time reverse-transcription
polymerase chain reaction. J. Biomol. Tech., 15, 155-166.
Cal RM, Vidal S, Martínez P, Álvarez-Blázquez B, Gómez C, Piferrer F (2006) Growth
and gonadal development of gynogenetic diploid Scophthalmus maximus. J.
Fish. Biol., 68, 401-413.
Callanan M, Kudo N, Gout S, Brocard M, Yoshida M, Dimitrov S, Khochbin S (2000)
Developmentally regulated activity of CRM1/XPO1 during early Xenopus
embryogenesis. J. Cell. Sci., 113, 451-459.
Campinho MA, Silva N, Nowell MA, Llewellyn L, Sweeney GE, Power DM (2007)
Troponin T isoform expression is modulated during Atlantic Halibut
metamorphosis. BMC Dev. Biol., 7.
Canario AVM, Bargelloni L, Volckaert F, Houston RD, Massault C, Guiguen Y (2008)
Genomics toolbox for farmed fish. Res. Fish. Sci., 16, 1-13.
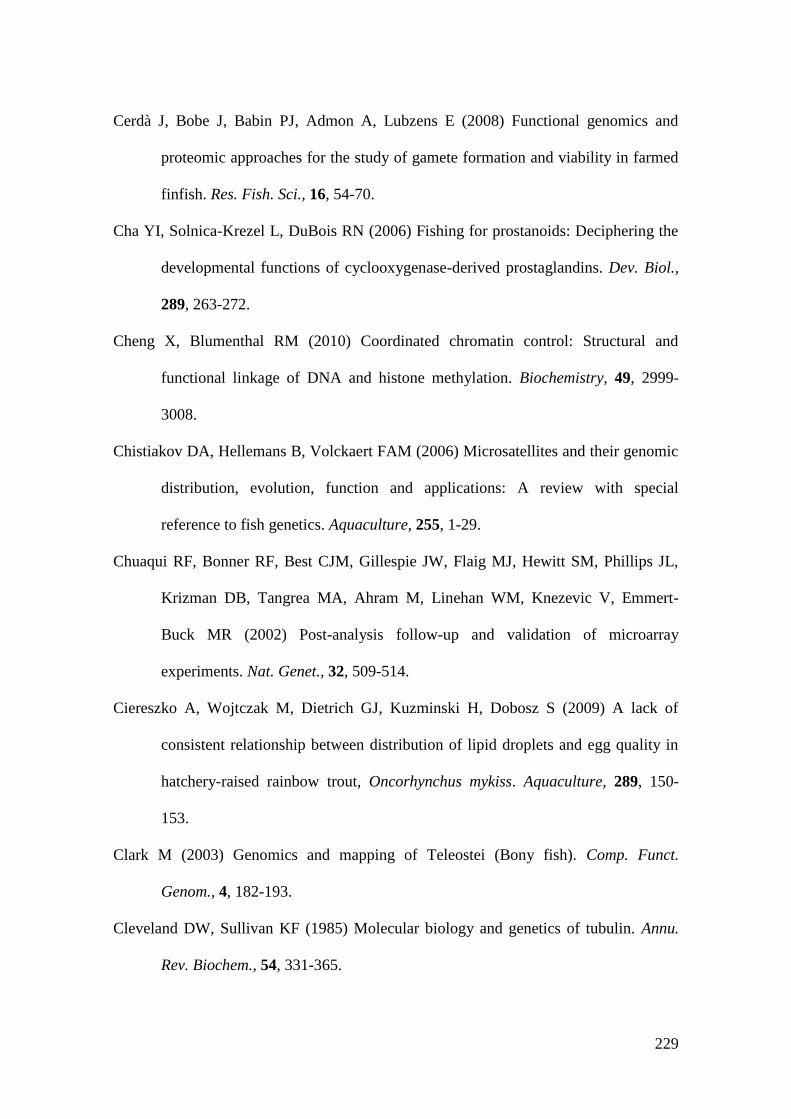
229
Cerdà J, Bobe J, Babin PJ, Admon A, Lubzens E (2008) Functional genomics and
proteomic approaches for the study of gamete formation and viability in farmed
finfish. Res. Fish. Sci., 16, 54-70.
Cha YI, Solnica-Krezel L, DuBois RN (2006) Fishing for prostanoids: Deciphering the
developmental functions of cyclooxygenase-derived prostaglandins. Dev. Biol.,
289, 263-272.
Cheng X, Blumenthal RM (2010) Coordinated chromatin control: Structural and
functional linkage of DNA and histone methylation. Biochemistry, 49, 2999-
3008.
Chistiakov DA, Hellemans B, Volckaert FAM (2006) Microsatellites and their genomic
distribution, evolution, function and applications: A review with special
reference to fish genetics. Aquaculture, 255, 1-29.
Chuaqui RF, Bonner RF, Best CJM, Gillespie JW, Flaig MJ, Hewitt SM, Phillips JL,
Krizman DB, Tangrea MA, Ahram M, Linehan WM, Knezevic V, Emmert-
Buck MR (2002) Post-analysis follow-up and validation of microarray
experiments. Nat. Genet., 32, 509-514.
Ciereszko A, Wojtczak M, Dietrich GJ, Kuzminski H, Dobosz S (2009) A lack of
consistent relationship between distribution of lipid droplets and egg quality in
hatchery-raised rainbow trout, Oncorhynchus mykiss. Aquaculture, 289, 150-
153.
Clark M (2003) Genomics and mapping of Teleostei (Bony fish). Comp. Funct.
Genom., 4, 182-193.
Cleveland DW, Sullivan KF (1985) Molecular biology and genetics of tubulin. Annu.
Rev. Biochem., 54, 331-365.
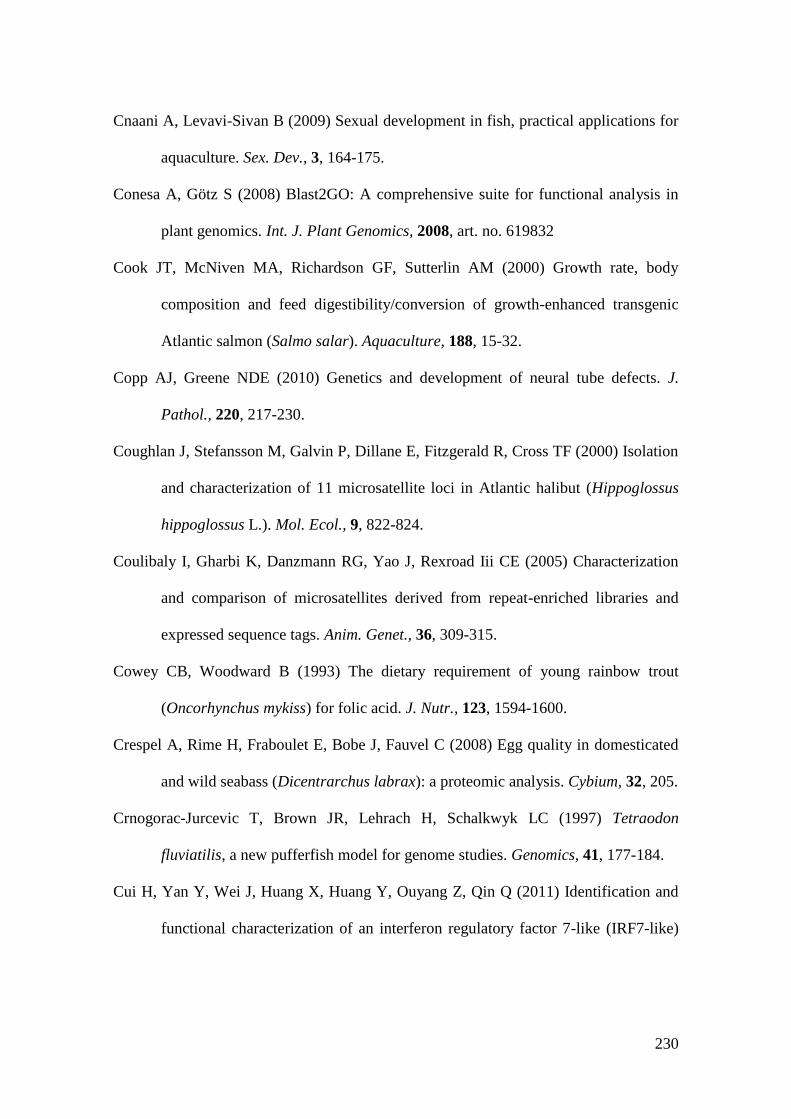
230
Cnaani A, Levavi-Sivan B (2009) Sexual development in fish, practical applications for
aquaculture. Sex. Dev., 3, 164-175.
Conesa A, Götz S (2008) Blast2GO: A comprehensive suite for functional analysis in
plant genomics. Int. J. Plant Genomics, 2008, art. no. 619832
Cook JT, McNiven MA, Richardson GF, Sutterlin AM (2000) Growth rate, body
composition and feed digestibility/conversion of growth-enhanced transgenic
Atlantic salmon (Salmo salar). Aquaculture, 188, 15-32.
Copp AJ, Greene NDE (2010) Genetics and development of neural tube defects. J.
Pathol., 220, 217-230.
Coughlan J, Stefansson M, Galvin P, Dillane E, Fitzgerald R, Cross TF (2000) Isolation
and characterization of 11 microsatellite loci in Atlantic halibut (Hippoglossus
hippoglossus L.). Mol. Ecol., 9, 822-824.
Coulibaly I, Gharbi K, Danzmann RG, Yao J, Rexroad Iii CE (2005) Characterization
and comparison of microsatellites derived from repeat-enriched libraries and
expressed sequence tags. Anim. Genet., 36, 309-315.
Cowey CB, Woodward B (1993) The dietary requirement of young rainbow trout
(Oncorhynchus mykiss) for folic acid. J. Nutr., 123, 1594-1600.
Crespel A, Rime H, Fraboulet E, Bobe J, Fauvel C (2008) Egg quality in domesticated
and wild seabass (Dicentrarchus labrax): a proteomic analysis. Cybium, 32, 205.
Crnogorac-Jurcevic T, Brown JR, Lehrach H, Schalkwyk LC (1997) Tetraodon
fluviatilis, a new pufferfish model for genome studies. Genomics, 41, 177-184.
Cui H, Yan Y, Wei J, Huang X, Huang Y, Ouyang Z, Qin Q (2011) Identification and
functional characterization of an interferon regulatory factor 7-like (IRF7-like)
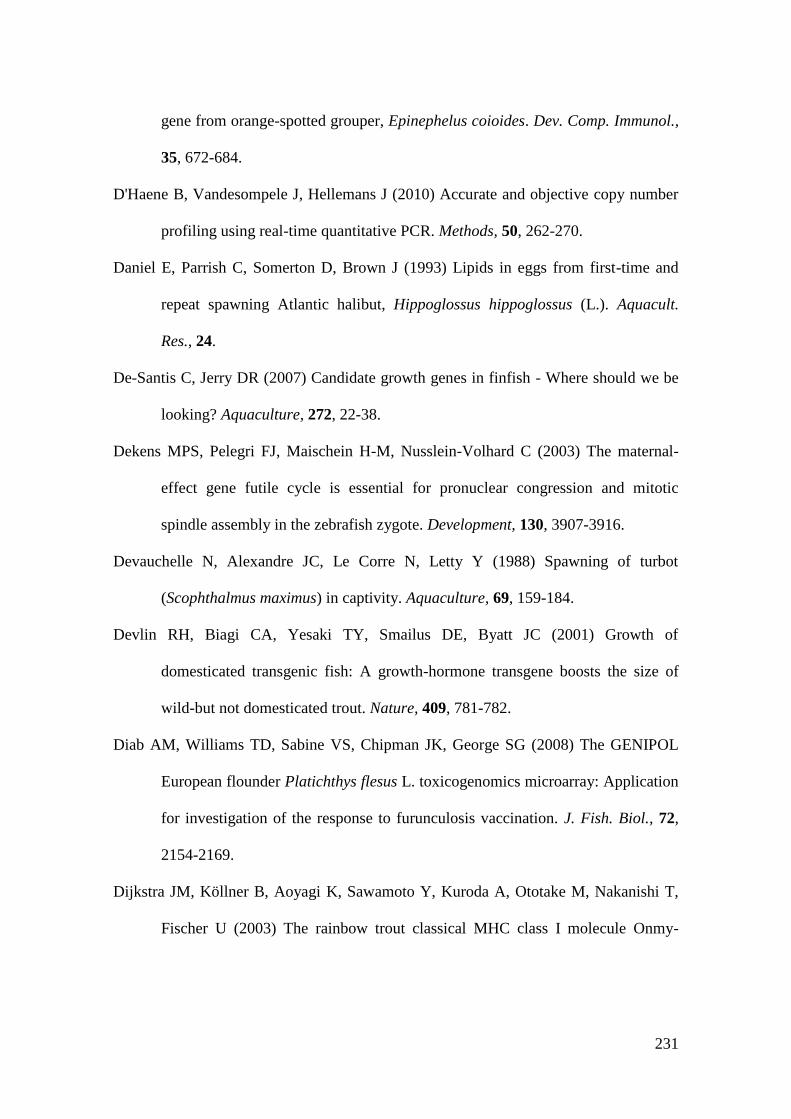
231
gene from orange-spotted grouper, Epinephelus coioides. Dev. Comp. Immunol.,
35, 672-684.
D'Haene B, Vandesompele J, Hellemans J (2010) Accurate and objective copy number
profiling using real-time quantitative PCR. Methods, 50, 262-270.
Daniel E, Parrish C, Somerton D, Brown J (1993) Lipids in eggs from first-time and
repeat spawning Atlantic halibut, Hippoglossus hippoglossus (L.). Aquacult.
Res., 24.
De-Santis C, Jerry DR (2007) Candidate growth genes in finfish - Where should we be
looking? Aquaculture, 272, 22-38.
Dekens MPS, Pelegri FJ, Maischein H-M, Nusslein-Volhard C (2003) The maternal-
effect gene futile cycle is essential for pronuclear congression and mitotic
spindle assembly in the zebrafish zygote. Development, 130, 3907-3916.
Devauchelle N, Alexandre JC, Le Corre N, Letty Y (1988) Spawning of turbot
(Scophthalmus maximus) in captivity. Aquaculture, 69, 159-184.
Devlin RH, Biagi CA, Yesaki TY, Smailus DE, Byatt JC (2001) Growth of
domesticated transgenic fish: A growth-hormone transgene boosts the size of
wild-but not domesticated trout. Nature, 409, 781-782.
Diab AM, Williams TD, Sabine VS, Chipman JK, George SG (2008) The GENIPOL
European flounder Platichthys flesus L. toxicogenomics microarray: Application
for investigation of the response to furunculosis vaccination. J. Fish. Biol., 72,
2154-2169.
Dijkstra JM, Köllner B, Aoyagi K, Sawamoto Y, Kuroda A, Ototake M, Nakanishi T,
Fischer U (2003) The rainbow trout classical MHC class I molecule Onmy-
232
UBA*501 is expressed in similar cell types as mammalian classical MHC class I
molecules. Fish Shellfish. Immun., 14, 1-23.
Ding H, Shao C, Liao X, Xu G, Ji X, Chen S (2009) Ten polymorphic microsatellite
loci for the Atlantic halibut (Hippoglossus hippoglossus) and cross-species
application in related species. Conserv. Genet., 10, 611-614.
Dios S, Novoa B, Buonocore F, Scapigliati G, Figueras A (2008) Genomic resources for
immunology and disease of salmonid and non-salmonid fish. Rev. Fish. Sci., 16,
117-130.
Dosch R, Niehrs C (2000) Requirement for anti-dorsalizing morphogenetic protein in
organizer patterning. Mech. Dev., 90, 195-203.
Dosch R, Wagner DS, Mintzer KA, Runke G, Wiemelt AP, Mullins MC (2004)
Maternal control of vertebrate development before the midblastula transition:
Mutants from the Zebrafish I. Dev. Cell., 6, 771-780.
Douglas S, Knickle, Williams, Flight, Reith (2008) A first generation Atlantic halibut
Hippoglossus hippoglossus (L.) microarray: Application to developmental
studies. J. Fish. Biol., 72, 2391-2406.
Douglas SE (2006) Microarray studies of gene expression in fish. OMICS, 10, 474-489.
Douglas SE, Knickle LC, Kimball J, Reith ME (2007) Comprehensive EST analysis of
Atlantic halibut (Hippoglossus hippoglossus), a commercially relevant
aquaculture species. BMC Genet., 8, 144.
Du SJ, Gong Z, Fletcher GL, Shears MA, King MJ, Idler DR, Hew CL (1992) Growth
enhancement in transgenic Atlantic salmon by the use of an "all fish" chimeric
growth hormone gene construct. Nat. Biotechnol., 10, 176-181.
233
Duncan PL, Lovell RT, Butterworth Jr CE, Freeberg LE, Tamura T (1993) Dietary
folate requirement determined for channel catfish, Ictalurus punctatus. J. Nutr.,
123, 1888-1897.
Dunham RA (2004) Aquaculture and fisheries biotechnology: genetic approaches,
CABI Publishing, Wallingford, UK.
Dunham RA (2009) Transgenic fish resistant to infectious diseases, their risk and
prevention of escape into the environment and future candidate genes for disease
transgene manipulation. Comp. Immunol. Microbiol. Infec. Dis., 32, 139-161.
Dunham RA, Ramboux AC, Duncan PL, Hayat M, Chen TT, Lin CM, Kight K,
Gonzalez-Villasenor I, Powers DA (1992) Transfer, expression, and inheritance
of salmonid growth hormone genes in channel catfish, Ictalurus punctatus, and
effects on performance traits. Mol. Mar. Biol. Biotech., 1, 380-389.
Dworkin M, Dworkin-Rastl E (1990) Functions of maternal mRNA in early
development. Mol. Reprod. Dev., 26, 261-297.
Eknath AE, Bentsen HB, Ponzoni RW, Rye M, Nguyen NH, Thodesen J, Gjerde B
(2007) Genetic improvement of farmed tilapias: Composition and genetic
parameters of a synthetic base population of Oreochromis niloticus for selective
breeding. Aquaculture, 273, 1-14.
Elbashir SM, Harborth J, Weber K, Tuschl T (2002) Analysis of gene function in
somatic mammalian cells using small interfering RNAs. Methods, 26, 199-213.
Erali M, Wittwer CT (2010) High resolution melting analysis for gene scanning.
Methods, 50, 250-261.
Eskelinen P (1989) Effects of different diets on egg production and egg quality of
Atlantic salmon (Salmo salar L.). Aquaculture, 79, 275-281.
234
Estévez A, Ishikawa M, Kanazawa A (1997) Effects of arachidonic acid on
pigmentation and fatty acid composition of Japanese flounder, Paralichthys
olivaceus. Aquacult. Res., 28, 279-289.
Evans RP, Parrish CC, Brown JA, Davis PJ (1996) Biochemical composition of eggs
from repeat and first-time spawning captive Atlantic halibut (Hippoglossus
hippoglossus). Aquaculture, 139, 139-149.
Ewing B, Hillier L, Wendl MC, Green P (1998) Base-calling of automated sequencer
traces using phred. I. Accuracy assessment. Genome. Res., 8, 175-185.
Ezaz MT, Myers JM, Powell SF, McAndrew BJ, Penman DJ (2004) Sex ratios in the
progeny of androgenetic and gynogenetic YY male Nile tilapia, Oreochromis
niloticus L. Aquaculture, 232, 205-214.
Falk-Petersen S, Falk-Petersen IB, Sargent JR, Haug T (1986) Lipid class and fatty acid
composition of eggs from the Atlantic halibut (Hippoglossus hippoglossus).
Aquaculture, 52, 207-211.
Falk-Petersen S, Sargent JR, Fox C, Falk-Petersen IB, Haug T, Kjørsvik E (1989)
Lipids in Atlantic halibut (Hippoglossus hippoglossus) eggs from planktonic
samples in Northern Norway. Mar. Biol., 101, 553-556.
Fauvel C, Omnès M-H, Suquet M, Normant Y (1993) Reliable assessment of
overripening in turbot (Scophthalmus maximus) by a simple pH measurement.
Aquaculture, 117, 107-113.
Fernandes JMO, Mackenzie MG, Elgar G, Suzuki Y, Watabe S, Kinghorn JR, Johnston
IA (2005) A genomic approach to reveal novel genes associated with myotube
formation in the model teleost, Takifugu rubripes. Physiol. Genomics, 22, 327-
338.
235
Fernandes JMO, Mommens M, Hagen Ø, Babiak I, Solberg C (2008) Selection of
suitable reference genes for real-time PCR studies of Atlantic halibut
development. Comp. Biochem. Physiol. B, 150, 23-32.
Fernández-Palacios H, Izquierdo MS, Robaina L, Valencia A, Salhi M, Vergara J
(1995) Effect of n - 3 HUFA level in broodstock diets on egg quality of gilthead
sea bream (Sparus aurata L.). Aquaculture, 132, 325-337.
Finn R (2007a) The maturational disassembly and differential proteolysis of paralogous
vitellogenins in a marine pelagophil teleost: A conserved mechanism of oocyte
hydration. Biol. Reprod., 76, 936-948.
Finn R (2007b) The physiology and toxicology of salmonid eggs and larvae in relation
to water quality criteria. Aquat. Toxicol., 81, 337-354.
Finn R, Fyhn H (2010) Requirement for amino acids in ontogeny of fish. Aquacult.
Res., 41, 684-716.
Finn R, Fyhn H, Evjen M (1991) Respiration and nitrogen-metabolism of Atlantic
halibut eggs (Hippoglossus hippoglossus). Mar. Biol., 108, 11-19.
Finn R, Ronnestad I, Fyhn H (1995) Respiration, nitrogen and energy-metabolism of
developing yolk-sac larvae of Atlantic halibut (Hippoglossus hippoglossus L).
Comp. Biochem. Physiol. A, 111, 647-671.
Finn R, Østby G, Norberg B, Fyhn H (2002) In vivo oocyte hydration in Atlantic
halibut (Hippoglossus hippoglossus); proteolytic liberation of free amino acids,
and ion transport, are driving forces for osmotic water influx. J. Exp. Biol., 205,
211-224.
Folch J, Lees M, Sloane Stanley G (1957) A simple method for the isolation and
purofication of total lipids from animal tissues. J. Biol. Chem., 497-507.
236
Foss A, Imsland AK, Vikingstad E, Stefansson SO, Norberg B, Pedersen S, Sandvik T,
Roth B (2009) Compensatory growth in Atlantic halibut: Effect of starvation and
subsequent feeding on growth, maturation, feed utilization and flesh quality.
Aquaculture, 290, 304-310.
Fu C, Li D, Hu W, Wang Y, Zhu Z (2007) Growth and energy budget of F2 'all-fish'
growth hormone gene transgenic common carp. J. Fish Biol., 70, 347-361.
Furuita H, Tanaka H, Yamamoto T, Shiraishi M, Takeuchi T (2000) Effects of n - 3
HUFA levels in broodstock diet on the reproductive performance and egg and
larval quality of the Japanese flounder, Paralichthys olivaceus. Aquaculture,
187, 387-398.
Furuita H, Tanaka H, Yamamoto T, Suzuki N, Takeuchi T (2002) Effects of high levels
of n-3 HUFA in broodstock diet on egg quality and egg fatty acid composition
of Japanese flounder, Paralichthys olivaceus. Aquaculture, 210, 323-333.
Gahr SA, Vallejo RL, Weber GM, Shepherd BS, Silverstein JT, Rexroad Iii CE (2008)
Effects of short-term growth hormone treatment on liver and muscle
transcriptomes in rainbow trout (Oncorhynchus mykiss). Physiol. Genomics, 32,
380-392.
Galloway TF, Bardal T, Kvam SN, Dahle SW, Nesse G, Randol M, Kjorsvik E,
Andersen O (2006) Somite formation and expression of MyoD, myogenin and
myosin in Atlantic halibut (Hippoglossus hippoglossus L.) embryos incubated at
different temperatures: transient asymmetric expression of MyoD. J. Exp. Biol.,
209, 2432-2441.
Garber AF, Tosh JJ, Fordham SE, Hubert S, Simpson G, Symonds JE, Robinson JAB,
Bowman S, Trippel EA (2010) Survival and growth traits at harvest of
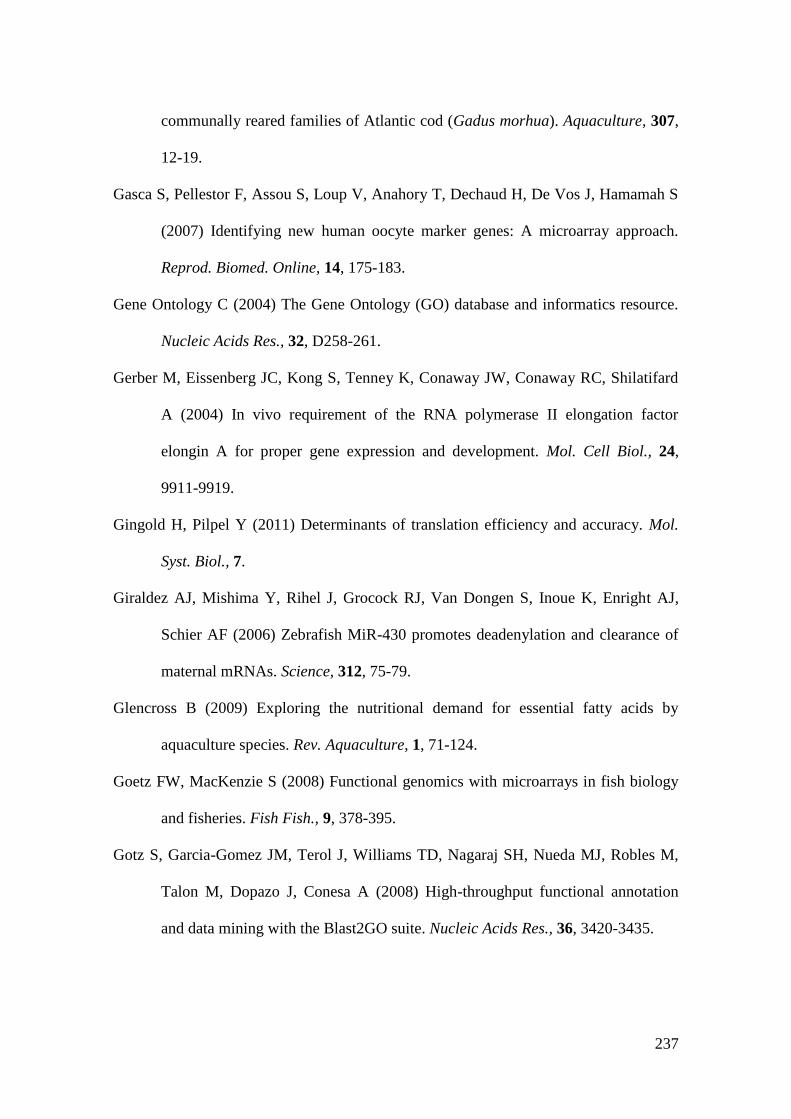
237
communally reared families of Atlantic cod (Gadus morhua). Aquaculture, 307,
12-19.
Gasca S, Pellestor F, Assou S, Loup V, Anahory T, Dechaud H, De Vos J, Hamamah S
(2007) Identifying new human oocyte marker genes: A microarray approach.
Reprod. Biomed. Online, 14, 175-183.
Gene Ontology C (2004) The Gene Ontology (GO) database and informatics resource.
Nucleic Acids Res., 32, D258-261.
Gerber M, Eissenberg JC, Kong S, Tenney K, Conaway JW, Conaway RC, Shilatifard
A (2004) In vivo requirement of the RNA polymerase II elongation factor
elongin A for proper gene expression and development. Mol. Cell Biol., 24,
9911-9919.
Gingold H, Pilpel Y (2011) Determinants of translation efficiency and accuracy. Mol.
Syst. Biol., 7.
Giraldez AJ, Mishima Y, Rihel J, Grocock RJ, Van Dongen S, Inoue K, Enright AJ,
Schier AF (2006) Zebrafish MiR-430 promotes deadenylation and clearance of
maternal mRNAs. Science, 312, 75-79.
Glencross B (2009) Exploring the nutritional demand for essential fatty acids by
aquaculture species. Rev. Aquaculture, 1, 71-124.
Goetz FW, MacKenzie S (2008) Functional genomics with microarrays in fish biology
and fisheries. Fish Fish., 9, 378-395.
Gotz S, Garcia-Gomez JM, Terol J, Williams TD, Nagaraj SH, Nueda MJ, Robles M,
Talon M, Dopazo J, Conesa A (2008) High-throughput functional annotation
and data mining with the Blast2GO suite. Nucleic Acids Res., 36, 3420-3435.
238
Govoroun M, Le Gac F, Guiguen Y (2006) Generation of a large scale repertoire of
Expressed Sequence Tags (ESTs) from normalised rainbow trout cDNA
libraries. BMC Genomics, 7.
Gray JD, Ross ME (2009) Mechanistic insights into folate supplementation from
crooked tail and other NTD-prone mutant mice. Birth Defects Res. A 85, 314-
321.
Haffter P, Granato M, Brand M, Mullins MC, Hammerschmidt M, Kane DA, Odenthal
J, van Eeden FJ, Jiang YJ, Heisenberg CP, Kelsh RN, Furutani-Seiki M,
Vogelsang E, Beuchle D, Schach U, Fabian C, Nusslein-Volhard C (1996) The
identification of genes with unique and essential functions in the development of
the zebrafish, Danio rerio. Development, 123, 1-36.
Hake LE, Richter JD (1997) Translational regulation of maternal mRNA. Biochem.
Biophys. Acta, 1332, M31-38.
Hamel M, Dufort I, Robert C, Léveillé MC, Leader A, Sirard MA (2010) Genomic
assessment of follicular marker genes as pregnancy predictors for human IVF.
Mol. Hum. Reprod., 16, 87-96.
Hamre K, Holen E, Moren M (2007) Pigmentation and eye migration in Atlantic halibut
(Hippoglossus hippoglossus L.) larvae: New findings and hypotheses. Aquacult.
Nutr., 13, 65-80.
Hamre K, Opstad I, Espe M, Solbakken J, Hemre GI, Pittman K (2002) Nutrient
composition and metamorphosis success of Atlantic halibut (Hippoglossus
hippoglossus, L.) larvae fed natural zooplankton or Artemia. Aquacult. Nutr., 8,
139-148.
239
Haouzi D, Hamamah S (2009) Pertinence of apoptosis markers for the improvement of
in vitro fertilization (IVF). Curr. Med. Chem., 16, 1905-1916.
Harboe T, Adoff G (2005) Oppdrett av kveite. In: Kyst og Havbruk 2005 (ed.). Institute
of Marine Reseach, Bergen, Norway.
Harboe T, Mangor-Jensen A, Naas KE, Næss T (1998) A tank design for first feeding of
Atlantic halibut, Hippoglossus hippoglossus L., larvae. Aquacult. Res., 29, 919-
923.
Harel M, Tandler A, Kissil GW, Applebaum SW (1994) The kinetics of nutrient
incorporation into body tissues of gilthead seabream (Sparus aurata) females
and the subsequent effects on egg composition and egg quality. Br. J. Nutr., 72,
45-58.
Hashimoto A, Oka T, Nishikawa T (1995) Anatomical distribution and postnatal
changes in endogenous free D-aspartate and D-serine in rat brain and periphery.
Eur. J. Neurosci., 7, 1657-1663.
Haug T (1990) Biology of the Atlantic halibut, Hippoglossus hippoglossus (L., 1758).
Adv. Mar. Biol., 26, 1-70.
Haug T, Gulliksen B (1988) Fecundity and oocyte sizes in ovaries of female Atlantic
halibut, Hippoglossus hippoglossus (L). Sarsia, 73, 259-261.
Helvik JV, Oppen-Berntsen DO, Walther BT (1991) The hatching mechanism in
Atlantic halibut. Int. J. Dev. Biol., 35, 9-16.
Hendry C, Martin-Robichaud J, Benfey T (2002) Gonadal sex differentiation in Atlantic
halibut. J. Fish. Biol., 60, 1431-1442.
Hildahl J, Galay-Burgos M, Sweeney G, Einarsdóttir IE, Björnsson BT (2007a)
Identification of two isoforms of Atlantic halibut insulin-like growth factor-I
240
receptor genes and quantitative gene expression during metamorphosis. Comp.
Biochem. Physiol. B 147, 395-401.
Hildahl J, Sweeney G, Galay-Burgos M, Einarsdottir IE, Bjornsson BT (2007b) Cloning
of Atlantic halibut growth hormone receptor genes and quantitative gene
expression during metamorphosis. Gen. Comp. Endocr., 151, 143-152.
Hiramatsu N, Ichikawa N, Fukada H, Fujita T, Sullivan CV, Hara A (2002)
Identification and characterization of proteases involved in specific proteolysis
of vitellogenin and yolk proteins in salmonids. J. Exp. Zool., 292, 11-25.
Hiraoka D, Hori-Oshima S, Fukuhara T, Tachibana K, Okumura E, Kishimoto T (2004)
PDK1 is required for the hormonal signaling pathway leading to meiotic
resumption in starfish oocytes. Dev. Biol., 276, 330-336.
Holland JW, Bird S, Williamson B, Woudstra C, Mustafa A, Wang T, Zou J, Blaney
SC, Collet B, Secombes CJ (2008) Molecular characterization of IRF3 and IRF7
in rainbow trout, Oncorhynchus mykiss: Functional analysis and transcriptional
modulation. Mol. Immunol., 46, 269-285.
Howley C, Ho RK (2000) mRNA localization patterns in zebrafish oocytes. Mech.
Develop., 92, 305-309.
Hutten S, Kehlenbach RH (2007) CRM1-mediated nuclear export: to the pore and
beyond. Trends. Cell Biol., 17, 193-201.
Imsland AK, Roth B, Foss A, Vikingstad E, Stefansson SO, Pedersen S, Sandvik T,
Norberg B (2009) Long-term effect of photoperiod manipulation on growth,
maturation and flesh quality in Atlantic halibut. Aquacult. Res., 40, 1260-1269.
Infante C, Asensio E, Cañavate J, Manchado M (2008) Molecular characterization and
expression analysis of five different elongation factor 1 alpha genes in the
241
flatfish Senegalese sole (Solea senegalensis Kaup): Differential gene expression
and thyroid hormones dependence during metamorphosis. BMC Mol. Biol., 9.
Ingerslev HC, Pettersen EF, Jakobsen RA, Petersen CB, Wergeland HI (2006)
Expression profiling and validation of reference gene candidates in immune
relevant tissues and cells from Atlantic salmon (Salmo salar L.). Mol. Immunol.,
43, 1194-1201.
Izquierdo MS, Fernandez-Palacios H, Tacon AGJ (2001) Effect of broodstock nutrition
on reproductive performance of fish. Aquaculture, 197, 25-42.
Jackson TR, Martin-Robichaud DJ, Reith ME (2003) Application of DNA markers to
the management of Atlantic halibut (Hippoglossus hippoglossus) broodstock.
Aquaculture, 220, 245-259.
Jalabert B (2005) Particularities of reproduction and oogenesis in teleost fish compared
to mammals. Reprod. Nutr. Dev., 45, 261-279.
Jesuthasan S (1998) Furrow-associated microtubule arrays are required for the cohesion
of zebrafish blastomeres following cytokinesis. J. Cell Sci., 111, 3695-3703.
Jordal AEO, Torstensen BE, Tsoi S, Tocher DR, Lall SP, Douglas SE (2005) Dietary
rapeseed oil affects the expression of genes involved in hepatic lipid metabolism
in Atlantic salmon (Salmo salar L.). J. Nutr., 135, 2355-2361.
Ju Z, Wells MC, Martinez A, Hazlewood L, Walter RB (2005) An in silico mining for
simple sequence repeats from expressed sequence tags of zebrafish, medaka,
Fundulus, and Xiphophorus. in Silico Biol., 5, 439-463.
Jump DB (2004) Fatty Acid Regulation of Gene Transcription. Crit. Rev. Clin. Lab.
Sci., 41, 41-78.
242
Kamler E (2008) Resource allocation in yolk-feeding fish. Rev. Fish. Biol. Fisher., 18,
143-200.
Kane D, Kimmel C (1993) The zebrafish midblastula transition. Development, 119,
447-456.
Kanehisa M, Araki M, Goto S, Hattori M, Hirakawa M, Itoh M, Katayama T,
Kawashima S, Okuda S, Tokimatsu T, Yamanishi Y (2008) KEGG for linking
genomes to life and the environment. Nucleic Acids Res., 36, D480-484.
Kappas NC, Savage P, Chen KC, Walls AT, Sible JC (2000) Dissection of the XChk1
signaling pathway in Xenopus laevis embryos. Mol. Biol. Cell, 11, 3101-3108.
Kas K, Michiels L, Merregaert J (1992) Genomic structure and expression of the human
fau gene: Encoding the ribosomal protein S30 fused to a ubiquitin-like protein.
Biochem. Bioph. Res. Co., 187, 927-933.
Kelly C, Chin AJ, Leatherman JL, Kozlowski DJ, Weinberg ES (2000) Maternally
controlled β-catenin-mediated signaling is required for organizer formation in
the zebrafish. Development, 127, 3899-3911.
Kemphues KJ, Kusch M, Wolf N (1988) Maternal-effect lethal mutations on linkage
group II of Caenorhabditis elegans. Genetics, 120, 977-986.
Kim KC, Friso S, Choi S-W (2009) DNA methylation, an epigenetic mechanism
connecting folate to healthy embryonic development and aging. J. Nutr.
Biochem., 20, 917-926.
Kimmel C (1989) Genetics in early development of zebrafish. Trends. Genet., 5, 283-
288.
243
Kjorsvik E, Haug T, Tjemsland J (1987) Spawning season of the Atlantic halibut
(Hippoglossus hippoglossus L.) in the northern Norway. Rapp. P.-v. Réun. Cons.
int. Explor. Mer, 43, 285-293.
Kjorsvik E, Hoehne-Reitan K, Reitan KI (2003) Egg and larval quality criteria as
predictive measures for juvenile production in turbot (Scophthalmus maximus
L.). Aquaculture, 227, 9-20.
Kjorsvik E, Mangorjensen A, Holmefjord I (1990) Egg quality in fishes. Adv. Mar.
Biol., 26, 71-113.
Kobayashi D, Takeda H (2008) Medaka genome project. Brief Funct. Genom. Proteom.,
7, 415-426.
Komen H, Thorgaard GH (2007) Androgenesis, gynogenesis and the production of
clones in fishes: A review. Aquaculture, 269, 150-173.
Koppel J, Rehák P, Baran V, Veselá J, Hlinka D, Manceau V, Sobel A (1999) Cellular
and subcellular localization of stathmin during oocyte and preimplantation
embryo development. Mol. Reprod. Dev., 53, 306-317.
Kosubek A, Klein-Hitpass L, Rademacher K, Horsthemke B, Ryffel GU (2010) Aging
of Xenopus tropicalis eggs leads to deadenylation of a specific set of maternal
mRNAs and loss of developmental potential. PLoS One, 5, e13532.
Kroll K (2007) Geminin in embryonic development: Coordinating transcription and the
cell cycle during differentiation. Front. Bioscie., 12, 1395-1409.
Kvenseth AM, Pittman K, Helvik JV (1996) Eye development in Atlantic halibut
(Hippoglossus hippoglossus): Differentation and development of the retina from
early yolk sac stages through metamorphosis. Can. J. Fish. Aquat. Sci., 53,
2524-2532.
244
Laanpere M, Altmäe S, Stavreus-Evers A, Nilsson TK, Yngve A, Salumets A (2010)
Folate-mediated one-carbon metabolism and its effect on female fertility and
pregnancy viability. Nutr. Rev., 68, 99-113.
Lahnsteiner F (2000) Morphological, physiological and biochemical parameters
characterizing the over-ripening of rainbow trout eggs. Fish. Physiol. Biochem.,
23, 107-118.
Lahnsteiner F, Giménez G, Alicia E (2008) Egg quality determination based on the
shape of the lipid vesicle in common dentex, Dentex dentex. Aquacult. Res., 39,
144-149.
Lahnsteiner F, Patarnello P (2005) The shape of the lipid vesicle is a potential marker
for egg quality determination in the gilthead seabream, Sparus aurata, and in the
sharpsnout seabream, Diplodus puntazzo. Aquaculture, 246, 423-435.
Lawlor MA, Mora A, Ashby PR, Williams MR, Murray-Tait V, Malone L, Prescott AR,
Lucocq JM, Alessi DR (2002) Essential role of PDK1 in regulating cell size and
development in mice. EMBO J., 21, 3728-3738.
Leaver MJ, Villeneuve LAN, Obach A, Jensen L, Bron JE, Tocher DR, Taggart JB
(2008) Functional genomics reveals increases in cholesterol biosynthetic genes
and highly unsaturated fatty acid biosynthesis after dietary substitution of fish
oil with vegetable oils in Atlantic salmon (Salmo salar). BMC Genomics, 9.
Lee KB, Bettegowda A, Wee G, Ireland JJ, Smith GW (2009) Molecular determinants
of oocyte competence: Potential functional role for maternal (oocyte-derived)
follistatin in promoting bovine early embryogenesis. Endocrinology, 150, 2463-
2471.
245
Lein I, Holmefjord I (1992) Age at first feeding of Atlantic halibut larvae. Aquaculture,
105, 157-164.
Lein I, Holmefjord I, Rye M (1997a) Effects of temperature on yolk sac larvae of
Atlantic halibut (Hippoglossus hippoglossus L.). Aquaculture, 157, 123-135.
Lein I, Tveite S, Gjerde B, Holmefjord I (1997b) Effects of salinity on yolk sac larvae
of Atlantic halibut (Hippoglossus hippoglossus L.). Aquaculture, 156, 291-303.
Leoni G, Bebbere, Succu S, Berlinguer F, Mossa F, Galioto M, Bogliolo L, Ledda S,
Naitana S (2007) Relations between relative mRNA abundance and
developmental competence of ovine oocytes. Mol. Reprod. Dev., 74, 249-257.
Lewis-McCrea LM, Lall SP (2007) Effects of moderately oxidized dietary lipid and the
role of vitamin E on the development of skeletal abnormalities in juvenile
Atlantic halibut (Hippoglossus hippoglossus). Aquaculture, 262, 142-155.
Lewis LM, Lall SP (2006) Development of the axial skeleton and skeletal abnormalities
of Atlantic halibut (Hippoglossus hippoglossus) from first feeding through
metamorphosis. Aquaculture, 257, 124-135.
Lewis LM, Lall SP, Witten PE (2004) Morphological descriptions of the early stages of
spine and vertebral development in hatchery-reared larval and juvenile Atlantic
halibut (Hippoglossus hippoglossus). Aquaculture, 241, 47-59.
Li C, Yu Y, Sun Y, Li S, Zhong Q, Wang X, Wangz Z, Qiz J, Zhang Q (2010) Isolation,
polymorphism and expression study of two distinct major histocompatibility
complex class II B genes from half-smooth tongue sole (Cynoglossus
semilaevis). Int. J. Immunogenet., 37, 185-197.
Liu Y, Jiang B, Zhang X (2009) Gene-set analysis identifies master transcription factors
in developmental courses. Genomics, 94, 1-10.
246
Lubzens E, Young G, Bobe J, Cerda J (2009) Oogenesis in teleosts: How fish eggs are
formed. Gen. Comp. Endocr., 16, 367-389.
Luckenbach JA, Iliev DB, Goetz FW, Swanson P (2008) Identification of differentially
expressed ovarian genes during primary and early secondary oocyte growth in
coho salmon, Oncorhynchus kisutch. Reprod. Biol. Endocrin., 6.
Lukyanov S, Rebrikov D, Buzdin A (2007) Suppression Subtractive Hybridization
Nucleic Acids Hybridization Modern Applications. (ed. by Buzdin A, Lukyanov
S). Springer Netherlands, pp. 53-84.
Lønning S, Kjorsvik E, Haug T, Gulliksen B (1982) The early development of the
halibut, Hippoglossus hippoglossus (L), compared with other marine teleosts.
Sarsia, 67, 85-91.
Maclean N, Rahman MA, Sohm F, Hwang G, Iyengar A, Ayad H, Smith A, Farahmand
H (2002) Transgenic tilapia and the tilapia genome. Gene, 295, 265-277.
Maeda Y, Suzuki T, Pan X, Chen G, Pan S, Bartman T, Whitsett JA (2008) CUL2 is
required for the activity of hypoxia-inducible factor and vasculogenesis. J. Biol.
Chem., 283, 16084-16092.
Maestripieri D, Mateo J (2009) The role of maternal effects in mammalian evolution
and adaptation. In: Maternal Effects in Mammals (ed by J.M.Mateo DMa).
University of Chicago Press, Chicago, IL, USA, pp. 354.
Mair GC, Abucay US, Skibinski DOF, Abella TA, Beardmore JA (1997) Genetic
manipulation of sex ratio for the large-scale production of all-male tilapia,
Oreochromis niloticus. Can. J. Fish. Aquat. Sci., 54, 396-404.
247
Malecová B, Morris KV (2010) Transcriptional gene silencing throug epigenetic
changes mediated by non-coding RNAs. Curr. Opin. Mol. Ther., 12, 214-222.
Malmer M, Schroeder L (1990) Amino acid analysis by high-performance liquid
chromatography with methanesulfonic acid hydrolysis and 9-
fluorenylmethylchloroformate derivatization. J. Chromatogr. A, 227-239.
Mangor-Jensen A, Harboe T, Henna JS, Troland R (1998) Design and operation of
Atlantic halibut, Hippoglossus hippoglossus L., egg incubators. Aquacult. Res.,
29, 887-892.
Mangor-Jensen A, Waiwood KG (1995) The effect of light exposure on buoyancy of
halibut eggs. J. Fish. Biol., 47, 18-25.
Maniatis T (1999) A ubiquitin ligase complex essential for the NF-kappaB,
Wnt/Wingless, and Hedgehog signaling pathways. Genes Dev., 13, 505-510.
Mansour N, Lahnsteiner F, McNiven MA, Richardson GF (2008) Morphological
characterization of Arctic char, Salvelinus alpinus, eggs subjected to rapid post-
ovulatory aging at 7 °C. Aquaculture, 279, 204-208.
Mansour N, Lahnsteiner F, Patzner RA (2007) Distribution of lipid droplets is an
indicator for egg quality in brown trout, Salmo trutta fario. Aquaculture, 273,
744-747.
Marlow FL, Mullins MC (2008) Bucky ball functions in Balbiani body assembly and
animal-vegetal polarity in the oocyte and follicle cell layer in zebrafish. Dev.
Biol., 321, 40-50.
Martin SAM, Collet B, MacKenzie S, Evensen O, Secombes CJ (2008) Genomic tools
for examining immune gene function in salmonid fish. Res. Fish. Sci., 16, 110-
116.
248
Mathavan S, Lee SG, Mak A, Miller LD, Murthy KR, Govindarajan KR, Tong Y, Wu
YL, Lam SH, Yang H, Ruan Y, Korzh V, Gong Z, Liu ET, Lufkin T (2005)
Transcriptome analysis of zebrafish embryogenesis using microarrays. PLoS
Genet., 1, 260-276.
Matsuyama T, Fujiwara A, Nakayasu C, Kamaishi T, Oseko N, Tsutsumi N, Hirono I,
Aoki T (2007) Microarray analyses of gene expression in Japanese flounder
Paralichthys olivaceus leucocytes during monogenean parasite
Neoheterobothrium hirame infection. Dis. Aquat. Organ., 75, 79-83.
Mazorra C, Bruce M, Bell J, Davie A, Alorend E, Jordan N, Rees J, Papanikos N, Porter
M, Bromage N (2003) Dietary lipid enhancement of broodstock reproductive
performance and egg and larval quality in Atlantic halibut (Hippoglossus
hippoglossus). Aquaculture, 227, 21-33.
McCurley AT, Callard GV (2008) Characterization of housekeeping genes in zebrafish:
Male-female differences and effects of tissue type, developmental stage and
chemical treatment. BMC Mol. Biol., 9.
McEvoy L (1984) Ovulatory rhythms and over-ripening of eggs in cultivated turbot,
Scophthalmus maximus L. J. Fish Biol., 24, 437-448.
McGowan C, Keith ME (1999) Polymorphic microsatellite markers for Atlantic halibut,
Hippoglossus hippoglossus. Mol. Ecol., 8, 1761-1763.
Metcalfe LD, Schmitz AA, RJ P (1966) Rapid preparation of fatty acid esters from
lipids for gas chromatographic analysis. Anal. Chem., 28, 5104-5105.
Migaud H, Davie A, Taylor JF (2010) Current knowledge on the photoneuroendocrine
regulation of reproduction in temperate fish species. J. Fish Biol., 76, 27-68.
249
Millán A, Gómez-Tato A, Fernández C, Pardo BG, Álvarez-Dios JA, Calaza M, Bouza
C, Vázquez M, Cabaleiro S, Martínez P (2010) Design and performance of a
turbot (Scophthalmus maximus) oligo-microarray based on ESTs from immune
tissues. Mar. Biotechnol., 12, 452-465.
Miller KM, Maclean N (2008) Teleost microarrays: Development in a broad
phylogenetic range reflecting diverse applications. J. Fish Biol., 72, 2039-2050.
Mitter K, Kotoulas G, Magoulas A, Mulero V, Sepulcre P, Figueras A, Novoa B,
Sarropoulou E (2009) Evaluation of candidate reference genes for qPCR during
ontogenesis and of immune-relevant tissues of European seabass (Dicentrarchus
labrax). Comp. Biochem. Physiol. B 153, 340-347.
Mockler TC, Ecker JR (2005) Applications of DNA tiling arrays for whole-genome
analysis. Genomics, 85, 1-15.
Moen T, Baranski M, Sonesson AK, Kjøglum S (2009) Confirmation and fine-mapping
of a major QTL for resistance to infectious pancreatic necrosis in Atlantic
salmon (Salmo salar): Population-level associations between markers and trait.
BMC Genomics, 10.
Mora A, Komander D, Van Aalten DMF, Alessi DR (2004) PDK1, the master regulator
of AGC kinase signal transduction. Semin. Cell Dev. Biol., 15, 161-170.
Morrison CM, Macdonald CA (1995) Normal and abnormal jaw development of the
yolk-sac larva of Atlantic halibut Hippoglossus hippoglossus. Dis. Aquat.
Organ., 22, 173-184.
Moulana M, Evenhuis J, Albertino M, Godwin U, Kountikov EI, Stuge TB, Wilson M,
Bengtén E, Miller NW, McConnell TJ (2008) Characterization of anti-channel
250
catfish MHC class IIβ monoclonal antibodies. Vet. Immunol. Immunop., 126,
120-130.
Mourot M, Dufort I, Gravel C, Algriany O, Dieleman S, Sirard MA (2006) The
influence of follicle size, FSH-enriched maturation medium, and early cleavage
on bovine oocyte maternal mRNA levels. Mol. Reprod. Dev., 73, 1367-1379.
Murai S, Stein P, Buffone MG, Yamashita S, Schultz RM (2010) Recruitment of Orc6l,
a dormant maternal mRNA in mouse oocytes, is essential for DNA replication in
1-cell embryos. Dev. Biol., 341, 205-212.
Murray HM, Lall SL, Rajaselvam R, Boutilier LA, Flight R, Blanchard B, Colombo S,
Mohindra V, Yúfera M, Douglas S (2009) Effect of early introduction of
microencapsulated diet to larval Atlantic halibut, Hippoglossus hippoglossus L.
assessed by microarray analysis. Mar. Biotechnol., 12, 214-219.
Murray HM, Lall SP, Rajaselvam R, Boutilier LA, Blanchard B, Flight RM, Colombo
S, Mohindra V, Douglas SE (2010) A nutrigenomic analysis of intestinal
response to partial soybean meal replacement in diets for juvenile Atlantic
halibut, Hippoglossus hippoglossus, L. Aquaculture, 298, 282-293.
Müller-Belecke A, Hörstgen-Schwark G (2007) A YY-male Oreochromis niloticus
strain developed from an exceptional mitotic gynogenetic male and growth
performance testing of genetically all-male progenies. Aquacult. Res., 38, 773-
775.
Mæland A, Ronnestad I, Waagbo R (2003) Folate in eggs and developing larvae of
Atlantic halibut, Hippoglossus hippoglossus L. Aquacult Nutr, 9, 185-188.
251
Nagler J (2000) In vivo treatment with cycloheximide or actinomycin D inhibits early
embryonic development in rainbow trout (Oncorhynchus mykiss) Fish. Physiol.
Biochem., 22, 61-66.
Nakayama K, Kitamura SI, Murakami Y, Song JY, Jung SJ, Oh MJ, Iwata H, Tanabe S
(2008) Toxicogenomic analysis of immune system-related genes in Japanese
flounder (Paralichthys olivaceus) exposed to heavy oil. Mar. Pollut. Bull., 57,
445-452.
Neidle A, Dunlop DS (1990) Developmental changes in free D-aspartic acid in the
chicken embryo and in the neonatal rat. Life Sci., 46, 1517-1522.
Nelson J (2006) Fishes of the world. John Wiley & Sons, New York, pp. 624.
Nielsen HM, Ødegård J, Olesen I, Gjerde B, Ardo L, Jeney G, Jeney Z (2010) Genetic
analysis of common carp (Cyprinus carpio) strains. I: Genetic parameters and
heterosis for growth traits and survival. Aquaculture, 304, 14-21.
Ning S, Pagano JS, Barber GN (2011) IRF7: Activation, regulation, modification and
function. Genes Immun.12, 399-414
Norberg B, Valkner V, Huse J, Karlsen I, Grung GL (1991) Ovulatory rhythms and egg
viability in the Atlantic halibut (Hippoglossus hippoglossus). Aquaculture, 97,
365-371.
Næss T, Hamre K, Holm JC (2001) Successful early weaning of Atlantic halibut
(Hippoglossus hippoglossus L.) in small shallow raceway systems. Aquacult.
Res., 32, 163-168.
Næss T, Harboe T, Mangor-Jensen A, Naas KE, Norberg B (1996) Successful first
feeding of Atlantic halibut larvae from photoperiod-manipulated broodstock.
Prog. Fish-Cult., 58, 212-214.
252
O'Boyle S, Bree RT, McLoughlin S, Grealy M, Byrnes L (2007) Identification of
zygotic genes expressed at the midblastula transition in zebrafish. Biochem.
Bioph. Res. Co., 358, 462-468.
Ogushi S, Palmieri C, Fulka H, Saitou M, Miyano T, Fulka Jr J (2008) The maternal
nucleolus is essential for early embryonic development in mammals. Science,
319, 613-616.
Ohtsuka M, Makino S, Yoda K, Wada H, Naruse K, Mitani H, Shima A, Ozato K,
Kimura M, Inoko H (1999) Construction of a linkage map of the medaka
(Oryzias latipes) and mapping of the Da mutant locus defective in dorsoventral
patterning. Genome Res., 9, 1277-1287.
Olsen Y, Evjemo J, Olsen A (1999) Status of the cultivation technology for production
of Atlantic halibut (Hippoglossus hippoglossus) juveniles in Norway/Europe.
Aquaculture, 176, 3-13.
Olsvik PA, Kristensen T, Waagbo R, Rosseland BO, Tollefsen KE, Baeverfjord G,
Berntssen MH (2005) mRNA expression of antioxidant enzymes (SOD, CAT
and GSH-Px) and lipid peroxidative stress in liver of Atlantic salmon (Salmo
salar) exposed to hyperoxic water during smoltification. Comp. Biochem.
Physiol. C 141, 314-323.
Park KC, Osborne JA, Montes A, Dios S, Nerland AH, Novoa B, Figueras A, Brown
LL, Johnson SC (2009) Immunological responses of turbot (Psetta maxima) to
nodavirus infection or polyriboinosinic polyribocytidylic acid (pIC) stimulation,
using expressed sequence tags (ESTs) analysis and cDNA microarrays. Fish
Shellfish Immun., 26, 91-108.
253
Park KC, Osborne JA, Tsoi SCM, Brown LL, Johnson SC (2005) Expressed sequence
tags analysis of Atlantic halibut (Hippoglossus hippoglossus) liver, kidney and
spleen tissues following vaccination against Vibrio anguillarum and Aeromonas
salmonicida. Fish Shellfish Immun., 18, 393-415.
Parkinson J, Anthony A, Wasmuth J, Schmid R, Hedley A, Blaxter M (2004)
PartiGene-constructing partial genomes. Bioinformatics, 20, 1398-1404.
Parrish C, Brown J, Daniel E, Somerton D (1993) Lipid compostion of Atlantic halibut
(Hippoglossus hippoglossus) eggs over the spawning season. In: Proceedings
10th Annual Meeting. Bull. Aquacult. Assoc. Can., Charlottetown, PEI, pp. 35-
37.
Parrish C, Castell J, Brown J, Boston L, Strickland J, Somerton D (1994) Fatty acid
composition of Atlantic halibut eggs in relation to fertilization. Bull. Aquacult.
Assoc. Can., 94, 36-38.
Patel OV, Bettegowda A, Ireland JJ, Coussens PM, Lonergan P, Smith GW (2007)
Functional genomics studies of oocyte competence: Evidence that reduced
trascript abundance for follistatin is associated with poor developmental
competence of bovine oocytes. Reproduction, 133, 95-106.
Patel S, Malde K, Lanzén A, Olsen RH, Nerland AH (2009a) Identification of immune
related genes in Atlantic halibut (Hippoglossus hippoglossus L.) following in
vivo antigenic and in vitro mitogenic stimulation. Fish Shellfish Immun., 27,
729-738.
Patel S, Sørhus E, Fiksdal IU, Espedal PG, Bergh Ø, Rødseth OM, Morton HC, Nerland
AH (2009b) Ontogeny of lymphoid organs and development of IgM-bearing
254
cells in Atlantic halibut (Hippoglossus hippoglossus L.). Fish Shellfish Immun.,
26, 385-395.
Pelegri F (2003) Maternal factors in zebrafish development. Dev Dynam, 228, 535-554.
Pelegri F, Knaut H, Maischein H-M, Schulte-Merker S, Nusslein-Volhard C (1999) A
mutation in the zebrafish maternal-effect gene nebel affects furrow formation
and vasa RNA localization. Curr. Biol., 9, 1431-1440.
Penney RW, Lush PL, Wade J, Brown JA, Parrish CC, Burton MPM (2006)
Comparative utility of egg blastomere morphology and lipid biochemistry for
prediction of hatching success in Atlantic cod, Gadus morhua L. Aquacult. Res.,
37, 272-283.
Pfaffl M, Hageleit M (2001) Validities of mRNA quantification using recombinant
RNA and recombinant DNA external calibration curves in real-time RT-PCR.
Biotechol. Lett., 23, 275-282.
Pfaffl MW (2001 ) A new mathematical model for relative quantification in real time
RT-PCR. Nucleic Acids Res., 29.
Pfaffl MW, Tichopad A, Prgomet C, Neuvians TP (2004) Determination of stable
housekeeping genes, differentially regulated target genes and sample integrity:
BestKeeper-Excel-based tool using pair-wise correlations. Biotechnol. Lett., 26,
509-515.
Pickova J, Dutta PC, Larsson PO, Kiessling A (1997) Early embryonic cleavage pattern,
hatching success, and egg-lipid fatty acid composition: Comparison between
two cod (Gadus morhua) stocks. Can. J. Fish. Aquat. Sci., 54, 2410-2416.
Piferrer F, Cal RM, Gómez C, Álvarez-Blázquez B, Castro J, Martínez P (2004)
Induction of gynogenesis in the turbot (Scophthalmus maximus): Effects of UV
255
irradiation on sperm motility, the Hertwig effect and viability during the first 6
months of age. Aquaculture, 238, 403-419.
Pittman K, Bergh O, Opstad I, Skiftesvik AB, Skjolddal L, Strand H (1990a)
Development of eggs and yolk-sac larvae of halibut (Hippoglossus-
Hippoglossus L). J. App. Ichthyol., 6, 142-160.
Pittman K, Skiftesvik AB, Berg L (1990b) Morphological and behavioral development
of halibut, Hippoglossus hippoglossus (L) larvae. J. Fish Biol., 37, 455-472.
Pittman K, Skiftesvik AB, Harboe T (1989) Effect of temperature on growth rates and
organogenesis in the larvae of halibut (Hippoglossus hippoglossus L.). Rapp. P.-
v. Réun. Cons. int. Explor. Mer, 191, 421-430.
Powell M, Manandhar G, Spate L, Sutovsky M, Zimmerman S, Sachdev S, Hannik M,
Prather R, Sutovsky P (2010) Discovery of putative oocyte quality markers by
comparative ExacTag proteomics. Proteomics Clin Appl, 4, 337-351.
Radonic A, Thulke S, Mackay IM, Landt O, Siegert W, Nitsche A (2004) Guideline to
reference gene selection for quantitative real-time PCR. Biochem. Bioph. Res.
Co., 313, 856-862.
Raha D, Wang Z, Moqtaderi Z, Wu L, Zhong G, Gerstein M, Struhl K, Snyder M
(2010) Close association of RNA polymerase II and many transcription factors
with Pol III genes. Proc. Natl. Acas. Sci. USA, 107, 3639-3644.
Raz E (2002) Primordial germ cell development in zebrafish. Semin. Cell. Dev. Biol.,
13, 489-495.
Reid DP, Pongsomboon S, Jackson T, McGowan C, Murphy C, Martin-Robichaud D,
Reith M (2005) Microsatellite analysis indicates an absence of population
256
structure among Hippoglossus hippoglossus in the north-west Atlantic. J. Fish
Biol., 67, 570-576.
Reid DP, Smith C-A, Rommens M, Blanchard B, Martin-Robichaud D, Reith M (2007)
A genetic linkage map of Atlantic halibut (Hippoglossus hippoglossus L.).
Genetics, 177, 1193-1205.
Rescan PY (2001) Regulation and functions of myogenic regulatory factors in lower
vertebrates. Comp. Biochem. Phys. B, 130, 1-12.
Rexroad CE, 3rd, Lee Y, Keele JW, Karamycheva S, Brown G, Koop B, Gahr SA, Palti
Y, Quackenbush J (2003) Sequence analysis of a rainbow trout cDNA library
and creation of a gene index. Cytogenet. Genome Res., 102, 347-354.
Richards JS (1994) Hormonal control of gene expression in the ovary. Endocr. Rev., 15,
725-751.
Rideout RM, Trippel EA, Litvak MK (2004) Predicting haddock embryo viability based
on early cleavage patterns. Aquaculture, 230, 215-228.
Roberts A, Trapnell C, Donaghey J, Rinn J, Pachter L (2011) Improving RNA-Seq
expression estimates by correcting for fragment bias. Genome Biol., 12, R22.
Robinson N, Hayes B (2008) Modelling the use of gene expression profiles with
selective breeding for improved disease resistance in Atlantic salmon (Salmo
salar). Aquaculture, 285, 38-46.
Robinson TL, Sutherland IA, Sutherland J (2007) Validation of candidate bovine
reference genes for use with real-time PCR. Vet. Immunol. Immunop., 115, 160-
165.
Roest HP, Baarends WM, de Wit J, van Klaveren JW, Wassenaar E, Hoogerbrugge JW,
van Cappellen WA, Hoeijmakers JHJ, Grootegoed JA (2004) The ubiquitin-
257
conjugating DNA repair enzyme HR6A is a maternal factor essential for early
embryonic development in mice. Mol. Cell. Biol., 24, 5485-5495.
Rollefsen G (1934) The eggs and larvae of the halibut (Hippoglossus vulgaris). DKNVS,
7, 20-23.
Rosenlund G, Stoss J, Talbot C (1997) Co-feeding marine fish larvae with inert and live
diets. Aquaculture, 155, 183-191.
Roy A, Matzuk MM (2006) Deconstructing mammalian reproduction: Using knockouts
to define fertility pathways. Reproduction, 131, 207-219.
Ruan W, Lai M (2007) Actin, a reliable marker of internal control? Clinica. Chim.
Acta., 385, 1-5.
Rubin D, Laposata M (1991) Regulation of agonist-induced prostaglandin E1 versus
prostaglandin E2 production: A mass analysis. J. Biol. Chem., 266, 23618-
23623.
Salem NJ, Litman B, Kim HY, Gawrisch K (2001) Mechanisms of action of
docosahexaenoic acid in the nervous system. Lipids, 36, 945-959.
Salze G, Tocher DR, Roy WJ, Robertson DA (2005) Egg quality determinants in cod
(Gadus morhua L.): Egg performance and lipids in eggs from farmed and wild
broodstock. Aquacult. Res., 36, 1488-1499.
Sargent J, McEvoy L, Estevez A, Bell G, Bell M, Henderson J, Tocher D (1999) Lipid
nutrition of marine fish during early development: current status and future
directions. Aquaculture, 179, 217-229.
Sargent J, Tocher D, Bell J (2002) The Lipids. In: Fish Nutrition (ed by Halver JE).
Academic Press, San Diego, pp. 181-257.
258
Schier AF (2007) The maternal-zygotic transition: Death and birth of RNAs. Science,
316, 406-407.
Schlegel T, Mirus O, von Haeseler A, Schleiff E (2007) The tetratricopeptide repeats of
receptors involved in protein translocation across membranes. Mol. Biol. Evol.,
24, 2763-2774.
Schmitz G, Ecker J (2008) The opposing effects of n-3 and n-6 fatty acids. Prog. Lipid
Res., 47, 147-155.
Schulz R, Proudhon C, Bestor TH, Woodfine K, Lin C-S, Lin S-P, Prissette M, Oakey
RJ, Bourc'his D (2010) The parental non-equivalence of imprinting control
regions during mammalian development and evolution. PLoS Genet., 6,
e1001214.
Seear PJ, Carmichael SN, Talbot R, Taggart JB, Bron JE, Sweeney GE (2009)
Differential gene expression during smoltification of Atlantic salmon (Salmo
salar L.): A first large-scale microarray study. Mar. Biotechnol., 1-15.
Seugnet L, Simpson P, Haenlin M (1997) Requirement for dynamin during notch
signaling in Drosophila neurogenesis. Dev. Biol., 192, 585-598.
Seydoux G (1996) Mechanisms of translational control in early development. Curr.
Opin. Genet. Dev., 6, 555-561.
Shields RJ, Brown NP, Bromage NR (1997) Blastomere morphology as a predictive
measure of fish egg viability. Aquaculture, 155, 1-12.
Siegel V, Jongens TA, Jan LY, Jan YN (1993) Pipsqueak, an early acting member of
the posterior group of genes, affects vasa level and germ cell-somatic cell
interaction in the developing egg chamber. Development, 119, 1187-1202.
259
Sink TD, Lochmann RT (2008) Effects of dietary lipid source and concentration on
channel catfish (Ictalurus punctatus) egg biochemical composition, egg and fry
production, and egg and fry quality. Aquaculture, 283, 68-76.
Skern R, Frost P, Nilsen F (2005) Relative transcript quantification by quantitative
PCR: Roughly right or precisely wrong? BMC Mol. Biol., 6, 10.
Skjærven KH, Olsvik PA, Finn RN, Holen E, Hamre K (2011) Ontogenetic expression
of maternal and zygotic genes in Atlantic cod embryos under ambient and
thermally stressed conditions. Comp. Biochem. Physiol. A, 159, 196-205.
Smith EM, Gregory TR (2009) Patterns of genome size diversity in the ray-finned
fishes. Hydrobiologia, 625, 1-25.
Smith JM, Bowles J, Wilson M, Teasdale RD, Koopman P (2004) Expression of the
tudor-related gene Tdrd5 during development of the male germline in mice.
Gene Expr. Patterns., 4, 701-705.
Smith THL, Stedronsky K, Morgan B, McGowan RA (2006) Identification and
isolation of a BTB-POZ-containing gene expressed in oocytes and early
embryos of the zebrafish Danio rerio. Genome, 49, 808-814.
Smyth GK (2004) Linear models and empirical bayes methods for assessing differential
expression in microarray experiments. Stat. Appl. Genet. Mol. Biol., 3, Art. no.
3.
Solanas M, Moral R, Escrich E (2001) Unsuitability of using ribosomal RNA as loading
control for Northern blot analyses related to the imbalance between messenger
and ribosomal RNA content in rat mammary tumors. Anal. Biochem., 288, 99-
102.
260
Solnica-Krezel L, Driever W (1994) Microtubule arrays of the zebrafish yolk cell:
Organization and function during epiboly. Development, 120, 2443-2455.
Speirs CK, Jernigan KK, Kim SH, Cha YI, Lin F, Sepich DS, DuBois RN, Lee E,
Solnica-Krezel L (2010) Prostaglandin Gβγ signaling stimulates gastrulation
movements by limiting cell adhesion through Snai1a stabilization. Development,
137, 1327-1337.
St.Johnston D, Nüsslein-Volhard C (1992) The origin of pattern and polarity in the
Drosophila embryo. Cell, 68, 201-219.
Stainier DY, Fouquet B, Chen JN, Warren KS, Weinstein BM, Meiler SE, Mohideen
MA, Neuhauss SC, Solnica-Krezel L, Schier AF, Zwartkruis F, Stemple DL,
Malicki J, Driever W, Fishman MC (1996) Mutations affecting the formation
and function of the cardiovascular system in the zebrafish embryo. Development,
123, 285-292.
Stark KD, Lim SY, Salem Jr N (2007) Artificial rearing with docosahexaenoic acid and
n-6 docosapentaenoic acid alters rat tissue fatty acid composition. J. Lipid Res.,
48, 2471-2477.
Strehlow D, Heinrich G, Gilbert W (1994) The fates of the blastomeres of the 16-cell
zebrafish embryo. Development, 120, 1791-1798.
Stroband HWJ, Krounie G, Gestel W (1992) Differential susceptibility of early steps in
carp (Cyrinus carpio) development to α-amanitin. Dev. Genes Evol., 202, 61-65.
Ståhlberg A, Bengtsson M (2010) Single-cell gene expression profiling using reverse
transcription quantitative real-time PCR. Methods, 50, 282-288.
261
Sun XJ, Xu PF, Zhou T, Hu M, Fu CT, Zhang Y, Jin Y, Chen Y, Chen SJ, Huang QH,
Liu TX, Chen Z (2008) Genome-wide survey and developmental expression
mapping of zebrafish SET domain-containing genes. PLoS ONE, 3, e1499.
Sæle O, Nordgreen A, Hamre K, Olsvik PA (2009) Evaluation of candidate reference
genes in qPCR studies of Atlantic cod (Gadus morhua) ontogeny, with emphasis
on the gastrointestinal tract. Comp. Biochem. Physiol. B 152, 94-101.
Sæle O, Silva N, Pittman K (2006) Post-embryonic remodelling of neurocranial
elements: A comparative study of normal versus abnormal eye migration in a
flatfish, the Atlantic halibut. J. Anat., 209, 31-41.
Sæle O, Solbakken JS, Watanabe K, Hamre K, Power D, Pittman K (2004) Staging of
Atlantic halibut (Hippoglossus hippoglossus L.) from first feeding through
metamorphosis, including cranial ossification independent of eye migration.
Aquaculture, 239, 445-465.
Tadros W, Lipshitz HD (2009) The maternal-to-zygotic transition: A play in two acts.
Development, 136, 3033-3042.
Takeuchi T, Watanabe Y, Takano-Shimizu T, Kondo S (2006) Roles of jumonji and
jumonji family genes in chromatin regulation and development. Dev. Dyn., 235,
2449-2459.
Tamura T, Picciano MF (2006) Folate and human reproduction. Am. J. Clin. Nutr., 83,
993-1016.
Tang R, Dodd A, Lai D, McNabb WC, Love DR (2007) Validation of zebrafish (Danio
rerio) reference genes for quantitative real-time RT-PCR normalization. Acta.
Bioch. Bioph. Sin., 39, 384-390.
262
Taylor JS, Van de Peer Y, Braasch I, Meyer A (2001) Comparative genomics provides
evidence for an ancient genome duplication event in fish. Philos. Trans. R. Soc.
Lond. B Biol. Sci., 356, 1661-1679.
Telford N, Watson A, Schultz G (1990) Transition from maternal to embryonic control
in early mammalian development: A comparison of several species. Mol.
Reprod. Dev., 26, 90-100.
Thelie A, Papillier P, Perreau C, Uzbekova S, Hennequet-Antier C, Dalbies-Tran R
(2009) Regulation of bovine oocyte-specific transcripts during in vitro oocyte
maturation and after maternal-embryonic transition analyzed using a
transcriptomic approach. Mol. Reprod. Dev., 76, 773-782.
Thellin O, ElMoualij B, Heinen E, Zorzi W (2009) A decade of improvements in
quantification of gene expression and internal standard selection. Biotechnol.
Adv., 27, 323-333.
Thorsen A, Fyhn HJ (1996) Final oocyte maturation in vivo and in vitro in marine
fishes with pelagic eggs; yolk protein hydrolysis and free amino acid content. J.
Fish Biol,, 48, 1195-1209.
Tingaud-Sequeira A, Chauvigné F, Lozano J, Agulleiro MJ, Asensio E, Cerdà J (2009)
New insights into molecular pathways associated with flatfish ovarian
development and atresia revealed by transcriptional analysis. Bmc Genomics, 10,
434.
Tocher D (2003) Metabolism and functions of lipids and fatty acids in teleost fish. Res.
Fish Sci., 11, 107-184.
Tocher DR (2010) Fatty acid requirements in ontogeny of marine and freshwater fish.
Aquacult. Res., 41, 717-732.
263
Tonheim SK, Koven W, Rønnestad I (2000) Enrichment of Artemia with free
methionine. Aquaculture, 190, 223-235.
Travis Thomson PL (2004) Drosophila tudor is essential for polar granule assembly and
pole cell specification, but not for posterior patterning. Genesis, 40, 164-170.
Tvedt HB, Benfey TJ, Martin-Robichaud DJ, McGowan C, Reith M (2006)
Gynogenesis and sex determination in Atlantic halibut (Hippoglossus
hippoglossus). Aquaculture, 252, 573-583.
Tveiten H, Johnsen HK (1999) Temperature experienced during vitellogenesis
influences ovarian maturation and the timing of ovulation in common wolffish.
J. Fish Biol., 55, 809-819.
Vallée M, Aiba K, Piao Y, Palin MF, Ko MSH, Sirard MA (2008) Comparative analysis
of oocyte transcript profiles reveals a high degree of conservation among
species. Reproduction, 135, 439-448.
Vallin L, Nissling A (1998) Cell morphology as an indicator of viability of cod eggs -
results from an experimental study. Fish Res., 38, 247-255.
Van Nes S, Andersen Ø (2006) Temperature effects on sex determination and
ontogenetic gene expression of the aromatases cyp19a and cyp19b, and the
estrogen receptors esr1 and esr2 in Atlantic Halibut (Hippoglossus
Hippoglossus). Mol. Reprod. Dev., 73, 1481-1490.
Van Nes S, Moe M, Andersen O (2005) Molecular characterization and expression of
two cyp19 (P450 aromatase) genes in embryos, larvae, and adults of Atlantic
halibut (Hippoglossus hippoglossus). Mol. Reprod. Dev., 72, 437-449.
Vandesompele J, De Preter K, Pattyn F, Poppe B, Van Roy N, De Paepe A, Speleman F
(2002) Accurate normalization of real-time quantitative RT-PCR data by
264
geometric averaging of multiple internal control genes. Genome Biol., 3,
research0034.0031 - research0034.0011.
Venkatesh B (2003) Evolution and diversity of fish genomes. Curr. Opin. Genet. Dev.,
13, 588-592.
Vermeirssen ELM, Mazorra de Quero C, Shields RJ, Norberg B, Kime DE, Scott AP
(2004) Fertility and motility of sperm from Atlantic halibut (Hippoglossus
hippoglossus) in relation to dose and timing of gonadotrophin-releasing
hormone agonist implant. Aquaculture, 230, 547-567.
Von Schalburg KR, Cooper GA, Leong J, Robb A, Lieph R, Rise ML, Davidson WS,
Koop BF (2008) Expansion of the genomics research on Atlantic salmon Salmo
salar L. project (GRASP) microarray tools. J. Fish Biol., 72, 2051-2070.
Von Schalburg KR, Rise ML, Brown GD, Davidson WS, Koop BF (2005) A
comprehensive survey of the genes involved in maturation and development of
the rainbow trout ovary. Biol. Reprod., 72, 687-699.
Wachirachaikarn A, Rungsin W, Srisapoome P, Na-Nakorn U (2009) Crossing of
African catfish, Clarias gariepinus (Burchell, 1822), strains based on strain
selection using genetic diversity data. Aquaculture, 290, 53-60.
Wagner DS, Dosch R, Mintzer KA, Wiemelt AP, Mullins MC (2004) Maternal control
of development at the midblastula transition and beyond: Mutants from the
zebrafish II. Dev. Cell, 6, 781-790.
Wai T, Ao A, Zhang X, Dufort D, Shoubridge EA (2010) The role of mitochondrial
DNA copy number in mammalian fertility. Biol. Reprod., 83, 52-62.
Wallace RA, Selman K (1985) Major protein changes during vitellogenesis and
maturation of Fundulus ooocytes. Dev Biol, 110, 492-498.
265
Wang X, Zhu S, Khan IA, Dasmahapatra AK (2007) Ethanol attenuates Aldh9 mRNA
expression in Japanese medaka (Oryzias latipes) embryogenesis. Comp.
Biochem. Physiol. B, 146, 357-363.
Wang Z, Gerstein M, Snyder M (2009) RNA-Seq: a revolutionary tool for
transcriptomics. Nat. Rev. Genet., 10, 57-63.
Warrington JA, Nair A, Mahadevappa M, Tsyganskaya M (2000) Comparison of
human adult and fetal expression and identification of 535
housekeeping/maintenance genes. Physiol. Genomics, 2, 143-147.
Watanabe T, Vassallo-Agius R (2003) Broodstock nutrition research on marine finfish
in Japan. Aquaculture, 227, 35-61.
Weber GM, Silverstein JT (2007) Evaluation of a stress response for use in a selective
breeding program for improved growth and disease resistance in rainbow trout.
N. Am. J. Aquacult., 69, 69-79.
Willis AL (1981) Nutritional and pharmacological factors in eicosanoid biology. Nutr.
Rev., 39, 289-301.
Wrenzycki C, Herrmann D, Niemann H (2007) Messenger RNA in oocytes and
embryos in relation to embryo viability. Theriogenology, 68, S77-S83.
Wu G (2009) Amino acids: Metabolism, functions, and nutrition. Amino Acids, 37, 1-
17.
Wyman AH, Chi M, Riley J, Carayannopoulos MO, Yang C, Coker KJ, Pessin JE,
Moley KH (2003) Syntaxin 4 expression affects glucose transporter 8
translocation and embryo survival. Mol. Endocrinol., 17, 2096-2102.
Xiang Z, Dong C, Qi L, Chen W, Huang L, Li Z, Xia Q, Liu D, Huang M, Weng S, He
J (2010) Characteristics of the interferon regulatory factor pairs zfIRF5/7 and
266
their stimulation expression by ISKNV Infection in zebrafish (Danio rerio).
Dev. Comp. Immunol., 34, 1263-1273.
Yabe T, Ge X, Lindeman R, Nair S, Runke G, Mullins MC, Pelegri F (2009) The
maternal-effect gene cellular island encodes Aurora B kinase and is essential for
furrow formation in the early zebrafish embryo. PLoS Genet., 5.1-31.
Yabe T, Ge X, Pelegri F (2007) The zebrafish maternal-effect gene cellular atoll
encodes the centriolar component sas-6 and defects in its paternal function
promote whole genome duplication. Dev. Biol., 312, 44-60.
Yasuike M, Kondo H, Hirono I, Aoki T (2007) Difference in Japanese flounder,
Paralichthys olivaceus gene expression profile following hirame rhabdovirus
(HIRRV) G and N protein DNA vaccination. Fish Shellfish. Immun., 23, 531-
541.
Yoshida K, Kuo F, George EL, Sharpe AH, Dutta A (2001) Requirement of CDC45 for
postimplantation mouse development. Mol. Cell Biol., 21, 4598-4603.
Zar J (1999) Biostatistical Analysis, Pearson higher education, Upper Saddle River.
Zhang K, Hansen PJ, Ealy AD (2010) Fibroblast growth factor 10 enhances bovine
oocyte maturation and developmental competence in vitro. Reproduction, 140,
815-826.
Zhang YB, Hu CY, Zhang J, Huang GP, Wei LH, Zhang QY, Gui JF (2003) Molecular
cloning and characterization of crucian carp (Carassius auratus L.) interferon
regulatory factor 7. Fish Shellfish Immun., 15, 453-466.
Zhang Z, Wang Y, Wang S, Liu J, Warren W, Mitreva M, RB w (2011) Transcriptome
analysis of female and male Xiphophorus maculatus Jp 163 A. PLoS One, 6.
267
Zheng L, Roeder RG, Luo Y (2003) S phase activation of the Histone H2B Promoter by
OCA-S, a coactivator complex that contains GAPDH as a key component. Cell,
114, 255-266.
Zhu P, Parrish C, Brown J (2003) Lipid and amino acid metabolism during early
development of Atlantic halibut (Hippoglossus hippoglossus). Aquacult. Int., 11,
43-52.
Øvergård AC, Nerland AH, Patel S (2010) Evaluation of potential reference genes for
real time RT-PCR studies in Atlantic halibut (Hippoglossus Hippoglossus L.);
during development, in tissues of healthy and NNV-injected fish, and in anterior
kidney leucocytes. BMC Mol. Biol., 11, 36-51.