Embed Size (px)
Citation preview

JOURNAL OF QUATERNARY SCIENCE (2005) 20(2) 113–133Copyright � 2005 John Wiley & Sons, Ltd.Published online in Wiley InterScience (www.interscience.wiley.com). DOI: 10.1002/jqs.902
Marginal formation of De Geer moraines andtheir implications to the dynamics ofgrounding-line recessionMATTIAS LINDEN* and PER MOLLERGeoBiosphere Science Centre, Quaternary Sciences, Lund University, Solvegatan 12, SE 22362 Lund, Sweden
Linden, M. and Moller, P. 2005. Marginal formation of De Geer moraines and their implications to the dynamics of grounding-line recession. J. Quaternary Sci., Vol. 20pp. 113–133. ISSN 0267-8179.
Received 16 April 2004; Revised 11 November 2004; Accepted 20 November 2004
ABSTRACT: De Geer moraine ridges occur in abundance in the coastal zone of northern Sweden,preferentially in areas with proglacial water depths in excess of 150 m at deglaciation. From detailedsedimentological and structural investigations in machine-dug trenches across De Geer ridges it isconcluded that the moraines formed due to subglacial sediment advection to the ice margin duringtemporary halts in grounding-line retreat, forming gradually thickening sediment wedges. The prox-imal part of the moraines were built up in submarginal position as stacked sequences of deformingbed diamictons, intercalated with glaciofluvial canal-infill sediments, whereas the distal parts werebuilt up from the grounding line by prograding sediment gravity-flow deposits, distally interfingeringwith glaciolacustrine sediments. The rapid grounding-line retreat (ca. 400myr�1) was driven by rapidcalving, in turn enhanced by fast iceflow and marginal thinning of ice due to deforming bed condi-tions. The spatial distribution of the moraine ridges indicates stepwise retreat of the grounding line. Itis suggested that this is due to slab and flake calving of the ice cliff above the waterline, forming agradually widening subaqueous ice ledge which eventually breaks off to a new grounding line, fol-lowed by regained sediment delivery and ridge build-up. Copyright � 2005 John Wiley & Sons, Ltd.
KEYWORDS: De Geer moraines; glacial sedimentology; subaqueous deglaciation; grounding line; deforming bed.
Introduction
Rapid decay of the last Scandinavian Ice Sheet succeeded theYounger Dryas cold-event readvance from the Skovde-Billingen Moraines in Sweden (e.g. Lundqvist and Wohlfarth,2001; Fig. 1a) and the Salpausselka Moraines in Finland (e.g.Donner, 1995; Fig. 1a). Along a flow-line from the Salpaus-selka Moraines towards the last ice remnants in northernSweden, the ice margin retreated 800 km within ca. 2000years, between 11 500 and 9500 cal. yr BP, equal to a meanrecession rate of ca. 400myr�1. Climate probably provided astrongly negative mass balance on the ice sheet driving thisrapid deglaciation (Siegert and Dowdeswell, 2002). Glacierdynamics and the deglacial environment were also importantfactors; longitudinal ice-sheet lineation patterns north of theYounger Dryas Moraines indicate the existence of major icestreams over Finland and the Gulf of Bothnia during ice-sheetdecay (Boulton et al., 2001b), enhancing the evacuation oflarge ice masses, and the ice margin was situated in deep water(up to ca. 330m in the deepest part of the Gulf of Bothnia), pro-moting a retreat dominantly forced by calving. It is unknown,
however, whether climate or glacier physics was the main trig-ger behind this rapid decay of the large ice volume.The rapid deglaciation of coastal Norrbotten, northern
Sweden (Fig. 1), left vast areas of recessional landforms suchas De Geer moraines and Niemisel moraines. Our ongoingresearch project has a special focus on the formation of theselandforms, with the main aim of reconstructing the sedimento-logical and landforming processes, and from this deducing thedeglaciation pattern and dynamics of the area. The emphasis inthis paper will be on De Geer moraines (Hoppe, 1959; in NorthAmerica usually named washboard or cross-valley moraines,e.g. Mawdsley, 1936; Norman, 1938; Elson, 1957; Andrews,1963a, 1963b; Prest, 1968), a type of moraine often abundantin areas characterised by subaqueous deglaciation. This workaims to demonstrate that De Geer moraines are strictly ice-marginal features and, as such, significant archives for ourunderstanding of sedimentary grounding-line processes. Theythus have bearing on grounding-line and calving dynamicsand help us to understand rapid ice-sheet decay. Ourinterpretations are based on detailed sedimentological andstructural investigations of De Geer moraines, combined withgeomorphologic expression and spatial distribution patterns,and form the basis for a process/facies model of De Geermoraine formation in Norrbotten. Hopefully, this model alsowill have a bearing on the formation of similar moraine ridgeselsewhere.
* Correspondence to: M. Linden, GeoBiosphere Science Centre, QuaternarySciences, Lund University, Solvegatan 12, SE 22362 Lund, Sweden.E-mail: [email protected]
De Geer moraines—previous work
De Geer moraines are abundant in areas below the highestshoreline/marine limit in Scandinavia, forming swarms of smallmoraine ridges roughly transverse to the former iceflow direc-tion. Ridges of this type were described as early as 1889 byGerhard De Geer. From the area around Stockholm, sets ofsmall-scale moraine ridges were interpreted as annual mor-aines (in Swedish, ‘arsmoraner’), suggested to be dump mor-aines deposited at a water-terminating ice margin duringwinter stillstands. The formative processes were later suggestedto be pushing and stacking of sediments, i.e. push moraines, atthe ice margin during winter readvances of a generally retreat-ing ice sheet (De Geer, 1940). De Geer also argued that theconcept of annual formation of the moraine ridges was sup-ported by his varve chronology as the average distancebetween adjacent ridges usually coincides with the ice reces-sion rate in central parts of Sweden, based on varve counting.De Geer moraines have drawn considerable attention,
resulting in a large number of investigations aimed at revealingtheir depositional history. In spite of this, the active processesresponsible for sediment formation and landform generationseem to be poorly understood. Most of the earlier investigations(e.g. De Geer, 1889; Hoppe, 1948, 1957, 1959; Moller, 1962;Lundqvist, 1989; Stromberg, 1965; Zilliacus, 1985, 1987,1989) on De Geer moraines are based on geomorphology, spa-
tial distribution patterns and ice-sheet recession chronology(varves), and only to a limited extent on sedimentologicaland structural evidence. However, attention has shiftedtowards sedimentological investigations in an attempt to revealthe processes responsible for De Geer moraine formation(Sollid and Carlsson, 1984; Beaudry and Prichonnet, 1991,1995; Larsen et al., 1991; Blake, 2000).Hoppe (1948) argued, based on field evidence from Norrbot-
ten, that more than one moraine ridge (ca. 2–3) was formedevery year. This was calculated from the relation between themean distance between moraine ridges and the mean annualice-retreat rate, obtained from varve chronology (De Geer,1940). Hoppe (1959) proposed an alternative hypothesis onmoraine ridge formation which included the seasonal velocityvariations of active glaciers; as no evidence of winter stillstandsor readvanceswere identified, moraine ridge formation was sug-gested to occur during the warmer seasons when the velocity ofthe ice sheet was at its maximum. Hoppe (1959) suggested thatsqueezing was the main process of transferring sediments to theice front and into submarginal crevasses parallel to the ice mar-gin, and that usually more than one ridge was produced duringeach melt season. It was concluded, when interpreting the‘annual’ moraines as not being annual, that the term annualmoraines was misleading and he therefore renamed them DeGeer moraines after their first describer (Hoppe, 1959).Stromberg (1965) agreed with Hoppe’s (1959) hypothesis of
sediment squeeze into submarginal crevasses, on the basis of
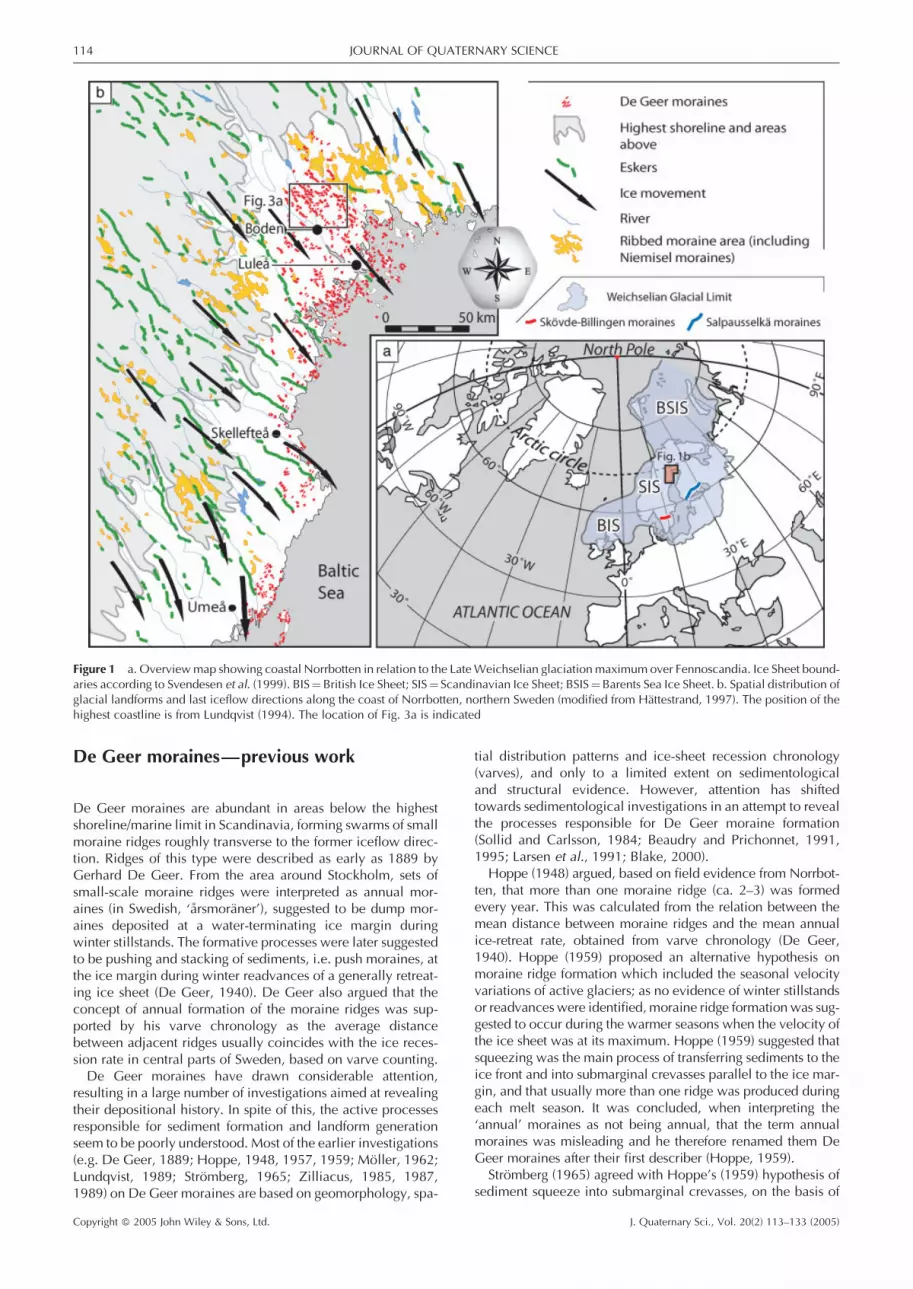
Figure 1 a. Overviewmap showing coastal Norrbotten in relation to the LateWeichselian glaciationmaximum over Fennoscandia. Ice Sheet bound-aries according to Svendesen et al. (1999). BIS¼British Ice Sheet; SIS¼ Scandinavian Ice Sheet; BSIS¼Barents Sea Ice Sheet. b. Spatial distribution ofglacial landforms and last iceflow directions along the coast of Norrbotten, northern Sweden (modified from Hattestrand, 1997). The position of thehighest coastline is from Lundqvist (1994). The location of Fig. 3a is indicated
114 JOURNAL OF QUATERNARY SCIENCE
Copyright � 2005 John Wiley & Sons, Ltd. J. Quaternary Sci., Vol. 20(2) 113–133 (2005)

his observations in the Uppsala area in Sweden. Zilliacus(1985, 1987, 1989) investigated De Geer moraines in Finland,and he also suggested formation by subglacial squeeze intocrevasses, although into sets of basal transverse crevassesinitiated by glacial surges. This view has also been supportedby Lundqvist (1989, 2000). The ice-surge hypothesis by Zillia-cus does not, however, take into account—or explain—theclassical calving bay configuration seen in many De Geer mor-aine areas (Stromberg, 1981, 1989).Based on sedimentological investigations on De Geer
moraines in the More and Pasvik areas, western and northernNorway, respectively, Larsen et al. (1991) and Sollid andCarlsson (1984) concluded that the ridges were deposited asannual recessional moraines at the ice margin. Sollid andCarlsson (1984) argued that formation was by lodgement ofbasal debris at the margin during the winter season. Further-more, they dismissed formation of basal crevasses since theplastic behaviour of the ice would prevent the developmentof such crevasses. It was also proposed that the similarity inbasal stress and hydrostatic pressure between the basal waterand the water in the adjacent basin (no effective stress gradient)would prevent marginal squeeze of saturated till. Larsen et al.(1991) suggested stacking of sediments by pushing at thegrounding line, and that the retreat was mainly controlled byiceberg calving. They rejected the crevasse model, since pre-servation would require an ice lift-off over a wide area and con-sidered this mechanism highly unlikely because the glacieroutlets were strongly controlled by the fjord topography.Based on extensive sedimentological investigations on De
Geer moraines fromQuebec, Canada, Beaudry and Prichonnet(1991, 1995) concluded that these were formed due to basalcrevasse infill beneath an active glacier. In areas with abundantbasal meltwater canals, prograding beds of sorted materialwere suggested to accumulate in crevasses by foreset migra-tion, whereas infill of till should be the case in areas wheremeltwater flow was absent. Subglacial shear was suggested toremobilise basal till locally and push it in a down-glacier direc-tion into basal crevasses and also overturn thick till beds, pre-viously deposited in these crevasses. Their proposed model forDe Geer moraine formation implies that a number of morainescan be formed simultaneously inside the grounding line and,accordingly, that they are not annual features.Blake (2000) investigated De Geer moraine formation from
the Svartisen area, northern Norway, and reached the conclu-sion that ridges formed at the grounding line were mainly com-posed of sorted sediments and basal till. It was argued that thestratigraphy indicated periods of deposition of sorted sedi-ments, followed by periods of till deposition and deformationof pre-deposited sediments. According to Blake (2000) thenumber of till units, separated by sorted sediment beds in a sin-gle moraine ridge, could indicate the number of times thegrounding line reoccupied the specific position, thus discredit-ing the annual moraine hypothesis.
Geological setting of the investigationarea—regional introduction
Regional geomorphology
The large-scale geomorphology of the investigation area ischaracterised by southeast-trending broad valleys and bedrockhills, the latter reaching altitudes of 600ma.s.l. (Fig. 1). Stream-lined bedrock knobs, drumlins and lee-side moraines, all pre-ferentially on higher ground, indicate a predominating ice
movement towards the southeast, possibly repeated throughseveral glacial cycles (Fromm, 1965; Lundqvist, 1981;Hattestrand, 1997; Kleman, 1990, 1992; Kleman et al., 1997).Valleys are predominantly occupied by till and glaciolacus-
trine/lacustrine silt, while glaciofluvial sediments seem to havea very restricted occurrence. Often the thickness of glaciola-custrine deposits increases towards the present coast as the val-leys become wider. Most of the till below the highest shorelineis represented by the local ‘Kalixpinnmo’ till, most typicallyseen as bimodal, poorly sorted sediment predominated by finesand with dispersed coarse clasts (Beskow, 1935; Fromm,1965; Hoppe, 1948, 1952, 1959; Lundqvist, 1981). Till sur-faces are significantly wave-washed below the highest shore-line (200–220ma.s.l.) and beach sediments frequently occurjust below the highest shoreline and on slopes exposed to waveaction during regression.Morainic landforms are abundant in low-lying terrain, espe-
cially De Geer moraines, but also large, continuous areas ofNiemisel moraines (Hoppe, 1948; Fromm, 1965; for areal dis-tribution see SGU Ak map series: Granas, 1990; Svedlund,1991, 1992; Rodhe and Svedlund, 1990). De Geer and Niemi-sel moraines are usually spatially separated, but in some areasthese moraines occur together and De Geer moraines are atseveral places seen to be superimposed on Niemisel moraines.
Spatial distribution of De Geer moraines
De Geer moraines are found below the highest shoreline of thelast glacial event and extend well below the present sea level inthe Gulf of Bothnia. Thus De Geer moraines are abundant in a30–100 km wide zone along the coast of Norrbotten (Fig. 1). Ingeneral, the height of De Geer moraines in Norrbotten variesbetween 1 and 3m, although heights up to 6–7m have beenrecorded (Hoppe, 1948; Fromm, 1965). The average width isca. 30m and the length is highly variable; some ridges are only100m long while others can be traced continuously over dis-tances of 2–3 km. The cross-sectional shape varies, but mostcommonly shows a gently sloping proximal side and a some-what steeper distal side (Fig. 2). The typical morphology istherefore a rather low, narrow and elongated moraine ridgewith variable length. The distance between adjacent ridges isusually between 50 and 200m, occasionally up to 500m.However, the average distance is ca. 100–150m.With respect to iceflow direction De Geer moraine tracts
form a transverse lineation pattern being slightly upflow con-cave in valleys and topographic lows and slightly convex over,or close to, elevated ground (Fig. 3a). This refers to the large-scale trend of De Geer moraines, even though individual ridgesmay diverge from this pattern. Occasionally two or three DeGeer moraines converge towards the valley side or whenapproaching topographic heights. Though rare, this feature ismore frequent for smaller (i.e.<1m high) moraine ridges. Eventhough the frequency of De Geer moraines is smaller on higherground and close to the highest shoreline, they are often foundon lower topographic heights and half-way up on valley sides.In these positions the moraine ridges are often small and flat.The rarity of moraine ridges on the heights might be due towave-washing during the isostatic uplift, which at places issupported by linear occurrences of residual boulders, but alsomight be because the ridge-forming processes were unfavour-able in this position.De Geer moraines are sometimes not recognised in the cen-
tral parts of the valleys. However, this is most probably a ‘mask-ing’ effect as lakes, rivers, mires and fine-grained sedimentsfrequently occupy or cover the valley floor. Small moraines
DE GEER MORAINES AND DYNAMICS OF GROUNDING-LINE RECESSION 115
Copyright � 2005 John Wiley & Sons, Ltd. J. Quaternary Sci., Vol. 20(2) 113–133 (2005)

in mid-valley position are probably especially vulnerable tobeing buried by fine-grained sediments; this might explainlocally large distances between moraine ridges. Natural breaksin the terrain, such as, for example, thresholds for lakes, oftenindirectly indicate De Geer moraine location on valley floors.
Deglaciation of the area—present knowledge
The accepted concept for northern Sweden is that, prior todeglaciation, the ice divide moved from the Bothnian basinto the mountain region, from east to west (Lundqvist,1994). The freshwater Ancylus Lake (Bjorck, 1995) graduallyinundated the area as the ice margin retreated westwards andmost of the investigated area was below sea level at deglacia-tion. However, the most elevated parts of the terrain formed anarchipelago at the time of deglaciation with islands and penin-sulas along which the highest shoreline was developed at ca.200–220ma.s.l. (SGU Ak map series: Granas, 1990; Svedlund,1991, 1992; Rodhe and Svedlund, 1990). The highest shorelineis well developed on the higher bedrock knobs, sometimesresulting in formation of till-capped hills. The altitude of thehighest shoreline decreases from the present coast and furtherinland due to higher isostatic uplift within the Gulf of Bothnia,where the ice sheet was at its thickest during the maximum gla-ciation (Lundqvist, 1994). A secondary cause is that the land-scape had already begun to rise faster than sea-level rise whenthe ice margin retreated across the area, gradually exposing
new areas to the Gulf of Bothnia and subsequent wave action.Hence, during this inundation of Norrbotten by Ancylus Lakethe regressive and asynchronous highest shoreline was formed.Isostatic uplift is a still-continuing process in the coastal areasof Norrbotten, raising the land at present by slightly less than1 cmyr�1 (Eriksson and Henkel, 1994). The area was degla-ciated approximately at ca. 10 000 cal. yr BP accordingto Lundqvist (1994) and varve-chronology data suggest thatthe ice retreat rate was approximately 300–400myr�1 inNorrbotten (De Geer, 1940) and 300–500myr�1 inVasterbotten (Bergstrom, 1968).
Methods
Morphological mapping of moraines was conducted by meansof aerial photographic interpretation. Most of the aerial photo-graphs used were black and white photographs at a 1:30 000scale. If available, false-coloured infrared photographs(1:60 000 scale) were also used in order to cover larger areas.The mapping was done partly as a supplement to the sediment/landformmaps at a scale of 1:50 000, published by the SwedishGeological Survey (Granas, 1990; Svedlund, 1991, 1992;Rodhe and Svedlund, 1990) and to construct high-resolutionmaps of the area with a higher control of distribution and spa-cing of the moraine ridges.Digital topographic data was put at our disposal by the
Swedish Geological Survey to produce Digital Elevation Mod-els (DEMs). ArcView served as a platform from which basicmap calculations were performed and a map of the highestshoreline was generated. The digital data was also manipulatedfor shadowing (sun angle) effects in order to highlight minortopographic lineations, which sometimes proved useful in con-nection with the aerial photographic interpretation.Sedimentological investigations were carried out in exca-
vated trenches, perpendicular to the ridge crests. Lithologicunits were recognised on the basis of lithofacies classification(Table 1). The boundaries between lithofacies units, their inter-nal structures and deformation structures, were measured anddocumented at a scale of 1:20. Sediment samples were takenfor grain size analysis.Clast fabric analyses were carried out on prolate pebbles,
excavated from 50� 30 cm horizontal benches in the sectionsand with vertical sampling less than 20 cm. Each fabric setcomprises 30 pebbles with the longest axis (a-axis) rangingbetween 2 and 12 cm, and only clasts with an a/b-axis ratioof � 2 were accepted. Pebbles with close contacts to bouldersand other pebbles were discarded because of possible orienta-tion interference. The orientation data were statistically evalu-ated according to the eigenvalue method of Mark (1973) andgraphically manipulated with StereoNet# 1.01 for Windows.
Ljusa and Rasmyran, type areas forsedimentological investigations ofDe Geer moraines
The area around Boden shows a high concentration of De Geermoraines (Fig. 3a). Two type-areas were chosen for moredetailed investigations, the Ljusa area (Fig. 3b) situated 18 kmnorth of Boden and the Rasmyran area (Fig. 3c) situated 12 kmwest of Boden. The numerous De Geer moraines in the areaaround Ljusa show with respect to palaeo-iceflow direction aslightly concave/convex plan-form distribution pattern. The
Figure 2 a. Oblique aerial photograph showing three narrow andslightly curved De Geer moraines marked by arrows, also indicatingthe iceflow direction. b. Typical De Geer moraine with asymmetriccross profile and boulder concentration. Iceflow was from left to right
116 JOURNAL OF QUATERNARY SCIENCE
Copyright � 2005 John Wiley & Sons, Ltd. J. Quaternary Sci., Vol. 20(2) 113–133 (2005)

Figure 3 a. Spatial distribution of De Geer moraines, compiled from SGU Ak-series maps (Granas, 1990; Svedlund, 1991, 1992; Rodhe andSvedlund, 1990) and aerial photographic interpretation. The bathymetry at deglaciation is indicated, as well as the highest shoreline at 210–220ma.s.l. Inserts mark the position of Figs 3b and 3c. The city of Boden is situated below ‘S’ in compass rose. b. Detailed spatial distribution ofDe Geer moraines and sediments in the Ljusa area, based on map by Granas (1990). Positions of excavated De Geer moraines are indicated. c.Detailed spatial distribution of De Geer moraines and sediments in the Rasmyran area, based on map by Rodhe and Svedlund (1990). Positions ofexcavated De Geer moraines are indicated
DE GEER MORAINES AND DYNAMICS OF GROUNDING-LINE RECESSION 117
Copyright � 2005 John Wiley & Sons, Ltd. J. Quaternary Sci., Vol. 20(2) 113–133 (2005)

ridges have an up-glacier concave outline in low-lying areas ofthe valley and tend to curve down-glacier when approachinghigher terrain. Conversely, the De Geer moraines in the areaaround Rasmyran show a straighter distribution pattern trans-verse to the valley, and the palaeo-iceflow direction, and showno significant trend to curve in any direction. These ridges aresituated closer to the highest shoreline (ca. 100–120m waterdepth at deglaciation) and exposed bedrock, thin till coverand beach deposits are more frequent (Fig. 3c), suggesting ahigher degree of exposure to wave action than in the Ljusa area(ca. 160–180m water depth at deglaciation). In each type areatwo moraines were chosen for sedimentological investigationsin machine-dug trenches. Those chosen for the Ljusa area aresituated in a densely packed ridge area; between Ljusa 1 andLjusa 2 (Fig. 3b) there are 13 individual moraines, which givean average of 90m between ridge crests. The moraines chosenin the Rasmyran area are just ca. 200m apart (Fig. 3c), with ashort ridge in between. The trenches were 28 to 37m long, cov-ering the whole or most of the cross-sectional area of eachridge, and the excavation depths (4–5m) extended beneaththe morphological expression of the ridges.
Sediments—descriptions and interpretations
All four trenches crossing the De Geer moraine ridges reveal asimilar large-scale sedimentary and deformational architectureand can therefore be described together as a general frameworkfor facies variability within and in connection to the moraines.Seven sedimentary facies are recognised along the studied sec-tion walls. Facies 1–4 are the primary building components incontext of De Geer moraine formation, whereas facies 5–7interfinger, overlie or onlap without being primary construc-tional sediment bodies of the moraine ridges. The formativefacies (1–4) are represented by sandy-silty diamicton (facies1) and gravelly-sandy diamicton (facies 2), the former predomi-
nantly located on the proximal side and the latter on the distalside of the moraines, and predominantly massive to laminatedsand and silt (facies 3) interbedded with the diamict facies.Facies 4 is sand and gravel, forming injection structures onthe proximal side of the moraines.
Facies descriptions, facies 1–4
Facies 1, sandy-silty diamicton. This facies is the predomi-nant facies in all four De Geer moraine sections, representedby a grey, sandy-silty, matrix-supported and massive diamicton(D(SSi)mm; see Table 1 for lithofacies codes). This sandy-siltydiamicton constitutes the base of the landform and probablyalso forms the local till cover in both type areas. It predomi-nates in the proximal parts of the ridges, but pinches out andusually interfingers with facies 2 diamicton distal to the ridgecrest-lines. Facies 1 diamicton also occurs as isolated bodies(up to 2m long and 0.5m thick) within the facies 2 sandy-gravelly diamicton.Although massive in structure, local variations in matrix tex-
ture are common with diffuse changes into a silty-sandy matrix,forming indistinct bodies of slightly more coarse-grained dia-micton on a decimetre to metre scale. The clast content is highwith randomly distributed subrounded to subangular cobblesand boulders, the maximum sizes being 1.2–2.5m. Beddingplanes in the massive diamicton are inferred from contacts tointer/intrabedded sediments of facies 3 (sand and silt). Fromthis it can be deduced that the facies 1 diamicton—at leastin the Ljusa 1, Ljusa 2 and Rasmyran 1 sections—constitutessets of stacked beds, 0.5–4m thick, with a primary up-glacierdip (6–35 �) with increasing inclination towards the crest-line.The intrabeds within the massive diamicton also reveal abun-dant dislocations, faulting and folding, comprising single bedsor composite bed-sets, indicating series of syndepositionaldeformational events.Seventeen fabric analyses were carried out in facies 1 dia-
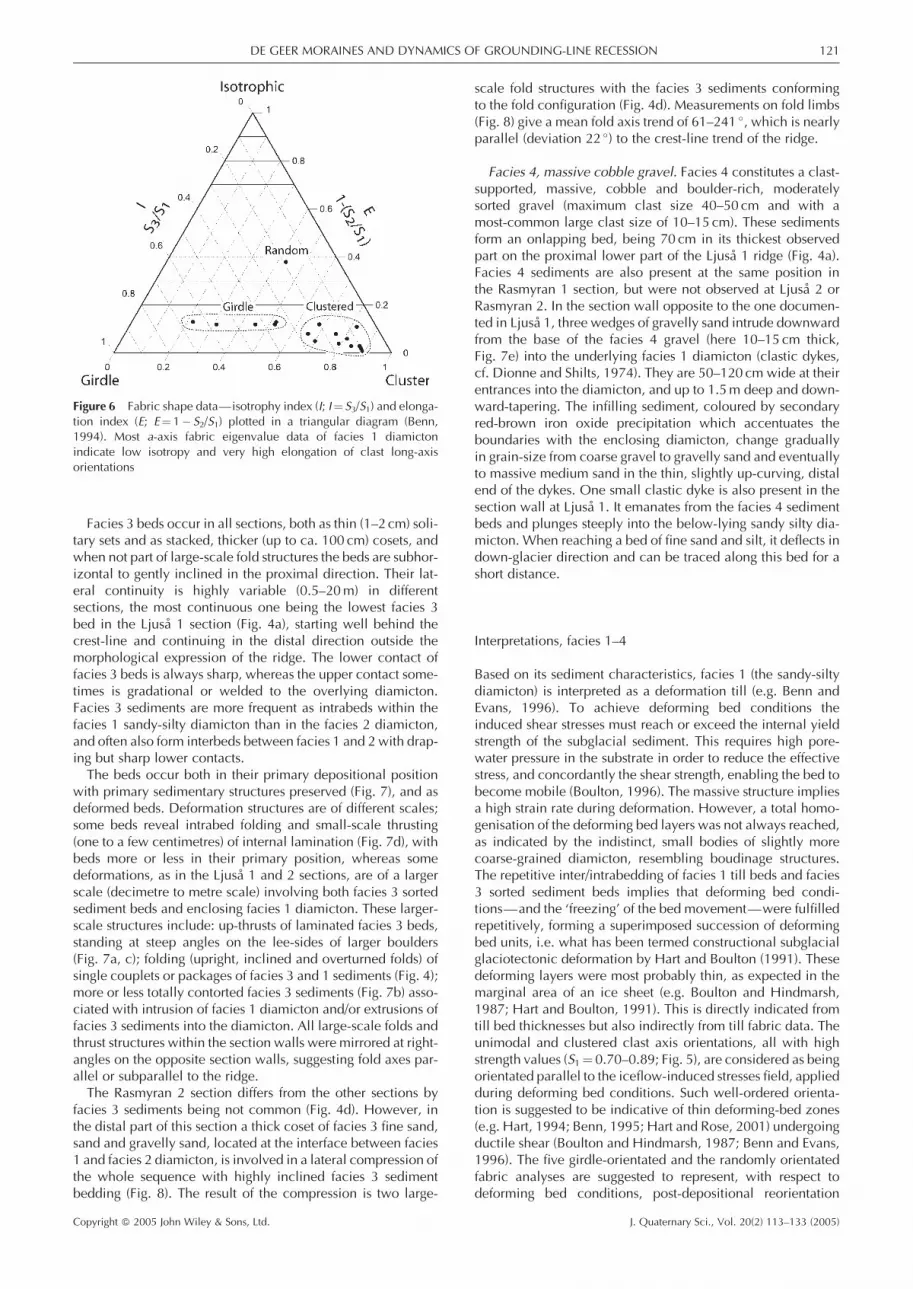
mictons at the different sites (Fig. 5), preferentially where visualindications of post-depositional disturbances were absent. Ele-ven analyses showed unimodal and clustered clast axis orien-tations with strength values (S1) varying between 0.76 and0.85, giving fabric shapes characterised by very low isotropy(I¼ 0.011–0.118) and very high elongation (E¼ 0.654–0.884;Fig. 6). Mean axis orientations (V1) are perpendicular or slightlyoblique to the local trend of moraine ridge crest-lines. Themean deflection of V1 from being perpendicular to ridgecrest-lines is 14.5 � with a maximum deflection of 33 �. Theremaining six fabric analyses revealed a distinctively differentfabric shape (Fig. 6); five show girdle distributions of clast axes(Ljusa 2:2, 2:3 and Rasmyran 1:1, 1:2, 2:4; Fig. 5) with low(0.51–0.62) but, for girdle distributions, significant S1 values.The dips of the distribution planes of three of these girdle dis-tributions plunge near-parallel to ridge crest-lines, whereas twoplunge near-to perpendicular and up-glacier to ridge crest-lines. The remaining fabric analysis, Rasmyran 2:3, shows arandom clast-axis distribution with a number of clast axes withhigh angles of plunge. The biggest clasts, i.e. cobbles andboulders, showed no apparent preferred orientation, possiblywith the exception of section Rasmyran 2 where a weak clus-tering, parallel to the overall iceflow direction, occurred.
Facies 2, gravelly-sandy diamicton. Facies 2 is a brown,gravelly-sandy to sandy-gravelly, massive and predominantlymatrix-supported diamicton (D(GS)mm). This facies isrestricted to the central and/or distal parts of all De Geer mor-aine sections, and pinches out and interfingers with facies5 sediments in the distal direction (Fig. 4). Facies 2 is thus
Table 1 Lithofacies codes (first-, second- and third-order code system)and their descriptions as used in this work (basic system according toEyles et al., 1983)
Lithofacies Lithofacies type description: grain size, graincode support system, internal structures
D(G/S/Si/C) Diamicton, gravelly, sandy, silty or clayey. One ormore grain-size code letters within brackets
D( )mm Diamicton, matrix-supported, massiveD( )ms Diamicton, matrix-supported, stratifiedCo– Cobbles, as belowD( )mm(ng) Diamicton, matrix-supported, massive, normally
gradedD( )mm(ig) Diamicton, matrix-supported, massive, inversely
gradedD( )mm (ing) Diamicton, matrix-supported, massive, inverse to
normally gradedGmm Gravel, matrix-supported, massiveGcm Gravel, clast-supported, massiveGc(ng) Gravel, clast-supported, normally gradedGc(ig) Gravel, clast-supported, inversely gradedSm Sand, massiveSm(ng) Sand, massive, normally gradedSm(ig) Sand, inversely gradedSpp Sand, planar parallel-laminatedSpc Sand, planar cross-laminatedStc Sand, trough cross-laminatedSr Sand, ripple-laminatedSl(def) Sand, laminated, deformedSim Silt, massiveSil Silt, laminated
118 JOURNAL OF QUATERNARY SCIENCE
Copyright � 2005 John Wiley & Sons, Ltd. J. Quaternary Sci., Vol. 20(2) 113–133 (2005)

predominantly connected to the distal slope of the De Geermoraine ridges.The diamicton is massive, but small-scale variations in sand/
gravel ratios are common, in both the lateral and the verticaldirection. Locally the diamicton grades into a nearly clast-supported state owing to very low matrix frequencies and thus
high concentrations of larger clasts. In Ljusa 2 the facies 2 dia-micton locally also grades into sorted coarse gravels with anopen framework. The cobble and boulder content of facies 2is slightly higher than that of facies 1, consisting of randomlydistributed, subrounded to subangular cobbles and boulders,with maximum sizes of 1–2m. In section Ljusa 1, the upper
Figure 4 Profiles showing discerned sediment facies (see text for explanation) from the four excavated De Geer moraines. Iceflow direction from leftto right. a. Section Ljusa 1 (N 65 � 58.1470; E 21 � 38.0390). The most geomorphologically distinct of the excavated moraines, 300m long, 30m widewith a crest-line height above adjacent troughs of 5.0m on its proximal side and 2.2m on its distal side. b. Section Ljusa 2 (N 65 � 58.5900; E 21 �
37.3680). This ridge is 300m long and 38m wide, and has a crest-line height above adjacent troughs of 3.2m on its proximal side and 2.0m on itsdistal side. Both trench walls were documented (4bi and 4bii). c. Section Rasmyran 1 (N 65 � 52.3940; E 21 � 31.7410). Geomorphologically a verydistinct ridge which with only short breaks can be followed for nearly 1.5 km. At the excavation site it is ca. 40m wide, and has a crest-line heightabove adjacent troughs of 3.4m on its proximal side and 2.4m on its distal side. d. Section Rasmyran 2 (N 65 � 52.4890; E 21 � 31.6710). This ridge, ca.250m long, is situated in a pronounced upslope position with respect to palaeo-iceflow direction. At the excavated site the ridge is 32m wide, butgives a very small geomorphological imprint, being just 0.8m high on its distal side and 2.7m high on the proximal side. The latter shows a step-likeprofile, enhanced with boulder concentrations continuing into surficial beach gravels
DE GEER MORAINES AND DYNAMICS OF GROUNDING-LINE RECESSION 119
Copyright � 2005 John Wiley & Sons, Ltd. J. Quaternary Sci., Vol. 20(2) 113–133 (2005)

distal part of the gravelly-sandy diamicton is gradually replacedby a more fine-grained, sandy diamicton in the distal direction.Bedding planes in the facies 2 diamicton are inferred from
contacts to interbeds of facies 1 diamicton and facies 3 and 5(sands and silts). These contacts are generally sharp, but locallygradational contacts are found. When not deformed, facies 2beds have low-angle dips in the distal direction from the ridgecrest-lines. As facies 2 occur in all section walls in a central todistal position it is concluded that this facies forms wedge-shaped sediment bodies distal to the ridge crest-lines.From visual examination it was obvious that facies 2 diamic-
ton has disturbed fabric orientations, for example due to fre-quent clast contacts, but especially caused by extensive post-depositional deformation of packages of facies 2 diamictonand facies 3 sorted sediments.
Facies 3, silt, sand and gravel. Facies 3 is an association ofsorted sediments occurring as intrabeds within facies 1 and facies3 diamictons. The facies is dominated by laminated to massivefine sand and silt, but also beds of usually massive (sometimesnormally graded) sand, gravelly sand and gravel are common.Out-sized clasts occur frequently, also in the silt and fine sandfacies; smaller clasts (1–2cm) are common and clasts up to15–30cm in diameter are not uncommon. Larger clasts in other-wise undeformed (see below) facies 3 silt and fine sand are some-times associated with basal/lateral small-scale deformationstructures. Occasionally very large clasts (60–120cm) withinfacies 3 sediments protrude upwards into overlying unit 1 dia-micton. These clasts should not be mistaken for those belongingto facies 1 diamicton, protruding down into facies 3 sedimentsand always associated with deformation structures.
Figure 5 Schmidt equal-area, lower-hemisphere projections of clast long-axis orientations from fabric analyses (30 clasts measured in each set) at thefour investigated sections (for positions within sections, see Fig. 4). Each scatterplot is accompanied by calculated largest eigenvector (V1) and normal-ised eigenvalues (S1 and S3) according to Mark (1973). Inferred iceflow directions (arrows) are shown on fabric sets showing a high fabric strengthvalue (S1). For fabric sets showing significant girdle orientations a best-fit plane through the plotted data is drawn as a great circle. Ridge axis orienta-tion is indicated in each plot
120 JOURNAL OF QUATERNARY SCIENCE
Copyright � 2005 John Wiley & Sons, Ltd. J. Quaternary Sci., Vol. 20(2) 113–133 (2005)
Facies 3 beds occur in all sections, both as thin (1–2 cm) soli-tary sets and as stacked, thicker (up to ca. 100 cm) cosets, andwhen not part of large-scale fold structures the beds are subhor-izontal to gently inclined in the proximal direction. Their lat-eral continuity is highly variable (0.5–20m) in differentsections, the most continuous one being the lowest facies 3bed in the Ljusa 1 section (Fig. 4a), starting well behind thecrest-line and continuing in the distal direction outside themorphological expression of the ridge. The lower contact offacies 3 beds is always sharp, whereas the upper contact some-times is gradational or welded to the overlying diamicton.Facies 3 sediments are more frequent as intrabeds within thefacies 1 sandy-silty diamicton than in the facies 2 diamicton,and often also form interbeds between facies 1 and 2 with drap-ing but sharp lower contacts.The beds occur both in their primary depositional position
with primary sedimentary structures preserved (Fig. 7), and asdeformed beds. Deformation structures are of different scales;some beds reveal intrabed folding and small-scale thrusting(one to a few centimetres) of internal lamination (Fig. 7d), withbeds more or less in their primary position, whereas somedeformations, as in the Ljusa 1 and 2 sections, are of a largerscale (decimetre to metre scale) involving both facies 3 sortedsediment beds and enclosing facies 1 diamicton. These larger-scale structures include: up-thrusts of laminated facies 3 beds,standing at steep angles on the lee-sides of larger boulders(Fig. 7a, c); folding (upright, inclined and overturned folds) ofsingle couplets or packages of facies 3 and 1 sediments (Fig. 4);more or less totally contorted facies 3 sediments (Fig. 7b) asso-ciated with intrusion of facies 1 diamicton and/or extrusions offacies 3 sediments into the diamicton. All large-scale folds andthrust structures within the section walls were mirrored at right-angles on the opposite section walls, suggesting fold axes par-allel or subparallel to the ridge.The Rasmyran 2 section differs from the other sections by
facies 3 sediments being not common (Fig. 4d). However, inthe distal part of this section a thick coset of facies 3 fine sand,sand and gravelly sand, located at the interface between facies1 and facies 2 diamicton, is involved in a lateral compression ofthe whole sequence with highly inclined facies 3 sedimentbedding (Fig. 8). The result of the compression is two large-
scale fold structures with the facies 3 sediments conformingto the fold configuration (Fig. 4d). Measurements on fold limbs(Fig. 8) give a mean fold axis trend of 61–241 �, which is nearlyparallel (deviation 22 �) to the crest-line trend of the ridge.
Facies 4, massive cobble gravel. Facies 4 constitutes a clast-supported, massive, cobble and boulder-rich, moderatelysorted gravel (maximum clast size 40–50 cm and with amost-common large clast size of 10–15 cm). These sedimentsform an onlapping bed, being 70 cm in its thickest observedpart on the proximal lower part of the Ljusa 1 ridge (Fig. 4a).Facies 4 sediments are also present at the same position inthe Rasmyran 1 section, but were not observed at Ljusa 2 orRasmyran 2. In the section wall opposite to the one documen-ted in Ljusa 1, three wedges of gravelly sand intrude downwardfrom the base of the facies 4 gravel (here 10–15 cm thick,Fig. 7e) into the underlying facies 1 diamicton (clastic dykes,cf. Dionne and Shilts, 1974). They are 50–120 cm wide at theirentrances into the diamicton, and up to 1.5m deep and down-ward-tapering. The infilling sediment, coloured by secondaryred-brown iron oxide precipitation which accentuates theboundaries with the enclosing diamicton, change graduallyin grain-size from coarse gravel to gravelly sand and eventuallyto massive medium sand in the thin, slightly up-curving, distalend of the dykes. One small clastic dyke is also present in thesection wall at Ljusa 1. It emanates from the facies 4 sedimentbeds and plunges steeply into the below-lying sandy silty dia-micton. When reaching a bed of fine sand and silt, it deflects indown-glacier direction and can be traced along this bed for ashort distance.
Interpretations, facies 1–4
Based on its sediment characteristics, facies 1 (the sandy-siltydiamicton) is interpreted as a deformation till (e.g. Benn andEvans, 1996). To achieve deforming bed conditions theinduced shear stresses must reach or exceed the internal yieldstrength of the subglacial sediment. This requires high pore-water pressure in the substrate in order to reduce the effectivestress, and concordantly the shear strength, enabling the bed tobecome mobile (Boulton, 1996). The massive structure impliesa high strain rate during deformation. However, a total homo-genisation of the deforming bed layers was not always reached,as indicated by the indistinct, small bodies of slightly morecoarse-grained diamicton, resembling boudinage structures.The repetitive inter/intrabedding of facies 1 till beds and facies3 sorted sediment beds implies that deforming bed condi-tions—and the ‘freezing’ of the bed movement—were fulfilledrepetitively, forming a superimposed succession of deformingbed units, i.e. what has been termed constructional subglacialglaciotectonic deformation by Hart and Boulton (1991). Thesedeforming layers were most probably thin, as expected in themarginal area of an ice sheet (e.g. Boulton and Hindmarsh,1987; Hart and Boulton, 1991). This is directly indicated fromtill bed thicknesses but also indirectly from till fabric data. Theunimodal and clustered clast axis orientations, all with highstrength values (S1¼ 0.70–0.89; Fig. 5), are considered as beingorientated parallel to the iceflow-induced stresses field, appliedduring deforming bed conditions. Such well-ordered orienta-tion is suggested to be indicative of thin deforming-bed zones(e.g. Hart, 1994; Benn, 1995; Hart and Rose, 2001) undergoingductile shear (Boulton and Hindmarsh, 1987; Benn and Evans,1996). The five girdle-orientated and the randomly orientatedfabric analyses are suggested to represent, with respect todeforming bed conditions, post-depositional reorientation
Figure 6 Fabric shape data—isotrophy index (I; I¼ S3/S1) and elonga-tion index (E; E¼ 1� S2/S1) plotted in a triangular diagram (Benn,1994). Most a-axis fabric eigenvalue data of facies 1 diamictonindicate low isotropy and very high elongation of clast long-axisorientations
DE GEER MORAINES AND DYNAMICS OF GROUNDING-LINE RECESSION 121
Copyright � 2005 John Wiley & Sons, Ltd. J. Quaternary Sci., Vol. 20(2) 113–133 (2005)

Figure 7 Sediment pictures and drawings containing mainly facies 1 and 3, and deformation structures. a/a0–b/b0. Deformed laminated sand and siltinterbedded in sandy-silty deformation till. Primary sedimentary structures are preserved although deformed by shearing, folding, rotation, andploughing. c/c0. Detailed picture and drawing of a rotated clast. The rotation by shearing is illustrated in ci–cii. d. Small-scale folding and faultingof primary sedimentary structures in the laminated sand and silt (facies 3). e. A conjugate shear fracture forming a clastic dyke into facies 1 diamicton,filled with gravel and sand (emanates from onlapping facies 4 sediments; photo from trench wall opposite to the Ljusa 1 section, Fig. 4a). Facies 5 fine-grained sediments with a large dropstone (boulder) are seen to onlap in top of the picture
122 JOURNAL OF QUATERNARY SCIENCE
Copyright � 2005 John Wiley & Sons, Ltd. J. Quaternary Sci., Vol. 20(2) 113–133 (2005)

Figure 8 a. Detailed drawing of a synclinal fold in the distal part of section Rasmyran 2 (for legend, see Fig. 4). b–c. Pictures of details (marked inFig. 8a). d. Plot of axial planes of folded beds within the section shown in Fig. 8a. e. Oblique photo of the distal part of section Ljusa 1 (Fig. 4a) withdebris flow and glaciolacustrine deposits of facies 2 and 5, respectively, deposited on top of facies 3 (basically following the white string). The distancebetween white boxes on the string is 1m. f. Close-up on facies 2 and 5 at mark 33m in the Ljusa 1 section (Fig. 4a)
DE GEER MORAINES AND DYNAMICS OF GROUNDING-LINE RECESSION 123
Copyright � 2005 John Wiley & Sons, Ltd. J. Quaternary Sci., Vol. 20(2) 113–133 (2005)

during large-scale folding of facies 1 and interbedded facies 3sediments. This is evident at the Rasmyran 2 section; the fourfabric analyses in this section (Fig. 5) are taken vertically aboveeach other at approximately mark 25m where facies 1 diamic-ton and overlying sediment form a compressional, open-foldstructure (Fig. 4d, between marks 25–35m, and Fig. 8). Thelowermost fabric analyses (Rasmyran 2:1 and 2:2) show a verystrong elongate fabric shape whereas the two upper analyses(Rasmyran 2:3 and 2:4), which are located in an anticlinal posi-tion within the diamicton, have lost most of their fabric strength.The primarily waterlain facies 3 sediments are intimately
related to facies 1 diamicton, one of the criteria making usinterpret them as subglacial canal-infill sediments. The three-dimensional canal configuration is not easy to reconstruct fromtwo-dimensional section walls. However, at places thicker andmore extensive sorted sediment beds were exposed in both sec-tion walls of the trenches, 2–4m apart. The sediments werethicker in one of the walls than in the other, indicating concavelower contacts transverse to flow direction. Some facies 3 bedsare short along the projections of the section walls, beingthicker in the middle and thinner towards both ends. All thissuggests systems of broad (one metre to a couple of metresscale) but shallow (decimetre scale) canals, cut down into theunderlying diamicton (facies 1), resembling the subglacialbraided canal networks described by Walder and Fowler(1994) and Clark and Walder (1994). The existence of this sub-glacial fluvial distributary system shows that the basal melt-rateof the ice sheet, and thus the production of meltwater, washigher than could be drained by means of bulk movement ofwater within the deforming sediments (Clarke, 1987) and bydarcian flow of the water through the pore spaces of the subgla-cial diamicton (Boulton and Jones, 1979; Boulton et al., 1994),which due to its fine-grained composition has a low hydraulicconductivity. As indicated from the inter/intrabedding of facies3 sorted sediments and facies 1 diamicton throughout thewhole vertical sequence of a De Geer moraine, the canal drai-nage system followed the due to sediment accretion rising ice/bed interface, although migrating in time and space.The sediment source for facies 3 might be threefold: erosion
by meltwater at the ice–till interface, creep of diamict sedi-ments from the contemporaneously deforming-bed systemfrom outside into the canals when these were formed (cf.Walder and Fowler, 1994), and/or melt-out of debris from thecanal roof. The coarser beds of facies 3 (gravelly sand andgravel) could represent residual deposits from all three typesof sediment input. However, the predominating facies statesare interbedded silt and fine sand, most likely deposited fromsuspension load at low to moderate, but fluctuating, streamvelocities. Higher-velocity stream pulses are indicated by wan-ing flow, normally graded sand beds, but traction-load bed-forms were nowhere observed. The out-sized gravel andlarger clasts, embedded within the fine-grained sediments,must be derived from the canal roof and deposited as drop-stones (Thomas and Connell, 1985). The larger ones often showdeformational load structures at their lower contacts but undis-turbed onlap bedding of above-lying sediments.The post-depositional deformation structures of different
scales are characteristic for facies 3 sediments. When unde-formed the contact to above-lying diamicton is sharp, indicat-ing the development of a decollement surface at canal closure,while the small-scale deformation structures usually are con-nected to a gradational or folded upper contact to the diamic-ton (Fig. 7d), implying a stress transfer down into the facies 3sediments beneath the reappeared deforming bed zone. How-ever, as indicated from predominantly preserved primary bed-ding the cumulative strain induced into the facies 3 sedimentswere never large enough to cause a penetrative ductile defor-
mation and can in this state be classified as a glacitectonitewith just mildly distorted primary structures (Benn and Evans,1996, 1998). Post-depositional deformation is also commonlyoccurring in connection with boulders. One type is associatedwith rotation of boulders, primarily deposited within facies 3sediments but larger than bed thickness, thus protruding abovethe upper sediment contact after canal closure and thereforeexposed to deforming bed conditions (Fig. 7c). The other typeof deformation is connected to boulders in the deforming bedthat were ploughed during deposition into facies 3 sediments.Facies 2 diamicton is interpreted as reworked facies 1 defor-
mation till, a rework leading to loss of the fine-grained consti-tuents (ca. 75% of sediment <0.063mm) and a transformationinto a predominantly gravelly-sandy diamicton with increasedclast concentrations. The interfingering contacts to facies 1 dia-micton along the ridge crest-line suggest deposition at the mar-ginal zone of a deforming bed during processes promotingwinnowing out of fines from the parent diamicton. One processacting in this way would be reworking and subsequent removalof fines by subglacial meltwater that, in the frontal position,changed from a channelised system into a sheet-like drainage,possibly due to a slight buoyancy lift of the ice at and distal tothe moraine ridge crest-line. At places this sorting process isinterpreted to have been intense enough to change the parentmaterial to clast-supported gravels, lying as diffuse bodieswithin the sandy-gravelly diamicton. In places where rework-ing was not complete, the preservation of sandy-silty lenses ofdiamicton enclosed within proximally situated gravelly-sandydiamicton was enabled.The distal slope of ridge deposits is likely to have been
unstable, directly owing to sediment failure and/or indirectlyowing to ice push; the response in either case would be initia-tion of non-cohesive hyperconcentrated to concentrated den-sity flows (Mulder and Alexander, 2001), as indicated by thedistally inclined and out-pinching facies 2 beds, interbeddedwith facies 5 laminated sand and silt (for example, as in sec-tions Ljusa 1 (Fig. 8e, f) and Rasmyran 1, of glaciolacustrine ori-gin. The delivery of deforming bed diamicton (facies 1) at theice margin would also result in gravity-driven density flows intothe proglacial environment (cf. Lønne, 1995) once the ridge hasstarted to build up. Erosive lower contacts of facies 2 beds intounderlying facies 5 further support the density flow interpreta-tion (Fig. 8f). The erosive nature of subaqueous density flowsdue to imposed shear stresses at their basal interface have beendescribed both from modern environments and from ancientsediments (e.g. Eyles et al., 1987; Prior and Bornhold, 1989;Lønne, 1993, 1995). Sorting processes with winnowing-outof fines should also be active during these flow stages; grain-to-grain interaction in the lower part and possibly turbid flowin the upper part of flow packages (Middleton, 1972; Postmaet al., 1988) will expel fine sands and silts into suspension(Lowe, 1982; Nemec et al., 1984), later deposited as, for exam-ple, normally graded sand beds, here represented as facies 5.The massive structure of the facies 2 beds, the disorganised dis-tribution of floating large clasts, and the absence of normal orinverse grading indicate a very low ‘maturity’ of these densityflows, probably reflecting the short transport distance acrossthe distal slope of the moraine ridge.The deformation and folding of facies 2 sediments and inter-
bedded facies 1 and 3 is most prominent in the central part, i.e.near the ridge crest-lines. Some of the deformation could be theresult of loading due to rapid sediment deposition, although itis more likely that ice-induced stress is the main process asthere is an increase of deformation towards the ice-proximalparts. Furthermore, the proximally predominant sandy-siltydiamicton of facies 1, with silt and clay content up to 30%, ismore likely to deform than distally laid facies 2.
124 JOURNAL OF QUATERNARY SCIENCE
Copyright � 2005 John Wiley & Sons, Ltd. J. Quaternary Sci., Vol. 20(2) 113–133 (2005)

On the proximal slope of the Ljusa 1 ridge, the onlappingfacies 4 coarse-grained sediments imply traction bed-loadand deposition at high flow velocities. Bed configurations inboth section walls suggest a channelised flow with down-cutting into facies 1 diamicton. The wedge-shaped injections(Fig. 7e), emanating from this bed and forming clastic dykes,are found in the section wall with thin facies 4 sediments andare therefore situated closer to the lateral margin of the chan-nel. This indicates that the fractures originate from glacialshearing and loading outside the channel, and that the fracturespropagated into the substrate of the channel. The fractures areinterpreted as conjugate shear fractures, suggested to representbrittle failure as a result of both the shear stress and the loadapplied by the ice, the shear stress component furtherenhanced by the up-glacier dip of the proximal ridge slope(Klint, 2001). Furthermore, the upward widening of the wedgestructures is probably a response to upward-increasing inducedshear stress (Fig. 7e). Owing to the lateral contact with thefacies 4 sediment channel, sorted sediments were gradually fill-ing the widening fractures, being syndepositional with thechannel infill.
Facies 5: fine sand, silt and clay, interfingering with oronlapping ridge-forming sediments
Facies description. The sediments grouped into facies 5 wereobserved both in the proximal and distal parts of the Ljusa 1section (Fig. 4). In Rasmyran 1 they were present just in the dis-tal part of the section, whereas they were absent in all othersections. The lateral relationships to the ridge-forming facies1–4 sediments are totally different with respect to location;facies 5 sediments onlap, and wedge out on the proximal sideof the moraines, whereas they pinch out towards and interfin-ger with ridge-forming facies 2 sediments on the distal side(Figs. 8e and 8f). Unfortunately none of the trenches were longenough in proximal and distal directions to document theserelations to be occurring everywhere.On the proximal side of the Ljusa 1 ridge the facies 5
sediments form a fining upward sequence (maximum recordedthickness in section 50 cm), starting with laminated silt andfine sand with a sharp basal contact to underlying facies 4sediments (Fig. 7e). They continue upwards into interlami-nated silt and clay and eventually into massive silty clay,draped by facies 7 sands. Out-sized clasts occur, usually ingravel grades, but also some cobbles, 10–15 cm in diameter.In the opposite section wall at Ljusa 1 a boulder, ca. 1m in dia-meter, was embedded in the sediments (Fig. 7e). The largerclasts are usually associated with deformation structures inthe enclosing sediments as basal contact bending and small-scale folding.In the distal parts of the sections Ljusa 1 and Rasmyran 1,
facies 5 appears as thin beds (1–5 cm) or bedsets (up to40 cm) of laminated to massive, sometimes normally graded,medium sand to silt. These beds are interbedded with facies2 diamicton beds and, as the latter pinch out in the distal direc-tion, the former grow gradually thicker with decreasing dipangles. The lower contacts to interbedded facies 2 are draping,whereas the upper contacts at places are slightly erosive.Small-scale deformation of primary sedimentary structures,and also of whole beds, are seen in conjunction with out-sizedclasts, but also at a few places as overturned folds beneathoverlying facies 2 diamicton.
Facies interpretation. Facies 5 represents deposition in theglaciolacustrine environment that gradually inundated the area
during ice-margin retreat. Water depth at deglaciation of theexcavated sites was 100–180m. The interlaminated fine sand,silt and clay beds suggest that the primary process of depositionwas suspension settling. As indicated from the interbeddingwith and close association to ridge-forming facies 2 diamicton,it is suggested that deposition was from low-density turbiditycurrents (cf. Lowe, 1982; Mulder and Alexander, 2001) thatemanated close to the ice margin. Sediment sources for thesedensity underflows were probably both the debouching subgla-cial drainage canals (containing facies 3) and the facies 2 con-centrated to hyperconcentrated density flows at the moraine-ridge fronts, giving rise to secondary density flows duringexpelling and winnowing of fines (see above).The distal-front exposures at Ljusa 1 and Rasmyran 1 show
the ‘active’ interrelation between ridgeforming and non-ridge-forming sediment facies, whereas the facies 5 sediment succes-sion at the proximal side of the Ljusa 1 ridge gives an exampleof the ‘passive’ relation. Here the sharp and onlapping contactto underlying facies 2 diamicton testifies to an abrupt change indepositional environment and the upward-fining sequenceindicates increasing distance to the retreating ice margin. It issuggested that this abrupt shift in sedimentation is the result of aquick break-up of a grounding-line margin due to iceberg cal-ving. Out-sized clasts within facies 5 sediment indicate sedi-ment delivery also by ice rafting, though some of theembedded clasts in the ridge-frontal sediments could possiblybe outrunners from gravity-induced processes.
Facies 6, surficial coarse-grained diamicton
Facies description. Facies 6 is predominantly acoarse-grained diamicton, appearing in the uppermost partof all sections, but most prominently seen in sections Ljusa2:1 and Rasmyran 2 (Fig. 4). The bulldozing and destroyingeffect of the excavator disturbed and removed some of thefacies 6 sediments, which explains their absence in some ofthe drawn sections. In general, facies 6 constitutes the groundsurface of the moraine ridges and extends down to depths of20–60 cm, with a diffuse contact to underlying facies 1 or 2diamictons. The texture varies between sandy-gravelly dia-micton to poorly sorted sandy gravel, always with a high con-tent of large clasts. The concentration of boulders, embeddedin or lying on top of the diamicton, changes laterally along thesections and is substantially higher at crests and on distalslopes.
Facies interpretation. Facies 6 is interpreted as a product ofwave-reworking of the diamict sediments of facies 1 and 2.During a late stage of the glacial isostasy-driven regression,i.e. when moraine ridges were in a position between the wavebase and the contemporary shoreline, they were exposed tosignificant reworking and redistribution of surface sedimentsand extraction of fines. Because of their position within themore large-scale topography, some ridge areas were moreexposed to wave action than others. As shoreline regressionwas east-directed due to general slope of the terrain, the distalslopes of De Geer moraines were the ones that usually wereexposed to the largest waves and storm fetch. This is indicatedby a general trend for these slopes, together with ridge crest-lines, to have higher boulder concentrations. The fine grainswinnowed out by the waves were probably driven into suspen-sion and brought further offshore, finally deposited as post-glacial silt and clay in low-energy environments, whereas sandand gravel fractions were deposited as facies 7 beach depositsin favourable positions (see below).
DE GEER MORAINES AND DYNAMICS OF GROUNDING-LINE RECESSION 125
Copyright � 2005 John Wiley & Sons, Ltd. J. Quaternary Sci., Vol. 20(2) 113–133 (2005)

Facies 7, surficial sand and gravel
Facies description. Facies 7 constitutes massive and planarparallel-laminated beds of medium sand to fine gravel. Itoccurs in all trenches, but is restricted to the lowermost, flat-tened-out slopes on both the proximal and distal sides of themoraine ridges and is therefore usually outside the documen-ted parts of the sections. When lower contacts to facies 2 or5 sediments could be observed, they were found to be sharpbut not erosive (no lag deposits). The facies 7 successions areusually thicker (up to 1m) and more well-developed on theproximal sides of the ridges, and could often be traced intothe basinal troughs between adjacent moraine ridges. This isespecially prominent along and between the Rasmyran ridges,lying in a more elevated and exposed position than the Ljusaridges.
Facies interpretation. Facies 7 is interpreted as beach depos-its, composed of sediments removed from areas exposed towave action. The source for facies 7 is thus all sediment sur-faces containing these grain sizes, predominantly the moraineridges themselves, but also adjacent till-covered hillsides anddraping glaciolacustrine deposits. This means that depositionof facies 7 is synchronous with wave erosion at formation offacies 6.The more frequent appearance and thicker accumulation of
beach deposits on the proximal side of De Geer moraine ridgesis probably due to a sheltering, lee-side effect provided by themoraine ridge, the inverted circumstances related to formationof facies 6. The more exposed distal side favoured erosion bywave action and partly prevented deposition of thicker facies 7sequences; beach sediments were instead deposited on the leeside of the ridge. This phenomenon is evident from geologicalmaps showing preferential deposition of beach deposits onNW-, SW- and NE-oriented slopes, slopes that were leastaffected by the general wave fetch from the southeast.
A depositional model for De Geermoraine formation
The model
Ridge-forming facies and their architectural relationships, andalso their relations to ridge-distal facies, all indicate that DeGeer moraines in the Boden area were formed along groundinglines associated with glacier retreat in a subaqueous environ-ment. Thus they form ramp-like moraine ridges that are mem-bers of the morainal bank concept as proposed by, for example,Powell and Domack (1995). Furthermore, the De Geer mor-aine formation is associated with deforming bed transport ofsediments to, and deposition at, the grounding line. Figure 9proposes a four-stage sequential depositional model, in whichdifferent environments and processes are closely related toeach other in time and space. Processes and products, and theirrelation to the grounding line, are listed in more detail inTable 2, presenting all processes thought to operate duringridge build-up, both erosional and depositional, and their asso-ciated products in a proximal–distal approach.
Stage 1. A subglacial deforming bed system, coupled to asuperimposed migrating braided canal network (Fig. 9A) existsfor some distance behind the retreating grounding line. Defor-mation till with highly developed clast orientation is depositedas a subglacial floor for the subsequently deposited De Geermoraines.
Stage 2. Up-glacier relocation of the grounding line is pri-marily due to ice-marginal calving. The subglacial system thenbecomes submarginal in relation to the grounding line and thedeforming bed transport system changes to a predominantlydepositional system (Fig. 9B) with constructional glaciotec-tonic deformation (Hart and Boulton, 1991), generating a localthickening of the subglacial bed, i.e. the initiation of De Geermoraine formation. The change into a predominantly deposi-tional system is suggested to be a result of diminishing stresstransfer from the ice into the substrate in the grounding-linedirection; the deforming bed loses competence, ‘freezing’ thetransport system and depositing the sandy-silty deformation tillsimultaneously with the glaciofluvial canal infill. The areaimmediately outside the grounding line is a glaciolacustrineenvironment, dominated by sediment gravity flows down theevolving distal slope of the moraine, suspension settling fromunderflows and deposition of melt-out debris from the ice-cliffand from icebergs (IRD). The sediments deposited in the pro-ridge glaciolacustrine system derive from direct deliveranceby the deforming bed conveyor-belt and from debouchingbraided canal networks, and indirectly by redeposition due tosediment failure.
Stage 3. With a temporary stable grounding line, sedimentsare brought continuously from the subglacial environment tothe submarginal–marginal zone where sediments are succes-sively stacked, either as deformation till units on the proximalslope or as suspension settling and sediment gravity flow unitson the distal slope (Fig. 9C). This results in a continuous verti-cal, but also proximal and distal build-up of a ramp-like mor-aine with a pronounced interfingering architecture of thediscerned sedimentary units (facies 1–3) in the distal direction.Syn- and post-depositional deformation, seen as folding of bedsor bedsets and plough deformation in association with largeboulders, is abundant, predominantly in the proximal directionfrom ridge axes, representing varying stress-transfer penetrationdepths into sub-sole sediments.
Stage 4. After a new calving event and further up-glacierrelocation of the grounding line, the former submarginal–marginal environment changes into an entirely glaciolacustrineone, dominated by suspension settling of fine-grained sedimentfrom density underflows originating from the nearby newgrounding line, incorporating varying amounts of ice-rafteddebris. Contrary to the interfingering architecture of glaciola-custrine and moraine ridge sediments within the distal slopeof the moraine, glaciolacustrine sediments now form an onlap-ping fining-upward succession of laminated sand and silt tomassive silty clay in the proximal direction from ridge crest-linewhen depositional space is created due to calving-induced ‘icelift-off’. The fining-upward succession within the glaciolacus-trine sediments indicates gradually increasing distance to theice margin due to further grounding-line retreat.
Model comparisons
DeGeer moraine sections in Norway, described by Larsen et al.(1991) and Blake (2000) reveal the same pattern of stackedsequences of diamicton and sorted sediment, all associatedwith syn- and post-depositional deformation and formation ofmoraines at grounding-line positions as described here fromthe Boden area. However, Larsen et al. (1991) stress ice-mar-ginal push as the main process responsible for ridge formationand argues that the distribution pattern of the ridges supports amore or less annual formation at winter advances of the ice
126 JOURNAL OF QUATERNARY SCIENCE
Copyright � 2005 John Wiley & Sons, Ltd. J. Quaternary Sci., Vol. 20(2) 113–133 (2005)

margin. Formation of De Geer moraines at winter grounding-line advance is also proposed by Sollid and Carlsson (1984),based on ridge sedimentology much resembling that from theBoden area. However, these ridges lack evidence of glaciotec-tonic disturbances. Contrary to Larsen et al. (1991), Blake(2000) dismisses De Geer moraines as a chronological tool;each diamict bed with associated deformational structures inthe stacked sequence of ridge sediments are taken as evidencefor advance–retreat cycles of the grounding line over each par-ticular De Geer moraine, the moraines therefore being poten-tially multi-annual. However, an alternative is suggested; thestacked sequence could also represent deposition during alter-nating settling and lifting off of the ice-front during one summer(Blake, 2000). The sedimentological data from the abovemen-tioned investigations are all congruent with those fromDeGeermoraines in the Boden area and fit well within the proposedmodel, even though this model suggests deposition at tempor-ary halts in the grounding-line retreat during the melt season.This will be further elucidated below in connection with dis-cussions on grounding-line dynamics.A large number of papers propose formation of De Geer mor-
aines due to squeeze of water-saturated till into submarginaltransverse crevasses (e.g. Elson, 1957; Hoppe, 1957, 1959;
Andrews, 1963a, 1963b; Stromberg, 1965; Andrews andSmithson, 1966; Zilliacus, 1985, 1987, 1989; Lundqvist,1989, 2000). However, none of these studies presents any sedi-mentological evidence for the proposed process. The onlyinvestigations on De Geer moraines that suggest depositionwithin submarginal crevasses and that are based on thoroughsedimentological analysis are those of Beaudry and Prichonnet(1991, 1995). However, their model is not one of squeeze of tillinto crevasses. They suggest transport of diamict and sortedsediment to the proximal entrance of transverse crevasses, fol-lowed by deposition of down-glacier-inclined strata that showglaciotectonic structures as thrust faults and overturned torecumbent folds with up-glacier inclined planes. Firm diamictsare also preferentially deposited on the proximal side of theridges. The described facies variability and sediment architec-ture from Beaudry and Prichonnet (1991, 1995) correspondwell to those described for De Geer moraines in the Boden areaand suggest that a grounding-line interpretation is equally ade-quate, especially as the sediments described do not reveal anyevidence of confinement in the distal direction.Independently of weak sedimentological evidence for sub-
glacial crevasse infill in various ways, the weakest point in thecrevasse concept seems to be the existence of the subglacial
Table 2 Grounding-line processes in De Geer moraine formation (partly based on Hunter et al., 1996)
Process Description Contribution to sediment bodies and properties withinand adjacent to grounding-line ridge
Subglacial
Deforming bed Down-glacier transfer of soft sediments belowthe glacier sole.
Repetitive deposition/stacking of deforming beddiamict units (facies 1) on proximal side of moraine.
Glaciofluvial transport/deposition Braided canal networks beneath glaciersole with reworking and transport of sediments.
Canal infill of residual sediments and deposition ofsediments from bedload and suspension transport(facies 3) in proximal and mid-ridge position.
Subglacial melt-out Sediment release at the glacier sole. Adds sediment to the transport/depositional system offacies 1 and 3; single larger clasts as ‘dropstones’ infacies 3.
Syn/post-depositional deformation Stress transfer into sediments belowglacier sole.
Non-penetrative deformation of facies 3 sediments,folding and thrusting of beds and bedsets of facies 1and 3, boulder rotation and ploughing.
Ice marginal
Mass movement Sediment gravity flows at and distal to thegrounding line, originating from direct deliveryof deforming bed diamicton or indirectlydue to sediment failure.
Repetitive vertical stacking of distally inclined diamictbeds (facies 2) on distal side of the moraine. Duringflow stage a more or less pronounced winnowing-outof fines, forming a more coarse-grained diamict.
Ice-cliff melt-out Surface melting in the ice cliff. Release of debris, of which the coarser constituents aredeposited along and distal to ridge axis and incorpo-rated into facies 2 diamictons and ice-marginal unitsof facies 3 and 5 sorted sediments.
Calve dumping Dumping of supraglacial debris duringcalving events.
Same as above.
Glaciofluvial bedload deposition Canal mouths of the subglacial drainagenetwork at grounding line.
Coarse-grained sediments debouch and spread out atthe grounding line; build facies 3 beds interbeddedwithfacies 2 diamicton.
Glaciofluvial erosion Canal mouths of the subglacial drainagenetwork at grounding line.
Erosion and winnowing of fines from facies 2 diamictonbeds along ridge front.
Pro-marginal
Density-flow settling Suspended fine sediments in low-densityturbidity currents in front of the groundingline.
Suspension settling, forming the glaciolacustrine faciesassociation 5 sediments. Interbeds with facies 2 diamic-tons in distal part of the moraine ridge.
Iceberg rafting Transport of debris in the distal directionfrom grounding line.
Do not contribute to ridge build-up; give out-sizedclasts in distal facies 5 glaciolacustrine sediments.
Ice ‘lift-off’ Ice-berg calving events. Do not contribute to ridge build-up; creates deposi-tional space in proximal direction from the formergrounding, thus initiating deposition of onlappingfacies 5 glaciolacustrine sediments.
DE GEER MORAINES AND DYNAMICS OF GROUNDING-LINE RECESSION 127
Copyright � 2005 John Wiley & Sons, Ltd. J. Quaternary Sci., Vol. 20(2) 113–133 (2005)

crevasses themselves. Blake (2000) gives a good review of theirnon-probability of existence and thus there is no need for repe-tition here. However, it must be noted that the crevasse patternsthat Beaudry and Prichonnet (1991, 1995) take as analogues fortheir formation model, described from Antarctica by Jezek et al.(1979) and Jezek and Bentley (1983), are formed at, and distal
to, the grounding-line of an ice shelf or at ice rises beneaththe Ross Ice Shelf and are not proved to exist in the proximaldirection from a grounding line.Another possibility touched upon by De Geer (1940) for for-
mation of subglacial crevasse systems is seismic activity in con-nection with isostatic rebound during the deglaciation. This
Figure 9 Depositional model of DeGeermoraine formation. Stages A–C in the figure are related to stages 1–3 in the depositional-model text, respectively(for legend, see Fig. 4), whereas stage 4 in the text correspond to the onlapping glaciolacustrine sedimentation occurring distally of stages A–C in the figure
128 JOURNAL OF QUATERNARY SCIENCE
Copyright � 2005 John Wiley & Sons, Ltd. J. Quaternary Sci., Vol. 20(2) 113–133 (2005)

was further elucidated by Lundqvist (2000), arguing that thespatial distribution of De Geer moraines in Fennoscandia cor-responds to known areas with high palaeoseismic activity.However, as it has not been proved by sedimentological evi-dence that De Geer moraines consist of crevasse-infill tills, asmost existing sedimentological data point towards formation atretreating grounding lines and as seismicity-induced crevassepattern cannot explain the topography-dependent spatial distri-bution and undulating configuration of De Geer moraine tracts,it must be ruled out that palaeoseismic activity has anything todo with De Geer moraine formation sensu stricto, other thanpossibly triggering major calving events.
Implications on ice sheet retreat and groundingline dynamics—a discussion
The large-scale picture
The final deglaciation of roughly one-quarter of the Scandina-vian ice sheet took place with an average recession rate of400myr�1, calculated along a flow line from Salpausselka inthe south, across the Gulf of Bothnia and to coastal northernSweden, a recession rate sustained for ca. 2000 years. Thedeglaciation along the abovementioned flow line took placeat ice-marginal water depths of 200–300m, first during a shortperiod of marine-brackish conditions (e.g. Bjorck, 1995), theYoldia phase of the Baltic basin, but mostly during freshwaterlacustrine conditions, the Ancylus Lake phase. Continuous for-mation of De Geer moraines at the retreating ice margin seemsnot to have been the case as these turn up in a patchy distribu-tion pattern over southwestern Finland (cf. Zilliacus, 1987). DeGeer moraines would be expected on the bottom of the Gulf ofBothnia as an extension of the abundant occurrences in theVasa district, Finland. This seems, however, not to be the caseaccording to seismic studies by Andren (1990). De Geer mor-aines in abundance turn up again on emerged—and emer-ging—coastal areas of northern Sweden along the Gulf ofBothnia. The distribution pattern of De Geer moraines there-fore indicates that favourable conditions for moraine ridge for-mation were not always present during ice-margin retreat.The abovementioned retreat rate as such is not exceptional,
as much higher ones have been reported from modern settingsin water-terminating glaciers (e.g. Warren, 1992; van der Veen,1996). However, most monitoring is on topography-bound out-let glaciers and the monitored time is short, so possibly there isno reliable, modern analogy to the fast and spatially extensivedown-wasting of the southeastern flank of the Scandinavian IceSheet. Calving along a grounded ice cliff is regarded as the pre-dominating ablation process of water-terminating glaciers. Esti-mates from Greenland (Reeh, 1994) and Antarctica (Jacobset al., 1992) suggest that calving accounts for about 56% and77% of the total mass loss, respectively. Surface, ice cliff andbasal melting thus seem to be of a second order of importance,though the large and frequently occurring beaded esker sys-tems north of the Swedish/Finnish Younger Dryas ice-marginalzone testifies the importance of extensive surface melting andwell-developed subglacial drainage systems during the finaldeglaciation. The calving rate is balanced by the ice fluxtowards the margin; if equal the margin would be in a stableposition. As this is not the case, as shown by the recession data,the calving rate must have been greater than the iceflux towards the margin, the latter determined by the iceflowvelocity.The calving processes at water-terminating glaciers—and
forces driving the process(es)—are not fully understood and
seem to be quite complex (e.g. Warren, 1992; van der Veen,1996). Based preferentially on studies of tidewater glaciers, itis commonly accepted that there is a strong linear relationbetween calving rate and water depth at grounded ice margins(Brown et al., 1982), but that the absolute values of calving ratein this relation is an order of magnitude smaller in a lacustrineenvironment, compared to a marine environment (Funk andRothlisberger, 1989). The higher calving rate for tidewater gla-ciers has been attributed to a number of physical differences,for example higher buoyancy in saltwater, a larger exposureto waves and storms, high tidal flexure and enhanced ice-cliffmelting in saltwater (Warren, 1992). If the linear relationbetween calving rate and water depth holds true this wouldmean that a glacier with constant ice flux along its marginwould calve back faster where it is situated in deep water, com-pared to areas where the grounded ice cliff is standing in shal-lower water. This process might be demonstrated by the factthat De Geer moraine distribution often suggests an undulatingconcave/convex ice-margin configuration, most clearly devel-oped as deep embayments around nearly all subaqueous eskersnorth of the Swedish Younger Dryas ice-marginal zone, inter-preted as calving bays with enhanced calving in the deepestpart of the bottom topography, which also is the location forthe eskers (Stromberg, 1981, 1989).This undulating ice-marginal configuration can also be seen
in Norrbotten, mirrored in the distribution pattern of De Geermoraines. In the flat coastal areas the De Geer moraines indi-cate a quite linear ice margin, whereas further towards thenorthwest with increasing relative relief of the landscape—and thus different water depths in front of the receding ice mar-gin—the configuration of De Geer moraines suggests more orless evident embayment within the major valleys and protrud-ing ice margins over high ground. Measurements over a num-ber of adjacent valleys in the Boden area show maximumindentations, calculated from a hypothetical linear ice margin,of 200–800m over 2–6 km ice-marginal length. These valleysexperienced maximum water depths of around 150–200m atdeglaciation. Taking the calving rate/water depth equation(Funk and Rothlisberger, 1989; Warren, 1992) for freshwaterat face value and excluding compensation for calving mass-loss by means of ice flux towards the margin, water twice asdeep in valleys than over the interfluves would create an undu-lation of the ice margin much larger than that indicated abovefrom the De Geer moraines. This undulation would alsoincrease exponentially in time due to a cumulative effect whichsuggests that the calving process—and rate—is strongly coun-terbalanced by iceflow towards the ice margin, and that the iceflux is higher in the valleys than over higher ground.The assumption that the annual mean calving rate has just a
simple linear relation to increase in water depth at the terminushas been challenged by van der Veen (1996), arguing that thiscalving law is based on circumstantial evidence. Instead it wassuggested that increasing calving rate and glacier retreat islinked to increasing glacier speed and the associated thinningof the glacier. Data from Columbia Glacier, Alaska (van derVeen, 1996), indicate that the terminus retreats if the ice thick-ness in excess of flotation becomes less than a critical value,which here seems to be in the order of 50m above flotationthickness for steady-state conditions. Thus calving ratebecomes a secondary parameter, determined by thinning rateat the glacier margin due to iceflow velocity and not primarilyby the water depth, and the focus is then changed to processesalong the glacier bed.Our sedimentological data and model of De Geer moraine
formation indicate advection of deforming bed sedimentstowards the grounded ice margin where a gradually thickeningwedge of till is deposited owing to decreasing effective stress,
DE GEER MORAINES AND DYNAMICS OF GROUNDING-LINE RECESSION 129
Copyright � 2005 John Wiley & Sons, Ltd. J. Quaternary Sci., Vol. 20(2) 113–133 (2005)

eventually being close to flotation pressures (i.e. zero effectivestress at the base of the glacier). The sedimentological evidenceof an existing deforming bed also suggests fast iceflow, promot-ing thinning of the ice and therefore enhancing calving pro-cesses according to the ideas suggested by van der Veen(1996). The existence of a wide infra-marginal zone withdeforming bed conditions is also supported by Kleman et al.(1997) who, on the basis of aerial photographic interpretationof glacial landforms, identified a wet-based deglacial fan overthe investigation area.Our ongoing studies on Niemisel moraines (Linden and
Moller, in preparation) also support the deforming bed con-cept; occasionally De Geer and Niemisel moraines occur inthe same areas, the former landforms always superimposedon the latter, which shows their relative age relation. Niemiselmoraine ridges are built up in their proximal part by thrust andfolded slabs of sorted sediments and by glacitectonites (deform-ing bed sediments; Benn and Evans, 1996), and the whole land-form is draped with a late-stage bed of deformation till,indicating a broad area with deforming bed conditions. Theoccurrence of Niemisel moraines in the lowest parts of the val-leys coincides with the distribution of the largest and most con-tinuous De Geer moraines; the latter are also found on higherground but become lower and more discontinuous if they con-tinue up valley sides and over interfluves, and become almostabsent at altitudes above 150ma.s.l., which corresponds towater depths of ca. 70 metres at deglaciation (Fig. 3a). Theserelations can be interpreted in terms of sediment flux and thusalso iceflow velocities. Valleys promote higher iceflow veloci-ties and thus higher sediment fluxes, giving rise to higher andmore continuous De Geer moraines at the grounded ice marginand infra-marginal draping of deforming bed till over pre-viously deposited Niemisel moraines, at the same time promot-ing a high calving rate and ice-margin embayment due toglacier thinning. High ground would experience the oppositerelations with a subglacial environment incompatible withNiemisel moraine formation and weak conditions for marginalDe Geer moraine formation, which more or less totally stops atwater depths less than ca. 70m, suggested to be due to insuffi-cient sediment flux.
Grounding-line dynamics
The original idea of De Geer (1889) was that annual subaquaticmoraines were formed during a winter advance of thegrounded ice margin, pushing up a ridge of available sedimentsin front of the glacier. If the next winter advance did not reachthe previous winter position the distance between two adjacentridges should mark the net retreat, i.e. summer retreat minuswinter advance of that year. However, this quite logicalhypothesis was not based on any field evidence, until morerecent work by, for example, Powell (1981) and Boulton(1986). From Aavatsmarkbreen, Spitsbergen, Boulton (1986)demonstrated how a winter advance in subaerial position, heremarked by a push-moraine formed from proglacial sand andgravel could be followed into its subaquatic continuation, heremarked by buckled and overthrust sea ice along the ice cliff.Sonar profiles on the sea bed in front of the glacier revealeda series of well-defined, up to 10m high, till ridges whichaccordingly were interpreted to be annually formed push-moraines of former winter advances. As the number of ridgesfitted perfectly to the monitored time slice—seven years witha calculated mean retreat rate of 40myr�1—there is a strongcase for these ridges being annual. Winter advance ofgrounded ice margins have been reported from a number of
modern settings (e.g. Powell, 1981; Boulton, 1986; van derVeen, 1996), which can be explained by an ice flux towardsthe margin during winter that is larger than the mass loss, pre-ferentially by calving. Winter calving is suppressed by, forexample, obstruction from frontal sea/lake ice, also reducingthermal and physical notch erosion at the water line (Kirkbrideand Warren, 1997), freezing of water in terminal crevasses(Boulton, 1986) and winter decrease of iceflow which in turnreduce crevasse-forming tensional stress (Warren et al., 1995).Our sedimentological data and model of De Geer moraine
formation do not support this annual winter-advance push-moraine formation. Instead, the De Geer moraines in theBoden area suggest active sediment deposition at temporary,quite short-lived, grounding-line positions during summerretreat, driven preferentially by calving processes. However,we think that both models can be neatly put together, indicat-ing the complexity of De Geer moraine formation at thegrounding line, instead of elaborating with basal crevasses toproduce moraines with no relative geochronological value(Beaudry and Prichonnet, 1995). In areas with favourable con-ditions for advection of deforming bed sediments (and glacio-fluvially transported sediments) to temporary grounding-linestillstands a varying number of ‘summer moraines’ are formedduring general ice-margin retreat. During winter, with a highlysuppressed calving rate, possibly reaching zero, the groundingline advances. Depending on the spacing between the pre-viously deposited summer moraines, a number of them areerased and possibly a terminal push-moraine of that winteradvance is formed, a ‘winter moraine’. This erasure of pre-viously deposited moraines has been demonstrated by Boulton(1986) from a modern fjord setting on Baffin Island, arcticCanada, where only 40 moraines from 60 to 100 years ofretreat of the glacier have survived owing to the slow meanretreat rate and the quite large and varying winter advances.A De Geer moraine formed primarily by marginal pushing
should be recognisable from its internal structures. None ofour studied sections reveal such structures, and we thereforesuggest that our trenches by mere chance were laid out onlyover summer moraines, which by their number should be thepredominating moraines in this area. However, winter mor-aines should be expected somewhere, integrated with summermoraines.
Calving dynamics
If grounding-line retreat was just due to a continuous calving,then there would be no time for wedge-like sediment build-upalong clearly defined lines, but just an indifferent sedimentdelivery at the grounding-line, not recognised as ridges. Ourmodel of De Geer moraine formation stresses the importanceof grounding-line activity and indicates that there must havebeen a stepwise marginal retreat, steps being in the order of150–200m, as indicated by the mean distance between ridges,but sometimes as short as 50m. On the other hand, in areasdevoid of moraine ridges—which is common within predomi-nating De Geer moraine tracts—the opposite would then bethe case, i.e. just gradual ice-margin retreat with insufficienttime for moraine ridge build-up within localised areas.The calving mechanism of water-terminating glaciers has
been described by, for example, Warren (1992), Warren et al.(1995), Kirkbride and Warren (1997) and Hughes (2002). Insummary, the processes can be categorised into slab and flakecalving above the waterline, and large-scale block calvingbelow the waterline (Fig. 10). The former include full-heightslab calving, emanating from cliff-parallel vertical surface
130 JOURNAL OF QUATERNARY SCIENCE
Copyright � 2005 John Wiley & Sons, Ltd. J. Quaternary Sci., Vol. 20(2) 113–133 (2005)

cracks, but also calving of smaller blocks of ice above notchesproduced by thermal erosion along the waterline. Both types ofcalving above or close to the waterline interact into formationof a submarine ledge (Hughes, 2002) which calves upwardswhen buoyancy stresses are large enough to produce a fracturethat can free the ice-block from the main ice cliff. According toHughes (2002), ice ledges theoretically calve along producedbottom crevasses when the width of the ledge approaches halfof the ice thickness below water. If correct, for common waterdepths at deglaciation in the Boden area this would produceicebergs 50–100m wide measured perpendicularly to the icecliff and thus also grounding-line recessional steps of the samemagnitude. The mechanisms described for ice-cliff retreatmatch our proposed model for DeGeer formation, even thoughthe relationship between water depth and ice ledge width atbreak-off seems to be larger than proposed by Hughes (2002)if ice ledge calving just happens in one step. The absence ofany tidewater effect at deglaciation of the Boden area and alsothe reduced buoyancy effect owing to freshwater and not salt-water in the Ancylus Lake can be parameters explaining asomewhat wider ice ledge before break-off in this kind of envir-onment. The process of ice-ledge formation gives time for ridgebuild-up at a temporarily stable subaqueous grounding line, atthe same time as the subaerial part of the ice cliff calves back,forming the submarine ledge. When the ledge eventuallybreaks off because of buoyancy forces, the grounding-line sedi-ment accretion comes to an abrupt halt, depositional space iscreated for onlapping lacustrine sediments in the proximaldirection from the previous grounding line and a new tempora-rily stable grounding line is established, starting the processagain.
Conclusions
* De Geer moraines form during temporary halts in ground-ing-line retreat of water-terminating ice sheet margins, pre-ferentially during the summer season, as a result ofsubglacial sediment advection to the ice margin.
* De Geer moraines most probably also form during winterreadvances of the ice margin as push moraines, though thisis not supported from our field studies.
* The proximal part of De Geer moraines is built up in a sub-marginal position as stacked sequences of deforming bed
diamictons intercalated with glaciofluvial canal-infill sedi-ments, all associated with both syn- and post-depositionaldeformation.
* The distal part of De Geer moraines is dominantly built upfrom the grounding line by prograding sediment gravity flowdeposits, distally interfingering with fine-grained sedimentsdeposited in the frontal glaciolacustrine environment.
* The rapid marginal recession rate (ca. 400myr�1) is sug-gested to be driven by rapid calving, in turn enhanced by fasticeflow and marginal thinning of the ice due to deformingbed conditions.
* The stepwise retreat of grounding lines, as indicated by thespatial distribution of De Geer moraine ridges, suggests sub-aqueous ice-ledge calving to a new grounding-line position,followed by regained sediment delivery and ridge build-up.
* The spatial distribution of De Geer moraines in Norrbotten,northern Sweden, suggest an average formation/preserva-tion of 2–3 ‘summer moraine’ ridges every year, possiblyintercalated with a push-ridge formed during winteradvance.
Acknowledgements This work was supported by the Geological Sur-vey of Sweden by a 3-year grant to Per Moller (contract no. 03-1145/2000). Kurt H. Kjær and Lena Adrielsson critically read the manuscriptand gave valuable suggestions for improvements. Kevin Gustavson andan anonymous reviewer forced us to strengthen our arguments. TheSCA (Svenska Cellulosa Aktiebolaget) gave us permission to exercise‘brutal geology’ when excavating De Geer moraines on their propertyin the Ljusa area and so did the Vestman family in Rasmyran. Our sin-cere thanks are forwarded to all of them.
References
Andren T. 1990. Till stratigraphy and ice recession in the Bothnian Bay.University of Stockholm. Department of Quaternary Research,Report 18; 59 pp.
Andrews JT. 1963a. Cross-valley moraines of the Rimrock and Isortoqvalleys, Baffin Island, N.W.T: a descriptive analysis. GeographicalBulletin 5: 49–77.
Andrews JT. 1963b. The cross-valley moraines on north-central BaffinIsland: a quantitative analysis. Geographical Bulletin 20: 82–129.
Andrews JT, Smithson BB. 1966. Till fabrics of the cross-valley mor-aines of north-central Baffin Island, Northwest Territories, Canada.Geological Society of America Bulletin 77: 271–290.
Beaudry LM, Prichonnet G. 1991. Late Glacial De Geer moraines withglaciofluvial sediment in the Chapais area, Quebec (Canada). Boreas20: 377–394.
Beaudry LM, Prichonnet G. 1995. Formation of De Geer morainesdeposited subglacially, central Quebec. Geographie Physique etQuaternaire 49: 337–361.
Benn DI. 1994. Fabric shape and the interpretation of sedimentaryfabric data. Journal of Sedimentary Research A64: 910–915.
Benn DI. 1995. Fabric signature of subglacial till deformation, Breida-merjokull, Iceland. Sedimentology 42: 735–747.
Benn DI, Evans JA. 1996. The interpretation and classification of subgla-cially-deformed materials. Quaternary Science Reviews 15: 23–52.
Benn DI, Evans JA. 1998. Glaciers and Glaciation. Arnold: London;734.
Bergstrom R. 1968. Stratigrafi och isrecession i sodra Vasterbotten.Swedish Geological Survey C, 634; 76 pp.
BeskowG. 1935. Praktiska och kvartargeologiska resultat av grusinven-teringen i Norrbotten. Geologiska Foreningens i Stockholm Forhan-dlingar 57: 120–123.
Bjorck S. 1995. A review of the history of the Baltic Sea, 13.0–8.0 kaBP.Quaternary International 27: 19–40.
Blake KP. 2000. Common origin for DeGeer moraines of variable com-position in Raudvassdalen, northern Norway. Journal of QuaternaryScience 15: 633–644.
Figure 10 Cartoon showing calving mechanisms above and belowthe waterline and formation of a subaqueous ice ledge (modified fromHughes, 2002). Position of deposition of De Geer moraines at the mar-gin in the figure is moved in proximal direction as the ice ledge calvesback
DE GEER MORAINES AND DYNAMICS OF GROUNDING-LINE RECESSION 131
Copyright � 2005 John Wiley & Sons, Ltd. J. Quaternary Sci., Vol. 20(2) 113–133 (2005)

Boulton GS. 1986. Push-moraines and glacier-contact fans in marineand terrestrial environments. Sedimentology 33: 677–698.
Boulton GS. 1996. Theory of glacial erosion, transport and depositionas a consequence of subglacial sediment deformation. Journal ofGlaciology 42: 43–62.
Boulton GS, Hindmarsh RCA. 1987. Sediment deformation beneathglaciers: rheology and sedimentological consequences. Journal ofGeophysical Research 92: 9059–9082.
Boulton GS, Jones AS. 1979. Stability of temperate ice caps and icesheets resting on beds of deformable sediments. Journal of Glaciol-ogy 24: 29–43.
Boulton GS, Slot T, Blessing G, Glasbergen P, Leijnse T, van Gijssel K.1994. Deep circulation of ground water in overpressured subglacialaquifers and its geological consequences. Quaternary ScienceReviews 12: 739–745.
Boulton GS, Dobbie KE, Zatsepin S. 2001a. Sediment deformationbeneath glaciers and its coupling to the subglacial hydraulic system.Quaternary International 86: 3–28.
Boulton GS, Dongelmans P, Punkari M, Broadgate M. 2001b. Palaeo-glaciology of an ice sheet through a glacial cycle: the European icesheet through the Weichselian. Quaternary Science Reviews 20:591–625.
Brown CS, Meier MF, Post A. 1982. Calving speed of Alaska tidewaterglaciers, with application to Columbia Glacier. U.S.G.S. ProfessionalPaper, 1258-C.
Clark PU, Walder JS. 1994. Subglacial drainage, eskers, and deformingbeds beneath the Laurentide and Eurasian ice sheets. GeologicalSociety of America Bulletin 106: 304–314.
Clarke GKC. 1987. Subglacial till: a physical framework for itsproperties and processes. Journal of Geophysical Research 92:9023–9036.
De Geer G. 1889. Andmoranerna i trakten mellan Spanga och Sundby-berg. Geologiska Foreningens i Stockholm Forhandlingar 11(126):395–396.
De Geer G. 1940. Geochronologia Suecica Principles. KungligaSvenska Vetenskapsakademiens Handlingar III:18:6; 367 pp.
Dionne JC, Shilts WW. 1974. A Pleistocene clastic dike, upper Chau-diere valley, Quebec. Canadian Journal of Earth Sciences 11: 1594–1605.
Donner J. 1995. The Quaternary History of Scandinavia. CambridgeUniversity Press: Cambridge; 200.
Elson JA. 1957. Origin of wash-board moraines. Geological Society ofAmerica Bulletin 68: 1721.
Eriksson L, Henkel H. 1994. Geophysics. In Geolog: National Atlasof Sweden, Freden C (ed.). Almqvist & Wiksell International:Stockholm; 208.
Eyles N, Eyles CH, Miall AD. 1983. Lithofacies types and vertical pro-file models: an alternative approach to the description and environ-mental interpretation of glacial diamict and diamictite sequences.Sedimentology 30: 393–410.
Eyles N, Clark BM, Clague JJ. 1987. Coarse-grained sediment-gravity flow facies in a large supraglacial lake. Sedimentology 34:193–216.
Fischer UH, Clarke GKC. 2001. Review of subglacial hydro-mechani-cal coupling: Trapridge Glacier, Yukon Territory, Canada. Quatern-ary International 86: 29–43.
Fromm E. 1965. Beskrivning av jordartskarta over Norrbottens lannedan lappmarksgransen. Swedish Geological Survey, Ca 39; 232pp.
Funk M, Rothlisberger H. 1989. Gletcher-Kalbungsgeschwindigkeit imSusswasser: eine Studie am Nordbogletcher im Johan Dahls Land,Sud-West Gronland. MitteilungVAW/ETHZ 20: 1–47.
Granas K. 1990. Jordartkarta 25L Boden NV. Swedish GeologicalSurvey, Ak 17.
Hart JK. 1994. Till fabric associated with deformable beds. Earth Sur-face Processes and Landforms 19: 15–32.
Hart JK, Boulton GS. 1991. The interrelation of glaciotectonic and gla-ciodepositional processes within the glacial environment. Quatern-ary Science Reviews 10: 335–350.
Hart J, Rose J. 2001. Approaches to the study of glacier bed deforma-tion. Quaternary International 86: 45–58.
Hattestrand C. 1997. The glacial geomorphology of central and north-ern Sweden. Swedish Geological Survey, Ca 85; 47 pp.
HoppeG. 1948. Isressessionen fran Norrbottens kustland.Geographica20: 1–112.
Hoppe G. 1952. Hummockymoraine regions, with special reference tothe interior of Norrbotten. Geografiska Annaler 33: 157–165.
Hoppe G. 1957. Problems of glacial geomorphology and the Ice Age.Geografiska Annaler 39: 1–18.
Hoppe G. 1959. Glacial morphology and inland ice recession in north-ern Sweden. Geografiska Annaler 41: 193–212.
Hughes T. 2002. Calving bays. Quaternary Science Reviews 21: 267–282.
Hunter LE, Powell RD, Lawson DE. 1996. Morainal-bank sedimentbudgets and their influence on the stability of tidewater terminiof valley glaciers entering Glacier Bay, Alaska, USA. Annals ofGlaciology 22: 211–216.
Jacobs SS, Helmer HH, Doake CSM, Jenkins A, Frolich RM. 1992.Melting of ice shelfs and the mass balance of Antarctica. Journal ofGlaciology 38: 375–387.
Jezek CK, Bentley C. 1983. Field studies of bottom crevasses in the RossIce Shelf, Antarctica. Journal of Glaciology 29: 118–126.
Jezek CK, Bentley C, Clough J. 1979. Electromagnetic sounding of bot-tom crevasses on the Ross Ice Shelf, Antarctica. Journal of Glaciology24: 321–330.
Kirkbride MP, Warren CR. 1997. Calving processes at a grounded icecliff. Annals of Glaciology 24: 116–121.
Kleman J. 1990. On the use of glacial striae for reconstruction of paleo-ice flow patterns—with application to the Scandinavian ice sheet.Geografiska Annaler 72A: 217–236.
Kleman J. 1992. The palimpsest glacial landscape in northernSweden—Late Weichselian deglaciation landforms and traces ofolder west-centred ice sheets. Geografiska Annaler 72A: 305–325.
Kleman J, Hattestrand C, Borgstrom I, Stroeven A. 1997. Fennoscan-dian palaeoglaciology reconstructed using a glacial inversion model.Journal of Glaciology 43: 283–299.
Klint KES. 2001. Fractures in glacigene diamict deposits: origin and dis-tribution. Danmarks og Gronlands Geologiske Undersokelse, Report2001/129; 360 pp.
Larsen E, Longva O, Follestad BA. 1991. Formation of De Geer mor-aines and implications for deglaciation dynamics. Journal of Qua-ternary Science 6: 263–277.
Lawson DE. 1982. Mobilization, movement and deposition of activesubaerial sediment flows, Matanuska Glacier, Alaska. Journal ofGeology 90: 279–300.
Lønne I. 1993. Physical signatures of ice advance in a Younger Dryasice-contact delta, Troms, northern Norway: implications for glacier-terminus history. Boreas 22: 59–70.
Lønne I. 1995. Sedimentary facies and depositional architecture of ice-contact glaciomarine systems. Sedimentary Geology 98: 13–43.
Lowe DR. 1982. Sediment gravity flows: II. Depositional models withspecial reference to the deposits of high-density turbidity currents.Journal of Sedimentary Petrology 52: 279–297.
Lundqvist J. 1981. Moraine morphology—terminal remarks and regio-nal aspects. Geografiska Annaler 63A: 127–137.
Lundqvist J. 1989. Late glacial ice lobes and glacial landforms in Scan-dinavia. In Genetic Classification of Glacigenic Deposits, GoldthwaitRP, Matsch CL (eds). A. A. Balkema: Rotterdam; 217–225.
Lundqvist J. 1992. Glacial stratigraphy in Sweden. Geological Surveyof Finland, Special Paper No. 15; 43–59.
Lundqvist J. 1994. The deglaciation. In Geology, National Atlas ofSweden, Freden C (ed.). Almqvist & Wiksell: Stockholm; 208.
Lundqvist J. 2000. Palaeoseismicity andDeGeerMoraines.QuaternaryInternational 68–71: 175–186.
Lundqvist J, Wohlfarth B. 2001. Timing and east–west correlation ofsouth Swedish ice marginal lines during the Late Weichselian. Qua-ternary Science Reviews 20: 1127–1148.
Mark DM. 1973. Analysis of axial orientation data, including till fab-rics. Geological Society of America Bulletin 84: 1369–1374.
Mawdsley JB. 1936. The wash-board moraines of the Opawica-Chibougamau Area Quebec. Transactions of the Royal Society ofCanada 3(30): 9–12.
Middleton MA. 1972. The role of subaqueous debris flows in generat-ing turbidity currents. Journal of Sedimentary Petrology 42: 775–793.
Moller H. 1962. Annuella och interannuella andmoraner. GeologiskaForeningens i Stockholm Forhandlingar 84: 134–143.
132 JOURNAL OF QUATERNARY SCIENCE
Copyright � 2005 John Wiley & Sons, Ltd. J. Quaternary Sci., Vol. 20(2) 113–133 (2005)

Mulder T, Alexander J. 2001. The physical character of subaqueoussedimentary density flows and their deposits. Sedimentology 48:269–299.
Nemec W, Steel RJ, Porebski SJ, Spinnangr X. 1984. Domba Conglom-erate, Devonian, Norway: process and lateral variability in a massflow-dominated, lacustrine fan-delta. In Sedimentology of Gravelsand Conglomerates, Koster EH, Steel RJ (eds). Canadian Society ofPetroleum Geologists, Memoir No. 10; 295–320.
Norman GWH. 1938. The last Pleistocene ice front in Chibougamaudistrict, Quebec. Transactions of the Royal Society of Canada3(32): 69–86.
Postma G, NemecW, Kleinspehn KL. 1988. Large floating clasts in tur-bidites: a mechanism for their emplacement. Sedimentary Geology58: 47–61.
Powell R. 1981. A model for sedimentation by tidewater glaciers.Annals of Geology 2: 129–135.
Powell R, Domack E. 1995. Modern glaciomarine environments.In Modern Glacial Environments—Processes, Dynamics andSediments, Vol. 1, Menzies J (ed.). Butterworth Heinemann: Oxford;445–486.
Prest VK. 1968. Nomenclature of moraines and ice-flow features asapplied to the map of Canada. Geological Survey of Canada, Papers67–57; 32 pp.
Prior DB, Bornhold BD. 1989. Submarine sedimentation on a develop-ing Holocene fan delta. Sedimentology 36: 1053–1076.
Reeh N. 1994. On the calving of ice from floating glaciers and iceshelfs. Journal of Glaciology 7: 215–232.
Rodhe L, Svedlund JO. 1990. Jordartkarta 25L Boden SV. Swedish Geo-logical Survey, Ak 14.
Siegert MJ, Dowdeswell JA. 2002. Late Weichselian iceberg, surfacemelting and sediment production from the last Eurasian Ice Sheet:results from numerical ice-sheet modelling. Marine Geology 188:109–127.
Sollid JK, Carlsson AB. 1984. De Geer moraines and eskers in Pasvik,North Norway. In Ten Years of Nordic Till Research, Konigsson LK(ed.). Striae 20: 55–61.
Stromberg B. 1965. Mapping and geochronological investigations insome moraine areas of south-central Sweden. Geografiska Annaler47A: 73–82.
Stromberg B. 1981. Calving bays, striae and moraines at Gysinge-Hedesunda, central Sweden. Geografiska Annaler 63A: 149–154.
Stromberg B. 1989. Late Weichselian deglaciation and clay varvechronology in east-central Sweden. Swedish Geological Survey, Ca73; 70 pp.
Svedlund JO. 1991. Jordartkarta 25L Boden NO. Swedish GeologicalSurvey, Ak 16.
Svedlund JO. 1992. Jordartkarta 25L Boden SO. Swedish GeologicalSurvey, Ak 23.
Svendsen JI, Astakhov VI, Bolshiyanov DYu, Demidov I, DowdeswellJA, Gataullin V, Hjort C, Hubberten HW, Larsen E, Mangerud J,Melles M, Moller P, Saarnisto M, Siegert MJ. 1999. Maximum extentof the Eurasian ice sheets in the Barents and Kara Sea region duringthe Weichselian. Boreas 28: 234–242.
Thomas GSP, Connell RJ. 1985. Iceberg drop, dump and groundingstructures from Pleistocene glacio-lacustrine sediments, Scotland.Journal of Sedimentary Petrology 55: 243–249.
van der Veen CJ. 1996. Tidewater calving. Journal of Glaciology 42:375–385.
Walder JS, Fowler A. 1994. Channelized subglacial drainage over adeformable bed. Journal of Glaciology 40: 199–200.
Warren CR. 1992. Iceberg calving and the glacioclimatic record. Pro-gress in Physical Geography 16: 253–282.
Warren CR, Glasser NF, Harrison S, Winchester V, Kerr AR, Rivera A.1995. Characteristics of tide-water calving at Glaciar San Rafael,Chile. Journal of Glaciology 41: 273–289.
Zilliacus H. 1985. On the moraine ridges east of Pohjankangas innorthern Satakunta, western Finland. Geologiska Foreningens iStockholm Forhandlingar 106: 335–345.
Zilliacus H. 1987. De Geer moraines in Finland and the annual mor-aine problem. Fennia 165: 147–239.
Zilliacus H. 1989. Genesis of De Geer moraines in Finland. Sedimen-tary Geology 62: 309–317.
DE GEER MORAINES AND DYNAMICS OF GROUNDING-LINE RECESSION 133
Copyright � 2005 John Wiley & Sons, Ltd. J. Quaternary Sci., Vol. 20(2) 113–133 (2005)


