Embed Size (px)
Citation preview
MARKET ENTRY STRATEGY FOR COMPETITIVE ADVANTAGE IN THE DIAGNOSTICS INDUSTRY
Lydia Taylor B.Sc., University of British Columbia, 1996 M.Sc., University of British Columbia, 1999
PROJECT SUBMITTED IN PARTIAL FULFILLMENT OF THE REQUIREMENTS FOR THE DEGREE OF
Master of Business Administration EMBA Program
in the Faculty
Business Administration
OLydia Taylor 2004 SIMON FRASER UNIVERSITY
August 2004
All rights reserved. This work may not be reproduced in whole or in part, by photocopy
or other means, without permission of the author.

APPROVAL
Name:
Degree:
Title of Project:
Lydia Taylor
Master of Business Administration
Market Entry Strategy for Competitive Advantage in the Diagnostics Industry
Supervisory Committee:
Dr. Ed Bukszar Senior Supervisor Faculty of Business Administration
Date Approved:
Dr. Jill Shepherd Associate Professor Faculty of Business Administration

Partial Copyright Licence
The author, whose copyright is declared on the title page of this work, has
granted to Simon Fraser University the right to lend this thesis, project or
extended essay to users of the Simon Fraser University Library, and to
make partial or single copies only for such users or in response to a
request from the library of any other university, or other educational
institution, on its own behalf or for one of its users.
The author has further agreed that permission for multiple copying of this
work for scholarly purposes may be granted by either the author or the
Dean of Graduate Studies.
It is understood that copying or publication of this work for financial gain
shall not be allowed without the author's written permission.
The original Partial Copyright Licence attesting to these terms, and signed
by this author, may be found in the original bound copy of this work,
retained in the Simon Fraser University Archive.
Bennett Library Simon Fraser University
Burnaby, BC, Canada

ABSTRACT
This paper examines optimal marketing and competitive strategies for a pre-revenue
stage medical device firm in the lung cancer diagnostics industry. The company under
consideration is focused on delivery of a new portfolio of products to improve diagnosis and
outcomes of lung cancer. All three of its product lines are scheduled to enter the market in the
second quarter of 2005.
The main body of this work is centred on analyses of the lung cancer diagnostics
industry and of the Company's current business plan to determine the key strategic issues facing
the firm presently and moving forward to market entry. Planning surrounding fundraising and
marketing emerge as areas of key concern. Recommendations surrounding these issues conclude
the work addressing concerns raised by potential investors and to anticipating the market's
response to the firm's pending market entry.
This industry is in need of new technology and the Company is well placed to meet this
need. Business success will hinge on the ability of the firm to raise capital, protect its
innovations, partner its operations, and deliver its portfolio of products to the consumer.

DEDICATION
I dedicate chis work to my husband, Juan, and my family. This work would not have been
possible without their immense love and support.
Thanks to Juan for believing in me and making my dreams possible - you are my home.
Thanks to my parents for giving me the tools - the brains and the brick.
Thanks to my sister, Beaner, for being my role model - smart, kind, and fun.

ACKNOWLEDGMENTS
I would like to thank my colleagues and co-workers. This work is as much theirs as it is
mine for I merely documented and put to words their brain-trust, knowledge and experience. I am
fortunate to work with such a bright group of people.
I would also like to thank my supervisors, Drs. Ed ~uksza; and Jill Shepherd, whose
knowledge and insight helped to guide me during this work.
TABLE OF CONTENTS
. . Approval ......................................................................................................................................... 11
... Abstract ......................................................................................................................................... 111
Dedication ...................................................................................................................................... iv
Acknowledgments .......................................................................................................................... v
Table of Contents .......................................................................................................................... vi
List of Tables ................................................................................................................................. xi ..
List of Figures ..............................................................................................................................xn
.................................................................. 1 Products. Markets and Overview of the Firm 1
.......................................................................................................... 1.1 Company Overview 1
.......................................................................................................... 1.2 Corporate Structure 1 ........................................... ...................................... 1.3 Cancer Problem .............................. 2
................................................................................................ 1.4 Cancer Care Management 3 ...................................................................................... 1.4.1 Current Cancer Detection 3
. . .................................................................................. 1.4.2 Current Cancer Localizatio rm 4 ............................................................................................. 1 A.2.1 Imaging Methods - 4
..................................................................................... 1.4.2.2 Endoscopic Procedures 4 1.4.3 Current Cancer Diagnosis ...................................................................................... 5
1.4.3.1 Pathology and Cytology .................................................................................... 5 1.5 Lung Cancer Problem ...................................................................................................... 5
............................................................................. 1.5.1 Current Lung Cancer Detection 6 ....................................................................... 1.5.2 Current Lung Cancer Localization 6
1.5.3 Current Lung Cancer Diagnosis ............................................................................ 7 ............................................................................................... 1.6 Comprehensive Approach 7
1.6.1 Key lessons from the BCCA and Cervical Cancer Screening ............................... 8 ................................ 1.7 Perceptronix's Role in Comprehensive Lung Cancer Management 8
1.8 Products .......................................................................................................................... 10 1.8.1 The ClearSignTM Test for Detection .................................................................... 10
....................................................................................... 1.8.1.1 How the Test Works 11 .................................................................................... 1.8.1.2 Time to Market Status 11
.................................................................. 1.8.2 Endoscopy Products for Localization 12 .... 1.8.2.1 clearvuTM - Fluorescence Bronchoscopy at the Speed of White LightTM 13
1.8.2.2 ClearVu ~ l i t e ~ ~ - Next Generation Bronchoscopy ........................................ 13 .................................................................................... 1.8.2.3 Time to Market Status 14
.................................................................... 1.8.3 Workstation Products for Diagnosis 15 1.8.3.1 ClearCyteTM - To Improve Cytology .............................................................. 15
............................................................. 1.8.3.2 ClearPathTM - To Improve Pathology 17 .................................................................................... 1.8.3.3 Time to Market Status 18
....................................................................................................... 1.9 Intellectual Property 18 1.9.1 ClearSignTM Test and Workstation Products ....................................................... 19 1.9.2 Endoscopy Products ............................................................................................. 19
1.10 Marketing ..................................................................................................................... 20 .............................................................................................. 1.10.1 Marketing Strategy 20
........................................................................................................ 1.10.2 Market Entry 22 ..................................................................................................... 1.10.3 Marketing Mix 23
........................................................ 1.11 Revenue streams. profitability. and market share 26 ............................................... 1.1 1.1 ClearSignTM Test Profitability and Market Share 27
........................................... 1.1 1.2 Endoscopy Products Profitability and Market Share 28 ......................................... 1.1 1.3 Workstation Products Profitability and Market Share 29
............................. ............................................. 1.1 1.4 Sales and Marketing Resources : 30 .................................................................................................................. 1.12 Competition 31
1.12.1 Competition for ClearSignTM Test ......................... ; ............................................. 32 ........................................................................................ 1.12.1.1 Direct Competitors 33
..................................................................... 1.12.1.2 Molecular Marker Companies 3 4 1.12.1.3 Automated Imaging Companies .................................................................... 36
.................................................................. 1.12.2 Competition for Endoscopy Products 36 1.12.3 Competition for Workstation Products ............................................................... 37
.................................................................................................. 1.12.3.1 ClearCyteTM 37 ................................................................................................... 1.12.3.2 ClearPathTM 37
.................................................................................................... I . 13 Chapter Conclusion 3 7 2 Industry Analysis ............................................................................................................... 38
......................................................................................... 2.1 Porter's Five Factor Analysis 39 ................................................................................................................. 2.1.1 Rivalry 41
............................................................. 2.1.1.1 (-) Competitive concentration is high 41 ................................................................................ 2.1.1.2 (-) Market growth is high 41
........................................................... 2.1.1.3 (+) Competition for healthcare dollars 41 ................................................................................. 2.1.1.4 (+) High switching costs 42
............................................................ 2.1.1.5 (+) Relatively homogeneous products 42 ............................... 2.1.1.6 (+) Robust product pipelines and innovation propensity 42
2.1.1.7 (+) Time to market is important ...................................................................... 42 ..................................................................................................... 2.1.2 Threat of Entry 43
2.1.2.1 (+) Large market; largely untapped; growing ................................................. 43 2.1.2.2 (+) Large unmet need - early lung cancer ...................................................... 43 2.1.2.3 (+) Current technology insufficient ................................................................ 43 2.1.2.4 (+) Technological change / innovation ........................................................... 43
............................................................................... 2.1.2.5 (-) High R&D investment 44 ..................................................................................... 2.1.2.6 (+) Patent protection 4 4
......................................................................... 2.1.2.7 (-) Low branding / Ad barrier 44 2.1.2.8 (-) High regulatory hurdles ............................................................................. 44 2.1.2.9 (-) Difficult distribution .................................................................................. 45
......................................................................... 2.1.2.10 (-) Long timeline to revenue 45 ............................................................................ 2.1.3 Bargaining Power of Suppliers 45
2.1.3.1 (+) Labour: a shortage of specialists .............................................................. 46 ....................................................................................... 2.1.3.2 (+) Large companies 46
............................................................. 2.1.3.3 (-) Relatively homogeneous products 46 ........................................................................................ 2.1.3.4 (-) Multiple vendors 46
......................................................................... 2.1.4 Bargaining Power of Customers 4 6 2.1.4.1 (+) Multiple stakeholders ................................................................................ 46 2.1 .4.2 (+) Distributors are gatekeepers ..................................................................... 47 2.1.4.3 (+) Information asymmetry ............................................................................. 47 2.1.4.4 (+) One to one selling ..................................................................................... 47
........................................................................ 2.1.4.5 (+) Large capital expenditures 48 2.1.4.6 (-) More health consciousness and shifting demographics (older; more ex- smokers) 48
vii

............................................................. 2.1.4.7 (+) Relatively homogenous products 4 8 2.1 .4.8 (-) Products seen as high value add ................................................................ 48 2.1.4.9 (-) Lack of buyer concentration ...................................................................... 48
............................................................................................ 2.1.5 Threat of Substitutes 49 2.1.5.1 (+) Prophylactic lung cancer therapies ............. : ............................................. 49 2.1 S.2 (+) No diagnosis .............................................. .............................................. 49 2.1.5.3 (+) Non-traditional methods ............................. : ............................................. 49
2.1.6 Porter's Five Factor Analysis Conclusion ........................................................... 49 2.1.6.1 Industry Attractiveness ................................................................................... 49
......................................................................... 2.1.6.2 Industry Key Success Factors 50 ..................................................................................................... 2.2 Industry Value Chain 51
2.3 Chapter Conclusion ........................................................................................................ 52 3 Internal Analysis ............................................................................................................... 53
.................................................................................................................. 3.1 Strategic Fit 5 3 3.1.1 Product Strategy ................................................................................................... 54 3.1.2 R&D Expense ...................................................................................................... 54 3.1.3 Structure ............................................................................................................... 55 3.1.4 Decision-Making ................................................................................................. 55 3.1.5 Manufacturing ..................................................................................................... 56 3.1.6 Labour .................................................................................................................. 57 3.1.7 Marketing ............................................................................................................. 57
.......................................................................................................... 3.1.8 Risk Profile 58 .................................................................................................. 3.1.9 Capital Structure 58
3.1.10 Conclusion Regarding Strategic Fit at Perceptronix ........................................... 59 .............................................................................................. 3.2 Perceptronix Value Chain 59
................................................................................................ 3.2.1 Primary Activities 62 3.2.1.1 Inbound Logistics ........................................................................................... 62
....................................................................................................... 3.2.1.2 Operations 62 ......................................................................................... 3.2.1.3 Outbound Logistics 64
3.2.1.4 Marketing and Sales ....................................................................................... 64 ............................................................................................................ 3.2.1.5 Service 66
................................................................................................ 3.2.2 Support Activities 66 .................................................................................................. 3.2.2.1 Procurement 6 6
............................................................................... 3.2.2.2 Technology Development 66 ........................................................... 3.2.2.3 Human Resources (HR) Management 6 7
......................................................................................... 3.2.2.4 Firm Infrastructure 6 7 3.2.3 Conclusion Regarding Value Chain at Perceptronix ........................................ 67
......................................................................................................... 3.3 Financial Analysis 6 9 3.3.1 Current Business Plan - Summary ...................................................................... 69
......................................................................................... 3.3.1.1 Revenue Projection 69 . . 3.3.1.2 Gross Margin Project~on ................................................................................. 70
................................................................................. 3.3.1.3 Net Earnings Projection 7 1 ...................................................................................... 3.3.1.4 Cash Flow Projection 71 .................................................................................. 3.3.1.5 Funding Requirements 7 2 ..................................................................................... 3.3.1.6 Near-term Milestones 72
3.3.2 Product Group Specific Analysis ........................................................................ 73 ........................................................................................................ 3.4 Chapter Conclusion 77
4 Issues ................................................................................................................................... 78
...................................................................................... 4.1 Meta Issue . Access to Capital 78
... V l l l

..................................................................... 4.2 Meta Issue . Too Many Products at Once 79 ................................................................................... 4.3 Meta Issue . Marketing Strategy 80
. ...................................................................................................... 4.4 Micro Issues Risks 82 ................................................................................... 4.4.1 Risk of Regulatory Delays 82
......................... 4.4.2 Risks of Slow Market Acceptance : ............................................. 82 ........................................................................ 4.4.3 Risks of Fast Market Acceptance 82
................................................................................................ 4.4.4 Competitive Risks 83 4.5 Chapter Conclusion ........................................................................................................ 83
5 Recommendations ............................................................................................................ 84
5.1 Meta Issue . Access to Capital ...................................................................................... 84 5.1.1 Theplan ............................................................................................................... 84 5.1.2 The Sales Pitch .................................................................................................... 85
................................................................................. 5.1.2.1 Trying to Do Everything 85 ......................................................................... 5.1.2.2 Endoscopy Product Concerns 87
.......................................................................................... 5.1.2.3 Patent Worries 8 8 ....................................................................... 5.1.2.4 Workstation Product Concerns 89
......................................................................... 5.1.3 Additional Fundraising Concern 89 ..................................................................... 5.2 Meta Issue - Too Many Products at Once 89
5.3 Meta Issue - Marketing strategy ................................................................................... 92 ........................................................................ 5.3.1 Sales and Marketing Experience -92
5.3.2 Primary Market Research .................................................................................... 93 5.3.3 Promoting a Portfolio .......................................................................................... 93 5.3.4 PSA Test Model ................................................................................................... 96
....................... 5.3.4.1 Scenario 1: 50% sensitivity at 90% specificity prior to others 98 .......... 5.3.4.2 Scenario 2: 50% sensitivity at 90% specificity in parallel with others 98
..................... 5.3.4.3 Scenario 3: 90% sensitivity at 50% specificity prior to others 101 .......... 5.3.4.4 Scenario 4: 90% sensitivity at 50% specificity in parallel with other 101
.................................................................................. 5.3.5 International Conferences 103 ............................................................................ 5.3.6 Sales Forecast and Resources 104
.................................................................................................... 5.4 Micro Issues - Risks 109 ................................................................................. 5.4.1 Risk of Regulatory Delays 109
..................................................................... 5.4.2 Risks of Slow Market Acceptance 110 ...................................................................... 5.4.3 Risks of Fast Market Acceptance 110
5.4.4 Competitive Risks .............................................................................................. 111 ........................................................................................ 5.4.4.1 New Technologies 1 12
...................................................................................................... 5.5 Chapter Conclusion 1 12 ....................................................................................................................... 6 Appendices 114
6.1 Appendix A . Regulatory Hurdles ................................................................................. 1 14 .......................................................................... 6.1.1 Canadian Regulatory Situation 115
............................................................... 6.1.2 European Union Regulatory Situation 1 16 .................................................................... 6.1.3 United States Regulatory Situation 117
6.2 Appendix B . What is the Goal of Screening for Cancer? A Discussion on Cancer .................................................................... Detection Test Performance and Market Utility 119
............................................................................................ 6.2.1 What is Screening? 119 ................................................................................. 6.2.2 What is a Screening Test? 119
.............................................................................................. 6.2.3 What is the Goal? 120 ........................... 6.2.4 Test Performance: Sensitivity, Specificity, and ROC Curves 120
..... 6.2.5 Which is Most Important for Screening Tests - Sensitivity or Specificity? 122 ....................................................................................... 6.2.6 The Goal of Screening 124

7 Bibliography .................................................................................................................... 126
LIST OF TABLES
Table 1 . The marketing mix for Perceptronix's portfolio of products ......................................... 24 ..................................... Table 2 . Projected revenue and profitability over time (in 000's CDN$) 26
Table 3 . Projected revenue contributions of each product line over time (in CDN$) ................... 26 Table 4 . Projected pricing and profitability of the ClearSignTM Test ........................................ 27
.... Table 5 . Post-operative surveillance market for ClearSignTM Test: Size and penetration rates 27 Table 6 . High risk market for the ClearSignTM Test: Size and penetration rates .......................... 28
........................ Table 7 . Projected pricing and profitability of Perceptronix endoscopy products 28 .... Table 8 . Perceptronix projected penetration rates of worldwide bronchoscopy installed base 29
...................... Table 9 . Projected pricing and profitability of Perceptronix workstation products 29 ..... Table 10 . Estimated total installed base and market penetration projections for ClearCyte TM 30 ..... Table 11 . Estimated total installed base and market penetration projections for ClearPathTM 30
............................................................. Table 12 . Projected total sales personnel per jurisdiction 31 Table 13 . Distribution of Perceptronix current and future employees by function ....................... 68 Table 14 . Funding requirements .................................................................................................... 72 Table 15 . Analysis of Perceptronix 5-year projected budget by product (in 000's CDN$) .......... 74 Table 16 . ClearSignTM Test product group earnings ..................................................................... 75 Table 17 . Endoscopy product group earnings ............................................................................... 75 Table 18 . Workstation product group earnings ............................................................................. 76
............................. Table 19 . Analysis of the investment in each of Perceptronix's product lines 77 Table 20 . Potential results of diagnostic work-up with and without the ClearSignTM Test . Grey
shaded area indicates area of difference ............................................................................... 99 Table 21 . Individual performance of ClearSignTM Test (50%:90%) and CT for lung cancer
detection on a population with 10% incidence ................................................................... 100 Table 22 . Combined performance of ClearSignTM Test (50%:90%) and CT for lung cancer
................................................................... detection on a population with 10% incidence 100 Table 23 . Individual performance of ClearSignTM Test (90%:50%) and CT for lung cancer
detection on a population with 10% incidence ................................................................... 101 Table 24 . Combined performance of ClearSignTM Test (90%:50%) and CT for lung cancer
................................................................... detection on a population with 10% incidence 102 ....................................................................... Table 25 . New sales forecast model assumptions 104
.............. Table 26 . ClearSignTM Test new sales forecast assumptions and revenue calculations 105 ......... Table 27 . Endoscopy Products new sales forecast assumptions and revenue calculations 105 ....... Table 28 . Workstation Products new sales forecast assumptions and revenue calculations 106
Table 29 . Total revenues for new sales forecast .......................................................................... 107 ................................. Table 30 . Sales personnel resources needed for new sales forecast model 108
......................................................... Table 31 . Sensitivity analysis of new sales forecast model 109
LIST OF FIGURES
Figure 1 . Cancer management pathway ........................................................................................... 3 Figure 2 . Cervical cancer mortality curve . Age standardized incidence and mortality rates for
cervical cancer in BC 1970-2000 ............................................................................................ 8 Figure 3 . Lung cancer management pathway . Perceptronix's products are expected to augment
current practices to promote earlier lung cancer intervention by means of early, more accurate diagnosis . The ClearSignTM Test is designed as a new step in the chain to detect early lung cancer lesions . The Endoscopy Products and Workstations are designed as next generation offerings for better in vivo localization and diagnosis of early lesions ................ 9
Figure 4 . The ClearVuTM development prototype ......................................................................... 13 Figure 5 . The ClearVu EliteTM development prototype ................................................................. 14
.............................................................................. Figure 6 . ClearCyteTM development prototype 16 Figure 7 . ClearPathTM development prototype .............................................................................. 17 Figure 8 . Timeline to market entry for Perceptronix products ...................................................... 22 Figure 9 . Timeline to market entry in each jurisdiction for Perceptronix products ...................... 23 Figure 10 . Price comparison for ClearSignTM Test competitors . See Appendix B for a detailed
account of the effect of test sensitivity and specificity in cancer detection ......................... 32 Figure 11 . A comparison of the current lung cancer management pathway and outcomes and
......................................... Perceptronix's lung cancer management pathway and outcomes 39 Figure 12 . The lung cancer diagnostics industry in 2004 .............................................................. 40 Figure 13 . The lung cancer diagnostics industry value chain ........................................................ 51 Figure 14 Overview of Perceptronix's Competencies and Capacities ......................................... 53 Figure 15 . Perceptronix's footprint within the lung cancer diagnostics industry value chain ...... 60 Figure 16 . The value chain at Perceptronix ................................................................................... 61
.................................................................................. Figure 17 . Total revenue projected per year 70 Figure 18 . Projected gross margin per year ................................................................................... 70 Figure 19 . Projected net earnings (loss) per year .......................................................................... 71 Figure 20 . Projected net cash flow per year .................................................................................. 72 Figure 21 . Perceptronix milestones for 2004 and 2005 ................................................................. 73 Figure 22 . A demonstration of how a detection test's ROC curve decision boundary relates to its
ability to separate a positive and negative population ........................................................ 121 Figure 23 . A demonstration of how an ROC curve represents test performance - better separation
of the positive and negative population means a better detection test ................................ 122 Figure 24 . A graph demonstrating the relationship between PPV and specificity ...................... 124 Figure 25 . ROC curves for the PSA test ...................................................................................... 125
xii
1 PRODUCTS, MARKETS AND OVERVIEW OF THE FIRM
Perceptronix Medical Inc. (Perceptronix) is a cancer diagnostics company founded in
1999 and based in Vancouver, B.C.. The Company is approximately one year away from market
launch and first revenues at this time. The purpose of this analysis is to determine the optimal
market entry strategy for Perceptronix's products and to craft the optimal strategy for the firm to
create and maintain competitive advantage in the lung cancer diagnostics industry.
1.1 Company Overview
The Company's goal is to commercialize practical technologies for the early detection
and diagnosis of cancer, thereby profitably making these technologies available worldwide to
reduce suffering and death from this disease. The Company's initial focus is on products to
combat lung cancer, by far the most deadly and unmet cancer problem worldwide.
The name, Perceptronix, reflects the Company's focus on providing technology that
enables physicians to perceive cancer early in the progression of the disease. Perceptronix's
business proposition is to market a suite of products and services for the improved diagnosis of
lung cancer. Perceptronix's three product offerings, the ClearSignTM Test for early lung cancer
detection, Endoscopy Products for in vivo localization of early lung cancer, and Workstation
Products for accurate diagnosis of early lung cancer, form an integrated solution for lung cancer
diagnosis. This solution presents a compelling proposition for lung cancer care physicians and an
opportunity to capitalize on synergies in development, distribution, and marketing.
1.2 Corporate Structure
Perceptronix is a privately owned, Vancouver-based, federally incorporated company.
Perceptronix was founded in June 1999 to commercialize the results of novel technologies
developed in partnership with the British Columbia Cancer Agency ("BCCA"), a world-class
cancer research and treatment facility with a successful track record in implementing early
cancer detection programs. The Company's registered office and principal place of business is
located at Suite 604,601 West Broadway, Vancouver, British Columbia, V5Z 4C2 and currently
occupies 6,472 square feet of office and laboratory space at this location (1,091 ft2 of laboratory,
3,581ft2 of product development, and 1,800 ft2 of general & administrative space ("G&A")).
Perceptronix has been funded by private equity and currently has 37 employees.
The Company is working towards commercializing three product lines that provide
revenue from eight individual product offerings plus warranties and service contracts to support
unit sales. The entire product line-up and type of revenue is outlined below:
(1) The ClearSignTM Test - testing service provided in-house; annual recurring
(2) The Endoscopy Product Line
a. The ClearVuTM Endoscopy Imaging System - unit sales
b. The ClearVu EliteTM Endoscopy Imaging System - unit sales
(3) The Workstation Product Line
a. The ClearCyteTM Workstation - unit sales
b. The ClearPathTM Workstation - unit sales
1.3 Cancer Problem
Cancer is a deadly and globally burdensome disease. Worldwide in 2000, 5.3 million
men and 4.7 million women developed a malignant tumour and 7.2 million people died from the
disease. l Currently in North America, approximately one woman in three and one man in two
will develop some form of cancer during their lifetimes.
As a result of the growing incidence of cancer, the worldwide market for anatomic
pathology services is approximately CDN$l8.O billion213 and for cancer diagnostic consumables
and equipment is approximately CDN$2.3 billion and growing at an average rate of 15%.~
Cancer management often requires complex analysis and subjective interpretation. Lack
of accurate and timely diagnostics significantly impacts cancer treatment costs and patient
mortality. For example, it is estimated that treatment of stage 1 lung cancer is CDN$21,927,
versus CDN$76,311 if treatment is delayed until late disease stages.
Although cancer can kill, it can be treated with a higher cure rate if it is detected early
and diagnosed accurately. There are three interlinked methods to improve the accuracy and early
detection of cancer. They are:
Improved detection, which Perceptronix intends to provide with its ClearSignTM
Test
Improved localization, which Perceptronix intends to provide with its
Endoscopy Products
Improved diagnosis, which Perceptronix intends to provide with its
Workstation Products
Source: World Health Organization. May 2004.
Quest Diagnostics 2002 10-K for US market is $6 billion. Extrapolated for world.
All amounts in this document have been converted at CDN$1.35 to US$1.00.
Theta Reports - Cancer Diagnostics: Global markets and developments. 2003.
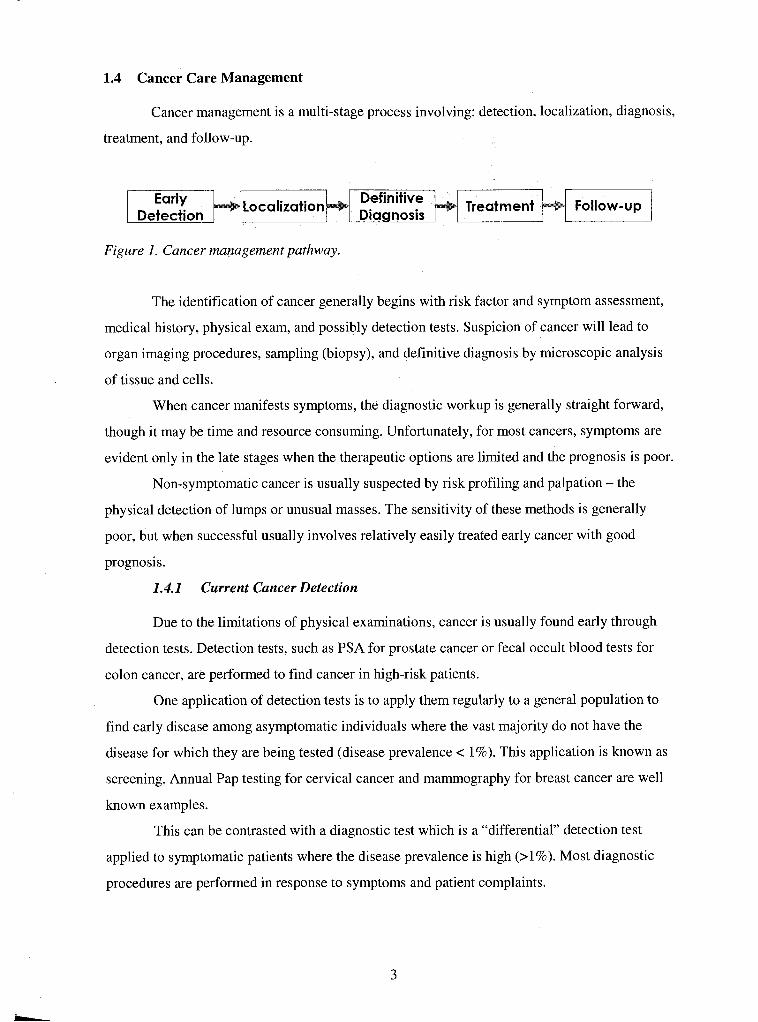
1.4 Cancer Care Management
Cancer management is a multi-stage process involving: detection, localization, diagnosis,
treatment, and follow-up.
Figure I . Cancer management pathway.
The identification of cancer generally begins with risk factor and symptom assessment,
medical history, physical exam, and possibly detection tests. Suspicion of cancer will lead to
organ imaging procedures, sampling (biopsy), and definitive diagnosis by microscopic analysis
of tissue and cells.
When cancer manifests symptoms, the diagnostic workup is generally straight forward,
though it may be time and resource consuming. Unfortunately, for most cancers, symptoms are
evident only in the late stages when the therapeutic options are limited and the prognosis is poor.
Non-symptomatic cancer is usually suspected by risk profiling and palpation - the
physical detection of lumps or unusual masses. The sensitivity of these methods is generally
poor, but when successful usually involves relatively easily treated early cancer with good
prognosis.
1.4.1 Current Cancer Detection
Due to the limitations of physical examinations, cancer is usually found early through
detection tests. Detection tests, such as PSA for prostate cancer or fecal occult blood tests for
colon cancer, are performed to find cancer in high-risk patients.
One application of detection tests is to apply them regularly to a general population to
find early disease among asymptomatic individuals where the vast majority do not have the
disease for which they are being tested (disease prevalence < 1%). This application is known as
screening. Annual Pap testing for cervical cancer and mammography for breast cancer are well
known examples.
This can be contrasted with a diagnostic test which is a "differential" detection test
applied to symptomatic patients where the disease prevalence is high (>I%). Most diagnostic
procedures are performed in response to symptoms and patient complaints.
Detection tests do not yield an actual diagnosis. A makes the definitive
diagnosis of cancer after microscopic examination of a tissue or cellular biopsy.
Additional tests are used to monitor the disease or the patient's response to treatment.
Following treatment, these tests may be repeated at regular intervals during the life of the patient
to monitor for cancer recurrence.
Most cancer detection tests are based on indirect evidence provided by monitoring
changes that are strongly associated with a particular form of cancer but may have other causes.
For example, the PSA test, widely used to detect prostate cancer, is an assay that tests blood for
the presence of prostate specific antigen - a protein that is sometimes elevated when a patient has
prostate cancer and sometimes elevated when a patient does not have prostate cancer (a false
positive). Therefore, the usefulness of a detection test to the patient and to the healthcare system
is limited by the biological association between the surrogate marker and the cancer it implies.
For example, the PSA test yields a high number of false positives when applied to men over the
age of 50. In this age group, 80% of the men who test positive for elevated PSA levels do not
have cancer, leading to misplaced patient concern and unnecessary follow-up procedural costs.
1.4.2 Current Cancer Localization
1.4.2.1 Imaging Methods
If cancer is suspected, then a variety of imaging methods, including computed
tomography (CT; 3D X-ray technique) and X-ray, may be utilized to find the location of a lesion
and obtain cell andor tissue samples for pathology diagnosis.
These imaging technologies are sensitive to the differences in density between tumour
and normal tissue and are better at discerning these differences in soft rather than rigid body
structures. Thus, a tumour's location, if it is located in a soft tissue area, can be visualized as a
highlighted mass on a film.
1.4.2.2 Endoscopic Procedures
For certain cancers that are accessible with a minimally invasive approach, endoscopy
can provide direct visual assessment of suspect tissue and procure samples for pathology
examination in the form of washings, brushings, andor biopsies. Common examples include
bronchoscopy for the inside of the lung passages, colonoscopy for the colon, and colposcopy for
the cervix.
1.4.3 Current Cancer Diagnosis
1.4.3.1 Pathology and Cytology
Pathology plays a vital role in the management of many cancers. Tissue pathology is
used for definitive diagnosis of most solid tumours. Cell pathology (cytology) is used for the
diagnosis of a wide range of tumours, such as those of breast and prostate, via fine needle
aspiration of cells, and for cervical cancer screening using the Pap test.
Typically, pathology laboratory tests involve placing a specimen (either tissue or cells)
on a glass microscope slide, and staining the cells to highlight abnormalities, followed by
microscopic examination by a pathologist.
Although cytology tests are widely used, they possess significant accuracy limitations,
which generate false negative diagnoses. A false negative diagnosis may allow the disease to
progress to a later stage of development before being detected. This may have the effect of
increasing the cost of treatment and poor patient outcome.
The underlying causes of false negative diagnoses are inadequacies in the cytology tests
themselves. Often diagnostic (abnormal or cancer) cells are absent from a sample or these cells
are missed in the manual review of the sample. Perceptronix's ClearSignTM Test mitigates this
problem.
1.5 Lung Cancer Problem
Lung cancer is the most lethal form of cancer, accounting for a mortality rate that in the
USA and Canada exceeds the next four deadliest cancers combined (breast, prostate, colorectal,
and non-Hodgkin's lymphoma). This situation is similar in Europe and the rest of the developing
world as lung cancer incidence and mortality rates continue to rise.
Although great progress has been made towards the control and even the cure of many
types of cancer, this has not been the case for lung cancer. Little scientific and technological
progress has been made for lung cancer management over the past few decades.
Currently, a patient diagnosed with lung cancer has a less than a 15% chance of
surviving five years after diagnosis and most patients will die within one year of diagnosis, often
experiencing significant pain and suffering despite expensive attempts at palliative treatment.
The principle issue in lung cancer is that patients remain asymptomatic until the later
stages of the disease, at which point the malignancy has become invasive and spread throughout
the body so that it cannot be successfully treated. One of the factors underlying this problem is
that a key lung cancer symptom, a cough, is often misinterpreted by physicians as a "normal"
condition among smokers.
If the lung cancer can be detected at a very early, non-invasive or even in micro-invasive
stage, when the malignant growth is still localized, it can often be removed, resulting in a cure
and good quality of life for the patient.
The key to controlling and managing lung cancer is detecting it at a very early stage,
preferably at the onset of the cancer lesion. This tactic has proven to be a successful way to
control cervical cancer, skin cancer, breast cancer, colon cancer and cancers of other types.
1.5.1 Current Lung Cancer Detection
There are no lung cancer early detection tests currently on the market. Doctors are
currently applying localization and diagnostic techniques to find lung cancer.
Presently, lung cancer is detected using X-ray, CT, bronchoscopy, or conventional
sputum cytology. Although these methodologies are well suited for precise localization and
diagnosis of lung cancer, they are not well suited for primary detection of lung cancer.
The problem with using X-ray and conventional sputum cytology is that these methods
detect lung cancer too late in the progression of the disease. A lung tumour must reach sufficient
size in order to be visible via X-ray or to be likely to donate a tumour cell into a sputum sample.
The problem with using CT to detect lung cancer is that it is a localization technique that
is impractical in application as a detection modality - there is a high cost associated with the
instrumentation and with the high false positive rate and it can only detect solid tumours
occurring in the periphery of the lung (30-45% of lung cancers15.
Fluorescence bronchoscopy is impractical as a detection method as well. It is an invasive
procedure and only applicable to tumours occurring in the central airways (30-45% of lung
cancers15.
1.5.2 Current Lung Cancer Localization
There are currently two methods to localize lung cancer: CT, which is effective for the
visualization of cancers that occur in the peripheral region of the lung, and fluorescence
bronchoscopy, which is effective for the visualization of cancers that occur in the central regions
of the lung.
Incidence varies depending on jurisdiction. Small cell lung cancer, accounting for 15-25% of lung cancers, does not form solid tumours. Large cell lung cancer accounts for 10% of lung cancers. Both small cell and large cell lung cancers are so deadly that early detection will not affect outcomes. Source: http://www.bccancer.bc.ca~HPI/CancerManamentGuidlinesun/sa.htn . July 20, 2004.
Current bronchoscopy systems are white light imaging devices with or without
fluorescence. White light bronchoscopy has been in use for over 50 years and is the most widely
used method. This technique is not very sensitive for early lung cancer visualization.
Fluorescence imaging was added to bronchoscopy equipment 5-10 years ago to improve
cancer detection. This modification greatly improved the sensitivity for early lung cancer
detection but also increased the number of false positives and the number of unnecessary
biopsies.
Fluorescence bronchoscopy has not been widely employed by the medical community
because of the increased level of expertise required to navigate in fluorescence light.
1.5.3 Current Lung Cancer Diagnosis
Pathology diagnosis of lung cancer is presently done manually by pathologists using
cells from sputum samples, bronchial washes / brushings, or fine needle aspirates and tissue
biopsies. Roughly 80% of these cancers are late stage (Stage 2 and above).
1.6 Comprehensive Approach
To detect lung cancer at an early stage, high-risk individuals need to be examined. Since
lung cancer can occur anywhere in the lining of the lung (a tennis court size area), its detection
and localization present a unique challenge.
The solution lies in the design of a comprehensive approach to the problem. This
approach should include:
A simple, non-invasive, cost-effective method, such as the ClearSignTM Test,
that can identify patients that have a high probability of harbouring lung cancer;
Followed by a more involved, invasive, and expensive examination that can
confirm the presence and location of a cancer - Perceptronix's Endoscopy
Products are designed as new tools for this localization;
Once a tumour has been identified, an objective, definitive diagnosis must be
completed in order to select the most appropriate treatment - the Workstation
Products are designed as new tools for accurate diagnosis;
After treatment a diligent and cost-effective follow-up test, such as the
ClearSignTM Test, should be used to monitor patients for cancer recurrence.
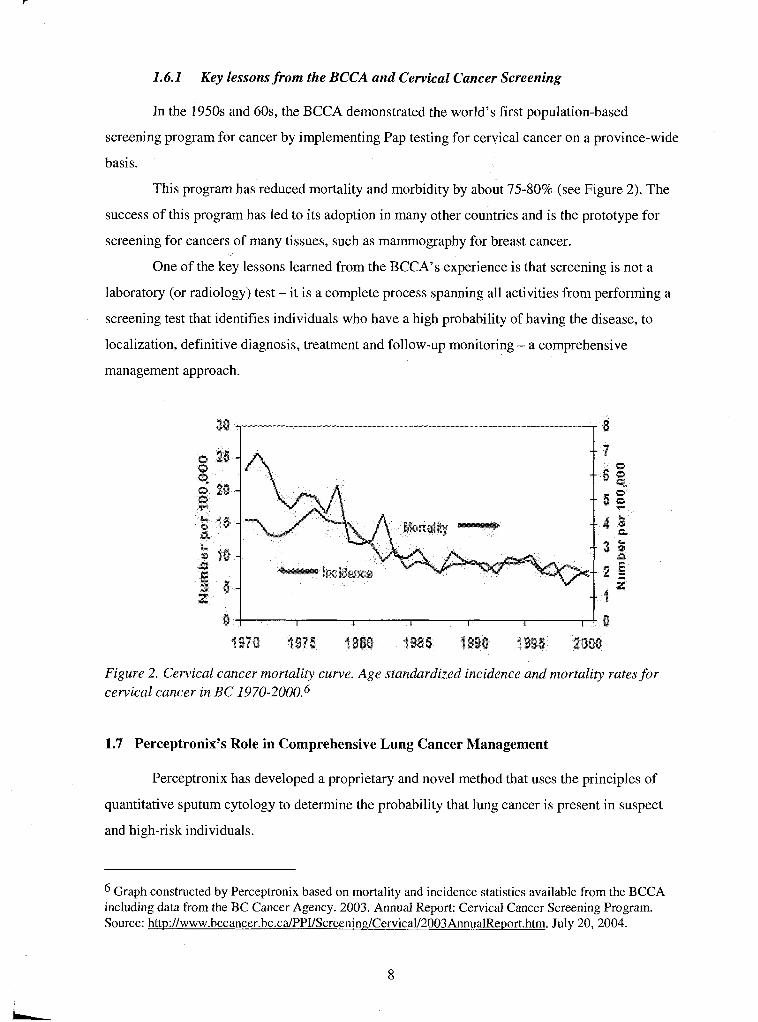
1.6.1 Key lessons from the BCCA and Cervical Cancer Screening
In the 1950s and 60s, the BCCA demonstrated the world's first population-based
screening program for cancer by implementing Pap testing for cervical cancer on a province-wide
basis.
This program has reduced mortality and morbidity by about 75-80% (see Figure 2). The
success of this program has led to its adoption in many other countries and is the prototype for
screening for cancers of many tissues, such as mammography for breast cancer.
One of the key lessons learned from the BCCA's experience is that screening is not a
laboratory (or radiology) test - it is a complete process spanning all activities from performing a
screening test that identifies individuals who have a high probability of having the disease, to
localization, definitive diagnosis, treatment and follow-up monitoring - a comprehensive
management approach.
Figure 2. Cervical cancer mortality curve. Age standardized incidence and mortality rates for cervical cancer in BC 1970-2000.~
1.7 Perceptronix's Role in Comprehensive Lung Cancer Management
Perceptronix has developed a proprietary and novel method that uses the principles of
quantitative sputum cytology to determine the probability that lung cancer is present in suspect
and high-risk individuals.
Graph constructed by Perceptronix based on mortality and incidence statistics available from the BCCA including data from the BC Cancer Agency. 2003. Annual Report: Cervical Cancer Screening Program. Source: http://www.bccancer.bc.ca/PPI/Screening/Cervica1/2003AnnualReport.htm. July 20, 2004.
Conventional cytology has historically been the best approach for the detection of
cervical cancer, breast cancer and several cancers of other tissue types. In lung cancer, however,
the probability of capturing any cells from a small, early lung cancer lesion in the sputum, even
using induced cough, is very low. Even the best experts are, therefore, unable to make a
diagnosis as conventional cytology diagnosis is based on the presence of atypical and cancer
cells. Thus, the probability to detect an early cancer by conventional cytology is less than 10%.
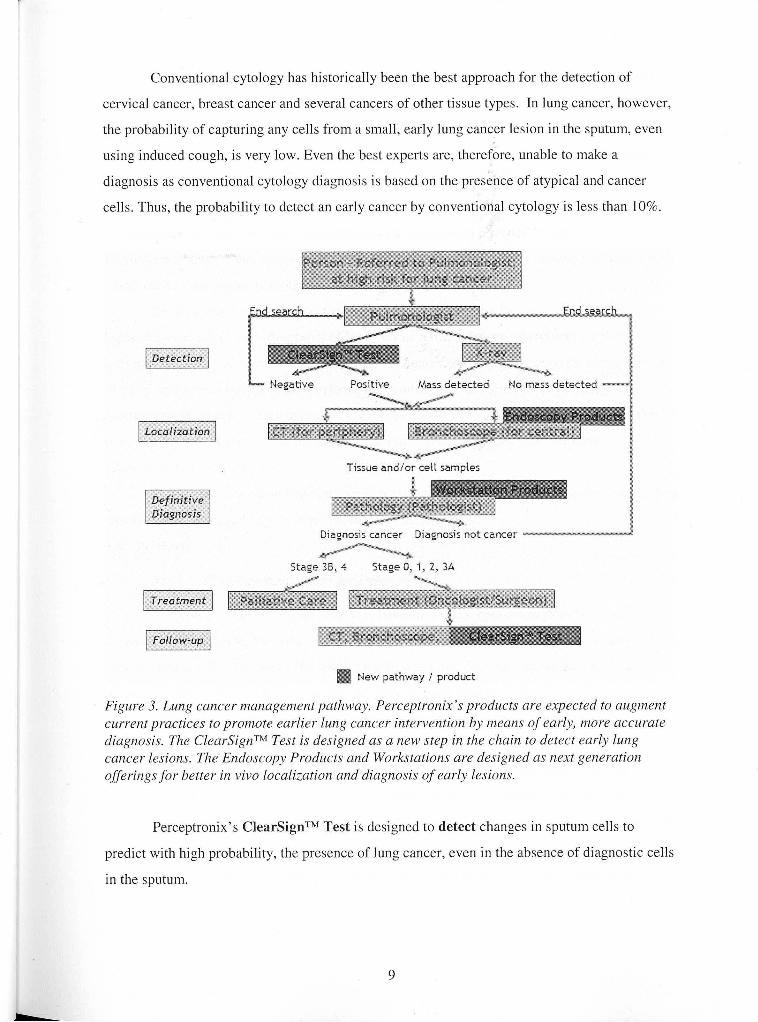
Negative Positive Mass detected No mass detected - -
Tissue andlor ceit sampies
Diagnosis cancer Diagnosis not cancer
Stage 38.4 Stage 0, 7 , 2, 3A
New pathway f product
Figure 3. Lung cancer management pathway. Perceptronix's products are expected to augment current practices to promote earlier lung cancer intervention by means of early, more accurate diagnosis. The ClearSignTM Test is designed as a new step in the chain to detect early lung cancer lesions. The Endoscopy Products and Workstations are designed as next generation offerings for better in vivo localization and diagnosis o f early lesions.
Perceptronix's ClearSignTM Test is designed to detect changes in sputum cells to
predict with high probability, the presence of lung cancer, even in the absence of diagnostic cells
in the sputum.
As a result the ClearSignTM Test is expected to fill a crucial missing link in the existing
lung cancer care methods that will provide early detection of lung cancer in high-risk individuals
such as long term current and ex-smokers. The ClearSignTM Test is designed to provide
information on the presence or absence of lung cancer in a very cost effective way with little
discomfort to the patient.
An important second potential application for the ClearSignTM Test is in the monitoring
of lung cancer patients for cancer recurrence or the presence of a second primary tumour.
Perceptronix believes that this will be a welcome replacement of current involved, invasive, and
costly monitoring practices using CT and bronchoscopy.
Perceptronix's other products are designed as tools for use by physicians for the
localization and definitive diagnosis of lung cancer. The Endoscopy Products are designed to
aid pulmonologists in cancer localization by providing enhanced performance for identification
of early lung cancer lesions. The Workstation Products are designed to aid pathologists in
making a more objective diagnosis once a lesion biopsy or cells are collected from the patients'
lung. Perceptronix believes that these products will provide important links for better
management of early lung cancer.
Figure 3 outlines how Perceptronix expects these products will fit within the current lung
cancer management pathway to improve lung cancer outcomes.
1.8 Products
1.8.1 The ClearSignTM Test for Detection
Perceptronix has developed what it believes is a major breakthrough in lung cancer
diagnostics, the ClearSignTM Test, for the detection of early stage lung cancer. It is a non-
invasive test and Perceptronix believes it is the first test that does not require the presence of
diagnostic cells in sputum in order to identify patients with lung cancer.
Diagnostic cells (e.g. cancer cells) are not usually present in sputum samples from
patients with early stage lung cancer, which makes conventional or molecular marker analysis
ineffective. As a result, the medical community has been slow to embrace sputum analysis.
The ClearSignTM Test is designed to solve this problem by detecting the changes a cancer
cell affects on the cells surrounding it. These subtle changes are measured and used to predict the
probability that a patient has lung cancer. In other words, the ClearSignTM Test is used to detect
the global changes in the population of normal cells created by the presence of lung cancer. Thus
far, clinical studies indicate that this technology is more than three times as sensitive as
conventional sputum analysis.
As a result, Perceptronix believes the ClearSignTM Test will be able to reduce the
incidence of false negative diagnoses and detect lung cancer in its earliest stages.
1.8.1.1 How the Test Works ,
When a person coughs deeply, cells from the lining of their lungs are present in the
expectorated sputum. The ClearSignTM Test detects these cells and makes precise measurements
of the nuclear irregularities within the cells. By measuring the properties of many cells, the
ClearSignTM Test is designed to detect lung cancer in a patient even if no diagnostic cells are
present in the sputum.
In practise, Perceptronix expects that the ClearSignTM Test will be used as part of the
following process: (1) sputum samples will be collected under the supervision of a respiratory
technician or via a take-home kit; (2) once collected, the sample will be deposited on a
microscope slide and sent to a Perceptronix lab for processing; (3) at Perceptronix, the slide will
be prepared and scanned by the ClearSignTM analysis platform for automated scanning, image
capture, quantification, data analysis, and score generation; (4) the ClearSignTM analysis platform
will scan each slide to produce precise images of the genetic material in approximately 10,000
cell nuclei per slide; (5) image processing algorithms will then be applied to each cell nucleus to
calculate over 100 features that measure the amount, distribution, and conformation of the
genetic material; and (6) finally, proprietary decision rules are applied, which will convert the
accumulated data into a single score that indicates the likelihood of the patient having lung
cancer.
This score and its interpretation will be sent to the patient's doctor within three working
days of receiving the sample. If the ClearSignTM Test score indicates cancer is likely to be
present, the doctor will order further investigations such as localization procedures using
bronchoscopy andlor CT. If a lesion is found, a biopsy will be taken to provide cells or tissue for
diagnostic tests using cytology or pathology to verify the diagnosis.
1.8.1.2 Time to Market Status
As a medical diagnostic test, the ClearSignTM Test requires regulatory approval in order
to be used in any market. Because ClearSignTM is a breakthrough technology, and because it
involves patients with cancer, such approvals may require that clinical trials be conducted within
each jurisdiction.
The ClearSignTM Test is currently being evaluated for Health Canada approval through
an international, multi-centre clinical trial involving approximately 1,200 patients. The
completion of this clinical trial is expected in the third quarter of 2004 and Health Canada
approval is anticipated in the second quarter of 2005. This will allow marketing and delivery of
the test in Canada and other countries as a Canadian reference lab service.
Data from the clinical trial will also be used to obtain European Union ("EU") regulatory
approval. This will entail filing for a CE mark, which is anticipated to occur in parallel with
filing for Health Canada approval and take approximately 3 months. EU approval is anticipated
in the second quarter of 2005. Perceptronix intends to build a ClearSignTM Test service
laboratory facility in the UK by the fourth quarter of 2005. EU sales (focused on the UK and
Germany) are expected to begin immediately thereafter.
For the USA, FDA approval in the form of a pre-market approval ("PMA") will need to
be obtained. Perceptronix is of the view that significant risks in terms of a prolonged regulatory
process, cost, and/or barrier to entry exist with FDA submissions for new medical diagnostic
tests.
To mitigate these risks Perceptronix has chosen a strategy to test market the ClearSignTM
Test in Canada and the EU prior to FDA submission. Perceptronix believes this strategy will
ultimately allow Perceptronix to move up the learning curve operationally, provide revenues for
FDA submission costs, and provide compelling evidence to have the FDA submission fast-
tracked.
For more information on the regulatory hurdles in each jurisdiction and approximate
timelines for each see Appendix A.
1.8.2 Endoscopy Products for Localization
Perceptronix's Endoscopy Products are designed to dramatically expand the current
fluorescence bronchoscopy market and provide the next generation technological enhancements
for better localization of cancer. For these products, Perceptronix has developed the computer
hardware, software, and camera components and paired them with third party scopes and fibre
optics.
Perceptronix's Endoscopy products are expected to transform the bronchoscopy market
by enabling simultaneous white light and fluorescence imaging and provide real-time spectral
analysis to reduce unnecessary biopsies.
Perceptronix's endoscopy products have been developed to bridge the gap between the
low cancer detection of white light bronchoscopy and the low usability and high false positive
rate of fluorescent bronchoscopy.
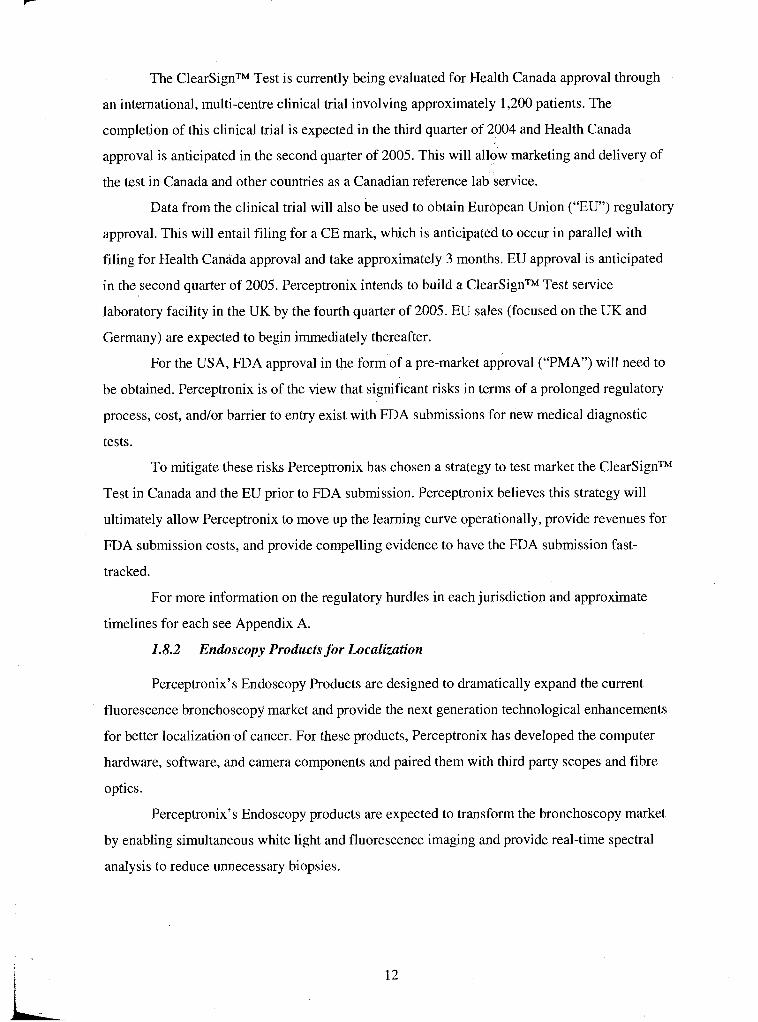
1.8.2.1 ClearvuTM - Fluorescence Bronchoscopy at the Speed of White LightTM
Figure 4. The ClearVuTM development prototype.
The ClearVuTM is designed to be an endoscopy imaging system offering real-time,
simultaneous white light ("WL") and fluorescence ("FL") imaging. This will enable navigation
in white light with fluorescence imaging occurring simultaneously for early cancer detection.
Perceptronix believes that this simultaneous viewing of WL and FL images will help to
convert current WL bronchoscopists to use of FL bronchoscopy early cancer detection -
effectively growing the market for fluorescence bronchoscopy.
1.8.2.2 ClearVu ~ l i t e ~ ~ - Next Generation Bronclzoscopy
The ClearVu EliteTM is designed to be the next generation endoscopy imaging system
offering real-time spectral analysis of suspect lesions to reduce unnecessary biopsies.
The ClearVu EliteTM will employ the same simultaneous WL and FL imaging as the
ClearVuTM with the addition of two innovative technologies: reflectance spectroscopy and
computerized quantitative analysis of suspect lesions.
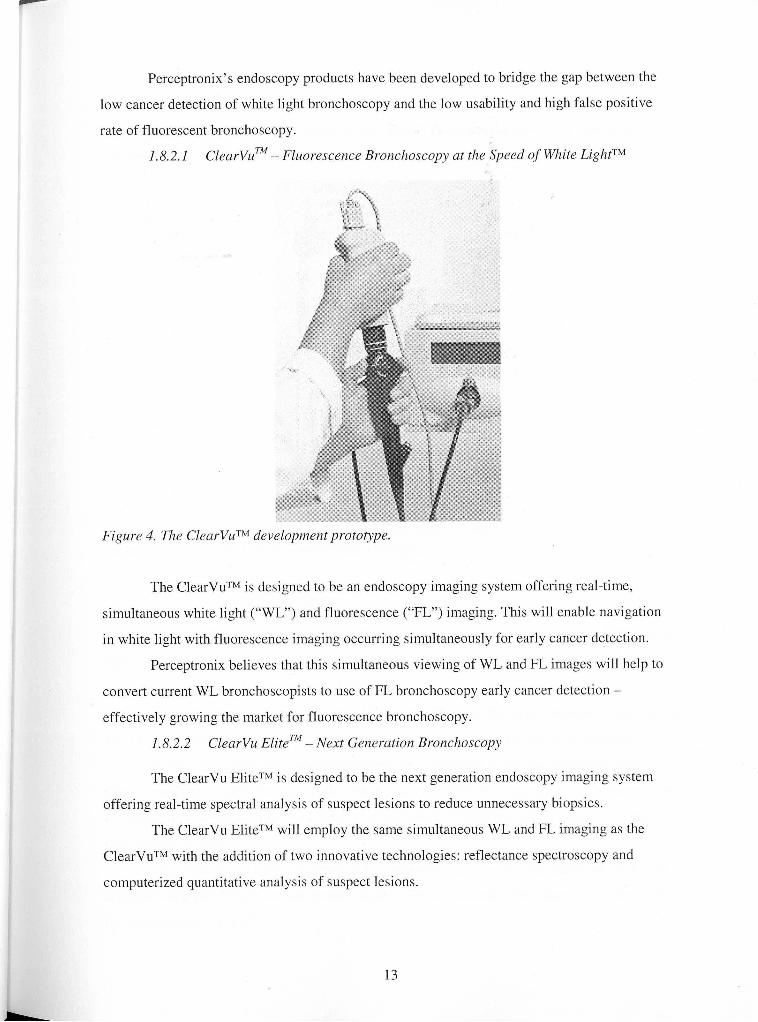
As a result, the ClearVu EliteTM is expected to solve the problems associated with WL
and FL bronchoscopy - high false positives and low usability. It is designed to have a high
sensitivity for cancer and pre-cancerous lesions, greatly decreases the number of false positives
and unnecessary biopsies, and is easier to operate.
Figure 5. Tlze ClearVu EliteTM developnient prototype.
1.8.2.3 Time to Market Status
ClearVuTM system clinical trials will be carried out in the first two quarters of 2005 with
approvals expected in Canada and the EU in the third quarter of 2005. Product launch in these
markets is planned for the last quarter of 2005.
Perceptronix aims to have ClearVu EliteTM prototypes in the field (deployed with Canada
and EU collaborators) during 2004 and 2005 for data collection and algorithm development.
Completion of the first production prototype is expected in the first quarter of 2005.
Clinical trials are expected to start in the fourth quarter of 2005 with approvals in Canada and the
EU anticipated in second quarter of 2006. Product launch in these markets is planned for the
third quarter of 2006.
The clinical trial for FDA approval is expected to begin in the first quarter of 2006 with
approval anticipated in the second quarter of 2007. Product launch in this market is planned for
the fourth quarter of 2007.
1.8.3 Workstation Products for Diagnosis
Reliable and repeatable diagnosis of pre-invasive and early invasive cancer lesions of the
lung presents a challenge to even experienced pathologists.
Currently, pathologists rely on subjective judgments for diagnosis, which leads to
diagnostic variability within and between observers for even the most qualified experts. This
situation can hamper accurate diagnosis and the clinical management of the patient.
In the instance of early cancer, this problem is compounded because most pathologists
have limited exposure to early stage diagnostic material for lung cancer (when lung cancer is not
detected early, early stage biopsies and cell samples are not forwarded to the pathologist for
diagnosis).
Perceptronix believes that the acceptance of its ClearSignTM Test and improvements in
localization will make the detection and sampling of tissue from pre-invasive and early stage
lung cancers more common. The Company has learned from the BCCA's experience with
implementing the Pap test in the 1950's that in order to change cancer outcomes the knowledge
of how to diagnosis early cancer lesions accurate must be learned. This knowledge is
encapsulated in Perceptronix's workstation products, making it available to pathologists to speed
better lung cancer outcomes.
Perceptronix has developed two diagnostic tools, the ClearCyteTM Workstation and the
ClearPathTM Workstation, which are designed to address the need for instrumentation that will
assist pathologists in assigning repeatable and reliable diagnoses of early lesions of the lung. The
ClearCyteTM aids pathologists in the objective diagnosis of cell samples while the ClearPathTM
aids the pathologist in the objective diagnosis of tissue samples.
The target users for the ClearCyteTM and ClearPathTM are clinical pathologists and other
medical professionals who work in the area of lung cancer. Additional targets for the
ClearPathTM include pathology teaching organizations, where the ClearPathTM can be used as a
training tool.
The workstation products are currently being developed for lung cancer diagnosis.
However, software modules for other cancer types are possible and contemplated for the future.
This technology is applicable universally to the diagnosis of cancer cells and tissues.
1.8.3.1 ClearCyteTM - To Improve Cytology
The ClearCyteTM is an automated cellular imaging device (image cytometer) for cell
sample preparations such as bronchial washings, brushings, fine needle aspirates, and sputum,
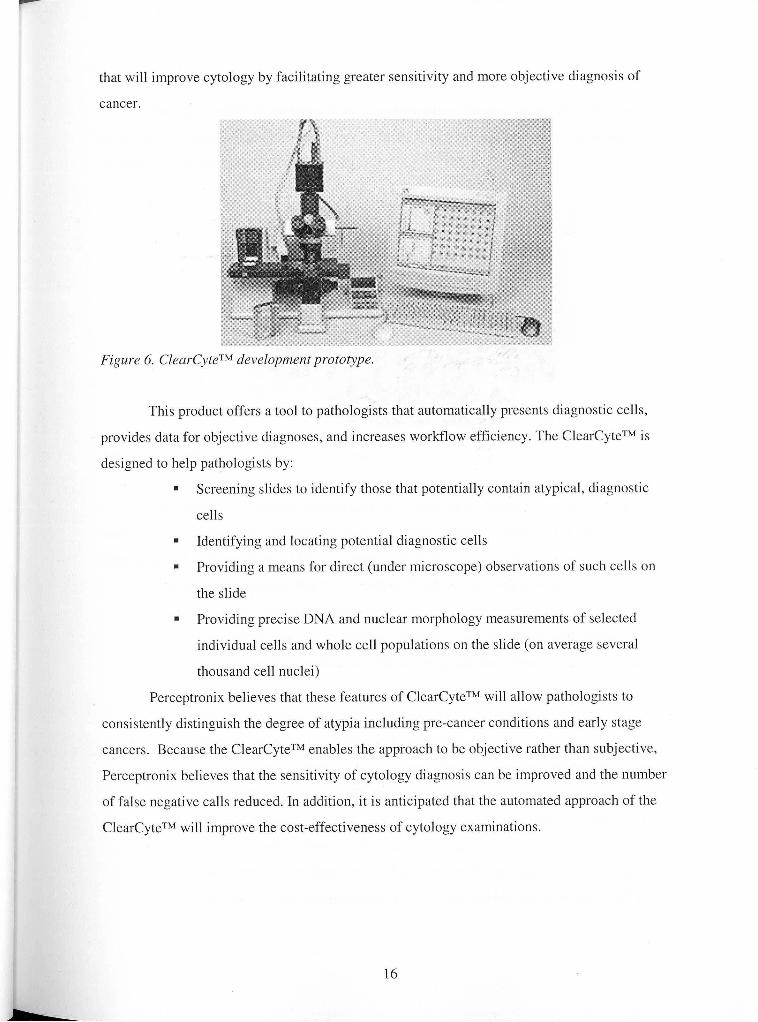
that will improve cytology by facilitating greater sensitivity and more objective diagnosis of
cancer.
Figure 6. ClearCyteTM development prototype.
This product offers a tool to pathologists that automatically presents diagnostic cells,
provides data for objective diagnoses, and increases workflow efficiency. The ClearCyteTM is
designed to help pathologists by:
Screening slides to identify those that potentially contain atypical, diagnostic
cells
Identifying and locating potential diagnostic cells
Providing a means for direct (under microscope) observations of such cells on
the slide
Providing precise DNA and nuclear morphology measurements of selected
individual cells and whole cell populations on the slide (on average several
thousand cell nuclei)
Perceptronix believes that these features of ClearCyteTM will allow pathologists to
consistently distinguish the degree of atypia including pre-cancer conditions and early stage
cancers. Because the ClearCyteTM enables the approach to be objective rather than subjective,
Perceptronix believes that the sensitivity of cytology diagnosis can be improved and the number
of false negative calls reduced. In addition, it is anticipated that the automated approach of the
ClearCyteTM will improve the cost-effectiveness of cytology examinations.
1 X3.2 ClearPathTM - To Improve Pathology
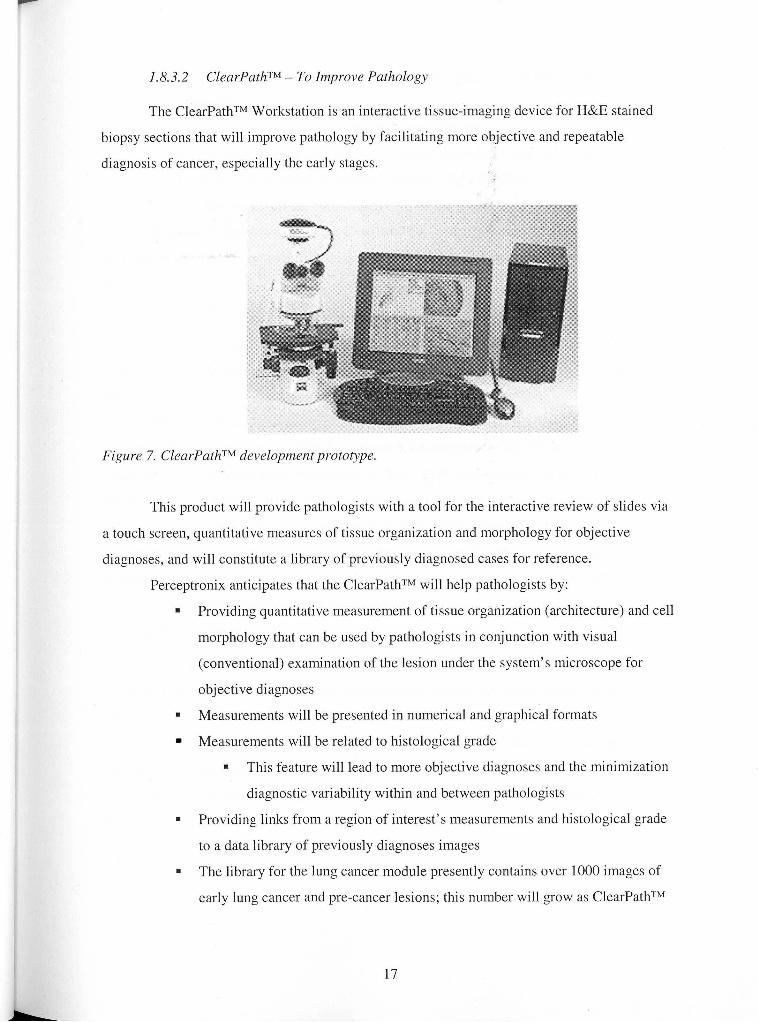
The ClearPathTM Workstation is an interactive tissue-imaging device for H&E stained
biopsy sections that will improve pathology by facilitating more objective and repeatable
diagnosis of cancer, especially the early stages.
Figure 7. ClearPathTM development prototype.
This product will provide pathologists with a tool for the interactive review of slides via
a touch screen, quantitative measures of tissue organization and morphology for objective
diagnoses, and will constitute a library of previously diagnosed cases for reference.
Perceptronix anticipates that the ClearPathTM will help pathologists by:
Providing quantitative measurement of tissue organization (architecture) and cell
morphology that can be used by pathologists in conjunction with visual
(conventional) examination of the lesion under the system's microscope for
objective diagnoses
Measurements will be presented in numerical and graphical formats
Measurements will be related to histological grade
This feature will lead to more objective diagnoses and the minimization
diagnostic variability within and between pathologists
Providing links from a region of interest's measurements and histological grade
to a data library of previously diagnoses images
The library for the lung cancer module presently contains over 1000 images of
early lung cancer and pre-cancer lesions; this number will grow as ClearPathTM
units are deployed and collaborators send images back to the Perceptronix
database
Users may also create their own libraries
Providing an easy user interface with automated focusing and a touch-screen
display for selection of areas of interest using a light pen
Offering ClearPathTM module for deployment with existing microscopes
Perceptronix intends to offer the ClearPathTM to lung cancer pathologists and to
universities and medical schools as a training tool for students studying the pathology of early
lung cancer.
1.8.3.3 Time to Market Status
Perceptronix intends to position and sell the ClearCyteTM and ClearPathTM as Class I1
medical devices. As such, these units will be subject to minimal clinical regulatory approval
requirements.
The first technical feasibility prototypes of ClearPathTM and ClearCyteTM have been
completed. Perceptronix expects that the commercial prototypes for the ClearCyteTM and
ClearPathTM will be ready in the first quarter of 2005. Both workstations will be involved in
Perceptronix's IS013485 Quality Assurance system certification for medical devices.
For market entry, Perceptronix intends to make applications to Health Canada, the EU,
and the FDA. These applications will entail a short clinical trial (approximately 90 days) on 100
samples. Approvals in these jurisdictions are anticipated in the second quarter of 2005.
Product launch for the workstations is planned for the second quarter of 2005
1.9 Intellectual Property
The Company relies on a combination of patents, trade secrets, trademarks, copyrights,
and confidentiality agreements to protect its proprietary technology, rights and know-how -
referred to collectively as intellectual property (IP).
The Company owns rights to three United States patents and has seven pending US
patents with corresponding international patent applications under the provisions of the Patent
Cooperation Treaty (PCT) relating to various aspects of the Company's technology.
Perceptronix also holds right of first refusal to an additional six United States patents with
international (PCT) equivalents.
1.9.1 ClearSignTM Test and Workstation Products
Two patent applications have been filed: one covering the Company's method for
depositing cells on microscope slides from density gradients of sputum which is assigned to
Perceptronix and the other covering the concept of using computerized methods and systems that
support analysis related to the detection of malignancy associated dhanges to detect cancer
generally and lung cancer specifically, which is jointly assigned to Perceptronix and the BCCA.
Additional patent applications will target the Company's Feulgen-Thionin stain and
staining method for DNA visualization and standardization, automated staining device, algorithm
for obtaining diagnostic information from cell clumps and masses, and algorithm for matching
and mapping cellular images to cellular features.
A substantial part of the ClearSignTM Test is protected as trade secret and know-how
including the computer algorithms and decision-trees behind the test. Replicating the
ClearSignTM Test algorithms would be extremely difficult, requiring tremendous resources,
clinical expertise, and access to relevant clinical samples. The Company's strategy to offer the
ClearSignTM Test via a service-based model protects the IP as trade secrets and know-how.
Perceptronix additionally has right of first refusal to license five patents related to
sputum sample preparation methods from G6 Science Corp. (G6) and the BCCA. These methods
are not currently being used by Perceptronix but may be of interest in the future as cell
preparation is fundamental to the ClearSignTM Test.
1.9.2 Endoscopy Products
Three patent applications have been filed and assigned to Perceptronix related to
Perceptronix's endoscopy products covering the methods and devices for spectral analysis,
simultaneous fluorescence and white light imaging (multi-modal imaging) and its uses, and the
idea of using automated algorithms in an endoscopy system for cancer diagnosis.
Additionally, Perceptronix owns or is developing patents for future endoscopy
technology innovations. One patent has been granted (US 6546276) regarding use of optical
coherence tomography for 3D tissue imaging of internal organs. Two patent applications have
been filed regarding use of raman spectroscopy (molecular identification) for detecting lung
cancer and methods and apparatus for multiple excitation-emission pairs imaging. One patent has
been licensed from the BCCA regarding apparatus and methods related to high speed raman
spectroscopy. These technologies will not be incorporated into the Company's first products but
will be used for future offerings.
Furthermore, Perceptronix has right of first refusal to license a non-coherent fiber optic
apparatus and imaging method patent from G6. Again, this technology is not currently being used
but may be of interest in the future.
1.10 Marketing
Perceptronix intends to offer an integrated solution based dn a portfolio of
complementary products for lung cancer spanning early detection, localization, and definitive
diagnosis to improve lung cancer outcomes and achieve synergies in product development,
distribution, and marketing.
The Company's preliminary market research indicates that this integrated approach is
very attractive to the consumer and will be a significant competitive advantage over single
product competitors.
1.10.1 Marketing Strategy
Perceptronix's strategy includes commercializing a product portfolio that solves
deficiencies in clinical practise. ClearSignTM Test is designed to provide routine, non-invasive,
effective detection of early stage lung cancer. ClearVuTM is designed to convert white light
bronchoscopists to use of fluorescence. ClearVu EliteTM is designed to reduce the number of
false positive biopsies taken using fluorescence bronchoscopy. ClearCyteTM is designed to
increase accuracy and reduce time-spent on cancer diagnosis using cells. ClearPathTM is designed
to instruct pathologists on the pathology of early cancer and pre-cancerous lesions of the lung7
Perceptronix's strategy includes leveraging the complementarity of the Company's
product portfolio to promote sales. The sales target for the ClearSignTM Test and Endoscopy
products is the pulmonologist. The pulmonologist is referred patients who are suspected of
having lung cancer, manages patients who have a high probability of developing lung cancer (e.g.
COPD~ patients) and manages patients who have been treated for lung cancer. Typically, the
pulmonologist will collect cell and tissue samples of suspect areas from patients during
investigational bronchoscopies and send them to a pathologist - the sales target for the
Workstation Products - for diagnosis.
7 Early cancer and pre-cancerous lesions of the lung were not routinely found until the advent of fluorescence bronchoscopy -10 years ago and most pathologists still do not see these lesions on a regular basis. This product embodies a knowledge-base from the BC Cancer Agency, where the pathology of these lesions has been studied for the past -10 years, for diagnosis of these lesions.
COPD = chronic obstructive pulmonary disease
The Company's strategy includes entering the market using a slow skimming strategy
(high price, low promotion), entering the market as quickly as possible to establish first mover
advantage, and building a network of users to secure this advantage. Perceptronix intends to do
this by:
Targeting high incident populations with the ClearSignTM Test to quickly prove
efficacy to regulatory bodies and to the market (this is faster because a greater
number of cancers can be found in a given amount of people tested)
Targeting gatekeepers - pulmonologists and the pathologists that work with
them - for cost-efficient entry
Targeting thought leaders - pulmonologists and the pathologists that work with
them - to promote viral marketing, both peer-to-peer and specialist-to-general
practioner (GP)
A slow skimming strategy is a cost-effective strategy dictated by the healthcare
environment in which sales of Perceptronix's products will take place. The healthcare
environment has multiple stakeholders, is highly fragmented, and has unique ethical and
regulatory hurdles. Therefore, traditional heavy promotion sales methods are typically ineffective
and inefficient. Instead, successful sales models target the industry gatekeepers (for successful
entry) and thought leaders (for sales growth through product referral). These key individuals help
to persuade other stakeholders and expedite regulatory approvals.
The Company has learned from the examples set by the market entry of previous cancer
tests and cancer diagnosis programs. From the example of BCCA population-based Pap test
screening for cervical cancer, the Company has learned:
Cancer screening is much more than a single test. It is the complete process from
screening test, to diagnostic work-up, to treatment, and follow-up
A decrease in disease specific mortality is the most reliable demonstration of
screening effectiveness
It may take a very long time to demonstrate screening effectiveness, often 15
years or more, even with a very large population tested
From the example of market acceptance of the PSA test for prostate cancer screening,
Perceptronix has learned:
The market will gradually accept a new test with fairly low promotion if it is
appropriately positioned
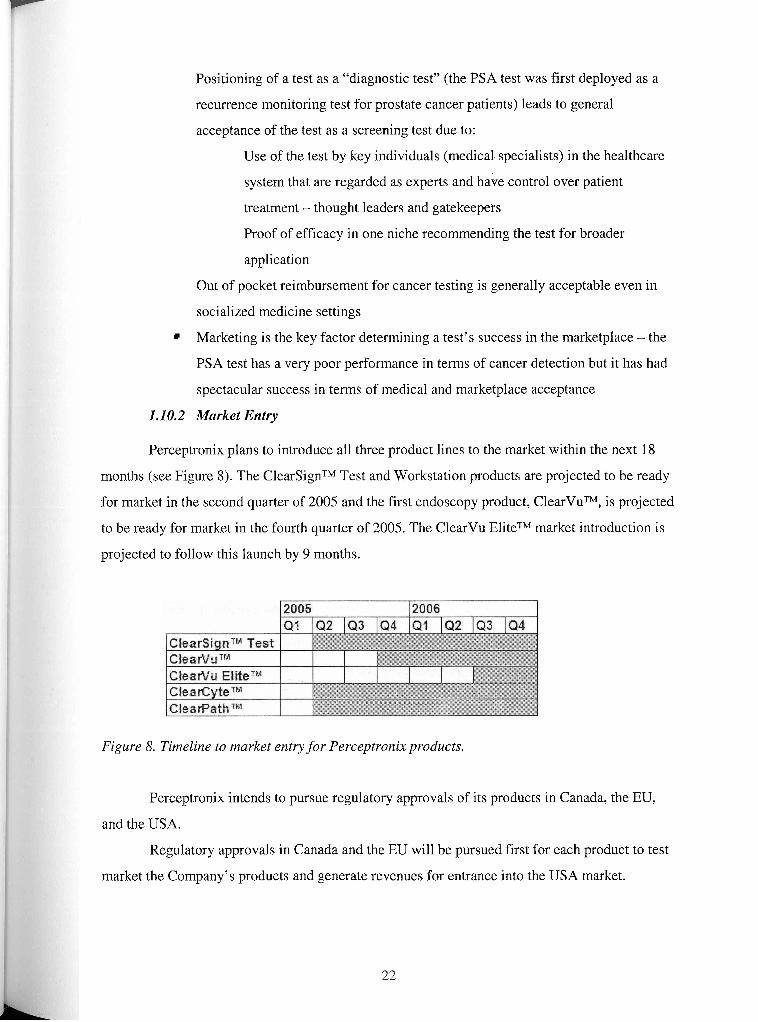
Positioning of a test as a "diagnostic test" (the PSA test was first deployed as a
recurrence monitoring test for prostate cancer patients) leads to general
acceptance of the test as a screening test due to:
Use of the test by key individuals (medical specialists) in the healthcare
system that are regarded as experts and have control over patient
treatment - thought leaders and gatekeepers
Proof of efficacy in one niche recommending the test for broader
application
Out of pocket reimbursement for cancer testing is generally acceptable even in
socialized medicine settings
Marketing is the key factor determining a test's success in the marketplace - the
PSA test has a very poor performance in terms of cancer detection but it has had
spectacular success in terms of medical and marketplace acceptance
1.10.2 Market Entry
Perceptronix plans to introduce all three product lines to the market within the next 18
months (see Figure 8). The ClearSignTM Test and Workstation products are projected to be ready
for market in the second quarter of 2005 and the first endoscopy product, ClearVuTM, is projected
to be ready for market in the fourth quarter of 2005. The ClearVu EliteTM market introduction is
projected to follow this launch by 9 months.
Figure 8. Timeline to market entry for Perceptronix products.
Perceptronix intends to pursue regulatory approvals of its products in Canada, the EU,
and the USA.
Regulatory approvals in Canada and the EU will be pursued first for each product to test
market the Company's products and generate revenues for entrance into the USA market.
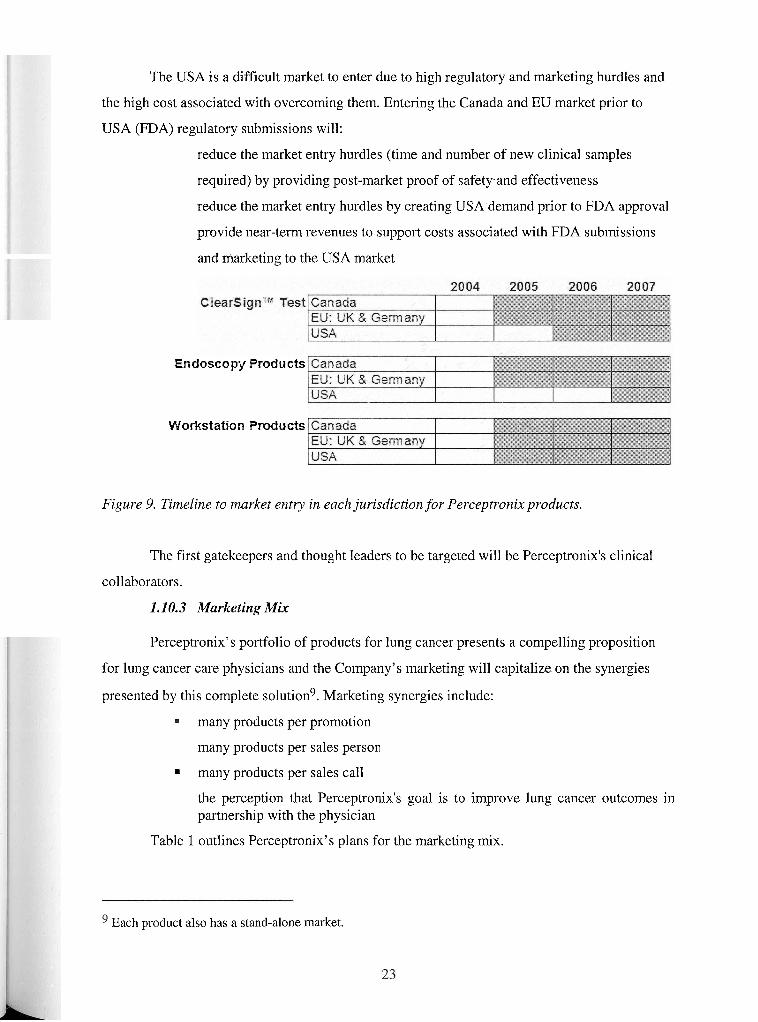
The USA is a difficult market to enter due to high regulatory and marketing hurdles and
the high cost associated with overcoming them. Entering the Canada and EU market prior to
USA (FDA) regulatory submissions will:
reduce the market entry hurdles (time and number of new clinical samples
required) by providing post-market proof of safety.and effectiveness
reduce the market entry hurdles by creating USA demand prior to FDA approval
provide near-term revenues to support costs associated with FDA submissions
and marketing to the USA market
Endoscopy Products
Workstation Products
Figure 9. Tirneline to market entry in each jurisdiction for Perceptronix products.
The first gatekeepers and thought leaders to be targeted will be Perceptronix's clinical
collaborators.
1.1 0.3 Marketing Mix
Perceptronix's portfolio of products for lung cancer presents a compelling proposition
for lung cancer care physicians and the Company's marketing will capitalize on the synergies
presented by this complete solution9. Marketing synergies include:
many products per promotion
many products per sales person
many products per sales call
the perception that Perceptronix's goal is to improve lung cancer outcomes in partnership with the physician
Table 1 outlines Perceptronix's plans for the marketing mix.
Each product also has a stand-alone market.
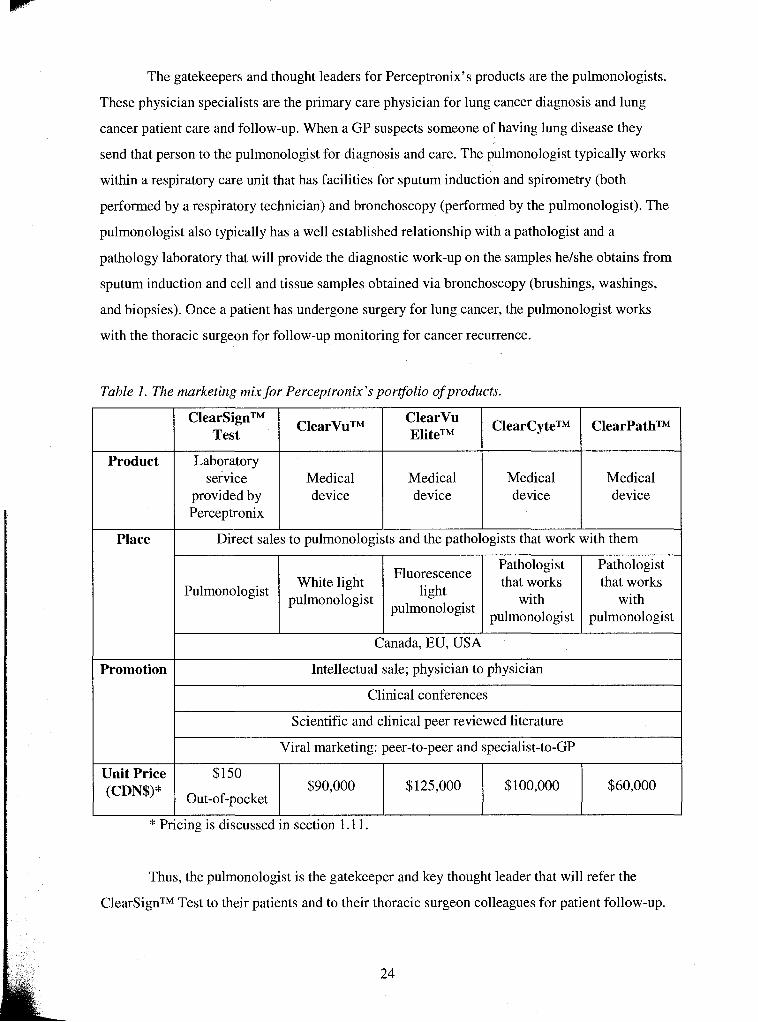
The gatekeepers and thought leaders for Perceptronix's products are the pulmonologists.
These physician specialists are the primary care physician for lung cancer diagnosis and lung
cancer patient care and follow-up. When a GP suspects someone of having lung disease they
send that person to the pulmonologist for diagnosis and care. The pulmonologist typically works
within a respiratory care unit that has facilities for sputum induction and spirometry (both
performed by a respiratory technician) and bronchoscopy (performed by the pulmonologist). The
pulmonologist also typically has a well established relationship with a pathologist and a
pathology laboratory that will provide the diagnostic work-up on the samples helshe obtains from
sputum induction and cell and tissue samples obtained via bronchoscopy (brushings, washings,
and biopsies). Once a patient has undergone surgery for lung cancer, the pulmonologist works
with the thoracic surgeon for follow-up monitoring for cancer recurrence.
Table 1. The marketing mix for Perceptronix's porqolio of products.
I Canada, EU, USA I
Product
I
Promotion I Intellectual sale; physician to physician
ClearCyteTM
Medical device
Pulmonologist
ClearPathTM
Medical device
Place
ClearSignTM Test
Laboratory service
provided by Perceptronix
Fluorescence light
pulmonologist
White light pulmonologist
Direct sales to pulmonologists and the pathologists that work with them
I
ClearVuTM
Medical device
Pathologist that works
with pulmonologist
Clinical conferences
I
ClearVu EliteTM
Medical device
Pathologist that works
with pulmonologist
Scientific and clinical peer reviewed literature
I
Thus, the pulmonologist is the gatekeeper and key thought leader that will refer the
ClearSignTM Test to their patients and to their thoracic surgeon colleagues for patient follow-up.
Viral marketing: peer-to-peer and specialist-to-GP
Unit Price (CDN$)*
* Pricing is discussed in section 1.1 1.
$125,000 $100,000 $150
Out-of-pocket $60,000 $90,000
Patients will pay for the ClearSignTM Test out-of-pocket while Perceptronix works towards
public and private reimbursement. The pulmonologist are also the target consumer for the
Endoscopy Products and the key gatekeeper and thought leader that will refer the Workstation
Products to their pathologist colleagues for sample diagnosis.
It should be noted that the ClearVuTM and the ClearVu EliteTM will not be competing for
the same market segment.
The ClearVuTM is designed to convert current white light bronchoscopy users to the use
of fluorescence light. Fluorescence bronchoscopy is widely recognized by the medical
community as a necessary technology for early lung cancer localization. However, the number of
pulmonologists currently practising fluorescence bronchoscopy is small and limited to highly
expert users. This is because navigation in fluorescence light is difficult and time-consuming as
users typically image the patient in white light and then do a second scan in fluorescence mode.
To convert current white light users to fluorescence using current competitors offerings, the
pulmonologist must be re-trained to use fluorescence. Plus, the converting pulmonologist must be
willing to spend more time per procedure which will affect their billable hours. Thus, ClearVuTM
is designed to convert white light users to use of fluorescence by providing white light navigation
and simultaneous fluorescence imaging feedback. This innovation does not require the white
light pulmonologist to be re-trained and does not affect procedure time. Thus, Perceptronix
anticipates that the ClearVuTM will effectively grow the fluorescence bronchoscopy market by
converting white light users to fluorescence use. Early market research indicates that this will be
the case - white light users surveyed, thus far, are very interested in using ClearVuTM.
ClearVu EliteTM, on the other hand, is designed to be the next generation fluorescence
bronchoscope incorporating the innovations of ClearVuTM plus offering real-time spectral
analysis to reduce unnecessary biopsies. The customers for ClearVu EliteTM are current
fluorescence bronchoscopy users that want to improve their practise and possess the very latest
technological advances. These customers are the elite segment of the pulmonologist customer
population.
Sales of the Perceptronix product portfolio are expected to be intellectual or missionary
in nature. In other words, pulmonologists and the pathologists that they work with will need to be
educated regarding the science behind the Company's products and converted to the Company's
mission for better lung cancer patient outcomes. This is particularly true with the creation of the
ClearSignTM Test market. Since a new market is being created and this product is being fit into
the pulrnonologists current practise, Perceptronix will need to work with the pulmonologists to
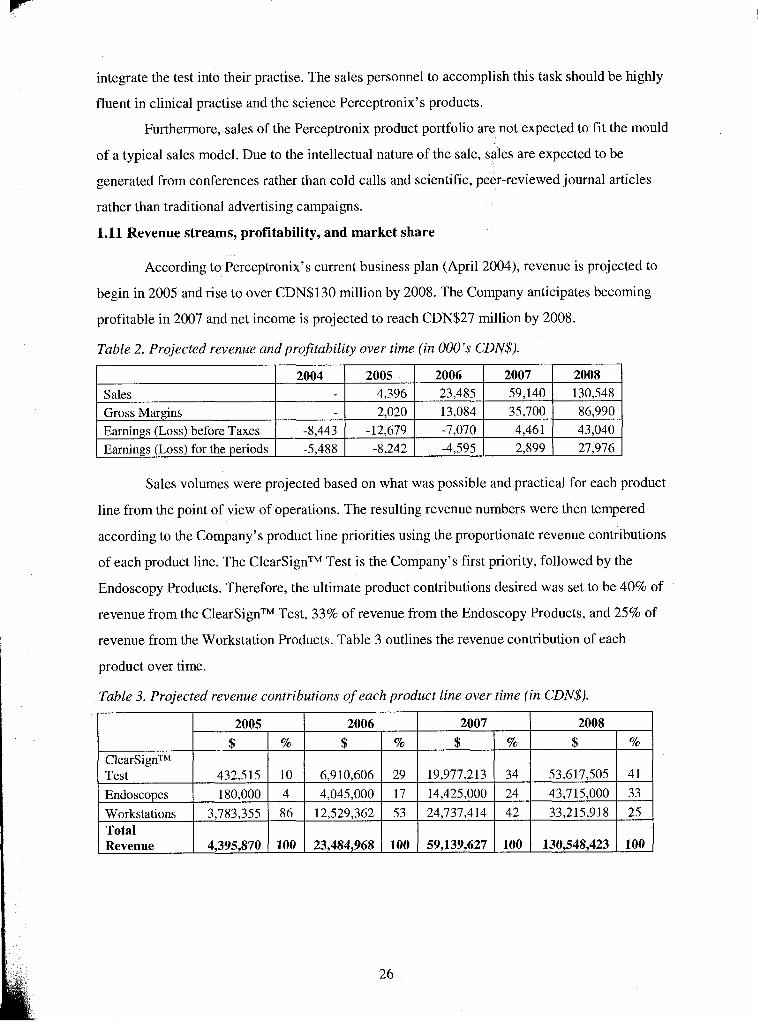
integrate the test into their practise. The sales personnel to accomplish this task should be highly
fluent in clinical practise and the science Perceptronix's products.
Furthermore, sales of the Perceptronix product portfolio are not expected to fit the mould
of a typical sales model. Due to the intellectual nature of the sale, sales are expected to be
generated from conferences rather than cold calls and scientific, peer-reviewed journal articles
rather than traditional advertising campaigns.
1.11 Revenue streams, profitability, and market share
According to Perceptronix's current business plan (April 2004), revenue is projected to
begin in 2005 and rise to over CDN$130 million by 2008. The Company anticipates becoming
profitable in 2007 and net income is projected to reach CDN$27 million by 2008.
Table 2. Projected revenue and profitability over time (in 000's CDN$).
Sales volumes were projected based on what was possible and practical for each product
line from the point of view of operations. The resulting revenue numbers were then tempered
according to the Company's product line priorities using the proportionate revenue contributions
of each product line. The ClearSignTM Test is the Company's first priority, followed by the
Endoscopy Products. Therefore, the ultimate product contributions desired was set to be 40% of
revenue from the ClearSignTM Test, 33% of revenue from the Endoscopy Products, and 25% of
revenue from the Workstation Products. Table 3 outlines the revenue contribution of each
product over time.
Table 3. Projected revenue contributions of each product line over time (in CDN$).
Sales Gross Margins Earnings (Loss) before Taxes Earnings (Loss) for the periods
( Revenue 1 4,395,870 1 100 1 23,484,968 1 100 1 59,139,627 1 100 1 130,548,423 1 100 1
2004
-8,443 -5,488
2005 4,396 2,020
-12,679 -8,242
2006 23,485 13,084 -7,070 -4,595
2007 59,140 35,700 4,46 1 2,899
2008 130,548 86,990 43,040 27,976
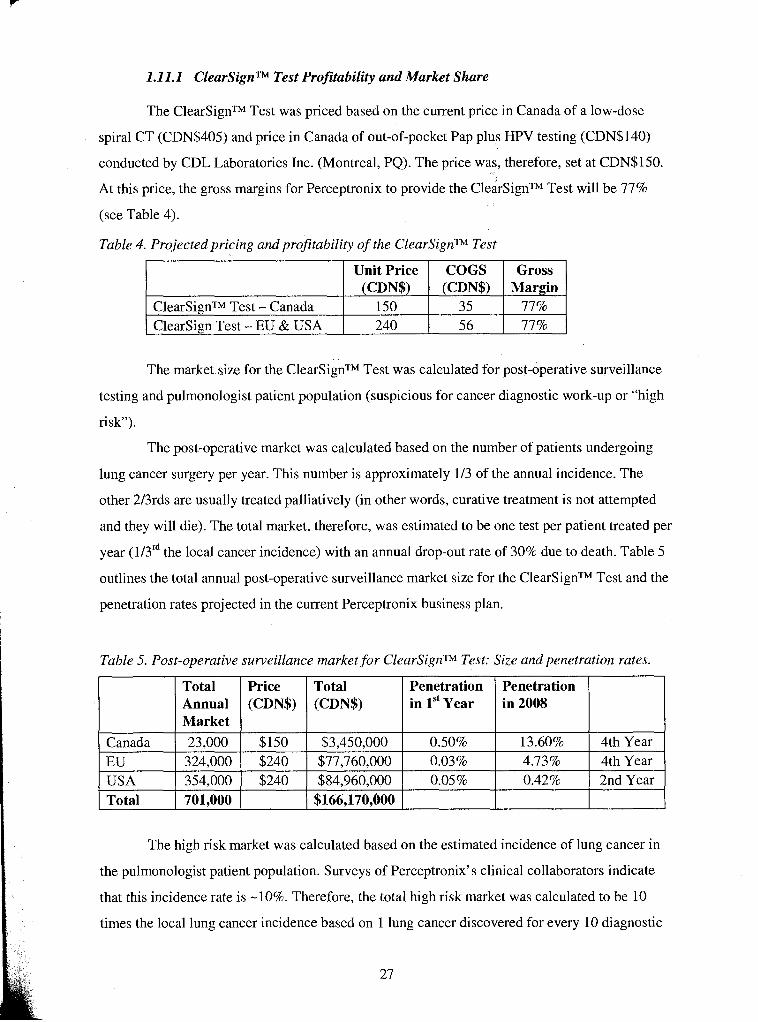
1.11.1 ClearSignTM Test Profitability and Market Share
The ClearSignTM Test was priced based on the current price in Canada of a low-dose
spiral CT (CDN$405) and price in Canada of out-of-pocket Pap plus HPV testing (CDN$140)
conducted by CDL Laboratories Inc. (Montreal, PQ). The price was, therefore, set at CDN$15O.
At this price, the gross margins for Perceptronix to provide the ClearSignTM Test will be 77%
(see Table 4).
Table 4. Projected pricing and profitability of the ClearSignTM Test
The market size for the ClearSignTM Test was calculated for post-operative surveillance
testing and pulmonologist patient population (suspicious for cancer diagnostic work-up or "high
risk").
The post-operative market was calculated based on the number of patients undergoing
ClearSignTM Test - Canada Clearsign Test - EU & USA
lung cancer surgery per year. This number is approximately 113 of the annual incidence. The
other 213rds are usually treated palliatively (in other words, curative treatment is not attempted
Unit Price (CDN$)
150 240
and they will die). The total market, therefore, was estimated to be one test per patient treated per
year (113'~ the local cancer incidence) with an annual drop-out rate of 30% due to death. Table 5
outlines the total annual post-operative surveillance market size for the ClearSignTM Test and the
penetration rates projected in the current Perceptronix business plan.
Table 5. Post-operative surveillance market for ClearSignTM Test: Size and penetration rates.
COGS (CDN$)
35 5 6
Gross Margin
77% 77%
Total Annual Market
Penetration in 1" Year
Price (CDN$)
Penetration in 2008
Canada EU
The high risk market was calculated based on the estimated incidence of lung cancer in
Total (CDN$)
USA Total
the pulmonologist patient population. Surveys of Perceptronix's clinical collaborators indicate
that this incidence rate is -10%. Therefore, the total high risk market was calculated to be 10
times the local lung cancer incidence based on 1 lung cancer discovered for every 10 diagnostic
23,000 324,000 354,000 701.000
$150 $240 $240
$3,450,000 $77,760,000 $84,960,000
$166,170,000
0.50% 0.03% 0.05%
I
0.42% 1 2nd Year
13.60% 4.73%
4th Year 4th Year
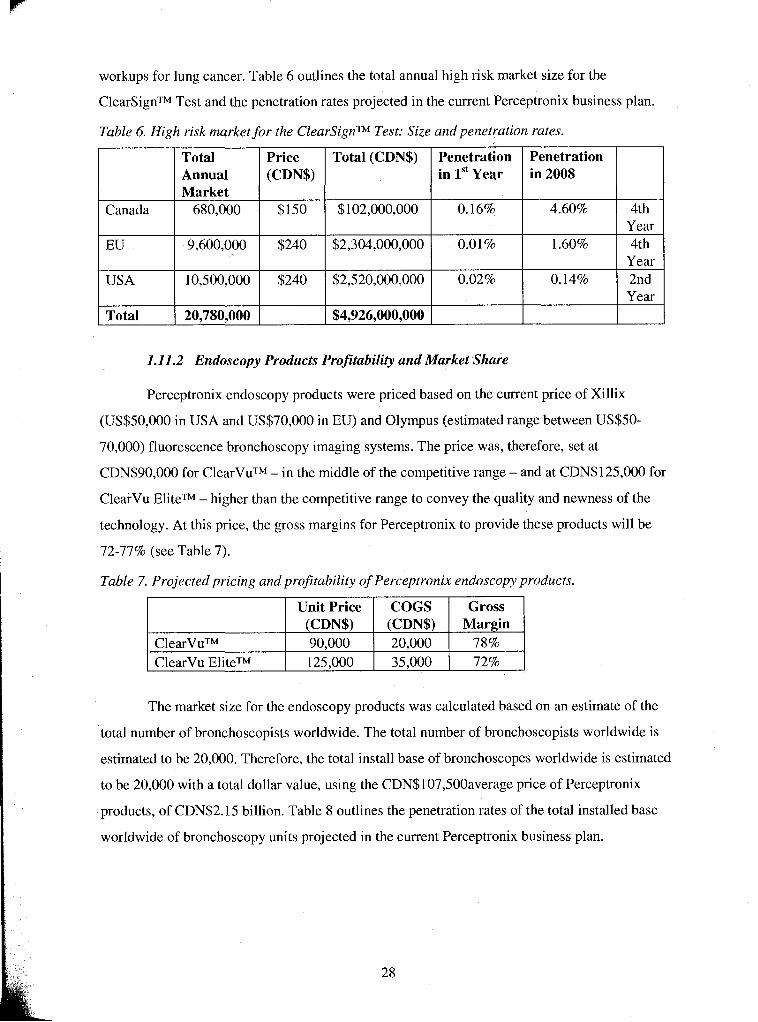
workups for lung cancer. Table 6 outlines the total annual high risk market size for the
ClearSignTM Test and the penetration rates projected in the current Perceptronix business plan.
Table 6. High risk market for the ClearSignTM Test: Size and penetration rates.
1.11.2 Endoscopy Products Profitability and Market Share
Canada
EU
USA
Total
Perceptronix endoscopy products were priced based on the current price of Xillix
(US$50,000 in USA and US$70,000 in EU) and Olympus (estimated range between US$50-
70,000) fluorescence bronchoscopy imaging systems. The price was, therefore, set at
CDN$90,000 for ClearVuTM - in the middle of the competitive range - and at CDN$125,000 for
ClearVu EliteTM - higher than the competitive range to convey the quality and newness of the
technology. At this price, the gross margins for Perceptronix to provide these products will be
72-77% (see Table 7).
Table 7. Projected pricing and profitability of Perceptronix endoscopy products.
Total Annual Market
680,000
9,600,000
10,500,000
20,780,000
The market size for the endoscopy products was calculated based on an estimate of the
ClearVuTM ClearVu EliteTM
total number of bronchoscopists worldwide. The total number of bronchoscopists worldwide is
estimated to be 20,000. Therefore, the total install base of bronchoscopes worldwide is estimated
to be 20,000 with a total dollar value, using the CDN$107,500average price of Perceptronix
products, of CDN$2.15 billion. Table 8 outlines the penetration rates of the total installed base
Price (CDN$)
$150
$240
$240
worldwide of bronchoscopy units projected in the current Perceptronix business plan.
Unit Price (CDN$) 90,000 125,000
Total (CDN$)
$102,000,000
$2,304,000,000
$2,520,000,000
$4,926,000,000
COGS (CDN$) 20,000 35,000
Penetration in 1" Year
0.16%
0.01%
0.02%
Gross Margin
78% 72%
Penetration in 2008
4.60%
1.60%
0.14%
4th Year 4th
Year 2nd Year
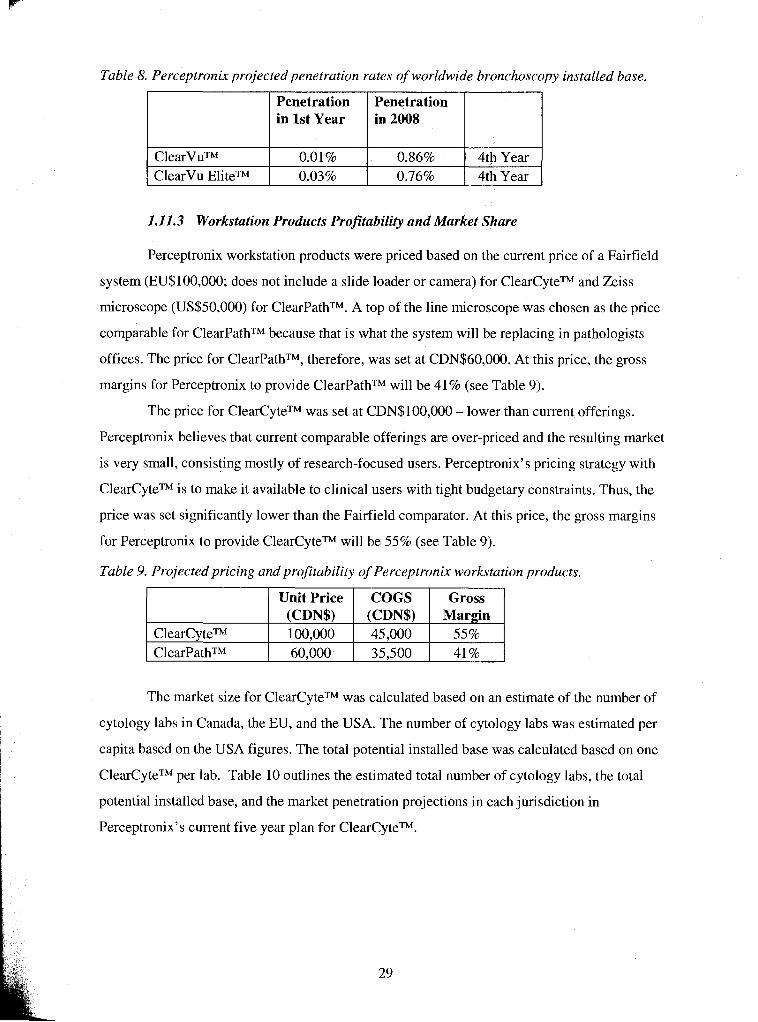
Table 8. Perceptronix projected penetration rates of worldwide bronchoscopy installed base.
I ClearVu EliteTM 1 0.03% 1 0.76% 14th Year I
Penetration in 1st Year
1.11.3 Workstation Products Profitability and Market Share
Penetration in 2008
Perceptronix workstation products were priced based on the current price of a Fairfield
system (EU$100,000; does not include a slide loader or camera) for ClearCyteTM and Zeiss
microscope (US$50,000) for ClearPathTM. A top of the line microscope was chosen as the price
comparable for ClearPathTM because that is what the system will be replacing in pathologists
offices. The price for ClearPathTM, therefore, was set at CDN$60,000. At this price, the gross
margins for Perceptronix to provide ClearPathTM will be 41% (see Table 9).
The price for ClearCyteTM was set at CDN$100,000 - lower than current offerings.
Perceptronix believes that current comparable offerings are over-priced and the resulting market
is very small, consisting mostly of research-focused users. Perceptronix's pricing strategy with
ClearCyteTM is to make it available to clinical users with tight budgetary constraints. Thus, the
price was set significantly lower than the Fairfield comparator. At this price, the gross margins
for Perceptronix to provide ClearCyteTM will be 55% (see Table 9).
Table 9. Projected pricing and profitability of Perceptronix workstation products.
Gross I ' U n i t ~ r i c e ~ ~ ~ S 55i--l (CDN$) (CDN$) Mar in
ClearCyteTM 100,000 45,000 ClearPathTM 60,000 35,500 41%
The market size for ClearCyteTM was calculated based on an estimate of the number of
cytology labs in Canada, the EU, and the USA. The number of cytology labs was estimated per
capita based on the USA figures. The total potential installed base was calculated based on one
ClearCyteTM per lab. Table 10 outlines the estimated total number of cytology labs, the total
potential installed base, and the market penetration projections in each jurisdiction in
Perceptronix's current five year plan for ClearCyteTM.
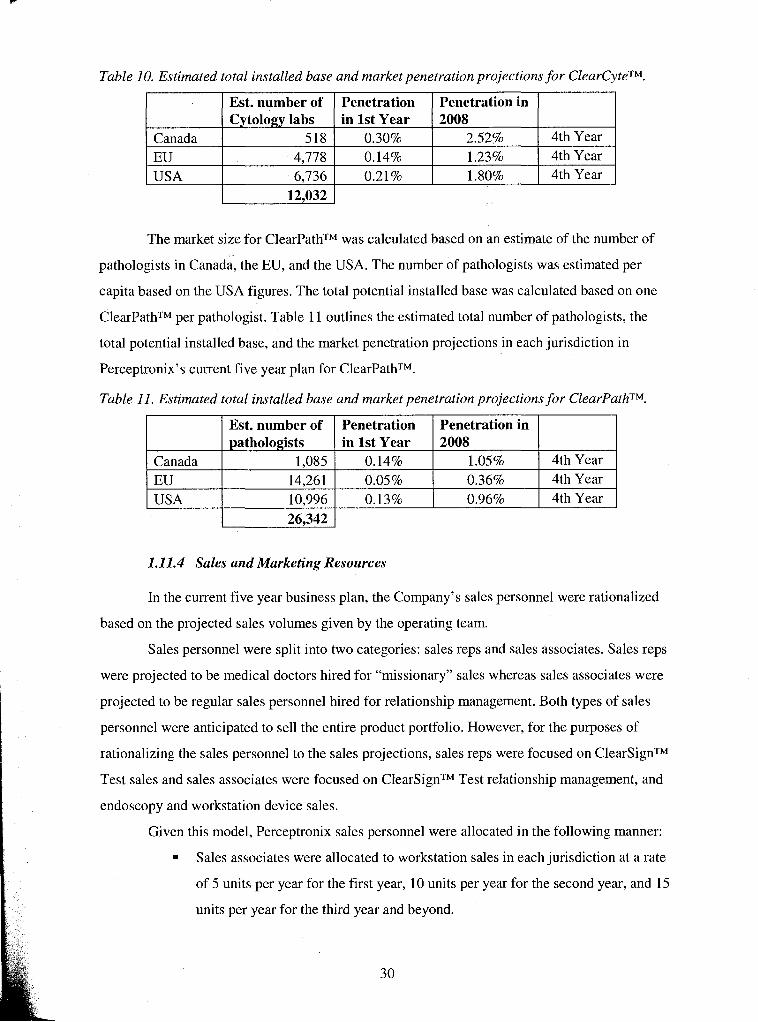
Table 10. Estimated total installed base and market penetration projections for ClearCyteTM.
The market size for ClearPathTM was calculated based on an estimate of the number of
pathologists in Canada, the EU, and the USA. The number of pathologists was estimated per
capita based on the USA figures. The total potential installed base was calculated based on one
ClearPathTM per pathologist. Table 11 outlines the estimated total number of pathologists, the
total potential installed base, and the market penetration projections in each jurisdiction in
Perceptronix's current five year plan for ClearPathTM.
Table 11. Estimated total installed base and market penetration projections for ClearPathTM.
1 USA
I I Est. number of I Penetration I Penetration in I
4th Year 4th Year
Canada EU
6,736 12,032
Est. number of Cytology labs
518 4.778
Canada
1 26,342 1
1.11.4 Sales and Marketing Resources
0.21%
EU USA
In the current five year business plan, the Company's sales personnel were rationalized
based on the projected sales volumes given by the operating team.
Sales personnel were split into two categories: sales reps and sales associates. Sales reps
were projected to be medical doctors hired for "missionary" sales whereas sales associates were
projected to be regular sales personnel hired for relationship management. Both types of sales
personnel were anticipated to sell the entire product portfolio. However, for the purposes of
rationalizing the sales personnel to the sales projections, sales reps were focused on ClearSignTM
Test sales and sales associates were focused on ClearSignTM Test relationship management, and
endoscopy and workstation device sales.
Given this model, Perceptronix sales personnel were allocated in the following manner:
Sales associates were allocated to workstation sales in each jurisdiction at a rate
of 5 units per year for the first year, 10 units per year for the second year, and 15
units per year for the third year and beyond.
Penetration in 1st Year
0.30% 0.14%
1.80% I 4th Year I
pathologists 1,085
Penetration in 2008
2.52% 1.23%
14,261 10.996
in 1st Year 0.14% 0.05% 0.13%
2008 1.05% 4th Year 0.36% 0.96%
4th Year 4th Year
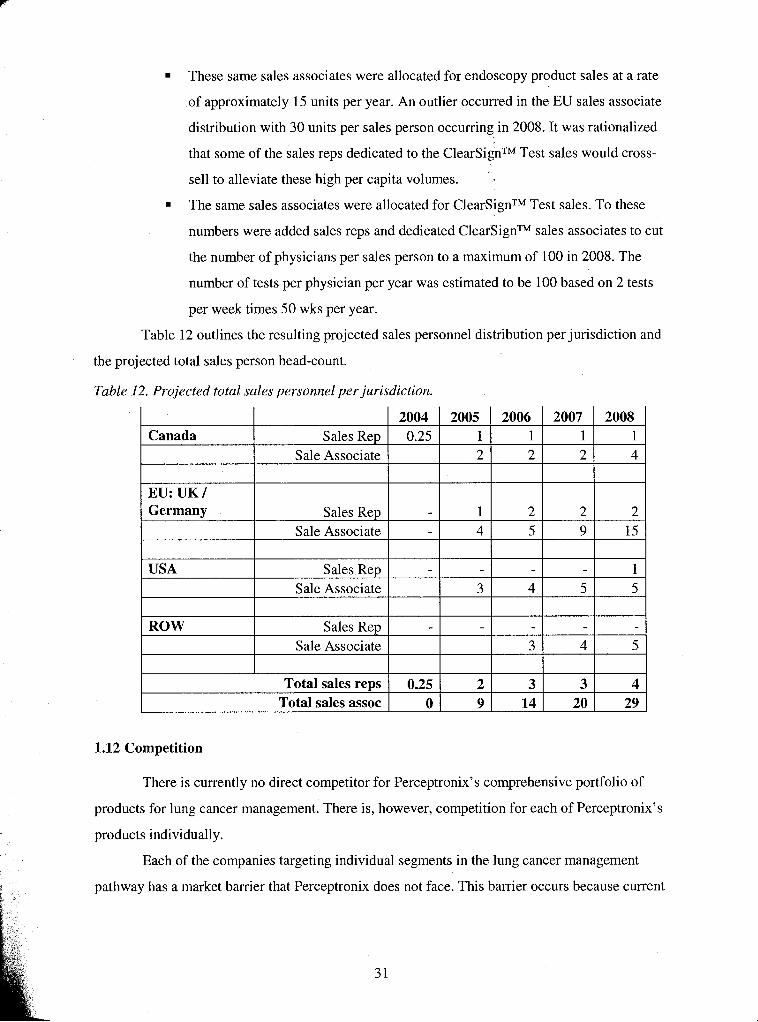
These same sales associates were allocated for endoscopy product sales at a rate
of approximately 15 units per year. An outlier occurred in the EU sales associate
distribution with 30 units per sales person occurring in 2008. It was rationalized
that some of the sales reps dedicated to the ClearSignTM Test sales would cross-
sell to alleviate these high per capita volumes.
The same sales associates were allocated for ClearSignTM Test sales. To these
numbers were added sales reps and dedicated ClearSignTM sales associates to cut
the number of physicians per sales person to a maximum of 100 in 2008. The
number of tests per physician per year was estimated to be 100 based on 2 tests
per week times 50 wks per year.
Table 12 outlines the resulting projected sales personnel distribution per jurisdiction and
the projected total sales person head-count.
Table 12. Projected total sales personnel per jurisdiction.
Canada
EU: UK 1 Germany
2007 1 2
USA
2008 1 4
Sales Rep Sale Associate
Sales Rep Sale Associate
ROW
Sales Rep Sale Associate
Sales R ~ D Sale Associate
1.12 Competition
There is currently no direct competitor for Perceptronix's comprehensive portfolio of
products for lung cancer management. There is, however, competition for each of Perceptronix's
products individually.
Each of the companies targeting individual segments in the lung cancer management
pathway has a market barrier that Perceptronix does not face. This barrier occurs because current
2004 0.25
1 4
Total sales reps Total sales assoc
3
3
2005 1 2
2 5
0.25 0
2006 1 2
4
4
2 9
5
2 9
2 15
5 1 5
3 14
3 20
4 29
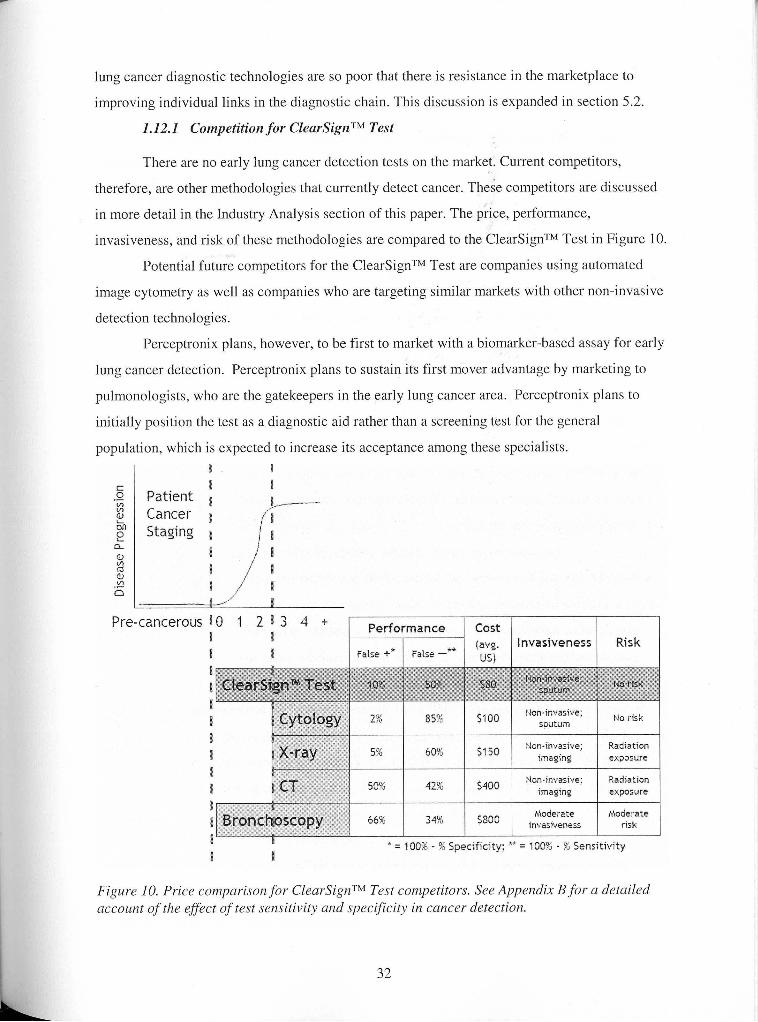
lung cancer diagnostic technologies are so poor that there is resistance in the marketplace to
improving individual links in the diagnostic chain. This discussion is expanded in section 5.2.
1.12.1 Competition for ClearSignTM Test
There are no early lung cancer detection tests on the market. Current competitors,
therefore, are other methodologies that currently detect cancer. These competitors are discussed
in more detail in the Industry Analysis section of this paper. The price, performance,
invasiveness, and risk of these methodologies are compared to the ClearSignTM Test in Figure 10.
Potential future competitors for the ClearSignTM Test are companies using automated
image cytometry as well as companies who are targeting similar markets with other non-invasive
detection technologies.
Perceptronix plans, however, to be first to market with a biomarker-based assay for early
lung cancer detection. Perceptronix plans to sustain its first mover advantage by marketing to
pulmonologists, who are the gatekeepers in the early lung cancer area. Perceptronix plans to
initially position the test as a diagnostic aid rather than a screening test for the general
population, which is expected to increase its acceptance among these specialists.
I I Patient
I J Cancer I Staging I
Pre-cancerous D
Performance Cost *, (avg. invasiveness Risk
1 False +* False -
* = 100% - % Specificity; ** = 100% - % Sensitivity
Figure 10. Price comparison for ClearSignTM Test competitors. See Appendix B for a detailed account of the effect of test sensitivity and specificity in cancer detection.
1.12.1 .I Direct Competitors
The ClearSignTM Test has a number of direct competitors in the early lung cancer
detection area. Similar to Perceptronix, these companies are using technologies that are based on
detection of global changes in the body created by the presence of ling cancer and are thus able
to detect lung cancer at its earliest stages. Companies in this category include:
Menssana Research Inc. (Fort Lee, NJ) with a breath test for lung cancer based
on chemical analysis of compounds associated with cancer in exhaled air. The
Company has one test approved for heart transplant rejection and has announced
plans to submit its lung cancer detection test for FDA approval.
In 2003 this test was reported to have twice as many false positives as
the ClearSignTM Test. In other words, twice as many people will
unnecessarily have to undergo costly follow-up procedures and the
trauma of a false diagnosis compared to the ClearSignTM Test. This
number is highly significant because it applies to the vast majority of the
test population that do not have cancer. In other words, if 99% of the
people taking the Menssana test do not have cancer, 20% of them will
get a false positive result. This is a very large number, thus, this test, at
its current performance, would do more harm than good.
The published test performance of the Menssana's test was based on a
very small dataset (n=187 total).1•‹ Thus, it is hard to determine whether
this will be the test's performance on a real population and difficult to
speculate whether the test represents a real competitive threat to the
ClearSignTM Test. This test may never reach the marketplace.
International Medical Innovations Inc. ("IMI"; Toronto, ON) is developing a
lung cancer detection test, the LungAlert Test, based on a colour-based, chemical
detection of sugars present in sputum. The Company has a test for cholesterol
detection approved in Canada, USA, and Europe and they have partnered with
Johnson & Johnson for distribution and marketing of this test.
In 2003 IMI announced it is formulating its FDA strategy for the
LungAlert Test and will be targeting the US lung cancer screening
Phillips, M. et al. 2003. Chest 123: 21 15-2123.
market. A successful screening application will require long term
outcome data; thus, IMI is likely to be at least 5 years from market with
the LungAlert test.
= In 2003 IMI joined a large international lung cancer screening study to
test approximately 1000 patients with the LungAlert test.
The LungAlert Test's current performance based on a small sample size
( ~ 1 2 3 total; 55 cancers of which 33 were Stage I; 68 high risk non-
cancers) appears to be significantly less than the ClearSignTM Test. At
90% specificity, their sensitivity is less than 20%., compared to 50% for
the ClearSignTM Test. Furthermore, their test appears to work better on
advanced lung cancers than early stage lung cancer with approximately
twice the galactose oxidase Schiff result for Stage III/TV as for Stage I
lung cancer. Therefore, Perceptronix believes that this technology
does not represent a significant competitive threat for early lung cancer
detection and that it will be some time before this test makes it into the
marketplace, if ever.
Molecular Marker Companies
Molecular Marker companies present a threat to Perceptronix as these companies could
potentially create substitute products for lung cancer detection.
However, most of these technologies need to have cancer cells present in the sample in
order to detect cancer. For detecting early lung cancer this is a problem because sputum samples
from patients with an early stage tumour are unlikely to have cancer cells in the specimen,
whether it is a sputum or a blood specimen. The tumour at this stage is a small clump of cells and
the area of the lung is comparable to the area of a tennis court. Therefore, the ClearSignTM Test is
believed to be able to out-compete competitors molecular marker-based tests in the detection of
early cancer. Companies in this category include:
AMDL Inc. (Tustin, CA) has developed a cancer blood test for 13 types of
cancer including lung cancer. ADML's studies have been based on detection of
late stage, invasive cancer and it is unknown whether this test can detect early
stage lung cancer. In 2002, AMDL received approval to sell this test in Canada,
Data presented at American Thoracic Society 2004. Talk entitled, "Examination of the association of galactose oxidase Schiff s reactivity in sputum with lung cancer." By Drs Cox and Miller.
Australia, and New Zealand. In 2004, the FDA declined AMDL's 5 10(k)
submission for the test. It appears that AMDL's test cannot differentiate between
the cancer types - a positive test will indicate the presence of cancer but not
which type.
Biomoda Inc. (Albuquerque, NM) has published objectives to developing a
sputum sample cytopathology reagent kit (TCPP) for diagnosing lung cancer. No
information is available regarding its progress.
CeMines Inc. (Evergreen, CO) is developing an antibody based blood test for
many cancers, including lung. In 2003 CeMines partnered with Aldrich Sigma to
sell monoclonal antibodies. It appears that CeMines has shifted focus to become
a research reagent company.
Matritech Inc. (Newton, MA) has developed a bladder cancer diagnostic product
based on a proprietary nuclear matrix protein. In 2003 it announced that its next
goal is the development of a lung cancer test. No information is available
regarding its progress. It is very unlikely that a lung cancer detection test can be
developed using the same technology as the bladder cancer test. Therefore, it
will be many years before this company is a competitive threat, if ever.
= Hoffman La Roche Inc. (Burlington, NC) has just announced a 3 year plan for
developing a range of molecular diagnostic products based on cancer-caused
DNA changes. No information is available regarding their progress.
Development timelines for this kind of endeavour are lengthy; therefore, it will
be many years before this company is a competitive threat, if ever.
There has been some speculation that lung cancer specific molecular markers will eclipse
other technologies. Perceptronix believes that it is unlikely that molecular markers will eclipse
the ClearSignTM Test as the test of preference for early lung cancer detection in the general
population. The reasons for this belief are threefold:
= Molecular markers need cancer cells present in order to detect cancer and such
samples are difficult to obtain.
Cancer is a heterogeneous disease with over 200 different mechanisms of action
identified. Thus, it is unlikely that a single molecular marker will be general and
specific enough to detect most lung cancers.
Developing a panel of markers that will be general and specific enough to detect
most lung cancers is likely to be expensive and time-consuming.

1.12.1.3 Automated Imaging Companies
Automated Imaging companies are a threat to Perceptronix because they are large
companies using similar technologies to Perceptronix. None of these companies are currently
focused on lung cancer diagnostics but their potential entry is a threat. TriPath Imaging Inc.
(Burlington, NC) and Cytyc Corporation (Boxborough, MA) in the dervical cancer diagnostics
industry are two companies in this category.
1.12.2 Competition for Endoscopy Products
The fluorescence endoscopy imaging system market is highly competitive. Several multi-
national firms including Olympus (Shinjuku-ku, Tokyo) and Pentax (Chuo-ku, Tokyo) are major
active players. There are also several smaller firms including Storz (Tuttlingen, Germany), Wolf
(Vernon Hills, IL), and Xillix (Vancouver, BC).
Olympus and Pentax market fiber optic endoscopes as well as fluorescence imaging
systems. Most other fluorescence endoscopy system companies design their systems to use these
fiber optic endoscopes as well. Olympus and Pentax latest products are video endoscopes and
fluorescence imaging systems. These have lower image quality for fluorescence imaging but
better image quality for white light.
Storz, Wolf, and Xillix market fluorescence imaging systems. These systems have
instantaneous switching between white light and fluorescence field of view. Storz makes fiber
endoscopes as well and their imaging system will only work with their endoscopes.
The most advanced technology and best image quality is thought to be provided by
Xillix. Their Onco-LIFE system provides capabilities for split-screen freeze-frame imaging in
white light while real-time imaging in fluorescence light or vice versa. They also provide a real-
time measurement of the red-green imaging ratio for lesion detection. Xillix intends gain
approval for use of this product for GI tract imaging as well - a market that is estimated to be 3-
10 times the size of the bronchoscopy market.
The price comparisons that are available at this time are Olympus at ~ S $ 5 0 - 7 0 , 0 0 0 ~ ~
and Xillix (Onco-LIFE) at US$50,000 for the US market and US$70,000 for the EU market.13
Perceptronix products offer solutions that address the problems of conventional
bronchoscopy without having to re-train bronchoscopists. This gives the Company's products a
l2 Estimate provided by Dr. S. Lam (BCCA).
l 3 Described by Ms. Cynthia Rooney (CEO, Xillix) at MedTech 2004 in Vancouver, BC.
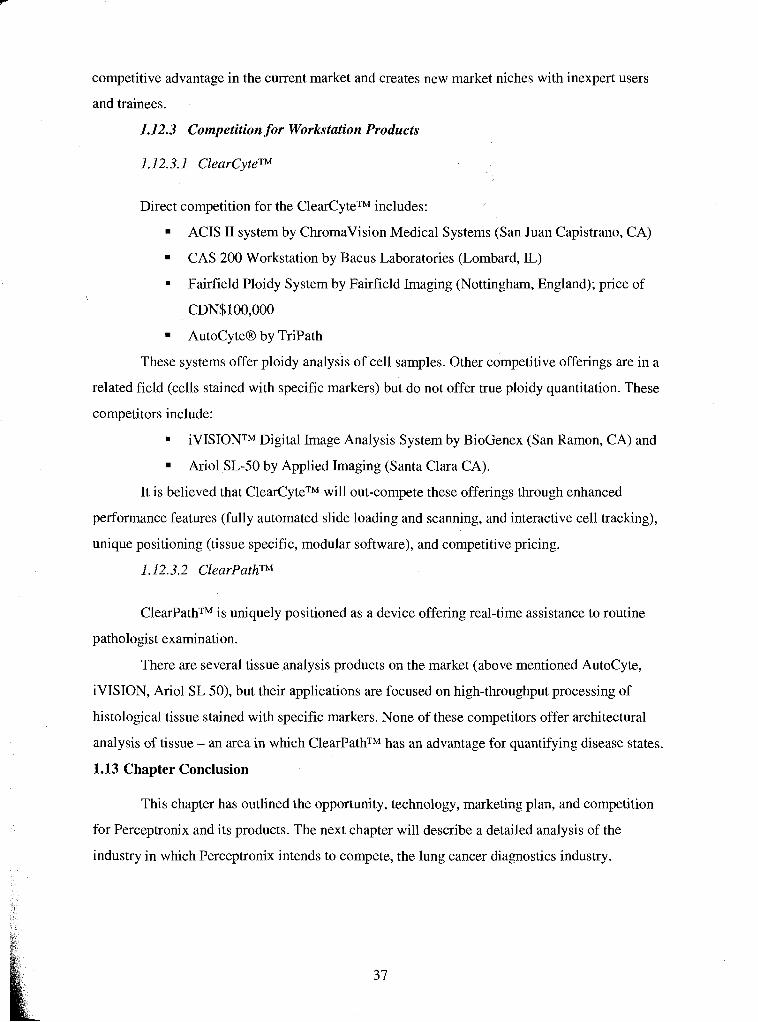
competitive advantage in the current market and creates new market niches with inexpert users
and trainees.
1.12.3 Competition for Workstation Products
Direct competition for the ClearCyteTM includes:
ACIS I1 system by Chromavision Medical Systems (San Juan Capistrano, CA)
CAS 200 Workstation by Bacus Laboratories (Lombard, IL)
Fairfield Ploidy System by Fairfield Imaging (Nottingham, England); price of
CDN$100,000
AutoCyte@ by TriPath
These systems offer ploidy analysis of cell samples. Other competitive offerings are in a
related field (cells stained with specific markers) but do not offer true ploidy quantitation. These
competitors include:
iVISIONTM Digital Image Analysis System by BioGenex (San Ramon, CA) and
Ariol SL-50 by Applied Imaging (Santa Clara CA).
It is believed that ClearCyteTM will out-compete these offerings through enhanced
performance features (fully automated slide loading and scanning, and interactive cell tracking),
unique positioning (tissue specific, modular software), and competitive pricing.
1 .12.3.2 ClearPathTM
ClearPathTM is uniquely positioned as a device offering real-time assistance to routine
pathologist examination.
There are several tissue analysis products on the market (above mentioned AutoCyte,
iVISION, Ariol SL 50), but their applications are focused on high-throughput processing of
histological tissue stained with specific markers. None of these competitors offer architectural
analysis of tissue - an area in which ClearPathTM has an advantage for quantifying disease states.
1.13 Chapter Conclusion
This chapter has outlined the opportunity, technology, marketing plan, and competition
for Perceptronix and its products. The next chapter will describe a detailed analysis of the
industry in which Perceptronix intends to compete, the lung cancer diagnostics industry.
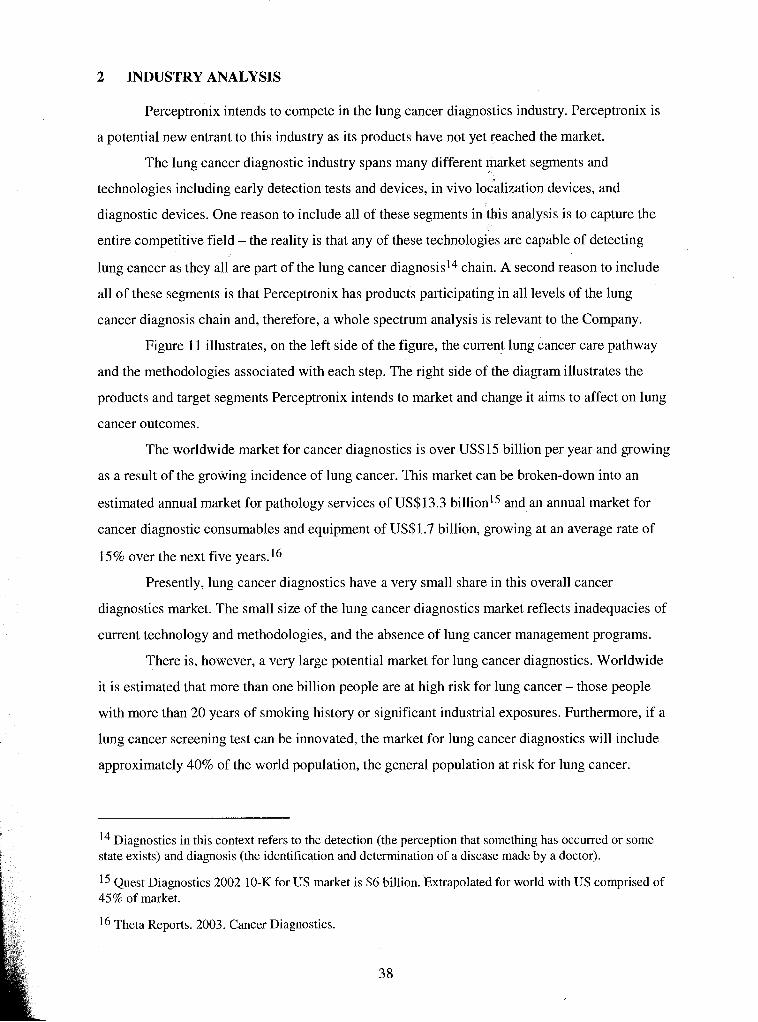
2 INDUSTRY ANALYSIS
Perceptronix intends to compete in the lung cancer diagnostics industry. Perceptronix is
a potential new entrant to this industry as its products have not yet reached the market.
The lung cancer diagnostic industry spans many different market segments and
technologies including early detection tests and devices, in vivo localization devices, and
diagnostic devices. One reason to include all of these segments in this analysis is to capture the
entire competitive field - the reality is that any of these technologies are capable of detecting
lung cancer as they all are part of the lung cancer diagnosis14 chain. A second reason to include
all of these segments is that Perceptronix has products participating in all levels of the lung
cancer diagnosis chain and, therefore, a whole spectrum analysis is relevant to the Company.
Figure 1 I illustrates, on the left side of the figure, the current lung cancer care pathway
and the methodologies associated with each step. The right side of the diagram illustrates the
products and target segments Perceptronix intends to market and change it aims to affect on lung
cancer outcomes.
The worldwide market for cancer diagnostics is over US$15 billion per year and growing
as a result of the growing incidence of lung cancer. This market can be broken-down into an
estimated annual market for pathology services of US$13.3 billion15 and an annual market for
cancer diagnostic consumables and equipment of US$1.7 billion, growing at an average rate of
15% over the next five years.16
Presently, lung cancer diagnostics have a very small share in this overall cancer
diagnostics market. The small size of the lung cancer diagnostics market reflects inadequacies of
current technology and methodologies, and the absence of lung cancer management programs.
There is, however, a very large potential market for lung cancer diagnostics. Worldwide
it is estimated that more than one billion people are at high risk for lung cancer - those people
with more than 20 years of smoking history or significant industrial exposures. Furthermore, if a
lung cancer screening test can be innovated, the market for lung cancer diagnostics will include
approximately 40% of the world population, the general population at risk for lung cancer.
l4 Diagnostics in this context refers to the detection (the perception that something has occurred or some state exists) and diagnosis (the identification and determination of a disease made by a doctor).
l5 Quest Diagnostics 2002 10-K for US market is $6 billion. Extrapolated for world with US comprised of 45% of market.
l6 Theta Reports. 2003. Cancer Diagnostics.
nosis Leads to Poor Outcome
Perceptronix Products: Eartier nosis for Better OuEco
Figure I I . A comparison of the current lzing cancer management pathway and outcomes and Perceptronix's lung cancer management pathway and outcomes.
2.1 Porter's Five Factor Analysis
The analysis of the competitive factors, attractiveness, and key success factors for
individual firms outlined in this document of the world's lung cancer diagnostics industry has
been performed using Michael Porter's five forces model. Porter's model takes into account the
following five factors: rivalry amongst incumbent firms, the threat of new entrants, the
bargaining power of suppliers, the bargaining power of customers, and the threat of substitutes.
Figure 12 summarizes the factors contributing to each force in the lung cancer diagnostics
industry.
L nv
t
(+)
Labo
ur:
a sh
orta
ge o
f sp
ecta
ltsts
(+
) L
arg
e c
onip
anle
s [-
) R
elab
uelv
ho
nia
ge
rtw
us
prod
ucts
<-
I Mul
tiple
ven
dors
Lu
ng
Ca
nc
er
Dia
gn
ost
ics
Ind
ust
ry, 2004
i+j
La
rge
nia
tke
c la
rgel
y ttn
tapp
ed,
qrow
lng
:+)
La
rge
un
me
t nee
d -
earl
v l
un
~
canc
er
i+)
Cur
rent
tec
hnol
og.+
tnsu
ffla
en
t i+
j Tec
hi-ia
lc;g
~cal
chan
ge l
rnno
vatlo
n I-
] H
fgh
R&
D I
nve
stm
en
t (+
) P
aten
t pro
tecb
on
(-
) La
m b
rand
tng
Ad
barr
ler
I-)
H~
gh
re
pula
torv
hut
dles
i-
l C
~FFt
cult d
~st
r~b
utr
on
<-
I Lon
g tm
elt
ne
to
reve
nue
I I
bfud
n aTP
{-:I
Co
nip
ft~
bv
e conc
entr
atto
n IS
hig
h
i-i Iv
lark
et g
row
th IS
litg
h
{+!
Co
nip
et~
t~e
n
for
heal
thca
re d
wlta
rs
I-]
Incr
easm
g s
w~
tch
~n
g
cost
s (+
) R
ela
tive
ly h
omog
eneo
us p
rod
uct
s fx
lblry
(ti R
olw
st p
rod
ud
ptp
elfn
es s
ncf
Inno
vatI
an p
rope
nskg
I+
>
T11
ne to
nia
tke
t IS
tin
po
rta
nt
.trod
et ar
u to H
I@
(+)
Flu
lhpl
e ga
keho
lder
s J+
J D
~st
nb
uto
rs are
gate
keep
ers
{+I
Info
rn~
atr
on
assv
nini
etrv
(+
) O
ne t
o o
ne s
elltn
g !+
J La
t ge
capt
tal
erpe
ndltu
res
(-)
Mot
e he
alth
cm
sclo
clsn
ess
and
shlft
m
dem
ogra
pht:
~ (
alde
r;
mo
re e
x-m
ake
rs]
(+.I
Ee
latlv
dv
hom
ogen
eous
pro
duct
s [-
) P
rodu
cts
seen
as
htg
h v
alue
add
(-1
L~
ck
of
bu
y=
conc
entr
atio
n
lo *
(+)
No
da
gn
as~
s j+
) N
$on-
bad
ttl m
a1
nie
thad
s [+
j d
ltern
atlv
e d
l str
~b
utl
on
chan
nels
2.1.1 Rivalry
Rivalry in the lung cancer diagnostic industry is moderate. Rivalry is increased by the
relative homogeneity of existing products, strong innovation propensity of incumbent firms, and
intense competition for healthcare dollars but decreased by the high'c~rn~etitive concentration,
high market growth, and high switching costs.
2.1.1.1 (-) Competitive concentration is high
Existing companies in the lung cancer diagnostics market are companies with
bronchoscopy, CT, or pathology workstation offerings.
For fluorescence bronchoscopy, there are two multi-national firms including Olympus,
and Pentax, and three small firms including Storz, Wolf, and Xillix. For CT, there are several
multi-national firms including GE, Siemens, and Philips. For pathology workstations, there are
many firms including Chromavision Medical Systems, Bacus Laboratories, Fairfield Imaging,
Tripath, BioGenex, and Applied Imaging.
This competitive field decreases rivalry within the industry as market shares are
reasonably static and the presence of large companies in this space discourages the plays of small
companies to increase market share.
2.1.1.2 (-) Market growth is high
The lung cancer diagnostics market is expected to grow. It is estimated that the cancer
diagnostics market is growing at an average rate of 15% over the next five years. Lung cancer
diagnostics is expected to grow at no less than this rate and may grow exponentially if new
technologies that facilitate lung cancer screening reach the market.
There are currently no widely used technologies for early lung cancer detection or
screening and it has been widely acknowledged by both the medical fraternity and the industry
that such a solution is needed. While market size numbers are not available for lung cancer
diagnostics industry specifically, it is estimated that 1 billion people worldwide are currently at
high risk and as much as 40% of the world's population is at some risk for lung cancer.
This high growth rate decreases rivalry within the industry as companies can grow
revenues without having to grow market share through competition.
2.1.1.3 (+) Competition for healthcare dollars
The hospital and clinic budgets that pay for products in the lung cancer diagnostics
industry are slim and equipment is not re-purchased often. This circumstance increases rivalry
amongst existing competitors because they must compete within tight monetary limits typically
via a request for proposals system (which is much like tendering - a process of cost-based
competition) and if the sale is lost, the customer is lost for an extended period of time.
2.1.1.4 (+) High switching costs
As end consumers of these products are healthcare providers, the limited resources
available for new equipment purchases also has the effect of increasing rivalry as consumers are
less likely to purchase technology innovations until their existing equipment is due to be
replaced. This has the effect of decreasing the available pool of customers and, thus, increasing
rivalry.
2.1.1.5 (+) Relatively homogeneous products
The products within the lung cancer diagnostics market are relatively homogeneous.
While individual product classes are differentiated based on technology, performance, and
position in the diagnostic chain, multiple firms within a product class have similar technologies
and capabilities and, thus, have relatively homogeneous products. For example, Xillix innovated
the fluorescence bronchoscope a number of years ago and its patent was based on the product
design. Now, many other bronchoscopy companies have copied the idea of using fluorescence to
detect cancer and have gone around Xillix7s patent by changing the design to offer competing
fluorescence bronchoscopes. All of these offerings perform similarly, in other words enable the
visualization of early cancer lesions in the eyes of the customer, and are homogeneous. CTs are
viewed in a similar light.
The relative homogeneity of products within the lung cancer diagnostics industry
increases the rivalry between firms because they need to compete largely on price and convince
the consumer of the value of their product in comparison with the rest of the field.
2.1.1.6 (+) Robust product pipelines and innovation propensity
In this industry, existing firms support new product development and short timelines to
market via robust product pipelines and innovation capacity. These resources increase the rivalry
in the industry as most incumbents are focused on building better products and releasing them
faster than the competition. As a result, the industry's technology is quickly dated and companies
must innovate to keep up with the field.
2.1.1.7 (+) Time to market is important
As described in the section above, new product offerings in this space are copied very
quickly by the rest of the field. Products in this industry are protected by design rather than idea

patents as the science behind them has often been around for generations. The problem with
design rather than idea patents is that it is relatively trivial to engineer around a design patent.
Therefore, companies within this industry must be first to market with new products in order to
enjoy above-normal profits and this first to market advantage is not sustainable.
The pursuit of first mover advantage increases competition between existing firms, as
they try to reach the market first with new products.
2.1.2 Threat of Entry
The threat of entry to the lung cancer diagnostics industry can be characterized as
moderate to high. There is a very large and growing market and an unmet need, which increases
the threat of entry. However, there are substantial barriers to entry, which lessen this threat.
2.1.2.1 (+) Large market; largely untapped; growing
As described above, the lung cancer diagnostics market is growing and largely untapped
with regard to lung cancer screening and early detection. This makes it a very attractive market
for new entrants that can fill this demand.
2.1.2.2 (+) Large unmet need - early lung cancer
Lung cancer is a major, global problem that is responsible for more loss of life than any
other cancer. The problem has not been addressed by the current healthcare system - perhaps in
part because those at high risk for lung cancer, smokers and ex-smokers, have been thought to
bring this illness on themselves.
The large unmet need for early lung cancer diagnostics creates a major incentive for
government, healthcare bodies, public interest groups, and private sector funding groups to
support the entry of new firms into this area in the hopes of addressing this global problem.
2.1.2.3 (+) Current technology insufficient
As described above, the lung cancer problem is unmet by current products and
technologies. This creates an opportunity for new firms that can provide effective solutions to
this problem to enter the market with a technological advantage over incumbents and, thus,
increases the threat of entry.
2.1 .2.4 (+) Technological change / innovation
This industry is characterized by rapid technological change and innovation. Often it is
easier for smaller, new entrants to innovate more effectively and rapidly due to their smaller size
and singular focus. This is a competitive advantage that will attract new, small, innovative firms
to this industry.
2.1.2.5 (-) High R&D investment
In order to enter this industry, new firms must either meet or raise, through innovation,
the technological barrier created by current product offerings. High R&D spending is required to
do this and this investment erects a substantial barrier to entry for new firms. Firstly, new firms
must have the capability to perform the requisite R&D or the resources to purchase technology.
Secondly, new firms must have the resources to fund this R&D.
2.1.2.6 (+) Patent protection
It has been discussed that it is easy for firms to copy existing products in the lung cancer
diagnostics market. However, for totally new technology, there is great potential for patent
protection of more than just design. Therefore, entrants with new technology that have
appropriate patent protection will enjoy sustainable competitive advantage. This increases the
likelihood of entry for these firms.
2.1.2.7 (-) Low branding /Ad barrier
In the lung cancer diagnostics industry there is a low branding and advertising barrier for
new entrants. However, new firms have to establish their own brand to compete in this
marketplace. This is particularly important given the level of trust that needs to be established
with marketplace stakeholders in order to create demand for a healthcare product. Additionally,
most of the sales & marketing efforts will be focused on costly face-to-face sales. These high
brand and direct sales costs lower the threat of entry.
2.1.2.8 (-) High regulatory hurdles
This industry is regulated in every jurisdiction of the world by some kind of a healthcare
regulatory body. Some examples are Health Canada for Canada and the FDA for the US. These
regulatory bodies govern the market and in order to market a new product, entrants must prove
that their products are safe and effective for their intended use. This is usually proven through
lengthy human clinical trials and pre-market approval applications.
The process of getting regulatory body approval in every jurisdiction in which an entrant
wishes to market its product is a time- and resource-consuming exercise that erects a sizable
barrier to entry for new firms and new products (see Appendix A for details of the regulatory and
clinical hurdles for Perceptronix). New firms must not only be proficient in conducting clinical
trials and regulatory body applications, but also have the resources and the time necessary for
successful application.

2.1.2.9 (-) Dificult distribution
One of the most difficult problems facing this industry is that the sale of healthcare
products is complicated by the presence of multiple stakeholders. These stakeholders include:
doctors, who administer tests and use equipment for medical procedures
hospital/clinic administration, which pays for the equipment and approves the
use of tests
governing medical bodies, who dictate best practises
public healthcare systems (e.g. MSP or Medicare), HMOs and private insurers
that reimburse tests and procedures
patients, who receive the test or procedure
Each of these stakeholders can adversely affect the successful launch of a new product,
thus, personal and reputation-based selling are essential for navigating the distribution of
products in the lung cancer diagnostics industry. This creates a substantial barrier to entry as an
intimate knowledge of the appropriate path through the layers of bureaucracy and contacts within
each layer are necessary for selling success.
Direct and missionary selling to each of these stakeholders is also necessary for success
as these individuals are unlikely to be persuaded through mass media. Direct selling should take
the form of face-to-face sales calls and conference / seminar events where stakeholders have an
opportunity to question and challenge the science and clinical background behind the products.
However, there are key groups within these stakeholders that can contribute to viral, peer-to-peer
marketing once they are sold on the "mission" of these products. These groups are the thought
leaders within the doctor stakeholder group.
2.1.2.10 (- j Long timeline to revenue
The long R&D and regulatory approval timelines required for new product entry to this
industry results in long timelines to revenue for entrant firms. This erects a barrier to entry based
on having enough cash to get to revenues - a significant problem for cash-strapped start-up firms
in this industry.
2.1.3 Bargaining Power of Suppliers
The bargaining power of suppliers for this industry is low to moderate. While labour and
large suppliers increase the bargaining power, the homogeneous nature of industry inputs and
existence of multiple potential vendors mitigates this power.

2.1.3.1 (+) Labour: a shortage of specialists
Labour for this industry is highly specialized and skilled. A majority of them hold PhDs
and have significant research and industry experience. These people enable the innovation
necessary for competition and are often hard to find, especially in a highly specialized area of
science pursued by an individual company. Thus, this shortage of specialists increases the power
of labour as a firm's supplier - they are the life-blood of the Company's future and can leverage
this place of importance and scarcity for higher wages and greater job security.
2.1.3.2 (+) Large companies
Suppliers to this industry are companies supplying equipment like computers, monitors,
microscopes, cameras, slide loaders, scopes, and electronics. These companies are typically large
and command high bargaining power as they have multiple accounts and individual accounts are
unlikely to command much leverage.
2.1.3.3 (-) Relatively homogeneous products
Mitigating the bargaining power enabled by the large size of suppliers is the non-branded
and relatively homogeneous nature of their products. This gives firms in this industry freedom
and ease to change suppliers. This variable decreases the bargaining power of suppliers.
2.1.3.4 (-) Multiple vendors
There are multiple vendors for this industry's inputs throughout the world; therefore, a
firm has a choice between suppliers for their inputs. This decreases the bargaining power of
suppliers because they have to compete in a highly competitive worldwide market to win and
keep an individual firm's business.
2.1.4 Bargaining Power of Customers
The bargaining power of customers is moderate to high in this industry, mostly due to the
dynamics involved with selling to the healthcare industry. Multiple stakeholders, industry
gatekeepers, and tight healthcare budgets increase the bargaining power of customers. Lessening
this power is the lack of buyer concentration and the important value the lung cancer diagnostics
products perceived by the customer.
2.1.4.1 (+) Multiple stakeholders
There are multiple levels of stakeholders within the customer group (see the "(+)
Difficult distribution" section under "Threat of Entry"). Each of these stakeholder groups is
another layer of selling and bureaucracy and the sheer number of them increases customer
bargaining power - each group has to be targeted and appeased for successful sales.
2.1.4.2 (+) Distributors are gatekeepers
Many of the stakeholder groups are gatekeepers for sales, meaning that they have the
power to restrict or prevent sales. Doctors and hospital administrators, in particular, fall into this
category. The presence of gatekeepers in this industry significantly increases the bargaining
power of customers.
2.1.4.3 (+) Information asymmetry
The products offered by this industry are often based on complex technology, science,
and medicine. It is, therefore, difficult for customers to use andlor understand these products,
which increases the resources required for sale. Furthermore, the outcomes and information
generated by these products are often hard to interpret. For example, most studies using CT have
focused on patients in certain age and risk groups. For these patients, doctors can accurately
predict the likelihood that a lesion found by CT is cancer. However, a growing number of CTs
are being performed on healthy people (the worried well) by direct to consumer CT screening
companies. As a result, healthy people are showing up at doctor's offices with CT identified
lesions18 and doctors are unable to determine the likelihood that these lesions are cancer because
their risk is so low that it has not been characterized and quantified by clinical study.
Since the products in this industry are difficult to understand and interpret there exists a
high degree of information asymmetry regarding a particular product's benefits and intended use.
This makes selling more difficult and increases the bargaining power of customers - more time is
needed to demonstrate product benefits and complete sales.
2.1.4.4 (+) One to one selling
Information asymmetry and multiple stakeholders dictate the need for personal one on
one selling in this industry. This increases the bargaining power of customers because firms must
dedicate vast resources to building and expanding their selling networks, and building and
managing their reputations. Furthermore, firms rely heavily on and are relatively tied into their
customer networks for continued sales over the long term, which increases customer power.
l8 CT results in a high number of false positives - meaning a test result indicating cancer in a person that does not have cancer.
2.1.4.5 (+) Large capital expenditures
The purchase of products in this industry requires large capital expenditures by doctors
and hospital and clinic administrators from cash-limited budgets. Therefore, purchasing typically
entails long lead times, extensive research of potential purchases, and a request for proposal
system. All of these factors increase the bargaining power of supplikrs by increasing selling time
and creating a bidding selling environment.
2.1.4.6 (-) More health consciousness and shifting demographics (older; more ex-
smokers)
Patients in this industry are becoming increasingly involved in caring for their health and
are demanding better products. This creates pull-through demand for innovations and enables
small firms to survive. This group is increasing in number and will continue to be a powerful
buyer force in the near- to medium-term future.
2.1.4.7 (+) Relatively homogenous products
The current products in this industry are relatively homogeneous; therefore, customers
are not tied to individual products or brands. This increases customer power.
2.1.4.8 (-) Products seen as high value add
Counter-acting customer power in this industry is the necessity of lung cancer diagnostic
products. Lung cancer is a major health problem recognized by all industry stakeholder groups.
Patients demand lung cancer diagnostic products because of their fear of lung cancer. They apply
pressure to doctors, administrators, and regulatory bodies directly and through patient advocate
groups to implement best practises for lung cancer diagnosis. While current technologies may be
insufficient for early lung cancer detection (i.e. high false positive rates and/or low cancer
detection), these products are used necessarily to fill patient demand.
2.1.4.9 (-) Lack of buyer concentration
The most important stakeholders in the customer group for this industry are not
organized or concentrated. Doctors, hospital administrators, and patients largely make buying
decisions independently based on their best judgement. Moreover, there are many of these
customers. Thus, firms within this industry are not tied solely to an individual customer, resulting
in decreased buyer bargaining power.
2.1.5 Threat of Substitutes
The threat of substitutes is very low for this industry. Lung cancer diagnostics are a
necessary part of the current healthcare picture as lung cancer is deadly and affects such a large
percentage of the world's population. This being the case, a few substitutes are contemplated.
2.1.5.1 (+) Prophylactic lung cancer therapies
One potential substitute to lung cancer diagnosis is to take prophylactic lung cancer
prevention therapies. To date, no such compound has been developed but it is a project
contemplated by many natural product therapy companies and pharmaceutical companies. The
probability of such a drug being developed is slim and far in the future. As of yet, research
techniques do not have the ability to select for such products and the necessary clinical trials
would be lengthy in order to prove lung cancer prevention.
2.1.5.2 (+) No diagnosis
One alternative to diagnosis is to ignore lung cancer symptoms, both patients and
doctors, and let the disease run its course to death. Presently, this is a viable substitute given the
cost of the current technology and diagnostic process, particularly in poorer countries.
2.1.5.3 (+) Non-traditional methods
Lung cancer may be detected by other medical practitioners other than the traditional
medical fraternity like doctors of traditional Chinese medicine, dentists, or alternative medicine
practitioners. One would hope that once lung cancer was suspected by this group, the patient
would be referred into the traditional healthcare system for definitive diagnosis via lung cancer
diagnostics but some patients relying solely on alternative medical care may not.
2.1.6 Porter's Five Factor Analysis Conclusion
2.1.6. I Industry Attractiveness
The current lung cancer diagnostics industry is not very attractive. There is significant
rivalry between existing firms, fairly high threat of entry, and high bargaining power of
customers. Current technologies are dated and do not meet consumer's needs. Competitive
advantages are relatively fleeting and existing companies find it difficult to earn profits.
Moving forward, it is likely that new firms will enter this market, attracted by the large
market size and unmet need. These firms will likely change the competitive dynamics and
significantly increase the attractiveness of the industry. J
The new competitive environment will be based on innovation and differentiation. As
discussed above, new firms are likely to bring new, patent protected technology to this industry
that will effectively solve the current problems with lung cancer management - namely, enable
early detection of lung cancer to make curative treatment possible - and change lung cancer
management practises. The first movers will enjoy sustainable competitive advantages and high
profits based on critical mass acceptance of the technology blocking subsequent offerings (until
disruptive technology arises) and technology patent protection blocking mimicry.
2.1.6.2 Industry Key Success Factors
The four key success factors for this industry, now and moving forward, are: (I) product
innovation and patent protection; (2) being first to market and gaining critical mass; (3) having
ample capital resources; and (4) having marketing prowess specific to the healthcare industry.
These factors will be justified and defended in the remainder of the section.
Product innovation and patent protection is necessary to out compete other firms, now
and in the future, and to address the unmet healthcare need for lung cancer diagnostics. Product
innovations need to solve deficiencies in the current clinical practise. Patent protection needs to
be robust enough to keep others from mimicking successful product offerings. When at all
possible, idea patents rather than design patents should be sought.
Being a first mover and gaining critical mass with new technologies is important for
creating sustainable competitive advantage to earn profits. Healthcare is loath to change current
practises unless there is substantial evidence of increased benefit. Therefore, the first firm to
offer a new technology that effectively detects lung cancer earlier will need to convince the
healthcare stakeholders to change from the current technology. If the new technology is able to
gain a critical mass of users within the healthcare industry, this adopted technology will be
difficult to displace as the new market standard.
Having ample capital resources in order to get to revenues is a critical success factor in
this industry. The timelines for getting new products through regulatory approvals are lengthy
and the resources required for clinical trials and marketing of new products are substantial.
Finally, having marketing prowess specific to the healthcare industry is necessary for
success in this industry. The bargaining power of customers is substantial largely due to the
requirements of marketing products to the healthcare industry. Multiple stakeholders,
information asymmetry, the necessity to fit within healthcare budgets, and a lack of buyer
concentration all make negotiating the bureaucracy, personal selling, and marketing networks
very important to successful market acceptance.

2.2 Industry Value Chain
The lung cancer diagnostics industry value chain consists of eight major functional areas
including research, product development, clinical and regulatory, manufacturing, marketing and
business development, distribution, selling and promotion, and service.
Research L I I I Selling / Manufacturing Business Distribution Service n Figure 13. The lung cancer diagnostics industry value chain.
In the research area, new ideas and scientific innovations are generated and tested for
validity. Once these scientific hypotheses are validated, the ideas are applied to the creation of
commercially viable products in product development. This area includes prototype
development, engineering, and testing. Once products are developed, they are passed to clinical
and regulatory, where they are tested within a real-life clinical setting in order to obtain product
market entry approval from jurisdictional regulatory bodies, such as Health Canada in Canada or
the Food and Drug Administration (FDA) in the USA.
The remaining links in the industry value chain are less linear. The manufacturing area
covers product manufacture and assembly. The marketing and business development area
develops strategies for product market adoption, growth of market share, and creation of
sustainable competitive sustainable advantages through marketing and partnership. The
distribution area covers distribution of the product from manufacture to the end consumers. The
selling and promotion area provides an implementation of the marketing strategy function. The
service area provides ongoing product maintenance, servicing, and repair to product users.
The degree of vertical integration along this value chain in the lung cancer diagnostics
industry varies greatly between firms, however, a trend can be observed correlating with firm
size. Small and new entrant companies most often begin with research and product development
areas and outsource multiple steps in the value chain including clinical and regulatory,
manufacturing, marketing and business development, distribution, selling and promotion, andlor
service. Typically, only the biggest industry players, companies like GE, Siemens, Philips,
Olympus, Pentax, Fujinon, and Tripath, integrate along the entire value chain. However, these
large players are typically weak in research and product development and will often augment

these functionalities through the acquisition of smaller research and product development
oriented firms.
2.3 Chapter Conclusion
In this chapter, the lung cancer diagnostics industry was analyzed to determine the
overall attractiveness of the industry and the key success factors from the point of view of the
entrant firm. In summary, the lung cancer diagnostics industry is highly attractive to new entrants
that possess disruptive technology that fits the market need. To succeed, these firms need to have
product innovation and patent protection, create and sustain first mover advantage, have ample
capital resources, and have healthcare specific marketing prowess. Additionally, new entrants are
likely to be small companies that need to outsource or partner to fulfill many of functions or links
in the industry value chain.
In the next chapter, an internal analysis of Perceptronix will be conducted to determine
its fit with these key industry success factors.
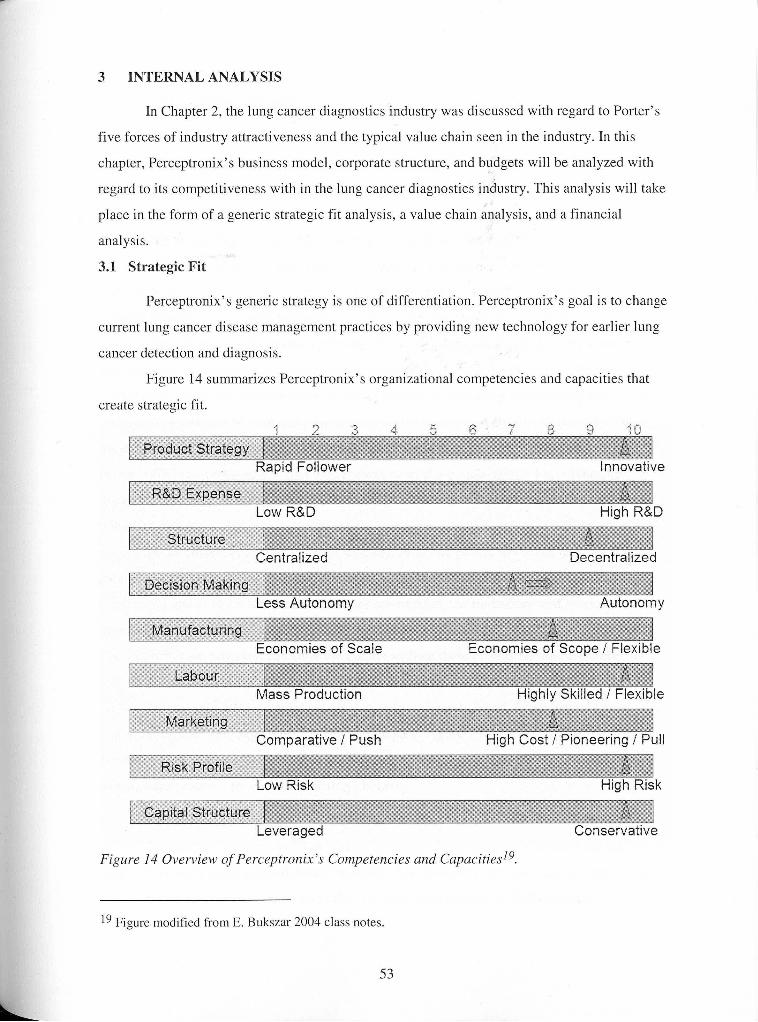
3 INTERNAL ANALYSIS
In Chapter 2, the lung cancer diagnostics industry was discussed with regard to Porter's
five forces of industry attractiveness and the typical value chain seen in the industry. In this
chapter, Perceptronix's business model, corporate structure, and budgets will be analyzed with
regard to its competitiveness with in the lung cancer diagnostics industry. This analysis will take
place in the form of a generic strategic fit analysis, a value chain analysis, and a financial
analysis.
3.1 Strategic Fit
Perceptronix's generic strategy is one of differentiation. Perceptronix's goal is to change
current lung cancer disease management practices by providing new technology for earlier lung
cancer detection and diagnosis.
Figure 14 summarizes Perceptronix's organizational competencies and capacities that
create strategic fit.
Low R&D
Centralized Decentralized
Less Autonomy Autonomy
Economies of Scale Economies of Scope I Flexible
Figure 14 Overview of Perceptronix's Competencies and ~ a ~ a c i t i e s l ~ .
l9 Figure modified from E. Bukszar 2004 class notes.
3.1.1 Product Strategy
Perceptronix is a technology based company that is relying on innovation to create new
product offerings for the market. Perceptronix's technology has been developed in-house
(relatively speaking; the technology was first developed at the BCCA and then those scientists
moved to Perceptronix) and is truly pioneering.
The technology and proprietary software behind the ClearSignTM Test is one of a kind
and a major break-through in early lung cancer detection. It is a non-invasive test and is the first
test which does not require the presence of frankly cancerous "diagnostic" cells in sputum in
order to identify patients with lung cancer. This is a new product for a new market.
Perceptronix's other product offerings, bronchoscopes and Cytology and Pathology
Workstations, possess technology innovations that will give them a competitive advantage in the
marketplace. These innovations were necessary in order to gain entry into existing markets as
they are well established with many big players and extensive patenting of technology. Thus,
these Perceptronix products employ innovations that will greatly improve their performance over
current offerings. Furthermore, they also possess ease of use innovations that will enable
expansion of the applicable market (to less technically savvy users and trainees) and improve
uptake.
As discussed in section 1.9, the Company owns one patent, has seven pending US
patents with corresponding PCTs plus the right of first refusal to six more. Much of the
Company's ability to protect their innovations surrounding the Endoscopy and Workstation
products as they enter the market relies on the success of the pending applications. The
ClearSignTM Test, however, can enter the market without these patents because the technology
will be held as trade secret until patent coverage is assured.
In summary, Perceptronix's product strategy is heavily based on innovation to create new
and novel product offerings. This has been reflected in Figure 1 by a score of 10 on the Product
Strategy scale. This innovation supports Perceptronix's differentiation strategy by providing new,
cutting edge products for new and existing markets.
3.1.2 R&D Expense
Research & Development has been at the heart of Perceptronix's business for the last 3
years. As an early stage medical device company, Perceptronix is pre-revenue and approximately
half of the monies that have been spent thus far have gone directly to R&D expense.
54
Furthermore, as the Company moves forward over the next three years, R&D expense will
remain high at approximately 20% of the Company's total expenses.
Perceptronix's high R&D expense has been reflected in Figure 1 by a score of 10 on the
R&D Expense scale. This high R&D spending helps to support Perceptronix's differentiation
strategy by providing funding for the activities that spawn innovation. This will be a key success
factor in the industry moving forward.
3.1.3 Structure
When Perceptronix was founded in 1999, it was established with a structure comprised
of a parent company and two majority owned subsidiaries, Perceptronix Medical Inc. ("PMI")
and SpectraVu Medical Incorporated ("SMI"). This structure was established in order to reward
the founding scientists with minority shareholdings and to ensure resource dedication for product
development. Each subsidiary was focused on product development activities (separate
companies for separate product lines), while the parent company was focused on finance,
marketing, and administration for the corporate group.
Perceptronix has recently acquired 100% holdings of these subsidiaries and the corporate
structure is changing such that each product line are separate divisions and the supporting
functions of clinical and regulatory, sales and marketing, quality assurance, and finance work in
a matrix structure to support product commercialization efforts. As Perceptronix's previous and
existing structure is decentralized, it has been given a score of 9 on the Structure scale in Figure
14.
This decentralized structure supports Perceptronix's differentiation strategy in that it
allows each division to be evaluated as a stand alone business that can be adjusted (or cut) as
needed. In other words, it allows Perceptronix to be flexible and quick in response to changing
market conditions.
3.1.4 Decision-Making
Accompanying changes in the Company's corporate structure, Perceptronix has made
recent changes to its management and decision-making organization.
This management change has led to a re-organization of management and decision-
making at Perceptronix. The Company is now organized around the three product groups, led by
the product leaders, and the functions of sales & marketing, clinical & regulatory, and quality
systems support these groups. Thus, on the decision-making scale outlined in Figure 1 above,
Perceptronix is ranked at 7 and moving towards greater autonomy (as indicated with an arrow).
This greater autonomy is in keeping with the structure of the organization and with its
differentiation strategy. As outlined for structure above, the greater decision-making autonomy at
Perceptronix gives the corporation greater flexibility with regard to each product division
independently.
However, as each of the products will be marketed as part of an integrated solution of
complementary products, the sales & marketing function is centralized. Overall sales &
marketing strategy is set centrally at the level of the President and COO, Acting CFO, and
Director of Business Development. These decisions are then brought into the product groups.
Direct and regular contact with product development within the context of the separate biweekly
product group meetings helps to ground sales & marketing decisions in reality (what can be done
based on the state of development) and helps to bring sales & marketing feedback to the product
teams to temper product development and clinical & regulatory decisions.
3.1.5 Manufacturing
Manufacturing at Perceptronix entails product assembly from off the shelf components,
including microscopes, cameras and computers, and software installation. Components are
ordered as needed and little inventory is stored in-house.
At this stage in Perceptronix's development, manufacturing entails only the production
of a handful of prototypes. In the future, Perceptronix does not intend to manufacture its own
products. Once product demand increases to over 20-50 systems per year for any one product
line, Perceptronix will contract out the manufacture of these systems. The Company has begun
discussions with a number of manufacturing groups to pursue such a manufacturing contract or
OEM partnership.
Manufacturing or assembly at Perceptronix is quite flexible since suppliers can be
exchanged readily and new contracts can be easily undertaken. This manufacturing flexibility
gives Perceptronix the ability to introduce further innovations or adjust each product as needed
because Perceptronix is free of a committed manufacturing infrastructure for each product. This
capability supports the Company's differentiation strategy because the product and
manufacturing specifications can be changed as needed - allowing Perceptronix to respond
quickly to customer and market demands. Perceptronix has been ranked 8 on the Manufacturing
scale in Figure 1 to reflect this flexibility.
Perceptronix was not ranked higher than 8 on this scale because the Company, while
flexible with regard to manufacturing, has not maximized economies of scope. Each product
division is focused on separate technologies which need dedicated expertise and resources.
Separate manufacturing contracts are contemplated for the endoscope products and the
workstation products.
3.1.6 Labour
The labour at Perceptronix is highly skilled. Over half of the management team and
approximately 25% of the Company's employees have either MDs (Medical Doctorate) or PhDs
(Doctor of Philosophy). The Company's employees are expert in the areas of medicine, physics,
engineering, and computer science including: cancer pathology, imaging physics and
engineering, quantitative DNA staining chemistry, biophotonics, bioinformatics software 1
algorithm development, and system engineering development. These people are currently
employed in research and product development.
This highly skilled labour supports the Company's differentiation strategy by providing
the resources, the brain power and expertise, necessary for innovation. To reflect this highly
skilled labour pool, Perceptronix was ranked 10 on the Labour scale in Fjgure 1.
3.1.7 Marketing
Marketing at Perceptronix is only in planning at the moment. The marketing personnel
that are contemplated are a small, highly skilled labour force suited to missionary marketing of
all three product lines.
The target of marketing efforts for the Clearsign Test is the medical specialist that
investigates patients for lung cancer rather than the end consumer (the patient that pays for the
test out of pocket). In this way, Perceptronix is employing a targeted pull strategy - the
communications and promotional activities by the marketer to persuade channel members to
demand specific products. This can be contrasted with the typical pull strategy - mass marketing
direct to consumer.
The medical fraternity are the gatekeepers to the patient population in this industry.
Thus, marketing to the gatekeeper rather than the end consumer is necessary in this industry.
There are strong precedents in the field of diagnostic testing in support of marketing to
the channel rather than the end consumer. One of these is the spectacular marketing success of
the PSA (prostate specific antigen) test by Bayer, among others, as a diagnostic test for prostate
cancer. The PSA test was marketed to urologists and GPs rather than to the end consumer and
even though the test benefit is questionable (see Appendix B), it has had phenomenal uptake in
the market. Most GPs will recommend that their patient's take a PSA test even when the medical
associations do not recommended its use. For example, in Canada the PSA test is not
recommended or reimbursed in screening application but approximately 69% of PSA tests
performed annually are for prostate cancer screening20
The target of marketing efforts for the Endoscope and Workstation products are the end
consumer, the medical specialists and clinic administrators that will be purchasing the product.
For these products Perceptronix is also employing a targeted pull strategy. As for the
ClearSignTM Test, these products will be sold direct to the pulmonologist and the pathologist that
works with them via missionary marketing.
This direct sales force and targeted pull strategy help to sell Perceptronix's high
differentiated product lines and product portfolio and is, therefore, in line with the Company's
differentiation strategy. Marketing has been ranked 8 on the scale to reflect this alignment. It has
not been ranked higher because the planned sales force and strategy have not yet been put into
present action at Perceptronix.
3.1.8 Risk Profile
Perceptronix is a relatively early-stage company that does not yet have revenues. Its
products are approximately one year away from the market. The Company has significant clinical
and regulatory, operations, and marketing hurdles to overcome to reach the market. The
Company must enter the market and create an entirely new market for the ClearSignTM Test and
out-compete competitive offerings with the endoscopy and workstation products. The Company's
products have not yet been proven to create consumer demand. Given these factors, there is a
very high risk that Perceptronix will not be successful. This high risk profile is in keeping with a
generic differentiation strategy as innovation is typically a risky proposition. Perceptronix has
been ranked 10 on the risk scale to reflect its high risk.
3.1.9 Capital Structure
Perceptronix's capital structure is entirely equity based (no debt). Thus, Perceptronix is
ranked 10 on the Capital Structure scale, reflecting its conservative structure. The lack of debt
enables Perceptronix to raise funds as needed. Investors in life sciences companies do not like
see debt on the books of their investees - they do not like to put money into a company that will
end up in someone else's pocket and they like to invest in future rather than past operations. The
conservative capital structure of Perceptronix is in keeping with its generic differentiation
20 Information re: frequency of PSA testing from Cycle 1.1 of the Canadian Community Health Survey, 2000-2001. Statistics Canada. 2003.
strategy because it provides access to funds for differentiation and innovation as needed for ideas
that are deemed worthy of investment by investors.
3.1.1 0 Conclusion Regarding Strategic Fit at Perceptronix
Perceptronix's innovative product strategy, high R&D expenses, decentralized structure,
highly skilled labour, targeted pull marketing strategy, high risk profile, and conservative capital
structure are all in keeping with its generic strategy of differentiation.
Where Perceptronix could improve its strategic fit is in decision-making and
manufacturing. Decision making at Perceptronix needs to be brought into line with its
decentralized structure by giving more autonomy to the product groups. This transition is
happening now as the new Product Directors are tackling their new mandates and the matrix
structure supporting the product lines is developing. As each product line goes to market and
reporting structures evolve, each product line will have the data necessary for more autonomous
decision-making regarding product line specific success and return on investment. However, the
Company should keep some of its decision-making centralized to evaluate the product portfolio
as a whole to understand the synergies afforded to the Company.
Manufacturing at Perceptronix needs to capitalize on greater economies of scope. As the
matrix organization structure develops at Perceptronix economies of scope should increase with
the development of support groups, such as data analysis, information technology, software
development, and engineering groups, that cross product groups. Furthermore, suppliers and
manufacturers should be selected that cater to the requirements of more than one product group
to increase economies of scope.
In summary, the focus, structure, and resources at Perceptronix are quite strongly aligned
with a generic strategy of differentiation. Important issues for Perceptronix moving forward
arising from this analysis are: (1) the importance of patents to protect their product innovations,
particularly with respect to the Endoscopy and Workstation products; (2) the importance of
obtaining a manufacturing deal or partnership in the near-term to maximize flexibility and reduce
operational burden; and (3) the necessity to access the right kind of sales and marketing force in
the near-term.
3.2 Perceptronix Value Chain
With regard to the lung cancer diagnostic industry value chain discussed in Section 2.2,
Perceptronix currently performs the research, product development, clinical and regulatory, and
marketing and business development functions of the chain (see Figure 15).
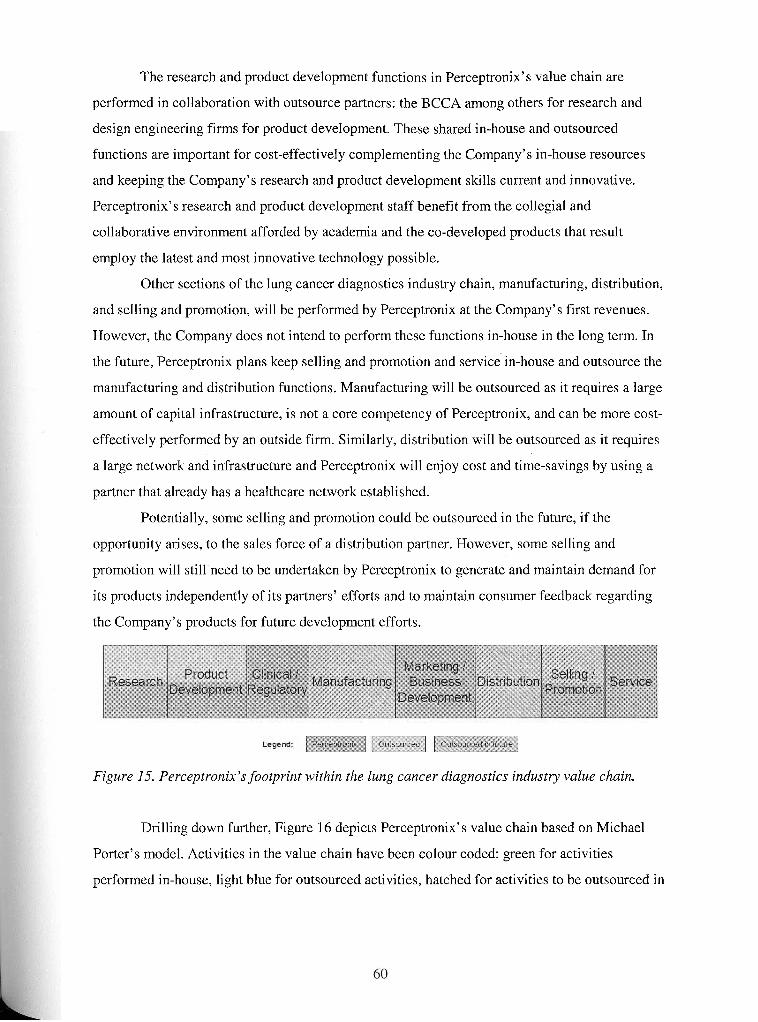
The research and product development functions in Perceptronix's value chain are
performed in collaboration with outsource partners: the BCCA among others for research and
design engineering firms for product development. These shared in-house and outsourced
functions are important for cost-effectively complementing the Company's in-house resources
and keeping the Company's research and product development skills current and innovative.
Perceptronix's research and product development staff benefit from the collegial and
collaborative environment afforded by academia and the co-developed products that result
employ the latest and most innovative technology possible.
Other sections of the lung cancer diagnostics industry chain, manufacturing, distribution,
and selling and promotion, will be performed by Perceptronix at the Company's first revenues.
However, the Company does not intend to perform these functions in-house in the long term. In
the future, Perceptronix plans keep selling and promotion and service in-house and outsource the
manufacturing and distribution functions. Manufacturing will be outsourced as it requires a large
amount of capital infrastructure, is not a core competency of Perceptronix, and can be more cost-
effectively performed by an outside firm. Similarly, distribution will be outsourced as it requires
a large network and infrastructure and Perceptronix will enjoy cost and time-savings by using a
partner that already has a healthcare network established.
Potentially, some selling and promotion could be outsourced in the future, if the
opportunity arises, to the sales force of a distribution partner. However, some selling and
promotion will still need to be undertaken by Perceptronix to generate and maintain demand for
its products independently of its partners' efforts and to maintain consumer feedback regarding
the Company's products for future development efforts.
Figure 15. Perceptronix's footprint within the lung cancer diagnostics industry value chain.
Drilling down further, Figure 16 depicts Perceptronix's value chain based on Michael
Porter's model. Activities in the value chain have been colour coded: green for activities
performed in-house, light blue for outsourced activities, hatched for activities to be outsourced in
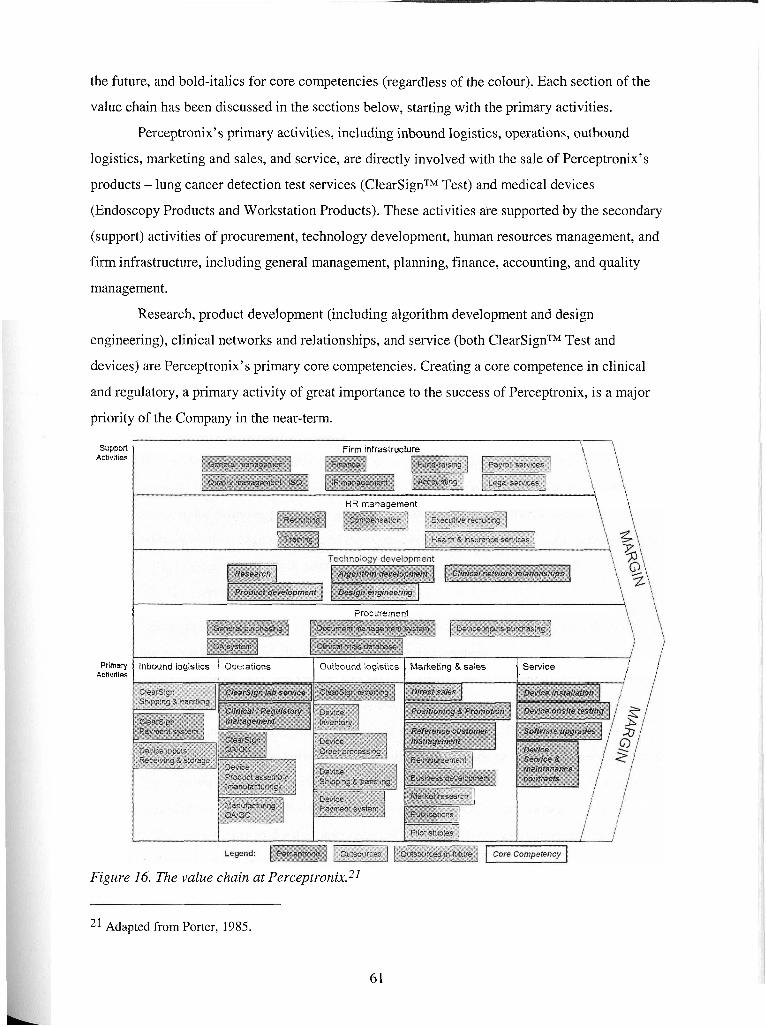
the future, and bold-italics for core competencies (regardless of the colour). Each section of the
value chain has been discussed in the sections below, starting with the primary activities.
Perceptronix's primary activities, including inbound logistics, operations, outbound
logistics, marketing and sales, and service, are directly involved with the sale of Perceptronix's
products - lung cancer detection test services (ClearSignTM Test) and medical devices
(Endoscopy Products and Workstation Products). These activities are supported by the secondary
(support) activities of procurement, technology development, human resources management, and
firm infrastructure, including general management, planning, finance, accounting, and quality
management.
Research, product development (including algorithm development and design
engineering), clinical networks and relationships, and service (both ClearSignTM Test and
devices) are Perceptronix's primary core competencies. Creating a core competence in clinical
and regulatory, a primary activity of great importance to the success of Perceptronix, is a major
priority of the Company in the near-term.
Suppofl Firm infrastructure \ \
Activities
HR management i\ \
1 Procurement
Prima.)i ] Inbound logistics / Operations 1 Outbound logistics Marketing & sales t 1 Service Activities
' i i I
Figure 16. The value chain at Perceptror~ix.~~
21 Adapted from Porter, 1985.
6 1
As a general note, all activities at Perceptronix, with the exception of accounting, are
structured to be IS0 13485 compliant. In other words, Perceptronix's systems, processes, and
procedures have been rigorously documented and internally and externally audited. IS0 13485
certification is anticipated in the fourth quarter of 2004.
3.2.1 Primary Activities
3.2.1 . I Inbound Logistics
For the ClearSignTM Test, sputum samples will be collected under the supervision of a
respiratory technician or through a take-home kit. Once collected, the sample will be shipped
from physician's offices and clinics to Perceptronix's service laboratories. This shipping and
handling will be outsourced, most likely to FedEx. Perceptronix's sample collection kits will
have pre-paid shipping supplied by such a vendor. Tests will be paid for by the patient to the
physician administrating the ClearSignTM Test. Administration of the transfer payment for the
ClearSignTM Test service from participating physicians to Perceptronix will be handled in-house.
For the device products, inbound logistics are device inputs receiving and storage.
Currently, each product director manages this process for their product line. These activities will
be outsourced in the future as part of the general outsourcing of Perceptronix's device
manufacturing function. Manufacturing of Perceptronix's device products entails only assembly
of off the shelf components such as microscopes, slide loaders, cameras, and computers.
3.2.1.2 Operations
Operations at Perceptronix entail provision of the ClearSignTM Test service, device
manufacturing (assembly), and clinical and regulatory management.
For provision of the ClearSignTM Test service, sputum samples sent to the Company's
lab will be deposited on a microscope slide, stained, and scanned using automated scanning,
image processing, quantification, data analysis, and score generation. This score and its
interpretation will be sent to the patient's doctor within seven working days of sputum collection.
Thus, provision of the ClearSignTM Test will require operating a reference laboratory
including quality assurance and quality control processes (QNQC). The operations functions
will be performed in-house under the supervision of a dedicated laboratory manager and the
QAIQC functions will be performed under the Director of Quality Assurance.
This operations process is currently underway for the Company's international clinical
trial of the ClearSignTM Test. Judging from this application, the operation of the ClearSignTM
Test reference laboratory is a core competence of Perceptronix, Furthermore, as this test is a
central to Perceptronix's plans for early intervention in lung cancer diagnosis, the Company
intends to keep this function as a core competence and priority moving forward.
Keeping the lab operations in-house will be particularly important to the Company in the
first few years of operation. This will enable the Company to streamline the operations
surrounding the test, improve the test performance via further algorithm development based on
the growing clinical sample base resulting from commercialization, and file encapsulating
patents to protect the technology completely before it is distributed to other labs. Furthermore,
while the first markets are being created for the ClearSignTM Test, it is in the Company's best
interest to perform the test in-house to assure the highest quality delivery possible. This will
enable the Company to established a quality reputation and branding for the test. This will enable
Perceptronix, once test provision is ready to be outsourced, to establish a equitable partnership
with a distribution partner. Perceptronix will have a strong partnership negotiation position based
on established market demand, documented performance, and high brand power.
Device manufacturing and manufacturing associated QAIQC are currently performed in-
house at Perceptronix under the direction of the Systems Engineer and Product Directors. These
functions will be outsourced once device sales reach unit volume thresholds.
Clinical and regulatory management is handled in-house at Perceptronix under the
supervision of the Director of Clinical and Regulatory Affairs. This function is not currently a
core competence of Perceptronix but it has been identified as an area of high priority to build
into a core competence as it has a central role in the Company's success and value creation.
Clinical and regulatory management is essential to Perceptronix's operations as all of the
Company's products are subject to jurisdictional regulatory approvals, market entry and ongoing
sales depend on these approvals, and this department is responsible for the Company's first sales
to opinion leaders.
Additionally, clinical and regulatory management activities add value to marketing,
research, and product development at Perceptronix. With regard to marketing, the success of
clinical and regulatory activities determine product positioning (intended use claims involved
with regulatory approvals), timing of market entry (an early and strong entry can establish a first
mover advantage), and strength of sales materials and referrals for promotion (publications,
thought leader endorsement, and reference customers). For research and product development,
clinical and regulatory activities are significant resources contributing clinical data and contacts
for hypothesis testing, algorithm development, and application development.
Some cancer diagnostics firms outsource clinical and regulatory management to clinical
research organizations (CROs). In contrast, Perceptronix has decided, based on the reasons
outlined above, to develop and maintain clinical and regulatory management in-house for related
learning.
3.2.1.3 Outbound Logistics
Outbound logistics for the ClearSignTM Test will include score reporting to the
physician. This activity will be performed by Perceptronix in-house and will be important for
establishing and maintaining on-going relationships with physicians prescribing the Company's
test. This function is currently overseen by the Director of Clinical and Regulatory Affairs for the
ClearSignTM Test clinical trial.
Other outbound logistics will be involved with the manufacture, inventory, and delivery
of Perceptronix's device offerings. In the near-term, these activities will be performed in-house
under the Systems Engineer, including device inventory, device order processing, device
shipping and handling, and device payment systems. In the longer term, once unit volumes reach
thresholds, these functions will be outsourced to a manufacturing and distribution partner.
3.2.1.4 Marketing and Sales
Small firms in the cancer diagnostics industry often outsource marketing and sales
functions as these activities require large capital resources and competencies that diverge from
their research and product development focus. The problem with outsourcing this function,
however, is that typically the outsource companies are large, powerful customers that may not be
motivated to maximize market demand for the small firm's product particularly where new
markets need to be created. In fact, sometimes these companies will agree to market and
distribute a small firm's product in order to keep it from the market as it competes with one of
their own product offerings.
Perceptronix has decided that outsourcing marketing and sales at this time is not in its
best interest. The rationale for this is several-fold. First, as described above, a partnership with a
powerful distributor at this time may jeopardize the success of Company's product launch.
Second, the Perceptronix product portfolio is unique to the market and there is no single
distributor that has the capability to market the entire portfolio. Third, there is no distributor
currently focused on the Company's target consumer. Fourth, Perceptronix can gain valuable
information by marketing and selling its own products in terms of related learning for research,
product development, and clinical network relationships.
Perceptronix is working towards making sales and marketing a core-competency. It is
starting this development on the basis of the Company's strengths in clinical and regulatory
affairs and experience within the industry.
Perceptronix will be performing as many marketing and sales activities as possible in-
house including positioning and promotion, reference customer management, and business
development. Sales will be driven by an in-house, direct sales force in the near-term. This sales
force will evolve largely from the Clinical and Regulatory Affairs Department as they will have
extensive knowledge of and relationships with the consumer at market entry. Marketing and sales
at Perceptronix will be overseen by the Director of Business Development who is also
responsible for the related functions of partnerships and new product development.
This approach could create a substantial competitive advantage for Perceptronix. While
other companies are focused on selling individual products through distributors, Perceptronix
will be developing one to one relationships with the consumer based on working with them to
change lung cancer outcomes with an integrated portfolio of products. This relationship may
have a network effect that secures the Company's position in the market, defending it from
competitive attack.
In the longer term, once markets have been created for the ClearSignTM Test and the
Perceptronix product portfolio has brand power in the market, Perceptronix may consider taking
advantage of the networks of sales and distribution partners in addition to its in-house efforts.
The right time will be when distributors are coming to Perceptronix to ask to distribute the
Company's products and the integrated approach is sold via peer-to-peer viral marketing amongst
the medical community. At this time, the Perceptronix "mission" would already be sold to the
customer and the distributor would simply provide access to the products.
Market research is and will continue to be performed by a mix of in-house and
outsourced staff. Where possible, market research is conducted in-house to ensure complete
capitalization of learning opportunities. However, some market research is outsourced as needed
where it is cost-effective to do so (e.g. international information required).
Publications are and will continue to be shared between in-house and outsourced staff in
order to promote the independent, academic validity of Perceptronix's research and clinical
results. Independent data and peer-reviewed literature in highly-ranked journals are criteria
demanded for acceptance by the scientific and clinical community.
Similarly, pilot studies and post-marketing clinical studies will need to outsourced in
order to ensure scientific validity and independence.
3.2.1.5 Sewice
Service will be handled in-house at Perceptronix under the supervision of the Product
Directors. This function is not currently a core competence of Perceptronix but it has been
identified as an area of high priority to build into a core competence as it has an important role in
giving user and product feedback to the product development teams and in maintaining a high
quality brand image surrounding the products.
Good service is important to maintaining long-term relationships with consumers.
Therefore, creating service as an in-house core competency will be integral to Perceptronix's
marketing and sales success.
Furthermore, in-house service will allow Perceptronix to upgrade client software on a
regular basis. This allows the Company to ensure that the leading clinicians and researchers in
the lung cancer diagnostics field always have the most advanced technology possible, which will
help to strengthen the clinical data flowing to Perceptronix and the positive word-of-mouth
endorsements of Perceptronix's products.
3.2.2 Support Activities
3.2.2.1 Procurement
Procurement at Perceptronix includes general purchasing procedures, quality assurance
systems, document management systems, and a clinical trials database. The Company is working
towards becoming I S 0 13485 compliant for all of these systems. Inputs for Perceptronix's
products are off the shelf components with multiple potential suppliers. Once device
manufacturing is outsourced, device inputs purchasing will be handled by an outsource partner.
3.2.2.2 Technology Development
Research, product development, algorithm development, design engineering, and clinical
network relationships are all cbre competencies of Perceptronix. These functions are performed
in-house under the supervision of the Product Directors, and Director of New Product
Development. The first four functions were inherited, along with many of the scientists, from the
cancer imaging group at the BCCA. The last function has been developed, as outlined above in
the service section, through working with the Company's clinical collaborators.
As mentioned above, in addition to performing research activities in-house, they are also
outsourced. This allows Perceptronix's research group to work in collaboration with academia,
an arrangement that allows this group to keep pace with the field and benefit from interacting in
the academic scientific environment. Even though this is a core competency, it is important that
this function is never performed fully in-house. The collaborative and innovative environment
that outsourcing some research to academia provides is an important factor that Perceptronix is
able to successfully capitalize for competitive advantage.
Design engineering is also performed in-house and outsourced. While Perceptronix has
core competencies in some aspects of design engineering, the Company's limitations have also
been recognized and complemented with external skill sets for particular projects.
3.2.2.3 Human Resources (HR) Management
Recruiting, training, and some compensation research at Perceptronix is performed in-
house. Training for technology development and operations is best performed in-house to
maintain Perceptronix's core competencies. Additionally, Perceptronix is the only one that could
provide this training as these functions are firm specific. Most recruiting at Perceptronix is
performed in-house as it involves hiring into specific technical positions that are best understood
by the Perceptronix team. Some compensation research is performed in-house to save costs.
Other HR functions like executive recruiting, and health and insurance services are
outsourced. The skill sets required for these functions do not exist within Perceptronix and are
performed cost-effectively through outsourcing.
3.2.2.4 Firm Infrastructure
General management, quality management, finance, and IP management are all
performed fully in-house due to their importance as support activities for the Company. These
functions provide the infrastructure and environment that facilitates Perceptronix's core
competencies. Both fund-raising and accounting activities are performed in-house with some
support from outsourcing. Accounting functions are supported by outsourcing because the
workflow requirements are variable and it is more cost-effective to add temporary staff to met
temporary workflow demands such as year end financials. Legal services are outsourced because
depth and breadth of experience in this area are necessary to successful function and this
experience is expensive to hire in-house. Payroll services are outsourced this function is tedious
and outsourcing is inexpensive.
3.2.3 Conclusion Regarding Vahe Chain at Perceptronix
Analysis Perceptronix's value chain has yielded the key areas where the firm creates
value. These areas are technology development and ClearSignTM Test service provision.
Perceptronix would also like to add clinical and regulatory management, sales and marketing,
and service as core competencies.
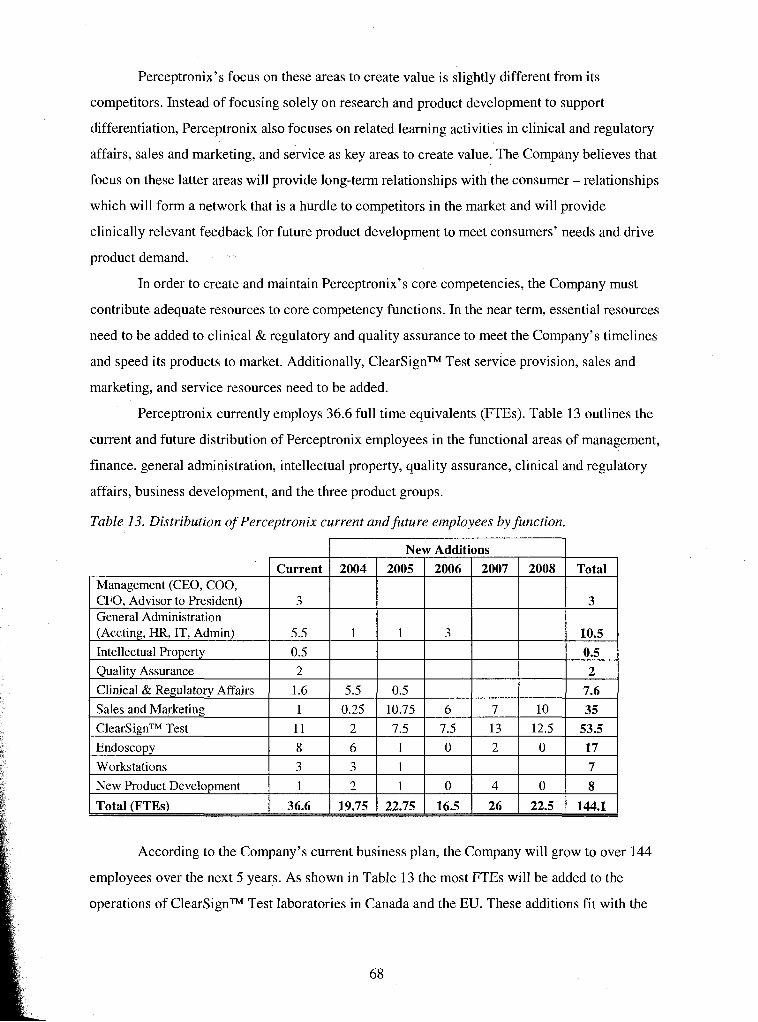
Perceptronix's focus on these areas to create value is slightly different from its
competitors. Instead of focusing solely on research and product development to support
differentiation, Perceptronix also focuses on related learning activities in clinical and regulatory
affairs, sales and marketing, and service as key areas to create value. The Company believes that
focus on these latter areas will provide long-term relationships with the consumer - relationships
which will form a network that is a hurdle to competitors in the market and will provide
clinically relevant feedback for future product development to meet consumers' needs and drive
product demand.
In order to create and maintain Perceptronix7s core competencies, the Company must
contribute adequate resources to core competency functions. In the near term, essential resources
need to be added to clinical & regulatory and quality assurance to meet the Company's timelines
and speed its products to market. Additionally, ClearSignTM Test service provision, sales and
marketing, and service resources need to be added.
Perceptronix currently employs 36.6 full time equivalents (FTEs). Table 13 outlines the
current and future distribution of Perceptronix employees in the functional areas of management,
finance, general administration, intellectual property, quality assurance, clinical and regulatory
affairs, business development, and the three product groups.
Table 13. Distribution of Perceptronix current and future employees by function.
According to the Company's current business plan, the Company will grow to over 144
employees over the next 5 years. As shown in Table 13 the most FTEs will be added to the
operations of ClearSignTM Test laboratories in Canada and the EU. These additions fit with the
Management (CEO, COO, CFO, Advisor to President) General Administration (Accting, HR, IT, Admin)
Intellectual Property
Quality Assurance
Current
3
5.5
0.5
2
Total
3
10.5 0.5 2
New Additions 2004
1
2007 2008 2005
1
2006
3
Company's intention to create a core competency in the provision of the ClearSignTM Test. The
second largest FTE additions will be to sales and marketing and again this is fitting with creating
a sales and marketing core competence. However, it can be seen that the third area in which
Perceptronix wishes to create a core competence, namely clinical and regulatory affairs, may be
under-resourced. Only six FTEs are contemplated as additions to this department. Perceptronix
should re-evaluate the resource requirements for this area. In order to create a core competence in
clinical and regulatory affairs, the Company needs to invest heavily in this area.
3.3 Financial Analysis
The Company's current business plan (April 21,2004) calls for the expenditure of
CDN$32 million over the next three years until Perceptronix becomes self-sustaining in 2007.
According to this plan, the Company will require $9.97 million to fund operations for the next 12
months.
The Company presently has a CDN$6.5 million cash balance and plans to raise all or
part of the remaining funds required (CDN$26 million) through private placements over the next
year. However, given the reality of the Company's current cash position, the management team is
revising their budgets in order to make the amount of cash on hand presently last 12 months of
operations. While the management team is confident of the ability to accomplish this task, these
new budgets will not be ready until rnid-August.
Therefore, the Company's April 21,2004 budgets will be analysed for the purpose of
this paper. As of April, 21,2004, the Company's cash balance was CDN$3.6 million.
3.3.1 Current Business Plan - Summary
The projected financial results outlined in this section demonstrate the extent of the
cumulative financing required by Perceptronix to fund its clinical trials and operations through to
profitability in 2007.
3.3.1.1 Revenue Projection
Revenue is projected to start in mid-2005. Revenue growth is substantial due to the
unique nature of the technology and first mover advantage in the early detection of lung cancer.
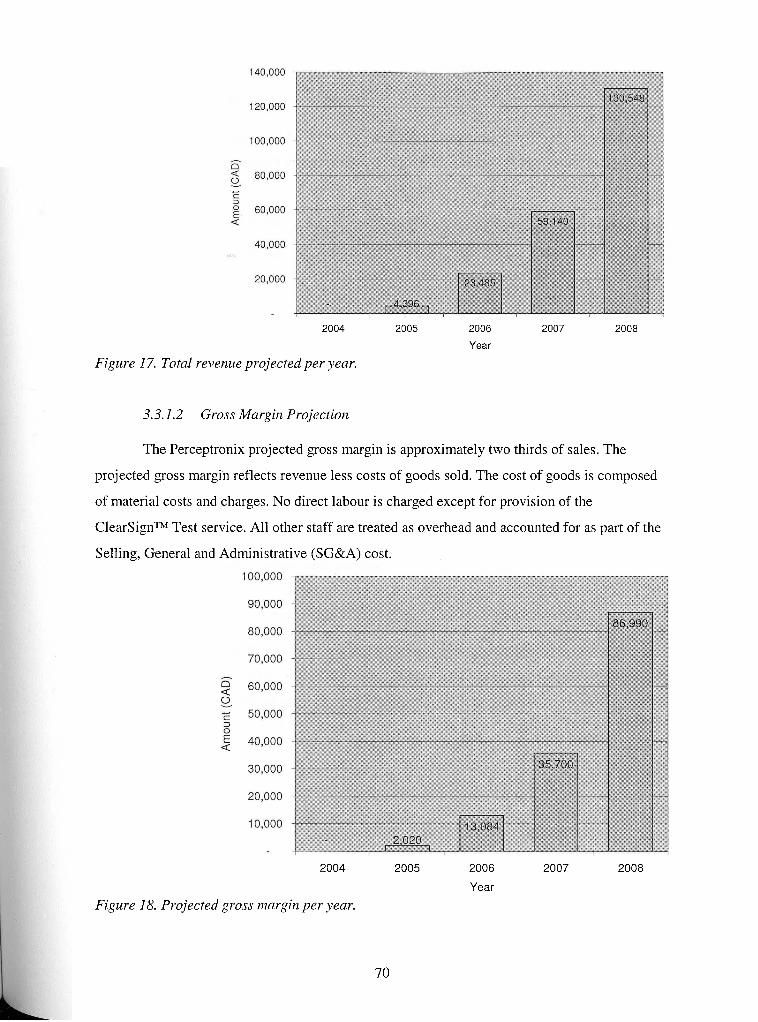
2004 2005 2006 2007 2008
Year
Figure 17. Total revenue projected per year.
3.3.1.2 Gross Margin Projection
The Perceptronix projected gross margin is approximately two thirds of sales. The
projected gross margin reflects revenue less costs of goods sold. The cost of goods is composed
of material costs and charges. No direct labour is charged except for provision of the
ClearSignTM Test service. All other staff are treated as overhead and accounted for as part of the
Selling, General and Administrative (SG&A) cost.
2004 2005 2006 2007 2008
Year
Figure 18. Projected gross margin per year.
70
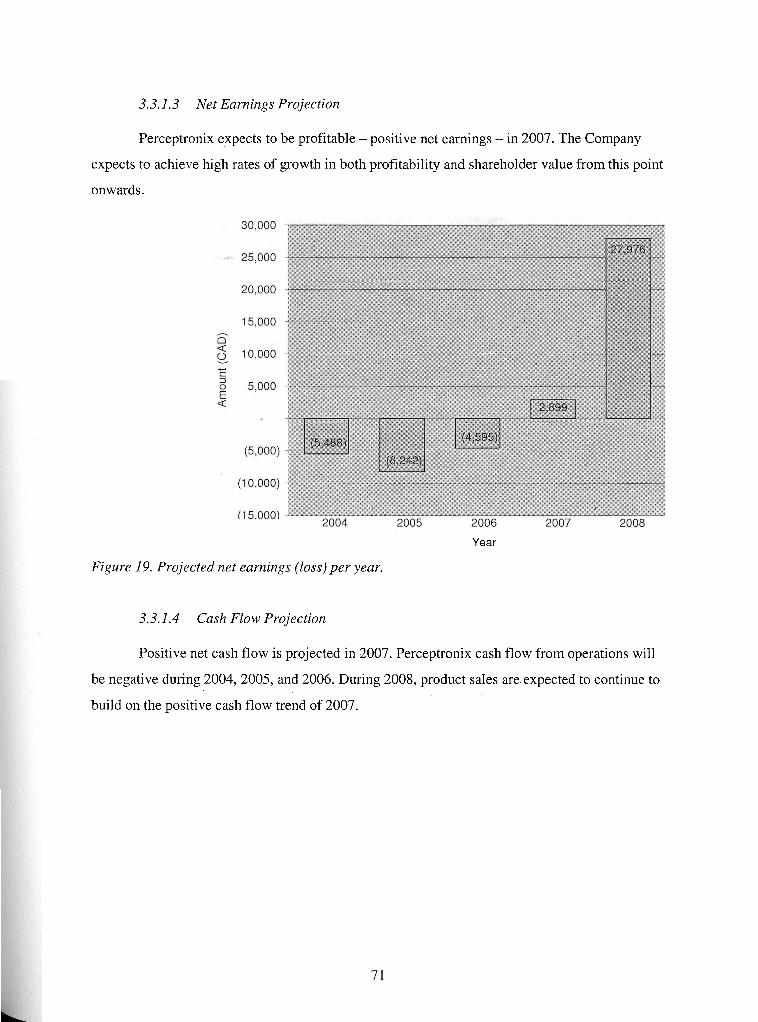
3.3.1.3 Net Earnings Projection
Perceptronix expects to be profitable -positive net earnings - in 2007. The Company
expects to achieve high rates of growth in both profitability and shareholder value from this point
onwards.
Year
Figure 19. Projected net earnings (loss) per year.
3.3.1.4 Cash Flow Projection
Positive net cash flow is projected in 2007. Perceptronix cash flow from operations will
be negative during 2004,2005, and 2006. During 2008, product sales are expected to continue to
build on the positive cash flow trend of 2007.
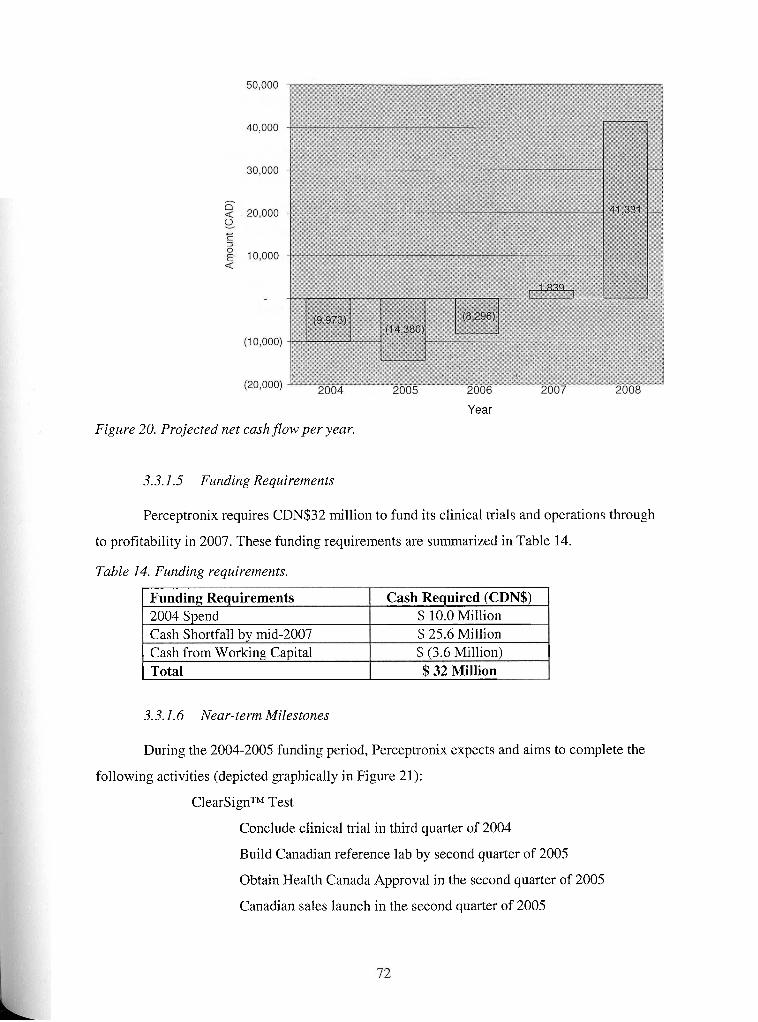
. .
Year
Figure 20. Projected net caslz flow per year.
3.3.1.5 Funding Requirements
Perceptronix requires CDN$32 million to fund its clinical trials and operations through
to profitability in 2007. These funding requirements are summarized in Table 14.
Table 14. Funding requirements.
I Cash from Worlunrr Ca~ital I $ (3.6 Million) I
-Funding Requirements 2004 Spend Cash Shortfall bv mid-2007
) Total $ 32 Million
Cash Required (CDN$) $ 10.0 Million $ 25.6 Million
3.3.1.6 Near-term Milestones
During the 2004-2005 funding period, Perceptronix expects and aims to complete the
following activities (depicted graphically in Figure 21):
ClearSignTM Test
Conclude clinical trial in third quarter of 2004
Build Canadian reference lab by second quarter of 2005
Obtain Health Canada Approval in the second quarter of 2005
Canadian sales launch in the second quarter of 2005
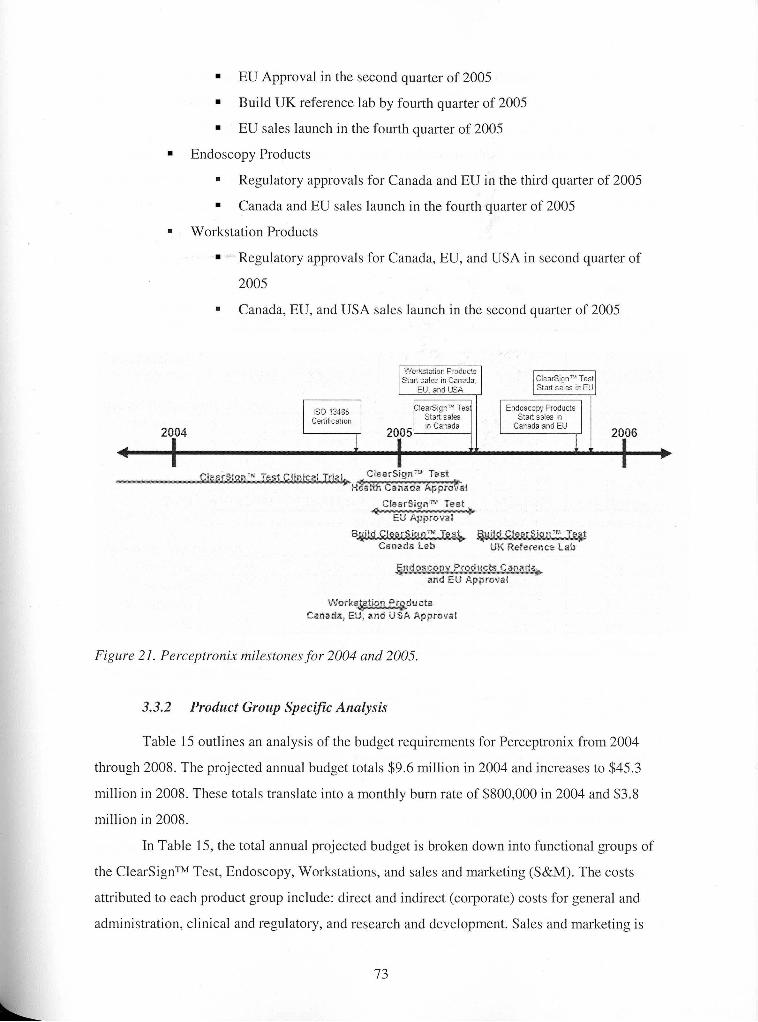
EU Approval in the second quarter of 2005
Build UK reference lab by fourth quarter of 2005
EU sales launch in the fourth quarter of 2005
Endoscopy Products
Regulatory approvals for Canada and EU in the third quarter of 2005
Canada and EU sales launch in the fourth quarter of 2005
Workstation Products
Regulatory approvals for Canada, EU, and USA in second quarter of
2005
Canada, EU, and USA sales launch in the second quarter of 2005
Canada Lab LtK Reference Lab
and EU Approval
Work u cts Csnada, EU, and USA Approval
Figure 21. Perceptronix nzilestorzes for 2004 and 2005.
3.3.2 Product Group Specific Analysis
Table 15 outlines an analysis of the budget requirements for Perceptronix from 2004
through 2008. The projected annual budget totals $9.6 million in 2004 and increases to $45.3
million in 2008. These totals translate into a monthly burn rate of $800,000 in 2004 and $3.8
million in 2008.
In Table 15, the total annual projected budget is broken down into functional groups of
the ClearSignTM Test, Endoscopy, Workstations, and sales and marketing (S&M). The costs
attributed to each product group include: direct and indirect (corporate) costs for general and
administration, clinical and regulatory, and research and development. Sales and marketing is
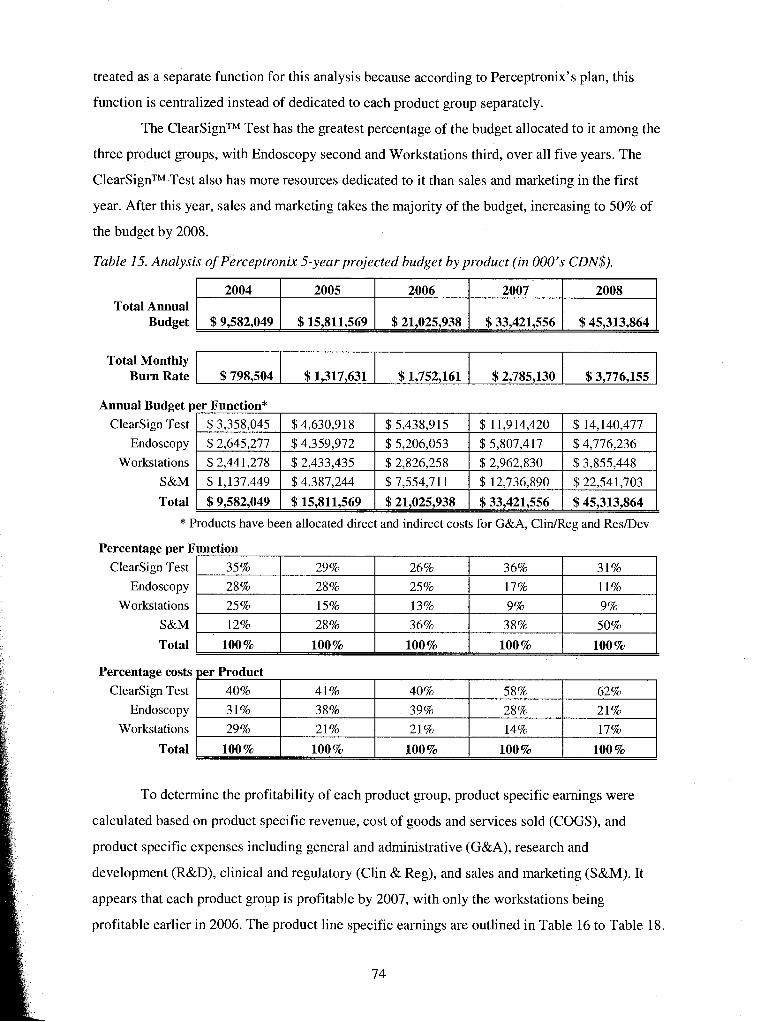
treated as a separate function for this analysis because according to Perceptronix's plan, this
function is centralized instead of dedicated to each product group separately.
The ClearSignTM Test has the greatest percentage of the budget allocated to it among the
three product groups, with Endoscopy second and Workstations third, over all five years. The
ClearSignTM Test also has more resources dedicated to it than sales and marketing in the first
year. After this year, sales and marketing takes the majority of the budget, increasing to 50% of
the budget by 2008.
Table 15. Analysis of Perceptronix 5-year projected budget by product (in 000's CDN$).
Total Annual Budget
Total Monthly Burn Rate
Total / $9,582,049 I $ 15,811,569 1 $21,025,938 1 $33,421,556 1 $45,313,864 [ * Products have been allocated direct and indirect costs for G&A, ClidReg and ResIDev
2004
$9,582,049
Annual Budget per Function*
$798,504
ClearSign Test
Endoscopy
Workstations
S&M
2005
$15,811,569
Percentage per Function
To determine the profitability of each product group, product specific earnings were
$ 1,317,631
$3,358,045
$2,645,277
$2,441,278
$ 1.137.449
Clearsign Test
Endoscopy
Workstations
S&M
Total
Percentage costs per Product
calculated based on product specific revenue, cost of goods and services sold (COGS), and
2006
$21,025,938
Clearsign Test
Endoscopy
Workstations
Total
product specific expenses including general and administrative (G&A), research and
development (R&D), clinical and regulatory (Clin & Reg), and sales and marketing (S&M). It
$1,752,161
$4,630,918
$4,359,972
$ 2,433,435
$4.387.244
35%
28 %
25 %
12%
100%
appears that each product group is profitable by 2007, with only the workstations being
2007
$33,421,556
40%
3 1%
29 %
100%
profitable earlier in 2006. The product line specific earnings are outlined in Table 16 to Table 18.
2008
$45,313,864
$2,785,130
$ 5,438,9 15
$5,206,053
$ 2,826,258
$7.554.71 1
29%
28%
15%
28%
100 %
$3,776,155
41%
38%
21%
100%
$ 1 1,9 14,420
$ 5,807,417
$ 2,962,830
$ 12.736.890
26%
25%
13%
36%
100%
$ 14,140,477
$4,776,236
$ 3,855,448
$ 22.541.703
40%
39%
21%
100%
36%
17%
9%
38%
100 %
31%
11%
9%
50%
100 %
58%
28%
14%
100 %
62%
21%
17%
100 %
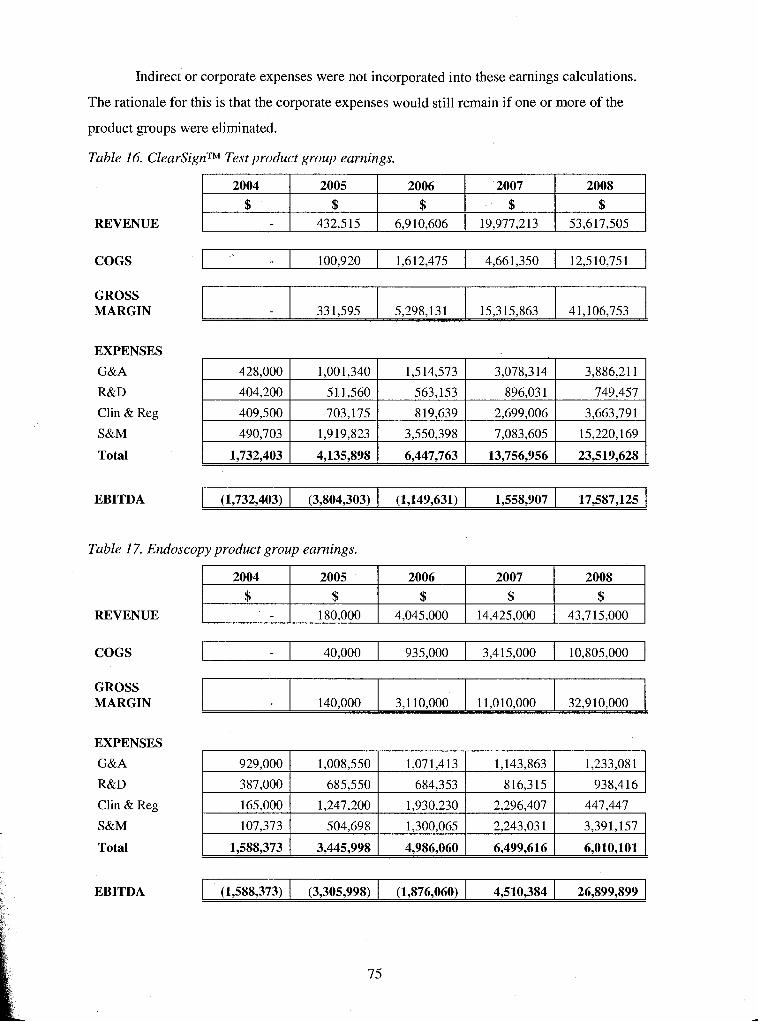
Indirect or corporate expenses were not incorporated into these earnings calculations.
The rationale for this is that the corporate expenses would still remain if one or more of the
product groups were eliminated.
Table 16. ClearSignTM Test product group earnings.
REVENUE
COGS
GROSS MARGIN
EXPENSES
G&A
R&D
Clin & Reg
S&M
Total
EBITDA
Table 17. Endoscopy product group earnings.
REVENUE
COGS
GROSS MARGIN
EXPENSES
G&A
R&D
Clin & Reg
S&M
Total
EBITDA
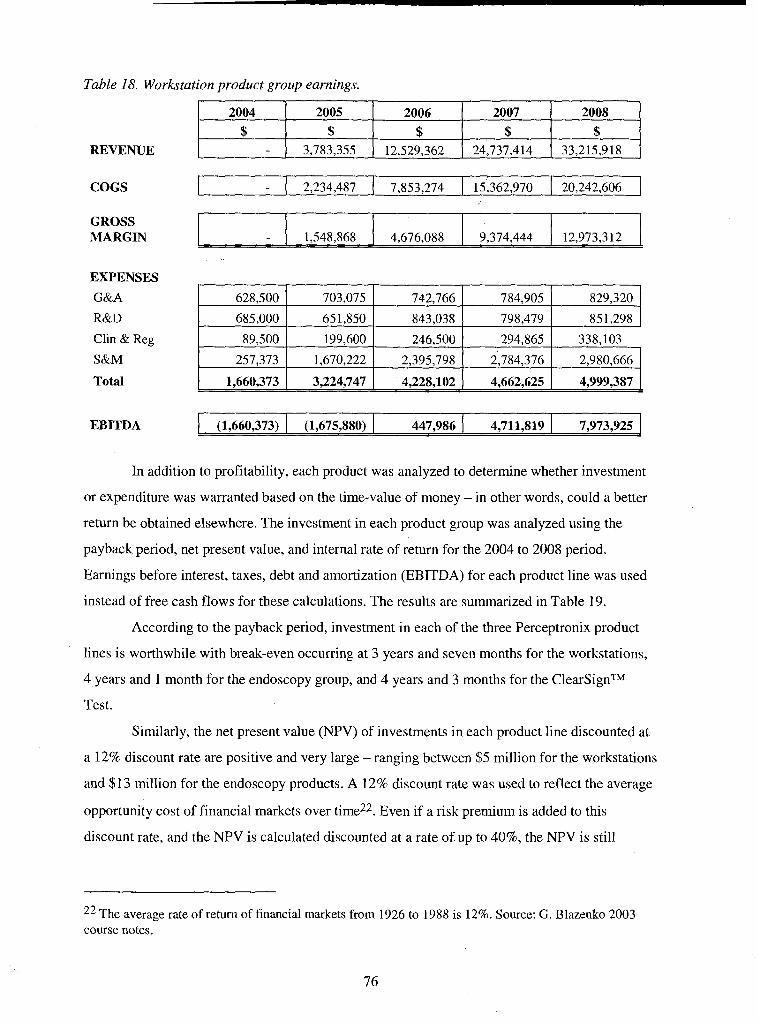
COGS
Table 18. Workstation product group earnings.
REVENUE
EXPENSES I I I I I I
GROSS MARGIN
2004
$
Total
1,548,868
Clin & Reg
S&M
EBITDA (1,660,373) 1 (1,675,880) ( 447,986 1 4,711,819 1 7,973,925
2005
$ 3,783,355
In addition to profitability, each product was analyzed to determine whether investment
or expenditure was warranted based on the time-value of money - in other words, could a better
return be obtained elsewhere. The investment in each product group was analyzed using the
4,676,088
89,500
257,373
payback period, net present value, and internal rate of return for the 2004 to 2008 period.
Earnings before interest, taxes, debt and amortization (EBITDA) for each product line was used
instead of free cash flows for these calculations. The results are summarized in Table 19.
According to the payback period, investment in each of the three Perceptronix product
lines is worthwhile with break-even occurring at 3 years and seven months for the workstations,
4 years and 1 month for the endoscopy group, and 4 years and 3 months for the ClearSignTM
Test.
Similarly, the net present value (NPV) of investments in each product line discounted at
a 12% discount rate are positive and very large - ranging between $5 million for the workstations
and $13 million for the endoscopy products. A 12% discount rate was used to reflect the average
opportunity cost of financial markets over time22. Even if a risk premium is added to this
discount rate, and the NPV is calculated discounted at a rate of up to 40%, the NPV is still
22 The average rate of return of financial markets from 1926 to 1988 is 12%. Source: G. Blazenko 2003 course notes.
2008
$ 33,215,918 -
2006
$ 12,529,362
9,374,444
199,600
1,670,222
2007
$ 24,737,414
12,973,3 12
246,500
2,395,798
294,865
2,784,376
338,103
2,980,666
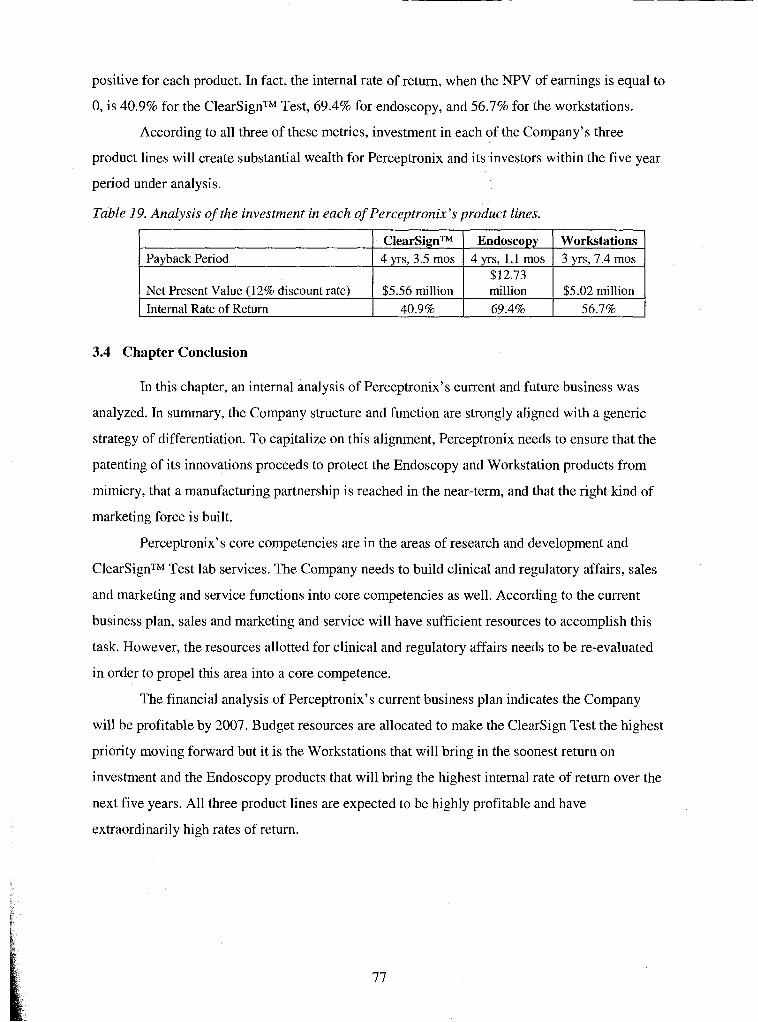
positive for each product. In fact, the internal rate of return, when the NPV of earnings is equal to
0, is 40.9% for the ClearSignTM Test, 69.4% for endoscopy, and 56.7% for the workstations.
According to all three of these metrics, investment in each of the Company's three
product lines will create substantial wealth for Perceptronix and its investors within the five year
period under analysis.
Table 19. Analysis of the investment in each of Perceptronix's product lines.
Payback Period
3.4 Chapter Conclusion
Net Present Value (12% discount rate) Internal Rate of Return
In this chapter, an internal analysis of Perceptronix's current and future business was
analyzed. In summary, the Company structure and function are strongly aligned with a generic
strategy of differentiation. To capitalize on this alignment, Perceptronix needs to ensure that the
patenting of its innovations proceeds to protect the Endoscopy and Workstation products from
mimicry, that a manufacturing partnership is reached in the near-term, and that the right kind of
marketing force is built.
Perceptronix's core competencies are in the areas of research and development and
ClearSignTM Test lab services. The Company needs to build clinical and regulatory affairs, sales
and marketing and service functions into core competencies as well. According to the current
business plan, sales and marketing and service will have sufficient resources to accomplish this
task. However, the resources allotted for clinical and regulatory affairs needs to be re-evaluated
in order to propel this area into a core competence.
The financial analysis of Perceptronix's current business plan indicates the Company
will be profitable by 2007. Budget resources are allocated to make the Clearsign Test the highest
priority moving forward but it is the Workstations that will bring in the soonest return on
investment and the Endoscopy products that will bring the highest internal rate of return over the
next five years. All three product lines are expected to be highly profitable and have
extraordinarily high rates of return.
ClearSignTM 4 yrs, 3.5 mos
$5.56 million 40.9%
Endoscopy 4 yrs, 1.1 mos
$12.73
Workstations 3 yrs, 7.4 mos
million 69.4%
$5.02 million 56.7%
4 ISSUES
This chapter will outline the major issues and obstacles facing Perceptronix as it moves
forward towards market entry. The major issues include the Company's access to capital, pursuit
of too many products at once, and marketing strategy. Other issues and risks will also be
discussed.
4.1 Meta Issue - Access to Capital
According to the Company's current business plan, Perceptronix requires CDN$30-35
million to fund its market launch and operations through to profitability in 2007. As the
Company's current cash position is close to CDN$6.3 million, a major issue facing Perceptronix
is how to raise the remaining $22-27 million it requires over the next three years.
Raising money is difficult in the current market. Many investors have grown wary of
healthcare investments since the technology stock bubble burst in 2001. The public markets have
not yet recovered and are still highly volatile. It is particularly hard to raise financing for early,
pre-revenue stage companies, like Perceptronix, in this climate as investors are wary of buying
projected earnings rather than concrete performance.
Even healthcare-focused investors are an issue for Perceptronix. Healthcare investors in
Canada are more habituated in investing in traditional pharmaceutical and biotechnology
investments with long timelines to market and bigger potential returns than medical device
companies. They are less attracted to the "lower risk, lower return" profile of medical device
companies.
Furthermore, investors appear to have the following concerns regarding Perceptronix
specifically:
Pursuing too many products at once
Perceptronix should just pursue the ClearSignTM Test and sell off the
other technologies
Investment firms do not like their investees to diversify; they would
rather diversify their own portfolio
Trying to do everything
Why not pursue partnerships for distribution, manufacturing and/or sales
and marketing?
Entry into a highly competitive field with a me-too fluorescence endoscopy
product
Why bother?
Why not sell technology to Xillix?
Patent worries
Infringement on Xillix or others?
Are Perceptronix's innovations protected?
= Saleable assets rather than just licensed or shared patents
Why bother with the workstation products?
Market opportunity is poor
Why waste resources?
These issues are discussed in more detail in the following sections.
Perceptronix's plan to raise its required funding is a single round of financing through
private placements. This round will be attempted in the next 12 months. The Company has hired
a consultant from Toronto, Mr. Nitin Kaushal who is expert in life sciences investment and well-
known to the finance community, to help with this fundraising endeavour.
The target investors will be large institutions specializing in healthcare and medical
devices. Ideally, the Company would like to get three major institutions investing CDN$7-9
million a piece.
The Company is trying to steer away from venture capital funding as their investment is
typically contingent on getting a Board of Directors seat and veto power. Perceptronix has
determined that it is not in the Company's and current shareholders' (45% of shares are owned
by management) best interest to have a Board of Directors composed of venture capitalists.
Venture capitalist board members typically act in their own interest rather than the general
shareholders and do not have experience operating early stage life sciences companies.
4.2 Meta Issue - Too Many Products at Once
Perceptronix intends to launch a portfolio of integrated products into the market next
year. In order to fulfill this plan, the Company must invest precious time and resources into the
product development, clinical and regulatory approvals, and sales and marketing of all three
product lines. The issue, thus, is whether the Company would be more successful to focus all of
its resources on getting just one product ready for and into the marketplace and either introduce
the other product lines once the Company has revenues to sustain their introduction or sell the
other technologies and focus the Company entirely on one product.
As mentioned, investors are particularly uncomfortable with Perceptronix's involvement
in many product lines. Investors typically want to invest in companies that are focused on one
product because they are easier to evaluate in terms of the potential risks and returns involved
and single products might have a better chance of success. Investors like to be able to choose the
company/product they think has the greatest likelihood of success. They would prefer to
diversify their own investment portfolio rather than have the companies in which they are
invested diversify.
With an investment in Perceptronix, investors are uncomfortable with the distribution
and dilution of their investment across product lines. They are forced to invest in products to
which they would not otherwise contribute. They think that the lack of focus on one product
slows the market entry and market acceptance of all three products.
The ClearSignTM Test is generally seen as the "winning" product line in the eyes of
investors. This is because it is addressing an unmet need and large market opportunity, is
creating a new market, has few competitors, and has the potential to be a blockbuster in terms of
return on investment in the long term. Furthermore, this product is closest to the type of
investment they are used to funding - high margin, large potential market.
The Endoscopy products, on the other hand, are not as attractive to investors. These
products are seen as "me-too" products as there are many fluorescence bronchoscopy companies
in the marketplace. Investors question the rationale for entering this highly competitive market
and question whether Perceptronix can compete. Additionally, investors wonder why
Perceptronix is involved in this area as there is a local competitor to which Perceptronix could
sell their technology.
Similarly, the Workstation products are not attractive to investors as the profit margins
are low and the market is questionable. Firms have been putting cameras on and attaching
computers to microscopes for years. Many of these devices have been engineering successes but
spectacular market failures. Investors wonder what is Perceptronix's reason for entering this
market and why the Company thinks its products will sell.
The concern expressed by investors that Perceptronix is undertaking to commercialize
too many products at once is a valid concern that needs to be evaluated. The issue is whether
Perceptronix would earn higher profits through pursuit of less than all three products at once.
4.3 Meta Issue - Marketing Strategy
There are a number of issues regarding Perceptronix's marketing strategy. First, while
many of the Company's management team have extensive experience in the industry, none of its
number has specific sales and marketing experience or experience in creating new markets, and
the sales and marketing effort is being led by a talented but inexperienced person.
Second, while much of the current strategy is built on industry knowledge, little
organized, primary market research has been conducted.
Third, the current marketing strategy of a small company promoting an integrated
product portfolio of complementary products is untried. The Company's success and growth
depend primarily on market acceptance of its products by pulmonologists and the pathologists
that work with them. Acceptance of the Company's products will depend on its ability to
convince the market that the Company's products significantly reduce the limitations present in
the existing conventional lung cancer diagnosis process.
Fourth, the marketing example of the PSA test market acceptance as a benchmark or
reference for the ClearSignTM Test needs to be re-evaluated. There is some incongruity between
the ClearSignTM Test and the PSA test. Namely, the PSA test performance, though poor, was set
to select as many cancers as possible at the expense of a high number of false positives. Whereas,
the ClearSignTM Test performance is set to minimize the number of false positives at the expense
of selecting only half of the cancers. Both approaches are valid. The issue is whether or not the
marketing success of the PSA test can be used as a marketing reference for the ClearSignTM Test.
With this issue, Perceptronix should also re-evaluate whether or not the current operating point23
is optimal for market entry and marketing success.
Fifth, the selling of Perceptronix products at international conferences is a concern.
Perceptronix may have to gain clinical and regulatory approvals in many more jurisdictions than
currently contemplated in order to effectively sell their products at international conferences to
customers outside of Canada, the EU, and the USA. This creates a heavy resource demand on
clinical and regulatory affairs and on service and may jeopardize the Company's profitability.
Sixth, the sales forecast and resources required need to be revisited. The current business
plan sales forecast and resources required are based on estimated market penetrations rather than
based on a per sales visit model. The sales forecast was estimated based on what the product
groups thought they could accomplish with regards to product output. The number of sales
personnel needed to sell these numbers was then overlaid to meet these forecasts. A new sales
forecast should be generated that fits with the current marketing plan based on model that
23 For a test measuring a continuous quantitative variable, such as the ClearSignTM Test, its performance must be set at a particular point on the curve described by the variable. This can be thought of as a threshold value above which the result is called "positive" and below which the result is called "negative". As no test is perfect, there will be false positives and false negatives at any operating point. This is described in detail in Appendix B. For the ClearSignTM Test, an operating point of 90% specificity was chosen, based on feedback from clinicians, which results in a sensitivity of 50%.

incorporates primary market research, the sales vehicles (conferences; expected per sales
person), and sales synergy between the product lines.
4.4 Micro Issues - Risks
4.4.1 Risk of Regulatory Delays
To date, regulatory approvals have not been obtained for any of Perceptronix's products.
The Company's ability to successfully market and sell its products depends on receiving and
maintaining regulatory approvals in each sales jurisdiction. There is a risk that such regulatory
approvals may not be obtained on a timely basis or may not be obtained at all.
The USA jurisdiction, in particular, poses significant risks. Several factors affect the
Company's ability to successfully obtain FDA approvals including:
= Perceptronix has only limited experience with FDA approval
= The application process can be expensive and time-consuming, sometimes
lasting up to three years or more for pre-market approval ("PMA") applications
for class III medical devices - needed for the ClearSignTM Test and Endoscopy
Products
There may be significant unanticipated delays and costs in the Company's
efforts to secure FDA approval
Even if FDA PMA approval is obtained it may include significant limitations on
the indicated uses for which Perceptronix may market its products such as:
Warnings, precautions, or contraindications
Requests for post-market studies
Additional regulatory requirements
An approved product is still subject to continual review and regulation by the
FDA as long as the product is being marketed.
4.4.2 Risks of Slow Market Acceptance
Perceptronix's long-term success depends on market acceptance of its products for
comprehensive lung cancer care management. There is a risk that market acceptance does not
meet the Company's projections and revenues are insufficient to offset costs and achieve
profitability in 2007.
4.4.3 Risks of Fast Market Acceptance
If the market demand for the ClearSignTM Test exceeds Perceptronix's projections, the
success of the Company will depend on its ability to grow operations to support demand. In this
instance, an in-house service-based model and a direct sales force will be rate-limiting. If
Perceptronix cannot fill demand to the satisfaction of all stakeholders, patients, doctors, and
healthcare administrators alike, the Company runs the risk of extinguishing demand due to
customer dissatisfaction and harming the Company's image or brand in the marketplace. The
Company's operations and sales force should be evaluated for this flexibility.
4.4.4 Competitive Risks
Competitors may develop and market competitive technologies that reduce the
attractiveness of Perceptronix's products or render them obsolete. Perceptronix needs to evaluate
the competitive risks in the current and future marketplace and determine the most appropriate
strategy for creating and maintaining sustainable competitive advantage.
4.5 Chapter Conclusion
The major issues facing Perceptronix as it moves forward to market involve access to
capital, taking all three products to market at once, and the sales and marketing of those products.
The next chapter will discuss recommended actions and mitigations to these issues.
5 RECOMMENDATIONS
This chapter discusses recommendations to the major issues and risks facing
Perceptronix as the company moves forward to market entry and acceptance.
5.1 Meta Issue - Access to Capital
Perceptronix should adopt a two prong approach to mitigate its access to capital issue.
One prong needs to construct an appropriate financing strategy to raise the required funds given
the current investment climate - the plan - and the other needs to address the concerns of
investors - the sales pitch.
5.1.1 The Plan
With regard to the plan, Perceptronix needs to re-evaluate its financing strategy. While
institutional investors appear to be the right group to target, it is unlikely that Perceptronix will
be able to raise the $22-27 million it is seeking through a single private placement at this time.
Institutional investors typically only invest $1-3 million in private placement rounds in Canada.
Therefore, if Perceptronix wants to raise a minimum of $21 million, they will need to get 9
institutions interested in investing. This is again unlikely given that most institutional investors
typically join only 2-4 other firms to form investment syndicates. Furthermore, the current
valuation of the Company is an issue if it wants to raise $22-27 million in a single round in the
near-term. The Company's last round closed in May and was valued at $0.13 per share, which
places the value of the Company at $17.5 million. Investors are going to want to see the
Company achieve several major milestones to increase the value of the Company substantially
before they are willing to put $22-27 million into it in return for a less than 100% share of the
Company. Existing shareholders will want an increased valuation before the next round as well
so that they are not overly diluted.
Alternatives to a single private placement round for $22-27 million include: a single
public offering round; several private rounds; or a smaller private round followed by a public
round. A single public offering round to raise $22-27 million is also unlikely. A small life
sciences initial public offering (IPO) window has opened up lately but is highly volatile and
companies are being beaten down on price24. This window has definitely closed for the summer
months and there is no guarantee of it opening in the fall. Furthermore, even if the Company does
24 "Alnylam Pharmaceutical debuted on Nasdaq after slashing its asking price to $6 per share from an originally estimated $10 to $12 per share. . . . Market watchers noted that this is the seventh IPO this week to slash its asking price, a common feature of many new biotech offerings." Source: FierceBiotech May 28,2004 issue.
a reverse split of its stock at 10 to 1, public markets are going to want to know what the
Company has done since May to value the price at higher than the $1.30 per share. Plus,
Perceptronix's lack of revenue contributes to greater risk of lack of confidence and under-
valuation by the public market compared to the private market due to the typically lower risk
tolerance of the public market.
Raising a smaller private placement round in the next year is perhaps the Company's best
option. Raising $10-12 million from institutional investors is achievable in terms of constructing
a syndicate of 3-5 institutional investors to contribute between $1-3 million a piece. They are
expected to be willing to invest in this round based on the projected company valuation increase
anticipated with each product regulatory approval over the next 12 months and with the start of
revenues. Plus they may be attracted by the potential for follow-on rounds of funding to be public
rounds, which would provide them with a liquidity event and substantial increase in the valuation
of their investment. This money, combined with the $6.5 million the Company currently has,
would fund operations for the next 18 to 24 months. During this period, Perceptronix would be
able to reach many significant milestones during this period including Health Canada and EU
approval to market its products and revenues that will help to increase the Company's valuation
and make a subsequent public or private round for the additional $12-15 million required for
2006 possible.
5.1.2 The Sales Pitch
The Company needs to focus on educating investors on the nature of its business and the
reduced risks associated with a medical device venture - nearer timelines to market, lower
regulatory risks, and lower return on investment. While many of the traditional life sciences
investors may not be interested, it appears that there is some appetite for medical devices
investment - a lower return for a less risky investment - in the investment community
particularly in light of the greater caution being taken with healthcare investments in general. To
these interested parties, Perceptronix needs to address their concerns regarding the Company's
business model.
5.1.2.1 Trying to Do Everything
The issue of trying to do everything ourselves is a valid concern. The current business
plan outlines that the Company will be doing everything from research to manufacturing to sales
and marketing because this is the current status of the Company's contracts and partnerships.
However, the Company realizes that this is not the best way for it to proceed and the Company
intends to pursue strategic partnerships to help it achieve its goals. However, the timing of each
of these partnerships is of critical importance to the effectiveness and contribution of the
partnership to the success of the Company.
For instance, a distribution partnership and/or sales partnership has limited value for the
Company at this time, before demand is created for the Company's products. Perceptronix knows
of no distributor or sales organization that targets pulmonologists or is capable of distributing its
integrated portfolio of products in terms of the product and clinical knowledge necessary for
"missionary" sales. Contract sales and distribution organizations are typically composed of sales
people rather than the clinical and scientific specialists that the Company believes are needed to
be able to effectively sell the Company's product portfolio to pulmonologists.
Sales of the ClearSignTM Test are the biggest hurdle to contracting out sales. Sales
people for the ClearSignTM Test need to be able to talk to the pulmonologist knowledgeably
about sensitivity, specificity, and test positioning within their clinical practise based on their
patient population incidence rate. Plus it would be best if these same sales people were able to
get each new site set-up to send samples to Perceptronix to perform the ClearSignTM Test. To do
this they need to be able to talk knowledgeably to respiratory technicians, inspect sputum
induction procedures, and potentially teach laboratory technicians to prepare slides (if the site
would like to send slides rather than sputum samples).
To make a distribution or sales partnership work the Company would need to establish
large incentives for sales people to create demand and extensive training to enable them to sell
effectively. Incentives would reduce the Company's gross margins significantly and Perceptronix
would need to build up a sizable sales and marketing force in-house to train the outside sales
force.
Furthermore, it is unlikely that a single distributor would carry and market all three
product lines. Separate distribution and sales of Perceptronix's products would destroy any sales
and marketing synergy across the product lines and hamper Perceptronix's mission to partner
with physicians to change lung cancer outcomes.
A new market needs to be created for the ClearSignTM Test and it is unlikely that a
distributor's sales team will be motivated to sell the product without demand created.
Perceptronix would need to employ its own sales team, arguably in the same numbers as under a
direct selling model, in order to create demand for its products and educate the distributor's sales
team. Additionally, for the other products, distributors typically carry competing Endoscopy and
Workstation offerings and, thus, may not be motivated to sell the Company's products.
Therefore, Perceptronix should not pursue a distribution or sales partnership until demand has
been created for its product portfolio and the target consumer is well educated regarding its
benefits and Perceptronix's "mission".
On the other hand, a manufacturing partnership could greatly benefit Perceptronix in the
near-term. In an ideal situation, the Company would like to focus on and create core
competencies of research and product conceptualization, clinical and regulatory, and sales and
marketing. Having product development and manufacturing handled by a partner firm would free
up the Company to focus on these competencies. A partnership with a manufacturing firm that
offered cost advantages would be a further plus, particularly for the Endoscopy and Workstation
products that are entering competitive markets. A manufacturing partnership also has the benefit
of reducing risk associated with the Company's supply. Current suppliers are large companies
like Zeiss (microscopes) that are unlikely to enter into a structured relationship with a small
company like ours. A partner would also leverage power but if the deal is structured equitably,
Perceptronix will have more control over the type and quality of supply even at small volumes.
China has been identified as one place to search for a manufacturing partner. There are a
number of firms in China that are manufacturing microscopes and endoscopes at very low cost
and at adequate quality to the more reputable international firms like Olympus (endoscopes),
Nikon, and Zeiss (microscopes). Such a partnership has advantages in reducing supplier risk and
may be a potential source of capital for a small near-term round of financing, depending on the
deal structure. Furthermore, a partner firm may want to sell the Company's product portfolio into
the China market, creating a distribution or royalty revenue stream for Perceptronix.
5.1.2.2 Endoscopy Product Concerns
Other concerns raised by potential investors centre on the Endoscopy Products. These
products are often seen as "me too" products since many firms are in the fluorescence
bronchoscopy market including a local firm, Xillix. To rebut this concern, Perceptronix needs to
explain to investors why the Company believes its products have a competitive advantage in this
market. First, the Company's products solve some of the limitations of current technology
including increased usability (ClearVuTM: navigation in white light with simultaneous
fluorescence imaging; smaller, light-weight camera), increased specificity (ClearVu EliteTM:
spectral analysis reduces the number of false positive biopsies), and space saving (both products
have single box solution) for crowded operating rooms. It is the Company's belief that these
solutions will help to grow the fluorescence bronchoscopy market so that instead of having to
take market share away from other competitors the Company can grow market share for itself.
Second, the Company believes it has a cost advantage in producing its products due to
innovations in camera design. Third, by marketing to the end user, the Company is in the best
position to create meaningful relationships with the pulmonologist and to integrate consumer
feedback into new products that fit consumer demand. Many of the Company's competitors,
including Xillix, are missing this connection as their sales model is based on using distributors
for sales. Fourth, market introduction of the ClearSignTM Test will stimulate market growth for
the Endoscopy Products. Once lung cancer is detected early, fluorescence bronchoscopes will be
needed to localize the early lesions in the central airways. These four points make up the
Company7 s competitive advantage in the endoscopy marketplace.
5.1.2.3 Patent Worries
With regard to concerns over patent infringement, many concerns are raised because
Xillix used to employ many of the same inventors behind Perceptronix's Endoscopy Products.
The Company has tried to deal with this concern by explaining that these scientists are confident
that they have not infringed on prior intellectual property but to put these concerns to rest for
good, Perceptronix should engage a law firm specializing in patents such as Morrison and
Foerester (Palo Alto, CA) to obtain a legal "freedom to operate" opinion.
Concerns over whether Perceptronix's patents are saleable are less easy to mitigate.
Much of Perceptronix technology is either joint IP or obtained through licence from the BCCA.
This affords Perceptronix protection from mimicry but it does not give investors an asset that
they can sell if Perceptronix is acquired or folded-up. This issue arises because of the differences
in objectives between potential future investors and Perceptronix management (the largest
shareholder). Perceptronix management's objective is to improve lung cancer outcomes and the
most efficient and effective way for the Company to achieve this is in partnership with the
BCCA. The objective of some investors, on the other hand, is to have a realizable exit strategy
(acquisition) and to minimize their risk. Thus far, Perceptronix's pursuit of and support of their
partnership with the BCCA has helped them to realize major milestones in development and in
fundraising with investors that are devoted to making the Company a long-term going concern.
Furthermore, many investors are interested in Perceptronix because of the Company's link with
the BCCA and its reputation for excellence in research and in the clinic. Therefore, it is in the
Company's best interest to continue its joint IP development and partnership with the BCCA and
pursue investors that are tolerant of this policy. Two things the Company can do, however, is to
support as much in-house IP development as possible to supplement the joint IP and to provide
investors with an P O liquidity event instead of an acquisition.
5.1.2.4 Workstation Product Concerns
Some investors have questioned the Workstation Products as a viable product line both
in terms of whether a market exists and in terms of return on investment. The Workstations are
the Company's least attractive product line in terms of contribution margin and in terms of fit
within the lung cancer portfolio of products as they have a different sales target than the
ClearSignTM Test and the Endoscopy Products. This concern should be put to rest by the
workstations high rate of return (57% internal rate of return over the next 5 years) and consumer
demand.
With a modest investment, the Workstations carry the Company's revenue in 2005 with
86% of revenue and in 2006 with 53% of revenue. Furthermore, early market research indicates
that it is the workstations that will help to sell the Company's endoscopes and integrated product
portfolio. One pulmonologist surveyed indicated that he did not even want to consider using
fluorescence bronchoscopy to find early cancer until the pathology of early lung cancer lesions
was understood. Perceptronix's ClearPathTM and ClearCyteTM have encapsulated this knowledge.
5.1.3 Additional Fundraising Concern
One additional concern for Perceptronix with regard to fundraising is that many investors
the Company has talked to in Canada are already investors in Xillix. This is a problem from three
perspectives. The first is that Xillix has not performed very well with a market cap of $1 16
million, $0.5 million in revenues last year, and consistent losses for the last 12 years. While
Xillix is a separate company, its performance reflects badly on Perceptronix. Many of the co-
founders are the same between the two companies and investors are worried that Perceptronix
will follow the same path. The second is that many of Xillix's investors do not want to fund a
company that competes with Xillix to harm Xillix's chances. This limits Perceptronix's pool of
potential investors. The third is that many of Xillix's investors are taking meetings with
Perceptronix in order to gain competitive intelligence, which could harm Perceptronix's
competitive advantage if this information is passed onto Xillix. To mitigate these problems,
Perceptronix should avoid seeking investment from Xillix's investors. Fortunately, most of
Xillix's major investors are venture capital companies, a financing group that Perceptronix wants
to avoid obtaining financing from, if possible.
5.2 Meta Issue - Too Many Products at Once
At this point in time, Perceptronix has three product lines. Given that investors have
concerns that Perceptronix is pursuing commercialization of too many products at once, the
Company should look at whether focusing on one product or continuing to develop all three is in
the best interest of its shareholders at this point in time. The issue is which option is more
profitable and has the best probability of success.
If the Company were to focus on one product, it should be the ClearSignTM Test as it has
the best profitability and market potential (large market and little rivalry) in the long term.
However, solely focusing on this product would not be as profitable and has less probability of
success than pursuing all three products. If all of the Company's resources were focused on this
test it would not speed its timelines to market as the test will be satisfying regulatory hurdles for
the next year and added resources would not speed-up this process. Plus, as the only product, the
ClearSignTM Test would end up bearing the burden of all of the Company's overhead, which
would greatly reduce its profitability.
Additionally, marketing the ClearSignTM Test alone would be less powerful than the
marketing of the integrated portfolio of products for lung cancer. This is because the current set
of technologies for diagnostic follow-up from a positive ClearSignTM Test is inadequate.
Once early lung cancer (Stage I) is detected by the ClearSignTM Test, pulmonologists
will not be able to localize it, if the lesion is in the central airways (30-45% of lung cancers),
unless they use fluorescence bronchoscopy. Fluorescence bronchoscopy is currently only in the
hands of a minority of pulmonologists. This inability to localize an early stage lung cancer will
result in a high number of diagnostic work-ups that are negative (no lung cancer is observed), the
ClearSignTM Test performance will appear poor, and its acceptance in the marketplace will
stagnate or decline. Perceptronix could partner with an existing fluorescence bronchoscopy
company to ameliorate this problem but other companies do not have the ability to turn white
light users into fluorescence bronchoscopists and the problem would remain. Using an early
detection test without providing the means for early lung cancer localization and diagnosis to
confirm the accuracy of the test and trigger appropriate patient treatment for better outcomes will
lead to resistance to market adoption by doctors and healthcare administrators.
Furthermore, there are similar links existing between Perceptronix7s endoscopy and
workstation products that make a combined approach more powerful than an individual product
approach. For instance, one pulmonologist recently surveyed indicated that he would not be
interested in adopting fluorescence bronchoscopy until the pathology of early lung cancer was
determined because even if he found early lesions via fluorescence bronchoscopy, any biopsies
that he sent for pathology diagnosis may be misdiagnosed.
Likewise, there are links between sales of the Endoscopy Products and the ClearSignTM
Test. Many white light bronchoscopy users are reluctant to make the switch to fluorescence
bronchoscopy because they believe that the patient population that they currently investigate
using bronchoscopy are late stage and, therefore early localization of cancer lesions using
fluorescence bronchoscopy is redundant. They argue that they are not interested in fluorescence
bronchoscopy until there is an early detection test to identify early lung cancer patients for
fluorescence bronchoscopy.
Thus, there are synergies to be gained by marketing Perceptronix's three product lines in
terms of market acceptance and creation of brand power.
There are also synergies in the development of these three product lines. First, corporate
overheads are distributed among the three products leading to a lower per product indirect cost.
Second, there are significant manufacturing synergies. Manufacturing of the ClearSignTM Test
system and Workstation Products benefit from the use the same microscopes, slide loaders, and
computer systems. Third, resources are shared across product lines. Data analysis, algorithm
development, system engineering, and clinical and regulatory affairs utilize the same skill sets
and personnel across all three products. The sales targets for the products are linked thereby
reducing the resources needed for sales. The similar focus on lung cancer diagnosis enables all
three products to be marketed at lung cancer conferences and to lung cancer physicians
determined to make a difference to the outcomes of their patients.
There are also direct losses to be incurred with divesting the Endoscopy and Workstation
products at this point in time. Despite the resources that have been invested in these product
lines to date these products have low market value because they need further development
(people would need to be transferred with the product to continue development), have not passed
regulatory hurdles, and have not been proven in the market. Significantly greater value can be
extracted for Perceptronix shareholders from divesting these products once development is
completed and regulatory hurdles have been cleared. Therefore, even if Perceptronix was to
choose to divest the Company of these products, now is not the right time.
This is also true for licensing. Perceptronix's products are not ready to be licensed out.
The ClearSignTM Test is not ready to be moved off site yet. Similarly, the Endoscopy and
Workstation products have not yet finished development and licensing would be premature.
In summary, it is not in Perceptronix's shareholders best interest to divest or license out
any of the product lines at this time and Perceptronix should continue to focus on development of
all three products. There are significant synergies to be realized in development and shareholder
value can be maximized by completing development.
All three products are worthy of investment in terms of near-term payback periods
(within 4 years and 3 months), high net present value ($5 to $12 million), and high internal rates
of return (40-69%). Therefore, divesting of any one would erode potential profitability.
Furthermore, there are significant sales and marketing synergies to be gained by going to
market with all three product lines. This approach will maximize market acceptance and brand
power of all three products.
Once product development is complete, Perceptronix should evaluate divesting and
licensing opportunities in the context of market conditions and marketing strategy success. At
this time, it may be in shareholders best interest to divest or license.
5.3 Meta Issue - Marketing strategy
Perceptronix's marketing strategy is centred on the pulmonologist. This physician is the
key person responsible for diagnosing lung cancer and for follow-up of lung cancer patients. It is
the pulmonologist that will order the ClearSignTM Test and use the Endoscopy Products to obtain
lung biopsies and cells for pathology examination. This latter undertaking is currently the
pulmonologist's main service and there is likely to be a relationship between the pulmonologist
and the pathologist that helshe sends tissue and cell samples to for definitive diagnosis. It is this
relationship that Perceptronix plans to exploit for sales of the Workstation Products.
5.3.1 Sales and Marketirlg Experience
Perceptronix's management team does not have experience with sales and marketing,
healthcare-specific or otherwise. This may be viewed as a deficiency but it may also be viewed
as an asset. On the one hand, Perceptronix does not have healthcare-specific sales and marketing
experience. On the other hand, Perceptronix's lack of traditional sales and marketing experience
may lead to more creative marketing solutions that result in greater marketing success.
Healthcare-specific marketing prowess was identified as a key industry success factor in
Chapter 2 because of the differences between traditional sales and marketing and healthcare sales
and marketing. Healthcare sales and marketing has to negotiate issues of multiple stakeholders,
information asymmetry, necessity to fit within healthcare budgets, and a lack of customer
concentration. Therefore, negotiating the healthcare bureaucracy, personal selling, and marketing
networks are very important to successful market acceptance.
While Perceptronix does not have sales and marketing experience to address these
issues, it does have a strong understanding of the consumer and the clinical environment.
Perceptronix's strengths in clinical and regulatory affairs grants it in-depth knowledge of the
healthcare bureaucracy, personal relationships with consumers, and networks of collaborators.
These strengths meet the issues outlined for marketing to healthcare. Therefore, it appears that
Perceptronix is well equipped to market to healthcare if it turns its clinical and regulatory
strengths into marketing tools.
Exploiting Perceptronix's strengths in clinical and regulatory affairs, in fact, matches the
Company's initial sales and marketing plans. These plans include converting its clinical trial sites
into the first commercial sites and converting its clinical and regulatory staff into the first sales
personnel. These people are knowledgeable about the clinical environment and experts regarding
the product portfolio. They have established relationships with the target consumer and are
typically well educated (M.D.s) that are equally capable of "missionary" sales and conference
presentations. Plus, as clinical trials wind-down for the products, the sales and marketing efforts
will wind-up so that the transition of these people from clinical and regulatory to sales and
marketing is a logical one.
5.3.2 Primary Market Research
Little organized primary market research has been conducted. Perceptronix has attended
conferences and seminars, read white papers, met with pulmonologists, and worked with its
network of clinical collaborators to gather most of its current market knowledge. However, as the
Company approaches the market, a more organized effort should be initiated. Perceptronix needs
to determine the number of pulmonologists there are in each jurisdiction and how best to reach
them.
5.3.3 Promoting a Portfolio
There are several precedents of co-promotion of medical devices and drugs or
consumables that are linked in use. However, the concept of promoting a portfolio of separate
medical device products for distinctly different uses to address a healthcare problem is untried
and there are no direct precedents from which Perceptronix can learn. This should not shake
confidence in Perceptronix's approach, however, as early feedback from the consumer indicates
that demand is strong and there are significant synergies to be had with promotion of an
integrated portfolio of products for lung cancer diagnosis.
Furthermore, there are many precedents of unsuccessful companies and unsuccessful
strategies from which Perceptronix has learned.
In the mid-1980s, many medical device companies were started with the mission of
solving problems with Pap Test screening for cervical cancer. The instigation of this was an
article written in the Wall Street Journal exposing the problems of "Pap test mills" which
outlined alarming evidence of negligent Pap test practises in the USA. This exposed problem
spawned the formation of the Clinical Laboratory Improvement Act (CLIA) of 1988 and the
formation of multiple medical device companies including Cytyc, Neopath Inc., Neuromedical
Systems Inc., Roche Image Analysis Systems Inc., AccuMed International Inc., and
Morphometrix Inc.. All of these companies attempted to build automated cervical cancer
screening devices to replace cytotechnologists.
Of these six companies, only Cytyc was successful and only two other companies are
still going concerns today, Tripath Imaging Inc. (formed from a merger of NeoPath and Roche),
and Molecular Diagnostics Inc. (formerly AccuMed). These latter two companies have not been
profitable and have sustained substantial losses. Cytyc was successful by focusing on sample
acquisition quality, ensuring consumables plus device revenue streams, and propelling its
product into the standard of care in the USA through the threat of liability.
Perceptronix has learned several lessons from the mistakes made by these companies.
Key mistakes included:
Chose a market that already had a solution - cervical cancer
Tried to create a mechanical cytotechnician
Had to do substantially better or save substantial costs in order to
succeed - very expensive to develop and to prove
Created the wrong product for the consumer
Focused on creating better technology rather than solving a consumer's
problem
Consumer was HMO and insurers and their problem was high cost of
Pap testing. The products made available by these companies did not
reduce costs; they made Pap testing more expensive.
Marketed to the wrong stakeholders
Marketed direct to patient using fear tactics - suffered backlash from
doctors
Failed to identify the importance of doctors to sales. Doctors dictate the
standard of care and, thus, influence market acceptance, patient opinion,
and creation of reimbursement codes
Focused on competing for market share but needed to create a market first
Market for mechanical cytotechnician was not created
Slowed market entry for all by litigating and interfering with FDA
approval of competing technology
These companies, with the exception of Cytyc, failed to understand the market and were
so focused on competing with each other that they failed to deliver products that consumers
wanted. Perceptronix has learned from the example set by these companies that marketing a
product to the gatekeepers and thought leaders that is a solution to a clinical problem is of
paramount importance to successful market acceptance.
Many of Perceptronix's lessons were also learned from Xillix. Xillix encountered
problems with marketing its first product, the LIFE-Lung. Xillix was the first company on the
market with a fluorescence bronchoscopy system and, thus, had to create the market. It employed
a large direct sales force to do this but tried to sell in a traditional "sales call" mode. It
encountered resistance from the marketplace and very few units sold. Plus, the units that did sell
were sold through referrals of thought leaders rather than its expensive sales team.
An additional problem encountered with this product was that it was released too soon.
There were major quality problems with the first product which cost Xillix massive service
expenses and hurt market creation, brand equity, and firm reputation.
Xillix also made the mistake of partnering with a large distribution partner too soon. A
deal was cut with Olympus, a competitor, for a distribution partnership. The partnership was
inequitable and Olympus was not motivated to sell its competitor's, Xillix's, products. Xillix
subsequently spent many millions of dollars fighting to get out of this partnership and this
lawsuit almost bankrupted it. From this, Perceptronix has learned that the timing of investment in
sales force, distribution, and manufacturing are all crucial for a small company with limited cash
flow.
Another mistake Xillix made was to jettison valuable products prematurely. At one point
Xillix owned a camera technology. It decided to divest itself of this product and sold the
technology to QImaging Inc. (Burnaby, B.C.) for several thousands of dollars. QIrnaging turned
this technology into a profitable business and sold the business for approximately $20 million
within 18 m0nths.~5
So while there may not be a positive precedent on which Perceptronix can benchmark its
marketing strategy, there are many negative benchmarks that Perceptronix can learn from and
25 htt~://www.qima~ina.codnews/~ress/~2-02.h . July 20, 2004.
95
previously used tactics it can avoid. These negative examples are incredibly valuable to
Perceptronix so that it can avoid making some of the mistakes of its predecessors.
5.3.4 PSA Test Model
The market acceptance model of the PSA test in North America has been used as a
benchmark for ClearSignTM Test market entry and dissemination strategy. The PSA test was
introduced to the North American market as a prostate cancer detection test in patients at high
risk for prostate cancer, patients referred to an urologist due to prostate problems, and follow-up
test for treated prostate cancer patients. From this position, the PSA test was disseminated via
viral marketing to the GP population within 5-10 years. The PSA test is now recommended for
prostate cancer screening in the USA. In Canada, only the former application is recommended
but the government has commissioned two major studies to determine whether it should be used
for general screening. GPs routinely recommend that their patients in the high risk age range get
PSA test, even if they have to pay out of pocket for screening. In fact, 69% of the PSA tests
performed in Canada are for prostate cancer screening.26
Similarly, Perceptronix intends to market its test to the lung cancer gatekeeperslthought
leaders, the pulmonologists, and get their test approved as a detection test in patients at high risk
for lung cancer and as a follow-up test for treated lung cancer patients. From this point,
Perceptronix hopes that the ClearSignTM Test will be disseminated to GPs through viral
marketing and eventually the governments will fund major ClearSignTM Test screening trials and
approve the ClearSignTM Test for screening application.
For the most part, the PSA test precedent is a good match for Perceptronix's plans.
However, the PSA test has a different operating point than the operating point being tested by the
ClearSignTM Test's international clinical trial. The PSA test performance is approximately 90%
sensitive at a specificity of 2 0 % . ~ ~ In other words, it will catch 90% of the prostate cancers but at
a cost of a false positive rate of 80% (calling 80% of the negative population positive). In
contrast, the current operating point for the ClearSignTM Test is 50% sensitive at a specificity of
90%.28 In other words, it will catch 50% of the lung cancers but at a cost of a false positive rate
26 Information re: frequency of PSA testing from Cycle 1.1 of the Canadian Community Health Survey, 2000-200 1. Statistics Canada. 2003.
27 Horninger W. et al. 2002. Urology 60 (4 Suppl 1): 31-5.
28 Result from Perceptronix ClearSignTM Test field study of 1464 sputum samples (326 confirmed lung cancer patients and 1128 high risk patients with no known malignancy). Results not published.
of 10% (calling 10% of the negative population positive). This operating point is comparable to
the performance of a single Pap test.29
There is no question that the operating point chosen by Perceptronix is the right one in
terms of feasibility (will not over-burden the healthcare system with false positives) and cost-
benefit (less trauma to patient associated with false positive result and less cost associated with
diagnostic work-ups of false positives; see Appendix B). However, there is some question as to
whether, given the differences in operating points between the PSA test and the ClearSignTM
Test, the PSA test market acceptance is an appropriate precedent on which to base ClearSignTM
Test market entry strategy.
One question that arises is whether or not at the chosen operating point there will be the
same momentum for dissemination of the ClearSignTM Test from the pulmonologists to the GPs.
Doctors, and GPs especially, can have a difficult time understanding sensitivity and specificity
(see Appendix B) and its implication in practise on a population. Often their response is an
emotional one, similar to the response of an individual patient, in that they would like to have
90% of the lung cancers detected rather than 50%, regardless of the specificity. However, the
Pap test has been well accepted by the medical community at a sensitivity of 50% for a single
test because application of the test every year brings the sensitivity up to the 70-80% range for
the testing program.30 Serial application of the ClearSignTM Test has not yet been tested but
because of the usual slow-growing nature of most non-small cell lung cancer (-85% of lung
cancers31), the sensitivity of a program of regular ClearSignTM testing is likely to be higher, like
Pap testing programs. If so, this should ameliorate doctors concerns and promote ClearSignTM
Test dissemination. Plus the comparison between the ClearSignTM Test and the Pap test should
help facilitate understanding of the ClearSignTM Test performance. Thus, the ClearSignTM Test
appears well positioned for dissemination from the testing the high risk pulmonologist patient
population to the GPs' screening application.
Another question that arises is whether or not the chosen operating point is the right one
for pulmonologists and their patients. A pulmonologist's patient population includes people
referred by GPs for suspected lung cancer, lung disease patients (e.g. emphysema or chronic
obstructive pulmonary disease), and treated lung cancer patients. The incidence of lung cancer in
29 Soost H.J. et al. 1991. Acta Cytol35 (1): 8-14. ; Benoit A.G. et al. 1984. Am J Obstet Gynecol 148 (5): 690-4.
30 Nanda K. et al. 2000. Ann Intern Med 132 (10): 8 10-9.
this patient population is high (estimated to be in the range of 10%) and pulmonologists would
like to be able to test these patients for lung cancer. The question is whether the chosen operating
point for the ClearSignTM Test is optimal for each of these groups within the pulmonologist's
patient population.
With regard to lung disease and lung cancer patients, pulmonologists would like a non-
invasive routine test that will monitor these patients for the incidence of lung cancer. This
application is much like a screening application, although to a high incident population, and a
program of regular testing at the 50% sensitivity at 90% specificity operating point will be
beneficial as described above.
For the other patient group, the people referred to the pulmonologist by GPs for
suspected lung cancer, the chosen operating point needs to be examined in the context of current
typical practise. When pulmonologists suspect lung cancer presently in the developed world, they
will typically order diagnostic work-ups that include bronchoscopy and CTs. When the
ClearSignTM Test is available the pulmonologist will either order the test in advance of this work-
up or in parallel with it. The issue is which point of administration in the diagnostic work-up is
the ClearSignTM Test best applied at the chosen operating point and at an operating point similar
to the PSA test. This question is best explored by looking at the pros and cons of four scenarios.
5.3.4.1 Scenario 1: 50% sensitivity at 90% specificity prior to others
If the ClearSignTM Test is used in advance of the other technologies, half of the patients
that have lung cancer will be detected and 90% of the cost associated with diagnostic work-up of
patients that do not have lung cancer will be avoided.
If pulmonologists typically perform bronchoscopies on all patients they suspect of
having lung cancer, this will reduce their work load and reduce their income - a negative
incentive for applying the test.
If pulmonologists typically do not perform bronchoscopies on all patients they suspect of
having lung cancer, this will increase their work load and increase their income - a positive
incentive for applying the test.
5.3.4.2 Scenario 2: 50% sensitivity at 90% specificity in parallel with others
If the ClearSignTM Test is used in parallel with bronchoscopy and CT eight combinations
of results are possible. As can be seen in Table 20 the main area of difference between follow-up
31 hltp:llwww.bccancer.bc.ca/HPI/Ca~~~erManaenentGuideIinesun/strt.htm . July 20, 2004.
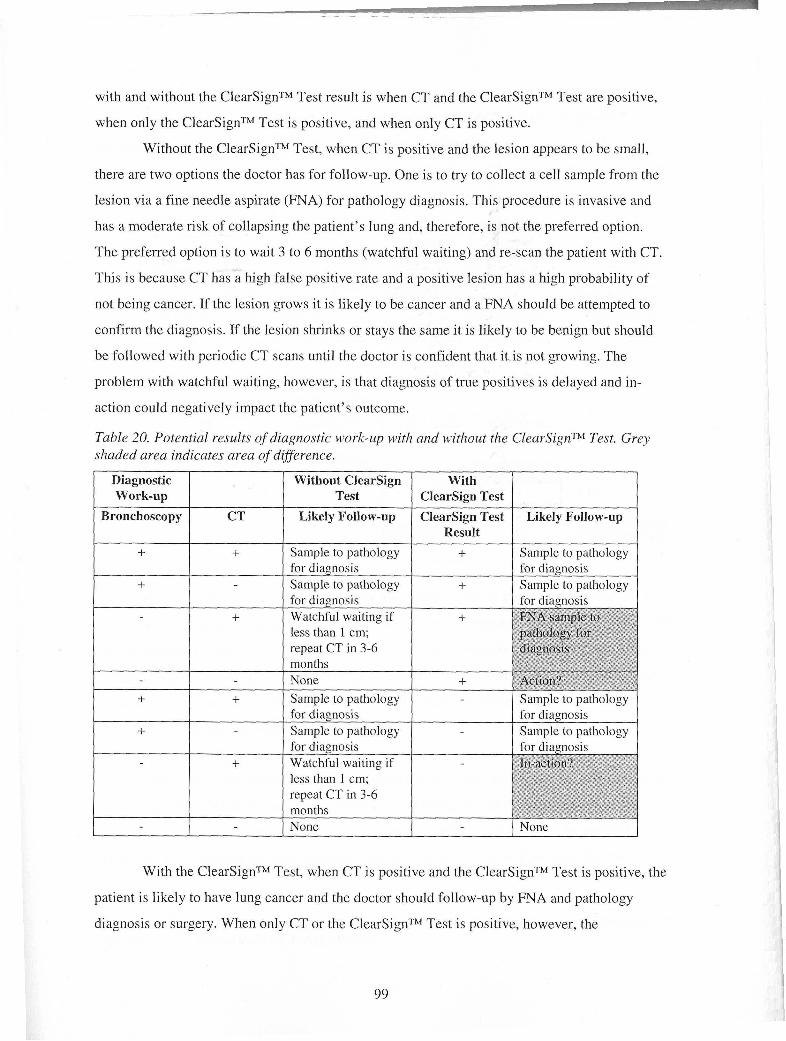
with and without the ClearSignTM Test result is when CT and the ClearSignTM Test are positive,
when only the ClearSignTM Test is positive, and when only CT is positive.
Without the ClearSignTM Test, when CT is positive and the lesion appears to be small,
there are two options the doctor has for follow-up. One is to try to collect a cell sample from the
lesion via a fine needle aspirate (FNA) for pathology diagnosis. This procedure is invasive and
has a moderate risk of collapsing the patient's lung and, therefore, is not the preferred option.
The preferred option is to wait 3 to 6 months (watchful waiting) and re-scan the patient with CT.
This is because CT has a high false positive rate and a positive lesion has a high probability of
not being cancer. If the lesion grows it is likely to be cancer and a FNA should be attempted to
confirm the diagnosis. If the lesion shrinks or stays the same it is likely to be benign but should
be followed with periodic CT scans until the doctor is confident that it is not growing. The
problem with watchful waiting, however, is that diagnosis of true positives is delayed and in-
action could negatively impact the patient's outcome.
Table 20. Potential results of diagnostic wo1.k-up with and without tlze ClearSignT" Test. Grey shaded area indicates area of difference.
With the ClearSignTM Test, when CT is positive and the ClearSignTM Test is positive, the
patient is likely to have lung cancer and the doctor should follow-up by FNA and pathology
diagnosis or surgery. When only CT or the ClearSignTM Test is positive, however, the
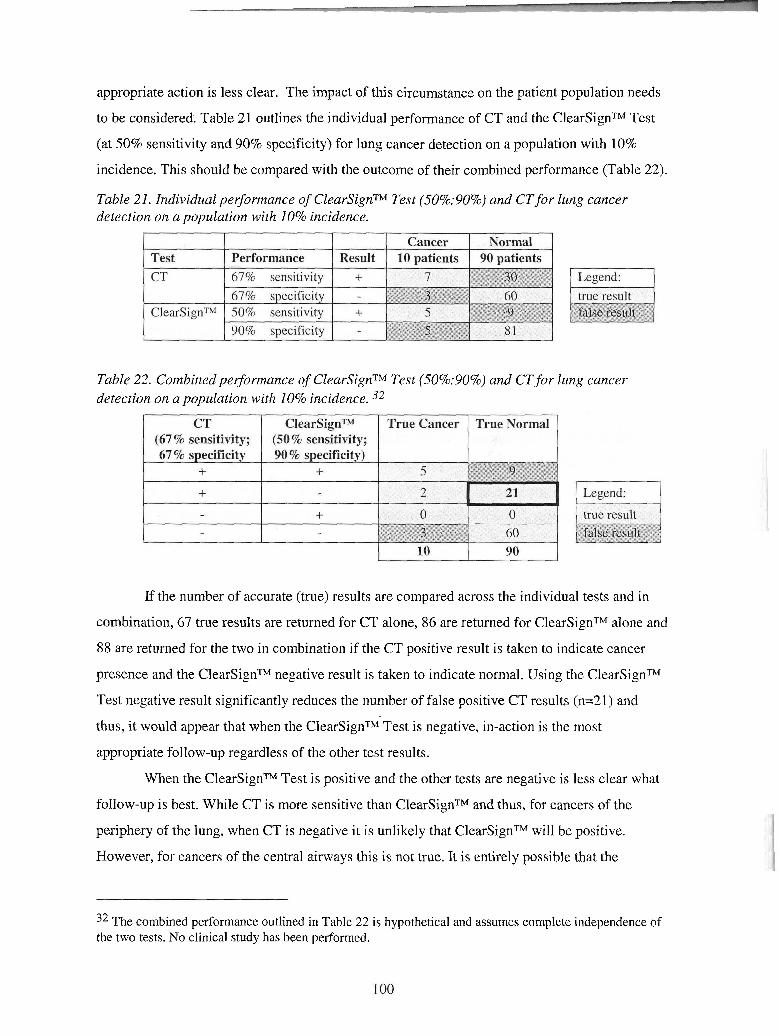
appropriate action is less clear. The impact of this circumstance on the patient population needs
to be considered. Table 21 outlines the individual performance of CT and the ClearSignTM Test
(at 50% sensitivity and 90% specificity) for lung cancer detection on a population with 10%
incidence. This should be compared with the outcome of their combined performance (Table 22).
Table detect
21. Individual pei-j-ormance of ClearSignTM Test (50%:90%) and CTfor 'ion on a population with 10% incidence.
lung cancer
Table 22. Cor~dinedpe$or~izance of ClearSignTM Test (50%:90%) and CTfor lung cancer detection on a population with 10% incidence. 32
If the number of accurate (true) results are compared across the individual tests and in
combination, 67 true results are returned for CT alone, 86 are returned for ClearSignTM alone and
88 are returned for the two in combination if the CT positive result is taken to indicate cancer
presence and the ClearSignTM negative result is taken to indicate normal. Using the ClearSignTM
Test negative result significantly reduces the number of false positive CT results (n=21) and
thus, it would appear that when the ClearSignTM Test is negative, in-action is the most
appropriate follow-up regardless of the other test results.
When the ClearSignTM Test is positive and the other tests are negative is less clear what
follow-up is best. While CT is more sensitive than ClearSignTM and thus, for cancers of the
periphery of the lung, when CT is negative it is unlikely that ClearSignTM will be positive.
However, for cancers of the central airways this is not true. It is entirely possible that the
32 The combined performance outlined in Table 22 is hypothetical and assumes complete independence of the two tests. No clinical study has been performed.
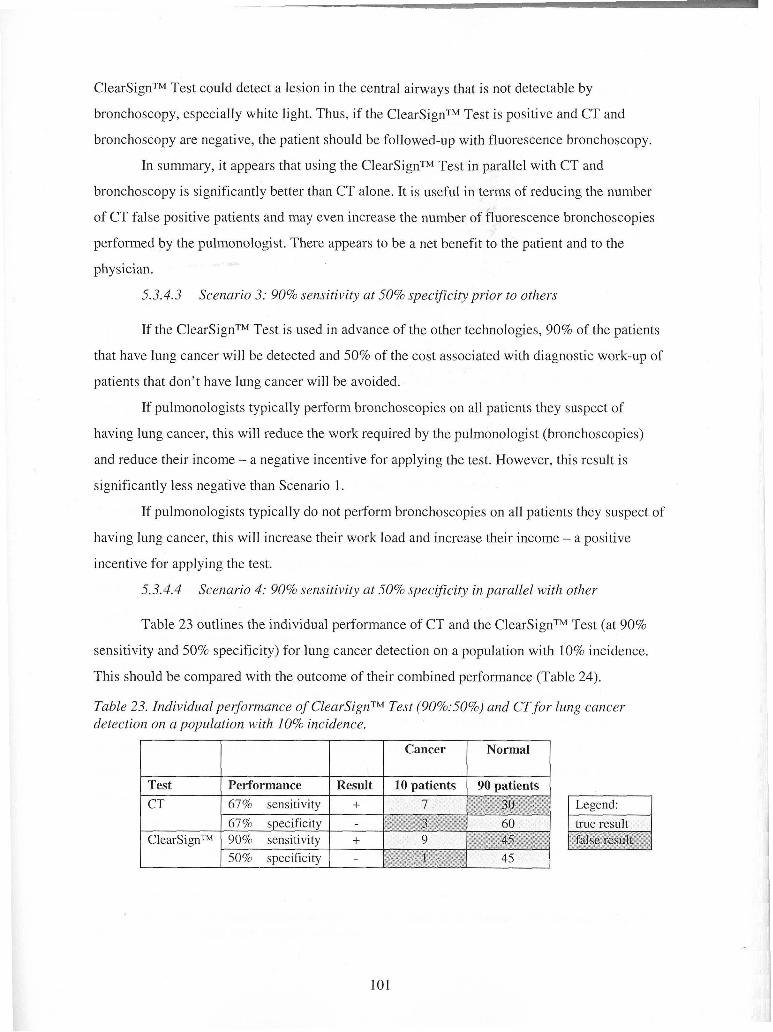
ClearSignTM Test could detect a lesion in the central airways that is not detectable by
bronchoscopy, especially white light. Thus, if the ClearSignTM Test is positive and CT and
bronchoscopy are negative, the patient should be followed-up with fluorescence bronchoscopy.
In summary, it appears that using the ClearSignTM Test in parallel with CT and
bronchoscopy is significantly better than CT alone. It is useful in terms of reducing the number
of CT false positive patients and may even increase the number of fluorescence bronchoscopies
performed by the pulmonologist. There appears to be a net benefit to the patient and to the
physician.
5.3.4.3 Scenario 3: 90% sensitivity at 50% specificity prior to others
If the ClearSignTM Test is used in advance of the other technologies, 90% of the patients
that have lung cancer will be detected and 50% of the cost associated with diagnostic work-up of
patients that don't have lung cancer will be avoided.
If pulmonologists typically perform bronchoscopies on all patients they suspect of
having lung cancer, this will reduce the work required by the pulmonologist (bronchoscopies)
and reduce their income - a negative incentive for applying the test. However, this result is
significantly less negative than Scenario 1.
If pulmonologists typically do not perform bronchoscopies on all patients they suspect of
having lung cancer, this will increase their work load and increase their income - a positive
incentive for applying the test.
5.3.4.4 Scenario 4: 90% sensitivity at 50% specificity in parallel with other
Table 23 outlines the individual performance of CT and the ClearSignTM Test (at 90%
sensitivity and 50% specificity) for lung cancer detection on a population with 10% incidence.
This should be compared with the outcome of their combined performance (Table 24).
Table 23. Individual perfornzance of ClearSignTM Test (90%:50%) and CTfor lung cancer detection on a population with 10% incidence.
I I I I
Test 1 Performance 1 Result 1 10 patients 1 90 patients
Cancer
I
1 67% sensitivitv 1 + 1 7
Normal
I Legend: I
ClearSignTM 90% sensitivity I + 1 9 50% suecificitv I -
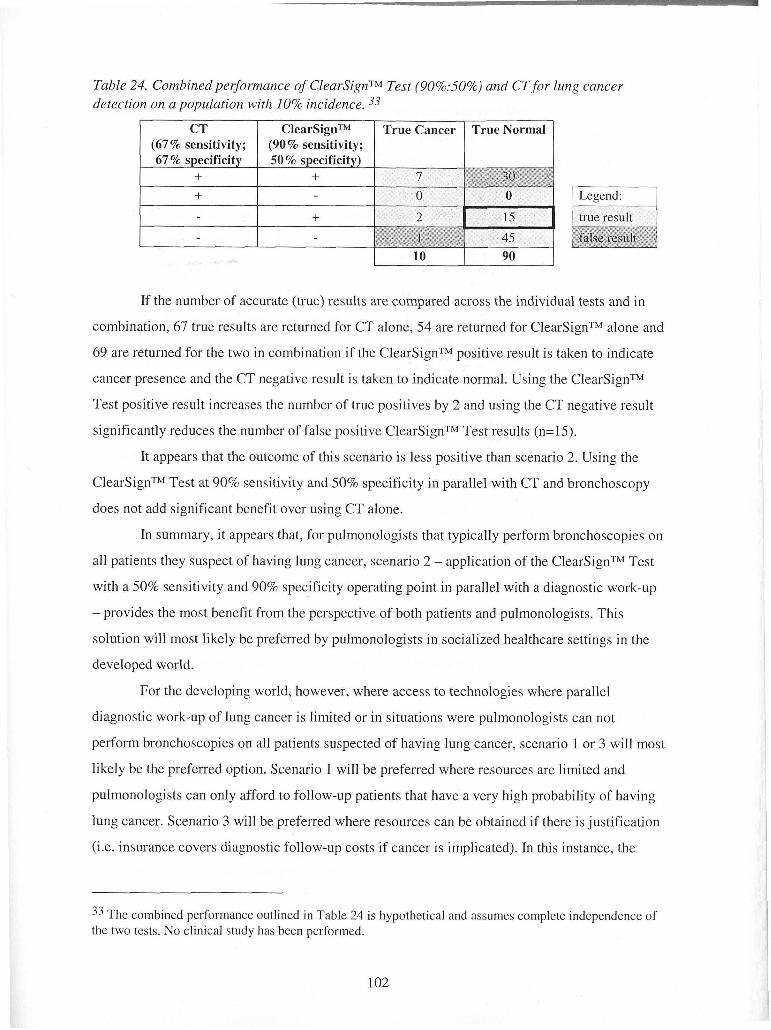
Table 24. Cornbinedpe~ormance of ClearSignTM Test (90%:50%) and CT for lung cancer detection on a population with 10% incidence. 33
If the number of accurate (true) results are compared across the individual tests and in
combination, 67 true results are returned for CT alone, 54 are returned for ClearSignTM alone and
69 are returned for the two in combination if the ClearSignTM positive result is taken to indicate
cancer presence and the CT negative result is taken to indicate normal. Using the ClearSignTM
Test positive result increases the number of true positives by 2 and using the CT negative result
significantly reduces the number of false positive ClearSignTM Test results (n=15).
It appears that the outcome of this scenario is less positive than scenario 2. Using the
ClearSignTM Test at 90% sensitivity and 50% specificity jn parallel with CT and bronchoscopy
does not add significant benefit over using CT alone.
In summary, it appears that, for pulmonologists that typically perform bronchoscopies on
all patients they suspect of having lung cancer, scenario 2 - application of the ClearSignTM Test
with a 50% sensitivity and 90% specificity operating point in parallel with a diagnostic work-up
- provides the most benefit from the perspective of both patients and pulmonologists. This
solution will most likely be preferred by pulmonologists in socialized healthcare settings in the
developed world.
For the developing world, however, where access to technologies where parallel
diagnostic work-up of lung cancer is limited or in situations were pulmonologists can not
perform bronchoscopies on all patients suspected of having lung cancer, scenario 1 or 3 will most
likely be the preferred option. Scenario 1 will be preferred where resources are limited and
pulmonologists can only afford to follow-up patients that have a very high probability of having
lung cancer. Scenario 3 will be preferred where resources can be obtained if there is justification
(i.e. insurance covers diagnostic follow-up costs if cancer is implicated). In this instance, the
CT (67% sensitivity;
33 The combined performance outlined in Table 24 is hypothetical and assumes complete independence of the two tests. No clinical study has been performed.
ClearSignTM (90 % sensitivity;
True Cancer True Normal
ClearSignTM Test with a 90% sensitivity at 50% specificity will help them to increase the number
of patients to which they give diagnostic follow-up and, thus, increase their revenues.
Thus, it does appear that the PSA test is a good precedent for the market acceptance of
the ClearSignTM Test. It looks like pulmonologists will accept and use the test at the current
operating point (50% sensitivity at 90% specificity; scenario 1 and 2). This use will lead to
dissemination of the test to GPs, who will understand the use of the test if it is likened to the Pap
test. GP understanding will lead to wide-spread use of the test for lung cancer screening. Wide-
spread use will spur governments to endeavour to gain approval for the ClearSignTM Test as the
recommended screening test for early lung cancer detection.
5.3.5 International Conferences
According to Perceptronix's marketing strategy, sales will be generated largely through
conferences, white papers, and referrals rather than through traditional sales calls. Based on the
Company's recent experience at the World Congress of Bronchology (June, 2004), this strategy
will result in interest from consumers from Canada, the EU, USA, Asia, and South America.
According to the current plan, Perceptronix is anticipating obtaining regulatory approvals for
sales in Canada, the EU, and the USA but not Asia or South America. Therefore, there is a
conflict between the Company's current plans and the projected interest from consumers.
Perceptronix can respond one of two ways to this issue. Either the Company can restrict
sales to countries that fall within the jurisdictions that have granted approval and countries that
accept Health Canada or FDA approval as sufficient for regional sales or the Company can
pursue regulatory approvals in Asia and South America to ensure potential customers from these
countries have access to Perceptronix technology. The former option will restrict sales but the
latter will greatly increase the Company's clinical and regulatory expenses.
Thus, Perceptronix should choose to restrict sales to Canada, the EU, and the USA and to
countries that accept foreign regulatory approvals at this time. The Company should not divert its
focus from obtaining regulatory approvals in these large, important markets plus the Company
does not have the resources to pursue other clinical and regulatory approvals at this time.
However, moving forward regional levels of interest and regulatory hurdles for additional
markets should be monitored closely for significant opportunities. Where strong business cases
can be made with decent five year internal rates of return (>20%), expansion into new markets
should be undertaken on a case by case basis.
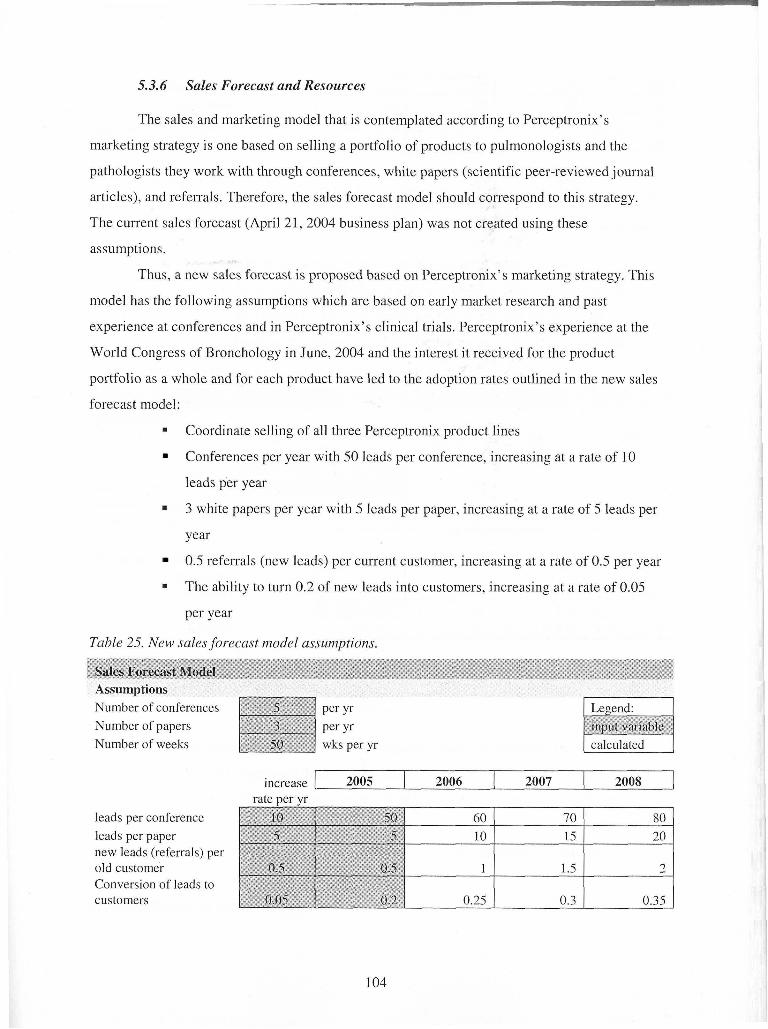
5.3.6 Sales Forecast and Resources
The sales and marketing model that is contemplated according to Perceptronix's
marketing strategy is one based on selling a portfolio of products to pulmonologists and the
pathologists they work with through conferences, white papers (scientific peer-reviewed journal
articles), and referrals. Therefore, the sales forecast model should correspond to this strategy.
The current sales forecast (April 21,2004 business plan) was not created using these
assumptions.
Thus, a new sales forecast is proposed based on Perceptronix's marketing strategy. This
model has the following assumptions which are based on early market research and past
experience at conferences and in Perceptronix's clinical trials. Perceptronix's experience at the
World Congress of Bronchology in June, 2004 and the interest it received for the product
portfolio as a whole and for each product have led to the adoption rates outlined in the new sales
forecast model:
Coordinate selling of all three Perceptronix product lines
Conferences per year with 50 leads per conference, increasing at a rate of 10
leads per year
3 white papers per year with 5 leads per paper, increasing at a rate of 5 leads per
year
0.5 referrals (new leads) per current customer, increasing at a rate of 0.5 per year
The ability to turn 0.2 of new leads into customers, increasing at a rate of 0.05
per year
Table 25. New sales forecast model assumptions.
Sales Forecast Model
Number of conferences Per Yr Number of papers Per Yr Number of weeks wks per yr
leads per conference leads per paper new leads (referrals) per old customer Conversion of leads to customers
increase 2005 rate ver vr
2006 2007 2008
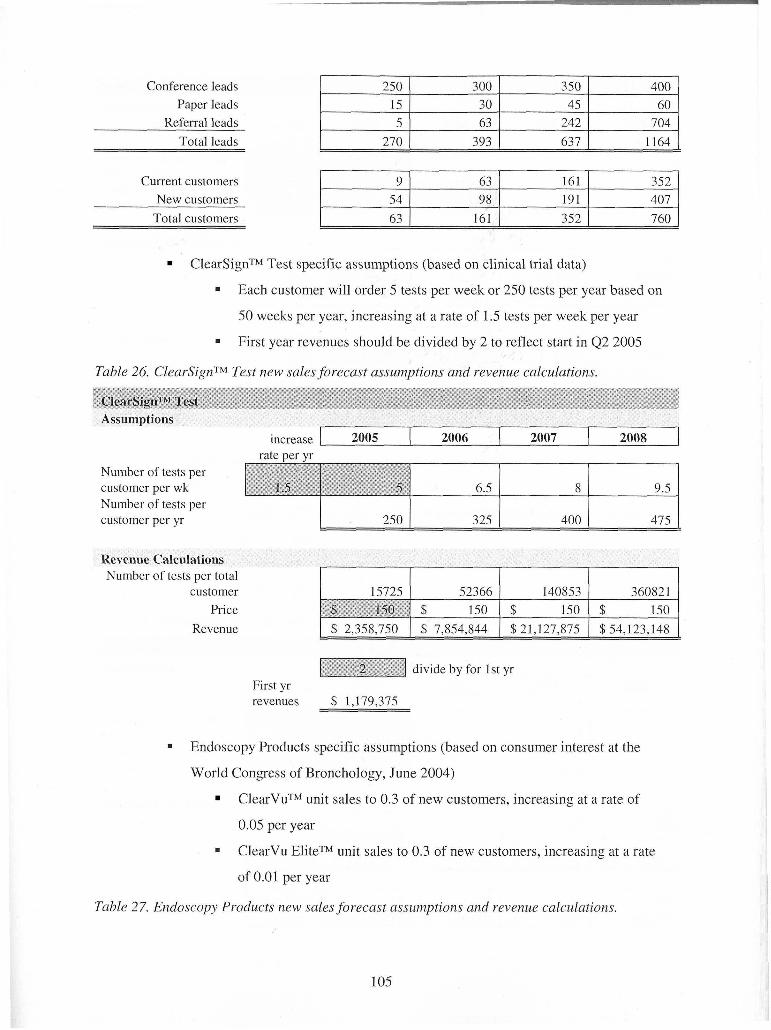
Conference leads Paper leads
Referral leads 242 Total leads 270 393 637
ClearSignTM Test specific assumptions (based on clinical trial data)
Current customers New customers
Total customers
Each customer will order 5 tests per week or 250 tests per year based on
50 weeks per year, increasing at a rate of 1.5 tests per week per year
First year revenues should be divided by 2 to reflect start in 4 2 2005
9 54 63
Table 26. ClearSignTM Test new sales forecast assumptions and revenue calculations.
ClearSignTv Test
63 98
161
Assumptions
Number of tests per customer per wk Number of tests per customer per yr
161 191 352
Revenue Calculations Number of tests per total
customer Price
Revenue
352 407 760
increase 2005 2006 2007 2008 1 rate per yr
divide by for 1st yr First yr revenues $ 1.179.375
Endoscopy Products specific assumptions (based on consumer interest at the
World Congress of Bronchology, June 2004)
ClearVuTM unit sales to 0.3 of new customers, increasing at a rate of
0.05 per year
ClearVu EliteTM unit sales to 0.3 of new customers, increasing at a rate
of 0.01 per year
Table 27. Endoscopy Products new sales forecast assumptions and revenue calculations.
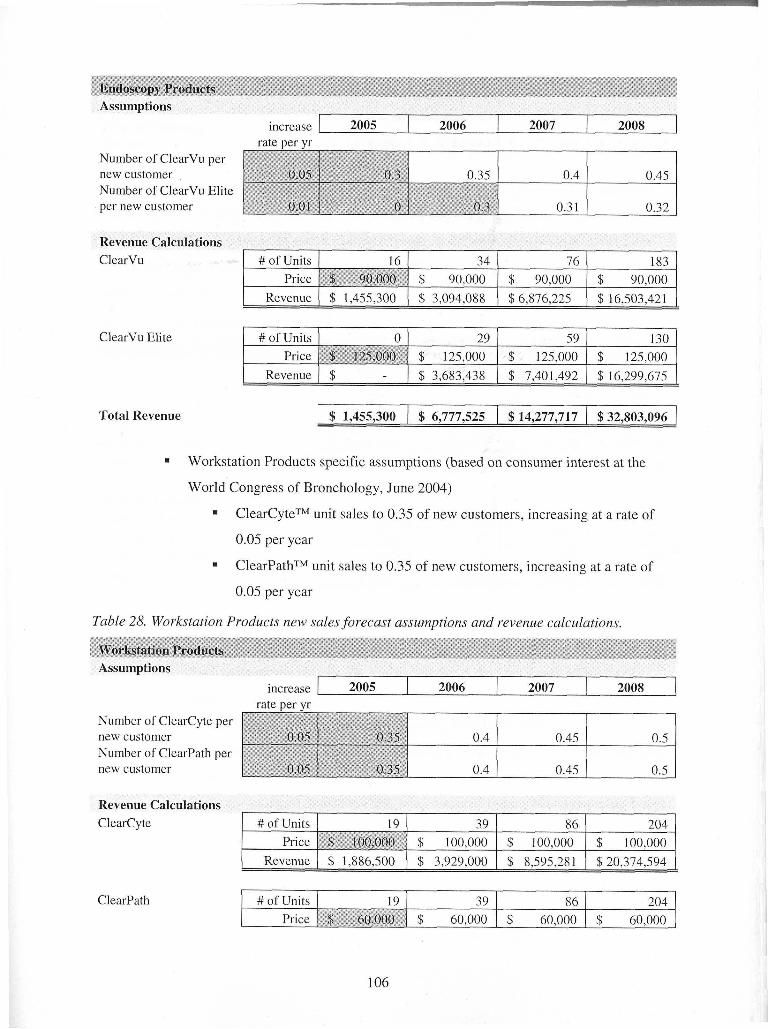
Endoscopy Products Assumptions
Number of ClearVu per new customer Number of ClearVu Elite per new customer
Revenue Calculations
increase 2005
ClearVu
rate ver yr 2006 2007
ClearVu Elite
2008
Total Revenue
1 Revenue ( $ - 1 $ 3,683,438 1 $ 7,401,492 1 $ 16,299,675 (
Workstation Products specific assumptions (based on consumer interest at the
World Congress of Bronchology, June 2004)
ClearCyteTM unit sales to 0.35 of new customers, increasing at a rate of
0.05 per year
ClearPathTM unit sales to 0.35 of new customers, increasing at a rate of
0.05 per year
Table 28. Workstation Products new sales forecast assumptions and revenue calculations.
\Yorkstation Products
Number of ClearCyte new customer Number of ClearPath new customer
Assumptions
Revenue Calculations I
increase
ClearCyte
ClearPath
rate Der vr 2005
1 Revenue ( $ 1,886,500 1 $ 3,929,000 1 $ 8,595,281 1 $20,374,594 1
2006
# of Units Price
2007
19 ( 39 $~~&oo$*I $ 100,000
# of Units Price
2008
86 $ 100,000
19 $p' =/0,000*\1
204 $ 100,000
39 $ 60,000
8 6 $ 60,000
204 $ 60,000
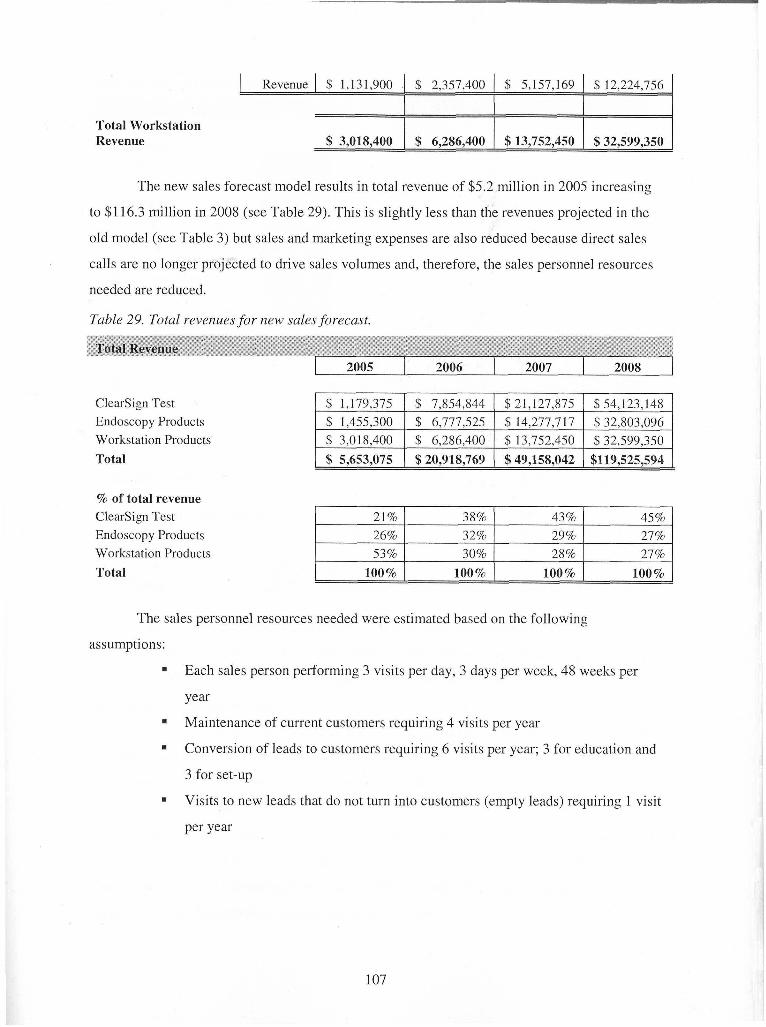
The new sales forecast model results in total revenue of $5.2 million in 2005 increasing
to $1 16.3 million in 2008 (see Table 29). This is slightly less than the revenues projected in the
old model (see Table 3) but sales and marketing expenses are also reduced because direct sales
calls are no longer projected to drive sales volumes and, therefore, the sales personnel resources
I Revenue 1 $ 1,131,900
Total Workstation Revenue $ 3,018,400
needed are reduced.
$ 2,357,400
$ 6,286,400
$ 5,157,169
$13,752,450
Table 29. Total revenues for new sales forecast.
$ 12,224,756
$32,599,350
Total Revenue
ClearSign Test Endoscopy Products Workstation Products
Total
% of total revenue ClearSign Test Endoscopy Products Workstation Products
assumptions:
rn
Total
Each sales person performing 3 visits per day, 3 days per week, 48 weeks per
year
Maintenance of current customers requiring 4 visits per year
Conversion of leads to customers requiring 6 visits per year; 3 for education and
3 for set-up
Visits to new leads that do not turn into customers (empty leads) requiring 1 visit
per year
100% 1 100% 1 100% ( 100% 1
The sales personnel resources needed were estimated based on the following
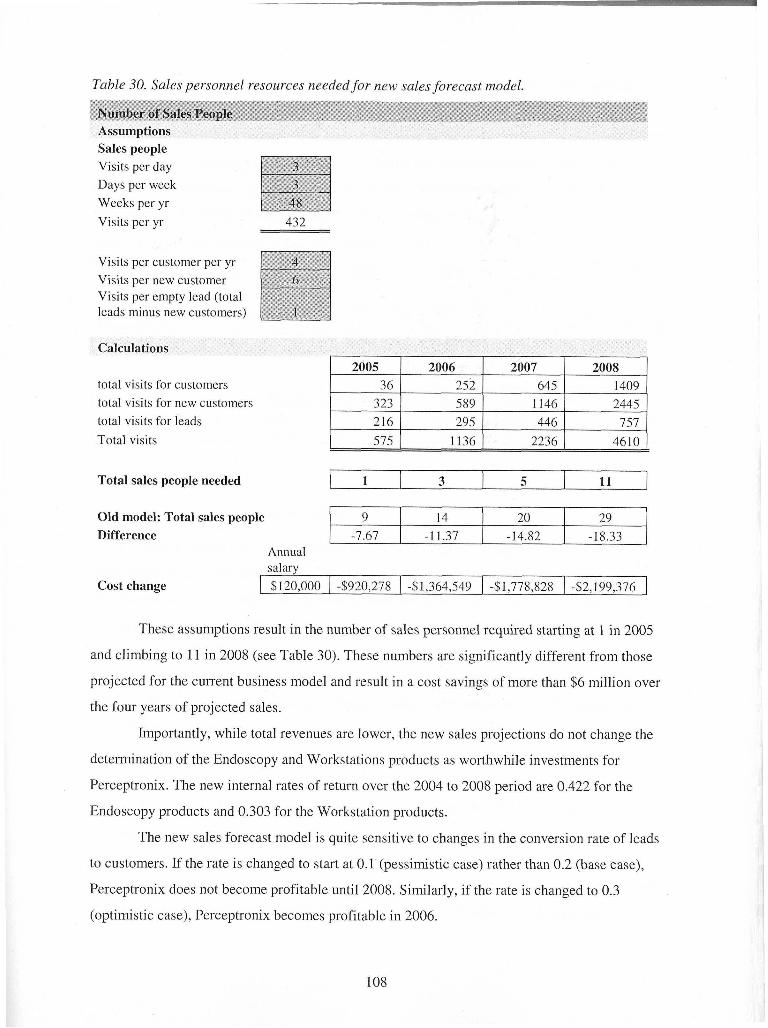
Table 30. Sales personnel resources needed for new sales forecast model.
Number of Sales People Assumptions Sales ~ e o ~ l e n
Visits per day Days per week Weeks per yr Visits per yr 432
Visits per customer per yr Visits per new customer Visits per empty lead (total leads minus new customers)
Calculations
total visits for customers total visits for new customers total visits for leads 216 1 295 1 446 1 757 1 Total visits 575 1 1136 1 2236 1 4610
Total sales people needed
Cost change 1 $120,000 1 4920,278 1 41,364,549 1 -$1,778,828 1 -52,199,376 1
Old model: Total sales people Difference
These assumptions result in the number of sales personnel required starting at 1 in 2005
1
and climbing to 11 in 2008 (see Table 30). These numbers are significantly different from those
Annual salarv
9 -7.67
projected for the current business model and result in a cost savings of more than $6 million over
3
the four years of projccted sales.
14 -1 1.37
Importantly, while total revenues are lower, the new sales projections do not change the
5
determination of the Endoscopy and Workstations products as worthwhile investments for
11
20 -14.82
Perceptronix. The new internal rates of return over the 2004 to 2008 period are 0.422 for the
29 -18.33
Endoscopy products and 0.303 for the Workstation products.
The new sales forecast model is quite sensitive to changes in the conversion rate of leads
to customers. If the rate is changed to start at 0.1 (pessimistic case) rather than 0.2 (base case),
Perceptronix does not become profitable until 2008. Similarly, if the rate is changed to 0.3
(optimistic case), Perceptronix becomes profitable in 2006.
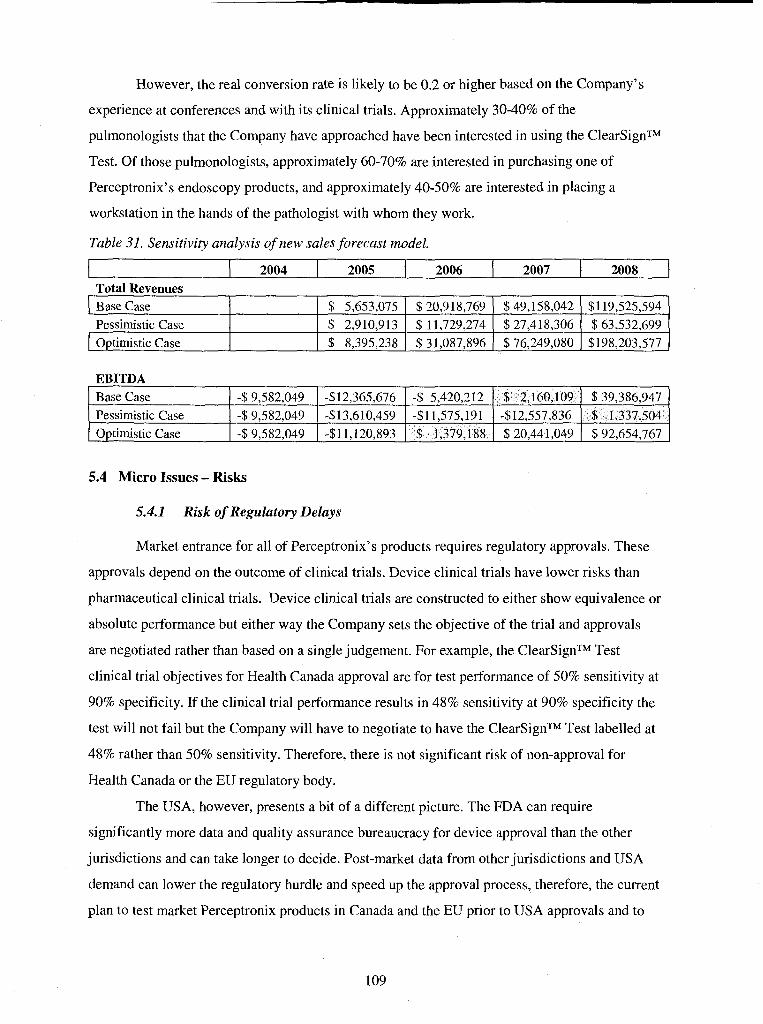
However, the real conversion rate is likely to be 0.2 or higher based on the Company's
experience at conferences and with its clinical trials. Approximately 30-40% of the
pulmonologists that the Company have approached have been interested in using the ClearSignTM
Test. Of those pulmonologists, approximately 60-70% are interested in purchasing one of
Perceptronix's endoscopy products, and approximately 40-50% are interested in placing a
workstation in the hands of the pathologist with whom they work.
Table 31. Sensitivity analysis of new sales forecast model.
2004 2005 2006 2007 2008 1 Total Revenues
5.4 Micro Issues - Risks
EBITDA
5.4.1 Risk of Regulatory Delays
$1 19,525,594
$ 63,532,699 $198,203,577
I ~ a s e Case Pessimistic Case Optimistic Case
Market entrance for all of Perceptronix's products requires regulatory approvals. These
approvals depend on the outcome of clinical trials. Device clinical trials have lower risks than
pharmaceutical clinical trials. Device clinical trials are constructed to either show equivalence or
absolute performance but either way the Company sets the objective of the trial and approvals
are negotiated rather than based on a single judgement. For example, the ClearSignTM Test
clinical trial objectives for Health Canada approval are for test performance of 50% sensitivity at
90% specificity. If the clinical trial performance results in 48% sensitivity at 90% specificity the
test will not fail but the Company will have to negotiate to have the ClearSignTM Test labelled at
48% rather than 50% sensitivity. Therefore, there is not significant risk of non-approval for
Health Canada or the EU regulatory body.
The USA, however, presents a bit of a different picture. The FDA can require
significantly more data and quality assurance bureaucracy for device approval than the other
jurisdictions and can take longer to decide. Post-market data from other jurisdictions and USA
demand can lower the regulatory hurdle and speed up the approval process, therefore, the current
plan to test market Perceptronix products in Canada and the EU prior to USA approvals and to
$39,386,947 $ 1,337,504 $ 92,654,767
Base Case Pessimistic Case Optimistic Case
$49,158,042 $ 27,418,306 $76,249,080
$ 5,653,075 $ 2,910,913 $ 8,395,238
-$9,582,049 -$9,582,049 -$9,582,049
$20,918,769 $ 11,729,274 $ 3 1,087,896
$ 2,160,109 -$12,557,836 $ 20,441,049
-$12,365,676 -$13,610,459 -$11,120,893
-$ 5,420,212 -$I 1,575,191 $ 1,379,188
sell Perceptronix products at international conferences attended by Americans are the right
measures to fast-track FDA approval. Plus, the use of USA sites in Health Canada and EU
clinical trials will help to lower the amount of additional data required by the FDA once USA
applications are made.
With regard to regulatory approvals, the biggest risk to Perceptronix is not failed
approvals, however. The biggest risk is delay. Delays in clinical trials will delay market entry for
Perceptronix which will impact the Company's ability to raise further capital. Investors are more
comfortable investing in companies that have products with regulatory approvals and revenues.
Plus, delays in meeting the milestones communicated to current and potential investors can
undermine confidence in the Company's abilities. Access to capital should be of primary
importance to the Company moving forward until the further $22-27 million it requires is raised.
Therefore, Perceptronix can not afford not to meet any of its milestones moving forward.
Perceptronix should mitigate the risk of regulatory delays by addressing its regulatory
and clinical trial strategy. Clinical trial sites should be monitored closely to ensure sample
recruitments are meeting expectations. Site agreements should have tight recruitment policies
and non-performance clauses. The Company has many sites that would like to work with it and it
should keep sites on stand-by to fill-in samples if accruals are not meeting projections.
Plus clinical and regulatory affairs should take central importance in the Company's
operations over the next 12 months. This department needs to be adequately funded and staffed
immediately. Its budgets should be the first to be re-worked in the next budgeting cycle.
5.4.2 Risks of Slow Market Acceptance
If the Company cannot generate the demand projected, profitability will not be possible
until 2008 or later and more capital will be required. The Company's ability to raise this money
will depend on its ability to meet shareholders' and potential investors' expectations. It is of
central importance for the Company to deliver according to its business plan and milestones over
the next five years in order to raise more capital.
5.4.3 Risks of Fast Market Acceptance
If excess demand is generated, Perceptronix will also have a problem. This problem will
also need more capital to handle but raising it should be easier. If greater demand can be shown
to shareholders and potential investors, Perceptronix should be able to raise the capital required
for expanded operations. Plus, greater demand will support greater revenues so that Perceptronix
can fund much of its own expansion.
Perceptronix should prepare carefully for this risk. Any physical plant, processes, and
systems that are built should be scalable. Contingencies should be prepared for sustainable
growth. An OEM manufacturing partner will be important part of mitigating this risk. Plus, if
demand is great, Perceptronix may be able to negotiate a distribution or sales partnership as well
once demand can be demonstrated.
5.4.4 Competitive Risks
Market entry will bring competitive risks for Perceptronix. Risks will be presented from
current market rivals and new entrants for each of the Company's product lines.
The ClearSignTM Test is not expected to have any competitors in its first years on the
market but the Company will need to prepare for the entry of rivals in the near-future drawn by
the large market opportunity and profits. MI and Menssana do not appear to be realistic entrants
at this moment but there may be others that the Company does not know about. Perceptronix
should be vigilant in its competitive surveillance to prepare for new entrants.
The key to sustaining competitive advantage for Perceptronix with the threat of new
entrants will be its positioning with the thought leaders and gatekeepers in the industry.
Perceptronix should build and maintain strong relationships with a large network of
pulmonologists throughout Canada, the EU, and the USA. These individuals will help
Perceptronix to maintain its first mover advantage and become a competitive hurdle that others
must overcome to gain entry. Keeping the ClearSignTM Test as an in-house service lab test will
be important for maintaining strong relationships as pulmonologists will be connected to
Perceptronix as a company as well as the ClearSignTM Test as a product.
Perceptronix's Endoscopy products will have the largest competitive risks. The biggest
threat will be from Xillix, which sees Vancouver and the Company's relationship with the BCCA
as its own province. Perceptronix will need to ensure that it is above reproach with respect to IP
so that the risk of patent infringement litigation is minimized.
To mitigate competitive risks for the Endoscopy products, Perceptronix should again
create and maintain strong relationships with pulmonologists. This direct relationship with the
end consumer and the Company's low cost base will afford Perceptronix a competitive advantage
over rivals like Xillix who typically use distributors and cannot afford to cut their margins
indefinitely. Perceptronix will not be able to afford to compete against the deep pockets of
Pentax and Olympus based on cost but Perceptronix may be able to grow its own market rather
than competing it away from these big companies. Since Perceptronix intends to create its own
market share by growing the market rather than taking it from others, the Company may avoid
rivalry from these big companies for some time.
For the Workstation products, Perceptronix does not intend to enter markets that will
attract the attention of workstation competitors. The Company is targeting different consumers-
clinicians rather than researchers - and a different market segment - lung cancer rather than
cervical cancer - than other workstation companies. Plus, workstation companies typically
promote a product rather than a clinical solution. Perceptronix's focus on promoting workstations
to solve the lung cancer problem and connection to the clinicians on the front line will be the
Company's advantage in the marketplace.
There is some potential for incumbents or new entrants to copy Perceptronix's market
strategy and build product portfolios that address the whole lung cancer diagnostics chain as
well. However, it is unlikely that a single company will be able to do this. Incumbents do not
have the capability to do this in-house and there are few companies that could be acquired to
round out their own portfolio.
5.4.4.1 New Technologies
Perceptronix's strong relationship with pulmonologists secures another competitive
advantage for the Company. Perceptronix's relationship and connection to the clinicians and
researchers places the Company is a good position to survey the market for new technology, to
acquire it, and to take it to market. This will allow the Company's technology portfolio to evolve
rather than be taken-over by the next disruptive discovery.
5.5 Chapter Conclusion
This chapter addresses recommendations to the major issues and risk facing Perceptronix
as it moves forward towards market entry. Access to the capital required to get the Company's
products to market and the right marketing plan to stimulate revenues are key to the
Perceptronix's future success.
The recommendations of this analysis are that the fundraising plan should be altered.
While Perceptronix appears to be targeting the right kind of investors, the timing and amount of
the Company's next funding should be changed. The Company is likely to have greater
fundraising success if a $10-12 million amount is targeted for near-term fundraising, followed by
a subsequent $15-17 million round once the Company has product approvals and a track-record
of revenues.

Successful fundraising is likely to be contingent upon the Company's ability to address
the concerns of potential investors. Analysis suggests that Perceptronix7s business plan is sound
but the Company has to do a good job of communicating this to potential investors.
Similarly, analysis indicates that the fundamental premises underlying the Company's
marketing strategy are sound but Perceptronix needs to revamp some of its tactical plans. A new
sales forecast and resources model was proposed to address the gap between the strategy and the
tactics.
Perceptronix will face many challenges in the road ahead including keeping regulatory
timelines on track, meeting market demands, and defending competitive attack. It is important for
the Company to manage these risks proactively and plan for contingencies in order to succeed in
the marketplace.
In summary, business success will hinge on the ability of Perceptronix to raise capital,
protect its innovations, partner its operations, and deliver its portfolio of products to the market.
6 APPENDICES
6.1 Appendix A. Regulatory Hurdles
The manufacture and sale of medical devices are subject to extensive governmental
regulation in Canada, the European Union, the United States, and in other jurisdictions.
Regulations vary widely from country to country as does the time required to obtain approval.
Regulatory oversight includes pre-market review and approval prior to commercial
distribution and post-market surveillance to ensure that products on the market remain safe and
effective. In addition, product design and manufacturing requirements are subject to regulatory
review and approval prior to commercial distribution. Regulatory requirements apply to pre-
clinical and clinical testing, manufacture, labelling, distribution, sales, marketing, advertising and
promotion of medical devices in each jurisdiction. Non-compliance with applicable
requirements can result in refusal of the government to grant pre-market approval for devices,
suspension or withdrawal of clearances or approvals, total or partial suspension of production,
distribution, sales and marketing, fines, injunctions, civil penalties, recall or seizure of products,
and criminal prosecution of a company and its officers and employees.
Each jurisdiction assigns medical devices to a risk-based classification system where
Class I represents the lowest risk and Class 111 or IV (depending on the jurisdiction) represents
the highest risk. The higher the risk classification of a device, the more regulatory controls are
applied to the commercial sale of that device. In almost all countries, the Company's
ClearSignTM Test and endoscopy products will be classified as Class III in vitro diagnostic
medical devices. The ClearCyteTM Workstation will be a Class 11 medical device. The Pathology
Workstation will be either Class 11 or Class 111 depending on whether the Company intends to
claim that this device is specific to lung cancer or can be used generally for any cancer. Class III
medical devices usually require clinical testing to demonstrate that they are safe and effective
and they must receive regulatory approval prior to marketing and distribution. Marketing
approval for Class I1 medical devices is generally based on performance studies which evaluate
reproducibility and repeatability - these studies are usually substantially shorter, require fewer
samples and are less expensive than the clinical studies required for Class III devices.
Perceptronix intends to introduce its products initially in Canada, followed by select
jurisdictions in the European Union and then the United States. Once the Company's products
are established in these key markets, the Company plans to pursue regulatory approvals in other
"rest of world" countries.
Once the Company's products receive marketing approval in any jurisdiction, they will
be subject to pervasive and continuing regulation by the regulatory authorities, including record-
keeping requirements and reporting of adverse experience with the use of the device. The
Company will continue to be inspected on a routine basis for compliance with regulations with
respect to manufacturing, testing, distribution, storage and control activities. The Company must
establish and maintain a system for tracking its products through the chain of distribution and
conduct post-market surveillance, and must provide periodic reports containing safety and
effectiveness information.
6.1.1 Canadian Regulatory Situation
From a regulatory standpoint, the Company believes that Canada represents a suitable
first market for its products. The Canadian medical device regulatory system has received high
praise from domestic and international manufacturers for its simplicity, responsiveness and
willingness of staff to discuss and explain requirements. Canada's regulatory system is also well-
regarded by both US and European Union regulatory agencies.
In Canada, medical devices are regulated nationally by the Bureau of Radiation and
Medical Devices in the Health Canada Protection Branch (HPB) through the Medical Device
Regulation under the authority of the Food and Drugs Act, which forms a part of the Criminal
Code of Canada. The Act controls the sale of medical devices.
According to the Medical Device Regulations (published in Canada Gazette Part 11, May
27, 1998), medical devices in Canada are classified according to a Class I to IV risk-based where
Class I represents the lowest risk and Class IY represent the highest risk.
Class I Devices: General controls only. These apply to all medical devices and
include Device Listing and Establishment Registration, Quality System
Regulation and Good Manufacturing Practices
Class 11 Devices: Special controls which may include performance standards and
post-market surveillance
Class III Devices: Special controls requiring clinical trials to establish safety and
effectiveness
Class IV Devices: Special controls requiring additional information regarding
safety
Each class of device is further divided into invasive and non-invasive categories. All of
the Company's products, including its endoscopy products, fall into the non-invasive categories.
Although bronchoscopes themselves are categorized as invasive, the Company's endoscopy
products are considered bronchoscope accessories and are therefore classified as non-invasive.
To apply for a medical license in Canada, a manufacturer must be certified to the
Canadian Medical Device Conformity Assessment System (CMDCAS) /IS0 13485 by an
accredited third party registrar. Acquiring CMDCAS certification can be very helpful for
demonstrating compliance with USA Food and Drug Administration's (FDA) Quality System
Regulation (QSR) as QSR is based on IS0 9001 and IS0 13485.
Perceptronix is in the process of developing its licensing application to Health Canada
for the ClearSignTM test as a Class 111 medical device. Perceptronix is conducting a Health
Canada authorized clinical trial which the Company projects will be completed late 2004. The
Company expects to be audited for compliance to IS0 13485 by the end of 2004 and will seek
CMDCAS compliance certification at that time. The Company believes that it is on track to
receive regulatory approvals and a device license for this test early in 2005.
Perceptronix applied to Health Canada in May 2004 for a Class III Investigational
Device Exemption (JDE) for its ClearVu EliteTM endoscopy system and received conditional
approval in June 2004. Receipt of this IDE will allow us to proceed with Phase I and Phase II of
an international, multi-centre clinical trial to collect spectral and image data. The Company
estimates that the Phase I1 clinical trial will be completed in mid- 2005 and that the Phase I11
clinical trial will commence later that year.
Perceptronix plans to apply for Health Canada permission to proceed with clinical trials
for each of its ClearCyteTM and ClearPathTM Workstation products during the third quarter of
2004. The Company expects that the ClearCyteTM Workstation will be classified as a Class II
medical device. Although the Company expects that the ClearPathTM Workstation will also be
classified as a Class 11 medical device, the Company plans to discuss with Health Canada
whether a diagnostic claim for any cancer as opposed to a lung cancer specific claim could
trigger a Class I11 classification.
6.1.2 European Union Regulatory Situation
In-vitro medical devices, including Perceptronix' products, must comply with the
European Union's In-Vitro Diagnostic Medical Devices Directive. This Directive was published
in the Official Journal of European Communities in December 1998 and, following a transition
period which began from the date of publication and ended December 2003, now applies to all
medical devices placed on the market in the EU. Our products must comply with the
requirements of the Directive and with member state local language requirements.
The In-Vitro Diagnostic Medical Devices (ND) Directive is a product-associated
directive which regulates the safety and quality of the product rather than the effectiveness of the
diagnostic procedure. Product conformity to the Directive is assessed by a Notified Body (an
organization designated by a member state government to independently assess whether a
product meets the requirements of the Directive). The conformity assessment includes review of
the technical documentation demonstrating compliance with the Essential Requirements
specified in the Directive and auditing of the quality system to ENIISO 13485. Products that are
assessed as conforming to the Directive are given a CE-mark and can then be sold anywhere in
the EU.
As each of the Company's products receives approvals in Canada, Perceptronix plans to
engage Notified Bodies in the EU to provide conformity assessments. The Company anticipates
that these assessments will lead to the receipt of CE-marks, particularly since its product
development efforts have been designed to support CE-mark approval by incorporating European
clinical trial sites, by conducting - during the preparation for IS0 13845 - risk analysis and
management of the Company's devices consistent with the required EU IS0 14 721 standard, and
by preparing each of its products "technical files" in accordance with EU approval standards.
6.1.3 United States Regulatory Situation
Medical devices in the United States are regulated by the FDA under the Food, Drug,
and Cosmetic Act (the "FD&C Act"). Similar to Canada and the EU, the level of regulatory
control is set by the risk classification of the device.
Class I Devices: General controls only. There apply to all medical devices and
regulate Device Listing and Establishment registration, Quality System
Requirements (QSR) and Good Manufacturing Practices (GMP).
Class 11 Devices: Special Control - Pre-market Notification (510k). The FDA
requires the medical device to be shown as substantially equivalent to a predicate
device (legally marketed device) in terms of safety and effectiveness.
Class I11 Devices: Special Control - Pre-market Approval (PMA). This is
considered the most stringent category of control used by the FDA. PMA
approval is based on determination by the FDA that the PMA submission
contains sufficient valid scientific evidence, including well-controlled clinical
investigations, to assure that the device is safe and effective for its intended
use(s).

FDA reviews PMA submissions in a 180-day timeline. If there are unaddressed
scientific issues, the review scientists can ask for additional information and put the submission
temporarily on hold. Approval of a PMA requires review of the manufacturing processes, an
inspection of the manufacturing facility, a bioresearch monitoring audit of clinical data sites, as
well as comprehensive review of the pre-market data.
The ClearSignTM Test is a Class I11 medical device requiring a PMA application. Our
PMA application strategy is to submit the international data being collected in the Company's
current Health Canada clinical trial. Perceptronix intends to apply for the review of this data
under 21CFR 812 FDA regulations which permit the acceptance of foreign clinical studies in
support of an application for marketing approval.
Perceptronix products which it manufactures or distributes pursuant to an approved PMA
application and supplements (or to 510(k) clearances) will be subject to pervasive and continuing
regulation by the FDA, including record-keeping requirements and reporting of adverse
experience with the use of the device. The Company will continue to be inspected on a routine
basis by the FDA for compliance with regulations with respect to manufacturing, testing,
distribution, storage and control activities. Perceptronix must establish and maintain a system for
tracking its products through the chain of distribution and conduct post-market surveillance, and
must provide periodic reports containing safety and effectiveness information.
Device manufacturers are required to register their establishments and list their devices
with the FDA. The FD&C Act requires that medical devices be manufactured in accordance
with the FDA's Quality System Regulation (QSR) based on IS0 9001 and IS0 13485. Product
labelling and promotional activities are also subject to scrutiny by the FDA. Products may only
be promoted by us and any of the Company's distributors for their approved indications.
6.2 Appendix B. What is the Goal of Screening for Cancer? A Discussion on Cancer
Detection Test Performance and Market Utility34
The earlier cancer is detected, the better the odds of a successful outcome. Thus, the
public and the medical community are receptive to the notion of screening for cancer. However,
screening isn't necessarily a good thing. It is possible to set the wrong goal for screening and do
greater harm than good. This is because understanding the underlying mathematical basis of
screening and identifying the goal of screening is not necessarily intuitive.
6.2.1 What is Screening?
Screening is much more than a single test. It is the complete process from screening test,
to diagnostic work-up, to therapy, and follow-up.
6.2.2 What is a Screening Test?
A screening test is a "discovery" detection test applied to an asymptomatic, healthy
population where the vast majority do not have the disease for which they are being tested
(disease prevalence < 1%). Some examples of screening tests are mammography for breast
cancer and Pap tests for cervical cancer. These approaches are typically "targeted" in the sense
that they are applied to only subsections of the general population like mammography for women
over the age of 40.
This can be contrasted with a diagnostic test which is a "differential" detection test
applied to symptomatic patients where the disease prevalence is high (1 % to 50%). Most
diagnostic procedures are performed in response to symptoms and a patient's complaints.
Even when we try to define high-risk populations who might get cancer (for example
long term smokers for lung cancer), seldom to the incidence rates among such targeted
populations approach 1%. Men who smoke are estimated to be 22 times more likely to develop
lung cancer than a non-smoker, while women who smoke are estimated to be 12 times more
likely.35 One in 10 smokers will develop lung cancer.36
Population-based Pap screening was pioneered at the BCCA in the 1950's and led to a
70-80% reduction in age standardized mortality due to cervical cancer in BC. Key lessons from
this example are
34 Transcribed from seminar by Dr. David Garner given to the ASC in April 2001.
35 htt~://www.healthatoz.co~dhealthatoz/Atoz/dc/caz/canc/lunc/lun~risk.html . April 15, 2004.
36 htt~://www.mydr.com.au/default.asp?article=3498 . April 15, 2004.

that a decrease in disease specific mortality is the most reliable demonstration of
screening effectiveness
that it may take a very long time to demonstrate screening effectiveness, often 15
years or more, with a very large fraction of the population being screened
Of all the cancer screening tests presently in use, only the Pap test has demonstrated
effectiveness based on a decrease in disease specific mortality so far.
6.2.3 What is the Goal?
Meeting the goal of screening for cancer - How do we know when we are saving lives
and reducing pain & suffering? Intuition tells us that 100% accuracy should be the goal of a
screening test. However, intuition in this instance is wrong.
Setting the wrong goal is not a benign error, it can harm people. 100% accuracy is a
dangerous goal. What is often reasonable when applied to general diagnosis may become
unreasonable when applied to screening.
Is 100% accuracy theoretically possible? No. The present methods of diagnosing cancer
are not and never will be 100% accurate. Accuracy is the number of tests done right divided by
the total number done.
The strategy of perfectly implementing a theoretically perfect test is fundamentally
different than the strategy of optimizing the implementation of an imperfect test.
Consider a fraudulent screening test for colorectal cancer. The disease incidence in the
testing population (BC) is 50 per 100,000 per year. If 100,000 people are tested and 50 of them
are randomly called positive the errors are:
= 50 called positive are wrong (false positives)
50 actually positives are missed (false negatives)
In this instance 100 cases were called wrong and 99,900 were correct so the accuracy is
99.9% but the test is perfectly useless.
To improve this test we could call all 100,000 negative. This would yield 0 false
positives, 50 false negatives, and an accuracy of 99.95% - an improved accuracy.
This is an excellent and still perfectly useless because it tells us nothing about who has
cancer. Thus, using accuracy as the goal has led to an improved test that is perfectly useless. This
is an example of how setting the wrong screening goal can be dangerous.
6.2.4 Test Performance: Sensitivity, Specificity, and ROC Curves
Sensitivity is the ability of the test to detect the disease in a diseased population.
Specificity is the ability of the test to rule out disease in a disease-free population. Often these
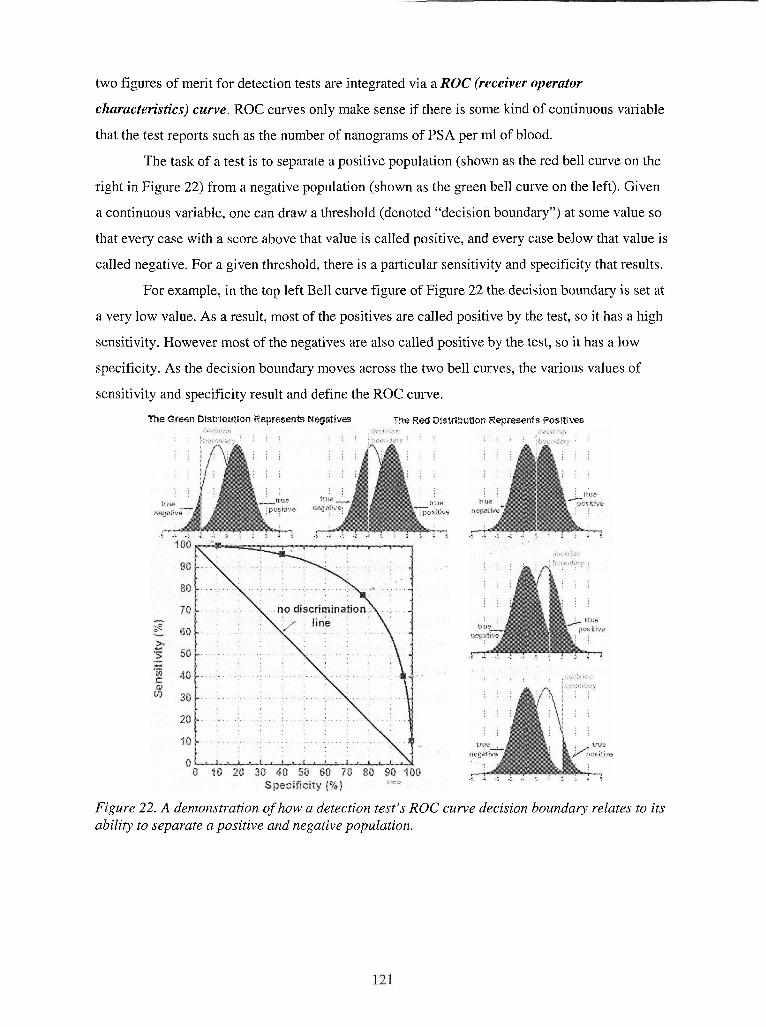
two figures of merit for detection tests are integrated via a ROC (receiver operator
characteristics) curve. ROC curves only make sense if there is some kind of continuous variable
that the test reports such as the number of nanograms of PSA per ml of blood.
The task of a test is to separate a positive population (shown as the red bell curve on the
right in Figure 22) from a negative population (shown as the green bell curve on the left). Given
a continuous variable, one can draw a threshold (denoted "decision boundary") at some value so
that every case with a score above that value is called positive, and every case below that value is
called negative. For a given threshold, there is a particular sensitivity and specificity that results.
For example, in the top left Bell curve figure of Figure 22 the decision boundary is set at
a very low value. As a result, most of the positives are called positive by the test, so it has a high
sensitivity. However most of the negatives are also called positive by the test, so it has a low
specificity. As the decision boundary moves across the two bell curves, the various values of
sensitivity and specificity result and define the ROC curve.
The Green aistribution Represents Negattves The Red Dlstribution Represents Poslt~ms
Figure 22. A demonstration of how a detection test's ROC curve decision boundary relates to its ability to separate a positive and negative population.
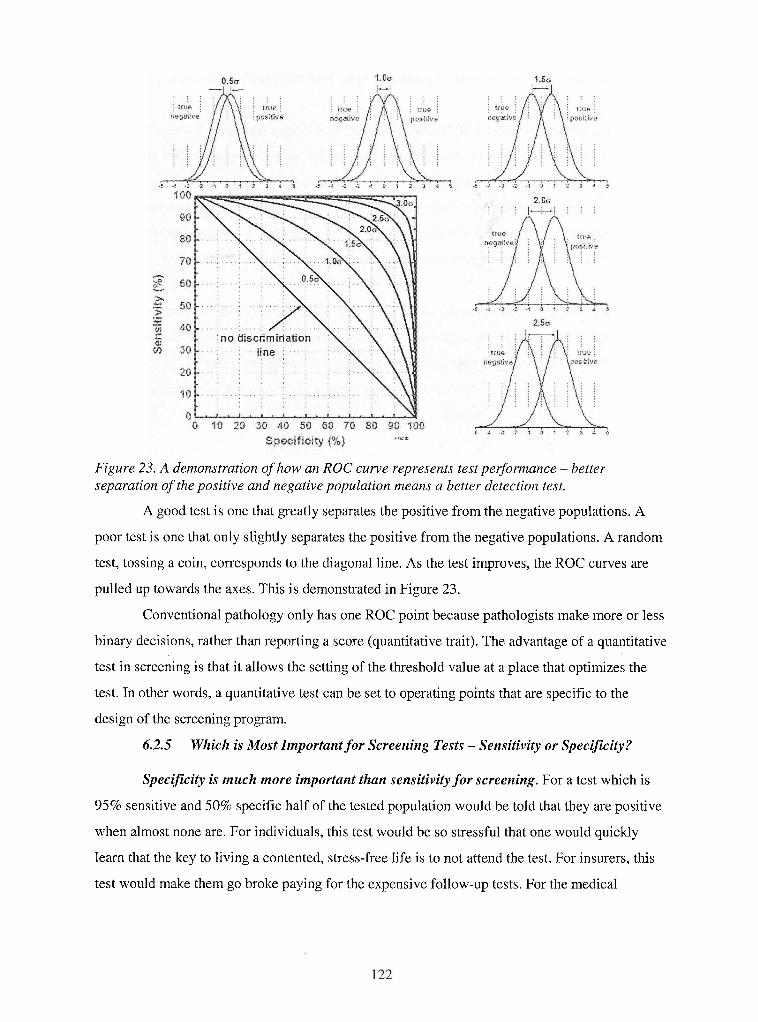
Figure 23. A demonstration of how an ROC curve represents test per$ormance - better separation of the positive and negative population means a better detection test.
A good test is one that greatly separates the positive from the negative populations. A
poor test is one that only slightly separates the positive from the negative populations. A random
test, tossing a coin, corresponds to the diagonal line. As the test improves, the ROC curves are
pulled up towards the axes. This is demonstrated in Figure 23.
Conventional pathology only has one ROC point because pathologists make more or less
binary decisions, rather than reporting a score (quantitative trait). The advantage of a quantitative
test in screening is that it allows the setting of the threshold value at a place that optimizes the
test. In other words, a quantitative test can be set to operating points that are specific to the
design of the screening program.
6.2.5 Which is Most Important for Screening Tests - Sensitivity or Specificity?
Specificity is much more important than sensitivity for screening. For a test which is
95% sensitive and 50% specific half of the tested population would be told that they are positive
when almost none are. For individuals, this test would be so stressful that one would quickly
learn that the key to living a contented, stress-free life is to not attend the test. For insurers, this
test would make them go broke paying for the expensive follow-up tests. For the medical
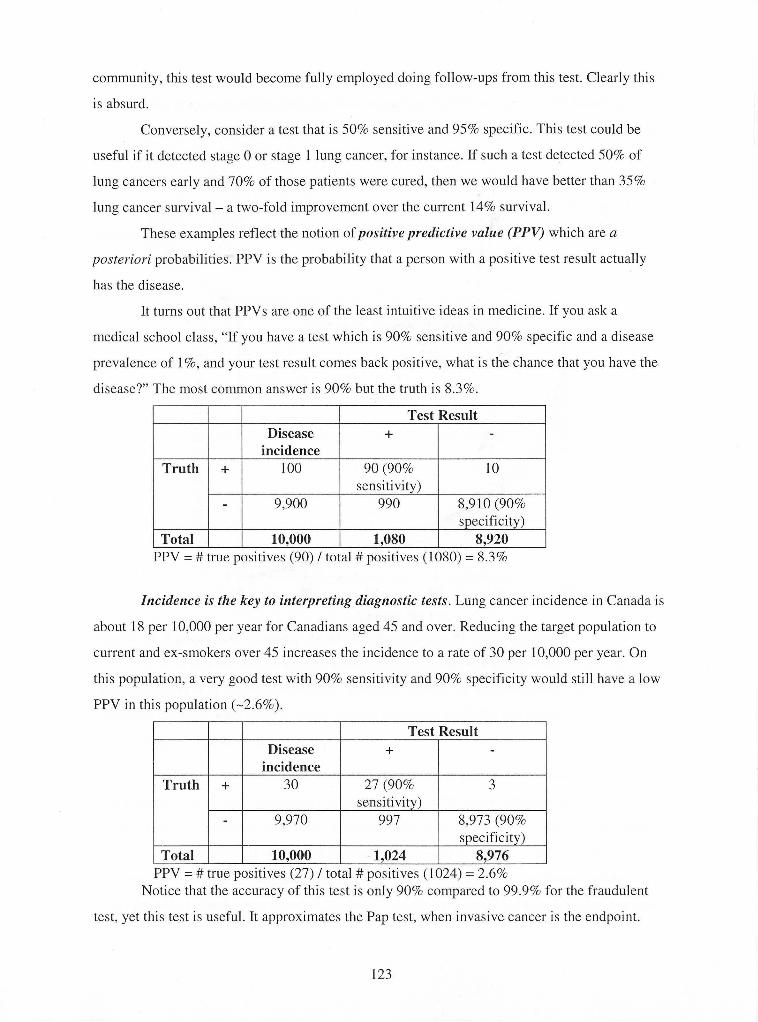
community, this test would become fully employed doing follow-ups from this test. Clearly this
is absurd.
Conversely, consider a test that is 50% sensitive and 95% specific. This test could be
useful if it detected stage 0 or stage 1 lung cancer, for instance. If such a test detected 50% of
lung cancers early and 70% of those patients were cured, then we would have better than 35%
lung cancer survival - a two-fold improvement over the current 14% survival.
These examples reflect the notion of positive predictive value (PPV, which are a
posteriori probabilities. PPV is the probability that a person with a positive test result actually
has the disease.
It turns out that PPVs are one of the least intuitive ideas in medicine. If you ask a
medical school class, "If you have a test which is 90% sensitive and 90% specific and a disease
prevalence of 1 %, and your test result comes back positive, what is the chance that you have the
disease?" The most common answer is 90% but the truth is 8.3%.
1 I I I Test Result I
Truth
9,900
Incidence is the key to interpreting diagnostic tests. Lung cancer incidence in Canada is
+
I I I I - r - - - - - - -~ /
about 18 per 10,000 per year for Canadians aged 45 and over. Reducing the target population to
sensitivity) 990
current and ex-smokers over 45 increases the incidence to a rate of 30 per 10,000 per year. On
Disease incidence
100
8,910 (90%
Total I
this population, a very good test with 90% sensitivity and 90% specificity would still have a low
PPV = # true positives (90) I total # positives (1 080) = - - 10,000 1,080
PPV in this population (-2.6%).
+
90 (90%
8,920
PPV = # true positives (27) I total # positives (1 024) = 2.6% Notice that the accuracy of this test is only 90% compared to 99.9% for the fraudulent
10
test, yet this test is useful. It approximates the Pap test, when invasive cancer is the endpoint.
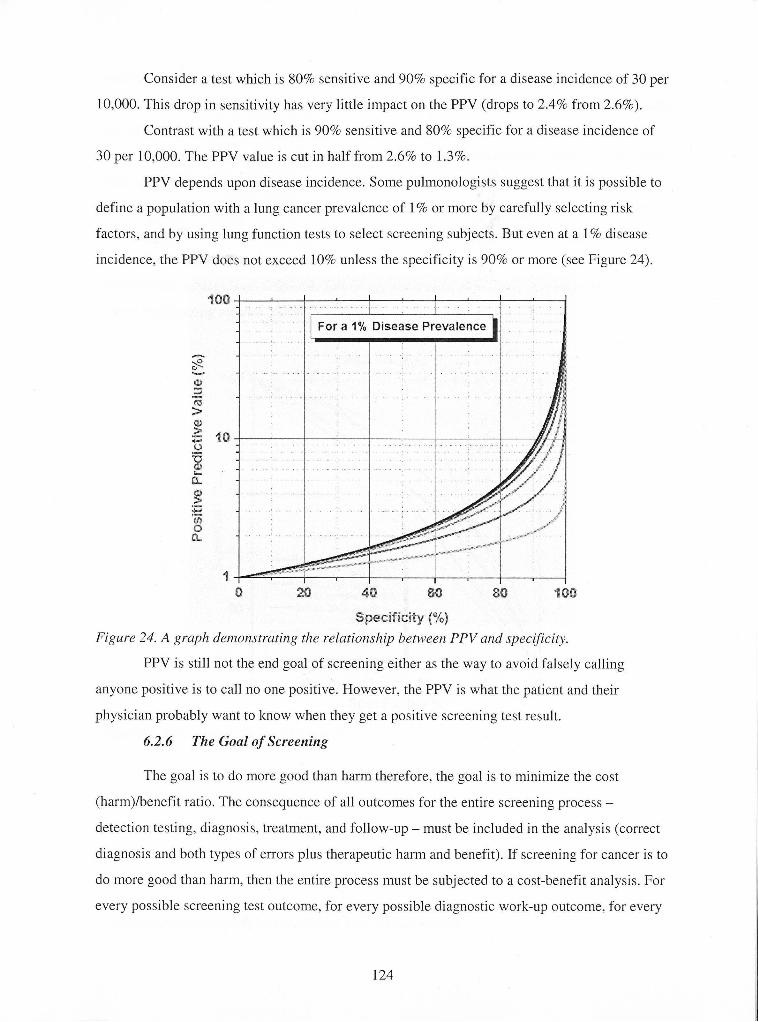
Consider a test which is 80% sensitive and 90% specific for a disease incidence of 30 per
10,000. This drop in sensitivity has very little impact on the PPV (drops to 2.4% from 2.6%).
Contrast with a test which is 90% sensitive and 80% specific for a disease incidence of
30 per 10,000. The PPV value is cut in half from 2.6% to 1.3%.
PPV depends upon disease incidence. Some pulmonologists suggest that it is possible to
define a population with a lung cancer prevalence of 1 % or more by carefully selecting risk
factors, and by using lung function tests to select screening subjects. But even at a I % disease
incidence, the PPV does not exceed 10% unless the specificity is 90% or more (see Figure 24).
I I - . . .. .. ..
- . .. For a 1% Disease Prevalence 1 I
Figure 24. A graph demonstrating the relationslzip between PPV and specificity.
PPV is still not the end goal of screening either as the way to avoid falsely calling
anyone positive is to call no one positive. However, the PPV is what the patient and their
physician probably want to know when they get a positive screening test result.
6.2.6 Tlze Goal of Screening
The goal is to do more good than harm therefore, the goal is to minimize the cost
(harm)/benefit ratio. The consequence of all outcomes for the entire screening process -
detection testing, diagnosis, treatment, and follow-up - must be included in the analysis (correct
diagnosis and both types of errors plus therapeutic harm and benefit). If screening for cancer is to
do more good than harm, then the entire process must be subjected to a cost-benefit analysis. For
every possible screening test outcome, for every possible diagnostic work-up outcome, for every
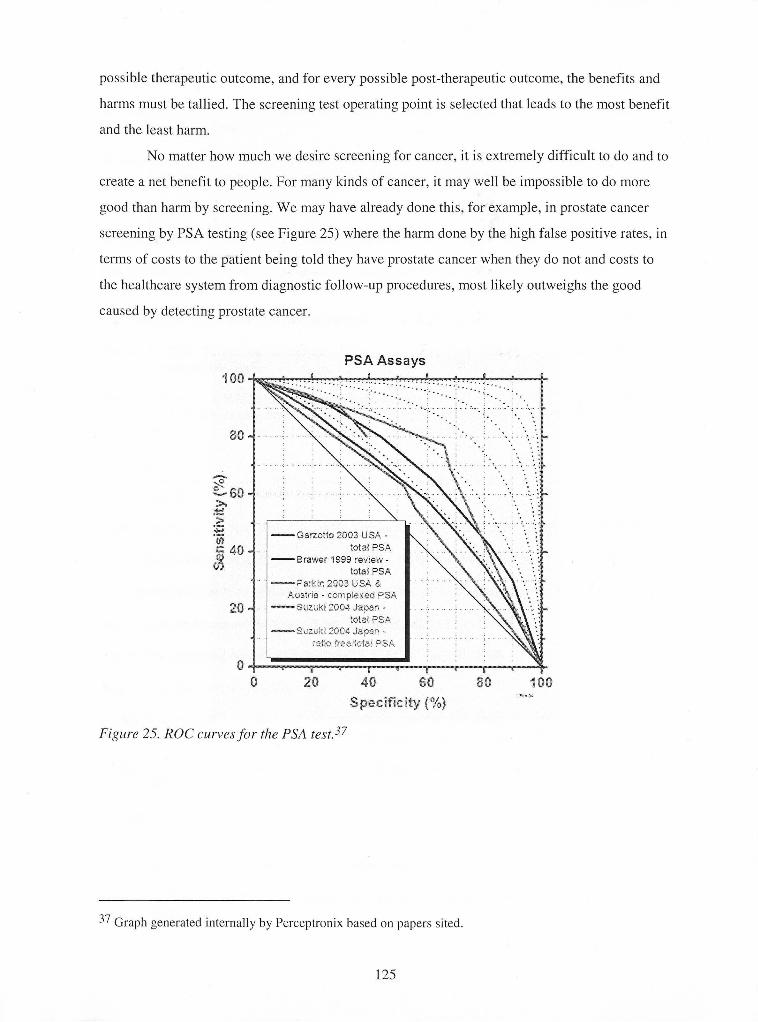
possible therapeutic outcome, and for every possible post-therapeutic outcome, the benefits and
harms must be tallied. The screening test operating point is selected that leads to the most benefit
and the least harm.
No matter how much we desire screening for cancer, it is extremely difficult to do and to
create a net benefit to people. For many kinds of cancer, it may well be impossible to do more
good than harm by screening. We may have already done this, for example, in prostate cancer
screening by PSA testing (see Figure 25) where the harm done by the high false positive rates, in
terms of costs to the patient being told they have prostate cancer when they do not and costs to
the healthcare system from diagnostic follow-up procedures, most likely outweighs the good
caused by detecting prostate cancer.
PSA Assays
-6arzotio 2003 USA - total PSA - Brawer 1999 review - total PSA - Parkn 2903 USA &
Austrla - ccrnple,eci PSA - Scrzuki 7004 Jana- - :otal FSA
rats Fee:tcta, WSP,
Figure 25. ROC curves for the PSA test.37
37 Graph generated internally by Perceptronix based on papers sited.
7 BIBLIOGRAPHY
Blazenko, G. 2003. Financial Management Course Notes. Executive MBA Program. Simon Fraser University.
Benoit A.G. et al. 1984. Results of prior cytologic screening in patients with a diagnosis of Stage I carcinoma of the cervix. Am J Obstet Gynecol 148 (5): 690-4.
Brawer, M. 1999. Complexed PSA: The newest advance in PSA testing. Urology. 54(1): 2-3.
Bukszar, E. 2004. Strategy Course Notes. Executive MBA Program. Simon Fraser University.
Cox G. and J. Miller. 2004. Examination of the association of galactose oxidase Schiff's reactivity in sputum with lung cancer. American Thoracic Society. Presentation. April.
FierceBiotech. 2004. IPO: Alnylam goes public after slashing asking price in half. May 28 issue.
Garner, D. 2001. Screening for cancer -What is the goal? American Society of Cytopathology. Presentation. April.
Garzotto, M. et al. 2003. Predictive modeling for the presence of prostate carcinoma using clinical, laboratory, and ultrasound parameters in patients with prostate specific antigen levels < or = 10 ng/mL. Cancer. 98(7): 1417-1422.
Horninger W. et al. 2002. Complexed prostate-specific antigen for early detection of prostate cancer in men with serum prostate-specific antigen levels of 2 to 4 nanograms per millilitre. Urology 60 (4 Suppl 1): 31-5.
http://www.bccancer.bc.cdHPVCancerManagementGuidelines/lung/start.htm. July 20, 2004.
http://www.bccancer.bc.cdPPVScreening/Cervical/2OO3AnnualReport.htm. July 20, 2004.
http://www.healthatoz.com/healthatoz/Atoz/dc/caz/canc/lunc/lungrisk.htd . April 15,2004.
http://www.mydr.com.au/default.asp?article=3498 . April 15, 2004.
http://www.qimaging.com/news/press/aug22-02htd . July 20, 2004.
http://www.who.int/en/. July 20,2004.
Nanda K. et al. 2000. Accuracy of the Papanicolaou test in screening for and follow-up of cervical cytologic abnormalities: a systematic review. Ann Intern Med 132 (10): 810-9.
Parkin, J. 2002. Laparoscopic lymph node sampling in locally advanced prostate cancer. BJU Int. 89(1): 14-17.
Phillips, M. et al. 2003. Detection of lung cancer with volatile markers in the breath. Chest 123: 21 15-2123.
Porter, M. 1979. How competitive forces shape strategy. Harvard Business Review. MarchIApril.
Porter, M. 1985. Competitive advantage: Creating and sustaining superior performance. Free Press.

Quest Diagnostics Inc. 2002. 10-K.
Soost H.J. et al. 1991. The validation of cervical cytology. Sensitivity, specificity and predictive values. Acta Cytol35 (1): 8-14. ;
Statistics Canada. 2003. Information re: frequency of PSA testing from Cycle 1.1. Canadian Community Health Survey 2000-2001.
Suzuki, H. et al. 2004. Clinical usefulness of serum antip53 antibodies for prostate cancer detection: a comparative study with prostate specific antigen parameters. J Urol. 171(1): 182-186.
Theta Reports. 2003. Cancer Diagnostics: Global markets and developments.