Embed Size (px)
Citation preview

Marsupial Genetics and Genomics

Janine E. Deakin · Paul D. Waters ·Jennifer A. Marshall GravesEditors
Marsupial Geneticsand Genomics
123
EditorsJanine E. DeakinARC Centre of Excellence for
Kangaroo GenomicsEvolution, Ecology and GeneticsThe Australian National UniversityResearch School of BiologyBuilding 460200 Canberra [email protected]
Jennifer A. Marshall GravesARC Centre of Excellence for
Kangaroo GenomicsEvolution, Ecology and GeneticsThe Australian National UniversityResearch School of BiologyBuilding 460200 Canberra ACTAustralia
Paul D. WatersARC Centre of Excellence for
Kangaroo GenomicsEvolution, Ecology and GeneticsThe Australian National UniversityResearch School of BiologyBuilding 460200 Canberra ACTAustralia
ISBN 978-90-481-9022-5 e-ISBN 978-90-481-9023-2DOI 10.1007/978-90-481-9023-2Springer Dordrecht Heidelberg London New York
Library of Congress Control Number: 2010928910
© Springer Science+Business Media B.V. 2010No part of this work may be reproduced, stored in a retrieval system, or transmitted in any form or byany means, electronic, mechanical, photocopying, microfilming, recording or otherwise, without writtenpermission from the Publisher, with the exception of any material supplied specifically for the purposeof being entered and executed on a computer system, for exclusive use by the purchaser of the work.
Printed on acid-free paper
Springer is part of Springer Science+Business Media (www.springer.com)
Preface
Marsupials are appealing subjects for genetics and genomics studies because of theirunique phylogenetic position, and their unique biology, as well as their tractablegenome.
In the vertebrate phylogeny they are placed in Class Mammalia, sharing featurescommon to all mammals such as possessing fur, feeding their young with milk pro-duced by mammary glands, and being warm blooded homeotherms. Marsupials lastshared a common ancestor with eutherian mammals ∼150 million years ago (MYA),thereby bridging the gap between the divergence of Sauropsida (birds/reptiles) fromthe mammalian ancestor (350 MYA), and the eutherian radiation (105 MYA). Asthe most distantly related therian mammals to humans, they have special value forcomparative genetic studies, and their inclusion in comparative genomic studies hasprovided many surprising findings in genome and gene evolution.
Marsupials are characterized especially by their reproductive system, whichevolved to fit them for a life in a harsh continent with uncertain food supplies. Unlikeeutherian (“placental”) mammals, they give birth to altricial young, and most of theirdevelopment occurs outside the protective environment of the uterus. This is usuallyin the confines of a pouch (hence their name, from “marsupium”, meaning pouch);however, in many species the teats are arrayed in folds of the skin.
Marsupial genetics is not new. The large size of their chromosomes and theirlow diploid number has made them easy to study at the cytogenetic level and, infact, they were amongst the first mammalian chromosomes to be examined earlylast century.
Much has happened since the landmark publication of Mammals from Pouchesand Eggs (edited by J. Graves, R. Hope and D. Cooper) almost 20 years ago. Thisvolume featured a collection of papers summarising research in marsupial breedingand genetics that has guided and shaped the field. But despite many major advancesin our understanding of the marsupial genome, this is the only book to be dedicatedto marsupial genetics and genomics. During the last decade, particularly, technolog-ical advances in genome sequencing and analysis have had a huge impact on thepace at which marsupial genetic and genomic research has, and is, progressing. Wefelt that it is time, once again, to compile a comprehensive collection of new work inmarsupial genetics and genomics for those working in the field, their collaborators,
v
vi Preface
advanced students and those with a general interest in the genomes of these amazingcreatures.
For many years, those working on marsupial genomics were not taken seriouslyby those studying more traditional model mammals, mouse and human. However,after sequencing of the human genome was completed, NHGRI recognised the needto sequence genomes of other mammals, particularly those of divergent species, togain a better understanding of the organization, function and evolution of the humangenome. Among mammal species chosen to be sequenced was a marsupial. Thesequencing of the grey short-tailed opossum (published in 2007), and the genomeof a second marsupial, the tammar wallaby, to be published shortly, has attractedworldwide attention, and enabled marsupials to be included in analyses of manygenes and genome features of mammals, as illustrated in many chapters of this book.Of course most contributors to this book recognised the value of marsupials longbefore the sequencing revolution, and have been using the current marsupial genomesequence data to address long standing questions about the unique features of thesefascinating animals.
Research into marsupial genetics and genomics informs many fields, as reflectedby the content of this book, from animal breeding to genome sequencing projects,the development of bioinformatic tools and programs to deal with some of theunique features of marsupial genomes, to gene and genome evolution, the role ofgenes in reproduction and development, and of course population genetics and con-servation. Often these areas overlap, and there is a high degree of collaborationbetween different groups working in this field, as is evident by the extent of cross-referencing between chapters. Through the compilation of work featured here, wehope this book will highlight more areas of potential collaboration and result in evenmore rapid progress in this field.
Marsupial genetics and genomics studies are critical for the conservation ofAustralia’s native fauna, particularly as so many Australian marsupials are on thethreatened or endangered species lists, including the iconic Tasmanian devil. Thedevil has recently been the subject of worldwide concern due to the devastatingeffects that devil facial tumour disease is having on the population. This uniquetransmissible tumour, with chromosomes and gene markers attesting to its clonalnature, has mobilized the genetic resources in Australia to genetically characterizethe tumour and the population of normal animals, in order to develop a strategy tosave the devil by enlightened management and captive breeding, or even by develop-ing a vaccine. In order to achieve such a goal, we need to know much more about thenormal and tumour genomes, as well as marsupial immunology. In the meantime,the knowledge of conservation geneticists is called upon to maximise the potentialof captive breeding colonies. We hope that the collection of reviews we have com-piled will be a useful resource to those taking up the fight to protect the Tasmaniandevil, and other vulnerable Australian marsupials, from extinction.
We wish to thank Des Cooper, who inspired two of the editors to work on theseinteresting creatures, and has been an inspiration, friend and mentor to many peopleworking in this field. We must acknowledge Max Haring, our publishing editor atSpringer, who approached us with the idea for putting together this volume. We

Preface vii
are also extremely grateful to all those who contributed chapters, and hope thisvolume will encourage them to continue their excellent work in marsupial geneticsand genomics.
Canberra, ACT Janine E. DeakinCanberra, ACT Paul D. WatersCanberra, ACT Jennifer A. Marshall GravesDecember 2009

Contents
Part I Marsupial BreedingJanine E. Deakin
1 Breeding and Genetic Management of Captive MarsupialPopulations . . . . . . . . . . . . . . . . . . . . . . . . . . . . . . . 5Emily J. Miller and Catherine A. Herbert
Part II Marsupial Chromosomes and Gene MapsJanine E. Deakin
2 The Conserved Marsupial Karyotype: ChromosomePainting and Evolution . . . . . . . . . . . . . . . . . . . . . . . . . 37Willem Rens and Malcolm Ferguson-Smith
3 Marsupial Centomeres and Telomeres: DynamicChromosome Domains . . . . . . . . . . . . . . . . . . . . . . . . . 55Dawn M. Carone and Rachel J. O’Neill
4 Marsupial Linkage Maps . . . . . . . . . . . . . . . . . . . . . . . 75Paul B. Samollow
5 Physical and Comparative Gene Maps in Marsupials . . . . . . . . 101Janine E. Deakin
Part III Marsupial Genome SequencingJennifer A. Marshall Graves
6 Marsupial Sequencing Projects and Bioinformatics Challenges . . 121Anthony T. Papenfuss, Arthur Hsu, and Matthew Wakefield
7 Insight into Evolution of Gene Regulation Networks fromthe Opossum Genome . . . . . . . . . . . . . . . . . . . . . . . . . 133Matthew J. Wakefield and Anthony T. Papenfuss
ix
x Contents
Part IV Marsupial Sex ChromosomesPaul D. Waters
8 Organization and Evolution of the MarsupialX Chromosome . . . . . . . . . . . . . . . . . . . . . . . . . . . . . 151Hardip R. Patel, Margaret L. Delbridge, andJennifer A.M. Graves
9 Gene Content of the Mammalian X Chromosome . . . . . . . . . . 173Margaret L. Delbridge
10 Marsupial Sex Chromosome Behaviour During Male Meiosis . . . 187Raúl Fernández-Donoso, Soledad Berríos, Julio S. Rufas, andJesús Page
11 Compact but Complex – The Marsupial Y Chromosome . . . . . . 207Veronica J. Murtagh, Paul D. Waters, andJennifer A. Marshall Graves
Part V Marsupial EpigeneticsPaul D. Waters
12 The Evolution of Genomic Imprinting – A Marsupial Perspective . 233Timothy A. Hore, Marilyn B. Renfree, Andrew J. Pask,and Jennifer A. Marshall Graves
13 Marsupial Genetics Reveals Insights into Evolutionof Mammalian X Chromosome Inactivation . . . . . . . . . . . . . 259Shafagh Al Nadaf, Paul D. Waters, Janine E. Deakin,and Jennifer A. Marshall Graves
Part VI Marsupial Reproductive and Developmental GeneticsJennifer A. Marshall Graves
14 Molecular Regulation of Marsupial Reproduction and Development 285Andrew J. Pask and Marilyn B. Renfree
15 Marsupial Milk – Identifying Signals for RegulatingMammary Function and Development of the Young . . . . . . . . . 317Julie A. Sharp, Christophe Lefevre, Joly Kwek, Denijal Topcic,Laurine Buscara, Cate Pooley, Robb de Iongh, Mary Familari,and Kevin R. Nicholas
Part VII Marsupial Immune GenesJanine E. Deakin
16 The Marsupial Major Histocompatibility Complex . . . . . . . . . 339Yuanyuan Cheng, Hannah V. Siddle, and Katherine Belov
17 Marsupial Immunoglobulin and T Cell Receptor Genomics . . . . 357Michelle L. Baker, Xinxin Wang, and Robert D. Miller
Contents xi
18 Use of Genomic Information to Gain Insights into ImmuneFunction in Marsupials: A Review of Divergent Immune Genes . . 381Katrina Morris, Emily S.W. Wong, and Katherine Belov
Part VIII Marsupial Genes and Gene EvolutionPaul D. Waters and Janine E. Deakin
19 Visual Pigments and Colour Vision in Marsupials and Monotremes 403Samir S. Deeb
20 The Evolutionary History of Globin Genes: Insights fromMarsupials and Monotremes . . . . . . . . . . . . . . . . . . . . . 415Vidushi S. Patel and Janine E. Deakin
21 The Olfactory Receptor Gene Family of Marsupials . . . . . . . . 435Margaret L. Delbridge, Amir Mohammadi, andJennifer A. Marshall Graves
Part IX Marsupial Conservation GeneticsJennifer A. Marshall Graves
22 Marsupial Population and Conservation Genetics . . . . . . . . . . 461Mark D.B. Eldridge
23 Devil Facial Tumour Disease (DFTD): Using Geneticsand Genomics to Investigate Infectious Diseasein an Endangered Marsupial . . . . . . . . . . . . . . . . . . . . . 499Hannah S. Bender
Index . . . . . . . . . . . . . . . . . . . . . . . . . . . . . . . . . . . . . 517

Contributors
Shafagh Al Nadaf Evolution, Ecology and Genetics, Research School of Biology,The Australian National University, Canberra, ACT 0200, Australia,[email protected]
Michelle L. Baker Australian Animal Health Laboratory, CSIRO LivestockIndustries, Geelong, VIC 3220, Australia, [email protected]
Katherine Belov Faculty of Veterinary Science, The University of Sydney,Sydney, NSW 2006, Australia, [email protected]
Hannah S. Bender Department of Evolution, Ecology and Genetics, ResearchSchool of Biology, The Australian National University, Canberra, ACT 0200,Australia, [email protected]
Soledad Berríos Programa de Genética Humana, Facultad de Medicina, Institutode Ciencias Biomédicas, Universidad de Chile, Santiago, Chile,[email protected]
Laurine Buscara Institute of Technology Research and Innovation, DeakinUniversity, Geelong, VIC 3214, Australia, [email protected]
Dawn M. Carone Department of Molecular and Cell Biology, Center for AppliedGenetics and Technology, University of Connecticut, Storrs CT 06269, USA,[email protected]
Yuanyuan Cheng Faculty of Veterinary Science, The University of Sydney,Sydney, NSW 2006, Australia, [email protected]
Robb de Iongh Department of Anatomy and Cell Biology, The University ofMelbourne, Melbourne, VIC 3010, Australia, [email protected]
Janine E. Deakin ARC Centre of Excellence for Kangaroo Genomics, Evolution,Ecology and Genetics, Research School of Biology, The Australian NationalUniversity, Canberra, ACT 0200, Australia, [email protected]
Samir S. Deeb Division of Medical Genetics, Department of Medicine, Universityof Washington, Seattle, WA, USA, [email protected]
xiii
xiv Contributors
Margaret L. Delbridge ARC Centre of Excellence for Kangaroo Genomics,Evolution, Ecology and Genetics, Research School of Biology, The AustralianNational University, Canberra, ACT 0200, Australia,[email protected]
Mark D.B. Eldridge Australian Museum, Sydney, NSW 2010, Australia,[email protected]
Mary Familari Department of Zoology, The University of Melbourne,Melbourne,VIC 3010, Australia, [email protected]
Malcolm Ferguson-Smith Cambridge Resource Centre for ComparativeGenomics, Department of Veterinary Medicine, University of Cambridge,Cambridge, CB3 0ES, UK, [email protected]
Raul Fernández-Donoso Programa de Genética Humana, Facultad de Medicina,Instituto de Ciencias Biomédicas, Universidad de Chile, Santiago, Chile,[email protected]
Catherine A. Herbert Faculty of Veterinary Science, The University of Sydney,Camperdown, NSW 2006, Australia, [email protected]
Timothy A. Hore ARC Centre of Excellence for Kangaroo Genomics, Evolution,Ecology and Genetics, Research School of Biology, The Australian NationalUniversity, Canberra, ACT 0200, Australia; Laboratory of Developmental Geneticsand Imprinting, The Babraham Institute, Cambridge, CB22 3AT, UK,[email protected]
Arthur Hsu Bioinformatics, The Walter and Eliza Hall Institute of MedicalResearch, Parkville, VIC 3052, Australia, [email protected]
Joly Kwek Department of Zoology, The University of Melbourne, Melbourne,VIC 3010, Australia, [email protected]
Christophe Lefevre Institute of Technology Research and Innovation, DeakinUniversity, Geelong, VIC 3214, Australia, [email protected]
Jennifer A. Marshall Graves ARC Centre of Excellence for KangarooGenomics, Evolution, Ecology and Genetics, Research School of Biology, TheAustralian National University, Canberra, ACT 0200, Australia,[email protected]
Robert D. Miller Department of Biology, Center for Evolutionary and TheoreticalImmunology, The University of New Mexico, Albuquerque, NM 87131, USA,[email protected]
Emily J. Miller Faculty of Veterinary Science, The University of Sydney,Camperdown, NSW 2006, Australia, [email protected]
Amir Mohammadi ARC Centre of Excellence for Kangaroo Genomics,Evolution, Ecology and Genetics, Research School of Biology, The AustralianNational University, Canberra, ACT 0200, Australia,[email protected]
Contributors xv
Katrina Morris Faculty of Veterinary Science, The University of Sydney, Sydney,NSW 2006, Australia, [email protected]
Veronica J. Murtagh Evolution, Ecology and Genetics, Research School ofBiology, The Australian National University, Canberra, ACT 0200, Australia,[email protected]
Kevin R. Nicholas Institute of Technology Research and Innovation, DeakinUniversity, Geelong, VIC 3214, Australia, [email protected]
Rachel J. O’Neill Department of Molecular and Cell Biology, Center for AppliedGenetics and Technology, University of Connecticut, Storrs CT 06269, USA,[email protected]
Jesús Page Unidad de Biología Celular, Departamento de Biología, UniversidadAutónoma de Madrid, Madrid, Spain, [email protected]
Anthony T. Papenfuss Bioinformatics, The Walter and Eliza Hall Institute ofMedical Research, Parkville, VIC 3052, Australia, [email protected]
Andrew J. Pask Department of Molecular and Cell Biology, University ofConnecticiut Storrs, CT 06269, USA; Department of Zoology, ARC Centre ofExcellence for Kangaroo Genomics, The University of Melbourne, Melbourne,VIC 3010, Australia, [email protected]
Hardip R. Patel ARC Centre of Excellence for Kangaroo Genomics, Evolution,Ecology and Genetics, Research School of Biology, The Australian NationalUniversity, Canberra, ACT 0200, Australia, [email protected]
Vidushi S. Patel ARC Centre of Excellence for Kangaroo Genomics, Evolution,Ecology and Genetics, Research School of Biology, The Australian NationalUniversity, Canberra, ACT 0200, Australia, [email protected]
Cate Pooley Institute of Technology Research and Innovation, Deakin University,Geelong, VIC 3214, Australia, [email protected]
Marilyn B. Renfree Department of Zoology, ARC Centre of Excellence forKangaroo Genomics, The University of Melbourne, Melbourne, VIC 3010,Australia, [email protected]
Willem Rens Department of Veterinary Medicine, Cambridge Resource Centrefor Comparative Genomics, University of Cambridge, Cambridge, CB3 0ES, UK,[email protected]
Julio S. Rufas Unidad de Biología Celular, Departamento de Biología,Universidad Autónoma de Madrid, Madrid, Spain, [email protected]
Paul B. Samollow Department of Veterinary Integrative Biosciences, Faculty ofGenetics, College of Veterinary Medicine and Biomedical Sciences, Texas A&MUniversity, College Station, TX 77843-4458, USA, [email protected]
Julie A. Sharp Institute of Technology Research and Innovation, DeakinUniversity, Geelong, VIC 3214, Australia, [email protected]
xvi Contributors
Hannah V. Siddle Faculty of Veterinary Science, The University of Sydney,Sydney, NSW 2006, Australia, [email protected]
Denijal Topcic Department of Zoology, The University of Melbourne, Melbourne,VIC 3010, Australia, [email protected]
Matthew J. Wakefield Bioinformatics, The Walter and Eliza Hall Institute ofMedical Research, Parkville, VIC 3052, Australia, [email protected]
Xinxin Wang Department of Biology, Center for Evolutionary and TheoreticalImmunology, The University of New Mexico, Albuquerque, NM 87131, USA,[email protected]
Paul D. Waters Evolution, Ecology and Genetics, Research School of Biology,The Australian National University, Canberra, ACT 0200, Australia,[email protected]
Emily S.W. Wong Faculty of Veterinary Science, The University of Sydney,Sydney, NSW 2006, Australia, [email protected]
Abbreviations
AE Axial elementsAFLPs Amplified fragment length polymorphismsALT Alternative lengthening of telomeresAS Angelman’s syndromeBAC Bacterial artificial chromosomeBCR B cell receptorBLAST Basic local alignment search toolBLAT BLAST-like alignment toolBLG β-lactoglobulinCE Central elementCEN CentromerecM centiMorgansCML Chronic myelogenous leukaemiacrasiRNA Centromere repeat associated small interacting RNACT Cancer-testisCTVT Canine transmissible venereal tumourDFTD Devil facial tumour diseaseDP Dense plateDSB Double strand breaksdsRNA Double-stranded RNADTH Delayed type hypersensitivityEB Evolutionary breakpointERV Endogenous retrovirusESD Environmental sex determinationESU Evolutionary significant unitsEU Euchromatic regionFIL Feedback inhibitor of lactationFISH Fluorescence in situ hybridisationGSD Genetic sex determinationHLA Human leukocyte antigenHMG High mobility group proteinsHMM Hidden Markov modelsHS Hypersensitive site
xvii
xviii Abbreviations
HSP High-scoring segment pairsICR Imprint control regionIg ImmunoglobulinKERV Kangaroo endogenous retroviruskLTR KERV long terminal repeatLCR Locus control regionLDL-C Low-density-lipoprotein cholesterolLE Lateral elementsLG Linkage groupLINE Long interspersed nucleotide elementLTR Long terminal repeatLWS Long-wave-sensitiveMb MegabasesMGR Multiple genome rearrangementMHC Major histocompatibility complexmiRNA Micro-RNAMLR Mixed lymphocyte reactionsMRE Major regulatory regionmRNA Messenger RNAMSCI Meiotic sex chromosome inactivationMSP MicrospectrophotometricMSUC Meiotic silencing of unsynapsed chromatinMSY Male specific region of the YmtDNA Mitochondrial DNAMWS Middle-wave-sensitiveMYA Millions of years agoNOR Nucleolar organising regionsNT Northern territoryOR Olfactory receptorORF Open reading framePAR Pseudoautosomal regionPBR Peptide binding regionpiRNA Piwi-interacting RNAPMSC Post meiotic sex chromatinPWS Prader-Willi syndromePY Pouch youngQTL Quantitative trait lociRAG recombination activating geneRAPD Random-amplified polymorphic DNARFLP Restriction fragment length polymorphismRNAi RNA interferenceRSS Recombination signal sequencesSA South AustraliaSC Synaptonemal complexsiRNA Short interfering RNA
Abbreviations xix
snoRNA Small nucleolar RNASNP Single nucleotide polymorphismSpA Staphylococcal protein ASRR Sex and reproduction relatedSSCP Single-strand conformation polymorphismSTR Simple tandem repeatSWS Short-wave-sensitiveTCR T cell receptorTDF Testis determining factorTF Transverse filamentsTSD Temperature-dependent sex determinationV(D)J Variable (diversity) JoiningVH IgH V domainsVic VictoriaVNTR Variable number of tandem repeatWA Western AustraliaWAP Whey acidic proteinXa Active X chromosomeXAR X added regionXCE X controlling elementXCI X chromosome inactivationXCR X conserved regionXi Inactive X chromosomeXIC X inactivation centreXIST X inactive specific transcriptXLMR X-linked mental retardation

Part IMarsupial Breeding
Janine E. Deakin
Well established and managed captive breeding colonies of marsupials have beenextremely important resources for research into marsupial genetics and genomics.In fact, much of the work described in this book would have been impossible with-out captive bred animals. Initially, many different species where used for marsupialgenetics research but three distantly related species were chosen to be “model”marsupial species 20 years ago at the Boden Conference from which “Mammalsfrom Pouches and Eggs” was derived (Hope and Cooper, 1990). The tammar wal-laby (Macopus eugenii) was chosen as a model kangaroo, representing the largeFamily Macropodidae, and the fat-tailed dunnart (Sminthopsis crassicaudata) as arepresentative of the speciose Family Dasyuridae. The grey short-tailed opossum(Monodelphis domestica) was chosen to represent South American marsupials.
Most work on marsupial genetics and genomics since then has been done on twoof these three species, the tammar wallaby and the grey opossum. The fat-taileddunnart was used to derive some of the first linkage maps, but this research hasnow ceased and the colony is no longer genetically managed (Graves et al., 2003)A closely related species, the stripe-faced dunnart (S. macroura) is now bred forresearch into the marsupial egg (Selwood and Hickford, 1999), but it is likely thatthe Tasmanian devil (Sarcophilus harissii) will soon replace S. crassicaudata as themodel dasyurid species for genetics and genomics research, with transcriptome andgenome projects for this species currently underway (see Papenfuss et al., Chapter 6and Bender, Chapter 23 for more details), and a physical map of the genome beingconstructed (Deakin, Chapter 5).
Both the tammar wallaby and the grey short-tailed opossum continue tobe important model species. Their genomes have been sequenced (http://www.genome.gov/12512299; Mikkelsen et al., 2007), cementing their status as modelmarsupials for genetic and genomics studies. The combination of genome sequencedata with the physiological data obtained from research on these animals will leadto a greater understanding of the unique features of marsupials.
The tammar wallaby (Macropus eugenii), a species now extinct on mainlandAustralia but still thriving on islands off the coast of South Australia (KangarooIsland) and Western Australia (e.g. Abrolhos Island), was chosen as the modelmacropod species (Hinds et al., 1990). Its small size makes handling of these
2 Part I Marsupial Breeding
animals easy and its reproduction is easily manipulated, although limited to oneoffspring per year. The many genetic polymorphisms detected between the two geo-graphically isolated populations were recognised as a further asset, with animalsbred from crosses between these two populations being particularly valuable forlinkage mapping studies (McKenzie and Cooper, 1997; see Samollow Chapter 4, inPart II of this book) and research for which information on the parent of origin forallele expression is important (e.g. imprinting and X chromosome inactivation; seeAl Nadaf et al., Chapter 13).
The grey short-tailed opossum (M. domestica), a South American species, is atrue “laboratory marsupial” that has been used for biomedical research. It is a smallmarsupial weighing between 70 and 160 g in its adult form, can be bred in cages sim-ilar to rodents, and is a prolific breeder, with litter sizes on average of eight youngand about three litters per year (Samollow, 2008). This species has been raised inpedigreed colonies for over 30 years (Samollow, 2008). These well-defined pedi-grees were essential for the construction of genetic linkage maps and mapping ofquantitative traits (described in Samollow, Part II of this book).
In Chapter 1, Miller and Herbert discuss the many factors that need to be con-sidered when establishing and maintaining captive breeding colonies of marsupials,such as the reproductive strategies of the species. They highlight the importance ofgenetic factors in maintaining captive breeding colonies and the procedures whichshould be carried out to maintain a healthy level of genetic diversity, using their ownexperience with a captive research colony of tammar wallabies as an example.
Some marsupial species are bred in captivity for conservation, rather thanresearch purposes. Miller and Herbert highlight the increasing need for captivebreeding colonies for the conservation of the ever growing list of threatened andendangered marsupial species. A very prominent example is the Tasmanian devil,a species recently added to the endangered species list as a result of devil facialtumour disease (DFTD) (see Bender, Chapter 23), which has killed more than halfthe world’s devils. Captive colonies of devils have been established on mainlandAustralia to insure against the extinction of this species. In this case, the considera-tion of genetic factors is critical. It appears that the prevalence of the disease in wilddevils is due to low levels of genetic diversity in key immune genes of the MajorHistocompatibility Complex (MHC) (Siddle et al., 2007). Each animal entering aninsurance colony is typed for its MHC alleles with the intent of maximising geneticdiversity for these loci (TDSC, 2007).
Obviously marsupial captive breeding colonies are vital for research and con-servation. Unfortunately, maintaining such colonies is an extensive and expensiveendeavour, but the loss of these valuable resources would be devastating for mar-supial research and the conservation of Australia’s native fauna. These colonies areparticularly important now that we have genome sequence data. Genome sequencesprovide the basic information required to now begin exploring, at the genetic andgenomic level, the unique biology of marsupials.
Part I Marsupial Breeding 3
References
Graves JAM, Wakefield MJ, Renfree MB, et al. (2003) Proposal to sequence thegenome of the model marsupial Macropus eugenii (Tammar Wallaby). http://wwwgenomegov/Pages/Research/Sequencing/SeqProposals/WallabySEQpdf.
Hinds LA, Poole WE, Tyndale-Biscoe CH, van Oorschot RAH, Cooper DW (1990)Reproductive biology and the potential for genetic studies in the tammar wal-laby Macropus eugenii. In: Graves JAM, Hope RM, Cooper DW (eds) Mammalsfrom Pouches and Eggs: Genetics, Breeding and Evolution of Marsupials andMonotremes. CSIRO Press, Melbourne.
Hope RM, Cooper DW (1990) Marsupial and monotreme breeding in wild and cap-tive populations: towards a laboratory marsupial. In: Graves JAM, Hope RM,Cooper DW (eds) Mammals from Pouches and Eggs: Genetics, Breeding andEvolution of Marsupials and Monotremes. CSIRO Press, Melbourne.
McKenzie LM, Cooper DW (1997) Hybridisation between tammar wallaby(Macropus eugenii) populations from Western and South Australia. J Hered88:398–400.
Mikkelsen TS, Wakefield MJ, Aken B, et al. (2007) Genome of the marsupialMonodelphis domestica reveals innovation in non-coding sequences. Nature447:167–177.
Samollow PB (2008) The opossum genome: insights from an alternative mammal.Genome Res 18:1199–1215.
Selwood L, Hickford D (1999) Early cell lineages in marsupial embryos. In: MoodySA (ed) Cell Fate and Cell Determination. Academic Press, New York.
Siddle HV, Kreiss A, Eldridge MDB, et al. (2007) Transmission of a fatal clonaltumor by biting occurs due to depleted MHC diversity in a threatened carnivorousmarsupial. Proc Natl Acad Sci USA 104:16221–16226.
TDSC (2007) Insurance Population Strategy. Save the Tasmanian Devil SteeringCommittee.

Chapter 1Breeding and Genetic Management of CaptiveMarsupial Populations
Emily J. Miller and Catherine A. Herbert
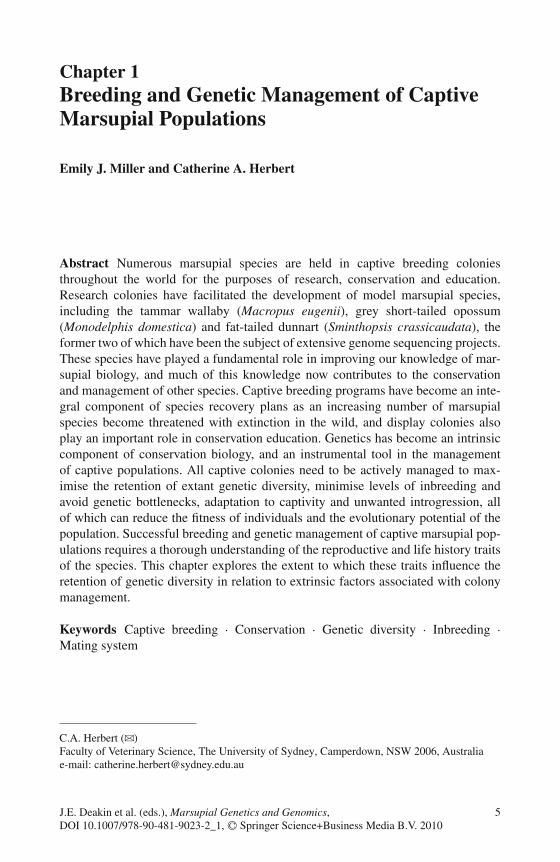
Abstract Numerous marsupial species are held in captive breeding coloniesthroughout the world for the purposes of research, conservation and education.Research colonies have facilitated the development of model marsupial species,including the tammar wallaby (Macropus eugenii), grey short-tailed opossum(Monodelphis domestica) and fat-tailed dunnart (Sminthopsis crassicaudata), theformer two of which have been the subject of extensive genome sequencing projects.These species have played a fundamental role in improving our knowledge of mar-supial biology, and much of this knowledge now contributes to the conservationand management of other species. Captive breeding programs have become an inte-gral component of species recovery plans as an increasing number of marsupialspecies become threatened with extinction in the wild, and display colonies alsoplay an important role in conservation education. Genetics has become an intrinsiccomponent of conservation biology, and an instrumental tool in the managementof captive populations. All captive colonies need to be actively managed to max-imise the retention of extant genetic diversity, minimise levels of inbreeding andavoid genetic bottlenecks, adaptation to captivity and unwanted introgression, allof which can reduce the fitness of individuals and the evolutionary potential of thepopulation. Successful breeding and genetic management of captive marsupial pop-ulations requires a thorough understanding of the reproductive and life history traitsof the species. This chapter explores the extent to which these traits influence theretention of genetic diversity in relation to extrinsic factors associated with colonymanagement.
Keywords Captive breeding · Conservation · Genetic diversity · Inbreeding ·Mating system
C.A. Herbert (B)Faculty of Veterinary Science, The University of Sydney, Camperdown, NSW 2006, Australiae-mail: [email protected]
5J.E. Deakin et al. (eds.), Marsupial Genetics and Genomics,DOI 10.1007/978-90-481-9023-2_1, C© Springer Science+Business Media B.V. 2010
6 E.J. Miller and C.A. Herbert
1.1 Introduction
Marsupials have been bred in captivity in Australia and internationally for severaldecades (George, 1990). Historically, captive populations were established to sat-isfy curiosity or provide entertainment. Today, there has been a philosophical shifttowards conservation. Many wild animal populations currently require some formof active management to ensure their survival. Human modifications to the envi-ronment, including habitat destruction and fragmentation, modification of faunalassemblages through the removal or introduction of predators and competitors, mod-ification of floral communities, alteration to fire regimes and water sources, and theprocess of urbanisation have resulted in dramatic changes to the distribution andabundance of endemic species (Caughley, 1987). The current losses of biodiver-sity and rates of extinction are unprecedented (Myers and Knoll, 2001) and the roleof conservation programs, including captive breeding, has become crucial for thesurvival of many species in the twenty-first century.
The rationale for maintaining marsupial captive breeding colonies generallyfalls within one of the following three broad categories, all of which contribute toconservation in some way:
Research colonies, housing one or more model marsupial species which pro-vide a source of individual animals for fundamental biological or appliedresearch;
Conservation colonies, which generally aim to breed threatened or vulnera-ble species in captivity for long-term conservation or reintroduction intotheir natural habitat once threatening processes have been ameliorated in thewild; and
Display colonies, which are open to the public and play an important role ineducation.
For the purpose of this review, a captive breeding colony is defined as thebreeding of a species in a controlled environment such as a zoo, conservation orresearch facility. This includes individual populations that are housed at a singlefacility, as well as the management of numerous colonies as a self-sustaining meta-population. A list of the marsupial species commonly kept in captivity is provided inTable 1.1.
Research colonies provide an important contribution to the understanding ofmany facets of biology, from behaviour to genomics. While there are innumer-able marsupial species that have been the subject of research, there are only afew species that could truly be considered model species for marsupial research.These include the tammar wallaby (Macropus eugenii) (Fig. 1.1a), grey short-tailedopossum (Monodelphis domestica), fat-tailed dunnart (Sminthopsis crassicaudata)and the brushtail possum (Trichosurus vulpecula) (Fig. 1.1b). The focus of muchof this research has been within the fields of genetics and genomics (Hope, 1993;Graves and Hesterman, 2002); reproductive biology (Tyndale-Biscoe and Renfree,
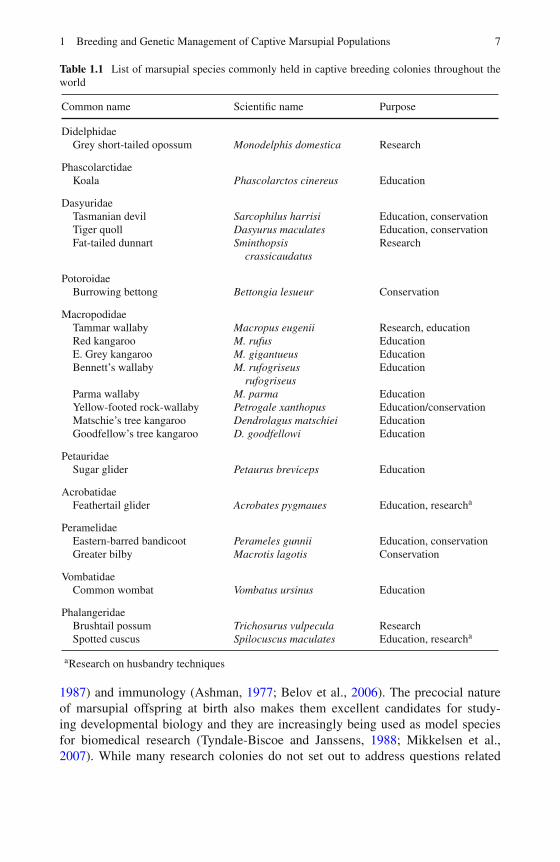
1 Breeding and Genetic Management of Captive Marsupial Populations 7
Table 1.1 List of marsupial species commonly held in captive breeding colonies throughout theworld
Common name Scientific name Purpose
DidelphidaeGrey short-tailed opossum Monodelphis domestica Research
PhascolarctidaeKoala Phascolarctos cinereus Education
DasyuridaeTasmanian devil Sarcophilus harrisi Education, conservationTiger quoll Dasyurus maculates Education, conservationFat-tailed dunnart Sminthopsis
crassicaudatusResearch
PotoroidaeBurrowing bettong Bettongia lesueur Conservation
MacropodidaeTammar wallaby Macropus eugenii Research, educationRed kangaroo M. rufus EducationE. Grey kangaroo M. gigantueus EducationBennett’s wallaby M. rufogriseus
rufogriseusEducation
Parma wallaby M. parma EducationYellow-footed rock-wallaby Petrogale xanthopus Education/conservationMatschie’s tree kangaroo Dendrolagus matschiei EducationGoodfellow’s tree kangaroo D. goodfellowi Education
PetauridaeSugar glider Petaurus breviceps Education
AcrobatidaeFeathertail glider Acrobates pygmaues Education, researcha
PeramelidaeEastern-barred bandicoot Perameles gunnii Education, conservationGreater bilby Macrotis lagotis Conservation
VombatidaeCommon wombat Vombatus ursinus Education
PhalangeridaeBrushtail possum Trichosurus vulpecula ResearchSpotted cuscus Spilocuscus maculates Education, researcha
aResearch on husbandry techniques
1987) and immunology (Ashman, 1977; Belov et al., 2006). The precocial natureof marsupial offspring at birth also makes them excellent candidates for study-ing developmental biology and they are increasingly being used as model speciesfor biomedical research (Tyndale-Biscoe and Janssens, 1988; Mikkelsen et al.,2007). While many research colonies do not set out to address questions related
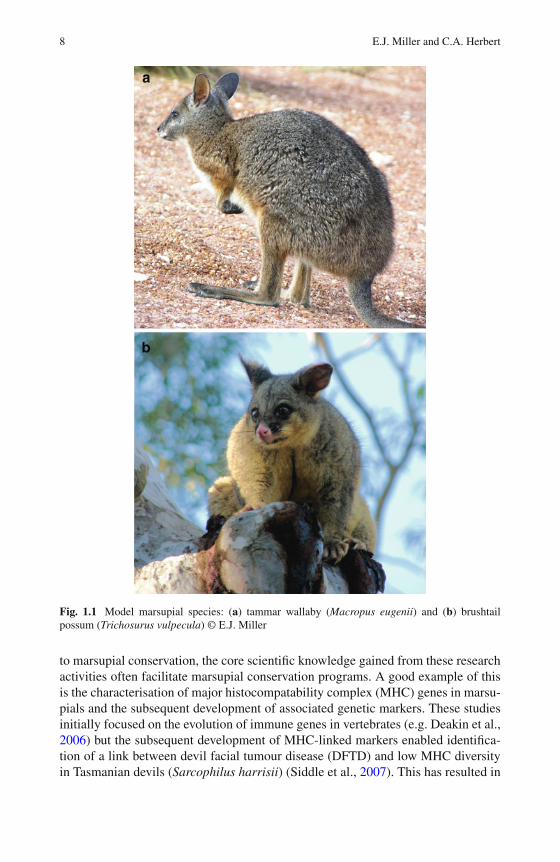
8 E.J. Miller and C.A. Herbert
Fig. 1.1 Model marsupial species: (a) tammar wallaby (Macropus eugenii) and (b) brushtailpossum (Trichosurus vulpecula) © E.J. Miller
to marsupial conservation, the core scientific knowledge gained from these researchactivities often facilitate marsupial conservation programs. A good example of thisis the characterisation of major histocompatability complex (MHC) genes in marsu-pials and the subsequent development of associated genetic markers. These studiesinitially focused on the evolution of immune genes in vertebrates (e.g. Deakin et al.,2006) but the subsequent development of MHC-linked markers enabled identifica-tion of a link between devil facial tumour disease (DFTD) and low MHC diversityin Tasmanian devils (Sarcophilus harrisii) (Siddle et al., 2007). This has resulted in
1 Breeding and Genetic Management of Captive Marsupial Populations 9
a coordinated approach to Tasmanian devil captive breeding programs to encouragepairings that will enhance the maintenance of genetic diversity, especially at MHCloci (TDSC, 2007; Bender, Chapter 23).
Conservation colonies have become an important component of threatenedspecies recovery programs and often form a necessary component of conservingthreatened taxa. These colonies vary from intensive one-on-one pairings of indi-vidual animals to large, semi-free range enclosures of breeding individuals. Theultimate goal of these populations is usually to produce progeny for release into thewild, but meeting this goal is dependent on addressing the initial cause(s) for theirdecline in the wild. If the threatening processes have not been removed, then releaseinto the wild may not be possible, and long-term maintenance in captivity will berequired. The marsupial species that fall within this category vary temporally andgeographically. The species list in Table 1.1 merely illustrates some well knownexamples and is by no means exhaustive.
Display colonies of many marsupial species are held in zoos and wildlifeparks throughout the world. The motivation for keeping these animals is primar-ily conservation education rather than a direct role in conservation per se. Forexample, the Regional Collection Plan (RCP) for marsupials within the mem-ber institutions of the American Zoo and Aquarium Association (AZA) focuseson keeping collections of “common [marsupial] species with interesting stories”that can play a role in educational programs by demonstrating important con-cepts in wildlife conservation and management (Hutchins et al., 1998). Mostzoos, particularly in the Australasian region, maintain a diversity of species thatis reflected in Table 1.1. Many zoos also try to place an emphasis on researchactivities in specific taxa, e.g. the common spotted cuscus (Spilocuscus macula-tus) was included in the RCP for North American Zoos because it can serve asthe focus for basic biological and husbandry research. Many species of cuscusare considered threatened or endangered and little is known about their basic biol-ogy or appropriate methods of care in captivity (Hutchins et al., 1998). Relativelycommon species, such as the common spotted cuscus, can therefore serve as amodel species for other less common species within this and other closely relatedgenera.
All captive colonies need to be actively managed to maximise the retentionof extant genetic diversity, minimise levels of inbreeding and avoid genetic bot-tlenecks, adaptation to captivity and unwanted introgression, all of which affectpopulation growth, survival and evolutionary potential (Ralls and Ballou, 1986;Reed and Frankham, 2003). Factors that influence the maintenance of genetic diver-sity in captivity include intrinsic factors, such as the species mating system andreproductive biology, and extrinsic factors, such as enclosure design, stocking den-sity and colony management strategies. The aim of this chapter is to discuss theinterplay of reproductive and genetic factors that influence successful breedingand genetic management of marsupial populations in captivity. As increasing num-bers of marsupial species decline in the wild and become the subject of intensive(or extensive) captive breeding programs, understanding these factors will becomeincreasingly important for long term species survival.
10 E.J. Miller and C.A. Herbert
1.2 Aspects of Species Biology Influencing Captive Breeding
1.2.1 Reproductive Strategies
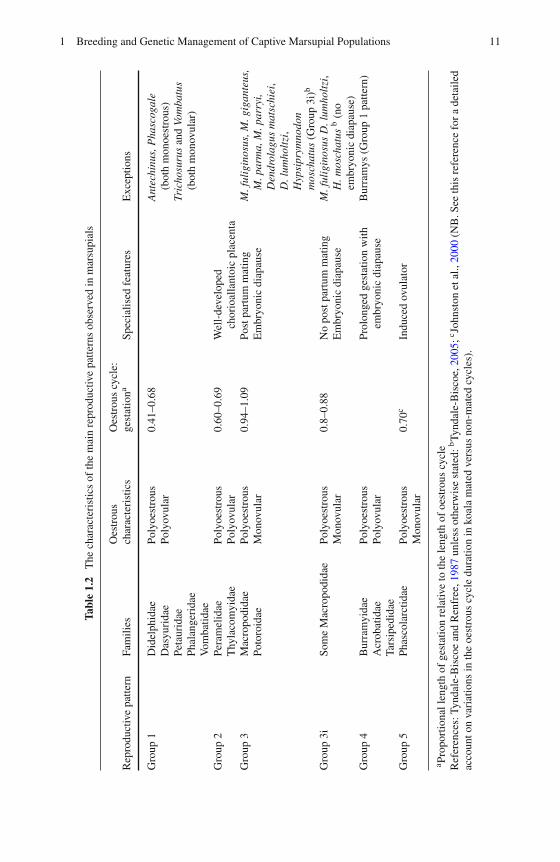
Most marsupials are seasonal breeders and produce relatively small, immatureyoung. The maternal investment in pregnancy is small, with a correspondinglylonger period of lactation. Marsupial reproductive strategies have been divided intofour basic reproductive patterns (Table 1.2) by Tyndale-Biscoe and Renfree (1987),following on from the initial attempt to classify marsupial reproductive patterns bySharman et al. (1966), who first recognised the four groups. The division into fourgroups is primarily based on the duration of the oestrous cycle as a function ofgestation, the type of placentation, whether they are polyoestrous or monoestrous,polyovular or monovular, and other specialised features, such as the occurrence ofembryonic diapause. It is important to be aware of these fundamental aspects oftheir reproductive biology to facilitate effective management of population size andpaternity of offspring.
Group 1 is thought to represent the basic or ancestral pattern from which the otherthree patterns are derived (Tyndale-Biscoe and Renfree, 1987). Species in this groupare polyoestrous and polyovular (with the exception of the brushtail possum, whichis monovular, and Antechinus sp. and Phascogale sp. which are monoestrous).The gestation period is considerably shorter than the oestrous cycle and coincideswith the luteal phase, so that post-partum oestrus and ovulation are suppressedduring lactation. Group 2 species have similar characteristics (see Table 1.2),but are unique in possessing a well formed, short-lived chorioallantoic placenta(Tyndale-Biscoe and Renfree, 1987). Species in this group are also renowned forhaving some of the shortest gestation periods of any mammal (Tyndale-Biscoe,2005).
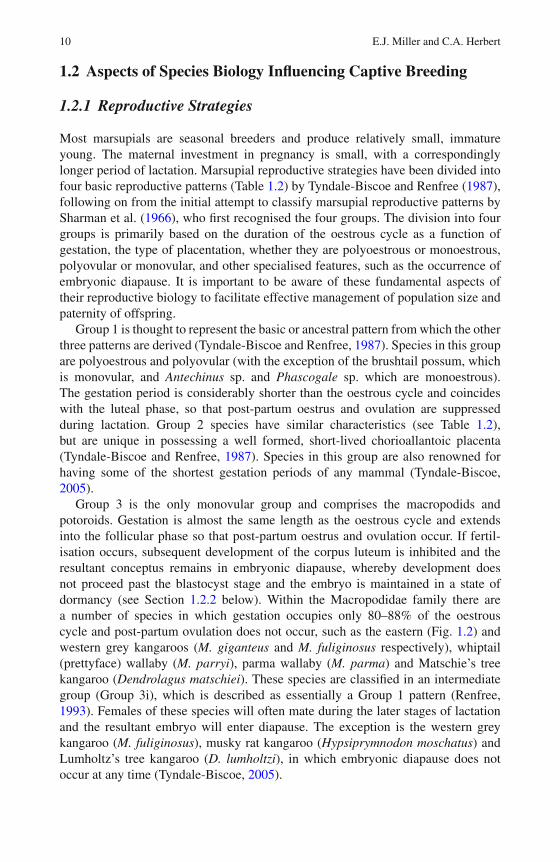
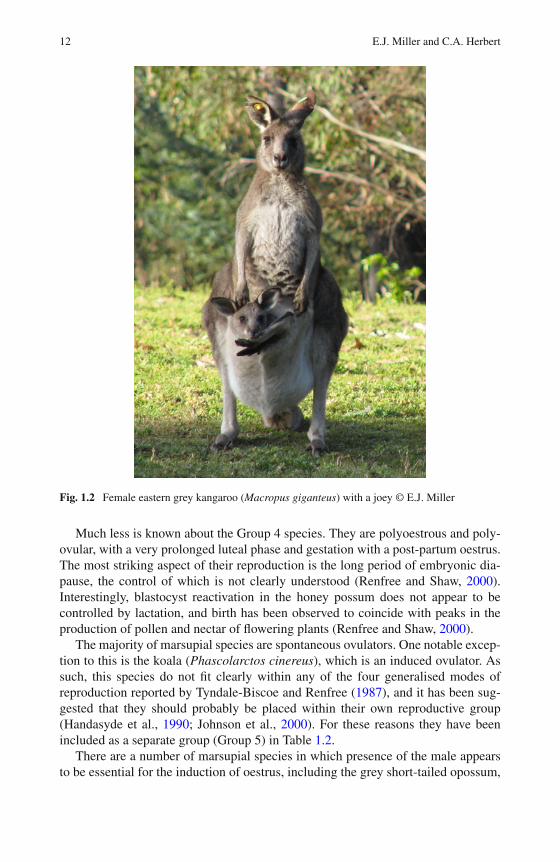
Group 3 is the only monovular group and comprises the macropodids andpotoroids. Gestation is almost the same length as the oestrous cycle and extendsinto the follicular phase so that post-partum oestrus and ovulation occur. If fertil-isation occurs, subsequent development of the corpus luteum is inhibited and theresultant conceptus remains in embryonic diapause, whereby development doesnot proceed past the blastocyst stage and the embryo is maintained in a state ofdormancy (see Section 1.2.2 below). Within the Macropodidae family there area number of species in which gestation occupies only 80–88% of the oestrouscycle and post-partum ovulation does not occur, such as the eastern (Fig. 1.2) andwestern grey kangaroos (M. giganteus and M. fuliginosus respectively), whiptail(prettyface) wallaby (M. parryi), parma wallaby (M. parma) and Matschie’s treekangaroo (Dendrolagus matschiei). These species are classified in an intermediategroup (Group 3i), which is described as essentially a Group 1 pattern (Renfree,1993). Females of these species will often mate during the later stages of lactationand the resultant embryo will enter diapause. The exception is the western greykangaroo (M. fuliginosus), musky rat kangaroo (Hypsiprymnodon moschatus) andLumholtz’s tree kangaroo (D. lumholtzi), in which embryonic diapause does notoccur at any time (Tyndale-Biscoe, 2005).
1 Breeding and Genetic Management of Captive Marsupial Populations 11
Tabl
e1.
2T
hech
arac
teri
stic
sof
the
mai
nre
prod
uctiv
epa
ttern
sob
serv
edin
mar
supi
als
Rep
rodu
ctiv
epa
ttern
Fam
ilies
Oes
trou
sch
arac
teri
stic
sO
estr
ous
cycl
e:ge
stat
iona
Spec
ialis
edfe
atur
esE
xcep
tions
Gro
up1
Did
elph
idae
Das
yuri
dae
Peta
urid
aePh
alan
geri
dae
Vom
batid
ae
Poly
oest
rous
Poly
ovul
ar0.
41–0
.68
Ant
echi
nus,
Pha
scog
ale
(bot
hm
onoe
stro
us)
Tric
hosu
rus
and
Vom
batu
s(b
oth
mon
ovul
ar)
Gro
up2
Pera
mel
idae
Thy
laco
myi
dae
Poly
oest
rous
Poly
ovul
ar0.
60–0
.69
Wel
l-de
velo
ped
chor
ioal
lant
oic
plac
enta
Gro
up3
Mac
ropo
dida
ePo
toro
idae
Poly
oest
rous
Mon
ovul
ar0.
94–1
.09
Post
part
umm
atin
gE
mbr
yoni
cdi
apau
seM
.ful
igin
osus
,M.g
igan
teus
,M
.par
ma,
M.p
arry
i,D
endr
olag
usm
atsc
hiei
,D
.lum
holt
zi,
Hyp
sipr
ymno
don
mos
chat
us(G
roup
3i)b
Gro
up3i
Som
eM
acro
podi
dae
Poly
oest
rous
Mon
ovul
ar0.
8–0.
88N
opo
stpa
rtum
mat
ing
Em
bryo
nic
diap
ause
M.f
ulig
inos
usD
.lum
holt
zi,
H.m
osch
atus
b(n
oem
bryo
nic
diap
ause
)G
roup
4B
urra
myi
dae
Acr
obat
idae
Tars
iped
idae
Poly
oest
rous
Poly
ovul
arPr
olon
ged
gest
atio
nw
ithem
bryo
nic
diap
ause
Bur
ram
ys(G
roup
1pa
ttern
)
Gro
up5
Phas
cola
rctid
aePo
lyoe
stro
usM
onov
ular
0.70
cIn
duce
dov
ulat
or
a Prop
ortio
nall
engt
hof
gest
atio
nre
lativ
eto
the
leng
thof
oest
rous
cycl
eR
efer
ence
s:Ty
ndal
e-B
isco
ean
dR
enfr
ee,1
987
unle
ssot
herw
ise
stat
ed:b
Tynd
ale-
Bis
coe,
2005
;c John
ston
etal
.,20
00(N
B.S
eeth
isre
fere
nce
for
ade
taile
dac
coun
ton
vari
atio
nsin
the
oest
rous
cycl
edu
ratio
nin
koal
am
ated
vers
usno
n-m
ated
cycl
es).
12 E.J. Miller and C.A. Herbert
Fig. 1.2 Female eastern grey kangaroo (Macropus giganteus) with a joey © E.J. Miller
Much less is known about the Group 4 species. They are polyoestrous and poly-ovular, with a very prolonged luteal phase and gestation with a post-partum oestrus.The most striking aspect of their reproduction is the long period of embryonic dia-pause, the control of which is not clearly understood (Renfree and Shaw, 2000).Interestingly, blastocyst reactivation in the honey possum does not appear to becontrolled by lactation, and birth has been observed to coincide with peaks in theproduction of pollen and nectar of flowering plants (Renfree and Shaw, 2000).
The majority of marsupial species are spontaneous ovulators. One notable excep-tion to this is the koala (Phascolarctos cinereus), which is an induced ovulator. Assuch, this species do not fit clearly within any of the four generalised modes ofreproduction reported by Tyndale-Biscoe and Renfree (1987), and it has been sug-gested that they should probably be placed within their own reproductive group(Handasyde et al., 1990; Johnson et al., 2000). For these reasons they have beenincluded as a separate group (Group 5) in Table 1.2.
There are a number of marsupial species in which presence of the male appearsto be essential for the induction of oestrus, including the grey short-tailed opossum,
1 Breeding and Genetic Management of Captive Marsupial Populations 13
brush-tailed bettong (B. penicillata) and greater bilby (Ballantyne et al., 2009). Inthe opossum, females are believed to respond to olfactory stimulus from a male,which induces oestrus and ovulation (Fadem, 1985). In the case of the bilby, it hasnot yet been determined if the female is an induced ovulator (like the koala) or ifthey respond to other factors associated with the presence of the male (Ballantyneet al., 2009).
1.2.2 Embryonic Diapause
Embryonic diapause is a common phenomenon that has been extensively studiedin macropodids (Group 3). Little is known about embryonic diapause in Group 4species, so they have been excluded from discussions in this section. If fertilisa-tion occurs as a result of a post partum oestrus in macropodids, the embryo willdevelop to the stage of a unilaminar blastocyst of approximately 100 cells (takingapproximately 8 days in the tammar wallaby), before entering a dormant state (dia-pause). Neural stimulation from the suckling of the newborn young in the pouchcauses the pituitary to inhibit further corpus luteum and embryonic development(Renfree, 1979) until the first young vacates the pouch (or dies). The quiescentstate of the ovaries as a result of lactation driven embryonic diapause is termedlactational quiescence (Tyndale-Biscoe et al., 1974). Two macropodid species, thetammar and Bennett’s wallaby (M. eugenii and M. rufogriseus respectively) alsoundergo a period of seasonal quiescence. In these two species, the corpus luteumand blastocyst are inhibited by the suckling stimulus of the pouch young during theperiod of decreasing daylength (from birth in late January to the winter solstice inJune in the Southern Hemisphere). Loss of the young during this period will resultin corpus luteum and embryo reactivation, with birth occurring approximately 26days later in the case of the tammar. However, if the young is lost during the periodof increasing daylength, the blastocyst and corpus luteum will not reactivate (due toa photoperiod inhibition) until daylength begins to decrease again after the summersolstice (Sadlier and Tyndale-Biscoe, 1977).
1.2.3 Monitoring Reproductive Status
Monitoring the reproductive status of colony animals, combined with knowledge ofthe reproductive strategy of the species, is essential to effectively manage populationsize and breeding opportunities. It is necessary to be aware when specific individu-als reach sexual maturity and when females are likely to return to oestrus, so that theappropriate pairings between males and females can be facilitated, or animals canbe isolated if no further breeding is desired. Consideration must also be given to theoccurrence of post-partum mating and embryonic diapause in the macropodids. Thiswill influence population management and paternity planning, with colony man-agers and curators needing to pair the appropriate male with females at the time ofoestrus, up to 11 months before the birth of the neonate.
14 E.J. Miller and C.A. Herbert
Given the short duration of gestation in marsupials, there is little need for theuse of hormone assays to determine the reproductive status of a female. Faecal hor-mone concentrations are primarily used to determine oestrous cycle length, timingof oestrus and gestation length, which can then be correlated with breeding successand behavioural observations. Such methods are often employed in the initial stagesof a captive breeding program or in species that have experienced poor breeding suc-cess in captivity, e.g. Gilbert’s potoroo (Stead-Richardson et al., 2010). The hopeis that this information can be used to optimise husbandry techniques to increasereproductive success.
1.2.4 Reproductive Behaviour and Mating Systems
Large groups of breeding animals in captivity will display varying levels of com-petition for access to mates. This will be influenced by the species mating system,but also conditions imposed by the nature of the captive environment, e.g. densityand sex ratio. Mating systems influence individual fitness and reproductive strate-gies, and are strongly linked with the genetic characteristics of a population. Theseare important to consider, as the genetic properties of a population will influence theevolutionary potential of a species. Furthermore, reproductive strategies are stronglylinked to effective population size (Ne) (Ralls and Ballou, 1986) which is defined as“the number of individuals that would give rise to the calculated inbreeding coef-ficient, loss of heterozygosity or variance in allele frequency if they behaved inthe manner of an idealised population” (Frankham et al., 2002). For example, inmating systems where there is high reproductive skew and some individuals areexcluded from breeding (Nunney, 1991; 1993), Ne can become very low (Nunneyand Elam, 1994; Frankham, 1995b). In populations of conservation concern, this isof particular importance as Ne determines the rate of loss of genetic diversity andinbreeding which contributes to the risk of extinction (Frankham, 1995b; Frankhamet al., 2002).
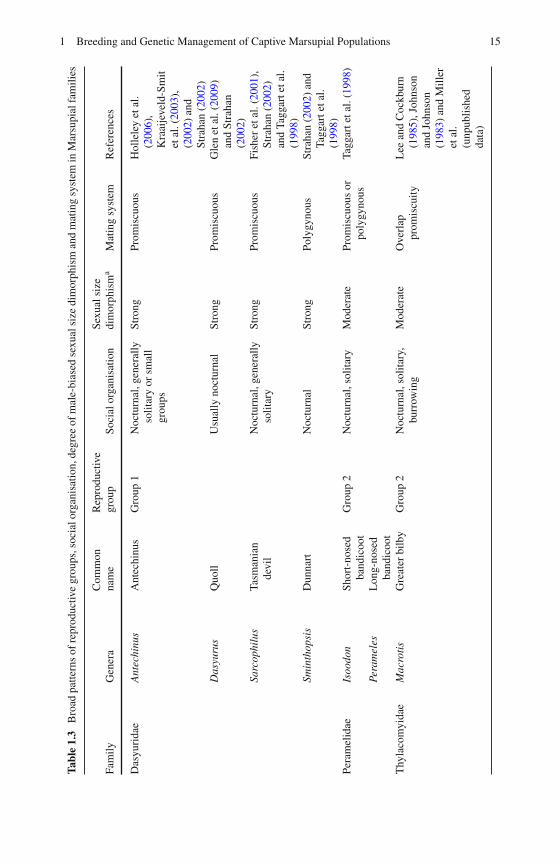
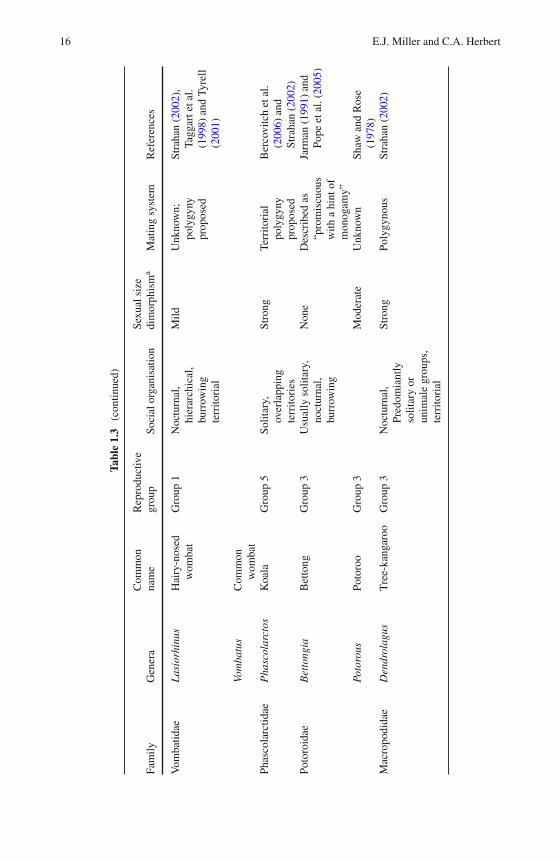
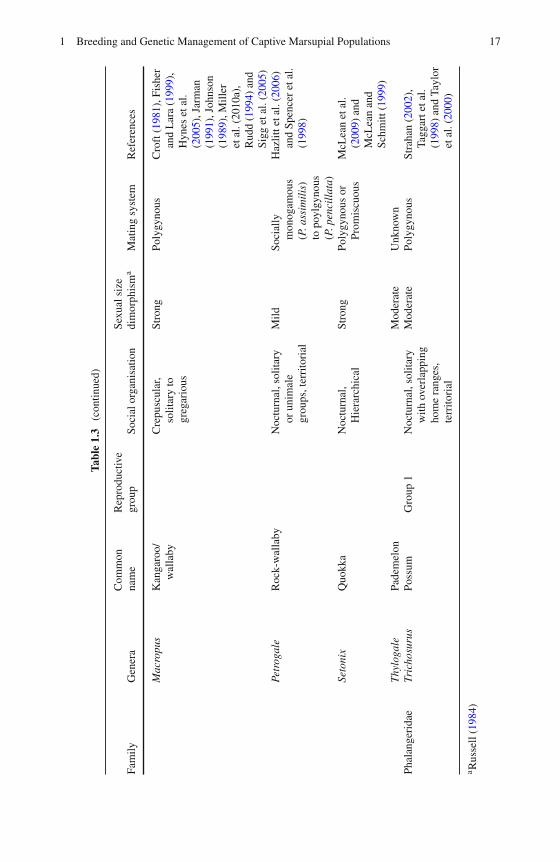
There is limited empirical data available on the genetic mating system of manymarsupial species. Table 1.3 summaries the broad patterns of the social organisa-tion, degree of sexual dimorphism and mating system for each marsupial family.The classic mating system classifications are monogamy, polygyny, polyandry andpromiscuity, though the precise definition of each can differ even within the field ofevolutionary biology (Andersson, 1994).
Typically, monogamy is defined as the continuing bond and exclusive relation-ship between a male and a female. The only marsupial known to show any indicationof monogamy is the allied rock-wallaby, Petrogale assimilis (Spencer et al., 1998).Using genetic techniques, Spencer et al. (1998) found evidence to suggest the alliedrock-wallaby forms long-term socially monogamous pair bonds, although there wasevidence of extra-pair fertilisations, which could lead to the assertion that they areeffectively promiscuous (Dobson and Zinner, 2003). In a promiscuous mating sys-tem, both males and females mate with more than one partner and there is no longterm relationship (Wittenberger, 1979). Polygyny occurs when a single male mates
1 Breeding and Genetic Management of Captive Marsupial Populations 15
Tabl
e1.
3B
road
patte
rns
ofre
prod
uctiv
egr
oups
,soc
ialo
rgan
isat
ion,
degr
eeof
mal
e-bi
ased
sexu
alsi
zedi
mor
phis
man
dm
atin
gsy
stem
inM
arsu
pial
fam
ilies
Fam
ilyG
ener
aC
omm
onna
me
Rep
rodu
ctiv
egr
oup
Soci
alor
gani
satio
nSe
xual
size
dim
orph
ism
aM
atin
gsy
stem
Ref
eren
ces
Das
yuri
dae
Ant
echi
nus
Ant
echi
nus
Gro
up1
Noc
turn
al,g
ener
ally
solit
ary
orsm
all
grou
ps
Stro
ngPr
omis
cuou
sH
olle
ley
etal
.(2
006)
,K
raai
jeve
ld-S
mit
etal
.(20
03),
(200
2)an
dSt
raha
n(2
002)
Das
yuru
sQ
uoll
Usu
ally
noct
urna
lSt
rong
Prom
iscu
ous
Gle
net
al.(
2009
)an
dSt
raha
n(2
002)
Sarc
ophi
lus
Tasm
ania
nde
vil
Noc
turn
al,g
ener
ally
solit
ary
Stro
ngPr
omis
cuou
sFi
sher
etal
.(20
01),
Stra
han
(200
2)an
dTa
ggar
teta
l.(1
998)
Smin
thop
sis
Dun
nart
Noc
turn
alSt
rong
Poly
gyno
usSt
raha
n(2
002)
and
Tagg
arte
tal.
(199
8)Pe
ram
elid
aeIs
oodo
nSh
ort-
nose
dba
ndic
oot
Gro
up2
Noc
turn
al,s
olita
ryM
oder
ate
Prom
iscu
ous
orpo
lygy
nous
Tagg
arte
tal.
(199
8)
Pera
mel
esL
ong-
nose
dba
ndic
oot
Thy
laco
myi
dae
Mac
roti
sG
reat
erbi
lby
Gro
up2
Noc
turn
al,s
olita
ry,
burr
owin
gM
oder
ate
Ove
rlap
prom
iscu
ityL
eean
dC
ockb
urn
(198
5),J
ohns
onan
dJo
hnso
n(1
983)
and
Mill
eret
al.
(unp
ublis
hed
data
)
16 E.J. Miller and C.A. Herbert
Tabl
e1.
3(c
ontin
ued)
Fam
ilyG
ener
aC
omm
onna
me
Rep
rodu
ctiv
egr
oup
Soci
alor
gani
satio
nSe
xual
size
dim
orph
ism
aM
atin
gsy
stem
Ref
eren
ces
Vom
batid
aeL
asio
rhin
usH
airy
-nos
edw
omba
tG
roup
1N
octu
rnal
,hi
erar
chic
al,
burr
owin
gte
rrito
rial
Mild
Unk
now
n;po
lygy
nypr
opos
ed
Stra
han
(200
2),
Tagg
arte
tal.
(199
8)an
dTy
rell
(200
1)
Vom
batu
sC
omm
onw
omba
tPh
asco
larc
tidae
Pha
scol
arct
osK
oala
Gro
up5
Solit
ary,
over
lapp
ing
terr
itori
es
Stro
ngTe
rrito
rial
poly
gyny
prop
osed
Ber
covi
tch
etal
.(2
006)
and
Stra
han
(200
2)Po
toro
idae
Bet
tong
iaB
etto
ngG
roup
3U
sual
lyso
litar
y,no
ctur
nal,
burr
owin
g
Non
eD
escr
ibed
as“p
rom
iscu
ous
with
ahi
ntof
mon
ogam
y”
Jarm
an(1
991)
and
Pope
etal
.(20
05)
Poto
rous
Poto
roo
Gro
up3
Mod
erat
eU
nkno
wn
Shaw
and
Ros
e(1
978)
Mac
ropo
dida
eD
endr
olag
usT
ree-
kang
aroo
Gro
up3
Noc
turn
al,
Pred
omia
ntly
solit
ary
orun
imal
egr
oups
,te
rrito
rial
Stro
ngPo
lygy
nous
Stra
han
(200
2)
1 Breeding and Genetic Management of Captive Marsupial Populations 17
Tabl
e1.
3(c
ontin
ued)
Fam
ilyG
ener
aC
omm
onna
me
Rep
rodu
ctiv
egr
oup
Soci
alor
gani
satio
nSe
xual
size
dim
orph
ism
aM
atin
gsy
stem
Ref
eren
ces
Mac
ropu
sK
anga
roo/
wal
laby
Cre
pusc
ular
,so
litar
yto
greg
ario
us
Stro
ngPo
lygy
nous
Cro
ft(1
981)
,Fis
her
and
Lar
a(1
999)
,H
ynes
etal
.(2
005)
,Jar
man
(199
1),J
ohns
on(1
989)
,Mill
eret
al.(
2010
a),
Rud
d(1
994)
and
Sigg
etal
.(20
05)
Petr
ogal
eR
ock-
wal
laby
Noc
turn
al,s
olita
ryor
unim
ale
grou
ps,t
erri
tori
al
Mild
Soci
ally
mon
ogam
ous
(P.a
ssim
ilis
)to
poyl
gyno
us(P
.pen
cill
ata)
Haz
litte
tal.
(200
6)an
dSp
ence
ret
al.
(199
8)
Seto
nix
Quo
kka
Noc
turn
al,
Hie
rarc
hica
lSt
rong
Poly
gyno
usor
Prom
iscu
ous
McL
ean
etal
.(2
009)
and
McL
ean
and
Schm
itt(1
999)
Thy
loga
lePa
dem
elon
Mod
erat
eU
nkno
wn
Phal
ange
rida
eTr
icho
suru
sPo
ssum
Gro
up1
Noc
turn
al,s
olita
ryw
ithov
erla
ppin
gho
me
rang
es,
terr
itori
al
Mod
erat
ePo
lygy
nous
Stra
han
(200
2),
Tagg
arte
tal.
(199
8)an
dTa
ylor
etal
.(20
00)
a Rus
sell
(198
4)
18 E.J. Miller and C.A. Herbert
with several females, and polyandry is the reverse, whereby a single female mateswith several males (Wittenberger, 1981). Polygyny is common among marsupials,and is often linked to sexual size dimorphism (see Table 1.3). Male-biased sexualsize dimorphism is exhibited to varying degrees in all marsupial families exceptBettongia.
The influence that mating system and male reproductive skew has on variousmeasures of genetic diversity can be predicted using Chesser’s breeding-groupmodel (Cheeser, 1991a, b; Chesser et al., 1993; Sugg and Chesser, 1994), which usesbehavioural and ecological data to calculate the gene dynamics of social groups.Under any mating system, as the number of fathers increases, the levels of kinshipand genetic differentiation among groups decreases, and Ne is increased (Dobsonand Zinner, 2003). Species with a polygynous mating system often have malehierarchies to varying degrees (Clutton-Brock,1989) and reproductive success cantherefore be highly skewed (e.g. eastern grey kangaroos, Miller et al. (2010b)). Insuch cases, a potential strategy to maximise the Ne in captive populations would beto manipulate mating patterns by using a specific number of sires (Oyama et al.,2007) to maximise founder representation. When more males participate in breed-ing, such as in socially monogamous and promiscuous mating systems, the lowervariance in male reproductive success slows the rates of inbreeding, lowers the levelof relatedness within the population and increases the Ne (Frankham et al., 2002). Agood example of this is the greater bilby, in which the promiscuous mating system isbelieved to have contributed to the maintenance of genetic diversity in free-rangingcaptive breeding programs for this species (Miller et al., unpublished data).
This discussion then leads to the question: should animals be artificially pairedbased on genetic considerations or allowed to mate randomly? Mate choice playsan important evolutionary role, providing individuals the opportunity to choose thefittest individual to mate with, thereby passing on good genes to their offspringand increasing its chance of survival and successful reproduction. If a captive pop-ulation is genetically depauperate, then every effort should be made to retain themaximum amount of genetic variation, particularly if the species is conservationdependent and has limited genetic variation across all populations. This will likelyinvolve selective breeding of individual animals, unless the mating system encour-ages the retention of genetic diversity through limited male reproductive skew. If apopulation is genetically diverse, there is less need for specific pairings. But, giventhat captive conditions will likely alter the duration of a male’s reign of dominancethrough improved health and nutrition, artificial male turnover may be necessary toprevent inbreeding.
1.3 Captive Breeding Strategies to Maintain Genetic Diversity
The maintenance of genetic diversity is a central focus of captive breeding pro-grams, especially for conservation dependent species, as it provides the raw materialfor adaptive change, which is fundamental for the long-term sustainability of
1 Breeding and Genetic Management of Captive Marsupial Populations 19
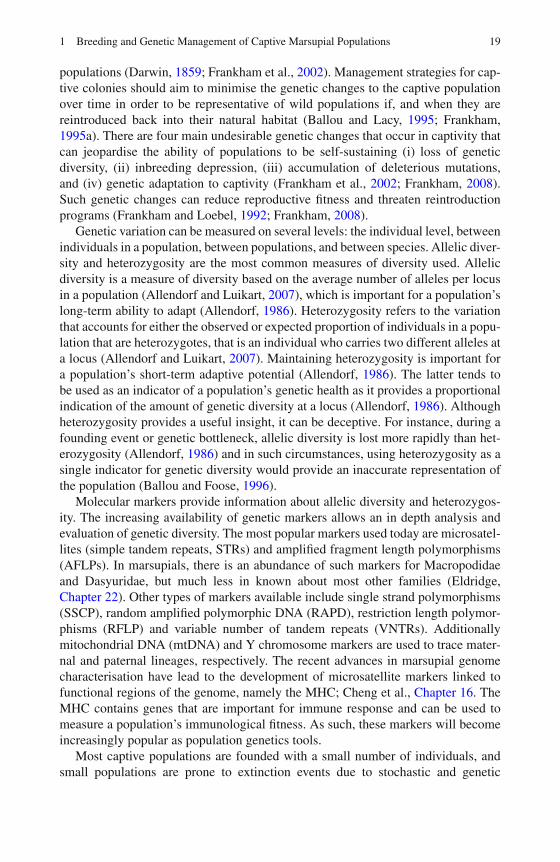
populations (Darwin, 1859; Frankham et al., 2002). Management strategies for cap-tive colonies should aim to minimise the genetic changes to the captive populationover time in order to be representative of wild populations if, and when they arereintroduced back into their natural habitat (Ballou and Lacy, 1995; Frankham,1995a). There are four main undesirable genetic changes that occur in captivity thatcan jeopardise the ability of populations to be self-sustaining (i) loss of geneticdiversity, (ii) inbreeding depression, (iii) accumulation of deleterious mutations,and (iv) genetic adaptation to captivity (Frankham et al., 2002; Frankham, 2008).Such genetic changes can reduce reproductive fitness and threaten reintroductionprograms (Frankham and Loebel, 1992; Frankham, 2008).
Genetic variation can be measured on several levels: the individual level, betweenindividuals in a population, between populations, and between species. Allelic diver-sity and heterozygosity are the most common measures of diversity used. Allelicdiversity is a measure of diversity based on the average number of alleles per locusin a population (Allendorf and Luikart, 2007), which is important for a population’slong-term ability to adapt (Allendorf, 1986). Heterozygosity refers to the variationthat accounts for either the observed or expected proportion of individuals in a popu-lation that are heterozygotes, that is an individual who carries two different alleles ata locus (Allendorf and Luikart, 2007). Maintaining heterozygosity is important fora population’s short-term adaptive potential (Allendorf, 1986). The latter tends tobe used as an indicator of a population’s genetic health as it provides a proportionalindication of the amount of genetic diversity at a locus (Allendorf, 1986). Althoughheterozygosity provides a useful insight, it can be deceptive. For instance, during afounding event or genetic bottleneck, allelic diversity is lost more rapidly than het-erozygosity (Allendorf, 1986) and in such circumstances, using heterozygosity as asingle indicator for genetic diversity would provide an inaccurate representation ofthe population (Ballou and Foose, 1996).
Molecular markers provide information about allelic diversity and heterozygos-ity. The increasing availability of genetic markers allows an in depth analysis andevaluation of genetic diversity. The most popular markers used today are microsatel-lites (simple tandem repeats, STRs) and amplified fragment length polymorphisms(AFLPs). In marsupials, there is an abundance of such markers for Macropodidaeand Dasyuridae, but much less in known about most other families (Eldridge,Chapter 22). Other types of markers available include single strand polymorphisms(SSCP), random amplified polymorphic DNA (RAPD), restriction length polymor-phisms (RFLP) and variable number of tandem repeats (VNTRs). Additionallymitochondrial DNA (mtDNA) and Y chromosome markers are used to trace mater-nal and paternal lineages, respectively. The recent advances in marsupial genomecharacterisation have lead to the development of microsatellite markers linked tofunctional regions of the genome, namely the MHC; Cheng et al., Chapter 16. TheMHC contains genes that are important for immune response and can be used tomeasure a population’s immunological fitness. As such, these markers will becomeincreasingly popular as population genetics tools.
Most captive populations are founded with a small number of individuals, andsmall populations are prone to extinction events due to stochastic and genetic
20 E.J. Miller and C.A. Herbert
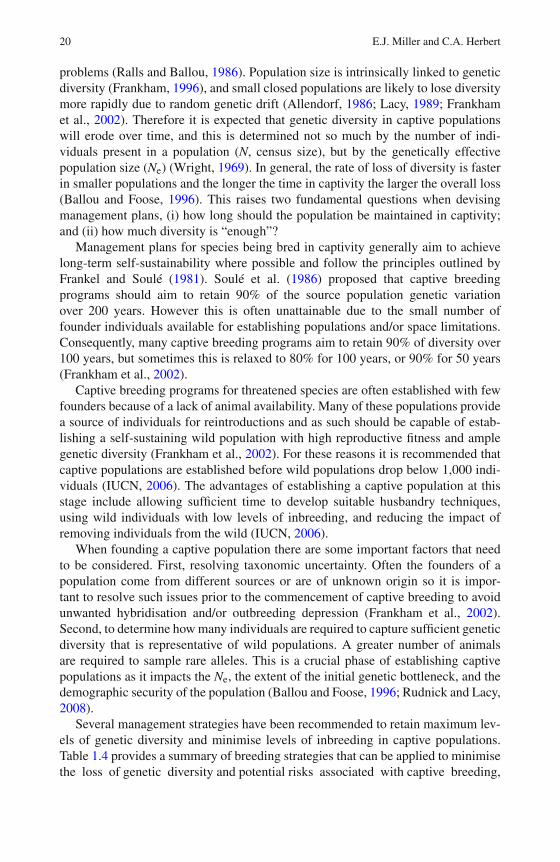
problems (Ralls and Ballou, 1986). Population size is intrinsically linked to geneticdiversity (Frankham, 1996), and small closed populations are likely to lose diversitymore rapidly due to random genetic drift (Allendorf, 1986; Lacy, 1989; Frankhamet al., 2002). Therefore it is expected that genetic diversity in captive populationswill erode over time, and this is determined not so much by the number of indi-viduals present in a population (N, census size), but by the genetically effectivepopulation size (Ne) (Wright, 1969). In general, the rate of loss of diversity is fasterin smaller populations and the longer the time in captivity the larger the overall loss(Ballou and Foose, 1996). This raises two fundamental questions when devisingmanagement plans, (i) how long should the population be maintained in captivity;and (ii) how much diversity is “enough”?
Management plans for species being bred in captivity generally aim to achievelong-term self-sustainability where possible and follow the principles outlined byFrankel and Soulé (1981). Soulé et al. (1986) proposed that captive breedingprograms should aim to retain 90% of the source population genetic variationover 200 years. However this is often unattainable due to the small number offounder individuals available for establishing populations and/or space limitations.Consequently, many captive breeding programs aim to retain 90% of diversity over100 years, but sometimes this is relaxed to 80% for 100 years, or 90% for 50 years(Frankham et al., 2002).
Captive breeding programs for threatened species are often established with fewfounders because of a lack of animal availability. Many of these populations providea source of individuals for reintroductions and as such should be capable of estab-lishing a self-sustaining wild population with high reproductive fitness and amplegenetic diversity (Frankham et al., 2002). For these reasons it is recommended thatcaptive populations are established before wild populations drop below 1,000 indi-viduals (IUCN, 2006). The advantages of establishing a captive population at thisstage include allowing sufficient time to develop suitable husbandry techniques,using wild individuals with low levels of inbreeding, and reducing the impact ofremoving individuals from the wild (IUCN, 2006).
When founding a captive population there are some important factors that needto be considered. First, resolving taxonomic uncertainty. Often the founders of apopulation come from different sources or are of unknown origin so it is impor-tant to resolve such issues prior to the commencement of captive breeding to avoidunwanted hybridisation and/or outbreeding depression (Frankham et al., 2002).Second, to determine how many individuals are required to capture sufficient geneticdiversity that is representative of wild populations. A greater number of animalsare required to sample rare alleles. This is a crucial phase of establishing captivepopulations as it impacts the Ne, the extent of the initial genetic bottleneck, and thedemographic security of the population (Ballou and Foose, 1996; Rudnick and Lacy,2008).
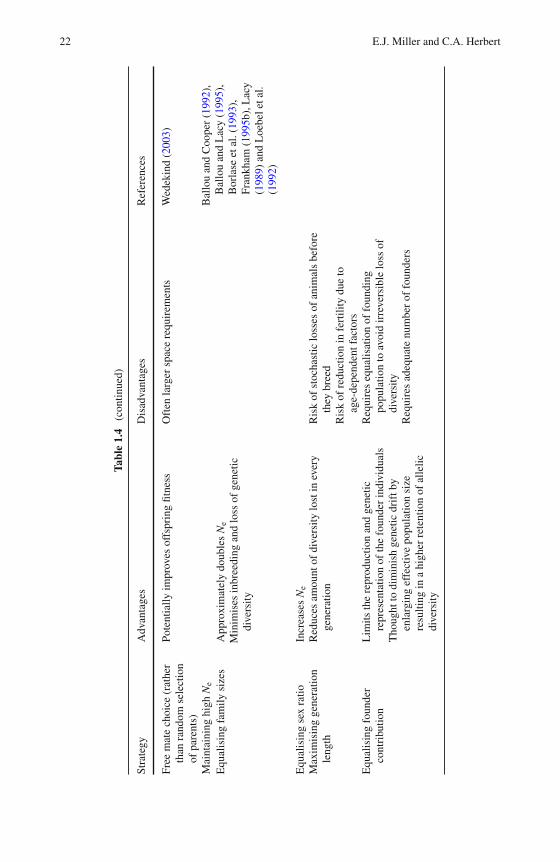
Several management strategies have been recommended to retain maximum lev-els of genetic diversity and minimise levels of inbreeding in captive populations.Table 1.4 provides a summary of breeding strategies that can be applied to minimisethe loss of genetic diversity and potential risks associated with captive breeding,
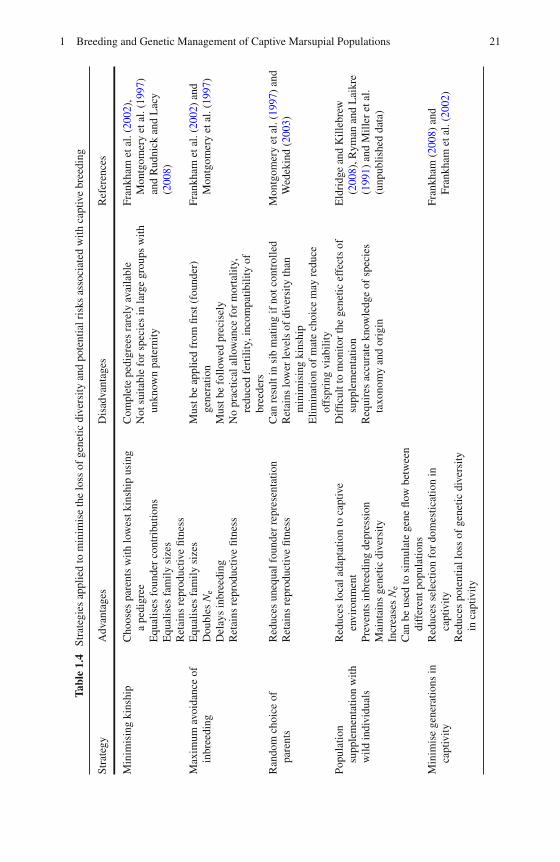
1 Breeding and Genetic Management of Captive Marsupial Populations 21
Tabl
e1.
4St
rate
gies
appl
ied
tom
inim
ise
the
loss
ofge
netic
dive
rsity
and
pote
ntia
lris
ksas
soci
ated
with
capt
ive
bree
ding
Stra
tegy
Adv
anta
ges
Dis
adva
ntag
esR
efer
ence
s
Min
imis
ing
kins
hip
Cho
oses
pare
nts
with
low
estk
insh
ipus
ing
ape
digr
eeE
qual
ises
foun
der
cont
ribu
tions
Equ
alis
esfa
mily
size
sR
etai
nsre
prod
uctiv
efit
ness
Com
plet
epe
digr
ees
rare
lyav
aila
ble
Not
suita
ble
for
spec
ies
inla
rge
grou
psw
ithun
know
npa
tern
ity
Fran
kham
etal
.(20
02),
Mon
tgom
ery
etal
.(19
97)
and
Rud
nick
and
Lac
y(2
008)
Max
imum
avoi
danc
eof
inbr
eedi
ngE
qual
ises
fam
ilysi
zes
Dou
bles
Ne
Del
ays
inbr
eedi
ngR
etai
nsre
prod
uctiv
efit
ness
Mus
tbe
appl
ied
from
first
(fou
nder
)ge
nera
tion
Mus
tbe
follo
wed
prec
isel
yN
opr
actic
alal
low
ance
for
mor
talit
y,re
duce
dfe
rtili
ty,i
ncom
patib
ility
ofbr
eede
rs
Fran
kham
etal
.(20
02)
and
Mon
tgom
ery
etal
.(19
97)
Ran
dom
choi
ceof
pare
nts
Red
uces
uneq
ualf
ound
erre
pres
enta
tion
Ret
ains
repr
oduc
tive
fitne
ssC
anre
sult
insi
bm
atin
gif
notc
ontr
olle
dR
etai
nslo
wer
leve
lsof
dive
rsity
than
min
imis
ing
kins
hip
Elim
inat
ion
ofm
ate
choi
cem
ayre
duce
offs
prin
gvi
abili
ty
Mon
tgom
ery
etal
.(19
97)
and
Wed
ekin
d(2
003)
Popu
latio
nsu
pple
men
tatio
nw
ithw
ildin
divi
dual
s
Red
uces
loca
lada
ptat
ion
toca
ptiv
een
viro
nmen
tPr
even
tsin
bree
ding
depr
essi
onM
aint
ains
gene
ticdi
vers
ityIn
crea
ses
Ne
Can
beus
edto
sim
ulat
ege
neflo
wbe
twee
ndi
ffer
entp
opul
atio
ns
Dif
ficul
tto
mon
itor
the
gene
ticef
fect
sof
supp
lem
enta
tion
Req
uire
sac
cura
tekn
owle
dge
ofsp
ecie
sta
xono
my
and
orig
in
Eld
ridg
ean
dK
illeb
rew
(200
8),R
yman
and
Lai
kre
(199
1)an
dM
iller
etal
.(u
npub
lishe
dda
ta)
Min
imis
ege
nera
tions
inca
ptiv
ityR
educ
esse
lect
ion
for
dom
estic
atio
nin
capt
ivity
Red
uces
pote
ntia
llos
sof
gene
ticdi
vers
ityin
capt
ivity
Fran
kham
(200
8)an
dFr
ankh
amet
al.(
2002
)
22 E.J. Miller and C.A. Herbert
Tabl
e1.
4(c
ontin
ued)
Stra
tegy
Adv
anta
ges
Dis
adva
ntag
esR
efer
ence
s
Free
mat
ech
oice
(rat
her
than
rand
omse
lect
ion
ofpa
rent
s)
Pote
ntia
llyim
prov
esof
fspr
ing
fitne
ssO
ften
larg
ersp
ace
requ
irem
ents
Wed
ekin
d(2
003)
Mai
ntai
ning
high
Ne
Bal
lou
and
Coo
per
(199
2),
Bal
lou
and
Lac
y(1
995)
,B
orla
seet
al.(
1993
),Fr
ankh
am(1
995b
),L
acy
(198
9)an
dL
oebe
leta
l.(1
992)
Equ
alis
ing
fam
ilysi
zes
App
roxi
mat
ely
doub
les
Ne
Min
imis
esin
bree
ding
and
loss
ofge
netic
dive
rsity
Equ
alis
ing
sex
ratio
Incr
ease
sN
eM
axim
isin
gge
nera
tion
leng
thR
educ
esam
ount
ofdi
vers
itylo
stin
ever
yge
nera
tion
Ris
kof
stoc
hast
iclo
sses
ofan
imal
sbe
fore
they
bree
dR
isk
ofre
duct
ion
infe
rtili
tydu
eto
age-
depe
nden
tfac
tors
Equ
alis
ing
foun
der
cont
ribu
tion
Lim
itsth
ere
prod
uctio
nan
dge
netic
repr
esen
tatio
nof
the
foun
der
indi
vidu
als
Tho
ught
todi
min
ish
gene
ticdr
iftb
yen
larg
ing
effe
ctiv
epo
pula
tion
size
resu
lting
ina
high
erre
tent
ion
ofal
lelic
dive
rsity
Req
uire
seq
ualis
atio
nof
foun
ding
popu
latio
nto
avoi
dir
reve
rsib
lelo
ssof
dive
rsity
Req
uire
sad
equa
tenu
mbe
rof
foun
ders
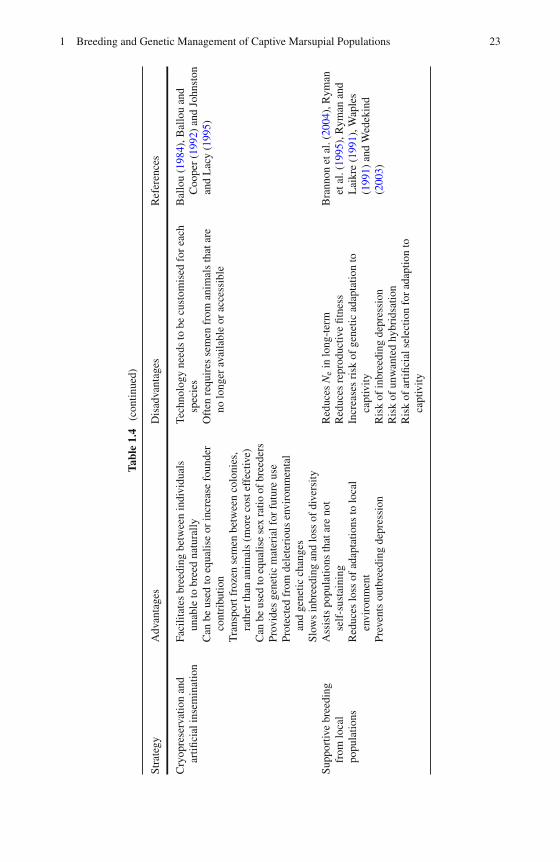
1 Breeding and Genetic Management of Captive Marsupial Populations 23
Tabl
e1.
4(c
ontin
ued)
Stra
tegy
Adv
anta
ges
Dis
adva
ntag
esR
efer
ence
s
Cry
opre
serv
atio
nan
dar
tifici
alin
sem
inat
ion
Faci
litat
esbr
eedi
ngbe
twee
nin
divi
dual
sun
able
tobr
eed
natu
rally
Can
beus
edto
equa
lise
orin
crea
sefo
unde
rco
ntri
butio
nT
rans
port
froz
ense
men
betw
een
colo
nies
,ra
ther
than
anim
als
(mor
eco
stef
fect
ive)
Can
beus
edto
equa
lise
sex
ratio
ofbr
eede
rsPr
ovid
esge
netic
mat
eria
lfor
futu
reus
ePr
otec
ted
from
dele
teri
ous
envi
ronm
enta
lan
dge
netic
chan
ges
Slow
sin
bree
ding
and
loss
ofdi
vers
ity
Tech
nolo
gyne
eds
tobe
cust
omis
edfo
rea
chsp
ecie
sO
ften
requ
ires
sem
enfr
oman
imal
sth
atar
eno
long
erav
aila
ble
orac
cess
ible
Bal
lou
(198
4),B
allo
uan
dC
oope
r(1
992)
and
John
ston
and
Lac
y(1
995)
Supp
ortiv
ebr
eedi
ngfr
omlo
cal
popu
latio
ns
Ass
ists
popu
latio
nsth
atar
eno
tse
lf-s
usta
inin
gR
educ
eslo
ssof
adap
tatio
nsto
loca
len
viro
nmen
tPr
even
tsou
tbre
edin
gde
pres
sion
Red
uces
Ne
inlo
ng-t
erm
Red
uces
repr
oduc
tive
fitne
ssIn
crea
ses
risk
ofge
netic
adap
tatio
nto
capt
ivity
Ris
kof
inbr
eedi
ngde
pres
sion
Ris
kof
unw
ante
dhy
brid
satio
nR
isk
ofar
tifici
alse
lect
ion
for
adap
tion
toca
ptiv
ity
Bra
nnon
etal
.(20
04),
Rym
anet
al.(
1995
),R
yman
and
Lai
kre
(199
1),W
aple
s(1
991)
and
Wed
ekin
d(2
003)
24 E.J. Miller and C.A. Herbert
such as adaptation to captivity. The most widely applied method is minimising kin-ship (Rudnick and Lacy, 2008). This strategy aims to reduce the overall kinshipof a population by managing pedigreed populations so that the matings are madebetween individuals that are the most distantly related in the population. Simulations(Ballou and Lacy, 1995; Fernandez et al., 2004) and empirical data (Montgomeryet al., 1997) provide evidence that this is the most effective strategy for maintaininggenetic diversity (Rudnick and Lacy, 2008).
Captive breeding programs are often managed through pedigrees that are main-tained in studbooks (Hedrick and Millar, 1992). Studbooks assist in minimisingkinship among individuals, maintaining the representation of wild founder geneticdiversity as well as providing a tool for assessing the genetic health of a populationbased on demographic data. The basic data that should be recorded for every indi-vidual includes animal identification, sex, parentage, birth and death dates, as wellas animal movements (Ballou and Foose, 1996). The calculation of kinship valuesfor captive breeding programs depends on a population’s pedigree. These calcula-tions are only effective when the relationships among individuals in a population areaccurately known (Hedrick and Kalinowski, 2000; Nielsen et al., 2007; Rudnick andLacy, 2008). Unfortunately all pedigrees have some level of uncertainty, especiallysince many were established during the early days of captive breeding when recordswere not always consistently maintained (Rudnick and Lacy, 2008). Errors in stud-book estimates of the “genetic health” of a population can arise due to missing orerroneous pedigree data. For example, estimates of genetic diversity and inbreed-ing were calculated from 5 years of studbook (pedigree) data and compared to thosecalculated from microsatellite data to assess studbook reliability for a captive breed-ing colony of the greater bilby (Macrotis lagotis). This study found that studbookgenetic estimates did not accurately reflect the microsatellite estimates of diversity,suggesting they should not be solely relied upon to evaluate the genetic health of thecaptive populations (Miller et al., unpublished data).
To improve the concordance between studbook and genetic estimates of diver-sity, institutions need to maintain more complete pedigree records. Validation ofthe “founder assumption” of individuals being unrelated and not inbred (Ballou,1984), should be prioritised when there are limited resources available. Geneticanalyses of parentage can help resolve questions regarding individual relationshipswithin a population, and verify pedigrees. Accurate parentage data is essential forwildlife managers when making decisions regarding the pairing of individuals formating and the transfer of individuals among institutions. The widespread applica-tion of genetic techniques has revealed inconsistencies in the presumed relationshipbetween social organisation, parentage and mating system (Ambs et al., 1999;Coltman et al., 1999; Worthington Wilmer et al., 1999; Issac, 2005), transforminghow mating systems are understood.
A significant biological problem associated with captive breeding is that eachcolony represents a small, fragmented population (Ballou and Foose, 1996) andtherefore has a reduced probability of long-term survival (Frankham, 1995a). Geneflow needs to be resurrected between populations, by allowing for the introduc-tion of “immigrants” and mutation (Ballou, 1984). Often animals are translocated
1 Breeding and Genetic Management of Captive Marsupial Populations 25
between institutions to simulate gene flow. Introducing new genotypes into a pop-ulation in this way can also help alleviate the effects of inbreeding and loss ofheterozygosity (Spielman and Frankham, 1992; Bryant et al., 1999) in a form of“genetic rescue” (Hedrick, 1995; 2000; Hedrick, 2005; Hedrick and Fredrickson,2008). However this is costly, there is a level of stress involved for the animals,potential risk of disease transfer and sometimes problems of acceptance into pop-ulations, particularly if the species is highly territorial. The genetic advantages oftranslocating animals between institutions must therefore be weighed up againstthese other potentially negative consequences (Tallmon et al., 2004).
1.4 Case Study: Management of a Research Colony of a ModelMarsupial (Macropus eugenii)
The management of a tammar wallaby research colony, housed at the University ofNew South Wales field station in the north of Sydney, Australia, will be used to illus-trate the complex interplay between intrinsic and extrinsic factors and their influenceon the maintenance of genetic diversity in a captive marsupial colony. As the tam-mar wallaby is a model macropodid marsupial that has been extensively studiedover the last 50 years, their reproductive biology has been well-characterised, whichprovides valuable baseline information for the management of captive colonies ofthis species.
The principal strategies employed to maintain genetic diversity include an initiallarge founder size (> 100 animals) with occasional supplementation of wild ani-mals (n = 30–80 every 4 years) into the population. This degree of supplementationis feasible given the large population present on Kangaroo Island (SA), which iscurrently managed by annual population harvesting (Wright and Stott, 1999), andthe ease with which this (sub)species adapts to captive conditions. Sexually maturemales are rotated every breeding season to maximise the potential for females tobreed with numerous males throughout their lifetime. Females are, however, givensome degree of mate-choice, with most enclosures housing multiple males, usuallyat a ratio of one male to four–eight females. Based on our knowledge of the matingsystem of the tammar wallaby, the dominant male on average will sire approxi-mately 50% of young (Hynes et al., 2005; Miller et al., 2010a), so subordinate maleswill have some capacity for breeding.
Prevention of inbreeding is enhanced by knowledge of the reproductive biol-ogy of this species and careful attention to the timing of reproductive events.Female tammar wallabies will undergo a post-partum mating, usually within 1 hof giving birth (Rudd, 1994), and the resultant blastocyst will remain in embry-onic diapause for up to 11 months (Berger, 1966). Hence, any young born as aresult of blastocyst reactivation triggered by the summer solstice will have beenconceived in the previous breeding season. Paternity records need to reflect this toprevent subsequent pairing of related individuals. If paternity is unknown, the largesuite of microsatellilte markers available for this species (see Eldridge, Chapter 22)should be utilised to confirm paternity. Maternity should also be confirmed by
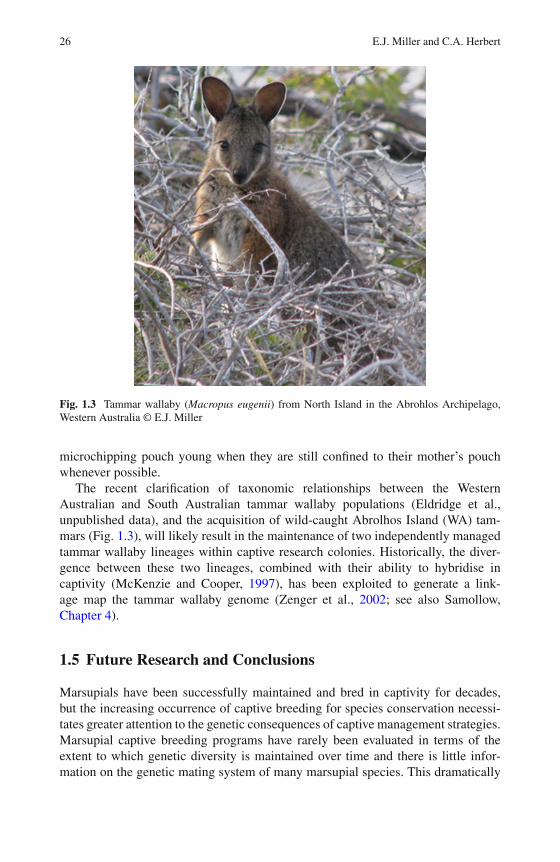
26 E.J. Miller and C.A. Herbert
Fig. 1.3 Tammar wallaby (Macropus eugenii) from North Island in the Abrohlos Archipelago,Western Australia © E.J. Miller
microchipping pouch young when they are still confined to their mother’s pouchwhenever possible.
The recent clarification of taxonomic relationships between the WesternAustralian and South Australian tammar wallaby populations (Eldridge et al.,unpublished data), and the acquisition of wild-caught Abrolhos Island (WA) tam-mars (Fig. 1.3), will likely result in the maintenance of two independently managedtammar wallaby lineages within captive research colonies. Historically, the diver-gence between these two lineages, combined with their ability to hybridise incaptivity (McKenzie and Cooper, 1997), has been exploited to generate a link-age map the tammar wallaby genome (Zenger et al., 2002; see also Samollow,Chapter 4).
1.5 Future Research and Conclusions
Marsupials have been successfully maintained and bred in captivity for decades,but the increasing occurrence of captive breeding for species conservation necessi-tates greater attention to the genetic consequences of captive management strategies.Marsupial captive breeding programs have rarely been evaluated in terms of theextent to which genetic diversity is maintained over time and there is little infor-mation on the genetic mating system of many marsupial species. This dramatically
1 Breeding and Genetic Management of Captive Marsupial Populations 27
limits our ability to effectively manage these populations for long term species con-servation and reintroduction goals. If captive breeding is to contribute significantlyto both in situ and ex situ marsupial conservation then genetic considerations areparamount. The recent dramatic decline of the Tasmanian devil is a prime exampleof the potentially disastrous consequences that loss of genetic diversity can have atboth a population and species level. More research is urgently needed to charac-terise marsupial mating systems and to evaluate the genetic consequences of captivebreeding strategies in the context of specific mating systems.
Glossary
Chorioallantoic placenta an enveloping vascular fetal membrane formed by thefusion of chorion and allantois.
Corpus luteum is a temporary structure in mammals that develops from theruptured ovarian follicle after ovulation and is involved in the production ofprogesterone.
Follicular phase phase of the oestrous cycle during which follicles in the ovarymature, secreting increasing amounts of oestradiol as maturation progresses.
Luteal phase the latter phase of the oestrous cycle when the corpus luteum isactively producing progesterone.
Monoestrous animals display one oestrous cycle within a breeding season.
Monovular ovulation of a single ovum.
Polyoestrous animals display multiple oestrous cycles within a breeding season.
Polyovular ovulation of more than one ovum during oestrus.
References
Allendorf FW (1986) Genetic drift and the loss of alleles versus heterozygosity. Zoo Biol 5:181–190.
Allendorf FW, Luikart G (2007) Conservation and the Genetics of Populations. BlackwellPublishing, Malden, MA.
Ambs SM, Boness DJ, Bowen WD, Perry EA, Fleischer RC (1999) Proximate factors associatedwith high levels of extraconsort fertilisation in polygynous grey seals. Anim Behav 58:527–535.
Andersson M (1994) Sexual Selection. Princeton University Press, Princeton, NJ.Ashman RB (1977) Marsupial immunology: a brighter future? Dev Comp Immunol 1:283–284.Ballantyne K, Matson P, Noakes N, Nicolson V, Johnson SD (2009) Reproductive physiology of
the female greater bilby (Macrotis lagotis Thylacomyidae): evidence for a male-induced lutealphase. Reprod Fert Dev 21:274–282.
Ballou JD (1984) Strategies for maintaining genetic diversity through reproductive technology.Zoo Biol 3:311–323.
Ballou JD, Cooper KA (1992) Application of biotechniology to captive breeding of endangeredspecies. Sym Zool S 64:183–296.
28 E.J. Miller and C.A. Herbert
Ballou JD, Foose TJ (1996) Demographic and genetic management of captive populations. In:Kleiman DG (ed) Wild Mammals in Captivity. Chicago University Press, Chicago, IL.
Ballou JD, Lacy RC (1995) Identifying genetically important individuals for management ofgenetic variation in pedigreed populations. In: Ballou JD, Gilpin M, Foose T (eds) PopulationManagement for Survival and Recovery. Columbia University Press, New York, NY.
Belov K, Deakin JE, Papenfuss AT, et al. (2006) Reconstructing an ancestral mammalian immunesupercomplex from a marsupial major histocompatibility complex. PLoS Biol 4:317–328.
Bercovitch FB, Tobey JR, Andrus CH, Doyle L (2006) Mating patterns and reproductive successin captive koalas (Phascolarctos cinereus). J Zool 270:512–516.
Berger PJ (1966) Eleven-month “embryonic diapause” in a marsupial. Nature 211:435–436.Borlase SC, Loebel DA, Frankham R, Nurthen RK, Briscoe DA, Daggard GE (1993) Modeling
problems in conservation genetics using captive Drosophila populations: effects of equalisingfamily sizes. Conserv Biol 7:122–131.
Brannon EL, Amend DF, Cronin MA, et al. (2004) The controversy about salmon hatcheries.Fisheries 29:12–31.
Bryant EH, Backus VL, Clark ME, Reed DH (1999) Experimental tests of captive breeding forendangered species. Conserv Biol 13:1487–1496.
Caughley G (1987) Introduction to the sheep rangelands. In: Caughley G, Shepherd N, Short J (eds)Kangaroos: Their Ecology and Management in the Sheep Rangelands of Australia. CambridgeUniversity Press, Cambridge, MA.
Cheeser RK (1991a) Gene diversity and female philopatry. Genetics 127:437–447.Cheeser RK (1991b) Influence of gene flowand breeding tactics on gene diveristy within
populations. Genetics 129:573–583.Chesser RK, Rhoades OE, Sugg DW, Schnabel A (1993) Effective sizes for subdivided popula-
tions. Genetics 135:1221–1232.Clutton-Brock TH (1989) Mammalian mating systems. P Roy Soc Lond B Bio 236:339–372.Coltman DW, Bancroft DR, Robertson A, Smith JA, Clutton-Brock TH (1999) Male reproductive
success in a promiscuous mammal: behavioural estimates compared with genetic paternity. MolEcol 8:1199–1209.
Croft DB (1981) Behaviour of the red kangaroo, Macropus rufus (Desmarest, 1822) in north-western New South Wales. Aust Mammal 5:5–13.
Darwin C (1859) On the Origin of Species by Means of Natural Selection. John Murray, London.Deakin JE, Papenfuss AT, Belov K, et al. (2006) Evolution and comparative analysis of the MHC
Class III inflammatory region. BMC Genomics 7:281–295.Dobson FS, Zinner B (2003) Social groups, genetic structure and conservation. In: Festa-
Bianchet M, Apollonio M (eds) Animal Behaviour and Wildlife Conservation. Island Press,Washington.
Eldridge W, Killebrew K (2008) Genetic diversity over multiple generations of supplementation:an example from Chinook salmon using microsatellite and demographic data. Conserv Genet9:13–28.
Fadem BH (1985) Evidence for the activation of female reproduction by males in a marsupial, thegray short-tailed opossum (Monodelphis domestica). Biol Reprod 33:112–116.
Fernandez J, Toro MA, Caballero A (2004) Managing individuals’ contributions to maximize theallelic diversity maintained in small, conserved populations. Conserv Biol 18:1358–1367.
Fisher DO, Lara MC (1999) Effects of body size and home range on access to mates and paternityin male bridled nailtail wallabies. Anim Behav 58:121–130.
Fisher DO, Owens IPF, Johnson CN (2001) The ecological basis of life history variation inmarsupials. Ecology 82:3531–3540.
Frankel OH, Soulé ME (1981) Conservation and Evolution. Cambridge University Press,Cambridge, MA.
Frankham R (1995a) Conservation genetics. Annu Rev Genet 29:305–327.Frankham R (1995b) Effective population size/adult population size ratios in wildlife: a review.
Genet Res 66:95–107.
1 Breeding and Genetic Management of Captive Marsupial Populations 29
Frankham R (1996) Relationship of genetic variation to population size in wildlife. Conserv Biol10:1500–1508.
Frankham R (2008) Genetic adaptation to captivity in species conservation programs. Mol Ecol17:325–333.
Frankham R, Ballou JD, Briscoe DA (2002) Introduction to Conservation Genetics. CambridgeUniversity Press, Cambridge, MA.
Frankham R, Loebel DA (1992) Modeling problems in conservation genetics using captiveDrosophila populations: rapid genetic adaptation to captivity. Zoo Biol 11:333–342.
George GG (1990) Monotreme and marsupial breeding programs in Australian zoos. Aust J Zool37:181–205.
Glen AS, Cardoso MJ, Dickman CR, Firestone KB (2009) Who’s your daddy? Paternity testingreveals promiscuity and multiple paternity in the carnivorous marsupial Dasyurus maculatus(Marsupialia: Dasyuridae). Biol J Linn Soc 96:1–7.
Graves JA, Hesterman M (2002) Marsupial genetics and gemonics. Trends Genet 18:517–521.Handasyde KA, McDonald R, Than KA, Michaelides J, Martin RW (1990) Reproductive hormones
and reproduction in the koala. In: Lee AK, Handasyde KA, Sanson GD (eds) Biology of theKoala. Surrey Beatty and Sons, Sydney.
Hazlitt SL, Sigg DP, Eldridge MDB, Goldizen AW (2006) Restricted mating dispersal and strongbreeding group structure in a mid-sized marsupial mammal (Petrogale penicillata). Mol Ecol15:2997–3007.
Hedrick PW (1995) Gene flow and genetic restoration: the Florida panther as a case study. ConservBiol 9:996–1007.
Hedrick PW (2000) Genetics of Populations, 2nd edn. Jones and Bartlett, Sudbury.Hedrick P (2005) ‘Genetic restoration’: a more comprehensive perspective than ‘genetic rescue’.
Trends Ecol Evol 20:489–496.Hedrick PW, Fredrickson RJ (2008) Captive breeding and the reintroduction of Mexican and red
wolves. Mol Ecol 17:344–350.Hedrick PW, Kalinowski ST (2000) Inbreeding depression in conservation biology. Annu Rev Ecol
Syst 31:139–162.Hedrick PW, Millar JS (1992) Conservation genetics techniques and fundamentals. Ecol Appl
2:30–46.Holleley CE, Dickman CR, Crowther MS, Oldroyd BP (2006) Size breeds success: multiple pater-
nity, multivariate selection and male semelparity in a small marsupial, Antechinus stuartii. MolEcol 15:3439–3448.
Hope RM (1993) Selected features of marsupial genetics. Genetica 90:165–180.Hutchins M, Roberts M, Cox C, Crotty MJ (1998) Marsupials and monotremes: a case study in
regional planning collection. Zoo Biol 17:433–451.Hynes EF, Rudd CD, Temple-Smith PD, Sofronidis G, Paris D, Shaw G, Renfree MB (2005)
Mating sequence, dominance and paternity success in captive male tammar wallabies.Reproduction 130:123–130.
IUCN (2006) 2006 IUCN Red List of Threatened Species. Retrieved 26 November 2009, fromwww.iucnredlist.org
Issac JL (2005) Potential causes and life-history consequences of sexual size dimorphism inmammals. Mammal Rev 35:101–115.
Jarman PJ (1991) Social behaviour and organisation in the Macropodoidea. Adv Study Behav20:1–37.
Johnson CN (1989) Social interactions and reproductive tactics in red-necked wallabies (Macropusrufogriseus banksianus). J Zool 217:267–280.
Johnson CN, Johnson KA (1983) Behaviour of the bilby, Macrotis lagotis (Reid), (Marsupialia,Thylacomyidae) in captivity. Aust Wildlife Res 10:77–87.
Johnson SD, McGowan MR, O’Callaghan PO, Cox R, Nicolson V (2000) Studies of the oestrouscycle, oestrus and pregnancy in the koala (Phascolarctos cinereus). J Reprod Fert 120:49–57.
30 E.J. Miller and C.A. Herbert
Johnston LA, Lacy RC (1995) Genome resource banking for species conservation:selection ofsperm donors. Cryobiology 32:68–77.
Kraaijeveld-Smit FJL, Ward SJ, Temple-Smith PD (2003) Paternity success and the direction ofsexual selection in a field population of a semelparous marsupial, Antechinus agilis. Mol Ecol12:475–484.
Kraaijeveld-Smit FJL, Ward SJ, Temple-Smith PD, Paetkau D (2002) Factors influencing pater-nity success in Antechinus agilis: last-male sperm precedence, timing of mating and geneticcompatibility. J Evol Biol 15:100–107.
Lacy RC (1989) Analysis of founder representation in pedigrees: founder equivalents and foundergenome equivalents. Zoo Biol 8:111–123.
Lee AK, Cockburn A (1985) The Evolutionary Ecology of Marsupials. Cambridge UniversityPress, Cambridge, MA.
Loebel DA, Nurthen RK, Frankham R, Briscoe DA, Craven D (1992) Modeling problemsin conservation genetics using Drosophila populations: consequences of equalising founderrepresentation. Zoo Biol 11:319–332.
McKenzie LM, Cooper DW (1997) Hybridisation between tammar wallaby (Macropus eugenii)populations from Western and South Australia. Heredity 88:398–400.
McLean IG, Cameron EZ, Linklater WL, Schmitt NT, Pulskamp KSM (2009) Partnerships in thesocial system of a small macropod marsupial, the quokkas (Setonix brachyurus). Behaviour146:89–112.
McLean IG, Schmitt NT (1999) Copulatory behaviour in the quokka, Setonix brachyurus. AustMammal 21:139–142.
Mikkelsen TS, Wakefield MJ, Aken B, et al. (2007) Genome of the marsupial Monodelphisdomestica reveals innovation in non-coding sequences. Nature 447:167–177.
Miller EJ, Eldridge MDB, Herbert CA (2010a) Dominance and paternity in the tammar wal-laby (Macropus eugenii). In: Coulson G, Eldridge MDB (eds) Macropods: The Biology ofKangaroos, Wallabies and Rat-Kangaroos. CSIRO Publishing, Melbourne, pp. 77–86.
Miller EJ, Eldridge MDB, Cooper DW, Herbert CA (2010b) Dominance, body size and inter-nal relatedness influence male reproductive success in eastern grey kangaroos (Macropusgiganteus). Reprod Fert Dev 22(3):539–549.
Montgomery ME, Ballou JD, Nurthen RK, England PR, Briscoe DA, Frankham R (1997)Minimizing kinship in captive breeding programs. Zoo Biol 16:377–389.
Myers N, Knoll AH (2001) The biotic crisis and the future of evolution. Proc Natl Acad Sci USA98:5389–5392.
Nielsen RK, Pertoldi C, Loeschcke V (2007) Genetic evaluation of the captive breeding programof the Persian wild ass. J Zool 272:349–357.
Nunney L (1991) The influence of age structure and fecundity on effective population size. ProcRoy Soc Lond B Biol Sci 246:71–76.
Nunney L (1993) The influence of mating system and overlapping generations on effectivepopulation size. Evolution 47:1329–1341.
Nunney L, Elam DR (1994) Estimating the effective population size of conserved populations.Conserv Biol 8:175–184.
Oyama K, Nojima M, Shojo M, Fukushima M, Anada K, Mukai F (2007) Effect of sire matingpatterns on future genetic merit and inbreeding in a closed beef cattle population. J Anim BreedGenet 124:73–80.
Pope LC, Blair D, Johnson CN (2005) Dispersal and population structure of the rufous bettong,Aepyprymnus rufescens (Marsupialia: Potoroidae). Austral Ecol 30:572–580.
Ralls K, Ballou J (1986) Captive breeding programs for populations with a small number offounders. Trends Ecol Evol 1:19–22.
Reed DH, Frankham R (2003) Correlation between fitness and genetic diversity. Conserv Biol17:230–237.
Renfree MB (1979) Initiation of development of diapausing embryo by mammary denervationduring lactation in a marsupial. Nature 278:549–551.
1 Breeding and Genetic Management of Captive Marsupial Populations 31
Renfree MB (1993) Endocrinology of pregnancy, parturition and lactation in marsupials. In:Lamming GE (ed) Marshall’s Physiology of Reproduction. Chapman and Hall, London.
Renfree MB, Shaw G (2000) Diapause. Annu Rev Physiol 62:353–375.Rudd CD (1994) Sexual behaviour of male and female tammar wallabies (Macropus eugenii) at
post-partum oestrus. J Zool 232:151–162.Rudnick JA, Lacy RC (2008) The impact of assumptions about founder relationships on the
effectiveness of captive breeding strategies. Conserv Genet 9:1439–1450.Russell EM (1984) Social behaviour and social organization of marsupials. Mammal Rev 14:
101–154.Ryman N, Jorde PE, Laikre L (1995) Supportive breeding and variance in effective population size.
Conserv Biol 9:1619–1628.Ryman N, Laikre L (1991) Effects of supportive breeding on the genetically effective population
size. Conserv Biol 5:325–329.Sadlier RM, Tyndale-Biscoe CH (1977) Photoperiod and the termination of embryonic diapause
in the marsupial Macropus eugenii. Biol Reprod 16:605–608.Sharman GB, Calaby JH, Poole WE (1966) Patterns of reproduction in female diprotodont mar-
supials. In: Rowlands IW (ed) Comparative Biology of Reproduction in Mammals. AcademicPress, London.
Shaw G, Rose RW (1978) Delayed gestation in the Potoroo Potorous tridactylus (Kerr). Aust JZool 27:901–912.
Siddle HV, Kreiss A, Eldridge MDB, et al. (2007) Transmission of a fatal clonal tumor by bitingoccurs due to depleted MHC diversity in a threatened carnivorous marsupial. Proc Natl AcadSci USA 104:16221–16226.
Sigg DP, Goldizen AW, Pople AR (2005) The importance of mating system in translocationprograms: reproductive success of released male bridled nailtail wallabies. Biol Conserv123:289–300.
Soulé ME, Gilpin M, Conway W, Foose T (1986) The millennium ark: how long a voyage, howmany staterooms, how many passengers? Zoo Biol 5:101–113.
Spencer PBS, Horsup AB, Marsh HD (1998) Enhancement of reproductive success throughmate choice in a social rock-wallaby, Petrogale assimilis (Macropodidiae) as revealed bymicrosatellite markers. Behav Ecol Sociobiol 43:1–9.
Spielman D, Frankham R (1992) Modeling problems in conservation genetics using captiveDrosophila popualations: improvement of reproductive fitness due to immigration of oneindividuals into small partially inbred populations. Zoo Biol 11:343–351.
Stead-Richardson E, Bradshaw D, Friend T, Fletcher T (2010) Monitoring reproduction inthe critically endangered marsupial, Gilbert’s potoroo (Potorous gilbertii): Preliminaryanalysis of faecal oestradiol-17b, cortisol and progestagens. Gen Comp Endocr 165(1):155–162.
Strahan R (2002) The Mammals of Australia. Reed New Holland, SydneySugg DW, Chesser RK (1994) Effective population sizes with multiple paternity. Genetics
137:1147–1155.Taggart DA, Breed WA, Temple-Smith PD, Purvis A, Shimmin G (1998) Reproduction, mating
strategies and sperm competition marsupials and monotremes. In: Birkhead TR, Møller AP(eds) Sperm Competition and Sexual Selection. Academic Press, London.
Tallmon DA, Luikart G, Waples RS (2004) The alluring simplicity and complex reality of geneticrescue. Trends Ecol Evol 19:489–496.
Taylor AC, Cowan PE, Fricke BL, Cooper DW (2000) Genetic analysis of the mating system ofthe common brushtail possum (Trichosurus vulpecula) in New Zealand farmland. Mol Ecol9:869–879.
TDSC (2007) Insurance Population Strategy. Save the Tasmanian Devil Steering Committee.Tyndale-Biscoe CH (2005) Life of Marsupials. CSIRO Publishing, Collingwood.Tyndale-Biscoe CH, Hearn JP, Renfree MB (1974) Control of reproduction in macropodid
marsupials. J Endocrinol 63:589–614.
32 E.J. Miller and C.A. Herbert
Tyndale-Biscoe CH, Janssens PA (1988) The Developing Marsupial: Models for BiomedicalResearch. Springer, Heidelberg.
Tyndale-Biscoe CH, Renfree MB (1987) Reproductive Physiology of Marsupials. CambridgeUniversity Press, Cambridge, MA.
Tyrell J (2001) The reproductive biology of the female Southern Hairy-nosed Wombat, Lasiorhinuslatifrons. Melbourne University, Victoria.
Waples RS (1991) Pacific salmon, oncorhynchus spp., and the definition of “species” under theendangered species act. Mar Fish Rev 53:11.
Wedekind C (2003) Pathogen-driven sexual selection for “good genes” versus genetic variabilityin small populations. In: Bianchet-Festa M, Apollonio M (eds) Animal Behaviour and WildlifeConservation. Island Press, Washington.
Wittenberger JF (1979) The evolution of mating systems in birds and mammals. In: Marler P,Vandenbergh JG (eds) Handbook of Behavioral Neurobiology. Plenum, New York, NY.
Wittenberger JF (1981) Animal Social Behaviour. Duxbury Press, Boston, MA.Worthington Wilmer J, Allen PJ, Pomeroy PP, Twiss SD, Amos W (1999) Where have all the
fathers gone? An extensive microsatellite analysis of paternity in the grey seal (Halichoerusgrypus). Mol Ecol 8:1417–1429.
Wright S (1969) Evolution and the Genetics of Populations: The Theory of Gene Frequencies.University of Chicago Press, Chicago, IL.
Wright M, Stott P (1999) The Kangaroo Island Tammar Wallaby: Assessing EcologicallySustainable Commercial Harvesting. Rural Industries Research and Development Corporation,Kingston, Canberra.
Zenger KR, McKenzie LM, Cooper DW (2002) The first comprehensive genetic linkage map of amarsupial: the tammar wallaby (Macropus eugenii). Genetics 162:321–330.
Part IIMarsupial Chromosomes and Gene Maps
Janine E. Deakin
The earliest work on marsupial genetics focussed on characterising marsupial chro-mosomes. Their large size and low diploid numbers have made them ideal to studyby cytogenetic methods. The remarkable conservation of chromosome numberand chromosome morphology observed by the pioneers in marsupial chromosomeresearch (David Hayman and Peter Martin) showed that marsupial chromosomeshave changed little since divergence from a common ancestor (Hayman and Martin,1969); much less than have eutherian mammals. In this current era of marsupialgenomics, we have the ability to delve much deeper into the characteristics ofmarsupial chromosomes, permitting a more thorough investigation of karyotypicand sequence conservation among divergent species, and allowing a much morepenetrating analysis of chromosome evolution in this branch of mammals.
In the first chapter of this part (Chapter 2), Rens and Ferguson-Smith recountthe history of early marsupial chromosome studies, and review how the develop-ment of chromosome painting confirmed the findings of G-banding studies. In thisbeautiful technique, DNA isolated from a particular chromosome from one speciescan be labelled and hybridised to the chromosome of another species to visualisedirectly regions of homology. Remarkably, chromosome painting demonstrated thatkaryotypic diversity among marsupials can be attributed to the rearrangement ofjust 19 conserved chromosomal segments. With the release of marsupial genomedata, “e-painting”, a method combining information from chromosome painting ofsome species with whole genome sequence data from others, has emerged as an insilico approach for determining chromosome evolution and reconstructing ancestralkaryotypes.
Within marsupials, the macropods (kangaroos and wallabies) display the mostkaryotypic diversity, largely as the result of repeated Robertsonian fusions betweenchromosome arms. In Chapter 3, Carone and O’Neill discuss how centromereshave played an important role in marsupial, particularly macropod, chromosomeevolution by centric fusion. An endogenous retrovirus known as KERV (kanga-roo endogenous retrovirus) appears to play a major role in chromosome evolution,being particularly prevalent at centromeres, telomeres and evolutionary break-points. Certain repeat elements associated with KERV appear to be importantfor transcription of centromeric sequences. Carone and O’Neill also review how
34 Part II Marsupial Chromosomes and Gene Maps
invaluable macropod interspecies hybrids have been for gaining insight into hybriddysgenesis. Continued sequencing efforts and analysis should lead to a greaterunderstanding of marsupial centromeres and the role they play in genome evolution.
Chromosome painting, described in Chapter 2, provides information on theglobal homology between chromosomes from different marsupial species, but pro-vides no information on the genic content or order within these chromosomes. Formany years now, it has been of great interest to construct gene maps in order todetermine gene content of marsupial chromosomes and compare the arrangementof these genes between marsupials and other vertebrates. Among the first genes tobe mapped in any marsupial were several on the kangaroo X chromosome, identifiedby their X-linked mode of inheritance in pedigrees. Autosomal linkage groups wereestablished later in the dunnart, then opossum species. Methods have progressedsince these X-linked genes were mapped in marsupials. Microsatellites (anonymoussequence markers), account for most markers on marsupial linkage maps. Mappingthese markers provides valuable information on recombination events, but doesnot provide information on gene content of marsupial chromosomes. In Chapter4, Samollow reviews the history and current status of marsupial linkage mappingand explains the peculiarities of these recombination events in marsupials and thepotential applications of linkage mapping data.
Linkage maps are vital for integrating phenotypic information with genetic mark-ers. However, most gene mapping in marsupials has been accomplished usingphysical mapping techniques such as fluorescence in situ hybridisation (FISH). Eventhe rudimentary maps produced a decade ago have been important in deducing howparts of the human genome, particularly the sex chromosomes, evolved (Graves,1995).
In Chapter 5, Deakin reviews the essential role physical mapping has played inmarsupial genome projects, and describes the immense impact the availability ofmarsupial genome sequence data has on the ease and speed at which marsupialgene maps can be constructed. By mapping genes found at the ends of evolutionaryconserved gene blocks, a detailed picture of the makeup of the tammar wallabygenome has been rapidly generated. The comparison of gene order between specieshas made it possible to construct comparative gene maps and determine ancestralgene arrangements. Both Samollow (Chapter 4) and Deakin (Chapter 5) explainhow linkage and physical maps are being integrated for the opossum and tammarwallaby, and the benefit gained from this integration during the assembly of thegenomes of these species.
The chapters in this part detail how technological advances have allowed researchon marsupial chromosomes to proceed at a rapid pace. Armed with data on thegross chromosome homologies between species obtained from chromosome paint-ing, genome sequence data and detailed maps, we can now begin to piece togetherthe ancestral marsupial karyotype and gain a greater understanding of the eventswhich have shaped marsupial – and eutherian (including human) – genomes.

Part II Marsupial Chromosomes and Gene Maps 35
References
Graves JAM (1995) The origin and function of the mammalian Y chromosome andY-borne genes – an evolving understanding. Bioessays 17:311–320.
Hayman DL, Martin PG (1969) Cytogenetics of marsupials. In: Benirschke K (ed)Comparative Mammalian Cytogenetics. Springer Verlag, New York.

Chapter 2The Conserved Marsupial Karyotype:Chromosome Painting and Evolution
Willem Rens and Malcolm Ferguson-Smith
Abstract Marsupials are an ancient group of mammals that fill diverse niches inAustralia, New Guinea, the East Indies and America. These species separated fromeutherians around 150 million years ago and the American species diverged fromthe Australian species around 70 million years ago. Compared to other mammalianspecies, the karyotypes of marsupials are highly conserved; their diploid numbersrange from 2n = 10–32 but with a predominance of 2n = 14 or 2n = 22. Thefirst chromosome comparative studies were performed mainly by searching forsimilarities in G-banding patterns leading to hypotheses on the ancestral marsu-pial karyotype and the chromosome rearrangement mechanisms that resulted in thekaryotypes seen in the extant species. The advent of chromosome painting allowedchromosome comparisons to be based on chromosome-wide sequence similarities,which is a more accurate method than the indirect method of banding analysis.This chapter is divided into six sections. The first section describes early marsupialkaryotype studies performed by G-banding and introduces hypotheses on marsu-pial chromosome evolution. The second explains chromosome painting techniquesincluding flow karyotyping and flow sorting, and presents results in the form of chro-mosome paint images and chromosome homology maps. The third section describesmarsupial chromosome evolution in terms of phylogeny, ancestral karyotypes, chro-mosome conserved regions, and mechanisms of chromosome rearrangements. Thefourth section explains the role of centromere dynamics in marsupial chromosomeevolution. The fifth section focuses on recent work on the sequenced genome of theopossum. This section is followed by concluding remarks.
Keywords Chromosome painting · Chromosome evolution · Centromeres ·G-banding · Marsupial
W. Rens (B)Department of Veterinary Medicine, Cambridge Resource Centre for Comparative Genomics,University of Cambridge, Cambridge, UKe-mail: [email protected]
37J.E. Deakin et al. (eds.), Marsupial Genetics and Genomics,DOI 10.1007/978-90-481-9023-2_2, C© Springer Science+Business Media B.V. 2010
38 W. Rens and M. Ferguson-Smith
2.1 Marsupial Karyotype Comparison by G-Banding
More than 330 marsupial species are found in America, Australia, New Guinea andislands of eastern Indonesia. Examples are the Virginia opossum in North America,the shrew opossums in the South American Andes, the Mexican mouse opossumseen in Central America, the gliders at the northern and eastern coastal regionsof Australia, and the bilbies in central Australia. Marsupial species are classifiedin seven extant orders as shown in Fig. 2.1. These orders are further categorisedinto families. For instance, Diprodontia is divided into Vombatiformes (wombatsand koala), Phalangeroidea (cuscuses, brushtail possums and scaly-tailed possums),Macropodiformes (kangaroos and wallabies), and Petauroidea (gliders). The mar-supial phylogeny shown in Fig. 2.1 is based on studies using sequence data fromfive nuclear genes (Meredith et al., 2009). This figure shows the gliders on topand American opossums at the base. The root of the marsupial tree is betweenPaucituberculata (shrew opossums) and the other marsupials. However, the loca-tion of this root is not certain (Meredith et al., 2009). Amrine-Madsen et al. (2003)prefer the root at the base of Didelphimorphia (opossums), however, this is onlyweakly supported by molecular data on nuclear genes with fewer taxa. Largerand other types of genomic and molecular data sets are required to determinethe root of Marsupialia (Meredith et al., 2009). The 2n chromosome numbers aregiven to the right of representative species. Some species are not presented with achromosome number to illustrate that several species still need to be investigated.Three species shown have different male and female chromosome numbers, whichis due to an X-autosome or Y-autosome fusion in these species. In two species,Petauroides volans, and Echymipera kalubu, B-chromosomes have been observed.B-chromosomes are supernumerary chromosomes that differ from the normal chro-mosome complement by being dispensable, often heterochromatic and exhibitingunusual meiotic behaviour.
A short glance at the chromosome numbers is enough to observe that chromo-some evolution has been relatively limited in marsupials when compared to othermammalian species. Two numbers, 2n = 14 and 2n = 22, dominate this list and adebate started between proponents of an ancestral marsupial karyotype with 2n =14 chromosomes or 2n = 22 chromosomes. The first party base their argument onsimilarities between the 2n = 14 karyotypes and their occurrence in many families(Rofe and Hayman, 1985), the second uses data on interstitial telomeres to supporttheir hypothesis (Svartman and Vianna-Morgante, 1998).
The first reports on marsupial chromosome studies appeared in the 1920s (see forinstance Altmann and Ellery, 1925), but more extensive studies were published fromthe 1970s and onwards (Hayman and Martin, 1969 and see references in Hayman,1990) and established most of the diploid numbers presented in Fig. 2.1.
An early study (Murray et al., 1980) compared the karyotype (un-banded orC-banded) of two species of gliders in the Petauroidea order. One species hasa diploid number of 2n = 20 (Pseudocheirus peregrinus) and one has 2n = 16(Pseudochirops dahlia). The latter was believed to have evolved by Robertsonianfusions (centromere-fusion between two acrocentric chromosomes). This report was
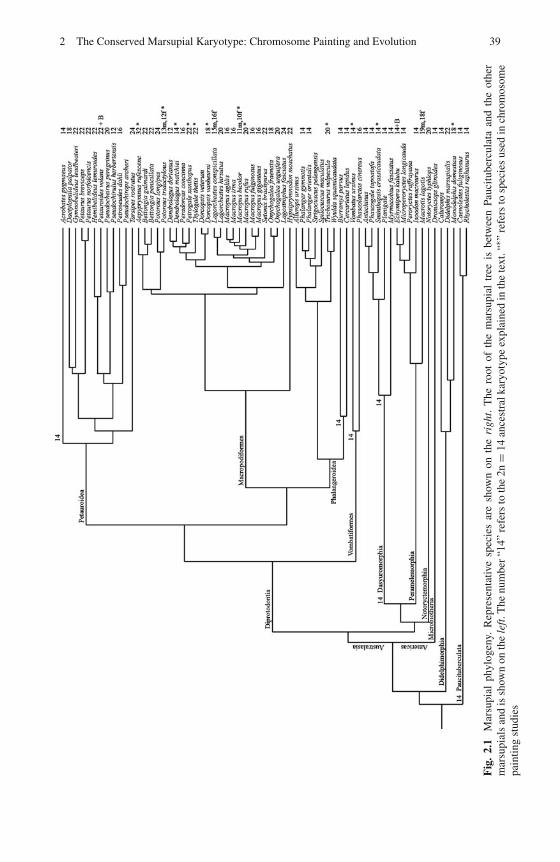
2 The Conserved Marsupial Karyotype: Chromosome Painting and Evolution 39
Fig
.2.
1M
arsu
pial
phyl
ogen
y.R
epre
sent
ativ
esp
ecie
sar
esh
own
onth
eri
ght.
The
root
ofth
em
arsu
pial
tree
isbe
twee
nPa
ucitu
berc
ulat
aan
dth
eot
her
mar
supi
als
and
issh
own
onth
ele
ft.T
henu
mbe
r“1
4”re
fers
toth
e2n
=14
ance
stra
lkar
yoty
peex
plai
ned
inth
ete
xt.“
∗ ”re
fers
tosp
ecie
sus
edin
chro
mos
ome
pain
ting
stud
ies
40 W. Rens and M. Ferguson-Smith
followed by karyotype studies on six species of the Petauroidea order (Murray et al.,1990).
Direct (no banding) karyotype comparison was performed for 19 Didel-phimorphia species (Carvalho et al., 2002). Eight species have a diploid numberof 2n = 14, four species have 2n = 18, and seven species have a 2n = 22diploid number. These findings together with studies performed by Reig et al.(1977) show that 2n = 14 is predominant (58%) in these south American marsupialsspecies followed by 2n = 22 (27%); the remaining species (15%) have a diploidnumber of 2n = 18. These are the only diploid numbers found in American mar-supials. Reig et al. (1977) hypothesized that the 2n = 18 and 2n = 22 karyotypesevolved from the 2n = 14 through a process of Robertsonian fissions.
One of the first papers presenting and comparing marsupial G-banded chro-mosomes was from Rofe and Hayman (1985). Eight Dasyuromorphia specieswere compared with two Peramelemorphia, four Vombatiformes, and oneDidelphimorphia species, all with 2n = 14. This comparison showed that thekaryotypes of these species were very similar with almost identical banding andobserved differences could be explained by pericentric inversions. This similarityindicates that a 2n = 14 karyotype was present at least around 70 million years agowhen Didelphimorphia and Australidelphia diverged. Alternatively, a similar 2n =14 karyotype must have evolved independently in the lineages leading to the speciesstudied (Rofe and Hayman, 1985).
South American marsupials with a diploid number of 2n = 14 also have similarG-banded karyotypes. The four species Caluromys philander (bare-tailed woollyopossum), Caluromys lanatus (brown-eared woolly opossum), Marmosa cinerea(woolly mouse opossum), and Marmosa murina (murine mouse opossum) have ahigh degree of chromosome conservation (Souza de et al., 1990). This similaritystrengthened the 2n = 14 pleisiomorphic karyotype hypothesis.
More recently, karyotypes of seven species from the Didelphimorphia orderwere compared by G- and C-banding. Four of those species have a 2n = 14karyotype, one (Monodelphis domestica, gray short-tailed opossum, Fig. 2.1) hasa 2n = 18 karyotype and two have a 2n = 22 karyotype (Philander Opossum,gray four-eyed opossum, and Didelphis marsupialis, common opossum, Fig. 2.1).Only one mechanism, namely Robertsonian rearrangements, seem to be the causeof change in chromosome numbers in these Didelphimorphia species. Howeverthe direction, increase in number by fission or decrease by fusions, of chro-mosome evolution could not be determined (Svartman and Vianna-Morgante,1998, 1999).
Thus a 2n = 14 karyotype is favoured by most of the above reports as ancestralas firstly the observed 2n = 14 karyotypes are very similar and secondly, they arefound in different marsupial families from both South America and Australia. Otherkaryotypes evolved through fissions. The only objection to this hypothesis comesfrom observations of interstitial telomeres, with their existence indicating telomericfusions. This points to 2n = 22 as the representative of the ancestral karyotype, withother karyotypes evolving through fusions (Svartman and Vianna-Morgante, 1998;Carvalho and Mattevi, 2000).
2 The Conserved Marsupial Karyotype: Chromosome Painting and Evolution 41
G-banding comparison in rock wallabies was important to shed light on chromo-some evolution in the superfamily Macropodiformes (Fig. 2.1) with high chromo-some variability (Eldridge et al., 1992a, b). Comparison between six rock wallabyspecies demonstrated a 2n = 22 karyotype that is plesiomorphic for this superfamilyand is retained in Thylogale thetis (red-necked pademelon). It is important to notethat this 2n = 22 karyotype is not similar to the 2n = 22 karyotype seen in othermarsupial superfamilies.
Figure 2.1 shows that Potorous tridactylus (long-nosed potoroo) contains anX-autosome fusion causing two different diploid numbers in male and female(Johnston et al., 1984). Sinclair et al. show by G-banding that this karyotypeis almost identical to Potorous gilbertii (Gilbert’s potoroo) indicating that thisfusion was not species specific, which had implications for the Potorous phylogeny(Johnston et al., 1984; Sinclair et al., 2000). The 2n = 24 karyotype of Potorouslongipes (long-footed potoroo) is seen as ancestral for Potorous species.
A beautiful collection of 55 G-banded marsupial chromosomes can be found inthe Atlas of Mammalian Chromosomes (Eldridge and Metcalfe, 2006). Karyotypesof ten Didelphimorphia species can be compared with ten Dasyuromorphia, twenty-nine Diprotondia, three Peramelemorphia and one species each of Paucituberculata,Microbiotheria and Notoryctemorphia. The set of G-banded marsupial karyotypesproduced by Rofe for his PhD investigations deserves special mention for its highquality.
G-banded karyotypes have been very instrumental in gaining insights intochromosome evolution but this method is based on chromosome morphology andappearance. A more unambiguous method for whole genome comparison basedon direct DNA comparison is cross-species chromosome painting discussed in thenext section.
2.2 Marsupial Karyotype Comparison by Cross-SpeciesChromosome Painting
2.2.1 History
Cross-species chromosome painting became possible after a technique was devel-oped for labelling specific chromosomes with a fluorescence tag. Two requirementshad to be fulfilled in order to accomplish this technique. First, each chromosometype of a species of interest needed to be collected in a separate tube, i.e. for humanthere would be 24 different tubes. The first flow cytometer that could separate andsort human chromosomes into 21 fractions was presented in 1982 by Lebo andBastian (1982). This was a major step forwards in cytology. Since then improve-ments have been made concerning accuracy and speed but these are only adaptationsof the original design. The second requirement for chromosome painting was themethod for DNA labelling with equal coverage along the length of the chromosome.This method was developed by Hakan Telenius (Telenius et al., 1992) 10 years after
42 W. Rens and M. Ferguson-Smith
the development of chromosome sorting. General amplification was achieved byusing a degenerate primer together with a specific PCR protocol in which initialprimer annealing occurs at a low temperature. Labelling of DNA occurs in a secondround of PCR amplification by incorporating a hapten. Immediately it was realisedthat this process is species independent and that chromosome specific DNA andpaints can be produced for a large variety of vertebrate species.
2.2.2 Marsupial Chromosome Painting
Studies into marsupial chromosome evolution started to benefit from chromosomepainting after 1997. Several reports were published focussing on different parts ofthe marsupial phylogenetic tree. The detected chromosome rearrangements weresubsequently placed on branches of this tree. In chronological order these reportsare the following.
In 1997 chromosome paints were produced from tammar wallaby (Macropuseugenii, 2n = 16) sorted chromosomes and these were hybridized onto metaphasesof the swamp wallaby (Wallabia bicolor, 2n = 11♂,10♀). Chromosome paintingrevealed that the reduction in chromosome number in the swamp wallaby wascaused by fusions of “tammar” chromosomes. For instance, swamp wallaby chro-mosome 1 consists of a region homologous to tammar chromosome 4, a region ontammar chromosome 1 and a region on tammar chromosome 6 (Toder et al., 1997).
Tammar wallaby chromosome paints were also painted on three rock wallabyspecies metaphases (all three 2n = 22) to shed light on chromosome evolutionwithin Petrogale species and detect conserved chromosome regions between mem-bers of Macropus and Petrogale. The karyotypes of Petrogale lateralis lateralis,P. l. pearsoni and P. xanthopus xanthopus are identical: they have identical paintdistributions after hybridization with tammar chromosome paints. Each Petrogalechromosome corresponds to only one tammar chromosome (region). Tammar chro-mosomes are thus a result of three fusions of six chromosomes of the 2n = 22karyotype, if the 2n = 22 Petrogale karyotype is regarded as pleisiomorphic forPetrogale and Macropus (O’Neill et al., 1999).
Cross-species chromosome painting becomes more informative when hybridiza-tion is performed bidirectionally (reciprocally): chromosomes of species A arehybridized on metaphases of species B and vice versa. A report in 1999 (Renset al., 1999) shows results of bidirectional chromosome painting between four dis-tantly related marsupial species: two Macropodiformes, one Phalangeroidea andone Dasyuromorphia species. The latter species is Sminthopsis crassicaudata (fat-tailed dunnart), which has a karyotype that, apart from inversions, represents theputative 2n = 14 ancestral karyotype. Five different chromosome homology mapswere produced, each important for comparative gene mapping and for showingthe limited number of chromosome rearrangements which have occurred betweenthese species. A karyotype phylogeny was constructed from these data. The kary-otype of Trichosurus vulpecula (brushtail possum; Phalangeridea, Fig. 2.1) can bederived from the 2n = 14 ancestral karyotype by four fissions and one fusion. The
2 The Conserved Marsupial Karyotype: Chromosome Painting and Evolution 43
Macropodiformes plesiomorphic 2n = 20 karyotype is related to the 2n = 14 ances-tral karyotype by four fissions and one fusion. The chromosome complement ofPotorous tridactylus evolved after one fission and five fusions. The 2n = 22 kary-otype that is ancestral to Macropods and Petrogale (see above) is derived after onefission. The Macropus eugenii complement evolved after three fusions. The S. cras-sicaudata karyotype is related to the 2n = 14 marsupial ancestral karyotype by sixinversions. Fifteen chromosome segments are conserved in the karyotypes of theseAustralian marsupials (Rens et al., 1999), but this number has been increased tonineteen based on studies on more marsupial species, see below (Rens et al., 2003).
Tammar wallaby chromosome specific paints were used to investigate the rela-tively large karyotypic diversity within Macropodiformes (Glas et al., 1999). Thesepaints were hybridized onto metaphases of Macropus rufus, Dendrolagus matschiei,Thylogale thetis and an unknown Dorcopsis species. This study showed that theThylogale thetis and Dorcopsis karyotypes are identical to the Petrogale 2n =22 karyotype. All three karyotypes can be considered as representatives of theMacropodid plesiomorphic karyotype. Although the Dendrolagus matschiei kary-otype has a diploid number of 2n = 14, it is not similar to the 2n = 14 marsupialancestral, but derived through independent fusions from the 2n = 22 Macropodidplesiomorphic karyotype. Only one fusion separates Macropus rufus from this 2n =22 karyotype.
Sminthopsis macroura and Vombatus latifrons are marsupials species from dif-ferent orders, Diprodontia and Dasyuromorphia, with both 2n = 14 karyotypes.Painting metaphases of these species with tammar wallaby chromosome paintsrevealed that these karyotypes are closely related and that each differs from theancestral 2n = 14 karyotypes by a different set of two inversions (De Leo et al.,1999).
In 2001 the American species Monodelphis domestica (2n = 18) was added to thelist of marsupial species studied by cross-species chromosome painting (Rens et al.,2001). Chromosome specific paints of this species were hybridized to Sminthopsiscrassicaudata (2n = 14), Macropus eugenii (2n = 16) and Trichosurus vulpecula(2n = 22) and vice versa. Fourteen of the fifteen chromosome segments that are con-served in S. crassicaudata, M. eugenii, P. tridactylus, and T. vulpecula (see above)are also conserved in the karyotype of Monodelphis domestica although 70 millionyears separate the American Didelphis species from Australian marsupial species.M. domestica chromosome 1, 2, 5 and 8 are homologous to S. crassicaudata chro-mosome 2, 4, 6, and 5 respectively. Chromosome 4 and 6 of M. domestica togetherform S. crassicaudata chromosome 1. S. crassicaudata chromosome 3 is homolo-gous to M. domestica chromosome 4 and 7. Apart from inversions, the karyotype ofSminthopsis represents the 2n = 14 marsupial ancestral karyotype.
One species Aepyprymnus rufuscens (2n = 32) within the Macropodiformesfamily has a noticeable higher diploid number. Chromosome evolution studiesusing A. rufuscens specific paints delivered higher resolution chromosome widehomology maps (Rens et al., 2003). Figure 2.2 shows an example of cross specieschromosome painting: a paint of A. rufuscens chromosome 9 was hybridized onP. tridactylus chromosome 2, the region highlighted is conserved region C16,
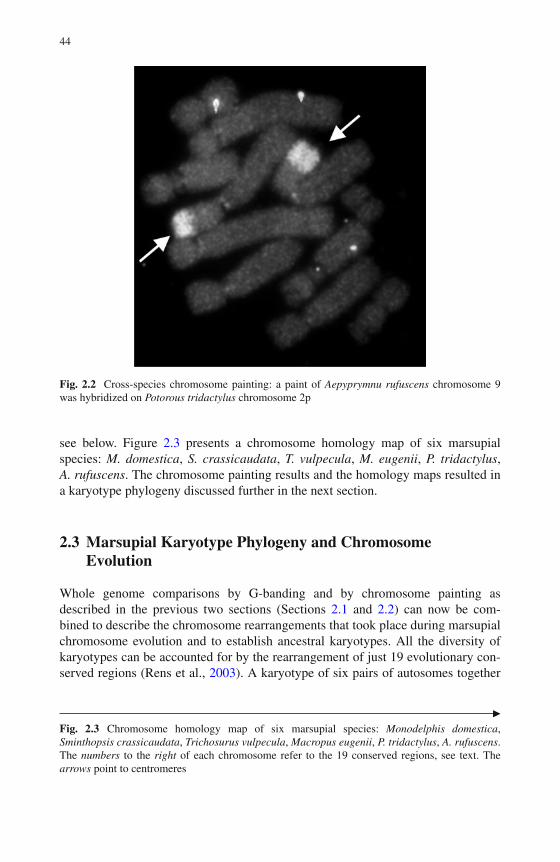
44
Fig. 2.2 Cross-species chromosome painting: a paint of Aepyprymnu rufuscens chromosome 9was hybridized on Potorous tridactylus chromosome 2p
see below. Figure 2.3 presents a chromosome homology map of six marsupialspecies: M. domestica, S. crassicaudata, T. vulpecula, M. eugenii, P. tridactylus,A. rufuscens. The chromosome painting results and the homology maps resulted ina karyotype phylogeny discussed further in the next section.
2.3 Marsupial Karyotype Phylogeny and ChromosomeEvolution
Whole genome comparisons by G-banding and by chromosome painting asdescribed in the previous two sections (Sections 2.1 and 2.2) can now be com-bined to describe the chromosome rearrangements that took place during marsupialchromosome evolution and to establish ancestral karyotypes. All the diversity ofkaryotypes can be accounted for by the rearrangement of just 19 evolutionary con-served regions (Rens et al., 2003). A karyotype of six pairs of autosomes together
�Fig. 2.3 Chromosome homology map of six marsupial species: Monodelphis domestica,Sminthopsis crassicaudata, Trichosurus vulpecula, Macropus eugenii, P. tridactylus, A. rufuscens.The numbers to the right of each chromosome refer to the 19 conserved regions, see text. Thearrows point to centromeres
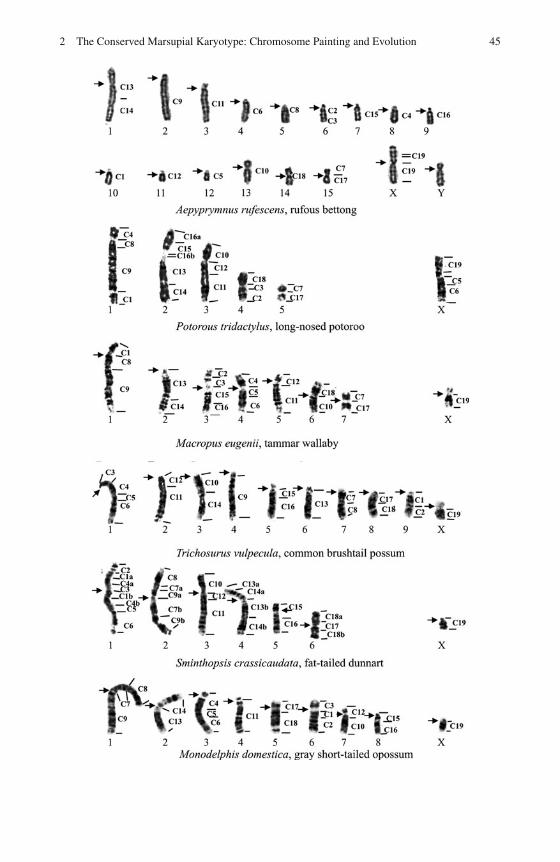
2 The Conserved Marsupial Karyotype: Chromosome Painting and Evolution 45
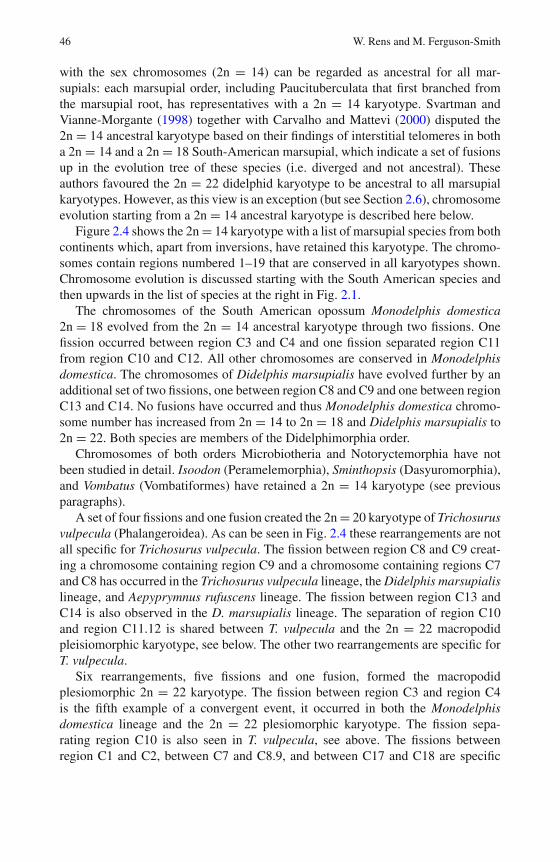
46 W. Rens and M. Ferguson-Smith
with the sex chromosomes (2n = 14) can be regarded as ancestral for all mar-supials: each marsupial order, including Paucituberculata that first branched fromthe marsupial root, has representatives with a 2n = 14 karyotype. Svartman andVianne-Morgante (1998) together with Carvalho and Mattevi (2000) disputed the2n = 14 ancestral karyotype based on their findings of interstitial telomeres in botha 2n = 14 and a 2n = 18 South-American marsupial, which indicate a set of fusionsup in the evolution tree of these species (i.e. diverged and not ancestral). Theseauthors favoured the 2n = 22 didelphid karyotype to be ancestral to all marsupialkaryotypes. However, as this view is an exception (but see Section 2.6), chromosomeevolution starting from a 2n = 14 ancestral karyotype is described here below.
Figure 2.4 shows the 2n = 14 karyotype with a list of marsupial species from bothcontinents which, apart from inversions, have retained this karyotype. The chromo-somes contain regions numbered 1–19 that are conserved in all karyotypes shown.Chromosome evolution is discussed starting with the South American species andthen upwards in the list of species at the right in Fig. 2.1.
The chromosomes of the South American opossum Monodelphis domestica2n = 18 evolved from the 2n = 14 ancestral karyotype through two fissions. Onefission occurred between region C3 and C4 and one fission separated region C11from region C10 and C12. All other chromosomes are conserved in Monodelphisdomestica. The chromosomes of Didelphis marsupialis have evolved further by anadditional set of two fissions, one between region C8 and C9 and one between regionC13 and C14. No fusions have occurred and thus Monodelphis domestica chromo-some number has increased from 2n = 14 to 2n = 18 and Didelphis marsupialis to2n = 22. Both species are members of the Didelphimorphia order.
Chromosomes of both orders Microbiotheria and Notoryctemorphia have notbeen studied in detail. Isoodon (Peramelemorphia), Sminthopsis (Dasyuromorphia),and Vombatus (Vombatiformes) have retained a 2n = 14 karyotype (see previousparagraphs).
A set of four fissions and one fusion created the 2n = 20 karyotype of Trichosurusvulpecula (Phalangeroidea). As can be seen in Fig. 2.4 these rearrangements are notall specific for Trichosurus vulpecula. The fission between region C8 and C9 creat-ing a chromosome containing region C9 and a chromosome containing regions C7and C8 has occurred in the Trichosurus vulpecula lineage, the Didelphis marsupialislineage, and Aepyprymnus rufuscens lineage. The fission between region C13 andC14 is also observed in the D. marsupialis lineage. The separation of region C10and region C11.12 is shared between T. vulpecula and the 2n = 22 macropodidpleisiomorphic karyotype, see below. The other two rearrangements are specific forT. vulpecula.
Six rearrangements, five fissions and one fusion, formed the macropodidplesiomorphic 2n = 22 karyotype. The fission between region C3 and region C4is the fifth example of a convergent event, it occurred in both the Monodelphisdomestica lineage and the 2n = 22 plesiomorphic karyotype. The fission sepa-rating region C10 is also seen in T. vulpecula, see above. The fissions betweenregion C1 and C2, between C7 and C8.9, and between C17 and C18 are specific
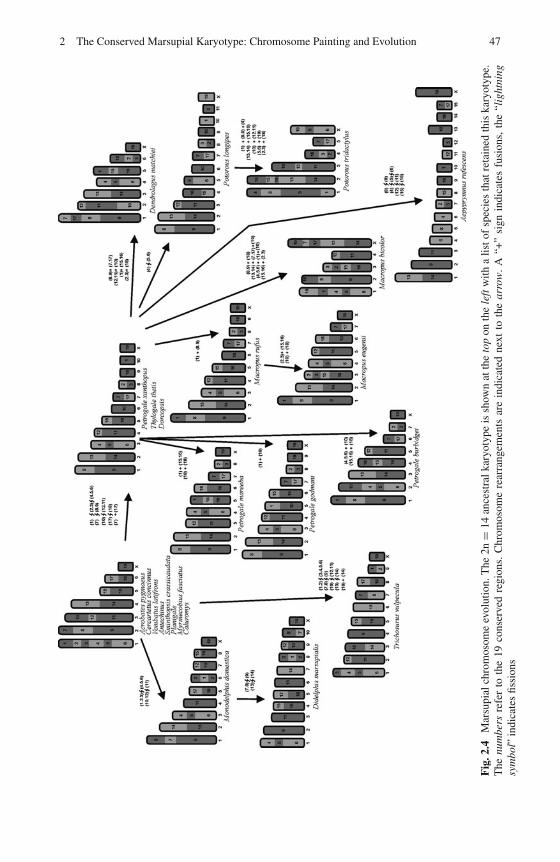
2 The Conserved Marsupial Karyotype: Chromosome Painting and Evolution 47
Fig
.2.4
Mar
supi
alch
rom
osom
eev
olut
ion.
The
2n=
14an
cest
ralk
aryo
type
issh
own
atth
eto
pon
the
left
with
alis
tof
spec
ies
that
reta
ined
this
kary
otyp
e.T
henu
mbe
rsre
fer
toth
e19
cons
erve
dre
gion
s.C
hrom
osom
ere
arra
ngem
ents
are
indi
cate
dne
xtto
the
arro
w.
A“+
”si
gnin
dica
tes
fusi
ons,
the
“lig
htni
ngsy
mbo
l”in
dica
tes
fissi
ons
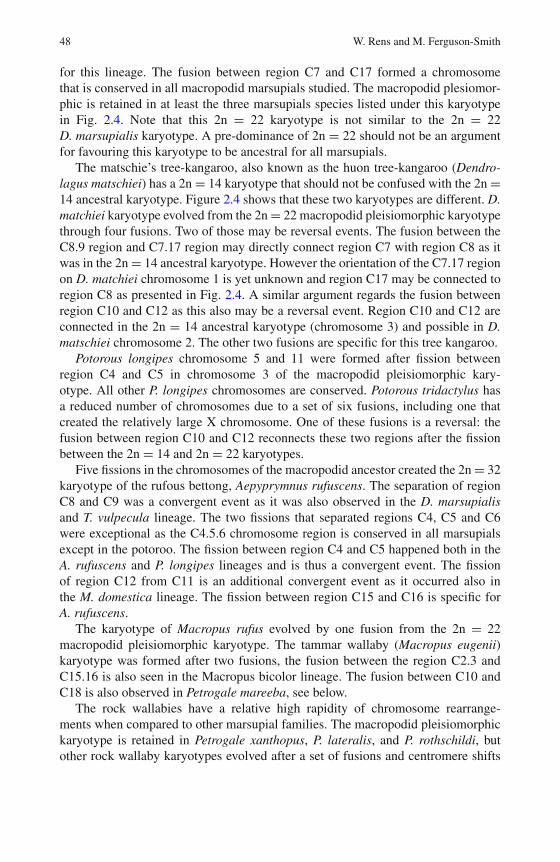
48 W. Rens and M. Ferguson-Smith
for this lineage. The fusion between region C7 and C17 formed a chromosomethat is conserved in all macropodid marsupials studied. The macropodid plesiomor-phic is retained in at least the three marsupials species listed under this karyotypein Fig. 2.4. Note that this 2n = 22 karyotype is not similar to the 2n = 22D. marsupialis karyotype. A pre-dominance of 2n = 22 should not be an argumentfor favouring this karyotype to be ancestral for all marsupials.
The matschie’s tree-kangaroo, also known as the huon tree-kangaroo (Dendro-lagus matschiei) has a 2n = 14 karyotype that should not be confused with the 2n =14 ancestral karyotype. Figure 2.4 shows that these two karyotypes are different. D.matchiei karyotype evolved from the 2n = 22 macropodid pleisiomorphic karyotypethrough four fusions. Two of those may be reversal events. The fusion between theC8.9 region and C7.17 region may directly connect region C7 with region C8 as itwas in the 2n = 14 ancestral karyotype. However the orientation of the C7.17 regionon D. matchiei chromosome 1 is yet unknown and region C17 may be connected toregion C8 as presented in Fig. 2.4. A similar argument regards the fusion betweenregion C10 and C12 as this also may be a reversal event. Region C10 and C12 areconnected in the 2n = 14 ancestral karyotype (chromosome 3) and possible in D.matschiei chromosome 2. The other two fusions are specific for this tree kangaroo.
Potorous longipes chromosome 5 and 11 were formed after fission betweenregion C4 and C5 in chromosome 3 of the macropodid pleisiomorphic kary-otype. All other P. longipes chromosomes are conserved. Potorous tridactylus hasa reduced number of chromosomes due to a set of six fusions, including one thatcreated the relatively large X chromosome. One of these fusions is a reversal: thefusion between region C10 and C12 reconnects these two regions after the fissionbetween the 2n = 14 and 2n = 22 karyotypes.
Five fissions in the chromosomes of the macropodid ancestor created the 2n = 32karyotype of the rufous bettong, Aepyprymnus rufuscens. The separation of regionC8 and C9 was a convergent event as it was also observed in the D. marsupialisand T. vulpecula lineage. The two fissions that separated regions C4, C5 and C6were exceptional as the C4.5.6 chromosome region is conserved in all marsupialsexcept in the potoroo. The fission between region C4 and C5 happened both in theA. rufuscens and P. longipes lineages and is thus a convergent event. The fissionof region C12 from C11 is an additional convergent event as it occurred also inthe M. domestica lineage. The fission between region C15 and C16 is specific forA. rufuscens.
The karyotype of Macropus rufus evolved by one fusion from the 2n = 22macropodid pleisiomorphic karyotype. The tammar wallaby (Macropus eugenii)karyotype was formed after two fusions, the fusion between the region C2.3 andC15.16 is also seen in the Macropus bicolor lineage. The fusion between C10 andC18 is also observed in Petrogale mareeba, see below.
The rock wallabies have a relative high rapidity of chromosome rearrange-ments when compared to other marsupial families. The macropodid pleisiomorphickaryotype is retained in Petrogale xanthopus, P. lateralis, and P. rothschildi, butother rock wallaby karyotypes evolved after a set of fusions and centromere shifts
2 The Conserved Marsupial Karyotype: Chromosome Painting and Evolution 49
(Eldridge and Close, 1993). Three examples are given in Fig. 2.4. Two fusions,one between region C1 and C15.16, and one between C10 and C18 formedthe P. mareeba karyotype. The latter is a convergent event as the same is seen inthe Macropus eugenii lineage. A fusion between region C1 and C10 is observedin the karyotype of P. godmani. The karyotype of P. burbidgei is formed after twofusions, between region C10 and C4.5.6, and between region C15.16 and C18.
In summary, nine recurrent (convergence) and three reversals are observed dur-ing chromosome evolution of the marsupials in this review. These events may be areason to reconsider the order of the sequential rearrangements in the phylogenetictree. However, Rens et al. (2003) have shown that reordering will produce differentreversals or convergences.
The Petauroidea remain to be studied by chromosome painting. Acrobatespygmaeus represent the 2n = 14 ancestral karyotype (as shown by G-banding).It will be of interest to investigate the extent of convergence and reversals inPetauroidea chromosome evolution.
2.4 Centromere Dynamics in Chromosome Evolution
A relatively high number of chromosome rearrangements that shaped the marsu-pial karyotypes can be classified as convergent or reversal events, as mentioned inSection 2.3. Marsupial chromosome rearrangements are therefore not ideal to beused as parameters for construction of phylogenetic trees. An explanation for reuseof breakpoints may be found by investigating the centromere sequence composition.That centromeres can influence chromosome stability was shown by characteris-ing the centromeres of Macropus hybrids (Metcalfe et al., 2007). It appeared thatsome centromeres were elongated and segmented in the hybrid and that specificsequences were amplified at the centromeres, one of them is a kangaroo endogenousretrovirus, KERV-1 (Ferreri et al., 2004; see also Carone and O’Neill, Chapter 3).A correlation between centromere sequences and convergent breakpoint reuse canbe determined by mapping both parameters in the marsupial phylogenetic tree. Itappears that expansion or diminishment of centromere sequences matches conver-gent breakpoint reuse at centromeres, i.e. centromere-satellite sequence evolutionfollows chromosomal evolution (Bulazel et al., 2007). Thus the observation of con-vergence and reversal in marsupial chromosome evolution actually has a biologicalexplanation; chromosome rearrangements are not necessarily random events. Thereuse of marsupial breakpoints extends beyond marsupials and even into humankaryotype evolution/instability. Longo et al. (2009) shows that both centromeres andevolutionary breakpoints are enriched for specific interspersed repeats, endogenousretroviruses and long interspersed nuclear elements, linking centromeres with chro-mosome instability. An evolutionary breakpoint on tammar wallaby chromosome 1qis orthologous to human 14q32.33, which itself is an evolutionary breakpoint; bothsites are enriched for the above types of repeats. Activity of these repeat elementsdetermines the instability observed at these locations.
50 W. Rens and M. Ferguson-Smith
2.5 Marsupial Whole Genome Sequencing
In the last few years chromosome painting has been joined by “E-painting” to dis-cover chromosome homologies and rearrangements. The latter technique becamepossible with the availability of whole genome sequences of many vertebratespecies. The tammar wallaby is currently sequenced with 2x coverage and theopossum (Monodelphis domestica) has been sequenced with 6x coverage, andassigned to chromosomes (Mikkelsen et al., 2007). These sequencing endeavoursprovide us with a wealth of comparative genomic data, which is covered elsewherein this book. E-painting uses the sequence data to discover regions of conservedsynteny between species. Although it relies on “computer” data, the resolution ismuch greater than that obtained by cross-species chromosome painting. Betweenmarsupial comparisons cannot be done yet as other marsupials await sequencing,but E-painting on eutherian species has been performed (Kemkemer et al., 2009).Six different mammalian species (including opossum) and chicken were comparedrevealing a large set of 526 evolutionary breakpoints. The eutherian ancestral kary-otype (Yang et al., 2003) is supported by the conserved regions detected in opossumas ancestral syntenic segment associations were present in Monodelphis domestica.
2.6 Conclusion
Since the 1970s a considerable amount of whole genome comparative data, eitherby G-banding or chromosome painting, has been collected and used to followchromosome evolution in different marsupial lineages and to reconstruct ancestralkaryotypes. Pioneers in this field had to rely on chromosome banding patterns toestablish homology between chromosomes from different marsupial species, whichlead to the first hypotheses on marsupial chromosome evolution. Cross-species chro-mosome painting made these studies more accurate and reliable which enableda relatively precise description of chromosome rearrangements that shaped thekaryotypes of extant marsupial species.
These studies are not yet completed. There are four major marsupial lineagesmissing in the chromosome painting analysis. Paucituberculata species all have2n = 14 karyotypes that presumably correspond to the proposed marsupial ances-tral karyotype. Likewise, Microbiotheria have not been studied yet. The missingNotoryctemorphia contain species with karyotypes with higher numbers and couldbe necessary to support or refute the 2n = 14 hypothetical ancestral karyotype.The Petauroidea lineage contains species that differ in chromosome number and areinteresting to study with respect to convergent and reversal events as discussed inthis chapter and with respect to the 2n = 14 hypothetical ancestral karyotype.
At the current status quo there is still an apparent conflict between the assumptionthat the ancestral karyotype contained 14 pairs of chromosomes and the observa-tion of interstitial telomeres in the American Didelphimorphia species. The locationof these telomeres indicate Robertsonian fusions and thus a reduction in chromo-some number from 2n = 22 to 2n = 14. It is therefore unfortunate that the root
2 The Conserved Marsupial Karyotype: Chromosome Painting and Evolution 51
of marsupials is uncertain. The marsupial phylogeny proposed by Meredith et al.(2009)and used in this chapter presents the Paucituberculata as outgroup species toDidelphimorphia and thus favours the 2n = 14 as ancestral. In contrast, Amrine-Madsen et al. (2003) prefers the root of marsupials at the base of Didelphimorphia.In that case, a 2n = 22 ancestral karyotype implies fusions that are convergent inthe Didelphimorphia lineage and the lineage leading to all other marsupials. Studiesusing non-marsupial species, such as monotremes, as outgroup will resolve this con-flict. These studies can only be performed by comparative gene mapping, becausethese species are too distantly related (150 million years ago) to permit chromosomepainting. Precise structural studies at evolutionary breakpoints such as performed byO’Neill’s group will also aid in the determination of the direction of chromosomechange, i.e. fusion or fission.
Whole genome comparison as discussed in this chapter will be very valuable forand is followed up by gene evolution and comparative functional genomic research.Important examples are the studies of MHC (Siddle et al., 2009; Cheng et al.,Chapter 16) and other gene clusters, and studies on the evolution of X-inactivation(Al Nadaf et al., Chapter 13) and genomic imprinting (Edwards et al., 2007, 2008;Renfree et al., 2009; Hore et al., Chapter 12). There is no doubt that evolutionaryand developmental biologists are also very interested in marsupial genomics.
References
Altmann SCA, Ellery MEW (1925) The chromosomes of four species of marsupials. Q J MicroscSci 69:463–469.
Amrine-Madsen H, Scally M, Westerman M, Stanhope MJ, Krajewski C, Springer MS (2003)Nuclear gene sequences provide evidence for the monophyly of australidelphian marsupials.Mol Phylogenet Evol 28:186–196.
Bulazel KV, Ferreri GC, Eldridge MD, O’Neill RJ (2007) Species-specific shifts in centromeresequence composition are coincident with breakpoint reuse in karyotypically divergent lin-eages. Genome Biol 8:R170.
Carvalho BD, Mattevi MS (2000) (T2AG3)n telomeric sequence hybridization suggestive ofcentric fusion in karyotype marsupials evolution. Genetica 108:205–210.
Carvalho BD, Oliveira CLFB, Nunes AP, Mattevi MS (2002) Karyotypes of nineteen marsupialspecies from Brazil. J Mammal 83:58–70.
De Leo AA, Guedelha N, Toder R, et al. (1999) Comparative chromosome painting between mar-supial orders: relationships with a 2n = 14 ancestral marsupial karyotype. Chromosome Res7:509–517.
Edwards CA, Mungall AJ, Matthews L, et al. (2008) The evolution of the DLK1-DIO3 imprinteddomain in mammals. PLoS Biol 6:e135.
Edwards CA, Rens W, Clarke O, et al. (2007) The evolution of imprinting: chromosomal mappingof orthologues of mammalian imprinted domains in monotreme and marsupial mammals. BMCEvol Biol 7:157.
Eldridge MD, Close RL (1993) Radiation of chromosome shuffles. Curr Opin Genet Dev 3:915–922.
Eldridge MD, Johnston PG, Close RL (1992a) Chromosomal rearrangements in rock wallabies,Petrogale (Marsupialia: Macropodidae). VI. Determination of the plesiomorphic karyotype:G-banding comparison of Thylogale with Petrogale persephone, P. xanthopus, and P. l.lateralis. Cytogenet Cell Genet 61:29–33.
52 W. Rens and M. Ferguson-Smith
Eldridge MD, Johnston PG, Lowry PS (1992b) Chromosomal rearrangements in rock wallabies,Petrogale (Marsupialia: Macropodidae). VII. G-banding analysis of Petrogale brachyotis andP. concinna: species with dramatically altered karyotypes. Cytogenet Cell Genet 61:34–39.
Eldridge MD, Metcalfe CJ (2006) Marsupialia. In: O’Brien SJ, Menniger J, Nash W (eds) Atlas ofMammalian Chromosomes. Wiley, New York, NY.
Ferreri GC, Marzelli M, Rens W, O’Neill RJ (2004) A centromere-specific retroviral ele-ment associated with breaks of synteny in macropodine marsupials. Cytogenet Genome Res107:115–118.
Glas R, De Leo AA, Delbridge ML, et al. (1999) Chromosome painting in marsupials: genomeconservation in the kangaroo family. Chromosome Res 7:167–176.
Hayman DL (1990) Marsupial cytogenetics. Aust J Zool 37:331–349.Hayman DL, Martin PG (1969) Cytogenetics of marsupials. In: Benirschke K (ed) Comparative
Mammalian Cytogenetics. Springer, New York, NY.Johnston PG, Davey RJ, Seebeck JH (1984) Chromosome homologies in Potorous tridactylus
and P. longipes (Marsupialia:Macropodidae) based on G-banding patterns. Aust J Zool 32:319–324.
Kemkemer C, Kohn M, Cooper DN, et al. (2009) Gene synteny comparisons between differentvertebrates provide new insights into breakage and fusion events during mammalian karyotypeevolution. BMC Evol Biol 9:84.
Lebo RV, Bastian AM (1982) Design and operation of a dual laser chromosome sorter. Cytometry3:213–219.
Longo MS, Carone DM, Program NC, Green ED, O’Neill MJ, O’Neill RJ (2009) Distinct retroele-ment classes define evolutionary breakpoints demarcating sites of evolutionary novelty. BMCGenom 10:334.
Meredith RW, Westerman M, Springer MS (2009) A phylogeny of Diprotodontia (Marsupialia)based on sequences for five nuclear genes. Mol Phylogenet Evol 51:554–571.
Metcalfe CJ, Bulazel KV, Ferreri GC, et al. (2007) Genomic instability within centromeres ofinterspecific marsupial hybrids. Genetics 177:2507–2517.
Mikkelsen TS, Wakefield MJ, Aken B, et al. (2007) Genome of the marsupial Monodelphisdomestica reveals innovation in non-coding sequences. Nature 447:167–177.
Murray JD, Donnellan S, McKay GM, et al. (1990) The chromosomes of four genera of possumsfrom the family Petauridae (Marsupialia;Diprotodonta). Aust J Zool 38:33–39.
Murray JD, Sharman GB, McKay GM, Calaby JH (1980) Karyotypes, constitutive heterochromatinand taxonomy of ringtail opossums of the genus Pseudocheirus (Marsupialia: Petauridae).Cytogenet Cell Genet 27:73–81.
O’Neill RJ, Eldridge MD, Toder R, Ferguson-Smith MA, O’Brien PC, Graves JA (1999)Chromosome evolution in kangaroos (Marsupialia: Macropodidae): cross species chromo-some painting between the tammar wallaby and rock wallaby spp. with the 2n = 22 ancestralmacropodid karyotype. Genome 42:525–530.
Reig OA, Gardner AL, Bianchi NO, Patton JL (1977) The chromosomes of the Didelphidae(Marsupialia) and their evolutionary significance. Biol J Linn Soc 9:191–216
Renfree MB, Hore TA, Shaw G, Graves JA, Pask AJ (2009) Evolution of genomic imprinting:insights from marsupials and monotremes. Annu Rev Genomics Hum Genet 10:241–262.
Rens W, O’Brien PC, Fairclough H, Harman L, Graves JA, Ferguson-Smith MA (2003)Reversal and convergence in marsupial chromosome evolution. Cytogenet Genome Res102:282–290.
Rens W, O’Brien PC, Yang F, et al. (2001) Karyotype relationships between distantly relatedmarsupials from South America and Australia. Chromosome Res 9:301–308.
Rens W, O’Brien PC, Yang F, Graves JA, Ferguson-Smith MA (1999) Karyotype relation-ships between four distantly related marsupials revealed by reciprocal chromosome painting.Chromosome Res 7:461–474.
Rofe R, Hayman D. (1985) G-banding evidence for a conserved complement in the Marsupialia.Cytogenet Cell Genet 39:40–50.
2 The Conserved Marsupial Karyotype: Chromosome Painting and Evolution 53
Siddle HV, Deakin JE, Coggill P, et al. (2009) MHC-linked and un-linked class I genes in thewallaby. BMC Genom 10:310.
Sinclair EA, Murch AR, Renzo MD, Palermo M (2000) Chromosome morphology in Gilbert’spotoroo, Potorous gilbertii (Marsupialia:Potoroidae). Aust J Zool 48:281–287.
Souza de MJ, Maia V, Santos dos JF (1990) Nucleolar organizer regions, G- and C-bands in someBrazilian species of Didelphidae. Braz J Genet 13:767–775.
Svartman M, Vianna-Morgante AM (1998) Karyotype evolution of marsupials: from higher tolower diploid numbers. Cytogenet Cell Genet 82:263–266.
Svartman M, Vianna-Morgante AM (1999) Comparative genome analysis in American marsupials:chromosome banding and in-situ hybridization. Chromosome Res 7:267–275.
Telenius H, Pelmear AH, Tunnacliffe A, et al. (1992) Cytogenetic analysis by chromosomepainting using DOP-PCR amplified flow-sorted chromosomes. Genes Chromosomes Cancer4:257–263.
Toder R, O’Neill RJ, Wienberg J, O’Brien PC, Voullaire L, Marshall-Graves JA (1997)Comparative chromosome painting between two marsupials: origins of an XX/XY1Y2 sexchromosome system. Mamm Genome 8:418–422.
Yang F, Alkalaeva EZ, Perelman PL, et al. (2003) Reciprocal chromosome painting among human,aardvark, and elephant (superorder Afrotheria) reveals the likely eutherian ancestral karyotype.Proc Natl Acad Sci USA 100:1062–1066.

Chapter 3Marsupial Centomeres and Telomeres: DynamicChromosome Domains
Dawn M. Carone and Rachel J. O’Neill
Abstract What has become clear from a synthesis of work on marsupial chro-mosomes over the last 100 years is that the centromere is more than simply anarchitectural feature of the chromosome. Rather, it has been participant, eitherdirectly or indirectly, in the evolution of the diversity of karyotypes observed in mar-supials. Across marsupial lineages, a family of model species stands out as an idealsystem in which to study centromere function and evolution: macropodines (kanga-roos and wallabies). This chapter focuses on the study of centromeres in marsupials,as both a region critical to ensuring the distribution of sister chromatids to daughtercells during cell division and a chromosomal domain involved in karyotypic stabil-ity and evolution. We will explore the role played by elements found at centromeresand telomeres in cell division and karyotypic change as supported by both historicand current experimental evidence.
Keywords Centromere · Telomere · Small RNA · Retroelement · KERV
3.1 Centromere Evolution in Marsupials
3.1.1 Satellite Sequence Convergence in Macropus
“Satellite DNA” is a phrase that originally applied to satellite bands observedin ultracentrifuge density gradients, yet now is commonly used to describe anytandemly repetitive sequence (John, 1988). It has been known for quite some timethat satellite DNA families can be species and/or group specific (for example, the α
satellites of primates) (Singer, 1982). However, their seemingly ubiquitous presence
R.J. O’Neill (B)Department of Molecular and Cell Biology, Center for Applied Genetics and Technology,University of Connecticut, Storrs, CT 06269, USAe-mail: [email protected]
55J.E. Deakin et al. (eds.), Marsupial Genetics and Genomics,DOI 10.1007/978-90-481-9023-2_3, C© Springer Science+Business Media B.V. 2010
56 D.M. Carone and R.J. O’Neill
at or near centromeric domains across a wide variety of organisms implicates themin centromere function (see Willard, 1990; Csink and Henikoff, 1998; Eichler, 1999;Henikoff et al., 2001; for reviews). Contrarily, studies have shown that, while satel-lites are capable of centromere function, they are neither necessary or required forfunctioning centromere identity. For instance, neocentromeres, aberrant ectopic cen-tromeres, are devoid of satellites. These observations have led to the hypothesis thatkinetochore establishment on chromatin is an epigenetic phenomenon independentof underlying DNA sequence (reviewed in Allshire and Karpen, 2008). The onlycommonality among centromere-associated sequences that have been identified todate is that most comprise large arrays of repeated DNAs. One notable exception tothis includes Saccharomyces cerevisiae within which the centromere is defined asa “point” centromere that consists of only ∼125 bp of DNA (Clarke, 1990). Thissimple structure appears to be an evolutionarily derived characteristic of S. cere-visiae as other fungal species carry arrays of repeats within their centromeres (seeCambareri et al., 1998 for an example).
Several authors have analyzed centromeric DNA in an evolutionary context,although this has proved difficult due to the low conservation of these DNAs andtheir complex sequence evolution. An investigation of chromosome-specific α satel-lite DNA from the chimpanzee chromosome 4 led Haaf and Willard (1997) topostulate that chromosomally-distinct sets of repeats have undergone lineage spe-cific amplification and/or concerted evolution and that most α satellite sequences donot evolve orthologously. Several chromosome specific subsets of α satellite DNAshave also been identified in humans (Greig et al., 1989; Greig et al., 1993; Verma,1999), suggesting that while this family of satellite repeats has been conservedwithin this lineage, there has been extensive chromosome specific diversification.Conversely, studies in plants have shown that some repeated DNA sequences havea conserved centromeric location across a wide range of species (Jiang et al., 1996;Miller et al., 1998).
Recent advancements in the analysis of centromere sequence composition under-scores the importance for an evolutionary framework on which to study howcentromeric repeats influence chromosome, and subsequently species evolution.While the body of knowledge concerning the evolution of centromere-associatedrepeated DNA within species groups is growing, studies examining the correla-tion between these sequences and chromosome evolution within a recently divergedgroup of organisms are limited. The marsupial genus Macropus has been thefocus of such an approach in the context of a karyotypically diverse group, themacropodines.
During the late Pleistocene (126–11 ka) the Macropodidae experienced a diver-sification (Flannery, 1989), ultimately resulting in the three modern subfamilies.Within the fossil record as early as 5 million years ago (MYA) the Macropodinegenera Thylogale, Petrogale and Macropus appeared (Archer, 1984). It is duringthis last major diversification that the evolution of the subfamily Macropodine,and the radiation of the genus Macropus (including the “true” kangaroos andwallabies), occurred. The time since the Macropus diversification has been rela-tively short (between 11 and 4 MYA) (Flannery, 1989; Burk and Springer, 2000),
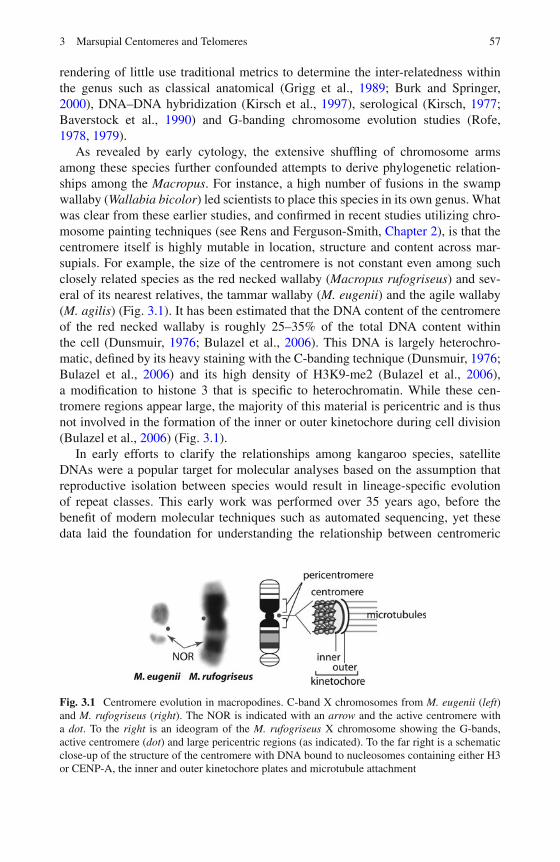
3 Marsupial Centomeres and Telomeres 57
rendering of little use traditional metrics to determine the inter-relatedness withinthe genus such as classical anatomical (Grigg et al., 1989; Burk and Springer,2000), DNA–DNA hybridization (Kirsch et al., 1997), serological (Kirsch, 1977;Baverstock et al., 1990) and G-banding chromosome evolution studies (Rofe,1978, 1979).
As revealed by early cytology, the extensive shuffling of chromosome armsamong these species further confounded attempts to derive phylogenetic relation-ships among the Macropus. For instance, a high number of fusions in the swampwallaby (Wallabia bicolor) led scientists to place this species in its own genus. Whatwas clear from these earlier studies, and confirmed in recent studies utilizing chro-mosome painting techniques (see Rens and Ferguson-Smith, Chapter 2), is that thecentromere itself is highly mutable in location, structure and content across mar-supials. For example, the size of the centromere is not constant even among suchclosely related species as the red necked wallaby (Macropus rufogriseus) and sev-eral of its nearest relatives, the tammar wallaby (M. eugenii) and the agile wallaby(M. agilis) (Fig. 3.1). It has been estimated that the DNA content of the centromereof the red necked wallaby is roughly 25–35% of the total DNA content withinthe cell (Dunsmuir, 1976; Bulazel et al., 2006). This DNA is largely heterochro-matic, defined by its heavy staining with the C-banding technique (Dunsmuir, 1976;Bulazel et al., 2006) and its high density of H3K9-me2 (Bulazel et al., 2006),a modification to histone 3 that is specific to heterochromatin. While these cen-tromere regions appear large, the majority of this material is pericentric and is thusnot involved in the formation of the inner or outer kinetochore during cell division(Bulazel et al., 2006) (Fig. 3.1).
In early efforts to clarify the relationships among kangaroo species, satelliteDNAs were a popular target for molecular analyses based on the assumption thatreproductive isolation between species would result in lineage-specific evolutionof repeat classes. This early work was performed over 35 years ago, before thebenefit of modern molecular techniques such as automated sequencing, yet thesedata laid the foundation for understanding the relationship between centromeric
Fig. 3.1 Centromere evolution in macropodines. C-band X chromosomes from M. eugenii (left)and M. rufogriseus (right). The NOR is indicated with an arrow and the active centromere witha dot. To the right is an ideogram of the M. rufogriseus X chromosome showing the G-bands,active centromere (dot) and large pericentric regions (as indicated). To the far right is a schematicclose-up of the structure of the centromere with DNA bound to nucleosomes containing either H3or CENP-A, the inner and outer kinetochore plates and microtubule attachment
58 D.M. Carone and R.J. O’Neill
DNA and chromosome change. Soon after E.M. Southern published his seminalpaper on the sequence and tandem repeat organization and evolution of the guineapig alpha satellite DNA (Southern, 1970), a satellite sequence from the kangaroorat, Dipodomys ordii was isolated and characterized (Fry et al., 1973), placing thismarsupial species among the first mammals for which satellite sequences were ana-lyzed. Using similar centrifugation techniques, satellite DNA was isolated for thered-necked wallaby (Macropus rufogriseus), red kangaroo (M. rufus) and wallaroo(M. robustus) (Dunsmuir, 1976; Dennis et al., 1980; Peacock et al., 1981; Venoliaand Peacock, 1981; Elizur et al., 1982).
More recently, Bulazel et al. (2007) used a microdissection and microcloningapproach to construct a library of sequences found at the centromere of theX chromosome of M. rufogriseus. Within this library, three different satellites werefurther characterized based on their sequence, function and distribution across thekaryotype. Sat23 was found at all centromeres of this species and functions asthe primary satellite, with a periodicity of 178 nt and a functional CENP-B DNAbinding domain, evidence that it is a functional component of the centromere.Two other satellites, sat1 and B29, were found restricted to the sex chromosomes,although sat1 was also found at the pericentromere of chromosome 2 (Bulazel et al.,2007). This autosomal localization was the first clue that there may be a tighterassociation between chromosome shuffling and centromere satellites than previ-ously recognized as this location on chromosome 2 is part of a fusion chromosomewith the X chromosome and chromosome 7 in another macopodid species, Wallabiabicolor (the swamp wallaby) (Toder et al., 1997).
Having a suite of three different satellites, with different distributions within thekaryotype of M. rufogriseus allowed us to build on, and extend, the studies into theevolution of satellites and chromosomes within macropodidae (Bulazel et al., 2007)initiated decades ago. To this end, an accurate species phylogeny was determinedbased on both a nuclear (TRSP) and mitochondrial gene (cytb) for nine Macropusspecies (inclusive of Wallabia) (Fig. 3.2). This phylogeny was then compared tothat derived from a novel approach using chromosome segments as phylogeneticmarkers. In this method, each conserved chromosome segment (as defined by Renset al., 2003) is transformed into a binary code and input into the MGR algo-rithm (multiple genome rearrangement tool) used primarily to analyze sequencedata between different genomes (Bourque and Pevzner, 2002). Using the conservedchromosome segments in this fashion allowed for the derivation of a chromosomephylogeny; in other words, a phylogeny representing the most parsimonious seriesof rearrangements possible to derive current karyotypes within Macropus with noconsideration of the true phylogenetic relationships of these species. When the chro-mosome phylogeny and “true” species phylogeny are compared to one another,it is clear they are not concordant, indicating that similar karyotypes have beenderived in distantly related species not by shared ancestry, but by convergent break-point reuse. Closer examination of the conserved chromosome segments involvedin this reuse showed that only a subset of breakpoints between segments wereinvolved in the derivation of extant karyotypes (C1, C2, C8, C10, C15 and C18)and all involved a centromere. A question emerging from this work was: What is
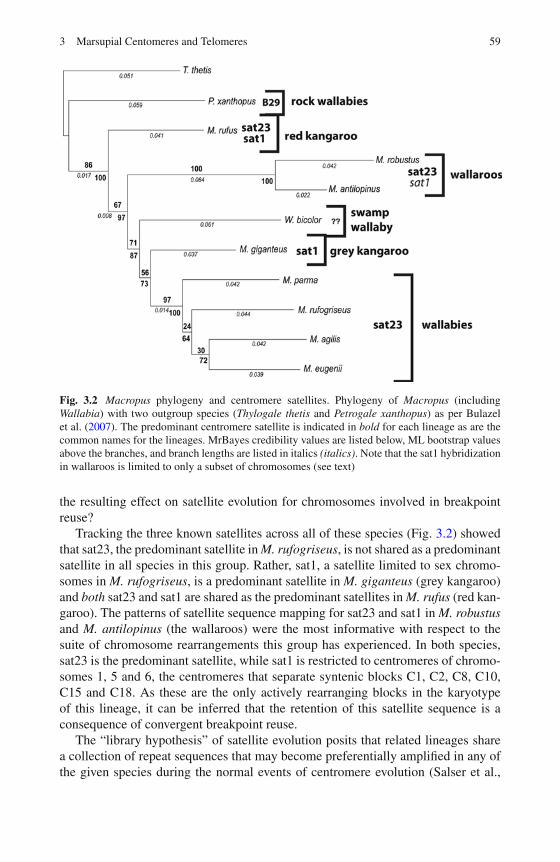
3 Marsupial Centomeres and Telomeres 59
Fig. 3.2 Macropus phylogeny and centromere satellites. Phylogeny of Macropus (includingWallabia) with two outgroup species (Thylogale thetis and Petrogale xanthopus) as per Bulazelet al. (2007). The predominant centromere satellite is indicated in bold for each lineage as are thecommon names for the lineages. MrBayes credibility values are listed below, ML bootstrap valuesabove the branches, and branch lengths are listed in italics (italics). Note that the sat1 hybridizationin wallaroos is limited to only a subset of chromosomes (see text)
the resulting effect on satellite evolution for chromosomes involved in breakpointreuse?
Tracking the three known satellites across all of these species (Fig. 3.2) showedthat sat23, the predominant satellite in M. rufogriseus, is not shared as a predominantsatellite in all species in this group. Rather, sat1, a satellite limited to sex chromo-somes in M. rufogriseus, is a predominant satellite in M. giganteus (grey kangaroo)and both sat23 and sat1 are shared as the predominant satellites in M. rufus (red kan-garoo). The patterns of satellite sequence mapping for sat23 and sat1 in M. robustusand M. antilopinus (the wallaroos) were the most informative with respect to thesuite of chromosome rearrangements this group has experienced. In both species,sat23 is the predominant satellite, while sat1 is restricted to centromeres of chromo-somes 1, 5 and 6, the centromeres that separate syntenic blocks C1, C2, C8, C10,C15 and C18. As these are the only actively rearranging blocks in the karyotypeof this lineage, it can be inferred that the retention of this satellite sequence is aconsequence of convergent breakpoint reuse.
The “library hypothesis” of satellite evolution posits that related lineages sharea collection of repeat sequences that may become preferentially amplified in any ofthe given species during the normal events of centromere evolution (Salser et al.,
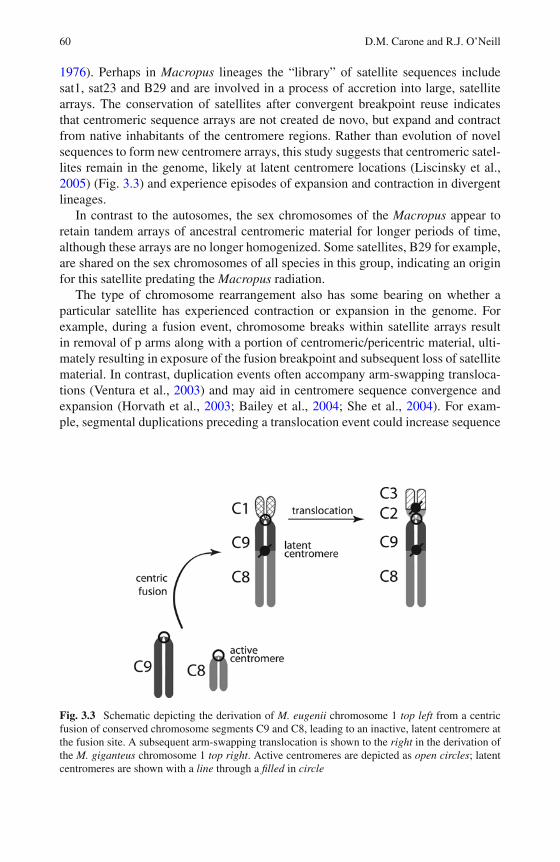
60 D.M. Carone and R.J. O’Neill
1976). Perhaps in Macropus lineages the “library” of satellite sequences includesat1, sat23 and B29 and are involved in a process of accretion into large, satellitearrays. The conservation of satellites after convergent breakpoint reuse indicatesthat centromeric sequence arrays are not created de novo, but expand and contractfrom native inhabitants of the centromere regions. Rather than evolution of novelsequences to form new centromere arrays, this study suggests that centromeric satel-lites remain in the genome, likely at latent centromere locations (Liscinsky et al.,2005) (Fig. 3.3) and experience episodes of expansion and contraction in divergentlineages.
In contrast to the autosomes, the sex chromosomes of the Macropus appear toretain tandem arrays of ancestral centromeric material for longer periods of time,although these arrays are no longer homogenized. Some satellites, B29 for example,are shared on the sex chromosomes of all species in this group, indicating an originfor this satellite predating the Macropus radiation.
The type of chromosome rearrangement also has some bearing on whether aparticular satellite has experienced contraction or expansion in the genome. Forexample, during a fusion event, chromosome breaks within satellite arrays resultin removal of p arms along with a portion of centromeric/pericentric material, ulti-mately resulting in exposure of the fusion breakpoint and subsequent loss of satellitematerial. In contrast, duplication events often accompany arm-swapping transloca-tions (Ventura et al., 2003) and may aid in centromere sequence convergence andexpansion (Horvath et al., 2003; Bailey et al., 2004; She et al., 2004). For exam-ple, segmental duplications preceding a translocation event could increase sequence
Fig. 3.3 Schematic depicting the derivation of M. eugenii chromosome 1 top left from a centricfusion of conserved chromosome segments C9 and C8, leading to an inactive, latent centromere atthe fusion site. A subsequent arm-swapping translocation is shown to the right in the derivation ofthe M. giganteus chromosome 1 top right. Active centromeres are depicted as open circles; latentcentromeres are shown with a line through a filled in circle
3 Marsupial Centomeres and Telomeres 61
identity between sites on non-homologous chromosomes, making such translocationevents more likely (Eichler, 1999).
What this rich field of research has shown is that, when examined in the con-text of species evolution, satellite sequence evolution is found to strictly followchromosome trajectories. Tracking satellites has uncovered interesting patterns ofchromosome change and further supports the thesis that the centromere plays anactive, dynamic role in karyotype change.
3.1.2 KERV, Centromeres and Evolutionary Breakpoints
Kangaroo Endogenous Retrovirus (KERV), an endogenous retrovirus (ERV), is resi-dent in centromeres of most marsupial lineages (Ferreri et al., 2004; Liscinsky et al.,2005; Carone and Ferreri, personal communication). While lacking an open readingframe for an envelope protein (env, required to form an infectious virion), KERVhas a typical ERV structure consisting of open reading frames for gag, pro, pol, andint and two identical long terminal repeats (LTRs). Initial studies into the genomicdistribution of KERV focused on M. eugenii, a marsupial model organism for whichconsiderable sequence data has been generated and is the focus of a concertedgenome sequencing initiative (Graves et al., 2003).
Within M. eugenii, KERV is found concentrated within centromeres, telomeres,and evolutionary breakpoints (EBs) (Ferreri et al., 2004). Further refinement of thelocalization of KERV copies conducted through a screen of a M. eugenii bacterialartificial chromosome (BAC) library with the gag region revealed this element tobe resident in extremely high copy number in M. eugenii (∼10% KERV-positivesignal per single BAC filter) (Ferreri et al., 2004). Fluorescence in situ hybridiza-tion of 49 KERV-positive BAC clones has further specified the KERV genomicdistribution to active centromere regions (pericentric or centric), telomeres or EBswithin the Macropodidae lineage (Ferreri et al., 2004; Liscinsky et al., 2005; Longoet al., 2009). Taking into account the location of centromeres within all macropodspecies, 100% of these clones map to active centromere or latent (old) centromeresites (Liscinsky et al., 2005). Whether these sites have the ability to potentiate newcentromere sites or re-activate latent sites is a current focus of research. Several linesof evidence indicate that EBs and latent centromere sites within macropods retainmany sequence features of active centromere sites, therefore harboring the ability tobecome active centromeres.
EBs were originally thought to occur at random locations in the genome (Nadeauand Taylor, 1984). However, more recent evidence has suggested that these sites areoften conserved even among divergent species (Pevzner and Tesler, 2003; Murphyet al., 2005) and harbor repetitive sequences which may render them prone tobreakage (Schibler et al., 2006). The observation of KERV retention at EBs withinmacropods prompted an investigation of the sequences resident at EBs, centromeres(CENs), and euchromatic regions (EUs). This study has highlighted the sequencesignatures at these locations and uncovered several features common to EBs andCENs (Longo et al., 2009). Detailed annotation and comparison of M. eugenii
62 D.M. Carone and R.J. O’Neill
BACs mapped by fluorescence in situ hybridization to CENs, EBs, and EU regionssuggests that repetitive elements are enriched at CENs and EBs compared to EUregions. Close examination of the distinct repetitive element classes resident atthese locations indicated that long interspersed nucleotide elements (LINEs) andERVs showed a significantly higher enrichment for CENs and EBs compared toEU regions. In addition, CENs and EBs were relatively devoid of short interspersednucleotide elements compared to EU regions, suggesting that the sequence compo-sition of CENs and EBs are more similar to each other than to EU regions. Of theERVs examined, the overwhelmingly most abundant sequence found at CEN andEB regions was KERV, further supporting the non-random distribution of KERVpreviously seen by BAC mapping (Ferreri et al., 2004; Liscinsky et al., 2005).
3.2 Centromere Function
3.2.1 KERV and Small RNAs
The strict localization of KERV at CENs and EBs suggests that KERV is an elementthat has been selected for centromeric sites (active or latent) or, at the very least,selectively maintained over significant evolutionary time at these locations. Thislevel of sequence conservation across marsupial lineages and across the karyotypeis unprecedented for centromeres, as centromeres are prone to sequence degrada-tion and often harbor divergent sequences even among closely related species, anobservation termed the centromere paradox (Henikoff et al., 2001). KERV retentionat CENs and EBs is therefore the exception to the rule and has prompted an inves-tigation into whether KERV maintains a functional role in the genome, other thanthat of a selfish element.
While intact, full-length KERV elements are found at both CEN and EB sites,there is also an enrichment of solo KERV LTRs (kLTRs) at CENs and EBs com-pared to EU regions (Longo et al., 2009). This observation is intriguing whentaking retroviral structure and function into account since the LTRs of retrovirusesare known to contain strong promoters that facilitate transcription of these selfishelements upon integration (Coffin et al., 1997). In addition, some retroviral pro-moters are known to promote transcription bidirectionally (Dunn et al., 2006) andcan be responsible for promoting transcription of adjacent surrounding sequences(Danilevskaya et al., 1997; Dunn et al., 2006). Further investigation into the pro-moter status of the kLTR using a GFP transfection assay indicates that the kLTRsequence does, in fact, contain a strong bidirectional promoter (Carone et al.,2009).
Transcription of centromeric sequences has been observed for almost all eukary-otic species examined to date (reviewed in Allshire and Karpen, 2008) andretroelements have been implicated in promoting transcription of these sequences(May et al., 2005; Ugarkovic, 2005), namely satellites (see satellite sequence sec-tion) which do not contain known promoter binding sites. High-resolution mappingof kLTR and centromeric satellites (sat23) localized by fiber FISH in M. eugenii has
3 Marsupial Centomeres and Telomeres 63
revealed that solo kLTRs are interspersed within sat23 arrays in tammar centromeres(Carone et al., 2009). It is therefore likely that kLTR bidirectional promoters resi-dent at CENs not only promote transcription of KERV elements, but also facilitatethe transcription of its nearest resident neighbor, sat23. Interestingly, this structureof interspersed satellite and retroelement sequences has also been observed in plantcentromeres (Cheng et al., 2002), indicating this sequence arrangement may be aconserved feature of eukaryotic centromeres (or at least of the core).
Transcripts emanating from centromeric satellites have been linked to centromerefunction in several species ranging from yeast to human (Reinhart and Bartel,2002; Volpe et al., 2002; Volpe et al., 2003; Fukagawa et al., 2004; Bouzinba-Segard et al., 2006) through processing by RNA interference (RNAi) machineryinto short interfering RNAs (siRNAs). RNAi is best known for its role in regula-tion of gene expression via small RNA intermediates. Originally discovered in C.elegans (Fire et al., 1998), this conserved mechanism has since been reported inspecies ranging from Drosophila melanogaster (Kennerdell and Carthew, 2000) tomouse (Wianny and Zernicka-Goetz, 2000). Within the past 10 years, three mainclasses of small RNAs have been described with wide ranging targets and effects.The first, microRNAs (miRNA), are generated from hairpin precursors. Processingof hairpin dsRNA into miRNA occurs in two stages: in the nucleus, Drosha pro-cesses hairpin RNA to ∼70 nt pre-miRNAs (Lee et al., 2003); following transportto the cytoplasm, the pre-miRNAs are processed by the RNase III-like enzymeDicer to ∼22 nt mature miRNAs. The second class of small RNA, short inter-fering RNAs (siRNAs), unlike miRNAs, are generated from long double-strandedRNA (dsRNA) precursors but also processed into ∼21–22 nt by Dicer. Silencingvia miRNAs and siRNAs occurs by homologous pairing to target mRNAs of onestrand of the Dicer product (the “guide” strand). Targeting of miRNAs/siRNAs totheir respective targets is facilitated by the RNA-induced silencing complex (RISC)(Hammond et al., 2000). Alternatively, siRNAs may be recruited by the RNAiinduced transcriptional silencing complex (RITS) to facilitate the targeting of epige-netic regulators to centromeric heterochromatin (Verdel et al., 2004). The third class,piwi-interacting RNAs (piRNAs), are a class of Dicer processing-independent smallRNAs found in the germline that are involved in transposon silencing and germlinedevelopment (Klattenhoff and Theurkauf, 2008). These RNAs are larger than theirmiRNA/siRNA counterparts (24–30 nt) and processed via an unknown mechanism.The specific role of piRNAs is not well understood, but new evidence indicatesthese small RNAs are maternally inherited and may play a role in hybrid dysgenesis(Brennecke et al., 2008).
In yeast (Verdel et al., 2004) and plants (Topp et al., 2004; May et al., 2005;Neumann et al., 2007) double stranded centromeric satellite transcripts are pro-cessed into siRNA and have been shown to recruit epigenetic modifications topericentric heterochromatin in yeast (Volpe et al., 2002) to propagate epigeneticmarks at the centromere. The presence of long satellite transcripts and/or siRNAsprocessed from mammalian centromeric satellites have been difficult to find, pos-sibly due to the rapid turnover of larger transcripts or an alternative mechanism ofprocessing. However, it is apparent that aberrant regulation of satellite sequences
64 D.M. Carone and R.J. O’Neill
(Valgardsdottir et al., 2005; Bouzinba-Segard et al., 2006) and abrogation of theRNAi machinery (Fukagawa et al., 2004; Kanellopoulou et al., 2005) in mammalsleads to impaired centromere function, indicating that these transcripts are undersome mechanism of tight regulation.
Investigations into the role of KERV in M. eugenii centromeres has revealed anew mechanism for transcription of centromere satellite and retroviral sequencesand a new class of small RNA that may be conserved in other mammalian sys-tems. KERV and sat23 transcripts in M. eugenii are processed into a class ofsmall RNA distinct from siRNA, miRNA and piRNAs based on their size (Caroneet al., 2009). This new class of small RNAs emanating from satellite and retroviralsequences at the centromere, called centromere repeat associated small interactingRNAs (crasiRNAs), are 34–42 nt and are thought to be processed from KERV andsat23 dsRNA precursors which are transcribed by the kLTR bidirectional promoter(Carone et al., 2009). Further investigation will determine if this is a conservedmammalian mechanism for processing of centromeric transcripts and shed light onthe regulatory elements involved in the biogenesis of this new class of small RNA.It is clear that transcription of centromeric sequences is under tight regulation inmammals, including the tammar wallaby, and that the role of retroviral promot-ers in facilitating this process may be an integral part of mammalian centromerefunction.
3.3 Hybrid Dysgenesis and Karyotypic Change
Despite the diversification of karyotypes within the Macropodinae, reproductive iso-lation has not formed a complete barrier to interspecific hybridization across allspecies. Hybrids have been identified in the wild and created in captive colonies(Fig. 3.4a) for many species within both the Macropus (including Wallabia) andPetrogale genera (Sharman et al., 1990; Eldridge and Close, 1992; Lowry et al.,1994; O’Neill et al., 1998; O’Neill et al., 2001; O’Neill et al., 2004; Metcalfe et al.,2007). Such interspecific hybrids have long been an essential tool in the study ofgenetics and evolutionary biology. As is usually the case in genetic research, abnor-mal or mutated states offer the best opportunity to gain a better understanding ofnormal processes. The abnormalities seen most often in interspecific hybrids, knowngenerally as “hybrid dysgenesis” are perturbations of development and reproductivecapacity.
The causes of hybrid dysgenesis have been a subject of considerable debate since1922, when J.B.S. Haldane made his famous observation, known as Haldane’s Rule(Haldane, 1922), that in hybrid zones, it is most often the heterogametic sex thatis sterile or inviable. The remarkable generality of Haldane’s Rule suggests thatthere is a basic commonality to the genetic defects seen in hybrids. For example,at a gross level, many hybrids suffer from chromosomal aberrations at much higherfrequencies than their parent species. One of the primary causes of chromosomalrearrangement, aside from exogenous insults by radiation or chemical mutagens, isthe activity of endogenous mobile DNA.
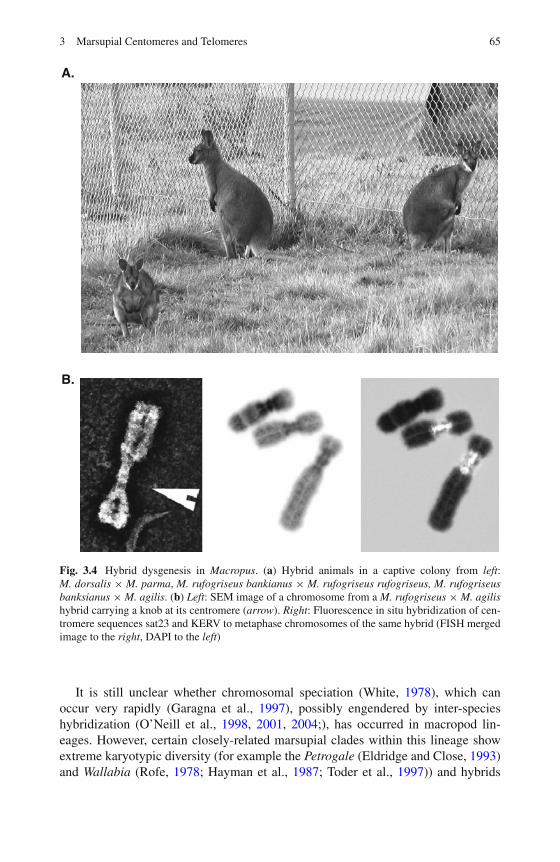
3 Marsupial Centomeres and Telomeres 65
A.
B.
Fig. 3.4 Hybrid dysgenesis in Macropus. (a) Hybrid animals in a captive colony from left:M. dorsalis × M. parma, M. rufogriseus bankianus × M. rufogriseus rufogriseus, M. rufogriseusbanksianus × M. agilis. (b) Left: SEM image of a chromosome from a M. rufogriseus × M. agilishybrid carrying a knob at its centromere (arrow). Right: Fluorescence in situ hybridization of cen-tromere sequences sat23 and KERV to metaphase chromosomes of the same hybrid (FISH mergedimage to the right, DAPI to the left)
It is still unclear whether chromosomal speciation (White, 1978), which canoccur very rapidly (Garagna et al., 1997), possibly engendered by inter-specieshybridization (O’Neill et al., 1998, 2001, 2004;), has occurred in macropod lin-eages. However, certain closely-related marsupial clades within this lineage showextreme karyotypic diversity (for example the Petrogale (Eldridge and Close, 1993)and Wallabia (Rofe, 1978; Hayman et al., 1987; Toder et al., 1997)) and hybrids
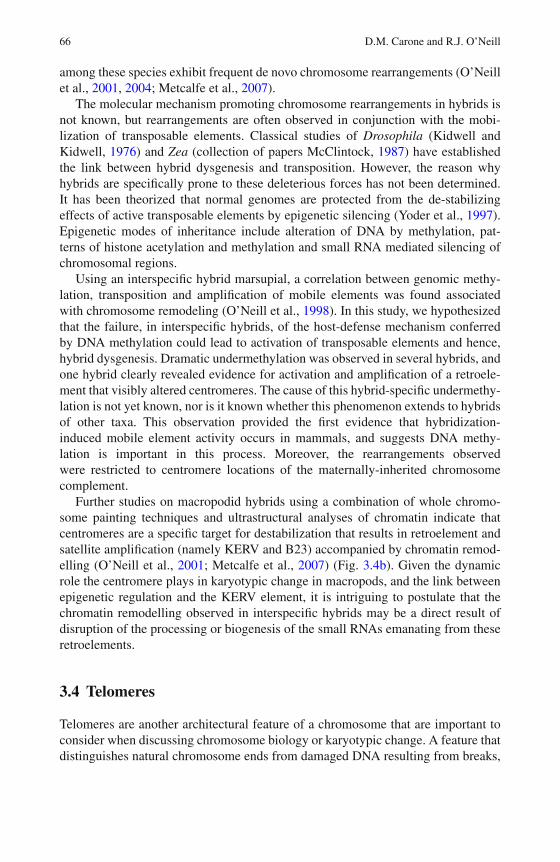
66 D.M. Carone and R.J. O’Neill
among these species exhibit frequent de novo chromosome rearrangements (O’Neillet al., 2001, 2004; Metcalfe et al., 2007).
The molecular mechanism promoting chromosome rearrangements in hybrids isnot known, but rearrangements are often observed in conjunction with the mobi-lization of transposable elements. Classical studies of Drosophila (Kidwell andKidwell, 1976) and Zea (collection of papers McClintock, 1987) have establishedthe link between hybrid dysgenesis and transposition. However, the reason whyhybrids are specifically prone to these deleterious forces has not been determined.It has been theorized that normal genomes are protected from the de-stabilizingeffects of active transposable elements by epigenetic silencing (Yoder et al., 1997).Epigenetic modes of inheritance include alteration of DNA by methylation, pat-terns of histone acetylation and methylation and small RNA mediated silencing ofchromosomal regions.
Using an interspecific hybrid marsupial, a correlation between genomic methy-lation, transposition and amplification of mobile elements was found associatedwith chromosome remodeling (O’Neill et al., 1998). In this study, we hypothesizedthat the failure, in interspecific hybrids, of the host-defense mechanism conferredby DNA methylation could lead to activation of transposable elements and hence,hybrid dysgenesis. Dramatic undermethylation was observed in several hybrids, andone hybrid clearly revealed evidence for activation and amplification of a retroele-ment that visibly altered centromeres. The cause of this hybrid-specific undermethy-lation is not yet known, nor is it known whether this phenomenon extends to hybridsof other taxa. This observation provided the first evidence that hybridization-induced mobile element activity occurs in mammals, and suggests DNA methy-lation is important in this process. Moreover, the rearrangements observedwere restricted to centromere locations of the maternally-inherited chromosomecomplement.
Further studies on macropodid hybrids using a combination of whole chromo-some painting techniques and ultrastructural analyses of chromatin indicate thatcentromeres are a specific target for destabilization that results in retroelement andsatellite amplification (namely KERV and B23) accompanied by chromatin remod-elling (O’Neill et al., 2001; Metcalfe et al., 2007) (Fig. 3.4b). Given the dynamicrole the centromere plays in karyotypic change in macropods, and the link betweenepigenetic regulation and the KERV element, it is intriguing to postulate that thechromatin remodelling observed in interspecific hybrids may be a direct result ofdisruption of the processing or biogenesis of the small RNAs emanating from theseretroelements.
3.4 Telomeres
Telomeres are another architectural feature of a chromosome that are important toconsider when discussing chromosome biology or karyotypic change. A feature thatdistinguishes natural chromosome ends from damaged DNA resulting from breaks,
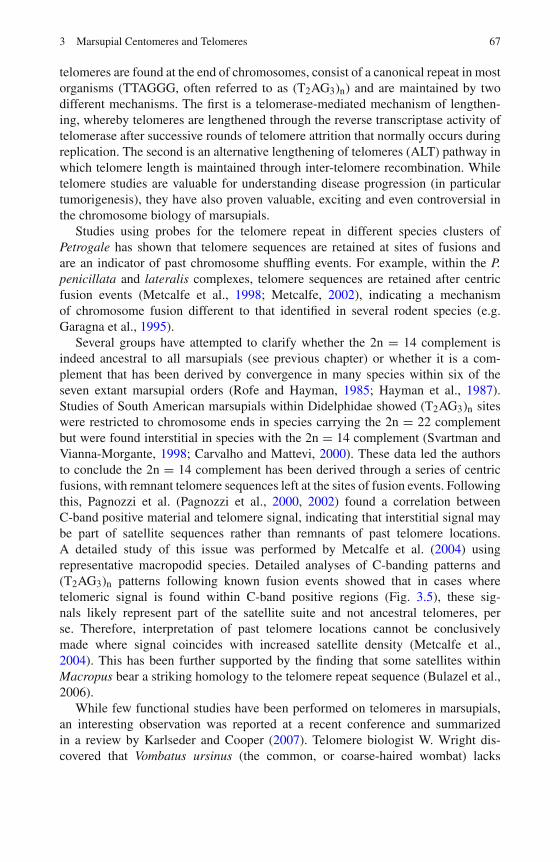
3 Marsupial Centomeres and Telomeres 67
telomeres are found at the end of chromosomes, consist of a canonical repeat in mostorganisms (TTAGGG, often referred to as (T2AG3)n) and are maintained by twodifferent mechanisms. The first is a telomerase-mediated mechanism of lengthen-ing, whereby telomeres are lengthened through the reverse transcriptase activity oftelomerase after successive rounds of telomere attrition that normally occurs duringreplication. The second is an alternative lengthening of telomeres (ALT) pathway inwhich telomere length is maintained through inter-telomere recombination. Whiletelomere studies are valuable for understanding disease progression (in particulartumorigenesis), they have also proven valuable, exciting and even controversial inthe chromosome biology of marsupials.
Studies using probes for the telomere repeat in different species clusters ofPetrogale has shown that telomere sequences are retained at sites of fusions andare an indicator of past chromosome shuffling events. For example, within the P.penicillata and lateralis complexes, telomere sequences are retained after centricfusion events (Metcalfe et al., 1998; Metcalfe, 2002), indicating a mechanismof chromosome fusion different to that identified in several rodent species (e.g.Garagna et al., 1995).
Several groups have attempted to clarify whether the 2n = 14 complement isindeed ancestral to all marsupials (see previous chapter) or whether it is a com-plement that has been derived by convergence in many species within six of theseven extant marsupial orders (Rofe and Hayman, 1985; Hayman et al., 1987).Studies of South American marsupials within Didelphidae showed (T2AG3)n siteswere restricted to chromosome ends in species carrying the 2n = 22 complementbut were found interstitial in species with the 2n = 14 complement (Svartman andVianna-Morgante, 1998; Carvalho and Mattevi, 2000). These data led the authorsto conclude the 2n = 14 complement has been derived through a series of centricfusions, with remnant telomere sequences left at the sites of fusion events. Followingthis, Pagnozzi et al. (Pagnozzi et al., 2000, 2002) found a correlation betweenC-band positive material and telomere signal, indicating that interstitial signal maybe part of satellite sequences rather than remnants of past telomere locations.A detailed study of this issue was performed by Metcalfe et al. (2004) usingrepresentative macropodid species. Detailed analyses of C-banding patterns and(T2AG3)n patterns following known fusion events showed that in cases wheretelomeric signal is found within C-band positive regions (Fig. 3.5), these sig-nals likely represent part of the satellite suite and not ancestral telomeres, perse. Therefore, interpretation of past telomere locations cannot be conclusivelymade where signal coincides with increased satellite density (Metcalfe et al.,2004). This has been further supported by the finding that some satellites withinMacropus bear a striking homology to the telomere repeat sequence (Bulazel et al.,2006).
While few functional studies have been performed on telomeres in marsupials,an interesting observation was reported at a recent conference and summarizedin a review by Karlseder and Cooper (2007). Telomere biologist W. Wright dis-covered that Vombatus ursinus (the common, or coarse-haired wombat) lacks
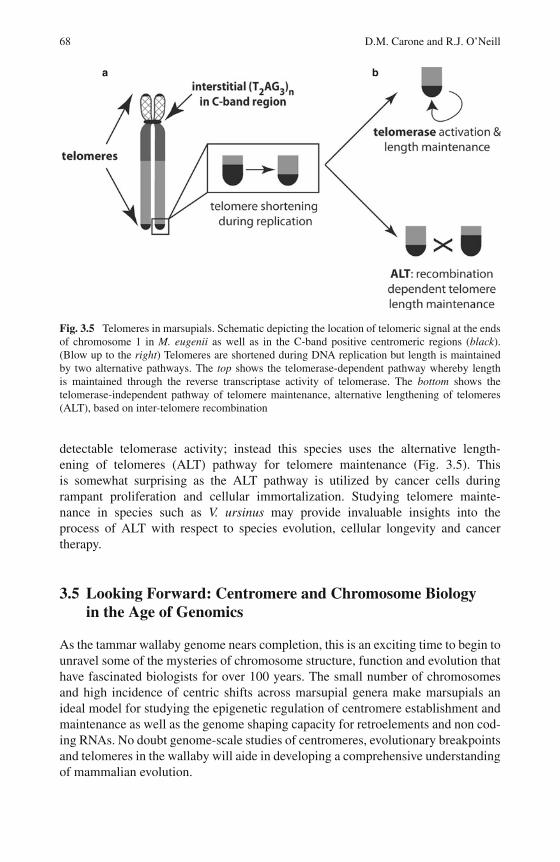
68 D.M. Carone and R.J. O’Neill
a b
Fig. 3.5 Telomeres in marsupials. Schematic depicting the location of telomeric signal at the endsof chromosome 1 in M. eugenii as well as in the C-band positive centromeric regions (black).(Blow up to the right) Telomeres are shortened during DNA replication but length is maintainedby two alternative pathways. The top shows the telomerase-dependent pathway whereby lengthis maintained through the reverse transcriptase activity of telomerase. The bottom shows thetelomerase-independent pathway of telomere maintenance, alternative lengthening of telomeres(ALT), based on inter-telomere recombination
detectable telomerase activity; instead this species uses the alternative length-ening of telomeres (ALT) pathway for telomere maintenance (Fig. 3.5). Thisis somewhat surprising as the ALT pathway is utilized by cancer cells duringrampant proliferation and cellular immortalization. Studying telomere mainte-nance in species such as V. ursinus may provide invaluable insights into theprocess of ALT with respect to species evolution, cellular longevity and cancertherapy.
3.5 Looking Forward: Centromere and Chromosome Biologyin the Age of Genomics
As the tammar wallaby genome nears completion, this is an exciting time to begin tounravel some of the mysteries of chromosome structure, function and evolution thathave fascinated biologists for over 100 years. The small number of chromosomesand high incidence of centric shifts across marsupial genera make marsupials anideal model for studying the epigenetic regulation of centromere establishment andmaintenance as well as the genome shaping capacity for retroelements and non cod-ing RNAs. No doubt genome-scale studies of centromeres, evolutionary breakpointsand telomeres in the wallaby will aide in developing a comprehensive understandingof mammalian evolution.
3 Marsupial Centomeres and Telomeres 69
References
Allshire RC, Karpen GH (2008) Epigenetic regulation of centromeric chromatin: old dogs, newtricks? Nat Rev Genet 9:923–937.
Archer M (1984) Evolution of arid Australia and its consequences for vertebrates. In: Archer M,Clayton G (eds) Vertebrate Zoogeography and Evolution in Australasia. Southwood Press,Marrickville.
Bailey JA, Baertsch R, Kent WJ, Haussler D, Eichler EE (2004) Hotspots of mammalianchromosomal evolution. Genome Biol 5:R23.
Baverstock PR, Krieg M, Birrell J (1990) Evolutionary Relationships of Australian Marsupials andAssessed by Albumin Immunology. Aust J Zool 37:273–287.
Bourque G, Pevzner PA (2002) Genome-scale evolution: reconstructing gene orders in the ancestralspecies. Genome Res 12:26–36.
Bouzinba-Segard H, Guais A, Francastel C (2006) Accumulation of small murine minor satellitetranscripts leads to impaired centromeric architecture and function. Proc Natl Acad Sci USA103:8709–8714.
Brennecke J, Malone CD, Aravin AA, Sachidanandam R, Stark A, Hannon GJ (2008) An epige-netic role for maternally inherited piRNAs in transposon silencing. Science 322:1387–1392.
Bulazel K, Metcalfe C, Ferreri G, Yu J, Eldridge M, O’Neill R (2006) Cytogenetic and molec-ular evaluation of centromere-associated DNA sequences from a marsupial (Macropodidae:Macropus rufogriseus) X chromosome. Genetics 172:1129–1137.
Bulazel KV, Ferreri GC, Eldridge MD, O’Neill RJ (2007) Species-specific shifts in centromeresequence composition are coincident with breakpoint reuse in karyotypically divergent lin-eages. Genome Biol 8:R170.
Burk A, Springer M (2000) Intergeneric relationships among Macropodoidea (Metatheria:Diprotodontia) and the chronicle of kangaroo evolution. J Mammal Evol 7:213–237.
Cambareri EB, Aisner R, Carbon J (1998) Structure of the chromosome VII centromere region inNeurospora crassa: degenerate transposons and simple repeats. Mol Cell Biol 18:5465–5477.
Carone DM, Longo MS, Ferreri GC, et al. (2009) A new class of retroviral and satellite encodedsmall RNAs emanates from mammalian centromeres. Chromosoma 118:113–125.
Carvalho BD, Mattevi MS (2000) (T2AG3)n telomeric sequence hybridization suggestive ofcentric fusion in karyotype marsupials evolution. Genetica 108:205–210.
Cheng Z, Dong F, Langdon T, et al. (2002) Functional rice centromeres are marked by a satelliterepeat and a centromere-specific retrotransposon. Plant Cell 14:1691–1704.
Clarke L (1990) Centromeres of budding and fission yeasts. Trends Genet 6:150–154.Coffin JM, Hughes SH, Varmus HE (1997) Retroviruses. Cold Spring Harbor Laboratory Press,
Cold Spring Harbor, NY.Csink AK, Henikoff S (1998) Something from nothing: the evolution and utility of satellite repeats.
Trends Genet 14:200–204.Danilevskaya ON, Arkhipova IR, Traverse KL, Pardue ML (1997) Promoting in tandem: the pro-
moter for telomere transposon HeT-A and implications for the evolution of retroviral LTRs.Cell 88:647–655.
Dennis ES, Dunsmuir P, Peacock WJ (1980) Segmental amplification in a satellite DNA: restrictionenzyme analysis of the major satellite of Macropus rufogriseus. Chromosoma 79:179–198.
Dunn CA, Romanish MT, Gutierrez LE, van de Lagemaat LN, Mager DL (2006) Transcription oftwo human genes from a bidirectional endogenous retrovirus promoter. Gene 366:335–342.
Dunsmuir P (1976) Satellite DNA in the kangaroo Macropus rufogriseus. Chromosoma 56:111–125.
Eichler EE (1999) Repetitive conundrums of centromere structure and function. Hum Mol Genet8:151–155.
Eldridge MD, Close RL (1992) Taxonomy of rock wallabies, Petrogale (Marsupialia:Macropodidae). I: a revision of the eastern Petrogale with the description of three new species.Aust J Zool 40:605–624.
70 D.M. Carone and R.J. O’Neill
Eldridge MD, Close RL (1993) Radiation of chromosome shuffles. Curr Opin Genet Dev 3:915–922.
Elizur A, Dennis ES, Peacock WJ (1982) Satellite DNA sequences in the red kangaroo (Macropusrufus). Aust J Biol Sci 35:313–325.
Ferreri GC, Marzelli M, Rens W, O’Neill RJ (2004) A centromere-specific retroviral ele-ment associated with breaks of synteny in macropodine marsupials. Cytogenet Genome Res107:115–118.
Fire A, Xu S, Montgomery MK, Kostas SA, Driver SE, Mello CC (1998) Potent and specificgenetic interference by double-stranded RNA in Caenorhabditis elegans. Nature 391:806–811.
Flannery TF (1989) Phylogeny of the Macropodoidea; a study in convergence. In: Grigg G, JarmanP, Hume I (eds) Kangaroos, Wallabies and Rat-Kangaroos. Surrey Beatty and Sons, ChippingNorton.
Fry K, Poon R, Whitcome P, et al. (1973) Nucleotide sequence of HS-beta satellite DNA fromkangaroo rat Dipodomys ordii. Proc Natl Acad Sci USA 70:2642–2646.
Fukagawa T, Nogami M, Yoshikawa M, et al. (2004) Dicer is essential for formation of theheterochromatin structure in vertebrate cells. Nat Cell Biol 6:784–791.
Garagna S, Broccoli D, Redi CA, Searle JB, Cooke HJ, Capanna E (1995) Robertsonian meta-centrics of the house mouse lose telomeric sequences but retain some minor satellite DNA inthe pericentromeric area. Chromosoma 103:685–692.
Garagna S, Zuccotti M, Redi CA, Capanna E (1997) Trapping speciation. Nature 390:241–242.Graves JAM, Wakefield MJ, Renfree MB, Cooper DW, Speed T, Lindblad-Toh K, Lander
ES, Wilson RK (2003) Proposal to Sequence the Genome of the Model MarsupialMacropus eugenii (Tammar Wallaby). http://wwwgenomegov/Pages/Research/Sequencing/SeqProposals/WallabySEQpdf
Greig GM, Warburton PE, Willard HF (1993) Organization and evolution of an alpha satellite DNAsubset shared by human chromosomes 13 and 21. J Mol Evol 37:464–475.
Greig GM, England SB, Bedford HM, Willard HF (1989) Chromosome-specific alpha satelliteDNA from the centromere of human chromosome 16. Am J Hum Genet 45:862–872.
Grigg GC, Jarman P, Hume ID (1989) Kangaroos, Wallabies and Rat-Kangaroos. Surrey Beatty &Sons, Chipping Norton.
Haaf T, Willard HF (1997) Chromosome-specific alpha-satellite DNA from the centromere ofchimpanzee chromosome 4. Chromosoma 106:226–232.
Haldane JBS (1922) Sex ratio and unisexual sterility in hybrid animals. J Genet 12:101–109.Hammond SM, Bernstein E, Beach D, Hannon GJ (2000) An RNA-directed nuclease mediates
post-transcriptional gene silencing in Drosophila cells. Nature 404:293–296.Hayman DL, Rofe RH, Sharp PJ (1987) Chromosome evolution in marsupials. Chromosomes
Today 9:91–102.Henikoff S, Ahmad K, Malik HS (2001) The centromere paradox: stable inheritance with rapidly
evolving DNA. Science 293:1098–1102.Horvath JE, Gulden CL, Bailey JA, et al. (2003) Using a pericentromeric interspersed repeat to
recapitulate the phylogeny and expansion of human centromeric segmental duplications. MolBiol Evol 20:1463–1479.
Jiang J, Nasuda S, Dong F, et al. (1996) A conserved repetitive DNA element located in thecentromeres of cereal chromosomes. Proc Natl Acad Sci USA 93:14210–14213.
John B (1988) Heterochromatin Molecular and Structural Aspects. Cambridge University Press,Cambridge, MA.
Kanellopoulou C, Muljo SA, Kung AL, et al. (2005) Dicer-deficient mouse embryonic stem cellsare defective in differentiation and centromeric silencing. Genes Dev 19:489–501.
Karlseder J, Cooper JP (2007) Of wombats and whales: telomere tales in Madrid. Conference ontelomeres and telomerase. EMBO Rep 8:542–546.
Kennerdell JR, Carthew RW (2000) Heritable gene silencing in Drosophila using double-strandedRNA. Nat Biotechnol 18:896–898.
3 Marsupial Centomeres and Telomeres 71
Kidwell MG, Kidwell JF (1976) Selection for male recombination in Drosophila melanogaster.Genetics 84:333–351.
Kirsch JA (1977) The comparative serology of Marsupialia, and a classification of marsupials. AustJ Zool Suppl Ser 52:1–152.
Kirsch JA, Lapointe F, Springer MS (1997) DNA-Hybridization Studies of Marsupials and theirImplications for Metatherian Classification. Aust J Zool 45:211–280.
Klattenhoff C, Theurkauf W (2008) Biogenesis and germline functions of piRNAs. Development135:3–9.
Lee Y, Ahn C, Han J, et al. (2003) The nuclear RNase III Drosha initiates microRNA processing.Nature 425:415–419.
Liscinsky DM, Ferreri GC, Mack JA, Eldridge MD, O’Neill RJ (2005) Retention of latentcentromeres in the Mammalian genome. J Hered 96:217–224.
Longo MS, Carone DM, Program NC, Green ED, O’Neill MJ,O’Neill RJ (2009) Distinct retroele-ment classes define evolutionary breakpoints demarcating sites of evolutionary novelty. BMCGenomics 10:334.
Lowry PS, Eldridge MDB, Johnston PG (1994) Genetic analysis of a female macropodidhybrid (Macropus agilis × M. rufogriseus) and her backcross offspring. Aust Mamm 18:79–82.
May BP, Lippman ZB, Fang Y, Spector DL, Martienssen RA (2005) Differential regulation ofstrand-specific transcripts from Arabidopsis centromeric satellite repeats. PLoS Genet 1:e79.
McClintock B (1987) The Discovery and Characterization of Transposable Elements. GarlandPublishing, Inc., New York, NY.
Metcalfe CJ (2002) Telomeres and Chromosome Evolution in Marsupials. Biological Sciences,Macquarie University, Sydney.
Metcalfe CJ, Eldridge MD, Toder R, Johnston PG (1998) Mapping the distribution of the telomericsequence (T2AG3)n in the Macropodoidea (Marsupialia), by fluorescence in situ hybridization.I. The swamp wallaby, Wallabia bicolor. Chromosome Res 6:603–610.
Metcalfe CJ, Eldridge MD, Johnston PG (2004) Mapping the distribution of the telomericsequence (T2AG3)n in the 2n = 14 ancestral marsupial complement and in the macrop-odines (Marsupialia: Macropodidae) by fluorescence in situ hybridization. Chromosome Res12:405–414.
Metcalfe CJ, Bulazel KV, Ferreri GC, et al. (2007) Genomic instability within centromeres ofinterspecific marsupial hybrids. Genetics 177:2507–2517.
Miller JT, Dong F, Jackson SA, Song J, Jiang J (1998) Retrotransposon-related DNA sequences inthe centromeres of grass chromosomes. Genetics 150:1615–1623.
Murphy WJ, Larkin DM, Everts-van der Wind A, et al. (2005) Dynamics of mammalianchromosome evolution inferred from multispecies comparative maps. Science 309:613–617.
Nadeau JH, Taylor BA (1984) Lengths of chromosomal segments conserved since divergence ofman and mouse. Proc Natl Acad Sci USA 81:814–818.
Neumann P, Yan H, Jiang J (2007) The centromeric retrotransposons of rice are transcribed anddifferentially processed by RNA interference. Genetics 176:749–761.
O’Neill RJ, O’Neill MJ, Graves JA (1998) Undermethylation associated with retroelement acti-vation and chromosome remodelling in an interspecific mammalian hybrid. Nature 393:68–72.
O’Neill RJ, Eldridge MD, Graves JA (2001) Chromosome heterozygosity and de novo chromo-some rearrangements in mammalian interspecies hybrids. Mamm Genome 12:256–259.
O’Neill RJ, Eldridge MD, Metcalfe CJ (2004) Centromere dynamics and chromosome evolutionin marsupials. J Hered 95:375–381.
Pagnozzi JM, De Jesus Silva MJ, Yonenaga-Yassuda Y (2000) Intraspecific variation in thedistribution of the interstitial telomeric (TTAGGG)n sequences in Micoureus demerarae(Marsupialia: Didelphidae). Chromosome Res 8:585–591.
Pagnozzi JM, Ditchfield AD, Yonenaga-Yassuda Y (2002) Mapping the distribution of the inter-stitial telomeric (TTAGGG)n sequences in eight species of Brazilian marsupials (Didelphidae)
72 D.M. Carone and R.J. O’Neill
by FISH and the correlation with constitutive heterochromatin. Do ITS represent evidence forfusion events in American marsupials? Cytogenet Genome Res 98:278–284.
Peacock WJ, Dennis ES, Elizur A, Calaby JH (1981) Repeated DNA sequences and kangaroophylogeny. Aust J Biol Sci 34:325–340.
Pevzner P, Tesler G (2003) Genome rearrangements in mammalian evolution: lessons from humanand mouse genomes. Genome Res 13:37–45.
Reinhart BJ, Bartel DP (2002) Small RNAs correspond to centromere heterochromatic repeats.Science 297:1831.
Rens W, O’Brien PC, Fairclough H, Harman L, Graves JAM, Ferguson-Smith MA (2003)Reversal and convergence in marsupial chromosome evolution. Cytogenet Genome Res 102:282–290.
Rofe R (1978) G-banded Chromosomes and the Evolution of Macropodidae. Aust Mamm 2:53–63.Rofe RH (1979) G-Banding and Chromosomal Evolution in Australian Marsupials. University of
Adelaide, Adelaide.Rofe R, Hayman D (1985) G-banding evidence for a conserved complement in the Marsupialia.
Cytogenet Cell Genet 39:40–50.Salser W, Bowen S, Browne D, et al. (1976) Investigation of the organization of mammalian
chromosomes at the DNA sequence level. Fed Proc 35:23–35.Schibler L, Roig A, Mahe MF, et al. (2006) High-resolution comparative mapping among man,
cattle and mouse suggests a role for repeat sequences in mammalian genome evolution. BMCGenomics 7:194.
Sharman GB, Close RL, Maynes M (1990) Chromosomal evolution, phylogeny and speciation ofRock Wallabies (Petrogale: Macropodidae). Aust J Zool 37:351–363.
She X, Horvath JE, Jiang Z, et al. (2004) The structure and evolution of centromeric transitionregions within the human genome. Nature 430:857–864.
Singer MF (1982) Highly repeated sequences in mammalian genomes. Int Rev Cytol 76:67–112.Southern EM (1970) Base sequence and evolution of guinea-pig alpha-satellite DNA. Nature
227:794–798.Svartman M, Vianna-Morgante AM (1998) Karyotype evolution of marsupials: from higher to
lower diploid numbers. Cytogenet Cell Genet 82:263–266.Toder R, O’Neill RJ, Wienberg J, O’Brien PC, Voullaire L, Marshall-Graves JA (1997)
Comparative chromosome painting between two marsupials: origins of an XX/XY1Y2 sexchromosome system. Mamm Genome 8:418–422.
Topp CN, Zhong CX, Dawe RK (2004) Centromere-encoded RNAs are integral components of themaize kinetochore. Proc Natl Acad Sci USA 101:15986–15991.
Ugarkovic D (2005) Functional elements residing within satellite DNAs. EMBO Rep 6:1035–1039.
Valgardsdottir R, Chiodi I, Giordano M, Cobianchi F, Riva S, Biamonti G (2005) Structural andfunctional characterization of noncoding repetitive RNAs transcribed in stressed human cells.Mol Biol Cell 16:2597–2604.
Venolia L, Peacock WJ (1981) A highly repeated DNA from the genome of the wallaroo (Macropusrobustus robustus). Aust J Biol Sci 34:97–113.
Ventura M, Mudge JM, Palumbo V, et al. (2003) Neocentromeres in 15q24-26 map to dupliconswhich flanked an ancestral centromere in 15q25. Genome Res 13:2059–2068.
Verdel A, Jia S, Gerber S (2004) RNAi-mediated targeting of heterochromatin by the RITScomplex. Science 303:672–676.
Verma RS (1999) Evolution of the centromeric alpha-satellite DNA sequences of human chromo-some 22. Prenat Diagn 19:590–591.
Volpe T, Schramke V, Hamilton GL, et al. (2003) RNA interference is required for normalcentromere function in fission yeast. Chromosome Res 11:137–146.
Volpe TA, Kidner C, Hall IM, Teng G, Grewal SI, Martienssen RA (2002) Regulation ofheterochromatic silencing and histone H3 lysine-9 methylation by RNAi. Science 297:1833–1837.

3 Marsupial Centomeres and Telomeres 73
White M (1978) Modes of Speciation. WH Freeman and Co, San Francisco, CA.Wianny F, Zernicka-Goetz M (2000) Specific interference with gene function by double-stranded
RNA in early mouse development. Nat Cell Biol 2:70–75.Willard HF (1990) Centromeres of mammalian chromosomes. Trends Genet 6:410–416.Yoder JA, Walsh CP, Bestor TH (1997) Cytosine methylation and the ecology of intragenomic
parasites. Trends Genet 13:335–340.

Chapter 4Marsupial Linkage Maps
Paul B. Samollow
Abstract Linkage maps provide information not only on the linear order of geneticloci on chromosomes; they also reveal the locations and frequencies of crossoverevents during gametogenesis. As such they have been invaluable resources forgenetic mapping for nearly 100 years and continue to be extremely useful for pro-viding insight into the meiotic process and disruptions thereof that physical mappingstrategies cannot furnish. Linkage mapping research with marsupial mammals hada late inception due to a long-standing lack of animal resources amenable to thereliable, multigenerational breeding programs necessary for the establishment ofgenetic lines and tools required for linkage-mapping studies. As this impedimentwas overcome through the establishment of several self-perpetuating marsupialbreeding colonies late in the twentieth century, linkage mapping studies began touncover evidence of unexpectedly low rates and unusual sex-specific patterns ofrecombination that run counter to those observed for almost all other vertebratesexamined. This chapter describes the history of linkage research in marsupials, sum-marizes the linkage maps of the tammar wallaby and the gray, short-tailed opossum,considers the value of these linkage maps in connection with the recent opossum andwallaby genome projects, and discusses the extent and implications of low recombi-nation rates and sex-specific recombination differences in these species. The chapterends with speculation on the potential of the opossum as a model for recombinationresearch.
Keywords Linkage mapping · Marsupial · Opossum · Recombination · Wallaby
P.B. Samollow (B)Department of Veterinary Integrative Biosciences, College of Veterinary Medicine and BiomedicalSciences, Texas A&M University, College Station, TX 77843, USA; Faculty of Genetics, TexasA&M University, College Station, TX 77843, USAe-mail: [email protected]
75J.E. Deakin et al. (eds.), Marsupial Genetics and Genomics,DOI 10.1007/978-90-481-9023-2_4, C© Springer Science+Business Media B.V. 2010
76 P.B. Samollow
4.1 Introduction
Soon after the rediscovery of Mendel’s work at the beginning of the twentiethcentury, it became clear that the genetic factors controlling variation in differ-ent characteristics did not always adhere to Mendel’s principle of independentassortment. Rather than assorting as independent entities during gametogenesis,some factors tended to co-segregate with one another more often than expected bychance alone. Viewed from the perspective of the then-novel chromosome theory ofinheritance, these observations led to the concept of genetic linkage and the possi-bility of determining the order and relative distances between factors (now calledgenes) on chromosomes by assessing the frequency of recombination between themduring meiosis (Morgan, 1911a, b, c). The first linkage map was a modest affairproposing the orders and interlocus distances of six sex-linked genes in the fruitfly Drosophila melanogaster (Sturtevant, 1913). Thus, linkage mapping became thefirst analytical approach for studying the structural arrangement of genetic elementsin genomes.
The realization that linkage data could provide tools for studying the meioticbehaviour of chromosomes and provide a means for manipulating the genetic con-tent of chromosomes to investigate gene interaction (epistasis) and other geneticphenomena, provided incentive to create extensive linkage maps for as many traitsas possible for Drosophila and encouraged the building of maps for other modelorganisms such as corn and mouse, wherein pedigreed stocks, short generation time,and the ability to rear large numbers of progeny made the task relatively straightfor-ward. Modest maps were also constructed for human single-gene traits and diseaseconditions, and for traits of commercial interest in some agricultural species.
Early linkage work was restricted to co-segregation analysis of morphologic andphysiologic variants known to be inherited as simple Mendelian traits; however suchvariants often display dominance, making discrimination of heterozygotes from oneof the homozygous classes impossible. This complication limited crossing schemesto simple pedigrees involving just a few variant traits at a time. Beginning in the1960s, novel biochemical and molecular genetic methodologies enabled the devel-opment of new types of map markers that were abundant in the genomes of virtuallyall eukaryotic organisms and exhibited codominant phenotypes; e.g., allozymes,restriction-fragment-length polymorphisms, microsatellites, and single-nucleotidepolymorphisms, which permitted unambiguous assignment of genotypes regardlessof the allelic combination. In most cases these molecular markers are “anonymous”,i.e., stretches of DNA with no known connection to any trait or condition; butthey do unambiguously flag specific locales in the genome and are highly poly-morphic, and so are extremely useful for mapping purposes. This plethora of mapmarkers spurred development of sophisticated computational methods that allowedlinkage analyses to be conducted with more complex pedigrees involving large num-bers of segregating loci. These advances led to a rapid increase in marker contentfor the linkage maps of established model species and enabled the construction ofmaps for species in which no single-gene morphologic or physiologic variants wereknown.
4 Marsupial Linkage Maps 77
Marsupials (metatherian mammals) were late arrivals on the linkage-mappingscene. Despite attempts with several species, developing marsupial modelsamenable to reliable, multigenerational breeding programs was for decades an elu-sive goal, and the lack of such animal resources precluded the establishment ofgenetic lines and tools necessary to conduct linkage mapping studies (VandeBerg,1990; Hope, 1993; Samollow and Graves, 1998). This obstacle was eventu-ally overcome as self-perpetuating colonies of the fat-tailed dunnart (Sminthopsiscrassicaudata), tammar wallaby (Macropus eugenii), and gray, short tailed opos-sum (Monodelphis domestica) were established in the 1980s (Hinds et al., 1990;VandeBerg, 1990; Hope, 1993; VandeBerg and Robinson, 1997). By that time,however, DNA-hybridization-based methods for the physical localization of probeshomologous to genes already mapped in human and rodent models had beendeveloped and were being applied with great enthusiasm to a variety of marsu-pial species, wild and colony-bred alike (Samollow and Graves, 1998; Graves andWesterman, 2002). The ability of these physical methods to locate the positions ofhighly conserved genes on marsupial chromosomes rapidly, and without the needfor genetic variants or breeding procedures, effectively quenched interest in link-age studies as a means to construct marsupial genetic maps for comparative genemapping research (see Deakin, Chapter 5).
Nevertheless, the availability of marsupial breeding colonies together with thesuccess of human and mouse linkage mapping studies based on the genotypingof highly informative microsatellite polymorphisms proved irresistible, and effortswere undertaken to construct linkage maps for both the wallaby and opossum, thetwo most intensively used marsupial species for basic biological and biomedicallyrelated research. This chapter furnishes an historical overview of linkage mappingin marsupials, describes the current state of their linkage maps, and provides aglimpse of current and possible future applications of these maps in genomicanalysis.
4.2 Why Construct Linkage Maps?
A linkage map (also known as a genetic or meiotic recombination map), as definedherein, is a statistical representation of the linear order and distances betweenspecific genetic loci on chromosomes of sexual organisms, based solely on thefrequency of co-segregation among these loci during meiosis. Construction ofmodern linkage maps is accomplished most often through analysis of multi-locusgenotypes of offspring produced by parents of known or inferred genetic compo-sition by means of any of several computationally intensive analytical tools thathave been devised over the past two decades. Linkage distances are generally givenin units known as centiMorgans (cM). One cM corresponds to 1% recombinationbetween two particular loci per meiosis. The genotyping of individual gametes isanother linkage mapping approach that enables the multilocus analysis of hundredsor thousands of meiotic products from a single individual, but for mammals it
78 P.B. Samollow
is essentially limited to male gametes, and its application to large numbers ofindividuals can be challenging.
The production of families and the genotyping of hundreds of individuals thatcomprise linkage-mapping panels are both costly and time consuming. One mightask, then, with highly efficient and relatively inexpensive physical mapping meth-ods readily available, why bother with linkage mapping any more? The answer liesin the kind of information generated by linkage data compared with that furnishedby physical maps (including full genome sequence assemblies). Physical and link-age maps both reveal the order and relative distances between genetic elements ofinterest on chromosomes, but only linkage data yield information on the behavioursof chromosomes during meiosis.
As is the case for physical maps, the order of loci on a linkage map reflects theorder of loci on the chromosome. However, the distances between loci on a linkagemap (map distances) do not necessarily correspond to the physical distances (num-ber of DNA bases) between the loci, but rather reflect the frequency with whichcrossing-over occurs between the loci during meiosis. There is of course a cor-relation between physical distance and linkage distances, but this correlation is aloose one and its strength may vary between regions on the same chromosome,between chromosomes, between individuals, and between species. Thus, whereasphysical maps yield information about the arrangement and the genomic coordi-nates (in base pairs or other physical metrics) between features on chromosomes,linkage maps provide information concerning the likelihood that a crossover eventwill occur in a particular chromosomal region defined by flanking marker loci. Usedtogether, physical and linkage maps enable the estimation of recombination eventsper physical distance, usually expressed as map distance per megabase (Mb) pairs,or simply cM/Mb. This is the physical recombination rate.
Linkage maps can be used as independent datasets to corroborate marker orderdeveloped from physical mapping procedures, support the construction of genomesequence assemblies, and refine the order and orientation of large-scale structuresin existing genome assemblies. In addition, they uniquely provide information onthe distribution and frequency of recombination events across the genome, therebyproviding a means to examine the molecular mechanisms that promote or inhibitthe formation of chiasmata (the physical manifestation of meiotic crossing over) indifferent regions of chromosomes, which in turn can influence the success or failureof homologous chromosomes to disjoin normally at anaphase I. Finally, linkagemaps enable the localization of quantitative trait loci (QTLs) that influence normaland abnormal physiologic and developmental variation, disease susceptibilities, andtraits of economic importance.
4.3 Pioneering Linkage Studies in Marsupials
The earliest evidence regarding genetic linkage in marsupials arose from investiga-tions of expression patterns of marsupial homologues of genes known to be X-linkedin eutherian (“placental”) mammals. In keeping with Ohno’s (1967) conjecture
4 Marsupial Linkage Maps 79
that the gene content of X chromosomes should be highly conserved across allmammals, simultaneous publications reported that electrophoretic mobility variants(allozymes) of glucose-6-phosphate dehydrogenase (G6PD) (Richardson et al.,1971) and phosphoglycerate kinase A (PGK-A) (Cooper et al., 1971) were inher-ited as X-linked traits in macropodid (kangaroo family) intra- and inter-speciescrosses, and that the genes encoding these enzymes (G6pd and Pgk-A, respec-tively) were subject to X-chromosome inactivation, as is true in eutherian mammals.Surprisingly, data from female offspring heterozygous at these loci failed to reflectthe random pattern of X-linked gene inactivation seen in eutherian females, butinstead indicated that it was exclusively the allele inherited from the father thatwas inactivated, regardless of which species or subspecies served as the sire in thecross. This unexpected, non-random X-inactivation pattern, which became known aspaternal X-chromosome inactivation to distinguish it from the eutherian pattern ofrandom X-chromosome inactivation (see Hore et al., Chapter 12 and Al Nadaf et al.,Chapter 13), arguably represents the earliest observation of genomic imprinting inanimals.
These findings spurred a great deal of activity to assess the expression of X-linkedgenes in a variety of Australian marsupial species and eventually an American one,and concurrently yielded the first chromosomal gene assignments accomplished bygenetic analysis in marsupials (reviewed by VandeBerg et al., 1987; Cooper et al.,1990, 1993). However, limited offspring numbers and lack of appropriate multilocusvariation in these species precluded the construction of linkage maps. Defining thelocations of these genes on marsupial X chromosomes was ultimately accomplishedthrough physical mapping methods.
The emphasis of early marsupial gene mapping was decidedly comparative.The general objective was to better understand genome evolution by exploitingeutherian/marsupial differences as probes to explore the phylogenetic nuances of sexdetermination, gene expression, and other genetic processes related to the evolutionof gene structure and function (Samollow and Graves, 1998; Graves and Westerman,2002). The fundamental strategy was to produce genetic maps that could be used toinvestigate the degree to which syntenic relationships were conserved or alteredamong species and between major mammalian clades. The emphasis was on highlyconserved loci, especially protein-coding genes, the homologies of which could beinferred across vast evolutionary distances. For reasons already mentioned, physicalmapping approaches overshadowed linkage analysis as the favoured means to deter-mine syntenic relationships on marsupial chromosomes. This led to rapid progressin the construction of marsupial gene maps, but furnished no information on thebehaviour of marsupial chromosomes during gametogenesis.
The first linkage estimates for a marsupial were derived from a combined cyto-logic and family study of the fat-tailed dunnart, Sminthopsis crassicaudata (familyDasyuridae). Linkage analysis defined two linkage groups (LG I and LG II), eachcontaining three genes (Table 4.1), and indicated that recombination between thesegenes was much less frequent in female dunnarts than in males. Four pairwisegene combinations exhibited no recombination in females but showed modest tohigh recombination frequencies (rf: 0.16–0.37) in males, while two other pairwise
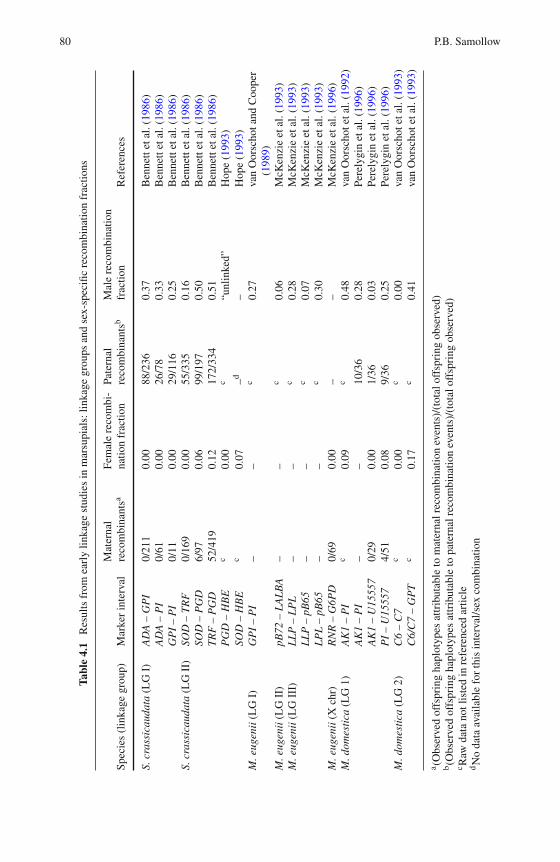
80 P.B. Samollow
Tabl
e4.
1R
esul
tsfr
omea
rly
linka
gest
udie
sin
mar
supi
als:
linka
gegr
oups
and
sex-
spec
ific
reco
mbi
natio
nfr
actio
ns
Spec
ies
(lin
kage
grou
p)M
arke
rin
terv
alM
ater
nal
reco
mbi
nant
saFe
mal
ere
com
bi-
natio
nfr
actio
nPa
tern
alre
com
bina
ntsb
Mal
ere
com
bina
tion
frac
tion
Ref
eren
ces
S.cr
assi
caud
ata
(LG
I)A
DA
–G
PI
0/21
10.
0088
/236
0.37
Ben
nett
etal
.(19
86)
AD
A–
PI
0/61
0.00
26/7
80.
33B
enne
ttet
al.(
1986
)G
PI
–P
I0/
110.
0029
/116
0.25
Ben
nett
etal
.(19
86)
S.cr
assi
caud
ata
(LG
II)
SOD
–T
RF
0/16
90.
0055
/335
0.16
Ben
nett
etal
.(19
86)
SOD
–P
GD
6/97
0.06
99/1
970.
50B
enne
ttet
al.(
1986
)T
RF
–P
GD
52/4
190.
1217
2/33
40.
51B
enne
ttet
al.(
1986
)P
GD
–H
BE
c0.
00c
“unl
inke
d”H
ope
(199
3)SO
D–
HB
Ec
0.07
–d–
Hop
e(1
993)
M.e
ugen
ii(L
GI)
GP
I–
PI
––
c0.
27va
nO
orsc
hota
ndC
oope
r(1
989)
M.e
ugen
ii(L
GII
)pB
72–
LA
LB
A–
–c
0.06
McK
enzi
eet
al.(
1993
)M
.eug
enii
(LG
III)
LL
P–
LP
L–
–c
0.28
McK
enzi
eet
al.(
1993
)L
LP
–pB
65–
–c
0.07
McK
enzi
eet
al.(
1993
)L
PL
–pB
65–
–c
0.30
McK
enzi
eet
al.(
1993
)M
.eug
enii
(Xch
r)R
NR
–G
6PD
0/69
0.00
––
McK
enzi
eet
al.(
1996
)M
.dom
esti
ca(L
G1)
AK
1–
PI
c0.
09c
0.48
van
Oor
scho
teta
l.(1
992)
AK
1–
PI
––
10/3
60.
28Pe
rely
gin
etal
.(19
96)
AK
1–
U15
557
0/29
0.00
1/36
0.03
Pere
lygi
net
al.(
1996
)P
I–
U15
557
4/51
0.08
9/36
0.25
Pere
lygi
net
al.(
1996
)M
.dom
esti
ca(L
G2)
C6
–C
7c
0.00
c0.
00va
nO
orsc
hote
tal.
(199
3)C
6/C
7–
GP
Tc
0.17
c0.
41va
nO
orsc
hote
tal.
(199
3)
a (Obs
erve
dof
fspr
ing
hapl
otyp
esat
trib
utab
leto
mat
erna
lrec
ombi
natio
nev
ents
)/(t
otal
offs
prin
gob
serv
ed)
b(O
bser
ved
offs
prin
gha
plot
ypes
attr
ibut
able
topa
tern
alre
com
bina
tion
even
ts)/
(tot
alof
fspr
ing
obse
rved
)c R
awda
tano
tlis
ted
inre
fere
nced
artic
ledN
oda
taav
aila
ble
for
this
inte
rval
/sex
com
bina
tion
4 Marsupial Linkage Maps 81
combinations that had minimal recombination in females (rf: 0.06, 0.12) exhibitedindependent assortment (were unlinked) in males (Bennett et al., 1986). This situ-ation was unexpected because in humans and other eutherians females generallyexhibited higher recombination rates than males. The accompanying cytologicexamination of meiotic cells revealed lower chiasma frequency in females than inmales and a strong clustering of chiasmata in terminal (sub-telomeric) regions offemale, but not male, autosomes, suggesting a causal relationship between chiasmacharacteristics and recombination rates in the dunnart (Bennett et al., 1986). Thediscovery several years later (Hope, 1993) of linkage between the genes HBE andPI enlarged LG II and corroborated the initial findings of strong heterochiasmy (sexdifference in recombination) by showing that HBE and PI did not recombine withone another in female dunnarts (rf = 0.00), but assorted independently in males.
Following upon studies in the dunnart, another cytologic examination foundvery similar meiotic characteristics (lower frequency and restricted distribution offemale chiasmata) in the distantly related grey, short tailed opossum, Monodelphisdomestica (family Didelphidae), leading to the prediction that females of this SouthAmerican marsupial would also exhibit reduced recombination in linkage studies(Hayman et al., 1988). The prediction was borne out by the first linkage dataproduced for opossums (van Oorschot et al., 1992, 1993; Perelygin et al., 1996)(Table 4.1). Female opossums exhibited low to moderate recombination rates in theintervals PI – U5557 (rf = 0.08), AK1 – PI (rf = 0.09), and C6/C7-GPT (rf = 0.17),whereas the corresponding rates for males were much higher (0.25, 0.48, and 0.41,respectively).
The only other marsupial for which linkage data have been published is the tam-mar wallaby, Macropus eugenii (family Macropodidae). Early linkage data for thisspecies showed that the GPI – PI linkage, previously noted in the dunnart, was alsopresent in the wallaby, providing some of the earliest data on synteny conserva-tion for deeply divergent marsupial clades (van Oorschot and Cooper, 1989). TheGPI – PI linkage defined wallaby LG I (Table 4.1). Subsequent studies (McKenzieet al., 1993) led to the discovery of two additional linkage groups, LG II (anony-mous marker pB72 and LALBA), LG III (pB65, LLP, and LPL), and very tightlinkage between RNR and G6PD on the X chromosome (McKenzie et al., 1996).Sex-specific data were not reported in these studies.
None of these pioneering efforts established the order of genetic markers withintheir respective linkage groups, so did not create linkage maps. Nonetheless, theyformed the foundation for linkage work upon which linkage maps would ultimatelybe built. First, they proved the practicality of conducting large family studies withmarsupials, which encouraged the characterization of genetic diversity within pedi-greed marsupial research colonies. These characterizations fostered greater interestin the genetic features of marsupials as tools for examining the molecular under-pinnings of the distinctive reproductive and developmental features that distinguishmarsupial and eutherian mammals. Equally important, these investigations were thefirst to call attention to a very unusual pattern of heterochiasmy in which femalesshow much lower levels of recombination than males. As discussed below, this isan exceedingly rare pattern in vertebrates, and certain features of the pattern may beunique to marsupials.
82 P.B. Samollow
4.4 Linkage Maps of Marsupials
4.4.1 The Tammar Wallaby Linkage Map
The first marsupial linkage map was produced by Kyall Zenger and colleaguesfor the tammar wallaby (Zenger et al., 2002). By that time, physical mappinginvestigations had already demonstrated the power of non-genetic approaches fordetermining synteny relationships and linear orders of highly conserved (type-1)coding genes on marsupial chromosomes. The impetus for constructing a wallabylinkage map was interest in its use as a tool for localizing unidentified genes (QTLs)that influenced variation in physiological, developmental, and health-related traits inthe wallaby, which was well established as one of the most important and intensivelyused marsupial research models in the world.
Lacking inbred strains of this species, the mapping strategy was based on creatinga highly informative mapping panel through crosses involving wallabies descendedfrom different natural populations that were geographically distant from one anotherand, thus, expected to be strongly genetically differentiated. The F1 hybrids so pro-duced would be expected to be heterozygous at many genetic loci. The F1 couldthen be backcrossed to one or the other parental stock to produce highly informa-tive backcross progeny. It had been shown previously (McKenzie et al., 1993) thatcrosses between distantly related tammar wallaby subspecies from Garden Island(GI), Western Australia and Kangaroo Island (KI), South Australia produced fertileF1 offspring and could be used for creating such a panel. Using this strategy, Zengerand colleagues analyzed 242 backcross offspring produced by matings between 25hybrid parents crossed to six GI and KI mates.
The wallaby mapping panel was genotyped for variation at 64 genetic lociincluding type-1 coding genes, anonymous microsatellite markers, and other anony-mous DNA sequences. Of these, 60 markers showed convincing pairwise linkagewith at least one other marker and could be clustered into nine distinct linkagegroups (Table 4.2). Markers within each linkage group were ordered and interlocusdistances were estimated to yield nine multipoint linkage-group maps ranging from176.5 to 15.7 cM sex-average length. Summed over all linkage groups, the totalmap was 828.8 cM long. Previous physical mapping studies with some of the sametype-1 loci enabled anchoring of three of the linkage groups to specific autosomesand the identification of an X-chromosome linkage group. Two of these linkagegroups anchored to the same autosome, bringing the number of linkage groups intoagreement with the n = 8 haploid complement of the species. Inheritance patternsindicated that the five unanchored linkage groups were autosomally located. Theautosomal linkage groups accounted for 771.7 cM of the total map length andthe X-chromosome linkage group for 57.1 cM. Markers placed uniquely (i.e., withnon-overlapping confidence ranges) defined 37 interlocus intervals.
Sex-specific recombination rates were inferred by comparing the lengths of themaps produced by recombination occurring in female parents vs. male parents. Theoverall length of the female autosomal map was only 78% that of the male map(F/M ratio = 0.78), and this difference was highly significant (P < 0.001 that the true
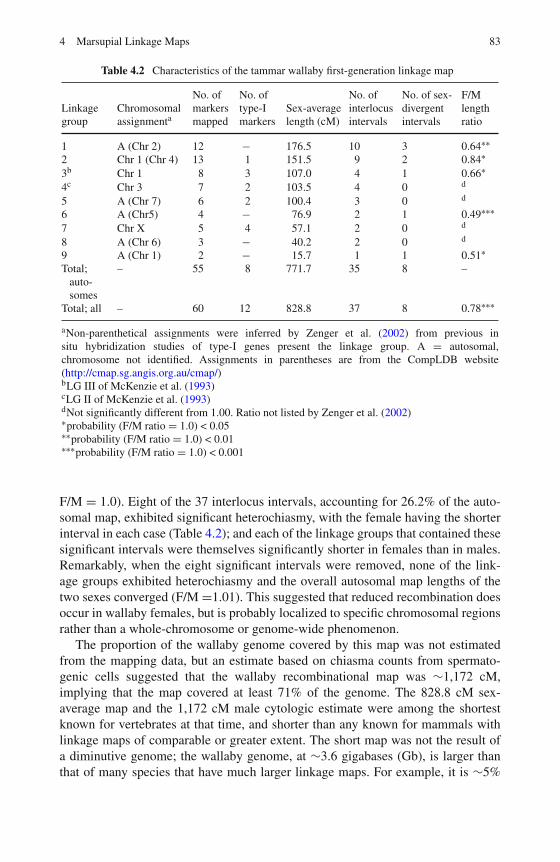
4 Marsupial Linkage Maps 83
Table 4.2 Characteristics of the tammar wallaby first-generation linkage map
Linkagegroup
Chromosomalassignmenta
No. ofmarkersmapped
No. oftype-Imarkers
Sex-averagelength (cM)
No. ofinterlocusintervals
No. of sex-divergentintervals
F/Mlengthratio
1 A (Chr 2) 12 − 176.5 10 3 0.64∗∗2 Chr 1 (Chr 4) 13 1 151.5 9 2 0.84∗3b Chr 1 8 3 107.0 4 1 0.66∗4c Chr 3 7 2 103.5 4 0 d
5 A (Chr 7) 6 2 100.4 3 0 d
6 A (Chr5) 4 − 76.9 2 1 0.49∗∗∗7 Chr X 5 4 57.1 2 0 d
8 A (Chr 6) 3 − 40.2 2 0 d
9 A (Chr 1) 2 − 15.7 1 1 0.51∗Total;
auto-somes
– 55 8 771.7 35 8 –
Total; all – 60 12 828.8 37 8 0.78∗∗∗
aNon-parenthetical assignments were inferred by Zenger et al. (2002) from previous insitu hybridization studies of type-I genes present the linkage group. A = autosomal,chromosome not identified. Assignments in parentheses are from the CompLDB website(http://cmap.sg.angis.org.au/cmap/)bLG III of McKenzie et al. (1993)cLG II of McKenzie et al. (1993)dNot significantly different from 1.00. Ratio not listed by Zenger et al. (2002)∗probability (F/M ratio = 1.0) < 0.05∗∗probability (F/M ratio = 1.0) < 0.01∗∗∗probability (F/M ratio = 1.0) < 0.001
F/M = 1.0). Eight of the 37 interlocus intervals, accounting for 26.2% of the auto-somal map, exhibited significant heterochiasmy, with the female having the shorterinterval in each case (Table 4.2); and each of the linkage groups that contained thesesignificant intervals were themselves significantly shorter in females than in males.Remarkably, when the eight significant intervals were removed, none of the link-age groups exhibited heterochiasmy and the overall autosomal map lengths of thetwo sexes converged (F/M =1.01). This suggested that reduced recombination doesoccur in wallaby females, but is probably localized to specific chromosomal regionsrather than a whole-chromosome or genome-wide phenomenon.
The proportion of the wallaby genome covered by this map was not estimatedfrom the mapping data, but an estimate based on chiasma counts from spermato-genic cells suggested that the wallaby recombinational map was ∼1,172 cM,implying that the map covered at least 71% of the genome. The 828.8 cM sex-average map and the 1,172 cM male cytologic estimate were among the shortestknown for vertebrates at that time, and shorter than any known for mammals withlinkage maps of comparable or greater extent. The short map was not the result ofa diminutive genome; the wallaby genome, at ∼3.6 gigabases (Gb), is larger thanthat of many species that have much larger linkage maps. For example, it is ∼5%
84 P.B. Samollow
larger than the human genome, which has a sex-average recombinational lengthof ∼3,790 cM (Matise et al., 2007). The short map instead reflects an overall lowrate of recombination in the wallaby genome relative to other vertebrate genomes.As we will see later, low recombination rate is also characteristic of the opossumgenome.
Building on the initial map, a second-generation wallaby linkage map has beencompiled and will soon be published (Chenwei Wang, personal communication).The second-generation map comprises 150 loci including the 60 markers placedon the original map, four original markers that could not be placed on the originalmap, and 86 new microsatellite loci. Judged from fluorescence in situ hybridization(FISH) analysis using hybridization probes containing linkage map markers, thesecond-generation map covers ∼85% of the wallaby genome. Definitive chromo-somal assignments have been made for all linkage groups. The second-generationmap is larger, exceeding 1,000 cM, but remains comparatively short by mammalianstandards (Chenwei Wang, personal communication). It still exhibits sexual dimor-phism in overall map length, and male map length exceeds female map length forseveral, but not all of the linkage groups, reinforcing the original impression thatreduced female recombination is localized rather than a genome-wide characteristicof the wallaby genome.
4.4.2 Gray, Short-Tailed Opossum Linkage Maps
As for the wallaby, the initial motivation for linkage mapping in the opossum was togenerate a resource that could serve as a framework for QTL mapping. An additionalimpetus was to determine the magnitude and describe the genomic distribution ofthe striking intersexual difference in recombination rates observed in early opos-sum linkage data as a means to better understand the meiotic characteristics of thespecies.
Lacking inbred strains, the mapping strategy for the opossum was similar to thatdescribed for the wallaby. Two independent linkage maps have been constructedfor the opossum using different mapping panels: the GMBX and BBBX panels.Three random-bred laboratory stocks designated, Pop1, Pop3, and Pop5 were usedto establish the panels. Pop1 and Pop3 founders originated from two distantly sep-arated locations in Brazil; Pop5 founders were captured in central Bolivia. Eachmapping panel was constructed by first crossing parents from two different stocks(GMBX: Pop1 × Pop3; BBBX: Pop1 × Pop5) to create an F1 generation. For eachpanel, F1 individuals of both sexes were backcrossed to Pop1 mates to producethe backcross generation (Pop3 and Pop5 mates were unavailable for the recipro-cal backcrosses). The BBBX-based map is the more highly developed of the twoand serves as the basis for ongoing mapping studies, but the general features of theGMBX map bear discussion to provide a basis for appreciating the similarity ofresults obtained from the two separate mapping studies.
The GMBX panel comprises 356 individuals from 30 three-generation fami-lies. The mapping dataset includes genotypes for 83 polymorphic loci including
4 Marsupial Linkage Maps 85
a mixture of type-1 coding genes, anonymous microsatellite loci, and anonymousrandom-amplified polymorphic DNA markers (RAPDs). These markers clusteredat high confidence into nine distinct linkage groups, in agreement with the n = 9haploid number of the species (Samollow et al., 2004). Three X-linked loci wereexcluded from analysis leaving an autosomal dataset of 80 marker loci in eightlinkage groups (Table 4.3). Several marker pairs did not exhibit recombination ineither sex, and some loci could not be ordered at high confidence in their linkagegroup maps. The successfully ordered, recombining markers defined 56 unambigu-ous interlocus intervals. These intervals covered a total sex-average length of only633.0 cM. Adding estimates for the unmapped regions beyond the ends of the auto-somal linkage groups and a “best guess” for the length of the X-chromosome map,the full length sex-average map was estimated to be a mere 890.7 cM, the short-est known for any vertebrate for which there is a substantially complete map. At∼3.6 Gb, the opossum genome is at least as large as that of the wallaby and largerthan those of humans and most other eutherian mammals; and evidence presentedby Samollow and colleagues (2004) argued that a large fraction of the genome wascovered by the linkage map. Thus, the short map length was not attributable tosmall genome size or poor genome coverage, but rather was indicative of a very lowrecombination rate in opossums.
Turning to sex-specific maps, the GMBX female-specific map was only halfthe length of the male map (443.1 vs. 884.6 cM) (F/M = 0.501) and the lengthof each male linkage-group map exceeded that of the corresponding female map(Table 4.3). Of the 56 recombining intervals, 22, representing 45.9% of the totalmap length, differed significantly in length between the sexes, with 20 of themlonger in the male map than in the female map. Contrasting with the situation in thewallaby, removal of the 22 significant intervals did not equalize the lengths of thefemale and male maps, which implies that the recombinational differences underly-ing the sexual dimorphism in map lengths in the opossum are not localized to a fewsmall dimorphic regions or just a few chromosomes, but are widespread across thegenome.
Overall then, results from the GMBX mapping analysis indicated that the opos-sum has a very low meiotic recombination rate and that females have a substantiallylower rate of recombination than males, a pattern that runs counter that observed ineutherian mammals and non-mammalian vertebrates, in which recombination ratesare either similar in both sexes or biased toward higher rates in females.
Based on inferential evidence it was reasoned that the GMBX map covered alleight opossum autosomes and encompassed a large proportion of the autosomalgenome (Samollow et al., 2004). Even so, the map was based on only 80 loci, andthe formal possibility remained that substantial regions of some chromosomes mighthave been overlooked. Thus, it seemed prudent to increase the number of markerson the map to see if its very unusual characteristics would persist with greater mapdensity. Specifically, we wondered if adding more markers would lead to a substan-tial increase in map length, and if so, what effect this increase would have on thedisparity in sex-specific map lengths (Samollow et al., 2007). This issue arises fromobservations that female, but not male, chiasmata are concentrated at chromosome
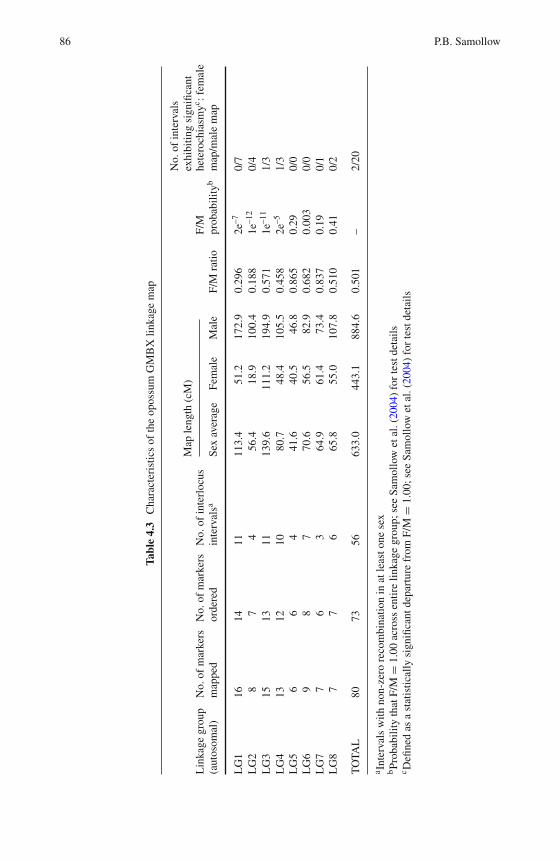
86 P.B. Samollow
Tabl
e4.
3C
hara
cter
istic
sof
the
opos
sum
GM
BX
linka
gem
ap
Map
leng
th(c
M)
No.
ofin
terv
als
exhi
bitin
gsi
gnifi
cant
Lin
kage
grou
p(a
utos
omal
)N
o.of
mar
kers
map
ped
No.
ofm
arke
rsor
dere
dN
o.of
inte
rloc
usin
terv
alsa
Sex
aver
age
Fem
ale
Mal
eF/
Mra
tioF/
Mpr
obab
ility
bhe
tero
chia
smyc :f
emal
em
ap/m
ale
map
LG
116
1411
113.
451
.217
2.9
0.29
62e
–70/
7L
G2
87
456
.418
.910
0.4
0.18
81e
–12
0/4
LG
315
1311
139.
611
1.2
194.
90.
571
1e–1
11/
3L
G4
1312
1080
.748
.410
5.5
0.45
82e
–51/
3L
G5
66
441
.640
.546
.80.
865
0.29
0/0
LG
69
87
70.6
56.5
82.9
0.68
20.
003
0/0
LG
77
63
64.9
61.4
73.4
0.83
70.
190/
1L
G8
77
665
.855
.010
7.8
0.51
00.
410/
2
TO
TAL
8073
5663
3.0
443.
188
4.6
0.50
1–
2/20
a Inte
rval
sw
ithno
n-ze
rore
com
bina
tion
inat
leas
tone
sex
bPr
obab
ility
that
F/M
=1.
00ac
ross
entir
elin
kage
grou
p;se
eSa
mol
low
etal
.(20
04)
for
test
deta
ilsc D
efine
das
ast
atis
tical
lysi
gnifi
cant
depa
rtur
efr
omF/
M=
1.00
;see
Sam
ollo
wet
al.(
2004
)fo
rte
stde
tails
4 Marsupial Linkage Maps 87
ends in the opossum (Hayman et al., 1988) and dunnart (Bennett et al., 1986). Thatbeing the case, newly added markers falling in subtelomeric regions beyond the endsof the existing linkage groups could disproportionately increase the length of thefemale map relative to the male map. Another and perhaps more important questionwas whether the heterochiasmy observed in the GMBX map mirrored a fundamentalopossum characteristic or rather might have been peculiar to the specific cross usedto create the mapping panel. This possibility argued that building a new and moredensely populated linkage map should be done using a different mapping panel.
The BBBX panel includes 29 Pop1 and 8 Pop5 grandparents, 33 F1 and 33Pop1 mates, and 468 third-generation offspring for a total of 571 individuals. Mapconstruction with this panel is ongoing, but only about half of the data have beenpublished. Herein I summarize the general characteristics of the initial BBBX link-age map based on 150 mapped markers (Samollow et al., 2007) and update thegeneral trends based on inspection of additional unpublished data. Because theBBBX map is based almost entirely on microsatellite markers, only 34 of theGMBX markers overlap with the BBBX study and no attempt has been made tointegrate GMBX and BBBX maps. However, the positions of the 34 overlappingmarkers are fully consistent between the two maps.
The salient features of the GMBX map, i.e., short sex-average length and thevery strong, male-biased heterochiasmy, are fully evident in the BBBX mappingdata, indicating that the unusual meiotic features inferred from the GMBX-basedmap are not idiosyncratic to a specific mapping panel, but are fundamental featuresof the opossum genome (Table 4.4). The sum of the eight BBBX autosomal linkage-group maps is only 714.8 cM. Adding estimates for unmapped regions yields afull autosomal map-length estimate of 866.2 cM, which is remarkably similar tothe 890.7 cM sex-average estimate from the GMBX map. The length of the male-specific map exceeds that of the female map for every linkage group, and in all casesthe difference is highly statistically significant (Table 4.4). Summing all linkagegroups, the female- and male-specific maps cover 515.5 and 948.2 cM (579.4 and1,064.9 cM after correcting for unmapped regions), respectively, yielding an F/Mratio of 0.544, which is in close agreement with the 0.501 F/M ratio of the GMBXsex-specific maps. Markers exhibiting X-linked inheritance were not included in themapping analysis.
The chromosomal affiliation of each linkage group, its orientation on the corre-sponding chromosome, and the extent of chromosomal coverage by each linkagegroup were determined by FISH mapping using BAC clones that encompassedparticular marker regions of interest, including the terminal markers of each link-age group. Individual linkage groups were estimated to cover between ∼72.9and ∼97.5% of their respective chromosomes, and total coverage was estimatedat ∼86.4% of the autosomal genome. This physical estimate agreed well with astatistical approach that yielded an estimate of ∼89.4% coverage. Averaging theFISH-based and statistical estimates suggests that the published BBBX linkage mapencompasses ∼87.8% of the opossum autosomal genome.
The virtually identical results from the GMBX and BBBX studies, which useddifferent genetic crosses and largely non-overlapping genetic marker sets, clearly
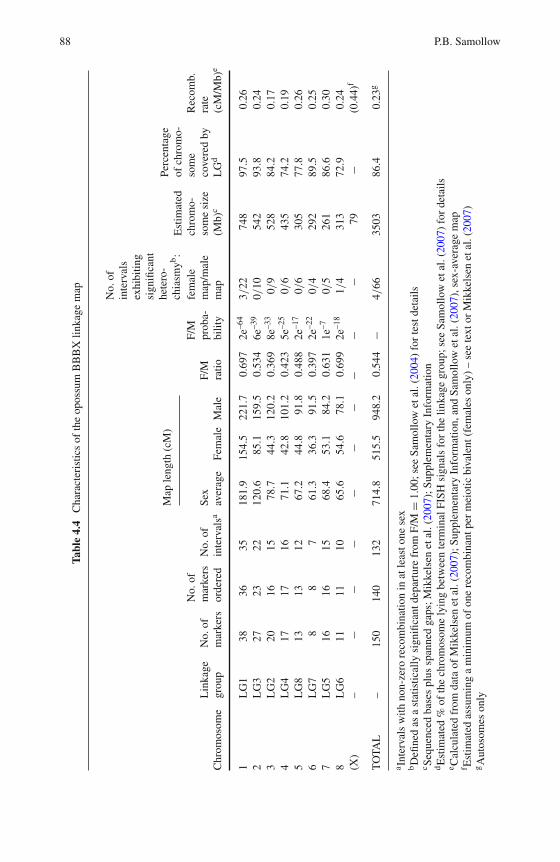
88 P.B. Samollow
Tabl
e4.
4C
hara
cter
istic
sof
the
opos
sum
BB
BX
linka
gem
ap
No.
ofin
terv
als
exhi
bitin
gsi
gnifi
cant
hete
ro-
Map
leng
th(c
M)
chia
smyb
:
Chr
omos
ome
Lin
kage
grou
pN
o.of
mar
kers
No.
ofm
arke
rsor
dere
dN
o.of
inte
rval
saSe
xav
erag
eFe
mal
eM
ale
F/M
ratio
F/M
prob
a-bi
lity
fem
ale
map
/mal
em
ap
Est
imat
edch
rom
o-so
me
size
(Mb)
c
Perc
enta
geof
chro
mo-
som
eco
vere
dby
LG
d
Rec
omb.
rate
(cM
/Mb)
e
1L
G1
3836
3518
1.9
154.
522
1.7
0.69
72e
–64
3/22
748
97.5
0.26
2L
G3
2723
2212
0.6
85.1
159.
50.
534
6e–3
90/
1054
293
.80.
243
LG
220
1615
78.7
44.3
120.
20.
369
8e–3
30/
952
884
.20.
174
LG
417
1716
71.1
42.8
101.
20.
423
5e–2
50/
643
574
.20.
195
LG
813
1312
67.2
44.8
91.8
0.48
82e
–17
0/6
305
77.8
0.26
6L
G7
88
761
.336
.391
.50.
397
2e–2
20/
429
289
.50.
257
LG
516
1615
68.4
53.1
84.2
0.63
11e
–70/
526
186
.60.
308
LG
611
1110
65.6
54.6
78.1
0.69
92e
–18
1/4
313
72.9
0.24
(X)
–−
−−
−−
−−
−−
79−
(0.4
4)f
TO
TAL
–15
014
013
271
4.8
515.
594
8.2
0.54
4−
4/66
3503
86.4
0.23
g
a Inte
rval
sw
ithno
n-ze
rore
com
bina
tion
inat
leas
tone
sex
bD
efine
das
ast
atis
tical
lysi
gnifi
cant
depa
rtur
efr
omF/
M=
1.00
;see
Sam
ollo
wet
al.(
2004
)fo
rte
stde
tails
c Sequ
ence
dba
ses
plus
span
ned
gaps
;Mik
kels
enet
al.(
2007
);Su
pple
men
tary
Info
rmat
ion
dE
stim
ated
%of
the
chro
mos
ome
lyin
gbe
twee
nte
rmin
alFI
SHsi
gnal
sfo
rth
elin
kage
grou
p;se
eSa
mol
low
etal
.(20
07)
for
deta
ilse C
alcu
late
dfr
omda
taof
Mik
kels
enet
al.(
2007
);Su
pple
men
tary
Info
rmat
ion,
and
Sam
ollo
wet
al.(
2007
),se
x-av
erag
em
apf E
stim
ated
assu
min
ga
min
imum
ofon
ere
com
bina
ntpe
rm
eiot
icbi
vale
nt(f
emal
eson
ly)
–se
ete
xtor
Mik
kels
enet
al.(
2007
)gA
utos
omes
only
4 Marsupial Linkage Maps 89
show that the short map length and strong, genome-wide and male-biased hete-rochiasmy are not artifacts of the particular population crosses employed. Moreover,inclusion of ∼88% of the autosomal genome in the BBBX map greatly diminishesthe likelihood that these results can be attributable to gross under representation oflarge portions of the genome.
Since publication of the BBBX map nearly 150 more markers have been added,many chosen by inspection of the opossum genome assembly (Mikkelsen et al.,2007) specifically to fill gaps in the map. Preliminary assessment of the data suggestthere has been some expansion of female linkage-group maps due to the targetedaddition of markers in subtelomeric regions, which would be expected to affect thefemale map length more than the male map length. This sex-specific differentialgrowth of linkage-group ends is expected to increase the F/M ratio slightly, but thedifference in sex-specific map lengths remains strikingly large. As a result of sex-specific expansions the overall sex-average map has also grown, but it is likely toremain under 1,000 cM.
We are also developing a linkage map for the opossum X chromosome. On thepresumption that all chromosomes must undergo at least one recombinational eventto assure proper disjunction at meiosis I, the diminutive opossum X (Table 4.4)was estimated to require a minimum recombination rate of 0.44 cM/Mb, a ratemuch higher than that for the autosomes (Mikkelsen et al., 2007). Preliminary datafrom ∼30 X-linked loci bear out this prediction and suggest that the X-chromosomerecombination rate is likely to be considerably higher than the theoretical minimum(K. C. Douglas and P. B. Samollow, unpublished data).
4.5 Implications of Low Recombination Rates
The wallaby and opossum genomes have some of the lowest recombination ratesamong vertebrates. The opossum estimated sex-average map length of 866 cM, forexample, falls far below the ∼1,630 cM sex-average mouse linkage map (Shifmanet al., 2006), which is the smallest known among eutherian species. As previouslynoted, the human genome is slightly smaller than that of the opossum, but its linkagemap spans ∼3,790 cM (Matise et al., 2007). Among other vertebrates with substan-tially complete linkage maps none have been reported to have shorter maps than theopossum. The combination of short linkage map and large genome translates to avery low average physical recombination rate of only ∼0.23 cM/Mb for the opos-sum autosome set, a rate far lower than that for mouse which, at ∼0.63 cM/Mb, hasthe lowest rate known among eutherian mammals. Rates for the individual opossumautosomes vary between ∼0.17 and ∼0.30 cM/Mb (Table 4.4). The correspondinggenome-wide rate for the wallaby, based on the published map (Zenger et al., 2002),is ∼0.33 cM/Mb. Although higher than that of the opossum, this is still very low bymammalian standards.
This low recombination rate may account for the unusual base compositionof the opossum genome relative to that of other fully sequenced and annotated
90 P.B. Samollow
amniote genomes. The opossum autosomes average only 37.7% G and C nucleotides(G+C), contrasting with levels of 40.9-41.8% for human, mouse, dog, and chicken(Mikkelsen et al., 2007), and 45.5% in the platypus (Warren et al., 2008). Mirroringthe low G+C content, the opossum autosomes also possess ≤ 50% the averageCpG dinucleotide content of other sequenced amniote genomes. A growing bodyof evidence suggests that G+C and CpG contents of a chromosomal region arestrongly influenced by the interplay of two opposing mutational processes; a gen-eral GC → AT mutation bias that reduces G+C content, and biased gene conversionwhich increases G+C content through biased AT → GC mismatch repair dur-ing recombination-mediated gene conversion events (Hogstrand and Bohme, 1999;Galtier et al., 2001; Duret et al., 2006). This model predicts that G+C and CpG con-tents will be positively correlated with recombination rate on a regional basis withinchromosomes and averaged across entire chromosomes. Averaged across wholegenomes, differences in species-specific recombination rate would be expected todrive interspecific diversity in overall G+C and CpG levels. The low G+C and CpGcontent of opossum autosomes are consistent with this model. Also consistent withthe model, the G+C and CpG fractions of the opossum X chromosome are muchhigher than those of the autosomes (40.9 and 1.4%, respectively), which is particu-larly interesting in light of the fact that X chromosomes of eutherians tend to havesubstantially lower G+C and CpG levels than their autosomes (Mikkelsen et al.,2007).
4.6 Sex-Role Reversal in Recombination Rates
In addition to the species already discussed, it appears that recombination occursmore frequently in male than female meiosis in at least one other marsupial,the brush-tailed possum, Trichosurus vulpecula (family Phalangeridae). Cytologicdata from this Australian species indicate that female meiocytes have reduced fre-quency and distal clustering of chiasmata relative to those of males (Hayman andRodger, 1990). The only contrary finding so far has been from the brush-tailedbettong, Bettongia penicillata (family Potoroidae), another Australian marsupial,which shows no obvious difference in sex-specific chiasma number or distribution(Hayman et al., 1990). Unfortunately there are no linkage data for the possum or bet-tong. Of the two species with linkage maps, the situation in the opossum is the mostextreme with the female linkage map barely half the size of the male map (54.5%).This degree of heterochiasmy is equaled in humans, house cats, and domestic pigs(Matise et al., 2007; Menotti-Raymond et al., 2009; Vingborg et al., 2009) and con-siderably surpassed in some fish species (Singer et al., 2002; Kai et al., 2005; Moenet al., 2008; Kucuktas et al., 2009); however, in all such cases it is the female thathas the longer map. Indeed, whenever heterochiasmy is encountered, it is almostinvariably the female that has the higher recombination rate.
Among non-marsupial vertebrates only two convincing cases of male-biased het-erochiasmy have been reported (other reported cases, based on pseudotestcrossstrategies and other single-sibship F1 mapping designs, are not considered here
4 Marsupial Linkage Maps 91
because such approaches are unreliable for discriminating genuine sex-specificrecombination rates from normal, interindividual variation in recombination ratesthat is not sex related. In addition, maps based on such designs often exhibit pooroverlap in genomic coverage between the parents and may not be representativeacross the genome generally). Female collared flycatchers (Ficedula albicollis) anddomestic sheep (Ovis aries) have shorter linkage maps than their male counterparts.Overall F/M for the flycatcher (a bird) is ∼0.82 but, as was the case for the wal-laby, not all linkage groups exhibit heterochiasmy (Backstrom et al., 2008). Allother bird species examined either display no heterochiasmy or have higher femalethan male recombination rates (Calderon and Pigozzi, 2006; Akesson et al., 2007;Stapley et al., 2008; Groenen et al., 2009; Jaari et al., 2009).
The situation in sheep is particularly interesting. Sheep exhibit an overall F/Mmap ratio of ∼0.85 (Maddox et al., 2001 and Jill Maddox, personal communica-tion). Across most of the map, the distances between markers are very similar forboth sexes (little or no heterochiasmy), but the male recombination rate rises dramat-ically in portions of the map corresponding to subtelomeric and pericentric regionsof the chromosomes, resulting in longer male linkage-group maps and overall maplength (Jill Maddox, personal communication). The low overall F/M ratio of sheepthus reflects a largely sex-equal recombination pattern punctuated by much highermale rates in subtelomeric and pericentric regions only. Increasing male recombina-tion (reduced F/M ratio) in subtelomeric regions is characteristic of eutherians, andpossibly vertebrates generally, occurring in humans, mice, and pigs (Broman et al.,1998; Kong et al., 2002; Shifman et al., 2006; Vingborg et al., 2009) and in severalfish species (Singer et al., 2002; Reid et al., 2007; Kochakpour and Moens, 2008;Moen et al., 2008), so sheep are typical in this regard. The rise in male recombina-tion in pericentric regions of sheep is unusual however, being opposite of what isknown based on humans and mice, wherein the F/M ratio in these regions gener-ally increases sharply due to a drop in male recombination and concomitant rise infemale recombination.
In any case, the recombination pattern underlying the low F/M ratio in sheepis quite distinct from that in the opossum, wherein males have higher recombina-tion across almost the entire genome. Equally important, the opossum map does notexhibit the eutherian pattern of sharply increased male relative to female recombina-tion rate (reduction in F/M ratio) in subtelomeric regions. Indeed, the pattern in theopossum is reversed, with the F/M ratio rising in subtelomeric regions. Comparedwith the male map, inter-locus distances in regions corresponding to the midsec-tions of chromosomes appear highly compressed in the female map while thosecorresponding to the ends of chromosomes are expanded (Fig. 4.1). This pattern,observed on several chromosomes (Samollow et al., 2007), is expected if femaleopossums regularly exhibit strong clustering of recombination events at the endsof chromosomes but males do not, as suggested by the cytologic observations ofHayman and colleagues (1988). Finally, it does not appear that opossum males havereduced pericentromeric recombination rates relative to females, as is seen in mouseand human maps, although rigorous conclusions must await more precise localiza-tion of centromeres on the linkage maps. Overall then, the sex-roles for the meiotic
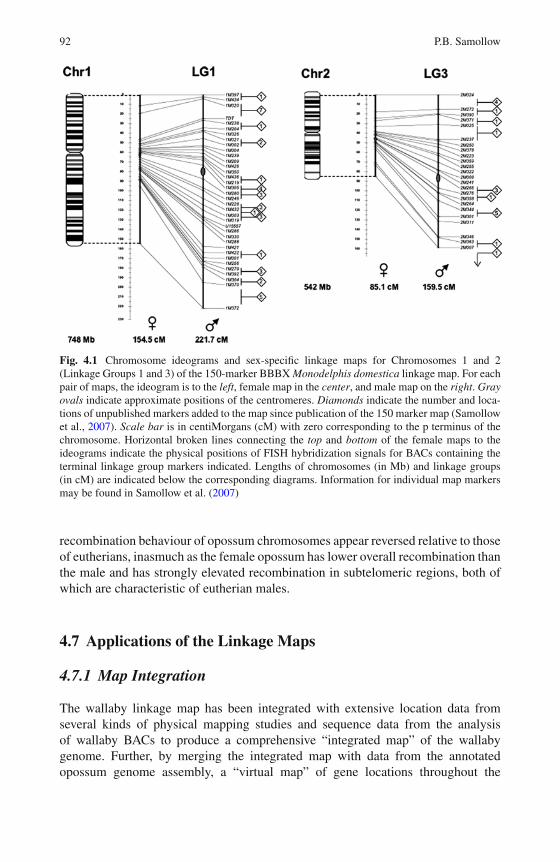
92 P.B. Samollow
Fig. 4.1 Chromosome ideograms and sex-specific linkage maps for Chromosomes 1 and 2(Linkage Groups 1 and 3) of the 150-marker BBBX Monodelphis domestica linkage map. For eachpair of maps, the ideogram is to the left, female map in the center, and male map on the right. Grayovals indicate approximate positions of the centromeres. Diamonds indicate the number and loca-tions of unpublished markers added to the map since publication of the 150 marker map (Samollowet al., 2007). Scale bar is in centiMorgans (cM) with zero corresponding to the p terminus of thechromosome. Horizontal broken lines connecting the top and bottom of the female maps to theideograms indicate the physical positions of FISH hybridization signals for BACs containing theterminal linkage group markers indicated. Lengths of chromosomes (in Mb) and linkage groups(in cM) are indicated below the corresponding diagrams. Information for individual map markersmay be found in Samollow et al. (2007)
recombination behaviour of opossum chromosomes appear reversed relative to thoseof eutherians, inasmuch as the female opossum has lower overall recombination thanthe male and has strongly elevated recombination in subtelomeric regions, both ofwhich are characteristic of eutherian males.
4.7 Applications of the Linkage Maps
4.7.1 Map Integration
The wallaby linkage map has been integrated with extensive location data fromseveral kinds of physical mapping studies and sequence data from the analysisof wallaby BACs to produce a comprehensive “integrated map” of the wallabygenome. Further, by merging the integrated map with data from the annotatedopossum genome assembly, a “virtual map” of gene locations throughout the
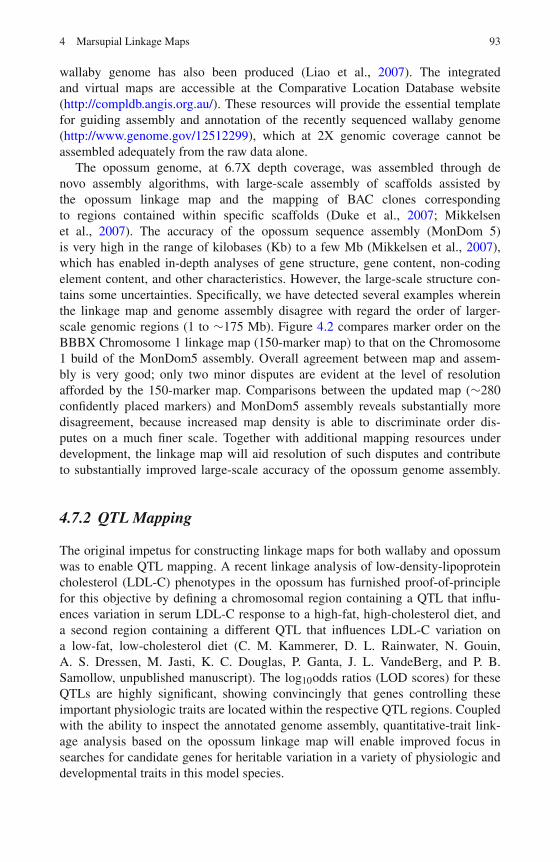
4 Marsupial Linkage Maps 93
wallaby genome has also been produced (Liao et al., 2007). The integratedand virtual maps are accessible at the Comparative Location Database website(http://compldb.angis.org.au/). These resources will provide the essential templatefor guiding assembly and annotation of the recently sequenced wallaby genome(http://www.genome.gov/12512299), which at 2X genomic coverage cannot beassembled adequately from the raw data alone.
The opossum genome, at 6.7X depth coverage, was assembled through denovo assembly algorithms, with large-scale assembly of scaffolds assisted bythe opossum linkage map and the mapping of BAC clones correspondingto regions contained within specific scaffolds (Duke et al., 2007; Mikkelsenet al., 2007). The accuracy of the opossum sequence assembly (MonDom 5)is very high in the range of kilobases (Kb) to a few Mb (Mikkelsen et al., 2007),which has enabled in-depth analyses of gene structure, gene content, non-codingelement content, and other characteristics. However, the large-scale structure con-tains some uncertainties. Specifically, we have detected several examples whereinthe linkage map and genome assembly disagree with regard the order of larger-scale genomic regions (1 to ∼175 Mb). Figure 4.2 compares marker order on theBBBX Chromosome 1 linkage map (150-marker map) to that on the Chromosome1 build of the MonDom5 assembly. Overall agreement between map and assem-bly is very good; only two minor disputes are evident at the level of resolutionafforded by the 150-marker map. Comparisons between the updated map (∼280confidently placed markers) and MonDom5 assembly reveals substantially moredisagreement, because increased map density is able to discriminate order dis-putes on a much finer scale. Together with additional mapping resources underdevelopment, the linkage map will aid resolution of such disputes and contributeto substantially improved large-scale accuracy of the opossum genome assembly.
4.7.2 QTL Mapping
The original impetus for constructing linkage maps for both wallaby and opossumwas to enable QTL mapping. A recent linkage analysis of low-density-lipoproteincholesterol (LDL-C) phenotypes in the opossum has furnished proof-of-principlefor this objective by defining a chromosomal region containing a QTL that influ-ences variation in serum LDL-C response to a high-fat, high-cholesterol diet, anda second region containing a different QTL that influences LDL-C variation ona low-fat, low-cholesterol diet (C. M. Kammerer, D. L. Rainwater, N. Gouin,A. S. Dressen, M. Jasti, K. C. Douglas, P. Ganta, J. L. VandeBerg, and P. B.Samollow, unpublished manuscript). The log10odds ratios (LOD scores) for theseQTLs are highly significant, showing convincingly that genes controlling theseimportant physiologic traits are located within the respective QTL regions. Coupledwith the ability to inspect the annotated genome assembly, quantitative-trait link-age analysis based on the opossum linkage map will enable improved focus insearches for candidate genes for heritable variation in a variety of physiologic anddevelopmental traits in this model species.
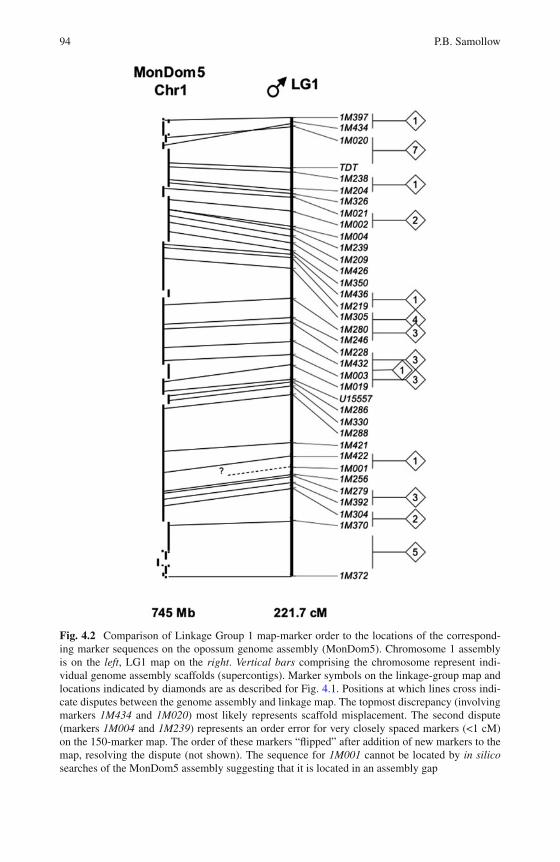
94 P.B. Samollow
Fig. 4.2 Comparison of Linkage Group 1 map-marker order to the locations of the correspond-ing marker sequences on the opossum genome assembly (MonDom5). Chromosome 1 assemblyis on the left, LG1 map on the right. Vertical bars comprising the chromosome represent indi-vidual genome assembly scaffolds (supercontigs). Marker symbols on the linkage-group map andlocations indicated by diamonds are as described for Fig. 4.1. Positions at which lines cross indi-cate disputes between the genome assembly and linkage map. The topmost discrepancy (involvingmarkers 1M434 and 1M020) most likely represents scaffold misplacement. The second dispute(markers 1M004 and 1M239) represents an order error for very closely spaced markers (<1 cM)on the 150-marker map. The order of these markers “flipped” after addition of new markers to themap, resolving the dispute (not shown). The sequence for 1M001 cannot be located by in silicosearches of the MonDom5 assembly suggesting that it is located in an assembly gap
4 Marsupial Linkage Maps 95
4.7.3 Determinants of Sex-Specific Recombination Rates
A substantial body of theory suggests that the frequency of meiotic recombinationis under genetic control and can be adjusted by natural selection to optimize thebalance between maintenance and destruction of favourable and unfavourable hap-lotypes from one generation to the next (reviewed by Otto and Lenormand, 2002;Rice, 2002; Barton and Otto, 2005; Otto and Gerstein, 2006; Coop and Przeworski,2007; see also Martin et al., 2006; Gandon and Otto, 2007). The increasing availabil-ity of quality linkage maps and genome sequence data have more recently enabledevaluation of neutral models of recombination rate evolution as well as the examina-tion of phylogenetic history and the effects of genomic substructure and redundancyon recombination rates (reviewed by Coop and Przeworski, 2007; de Visser andElena, 2007; Dumont and Payseur, 2008). Finally, physical constraints on meioticrecombination rates and patterns in assuring proper chromosomal disjunction, asdistinct from their influence in shaping haplotype structure and diversity, are alsoreceiving increasing scrutiny (see Coop and Przeworski, 2007).
Corollary to these general theories of recombination rate, several hypothesesand numerous variants of them have been elaborated to explain why males andfemales of the same species should have different recombination rates (reviewedby Hedrick, 2007). None of these concepts is adequate to explain all or even mostsuch cases, but an important outcome of these modeling efforts is recognition thatthe forces that shape recombination rates can act differentially on the sexes, result-ing in very distinct male and female recombination rates and patterns (Lenormand,2003; Lenormand and Dutheil, 2005).
Despite this extensive theoretical development, we do not know why any par-ticular species has the recombination rate it does, or why marsupials in particularshould have reduced recombination. In contrast, good progress is being made towardunderstanding the proximate molecular mechanisms that determine where and howoften meiotic recombination events take place (Morelli and Cohen, 2005; Hunt,2006; Moens et al., 2007; Petkov et al., 2007; and general reviews by Petronczkiet al., 2003; Kauppi et al., 2004; Ivanovska and Orr-Weaver, 2006). Illuminatingthe proximal factors that influence sex-specific differences in chiasma number anddistribution can enable the testing of more general hypotheses regarding the physi-cal basis of crossover interference and the relationships between chiasma numberand location vis-à-vis sex-specific differences in the risk of nondisjunction. Forexample, there is mounting evidence that large-scale genomic structure, local DNAsequence characteristics, and particularly variation in chromatin configuration (epi-genetic states) have influences on recombination rates and locations (Lercher andHurst, 2003; Sandovici et al., 2006; Buard and de Massy, 2007; Ng et al., 2009;Sigurdsson et al., 2009). In this context, the extreme heterochiasmy seen in theopossum can provide a powerful system with which to explore the interaction ofsex and meiotic chromosome behavior. For example, if sex-specific differences inchromatin structure (histone modifications, DNA methylation state) differentiallyinfluence vulnerability to double-strand DNA breaks or their ultimate resolution(reciprocal exchange vs. non-exchange) in mammalian meiocytes, then the genomic
96 P.B. Samollow
distributions and intensities of sex-specific epigenetic states in the early meiotic cellsof male and female opossums can be expected to be predictably different (reversed)from those of a eutherian model species, such as mouse. The unusual recombi-national features of the opossum genome can thus furnish a naturally occurring,comparative model for testing hypotheses about epigenetic influences on molecularprocesses that promote or inhibit chiasma formation and distributions, particularlybetween the sexes.
Acknowledgments The author’s work is supported in part by grant RR014214 from the NationalCenter for Research Resources of the National institutes of Health (USA).
References
Akesson M, Hansson B, Hasselquist D, Bensch S (2007) Linkage mapping of AFLP markers in awild population of great reed warblers: importance of heterozygosity and number of genotypedindividuals. Mol Ecol 16:2189–2202.
Backstrom N, Karaiskou N, Leder EH, et al. (2008) A gene-based genetic linkage map of thecollared flycatcher (Ficedula albicollis) reveals extensive synteny and gene-order conservationduring 100 million years of avian evolution. Genetics 179:1479–1495.
Barton NH, Otto SP (2005) Evolution of recombination due to random drift. Genetics 169:2353–2370.
Bennett JH, Hayman DL, Hope RM (1986) Novel sex differences in linkage values and meioticchromosome behaviour in a marsupial. Nature 323:59–60.
Broman KW, Murray JC, Sheffield VC, White RL, Weber JL (1998) Comprehensive human geneticmaps: individual and sex-specific variation in recombination. Am J Hum Genet 63:861–869.
Buard J, de Massy B (2007) Playing hide and seek with mammalian meiotic crossover hotspots.Trends Genet 23:301–309.
Calderon PL, Pigozzi MI (2006) MLH1-focus mapping in birds shows equal recombinationbetween sexes and diversity of crossover patterns. Chromosome Res 14:605–612.
Coop G, Przeworski M (2007) An evolutionary view of human recombination. Nat Rev Genet8:23–34.
Cooper DW, Johnston PG, VandeBerg JL, Robinson ES (1990) X-chromosome inactivation inmarsupials. In: Graves JAM, Hope R, Cooper DW (eds) Mammals from Pouches and Eggs:Genetics, Breeding and Evolution of Marsupials and Monotremes. CSIRO, Melbourne.
Cooper DW, Johnston PG, Watson JM, Graves JAM (1993) X-inactivation in marsupials andmonotremes. Sem Dev Biol 4:117–128.
Cooper DW, VandeBerg JL, Sharman GB, Poole WE (1971) Phosphoglycerate kinase polymor-phism in kangaroos provides further evidence for paternal X inactivation. Nat New Biol230:155–157.
de Visser JA, Elena SF (2007) The evolution of sex: empirical insights into the roles of epistasisand drift. Nat Rev Genet 8:139–149.
Duke SE, Samollow PB, Mauceli E, Lindblad-Toh K, Breen M (2007) Integrated cytogenetic BACmap of the genome of the gray, short-tailed opossum, Monodelphis domestica. ChromosomeRes 15:361–370.
Dumont BL, Payseur BA (2008) Evolution of the genomic rate of recombination in mammals.Evolution 62:276–294.
Duret L, Eyre-Walker A, Galtier N (2006) A new perspective on isochore evolution. Gene 385:71–74.
Galtier N, Piganeau G, Mouchiroud D, Duret L (2001) GC-content evolution in mammaliangenomes: the biased gene conversion hypothesis. Genetics 159:907–911.
4 Marsupial Linkage Maps 97
Gandon S, Otto SP (2007) The evolution of sex and recombination in response to abiotic orcoevolutionary fluctuations in epistasis. Genetics 175:1835–1853.
Graves JA, Westerman M (2002) Marsupial genetics and genomics. Trends Genet 18:517–521.Groenen MA, Wahlberg P, Foglio M, et al. (2009) A high-density SNP-based linkage map of the
chicken genome reveals sequence features correlated with recombination rate. Genome Res19:510–519.
Hayman D, Moore H, Evans E (1988) Further evidence of novel sex differences in chiasmadistribution in marsupials. Heredity 61:455–458.
Hayman DL, Rodger JC (1990) Meiosis in male and female Trichosurus vulpecula (Marsupialia).Heredity 64:251–254.
Hayman DL, Smith MJ, Rodger JC (1990) A comparative study of chiasmata in male and femaleBettongia penicillata (Marsupialia). Genetica 83:45–49.
Hedrick PW (2007) Sex: differences in mutation, recombination, selection, gene flow, and geneticdrift. Evolution 61:2750–2771.
Hinds LA, Poole WE, Tyndale-Biscoe CH, van Oorschot RAH, Cooper DW (1990) Reproductivebiology and the potential for genetic studies in the tammar wallaby, Macropus eugenii. Aust JZool 37:223–234.
Hogstrand K, Bohme J (1999) Gene conversion of major histocompatibility complex genes isassociated with CpG-rich regions. Immunogenetics 49:446–455.
Hope RM (1993) Selected features of marsupial genetics. Genetica 90:165–180.Hunt PA (2006) Meiosis in mammals: recombination, non-disjunction and the environment.
Biochem Soc Trans 34:574–577.Ivanovska I, Orr-Weaver TL (2006) Histone modifications and the chromatin scaffold for meiotic
chromosome architecture. Cell Cycle 5:2064–2071.Jaari S, Li MH, Merila J (2009) A first-generation microsatellite-based genetic linkage map of
the Siberian jay (Perisoreus infaustus): insights into avian genome evolution. BMC Genomics10:1.
Kai W, Kikuchi K, Fujita M, et al. (2005) A genetic linkage map for the tiger pufferfish, Takifugurubripes. Genetics 171:227–238.
Kauppi L, Jeffreys AJ, Keeney S (2004) Where the crossovers are: recombination distributions inmammals. Nat Rev Genet 5:413–424.
Kochakpour N, Moens PB (2008) Sex-specific crossover patterns in Zebrafish (Danio rerio).Heredity 100:489–495.
Kong A, Gudbjartsson DF, Sainz J, et al. (2002) A high-resolution recombination map of the humangenome. Nat Genet 31:241–247.
Kucuktas H, Wang S, Li P, et al. (2009) Construction of genetic linkage maps and comparativegenome analysis of catfish using gene-associated markers. Genetics 181:1649–1660.
Lenormand T (2003) The evolution of sex dimorphism in recombination. Genetics 163:811–822.Lenormand T, Dutheil J (2005) Recombination difference between sexes: a role for haploid
selection. PLoS Biol 3:e63.Lercher MJ, Hurst LD (2003) Imprinted chromosomal regions of the human genome have
unusually high recombination rates. Genetics 165:1629–1632.Liao W, Collins A, Hobbs M, Khatkar MS, Luo J, Nicholas FW (2007) A comparative loca-
tion database (CompLDB): map integration within and between species. Mamm Genome 18:287–299.
Maddox JF, Davies KP, Crawford AM, et al. (2001) An enhanced linkage map of the sheep genomecomprising more than 1000 loci. Genome Res 11:1275–1289.
Martin G, Otto SP, Lenormand T (2006) Selection for recombination in structured populations.Genetics 172:593–609.
Matise TC, Chen F, Chen W, et al. (2007) A second-generation combined linkage physical map ofthe human genome. Genome Res 17:1783–1786.
98 P.B. Samollow
McKenzie LM, Collet C, Cooper DW (1993) Use of a subspecies cross for efficient developmentof a linkage map for a marsupial mammal, the tammar wallaby (Macropus eugenii). CytogenetCell Genet 64:264–267.
McKenzie LM, Johnston PG, Eldridge MD, Cooper DW (1996) Close linkage between RNR andGPD genes on the tammar wallaby (Macropus eugenii) X chromosome. Cytogenet Cell Genet72:197–199.
Menotti-Raymond M, David VA, Schaffer AA, et al. (2009) An autosomal genetic linkage map ofthe domestic cat, Felis silvestris catus. Genomics 93:305–313.
Mikkelsen TS, Wakefield MJ, Aken B, et al. (2007) Genome of the marsupial Monodelphisdomestica reveals innovation in non-coding sequences. Nature 447:167–177.
Moen T, Hayes B, Baranski M, et al. (2008) A linkage map of the Atlantic salmon (Salmo salar)based on EST-derived SNP markers. BMC Genomics 9:223.
Moens PB, Marcon E, Shore JS, Kochakpour N, Spyropoulos B (2007) Initiation and resolutionof interhomolog connections: crossover and non-crossover sites along mouse synaptonemalcomplexes. J Cell Sci 120:1017–1027.
Morelli MA, Cohen PE (2005) Not all germ cells are created equal: aspects of sexual dimorphismin mammalian meiosis. Reproduction 130:761–781.
Morgan TH (1911a). Random segregation versus coupling in Mendelian inheritance. Science34:384.
Morgan TH (1911b). Chromosomes and associative inheritance. Science 34:636–638.Morgan TH (1911c). An attempt to analyze the constitution of the chromosomes on the basis of
sex-limited inheritance in Drosophila. J Exp Zool 11:365–413.Ng SH, Madeira R, Parvanov ED, Petros LM, Petkov PM, Paigen K (2009) Parental origin of chro-
mosomes influences crossover activity within the Kcnq1 transcriptionally imprinted domain ofMus musculus. BMC Mol Biol 10:43.
Ohno S (1967) Sex-Chromosomes and Sex-Linked Genes. Springer, Berlin.Otto SP, Gerstein AC (2006) Why have sex? The population genetics of sex and recombination.
Biochem Soc Trans 34:519–522.Otto SP, Lenormand T (2002) Resolving the paradox of sex and recombination. Nat Rev Genet
3:252–261.Perelygin AA, Samollow PB, Perelygina LM, Cherry LM, Mahaney SM, VandeBerg JL (1996)
A new DNA marker, U15557, is linked to protease inhibitor and adenylate kinase-1 in thelaboratory opossum, Monodelphis domestica. Anim Genet 27:113–116.
Petkov PM, Broman KW, Szatkiewicz JP, Paigen K (2007) Crossover interference underlies sexdifferences in recombination rates. Trend Genet 23:539–542.
Petronczki M, Siomos MF, Nasmyth K (2003) Un menage a quatre: the molecular biology ofchromosome segregation in meiosis. Cell 112:423–440.
Reid DP, Smith CA, Rommens M, Blanchard B, Martin-Robichaud D, Reith M (2007) A geneticlinkage map of Atlantic halibut (Hippoglossus hippoglossus L.). Genetics 177:1193–1205.
Rice WR (2002) Experimental tests of the adaptive significance of sexual recombination. Nat RevGenet 3:241–251.
Richardson BJ, Czuppon AB, Sharman GB (1971) Inheritance of glucose-6-phosphate dehydroge-nase variation in kangaroos. Nat New Biol 230:154–155.
Samollow PB, Gouin N, Miethke P, et al. (2007) A microsatellite-based, physically anchoredlinkage map for the gray, short-tailed opossum (Monodelphis domestica). Chromosome Res15:269–281.
Samollow PB, Graves JAM (1998) Gene maps of marsupials. ILAR J 39:203–224.Samollow PB, Kammerer CM, Mahaney SM, et al. (2004) First generation linkage map of the
gray, short-tailed opossum, Monodelphis domestica, reveals genome-wide reduction in femalerecombination rates. Genetics 166:307–329.
Sandovici I, Kassovska-Bratinova S, Vaughan JE, Stewart R, Leppert M, Sapienza C (2006)Human imprinted chromosomal regions are historical hot-spots of recombination. PLoS Genet2:e101.
4 Marsupial Linkage Maps 99
Shifman S, Bell JT, Copley RR, et al. (2006) A high-resolution single nucleotide polymorphismgenetic map of the mouse genome. PLoS Biol 4:e395.
Sigurdsson MI, Smith AV, Bjornsson HT, Jonsson JJ (2009) HapMap methylation-associatedSNPs, markers of germline DNA methylation, positively correlate with regional levels ofhuman meiotic recombination. Genome Res 19:581–589.
Singer A, Perlman H, Yan Y, et al. (2002) Sex-specific recombination rates in zebrafish (Daniorerio). Genetics 160:649–657.
Stapley J, Birkhead TR, Burke T, Slate J (2008) A linkage map of the zebra finch Taeniopygiaguttata provides new insights into avian genome evolution. Genetics 179:651–667.
Sturtevant AH (1913) The linear arrangement of six sex-linked factors in Drosophila, as shown bytheir mode of inheritance. J Exp Zool 14:43–59.
VandeBerg JL (1990) The gray, short-tailed opossum (Monodelphis domestica) as a modeldidelphid for genetic research. Aust J Zool 37:235–247.
VandeBerg JL, Robinson ES (1997) The laboratory opossum (Monodelphis domestica) in labora-tory research. ILAR Journal 38:4–12.
VandeBerg JL, Robinson ES, Samollow PB, Johnston PG (1987) X-linked gene expression andX-chromosome inactivation: marsupials, mouse, and man compared. Isozymes Curr Top BiolMed Res 15:225–253.
van Oorschot RA, Birmingham V, Porter PA, Kammerer CM, VandeBerg JL (1993) Linkagebetween complement components 6 and 7 and glutamic pyruvate transaminase in the marsupialMonodelphis domestica. Biochem Genet 31:215–222.
van Oorschot RAH, Cooper DW (1989) A conserved linkage between PI and GPI in a marsupialmammal, the tammar wallaby (Macropus eugenii). Cytogenet Cell Genet 51:1097.
van Oorschot RA, Porter PA, Kammerer CM, VandeBerg JL (1992) Severely reduced recombi-nation in females of the South American marsupial Monodelphis domestica. Cytogenet CellGenet 60:64–67.
Vingborg RK, Gregersen VR, Zhan B, et al. (2009) A robust linkage map of the porcine autosomesbased on gene-associated SNPs. BMC Genomics 10:134.
Warren WC, Hillier LW, Marshall Graves JA, et al. (2008) Genome analysis of the platypus revealsunique signatures of evolution. Nature 453:175–183.
Zenger KR, McKenzie LM, Cooper DW (2002) The first comprehensive genetic linkage map of amarsupial: the tammar wallaby (Macropus eugenii). Genetics 162:321–330.

Chapter 5Physical and Comparative Gene Mapsin Marsupials
Janine E. Deakin
Abstract Comparative gene mapping in marsupials is responsible for manyadvances in our understanding of the events occurring during mammalian genomeevolution. Over the past few years, the ease and speed at which genes can bephysically mapped in marsupials has resulted in moderately dense physical mapsfor the South American opossum and the tammar wallaby. These maps haveenabled genome sequence assemblies to be anchored to chromosomes and facili-tated detailed comparative studies into genome evolution. The physical assignmentof genes to marsupial chromosomes has resulted in many interesting and unexpectedfindings, including the discovery of novel genes and the absence of others, as well asproviding insight into the evolution of epigenetic phenomena of genomic imprint-ing and X chromosome inactivation. Expanding comparative maps to include otherdistantly related marsupials is now possible and will be important for an accuratereconstruction of the ancestral marsupial karyotype.
Keywords Chromosome · Cytogenetic · Genome evolution · Physicalmap · Comparative genomics
5.1 Introduction
For over 30 years, a major goal in marsupial genetics and genomics studies hasbeen to construct detailed gene maps for several distantly related species, in order tocompare gene arrangement between different marsupials, as well as between mar-supials and other vertebrates. Gene mapping data complements the comparative
J.E. Deakin (B)ARC Centre of Excellence for Kangaroo Genomics, Evolution, Ecology and Genetics, ResearchSchool of Biology, The Australian National University, Canberra, ACT 0200, Australiae-mail: [email protected]
101J.E. Deakin et al. (eds.), Marsupial Genetics and Genomics,DOI 10.1007/978-90-481-9023-2_5, C© Springer Science+Business Media B.V. 2010
102 J.E. Deakin
chromosome painting work described by Rens and Ferguson-Smith (Chapter 2),which has provided an excellent overview of global chromosome homologiesamongst marsupials and shown the highly conserved nature of the marsupial kary-otype. However, gene maps can provide information on gene order and internalrearrangements, which is beyond the sensitivity of chromosome painting. Marsupialgene maps assist in determining the events which have shaped the mammaliangenome since the divergence of mammals and birds. They provide informationon gene order and genome rearrangements among marsupials, enabling the evo-lutionary history of their genomes to be traced and the relationship between genearrangement and function to be determined.
There have been several different methods used to construct gene maps in mar-supials, including somatic cell hybrids, linkage (genetic) mapping and physical(cytogenetic) mapping. Marsupial-rodent somatic cell hybrids, the original methodused for gene mapping, were problematic to work with and very unstable (reviewedin Graves et al., 1989). However, they were useful for assigning genes to the X chro-mosome in marsupials (Dawson and Graves, 1984; Donald and Hope, 1981; Graveset al., 1979). Linkage mapping (discussed by Samollow in the previous chapter)is able to provide information on gene order within a linkage group but requiresphysical mapping to assign these linkage groups to chromosomes. In addition, link-age mapping, for the most part, consists of anonymous sequence markers ratherthan actual genes, limiting the value of these maps in comparative genomic stud-ies. Physical mapping by fluorescence in situ hybridisation (FISH) overcomes thelimitations of somatic cell hybrids and linkage mapping. It is the most appropriatemethod for localising a gene of interest to a chromosome and provides a fairly pre-cise location of the gene, which is important for comparing genome organisationacross taxa.
5.2 Species Used for Physical Mapping
In the past, the construction of gene maps in marsupials was a challenging and slowprocess. Early work on gene maps in marsupials saw a handful of genes assigned tochromosomes, by various techniques, in 17 different species (Samollow and Graves,1998). With different genes mapped in these species and so few genes in total,construction of comparative maps was difficult. To overcome part of this problem,three model marsupials were proposed for genetic studies and the construction ofdetailed gene maps; the tammar wallaby (Macropus eugenii), the South Americanopossum (Monodelphis domestica) and the fat-tailed dunnart (Sminthopsis cras-sicaudata) (Bennett et al., 1989; Hinds et al., 1989; VandeBerg, 1989). Thesespecies were chosen due to the availability of captive breeding colonies with somegenetic linkage data available, and they represented three of the five major marsupialorders (Hope and Cooper, 1989). However, most cytogenetic mapping in a dasyuridspecies has been carried out in the striped-face dunnart (S. macroura) rather thanS. crassicaudata.
5 Physical and Comparative Gene Maps in Marsupials 103
5.3 Physical Mapping in the Pre-genomics Era
The first genes physically localised in a marsupial were the globin genes HBB andHBA of the Eastern quoll (Dasyurus viverrinus) (Wainwright and Hope, 1985).Radioactive in situ hybridisation (RISH), a technique which detected the locationof radioactively labelled probes on chromosomes by autoradiography, was used tomap the quoll cDNA probes for the HBA and HBB genes (Wainwright and Hope,1985). Due to the difficulty in isolating marsupial sequences, heterologous probes tohighly conserved genes, often human or mouse cDNA clones, were used to localisemost genes by this technique. Unfortunately, RISH was inherently floored by theuse of these heterologous probes, which also detected processed pseudogenes andparalogues and relied on statistical analysis to provide an approximate position onthe chromosome. A number of the localisations made using this approach have nowbeen shown to be incorrect by fluorescence in situ hybridisation (FISH) (Deakinet al., 2008).
FISH revolutionised physical mapping in marsupials in the late 1990s. Thisapproach relies on the labelling of large homologous probes, either directly orindirectly, with a fluorochrome. Following hybridisation, fluorescent signals arevisualised on chromosomes using a fluorescence microscope, overcoming manyof the problems associated with RISH. It has the added advantage of allowingtwo or more probes, labelled with different fluorochromes, to be mapped in oneexperiment, permitting the relative order of genes on a chromosome to be deter-mined. A limiting factor for this technique prior to the marsupial genome projectswas obtaining the large homologous probes for hybridisation. This involved screen-ing lambda genomic libraries, with inserts of approximately 15 kb, using humanor mouse cDNA clones. Screening with these heterologous probes was oftenfrustrating and resulted in the isolation of false positives. Alternatively, species-specific probes for library screening could be generated by PCR with degenerateprimers, but unfortunately these primers often did not result in the amplificationof the gene of interest. More recently, the construction of BAC (Bacterial ArtificialChromosome) libraries for several marsupials with inserts on average ∼150 kb haveproven to be a tremendous resource for physical mapping studies. Libraries used forphysical mapping purposes include two male tammar wallaby libraries [Me_VIAlibrary (Sankovic et al., 2005) and ME_KBa (Arizona Genomics Institute)], male(VMRC6) and female (VMRC18) M. domestica libraries (BACPAC Resources) anda Didelphis virginiana (LBNL-3) library (BACPAC Resources). The larger insertsize of the BAC clones compared to lambda clones makes the hybridisation moreefficient and FISH signals easier to detect under the fluorescence microscope.
During the pre-genomics era, genes were chosen for mapping based on inter-est, such as those on the sex chromosomes in human. With different genes beingchosen for mapping in different species, the construction of large-scale comparativemaps between marsupials and human and other vertebrates was difficult. Despitethis drawback, gene mapping still proved to be extremely valuable for determin-ing the relationship between gene arrangement and gene function. One renownedexample involves the discovery of the mammalian sex-determining gene. The region
104 J.E. Deakin
responsible for testis determination on the human Y chromosome was narroweddown to a 35 kb region after many years of deletion mapping analysis on sex-reversed humans (Vergnaud et al., 1986). One zinc finger protein gene cloned fromthis region, ZFY, was put forward as a candidate testis-determining gene. Mappingof the marsupial ZFY orthologue to an autosome provided the first evidence that itwas not the gene responsible for testis determination (Sinclair et al., 1988). Later, theSRY gene was isolated from this same region of the human Y (Sinclair et al., 1990),and evidence for this gene playing a role in testis development was demonstrated bythe development of testes in XX mice with a Sry transgene (Koopman et al., 1991).SRY was subsequently mapped to the marsupial Y chromosome, confirming it as thesex-determining gene in therian (marsupial and eutherian) mammals (Foster et al.,1992). The hypothesis to explain the evolution of SRY from an X-borne copy wasproposed after a related gene (SOX3) was mapped to the marsupial X chromosome(Foster and Graves, 1994).
5.4 Physical Mapping in the Genomics Era
Following the sequencing of the human genome, a number of other vertebrates werechosen for genome sequencing to aid in the annotation of the human genome and tofacilitate comparative studies into genome evolution, structure and function (Green,2007; http://www.genome.gov/25521739). Two marsupials were among the list ofmammals chosen for genome sequencing; the South American grey short-tailedopossum and the tammar wallaby. Although, genome sequence is unarguably anextremely valuable resource, the assignment of sequence to chromosomes is criticalif this resource is to be used to its full potential (Lewin et al., 2009). In both marsu-pial genome projects, physical mapping has played an important role in anchoringsequence to chromosomes. With the emergence of Devil Facial Tumour Disease(DFTD) in the Tasmanian devil population (see Bender, Chapter 23), a third marsu-pial genome project has commenced. This genome is being sequenced entirely bynext generation sequencing technology and, once again, physical mapping will needto be an integral part of the assembly process if this sequence is to be anchored tochromosomes. Fortunately, the devil belongs to the dasyuridae family and will nowreplace the dunnart as the third model marsupial for gene mapping and genomicsstudies.
With the sequencing of these marsupial genomes, the construction of physi-cal maps has moved away from the mapping of genes haphazardly as a resultof a particular interest in certain genes, to being able to construct maps encom-passing the entire genome. For the first time, detailed maps comparing thegenome organisation across multiple vertebrate taxa, including marsupials, havebeen constructed (Deakin et al., 2008; Deakin et al., in preparation; Mikkelsenet al., 2007; Mohammadi et al., 2009) providing new insight into genomeevolution.
5 Physical and Comparative Gene Maps in Marsupials 105
5.4.1 The Important Role of Gene Mapping in the OpossumGenome Project
In addition to the important role it plays in assigning sequence to chromo-somes, gene mapping assists in determining the quality of the genome assem-bly and detects regions with potential assembly errors. Gene mapping can helpin overcoming inherent problems with genome sequence assembly in highlyrepetitive regions, in regions where haplotype differences in gene copy numberpose a problem, or areas enriched in genes which have evolved via segmentalduplication.
The opossum was the first marsupial to have its genome deeply sequenced(Mikkelsen et al., 2007). In the absence of a radiation hybrid map or a referencegenome sequence from a closely related species, physical mapping was seen as themost efficient means of anchoring sequence to chromosomes (Duke et al., 2007).By mapping 381 BACs, identified from BAC end sequences located at the ends ofsequence scaffolds, 97% of the genome was assigned to opossum chromosomes(Duke et al., 2007). A further 103 Mb of genome sequence remained unanchored(Duke et al., 2007). Unfortunately, genes of interest falling into this unanchoredcategory, or those simply missing from the assembly altogether, have had to belocalised as the need arises.
There are a number of examples for the opossum genome where gene mappinghas played a vital role. In fact many of the opossum genome studies mentionedelsewhere in this book have relied to some extent on gene mapping. Examples of theimportance of gene mapping include aiding in genome assembly, anchoring genesfrom large gene families to chromosomes, isolating genes absent from the assemblyand confirming that novel sequences in the assembly are true and not the result ofassembly errors.
The first large region of the opossum genome (∼4 Mb) to be annotated wasthe Major Histocompatability Complex (MHC) (Belov et al., 2006 and reviewedin Cheng et al., Chapter 16). This analysis was carried out on preliminaryassemblies MonDom1 and MonDom2. Genes within the MHC can be dividedinto three classes with molecules encoded by genes belonging to two of theseclasses (MHC Class I and II genes) involved in presenting antigens to T cells.MHC Class I and II genes evolve via segmental duplication. Genome assemblyprograms often struggle to accurately assemble such regions. Haplotype differ-ences further confound the assembly process when it is not possible to use aninbred individual for genome sequencing, as is the case for the opossum genomeproject.
In the MonDom1 assembly, genes from the MHC region were distributed acrossfive different sequence scaffolds. With MHC Class I genes UB/UC and UG map-ping to different regions of opossum chromosome 2 (Belov et al., 2006), it wasimperative that the MHC-containing sequence scaffolds be localised in order todetermine whether the region had been split due to chromosomal rearrangementor whether genes had been moved by a transposition event. BACs isolated from
106 J.E. Deakin
the ends of these scaffolds mapped to the same region on the long arm of chromo-some 2 as the MHC Class I gene UG. Aided by mapping information, this regionwas assembled onto a single scaffold in the subsequent MonDom2 assembly (Belovet al., 2006). The movement of UB and UC away from the main MHC cluster maybe linked to marsupial-specific repeats found flanking these genes (Belov et al.,2006).
It is a difficult task to prove that a gene not found in a genome assembly istruly absent from the genome, and not simply missing from the assembly dueto a difficulty in sequencing or assembly of the region containing the gene. Onesuch example of a gene missing from the assembly is XIST (X-Inactive SpecificTranscript), a non-coding RNA critical to the process of X chromosome inactiva-tion in humans and other eutherian mammals (see Al Nadaf et al., Chapter 13).Searches of the assembly failed to find any sequence similar to XIST in the opossumgenome (Davidow et al., 2007; Hore et al., 2007; Shevchenko et al., 2007). Genesflanking XIST in humans are adjacent in chicken and frog, yet these same genesmap to different ends of the opossum X chromosome, suggesting that the regionwas disrupted in the marsupial lineage and acquired XIST after marsupial/eutheriandivergence (Davidow et al., 2007; Hore et al., 2007; Shevchenko et al.,2007).
Another gene absent from the assembly was Insulin-like growth factor II (IGF2),a gene subject to genomic imprinting in both marsupials and eutherians (for moredetails on genomic imprinting refer to Hore et al., Chapter 12). Since cDNAsequence for this gene had previously been obtained (O’Neill et al., 2000), itsabsence from the assembly was surprising. A BAC clone containing IGF2 was sub-sequently isolated and mapped to opossum chromosome 5, proving that it is onlymissing from the assembly but very much a part of the opossum genome (Lawtonet al., 2007).
The discovery of a novel T-cell receptor (TCR) gene sequence in the genomeassembly, with sequence similarity to TCRD (one of four TCR genes foundin all jawed vertebrates), could have easily been disregarded as an assemblyerror or simply a divergent TCRD (Baker et al., 2005; Parra et al., 2007).However, physical mapping of all opossum TCR loci showed that this novelsequence was found on chromosome 3 (Parra et al., 2007) and did not co-localisewith other TCR genes (Deakin et al., 2006). This novel TCR gene (TCRM)appears to be common to all marsupials, having been isolated from three dis-tantly related marsupial species (refer to Baker et al., Chapter 17 for moredetails).
Anchoring the opossum genome sequence to chromosomes enabled theidentification of 372 large blocks of genes with conserved synteny betweenopossum and human. Extending this comparison to other eutherians providedinsight into eutherian genome evolution and has been used to reconstruct thekaryotype of the boroeutherian ancestor (ancestor of most eutherian species)(Mikkelsen et al., 2007). It has also facilitated further “e-painting” studies(Kemkemer et al., 2009) such as the one mentioned in Rens and Ferguson-Smith(Chapter 2).
5 Physical and Comparative Gene Maps in Marsupials 107
5.4.2 The Wallaby Genome and a New Strategy for Physical MapConstruction
The tammar wallaby genome has now been sequenced to a depth of two-fold cover-age in a combined effort by the Australian Genome Research Facility and the BaylorCollege of Medicine Human Genome Sequencing Center. Scaffold sequences forthis light coverage genome are a great deal smaller and the assembly contains manymore gaps (http://www.ensembl.org/Macropus_eugenii/Info/Index) than the aver-age found in the opossum assembly. Obviously using the same approach as that usedto anchor sequence to opossum chromosomes would be a laborious and costly taskfor the more than 400,000 scaffolds of the wallaby genome. However, the assign-ment of sequence to chromosomes is imperative if this sequence is to be used toanswer questions regarding genome evolution (Lewin et al., 2009).
An alternative approach to mapping every sequence scaffold is to identify largeconserved blocks of genes between opossum and human genomes and to map genesat either end of these blocks (Fig. 5.1). Information from the opossum genomecan then be used to infer the location of genes within these blocks, circumvent-ing the need to map every wallaby sequence scaffold. This approach has been madefeasible with the availability of a high density wallaby BAC library and the devel-opment of a library screening technique using short, homologous probes calledovergos. Overgo probes consist of two 24 bp oligonucleotides overlapping by eightbase pairs, which are radioactively labelled by an end-filling reaction. Overgos aredesigned by extracting sequence from the wallaby genome project for the gene ofinterest, thereby resulting in a species-specific probe. These probes can be pooledto screen the library for multiple genes at once. BACs isolated in this way areconfirmed positive for the gene of interest by a second round of screening on dotblots with overgos to individual genes. Dot blots have proven to be a very accuratemethod for confirming the presence of the gene of interest in a BAC clone but, asan additional level of confirmation, individual overgos have also been used to obtainsequence from positive BAC clones (Deakin et al., 2008).
The first two regions of the wallaby genome to be densely mapped were thosecontaining genes found on the human X chromosome. Earlier gene mapping andchromosome painting studies had shown that the human X chromosome could bedivided into an ancient conserved region, with genes from this region on the Xin therian mammals, and a region added to the eutherian X after the divergenceof marsupials and eutherians (Glas et al., 1999; Graves, 1995; Wilcox et al., 1996).Previous mapping experiments had shown that genes from the recently added regionwere found on wallaby chromosome 5 (Delbridge and Graves, 2004; Fitzgeraldet al., 1993; Pask et al., 1997; Sinclair et al., 1988; Toder and Graves, 1998; Waterset al., 2003; Watson et al., 1992; Wilcox et al., 1996). In the opossum assembly,these genes are found in two separate blocks, one on chromosome 4 and another onchromosome 7. Overgos designed for human X genes found in the block on chromo-some 4 were used to screen the wallaby BAC library. A dense map of this “neo-X”region was generated, with 52 out of a total of 58 genes from opossum chromosome4 with a homologue on the human X being localised to the short arm of wallaby
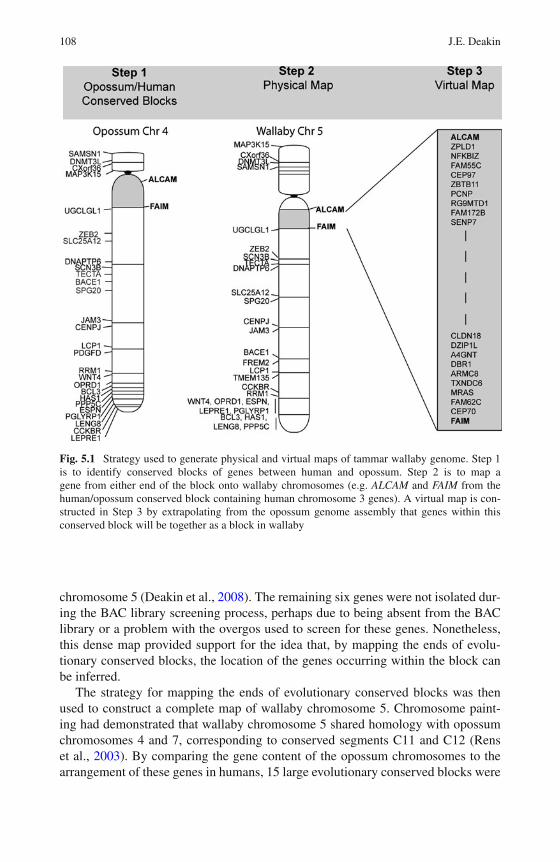
108 J.E. Deakin
Fig. 5.1 Strategy used to generate physical and virtual maps of tammar wallaby genome. Step 1is to identify conserved blocks of genes between human and opossum. Step 2 is to map agene from either end of the block onto wallaby chromosomes (e.g. ALCAM and FAIM from thehuman/opossum conserved block containing human chromosome 3 genes). A virtual map is con-structed in Step 3 by extrapolating from the opossum genome assembly that genes within thisconserved block will be together as a block in wallaby
chromosome 5 (Deakin et al., 2008). The remaining six genes were not isolated dur-ing the BAC library screening process, perhaps due to being absent from the BAClibrary or a problem with the overgos used to screen for these genes. Nonetheless,this dense map provided support for the idea that, by mapping the ends of evolu-tionary conserved blocks, the location of the genes occurring within the block canbe inferred.
The strategy for mapping the ends of evolutionary conserved blocks was thenused to construct a complete map of wallaby chromosome 5. Chromosome paint-ing had demonstrated that wallaby chromosome 5 shared homology with opossumchromosomes 4 and 7, corresponding to conserved segments C11 and C12 (Renset al., 2003). By comparing the gene content of the opossum chromosomes to thearrangement of these genes in humans, 15 large evolutionary conserved blocks were
5 Physical and Comparative Gene Maps in Marsupials 109
identified. Genes from the ends of these conserved blocks were mapped to chro-mosome 5. Four large-scale rearrangements have taken place between wallaby andopossum including two inversions which have occurred on the long arm of chro-mosome 5. Breakpoints for these inversions were narrowed down to within a threeMegabase region on opossum chromosome 4 between genes SPG20 and FREM2and a four Megabase region between TECTA and BACE1 on opossum chromo-some 4. The region corresponding to opossum chromosome 7 encompasses thepericentric region of wallaby chromosome 5, spanning from RPL31 to CPOX. Thecentromere was determined to lie between two human X genes, EGFL6 on the shortarm and CTPS2 on the long arm (Deakin et al., 2008).
By completing the map of chromosome 5, it was discovered that the “neo X”region is split into two regions by genes found on human chromosomes 2 and 15(Deakin et al., 2008). The arrangement of these conserved gene blocks has particularrelevance to the evolution of Prader-Willi/Angelman syndrome imprinted domain onhuman chromosome 15. In humans, this region consists of the maternally silenced(imprinted) SNRPN gene associated with Prader-Willi syndrome and the paternallyimprinted UBE3A gene connected with Angelman syndrome. In the tammar wal-laby, these two genes are found on different chromosomes, with SNRPN located onchromosome 1 and UBE3A part of the conserved block of human chromosome 15genes found on chromosome 5, and neither gene is imprinted (Rapkins et al., 2006).Genes from human chromosomes X, 2 and 15 are found together in the chicken aswell (Edwards et al., 2007), indicating that the organisation of the conserved geneblocks in wallaby represents the ancestral arrangement. The Prader-Willi/Angelmanregion assembled by fusing the regions containing the SNPRN and UBE3A genes,acquiring retrotransposed copies of genes and clusters of small nucleolar RNAsfrom other parts of the genome after the divergence of marsupials and eutherians(Rapkins et al., 2006).
About 20% of the protein coding genes making up the conserved region of the Xwere mapped on the wallaby X chromosome. A comparison of gene order betweenopossum, wallaby and human demonstrated a high level of rearrangement betweenthe X chromosomes of these species, a feature undetectable by chromosome paint-ing. The high degree of rearrangement between the marsupial X chromosomes wassurprising given the high level of conservation of gene order on the X amongsteutherians, a feature attributed to the mode of X chromosome inactivation in eutheri-ans, which would be disrupted by rearrangement (Deakin et al., 2008). This suggeststhat X inactivation in marsupials is achieved independent of gene position. Althoughthe factor(s) controlling X inactivation in marsupial is yet to be elucidated, the exten-sive rearrangement of X-borne genes between species and absence of XIST suggeststhat control of X inactivation in marsupials will be quite different to that of eutherianmammals.
The physical map of chromosome 5, with the ends of evolutionary conservedblocks and genes near breakpoints mapped, made it possible to construct a virtualmap of the chromosome. By extrapolating from the opossum genome, an additional2,320 protein-coding genes were able to assigned to wallaby chromosome 5 (Deakinet al., 2008). This efficient physical mapping strategy was further applied to the long
110 J.E. Deakin
of chromosome 6, a region which shares homology with the long arm of opossumchromosome 7 (Mohammadi et al., 2009). This chromosome arm is represented by18 conserved blocks (Mohammadi et al., 2009; Deakin et al., 2008). Gene order forthese blocks is well conserved between the wallaby and opossum, with only twosmall interstitial inversions (Mohammadi et al., 2009) and the movement of MINAto a different end of the chromosome (Deakin et al., 2008) being the only detectabledifferences in gene order between these species.
With the proven success of this strategy, this work was extended to the remainingwallaby chromosomes and a physical map of the entire genome has been constructed(Deakin et al., in preparation). Good physical maps are proving invaluable forwhole genome sequencing projects by providing the framework for genome anno-tation and comparative genomic analysis. Physical maps provide an independentmeans to check the accuracy of the assembly, providing information on the order ofscaffolds on a chromosome and are the only way to anchor sequence scaffolds tochromosomes (Lewin et al., 2009).
The complete physical map of the tammar wallaby genome has permitted com-parative maps to be constructed (Fig. 5.2), where the genome organisation betweendifferent species can be compared. This allows the evolution history of a chromo-some or specific regions of interest to be traced and the reconstruction of ancestralkaryotypes.
5.4.3 Genes that Break the Rules
Although the conserved block mapping strategy works for most genes, there arealways some that break the rules. MHC Class I genes in the wallaby are one suchexample. While constructing a BAC contig spanning the entire wallaby MHC, BACscontaining MHC Class I genes were isolated and physically mapped using FISH.It was expected that these genes would be located within the MHC region on thelong arm of wallaby chromosome 2 but these genes astoundingly localised to everyautosome, mapping eight out of ten cases at the telomeres (Deakin et al., 2007). Anendogenous retroviral element (KERV, see Carone and O’Neill, Chapter 3) has beenimplicated in the dispersal of these class I genes, perhaps by facilitating illegitimaterecombination events (Deakin et al., 2007; Siddle et al., 2009; see also Cheng et al.,Chapter 16). This extensive dispersal of MHC Class I genes has not been reportedfor any other vertebrate and would have remained undiscovered without the physicalmapping of these BACs.
5.4.4 Integrating the Linkage and Physical Maps
With two different types of maps available for both the opossum and wallaby, itwould obviously be advantageous to integrate the two data sets and ultimately incor-porate this integrated map with the genome sequence data to obtain the best genome
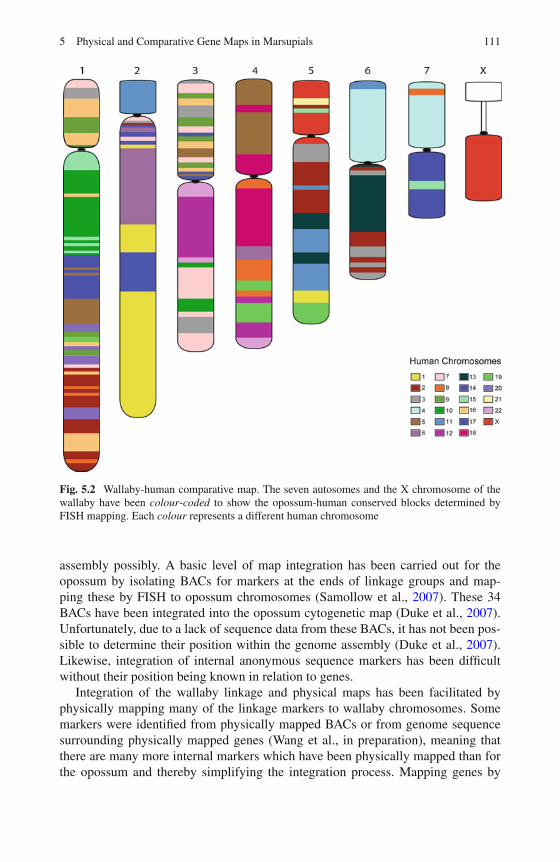
5 Physical and Comparative Gene Maps in Marsupials 111
Fig. 5.2 Wallaby-human comparative map. The seven autosomes and the X chromosome of thewallaby have been colour-coded to show the opossum-human conserved blocks determined byFISH mapping. Each colour represents a different human chromosome
assembly possibly. A basic level of map integration has been carried out for theopossum by isolating BACs for markers at the ends of linkage groups and map-ping these by FISH to opossum chromosomes (Samollow et al., 2007). These 34BACs have been integrated into the opossum cytogenetic map (Duke et al., 2007).Unfortunately, due to a lack of sequence data from these BACs, it has not been pos-sible to determine their position within the genome assembly (Duke et al., 2007).Likewise, integration of internal anonymous sequence markers has been difficultwithout their position being known in relation to genes.
Integration of the wallaby linkage and physical maps has been facilitated byphysically mapping many of the linkage markers to wallaby chromosomes. Somemarkers were identified from physically mapped BACs or from genome sequencesurrounding physically mapped genes (Wang et al., in preparation), meaning thatthere are many more internal markers which have been physically mapped than forthe opossum and thereby simplifying the integration process. Mapping genes by
112 J.E. Deakin
both techniques also serves as a form of quality control. Overgos used to isolateBACs for physical mapping were designed from sequence generated by the wallabygenome project, making it possible to subsequently incorporate genome assemblydata into the integrated map. This will greatly enhance the genome assembly.
5.5 Mapping in Other Marsupials
The development of this efficient mapping strategy makes it possible to rapidly con-struct gene maps for other marsupials for which sequence information and a BAClibrary are available. At present there are two additional species for which physicalmaps could be readily generated: the Tasmanian devil (Sacrophilus harrisii) and theNorthern brown bandicoot (Isoodon macrourus).
The plight of the Tasmanian devil has recently received a vast amount of attentiondue to Devil Facial Tumour Disease (DFTD) disease, which is decimating the devilpopulation (for more details refer to Bender, Chapter 23). As a result, the devil isthe third marsupial to have its genome and transcriptomes sequenced (see Papenfusset al., Chapter 6) and two BAC libraries have been constructed providing the basicresources required for cytogenetic mapping. With data from the opossum and wal-laby genomes, we are now able to determine blocks of genes conserved betweenthese two species and map the ends of these blocks rather than the opossum/humanconserved blocks, reducing the total number of genes required to be mapped. Theadded advantage of constructing such a map in the devil is that these same genescan be mapped in the different strains of the DFTD tumour and assist in the char-acterisation of the disease at the genetic level. Work on the devil physical map isprogressing quickly and should be complete in early 2010 (Deakin, unpublished).
The Northern brown bandicoot (Isoodon macroura), belonging to the familyPeramelidae, is another interesting species for which a BAC library is available. Theposition of bandicoots in marsupial phylogeny has always been a little puzzling.They possess features in common with dasyurids and macropodids but molecularstudies suggest they fall between the American and Australian marsupial radiations(Springer et al., 1998). There is only very limited sequence data for this species inthe form of ESTs (Baker et al., 2007), which would make designing species-specificovergo probes rather challenging. However, it may be possible to design universalovergos using conserved sequences (Sullivan et al., 2008).
Bandicoots possess a couple of distinct features, which make them very inter-esting animals to study. Their complex allantoic placenta means that they havethe most invasive placenta among marsupials. This almost eutherian-like placentameans that they would be a very valuable species in which to study genomicimprinting (for more information in genomic imprinting in marsupials refer to Horeet al., Chapter 12). In a bizarre twist on X chromosome inactivation, a mecha-nism employed to equalise the expression of genes on the X chromosome betweenfemales with two copies of the X chromosome and males with just one, bandicootseliminate one sex chromosome, one X in females and the Y in males, from somatic
5 Physical and Comparative Gene Maps in Marsupials 113
tissues. Very little is known about this fascinating phenomenon, but a detailed mapof the X chromosome would be a good starting point.
Like many other marsupials, bandicoots have a diploid chromosome numberof 2n = 14. G-banding of marsupials with a 2n = 14 number suggests that theslight variations in banding patterns seen among different species are due to internalchromosome rearrangements, such as inversions or transpositions, and not inter-chromosomal arrangements (Hayman, 1990). Hence it would be expected that thecomposition of the 2n = 14 karyotype would be very similar to that of the dasyurids.A good physical map of the bandicoot genome would test this hypothesis regardingthe 2n = 14 karyotype and provide insight into marsupial genome evolution.
5.6 Conclusion
Physical mapping of marsupial genomes has progressed in leaps and bounds overthe last few years, particularly since the release of marsupial genome sequence.Physical maps have been used to anchor assemblies of the opossum and wallabygenomes to chromosomes, enabling comparative studies to be carried out. Theefficient strategy developed for mapping the wallaby genome can now be used togenerate maps for other divergent species, enabling the ancestral marsupial kary-otype to be reconstructed. Information on the location of genes within the genomeis key to answering questions in genome evolution, making these maps an essentialcomponent of any marsupial sequencing project.
References
Baker ML, Indiviglio S, Nyberg AM, et al. (2007) Analysis of a set of Australian northern brownbandicoot expressed sequence tags with comparison to the genome sequence of the SouthAmerican grey short tailed opossum. BMC Genomics 8:50.
Baker ML, Osterman AK, Brumburgh S (2005) Divergent T-cell receptor delta chains frommarsupials. Immunogenetics 57:665–673.
Belov K, Deakin JE, Papenfuss AT, et al. (2006) Reconstructing an ancestral mammalian immunesupercomplex from a marsupial major histocompatibility complex. PLoS Biol 4:e46.
Bennett JH, Breed WG, Hayman DL, Hope RM (1989) Reproductive and genetic-studies witha laboratory colony of the dasyurid marsupial Sminthopsis crassicaudata. Aust J Zool 37:207–222.
Davidow LS, Breen M, Duke SE, et al. (2007) The search for a marsupial XIC reveals a break withvertebrate synteny. Chromosome Res 15:137–146.
Dawson GW, Graves JAM (1984) Gene mapping in marsupials and monotremes. I. The chro-mosomes of rodent-marsupial (Macropus) cell hybrids, and gene assignments to the Xchromosome of the grey kangaroo. Chromosoma 91:20–27.
Deakin JE, Koina E, Waters PD, et al. (2008) Physical map of two tammar wallaby chromosomes:a strategy for mapping in non-model mammals. Chromosome Res 16:1159–1175.
Deakin JE, Parra ZE, Graves JAM, Miller RD (2006) Physical mapping of T cell receptor loci(TRA@, TRB@, TRD@ and TRG@) in the opossum (Monodelphis domestica). CytogenetGenome Res 112:342 K.
114 J.E. Deakin
Deakin JE, Siddle HV, Belov K, Graves JAM (2007) Class I genes have split from the MHC in thetammar wallaby. Cytogenet Genome Res 116:205–211.
Delbridge ML, Graves JAM (2004) Assignment of the eukaryotic translation initiation factor(EIF2S3) to tammar wallaby chromosome 5p by in situ hybridization. Cytogenet Genome Res107:139.
Donald JA, Hope RM (1981) Mapping a marsupial X chromosome using kangaroo-mouse somaticcell hybrids. Cytogenet Cell Genet 29:127–137.
Duke SE, Samollow PB, Mauceli E, Lindblad-Toh K, Breen M (2007) Integrated cytogenetic BACmap of the genome of the gray, short-tailed opossum, Monodelphis domestica. ChromosomeRes 15:361–370.
Edwards CA, Rens W, Clarke O, et al. (2007) The evolution of imprinting: chromosomal mappingof orthologues of mammalian imprinted domains in monotreme and marsupial mammals. BMCEvol Biol 7:157.
Fitzgerald J, Wilcox SA, Graves JA, Dahl HH (1993) A eutherian X-linked gene, PDHA1, is auto-somal in marsupials: a model for the evolution of a second, testis-specific variant in eutherianmammals. Genomics 18:636–642.
Foster JW, Brennan FE, Hampikian GK, et al. (1992) Evolution of sex determination and theY chromosome: SRY-related sequences in marsupials. Nature 359:531–533.
Foster JW, Graves JAM (1994) An SRY-related sequence on the marsupial X chromosome: impli-cations for the evolution of the mammalian testis-determining gene. Proc Natl Acad Sci USA91:1927–1931.
Glas R, Marshall Graves JAM, Toder R, Ferguson-Smith M, O’Brien PC (1999) Cross-specieschromosome painting between human and marsupial directly demonstrates the ancient regionof the mammalian X. Mamm Genome 10:1115–1116.
Graves JAM (1995) The evolution of mammalian sex chromosomes and the origin of sexdetermining genes. Philos Trans R Soc Lond B Biol Sci 350:305–311.
Graves JA, Chew GK, Cooper DW, Johnston PG (1979) Marsupial – mouse cell hybrids containingfragments of the marsupial X chromosome. Somatic Cell Genet 5:481–489.
Graves JAM, Sinclair AH, Spencer JA (1989) Marsupial gene mapping and the evolution ofmammalian sex chromosome form and function. Aust J Zool 37:365–383.
Green P (2007) 2x genomes – does depth matter? Genome Res 17:1547–1549.Hayman DL (1990) Marsupial cytogenetics. Aust J Zool 37:331–349.Hinds LA, Poole WE, Tyndale-Biscoe CH, van Oorschot RAH, Cooper DW (1989) Reproductive
biology and the potential for genetic studies in the tammar wallaby, Macropus eugenii. Aust JZool 37:223–234.
Hope RM, Cooper DW (1989) Marsupial and monotreme breeding in wild and captive populations:towards a laboratory marsupial. Aust J Zool 37:157–160.
Hore TA, Koina E, Wakefield MJ, Graves JAM (2007) The region homologous to theX-chromosome inactivation centre has been disrupted in marsupial and monotreme mammals.Chromosome Res 15:147–161.
Kemkemer C, Kohn M, Cooper DN, et al. (2009) Gene synteny comparisons between differentvertebrates provide new insights into breakage and fusion events during mammalian karyotypeevolution. BMC Evol Biol 9:84.
Koopman P, Gubbay J, Vivian N, Goodfellow P, Lovell-Badge R (1991) Male development ofchromosomally female mice transgenic for Sry. Nature 351:117–121.
Lawton BR, Obergfell C, O’Neill RJ, O’Neill MJ (2007) Physical mapping of the IGF2 locus inthe South American opossum Monodelphis domestica. Cytogenet Genome Res 116:130–131.
Lewin HA, Larkin DM, Pontius J, O’Brien SJ (2009) Every genome sequence needs a good map.Genome Res 10.1101/gr.094557.109
Mikkelsen TS, Wakefield MJ, Aken B, et al. (2007) Genome of the marsupial Monodelphisdomestica reveals innovation in non-coding sequences. Nature 447:167–177.
Mohammadi A, Delbridge ML, Waters PD, Graves JAM (2009) Conservation of a chromosomearm in two distantly related marsupial species. Cytogenet Genome Res 124:147–150.
5 Physical and Comparative Gene Maps in Marsupials 115
O’Neill MJ, Ingram RS, Vrana PB, Tilghman SM (2000) Allelic expression of IGF2 in marsupialsand birds. Dev Genes Evol 210:18–20.
Parra ZE, Baker ML, Schwarz RS, et al. (2007) A unique T cell receptor discovered in marsupials.Proc Natl Acad Sci USA 104:9776–9781.
Pask A, Toder R, Wilcox SA, Camerino G, Graves JAM (1997) The candidate sex-reversingDAX1 gene is autosomal in marsupials: implications for the evolution of sex determinationin mammals. Genomics 41:422–426.
Rapkins RW, Hore T, Smithwick M, et al. (2006) Recent assembly of an imprinted domain fromnon-imprinted components. PLoS Genet 2:e182.
Rens W, O’Brien PC, Fairclough H, et al. (2003) Reversal and convergence in marsupialchromosome evolution. Cytogenet Genome Res 102:282–290.
Samollow PB, Gouin N, Miethke P, et al. (2007) A microsatellite-based, physically anchoredlinkage map for the gray, short-tailed opossum (Monodelphis domestica). Chromosome Res15:269–281.
Samollow PB, Graves JAM (1998) Gene Maps of Marsupials. ILAR J 39:203–224.Sankovic N, Bawden W, Martyn J, Graves JAM, Zuelke K (2005) Construction of a marsupial bac-
terial artificial chromosome library from the model Australian marsupial, the tammar wallaby(Macropus eugenii). Aust J Zool 53:389–393.
Shevchenko AI, Zakharova IS, Elisaphenko EA, et al. (2007) Genes flanking Xist in mouse andhuman are separated on the X chromosome in American marsupials. Chromosome Res 15:127–136.
Siddle HV, Deakin JE, Coggill P, et al. (2009) Genomic structure and function of MHC-linked andun-linked Class I genes in the wallaby. BMC Genomics 10:310.
Sinclair AH, Berta P, Palmer MS, et al. (1990) A gene from the human sex-determining regionencodes a protein with homology to a conserved DNA-binding motif. Nature 346:240–244.
Sinclair AH, Foster JW, Spencer JA, et al. (1988) Sequences homologous to ZFY, a candidatehuman sex-determining gene, are autosomal in marsupials. Nature 336:780–783.
Springer MS, Westerman M, Kavanagh JR (1998) The origin of the Australasian marsupial faunaand the phylogenetic affinities of the enigmatic monito del monte and marsupial mole. P RoySoc Lond B Bio 265:2381–2386.
Sullivan RT, Morehouse CB, Comparative Sequencing NISC, Program TJW (2008) Uprobe 2008:an online resource for universal overgo hybridisation-based probe retrieval and design. NucleicAcids Res 36:W149–W153.
Toder R, Graves JAM (1998) CSF2RA, ANT3, and STS are autosomal in marsupials: implicationsfor the origin of the pseudoautosomal region of mammalian sex chromosomes. Mamm Genome9:373–376.
VandeBerg JL (1989) The gray short-tailed opossum (Monodelphis domestica) as a modeldidelphid species for genetic research. Aust J Zool 37:235–247.
Vergnaud G, Page DC, Simmler MC, et al. (1986) A deletion map of the human Y chromosomebased on DNA hybridization. Am J Hum Genet 38:109–124.
Wainwright B, Hope R (1985) Cloning and chromosomal location of the alpha- and beta-globingenes from a marsupial. Proc Natl Acad Sci USA 82:8105–8108.
Waters PD, Sankovic N, Kirby PJ, Delbridge ML, Graves JAM (2003) Assignment of the thy-mosin beta 4 X/Y chromosome (TMSB4X/Y) gene to tammar wallaby chromosome 5p byfluorescence in situ hybridisation. Cytogenet Genome Res 103:203F.
Watson JM, Spencer JA, Graves JAM, Snead ML, Lau EC (1992) Autosomal localization of theamelogenin gene in monotremes and marsupials: implications for mammalian sex chromosomeevolution. Genomics 14:785–789.
Wilcox SA, Watson JM, Spencer JA, Graves JAM (1996) Comparative mapping identifies thefusion point of an ancient mammalian X-autosomal rearrangement. Genomics 35:66–70.

Part IIIMarsupial Genome Sequencing
Jennifer A. Marshall Graves
The most spectacular advances in marsupial genetics and genomics since thepublication of “Mammals from Pouches and Eggs” (Graves et al., 1990) have beenengendered by the ability to obtain DNA sequence from study species, and, morerecently, the availability of whole genome sequence for two marsupial species.
Every aspect of marsupial genetics and genomics has been hugely advanced bythis new source of data. Initially, investigations of marsupial genes depended oncloning and Southern or Northern blot analysis of small fragments of DNA. Genemapping in the 1980s and even the 1990s depended largely on identification andhybridisation of homologous sequence (usually human cDNA), which often iden-tified the location of pseudogenes or paralogues. Large scale and global analysesof genome structure, repeat frequency and gene arrangements especially withingene families, was impossible. Even with the advent of PCR, obtaining marsupialsequence was guesswork based on human and chicken gene sequence, and the hitrate was usually below 20%.
A big advance in the early 2000s was the construction of a BAC library fromthe tammar wallaby (Sankovic et al., 2005), and its use both for mapping and forinvestigating genes and gene families with limited BAC sequencing (e.g. de Leoet al., 2005, globin genes). Several marsupial BAC libraries are now available fortammar wallaby, devil and opossum.
With the sequencing of the human genome in 1999, mammalian genetics andgenomics entered a new era in which not only genes and gene families could beinvestigated, but also global analyses could be performed to survey the large scalegenome landscape, and to investigate the frequency and arrangement of repetitivesequences and transcribed non-coding sequences that provided new data that alteredour concept of the mammalian genome. The development of short read sequencingmethods greatly increased the ease of resequencing, introducing the possibility ofexamining different individuals (normal or diseased), but with the caveat that a goodshotgun sequence was required for the purposes of alignment.
A full genome sequence of a marsupial seemed, in the early 2000s, to be animpossible dream. However, I was approached in 2003 to write a “White paper”proposing the sequencing of a marsupial genome by the National Institutes ofHealth of the USA. A proposal was generated by a consortium of marsupial
118 Part III Marsupial Genome Sequencing
(largely Australian) geneticists, featuring the tammar wallaby (Graves et al., 2003).However, the decision was made to sequence “an American marsupial”, and theBrazilian short-tailed grey opossum Monodelphis domestica was chosen, and sub-sequently sequenced by Sanger shotgun sequencing (Mikkelsen et al., 2007). Thetammar genome has now been sequenced lightly by the shotgun method, but severalother sources of data need to be integrated.
In this part, Chapter 6 by Papenfuss et al. describe the history of marsu-pial genome sequencing, concentrating on the bioinformatics challenges they haveposed. Analysis of the opossum sequence taught us several lessons about annotatingsequence from an unknown genome for which there is no real reference. Papenfusset al. discuss some of the bioinformatics challenges that have had to be surmountedin annotating the opossum, and more recently the tammar genome. As described bythese authors, many of the commonly used bioinformatics packages are not appro-priate or are inefficient, and it has proved necessary to develop new tools to get themost out of these genomes. Novel solutions will be particularly necessary for theso-called hybrid genomes which have been sequence lightly by the Sanger method,but for which transcriptome and short-read sequence data are available, such as thegenome of the Tasmanian devil. The ultimate objective would be to develop methodsfor putting a de novo genome together solely from short-read sequence, as claimedfor the giant panda (Li et al., 2009).
One of the paramount reasons for whole genome sequencing of a range of ani-mals is to make sense of the “dark matter” that comprises more than 95% of themammalian genome (Wakefield and Papenfuss, Chapter 7). Repeat analysis usingsequence from the opossum genome established that the large size of the opos-sum genome was accounted for by the high proportion of repetitive sequence. Inparticular it was important to examine the distribution of LINE elements on theautosomes and the X chromosomes, these elements have been implicated in X chro-mosome inactivation. It was found that LINEs are not accumulated on the opossumX, which suggested that these elements were exapted to a new function relativelyrecently in eutherian mammals. Indeed, one of the most important contributions ofthe opossum genome was a new understanding of how ancient and recent exaptationof transposable sequences have contributed to building up regulatory pathways.
In addition, marsupial genome sequence made it possible to analyse the classesof miRNAs that might have regulatory activity, and the long non-coding transcribedsequences, such as the XIST gene that controls X chromosome inactivation. Giventhat XIST is absent from the marsupial X (Hore et al., 2007), it is interesting toinvestigate when this class of regulator evolved and how such sequences took overroles in regulation.
With the next generation of single molecule DNA sequencing, it is likely that allmarsupials (and monotremes and eutherian mammals) will be sequenced (Genome10K, 2009), at least to two-fold, providing comparative genomics with the power toresolve these longstanding questions.
Part III Marsupial Genome Sequencing 119
References
De Leo AA, Wheeler D, Lefevre C, et al. (2005) Sequencing and map-ping hemoglobin gene clusters in the Australian model dasyurid marsupialSminthopsis macroura. Cytogenet Genome Res 108:333–341.
G10K Community of Scientists: Coordinators, Haussler D, O’Brien SJ, RyderOA (2009) A proposal to obtain whole genome sequence for 10,000 vertebratespecies. J Hered 100:675–680.
Graves JAM, Hope RM, Cooper DW (eds) (1990) Mammals from Pouches andEggs: Genetics, Breeding and Evolution of Marsupials and Monotremes. CSIROPress, Melbourne.
Graves JAM, Wakefield MJ, Renfree MB, et al. (2003) Proposal to sequence thegenome of the model marsupial Macropus eugenii (Tammar Wallaby). http://wwwgenomegov/Pages/Research/Sequencing/SeqProposals/WallabySEQpdf
Hore TA, Koina E, Wakefield MJ, Graves JAM (2007) The region homologousto the X-chromosome inactivation centre has been disrupted in marsupial andmonotreme mammals. Chromosome Res 15:147–162.
Li R, Fan W, Tian G, Zhu H, He L, Cai J, et al. (2009) The sequence and de novoassembly of the giant panda genome. Nature 463:311–317.
Mikkelsen TS, Wakefield MJ, Aken B, et al (2007) Genome of the marsupialMonodelphis domestica reveals innovation in non-coding sequences. Nature447:167–177.
Sankovic N, Bawden W, Martyn J, Graves JAM, Zuelke K (2005) Construction ofa marsupial BAC library from the model Australian marsupial Tammar wallaby(Macropus eugenii). Aust J Zool 53:389–393.

Chapter 6Marsupial Sequencing Projectsand Bioinformatics Challenges
Anthony T. Papenfuss, Arthur Hsu, and Matthew Wakefield
Abstract The arrival of next or second generation sequencing has ushered in anew era of marsupial genomics, where large-scale sequencing of marsupial tran-scriptomes, and soon perhaps genomes, is within the scope of many independentlaboratories. This promises to reveal much about the biology of marsupial genomesand provides opportunities for comparison with eutherian genomes. These compar-isons will highlight both the conserved features that are critical, as well as importantdifferences where marsupials and eutherians have chosen different evolutionarypaths. Here we describe the current state of marsupial genomic sequencing projectsand resources, including available genome and transcriptome sequences. We alsosurvey a number of useful bioinformatics tools, particularly those that we haveutilized on marsupial, or sometimes monotreme, genomic data and found useful.Finally, some of the challenges met in dealing with, largely next generation, mar-supial sequence are described – experience that we think is also relevant to othernon-model organisms.
Keywords Marsupial genomes · Transcriptomics · Next generationsequencing · Bioinformatics
6.1 Marsupial Sequencing Projects – The State of Play
The first marsupial genome to be sequenced was that of the South American short-tailed grey opossum, Monodelphis domestica. This was performed at the BroadInstitute and published in 2007 (Mikkelsen et al., 2007). The opossum genome was
A.T. Papenfuss (B)Bioinformatics Division, The Walter and Eliza Hall Institute of Medical Research, Parkville, VIC3052, Australiae-mail: [email protected]
121J.E. Deakin et al. (eds.), Marsupial Genetics and Genomics,DOI 10.1007/978-90-481-9023-2_6, C© Springer Science+Business Media B.V. 2010
122 A.T. Papenfuss et al.
Sanger-sequenced1 to ∼7x coverage or draft quality. This has produced a generallyvery good and highly usable assembly, reflected by the large contig N50 of 108 kband scaffold N50 of 60 Mb. The N50 is a measure of how well the assembly hascome together. It is the length of the contig or scaffold such that 50% of nucleotidesin the assembly are from shorter sequences.
The Ensembl consortium (http://www.ensembl.org) annotated the opossumgenome. Unfortunately at the time, and still in late 2009, no large-scale opos-sum transcriptomic data was available. As a consequence, the annotation waslargely based on transcript and protein sequences from distantly-related species (e.g.human) (Hubbard et al., 2007). This has resulted in an annotation that is of goodquality for well-conserved genes, but one that misannotates or has failed to iden-tify many highly divergent genes. Immune genes are particularly affected by thisproblem and this has motivated several more careful analyses of these genes (e.g.Belov et al., 2006; Wong et al., 2006; Belov et al., 2007). Bioinformatics approachesto address the challenge of finding highly divergent genes are described in the lastsection of this chapter.
The opossum genome was selected by the National Human Genome ResearchInstitute over the bid of a friendly rival, the Tammar wallaby, Macropus eugenii, asmall kangaroo species which is an Australian model marsupial. The wallaby hasbeen Sanger-sequenced to 2x coverage and is now assembled and annotated, and duefor publication in 2010. The low-coverage sequencing of the wallaby genome hasproduced a highly fragmented assembly. Currently its scaffold N50 is in the range10–20 kb, though some efforts are underway to improve this. Additional bioinfor-matics challenges are introduced by such a fragmented genome. For example, genesmay be split across multiple contigs or scaffolds. To deal with this, Ensembl usesa gene-scaffold construct for low-coverage genomes (Hubbard et al., 2007), whichis a concatenation of contigs and scaffolds with order and orientation inferred byalignment to a gene sequence in a high quality reference genome such as human.
The opossum and wallaby represent key models for marsupial research. However,the recent emergence of Devil Facial Tumour Disease (DFTD), a contagious canceraffecting the Tasmanian devil, Sarcophilus harrisii, which is spread as an allo-graft by biting (Pearse and Swift, 2006 and reviewed in Bender, Chapter 23), hasmotivated the sequencing of this marsupial’s genome. Two individuals are beingsequenced using the Roche 454 platform.2 This cannot come too soon, as the devilpopulation is crashing as a result of the disease, which has spread to more than 65%of Tasmania (McCallum et al., 2007) and kills infected devils in around 6 months(Lachish et al., 2007). It is estimated that the devil will be extinct in the wild within25–35 years (McCallum et al., 2007). In the meantime, the transcriptome3 of the
1Sanger-sequencing is capillary-based DNA sequencing that producing long (600–1,000 nt), highquality reads.2The Roche 454 is a next generation sequencing platform that produces hundreds of thousands of200–600 nt long reads.3A transcriptome is the set of all transcripts or expressed genes in a tissue.
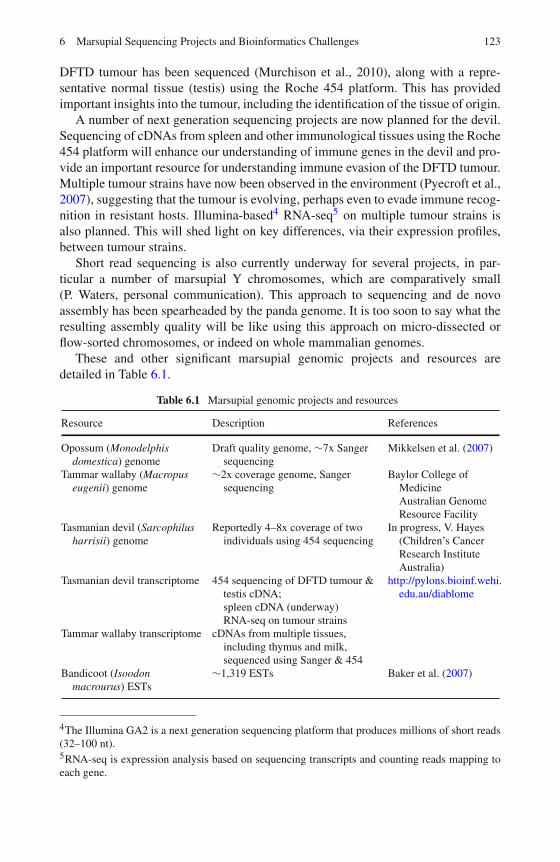
6 Marsupial Sequencing Projects and Bioinformatics Challenges 123
DFTD tumour has been sequenced (Murchison et al., 2010), along with a repre-sentative normal tissue (testis) using the Roche 454 platform. This has providedimportant insights into the tumour, including the identification of the tissue of origin.
A number of next generation sequencing projects are now planned for the devil.Sequencing of cDNAs from spleen and other immunological tissues using the Roche454 platform will enhance our understanding of immune genes in the devil and pro-vide an important resource for understanding immune evasion of the DFTD tumour.Multiple tumour strains have now been observed in the environment (Pyecroft et al.,2007), suggesting that the tumour is evolving, perhaps even to evade immune recog-nition in resistant hosts. Illumina-based4 RNA-seq5 on multiple tumour strains isalso planned. This will shed light on key differences, via their expression profiles,between tumour strains.
Short read sequencing is also currently underway for several projects, in par-ticular a number of marsupial Y chromosomes, which are comparatively small(P. Waters, personal communication). This approach to sequencing and de novoassembly has been spearheaded by the panda genome. It is too soon to say what theresulting assembly quality will be like using this approach on micro-dissected orflow-sorted chromosomes, or indeed on whole mammalian genomes.
These and other significant marsupial genomic projects and resources aredetailed in Table 6.1.
Table 6.1 Marsupial genomic projects and resources
Resource Description References
Opossum (Monodelphisdomestica) genome
Draft quality genome, ∼7x Sangersequencing
Mikkelsen et al. (2007)
Tammar wallaby (Macropuseugenii) genome
∼2x coverage genome, Sangersequencing
Baylor College ofMedicineAustralian GenomeResource Facility
Tasmanian devil (Sarcophilusharrisii) genome
Reportedly 4–8x coverage of twoindividuals using 454 sequencing
In progress, V. Hayes(Children’s CancerResearch InstituteAustralia)
Tasmanian devil transcriptome 454 sequencing of DFTD tumour &testis cDNA;spleen cDNA (underway)RNA-seq on tumour strains
http://pylons.bioinf.wehi.edu.au/diablome
Tammar wallaby transcriptome cDNAs from multiple tissues,including thymus and milk,sequenced using Sanger & 454
Bandicoot (Isoodonmacrourus) ESTs
∼1,319 ESTs Baker et al. (2007)
4The Illumina GA2 is a next generation sequencing platform that produces millions of short reads(32–100 nt).5RNA-seq is expression analysis based on sequencing transcripts and counting reads mapping toeach gene.
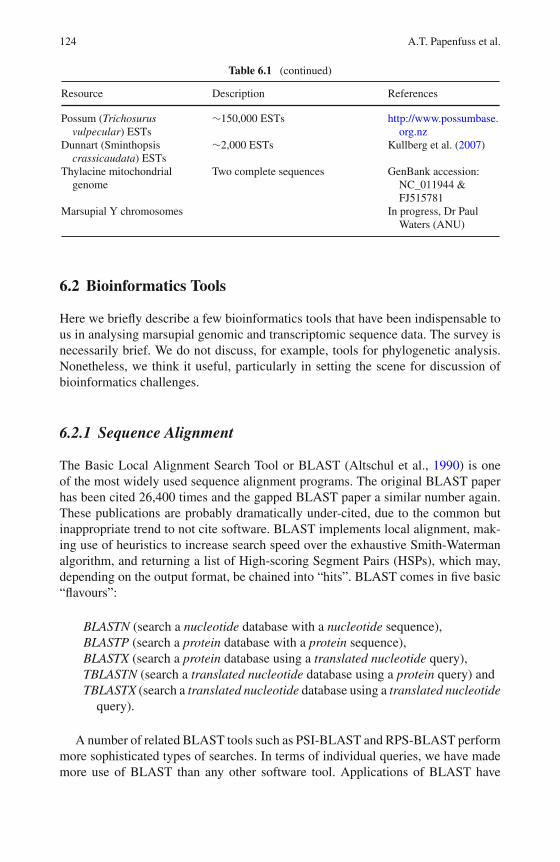
124 A.T. Papenfuss et al.
Table 6.1 (continued)
Resource Description References
Possum (Trichosurusvulpecular) ESTs
∼150,000 ESTs http://www.possumbase.org.nz
Dunnart (Sminthopsiscrassicaudata) ESTs
∼2,000 ESTs Kullberg et al. (2007)
Thylacine mitochondrialgenome
Two complete sequences GenBank accession:NC_011944 &FJ515781
Marsupial Y chromosomes In progress, Dr PaulWaters (ANU)
6.2 Bioinformatics Tools
Here we briefly describe a few bioinformatics tools that have been indispensable tous in analysing marsupial genomic and transcriptomic sequence data. The survey isnecessarily brief. We do not discuss, for example, tools for phylogenetic analysis.Nonetheless, we think it useful, particularly in setting the scene for discussion ofbioinformatics challenges.
6.2.1 Sequence Alignment
The Basic Local Alignment Search Tool or BLAST (Altschul et al., 1990) is oneof the most widely used sequence alignment programs. The original BLAST paperhas been cited 26,400 times and the gapped BLAST paper a similar number again.These publications are probably dramatically under-cited, due to the common butinappropriate trend to not cite software. BLAST implements local alignment, mak-ing use of heuristics to increase search speed over the exhaustive Smith-Watermanalgorithm, and returning a list of High-scoring Segment Pairs (HSPs), which may,depending on the output format, be chained into “hits”. BLAST comes in five basic“flavours”:
BLASTN (search a nucleotide database with a nucleotide sequence),BLASTP (search a protein database with a protein sequence),BLASTX (search a protein database using a translated nucleotide query),TBLASTN (search a translated nucleotide database using a protein query) andTBLASTX (search a translated nucleotide database using a translated nucleotide
query).
A number of related BLAST tools such as PSI-BLAST and RPS-BLAST performmore sophisticated types of searches. In terms of individual queries, we have mademore use of BLAST than any other software tool. Applications of BLAST have
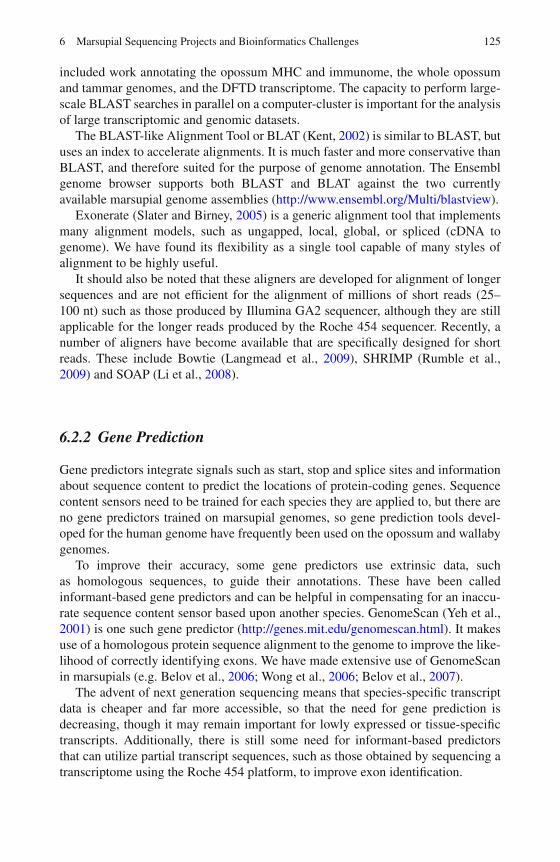
6 Marsupial Sequencing Projects and Bioinformatics Challenges 125
included work annotating the opossum MHC and immunome, the whole opossumand tammar genomes, and the DFTD transcriptome. The capacity to perform large-scale BLAST searches in parallel on a computer-cluster is important for the analysisof large transcriptomic and genomic datasets.
The BLAST-like Alignment Tool or BLAT (Kent, 2002) is similar to BLAST, butuses an index to accelerate alignments. It is much faster and more conservative thanBLAST, and therefore suited for the purpose of genome annotation. The Ensemblgenome browser supports both BLAST and BLAT against the two currentlyavailable marsupial genome assemblies (http://www.ensembl.org/Multi/blastview).
Exonerate (Slater and Birney, 2005) is a generic alignment tool that implementsmany alignment models, such as ungapped, local, global, or spliced (cDNA togenome). We have found its flexibility as a single tool capable of many styles ofalignment to be highly useful.
It should also be noted that these aligners are developed for alignment of longersequences and are not efficient for the alignment of millions of short reads (25–100 nt) such as those produced by Illumina GA2 sequencer, although they are stillapplicable for the longer reads produced by the Roche 454 sequencer. Recently, anumber of aligners have become available that are specifically designed for shortreads. These include Bowtie (Langmead et al., 2009), SHRIMP (Rumble et al.,2009) and SOAP (Li et al., 2008).
6.2.2 Gene Prediction
Gene predictors integrate signals such as start, stop and splice sites and informationabout sequence content to predict the locations of protein-coding genes. Sequencecontent sensors need to be trained for each species they are applied to, but there areno gene predictors trained on marsupial genomes, so gene prediction tools devel-oped for the human genome have frequently been used on the opossum and wallabygenomes.
To improve their accuracy, some gene predictors use extrinsic data, suchas homologous sequences, to guide their annotations. These have been calledinformant-based gene predictors and can be helpful in compensating for an inaccu-rate sequence content sensor based upon another species. GenomeScan (Yeh et al.,2001) is one such gene predictor (http://genes.mit.edu/genomescan.html). It makesuse of a homologous protein sequence alignment to the genome to improve the like-lihood of correctly identifying exons. We have made extensive use of GenomeScanin marsupials (e.g. Belov et al., 2006; Wong et al., 2006; Belov et al., 2007).
The advent of next generation sequencing means that species-specific transcriptdata is cheaper and far more accessible, so that the need for gene prediction isdecreasing, though it may remain important for lowly expressed or tissue-specifictranscripts. Additionally, there is still some need for informant-based predictorsthat can utilize partial transcript sequences, such as those obtained by sequencing atranscriptome using the Roche 454 platform, to improve exon identification.
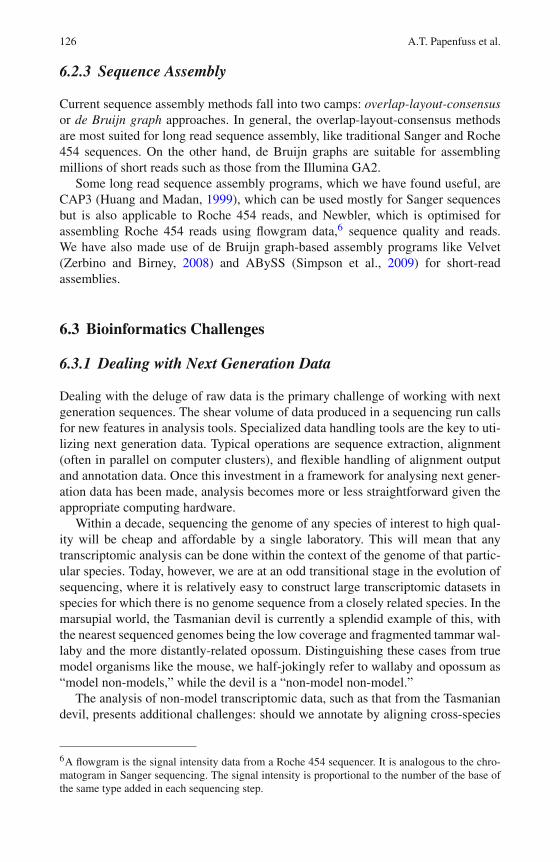
126 A.T. Papenfuss et al.
6.2.3 Sequence Assembly
Current sequence assembly methods fall into two camps: overlap-layout-consensusor de Bruijn graph approaches. In general, the overlap-layout-consensus methodsare most suited for long read sequence assembly, like traditional Sanger and Roche454 sequences. On the other hand, de Bruijn graphs are suitable for assemblingmillions of short reads such as those from the Illumina GA2.
Some long read sequence assembly programs, which we have found useful, areCAP3 (Huang and Madan, 1999), which can be used mostly for Sanger sequencesbut is also applicable to Roche 454 reads, and Newbler, which is optimised forassembling Roche 454 reads using flowgram data,6 sequence quality and reads.We have also made use of de Bruijn graph-based assembly programs like Velvet(Zerbino and Birney, 2008) and ABySS (Simpson et al., 2009) for short-readassemblies.
6.3 Bioinformatics Challenges
6.3.1 Dealing with Next Generation Data
Dealing with the deluge of raw data is the primary challenge of working with nextgeneration sequences. The shear volume of data produced in a sequencing run callsfor new features in analysis tools. Specialized data handling tools are the key to uti-lizing next generation data. Typical operations are sequence extraction, alignment(often in parallel on computer clusters), and flexible handling of alignment outputand annotation data. Once this investment in a framework for analysing next gener-ation data has been made, analysis becomes more or less straightforward given theappropriate computing hardware.
Within a decade, sequencing the genome of any species of interest to high qual-ity will be cheap and affordable by a single laboratory. This will mean that anytranscriptomic analysis can be done within the context of the genome of that partic-ular species. Today, however, we are at an odd transitional stage in the evolution ofsequencing, where it is relatively easy to construct large transcriptomic datasets inspecies for which there is no genome sequence from a closely related species. In themarsupial world, the Tasmanian devil is currently a splendid example of this, withthe nearest sequenced genomes being the low coverage and fragmented tammar wal-laby and the more distantly-related opossum. Distinguishing these cases from truemodel organisms like the mouse, we half-jokingly refer to wallaby and opossum as“model non-models,” while the devil is a “non-model non-model.”
The analysis of non-model transcriptomic data, such as that from the Tasmaniandevil, presents additional challenges: should we annotate by aligning cross-species
6A flowgram is the signal intensity data from a Roche 454 sequencer. It is analogous to the chro-matogram in Sanger sequencing. The signal intensity is proportional to the number of the base ofthe same type added in each sequencing step.
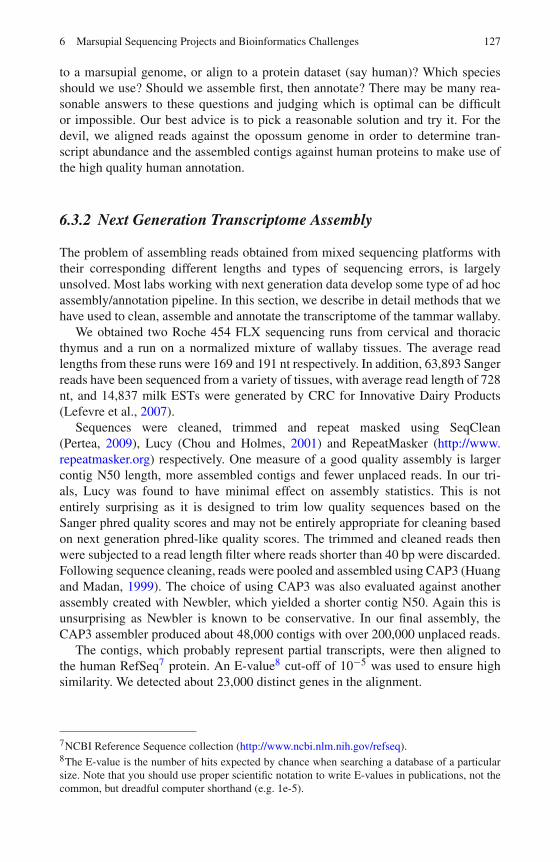
6 Marsupial Sequencing Projects and Bioinformatics Challenges 127
to a marsupial genome, or align to a protein dataset (say human)? Which speciesshould we use? Should we assemble first, then annotate? There may be many rea-sonable answers to these questions and judging which is optimal can be difficultor impossible. Our best advice is to pick a reasonable solution and try it. For thedevil, we aligned reads against the opossum genome in order to determine tran-script abundance and the assembled contigs against human proteins to make use ofthe high quality human annotation.
6.3.2 Next Generation Transcriptome Assembly
The problem of assembling reads obtained from mixed sequencing platforms withtheir corresponding different lengths and types of sequencing errors, is largelyunsolved. Most labs working with next generation data develop some type of ad hocassembly/annotation pipeline. In this section, we describe in detail methods that wehave used to clean, assemble and annotate the transcriptome of the tammar wallaby.
We obtained two Roche 454 FLX sequencing runs from cervical and thoracicthymus and a run on a normalized mixture of wallaby tissues. The average readlengths from these runs were 169 and 191 nt respectively. In addition, 63,893 Sangerreads have been sequenced from a variety of tissues, with average read length of 728nt, and 14,837 milk ESTs were generated by CRC for Innovative Dairy Products(Lefevre et al., 2007).
Sequences were cleaned, trimmed and repeat masked using SeqClean(Pertea, 2009), Lucy (Chou and Holmes, 2001) and RepeatMasker (http://www.repeatmasker.org) respectively. One measure of a good quality assembly is largercontig N50 length, more assembled contigs and fewer unplaced reads. In our tri-als, Lucy was found to have minimal effect on assembly statistics. This is notentirely surprising as it is designed to trim low quality sequences based on theSanger phred quality scores and may not be entirely appropriate for cleaning basedon next generation phred-like quality scores. The trimmed and cleaned reads thenwere subjected to a read length filter where reads shorter than 40 bp were discarded.Following sequence cleaning, reads were pooled and assembled using CAP3 (Huangand Madan, 1999). The choice of using CAP3 was also evaluated against anotherassembly created with Newbler, which yielded a shorter contig N50. Again this isunsurprising as Newbler is known to be conservative. In our final assembly, theCAP3 assembler produced about 48,000 contigs with over 200,000 unplaced reads.
The contigs, which probably represent partial transcripts, were then aligned tothe human RefSeq7 protein. An E-value8 cut-off of 10−5 was used to ensure highsimilarity. We detected about 23,000 distinct genes in the alignment.
7NCBI Reference Sequence collection (http://www.ncbi.nlm.nih.gov/refseq).8The E-value is the number of hits expected by chance when searching a database of a particularsize. Note that you should use proper scientific notation to write E-values in publications, not thecommon, but dreadful computer shorthand (e.g. 1e-5).
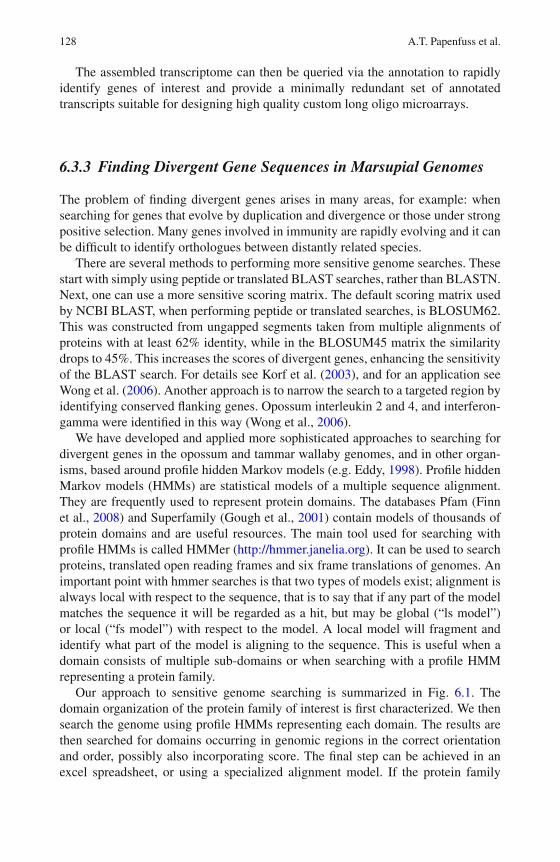
128 A.T. Papenfuss et al.
The assembled transcriptome can then be queried via the annotation to rapidlyidentify genes of interest and provide a minimally redundant set of annotatedtranscripts suitable for designing high quality custom long oligo microarrays.
6.3.3 Finding Divergent Gene Sequences in Marsupial Genomes
The problem of finding divergent genes arises in many areas, for example: whensearching for genes that evolve by duplication and divergence or those under strongpositive selection. Many genes involved in immunity are rapidly evolving and it canbe difficult to identify orthologues between distantly related species.
There are several methods to performing more sensitive genome searches. Thesestart with simply using peptide or translated BLAST searches, rather than BLASTN.Next, one can use a more sensitive scoring matrix. The default scoring matrix usedby NCBI BLAST, when performing peptide or translated searches, is BLOSUM62.This was constructed from ungapped segments taken from multiple alignments ofproteins with at least 62% identity, while in the BLOSUM45 matrix the similaritydrops to 45%. This increases the scores of divergent genes, enhancing the sensitivityof the BLAST search. For details see Korf et al. (2003), and for an application seeWong et al. (2006). Another approach is to narrow the search to a targeted region byidentifying conserved flanking genes. Opossum interleukin 2 and 4, and interferon-gamma were identified in this way (Wong et al., 2006).
We have developed and applied more sophisticated approaches to searching fordivergent genes in the opossum and tammar wallaby genomes, and in other organ-isms, based around profile hidden Markov models (e.g. Eddy, 1998). Profile hiddenMarkov models (HMMs) are statistical models of a multiple sequence alignment.They are frequently used to represent protein domains. The databases Pfam (Finnet al., 2008) and Superfamily (Gough et al., 2001) contain models of thousands ofprotein domains and are useful resources. The main tool used for searching withprofile HMMs is called HMMer (http://hmmer.janelia.org). It can be used to searchproteins, translated open reading frames and six frame translations of genomes. Animportant point with hmmer searches is that two types of models exist; alignment isalways local with respect to the sequence, that is to say that if any part of the modelmatches the sequence it will be regarded as a hit, but may be global (“ls model”)or local (“fs model”) with respect to the model. A local model will fragment andidentify what part of the model is aligning to the sequence. This is useful when adomain consists of multiple sub-domains or when searching with a profile HMMrepresenting a protein family.
Our approach to sensitive genome searching is summarized in Fig. 6.1. Thedomain organization of the protein family of interest is first characterized. We thensearch the genome using profile HMMs representing each domain. The results arethen searched for domains occurring in genomic regions in the correct orientationand order, possibly also incorporating score. The final step can be achieved in anexcel spreadsheet, or using a specialized alignment model. If the protein family
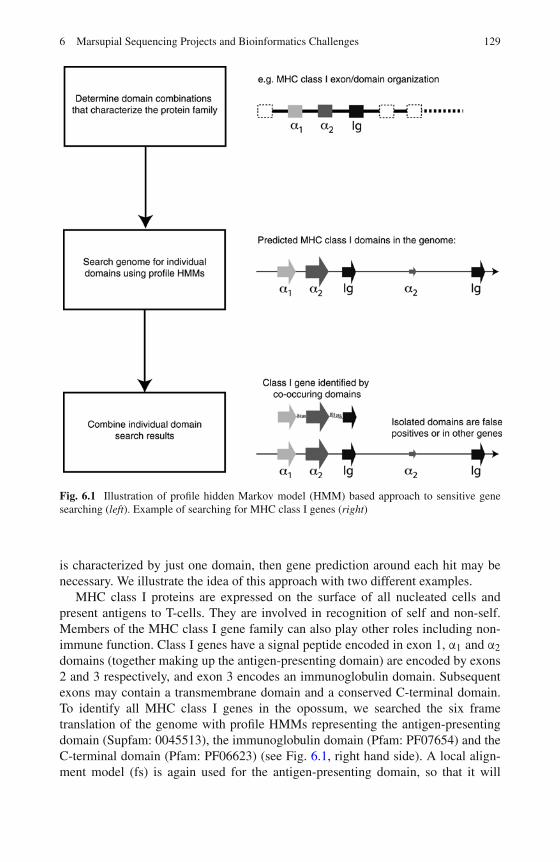
6 Marsupial Sequencing Projects and Bioinformatics Challenges 129
Fig. 6.1 Illustration of profile hidden Markov model (HMM) based approach to sensitive genesearching (left). Example of searching for MHC class I genes (right)
is characterized by just one domain, then gene prediction around each hit may benecessary. We illustrate the idea of this approach with two different examples.
MHC class I proteins are expressed on the surface of all nucleated cells andpresent antigens to T-cells. They are involved in recognition of self and non-self.Members of the MHC class I gene family can also play other roles including non-immune function. Class I genes have a signal peptide encoded in exon 1, α1 and α2domains (together making up the antigen-presenting domain) are encoded by exons2 and 3 respectively, and exon 3 encodes an immunoglobulin domain. Subsequentexons may contain a transmembrane domain and a conserved C-terminal domain.To identify all MHC class I genes in the opossum, we searched the six frametranslation of the genome with profile HMMs representing the antigen-presentingdomain (Supfam: 0045513), the immunoglobulin domain (Pfam: PF07654) and theC-terminal domain (Pfam: PF06623) (see Fig. 6.1, right hand side). A local align-ment model (fs) is again used for the antigen-presenting domain, so that it will
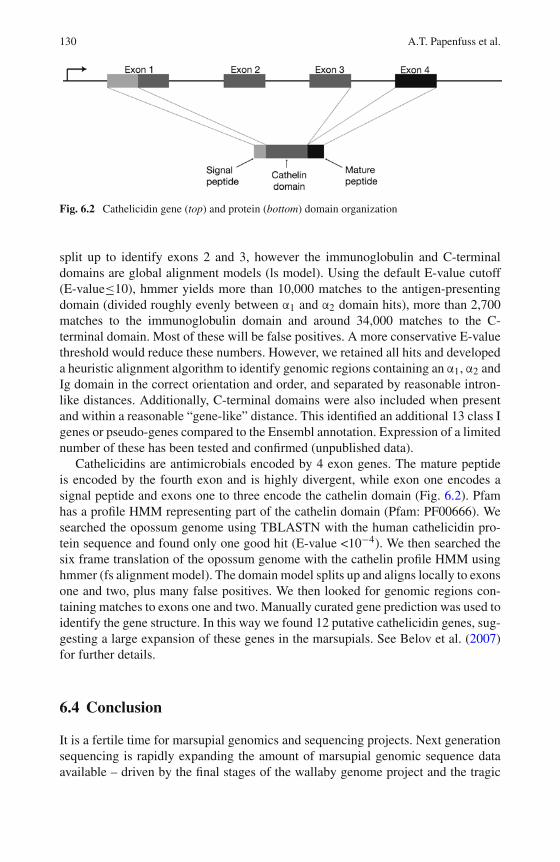
130 A.T. Papenfuss et al.
Fig. 6.2 Cathelicidin gene (top) and protein (bottom) domain organization
split up to identify exons 2 and 3, however the immunoglobulin and C-terminaldomains are global alignment models (ls model). Using the default E-value cutoff(E-value≤10), hmmer yields more than 10,000 matches to the antigen-presentingdomain (divided roughly evenly between α1 and α2 domain hits), more than 2,700matches to the immunoglobulin domain and around 34,000 matches to the C-terminal domain. Most of these will be false positives. A more conservative E-valuethreshold would reduce these numbers. However, we retained all hits and developeda heuristic alignment algorithm to identify genomic regions containing an α1, α2 andIg domain in the correct orientation and order, and separated by reasonable intron-like distances. Additionally, C-terminal domains were also included when presentand within a reasonable “gene-like” distance. This identified an additional 13 class Igenes or pseudo-genes compared to the Ensembl annotation. Expression of a limitednumber of these has been tested and confirmed (unpublished data).
Cathelicidins are antimicrobials encoded by 4 exon genes. The mature peptideis encoded by the fourth exon and is highly divergent, while exon one encodes asignal peptide and exons one to three encode the cathelin domain (Fig. 6.2). Pfamhas a profile HMM representing part of the cathelin domain (Pfam: PF00666). Wesearched the opossum genome using TBLASTN with the human cathelicidin pro-tein sequence and found only one good hit (E-value <10−4). We then searched thesix frame translation of the opossum genome with the cathelin profile HMM usinghmmer (fs alignment model). The domain model splits up and aligns locally to exonsone and two, plus many false positives. We then looked for genomic regions con-taining matches to exons one and two. Manually curated gene prediction was used toidentify the gene structure. In this way we found 12 putative cathelicidin genes, sug-gesting a large expansion of these genes in the marsupials. See Belov et al. (2007)for further details.
6.4 Conclusion
It is a fertile time for marsupial genomics and sequencing projects. Next generationsequencing is rapidly expanding the amount of marsupial genomic sequence dataavailable – driven by the final stages of the wallaby genome project and the tragic
6 Marsupial Sequencing Projects and Bioinformatics Challenges 131
story of the devil tumour. Third generation or “single molecule” sequencers willbring costs down a further order of magnitude and the deluge of data from thisinteresting group of mammals may really begin.
This chapter has discussed some of the bioinformatics challenges that arise whendealing with marsupial genomic sequence resources. It has also discussed a numberof tools that are useful in dealing with data of this type. It is important to realizethat not all bioinformatics problems have good packaged solutions or can be solvedwith pipelines of existing tools and there is a strong need for bioinformaticians withskills in mathematics, statistics and computer science, to develop new tools whererequired.
References
Altschul SF, Gish W, Miller W, Myers EW, Lipman DJ (1990) Basic local alignment search tool.J Mol Biol 215:403–410.
Baker ML, Indiviglio S, Nyberg AM, et al. (2007) Analysis of a set of Australian northern brownbandicoot expressed sequence tags with comparison to the genome sequence of the SouthAmerican grey short tailed opossum. BMC Genomics 8:50.
Belov K, Deakin JE, Papenfuss AT, et al. (2006) Reconstructing an ancestral mammalian immunesupercomplex from a marsupial major histocompatibility complex. PLoS Biol 4:e46.
Belov K, Sanderson CE, Deakin JE, et al. (2007) Characterization of the opossum immune genomeprovides insights into the evolution of the mammalian immune system. Genome Res 17:982–991.
Chou H-H, Holmes MH (2001) DNA sequence quality trimming and vector removal.Bioinformatics 17:1093–1104.
Eddy SR (1998) Profile hidden Markov models. Bioinformatics 14:755–763.Finn RD, Tate J, Mistry J, et al. (2008) The Pfam protein families database. Nucleic Acids Re
36:D281–D288.Gough J, Karplus K, Hughey R, Chothia C (2001) Assignment of homology to genome sequences
using a library of hidden Markov models that represent all proteins of known structure. J MolBiol 313:903–919.
Huang X, Madan A (1999) CAP3: A DNA sequence assembly program. Genome Res 9:868–877.Hubbard TJ, Aken BL, Beal K, et al. (2007) Ensembl 2007. Nucleic Acids Res 35:D610–D617.Kent WJ (2002) BLAT–the BLAST-like alignment tool. Genome Res 12:656–664.Korf I, Yandell M, Bedell J (2003) BLAST. O’Reilly and Associates, Sebastapol.Kullberg M, Hallström B, Arnason U, Janke A (2007) Expressed sequence tags as a tool for
phylogenetic analysis of placental mammal evolution. PLoS One 2:e775.Lachish S, Jones M, McCallum H (2007) The impact of disease on the survival and population
growth rate of the Tasmanian devil. J Anim Ecol 76:926–936.Langmead B, Trapnell C, Pop M, Salzberg SL (2009) Ultrafast and memory-efficient alignment of
short DNA sequences to the human genome. Genome Biol 10:R25.Lefevre CM, Digby MR, Whitley JC, Strahm Y, Nicholas KR (2007) Lactation transcriptomics
in the Australian marsupial, Macropus eugenii: transcript sequencing and quantification BMCGenomics 8:417.
Li R, Li Y, Kristiansen K, Wang J (2008) SOAP: short oligonucleotide alignment program.Bioinformatics 24:713–714.
McCallum H, Tompkins D, Jones M, et al. (2007) Distribution and impacts of Tasmanian DevilFacial Tumour Disease. EcoHealth 4:318–325.
Mikkelsen TS, Wakefield MJ, Aken B, et al. (2007) Genome of the marsupial Monodelphisdomestica reveals innovation in non-coding sequences. Nature 447:167–177.
132 A.T. Papenfuss et al.
Murchison EP, Tovar C, Hsu A, et al. (2010). The Tasmanian devil transcriptome reveals Schwanncell origins of a clonally transmissible cancer. Science 327(5961):84–87.
Pearse AM, Swift K (2006) Allograft theory: transmission of devil facial-tumour disease. Nature439:549.
Pertea G (2009) http://compbio.dfci.harvard.edu/tgi/software, Retrieved 20 August 2009, fromDana Farber-Cancer Institute Software Tools.
Pyecroft S, Pearse A, Loh R, et al. (2007) Towards a case definition for devil facial tumour disease:what is it? EcoHealth 4:346–351.
Rumble SM, Lacroute P, Dalca AV, Fiume M, Sidow A, Brudno M (2009) SHRiMP: accuratemapping of short color-space reads. PLoS Comput Biol 5:e1000386.
Simpson JT, Wong K, Jackman SD, Schein JE, Jones SJ, Birol I (2009) ABySS: a parallelassembler for short read sequence. Genome Res 19(6):1117–1123.
Slater GS, Birney E (2005) Automated generation of heuristics for biological sequence compari-son. BMC Bioinformatics 6:31.
Wong ES, Young LJ, Papenfuss AT, Belov K (2006) In silico identification of opossum cytokinegenes suggests the complexity of the marsupial immune system rivals that of eutherianmammals. Immunome Res 2:4.
Yeh RF, Lim LP, Burge CB (2001) In silico identification of opossum cytokine genes suggests thecomplexity of the marsupial immune system rivals that of eutherian mammals. Genome Res11:803–816.
Zerbino DR, Birney E (2008) Velvet: algorithms for de novo short read assembly using de Bruijngraphs. Genome Res 18:821–829.
Chapter 7Insight into Evolution of Gene RegulationNetworks from the Opossum Genome
Matthew J. Wakefield and Anthony T. Papenfuss
Abstract The Brazilian short-tailed grey opossum Monodelphis domestica was thefirst marsupial genome to be sequenced. The high quality draft genome sequencehas provided significant new understanding of mammal genome evolution, suggest-ing that innovation in protein coding genes occurs primarily by diversification ofexisting gene families and that truly novel protein coding genes are rare. The opos-sum genome also highlights the magnitude of the role transposable elements havehad in shaping gene regulatory networks, including X chromosome inactivation.The rate of innovation of new conserved non-coding elements is 20 fold higherthan for protein coding genes, and a substantial portion of the novel eutherian spe-cific conserved non-coding elements can be attributed to arising from transposableelements. Combined with insights into the role of recombination on genome com-position and structure, the opossum genome has provided unique insight into theforces that shaped the genomes of all mammals.
Keywords Brazilian short-tailed grey opossum · Gene evolution · Generegulation · Transposable elements · Exaptation
7.1 Introduction
The first marsupial to be sequenced to high quality draft status was the Brazilianshort grey-tailed opossum Monodelphis domestica. The major motivation forsequencing a marsupial genome was to use comparisons with other mammalianspecies to explore the evolutionary history of the mammalian genome. Evolutionarycomparisons provide insight into conserved features that are present in all mammals,as well as the unique features that have evolved independently in the eutherian “pla-cental” mammals and the metatherian “marsupial” mammals. Marsupial mammals
M.J. Wakefield (B)Bioinformatics Division, The Walter and Eliza Hall Institute of Medical Research, Parkville, VIC3052, Australiae-mail: [email protected]
133J.E. Deakin et al. (eds.), Marsupial Genetics and Genomics,DOI 10.1007/978-90-481-9023-2_7, C© Springer Science+Business Media B.V. 2010
134 M.J. Wakefield and A.T. Papenfuss
provide a powerful addition to the comparative genomics arsenal due to their greatevolutionary distance from eutherian mammals, while sharing the majority of com-mon mammalian traits (Wakefield and Graves, 2003; Wakefield and Graves, 2005).
One of the biggest surprises of the Human and subsequent genome projects wasthe small number of protein coding genes compared to the initial estimates. Priorto the sequencing of the human genome, estimates of gene numbers ranged as highas 100,000, while the final number of genes in the finished human genome was19,599 with an upper bound of 25,000 (IHGSC, 2004). Comparisons with singlecelled eukaryotes, insects, and vertebrates led to the conclusion that gene numberdoes not scale with organism complexity (Lander et al., 2001). The lack of correla-tion between complexity and gene number has lead to the hypothesis that organismcomplexity is governed by changes in regulatory programs, altering the combinationof genes expressed and their response to the environment. Proposed mechanisms forthis complex regulation include evolution of transcription factors and their bindingsites, and non-coding RNA regulation of transcripts and non-coding RNA regula-tion of translation into protein (Mattick, 2003; Davidson, 2006; Chen et al., 2007).The importance of regulation in accounting for the discrepancy in complexity issupported by the complex transcription of single gene loci that occurs in mammals(Carninci et al., 2005).
Comparative genomics has been recognized as a powerful tool for identify-ing functional regions of the human genome. The first mammalian comparativegenome analysis was that of the mouse genome, chosen both to provide sequencecomparison with the human and due to its importance as an experimental model(Mouse Genome Sequencing Consortium et al., 2002). Comparative power wasgreatly enhanced by the addition of the dog genome as a third divergent com-parator (Lindblad-Toh et al., 2005). Sequencing of the same small regions fromthe genomes of multiple species, to provide a representation of the power added incomparative analysis, showed that for non protein coding regions marsupials andmonotremes were the most powerful single species comparisons (Chapman et al.,2003; Margulies et al., 2005; Wakefield and Graves, 2005). This analysis of powerresulted in the eventual selection of platypus as the monotreme to be sequenced todraft quality (Warren et al., 2008), Monodelphis domestica to draft quality as therepresentative marsupial (Mikkelsen et al., 2007), and light two-fold coverage ofthe tammar wallaby (Macropus eugenii) as the representative Australian marsupialand within-marsupial comparator.
The analysis of the opossum genome was therefore focused on the questionsof how non-coding regions of the genome evolve and function, and how featuresunique to eutherian mammals evolved.
7.2 Opossum Genome Features
The opossum genome was sequenced using the shotgun cloning methodology inwhich small random fragments of DNA are cloned into bacterial vectors, puri-fied individually, and sequenced using Sanger dideoxy fluorescent sequencing on
7 Insight into Evolution of Gene Regulation Networks from the Opossum Genome 135
automated capillary sequencers. The majority of clones were 1–2 kb in size sup-plemented with 5–10 kb clones and BAC ends to aid scaffolding across contigbreaks and anchor scaffolds to chromosomes. In total 38.8 million Sanger sequenc-ing reads were performed to produce 3,475 Mb of sequence with a redundancy of 6.8fold, N50 contig length of 108 kb and N50 scaffold length of 59.8 Mb (Mikkelsenet al., 2007). Ninety-seven percent of the genome sequence was anchored to chro-mosomes using fluorescent in situ hybridisation and linkage mapping (Duke et al.,2007; Samollow et al., 2007).
Unusual features of the opossum genome include a large euchromatic genomesize of 3.47 Gbp (20% larger than the previous largest sequenced mammal, humanwith 2.88 Gbp), a low G+C content, low rate of segmental duplications, and a high52% of the genome derived from transposable elements.
In common with other marsupials, the Monodelphis domestica genome has largechromosomes and overall low recombination rates. All eight of the opossum auto-somes are larger than any human chromosomes; the smallest opossum autosome, at258 Mb, is 11 Mb longer than human chromosome 1. Recombination averages 0.2–0.3 centimorgans per megabase (cM/Mb), between half and 1/15th the rate seen inother amniotes, which range from 0.5–3 cM/Mb (see Samollow, Chapter 4). Thelarge size of the Monodelphis domestica chromosomes is proposed to drive theoverall low recombination rates.
The base composition of the opossum genome is significantly different from thatof other sequenced mammal genomes; a G+C density of 37.7% being significantlylower than the 40.9–41.8% observed in other sequenced amniotes (Mikkelsen et al.,2007). This compositional shift in nucleotides away from G+C towards A+T mayalso be explained by the lower recombination rate, which is proposed to alter the bal-ance between repair and mutation. Mutation is biased towards elevating A+T andthought to remain constant at an absolute level, while the reduced recombinationrate would decrease the rate of gene conversion which is biased towards increasingG+C levels (Goodstadt et al., 2007). This conclusion is supported by the low fre-quency of CpG dinucleotides in the genome (0.9% vs. 1.7–2.2% in other sequencedamniotes), reflecting the high rate of mutation by deamination of methyl cytosine tothymine being less effectively opposed due to lower recombination mediated repairin Monodelphis domestica (Goodstadt et al., 2007).
The lower recombination rate may also account for other features of the opos-sum genome. The large size of the opossum genome relative to human reflectsthe accumulation of transposable elements, which is consistent with a lower rateof recombination removing fewer new insertions. There is also a greater diversityof transposable elements which may be explained by a reduced level of non-homologous recombination which is thought to be a major homogenizing factor forrepeated sequences (Gentles et al., 2007). A lower level of non-homologous recom-bination would also explain the low level of segmental duplications in the opossumgenome (Mikkelsen et al., 2007).
Other differences in the genome metabolism of the opossum, such as changesin the rate of mutation repair pathways that are independent of recombination, andalterations in the biosynthetic pools of bases, may contribute to the differences in
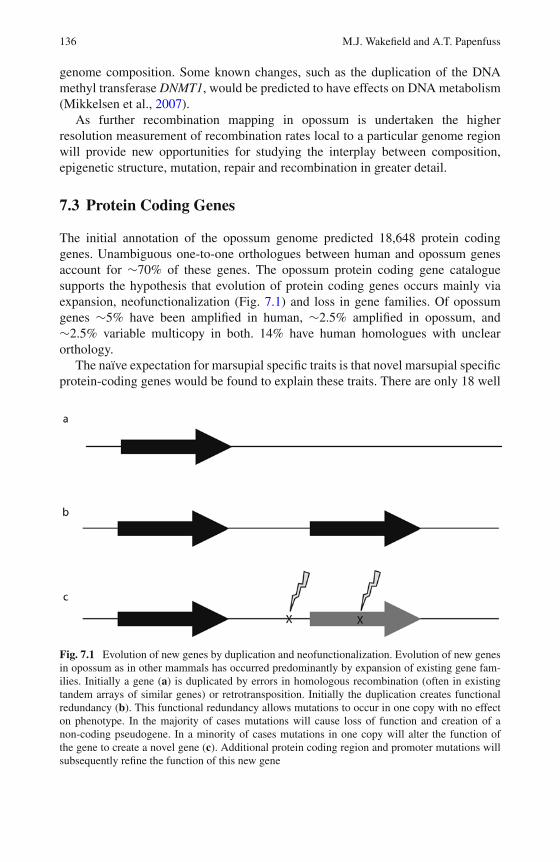
136 M.J. Wakefield and A.T. Papenfuss
genome composition. Some known changes, such as the duplication of the DNAmethyl transferase DNMT1, would be predicted to have effects on DNA metabolism(Mikkelsen et al., 2007).
As further recombination mapping in opossum is undertaken the higherresolution measurement of recombination rates local to a particular genome regionwill provide new opportunities for studying the interplay between composition,epigenetic structure, mutation, repair and recombination in greater detail.
7.3 Protein Coding Genes
The initial annotation of the opossum genome predicted 18,648 protein codinggenes. Unambiguous one-to-one orthologues between human and opossum genesaccount for ∼70% of these genes. The opossum protein coding gene cataloguesupports the hypothesis that evolution of protein coding genes occurs mainly viaexpansion, neofunctionalization (Fig. 7.1) and loss in gene families. Of opossumgenes ∼5% have been amplified in human, ∼2.5% amplified in opossum, and∼2.5% variable multicopy in both. 14% have human homologues with unclearorthology.
The naïve expectation for marsupial specific traits is that novel marsupial specificprotein-coding genes would be found to explain these traits. There are only 18 well
Fig. 7.1 Evolution of new genes by duplication and neofunctionalization. Evolution of new genesin opossum as in other mammals has occurred predominantly by expansion of existing gene fam-ilies. Initially a gene (a) is duplicated by errors in homologous recombination (often in existingtandem arrays of similar genes) or retrotransposition. Initially the duplication creates functionalredundancy (b). This functional redundancy allows mutations to occur in one copy with no effecton phenotype. In the majority of cases mutations will cause loss of function and creation of anon-coding pseudogene. In a minority of cases mutations in one copy will alter the function ofthe gene to create a novel gene (c). Additional protein coding region and promoter mutations willsubsequently refine the function of this new gene
7 Insight into Evolution of Gene Regulation Networks from the Opossum Genome 137
supported opossum specific genes when compared to eutherian mammals, whichare ancient genes retained in opossum and lost in the eutherian lineage (Mikkelsenet al., 2007). The method of annotation of the opossum genome did not use opossumtranscriptome data but relied on homology to known proteins from other species,primarily human. Due to the restriction to only finding genes that have some simi-larity to known genes, the gene annotation is therefore potentially biased away fromdetecting truly novel genes; however, novel genes in other species where transcriptbased annotation has been undertaken have been observed to be mainly detectableby homology and this bias is likely to be minor. Taking this bias into consider-ation the observed low rate of novel genes strongly suggests that true innovationin protein coding genes is rare relative to regulatory changes and diversification byduplication. The estimate that 15% of genes have been involved in one or more geneduplication or gene conversion event is strongly reduced when contrasted with the20% duplication rate in human. This reduction in duplication and gene conversionis consistent with the reduced rate of segmental duplication implicating the loweropossum recombination rate as a driver of reduced innovation in protein codinggenes (Goodstadt et al., 2007).
The diversification that has occurred in the opossum lineage is mainly in genefamilies involved in environmental interactions. These include eye lens proteins,taste, odorant and pheromone receptors. Diet related genes such as those involvedin toxin degradation and gastric enzymes are another rapidly evolving class, as wellas those involved in the adaptive immune system (Belov et al., 2007), which isexamined in detail elsewhere in this volume (Cheng et al., Chapter 16; Baker et al.,Chapter 17; Morris et al., Chapter 18).
Interestingly one rapidly evolving family in opossum and other mammals is thatof the KRAB zinc fingers, transcription factors that have rapid positive selection foradaptive changes in the zinc finger DNA binding site that mediates the specificity ofthese transcription factors. KRAB zinc fingers therefore provide a link between theevolution of protein coding genes and regulatory elements (Shannon et al., 2003;Mikkelsen et al., 2007).
The rapid birth and death of genes in existing multi gene families, and thefunctional categories involved, mirror those observed previously in eutherian mam-mals (Waterston et al., 2002; Emes et al., 2003; Gibbs et al., 2004; ChimpanzeeSequencing and Analysis Consortium et al., 2005; Goodstadt et al., 2007). Twonotable expansions that have not previously been observed in vertebrates may havesignificant impacts on marsupial biology. Multiple duplications have occurred in theSMG5 and SMG6 genes which are involved in nonsense mediated decay (Mikkelsenet al., 2007). The SMG proteins are components of P-bodies which in addition tononsense mediated decay play roles in miRNA and RNAi processes (Rehwinkelet al., 2005), raising the intriguing possibility of marsupial specific innovationin miRNA processing. Another marsupial specific duplication is the presence oftwo tandem paralogues of the DNMT1 cytosine methyl transferase gene. In mouseDNMT1 has been shown to be essential for the maintenance of random X inactiva-tion in the embryo but not imprinted extraembryonic tissue inactivation (Sado et al.,
138 M.J. Wakefield and A.T. Papenfuss
2000), and duplication of the DNMT1 gene may be involved marsupial specific dif-ference in X inactivation and differences in nucleotide composition of the opossumgenome.
7.4 Evolution of Non Protein Coding Regulatory Sequences
The significant paradigm shift that occurred as the consequence of the genomicsrevolution at the turn of the twenty-first century was an understanding of thetranscriptional complexity of the genome. A corollary of the transcriptional com-plexity is the requirement for complex regulatory mechanisms to orchestrate thiscomplexity.
Conservation of sequence is a powerful tool for identifying regions of the genomethat are important for function. Over time, sequences will be subject to randommutation at a similar rate across the genome, and a highly similar rate in localregions of the genome. If a mutation occurs in a non-functional region of thegenome, there will be no phenotypic consequence for this mutation and naturalselection will be unable to act on this mutation. These neutral mutations will there-fore accumulate randomly in non-functional DNA. In locations that are functional,either due to the coding for a protein or serving a regulatory function, mutationswill have a phenotypic consequence. As the phenotype is changed by the mutationnatural selection is able to act on these mutations. In a very tiny minority of casesthe mutation will cause a change that is beneficial and eventually come to dominatein the population; however, in most cases the mutation will be deleterious and willbe quickly eliminated from the population. This removal of deleterious mutations isknown as purifying selection.
As a consequence of the different fates of mutation in functional and non-functional regions of the genome, functional DNA sequence can be identifiedby the higher sequence conservation between species. This conservation effect isstrongest in protein coding genes, as mutations that truncate a protein have a highphenotypic consequence and are strongly selected against, but is also apparent ingenome features that are permissive of sequence variation such as transcriptionfactor binding sites.
In comparisons between the human genome and those of mouse and dog it wasdiscovered that the majority of evolutionarily conserved sequence occurs outsideprotein coding genes (Lindblad-Toh et al., 2005). Only 1–2% of the genome inmammals is identified as being protein coding. By comparing to ancient transpos-able elements and degenerate codon positions to estimate the neutral mutation rate,5–6% of the genome is observed to be under purifying selection. Given that only1–2% of this 5–6% conserved sequence is protein coding the observed conservationsuggests that 3–5% of the genome is conserved non-coding sequence and putativeregulatory regions of the genome.
The proportion of the genome under purifying selection may be underestimateddue to the difficulty in defining truly neutral alignable sequence. There are multiple
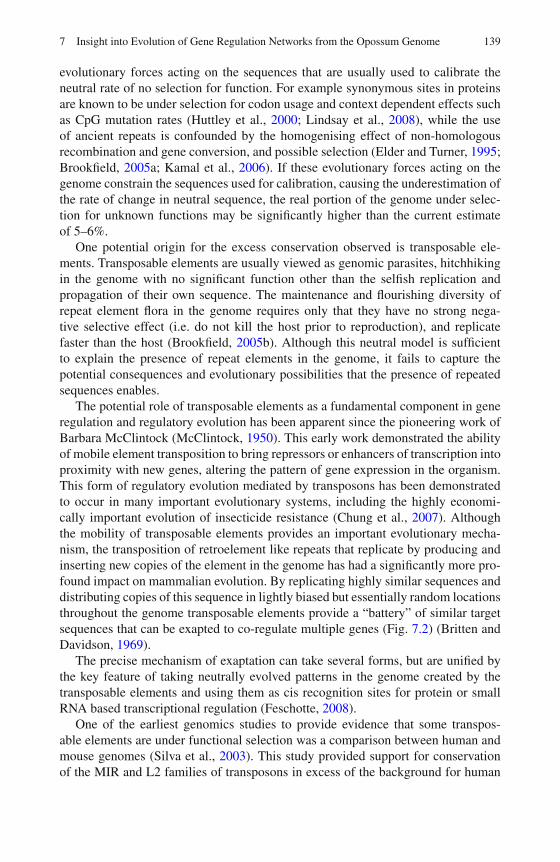
7 Insight into Evolution of Gene Regulation Networks from the Opossum Genome 139
evolutionary forces acting on the sequences that are usually used to calibrate theneutral rate of no selection for function. For example synonymous sites in proteinsare known to be under selection for codon usage and context dependent effects suchas CpG mutation rates (Huttley et al., 2000; Lindsay et al., 2008), while the useof ancient repeats is confounded by the homogenising effect of non-homologousrecombination and gene conversion, and possible selection (Elder and Turner, 1995;Brookfield, 2005a; Kamal et al., 2006). If these evolutionary forces acting on thegenome constrain the sequences used for calibration, causing the underestimation ofthe rate of change in neutral sequence, the real portion of the genome under selec-tion for unknown functions may be significantly higher than the current estimateof 5–6%.
One potential origin for the excess conservation observed is transposable ele-ments. Transposable elements are usually viewed as genomic parasites, hitchhikingin the genome with no significant function other than the selfish replication andpropagation of their own sequence. The maintenance and flourishing diversity ofrepeat element flora in the genome requires only that they have no strong nega-tive selective effect (i.e. do not kill the host prior to reproduction), and replicatefaster than the host (Brookfield, 2005b). Although this neutral model is sufficientto explain the presence of repeat elements in the genome, it fails to capture thepotential consequences and evolutionary possibilities that the presence of repeatedsequences enables.
The potential role of transposable elements as a fundamental component in generegulation and regulatory evolution has been apparent since the pioneering work ofBarbara McClintock (McClintock, 1950). This early work demonstrated the abilityof mobile element transposition to bring repressors or enhancers of transcription intoproximity with new genes, altering the pattern of gene expression in the organism.This form of regulatory evolution mediated by transposons has been demonstratedto occur in many important evolutionary systems, including the highly economi-cally important evolution of insecticide resistance (Chung et al., 2007). Althoughthe mobility of transposable elements provides an important evolutionary mecha-nism, the transposition of retroelement like repeats that replicate by producing andinserting new copies of the element in the genome has had a significantly more pro-found impact on mammalian evolution. By replicating highly similar sequences anddistributing copies of this sequence in lightly biased but essentially random locationsthroughout the genome transposable elements provide a “battery” of similar targetsequences that can be exapted to co-regulate multiple genes (Fig. 7.2) (Britten andDavidson, 1969).
The precise mechanism of exaptation can take several forms, but are unified bythe key feature of taking neutrally evolved patterns in the genome created by thetransposable elements and using them as cis recognition sites for protein or smallRNA based transcriptional regulation (Feschotte, 2008).
One of the earliest genomics studies to provide evidence that some transpos-able elements are under functional selection was a comparison between human andmouse genomes (Silva et al., 2003). This study provided support for conservationof the MIR and L2 families of transposons in excess of the background for human
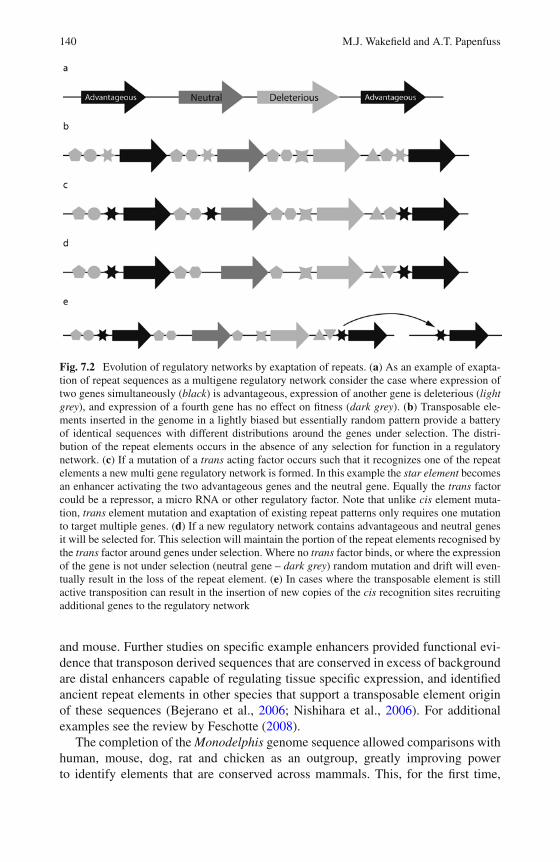
140 M.J. Wakefield and A.T. Papenfuss
Fig. 7.2 Evolution of regulatory networks by exaptation of repeats. (a) As an example of exapta-tion of repeat sequences as a multigene regulatory network consider the case where expression oftwo genes simultaneously (black) is advantageous, expression of another gene is deleterious (lightgrey), and expression of a fourth gene has no effect on fitness (dark grey). (b) Transposable ele-ments inserted in the genome in a lightly biased but essentially random pattern provide a batteryof identical sequences with different distributions around the genes under selection. The distri-bution of the repeat elements occurs in the absence of any selection for function in a regulatorynetwork. (c) If a mutation of a trans acting factor occurs such that it recognizes one of the repeatelements a new multi gene regulatory network is formed. In this example the star element becomesan enhancer activating the two advantageous genes and the neutral gene. Equally the trans factorcould be a repressor, a micro RNA or other regulatory factor. Note that unlike cis element muta-tion, trans element mutation and exaptation of existing repeat patterns only requires one mutationto target multiple genes. (d) If a new regulatory network contains advantageous and neutral genesit will be selected for. This selection will maintain the portion of the repeat elements recognised bythe trans factor around genes under selection. Where no trans factor binds, or where the expressionof the gene is not under selection (neutral gene – dark grey) random mutation and drift will even-tually result in the loss of the repeat element. (e) In cases where the transposable element is stillactive transposition can result in the insertion of new copies of the cis recognition sites recruitingadditional genes to the regulatory network
and mouse. Further studies on specific example enhancers provided functional evi-dence that transposon derived sequences that are conserved in excess of backgroundare distal enhancers capable of regulating tissue specific expression, and identifiedancient repeat elements in other species that support a transposable element originof these sequences (Bejerano et al., 2006; Nishihara et al., 2006). For additionalexamples see the review by Feschotte (2008).
The completion of the Monodelphis genome sequence allowed comparisons withhuman, mouse, dog, rat and chicken as an outgroup, greatly improving powerto identify elements that are conserved across mammals. This, for the first time,
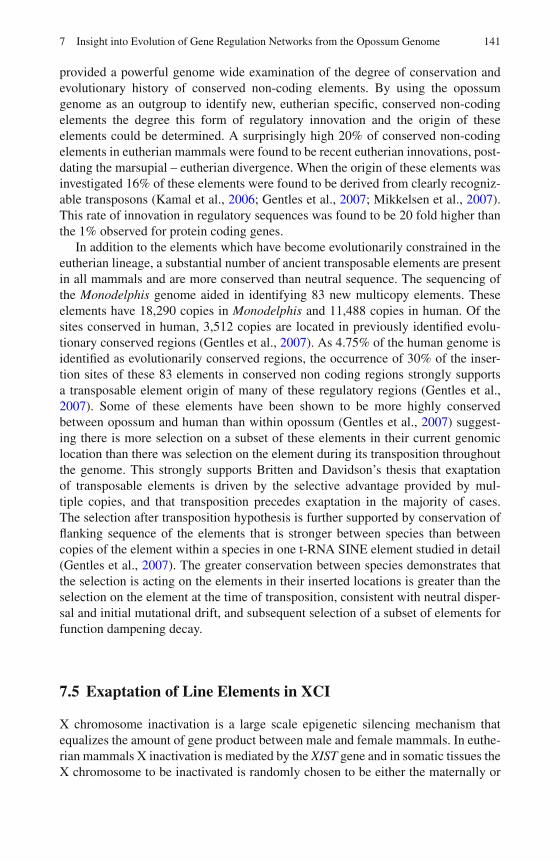
7 Insight into Evolution of Gene Regulation Networks from the Opossum Genome 141
provided a powerful genome wide examination of the degree of conservation andevolutionary history of conserved non-coding elements. By using the opossumgenome as an outgroup to identify new, eutherian specific, conserved non-codingelements the degree this form of regulatory innovation and the origin of theseelements could be determined. A surprisingly high 20% of conserved non-codingelements in eutherian mammals were found to be recent eutherian innovations, post-dating the marsupial – eutherian divergence. When the origin of these elements wasinvestigated 16% of these elements were found to be derived from clearly recogniz-able transposons (Kamal et al., 2006; Gentles et al., 2007; Mikkelsen et al., 2007).This rate of innovation in regulatory sequences was found to be 20 fold higher thanthe 1% observed for protein coding genes.
In addition to the elements which have become evolutionarily constrained in theeutherian lineage, a substantial number of ancient transposable elements are presentin all mammals and are more conserved than neutral sequence. The sequencing ofthe Monodelphis genome aided in identifying 83 new multicopy elements. Theseelements have 18,290 copies in Monodelphis and 11,488 copies in human. Of thesites conserved in human, 3,512 copies are located in previously identified evolu-tionary conserved regions (Gentles et al., 2007). As 4.75% of the human genome isidentified as evolutionarily conserved regions, the occurrence of 30% of the inser-tion sites of these 83 elements in conserved non coding regions strongly supportsa transposable element origin of many of these regulatory regions (Gentles et al.,2007). Some of these elements have been shown to be more highly conservedbetween opossum and human than within opossum (Gentles et al., 2007) suggest-ing there is more selection on a subset of these elements in their current genomiclocation than there was selection on the element during its transposition throughoutthe genome. This strongly supports Britten and Davidson’s thesis that exaptationof transposable elements is driven by the selective advantage provided by mul-tiple copies, and that transposition precedes exaptation in the majority of cases.The selection after transposition hypothesis is further supported by conservation offlanking sequence of the elements that is stronger between species than betweencopies of the element within a species in one t-RNA SINE element studied in detail(Gentles et al., 2007). The greater conservation between species demonstrates thatthe selection is acting on the elements in their inserted locations is greater than theselection on the element at the time of transposition, consistent with neutral disper-sal and initial mutational drift, and subsequent selection of a subset of elements forfunction dampening decay.
7.5 Exaptation of Line Elements in XCI
X chromosome inactivation is a large scale epigenetic silencing mechanism thatequalizes the amount of gene product between male and female mammals. In euthe-rian mammals X inactivation is mediated by the XIST gene and in somatic tissues theX chromosome to be inactivated is randomly chosen to be either the maternally or
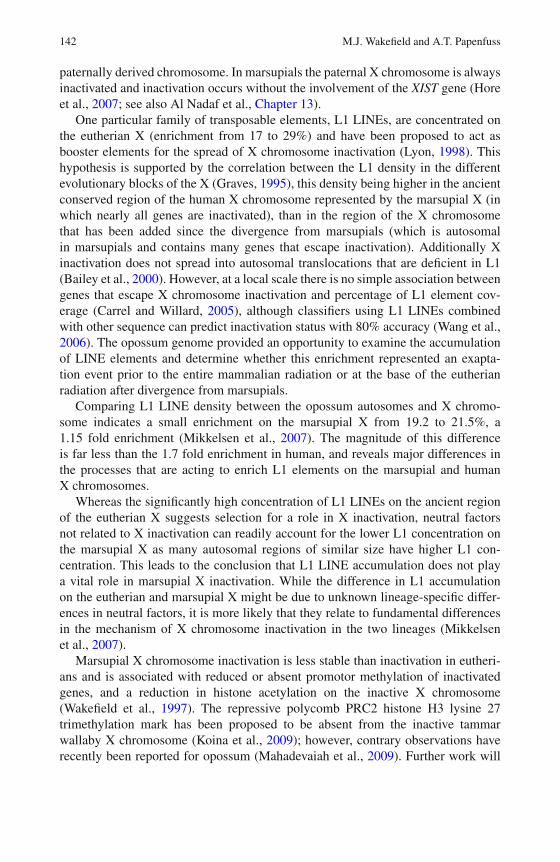
142 M.J. Wakefield and A.T. Papenfuss
paternally derived chromosome. In marsupials the paternal X chromosome is alwaysinactivated and inactivation occurs without the involvement of the XIST gene (Horeet al., 2007; see also Al Nadaf et al., Chapter 13).
One particular family of transposable elements, L1 LINEs, are concentrated onthe eutherian X (enrichment from 17 to 29%) and have been proposed to act asbooster elements for the spread of X chromosome inactivation (Lyon, 1998). Thishypothesis is supported by the correlation between the L1 density in the differentevolutionary blocks of the X (Graves, 1995), this density being higher in the ancientconserved region of the human X chromosome represented by the marsupial X (inwhich nearly all genes are inactivated), than in the region of the X chromosomethat has been added since the divergence from marsupials (which is autosomalin marsupials and contains many genes that escape inactivation). Additionally Xinactivation does not spread into autosomal translocations that are deficient in L1(Bailey et al., 2000). However, at a local scale there is no simple association betweengenes that escape X chromosome inactivation and percentage of L1 element cov-erage (Carrel and Willard, 2005), although classifiers using L1 LINEs combinedwith other sequence can predict inactivation status with 80% accuracy (Wang et al.,2006). The opossum genome provided an opportunity to examine the accumulationof LINE elements and determine whether this enrichment represented an exapta-tion event prior to the entire mammalian radiation or at the base of the eutherianradiation after divergence from marsupials.
Comparing L1 LINE density between the opossum autosomes and X chromo-some indicates a small enrichment on the marsupial X from 19.2 to 21.5%, a1.15 fold enrichment (Mikkelsen et al., 2007). The magnitude of this differenceis far less than the 1.7 fold enrichment in human, and reveals major differences inthe processes that are acting to enrich L1 elements on the marsupial and humanX chromosomes.
Whereas the significantly high concentration of L1 LINEs on the ancient regionof the eutherian X suggests selection for a role in X inactivation, neutral factorsnot related to X inactivation can readily account for the lower L1 concentration onthe marsupial X as many autosomal regions of similar size have higher L1 con-centration. This leads to the conclusion that L1 LINE accumulation does not playa vital role in marsupial X inactivation. While the difference in L1 accumulationon the eutherian and marsupial X might be due to unknown lineage-specific differ-ences in neutral factors, it is more likely that they relate to fundamental differencesin the mechanism of X chromosome inactivation in the two lineages (Mikkelsenet al., 2007).
Marsupial X chromosome inactivation is less stable than inactivation in eutheri-ans and is associated with reduced or absent promotor methylation of inactivatedgenes, and a reduction in histone acetylation on the inactive X chromosome(Wakefield et al., 1997). The repressive polycomb PRC2 histone H3 lysine 27trimethylation mark has been proposed to be absent from the inactive tammarwallaby X chromosome (Koina et al., 2009); however, contrary observations haverecently been reported for opossum (Mahadevaiah et al., 2009). Further work will
7 Insight into Evolution of Gene Regulation Networks from the Opossum Genome 143
therefore be required before the any role for L1 accumulation in the development ofthe multilayered X inactivation mechanism can be determined.
X chromosome inactivation therefore appears to be a striking case of exapta-tion at the base of the eutherian lineage. L1 elements accumulated neutrally on theancient X chromosome in a common therian ancestor, and this continued on themarsupial X, without selection for a role in X inactivation. Paternal X inactiva-tion in marsupials requires no choice or counting mechanism. Inactivation couldbe accurately targeted to the evolving heteromorphic region of the X chromosomesimply by identifying and silencing regions that are unpaired in male meiosis. Suchan unpaired DNA silencing mechanism would have had fitness benefits prior to sexchromosome evolution in silencing chromosomal abnormalities and transposableelements and is seen in meiotic sex chromosome inactivation (Turner et al., 2002),so need not have co-evolved with the heteromorphic state.
In the eutherian lineage, however, these enriched L1 LINEs have apparently beenco-opted into a chromosome-wide X inactivation mechanism after the evolution ofthe XIST gene. This exaptation may have been enhanced (or even precipitated) bythe addition of the L1-rich XAR. The inherently unstable XIST homologous regionXICHR is hypothesized to have undergone pseudogenisation (Duret et al., 2006) andinvasion of repetitive elements (Hore et al., 2007) to create a proto-XIST RNA thatinteracted with nearby L1 sequences on the X chromosome, promoting stabilizationof inactivation by inducing repeat silencing molecular mechanisms. This interactionwith L1 LINEs may account for the constrained re-arrangement of the X in eutherianmammals relative to Australian and American marsupials, and actively selected forfurther accumulation of the critical L1 sequences (Mikkelsen et al., 2007; Warrenet al., 2008). Further evolution of the proto-XIST and the surrounding locus thengave rise to the female specific expression, counting and choice mechanisms presentin the modern eutherian XCI system from this basic exaptation of repeats origin.
7.6 Conclusion
The large chromosomes and reduced recombination rate of the opossum genomehas provided an illuminating contrast to other mammals that highlights importantprocesses of genome evolution. The reduced rate of segmental duplication has sup-pressed the contribution of duplication and diversification of protein coding genes,suppressed clearance of transposable elements resulting in an increased genomesize, and altered the balance of mutation and repair resulting in reduced G+Ccontent.
Although the phenomenon of exaptation of repeats was known and demonstratedprior to the sequencing of the opossum genome, this evolutionary process was oftenconsidered a quirky minor player in how vertebrate complexity evolved. The lastinglegacy of the opossum genome analysis will be the identification of multiple exam-ples of the exaptation of transposable elements, and an indication of the scale ofcontribution exaptation has made throughout evolution.
144 M.J. Wakefield and A.T. Papenfuss
This has provided an appreciation of the important role the critical twin featuresof diverse sequence, and its distribution in variable repetitive copy density through-out the genome, has played in the evolution of regulatory complexity. The examplesof ancient mammal wide repeats and recent exaptation of transposable elementsin the eutherian lineage provide evidence of both the ancient and evolutionarilyrecent contributions of this mechanism. Excitingly, this new appreciation of hownetworks of gene regulation can form via exaptation provides testable hypotheseson the nature of regulatory network evolution. Exapted networks must initially startwith the random distribution of elements that exists prior to selection. Therefore,recently evolved networks will tend to regulate more genes than the phenotyperequires. Over time mutation will remove non-essential genes from the networkas there is no selection for their retention. This predicts that more ancient networkswill be smaller and contain a higher proportion of genes essential for the phenotype.
Many questions remain unanswered about how complex regulatory networksevolve, and the ancient and recent networks identified by the opossum genomewill continue to enhance our understanding of our symbiotic relationship with ourgenomes parasites.
Glossary
N50 The size of scaffold or contig for which half of all bases are in scaffolds orcontigs that are smaller.
Neofunctionalization The mutation of a duplicated copy of a gene to undertake acompletely novel function (distinct from subfunctionalization where the role of thegene in specific tissues, or one function of a multidomain protein is split betweenthe duplicate copies of the gene).
Exaptation The co-option by selection for a new function of a structure thathas evolved under selective pressure for an unrelated function or under neutralconditions with no functional fitness advantage (Gould and Vrba, 1982).
LINE Long Interspersed Nuclear Element, a family of retrotransposons commonin mammals which is transcribed as RNA and intergrates as additional reversetranscribed copies in genome.
References
Bailey JA, Carrel L, Chakravarti A, Eichler EE (2000) Molecular evidence for a relationshipbetween LINE-1 elements and X chromosome inactivation: the Lyon repeat hypothesis. ProcNatl Acad Sci USA 97:6634–6639.
Bejerano G, Lowe CB, Ahituv N, et al. (2006) A distal enhancer and an ultraconserved exon arederived from a novel retroposon. Nature 441:87–90.
7 Insight into Evolution of Gene Regulation Networks from the Opossum Genome 145
Belov K, Sanderson CE, Deakin JE, et al. (2007) Characterization of the opossum immune genomeprovides insights into the evolution of the mammalian immune system. Genome Res 17:982–991.
Britten RJ, Davidson EH (1969) Gene regulation for higher cells: a theory. Science 165:349–357.Brookfield JF (2005a). Evolutionary forces generating sequence homogeneity and heterogeneity
within retrotransposon families. Cytogenet Genome Res 110:383–391.Brookfield JF (2005b). The ecology of the genome – mobile DNA elements and their hosts. Nat
Rev Genet 6:128–136.Carninci P, Kasukawa T, Katayama S, et al. (2005) The transcriptional landscape of the mammalian
genome. Science 309:1559–1563.Carrel L, Willard HF (2005) X-inactivation profile reveals extensive variability in X-linked gene
expression in females. Nature 434:400–404.Chapman MA, Charchar FJ, Kinston S, et al. (2003) Comparative and functional analyses of LYL1
loci establish marsupial sequences as a model for phylogenetic footprinting. Genomics 81:249–259.
Chen JM, Cooper DN, Chuzhanova N, Férec C, Patrinos GP (2007) Gene conversion: mechanisms,evolution and human disease. Nat Rev Genet 8:762–775.
Chung H, Bogwitz MR, McCart C, et al. (2007) Cis-regulatory elements in the Accord retrotrans-poson result in tissue-specific expression of the Drosophila melanogaster insecticide resistancegene Cyp6g1. Genetics 17:1071–1077.
Chimpanzee Sequencing and Analysis Consortium et al. (2005) Initial sequence of the chimpanzeegenome and comparison with the human genome. Nature 437:69–87.
Davidson EH (2006) The Regulatory Genome: Gene Regulatory Networks in Development andEvolution. Academic, Burlington and San Diego.
Duke SE, Samollow PB, Mauceli E, Lindblad-Toh K, Breen M (2007) Integrated cytogenetic BACmap of the genome of the gray, short-tailed opossum, Monodelphis domestica. ChromosomeRes 15:361–370.
Duret L, Chureau C, Samain S, Weissenbach J, Avner P (2006) The Xist RNA gene evolved ineutherians by pseudogenization of a protein-coding gene. Science 312:1653–1655.
Elder JF Jr, Turner BJ (1995) Concerted evolution of repetitive DNA sequences in eukaryotes.Q Rev Biol 70:297–320.
Emes RD, Goodstadt L, Winter EE, Ponting CP (2003) Comparison of the genomes of human andmouse lays the foundation of genome zoology. Hum Mol Genet 12:701–709.
Feschotte C (2008) Transposable elements and the evolution of regulatory networks. Nat Rev Genet9:397–405.
Gentles AJ, Wakefield MJ, Kohany O, et al., (2007) Evolutionary dynamics of transposableelements in the short-tailed opossum Monodelphis domestica. Genome Res 17:992–1004.
Gibbs RA, Weinstock GM, Metzker ML, et al. (2004) Genome sequence of the Brown Norway ratyields insights into mammalian evolution. Nature 428:493–521.
Goodstadt L, Heger A, Webber C, Ponting CP (2007) An analysis of the gene complement of a mar-supial, Monodelphis domestica: evolution of lineage-specific genes and giant chromosomes.Genome Res 17:969–981.
Gould SJ, Vrba ES (1982) Exaptation; a missing term in the science of form. Paleobiology 8:4–15.Graves JAM (1995) The evolution of mammalian sex chromosomes and the origin of sex
determining genes. Philos Trans R Soc Lond B Biol Sci 350:305–311.Hore TA, Koina E, Wakefield MJ, Graves JAM (2007) The region homologous to the
X-chromosome inactivation centre has been disrupted in marsupial and monotreme mammals.Chromosome Res 15:147–161.
Huttley GA, Jakobsen IB, Wilson SR, Easteal S (2000) How important is DNA replication formutagenesis? Mol Biol Evol 17:929–937.
IHGSC (2004) Finishing the euchromatic sequence of the human genome. Nature 431:931–945.Kamal M, Xie X, Lander ES (2006) A large family of ancient repeat elements in the human genome
is under strong selection. Proc Natl Acad Sci USA 103:2740–2745.
146 M.J. Wakefield and A.T. Papenfuss
Koina E, Chaumeil J, Greaves IK, Tremethick DJ, Graves JA (2009) Specific patterns of histonemarks accompany X chromosome inactivation in a marsupial. Chromosome Res 17:115–126.
Lander ES, Linton LM, Birren B, et al. (2001) Initial sequencing and analysis of the humangenome. Nature 409:860–921.
Lindblad-Toh K, Wade CM, Mikkelsen TS, et al. (2005) Genome sequence, comparative analysisand haplotype structure of the domestic dog. Nature 438:803–819.
Lindsay H, Yap VB, Ying H, Huttley GA (2008) Pitfalls of the most commonly used models ofcontext dependent substitution. Biol Direct 3:52.
Lyon MF (1998) X-chromosome inactivation: a repeat hypothesis. Cytogenet Cell Genet 80:133–137.
Mahadevaiah SK, Royo H, VandeBerg JL, McCarrey JR, Mackay S, Turner JM (2009) Key fea-tures of the X inactivation process are conserved between marsupials and eutherians. Curr Biol19:1478–1484.
Margulies EH, NISC Comparative Sequencing Program, Maduro VV, et al. (2005) Comparativesequencing provides insights about the structure and conservation of marsupial and monotremegenomes. Proc Natl Acad Sci USA 102:3354–3359.
Mattick JS (2003) Challenging the dogma: the hidden layer of non-protein-coding RNAs incomplex organisms. Bioessays 25:930–939.
McClintock B (1950) The origin and behavior of mutable loci in maize. Proc Natl Acad Sci USA36:344–355.
Mikkelsen TS, Wakefield MJ, Aken B, et al. (2007) Genome of the marsupial Monodelphisdomestica reveals innovation in non-coding sequences. Nature 447:167–177.
Mouse Genome Sequencing Consortium Waterston RH, Lindblad-Toh K, et al. (2002) Initialsequencing and comparative analysis of the mouse genome. Nature 420:520–562.
Nishihara H, Smit AF, Okada N (2006) Functional noncoding sequences derived from SINEs inthe mammalian genome. Genome Res 16:864–874.
Rehwinkel J, Behm-Ansmant I, Gatfield D, Izaurralde E (2005) A crucial role for GW182 and theDCP1:DCP2 decapping complex in miRNA-mediated gene silencing. RNA 11:1640–1647.
Sado T, Fenner MH, Tan SS, Tam P, Shioda T, Li E (2000) X inactivation in the mouse embryo defi-cient for Dnmt1: distinct effect of hypomethylation on imprinted and random X inactivation.Dev Biol 225:294–303.
Samollow PB, Gouin N, Miethke P, et al. (2007) A microsatellite-based, physically anchoredlinkage map for the gray, short-tailed opossum (Monodelphis domestica). Chromosome Res15:269–281.
Shannon M, Hamilton AT, Gordon L, Branscomb E, Stubbs L (2003) Differential expansion ofzinc-finger transcription factor loci in homologous human and mouse gene clusters. GenomeRes 13:1097–1110.
Silva JC, Shabalina SA, Harris DG, Spouge JL, Kondrashovi AS (2003) Conserved fragments oftransposable elements in intergenic regions: evidence for widespread recruitment of MIR- andL2-derived sequences within the mouse and human genomes. Genet Res 82:1–18.
Turner JM, Mahadevaiah SK, Elliott DJ, et al. (2002) Meiotic sex chromosome inactivation in malemice with targeted disruptions of Xist. J Cell Sci 115:4097–4105.
Wakefield MJ, Graves JAM (2003) The kangaroo genome. Leaps and bounds in comparativegenomics. EMBO Rep 4:143–147.
Wakefield MJ, Graves JAM (2005) Marsupials and monotremes sort genome treasures from junk.Genome Biol 6:218.
Wakefield MJ, Keohane AM, Turner BM, Graves JA (1997) Histone underacetylation is anancient component of mammalian X chromosome inactivation. Proc Natl Acad Sci USA 94:9665–9668.
Wang Z, Willard HF, Mukherjee S, Furey TS (2006) Evidence of Influence of Genomic DNASequence on Human X Chromosome Inactivation. PLoS Comput Biol 2:e113.
Warren WC, Hillier LW, Graves JAM, et al. (2008) Genome analysis of the platypus reveals uniquesignatures of evolution. Nature 453:175–183.
Part IVMarsupial Sex Chromosomes
Paul D. Waters
Comparing sex chromosome systems between distantly related mammalian specieshas been a powerful tool in helping to solve mysteries surrounding the origin andevolution of the mammal X and Y. Comparisons of model eutherian sex chromo-somes (generally human and mouse) with the sex chromosomes of distantly relatedmarsupial representatives have revealed many similarities, but also some strikingdifferences. Although much of the eutherian X chromosome is homologous to themarsupial X, there is a region of the eutherian X (generally most of the short arm)that is autosomal in marsupials, indicating that the eutherian sex chromosomes wereaugmented by an addition prior to eutherian radiation (Graves, 1995), and accountsfor the size difference observed between the eutherian (∼5% of the haploid genome)and marsupial (∼3% of the haploid genome) Xs.
In this part, Patel and colleagues (Chapter 8) review the structure of the marsu-pial X chromosome, which has become possible at the sequence level thanks to therelease of the opossum (Monodelphis domestica) genome (Mikkelsen et al., 2007)and upcoming release of the tammar wallaby genome. In contrast to the eutherianX chromosome, which is well conserved across almost all eutherian lineages, theX chromosomes of American and Australian marsupials have suffered several inde-pendent rearrangements (Deakin et al., 2008). Hemizygosity (one copy) of the X inmales, and meiotic sex chromosome inactivation (MSCI), have been major forcesin shaping the gene content of the X chromosome, which happens to be enrichedfor genes involved in brain development and reproduction. In Chapter 9, Delbridgeexamines the gene content of the X chromosome and discusses how these forceshave resulted in gene trafficking to and from the X, and how the X might possiblybe involved in speciation.
It is now apparent that the therian mammal (eutherian and marsupial) sexchromosomes arose after monotremes diverged from therians, but before therianradiation (Veyrunes et al., 2008). As different as the X and Y chromosomes are intherian mammals, they evolved from an homologous pair of autosomes after theY obtained the dominant male determining gene SRY. Genes beneficial to malesaccumulated near this new testis-determining factor (TDF), and recombination wassuppressed with the X so that this cassette of male beneficial genes was only everinherited with the TDF. In the absence of recombination, mutated Y chromosomes
148 Part IV Marsupial Sex Chromosomes
in the population could not be repaired by recombination with the X, and the Ybegan to lose gene function and degrade.
In eutherian mammals all that remains of once extensive homology between theX and Y is small pseudoautosomal region (PAR). Within this PAR there is an obliga-tory recombination event at male meiosis, which is responsible for the proper pairingand segregation of the X and Y. However, marsupial sex chromosomes do not havea PAR, instead pairing and segregation of the X and Y during male meiosis is con-trolled by a completely different mechanism. Fernández-Donoso and colleagues(Chapter 10) review the intriguing process whereby proteins involved in synap-tanemal complex formation (Page et al., 2006) come together to form a structurecalled the dense plate, which associates with the X and Y, and controls their propersegregation into daughter cells.
The final chapter of this part, by Murtagh et al., reviews the marsupial Y chro-mosome and Y chromosome evolution. This chromosome is generally small ineutherian mammals, and often minute (10 Mb) in marsupials. As such the mar-supial Y has been suggested to represent the minimal mammalian Y (Toder et al.,2000). Although genome sequence is available for two marsupial species, there islittle information about the Y because females were chosen for sequencing to avoidthe problems associated with Y chromosome assembly. Murtagh and colleaguesdescribe current knowledge of the novel gene content of the tammar wallaby Ychromosome. All genes so far discovered on the wallaby Y have partners on the Xthat, interestingly, almost all have a role in the vertebrate brain or central nervoussystem. Most genes on the marsupial Y are missing from the eutherian Y, and prob-ably gained male-specific functions only in marsupials. There are only a few genesconserved on the Y chromosome of all therian mammals, an obvious example beingthe testis-determining factor SRY.
The four chapters in this part highlight the importance of data gathered froma range of distantly related mammals, and other vertebrates, in understanding thestructure and organization of sex chromosomes. There is a shortfall in Y chro-mosome sequence data from a host of mammalian species, and completed Xchromosome assemblies are missing from many species. Filling in these gaps iscritical to a deeper understanding of sex chromosome evolution.
References
Deakin JE, Koina E, Waters PD, et al. (2008) Physical map of two tammar wallabychromosomes: a strategy for mapping in non-model mammals. Chromosome Res16:1159–1175.
Graves JAM (1995). The origin and function of the mammalian Y chromosome andY-borne genes – an evolving understanding. Bioessays 17:311–320.
Mikkelsen TS, Wakefield MJ, Aken B, et al. (2007) Genome of the marsupialMonodelphis domestica reveals innovation in non-coding sequences. Nature447:167–177.
Part IV Marsupial Sex Chromosomes 149
Page J, Viera A, Parra MT, et al. (2006) Involvement of synaptonemal complexproteins in sex chromosome segregation during marsupial male meiosis. PLoSGenet 2:e136.
Toder R, Wakefield MJ, Graves JAM (2000) The minimal mammalian Y chromo-some – the marsupial Y as a model system. Cytogenet Cell Genet 91:285–292.
Veyrunes F, Waters PD, Miethke P, et al. (2008) Bird-like sex chromosomesof platypus imply recent origin of mammal sex chromosomes. Genome Res18:965–973.

Chapter 8Organization and Evolution of the MarsupialX Chromosome
Hardip R. Patel, Margaret L. Delbridge, and Jennifer A.M. Graves
Abstract Marsupial genomics and genetics provide invaluable data forcomparative analysis because these mammals are distantly related cousins ofhumans and other eutherian mammals (∼148 million years), but they are moreclosely related to eutherians compared to monotremes (∼166 million years) andbirds (∼310 million years). This divergence time places them uniquely on thephylogenetic tree whereby comparative gene mapping and genome sequences ofmarsupials enable us to trace the evolution of the therian X chromosome. It is shownby comparative gene mapping that the marsupial X chromosome is homologous tothe long arm and pericentric region of the short arm of the human X chromosome(X conserved region). However, it is homologous to autosomes in the platypusand the chicken, suggesting that a novel XY system evolved in therian mammalsafter they diverged from monotremes 166 million years ago but before marsupialsdiverged from eutherians 148 million years ago. Apart from the X conservedregion, eutherian mammals have an autosomal addition on the X chromosome (Xadded region) since their divergence from marsupials. Although the marsupial Xchromosome is similar in composition to that of the eutherian X chromosome, ithas accumulated numerous rearrangements, has become GC rich and has acquireda higher synonymous substitution rate since divergence of marsupial and eutherianmammals. Similarly, the marsupial X chromosome undergoes X inactivation likeeutherian mammals, but the mechanisms, which regulates X inactivation, is verydifferent from that observed in eutherian mammal, and may be the ancestral state.The XIST gene responsible for X inactivation in eutherian mammals is absent fromthe marsupial lineage suggesting that the evolution of XIST in early eutheriansset up selection for accumulation of LINE sequences that aided the spread of Xinactivation. Unlike the LINE accumulation on the eutherian X chromosome, themarsupial X has accumulated and expanded a microRNA family that could beinvolved in the marsupial X inactivation. This chapter provides a comprehensive
H.R. Patel (B)ARC Centre for Kangaroo Genomics, Evolution, Ecology and Genetics, Research School ofBiology, The Australian National University, Canberra, ACT 0200, Australiae-mail: [email protected]
151J.E. Deakin et al. (eds.), Marsupial Genetics and Genomics,DOI 10.1007/978-90-481-9023-2_8, C© Springer Science+Business Media B.V. 2010
152 H.R. Patel et al.
review of the organization and evolution of the marsupial X chromosome and theimplications this may have for X inactivation.
Keywords Chromosome painting · Comparative genomics · Genome evolu-tion · Karyotype · Sex chromosomes
8.1 Introduction
Sex chromosomes have evolved multiple times during the vertebrate evolution.In other words, different vertebrate groups have different sex chromosome pairsharbouring genes that trigger genetic sex determination (GSD) of the embryo.Mammals subscribe to a conserved XY system of male heterogamety in which theSRY gene on the Y chromosome is the male-determining gene at least in therianmammals. In contrast, birds and snakes show a ZW system of female heterogamety,although their ZW pairs are non-homologous. Similarly, many different speciesof fish, amphibians and reptiles exhibit either XY or ZW systems. Although sexchromosomes are strongly dimorphic (morphologically distinguishable) in mam-mals and birds, they are homomorphic (morphologically and genetically similarto each other) in many fish and amphibians with GSD. It should be noted thatsome fish and reptilian species determine sex via environmental cues such astemperature (ESD – environmental sex determination or TSD – temperature sexdetermination).
These quite different sex chromosome systems are the result of independent butparallel evolutionary processes. First a novel sex-determining locus is acquired onone member of a pair of autosomes. This is followed by accumulation of sex-specificgenes that confer an advantage to the heterogametic sex, and then homologousrecombination is decreased in this region by selection for the preservation of a sex-specific block of genes (Rice, 1987b). The result is progressive degeneration of thesex-specific element (Y or W) (reviewed in Graves, 2006).
For instance, in mammals, acquisition of the testis-determining SRY gene on aproto-Y chromosome was followed by accumulation of male-advantage (e.g. sper-matogenesis) genes to favour male fitness. This non-recombining region accumu-lated deletions as well as beneficial mutations because variation on the male-specificY is high and selection is inefficient (Muller, 1918; Charlesworth, 1978). The degra-dation of the Y chromosome is exacerbated by a one-way genetic drift (“Muller’sratchet”; Felsenstein, 1974) and inefficient selection on a non-recombining chromo-some (“genetic hitchhiking”; Rice, 1987a; Graves, 2006). On an evolutionary timescale, the proto-Y chromosome becomes fixed for male beneficial recessive allelesat several loci and the rest of the Y degenerates by deletion and accumulation ofrepetitive sequences, becoming the small heterochromatic Y chromosome that weobserve in all mammals.
This evolutionary history explains why the eutherian X and Y chromosomes areso different in size, gene content and function. In humans and other eutherians, the Xchromosome is a medium-sized chromosome, bearing more than 1,000 genes with
8 Organization and Evolution of the Marsupial X Chromosome 153
a wide range of functions. It is highly conserved among eutherians, amounting toabout 5% of the haploid genome and bearing essentially the same suite of genes, aspredicted by Ohno (1967). The Y chromosome on the other hand is much smaller,heterochromatic, and bears few active protein-coding genes (45, of which 27 arein the male-specific region), which are largely devoted to male-specific functions.Although the X and Y are so different, relics of ancient homology are apparentin the short pseudoautosomal region, in which the X and Y pair and recombine atmeiosis (Rappold, 1993; Graves et al., 1998), and presence of the X copies of Ygenes (Skaletsky et al., 2003).
Comparative gene mapping in fish, birds, reptiles, monotremes, marsupials andeutherians have shown that sex chromosomes have evolved independently from dif-ferent autosomes in different vertebrate lineages. Thus sex-determining loci wereacquired by different autosomes at different time points during evolution (Ohno,1967; Veyrunes et al., 2008; Delbridge et al., 2009). The analysis of the marsu-pial sex chromosomes has been crucial to our understanding of the evolution ofmammalian X and Y chromosomes.
8.2 Marsupial Karyotypes and Sex Chromosomes
The marsupial Y chromosome harbours an SRY gene (Foster et al., 1992), which isthought to be the male-determining gene, although direct evidence from sex rever-sal or transgenesis is lacking. Marsupial sex chromosomes are generally smallerthan eutherian sex chromosomes because eutherian sex chromosomes are fused withan autosomal region since their divergence from marsupials 148 million years ago(MYA) (Spencer et al., 1991a; Graves, 1995).
The karyotype of marsupials is extraordinarily well conserved, even betweenAmerican and Australian marsupials that diverged 83 MYA (see Rens and Ferguson-Smith, Chapter 2). Chromosome painting shows that marsupial karyotypes canbe divided into 19 blocks of conserved synteny even between the most divergentkaryotypes (2n = 10/11 to 2n = 32) (Rens et al., 2003). A common 2n = 14karyotype was probably ancestral to Australian marsupials and through a seriesof centric fusion rearrangements, these 19 blocks of conserved synteny make upthe diverse karyotype observed in different marsupial species (Rofe and Hayman,1985; Svartman and Vianna-Morgante, 1998).
Chromosome painting revealed that the euchromatic region of the marsupial Xchromosome is completely conserved between marsupial species (Glas et al., 1999a;Rens et al., 2003). Exceptions are species with large heterochromatic additions to theX (e.g. Macropus parryi and Antechinus apicalis) (Young et al., 1982), or the manyspecies in which there have been translocations or fusions between sex chromo-somes and autosomes (Toder et al., 1997a). X-autosome fusions and translocationare observed also in eutherians such as short-tailed bats and several mouse species(Jacobs, 2004; Noronha et al., 2009), but they seem to be particularly widespreadin marsupials. For instance the swamp wallaby Macropus bicolor has a karyotypeof 2n = 10 in females and 2n = 11 in males due to an XY1Y2 system generated
154 H.R. Patel et al.
by fusion of the ancestral X to an autosome, leaving an unpaired autosome thatis homologous to tammar wallaby chromosomes 2 and 7 (Toder et al., 1997a). Atdiplotene of male meiosis in an XY1Y2 system, the fused autosomal region on theX forms chiasmata with the unpaired autosome (Y2). Y1 and Y2 chromosomes seg-regate towards one pole and the X chromosome towards the opposite pole, ensuringthe production of balanced gametes.
8.3 Marsupial X Chromosome Structure and Organization
Early studies of marsupial sex chromosomes focused on their size, morphology,and visible landmarks such as the pairing segment and the nucleolar organi-zing region. More recently, gene mapping and chromosome painting have beenused to investigate organization and homology. The ultimate information on theX chromosome has been gathered from the genome sequence of representativemarsupial species, the opossum (Monodelphis domestica) representing Americanmarsupials, and the model kangaroo, tammar wallaby (Macropus eugenii), rep-resenting Australian marsupials. These two species represent the most distantlyrelated clades of the marsupials that last shared a common ancestor ∼83 MYA(Bininda-Emonds et al., 2007). Therefore, phylogenetically they are approximatelyas closely related to each other, as are human and mice. The opossum genomewas sequenced to approximately 6× coverage and most large contigs have beenassigned to chromosomes (Mikkelsen et al., 2007). The tammar wallaby genomehas been sequenced to approximately 2× coverage and has been recently assem-bled into contigs of ∼2,600 bp N50 size, most of which are yet to be assigned tochromosomes.
8.3.1 X Chromosome Size and Gene Content
The marsupial X chromosome is smaller than the X of humans and other eutherians(Hayman et al., 1982). The human X is about 155 Mb (∼5% of the haploid genome)and harbours about 1,000 protein-coding genes. In contrast, the marsupial X is about80 Mb (∼3%) and harbours 442 genes. The marsupial Y can be as small as 10 Mb(Toder et al., 2000), and to date has seven genes assigned to it (reviewed Murtaghet al., Chapter 11).
The conserved region of the human X chromosome (XCR), which is equivalent tothe marsupial X chromosome, contains 678 protein-coding genes compared to 442protein-coding genes on the opossum X chromosome (Hubbard et al., 2009). Partof the discrepancy is accounted for by the expansion in primates of the cancer/testisantigen gene family, which contains approximately 100 members in the human XCRregion (Ross et al., 2005; Delbridge and Graves, 2007). The human XCR and theopossum X chromosome share at least 322 orthologous genes (Vilella et al., 2009)supporting the hypothesis that most genes on the therian X chromosome are wellconserved.
8 Organization and Evolution of the Marsupial X Chromosome 155
8.3.2 The Marsupial X Chromosome Centromere
Differences in centromere position make the marsupial X quite variable morpho-logically between species. For instance, the X chromosome is metacentric in somespecies of opossums (genus Gracilinanus), submetacentric in the slender mouseopossum (Marmosops parvidens) and the tammar wallaby (M. eugenii), and acro-centric in the water opossum (Chironectes minimus) (Yunis et al., 1972; Glas et al.,1999b; Carvalho et al., 2002).
The centromere plays a critical role during cell division by participating inkinetechore formation and attachment to the spindle, ensuring regular segregation.Disturbance in centromere function results in improper segregation of the chromo-somes during division, which can result in aneuploidy. In eukaryotes, centromeresare made up of arrays of repetitive DNA sequences called satellite DNA (Craiget al., 1999; see also Carone and O’Neill, Chapter 3). In most marsupial species,the X chromosome contains a heterochromatic centromere that stains positive byC-banding (Bulazel et al., 2006). The amounts of heterochromatin differ greatlybetween species (e.g. the almost identical 2n = 14) karyotypes of dasyurids aregreatly different in heterochromatin content (Young et al., 1982).
The DNA component of marsupial centromeres is now well understood inkangaroos (Bulazel et al., 2006). For instance, the centromeric sequences of allchromosomes in the red-necked wallaby (Macropus rufogriseus) are made up ofan α-like satellite, Mrb-sat23 (178 bp AT-rich repeat unit). The sex chromosomesharbour two additional repeats Mrb-sat1 (342 bp AT-rich repeat unit) and Mrb-B29(very short AT-rich tandem repeats). The Mrb-sat1 sequence is specific to the Xchromosome, but is not confined to its centromere; it also extends into the shortand long arm of the chromosome. Mrb-B29 localizes to the whole Y chromosome,the centromere of the X chromosome and the pericentric region of chromosome 2.The Mrb-sat23 sequence is found on all chromosomes, including the centromere andpericentric region of the X chromosome, and is extensively amplified on the Y chro-mosome. It contains a CENP-B DNA binding domain (CENP-B box), which maybind the CENP-B protein associated with kinetechore formation. The role of thecentromeric X and the Y shared repeats in marsupials needs further investigation.
8.3.3 Absence of Pseudoautosomal Region
During meiosis, homologous chromosomes pair synapse and undergo recombina-tion. In eutherian mammals a small terminal region of homology is shared by theX and Y chromosomes, which pair to form obligatory chiasma during meiosis(Burgoyne, 1982). Segments of the X chromosome that pair with the Y chromosomeescape X inactivation in females. Since they behave much like autosomes, they arecalled pseudoautosomal regions (PARs). There is an obligate crossover within thissmall region (2.6 Mb in humans), so the recombination rate is extremely high inmales, but not in females.
156 H.R. Patel et al.
Surprisingly, marsupial sex chromosomes have no homologous pseudo-autosomal region, although the X and the Y chromosome may share heterochro-matic regions (Toder et al., 1997b; Graves et al., 1998) and there are at least fivegenes shared between the X and Y chromosomes in tammar wallaby (Delbridgeet al., 1997; Pask et al., 2000; Waters et al., 2001). Despite the lack of a PAR, mar-supial sex chromosomes are seen to pair end-to-end before pachytene of meiosis,and they segregate correctly (Sharp, 1982). However, no synaptonemal complex ispresent, and the observation that either end of the chromosome can participate inthis pairing (Page et al., 2003) indicates that pairing does not depend on regions ofhomology between the X and Y chromosome. Instead, the segregation of marsupialX and Y chromosomes during meiosis is achieved by structural and biochemicalmodifications of axial elements of the sex chromosomes (discussed in detail byFernández-Donoso et al., Chapter 10).
8.3.4 Nucleolus Organizer Region (NOR)
Some marsupial species have a heterochromatic nucleolar organizer region on the Xchromosome, which gives the appearance of a secondary constriction and satellite(Johnston et al., 1984; Dhaliwal et al., 1988; Alsop et al., 2005). NORs containtandem repeats of ribosomal RNA (rRNA) genes, and they participate in nucleolusformation and ribosome synthesis during cell growth.
The NOR on the X chromosome is very evident in unbanded chromosome prepa-rations of all the kangaroos (Family Macropodidae), and several South Americanspecies including the opossum M. domestica (Graves, 1967; Johnston et al., 1984;Hayman, 1990; Schmid et al., 2002; Alsop et al., 2005). In other Australian mar-supials, such as the dasyurids, the NOR is on a small satellited short arm ofchromosome 5. It has been proposed that the X and chromosome 5 of an ances-tral kangaroo about 20 MYA underwent Robertsonian translocation, to place theNOR on the X chromosome in the entire family (Toder et al., 1997b).
There appears to be no nucleolus organizer on the kangaroo Y chromosome,except perhaps in the pretty face wallaby, so that females have twice as many rDNAgenes as males (Robins et al., 1984). Since ribosome number greatly affects growth,it might be expected that some dosage compensation system operate to equalizethe dose of ribosomal genes in males and females. Indeed, the morphology of theNORs, which is indicative of transcriptionally active or inactive NORs, on the twoX chromosomes in females is strikingly different (Graves, 1967; Alsop et al., 2005).However, silver staining, which visualises the protein component on metaphasechromosomes shows that the NOR is actively transcribed from both X chromosomesin female kangaroos (Dhaliwal et al., 1988) and in female opossums (Merry et al.,1983; Svartman and Vianna-Morgante, 2003), suggesting that this region escapesX-inactivation and the dose of rRNA is not equal between males and females. Inmany other species (e.g. frogs, platypus), the NOR-bearing autosome is regularlydimorphic, but both appear to be active, so it is likely that the NOR on the marsupialX is regulated by some separate and very ancient mechanism.
8 Organization and Evolution of the Marsupial X Chromosome 157
8.3.5 Repeated Sequences and Isochore Structure of the MarsupialX Chromosome
Isochores are defined as stretches of DNA with a homogenous base composition(such as high GC), and examining changes in the conservation of isochores canbe used to trace evolutionary changes in chromosomes. Vertebrate genomes aremosaics of isochores, and the base composition of isochores reflects the base com-position of the coding sequences present in these isochores. Isochore structuresare observed in mammalian, avian and even crocodilian genomes, suggesting thegenomes of these groups can be compartmentalized into stretches of homogenousbase compositions (Bernardi, 2000; Chojnowski et al., 2007). Isochore struc-tures can be determined by analysing genomic DNA sequences (Costantini et al.,2006).
The human X chromosome contains relatively low GC (39%) compared tothe genome average of 41% (Ross et al., 2005). A low GC content is correlatedwith a low gene density and low substitution rate, which is consistent with thehuman X being a comparatively gene-poor chromosome. In contrast, the opossumX chromosome contains an unusually high GC content. The GC content of the Xchromosome (40.9%) is significantly higher than the average of autosomal DNA(37.7%) (Mikkelsen et al., 2007).
The human X chromosome can be divided into 175 isochores (122 in XCR and53 in XAR) that belong to five major families viz. L1 = ≤36.5% GC, L2 = 36.5–40.5% GC, H1 = 40.5–46.5% GC, H2 = 46.5–53.5% GC, and H3 = >53.5% GC(Fig. 8.1) (Costantini et al., 2006; Costantini et al., 2009). The human XCR con-tains 47 isochores belonging to H1, H2 and H3 families, and covering 24.9 Mb ofthe human X chromosome. On the other hand, the opossum X chromosome can bedivided into 104 isochores (Costantini et al., 2009). Given that the opossum X chro-mosome is entirely homologous to the human X conserved region (XCR), it wouldbe expected that the number of isochores on the opossum X chromosome wouldbe the same as for the conserved region of the human X. The difference betweenthe numbers of isochores on the opossum X (104) and the human XCR (122) areinconsistent with the expectation that isochore structures are preserved during evo-lution. The opossum X chromosome contains 54 isochores belonging to H1, H2 andH3 family covering 33.5 Mb of the opossum X chromosome. This is more than onthe human X (47 covering 24.9 Mb), suggesting that the opossum X chromosomecontains more high GC content regions than the human XCR.
What does this difference in isochore structure imply? Does this higher GCcontent imply more CpG islands in the promoter regions of the opossum X chro-mosome genes? It will be important to study the correlation between higher GCcontent of the opossum X chromosome with the CpG island density, and subse-quently the methylation patterns to examine if the marsupial X inactivation processis controlled by epigenetic factors like DNA methylation of the CpG islands in thepromoter region (Hellman and Chess, 2007) (see Al Nadaf et al., Chapter 13 fordetails on the role of DNA methylation as a mechanism of X inactivation and dosagecompensation).
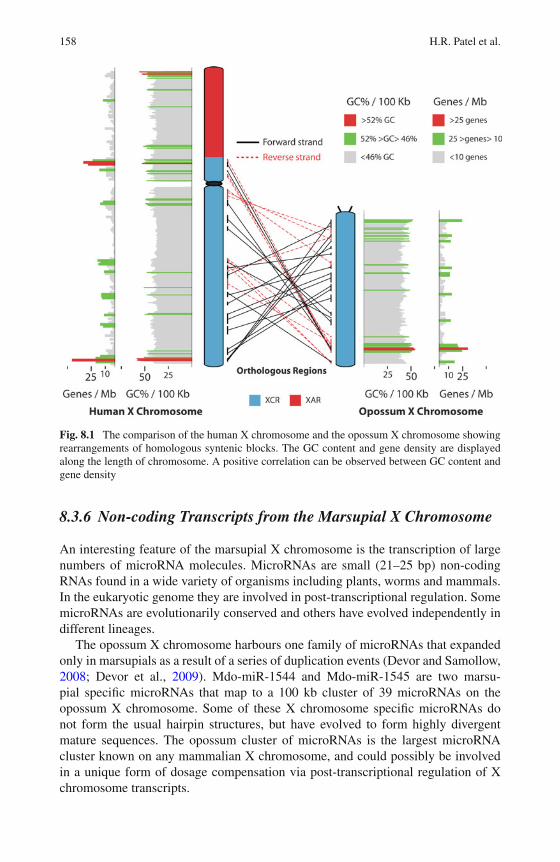
158 H.R. Patel et al.
Fig. 8.1 The comparison of the human X chromosome and the opossum X chromosome showingrearrangements of homologous syntenic blocks. The GC content and gene density are displayedalong the length of chromosome. A positive correlation can be observed between GC content andgene density
8.3.6 Non-coding Transcripts from the Marsupial X Chromosome
An interesting feature of the marsupial X chromosome is the transcription of largenumbers of microRNA molecules. MicroRNAs are small (21–25 bp) non-codingRNAs found in a wide variety of organisms including plants, worms and mammals.In the eukaryotic genome they are involved in post-transcriptional regulation. SomemicroRNAs are evolutionarily conserved and others have evolved independently indifferent lineages.
The opossum X chromosome harbours one family of microRNAs that expandedonly in marsupials as a result of a series of duplication events (Devor and Samollow,2008; Devor et al., 2009). Mdo-miR-1544 and Mdo-miR-1545 are two marsu-pial specific microRNAs that map to a 100 kb cluster of 39 microRNAs on theopossum X chromosome. Some of these X chromosome specific microRNAs donot form the usual hairpin structures, but have evolved to form highly divergentmature sequences. The opossum cluster of microRNAs is the largest microRNAcluster known on any mammalian X chromosome, and could possibly be involvedin a unique form of dosage compensation via post-transcriptional regulation of Xchromosome transcripts.
8 Organization and Evolution of the Marsupial X Chromosome 159
8.3.7 Gene Maps and Evolution of Marsupial Sex Chromosomes
Chromosome painting and gene mapping have been used to investigate homol-ogy between X chromosomes of different species. Physical localization of DNAfragments containing known genes has been accomplished by fluorescent in situhybridisation (FISH), in which large insert bacterial artificial chromosomes (BAC)clones are tagged with a fluorochrome and hybridized to homologous sequences inchromosomes immobilized on a microscope slide. This technique has been used tomap 73 genes onto the tammar wallaby X chromosome and compare gene contentand order with the chromosomes of opossum, other mammals and other vertebrates(Deakin et al., 2008).
8.3.7.1 Identification of Evolutionary Layers on the EutherianX Chromosome
Comparisons between the gene content of the human and marsupial X providedthe first clues that the human X is composed of two distinct evolutionary lay-ers. Marsupials (metatherian mammals) diverged from eutherian mammals 148MYA (Bininda-Emonds et al., 2007). Therian mammals (marsupials and eutheri-ans) shared a common ancestor with monotreme mammals 168 MYA. This deepdivergence allowed an examination of the origin of the mammalian X chromosome.
The eutherian X chromosome is exceptionally conserved in gene content, as orig-inally proposed by “Ohno’s Law”. Comparative gene mapping confirmed that theeutherian X chromosome has a virtually identical gene content in species as diverseas human, mouse, horse, cat, cow and elephant (Murphy et al., 1999; Band et al.,2000; Swinburne et al., 2006; Rodriguez Delgado et al., 2009).
Early comparative gene mapping showed that ten genes from the long arm ofthe human X chromosome (Xq) were also located on the X chromosome in dif-ferent species of marsupials, consistent with Ohno’s Law (Spencer et al., 1991b).The conservation of the therian X chromosome was also illustrated by chromosomepainting using a fluorochrome labelled tammar wallaby X chromosome probe thathybridized to the long arm and the pericentric region of the short arm of the humanX chromosome (Glas et al., 1999a). These gene mapping and chromosome paintingstudies have shown that the long arm of the human X chromosome is conserved onthe X chromosome of all therian mammals (marsupials and eutherians). The regionhomologous to the marsupial X chromosome in humans is thus referred to as the Xconserved region (XCR) (Graves, 1995).
However, genes from the short arm of the human X chromosome (Xp) wereshown to be autosomal in marsupials (Spencer et al., 1991a) suggesting that eitherthe X chromosome of eutherian mammals gained an autosomal region, or marsupi-als lost part of the X chromosome after the marsupials and eutherian mammals split148 MYA (Graves, 1995).
Further insight into the origins of the therian X were gained by comparative genemapping in platypus, one of the three extant species of monotreme mammal, whosegenome was recently sequenced (Warren et al., 2008). These studies confirmedthat the XCR region of the eutherian X chromosome is entirely conserved on the
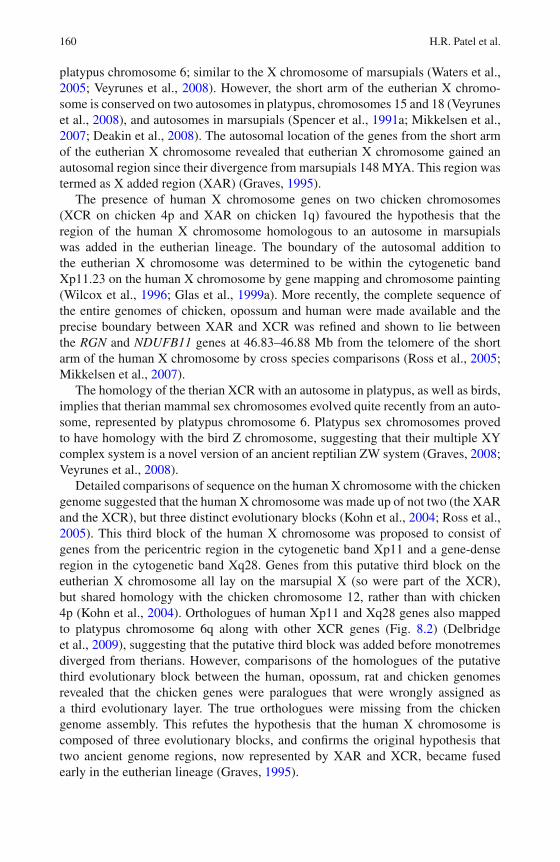
160 H.R. Patel et al.
platypus chromosome 6; similar to the X chromosome of marsupials (Waters et al.,2005; Veyrunes et al., 2008). However, the short arm of the eutherian X chromo-some is conserved on two autosomes in platypus, chromosomes 15 and 18 (Veyruneset al., 2008), and autosomes in marsupials (Spencer et al., 1991a; Mikkelsen et al.,2007; Deakin et al., 2008). The autosomal location of the genes from the short armof the eutherian X chromosome revealed that eutherian X chromosome gained anautosomal region since their divergence from marsupials 148 MYA. This region wastermed as X added region (XAR) (Graves, 1995).
The presence of human X chromosome genes on two chicken chromosomes(XCR on chicken 4p and XAR on chicken 1q) favoured the hypothesis that theregion of the human X chromosome homologous to an autosome in marsupialswas added in the eutherian lineage. The boundary of the autosomal addition tothe eutherian X chromosome was determined to be within the cytogenetic bandXp11.23 on the human X chromosome by gene mapping and chromosome painting(Wilcox et al., 1996; Glas et al., 1999a). More recently, the complete sequence ofthe entire genomes of chicken, opossum and human were made available and theprecise boundary between XAR and XCR was refined and shown to lie betweenthe RGN and NDUFB11 genes at 46.83–46.88 Mb from the telomere of the shortarm of the human X chromosome by cross species comparisons (Ross et al., 2005;Mikkelsen et al., 2007).
The homology of the therian XCR with an autosome in platypus, as well as birds,implies that therian mammal sex chromosomes evolved quite recently from an auto-some, represented by platypus chromosome 6. Platypus sex chromosomes provedto have homology with the bird Z chromosome, suggesting that their multiple XYcomplex system is a novel version of an ancient reptilian ZW system (Graves, 2008;Veyrunes et al., 2008).
Detailed comparisons of sequence on the human X chromosome with the chickengenome suggested that the human X chromosome was made up of not two (the XARand the XCR), but three distinct evolutionary blocks (Kohn et al., 2004; Ross et al.,2005). This third block of the human X chromosome was proposed to consist ofgenes from the pericentric region in the cytogenetic band Xp11 and a gene-denseregion in the cytogenetic band Xq28. Genes from this putative third block on theeutherian X chromosome all lay on the marsupial X (so were part of the XCR),but shared homology with the chicken chromosome 12, rather than with chicken4p (Kohn et al., 2004). Orthologues of human Xp11 and Xq28 genes also mappedto platypus chromosome 6q along with other XCR genes (Fig. 8.2) (Delbridgeet al., 2009), suggesting that the putative third block was added before monotremesdiverged from therians. However, comparisons of the homologues of the putativethird evolutionary block between the human, opossum, rat and chicken genomesrevealed that the chicken genes were paralogues that were wrongly assigned asa third evolutionary layer. The true orthologues were missing from the chickengenome assembly. This refutes the hypothesis that the human X chromosome iscomposed of three evolutionary blocks, and confirms the original hypothesis thattwo ancient genome regions, now represented by XAR and XCR, became fusedearly in the eutherian lineage (Graves, 1995).
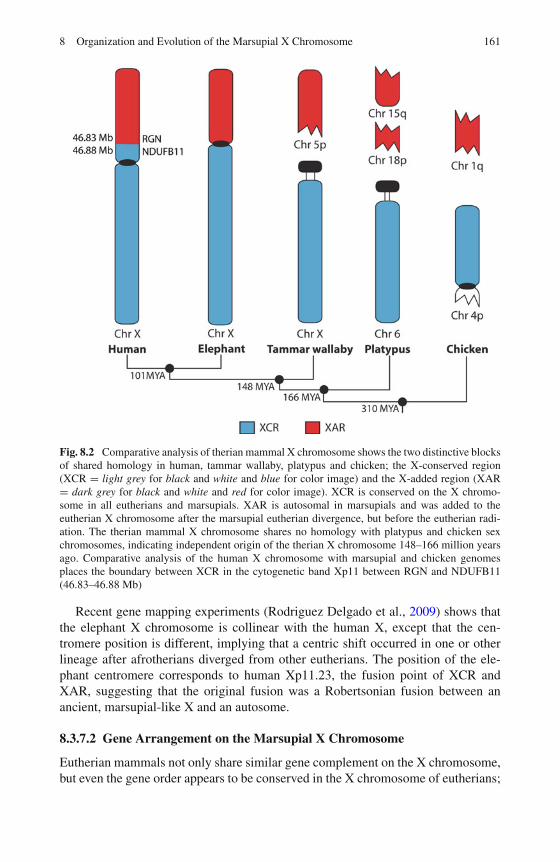
8 Organization and Evolution of the Marsupial X Chromosome 161
Fig. 8.2 Comparative analysis of therian mammal X chromosome shows the two distinctive blocksof shared homology in human, tammar wallaby, platypus and chicken; the X-conserved region(XCR = light grey for black and white and blue for color image) and the X-added region (XAR= dark grey for black and white and red for color image). XCR is conserved on the X chromo-some in all eutherians and marsupials. XAR is autosomal in marsupials and was added to theeutherian X chromosome after the marsupial eutherian divergence, but before the eutherian radi-ation. The therian mammal X chromosome shares no homology with platypus and chicken sexchromosomes, indicating independent origin of the therian X chromosome 148–166 million yearsago. Comparative analysis of the human X chromosome with marsupial and chicken genomesplaces the boundary between XCR in the cytogenetic band Xp11 between RGN and NDUFB11(46.83–46.88 Mb)
Recent gene mapping experiments (Rodriguez Delgado et al., 2009) shows thatthe elephant X chromosome is collinear with the human X, except that the cen-tromere position is different, implying that a centric shift occurred in one or otherlineage after afrotherians diverged from other eutherians. The position of the ele-phant centromere corresponds to human Xp11.23, the fusion point of XCR andXAR, suggesting that the original fusion was a Robertsonian fusion between anancient, marsupial-like X and an autosome.
8.3.7.2 Gene Arrangement on the Marsupial X Chromosome
Eutherian mammals not only share similar gene complement on the X chromosome,but even the gene order appears to be conserved in the X chromosome of eutherians;
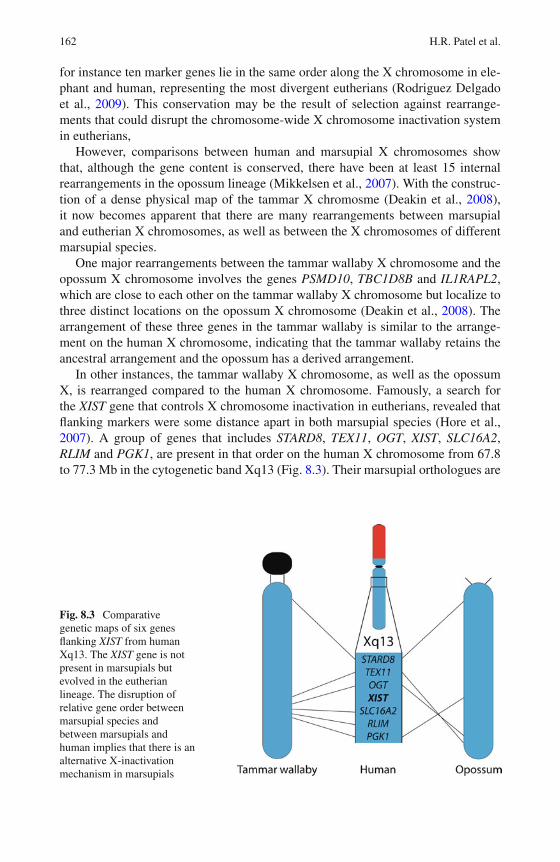
162 H.R. Patel et al.
for instance ten marker genes lie in the same order along the X chromosome in ele-phant and human, representing the most divergent eutherians (Rodriguez Delgadoet al., 2009). This conservation may be the result of selection against rearrange-ments that could disrupt the chromosome-wide X chromosome inactivation systemin eutherians,
However, comparisons between human and marsupial X chromosomes showthat, although the gene content is conserved, there have been at least 15 internalrearrangements in the opossum lineage (Mikkelsen et al., 2007). With the construc-tion of a dense physical map of the tammar X chromosme (Deakin et al., 2008),it now becomes apparent that there are many rearrangements between marsupialand eutherian X chromosomes, as well as between the X chromosomes of differentmarsupial species.
One major rearrangements between the tammar wallaby X chromosome and theopossum X chromosome involves the genes PSMD10, TBC1D8B and IL1RAPL2,which are close to each other on the tammar wallaby X chromosome but localize tothree distinct locations on the opossum X chromosome (Deakin et al., 2008). Thearrangement of these three genes in the tammar wallaby is similar to the arrange-ment on the human X chromosome, indicating that the tammar wallaby retains theancestral arrangement and the opossum has a derived arrangement.
In other instances, the tammar wallaby X chromosome, as well as the opossumX, is rearranged compared to the human X chromosome. Famously, a search forthe XIST gene that controls X chromosome inactivation in eutherians, revealed thatflanking markers were some distance apart in both marsupial species (Hore et al.,2007). A group of genes that includes STARD8, TEX11, OGT, XIST, SLC16A2,RLIM and PGK1, are present in that order on the human X chromosome from 67.8to 77.3 Mb in the cytogenetic band Xq13 (Fig. 8.3). Their marsupial orthologues are
Fig. 8.3 Comparativegenetic maps of six genesflanking XIST from humanXq13. The XIST gene is notpresent in marsupials butevolved in the eutherianlineage. The disruption ofrelative gene order betweenmarsupial species andbetween marsupials andhuman implies that there is analternative X-inactivationmechanism in marsupials
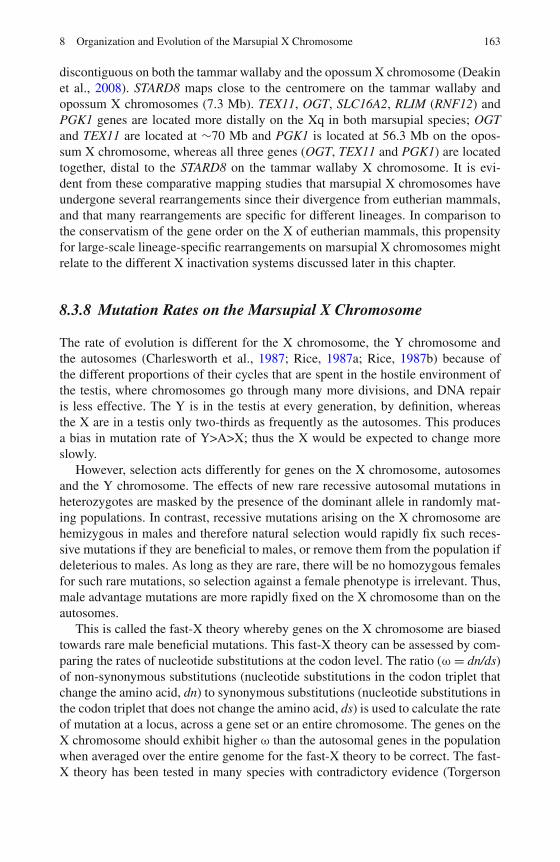
8 Organization and Evolution of the Marsupial X Chromosome 163
discontiguous on both the tammar wallaby and the opossum X chromosome (Deakinet al., 2008). STARD8 maps close to the centromere on the tammar wallaby andopossum X chromosomes (7.3 Mb). TEX11, OGT, SLC16A2, RLIM (RNF12) andPGK1 genes are located more distally on the Xq in both marsupial species; OGTand TEX11 are located at ∼70 Mb and PGK1 is located at 56.3 Mb on the opos-sum X chromosome, whereas all three genes (OGT, TEX11 and PGK1) are locatedtogether, distal to the STARD8 on the tammar wallaby X chromosome. It is evi-dent from these comparative mapping studies that marsupial X chromosomes haveundergone several rearrangements since their divergence from eutherian mammals,and that many rearrangements are specific for different lineages. In comparison tothe conservatism of the gene order on the X of eutherian mammals, this propensityfor large-scale lineage-specific rearrangements on marsupial X chromosomes mightrelate to the different X inactivation systems discussed later in this chapter.
8.3.8 Mutation Rates on the Marsupial X Chromosome
The rate of evolution is different for the X chromosome, the Y chromosome andthe autosomes (Charlesworth et al., 1987; Rice, 1987a; Rice, 1987b) because ofthe different proportions of their cycles that are spent in the hostile environment ofthe testis, where chromosomes go through many more divisions, and DNA repairis less effective. The Y is in the testis at every generation, by definition, whereasthe X are in a testis only two-thirds as frequently as the autosomes. This producesa bias in mutation rate of Y>A>X; thus the X would be expected to change moreslowly.
However, selection acts differently for genes on the X chromosome, autosomesand the Y chromosome. The effects of new rare recessive autosomal mutations inheterozygotes are masked by the presence of the dominant allele in randomly mat-ing populations. In contrast, recessive mutations arising on the X chromosome arehemizygous in males and therefore natural selection would rapidly fix such reces-sive mutations if they are beneficial to males, or remove them from the population ifdeleterious to males. As long as they are rare, there will be no homozygous femalesfor such rare mutations, so selection against a female phenotype is irrelevant. Thus,male advantage mutations are more rapidly fixed on the X chromosome than on theautosomes.
This is called the fast-X theory whereby genes on the X chromosome are biasedtowards rare male beneficial mutations. This fast-X theory can be assessed by com-paring the rates of nucleotide substitutions at the codon level. The ratio (ω = dn/ds)of non-synonymous substitutions (nucleotide substitutions in the codon triplet thatchange the amino acid, dn) to synonymous substitutions (nucleotide substitutions inthe codon triplet that does not change the amino acid, ds) is used to calculate the rateof mutation at a locus, across a gene set or an entire chromosome. The genes on theX chromosome should exhibit higher ω than the autosomal genes in the populationwhen averaged over the entire genome for the fast-X theory to be correct. The fast-X theory has been tested in many species with contradictory evidence (Torgerson
164 H.R. Patel et al.
and Singh, 2003; Thornton et al., 2006; Mank et al., 2007). Specifically, mutationrates in Drosophila spp. do not support the hypothesis that beneficial mutations goto fixation faster on the X chromosome than on other chromosomes, whereas thereis evidence that beneficial mutations are fixed faster on the X chromosome of mam-mals and the Z chromosome of birds (Torgerson and Singh, 2003; Thornton et al.,2006; Mank et al., 2007).
The fast-X theory has not been tested in the marsupial lineage. However, it isnoted that genes on the marsupial X chromosome exhibit decreased ω compared toautosomal genes, owing to increased synonymous substitution rate (Goodstadt et al.,2007). This decreased ω is also observed in subtelomeric regions of the marsupialautosomes suggesting that fast-X theory does not apply to the marsupial X chromo-some or substitution rate ratio (ω) measure is not a reliable predictor of the fast-Xtheory.
8.3.9 Marsupial X Chromosome Sequence and X Inactivation
In eutherian mammals with XX females and XY males, one of the X chromo-somes is transcriptionally silenced to maintain an equal dose of genes in males andfemales in somatic cells. This silencing phenomenon is called X chromosome inac-tivation and balancing of dose is called dosage compensation (see Al Nadaf et al.,Chapter 13 for detailed discussion about the X inactivation). In human and mouse Xinactivation is random; either the paternally derived or maternally derived X chro-mosome is silenced early in embryogenesis, and the clonal replicates of the cellsare propagated throughout development to produce a mosaic phenotype (Wutz andGribnau, 2007). However, in marsupials, X inactivation occurs, but is paternallyimprinted in the embryo such that the paternally derived X is always the inactiveone (VandeBerg et al., 1983). Additionally, marsupial X inactivation is incomplete,tissue-specific, and seems to occur by a stochastic mechanism. The genetic andmolecular basis of the X inactivation in marsupials will be discussed in followingsections.
8.3.10 Somatic X Inactivation in Marsupials
X inactivation in human and mouse is a whole X phenomenon regulated by the XISTgene at the X inactivation centre (XIC), and suggested to be propagated by LINEelements that act as “booster stations”. The concentration of LINE1 elements onthe opossum X was found to be 22%, which is similar to the XAR of the humanX (Mikkelsen et al., 2007). In contrast, the concentration of LINE1 elements in thehuman XCR, the region homologous to the opossum X chromosome, is significantlyhigher (33%). Similarly, dog X (34%), rat X (36%), and mouse X (32%) also havehigher concentration of the LINE1 elements. This suggest that there has been anaccumulation of LINE1 elements on the eutherian X chromosome to propagate and
8 Organization and Evolution of the Marsupial X Chromosome 165
maintain X inactivation. Lack of this accumulation of LINE1 elements, absence ofXIST gene (Hore et al., 2007) and rearrangement of XIST locus (Deakin et al., 2008)in marsupials suggests alternative mechanisms of the X chromosome inactivation.
The absence of the XIST and consequent spreading of the X inactivation locusin marsupials might also explain why the marsupial X chromosome is much morerearranged in different species than is the eutherian X chromosome. It mightalso explain why compound X chromosomes occur in many marsupial families.Evidence from replication studies shows that the condensation and late replicationof a compound X is confined to the original X (Hayman and Sharp, 1981) and thusonly the original X might be subject to X inactivation.
The X inactivation in mouse and human involves DNA methylation and severalhistone modifications at a molecular level. In marsupials, the X inactivation isaccompanied by loss of active histone modifications, but apparently not the acqui-sition of inactive histone marks (Koina et al., 2009), and does not involve DNAmethylation. This molecular evidence also suggests alternative mechanisms of theX inactivation in marsupials.
Marsupial X inactivation provides some clues to how the complex inactiva-tion system evolved in mammals, because in mouse and cattle (but curiously, nothuman) X inactivation is paternal and incomplete in the extraembryonic mem-branes, does not involve DNA methylation and does not require XIST (reviewedin Huynh and Lee, 2001). Paternal X inactivation may therefore represent theoriginal mechanism by which one X was silenced in females. Sequence analysisof the opossum X chromosome produced no evidence that LINEs have accumu-lated (Mikkelsen et al., 2007), suggesting that LINE elements are not involvedin X inactivation in marsupials, but accumulated once XIST had evolved a func-tion to coordinate and control spreading of inactivation. However, the expansionof a microRNA family on the marsupial X chromosome suggests that epigeneticfactors or post-transcriptional silencing might be involved in X inactivation inmarsupials.
Curiously, given the rather leaky inactivation in marsupials, some species havegone to the extreme of eliminating the inactive X from the somatic cells (Haymanand Martin, 1965). Germline cells of the Southern brown bandicoot (Isoodon obe-sulus), the northern brown bandicoot (I. macrourus) and the long-nosed bandicoot(Perameles nasuta) carry both a full complement of sex chromosomes (XX orXY). However, in somatic cells, males lose their Y chromosome and females oneof their X chromosomes so that both are XO. The Y chromosome is eliminatedfrom a proportion of cells in the male greater gliders as well (Petauroides volans)(Murray and McKay, 1979). Though not unique to marsupials, such eliminationsystems are rare in eutherians, and the creeping vole (Microtus oregoni), is theonly eutherian mammal in which tissue-specific chromosomal loss is observed(Ohno et al., 1963). The loss of the Y in males and the second X in females ofthese species implies that Y-specific genes are unnecessary for somatic develop-ment, and that gene dosage is either compensated in females, or is not critical fordevelopment.
166 H.R. Patel et al.
8.3.11 Meiotic Sex Chromosome Inactivation
The eutherian X chromosome also undergoes inactivation during male meiosis ina process called meiotic sex chromosome inactivation (MSCI). Both the X and Ychromosomes become transcriptionally inactivated in primary spermatocytes duringMSCI (Richler et al., 1992), and this occurs even in the absence of XIST (Turneret al., 2002). MSCI occurs in marsupials, as well as eutherians.
An important consequence of MSCI is that inactivation of X and Y chromosomegenes that are essential during spermatogenesis are copied or retrotransposed toautosomes. Two recent reports on the relatively high retrotransposition rate of genesfrom the X chromosome to autosomes (retrogenes), compared to autosome to auto-some retrotransposition, suggests that metatherians and eutherians may compensatefor the transcriptional silencing of essential genes on the X and Y chromosomesduring meiosis by having the “daughter genes” as retrogenes expressed from theautosomes (Emerson et al., 2004; Potrzebowski et al., 2008). Copying of essentialgenes onto autosomes has occurred in the marsupial lineage; for instance, marsupi-als, as well as eutherians have a testis-specific autosomal copy of PGK1 (Vandeberget al., 1980; Mccarrey et al., 1992). It is thus observed that the X chromosome inac-tivation has shaped the entire genome whereby testis-specific essential genes havemoved to autosomes and absence of XIST locus controlling eutherian mammal Xinactivation has allowed for more rearrangements on the marsupial X chromosomecompared to the eutherian X chromosome.
The similarities with paternal X inactivation in somatic cells has led to the pro-posal that MSCI was the system from which X inactivation evolved. It has beensuggested to have evolved concurrently with the degradation of the Y chromosomes,as it would be a disadvantage for sperm to differ in the presence of genes importantin meiosis (for details see Delbridge, Chapter 9). This system then was expected toproduce X inactivation in the embryo and extraembryonic tissues.
We suggest, therefore, that X inactivation in a therian ancestor was originallypaternal and incomplete, and was accomplished on a gene-by-gene basis by amechanism that included loss of active histone modifications, but not accumula-tion of inactive marks, or DNA methylation. With the evolution of XIST early inthe eutherian lineage, coordinate control by spreading from the XIST locus wasevolved in the embryo, but not the embryonic membranes, which retained the orig-inal mechanism. Comparison with the region orthologous to the XIST region inchicken and frog suggested that the XIST gene evolved by pseudogenization of aprotein coding gene after eutherians diverged from the common therian ancestor148 MYA (Duret et al., 2006), although the minimal sequence overlap suggestsit may have contributed little more than a transcription start site (Hore et al.,2007). Since X inactivation in marsupials seems not to be a whole X phenomenon,LINE booster elements are suggested to have been added after the evolution ofXIST to enable X inactivation to spread (Mikkelsen et al., 2007). Molecular mech-anisms such as DNA methylation and accumulation of inactive histone markswere also added to render inactivation more complete and stable in the eutherianlineage.
8 Organization and Evolution of the Marsupial X Chromosome 167
8.4 Conclusion
Studies of the marsupial X chromosome have been particularly revealing of theprocess by which an autosomal pair took on the functions of an XY pair of sex chro-mosomes; in particular sex determination and dosage compensation. Homology ofthe marsupial X to part of the eutherian X establishes a conserved therian X chromo-some, which is present as an autosome in the genomes of birds and even monotrememammals. Acquisition of the testis-determining gene SRY by the proto-Y chromo-some occurred in a therian ancestor between 166 and 148 MYA, and was followedby degradation of the Y and the evolution of X chromosome inactivation in females.Marsupials, having diverged from eutherians 148 MYA, retain some characteristicsof the original therian X; its smaller size and gene content, its propensity to rear-range internally and fuse with autosomes, its absence of LINE elements, and anancestral form of paternal and partial X inactivation. Features of the X that evolvedspecifically in marsupials include high GC and microRNA contents. Features thatevolved specifically on the eutherian X include Robertsonian fusion with an auto-some, centromeric shift, acquisition of XIST and accumulation of mechanisms thatensured spreading of inactivation in cis.
References
Alsop A, Miethke P, Rofe R, et al. (2005) Characterizing the chromosomes of the Australian modelmarsupial Macropus eugenii (tammar wallaby). Chromosome Res 13:627–636.
Band MR, Larson JH, Rebeiz M, et al. (2000) An ordered comparative map of the cattle and humangenomes. Genome Res 10:1359–1368.
Bernardi G (2000) Isochores and the evolutionary genomics of vertebrates. Gene 241:3–17.Bininda-Emonds ORP, Cardillo M, Jones KE, et al. (2007) The delayed rise of present-day
mammals. Nature 446:507–512.Bulazel K, Metcalfe C, Ferreri GC, Yu J, Eldridge MD, O’Neill RJ (2006) Cytogenetic and molec-
ular evaluation of centromere-associated DNA sequences from a marsupial (Macropodidae:Macropus rufogriseus) X chromosome. Genetics 172:1129–1137.
Burgoyne PS (1982) Genetic homology and crossing over in the X and Y chromosomes ofmammals. Hum Genet 61:85.
Carvalho BD, Oliveira LFB, Nunes AP, Mattevi MS (2002) Karyotypes of nineteen marsupialspecies from Brazil. J Mammal 83:58–70.
Charlesworth B (1978) Model for evolution of Y chromosomes and dosage compensation. ProcNatl Acad Sci USA 75:5618–5622.
Charlesworth B, Coyne JA, Barton NH (1987) The relative rates of evolution of sex-chromosomesand autosomes. Am Nat 130:113–146.
Chojnowski JL, Franklin J, Katsu Y, et al. (2007) Patterns of vertebrate isochore evolution revealedby comparison of expressed mammalian, avian, and crocodilian genes. J Mol Evol 65:259–266.
Costantini M, Clay O, Auletta F, Bernardi G (2006) An isochore map of human chromosomes.Genome Res 16:536–541.
Costantini M, Cammarano R, Bernardi G (2009) The evolution of isochore patterns in vertebrategenomes. BMC Genomics 10:538.
Craig JM, Earnshaw WC, Vagnarelli P (1999) Mammalian centromeres: DNA sequence, proteincomposition, and role in cell cycle progression. Exp Cell Res 246:249–262.
Deakin JE, Koina E, Waters PD, et al. (2008) Physical map of two tammar wallaby chromosomes:a strategy for mapping in non-model mammals. Chromosome Res 16:1159–1175.
168 H.R. Patel et al.
Delbridge ML, Graves JA (2007) Origin and evolution of spermatogenesis genes on the human sexchromosomes. Soc Reprod Fertil Suppl 65:1–17.
Delbridge ML, Harry JL, Toder R, et al. (1997) A human candidate spermatogenesis gene, RBM1,is conserved and amplified on the marsupial Y chromosome. Nat Genet 15:131–136.
Delbridge ML, Patel HR, Waters PD, McMillan DA, Marshall Graves JA (2009) Does the humanX contain a third evolutionary block? Origin of genes on human Xp11 and Xq28. Genome Res19:1350–1360.
Devor EJ, Samollow PB (2008) In vitro and in silico annotation of conserved and nonconservedmicroRNAs in the genome of the marsupial Monodelphis domestica. J Hered 99:66–72.
Devor EJ, Peek AS, Lanier W, Samollow PB (2009) Marsupial-specific microRNAs evolved frommarsupial-specific transposable elements. Gene 448:187–191.
Dhaliwal MK, Pathak S, Shirley LR, Flanagan JP (1988) Ag-nor Staining in the Bennett Wallaby,Macropus rufogriseus – Evidence for Dosage Compensation. Cytobios 56:29–38.
Duret L, Chureau C, Samain S, Weissenbach J, Avner P (2006) The Xist RNA gene evolved ineutherians by pseudogenization of a protein-coding gene. Science 312:1653–1655.
Emerson JJ, Kaessmann H, Betran E, Long M (2004) Extensive gene traffic on the mammalianX chromosome. Science 303:537–540.
Felsenstein J (1974) The evolutionary advantage of recombination. Genetics 78:737–756.Foster JW, Brennan FE, Hampikian GK, et al. (1992) Evolution of sex determination and the
Y chromosome: SRY-related sequences in marsupials. Nature 359:531–533.Glas R, Graves JAM, Toder R, Ferguson-Smith M, O’Brien PC (1999a). Cross-species chromo-
some painting between human and marsupial directly demonstrates the ancient region of themammalian X. Mamm Genome 10:1115–1116.
Glas R, Leo A, Delbridge M, et al. (1999b). Chromosome painting in marsupials: genomeconservation in the Kangaroo family. Chromosome Res 7:167–176.
Goodstadt L, Heger A, Webber C, Ponting CP (2007) An analysis of the gene complement of a mar-supial, Monodelphis domestica: evolution of lineage-specific genes and giant chromosomes.Genome Res 17:969–981.
Graves JAM (1967) DNA synthesis in chromosomes of cultured leucocytes from two marsupialspecies. Exp Cell Res 46:37–57.
Graves JAM (1995) The origin and function of the mammalian Y chromosome and Y-borne genes –an evolving understanding. Bioessays 17:311–320.
Graves JAM (2006) Sex chromosome specialization and degeneration in mammals. Cell 124:901.Graves JAM (2008) Weird animal genomes and the evolution of vertebrate sex and sex chromo-
somes. Annu Rev Genet 42:565–586.Graves JAM, Wakefield MJ, Toder R (1998) The origin and evolution of the pseudoautosomal
regions of human sex chromosomes. Hum Mol Genet 7:1991–1996.Hayman DL (1990) Marsupial cytogenetics. Aust J Zool 37:331–349.Hayman DL, Martin PG (1965) Sex chromosome mosaicism in the marsupial genera Isoodon and
Perameles. Genetics 52:1201–1206.Hayman D, Sharp P (1981) Verification of the structure of the complex sex chromosome system in
Lagorchestes conspicillatus Gould (Marsupialia: Mammalia). Chromosoma 83:263–274.Hayman DL, Ashworth LK, Carrano AV (1982) The relative DNA contents of the eutherian and
marsupial X-chromosomes. Cytogenet Cell Genet 34:265–270.Hellman A, Chess A (2007) Gene body-specific methylation on the active X chromosome. Science
315:1141–1143.Hore TA, Koina E, Wakefield MJ, Graves JAM (2007) The region homologous to the
X-chromosome inactivation centre has been disrupted in marsupial and monotreme mammals.Chromosome Res 15:147–161.
Hubbard TJ, Aken BL, Ayling S, et al. (2009) Ensembl 2009. Nucleic Acids Res 37:D690–D697.Huynh KD, Lee JT (2001) Imprinted X inactivation in eutherians: a model of gametic execution
and zygotic relaxation. Curr Opin Cell Biol 13:690–697.
8 Organization and Evolution of the Marsupial X Chromosome 169
Jacobs D (2004) The evolution of a neo-XY1Y2 sex chromosome system by autosome–sex chro-mosome fusion in Dundocoris nodulicarinus Jacobs (Heteroptera: Aradidae: Carventinae).Chromosome Res 12:175–191.
Johnston PG, Davey RJ, Seebeck JH (1984) Chromosome homologies in Potorous-Tridactylus andPotorous-Longipes (Marsupialia, Macropodidae) based on G-Banding patterns. Aust J Zool32:319–324.
Kohn M, Kehrer-Sawatzki H, Vogel W, Graves JAM, Hameister H (2004) Wide genome compar-isons reveal the origins of the human X chromosome. Trends Genet 20:598.
Koina E, Chaumeil J, Greaves IK, Tremethick DJ, Graves JAM (2009) Specific patterns of histonemarks accompany X chromosome inactivation in a marsupial. Chromosome Res 17:115–126.
Mank JE, Axelsson E, Ellegren H (2007) Fast-X on the Z: rapid evolution of sex-linked genes inbirds. Genome Res 17:618–624.
Mccarrey JR, Berg WM, Paragioudakis SJ, et al. (1992) Differential transcription of Pgk genesduring spermatogenesis in the mouse. Dev Biol 154:160–168.
Merry DE, Pathak S, VandeBerg JL (1983) Differential NOR activities in somatic and germcells of Monodelphis domestica (Marsupialia, Mammalia). Cytogenetic Genome Res 35:244–251.
Mikkelsen TS, Wakefield MJ, Aken B, et al. (2007) Genome of the marsupial Monodelphisdomestica reveals innovation in non-coding sequences. Nature 447:167–177.
Muller HJ (1918) Genetic variability, twin hybrids and constant hybrids, in a case of balancedlethal factors. Genetics 3:422–499.
Murphy WJ, Sun S, Chen Z-Q, Pecon-Slattery J, O’Brien SJ (1999) Extensive conservation ofsex chromosome organization between cat and human revealed by parallel radiation hybridmapping. Genome Res 9:1223–1230.
Murray JD, McKay GM (1979) Y Chromosome mosaicism in pouch young of the marsupial,greater glider (Marsupialia: Petauridae). Chromosoma 72:329–334.
Noronha RCR, Nagamachi CY, O’Brien PCM, Ferguson-Smith MA, Pieczarka JC (2009) Neo-XY body: an analysis of XY1Y 2 meiotic behavior in Carollia (Chiroptera, Phyllostomidae) bychromosome painting. Cytogenetic Genome Res 124:37–43.
Ohno S (1967) Sex Chromosome and Sex-Linked Genes. Springer-Verlag, Berlin.Ohno S, Jainchill J, Stenius C (1963) The Creeping Vole (Microtus Oregoni) as a gonosomic
mosaic. I. the Oy/Xy constitution of the male. Cytogenetics 14:232–239.Page J, Berrios S, Rufas JS, et al. (2003) The pairing of X and Y chromosomes during meiotic
prophase in the marsupial species Thylamys elegans is maintained by a dense plate developedfrom their axial elements. J Cell Sci 116:551–560.
Pask A, Renfree MB, Graves JAM (2000) The human sex-reversing ATRX gene has a homologueon the marsupial Y chromosome, ATRY: implications for the evolution of mammalian sexdetermination. Proc Natl Acad Sci USA 97:13198–13202.
Potrzebowski L, Vinckenbosch N, Marques AC, Chalmel F, Jegou B, Kaessmann H (2008)Chromosomal gene movements reflect the recent origin and biology of therian sex chromo-somes. PLoS Biol 6:e80.
Rappold GA (1993) The pseudoautosomal regions of the human sex chromosomes. Hum Genet92:315–324.
Rens W, O’Brien PCM, Fairclough H, Harman L, Graves JAM, Ferguson-Smith MA (2003)Reversal and convergence in marsupial chromosome evolution. Cytogenet Genome Res102:282–290.
Rice WR (1987a). Genetic hitchhiking and the evolution of reduced activity of the Y sexchromosome. Genetics 116:161–167.
Rice WR (1987b). The accumulation of sexually antagonistic genes as a selective agent promot-ing the evolution of reduced recombination between primitive sex chromosomes. Evolution41:911–914.
Richler C, Soreq H, Wahrman J (1992) X-inactivation in mammalian testis is correlated withinactive X-specific transcription. Nat Genet 2:192–195.
170 H.R. Patel et al.
Robins AJ, Hayman DL, Wells JRE (1984) Ribosomal gene reiteration in a marsupial species withan X-linked nucleolar organizer. Aust J Biol Sci 37:211–215.
Rodriguez Delgado CL, Waters PD, Gilbert C, Robinson TJ, Graves JAM (2009) Physical map-ping of the elephant X chromosome: conservation of gene order over 105 million years.Chromosome Res 17:917–926.
Rofe R, Hayman D (1985) G-banding evidence for a conserved complement in the Marsupialia.Cytogenet Cell Genet 39:40–50.
Ross MT, Grafham DV, Coffey AJ, et al. (2005) The DNA sequence of the human X chromosome.Nature 434:325.
Schmid M, Feichtinger W, Steinlein C, Haaf T, Visbal Garcia R, Fernandez Badillo A (2002) Xchromosomes of American marsupials contain minimal amounts of euchromatin. CytogenetGenome Res 99:315–322.
Sharp P (1982) Sex chromosome pairing during male meiosis in marsupials. Chromosoma 86:27–47.
Skaletsky H, Kuroda-Kawaguchi T, Minx PJ, et al. (2003) The male-specific region of the humanY chromosome is a mosaic of discrete sequence classes. Nature 423:825–837.
Spencer JA, Sinclair AH, Watson JM, Graves JAM (1991a). Genes on the short arm of the humanX chromosome are not shared with the marsupial X. Genomics 11:339–345.
Spencer JA, Watson JM, Graves JAM (1991b). The X chromosome of marsupials shares a highlyconserved region with eutherians. Genomics 9:598–604.
Svartman M, Vianna-Morgante AM (1998) Karyotype evolution of marsupials: from higher tolower diploid numbers. Cytogenet Cell Genet 82:263–266.
Svartman M, Vianna-Morgante AM (2003) Conservation of chromosomal location of nucleolusorganizer in American marsupials (Didelphidae). Genetica 118:11–16.
Swinburne JE, Boursnell M, Hill G, et al. (2006) Single linkage group per chromosome geneticlinkage map for the horse, based on two three-generation, full-sibling, crossbred horse referencefamilies. Genomics 87:1–29.
Thornton K, Bachtrog D, Andolfatto P (2006) X chromosomes and autosomes evolve at similarrates in Drosophila: no evidence for faster-X protein evolution. Genome Res 16:498–504.
Toder R, O’Neill R, Wienberg J, O’Brien P, Voullaire L, Graves JAM (1997a). Comparative chro-mosome painting between two marsupials: origins of an XX/XY1Y2 sex chromosome system.Mamm Genome 8:418–422.
Toder R, Wienberg J, Voullaire L, O’Brien PCM, Maccarone P, Graves JAM (1997b). SharedDNA sequences between the X and Y chromosomes in the tammar wallaby – evidencefor independent additions to eutherian and marsupial sex chromosomes. Chromosoma 106:94–98.
Toder R, Wakefield MJ, Graves JAM (2000) The minimal mammalian Y chromosome – themarsupial Y as a model system. Cytogenet Cell Genet 91:285–292.
Torgerson DG, Singh RS (2003) Sex-linked mammalian sperm proteins evolve faster thanautosomal ones. Mol Biol Evol 20:1705–1709.
Turner JM, Mahadevaiah SK, Elliott DJ, et al. (2002) Meiotic sex chromosome inactivation in malemice with targeted disruptions of Xist. J Cell Sci 115:4097–4105.
Vandeberg JL, Cooper DW, Sharman GB, Poole WE (1980) Somatic expression and autosomalinheritance of phosphoglycerate kinase-B in kangaroos. Genetics 95:413–424.
VandeBerg JL, Johnston PG, Cooper DW, Robinson ES (1983) X-chromosome inactivation andevolution in marsupials and other mammals. Isozymes Curr Top Biol Med Res 9:201–218.
Veyrunes F, Waters PD, Miethke P, et al. (2008) Bird-like sex chromosomes of platypus implyrecent origin of mammal sex chromosomes. Genome Res 18:965–973.
Vilella AJ, Severin J, Ureta-Vidal A, Heng L, Durbin R, Birney E (2009) EnsemblComparaGeneTrees: complete, duplication-aware phylogenetic trees in vertebrates. Genome Res19:327–335.
Warren WC, Hillier LW, Graves JAM, et al. (2008) Genome analysis of the platypus reveals uniquesignatures of evolution. Nature 453:175–183.

8 Organization and Evolution of the Marsupial X Chromosome 171
Waters PD, Duffy B, Frost CJ, Delbridge ML, Graves JAM (2001) The human Y chromosomederives largely from a single autosomal region added to the sex chromosomes 80–130 millionyears ago. Cytogenet Cell Genet 92:74–79.
Waters PD, Delbridge ML, Deakin JE, et al. (2005) Autosomal location of genes from the con-served mammalian X in the platypus (Ornithorhynchus anatinus): implications for mammaliansex chromosome evolution. Chromosome Res 13:401–410.
Wilcox SA, Watson JM, Spencer JA, Graves JAM (1996) Comparative mapping identifies thefusion point of an ancient mammalian X-autosomal rearrangement. Genomics 35:66–70.
Wutz A, Gribnau J (2007) X inactivation Xplained. Curr Opin Genet Dev 17:387–393.Young GJ, Graves JAM, Barbieri I, Woolley PA, Cooper DW, Westerman M (1982) The chromo-
somes of dasyurids (Marsupialia). In: Archer M (ed) Carnivorous Marsupials. Royal ZoologicalSociety of New South Wales, Sydney.
Yunis E, Ramirez E, Cayon J, Hernandez J (1972) The chromosomes of the Didelphids CaluromysLanatus Illiger and Chironectes minimus Zimmerman (Marsupialia: Didelphidae). Aust J Zool20:265–269.

Chapter 9Gene Content of the MammalianX Chromosome
Margaret L. Delbridge
Abstract The human and mouse X chromosomes have an atypical gene content.These X chromosomes contain more genes involved in reproduction and brainfunction than would be expected by chance alone. The accumulation of these typesof genes may be facilitated by the structure of the X chromosome, which may beconducive to the amplification of genes in particular regions. In addition, as theX chromosome is hemizygous in males and is silenced during male meiosis, thisaffects both the fixation of male-beneficial and female-beneficial genes, and theexpression of X-linked genes during meiosis. A requirement for the expressionof X-linked genes during spermatogenesis may have driven retrotransposition ofgenes both on and off the X, and this has had a role in shaping the gene content ofthe mammalian X chromosome. Characterisation of the structure and gene contentof the marsupial X chromosome is essential to understand whether the features ofstructure and expression observed on the human and mouse X chromosomes arefundamental to all therian X chromosomes. This will indicate whether the therian Xchromosome plays a special role in reproduction and brain functions, and possiblyspeciation.
Keywords Mammalian X chromosome · Meiotic sex chromosomeinactivation · Sex and reproduction related genes · Mental retardation genes
9.1 Introduction
The mammals are comprised of three major lineages; the eutherians (“placental”mammals) which radiated up to 105 million years ago; the metatherians, or mar-supials, which diverged from the eutherians approximately 148 million years ago;
M.L. Delbridge (B)ARC Centre of Excellence for Kangaroo Genomics, Evolution, Ecology and Genetics, ResearchSchool of Biology, The Australian National University, Canberra, ACT 0200, Australiae-mail: [email protected]
173J.E. Deakin et al. (eds.), Marsupial Genetics and Genomics,DOI 10.1007/978-90-481-9023-2_9, C© Springer Science+Business Media B.V. 2010
174 M.L. Delbridge
and the prototheria, or monotremes, which diverged from the theria (the euthe-ria and metatheria together) approximately 166 million years ago. The mammalsdiverged from the next closest group of vertebrates, the birds and reptiles, approxi-mately 310 million years ago (Bininda-Emonds et al., 2007), and so the marsupialsand monotremes represent two groups that fill the evolutionary gap between thebirds and reptiles and the eutherian mammals, and are useful for assessing theconservation of differences observed amongst the eutherian mammals.
Almost all mammals have an XX female: XY male sex chromosome system, inwhich a gene on the Y chromosome initiates male development. The X chromo-some gene content of different eutherian mammals is highly conserved. Mappinghuman X-borne genes in distantly related mammals showed that only part of the Xchromosome is conserved between the eutherians and marsupials. The long armand pericentric region of the human X chromosome is equivalent to the marsu-pial X chromosome and is therefore at least 148 million years old. This region ofthe human X chromosome is known as the X conserved region (XCR) (Graves,1995). However, genes on the short arm of the human X chromosome are auto-somal in two distantly related marsupials, the South American grey short-tailedopossum (Monodelphis domestica) (Mikkelsen et al., 2007) and the tammar wal-laby (Macropus eugenii) (Deakin et al., 2008), implying the addition of a region tothe sex chromosomes between 148 and 105 million years ago. This region of thehuman X chromosome is known as the X added region (XAR) and it is exposed tothe same forces that shaped the conserved region (Graves, 2006).
The therian X and Y chromosomes have a different origin to the monotremesex chromosome system. The platypus (our model monotreme) sex chromosomesystem consists of five X chromosomes (X1X2X3X4X5) and five Y chromosomes(Y1Y2Y3Y4Y5). Females have two copies of each X chromosome and males haveone copy of each of the X chromosomes and each of the Y chromosomes (Renset al., 2004). The different X and Y chromosomes form a translocation chain duringmale meiosis in the order X1Y1X2Y2 etc. The X’s and Y’s then segregate alternatelyto form balanced gametes (Grützner et al., 2004). The platypus sex chromosomesshare no homology with the therian sex chromosomes, instead they share exten-sive homology with the chicken Z chromosome, indicating that the platypus X andY chromosomes have a different origin from the therian X and Y chromosomes(Veyrunes et al., 2008). The building blocks of the human X chromosome are rep-resented by autosomal blocks on platypus chromosomes 6 (XCR), and 15 and 18(XAR) (Waters et al., 2005; Hore et al., 2007; Veyrunes et al., 2008), and are presentas two major autosomal regions on chromosomes 4 (XCR) and 1 (XAR) in chickens(Kohn et al., 2004).
The marsupial X chromosome, therefore, represents a minimal therian X chro-mosome. Homology between the X and Y chromosomes supports the hypothesisthat the therian X and Y chromosomes differentiated from a homologous autoso-mal pair (the proto-X and proto-Y) when one member acquired a male-determiningallele. SRY is the male-determining gene in therian mammals. SRY is found onthe Y chromosome of all therian mammals except for a few rodent species thathave recently lost their Y chromosome (Soullier et al., 1998; Vogel et al., 1998;
9 Gene Content of the Mammalian X Chromosome 175
Sutou et al., 2001). Following the acquisition of SRY, suppression of recombinationbetween the X and Y preserved SRY and the nearby accumulation of genes bene-ficial to males on the Y chromosome. This has led to the loss of active genes andaccumulation of mutations on the Y chromosome in the region where recombina-tion has been suppressed. Progressive degradation of genes and sequences on theY chromosome has resulted in the heterologous X and Y chromosomes observed inmost extant species, such that most genes on the X chromosome have no homologueon the Y chromosome (Graves, 2006).
9.2 Y Chromosome Gene Content
The gene content of the X and Y chromosomes has been shaped by this processof restriction of recombination and the associated loss of Y genes. The therian Ychromosome contains only a small number of genes, most of which have a rolein male-specific functions such as sex determination and spermatogenesis. TheseY genes have differentiated from their more widely expressed X homologues. Forexample, in humans, the putative gonadoblastoma gene TSPY, has a more restrictedexpression pattern than its X homologue TSPX, which is involved in the cell cycle(Delbridge et al., 2004). Similarly, the putative spermatogenesis gene RBMY, and thetestis-determining factor SRY have differentiated from their widely expressed homo-logues on the X chromosome RBMX and SOX3 respectively (Foster and Graves,1994; Delbridge et al., 1999). Gene mapping has shown that there are different suitesof Y genes that have been retained in different lineages on the Y (reviewed in Waterset al., 2007).
9.3 X Chromosome Gene Content
In contrast to the specialisation of genes on the Y chromosome, the majority ofgenes on the human X chromosome are well conserved, with genes from theXCR found on the X chromosome in all therians. There also is a subset of morespecialised genes on the human and mouse X chromosomes that appear to haveundergone amplification, which may have occurred out of the necessity for theirexpression during the repression of the X during male meiosis.
The human X chromosome is approximately 155 Mb long and contains about1,300 genes. The majority of genes from the XCR and XAR regions of the human Xchromosome have a variety of housekeeping functions, and these genes are almostentirely conserved between the X chromosomes of eutherian species. In the mar-supials, these genes are also conserved on the autosomal region that representsthe XAR and the X chromosome, representing the XCR (Graves, 2006). Genomesequencing projects have now confirmed the gene content of the human X chro-mosome is not representative of all types of genes, but in fact contains an atypicalbias in the gene content that is different to that found on the autosomes. This bias
176 M.L. Delbridge
is not confined to the human X chromosome as it is also observed on the mouse Xchromosome; there is enrichment for genes that are involved in sex and reproduction(Wang et al., 2001; Ross et al., 2005; Koslowski et al., 2006), and brain development(Wilda et al., 2000; Zechner et al., 2001).
9.4 Sex and Reproduction-Related Genes Within LargeInverted Repeats
The X chromosomes of humans and mice are enriched for genes that are involvedin sex and reproduction. Early spermatogonial genes, sex and reproduction related(SRR) and prostate-specific genes are over-represented on the X in humans andmice (Saifi and Chandra, 1999; Wang et al., 2001). In contrast, a paucity of genesinvolved in late spermatogenesis on the human and mouse X chromosomes has alsobeen observed (Khil et al., 2004; Ross et al., 2005). This description of the genecontent of the human and mouse X chromosomes relies largely on the analysis ofconserved single copy genes. However, a major feature of the human X chromosomethat was revealed by sequencing (Ross et al., 2005) is the presence of a number oflarge inverted repeat sequences (arm length between 9 and 142 kb) concentratedin the Xp11, Xq22 and Xq28 regions of the human X chromosome (Warburtonet al., 2004). A more recent report has detailed the existence of similar large repeatsequences that make up approximately 12% of the mouse X chromosome (Muelleret al., 2008). Analysis of marsupial X chromosome sequences (opossum and tammarwallaby) is currently underway, to determine if these large inverted repeats are afeature of all therian X chromosomes. These large inverted repeats found on thehuman and mouse X may be analogous to similar large palindromic sequences foundon the human Y chromosome in Yq11. On the Y chromosome, these palindromeshave been proposed to allow gene conversion between the different members ofmulticopy testis-specific gene families within them, such as TSPY and RBMY, topreserve the integrity and function of genes with a crucial male specific role in theabsence of meiotic recombination between homologues (Rozen et al., 2003). Arm-to arm gene conversion is unlikely to be a critical mechanism to maintain geneintegrity on the X chromosome, as X chromosomes do undergo crossing over infemales, but there is evidence that it does occur (Small et al., 1997).
Similarly to the Y chromosome, the inverted repeat structures on the human andmouse X chromosomes harbour multicopy testis-specific gene families (Muelleret al., 2008; Warburton et al., 2004). The human X chromosome repeats containlarge numbers of CT (cancer-testis) antigen genes. These genes are multicopy genefamilies that are normally expressed in the testis, but are reactivated in some cancers(Simpson et al., 2005). The expression of these genes in early spermatogenesis isconsistent with the prevailing view that the X chromosome is enriched for genesinvolved in spermatogenesis prior to meiosis (reviewed in Delbridge and Graves,2007). However, the X was thought to be depleted in genes expressed after meiosis(Khil et al., 2004), and this was attributed to the effects of meiotic sex chromosomeinactivation (MSCI), which silences the X and Y chromosomes during meiosis.
9 Gene Content of the Mammalian X Chromosome 177
9.5 Meiotic Sex Chromosome Inactivation
In eutherians, the X and Y chromosomes undergo meiotic sex chromosome inac-tivation (MSCI) during spermatogenesis in males. This is a temporary silencing ofthe sex chromosomes during the first meiotic prophase. Eutherian MSCI is initiatedwhen the BRCA1 protein recruits the ATR kinase to phosphorylate the nucleoso-mal core histone H2AX. Early marks of MSCI in the mouse are the associationof H2AX and the heterochromatin associated proteins (HP1β and HP1γ)with thesynapsed X and Y chromosomes, a structure known as the XY body (Mahadevaiahet al., 2001; Namekawa et al., 2006). The repression of transcription is largely main-tained following meiosis in round spermatids, due to the persistence of post-meioticsex chromatin (PMSC), and the associated H2AX, HP1β and HP1γ. Transcriptionof both the sex chromosomes and autosomes alike ceases during spermiogenesiswhen the genome undergoes extensive chromatin condensation and packaging withprotamines, rather than histones, in sperm (Namekawa et al., 2006).
MSCI and PMSC also occur during spermatogenesis in marsupials (Horneckeret al., 2007; Namekawa et al., 2007). Levels of expression of X-linked housekeepinggenes decline in meiotic spermatocytes in the opossum (M. domestica) similar to thereduction in levels of expression observed in mouse (Namekawa et al., 2006, 2007).This reduction in expression of housekeeping genes coincides with an increase inthe level of expression of BRCA1 and ATR, and the association of H2AX, HP1β
and HP1γ proteins with the X and Y chromosomes in early pachytene. In the opos-sum, the association of these MSCI marks occurs prior to the association of theXY body at the dense plate. This key difference between eutherian and marsupialMSCI implies that MSCI in all therians is triggered by the presence of unpairedDNA rather than paired elements. The silencing of the XY body continues throughmeiosis II (spermatocytes and round spermatids) and into the post meiotic period.Overall then, MSCI and PMSC follow a similar pattern in all therian mammals(Fig. 9.1) (Franco et al., 2007; Hornecker et al., 2007; Namekawa et al., 2007).
9.6 Postmeiotic Expression of Testis-SpecificX Chromosome genes
In eutherians, however, there is a specific derepression of some X-linked genesfollowing meiosis. In mouse, there is a specific reactivation of X-linked spermatoge-nesis genes during spermatogenesis in the round spermatids, following the meioticdivision (Mueller et al., 2008). The X-linked genes that are re-activated are mostlymulticopy testis-specific genes, whose levels of expression are increased to levelscomparable to the expression levels of autosomal genes. A number of single copyX-linked genes are also derepressed, but their post-meiotic expression levels arenot comparable to their pre-meiotic expression levels (Mueller et al., 2008). Thegene products from the X chromosome are also accessible to the Y bearing roundspermatids, due to the continued close association of the tetrad of spermatids. The
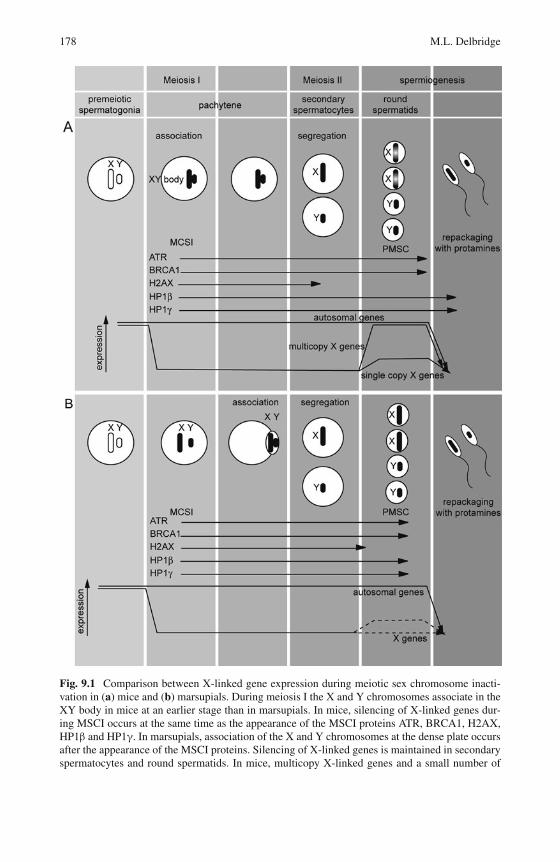
178 M.L. Delbridge
Fig. 9.1 Comparison between X-linked gene expression during meiotic sex chromosome inacti-vation in (a) mice and (b) marsupials. During meiosis I the X and Y chromosomes associate in theXY body in mice at an earlier stage than in marsupials. In mice, silencing of X-linked genes dur-ing MSCI occurs at the same time as the appearance of the MSCI proteins ATR, BRCA1, H2AX,HP1β and HP1γ. In marsupials, association of the X and Y chromosomes at the dense plate occursafter the appearance of the MSCI proteins. Silencing of X-linked genes is maintained in secondaryspermatocytes and round spermatids. In mice, multicopy X-linked genes and a small number of
9 Gene Content of the Mammalian X Chromosome 179
mouse X chromosome, therefore, also contains a much higher than expected propor-tion of genes that are expressed during spermatogenesis following meiosis (Muelleret al., 2008). There is evidence that this also occurs in humans, as the SPANX genefamily from human Xq27 is expressed in late spermatogenesis (Kouprina et al.,2004, 2005).
It has been reported that this reactivation is not seen in the round spermatids ofthe opossum, where germ cell specific X-linked gene expression is not detected inthe presence of high expression levels of the ATR gene (Hornecker et al., 2007)and the silencing marks HP1β and HP1γ, indicate the silencing of the opossumX and Y chromosomes in round spermatids (Fig. 9.1) (Namekawa et al., 2007).In contrast, reactivation of expression has been observed for a number of singlecopy X-linked genes in opossum round spermatids (Mahadevaiah et al., 2009). Thisreactivation occurs in only a proportion of X bearing spermatids (ranging from 28to 71%) (Mahadevaiah et al., 2009), and it is not clear whether the levels of genederepression are comparable to pre-meiotic levels. The reactivation of these singlecopy genes in the opossum could be the equivalent of the low level reactivationof single copy X-linked genes observed in the mouse. The continued repression ofgerm-cell specific X-linked genes may be a feature of marsupial MSCI (Horneckeret al., 2007), but this conclusion is based on data for a small number of genes, sosurveying a larger number of X-linked genes could help to resolve this question.Characterisation of the X chromosome in both opossum and tammar wallaby iscurrently underway to identify single copy and multi-copy testis specific genes onthe marsupial X chromosome. Investigation of the expression patterns of these geneswill be an essential contribution to determine how similar the patterns of MSCI andPMSC are in marsupial and eutherian mammals.
It is now known that the ZW chromosome pair is also transiently silenced duringmeiosis in female chickens. The presence of MSCI in a species with female het-erogamety is evidence that MSCI is not specific to spermatogenesis. The method ofpairing between the Z and W in chicken oogenesis is different to the method of pair-ing of the X and Y during therian spermatogenesis, and it may be that the form ofMSCI observed in birds evolved independently from MSCI in mammals. Silencingof the sex chromosomes during meiosis could be a mechanism by which recom-bination is suppressed between the heterologous chromosome pair (Schoenmakerset al., 2009).
In the mature sperm of eutherians, most of the genome is silenced, sex chromo-somes and autosomes alike, due to the packaging of the DNA into a different kindof chromatin, where protamines rather than histones are used. It has been suggested
�
Fig. 9.1 (Continued) single copy X-linked genes escape the silencing of PMSC in round sper-matids, despite the continued presence of MSCI proteins. This reactivation of X-linked geneexpression has been observed in marsupials for some single copy X-linked genes, but has notbeen observed for germ cell-specific genes. All genes are silenced in the mature sperm when theDNA is repackaged with protamines rather than histones
180 M.L. Delbridge
that X chromosome silencing during spermatogenesis might persist after fertilisa-tion, to facilitate dosage compensation by transmission of a partially inactivatedpaternal X chromosome to the eutherian embryo. The transmission of a pre-inactivated X might form the basis of imprinted X inactivation in some mammals(Huynh and Lee, 2003). Imprinted X inactivation, such as is found in marsupialswhere it is always the paternal X chromosome that is inactivated independently ofXIST/TSIX expression, has been proposed to be an ancestral form of X inactiva-tion (reviewed in Al Nadaf et al., Chapter 13). Imprinted X inactivation has alsobeen suggested to have evolved independently in eutherians, possibly following theevolution of the more stable, random X inactivation that depends on XIST/TSIXexpression (reviewed in Al Nadaf et al., Chapter 13; Heard and Disteche, 2006).
9.7 Retrotransposition of Genes On and Off the X Chromosome
Specific silencing of X-linked genes during spermatogenesis has been proposed todrive the retrotransposition events that generate testis-expressed copies of X-linkedgenes (e.g. PGK, PDHA1 and RBMX) on autosomes (Dahl et al., 1990; McCarreyet al., 1996; Lingenfelter et al., 2001). This data has largely been collected for genesthat are single copy on the X chromosome. This mechanism has been proposed tocompensate for the loss of activity of essential X-linked genes during spermatogene-sis (Emerson et al., 2004). Further studies have substantiated that retrotranspositionoff the X chromosome occurs in marsupials and eutherians, and this supports theidea that, as the therian X and Y chromosomes evolved from their autosomal pair,the evolution of MSCI followed the spread of non-recombination and was the driv-ing force for retrotransposition off the X chromosome to compensate for silencingof X chromosome genes during spermatogenesis (Potrzebowski et al., 2008).
However, retrotransposition seems to occur in both directions on the humanX chromosome. Many X-linked single copy testis-specific genes do not containintrons, and so probably arose on the X by retrotransposition of a processed copyof an autosomal source gene. For example, the ATXN3L and YY2 genes are likelyto be derived from intron-containing paralogues on autosomes (Loriot et al., 2003;Emerson et al., 2004). More than 75% of the genes generated by retrotranspositionon the human X chromosome are also found on the mouse X chromosome, whichimplies that these retrotransposition events must have occurred prior to the diver-gence of primates and rodents approximately 105 million years ago (Emerson et al.,2004).
The formation of cruciforms or other secondary structures by the large invertedrepeat sequences on the X that harbour many of the testis-specific gene families,may have contributed to the duplication of the genes within them, but also mightpermit escape from MSCI of those gene families that are crucial in late spermato-genesis (Skaletsky et al., 2003; Warburton et al., 2004). Within the repeat structureson the X chromosome many of the gene families have been amplified by retrotrans-position as well as gene duplication, such as has occurred in the expansion of the
9 Gene Content of the Mammalian X Chromosome 181
MAGE gene family on the human X chromosome (Chomez et al., 2001; Bertrandet al., 2004). In addition, it is suggested that gene amplification of the testis-specificgene families facilitates higher gene expression, by the additive effects of a smallamount of expression from a large number of gene copies from a generally repressedX chromosome following meiosis (Mueller et al., 2008). This may be another mech-anism to compensate for the loss of expression of essential single copy genes duringspermatogenesis. There must also be additional mechanisms that accomplish reac-tivation of X-linked genes post-meiotically, as a number of single copy X genes arealso reactivated.
It is interesting that the testis-specific genes within the inverted repeat sequenceson the human and mouse X comprise two different subsets of genes (Warburtonet al., 2004; Mueller et al., 2008), suggesting that amplification has occurredindependently in different lineages.
9.8 X-Linked Genes with a Function in the Brain
The eutherian X chromosome, therefore, is enriched in spermatogenesis genes thathave a role both before and after meiosis. In addition to this, there is evidence thatthe human X chromosome also contains a disproportionately large number of genesinvolved in brain development. The special role of the X chromosome in brain func-tion is supported by the fact that there are three times as many X-linked mentalretardation (XLMR) disorders than other abnormal X-linked phenotypes in humans.Although X-linked inheritance of mental retardation disorders is easily detectedin families, it has been shown that the ease of detection has not created an ascer-tainment bias on the X chromosome (Ropers and Hamel, 2005). XLMR genes arespread over the entire human X chromosome, with a higher density in Xp11 andXq28 (Chiurazzi et al., 2008). Interestingly, these two regions are also where thetestis-specific genes on the X and the large inverted repeats are concentrated. It isstriking that many genes that are expressed in the brain are also expressed in thetestis (Graves et al., 2002; Lubs et al., 1996). Perhaps this is how MSCI and PMSCcan affect the accumulation of X-linked genes involved in brain function, throughtheir effects on gene expression in the testis. The accumulation of brain and testisgenes on the mammalian X chromosome might mean that the mammalian X hasa role in speciation as does the Drosophila X chromosome, which is known to beinvolved in speciation and has an important effect on hybrid sterility (Orr and Coyne,1989).
The mammalian X chromosome has an accumulation of genes with a role in braindevelopment or function, which may affect traits such as intelligence (Zechner et al.,2001). The accumulation of “intelligence” genes was speculated to be because intel-ligence is a male-advantage trait, or perhaps because intelligence is selected for byfemales, as an indicator of beneficial genes (Zechner et al., 2001). The X chromo-some is transmitted two-thirds of the time through females and only one-third ofthe time through males. As a consequence, there would be more time for selection
182 M.L. Delbridge
to act on mutations that are of benefit to females. As long as the benefit of thesegenes to females was greater than the disadvantage of these genes to males, positiveselection would result in an accumulation of female-beneficial mutations on the Xchromosome. In contrast, the hemizygosity of the X chromosome in males allowsmale beneficial recessive or partially recessive alleles to be fixed more rapidly onthe X chromosome relative to the autosomes, which can lead to accumulation ofmale-advantage genes on the X chromosome. Therefore the X chromosome cancontain both female-advantage and male-advantage genes, depending on the under-lying genetic variation. Human and mouse X chromosomes show an enrichment forboth female and male-advantage genes, but this is not universal. For example, inDrosophila and Caenorhabditis elegans, the X chromosomes are depleted in male-specific genes and enriched for female biased genes, whereas in the chicken, inwhich the female is the heterogametic sex (ZW), the Z chromosome shows enrich-ment for male biased genes and depletion of female-biased genes (Gurbich andBachtrog, 2008).
Genes that have a role in either female or male reproduction could clearly beclassified as female or male-beneficial alleles that could be accumulated on thehuman X chromosome (Koslowski et al., 2006). It is more speculative whether thismechanism might result in the accumulation of genes that are involved in brainfunction on the X chromosome, where beneficial recessive alleles of genes with arole in the brain give a reproductive advantage to males, assuming females pref-erentially select more intelligent or resourceful males (Zechner et al., 2001). It hasbeen hypothesised that these genes may have evolved on the X chromosome becauseX-linked genes evolve faster than autosomal genes under positive selection, and/orthey may be subject to the effects of sexual antagonism (Vicoso and Charlesworth,2006). In addition to there being a higher number of genes involved in brain functionlocated on the X, there is also higher expression of these genes in the brains of bothsexes (Nguyen and Disteche, 2006a, b). It is suggested that mechanisms such aschromatin modifications that alter gene transcription levels in the brain cells wouldfavour the recruitment of X-linked genes into brain-specific functions because oftheir increased expression (Nguyen and Disteche, 2006b).
Investigation of the location and expression patterns of homologues of humanXLMR genes in marsupials showed that the XLMR genes are located on the equiv-alent regions in marsupials to the XCR and XAR of the human X chromosome,suggesting that they have been located in the same genomic regions for more than148 million years. As many of these marsupial XLMR homologues are widelyexpressed, this suggests that although some X-linked genes have had a role inthe brain throughout therian evolution, others have undergone a narrowing of theirexpression pattern, and a change of function, to play a larger role in the brain inhumans (Delbridge et al., 2008). This is consistent with observations that expres-sion patterns of some XLMR genes are similar in older regions of the brain (suchas the cerebellum) in mice and chickens, but are markedly different in youngerregions of the brain such as the telencephalon. The testis and telencephalon of themouse have specific expression of XLMR genes, which is absent from these tissuesin the chicken. This suggests that a location on the X chromosome in mammals
9 Gene Content of the Mammalian X Chromosome 183
may have accelerated selection for the more specialised functions in cognition andreproduction that have been acquired by XLMR genes in eutherians (Kohn et al.,2007).
9.9 Conclusion
The mammalian X chromosome has a large number of genes involved in sex andreproduction, and also brain function, suggesting that it may play a special role inthese functions. Further analysis of the genes on the X chromosome in differentspecies, and particularly marsupials, may indicate whether it is possible that theirconcentration on the X, and the lineage-specific amplification of testis and cognitiongenes within the large inverted repeats on the X chromosome, is related to a specialrole of the therian X chromosome in speciation.
References
Bertrand M, Huijbers I, Chomez P, De Backer O (2004) Comparative expression analysis of theMAGED genes during embryogenesis and brain development. Dev Dyn 230:325–334.
Bininda-Emonds ORP, Cardillo M, Jones KE, et al. (2007) The delayed rise of present-daymammals. Nature 446:507–512.
Chiurazzi P, Schwartz CE, Gecz J, Neri G (2008) XLMR genes: update 2007. Eur J Hum Genet16:422–434.
Chomez P, De Backer O, Bertrand M, et al. (2001) An overview of the MAGE gene family withthe identification of all human members of the family. Cancer Res 61:5544–5551.
Dahl HH, Brown RM, Hutchison WM, Maragos C, Brown GK (1990) A testis-specific form ofthe human pyruvate dehydrogenase E1 alpha subunit is coded for by an intronless gene onchromosome 4. Genomics 8:225–232.
Deakin JE, Koina E, Waters PD, et al. (2008) Physical map of two tammar wallaby chromosomes:a strategy for mapping in non-model mammals. Chromosome Res 16:1159–1175.
Delbridge ML, Graves JAM (2007) Origin and evolution of spermatogenesis genes on the humansex chromosomes. Soc Reprod Fertil Suppl 65:1–17.
Delbridge ML, Lingenfelter PA, Disteche CM, Graves JAM (1999) The candidate spermatogenesisgene RBMY has a homologue on the human X chromosome. Nat Genet 22:223–224.
Delbridge ML, Longepied G, Depetris D, et al. (2004) TSPY, the candidate gonadoblastoma geneon the human Y chromosome, has a widely expressed homologue on the X – implications forY chromosome evolution. Chromosome Res 12:345–356.
Delbridge ML, McMillan DA, Doherty RJ, Deakin JE, Graves JAM (2008) Origin and evolutionof candidate mental retardation genes on the human X chromosome (MRX). BMC Genomics9:65.
Emerson JJ, Kaessmann H, Betran E, Long M (2004) Extensive gene traffic on the mammalian Xchromosome. Science 303:537–540.
Foster JW, Graves JAM (1994) An SRY-related sequence on the marsupial X chromosome: impli-cations for the evolution of the mammalian testis-determining gene. Proc Natl Acad Sci USA91:1927–1931.
Franco MJ, Sciurano RB, Solari AJ (2007) Protein immunolocalization supports the presence ofidentical mechanisms of XY body formation in eutherians and marsupials. Chromosome Res15:815–824.
184 M.L. Delbridge
Graves JAM (1995) The origin and function of the mammalian Y chromosome and Y-borne genes–an evolving understanding. Bioessays 17:311–320.
Graves JAM (2006) Sex chromosome specialization and degeneration in mammals. Cell 124:901–914.
Graves JAM, Gecz J, Hameister H (2002) Evolution of the human X–a smart and sexy chromosomethat controls speciation and development. Cytogenet Genome Res 99:141–145.
Grützner F, Rens W, Tsend-Ayush E, et al. (2004) In the platypus a meiotic chain of ten sexchromosomes shares genes with the bird Z and mammal X chromosomes. Nature 432:913–917.
Gurbich TA, Bachtrog D (2008) Gene content evolution on the X chromosome. Curr Opin GenetDev 18:493–498.
Heard E, Disteche CM (2006) Dosage compensation in mammals: fine-tuning the expression ofthe X chromosome. Genes Dev 20:1848–1867.
Hore TA, Koina E, Wakefield MJ, Graves JAM (2007) The region homologous to the X-chromosome inactivation centre has been disrupted in marsupial and monotreme mammals.Chromosome Res 15:147–161.
Hornecker JL, Samollow PB, Robinson ES, Vandeberg JL, McCarrey JR (2007) Meiotic sexchromosome inactivation in the marsupial Monodelphis domestica. Genesis 45:696–708.
Huynh KD, Lee JT (2003) Inheritance of a pre-inactivated paternal X chromosome in early mouseembryos. Nature 426:857–862.
Khil PP, Smirnova NA, Romanienko PJ, Camerini-Otero RD (2004) The mouse X chromosome isenriched for sex-biased genes not subject to selection by meiotic sex chromosome inactivation.Nat Genet 36:642–646.
Kohn M, Kehrer-Sawatzki H, Vogel W, Graves JAM, Hameister H (2004) Wide genome compar-isons reveal the origins of the human X chromosome. Trends Genet 20:598–603.
Kohn M, Kehrer-Sawatzki H, Steinbach P, Graves JAM, Hameister H (2007) Recruitment of oldgenes to new functions: evidences obtained by comparing the orthologues of human XLMRgenes in mouse and chicken. Cytogenet Genome Res 116:173–180.
Koslowski M, Sahin U, Huber C, Tureci O (2006) The human X chromosome is enrichedfor germline genes expressed in premeiotic germ cells of both sexes. Hum Mol Genet 15:2392–2399.
Kouprina N, Mullokandov M, Rogozin IB, et al. (2004) The SPANX gene family of cancer/testis-specific antigens: rapid evolution and amplification in African great apes and hominids. ProcNatl Acad Sci USA 101:3077–3082.
Kouprina N, Pavlicek A, Noskov VN, et al. (2005) Dynamic structure of the SPANX genecluster mapped to the prostate cancer susceptibility locus HPCX at Xq27. Genome Res15:1477–1486.
Lingenfelter PA, Delbridge ML, Thomas S, et al. (2001) Expression and conservation of processedcopies of the RBMX gene. Mamm Genome 12:538–545.
Loriot A, Boon T, De Smet C (2003) Five new human cancer-germline genes identified among 12genes expressed in spermatogonia. Int J Cancer 105:371–376.
Lubs HA, Chiurazzi P, Arena JF, et al. (1996) XLMR genes: update 1996. Am J Med Genet64:147–157.
Mahadevaiah SK, Turner JM, Baudat F, et al. (2001) Recombinational DNA double-strand breaksin mice precede synapsis. Nat Genet 27:271–276.
Mahadevaiah SK, Royo H, Vandeberg JL, et al. (2009) Key features of the X inactivation processare conserved between marsupials and eutherians. Curr Biol 19:1478–1484.
McCarrey JR, Kumari M, Aivaliotis MJ, et al. (1996) Analysis of the cDNA and encoded proteinof the human testis-specific PGK-2 gene. Dev Genet 19:321–332.
Mikkelsen TS, Wakefield MJ, Aken B, et al. (2007) Genome of the marsupial Monodelphisdomestica reveals innovation in non-coding sequences. Nature 447:167–177.
Mueller JL, Mahadevaiah SK, Park PJ, et al. (2008) The mouse X chromosome is enriched formulticopy testis genes showing postmeiotic expression. Nat Genet 40:794–799.
Namekawa SH, Park PJ, Zhang LF, et al. (2006) Postmeiotic sex chromatin in the male germlineof mice. Curr Biol 16:660–667.
9 Gene Content of the Mammalian X Chromosome 185
Namekawa SH, VandeBerg JL, McCarrey JR, Lee JT (2007) Sex chromosome silencing in themarsupial male germ line. Proc Natl Acad Sci USA 104:9730–9735.
Nguyen DK, Disteche CM (2006a) Dosage compensation of the active X chromosome inmammals. Nat Genet 38:47–53.
Nguyen DK, Disteche CM (2006b) High expression of the mammalian X chromosome in brain.Brain Res 1126:46–49.
Orr HA, Coyne JA (1989) The genetics of postzygotic isolation in the Drosophila virilis group.Genetics 121:527–537.
Potrzebowski L, Vinckenbosch N, Marques AC, et al. (2008) Chromosomal gene movementsreflect the recent origin and biology of therian sex chromosomes. PLoS Biol 6:e80.
Rens W, Grützner F, O’Brien PC, et al. (2004) Resolution and evolution of the duck-billed platypuskaryotype with an X1Y1X2Y2X3Y3X4Y4X5Y5 male sex chromosome constitution. Proc NatlAcad Sci USA 101:16257–16261.
Ropers HH, Hamel BC (2005) X-linked mental retardation. Nat Rev Genet 6:46–57.Ross MT, Grafham DV, Coffey AJ, et al. (2005) The DNA sequence of the human X chromosome.
Nature 434:325–337.Rozen S, Skaletsky H, Marszalek JD, et al. (2003) Abundant gene conversion between arms of
palindromes in human and ape Y chromosomes. Nature 423:873–876.Saifi GM, Chandra HS (1999) An apparent excess of sex- and reproduction-related genes on the
human X chromosome. Proc R Soc Lond B Biol Sci 266:203–209.Schoenmakers S, Wassenaar E, Hoogerbrugge JW, et al. (2009) Female meiotic sex chromosome
inactivation in chicken. PLoS Genet 5:e1000466.Simpson AJ, Caballero OL, Jungbluth A, Chen YT, Old LJ (2005) Cancer/testis antigens,
gametogenesis and cancer. Nat Rev Cancer 5:615–625.Skaletsky H, Kuroda-Kawaguchi T, Minx PJ, et al. (2003) The male-specific region of the human
Y chromosome is a mosaic of discrete sequence classes. Nature 423:825–837.Small K, Iber J, Warren ST (1997) Emerin deletion reveals a common X-chromosome inversion
mediated by inverted repeats. Nat Genet 16:96–99.Soullier S, Hanni C, Catzeflis F, Berta P, Laudet V (1998) Male sex determination in the spiny rat
Tokudaia osimensis (Rodentia: Muridae) is not Sry dependent. Mamm Genome 9:590–592.Sutou S, Mitsui Y, Tsuchiya K (2001) Sex determination without the Y chromosome in two
Japanese rodents Tokudaia osimensis osimensis and Tokudaia osimensis spp. Mamm Genome12:17–21.
Veyrunes F, Waters PD, Miethke P, et al. (2008) Bird-like sex chromosomes of platypus implyrecent origin of mammal sex chromosomes. Genome Res 18:965–973.
Vicoso B, Charlesworth B (2006) Evolution on the X chromosome: unusual patterns and processes.Nat Rev Genet 7:645–653.
Vogel W, Jainta S, Rau W, et al. (1998) Sex determination in Ellobius lutescens: the story of anenigma. Cytogenet Cell Genet 80:214–221.
Wang PJ, McCarrey JR, Yang F, Page DC (2001) An abundance of X-linked genes expressed inspermatogonia. Nat Genet 27:422–426.
Warburton PE, Giordano J, Cheung F, Gelfand Y, Benson G (2004) Inverted repeat structure ofthe human genome: the X-chromosome contains a preponderance of large, highly homologousinverted repeats that contain testes genes. Genome Res 14:1861–1869.
Waters PD, Delbridge ML, Deakin JE, et al. (2005) Autosomal location of genes from the con-served mammalian X in the platypus (Ornithorhynchus anatinus): implications for mammaliansex chromosome evolution. Chromosome Res 13:401–410.
Waters PD, Wallis MC, Graves JAM (2007) Mammalian sex–Origin and evolution of the Ychromosome and SRY. Semin Cell Dev Biol 18:389–400.
Wilda M, Bachner D, Zechner U, et al. (2000) Do the constraints of human speciation causeexpression of the same set of genes in brain, testis, and placenta? Cytogenet Cell Genet91:300–302.
Zechner U, Wilda M, Kehrer-Sawatzki H, et al. (2001) A high density of X-linked genes for generalcognitive ability: a run-away process shaping human evolution? Trends Genet 17:697–701.

Chapter 10Marsupial Sex Chromosome Behaviour DuringMale Meiosis
Raúl Fernández-Donoso, Soledad Berríos, Julio S. Rufas, and Jesús Page
Abstract The absence of homology between sex chromosomes in marsupialsstrongly influences their behaviour during male meiosis. The highly differentiatedX and Y chromosomes perform a precise and specific meiotic program that includespairing and segregation, but lacks the usual mechanisms of synapsis, recombinationand chiasma formation that occur in the autosomes and also in the sex chromosomesof eutherian mammals. The most relevant feature of marsupial male meiosis is thedevelopment of a synaptonemal complex-derived structure called the dense plate(DP). This structure maintains the association between the asynaptic and achias-matic sex chromosomes during the first meiotic division, contributing to the propersegregation of sex chromosomes into daughter cells. Comparison of the meioticmechanism present in marsupials with those present in some eutherian mammalsopens new perspectives concerning the origin of sex chromosomes and sex chromo-some segregation in the ancestor of marsupials and placental mammals. Similarly,recent characterisation of the mechanisms involved in the inactivation of sex chro-mosomes during marsupial meiosis has led to the idea that somatic inactivationof sex chromosomes in mammals may have originated from the more ancientand conserved mechanism of meiotic sex chromosome inactivation. This clearlyplaces marsupial meiosis at the heart of the discussion concerning sex chromosomeevolution and the origin of gene dosage compensation in mammals.
Keywords Dense plate · Inactivation · Marsupial · Meiosis · Sexchromosomes · Synapsis
J. Page (B)Laboratorio C-001, Departamento de Biología, Universidad Autónoma de Madrid, Edificio deCiencias Biológicas, Cantoblanco, Madrid 28049, Spaine-mail: [email protected]
187J.E. Deakin et al. (eds.), Marsupial Genetics and Genomics,DOI 10.1007/978-90-481-9023-2_10, C© Springer Science+Business Media B.V. 2010
188 R. Fernández-Donoso et al.
10.1 Marsupial Sex Chromosomes
Marsupials are characterised by a striking conservation of their karyotypes.Chromosome numbers range from 2n = 10 to 2n = 32 in the approximate 270 recog-nised species, though there is a predominance of 2n = 14 and 2n = 22 (Sharman,1973; Hayman, 1990). Chromosome morphology is also very similar, even betweendistantly related species (Fig. 10.1). The evolution of marsupial karyotypes has beenattributed to the action of two main processes: chromosome fusion, which reduceschromosome number, and chromosome fission, which contributes to an increase inchromosome number (Svartman and Vianna-Morgante, 1998).
A second feature of marsupial karyotypes is the reduced size of sex chromo-somes, particularly the Y chromosome. Except for a few species in which one orboth sex chromosomes have been translocated to an autosomal pair, most speciesbear sex chromosomes that are much smaller than their eutherian (placental) coun-terparts (Hayman, 1990; Graves, 1996; Toder et al., 2000). The proportion of theX chromosome is estimated to represent about 3% of the haploid genome, whereasthe Y chromosome represents less than 1% (Graves, 1995). The reduction in sizeis accompanied by poor gene content. This is especially notable for the Y chromo-some, which bears the male sex determinant SRY and very few other genes (Toderet al., 2000). Indeed, different reports have indicated that the Y chromosome isdispensable for the somatic line and can be lost in some cell types (Gallardo andPaterson, 1987; Hayman, 1990; Palma, 1995; Watson et al., 1998).
A third feature of marsupial karyotypes is the absence of a region of homol-ogy between the X and Y chromosomes (Graves and Watson, 1991). This isdistinct from that observed in eutherian mammals, in which the X and Y chro-mosomes share a homologous segment called the pseudoautosomal region (PAR),and is the consequence of the complex evolutionary history of mammalian sexchromosomes. It has been proposed that X and Y chromosomes originated froman ordinary pair of autosomes in the reptilian ancestor of mammals through theacquisition by the Y chromosome of a male determining factor (Ohno, 1967). Thesuppression of recombination around this locus, putatively the SRY locus, couldhave promoted the genetic isolation and subsequent attrition of the Y chromosome,resulting in the highly differentiated sex chromosomes found today (Graves andWatson, 1991; Graves et al., 1998; Charlesworth et al., 2005; Wallis et al., 2008). Ineutherian mammals, recurrent translocation events of autosomal segments to bothsex chromosomes have occurred. These autosomal segments make up the currentPAR, which have contributed to the partial restoration of homology between theX and Y chromosomes (Graves et al., 1998; Skaletsky et al., 2003). In marsupi-als, such translocation events are rare, and except for a few species that possesslarge PARs of autosomal origin, which usually comprise the nucleolar organis-ing regions (NORs), most species show a complete lack of homology betweensex chromosomes (Hayman, 1990; Graves, 1996; Graves et al., 1998). Therefore,while eutherian sex chromosomes may have engaged in recurrent cycles of addi-tion/attrition, marsupial sex chromosomes would have undergone very few or noaddition events and extreme attrition of the Y chromosome. Nevertheless, it is
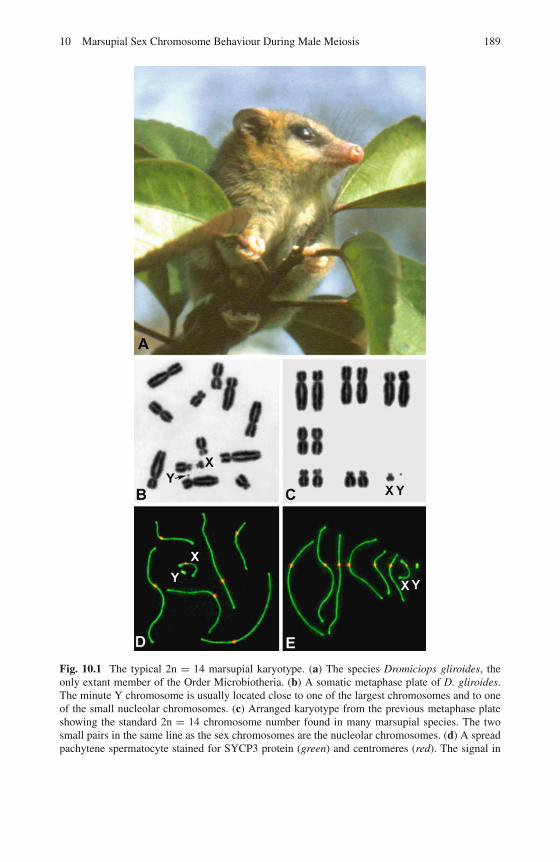
10 Marsupial Sex Chromosome Behaviour During Male Meiosis 189
Fig. 10.1 The typical 2n = 14 marsupial karyotype. (a) The species Dromiciops gliroides, theonly extant member of the Order Microbiotheria. (b) A somatic metaphase plate of D. gliroides.The minute Y chromosome is usually located close to one of the largest chromosomes and to oneof the small nucleolar chromosomes. (c) Arranged karyotype from the previous metaphase plateshowing the standard 2n = 14 chromosome number found in many marsupial species. The twosmall pairs in the same line as the sex chromosomes are the nucleolar chromosomes. (d) A spreadpachytene spermatocyte stained for SYCP3 protein (green) and centromeres (red). The signal in
190 R. Fernández-Donoso et al.
important to highlight that all marsupial species studied to date retain the Y chro-mosome, whereas some cases of complete loss of the Y chromosome have beendescribed among eutherian mammals (Fredga and Bulmer, 1988).
Recent advances in the characterisation of monotreme sex chromosomes indicatethat the evolutionary scenario described above is only valid for species included inthe therian clade. Sex chromosomes in the monotreme clade, comprised of platypusand echidnas, have a different evolutionary origin. Monotremes present a complexsystem of sex chromosomes that is composed of five X and five Y chromosomesin the platypus (Grützner et al., 2004; Rens et al., 2004), and five X and four Ychromosomes in the echidna (Rens et al., 2007). Interestingly, monotremes do nothave an SRY gene (Wallis et al., 2007), and their sex chromosomes share homologywith avian sex chromosomes (Rens et al., 2007; Veyrunes et al., 2008), a puzzlingsituation that opens numerous questions about the origin of sex chromosomes andsex determination in mammals and their reptilian relatives (Wallis et al., 2008).
10.2 Sex Chromosome Behaviour During Meiosis in Mammals
Meiosis is a specialised kind of cell division that comprises two consecutive celldivisions without a duplication of the DNA between them, resulting in haploiddaughter cells. The fusion of gametes during fertilization restores diploidy. Aspecific series of events takes place during meiosis, namely: pairing, synapsis,recombination, and segregation of homologous chromosomes. During prophase ofthe first meiotic division, homologous chromosomes associate in pairs to form thebivalents, and their association is maintained and stabilised by the synaptonemalcomplex (SC), a proteinaceous structure assembled between the two homologues.The SC consists of two lateral elements (LEs), one per homologue, called axial ele-ments (AEs) before synapsis is completed, and a series of transverse filaments (TFs)that emanate from each LE and imbricate in a zipper-like manner, organising thecentral element (CE) (von Wettstein et al., 1984; Heyting, 1996; Page and Hawley,2004). The molecular components of the SC are well characterised in mammals.SYCP2 and SYCP3 are the primary protein components of the LE (Lammers et al.,1994; Offenberg et al., 1998). SYCP1 is the main component of the TFs and the CE(Meuwissen et al., 1992), and SYCE1, SYCE2 and Tex12 are components locatedonly on the CE (Costa et al., 2005; Hamer et al., 2006).
Pairing, i.e., the close association between homologous chromosomes, andsynapsis, the formation of the SC between them, are dependent on the previous
�
Fig. 10.1 (continued) green outlines the trajectory of the synaptonemal complex. Sex chromo-somes (X, Y) appear in the same area, but there is not contact between them. (e) Arranged meiotickaryotype from the same spermatocyte shown in (d). The tiny Y chromosome is visualised assubmetacentric. To see original colors consult the PDF version
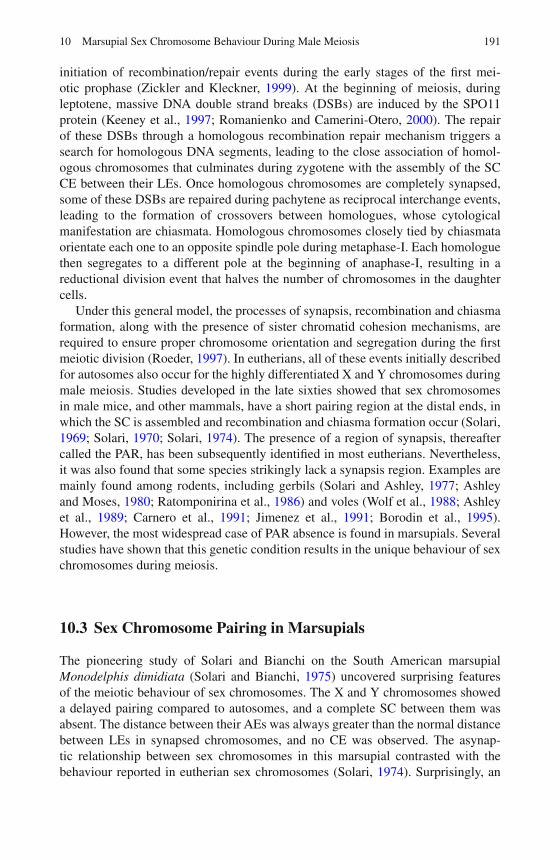
10 Marsupial Sex Chromosome Behaviour During Male Meiosis 191
initiation of recombination/repair events during the early stages of the first mei-otic prophase (Zickler and Kleckner, 1999). At the beginning of meiosis, duringleptotene, massive DNA double strand breaks (DSBs) are induced by the SPO11protein (Keeney et al., 1997; Romanienko and Camerini-Otero, 2000). The repairof these DSBs through a homologous recombination repair mechanism triggers asearch for homologous DNA segments, leading to the close association of homol-ogous chromosomes that culminates during zygotene with the assembly of the SCCE between their LEs. Once homologous chromosomes are completely synapsed,some of these DSBs are repaired during pachytene as reciprocal interchange events,leading to the formation of crossovers between homologues, whose cytologicalmanifestation are chiasmata. Homologous chromosomes closely tied by chiasmataorientate each one to an opposite spindle pole during metaphase-I. Each homologuethen segregates to a different pole at the beginning of anaphase-I, resulting in areductional division event that halves the number of chromosomes in the daughtercells.
Under this general model, the processes of synapsis, recombination and chiasmaformation, along with the presence of sister chromatid cohesion mechanisms, arerequired to ensure proper chromosome orientation and segregation during the firstmeiotic division (Roeder, 1997). In eutherians, all of these events initially describedfor autosomes also occur for the highly differentiated X and Y chromosomes duringmale meiosis. Studies developed in the late sixties showed that sex chromosomesin male mice, and other mammals, have a short pairing region at the distal ends, inwhich the SC is assembled and recombination and chiasma formation occur (Solari,1969; Solari, 1970; Solari, 1974). The presence of a region of synapsis, thereaftercalled the PAR, has been subsequently identified in most eutherians. Nevertheless,it was also found that some species strikingly lack a synapsis region. Examples aremainly found among rodents, including gerbils (Solari and Ashley, 1977; Ashleyand Moses, 1980; Ratomponirina et al., 1986) and voles (Wolf et al., 1988; Ashleyet al., 1989; Carnero et al., 1991; Jimenez et al., 1991; Borodin et al., 1995).However, the most widespread case of PAR absence is found in marsupials. Severalstudies have shown that this genetic condition results in the unique behaviour of sexchromosomes during meiosis.
10.3 Sex Chromosome Pairing in Marsupials
The pioneering study of Solari and Bianchi on the South American marsupialMonodelphis dimidiata (Solari and Bianchi, 1975) uncovered surprising featuresof the meiotic behaviour of sex chromosomes. The X and Y chromosomes showeda delayed pairing compared to autosomes, and a complete SC between them wasabsent. The distance between their AEs was always greater than the normal distancebetween LEs in synapsed chromosomes, and no CE was observed. The asynap-tic relationship between sex chromosomes in this marsupial contrasted with thebehaviour reported in eutherian sex chromosomes (Solari, 1974). Surprisingly, an
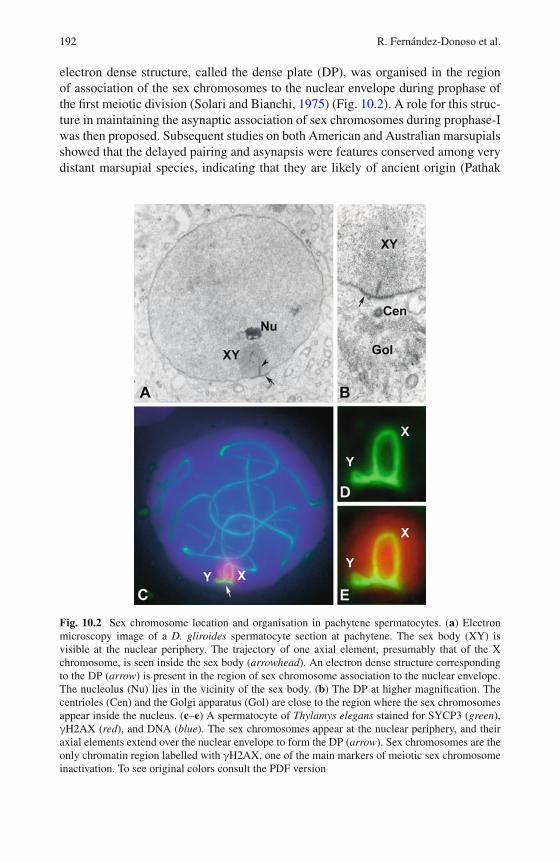
192 R. Fernández-Donoso et al.
electron dense structure, called the dense plate (DP), was organised in the regionof association of the sex chromosomes to the nuclear envelope during prophase ofthe first meiotic division (Solari and Bianchi, 1975) (Fig. 10.2). A role for this struc-ture in maintaining the asynaptic association of sex chromosomes during prophase-Iwas then proposed. Subsequent studies on both American and Australian marsupialsshowed that the delayed pairing and asynapsis were features conserved among verydistant marsupial species, indicating that they are likely of ancient origin (Pathak
Fig. 10.2 Sex chromosome location and organisation in pachytene spermatocytes. (a) Electronmicroscopy image of a D. gliroides spermatocyte section at pachytene. The sex body (XY) isvisible at the nuclear periphery. The trajectory of one axial element, presumably that of the Xchromosome, is seen inside the sex body (arrowhead). An electron dense structure correspondingto the DP (arrow) is present in the region of sex chromosome association to the nuclear envelope.The nucleolus (Nu) lies in the vicinity of the sex body. (b) The DP at higher magnification. Thecentrioles (Cen) and the Golgi apparatus (Gol) are close to the region where the sex chromosomesappear inside the nucleus. (c–e) A spermatocyte of Thylamys elegans stained for SYCP3 (green),γH2AX (red), and DNA (blue). The sex chromosomes appear at the nuclear periphery, and theiraxial elements extend over the nuclear envelope to form the DP (arrow). Sex chromosomes are theonly chromatin region labelled with γH2AX, one of the main markers of meiotic sex chromosomeinactivation. To see original colors consult the PDF version
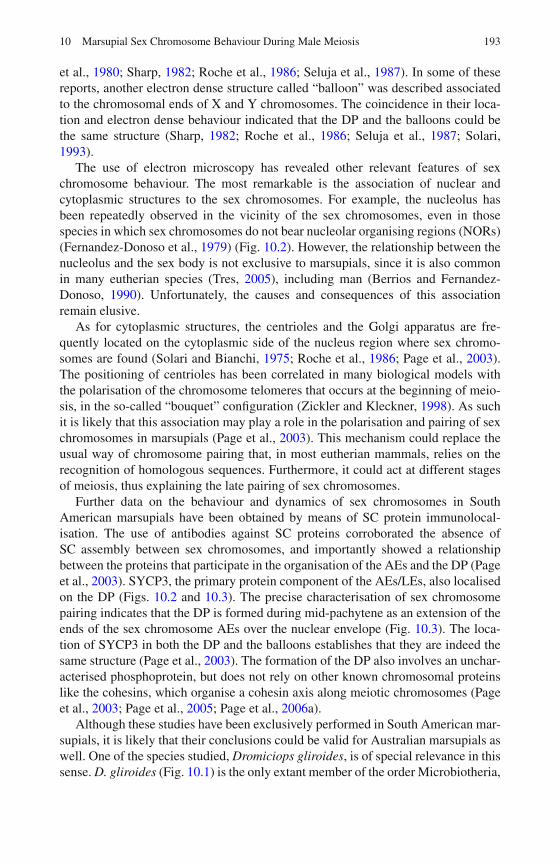
10 Marsupial Sex Chromosome Behaviour During Male Meiosis 193
et al., 1980; Sharp, 1982; Roche et al., 1986; Seluja et al., 1987). In some of thesereports, another electron dense structure called “balloon” was described associatedto the chromosomal ends of X and Y chromosomes. The coincidence in their loca-tion and electron dense behaviour indicated that the DP and the balloons could bethe same structure (Sharp, 1982; Roche et al., 1986; Seluja et al., 1987; Solari,1993).
The use of electron microscopy has revealed other relevant features of sexchromosome behaviour. The most remarkable is the association of nuclear andcytoplasmic structures to the sex chromosomes. For example, the nucleolus hasbeen repeatedly observed in the vicinity of the sex chromosomes, even in thosespecies in which sex chromosomes do not bear nucleolar organising regions (NORs)(Fernandez-Donoso et al., 1979) (Fig. 10.2). However, the relationship between thenucleolus and the sex body is not exclusive to marsupials, since it is also commonin many eutherian species (Tres, 2005), including man (Berrios and Fernandez-Donoso, 1990). Unfortunately, the causes and consequences of this associationremain elusive.
As for cytoplasmic structures, the centrioles and the Golgi apparatus are fre-quently located on the cytoplasmic side of the nucleus region where sex chromo-somes are found (Solari and Bianchi, 1975; Roche et al., 1986; Page et al., 2003).The positioning of centrioles has been correlated in many biological models withthe polarisation of the chromosome telomeres that occurs at the beginning of meio-sis, in the so-called “bouquet” configuration (Zickler and Kleckner, 1998). As suchit is likely that this association may play a role in the polarisation and pairing of sexchromosomes in marsupials (Page et al., 2003). This mechanism could replace theusual way of chromosome pairing that, in most eutherian mammals, relies on therecognition of homologous sequences. Furthermore, it could act at different stagesof meiosis, thus explaining the late pairing of sex chromosomes.
Further data on the behaviour and dynamics of sex chromosomes in SouthAmerican marsupials have been obtained by means of SC protein immunolocal-isation. The use of antibodies against SC proteins corroborated the absence ofSC assembly between sex chromosomes, and importantly showed a relationshipbetween the proteins that participate in the organisation of the AEs and the DP (Pageet al., 2003). SYCP3, the primary protein component of the AEs/LEs, also localisedon the DP (Figs. 10.2 and 10.3). The precise characterisation of sex chromosomepairing indicates that the DP is formed during mid-pachytene as an extension of theends of the sex chromosome AEs over the nuclear envelope (Fig. 10.3). The loca-tion of SYCP3 in both the DP and the balloons establishes that they are indeed thesame structure (Page et al., 2003). The formation of the DP also involves an unchar-acterised phosphoprotein, but does not rely on other known chromosomal proteinslike the cohesins, which organise a cohesin axis along meiotic chromosomes (Pageet al., 2003; Page et al., 2005; Page et al., 2006a).
Although these studies have been exclusively performed in South American mar-supials, it is likely that their conclusions could be valid for Australian marsupials aswell. One of the species studied, Dromiciops gliroides, is of special relevance in thissense. D. gliroides (Fig. 10.1) is the only extant member of the order Microbiotheria,
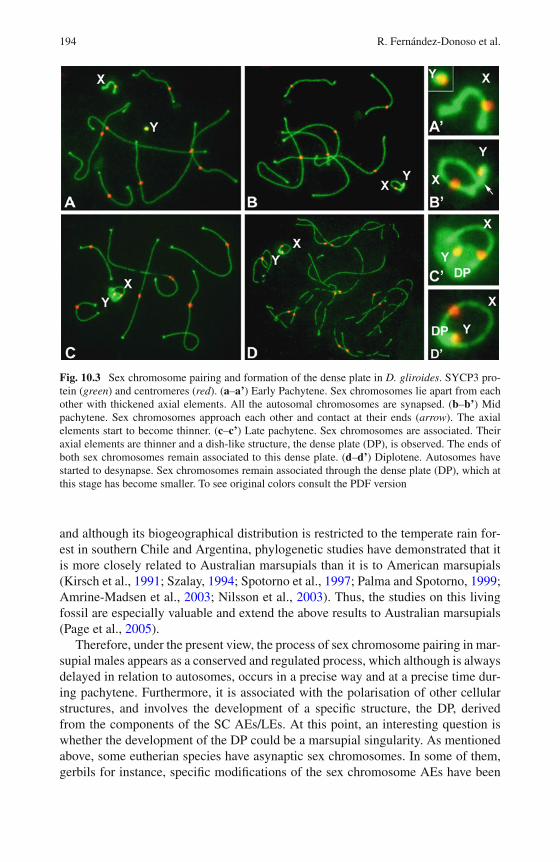
194 R. Fernández-Donoso et al.
Fig. 10.3 Sex chromosome pairing and formation of the dense plate in D. gliroides. SYCP3 pro-tein (green) and centromeres (red). (a–a’) Early Pachytene. Sex chromosomes lie apart from eachother with thickened axial elements. All the autosomal chromosomes are synapsed. (b–b’) Midpachytene. Sex chromosomes approach each other and contact at their ends (arrow). The axialelements start to become thinner. (c–c’) Late pachytene. Sex chromosomes are associated. Theiraxial elements are thinner and a dish-like structure, the dense plate (DP), is observed. The ends ofboth sex chromosomes remain associated to this dense plate. (d–d’) Diplotene. Autosomes havestarted to desynapse. Sex chromosomes remain associated through the dense plate (DP), which atthis stage has become smaller. To see original colors consult the PDF version
and although its biogeographical distribution is restricted to the temperate rain for-est in southern Chile and Argentina, phylogenetic studies have demonstrated that itis more closely related to Australian marsupials than it is to American marsupials(Kirsch et al., 1991; Szalay, 1994; Spotorno et al., 1997; Palma and Spotorno, 1999;Amrine-Madsen et al., 2003; Nilsson et al., 2003). Thus, the studies on this livingfossil are especially valuable and extend the above results to Australian marsupials(Page et al., 2005).
Therefore, under the present view, the process of sex chromosome pairing in mar-supial males appears as a conserved and regulated process, which although is alwaysdelayed in relation to autosomes, occurs in a precise way and at a precise time dur-ing pachytene. Furthermore, it is associated with the polarisation of other cellularstructures, and involves the development of a specific structure, the DP, derivedfrom the components of the SC AEs/LEs. At this point, an interesting question iswhether the development of the DP could be a marsupial singularity. As mentionedabove, some eutherian species have asynaptic sex chromosomes. In some of them,gerbils for instance, specific modifications of the sex chromosome AEs have been
10 Marsupial Sex Chromosome Behaviour During Male Meiosis 195
also described (Ratomponirina et al., 1986; de la Fuente et al., 2007). However,these modifications appear at late stages of first meiotic prophase, usually duringdiplotene, and are not as conspicuous and well developed as the DP. Therefore,development of the DP, as it has been described, seems to be exclusive to marsupials.
10.4 Sex Chromosome Segregation in Marsupials
The asynaptic nature of marsupial sex chromosomes has been accepted as evidencethat sex chromosomes are also achiasmatic (Hayman, 1990; Graves and Watson,1991). If this is the case, then it would be expected that sex chromosomes appearas univalents during the first meiotic metaphase. However, data concerning thisissue are contradictory. The seminal work of Koller showed that in five marsupialspecies studied, sex chromosomes consistently appeared associated at metaphase-Iand performed a normal reductional segregation (Koller, 1936). However, later stud-ies observed that a high incidence of sex chromosome univalents could be found insome of the same species studied by Koller (Hayman, 1990). These discrepancieshave been difficult to solve because the studies on sex chromosome segregationin marsupials have been very limited. Furthermore, the work of Koller and othersclearly predates the idea that marsupial sex chromosomes could be asynaptic, andtherefore it is not surprising that sex chromosomes were thought to be tied by achiasma (Koller, 1936; Solari and Bianchi, 1975). A recent report has proposed aplausible model that can reconcile these apparently dissimilar interpretations. Thestudy of sex chromosome segregation in the South American marsupial Thylamyselegans, revealed that the DP that organises during first meiotic prophase is main-tained until first meiotic division, providing a means for sex chromosomes to remainassociated (Page et al., 2006b) (Fig. 10.4). This report also showed that the associa-tion of sex chromosomes in this species was achiasmatic, since sex chromosomesegregation preceded the release of sister chromatid cohesion, and that the DPremained joined to the end of sex chromosomes throughout the process of orien-tation and stabilisation of these chromosomes at the metaphase-I plate. Once thesex chromosomes were properly oriented, each one facing an opposite cell pole, theDP detached from them and they initiated a precocious segregation. Therefore, thismodel accounts for the regular segregation of sex chromosomes during first meioticdivision (Koller, 1936), and also explains why in some instances, especially whenharsh chromosome spreading techniques have been used, sex chromosomes mayappear as univalents (Hayman, 1990).
Intriguingly, the DP adopted a SC-like structure at the end of prophase-I, incor-porating the SYCP1 protein of the SC central element. This organisation has alsobeen observed by electron microscopy in M. dimidiata (Solari and Bianchi, 1975),indicating that this late pattern of transformation of the DP at the end of prophase-Icould be a general process, at least in South American marsupials. The presence ofthe SC or SC-derived structures that maintain the association of achiasmatic chro-mosomes was already known for some organisms, such as butterflies and beetles
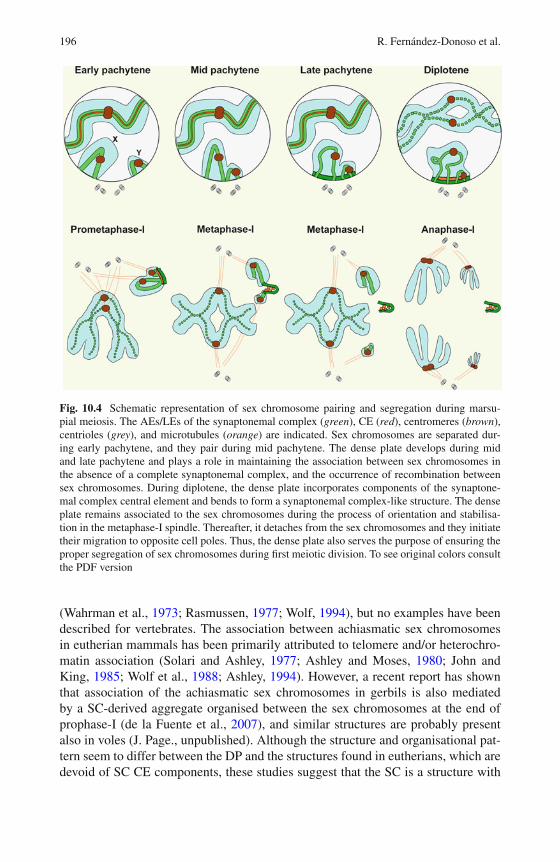
196 R. Fernández-Donoso et al.
Fig. 10.4 Schematic representation of sex chromosome pairing and segregation during marsu-pial meiosis. The AEs/LEs of the synaptonemal complex (green), CE (red), centromeres (brown),centrioles (grey), and microtubules (orange) are indicated. Sex chromosomes are separated dur-ing early pachytene, and they pair during mid pachytene. The dense plate develops during midand late pachytene and plays a role in maintaining the association between sex chromosomes inthe absence of a complete synaptonemal complex, and the occurrence of recombination betweensex chromosomes. During diplotene, the dense plate incorporates components of the synaptone-mal complex central element and bends to form a synaptonemal complex-like structure. The denseplate remains associated to the sex chromosomes during the process of orientation and stabilisa-tion in the metaphase-I spindle. Thereafter, it detaches from the sex chromosomes and they initiatetheir migration to opposite cell poles. Thus, the dense plate also serves the purpose of ensuring theproper segregation of sex chromosomes during first meiotic division. To see original colors consultthe PDF version
(Wahrman et al., 1973; Rasmussen, 1977; Wolf, 1994), but no examples have beendescribed for vertebrates. The association between achiasmatic sex chromosomesin eutherian mammals has been primarily attributed to telomere and/or heterochro-matin association (Solari and Ashley, 1977; Ashley and Moses, 1980; John andKing, 1985; Wolf et al., 1988; Ashley, 1994). However, a recent report has shownthat association of the achiasmatic sex chromosomes in gerbils is also mediatedby a SC-derived aggregate organised between the sex chromosomes at the end ofprophase-I (de la Fuente et al., 2007), and similar structures are probably presentalso in voles (J. Page., unpublished). Although the structure and organisational pat-tern seem to differ between the DP and the structures found in eutherians, which aredevoid of SC CE components, these studies suggest that the SC is a structure with
10 Marsupial Sex Chromosome Behaviour During Male Meiosis 197
surprising plasticity that, besides its role in synapsis, may also play a crucial rolein chromosome segregation when recombination and chiasma are absent betweenmeiotic chromosomes.
10.5 Sex Chromosome Inactivation
Transcriptional silencing is a characteristic feature of sex chromosomes duringmeiosis. It was recognised early that sex chromosomes appear as a compact chro-matin mass during prophase of the first meiotic division, and that this chromatindoes not transcribe (Henderson, 1963; Das et al., 1965; Monesi, 1965; Solari,1969). This process is referred to as meiotic sex chromosome inactivation (MSCI).Although it was first believed that mammalian sex chromosomes form a separatevesicle in the meiotic nucleus, as in some insects, it was eventually realised that thisis not the case, and the term sex body was coined to describe the special configura-tion of sex chromosomes in mammals (Solari, 1974). The reason why sex chromo-somes remain inactive has been a matter of debate for years (Handel and Hunt, 1992;McKee and Handel, 1993), but it is currently accepted that it is due to the presenceof unsynapsed AEs at non-homologous regions of both the X and the Y chromo-somes (Turner et al., 2004; Turner, 2007). It is now established that MSCI is aspecial case of a more general process called meiotic silencing of unsynapsed chro-matin (MSUC) that affects both autosomes and sex chromosomes in a wide range oforganisms, from worms to vertebrates (Schimenti, 2005; Turner et al., 2005; Kellyand Aramayo, 2007). In eutherian mammals, MSUC is initiated by the persistenceof recombination/repair components like BRCA1 and ATR on unsynapsed sex chro-mosomal AEs during prophase-I. This induces a deep chromatin remodelling inthese regions, which involves: (1) modification of histones, the most relevant beingthe phosphorylation of histone variant H2AX at serine 139 (γH2AX) (Mahadevaiahet al., 2001; Fernandez-Capetillo et al., 2003), ubiquitination of H2A (Baarendset al., 2005), and methylation and deacetylation of H3 and H4 (Khalil et al., 2004;Khalil and Driscoll, 2006); (2) the incorporation of specific histones like macroH2A(Hoyer-Fender et al., 2000) and H3.3 (van der Heijden et al., 2007); (3) the specificincorporation of some proteins like XY77 (Kralewski and Benavente, 1997), HP1(Motzkus et al., 1999), XMR (Escalier and Garchon, 2000), SUMO-1 (Rogers et al.,2004), Maelstrom (Costa et al., 2006) and others (Hoyer-Fender, 2003; Handel,2004); and (4) the association of non coding RNAs like XIST (Ayoub et al., 1997)and micro RNAs (Marcon et al., 2008). Some of these chromatin modifications arelost throughout meiosis, whereas others are maintained until postmeiotic stages ofspermatid differentiation (Namekawa et al., 2006; Turner et al., 2006).
Although MSCI has been intensively studied in eutherian models, early studieshave shown that marsupial sex chromosomes similarly formed a sex body duringmeiosis (Solari and Bianchi, 1975; Fernandez-Donoso et al., 1979) (Fig. 10.2).More recently, it has been reported that marsupial sex chromosomes are subjectedto MSCI, and that some of the chromatin modifications found in eutherians, like
198 R. Fernández-Donoso et al.
γH2AX, H3 methylation, and HP1 incorporation, also occur in South Americanmarsupials (Franco et al., 2007; Hornecker et al., 2007; Namekawa et al., 2007)(Fig. 10.2). Likewise, postmeiotic sex chromosome inactivation has been reportedin marsupials (Hornecker et al., 2007; Namekawa et al., 2007), suggesting thatsome of the mechanisms that govern MSCI are conserved in therian mammals.Nevertheless, the pattern of loading and release of some MSCI markers differsbetween eutherians and marsupials, since some MSCI markers that disappear fromeutherian sex chromosomes at the end of first meiotic prophase are maintained inmarsupials until spermatid differentiation (Namekawa et al., 2007). Initial reportsindicated that postmeiotic sex chromosome inactivation could be more stringent inmarsupials than in eutherians (Hornecker et al., 2007). However, other authors havereported contrasting results on the analysis of postmeiotic sex chromosome inactiva-tion in marsupials, indicating that the X chromosome is reactivated in the spermatids(Mahadevaiah et al., 2009). Obviously, more studies are necessary to elucidate thisissue.
The existence of specific mechanisms of sex chromosome inactivation dur-ing spermatogenesis may have interesting consequences for the understanding ofsomatic X chromosome inactivation (XCI). It is well established that one of the Xchromosomes in mammalian females is inactivated in the somatic cell line (Lyon,1961). XCI in eutherian mammals occurs mostly at random in the embryo tis-sues, so that the X chromosome from either paternal or maternal origin can beinactivated, but it exclusively affects the paternally derived X chromosome in theextra-embryonic tissues of mice and cattle. The initiation of XCI relies on the acti-vation of the XIST locus and the coating of one of the X chromosomes with thisnon-transcribed RNA, which subsequently leads to the incorporation of a plethoraof chromatin modifications that stabilises and maintains the silencing of the Xchromosome (Avner and Heard, 2001). While this pattern is well defined for euthe-rians, several differences have been observed regarding this process in marsupials.The most relevant is that inactivation in both embryonic and extra-embryonic tis-sues always affects the X chromosome of paternal origin (Cooper, 1971; Sharman,1971; Graves, 1996). Other differences are related to the mechanisms that trig-ger and maintain X chromosome inactivation. Strikingly, marsupials do not havean XIST gene (Davidow et al., 2007; Hore et al., 2007; Mikkelsen et al., 2007;Shevchenko et al., 2007), and although some chromatin modifications involved inthe maintenance of the inactive state of the X chromosome are shared with euthe-rians (Wakefield et al., 1997; Mahadevaiah et al., 2009) some others have not beenfound in marsupials (Koina et al., 2009).
On these grounds, there is increasing support of the hypothesis that somatic XCImight have arisen in both eutherians and marsupials from the more general and con-served mechanism of MSCI (Cooper, 1971; Ayoub et al., 1997; McCarrey, 2001;Huynh and Lee, 2005; Hornecker et al., 2007; Namekawa et al., 2007). Accordingto this hypothesis, MSCI during meiosis could result in the transmission of animprinted X-inactivated chromosome from the sperm to the zygote. This inacti-vated X chromosome of paternal origin would remain so in marsupials, and alsoin the extra-embryonic tissues in eutherian mammals. The subsequent rising of
10 Marsupial Sex Chromosome Behaviour During Male Meiosis 199
XIST in eutherian mammals could have allowed for the establishment of randomX chromosome inactivation in the somatic tissues.
Although this is an appealing hypothesis, it is not exempt from obstacles. Forexample, it is not clear how the epigenetic markers on the paternal X chromosomecould be transmitted. Histone or DNA modifications have not been observed to betransmitted through the sperm in mammals, although contradictory results have beenreported (Huynh and Lee, 2003; Okamoto et al., 2005). Likewise, there are no datarelative to the activation/inactivation of sex chromosomes in the marsupial zygoteand early embryos that could shed light into this issue. Finally, the inactivation ofsex chromosomes is currently known to be far more complex and incomplete thanpreviously thought in both eutherians and marsupials (Carrel and Willard, 2005;Chow and Heard, 2009). Moreover, the recent finding that the X chromosome inmarsupials can be reactivated in spermatids (Mahadevaiah et al., 2009) severelycompromises the hypothesis of an meiosis-inactivated X chromosome being trans-mitted through the sperm. Once again, more experimental evidences are necessarybefore this idea can be confirmed or refuted.
10.6 Future Prospects
Despite recent advances in our understanding of marsupial sex chromosomebehaviour during meiosis, several questions remain to be addressed. For example,the causes of SC absence between sex chromosomes seem to be more complexthat previously thought. While it is assumed that in most marsupials species X andY chromosomes do not possess a homologous region (Hayman, 1990; Graves andWatson, 1991), this inference was made mostly from meiotic studies that describedthe absence of synapsis between sex chromosomes in meiosis (Solari and Bianchi,1975; Sharp, 1982). However, when more specific studies have been developedto assess the extent of homology between sex chromosomes, it was found thatsex chromosomes in several species bear NORs in both sex chromosomes (Sharp,1982; Hayman, 1990). In fact, sex chromosomes cross-hybridise using chromosomeprobes in some of these species (Toder et al., 1997). Nevertheless, these homologousregions are not able to promote sex chromosome synapsis, which is only observed inthose species with complex and large sex chromosomes, such as XY1Y2 or X1X2Y,or in those in which both sex chromosomes have been translocated to autosomes(Sharp, 1982). Therefore, it is likely that the program of sex chromosome behaviourincludes the proscription of SC formation in the absence of an extensive and/or func-tional homologous region (Hayman, 1990). As such, it would be relevant to studythe process of sex chromosome pairing in a wider range of species with translocatedsex chromosomes in order to test if these translocated segments allow sex chromo-some synapsis, and also to explore if sex chromosomes in these cases develop a DPor any other modification of their AEs.
A second issue that deserves further attention is the evolutionary origin of SCmodifications that leads to the formation of the DP. The fact that many eutherian
200 R. Fernández-Donoso et al.
species also lack PARs, and develop SC-derived structures to associate and segre-gate achiasmatic sex chromosomes (de la Fuente et al., 2007), indicates that thefeatures displayed during marsupial meiosis might not be exclusive to this group.For example, it is possible that the absence of a PAR and the presence of SCcomplex-derived structures associated with sex chromosomes stem from the therianancestor of marsupials and eutherians. Under this scenario, marsupials would havemaintained the ancestral mechanism of sex chromosome pairing and segregation.This would be in agreement with other cytogenetic features of the group, such asthe extreme conservation of their karyotypes and the perpetuation of the Y chromo-some, even though this chromosome is extremely reduced in size and gene number.This could be considered as proof that marsupials represent a frozen pathway inmammalian sex chromosome evolution, but conversely could be interpreted in termsof the “6% solution” proposed by Kirsch (Kirsch, 1977). This hypothesis states thatsome of the supposed primitive features of marsupials have been conserved simplybecause they represent extraordinary adaptive solutions to specific biological prob-lems. On the other hand, eutherians would have followed a different evolutionarypathway that has resulted in a more dynamic karyotypic evolution, recurrent lossand addition of PARs to the sex chromosomes, and eventual loss of Y chromosomesin some species. Further studies on the nature of sex chromosomes and sex chromo-some behaviour in eutherians lacking PARs could bring interesting information totest if modifications of the SC act as an ancient backup system to segregate achias-mate chromosomes in mammals. Unfortunately, little information is expected fromthe study of monotremes, as their complex sex chromosome system makes it veryunlikely that they could represent the model from which therian sex chromosomesevolved. The study of other groups, such as some reptiles with XY determinationsystems (obviously not birds), could provide data relevant to this issue.
Finally, research concerning the mechanisms and origin of sex chromosomeinactivation in mammals, both during male meiosis and in the female somaticline, is now being conducted and is sure to bring exciting results in the future.The study of marsupials could be relevant to understand the universality of themechanisms described in eutherians. Likewise, the recent characterisation of somefeatures of somatic X chromosome inactivation in monotremes (Deakin et al., 2008;Daish and Grützner, 2009) opens new lines of interpretation about the origin ofdosage compensation in mammals. The extent of MSCI has not been investigatedin monotremes, but the recent discovery of MSCI in birds (Schoenmakers et al.,2009) suggests that it could be more conserved than was previously recognised.Therefore, it seems likely that this mechanism could be related to the origin of genedosage compensation in mammals.
Research into marsupial genetics, genomics, and cell biology in coming yearswill aid in the understanding of the general processes that to date have only beenstudied in eutherians. Sequencing of marsupial genomes has already fulfilled anextraordinary goal in this effort to put marsupials at the centre of mammaliangenetics (Mikkelsen et al., 2007). The study of marsupial meiosis will also con-tribute relevant information concerning our general understanding of meiosis andmammalian genetics and cell biology.
10 Marsupial Sex Chromosome Behaviour During Male Meiosis 201
Acknowledgments This work was supported by FONDECYT grant 1080090 (Chile), grantBFU2009-10987 from Ministerio de Ciencia e Innovación and grant A/017762/08 from AgenciaEspañola de Cooperación Internacional para el Desarrollo (Spain).
References
Amrine-Madsen H, Scally M, Westerman M, Stanhope MJ, Krajewski C, Springer MS (2003)Nuclear gene sequences provide evidence for the monophyly of australidelphian marsupials.Mol Phylogenet Evol 28:186–196.
Ashley T (1994) Mammalian meiotic recombination: a reexamination. Hum Genet 94:587–593.Ashley T, Moses MJ (1980) End association and segregation of the achiasmatic X and Y
chromosomes of the sand rat, Psammomys obesus. Chromosoma 78:203–210.Ashley T, Jaarola M, Fredga K (1989) Absence of synapsis during pachynema of the normal sized
sex chromosomes of Microtus arvalis. Hereditas 111:295–304.Avner P, Heard E (2001) X-chromosome inactivation: counting, choice and initiation. Nat Rev
Genet 2:59–67.Ayoub N, Richler C, Wahrman J (1997) Xist RNA is associated with the transcriptionally inactive
XY body in mammalian male meiosis. Chromosoma 106:1–10.Baarends WM, Wassenaar E, van der Laan R, et al. (2005) Silencing of unpaired chromatin and
histone H2A ubiquitination in mammalian meiosis. Mol Cell Biol 25:1041–1053.Berrios S, Fernandez-Donoso R (1990) Nuclear architecture of human pachytene spermato-
cytes: quantitative analysis of associations between nucleolar and XY bivalents. Hum Genet86:103–116.
Borodin PM, Sablina OV, Rodionova MI (1995) Pattern of X-Y chromosome pairing in microtinerodents. Hereditas 123:17–23.
Carnero A, Jimenez R, Burgos M, Sanchez A, de la Guardia R (1991) Achiasmatic sex chromo-somes in Pitymys duodecimcostatus: mechanisms of association and segregation. CytogenetCell Genet 56:78–81.
Carrel L, Willard HF (2005) X-inactivation profile reveals extensive variability in X-linked geneexpression in females. Nature 434:400–404.
Cooper DW (1971) Directed genetic change model for X chromosome inactivation in eutherianmammals. Nature 230:292–294.
Costa Y, Speed R, Ollinger R, et al. (2005) Two novel proteins recruited by synaptonemal complexprotein 1 (SYCP1) are at the centre of meiosis. J Cell Sci 118:2755–2762.
Costa Y, Speed RM, Gautier P, et al. (2006) Mouse MAELSTROM: the link between meioticsilencing of unsynapsed chromatin and microRNA pathway? Hum Mol Genet 15:2324–2334.
Charlesworth D, Charlesworth B, Marais G (2005) Steps in the evolution of heteromorphic sexchromosomes. Heredity 95:118–128.
Chow J, Heard E (2009) X inactivation and the complexities of silencing a sex chromosome. CurrOpin Cell Biol 21:359–366.
Daish T, Grützner F (2009) Location, location, location! Monotremes provide unique insights intothe evolution of sex chromosome silencing in mammals. DNA Cell Biol 28:91–100.
Das NK, Siegel EP, Alfert M (1965) Synthetic activities during spermatogenesis in the locust. JCell Biol 25:387–395.
Davidow LS, Breen M, Duke SE, Samollow PB, McCarrey JR, Lee JT (2007) The search for amarsupial XIC reveals a break with vertebrate synteny. Chromosome Res 15:137–146.
de la Fuente R, Parra MT, Viera A, et al. (2007) Meiotic pairing and segregation of achiasmate sexchromosomes in eutherian mammals: the role of SYCP3 protein. PLoS Genet 3:e198.
Deakin JE, Hore TA, Koina E, Graves JAM (2008) The status of dosage compensation in themultiple X chromosomes of the platypus. PLoS Genet 4:e1000140.
Escalier D, Garchon HJ (2000) XMR is associated with the asynapsed segments of sex chromo-somes in the XY body of mouse primary spermatocytes. Chromosoma 109:259–265.
202 R. Fernández-Donoso et al.
Fernandez-Capetillo O, Mahadevaiah SK, Celeste A, et al. (2003) H2AX is required for chromatinremodeling and inactivation of sex chromosomes in male mouse meiosis. Dev Cell 4:497–508.
Fernandez-Donoso R, Berrios S, Pincheira J (1979) Position of the nucleolus within the nucleiof pachytene spermatocytes of Dromiciops australis and Marmosa elegans (Didelphoidea-Marsupialia). Experientia 35:1021–1023.
Franco MJ, Sciurano RB, Solari AJ (2007) Protein immunolocalization supports the presence ofidentical mechanisms of XY body formation in eutherians and marsupials. Chromosome Res15:815–824.
Fredga K, Bulmer MG (1988) Aberrant Chromosomal Sex-Determining Mechanisms in Mammals,with Special Reference to Species with XY Females [and Discussion]. Phil Trans R Soc LondonB 322:83–95.
Gallardo MH, Paterson BD (1987) An additional 14-chromosome karyotype and sex-chromosomemosaicism in South American marsupials. Fieldiana Zool 39:111–116.
Graves JAM (1995) The origin and function of the mammalian Y chromosome and Y-borne genes –an evolving understanding. Bioessays 17:311–320.
Graves JAM (1996) Mammals that break the rules: genetics of marsupials and monotremes. AnnuRev Genet 30:233–260.
Graves JAM, Watson JM (1991) Mammalian sex chromosomes: evolution of organization andfunction. Chromosoma 101:63–68.
Graves JAM, Wakefield MJ, Toder R (1998) The origin and evolution of the pseudoautosomalregions of human sex chromosomes. Hum Mol Genet 7:1991–1996.
Grützner F, Rens W, Tsend-Ayush E, et al. (2004) In male platypus a meiotic chain of ten sexchromosomes shares genes with the bird Z and mammal X chromosomes. Nature 432:913–917.
Hamer G, Gell K, Kouznetsova A, Novak I, Benavente R, Hoog C (2006) Characterization of anovel meiosis-specific protein within the central element of the synaptonemal complex. J CellSci 119:4025–4032.
Handel MA (2004) The XY body: a specialized meiotic chromatin domain. Exp Cell Res296:57–63.
Handel MA, Hunt PA (1992) Sex-chromosome pairing and activity during mammalian meiosis.Bioessays 14:817–822.
Hayman DL (1990) Marsupial cytogenetics. Aust J Zool 37:331–349.Henderson SA (1963) Differential Ribonucleic Acid Synthesis of X and Autosomes During
Meiosis. Nature 200:1235.Heyting C (1996) Synaptonemal complexes: structure and function. Curr Opin Cell Biol
8:389–396.Hore TA, Koina E, Wakefield MJ, Marshall Graves JAM (2007) The region homologous to the
X-chromosome inactivation centre has been disrupted in marsupial and monotreme mammals.Chromosome Res 15:147–161.
Hornecker JL, Samollow PB, Robinson ES, Vandeberg JL, McCarrey JR (2007) Meiotic sexchromosome inactivation in the marsupial Monodelphis domestica. Genesis 45:696–708.
Hoyer-Fender S (2003) Molecular aspects of XY body formation. Cytogenet Genome Res103:245–255.
Hoyer-Fender S, Costanzi C, Pehrson JR (2000) Histone macroH2A1.2 is concentrated in the XY-body by the early pachytene stage of spermatogenesis. Exp Cell Res 258:254–260.
Huynh KD, Lee JT (2003) Inheritance of a pre-inactivated paternal X chromosome in early mouseembryos. Nature 426:857–862.
Huynh KD, Lee JT (2005) X-chromosome inactivation: a hypothesis linking ontogeny andphylogeny. Nat Rev Genet 6:410–418.
Jimenez R, Carnero A, Burgos M, Sanchez A, de la Guardia R (1991) Achiasmatic giant sexchromosomes in the vole Microtus cabrerae (Rodentia, Microtidae). Cytogenet Cell Genet57:56–58.
John B, King M (1985) Pseudoterminalisation, terminalisation and non-chiasmate modes ofterminal association. Chromosoma 92:89–99.
10 Marsupial Sex Chromosome Behaviour During Male Meiosis 203
Keeney S, Giroux CN, Kleckner N (1997) Meiosis-specific DNA double-strand breaks arecatalyzed by Spo11, a member of a widely conserved protein family. Cell 88:375–384.
Kelly WG, Aramayo R (2007) Meiotic silencing and the epigenetics of sex. Chromosome Res15:633–651.
Khalil AM, Driscoll DJ (2006) Histone H3 lysine 4 dimethylation is enriched on the inactive sexchromosomes in male meiosis but absent on the inactive X in female somatic cells. CytogenetGenome Res 112:11–15.
Khalil AM, Boyar FZ, Driscoll DJ (2004) Dynamic histone modifications mark sex chromosomeinactivation and reactivation during mammalian spermatogenesis. Proc Natl Acad Sci USA101:16583–16587.
Kirsch JA (1977) The six-percent solution: second thoughts on the adaptedness of the marsupialia.Am Sci 65:276–288.
Kirsch JA, Dickerman AW, Reig OA, Springer MS (1991) DNA hybridization evidence for theAustralasian affinity of the American marsupial Dromiciops australis. Proc Natl Acad Sci USA88:10465–10469.
Koina E, Chaumeil J, Greaves I, Tremethick D, Graves JAM (2009) Specific patterns of histonemarks accompany X chromosome inactivation in a marsupial. Chromosome Res 17:115–126.
Koller PC (1936) The genetical and mechanical properties of chromosomes. II. Marsupials. J Genet32:452–472.
Kralewski M, Benavente R (1997) XY body formation during rat spermatogenesis: an immuno-cytochemical study using antibodies against XY body-associated proteins. Chromosoma106:304–307.
Lammers JHM, Offenberg HH, van Aalderen M, Vink ACG, Dietrich AJJ, Heyting C (1994) Thegene encoding a major component of the lateral elements of synaptonemal complexes of the ratis related to X-linked lymphocyte-regulated genes. Mol Cell Biol 14:1137–1146.
Lyon MF (1961) Gene action in the X-chromosome of the mouse (Mus musculus L). Nature190:372–373.
Mahadevaiah SK, Turner JM, Baudat F, et al. (2001) Recombinational DNA double-strand breaksin mice precede synapsis. Nat Genet 27:271–276.
Mahadevaiah SK, Royo H, Vandeberg JL, McCarrey JR, Mackay S, Turner JM (2009) Key fea-tures of the X inactivation process are conserved between marsupials and eutherians. Curr Biol19:1478–1484.
Marcon E, Babak T, Chua G, Hughes T, Moens PB (2008) miRNA and piRNA localization in themale mammalian meiotic nucleus. Chromosome Res 16:243–260.
McCarrey JR (2001) X-chromosome inactivation during spermatogenesis: the original dosagecompensation mechanism in mammals? In: Xue G, Xue Y, Xu Z, Holmes R, Hammond GL,Lim HA (eds) Gene Families: Studies of DNA, RNA, Enzymes and Proteins. World Scientific,River Edge.
McKee BD, Handel MA (1993) Sex chromosomes, recombination, and chromatin conformation.Chromosoma 102:71–80.
Meuwissen RLJ, Offenberg HH, Dietrich AJJ, Riesewijk A, van Iersel M, Heyting C (1992) Acoiled-coil related protein specific for synapsed regions of meiotic prophase chromosomes.Embo J 11:5091–5100.
Mikkelsen TS, Wakefield MJ, Aken B, et al. (2007) Genome of the marsupial Monodelphisdomestica reveals innovation in non-coding sequences. Nature 447:167–177.
Monesi V (1965) Differential rate of ribonucleic acid synthesis in the autosomes and sexchromosomes during male meiosis in the mouse. Chromosoma 17:11–21.
Motzkus D, Singh PB, Hoyer-Fender S (1999) M31, a murine homolog of Drosophila HP1, isconcentrated in the XY body during spermatogenesis. Cytogenet Cell Genet 86:83–88.
Namekawa SH, Park PJ, Zhang LF, et al. (2006) Postmeiotic sex chromatin in the male germlineof mice. Curr Biol 16:660–667.
Namekawa SH, VandeBerg JL, McCarrey JR, Lee JT (2007) Sex chromosome silencing in themarsupial male germ line. Proc Natl Acad Sci USA 104:9730–9735.
204 R. Fernández-Donoso et al.
Nilsson MA, Gullberg A, Spotorno AE, Arnason U, Janke A (2003) Radiation of extant marsupialsafter the K/T boundary: evidence from complete mitochondrial genomes. J Mol Evol 57(Suppl1):S3–S12.
Offenberg HH, Schalk JA, Meuwissen RL, et al. (1998) SCP2: a major protein component of theaxial elements of synaptonemal complexes of the rat. Nucleic Acids Res 26:2572–2579.
Ohno S (1967) Sex Chromosomes and Sex Linked Genes. Springer, Berlin.Okamoto I, Arnaud D, Le Baccon P, et al. (2005) Evidence for de novo imprinted X-chromosome
inactivation independent of meiotic inactivation in mice. Nature 438:369–373.Page J, Berrios S, Rufas JS, et al. (2003) The pairing of X and Y chromosomes during meiotic
prophase in the marsupial species Thylamys elegans is maintained by a dense plate developedfrom their axial elements. J Cell Sci 116:551–560.
Page J, Berrios S, Parra MT, et al. (2005) The program of sex chromosome pairing in meio-sis is highly conserved across marsupial species: implications for sex chromosome evolution.Genetics 170:793–799.
Page J, de la Fuente R, Gomez R, et al. (2006a). Sex chromosomes, synapsis, and cohesins: acomplex affair. Chromosoma 115:250–259.
Page J, Viera A, Parra MT, et al. (2006b). Involvement of synaptonemal complex proteins in sexchromosome segregation during marsupial male meiosis. PLoS Genet 2:e136.
Page SL, Hawley RS (2004) The genetics and molecular biology of the synaptonemal complex.Annu Rev Cell Dev Biol 20:525–558.
Palma RE (1995) The karyotypes of two South American mouse opossums of the genus Thylamys(Marsupialia: Didelphidae), from the Andes and eastern Paraguay. Proc Biol Soc Wash108:1–5.
Palma RE, Spotorno AE (1999) Molecular systematics of marsupials based on the rRNA 12Smitochondrial gene: the phylogeny of didelphimorphia and of the living fossil microbiotheriidDromiciops gliroides thomas. Mol Phylogenet Evol 13:525–535.
Pathak S, Elder FF, Maxwell BL (1980) Asynaptic behavior of X and Y chromosomes in theVirginia oppossum and the southern pygmy mouse. Cytogenet Cell Genet 26:142–149.
Rasmussen SW (1977) The transformation of the Synaptonemal Complex into the ‘eliminationchromatin’ in Bombyx mori oocytes. Chromosoma 60:205–221.
Ratomponirina C, Viegas-Pequignot E, Dutrillaux B, Petter F, Rumpler Y (1986) Synaptonemalcomplexes in Gerbillidae: probable role of intercalated heterochromatin in gonosome-autosometranslocations. Cytogenet Cell Genet 43:161–167.
Rens W, Grützner F, O’Brien PCM, Fairclough H, Graves JAM, Ferguson-Smith MA(2004) Resolution and evolution of the duck-billed platypus karyotype with anX1Y1X2Y2X3Y3X4Y4X5Y5 male sex chromosome constitution. Proc Natl Acad Sci USA101:16257–16261.
Rens W, O’Brien P, Grutzner F, et al. (2007) The multiple sex chromosomes of platypus andechidna are not completely identical and several share homology with the avian Z. GenomeBiol 8:R243.
Roche L, Seluja G, Wettstein R (1986) The meiotic behaviour of the XY pair in Lutreolinacrassicaudata (Marsupialia: Didelphoidea). Genetica 71:213–224.
Roeder GS (1997) Meiotic chromosomes: it takes two to tango. Genes Dev 11:2600–2621.Rogers RS, Inselman A, Handel MA, Matunis MJ (2004) SUMO modified proteins localize to the
XY body of pachytene spermatocytes. Chromosoma 113:233–243.Romanienko PJ, Camerini-Otero RD (2000) The mouse Spo11 gene is required for meiotic
chromosome synapsis. Mol Cell 6:975–987.Schimenti J (2005) Synapsis or silence. Nat Genet 37:11–13.Schoenmakers S, Wassenaar E, Hoogerbrugge JW, Laven JSE, Grootegoed JA, Baarends WM
(2009) Female meiotic sex chromosome inactivation in chicken. PLoS Genet 5:e1000466.Seluja G, Roche L, Solari AJ (1987) Male meiotic prophase in Didelphis albiventris. J Heredity
78:218–222.
10 Marsupial Sex Chromosome Behaviour During Male Meiosis 205
Sharman GB (1971) Late DNA replication in the paternally derived X chromosome of femalekangaroos. Nature 230:231–232.
Sharman GB (1973) The chromosomes of non-eutherian mammals. In: Chiarelli AB, Capanna E(eds) Cytotaxonomy and Vertebrate Evolution. Academic Press, London.
Sharp P (1982) Sex chromosome pairing during male meiosis in marsupials. Chromosoma 86:27–47.
Shevchenko AI, Zakharova IS, Elisaphenko EA, et al. (2007) Genes flanking Xist in mouse andhuman are separated on the X chromosome in American marsupials. Chromosome Res 15:127–136.
Skaletsky H, Kuroda-Kawaguchi T, Minx PJ, et al. (2003) The male-specific region of the humanY chromosome is a mosaic of discrete sequence classes. Nature 423:825–837.
Solari AJ (1969) The evolution of the ultrastructure of the sex chromosomes (sex vesicle) duringmeiotic prophase in mouse spermatocytes. J Ultrastruct Res 27:289–305.
Solari AJ (1970) The spatial relationship of the X and Y chromosomes during meiotic prophase inmouse spermatocytes. Chromosoma 29:217–236.
Solari AJ (1974) The behavior of the XY pair in mammals. Int Rev Cytol 38:273–317.Solari AJ (1993) Sex Chromosomes and Sex Determination in Vertebrates. CRC Press, Boca
Raton, FL.Solari AJ, Ashley T (1977) Ultrastructure and behavior of the achiasmatic, telosynaptic XY pair
of the sand rat (Psammomys obesus). Chromosoma 62:319–336.Solari AJ, Bianchi NO (1975) The synaptic behaviour of the X and Y chromosomes in the
marsupial Monodelphis dimidiata. Chromosoma 52:11–25.Spotorno AE, Marin JC, Yévenes M, et al. (1997) Chromosome divergences among American
marsupials and the Australian affinities of the American Dromiciops. J Mamm Evol4:259–269.
Svartman M, Vianna-Morgante AM (1998) Karyotype evolution of marsupials: from higher tolower diploid numbers. Cytogenet Cell Genet 82:263–266.
Szalay FS (1994) Evolutionary History of Marsupials and an Analysis of Osteological Characters.Cambridge University Press, Cambridge, MA.
Toder R, Wienberg J, Voullaire L, O’Brien PC, Maccarone P, Graves JAM (1997) SharedDNA sequences between the X and Y chromosomes in the tammar wallaby – evidence forindependent additions to eutherian and marsupial sex chromosomes. Chromosoma 106:94–98.
Toder R, Wakefield MJ, Graves JAM (2000) The minimal mammalian Y chromosome – themarsupial Y as a model system. Cytogenet Cell Genet 91:285–292.
Tres LL (2005) XY chromosomal bivalent: nucleolar attraction. Mol Reprod Dev 72:1–6.Turner JM (2007) Meiotic sex chromosome inactivation. Development 134:1823–1831.Turner JM, Aprelikova O, Xu X, et al. (2004) BRCA1, histone H2AX phosphorylation, and male
meiotic sex chromosome inactivation. Curr Biol 14:2135–2142.Turner JM, Mahadevaiah SK, Fernandez-Capetillo O, et al. (2005) Silencing of unsynapsed meiotic
chromosomes in the mouse. Nat Genet 37:41–47.Turner JM, Mahadevaiah SK, Ellis PJ, Mitchell MJ, Burgoyne PS (2006) Pachytene asynapsis
drives meiotic sex chromosome inactivation and leads to substantial postmeiotic repression inspermatids. Dev Cell 10:521–529.
van der Heijden GW, Derijck AA, Posfai E, et al. (2007) Chromosome-wide nucleosome replace-ment and H3.3 incorporation during mammalian meiotic sex chromosome inactivation. NatGenet 39:251–258.
Veyrunes F, Waters PD, Miethke P, et al. (2008) Bird-like sex chromosomes of platypus implyrecent origin of mammal sex chromosomes. Genome Res 18:965–973.
von Wettstein D, Rasmussen SW, Holm PB (1984) The synaptonemal complex in geneticsegregation. Annu Rev Genet 18:331–413.
Wahrman J, Nezer R, Freund O (1973) Multiple chromosome mechanisms with ‘segregationbodies’. Chromosome Today 4:434.

206 R. Fernández-Donoso et al.
Wakefield MJ, Keohane AM, Turner BM, Graves JAM (1997) Histone underacetylation is anancient component of mammalian X chromosome inactivation. Proc Natl Acad Sci USA94:9665–9668.
Wallis M, Waters PD, Delbridge ML, et al. (2007) Sex determination in platypus and echidna:autosomal location of SOX3 confirms the absence of SRY from monotremes. ChromosomeRes 15:949–959.
Wallis M, Waters PD, Graves JAM (2008) Sex determination in mammals – Before and after theevolution of SRY. Cell Mol Life Sci 65:3182–3195.
Watson CM, Margan SH, Johnston PG (1998) Sex-chromosome elimination in the bandicootIsoodon macrourus using Y-linked markers. Cytogenet Cell Genet 81:54–59.
Wolf KW (1994) How meiotic cells deal with non-exchange chromosomes. Bioessays 16:107–114.Wolf KW, Baumgart K, Winking H (1988) Meiotic association and segregation of the giant sex
chromosomes in male field vole (Microtus agrestis). Chromosoma 97:124–133.Zickler D, Kleckner N (1998) The leptotene-zygotene transition of meiosis. Annu Rev Genet
32:619–697.Zickler D, Kleckner N (1999) Meiotic chromosomes: integrating structure and function. Annu Rev
Genet 33:603–754.
Chapter 11Compact but Complex – The MarsupialY Chromosome
Veronica J. Murtagh, Paul D. Waters, and Jennifer A. Marshall Graves
Abstract The mammalian Y chromosome is a gene poor element with enormousresponsibility. Just how the mammalian Y chromosome acquired the function ofsex determination, then surrendered most of its other functions, remains one of themost intriguing questions in genomics. The basic marsupial Y chromosome repre-sents a degraded relic of the original mammalian Y, which did not receive the largeautosomal addition that augmented the X and Y of eutherian mammals. Like the Yof other mammals, the marsupial Y contains species-specific repetitive sequences.It also bears an interesting mixture of genes; ancient male-specific genes, such asSRY and RBMY, which evolved from X-borne genes before the eutherian-marsupialdivergence, and are conserved across therian mammals. The marsupial Y also bearsnovel genes such as ATRY, that in eutherian mammals have been lost from the Y butmaintain a copy on the X. The unique properties of the marsupial Y chromosomehave provided insights into the evolution of the mammalian Y, enabling us to gain abetter understanding of the selection processes that shaped it.
Keywords Comparative genomics · Evolution · Mammals · Marsupials ·Y chromosome
11.1 Introduction
The mammalian Y chromosome has two distinguishing properties; the absence ofrecombination (or its restriction to a small region of the chromosome), and a highlyreduced number of active genes in the remaining (non-recombining) regions ofthe chromosome (Rice, 1996). These unique properties are the result of millionsof years of evolution which have produced a Y chromosome that is small, highlyheterochromatic, and highly specialized for functions in male sex and reproduction
V.J. Murtagh (B)Evolution, Ecology and Genetics, Research School of Biology, The Australian National University,Canberra, ACT 0200, Australiae-mail: [email protected]
207J.E. Deakin et al. (eds.), Marsupial Genetics and Genomics,DOI 10.1007/978-90-481-9023-2_11, C© Springer Science+Business Media B.V. 2010
208 V.J. Murtagh et al.
(Graves, 2006). Since its origin as one member of a pair of autosomes, the mam-malian Y chromosome appears to have undergone a rapid degradation, a result ofthe acquisition of a dominant male-determining gene followed by suppression ofrecombination between the X and Y (Graves, 2006).
11.2 Heterogametic Sex Chromosomes
Sex determination in vertebrates is particularly fascinating because of the variety ofsignals that direct male or female development. Sex determination in many reptilesand some fish is directed by environmental signals (usually temperature, TSD), butin mammals, birds, amphibians, many reptiles and most fish, it is determined genet-ically (GSD). Amongst vertebrates with genetic sex determination, some displaymale heterogamety (XX females: XY males) and others female heterogamety (ZWfemales: ZZ males) (that is either males or females produce two types of gamete).In many species, chromosomes that bear the sex determining gene are morphologi-cally distinct, although most fish, frogs and many reptiles have indistinguishable sexchromosomes.
H. J. Muller (Muller, 1914; Muller, 1918) first suggested that sex chromosomesevolved from a pair of autosomes, retaining the same complement of genes but nolonger possessing the ability to cross over with each other in at least part of thechromosome. Muller proposed that this restriction of recombination would resultin the accumulation of recessive lethal or deleterious mutations, ultimately result-ing in the degeneration of the Y chromosome (Muller, 1914). Ohno (1967) laterdeveloped this idea to explain the differences in ZW differentiation in different fam-ilies of snake. The Z and W in the Boidae are homomorphic, whereas the Z andW of members of the Colubridae may differ largely in rearrangement, and vipershave highly differentiated Z and W chromosomes (Ohno, 1967). Ohno suggestedthat the genetic deterioration displayed by the W chromosome is the consequenceof the accumulation of genes that govern female development, with the Z chromo-some retaining its original gene composition (Ohno, 1967). Ohno proposed that this“differential accumulation” could only occur through the establishment of reducedrecombination, which acts to preserve the accumulated female genes on the W chro-mosome. Birds, too, have a ZZ male ZW female system, in which different familieshave identical Z chromosomes, but W chromosomes that differ in size from virtuallyidentical to the Z in flightless ratites, to the much reduced W of chicken and othercarinate birds.
The differentiation of the mammal X and Y chromosome is thought to have takena parallel course (Charlesworth, 1996; Graves, 2006). In species with an XY system,male-advantage alleles accumulated around the sex-determining locus, and recom-bination was suppressed to preserve the sex specificity of this region. Over time,mutation and deletion in this non-recombining region lead to degradation of thesex-specific chromosome, ultimately leading to the dimorphic sex chromosomes ofextant mammals (Fig. 11.1). Dramatic confirmation of this hypothesis is provided by
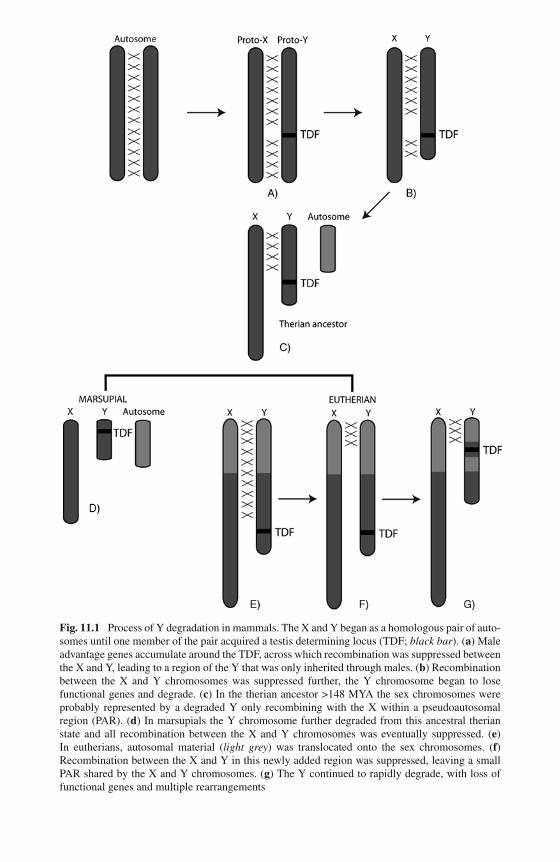
209
Fig. 11.1 Process of Y degradation in mammals. The X and Y began as a homologous pair of auto-somes until one member of the pair acquired a testis determining locus (TDF; black bar). (a) Maleadvantage genes accumulate around the TDF, across which recombination was suppressed betweenthe X and Y, leading to a region of the Y that was only inherited through males. (b) Recombinationbetween the X and Y chromosomes was suppressed further, the Y chromosome began to losefunctional genes and degrade. (c) In the therian ancestor >148 MYA the sex chromosomes wereprobably represented by a degraded Y only recombining with the X within a pseudoautosomalregion (PAR). (d) In marsupials the Y chromosome further degraded from this ancestral therianstate and all recombination between the X and Y chromosomes was eventually suppressed. (e)In eutherians, autosomal material (light grey) was translocated onto the sex chromosomes. (f)Recombination between the X and Y in this newly added region was suppressed, leaving a smallPAR shared by the X and Y chromosomes. (g) The Y continued to rapidly degrade, with loss offunctional genes and multiple rearrangements
210 V.J. Murtagh et al.
the recent evidence that all the genes on the human and marsupial X are autosomalin platypus as well as chicken, implying that the therian mammal X and Y begantheir differentiation from an autosome pair a mere 166 million years ago (MYA)(Veyrunes et al., 2008; Smith et al., 2009).
The independent evolution of heteromorphic sex chromosomes in a wide rangeof taxa presents fascinating parallels in cytological and genetic characteristics acrossdifferent orders (Charlesworth, 1996). In cases of extreme sex chromosome hetero-morphism, the X and Y, or the Z and W, may differ in size and morphology, as wellas content of genes (Bull, 1983). These characteristics also differ between the sexchromosomes and autosomes. In animal orders with male heterogametic systems,the X chromosome is typically larger than the Y, or at least differs in morphology(Bull, 1983) as a by-product of the degeneration of the sex-specific chromosome. Inthe absence of the genomic studies, which we take for granted these days, the bestevidence cited by Bull for the absence of genes on the Y was the observation of alarge number of X-linked traits, compared to very few known Y-linked traits. Thesedays with new molecular techniques available, in particular sequencing technolo-gies, we have a greater understanding of the genetic differences between the X andY chromosomes, especially in their gene content.
The paucity of genes on the Y chromosome suggests that the Y represents adegraded form of the X chromosome (the corollary is that the X contains many func-tional genes that have been lost from the Y chromosome). Early evidence supportingthis conclusion was based upon observations of XX/XO systems and viable XO (butnot YO or YY) individuals. We now have much evidence for homology between theX and Y; for instance the pseudoautosomal regions (PAR) that are shared betweenthem, and the homology of most Y-borne genes to an X-borne partner (Graves,2006).
11.2.1 Sex Chromosomes of Birds and Mammals
There is now much evidence suggesting that the bird ZW system and mammalianXY system evolved independently from two different autosome pairs. Comparativegene mapping shows that the therian mammal XY pair and the bird ZW pair shareno genes (Fridolfsson et al., 1998; Nanda et al., 1999; Graves and Shetty, 2001)and contain different sex determining genes. In mammals, male determination istriggered by the Y-borne SRY gene (mouse, Koopman et al., 1990; human, Sinclairet al., 1990), whereas in birds dosage of the Z-borne DMRT1 gene (2x in males and1x in females) is now known to be the trigger (Smith et al., 2009).
The basal monotreme mammals seem to be an exception. The absence of SRY inmonotremes, and autosomal mapping of the gene from which it evolved (SOX3)(Wallis et al., 2007), implies that a different gene is sex determining in platy-pus and echidna. The mapping of DMRT1 (which lies on the Z chromosome inchicken) to an X chromosome in platypus (one of a complex of ten sex chromo-somes that form a chain at male meiosis; Grützner et al., 2004) was proposed torepresent an evolutionary link between the mammalian and bird sex chromosomes.
11 Compact but Complex – The Marsupial Y Chromosome 211
However, orthologues of genes on the XY pair of therian mammals are autosomalin platypus (Veyrunes et al., 2008), which places the origin of the therian X andY chromosomes somewhere between 166 and 148 MYA, after therians divergedfrom the monotremes, but before the marsupial/eutherian split. It is possible that theSRY-driven therian XY system took over from an ancient bird-like ZW system soonafter the divergence of monotremes from therian mammals 166 MYA (Ezaz et al.,2006; Graves, 2008).
11.2.2 General Properties of Y Chromosomes
Y chromosomes in diverse taxa typically share three distinguishing properties; pres-ence only in males, recombination with the X is often restricted to a small regionof the chromosome, and highly reduced genetic activity in the remaining regions ofthe chromosome (Rice, 1996).
The independent evolution of a Y chromosome from an autosome in manydifferent animal and plant lineages suggests that similar evolutionary forces areat work (Bull, 1983; Charlesworth, 1996). Comparisons between the Y chromo-somes in different lineages have revealed different stages of Y degradation from acommon beginning; the appearance of a male-determining locus or set of closely-linked loci. However, the extent of XY differentiation is not merely a reflectionof the time since the acquisition of a male-determining gene by the proto-Y, asevidenced by the relatively undifferentiated sex chromosomes of ratite birds in con-trast to the highly differentiated W chromosome in chicken and other carinate birds.Similarly, boid snake species have homomorphic Z and W chromosomes, whereasthe Elapidae and Viperidae have highly degenerated, heterochromatic W chromo-somes. Young male heterogametic systems are characterised by the absence ofgross structural differences between the sex chromosomes (Charlesworth, 1996),with the Y chromosome in these systems possessing a sex determining factor. Astime progresses, chromosomal rearrangements begin to prevent recombination inthe sex-determining region and morphological differences between the sex chro-mosomes emerge. This sex determination stage is represented by the three-spinestickleback (Gasterosteus aculeatus) in which X and Y chromosomes are differen-tiated over only a tiny segment (Peichel et al., 2004), and in Medaka fish (Oryziaslatipes), in which a retroposed DMRT1 gene has established a new Y chromosomewith a small differential segment corresponding to a region on the proto-X withreduced recombination frequencies (Kondo et al., 2006). Ultimately the suppres-sion of recombination spreads to cover all or most of the length of the Y, whichresults in degradation and it becoming genetically very different from its partner –the X chromosome. The human Y chromosome (Skaletsky et al., 2003), gene-poorand riddled with non-coding repetitive elements, represents an advanced stage ofY chromosome evolution.
Numerous theories have been proposed to explain the mechanisms by whichthe Y chromosome evolves and degrades. One theory is that the suppression ofrecombination resulted in progressive degradation through higher variation, drift
212 V.J. Murtagh et al.
and inefficient selection. The higher variation is predicted by the observation ofmale-biased mutation in humans, thought to result from the increased chances ofmutation during the many mitoses of spermatogenesis and the oxidative environ-ment and lack of DNA repair of the sperm (Aitken and Graves, 2002). The drifthypothesis (“Muller’s ratchet”) proposes that in a population of Y chromosomes,less mutated Ys that are lost by chance can never be regenerated through recombi-nation. Inefficient selection occurs when a deleterious gene “hitchhikes” to fixationon the same Y as a male-advantage gene, or an advantageous gene is brought downby its association with deleterious genes.
The “sexually antagonistic genes hypothesis” is based on the theory that muta-tions conveying an advantage to the heterogametic sex could be unfavourable,even deleterious, in the homogametic sex (Rice, 1996). Genetic theory predictsthe accumulation of such genes only when there is a greater benefit to one sexthan there is disadvantage to the other. In the situation where there is tight linkageto the sex-inducing allele, sex-biased gene transmission can lead to accumulationof sexually antagonistic alleles without great disadvantage to the homogameticsex (Bull, 1983; Rice, 1987). Such a mechanism has been proposed as the majorcause of the disproportionate accumulation of male-advantage genes in developingY chromosomes.
11.3 Sex Chromosomes of Therian Mammals
The sex chromosomes of therian mammals are highly dimorphic, with a large, generich X and a small, heterochromatic Y (Graves, 2006). In eutherian mammals, theX chromosome is virtually identical in gene content between species, whereas theY chromosome varies greatly in gene content, representing different (but overlap-ping) subsets of genes on the X (reviewed in Waters et al., 2007). There is greatinterest in the identification and characterisation of genes on the Y chromosome,but the highly-repetitive nature of the human Y chromosome has made sequenc-ing difficult. In eutherian mammals a region of homology between the X and Y isstill retained as the pseudo-autosomal region (PAR), which enables pairing and cor-rect segregation at meiosis. The marsupial X chromosome is significantly smallerthan the eutherian X, and the Y is often minute and no longer able to pair with theX, raising questions about the mechanism of segregation during male meiosis (seeFernández-Donoso et al., Chapter 10).
11.3.1 Sex Chromosomes of Eutherian Mammals
The Y chromosome of eutherian mammals ranges in size as illustrated by thecharacterised Ys of chimpanzee (24 Mb), human (60 Mb) and mouse (95 Mb).It is highly heterochromatic, and full of repetitive sequences that are poorlyconserved, even between closely related species, so that numerous comparative
11 Compact but Complex – The Marsupial Y Chromosome 213
chromosome-painting studies resulted in no hybridization between Y chromosomesof different species (Goureau et al., 1996; Sherlock et al., 1996; Wienberg et al.,1997; Breen et al., 1999; Müller et al., 1999; Yang et al., 2000).
The advent of genome sequencing has not greatly advanced research on theY chromosome because the highly repetitive nature of Ys makes sequence assemblyextremely difficult. Virtually all genome sequencing studies have used female mate-rial, and detailed studies of the Y have been conducted only on human, mouse andchimpanzee Y chromosomes (Rozen et al., 2003; Skaletsky et al., 2003; Toure et al.,2005). Genes on the 94.7 Mb mouse Y are all concentrated in the tiny short arm,with the long arm being largely composed of repetitive sequences, although it doescontain amplified genes (Burgoyne, 1992; Toure et al., 2004) and a terminal PAR.The 24 Mb chimpanzee Y has been explored in detail and compared with the humanY (Hughes et al., 2005; Kuroki et al., 2006), revealing similarities in structure andgene content.
11.3.1.1 Human Sex Chromosomes
Human sex chromosomes are highly differentiated. The 165 Mb human X (Rosset al., 2005) contains 1,529 genes (NCBI database, http://www.ncbi.nlm.nih.gov),in contrast to the much smaller 60 Mb human Y chromosome. Sequencing of themale-specific region of the human Y (Skaletsky et al., 2003) showed that it con-tains many simple repetitive elements, large stretches of complex repeats, and only172 transcribed units. Many of these are untranslatable pseudogenes, and others arepresent in multiple copies, so that these sequences encode only 27 unique proteins.At least two of these genes are the result of transposition from other chromosomes,with the apparent insertion of autosomal copies of DAZ (Saxena et al., 1996) andretrotransposition of CDY (Lahn and Page, 1999) onto the Y.
The most dramatic finding from the BAC-based sequencing of the human Y chro-mosome (Skaletsky et al., 2003) was the revelation that the long arm of the human Ycontains at least eight large “ampliconic” regions composed of highly symmetricalpalindrome structures, which are apparently maintained by intra-chromosomal geneconversion. Comparisons with closely related primates (chimpanzee, bonobos andgorillas) indicate that most of these palindromic structures were already present inthe common ancestor of humans and chimpanzees, also showing near uniformity ofarm-to-arm sequences, suggesting that a steady-state balance exists between muta-tions in the palindrome and the gene-conversion events erase differences (Rozenet al., 2003). Although it was suggested by these authors that gene conversion couldserve as a means of correcting mutations in one arm of a palindrome, it has beenpointed out that conversion to the mutant form is equally probable (Graves, 2004),and may account for the tracts of pseudogenes such as those in the RBMY cluster.
The human X and Y chromosomes share a small region of homology, the pseu-doautosomal region (PAR1) at the termini of the X and Y short arms, within whichan obligatory recombination event occurs during male meiosis that mediates X andY segregation. This PAR has a critical role in male fertility, since deletion of PAR1in humans results in the failure of XY pairing (Mohandas et al., 1992). This critical
214 V.J. Murtagh et al.
function seems not to depend on the gene content of the PAR in eutherians, whichvaries between species (Graves et al., 1998). There is also a second small PAR(PAR2) at the ends of the long arms of the human X and Y (Freije et al., 1992).PAR2 is not essential for X and Y segregation during male meiosis, and its absencefrom the sex chromosomes of chimpanzee and macaque implies that it was createdmore recently in human evolution (Bickmore and Cooke, 1987; Kvaloy et al., 1994;Li and Hamer, 1995; Kuhl et al., 2001).
11.4 Marsupial Y Chromosomes
The different gene contents of Y chromosomes are the result of independent degra-dation in different lineages. Marsupials (pouched mammals that give birth to altricialyoung) diverged from eutherian mammals 148 MYA, so there is special valuein examining the differences between Y chromosomes that have been separatedfor such long evolutionary periods. Looking at the gene content of marsupialY chromosomes will provide insight into the origin and fate of Y genes.
11.4.1 Marsupial Sex Determination
As for other species with male heterogamety, the marsupial sex chromosomes seg-regate at male meiosis into X and Y bearing sperm, and which sperm fertilizes theegg will determine whether the young develops as either male or female. However,there are significant differences between marsupial and eutherian meiosis and sexdetermination.
In contrast to eutherian mammals, the marsupial X and Y chromosomes do notshare a PAR, so XY paring during male meiosis occurs in the absence of synap-tonemal complex (SC) formation (see Fernández-Donoso et al., Chapter 10). In theabsence of a PAR, the condensed X and Y remain separate until mid-pachytene ofmeiosis I, where they form end to end attachments without synapsis or crossing over(Solari and Bianchi, 1975; Sharp, 1982). Studies of male meiosis in American mar-supials have revealed that sex chromosomes develop axial elements that associateby the formation of a dense plate, which attaches to the ends of the X and Y (Solariand Bianchi, 1975; Roche et al., 1986; Seluja et al., 1987). This dense plate in lateprophase and metaphase I is composed of SCP3 and SCP1 proteins (Page et al.,2003; Page et al., 2005; Page et al., 2006), two of the constitutes of the tripartitesynaptonemal complex in eutherian mammals. The X and Y chromosomes segre-gate in an organized way into female-(X bearing) and male-(Y bearing) determiningsperm.
In eutherian mammals, the phenotypes of XO females and XXY males demon-strated that the presence of a Y chromosome determines maleness, which resultsfrom the presence of a dominant testis determining factor (TDF) on the Y thatactivates the testis-determining pathway. Hormones produced by the differentiated
11 Compact but Complex – The Marsupial Y Chromosome 215
eutherian testis control all other aspects of male development (Wilson et al., 1981).However, in marsupials, the role of the Y chromosome as the male-dominant sexdeterminer is somewhat equivocal. The Y chromosome also controls testis determi-nation in marsupials since XXY animals have testes and XO animals lack testes.However, differentiation of the embryonic testis does not hormonally control allaspects of sexual differentiation, since XXY animals have a pouch with mammaryglands and lack a scrotum, whereas XO animals lack a pouch and possess an emptyscrotum (Sharman et al., 1990). Thus development of the mammary glands and scro-tum is androgen-independent in marsupials (Shaw et al., 1988; Shaw et al., 1990),and must rely on either the dosage, or imprinting, of a gene on the X chromosome(Cooper et al., 1993). Refer to Pask and Renfree (Chapter 14) for more details onsex differentiation in marsupials.
In eutherian mammals the TDF has been identified as the SRY gene. The mar-supial Y contains a homologue of SRY, but there is no direct evidence that it is sexdetermining, and, intriguingly, there are other candidates among the genes on themarsupial Y. These marsupial-specific differences are at the core of research intothe content and function of genes on the marsupial Y, raising fundamental questionsabout the mechanisms behind sex determination and differentiation in marsupials,how they vary from eutherian mechanisms, and how both these systems evolvedfrom a common ancestral system.
11.4.2 Genes on the Marsupial Y
Genes on the marsupial Y are particularly interesting as they provide us with aninsight into the origin of the Y chromosome, as well as the process by which genesevolve novel functions (Graves, 1995). The marsupial Y chromosome bears onlya small number of genes (Fig. 11.2), many of which have important roles in sexdetermination and differentiation. All of the known marsupial Y-borne genes havecopies on the X chromosome, from which they differentiated.
Genes on the Y chromosome in mammals have been categorised as either dis-posable, as evidenced by their degradation compared to their homolog on the X, orselectable, having a function that provides a male-advantage, probably as a resultof a direct or indirect role in sex determination or differentiation (Graves, 1995).Given the homology of the marsupial X chromosome to the ancient region of theX in eutherian mammals, genes on Y in both lineages had a common evolutionaryorigin. The retention of a gene on the Y in both marsupials and eutherians suggeststhat it has an important male-specific function, because it must have been indepen-dently retained over vast evolutionary time. Genes that are only on the eutherian Yare likely to be more recently differentiated from their X counterparts, and derivedfrom the recent addition of an autosome to the eutherian sex chromosomes.
To date, just eight genes have been found to lie on the marsupial Y chromo-some, five of which are conserved on the Y of at least some other therian mammals(Fig. 11.2). These five genes; SRY, RBMY, KDM5D, RPS4Y and UBE1Y, have been
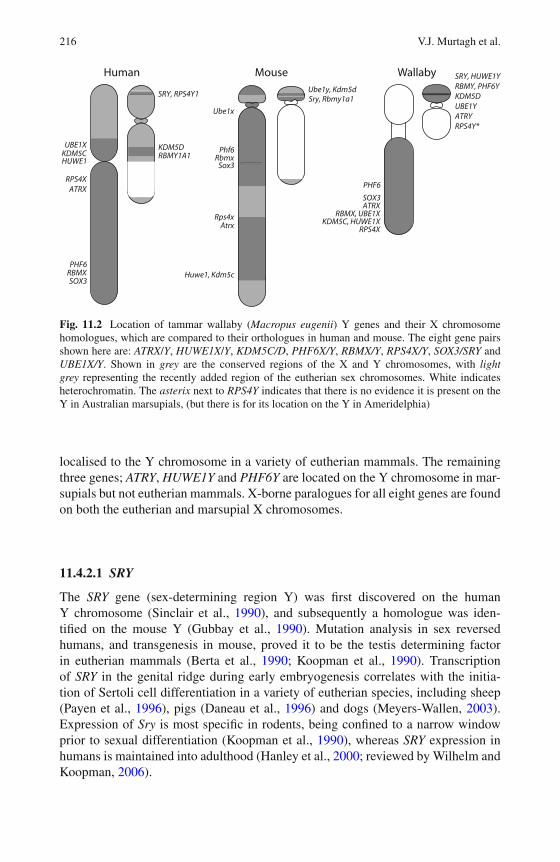
216 V.J. Murtagh et al.
UBE1X
RBMXSOX3
RPS4X
KDM5CHUWE1
ATRX
PHF6
SRY, RPS4Y1
KDM5DRBMY1A1
SRY, HUWE1YRBMY, PHF6YKDM5DUBE1YATRYRPS4Y*
SOX3
KDM5C, HUWE1XRBMX, UBE1X
PHF6
ATRX
RPS4X
Ube1y, Kdm5dSry, Rbmy1a1
Sox3
Ube1x
Huwe1, Kdm5c
Rps4xAtrx
RbmxPhf6
WallabyMouseHuman
Fig. 11.2 Location of tammar wallaby (Macropus eugenii) Y genes and their X chromosomehomologues, which are compared to their orthologues in human and mouse. The eight gene pairsshown here are: ATRX/Y, HUWE1X/Y, KDM5C/D, PHF6X/Y, RBMX/Y, RPS4X/Y, SOX3/SRY andUBE1X/Y. Shown in grey are the conserved regions of the X and Y chromosomes, with lightgrey representing the recently added region of the eutherian sex chromosomes. White indicatesheterochromatin. The asterix next to RPS4Y indicates that there is no evidence it is present on theY in Australian marsupials, (but there is for its location on the Y in Ameridelphia)
localised to the Y chromosome in a variety of eutherian mammals. The remainingthree genes; ATRY, HUWE1Y and PHF6Y are located on the Y chromosome in mar-supials but not eutherian mammals. X-borne paralogues for all eight genes are foundon both the eutherian and marsupial X chromosomes.
11.4.2.1 SRY
The SRY gene (sex-determining region Y) was first discovered on the humanY chromosome (Sinclair et al., 1990), and subsequently a homologue was iden-tified on the mouse Y (Gubbay et al., 1990). Mutation analysis in sex reversedhumans, and transgenesis in mouse, proved it to be the testis determining factorin eutherian mammals (Berta et al., 1990; Koopman et al., 1990). Transcriptionof SRY in the genital ridge during early embryogenesis correlates with the initia-tion of Sertoli cell differentiation in a variety of eutherian species, including sheep(Payen et al., 1996), pigs (Daneau et al., 1996) and dogs (Meyers-Wallen, 2003).Expression of Sry is most specific in rodents, being confined to a narrow windowprior to sexual differentiation (Koopman et al., 1990), whereas SRY expression inhumans is maintained into adulthood (Hanley et al., 2000; reviewed by Wilhelm andKoopman, 2006).
11 Compact but Complex – The Marsupial Y Chromosome 217
The presence of SRY in marsupials (Foster et al., 1992) is further evidence ofits important role in sex determination. However, the impracticality of mutation ortransgenesis studies in marsupials means that there is no direct evidence that SRY isthe marsupial testis determining gene.
At the core of SRY is an 80 amino acid motif, which shares homology with theHigh Mobility Group proteins, and hence, has been termed the HMG box (Sinclairet al., 1990). Paralogues of SRY have been grouped together into families of SOX(SRY-like HMG box containing) genes. The original SRY study in mouse identifiedfour related genes (Sox1–4) present in males and females (Gubbay et al., 1990),which were shown to have homologues in birds (Griffiths, 1991). An SRY-relatedsequence was discovered on the marsupial X chromosome, and this gene (identifiedas a homologue to the mouse Sox3) was shown to be the SOX family member withthe closest homology to SRY (Foster and Graves, 1994). Marsupial SOX3 was there-fore proposed to be the X chromosome partner of SRY and to represent the originalgene from which SRY evolved. This was among the earliest evidence support-ing the hypothesis that mammalian sex chromosomes evolved from a homologousautosome pair.
The pattern of conservation of the SOX3/SRY gene pair gives a particularlyintriguing insight into Y chromosome degeneration. Cross-species comparisonsbetween SRY sequences in eutherian mammals (human, mouse) and marsupi-als (tammar wallaby – Macropus eugenii and striped-face dunnart – Sminthopsismacroura) showed that sequence homology is conserved only within the HMG box,and homology drops down to less than 50% outside of the HMG box, even betweenthe two marsupial species (Mitchell et al., 1992). Mouse Sry is poorly conservedwith human SRY, and contains a rodent-specific 3’ tail that codes for a polyglu-tamine region (Koopman et al., 1990). In contrast, SOX3 is highly conserved acrossvertebrates. Expression of SOX3 is detected in the immature ovaries of the toadXenopus laevis (Koyano et al., 1997) and throughout gonadogenesis in male andfemale chicken (Smith et al., 1999), suggesting that expression of SOX3 in theurogenital ridge is a conserved vertebrate trait.
Some exceptional rodents lack SRY. Among three species of mole vole, twohave no Y; both sexes are XO in Ellobius lutescens and both are XX in Ellobiustancrei (Just et al., 1995). The XO Spiny Rat (Tokudaia osimensis), lacks SRY(Soullier et al., 1998), and ZOO-FISH with a mouse X chromosome probe sug-gests that the functional part of the Y chromosome has been translocated onto distalXq in Tokudaia (Arakawa et al., 2002). These exceptions clearly show that maledevelopment can occur in the absence of a Y chromosome and SRY.
The mechanism by which SRY triggers testis differentiation has been longdebated. Several genes have been identified in the human sex-determining pathwayby their mutation in sex-reversed individuals. The first was SOX9, an autosomal rel-ative of SOX3 and SRY, whose deletion or translocation caused male to female sexreversal (Foster et al., 1994), and which appears to be key to Sertoli cell differentia-tion in all mammals. Its role as a main player in sexual development was confirmedby demonstrating that abnormal Sox9 expression in XX gonads led to male develop-ment in the absence of SRY (Huang et al., 1999; Vidal et al., 2001). Most recently,
218 V.J. Murtagh et al.
it has been proposed that SRY functions as a genetic switch, cooperating with SF1(steroidogenic factor 1) to up-regulate Sox9 (Sekido and Lovell-Badge, 2008).
11.4.2.2 RBMY
RBMY was first suspected to play an important role in spermatogenesis when itwas identified in a region of the long arm of the human Y chromosome deleted inmen with azoospermia (Ma et al., 1993). RBMY is present in many copies on thehuman Y chromosome as part of palindromic expansions, with 15 copies clusteredat Yq11.23 in humans (Chandley and Cooke, 1994). RBMY is expressed specificallyin spermatogonia and early primary spermatocytes in adult males, as well as fetaland prepubertal germ cells, suggesting a role in germ cell development (Elliott et al.,1997). The discovery of a homologue of an RBMY on the Y chromosome in sev-eral marsupial species (Delbridge et al., 1997), suggested that it has an ancient andimportant male-specific role in all therian mammalians. The later discovery of anX-borne homologue of RBMY in marsupials, then in human (Delbridge et al., 1999)and mouse (Mazeyrat et al., 1999), challenged the theory that RBMY, and othermale-specific genes on the Y, had autosomal origins. The evidence now impliedthat, like SRY and SOX3, RBMY and RBMX evolved from a gene on the mammalianproto-X and proto-Y pair (Delbridge et al., 1999). RBMX retained a widespreadfunction and RBMY gained a male-specific function in spermatogenesis. These newfindings lent weight to the theory that most Y-borne genes are remnants of homologybetween the X and Y chromosomes (Graves, 1995).
Like SRY, RBMY is poorly conserved between lineages, so that marsupial andhuman RBMY share more homology with RBMX than to each other. However,within the marsupial lineage RBMY is more highly conserved, with a cDNA fromthe tammar wallaby able to detect male-specific copies of RBMY in four othermarsupial species (Brown Antechinus – Antechinus stuartii, South American opos-sum – Monodelphis domestica, Northern brown bandicoot – Isoodon macrourus,and brush-tail possum – Trichosurus vulpecula) (Delbridge et al., 1997). A remark-able observation was the apparent amplification of sequences in the bandicoot andbrush-tailed possum, which contrasts with the single copy in antechinus, tammarand opossum. This implies that RBMY was originally present as a single copy onthe Y chromosome of an ancestral therian mammal that was amplified and rear-ranged independently in at least three marsupial lineages, as well as in eutherianmammals, resulting in the observed interspecific RBMY variation.
11.4.2.3 KDM5D
KDM5D (lysine (K)-specific demethylase 5D) was first isolated from the deletioninterval 2 (�Sxrb) of the mouse Y (Sutcliffe and Burgoyne, 1989; Agulnik et al.,1994a). Deletion of this ∼250 kb region of the mouse Y, which also contains Ube1yand Zfy, affects spermatogenesis. A homologue on the X chromosome (KDM5C)was identified after a non-stringent cDNA library screen (Agulnik et al., 1994b).Originally named Smcx (KDM5C) and Smcy (KDM5D); expression of KDM5C
11 Compact but Complex – The Marsupial Y Chromosome 219
and KDM5D appears ubiquitous, with KDM5C detected even at the two-cell stageof pre-implantation mouse embryos, indicating an important housekeeping role(Agulnik et al., 1994a). Southern zoo blot analysis of the KDM5C cDNA showedmale specific bands in human, horse, pig, dog and kangaroo, demonstrating its con-servation on the Y throughout therian mammals. Although no male specific bandhas been detected in cattle or guinea pig, Southern blotting by Jegalian and Pagedetected a copy of KDM5D in rabbit, but reported that little or no KDM5D isexpressed (Jegalian and Page, 1998).
Uniquely, the X-borne KDM5C appears to escape X-inactivation in most euthe-rians (Agulnik et al., 1994b; Jegalian and Page, 1998) except cattle, guinea andrabbit, the species in which the Y-borne KDM5D is absent or under-expressed, sug-gesting that the X and Y copies are functionally interchangeable (Agulnik et al.,1999). High homology is observed between KDM5C and KDM5D, aside from thelast exon, coding for the C-terminal end of the protein, which shows only 32% pro-tein identity (Agulnik et al., 1999). The presence of a zinc finger domain in boththe X and Y copies indicates possible involvement in DNA binding and transcrip-tional regulation, with several splice variants of the transcripts detected in mouse andhuman (Agulnik et al., 1999). Recently, mutations in the X-borne KDM5C leadingto X-linked mental retardation have been cited as evidence that KDM5C plays animportant role in human brain function (Jensen et al., 2005).
Interestingly, KDM5D maps to the same region of the human Y chromosome asthe locus controlling expression of the histocompatibility antigen H-Y, which wasoriginally credited with a sex-determining role, but later eliminated by gene map-ping (McLaren et al., 1988). The widespread expression of KDM5C and KDM5D,along with differences between the two, could produce the H-Y male-specific minorantigen system. KDM5D was later shown to encode several H-Y antigen epitopes(Agulnik et al., 1999).
Unlike other genes on the Y which are highly amplified and degenerate, KDM5Dis present as a single active full-length copy on the mouse and human Y chromo-somes (Agulnik et al., 1994a). In contrast, when KDM5C and KDM5D were isolatedand FISH mapped in tammar wallaby, the KDM5D probe mapped to two regionson the wallaby Y chromosome, suggesting multiple Y borne copies (Waters et al.,2001).
11.4.2.4 UBE1Y
Ube1 (ubiquitin-activating enzyme E1), was also first isolated from the mouse�Sxrb deletion interval. UBE1Y has been identified in a range of eutherian mam-mals, excluding primates (Kay et al., 1991; Mitchell et al., 1991). Mouse Ube1ydisplays 85% nucleic acid identity to its X homologue (Uba1), orthologues of whichhave been identified in human and marsupials (Mitchell et al., 1991; Mitchell et al.,1992).
The testis-specific expression of Ube1y contrasts greatly to the ubiquitous expres-sion of its X-borne homologue (Uba1). The essential role Uba1 plays in eukaryoticcell proliferation made Ube1y a strong candidate for a spermatogenesis factor on
220 V.J. Murtagh et al.
the Y chromosomein mice (Mitchell et al., 1991; Odorisio et al., 1996). In partic-ular, it was a candidate for the spermatogonial proliferation factor (Spy) on the Y,this is until identification of Eif 2s3y (a subunit of the eukaryotic translation ini-tiation factor Eif 2) as the factor necessary to overcome the spermatogenic blockthat results from the �Sxrb deletion (Mazeyrat et al., 2001). In marsupials, EIF 2S3was localised to tammar wallaby chromosome 5p (Delbridge and Graves, 2004),the region homologous to the added region of the eutherian sex chromosomes,which contains many genes with roles in sex determination and differentiation. Theabsence of a Y-borne homologue of Eif 2s3 in humans, as well as the absence ofUbe1y in primates indicates that spermatogenic proliferation in primates is underthe influence of a third, as yet unknown factor.
11.4.2.5 RPS4Y
Ribosomal protein small subunit 4 (RPS4) codes for a basic ribosomal proteininvolved in mRNA binding. Its protein product is located at the 40/60 s subunit inter-face of the small ribosomal subunit, responsible for accurate translation (Nygardand Nika, 1982). Uniquely amongst human ribosomal proteins, two homologousloci have been identified, RPS4X (located on Xq13) and RPS4Y (located on distalYp,), encoding proteins with 93% amino acid identity (Fisher et al., 1990). A RPS4homologue in chicken, located on chromosome 4, is nearly identical to RPS4X (Zinnet al., 1994), suggesting a crucial role in development throughout vertebrates.
Deletions of a 90 kb region encompassing RPS4Y have been associated with thephenotypic features of Turner syndrome (Zinn et al., 1994). It may therefore beat least partially responsible for the gonadal dysgenesis and short stature associatedwith this syndrome, which is thought to result from monosomy of one or more genesshared between the X and Y chromosomes (Ferguson-Smith, 1965).
Although RPS4X is X-borne in all eutherian mammals (Bergen et al., 1998),RPS4Y has been described only in primates, including macaque (Omoe and Endo,1996), gibbons and various hominoids (Samollow et al., 1996). Accordingly, RPS4Xundergoes X inactivation in most eutherian mammals, escaping X-inactivationonly in primates (Jegalian and Page, 1998). The isolation of full-length cDNAclones from two different RPS4 genes in opossum (Jegalian and Page, 1998),corresponding to X and Y copies in marsupials, is evidence that RPS4Y is anancient mammalian Y gene, and was not recently acquired on the Y chromo-some in primates. However, no male-specific bands have been observed in anyAustralian marsupial, suggesting that RPS4Y might have been retained only inAmerican marsupials. The observation that in humans RPS4Y is expressed at justone-tenth the level of RPS4X (Zinn et al., 1994), suggests that RPS4Y has been par-tially inactivated, and is some way along the path to elimination from the humanY chromosome.
11.4.2.6 ATRY
A search for the mutated gene that results in mental retardation associated withα-thalassaemia (ATR-X syndrome), led to the discovery of ATRX (alpha-thalassemia
11 Compact but Complex – The Marsupial Y Chromosome 221
and mental retardation on the X chromosome) in humans (Gibbons et al., 1995b).The observation of genital abnormalities in ATR-X patients pinpointed a functionfor ATRX in the urogenital development pathway (Gibbons et al., 1995a), particu-larly with male-to-female sex reversal reported in a pedigree with a deletion at anintron/exon boundary (Ion et al., 1996).
Examination of the ATRX protein assigned it to a helicase superfamily subgroup(SNF2-like family) containing genes involved in DNA recombination, repair and theregulation of transcription (Picketts et al., 1996). A highly similar (83% identity)gene Atrx was isolated on the mouse X, enabling identification of two function-ally important regions; a catalytic domain and a zinc finger domain (Picketts et al.,1998). ATRX has no Y homologue in any eutherian mammal.
The search for marsupial ATRX led to the surprising discovery of an activehomologue on the marsupial Y (ATRY). Southern blot, fluorescent in situ hybridis-ation and partial sequence analyses demonstrated the presence of an X-borne ATRXand Y-borne ATRY in both Australian (Pask et al., 2000) and South American(Carvalho-Silva et al., 2004) marsupials. ATRY is testis-specific, which contraststo the ubiquitous expression of human and marsupial ATRX (Gibbons et al., 1995b;Villard et al., 1997), although marsupial ATRX is not expressed in the developingtestis (Pask et al., 2000). The different expression patterns of ATRX and ATRY inmarsupials suggests subfunctionalization, and indicates that ATRY plays a specificrole in marsupial sex differentiation.
The ancestral core of ATRX, identified by sequence comparisons between thetammar and human ATRX, consists of a cysteine-rich region, SWI2/SNF2 helicase-like domains, and modular protein binding elements (Park et al., 2004). This core isconserved in ATRY, suggesting that ATRX and ATRY operate via similar chromatinremodeling mechanisms. However, their difference in function, particularly tissuelocation, could be the result of a difference in binding partners (Park et al., 2005),with alterations of ATRY across a number of protein motifs a result of its testis-specific role in marsupials.
The involvement of ATRX in the human sex determining pathway, and its testis-specific expression pattern in marsupials, means that ATRY must be considered tobe a candidate testis-determining gene in marsupials. Whether ATRY functions inaddition to SRY or replaces SRY as the marsupial testis-determining factor, is stillunresolved.
11.4.2.7 PHF6Y and HUWE1Y
Full-sequencing of two tammar wallaby Y-specific BAC (bacterial artificial chro-mosome) clones containing RBMY and SRY unexpectedly revealed the presence oftwo novel genes on the tammar Y chromosome; PHF6Y (on the same BAC clone asRBMY) and HUWE1Y (on the same BAC clone as SRY) (Murtagh et al., in prepara-tion; Sankovic, 2005). Both genes have X-borne partners in marsupials, as well ashumans and mice, but no Y-borne homologues have been detected in any eutherianmammal.
PHF6 (plant homeodomain PhD-like finger) is located on Xq26.3 in humans, andhas been implicated in Börjeson–Forssman–Lehmann syndrome (BFLS) (Lower
222 V.J. Murtagh et al.
et al., 2002), which includes moderate to severe mental retardation, gynaecomastiaand hypogonadism. PHF6 is a nucleolar protein, encoding a 4.5 kb alternativelyspliced transcript with 11 exons and an ORF (open reading frame) of 1,095 bp.The presence of two zinc finger domains in the PHF6 protein indicates a rolein transcription regulation, and highly conserved orthologues have been identifiedin divergent vertebrate species such as mouse, zebrafish and African clawed frog(Lower et al., 2002). PHF6 is ubiquitously expressed in eutherian mammals, andhighly expressed in the embryonic central nervous system of mouse (Lower et al.,2002). An opossum copy of PHF6 has also been identified on the X chromosome(Shevchenko et al., 2007).
HUWE1 (HECT, UBA and WWE domain containing 1) is a ubiquitin ligasebelonging to the HECT (homologue of E6AP) family of E3 enzymes, and is thoughtto target Mcl1 (which inhibits apoptosis) and p53 (a tumour suppressor) for polyu-biquitination, triggering degradation of these proteins in the proteasome (Chen et al.,2005; Zhong et al., 2005). Most significantly, recent studies in humans have revealedthat a linear pathway involving HUWE1 allows neuronal differentiation and cell-cycle arrest of stem cells and cortical progenitors (Zhao et al., 2008). An orthologueof HUWE1 in Caenorhabditis elegans has also been found to be essential for synap-togenesis (Sieburth et al., 2005). In rats, the X-borne Huwe1 ubiquitinates multiplecore histones (Liu et al., 2005) and shows strong expression in spermatogonia andearly spermatocytes, but little to no expression in spermatids. Although Huwe1 isalso expressed in other tissues, this expression is mainly cytoplasmic except in theneuronal cells of the brain, indicating that Huwe1 has a specific function in thetestis compared to other tissues. These observations have been taken to suggest thatHuwe1 is involved in chromatin modification in early germs cells of the testis (Liuet al., 2007).
11.4.3 Summary of Genes on the Marsupial Y
The eight genes so far identified on the Y chromosome of marsupials share threecharacteristics: (1) There is a clear bias of genes with important roles in sex deter-mination and differentiation, as shown by the presence of RBMY and SRY on themarsupial, as well as the eutherian, Y chromosome. There is also evidence of sex-ual development phenotypes for the X orthologues of six of the eight genes. (2) Alleight of the known marsupial Y-borne genes have copies on the X chromosome, arelic of the ancient homology between the X and Y chromosomes. (3) Not all ofthe Y-borne genes in marsupials are found on the Y in eutherians, with three ofthe eight genes (ATRY, PHF6Y, HUWE1Y) lacking a homologue on the eutherianY chromosome.
11.5 Conclusion
Generally, the rules of gene content and function of the Y chromosome, estab-lished for human and mouse, apply also to marsupials. However, the marsupial
11 Compact but Complex – The Marsupial Y Chromosome 223
Y chromosome, although it is tiny in many species, contains more genes (eight) thanthe conserved region of the Y in human (four) or mouse (five). This suggests thatgene loss from the Y in marsupials has not proceeded as far as for the comparableregion of the human and mouse Y.
As for the human Y, genes located on the marsupial Y chromosome, and theirrespective partners on the X chromosome, show a clear involvement in sexual dif-ferentiation and/or brain development. It is interesting that these “brains and balls”genes on the X chromosome (Graves et al., 2002) are the ones whose Y homo-logues have survived, presumably because the original autosomal gene already hada selectable function in male reproduction.
The presence of SOX3 on the X and SRY on the Y in marsupials as well aseutherian mammals suggests that this gene differentiated from an original brains-and-balls gene before marsupials diverged from eutherian mammals. However, thereis no direct evidence that SRY is the sex-determining gene in marsupials, and itremains possible that another gene (ATRY? PHF6Y?) acquired the sex determiningfunction that led to the origin of the mammalian X and Y chromosomes, and wassupplanted by SRY.
Our knowledge of the marsupial Y therefore plays an important role in under-standing the evolution of mammalian sex chromosomes, and is a shining example ofthe value of non-model species for investigating genome organization and function.
References
Agulnik AI, Mitchell MJ, Lerner JL, Woods DR, Bishop CE (1994a). A mouse Y chromosomegene encoded by a region essential for spermatogenesis and expression of male-specific minorhistocompatibility antigens. Hum Mol Genet 3:873–878.
Agulnik AI, Mitchell MJ, Mattei M-G, et al. (1994b). A novel X gene with a widely transcribedY-linked homologue escapes X-inactivation in mouse and human. Hum Mol Genet 3:879–884.
Agulnik AI, Longepied G, Ty MT, Bishop CE, Mitchell M (1999) Mouse H-Y encoding Smcygene and its X Chromosomal homolog Smcx. Mamm Genome 10:926–929.
Aitken RJ, Graves JAM (2002) Human spermatozoa: the future of sex. Nature 415:963.Arakawa Y, Nishida-Umehara C, Matsuda Y, Sutou S, Suzuki H (2002) X-chromosomal local-
ization of mammalian Y-linked genes in two XO species of the Ryukyu spiny rat. CytogenetGenome Res 99:303–309.
Bergen A, Pratt M, Mehlman P, Goldman D (1998) Evolution of RPS4Y. Mol Biol Evol 15:1412–1419.
Berta P, Hawkins JB, Sinclair AH, et al. (1990) Genetic evidence equating SRY and the testis-determining factor. Nature 348:448–450.
Bickmore WA, Cooke HJ (1987) Evolution of homologous sequences on the human X andY chromosomes, outside of the meiotic pairing segment. Nucleic Acids Res 15:6261–6271.
Breen M, Thomas R, Binns MM, Carter NP, Langford CF (1999) Reciprocal Chromosome PaintingReveals Detailed Regions of Conserved Synteny between the Karyotypes of the Domestic Dog(Canis familiaris) and Human. Genomics 61:145–155.
Bull JJ (1983) Evolution of Sex Determining Mechanisms. Benjamin/Cummings PublishingCompany Inc, Menlo Park.
Burgoyne PS (1992) Fertility in mice requires X-Y pairing and a Y-chromosomal “spermatogene-sis” gene mapping to the long arm. Cell 71:391–398.
Carvalho-Silva DR, O’Neill R, Brown JD, et al. (2004) Molecular characterization and evolutionof X and Y-borne ATRX homologues in American marsupials. Chromosome Res 12:795–804.
224 V.J. Murtagh et al.
Chandley A, Cooke HJ (1994) Human male fertility – Y-linked genes and spermatogenesis. HumMol Genet 3:1449–1452.
Charlesworth B (1996) The evolution of chromosomal sex determination and dosage compensa-tion. Curr Biol 6:149–162.
Chen D, Kon N, Li M, Zhang W, Qin J, Gu W (2005) ARF-BP1/Mule Is a Critical Mediator of theARF Tumor Suppressor. Cell 121:1071–1083.
Cooper DW, Johnston PG, Watson JM, Graves JAM (1993) X-inactivation in marsupials andmonotremes. Sem Dev Biol 4:117–128.
Daneau I, Ethier J-F, Lussier JG, Silversides DW (1996) Porcine SRY gene locus and genital ridgeexpression. Biol Reprod 55:47–53.
Delbridge ML, Graves JAM (2004) Assignment of the eukaryotic translation initiation factor(EIF2S3) to tammar wallaby chromosome 5p by in situ hybridization. Cytogenet Genome Res107:139B.
Delbridge M, Harry J, Toder R, et al. (1997) A human candidate spermatogenesis gene, RBM1, isconserved and amplified on the marsupial Y chromosome. Nat Genet 15:131–136.
Delbridge M, Lingenfelter PA, Disteche CM, Graves JAM (1999) The candidate spermatogenesisgene RBMY has a homologue on the human X chromosome. Nat Genet 22:223–224.
Elliott DJ, Millar MR, Oghene K, et al. (1997) Expression of RBM in the nuclei of human germcells is dependent on a critical region of the Y chromosome long arm. Proc Natl Acad Sci USA94:3848–3853.
Ezaz T, Stiglec R, Veyrunes F, Marshall Graves JA (2006) Relationships between vertebrate ZWand XY sex chromosome systems. Curr Biol 16:R736–R743.
Ferguson-Smith MA (1965) Karyotype-phenotype correlations in gonadal dysgenesis and theirbearing on the pathogenesis of malformations. J Med Genet 39:142–155.
Fisher EMC, Beer-Romero P, Brown LG, et al. (1990) Homologous ribosomal protein genes onthe human X and Y chromosomes: escape from X inactivation and possible implications forturner syndrome. Cell 63:1205–1218.
Foster JW, Graves JAM (1994) An SRY-related sequence on the marsupial X chromosome: impli-cations for the evolution of the mammalian testis-determining gene. Proc Natl Acad Sci USA91:1927–1931.
Foster JW, Brennan FE, Hampikian GK, et al. (1992) Evolution of sex determination and theY chromosome: SRY-related sequences in marsupials. Nature 359:531–533.
Foster JW, Dominguez-Steglich MA, Guioli S, et al. (1994) Campomelic dysplasia and autosomalsex reversal caused by mutations in an SRY-related gene. Nature 372:525–530.
Freije D, Helms C, Watson MS, Donis-Keller H (1992) Identification of a Second PseudoautosomalRegion Near the Xq and Yq Telomeres. Science 258:1784–1787.
Fridolfsson AK, Cheng H, Copeland NG, et al. (1998) Evolution of the avian sex chromosomesfrom an ancestral pair of autosomes. Proc Natl Acad Sci USA 95:8147–8152.
Gibbons RJ, Brueton L, Buckle VJ, et al. (1995a). Clinical and hematologic aspects of the X-linkedalpha-thalassemia/mental retardation syndrome (ATR-X). Am J Med Genet 55:288–299.
Gibbons RJ, Picketts DJ, Villard L, Higgs DR (1995b). Mutations in a Putative GlobalTranscriptional Regulator Cause X-Linked Mental Retardation with �-Thalassemia (ATR-XSyndrome). Cell 80:837–845.
Goureau A, Yerle M, Schmitz A, et al. (1996) Human and Porcine Correspondence of ChromosomeSegments Using Bidirectional Chromosome Painting. Genomics 36:252–262.
Graves JAM (1995) The origin and function of the mammalian Y chromosome and Y-borne genes –an evolving understanding. BioEssays 17:311–320.
Graves JAM (2004) The degenerate Y chromosome – can conversion save it? Reprod Fert Develop16:527–534.
Graves JAM (2006) Sex chromosome specialiation and degeneration in mammals. Cell 124:901–914.
Graves JAM (2008) Weird Animal Genomes and the Evolution of Vertebrate Sex and SexChromosomes. Annu Rev Genet 42:565–586.
11 Compact but Complex – The Marsupial Y Chromosome 225
Graves JAM, Shetty S (2001) Sex from W to Z: evolution of vertebrate sex chromosomes and sexdetermining genes. J Exp Zool 290:449–462.
Graves JAM, Wakefield MJ, Toder R (1998) The origin and evolution of the pseudoautosomalregions of human sex chromosomes. Hum Mol Genet 7:1991–1996.
Graves JAM, Gecz J, Hameister H (2002) Evolution of the human X – a smart andsexy chromosome that controls speciation and development. Cytogenet Genome Res 99:141–145.
Griffiths R (1991) The Isolation of Conserved DNA Sequences Related the Human Sex-Determining Region Y Gene from the Lesser Black-Backed Gull (Larus fuscus). P Roy SocB Biol Sci 244:123–128.
Grützner F, Rens W, Tsend-Ayush E, et al. (2004) In the platypus a meiotic chain of ten sexchromosomes shares genes with the bird Z and mammal X chromosomes. Nature 432:913–917.
Gubbay J, Collignon J, Koopman P, et al. (1990) A gene mapping to the sex-determining regionof the mouse Y chromosome is a member of a novel family of embryonically expressed genes.Nature 346:245–250.
Hanley NA, Hagan DM, Clement-Jones M, et al. (2000) SRY, SOX9, and DAX1 expres-sion patterns during human sex determination and gonadal development. Mech Develop91:403–407.
Huang B, Wang S, Ning Y, Lamb AN, Bartley J (1999) Autosomal XX sex reversal caused byduplication of SOX9. Am J Med Genet 87:349–353.
Hughes JF, Skaletsky H, Pyntikova T, et al. (2005) Conservation of Y-linked genes during humanevolution revealed by comparative sequencing in chimpanzee. Nature 437:101–104.
Ion A, Telvi L, Chaussain JL, et al. (1996) A novel mutation in the putative DNA helicase XH2is responsible for male-to-female sex reversal associated with an atypical form of the ATR-Xsyndrome. Am J Med Genet 58:1185–1191.
Jegalian K, Page DC (1998) A proposed path by which genes common to mammalian X andY chromosomes evolve to become X inactivated. Nature 394:776–780.
Jensen LR, Amende M, Gurok U, et al. (2005) Mutations in the JARID1C Gene, Which IsInvolved in Transcriptional Regulation and Chromatin Remodeling, Cause X-Linked MentalRetardation. Am J Med Genet 76:227–236.
Just W, Rau W, Vogel W, et al. (1995) Absence of Sry in species of the vole Ellobius. Nat Genet11:117–118.
Kay GF, Ashworth A, Penny GD, et al. (1991) A candidate spermatogenesis gene on the mouseY chromosome is homologous to ubiquitin-activating enzyme E1. Nature 354:486–489.
Kondo M, Hornung U, Nanda I, et al. (2006) Genomic organization of the sex-determining andadjacent regions of the sex chromosomes of medaka. Genome Res 16:815–826.
Koopman P, Munsterberg A, Capel B, Vivian N, Lovell-Badge R (1990) Expression of a candidatesex-determining gene during mouse testis differentiation. Nature 348:450–452.
Koyano S, Ito M, Takamatsu N, Takiguchi S, Shiba T (1997) The Xenopus Sox3 gene expressed inoocytes of early stages. Gene 188:101–107.
Kuhl H, Rottger S, Heilbronner H, Enders H, Schempp W (2001) Loss of the Y chromosomalPAR2-region in four familial cases of satellited Y chromosomes (Yqs). Chromosome Res9:215–222.
Kuroki Y, Toyoda A, Noguchi H, et al. (2006) Comparative analysis of chimpanzee and humanY chromosomes unveils complex evolutionary pathway. Nat Genet 38:158–167.
Kvaloy K, Galvagni F, Brown WRA (1994) The sequence organization of the long arm pseudoau-tosomal region of the human sex chromosomes. Hum Mol Genet 3:771–778.
Lahn BT, Page DC (1999) Four evolutionary strata on the human X chromosome. Science286:964–967.
Li L, Hamer DH (1995) Recombination and allelic association in the Xq/Yq homology region.Hum Mol Genet 4:2013–2016.
Liu Z, Oughtred R, Wing SS (2005) Characterization of E3Histone, a novel testis ubiquitin proteinligase which ubiquitinates histones. Mol Cell Biol 25:2819–2831.
226 V.J. Murtagh et al.
Liu Z, Miao D, Xia Q, Hermo L, Wing SS (2007) Regulated expression of the ubiquitinprotein ligase, E3(Histone)/LASU1/Mule/ARF-BP1/HUWE1, during spermatogenesis. DevDyn 236:2889–2898.
Lower KM, Turner G, Kerr BA, et al. (2002) Mutations in PHF6 are associated with Borjeson-Forssman-Lehmann syndrome. Nat Genet 32:661–665.
Ma K, Inglis JD, Sharkey A, et al. (1993) A Y chromosome gene family with RNA-binding proteinhomology: candidates for the azoospermia factor AZF controlling human spermatogenesis. Cell75:1287–1295.
Mazeyrat S, Saut N, Mattei M-G, Mitchell MJ (1999) RBMY evolved on the Y chromosome froma ubiquitously transcribed X-Y identical gene. Nat Genet 22:224–226.
Mazeyrat S, Saut N, Grigoriev V, et al. (2001) A Y-encoded subunit of the translation initiationfactor Eif2 is essential for mouse spermatogenesis. Nat Genet 29:49–53.
McLaren A, Simpson E, Epplen JT, et al. (1988) Location of the genes controlling H-Y antigenexpression and testis determination on the mouse Y chromosome. Proc Natl Acad Sci USA85:6442–6445.
Meyers-Wallen VN (2003) Sry and Sox9 expression during canine gonadal sex determinationassayed by quantitative reverse transcription-polymerase chain reaction. Mol Reprod Dev65:373–381.
Mitchell MJ, Woods DR, Tucker PK, Opp JS, Bishop CE (1991) Homology of a candidate sper-matogenic gene from the mouse Y chromosome to the ubiquitin-activating enzyme El. Nature354:483–486.
Mitchell MJ, Woods DR, Wilcox SA, Marshall Graves JA, Bishop CE (1992) Marsupial Y chro-mosome encodes a homologue of the mouse Y-linked candidate spermatogenesis gene Ube1y.Nature 359:528–531.
Mohandas TK, Speed RM, Passage MB, Yen PH, Chandley A, Shapiro LJ (1992) Role of thepseudoautosomal region in sex-chromosome pairing during male meiosis: meiotic studies in aman with a deletion of distal Xp. Am J Hum Genet 51:526–533.
Muller HJ (1914) A gene for the fourth chromosome of Drosophila. J Exp Zool 17:325–336.Muller HJ (1918) Genetic Variability, Twin Hybrids and Constant Hybrids, in a Case of Balanced
Lethal Factors. Genetics 3:422–499.Müller S, Stanyon R, O’Brien P, Ferguson-Smith MA, Plesker R, Wienberg J (1999) Defining
the ancestral karyotype of all primates by multidirectional chromosome painting between treeshrews, lemurs and humans. Chromosoma 108:393–400.
Nanda I, Shan Z, Schartl M, et al. (1999) 300 million years of conserved synteny between chickenZ and human chromosome 9. Nat Genet 21:258–259.
Nygard O, Nika H (1982) Identification by RNA-protein cross-linking of ribosomal proteinslocated at the interface between the small and the large subunits of mammalian ribosomes.EMBO J 1:357–362.
Odorisio T, Mahadevaiah SK, Mccarrey JR, Burgoyne PS (1996) Transcriptional analysis of thecandidate spermatogenesis gene Ube1y and of the closely related Ube1x shows that they arecoexpressed in spermatogonia and spermatids but are repressed in pachytene spermatocytes.Dev Biol 180:336–343.
Ohno S (1967) Sex Chromosomes and Sex-Linked Genes. Springer, New York, NY.Omoe K, Endo A (1996) Relationship between the monosomy X phenotype and Y-linked ribo-
somal protein S4 (Rps4) in several species of mammals: a molecular evolutionary analysis ofRps4 homologs. Genomics 31:44–50.
Page J, Berrios S, Rufas JS, et al. (2003) The pairing of X and Y chromosomes during meioticprophase in the marsupial species Thylamys elegans is maintained by a dense plate developedfrom their axial elements. J Cell Sci 116:551–560.
Page J, Berrios S, Parra MT, et al. (2005) The program of sex chromosome pairing in meiosisis highly conserved across marsupial species: implications for sex chromosome evolution.Genetics 170:793–799.
Page J, Viera A, Parra MT, et al. (2006) Involvement of synaptonemal complex proteins in sexchromosome segregation during marsupial male meiosis. PLoS Genet 2:e136.
11 Compact but Complex – The Marsupial Y Chromosome 227
Park DJ, Pask AJ, Huynh K, Renfree MB, Harley VR, Marshall Graves JAM (2004) Comparativeanalysis of ATRX, a chromatin remodeling protein. Gene 339:39–48.
Park DJ, Pask AJ, Huynh K, Harley VR, Renfree MB, Graves JAM (2005) Characterisation of themarsupial-specific ATRY gene: implications for the evolution of male-specific function. Gene362:29–36.
Pask AJ, Renfree MB, Graves JAM (2000) The human sex-reversing ATRX gene has a homologueon the marsupial Y chromosome, ATRY: implications for the evolution of mammalian sexdetermination. Proc Natl Acad Sci USA 97:13198–13202.
Payen E, Pailhoux E, Merhi Ra, et al. (1996) Characterization of ovine SRY transcript and devel-opmental expression of genes involved in sexual differentiation. Int J Dev Biol 40:567–575.
Peichel CL, Ross A, Matson CK, et al. (2004) The master sex-determination locus in threespinesticklebacks is on a nascent Y chromosome. Curr Biol 14:1416–1424.
Picketts DJ, Higgs DR, Bachoo S, Blake DJ, Quarrell OWJ, Gibbons RJ (1996) ATRX encodesa novel member of the SNF2 family of proteins: mutations point to a common mechanismunderlying the ATR-X syndrome. Hum Mol Genet 5:1899–1907.
Picketts DJ, Tastan AO, Higgs DR, Gibbons RJ (1998) Comparison of the human and murineATRX gene identifies highly conserved, functionally important domains. Mamm Genome9:400–403.
Rice WR (1987) Genetic hitchhiking and the evolution of reduced genetic activity of the Y sexchromosome. Genetics 116:161–167.
Rice WR (1996) Evolution of the Y sex chromosome in animals. Bioscience 46:331–343.Roche L, Seluja G, Wettstein R (1986) The meiotic behaviour of the XY pair in Lutreolina
crassicaudata (Marsupialia: Didelphoidea). Genetica 71:213–224.Ross MT, Grafham DV, Coffey AJ, et al. (2005) The DNA sequence of the human X chromosome.
Nature 434:325–337.Rozen S, Skaletsky H, Marszalek JD, et al. (2003) Abundant gene conversion between arms of
palindromes in human and ape Y chromosomes. Nature 423:873–876.Samollow PB, Cherry LM, Witte SM, Rogers J (1996) Interspecific variation at the Y-linked
RPS4Y locus in hominoids: implications for phylogeny. Am J Phys Anthropol 101:333–343.
Sankovic N (2005) Molecular Characterisation of a Marsupial Y Chromosome. Research Schoolof Biological Sciences, The Australian National University, Canberra.
Saxena R, Brown LG, Hawkins T, et al. (1996) The DAZ gene cluster on the human Y chromosomearose from an autosomal gene that was transposed, repeatedly amplified and pruned. Nat Genet14:292–299.
Sekido R, Lovell-Badge R (2008) Sex determination involves synergistic action of SRY and SF1on a specific Sox9 enhancer. Nature 453:930–934.
Seluja GA, Roche L, Solari AJ (1987) Male meiotic prophase in Didelphis albiventris. J Hered78:218–222.
Sharman G, Hughes R, Cooper D (1990) The Chromosomal Basis of Sex-Differentiation inMarsupials. Aust J Zool 37:451–466.
Sharp P (1982) Sex chromosome pairing during male meiosis in marsupials. Chromosoma 86:27–47.
Shaw G, Renfree M, Short R, O WS (1988) Experimental manipulation of sexual differentiation inwallaby pouch young treated with exogenous steroids. Development 104:689–701.
Shaw G, Renfree MB, Short R (1990) Primary genetic control of sexual differentiation inmarsupials. Aust J Zool 37:443–450.
Sherlock JK, Griffin DK, Delhanty JDA, Parrington JM (1996) Homologies between human andmarmoset (Callithrix jacchus) chromosomes revealed by comparative chromosome painting.Genomics 33:214–219.
Shevchenko A, Zakharova I, Elisaphenko E, et al. (2007) Genes flanking Xist in mouse and humanare separated on the X chromosome in American marsupials. Chromosome Res 15:127–136.
Sieburth D, Ch’ng Q, Dybbs M, et al. (2005) Systematic analysis of genes required for synapsestructure and function. Nature 436:510–517.
228 V.J. Murtagh et al.
Sinclair AH, Berta P, Palmer MS, et al. (1990) A gene from the human sex-determining regionencodes a protein with homology to a conserved DNA-binding motif. Nature 346:240–244.
Skaletsky H, Kuroda-Kawaguchi T, Minx PJ, et al. (2003) The male-specific region of the humanY chromosome is a mosaic of discrete sequence classes. Nature 423:825–837.
Smith CA, Roeszler KN, Ohnesorg T, et al. (2009) The avian Z-linked gene DMRT1 is requiredfor male sex determination in the chicken. Nature 461:267–271.
Smith CA, Smith MJ, Sinclair AH (1999) Gene expression during gonadogenesis in the chickenembryo. Gene 234:395–402.
Solari AJ, Bianchi NO (1975) The synaptic behaviour of the X and Y chromosomes in themarsupial Monodelphis dimidiata. Chromosoma 52:11–25.
Soullier S, Hanni C, Catzeflis F, Berta P, Laudet V (1998) Male sex determination in the spiny ratTokudaia osimensis (Rodentia: Muridae) is not Sry dependent. Mamm Genome 9:590–592.
Sutcliffe MJ, Burgoyne PS (1989) Analysis of the testes of H-Y negative XOSxrb mice suggeststhat the spermatogenesis gene (Spy) acts during the differentiation of the A spermatogonia.Development 107:373–380.
Toure A, Grigoriev V, Mahadevaiah S, Rattigan Á, Ojarikre O, Burgoyne PS (2004) A proteinencoded by a member of the multicopy SSty gene family located on the long arm of the mouseY chromosome is expressed during sperm development. Genomics 83:140–147.
Toure A, Clemente E, Ellis P, et al. (2005) Identification of novel Y chromosome encoded tran-scripts by testis transcriptome analysis of mice with deletions of the Y chromosome long arm.Genome Biol 6:R102.
Veyrunes F, Waters PD, Miethke P, et al. (2008) Bird-like sex chromosomes of platypus implyrecent origin of mammal sex chromosomes. Genome Res 18:965–973.
Vidal VPI, Chaboissier M-C, de Rooij DG, Schedl A (2001) Sox9 induces testis development inXX transgenic mice. Nat Genet 28:216–217.
Villard L, Lossi A-M, Cardoso C, et al. (1997) Determination of the Genomic Structure of theXNP/ATRX Gene Encoding a Potential Zinc Finger Helicase. Genomics 43:149–155.
Wallis M, Waters P, Delbridge M, et al. (2007) Sex determination in platypus and echidna: auto-somal location of SOX3 confirms the absence of SRY from monotremes. Chromosome Res15:949–959.
Waters P, Duffy B, Frost C, Delbridge M, Graves JAM (2001) The human Y chromosome deriveslargely from a single autosomal region added to the sex chromosomes 80–130 million yearsago. Cytogenet Cell Genet 92:74–79.
Waters P, Wallis MC, Graves JAM (2007) Mammalian sex – origin and evolution of theY chromosome and SRY. Semin Cell Dev Biol 18:389–400.
Wienberg J, Stanyon R, Nash W, et al. (1997) Conservation of human vs. feline genomeorganization revealed by reciprocal chromosome painting. Cytogenet Cell Genet 77:211–217.
Wilhelm D, Koopman P (2006) The makings of maleness: towards an integrated view of malesexual development. Nat Rev Genet 7:620–631.
Wilson J, George F, Griffin J (1981) The hormonal control of sexual development. Science211:1278–1284.
Yang F, O’Brien P, Ferguson-Smith M (2000) Comparative chromosome map of the laboratorymouse and chinese hamster defined by reciprocal chromosome painting. Chromosome Res8:219–227.
Zhao X, Heng JI-T, Guardavaccaro D, et al. (2008) The HECT-domain ubiquitin ligase Huwe1controls neural differentiation and proliferation by destabilizing the N-Myc oncoprotein. NatCell Biol 10:643–653.
Zhong Q, Gao W, Du F, Wang X (2005) Mule/ARF-BP1, a BH3-only E3 ubiquitin ligase, catalyzesthe polyubiquitination of Mcl-1 and regulates apoptosis. Cell 121:1085–1095.
Zinn AR, Alagappan RK, Brown LG, Wool I, Page DC (1994) Structure and function of ribosomalprotein S4 genes on the human and mouse sex chromosomes. Mol Cell Biol 14:2485–2492.
Part VMarsupial Epigenetics
Paul D. Waters
The term epigenetics was originally coined to explain phenotypic variation that wasindependent of genotype; hence the name epi-(above) genetics. The term is nowwidely used to explain control of gene expression that is independent of underlyingDNA sequence. Epigenetic regulation has been (and still is) extensively studied inmouse and human. But outside of these model species much less is known abouteutherian epigenetic regulation, and even less is known about marsupial epigeneticregulation, leaving a large gap in our knowledge of even the most stunning examplesof mammalian epigenetics.
In this part two classic examples of epigenetic regulation are reviewed. Horeand colleagues in Chapter 12 review a biologically and medically important exam-ple of epigenetic regulation; genomic imprinting, where one allele is preferentiallysilenced depending on parent of origin. The first example ever observed of imprint-ing was in marsupials as paternal X chromosome inactivation (Cooper et al., 1971;Richardson et al., 1971; Sharman, 1971; see Al Nadaf et al., this part). Horeet al. discuss classic imprinted eutherian loci in marsupials, and the molecularmechanisms that regulate them. They use data collected from various vertebraterepresentatives to decipher when these mechanisms might have arisen during mam-malian evolution. The authors also highlight that the distribution of imprintingthroughout the mammalian tree correlates to the evolution of viviparity and the pla-centa. There is an estimated 80 imprinted loci in eutherians (with a well developedplacenta) (Morison et al., 2005), whereas in marsupials (with an under developedplacenta) there are considerably fewer, and imprinting appears to be absent inmonotremes (egg laying mammals) (reviewed in Renfree et al., 2008).
The evolution of the placenta and genomic imprinting occurring at a similar time,and the observation that many imprinted genes are expressed and imprinted (oftenexclusively) in the placenta and yoke sac (influencing placenta size and function),has led to the parental-conflict hypothesis (reviewed in Wilkins and Haig, 2003).This hypothesis states that imprinting results from conflict between the maternal andpaternal genomes for provisioning of the mother’s resources to the fetus. The fatherwants the offspring to receive as much of the maternal resources as possible, regard-less of the mother’s future fitness. In contrast, the mother wants to share resourcesevenly to all her young, irrespective of which male fathers them. The predictedresult is parent specific gene expression that alters the supply of resources to the
230 Part V Marsupial Epigenetics
fetus. Indeed, many paternally expressed loci stimulate placental and fetal growth,whereas maternally expressed loci suppress placental and fetal growth. However,the parental-conflict hypothesis does not explain imprinted loci that do not appearto function in placenta. Hore et al. outline alternative hypotheses that have been putforward to explain the evolution of imprinting, and highlight how understandingimprinting of different loci in distantly related mammals can help distinguish whichhypothesis is more correct.
Al Nadaf and colleagues (Chapter 13) review a second classic example of epige-netic regulation, X chromosome inactivation (XCI), a process in which one of theX chromosomes is transcriptionally silenced in the somatic cells of females. Thisphenomenon is arguably the most spectacular example of epigenetic regulation intherian mammals. It arose because the Y chromosome was once genetically iden-tical to the X, but has since lost most of its functional genes (see Murtagh et al.,previous part). Loss of Y gene function resulted in double the expression of X genesin females (with two X chromosomes) compared to males (with one X- and one Y-chromosome), and a dosage compensation mechanism was required to restore equalexpression of X gene between the sexes.
In human and mouse XCI is proposed to be complete along the X, stable, somat-ically heritable, and random with respect to which X is chosen for inactivation.In contrast, the limited information available on marsupial XCI indicates that itis incomplete, unstable, tissue specific and non-random (Cooper et al., 1993) AlNadaf et al. contrasts what is known about the cytogenetic and molecular manifes-tations of XCI in eutherian and marsupial mammals. This review extends beyondtherian mammals to compare XCI with monotreme and bird dosage compensa-tion, which in both groups appears to be incomplete and locus specific (Itoh et al.,2007; Melamed and Arnold, 2007; Deakin et al., 2008). Because birds, monotremesand therian mammals have independently evolved dosage compensation systems,any common epigenetic signatures must have been independently recruited from auniversal epigenetic “toolbox”.
Marsupial genome projects and next generation sequencing are allowing researchin this field to progress at a much faster rate than has been permitted in the past. Itis now possible to move from looking at single genes to studies that encompassthe entire X for XCI, and the entire genome for genomic imprinting. These globalstudies will permit broader comparisons between not just mammalian lineages, butvertebrates as a whole.
References
Cooper DW, Johnston PG, Watson JM, Graves JAM (1993) X inactivation inmarsupials and monotremes. Semin Dev Biol 4:117–128.
Cooper DW, VandeBerg JL, Sharman GB, Poole WE (1971) Phosphoglyceratekinase polymorphism in kangaroos provides further evidence for paternal Xinactivation. Nat New Biol 230:155–157.
Part V Marsupial Epigenetics 231
Deakin JE, Hore TA, Koina E, Marshall Graves JA (2008) The status of dosagecompensation in the multiple X chromosomes of the platypus. PLoS Genet4:e1000140.
Itoh Y, Melamed E, Yang X, et al. (2007) Dosage compensation is less effective inbirds than in mammals. J Biol 6:2.
Melamed E, Arnold AP (2007) Regional differences in dosage compensation on thechicken Z chromosome. Genome Biol 8:R202.
Morison IM, Ramsay JP, Spencer HG (2005) A census of mammalian imprinting.Trends Genet 21:457–465.
Renfree MB, Ager EI, Shaw G, Pask AJ (2008) Genomic imprinting in marsupialplacentation. Reproduction 136:523–531.
Richardson BJ, Czuppon AB, Sharman GB (1971) Inheritance of glucose-6-phosphate dehydrogenase variation in kangaroos. Nat New Biol 230:154–155.
Sharman GB (1971) Late DNA replication in the paternally derived X chromosomeof female kangaroos. Nature 230:231–232.
Wilkins JF, Haig D (2003) What good is genomic imprinting: the function of parent-specific gene expression. Nat Rev Genet 4:359–368.

Chapter 12The Evolution of Genomic Imprinting – AMarsupial Perspective
Timothy A. Hore, Marilyn B. Renfree, Andrew J. Pask,and Jennifer A. Marshall Graves
Abstract Genomic imprinting is a medically significant epigenetic trait in whichgenes are expressed from only one of the two alleles, according to their parent oforigin. Among vertebrates, imprinted gene expression has been found only in thelive-bearing therian mammals – eutherians (placental mammals) and marsupials.Because marsupials are so distantly related to eutherians, comparisons of imprint-ing between the two mammalian infraclasses are particularly valuable. However,the popular mammalian model organisms (humans, mice and domestic mammals)are all eutherian, so imprinting in marsupials has not received the attention itdeserves. Research gathered over some years shows that marsupial orthologues ofmany imprinted domains in eutherians, such as the well characterised IGF2/H19and PEG10 domains, comprise fewer imprinted genes. Other eutherian imprinteddomains, such as the X-inactivation centre, Callipyge and Prader-Willi/Anglemansyndrome domains, are either completely absent in marsupials or are not imprinted.The occurrence of imprinting in marsupials (with some imprinted genes) and euthe-rians (with many imprinted genes) contrasts with the likely absence of imprintingin egg-laying vertebrates (monotreme mammals, birds and reptiles). The acquisitionof imprinting by therian mammals correlates with increased dependence on placen-tation for early development and coincides with the acquisition of a unique repeatcontent within the genome and germline expression of BORIS. Analysis of the evo-lutionary trajectory of these traits offers us insights into how and why genomicimprinting evolved in mammals.
Keywords Evolution · Genomic imprinting · Marsupials · Parental conflict ·Regulators of imprinting
T.A. Hore (B)Laboratory of Developmental Genetics and Imprinting, The Babraham Institute, CambridgeCB22 3AT, UKe-mail: [email protected]
233J.E. Deakin et al. (eds.), Marsupial Genetics and Genomics,DOI 10.1007/978-90-481-9023-2_12, C© Springer Science+Business Media B.V. 2010
234 T.A. Hore et al.
12.1 Introduction
12.1.1 Genomic Imprinting: Definition and Relevance
Mammals, like all diploid organisms, have two copies of their autosomal genes –one copy (or allele) from each parent. Usually, both of these alleles are expressedat equal levels, thus maximising the protective benefit of diploidy should one allelefail due to mutation (Otto and Goldstein, 1992). Despite this, about 80 genes inmammals are expressed from only one of the two alleles, depending on their parentalorigin, a phenomenon known as genomic imprinting.
Genomic imprinting is important because it represents a striking example ofepigenetic regulation, now recognised to be critical in animal development. Theexpression of imprinted genes from only one allele (monoallelic) is determined onthe basis of the sex of the parent from which alleles were inherited, even thoughthe maternal and paternal alleles might have identical DNA sequences. Thus, thecontrol of genomic imprinting must occur at a level which is above or outside DNAsequence (hence, epi-genetic – see Russo et al., 1996).
It is now known that an epigenetic mark (or imprint) is imparted in the previ-ous generation during spermatogenesis in the father or oogenesis in the mother, todistinguish one parental allele from the other. It is thought that this original parent-distinguishing imprint is in the form of DNA methylation at CpG nucleotides,which is then “read” and interpreted during development and adult life to estab-lish parent-specific expression of nearby genes. Imprinted genes are often clusteredand regulated co-ordinately by a single region of differential methylation known asan imprint control region (ICR).
As well as their significance as an epigenetic model, imprinted genes are impor-tant medically. Although they number fewer than a hundred, imprinted genes aredisproportionately associated with human disease (Morison et al., 2005). This isbecause the mono-allelic expression of imprinted genes means that any mutation inthe single active copy of an imprinted gene is always fully penetrant, as no backupcopy is expressed that can compensate. Moreover, without even an alteration inDNA sequence, imprinted genes can cause disease. For example, if two sister chro-mosomes are inherited from only one parent (uniparental disomy), imprinted geneson that chromosome show twice their normal expression or no expression at all. Lossof imprinting (i.e. reactivation of a silenced allele) can also cause diseases such ascancer, as was discovered during initial characterisation of the archetypal imprintedgene, insulin-like growth factor 2 (IGF2) (Ogawa et al., 1993; Rainier et al., 1993).
Because of its relevance to human biology, agriculture and medicine, genomicimprinting has been examined in detail in humans and mice, and sporadically incattle and other domestic mammals. However, little work has been done on imprint-ing in marsupials (Hore et al., 2007b; Renfree et al., 2008; Renfree et al., 2009).This is perhaps surprising, given that the first discovery of imprinting in a mammalwas paternal-specific silencing of the X-chromosome in female kangaroos (Cooperet al., 1971; Richardson et al., 1971). In this chapter we examine observations of
12 The Evolution of Genomic Imprinting – A Marsupial Perspective 235
imprinted clusters and their regulators in marsupials, comparing this to observationsof imprinting in eutherians. We also highlight what this tells us about how and whygenomic imprinting evolved.
12.1.2 Evolution of Genomic Imprinting in Mammals: WhyMarsupials Are Important
Given the high disease burden associated with genomic imprinting, it seems bizarrethat it would ever evolve in the first place. Indeed, imprinting has been discoveredin only a few taxonomic groups – mammals, flowering plants and some insects –perhaps reflecting selection against imprinting in most diploids. Moreover, thenature and mechanism of imprinting in these distantly-related groups is so dissimilarthat it probably evolved independently in each lineage (Scott and Spielman, 2006).
Currently, the expectation is that mammalian imprinting evolved some time afterthe divergence of mammals from birds, reptiles and other vertebrates (Fig. 12.1).The most robust evidence for this proposition lies, not in the failure to discovergenomic imprinting in non-mammalian vertebrates (despite numerous attempts –O’Neill et al., 2000; Nolan et al., 2001; Yokomine et al., 2001; Lawton et al., 2005;Colosi et al., 2006), but rather the ability of non-mammalian vertebrates to undergoparthenogenesis. This contrasts with the inability of mammals to form partheno-genetic individuals (Mann and Lovell-Badge, 1984; McGrath and Solter, 1984;Surani et al., 1984). Parthenogenotes receive both haploid copies of their genomefrom their mother, and require no genetic input from a father. Therefore, imprintedgenes in a parthenogenote would have twice the normal expression of maternallyexpressed if imprinted genes are dosage sensitive or essential, genomic imprintingwill provide a barrier to parthenogenesis. All non-mammalian vertebrate groups,including fish, amphibians, reptiles and even birds can tolerate parthenogenesis andother forms of unequal parental inheritance in nature and the laboratory (reviewedHore, 2008). In contrast, mammalian parthenogenesis cannot occur without geneticmodification of imprinted loci and oocyte manipulation techniques that specificallynegate the effects of imprinted genes (Kono et al., 2004; Kawahara et al., 2007).
Since mammalian imprinting probably evolved after mammals diverged fromother vertebrates, distantly related mammalian taxa such as marsupials andmonotremes are likely to hold the key to understanding how and why imprintingevolved (Graves, 1996; Wilkins and Haig, 2003; Hore et al., 2007b; Renfree et al.,2009). This is because they diverged from other vertebrates at about the same timethat imprinting evolved (Fig. 12.1), and may still carry with them traces of the ear-liest innovations that were required for this specialised form of gene expression.Furthermore, marsupials represent the most distantly related mammalian taxa thatgive birth to live young, being nurtured in-utero with a placenta, a feature that isthought to be intimately linked with the evolution of genomic imprinting (discussedlater).
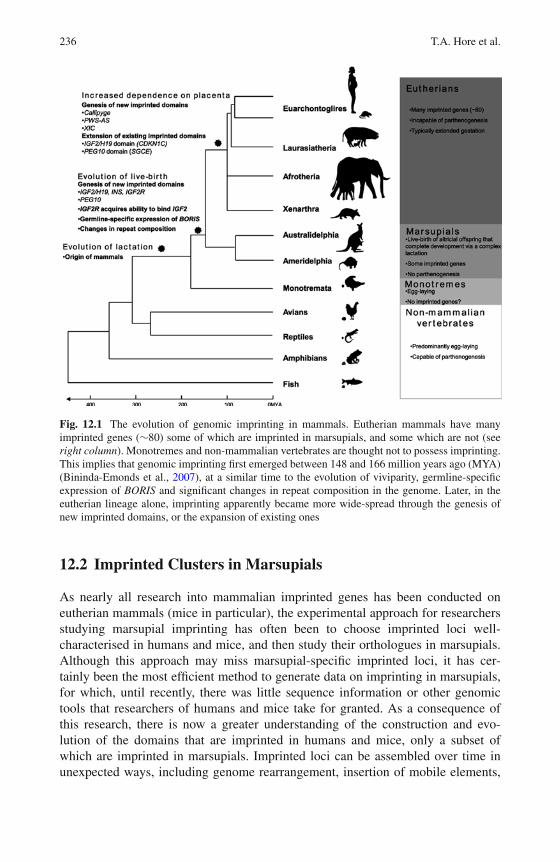
236 T.A. Hore et al.
Fig. 12.1 The evolution of genomic imprinting in mammals. Eutherian mammals have manyimprinted genes (∼80) some of which are imprinted in marsupials, and some which are not (seeright column). Monotremes and non-mammalian vertebrates are thought not to possess imprinting.This implies that genomic imprinting first emerged between 148 and 166 million years ago (MYA)(Bininda-Emonds et al., 2007), at a similar time to the evolution of viviparity, germline-specificexpression of BORIS and significant changes in repeat composition in the genome. Later, in theeutherian lineage alone, imprinting apparently became more wide-spread through the genesis ofnew imprinted domains, or the expansion of existing ones
12.2 Imprinted Clusters in Marsupials
As nearly all research into mammalian imprinted genes has been conducted oneutherian mammals (mice in particular), the experimental approach for researchersstudying marsupial imprinting has often been to choose imprinted loci well-characterised in humans and mice, and then study their orthologues in marsupials.Although this approach may miss marsupial-specific imprinted loci, it has cer-tainly been the most efficient method to generate data on imprinting in marsupials,for which, until recently, there was little sequence information or other genomictools that researchers of humans and mice take for granted. As a consequence ofthis research, there is now a greater understanding of the construction and evo-lution of the domains that are imprinted in humans and mice, only a subset ofwhich are imprinted in marsupials. Imprinted loci can be assembled over time inunexpected ways, including genome rearrangement, insertion of mobile elements,
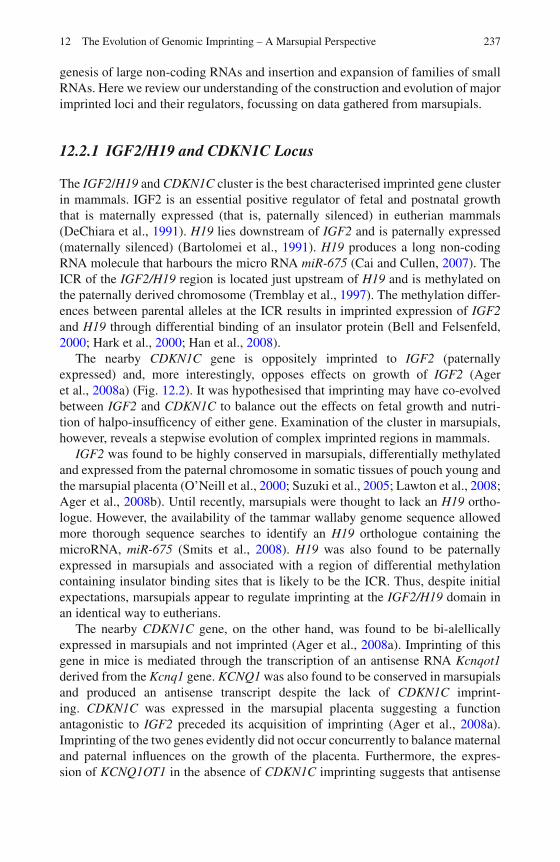
12 The Evolution of Genomic Imprinting – A Marsupial Perspective 237
genesis of large non-coding RNAs and insertion and expansion of families of smallRNAs. Here we review our understanding of the construction and evolution of majorimprinted loci and their regulators, focussing on data gathered from marsupials.
12.2.1 IGF2/H19 and CDKN1C Locus
The IGF2/H19 and CDKN1C cluster is the best characterised imprinted gene clusterin mammals. IGF2 is an essential positive regulator of fetal and postnatal growththat is maternally expressed (that is, paternally silenced) in eutherian mammals(DeChiara et al., 1991). H19 lies downstream of IGF2 and is paternally expressed(maternally silenced) (Bartolomei et al., 1991). H19 produces a long non-codingRNA molecule that harbours the micro RNA miR-675 (Cai and Cullen, 2007). TheICR of the IGF2/H19 region is located just upstream of H19 and is methylated onthe paternally derived chromosome (Tremblay et al., 1997). The methylation differ-ences between parental alleles at the ICR results in imprinted expression of IGF2and H19 through differential binding of an insulator protein (Bell and Felsenfeld,2000; Hark et al., 2000; Han et al., 2008).
The nearby CDKN1C gene is oppositely imprinted to IGF2 (paternallyexpressed) and, more interestingly, opposes effects on growth of IGF2 (Ageret al., 2008a) (Fig. 12.2). It was hypothesised that imprinting may have co-evolvedbetween IGF2 and CDKN1C to balance out the effects on fetal growth and nutri-tion of halpo-insufficency of either gene. Examination of the cluster in marsupials,however, reveals a stepwise evolution of complex imprinted regions in mammals.
IGF2 was found to be highly conserved in marsupials, differentially methylatedand expressed from the paternal chromosome in somatic tissues of pouch young andthe marsupial placenta (O’Neill et al., 2000; Suzuki et al., 2005; Lawton et al., 2008;Ager et al., 2008b). Until recently, marsupials were thought to lack an H19 ortho-logue. However, the availability of the tammar wallaby genome sequence allowedmore thorough sequence searches to identify an H19 orthologue containing themicroRNA, miR-675 (Smits et al., 2008). H19 was also found to be paternallyexpressed in marsupials and associated with a region of differential methylationcontaining insulator binding sites that is likely to be the ICR. Thus, despite initialexpectations, marsupials appear to regulate imprinting at the IGF2/H19 domain inan identical way to eutherians.
The nearby CDKN1C gene, on the other hand, was found to be bi-alellicallyexpressed in marsupials and not imprinted (Ager et al., 2008a). Imprinting of thisgene in mice is mediated through the transcription of an antisense RNA Kcnqot1derived from the Kcnq1 gene. KCNQ1 was also found to be conserved in marsupialsand produced an antisense transcript despite the lack of CDKN1C imprint-ing. CDKN1C was expressed in the marsupial placenta suggesting a functionantagonistic to IGF2 preceded its acquisition of imprinting (Ager et al., 2008a).Imprinting of the two genes evidently did not occur concurrently to balance maternaland paternal influences on the growth of the placenta. Furthermore, the expres-sion of KCNQ1OT1 in the absence of CDKN1C imprinting suggests that antisense
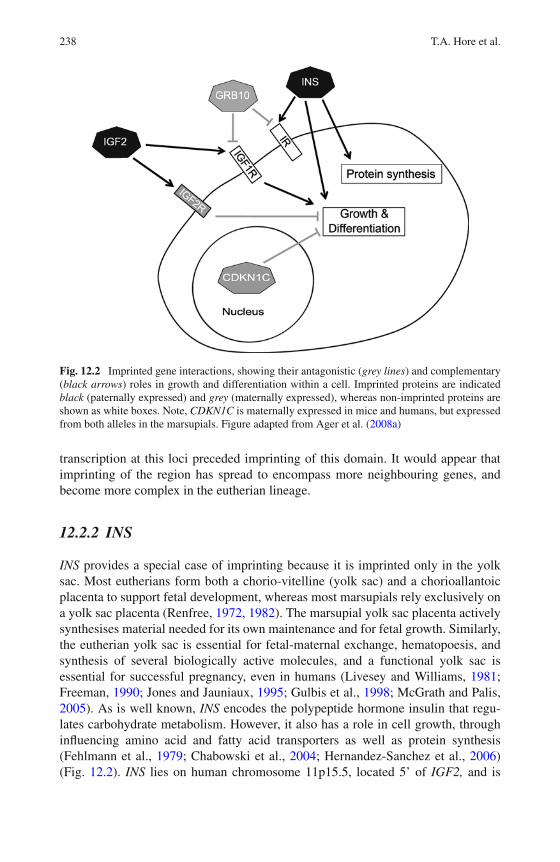
238 T.A. Hore et al.
Fig. 12.2 Imprinted gene interactions, showing their antagonistic (grey lines) and complementary(black arrows) roles in growth and differentiation within a cell. Imprinted proteins are indicatedblack (paternally expressed) and grey (maternally expressed), whereas non-imprinted proteins areshown as white boxes. Note, CDKN1C is maternally expressed in mice and humans, but expressedfrom both alleles in the marsupials. Figure adapted from Ager et al. (2008a)
transcription at this loci preceded imprinting of this domain. It would appear thatimprinting of the region has spread to encompass more neighbouring genes, andbecome more complex in the eutherian lineage.
12.2.2 INS
INS provides a special case of imprinting because it is imprinted only in the yolksac. Most eutherians form both a chorio-vitelline (yolk sac) and a chorioallantoicplacenta to support fetal development, whereas most marsupials rely exclusively ona yolk sac placenta (Renfree, 1972, 1982). The marsupial yolk sac placenta activelysynthesises material needed for its own maintenance and for fetal growth. Similarly,the eutherian yolk sac is essential for fetal-maternal exchange, hematopoesis, andsynthesis of several biologically active molecules, and a functional yolk sac isessential for successful pregnancy, even in humans (Livesey and Williams, 1981;Freeman, 1990; Jones and Jauniaux, 1995; Gulbis et al., 1998; McGrath and Palis,2005). As is well known, INS encodes the polypeptide hormone insulin that regu-lates carbohydrate metabolism. However, it also has a role in cell growth, throughinfluencing amino acid and fatty acid transporters as well as protein synthesis(Fehlmann et al., 1979; Chabowski et al., 2004; Hernandez-Sanchez et al., 2006)(Fig. 12.2). INS lies on human chromosome 11p15.5, located 5’ of IGF2, and is
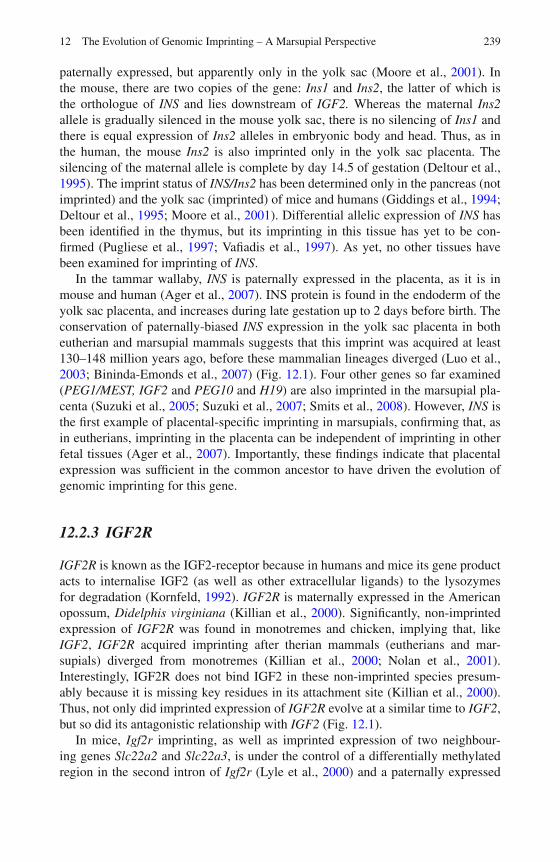
12 The Evolution of Genomic Imprinting – A Marsupial Perspective 239
paternally expressed, but apparently only in the yolk sac (Moore et al., 2001). Inthe mouse, there are two copies of the gene: Ins1 and Ins2, the latter of which isthe orthologue of INS and lies downstream of IGF2. Whereas the maternal Ins2allele is gradually silenced in the mouse yolk sac, there is no silencing of Ins1 andthere is equal expression of Ins2 alleles in embryonic body and head. Thus, as inthe human, the mouse Ins2 is also imprinted only in the yolk sac placenta. Thesilencing of the maternal allele is complete by day 14.5 of gestation (Deltour et al.,1995). The imprint status of INS/Ins2 has been determined only in the pancreas (notimprinted) and the yolk sac (imprinted) of mice and humans (Giddings et al., 1994;Deltour et al., 1995; Moore et al., 2001). Differential allelic expression of INS hasbeen identified in the thymus, but its imprinting in this tissue has yet to be con-firmed (Pugliese et al., 1997; Vafiadis et al., 1997). As yet, no other tissues havebeen examined for imprinting of INS.
In the tammar wallaby, INS is paternally expressed in the placenta, as it is inmouse and human (Ager et al., 2007). INS protein is found in the endoderm of theyolk sac placenta, and increases during late gestation up to 2 days before birth. Theconservation of paternally-biased INS expression in the yolk sac placenta in botheutherian and marsupial mammals suggests that this imprint was acquired at least130–148 million years ago, before these mammalian lineages diverged (Luo et al.,2003; Bininda-Emonds et al., 2007) (Fig. 12.1). Four other genes so far examined(PEG1/MEST, IGF2 and PEG10 and H19) are also imprinted in the marsupial pla-centa (Suzuki et al., 2005; Suzuki et al., 2007; Smits et al., 2008). However, INS isthe first example of placental-specific imprinting in marsupials, confirming that, asin eutherians, imprinting in the placenta can be independent of imprinting in otherfetal tissues (Ager et al., 2007). Importantly, these findings indicate that placentalexpression was sufficient in the common ancestor to have driven the evolution ofgenomic imprinting for this gene.
12.2.3 IGF2R
IGF2R is known as the IGF2-receptor because in humans and mice its gene productacts to internalise IGF2 (as well as other extracellular ligands) to the lysozymesfor degradation (Kornfeld, 1992). IGF2R is maternally expressed in the Americanopossum, Didelphis virginiana (Killian et al., 2000). Significantly, non-imprintedexpression of IGF2R was found in monotremes and chicken, implying that, likeIGF2, IGF2R acquired imprinting after therian mammals (eutherians and mar-supials) diverged from monotremes (Killian et al., 2000; Nolan et al., 2001).Interestingly, IGF2R does not bind IGF2 in these non-imprinted species presum-ably because it is missing key residues in its attachment site (Killian et al., 2000).Thus, not only did imprinted expression of IGF2R evolve at a similar time to IGF2,but so did its antagonistic relationship with IGF2 (Fig. 12.1).
In mice, Igf2r imprinting, as well as imprinted expression of two neighbour-ing genes Slc22a2 and Slc22a3, is under the control of a differentially methylatedregion in the second intron of Igf2r (Lyle et al., 2000) and a paternally expressed
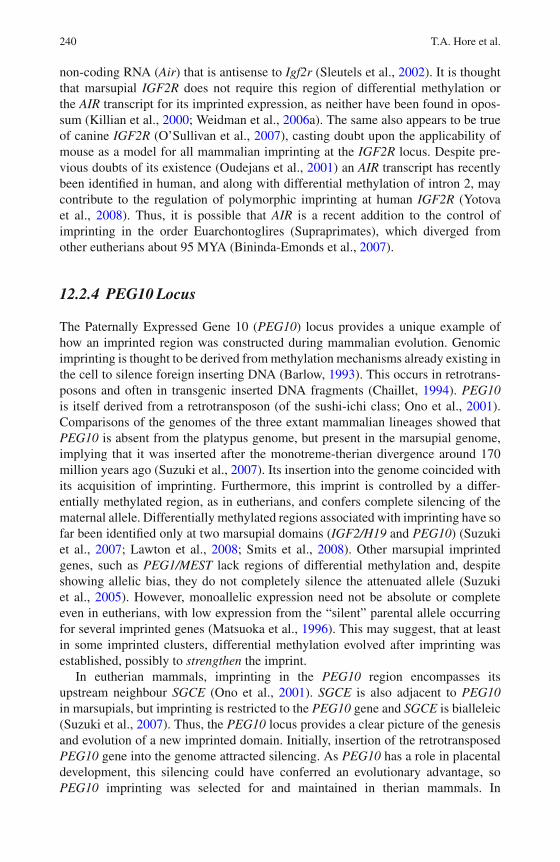
240 T.A. Hore et al.
non-coding RNA (Air) that is antisense to Igf2r (Sleutels et al., 2002). It is thoughtthat marsupial IGF2R does not require this region of differential methylation orthe AIR transcript for its imprinted expression, as neither have been found in opos-sum (Killian et al., 2000; Weidman et al., 2006a). The same also appears to be trueof canine IGF2R (O’Sullivan et al., 2007), casting doubt upon the applicability ofmouse as a model for all mammalian imprinting at the IGF2R locus. Despite pre-vious doubts of its existence (Oudejans et al., 2001) an AIR transcript has recentlybeen identified in human, and along with differential methylation of intron 2, maycontribute to the regulation of polymorphic imprinting at human IGF2R (Yotovaet al., 2008). Thus, it is possible that AIR is a recent addition to the control ofimprinting in the order Euarchontoglires (Supraprimates), which diverged fromother eutherians about 95 MYA (Bininda-Emonds et al., 2007).
12.2.4 PEG10 Locus
The Paternally Expressed Gene 10 (PEG10) locus provides a unique example ofhow an imprinted region was constructed during mammalian evolution. Genomicimprinting is thought to be derived from methylation mechanisms already existing inthe cell to silence foreign inserting DNA (Barlow, 1993). This occurs in retrotrans-posons and often in transgenic inserted DNA fragments (Chaillet, 1994). PEG10is itself derived from a retrotransposon (of the sushi-ichi class; Ono et al., 2001).Comparisons of the genomes of the three extant mammalian lineages showed thatPEG10 is absent from the platypus genome, but present in the marsupial genome,implying that it was inserted after the monotreme-therian divergence around 170million years ago (Suzuki et al., 2007). Its insertion into the genome coincided withits acquisition of imprinting. Furthermore, this imprint is controlled by a differ-entially methylated region, as in eutherians, and confers complete silencing of thematernal allele. Differentially methylated regions associated with imprinting have sofar been identified only at two marsupial domains (IGF2/H19 and PEG10) (Suzukiet al., 2007; Lawton et al., 2008; Smits et al., 2008). Other marsupial imprintedgenes, such as PEG1/MEST lack regions of differential methylation and, despiteshowing allelic bias, they do not completely silence the attenuated allele (Suzukiet al., 2005). However, monoallelic expression need not be absolute or completeeven in eutherians, with low expression from the “silent” parental allele occurringfor several imprinted genes (Matsuoka et al., 1996). This may suggest, that at leastin some imprinted clusters, differential methylation evolved after imprinting wasestablished, possibly to strengthen the imprint.
In eutherian mammals, imprinting in the PEG10 region encompasses itsupstream neighbour SGCE (Ono et al., 2001). SGCE is also adjacent to PEG10in marsupials, but imprinting is restricted to the PEG10 gene and SGCE is bialleleic(Suzuki et al., 2007). Thus, the PEG10 locus provides a clear picture of the genesisand evolution of a new imprinted domain. Initially, insertion of the retrotransposedPEG10 gene into the genome attracted silencing. As PEG10 has a role in placentaldevelopment, this silencing could have conferred an evolutionary advantage, soPEG10 imprinting was selected for and maintained in therian mammals. In
12 The Evolution of Genomic Imprinting – A Marsupial Perspective 241
eutherians, imprinting spread to encompass the neighbouring SGCE gene. Thesefindings add strong support to the host defence hypothesis (Barlow, 1993), as doesexamination of the genomes of non-imprinted species such as platypus (see below),potentially explaining how silencing mechanisms were recruited to imprinted loci.
12.3 Clusters Not Imprinted in Marsupials
Proving that imprinting does not occur at a given locus is more problematic thanproving that it does, as it is difficult to exclude monoallelic expression of a genein all the tissues and possible developmental time-frames. However, a combinationof gene expression and genomic analyses has recently provided very compellingevidence for the absence of imprinting at the marsupial orthologues of the Prader-Willi and Angleman’s syndrome (PWS-AS) locus and the Callipyge locus (Rapkinset al., 2006; Weidman et al., 2006b; Edwards et al., 2008). Significantly, thiswork demonstrates that not all domains evolved imprinting in the ancestor of the-rian mammals; rather they acquired parent-specific expression only in eutherians,perhaps in response to new or changing selective pressures (Hore et al., 2007b).
12.3.1 Prader-Willi and Angelman’s Syndrome Locus
Deletions or malfunction of imprinted genes on human chromosome 15q11–13are responsible for the neurological disorders Prader-Willi and Angelman’s syn-dromes (PWS and AS – Nicholls and Knepper, 2001). This locus contains multiplepaternally- and maternally-expressed genes, all of which are under the control ofa single ICR. This ICR is located in the promoter of a large (>100 kb), pater-nally expressed transcript that is responsible for the expression of two distinctproteins (SNURF and SmN – see Gray et al., 1999a) and several classes of smallnucleolar RNAs (snoRNAs) (Runte et al., 2001). This remarkable transcript (calledSNURF-SNRPN after the two protein-encoding genes it contains) also overlaps aneighbouring maternally expressed gene (UBE3A) in an antisense fashion, presum-ably providing the regulatory mechanism linking imprinted expression of UBE3Ato the ICR (Runte et al., 2004). Located distal to UBE3A is another maternallyexpressed gene (ATP10A), and there are three intronless, paternally expressed geneslocated proximal to SNRPN (NDN, MAGEL2 and MKRN3) (Nicholls and Knepper,2001).
Although genes from the PWS-AS region are conserved in number and arrange-ment throughout eutherians, most appear not to exist outside this mammal infra-class. Attempts to find NDN, MAGEL2 and MKRN3 in marsupials resulted only inthe discovery of their intron-bearing progenitors (implying that they arose by retro-transposition), whereas no sequence with similarity to the SNURF gene could befound (Gray et al., 2000; Rapkins et al., 2006). An orthologue of SNRPN was dis-covered in marsupials adjacent to a very similar gene SNRPB, but could not be foundin non-therians or other vertebrates. The position of SNRPN in marsupials and its
242 T.A. Hore et al.
absence from the genomes of monotremes and non-mammalian vertebrates indi-cates that SNRPN arose from SNRPB by tandem duplication during early eutherianradiation (Gray et al., 1999b; Rapkins et al., 2006).
In marsupials, UBE3A (the gene that lies next to SNRPN in eutherians) is locatedon a different chromosome to SNRPN, lying next to a gene called CNGA3. Thisunexpected UBE3A-CNGA3 conformation was shared with the platypus, chickenand fish genomes, implying that it was the ancestral vertebrate arrangement.A rearrangement that brought UBE3A and SNRPN together must have occurredin eutherians soon after their divergence from the marsupials. A single snoRNA(SNORD119) was found within marsupial SNRPN and is thought to have seeded atleast one of the large arrays of snoRNAs characteristic of the eutherian locus, pre-sumably by tandem duplication (Nahkuri et al., 2008). No trace of the regulatoryelements, including the ICR of the PWS-AS region, could be found in marsupials orany other non-eutherian. In line with the absence of regulatory elements and the dis-location of the PWS-AS domain, expression of marsupial and monotreme SNRPNand UBE3A orthologues was found to be non-imprinted (Rapkins et al., 2006). Thus,the PWS-AS region was assembled from a range of components found in disparateregions of the genome, and acquired imprinting only in the eutherian lineage.
12.3.2 Callipyge Locus
The Callipyge locus on human chromosome 14q32 contains an diverse collectionof imprinted genes and is named after a striking posterior muscle trait for whichits orthologue in sheep is responsible (Callipyge means beautiful buttock) (Cockettet al., 1996). This imprinted cluster contains three paternally expressed protein-encoding genes; the delta-like homologue which causes the callipyge phenotypewhen overexpressed (DLK1), the retrotransposon-derived RTL1 gene and the type3 deiodinase, DIO3 (reviewed in da Rocha et al., 2008). The Callipyge domainalso contains maternally expressed sequences, including a large non-coding tran-script (GTL2) and several classes of micro RNAs (miRNAs) and snoRNAs (Charlieret al., 2001; Cavaille et al., 2002; Seitz et al., 2004). Interestingly, seven of thesemiRNAs lie within the RTL1 gene, but on the anti-sense strand, and have beenshown to repress RTL1 expression on the maternally derived chromosome throughRNA-interference (Davis et al., 2005).
In vertebrates, the DLK1 and DIO3 genes lie in close proximity (Dunzinger et al.,2005). Thorough searches for homology between these genes has uncovered around50 regions that are conserved between mammalian groups, but none that overlapwith the ICR or any of the large imprinted non-coding RNAs, miRNAs or snoRNAs.DLK1 and DIO3, the only identifiable marsupial orthologues from the Callipygedomain, were found to have bi-allelic expression in wallaby and platypus (Weidmanet al., 2006b; Edwards et al., 2008). Thus, in parallel to the PWS-AS region (Rapkinset al., 2006), many of the genes from the Callipyge domain do not exist in marsupialsand other non-eutherian species, and of the ones that are present, none are imprinted(Weidman et al., 2006b; Edwards et al., 2008).
12 The Evolution of Genomic Imprinting – A Marsupial Perspective 243
Although Callipgye is clearly a eutherian-specific imprinted domain, traces of adegraded RTL1 sequence have been found in marsupials, but not platypus or anynon-mammals (Edwards et al., 2008). Thus, it is proposed that RTL1 was insertedby retrotransposition sometime during the early evolution of therian mammals.In eutherians this inserted sequence apparently gained functionality, as RTL1 isrequired for placental development in mice, but the gene appears to have succumbedto pseudogenisation in marsupials. It is interesting to compare this initial insertionevent with that of the PEG10 insertion, which is thought to have seeded imprint-ing at the PEG10 locus. A common thread between these domains may be thatrepeat insertion provided a mechanism for imprinting to evolve, perhaps throughhost-defence mechanisms (Barlow, 1993; Pask et al., 2009).
12.4 Distribution of Repeats in Mammalian Genomesand the Host Defence Hypothesis
The recent sequencing of the platypus genome (Warren et al., 2008) made it possibleto perform genome wide comparisons across all three extant lineages of mammals.This was of particular importance to understanding the genesis of genomic imprint-ing, as imprinting is thought not to occur in the monotreme genome, but be restrictedto marsupials and eutherians.
The distribution of repeat elements known to attract epigenetic silencing wastherefore examined in the genomic regions orthologous to eutherian imprinteddomains from representatives of each mammalian lineage (Pask et al., 2009).A significant accumulation of long terminal repeats and DNA elements was identi-fied in therian mammals when compared to platypus, implying that they expandedin therians after their divergence from monotremes. Repeat insertion can trigger epi-genetic silencing of surrounding alleles. If this silencing conferred an evolutionaryadvantage when applied in a parent-specific manner (such as in the PEG10 gene, forexample) it would be selected for and maintained, evolving into an imprinted locus.
Significantly, repeat accumulation is not a feature just of the imprinted domainsin therian mammals, but of the entire genome of therian mammals (Warren et al.,2008; Pask et al., 2009). Thus, it is possible that repeat accumulation in nearbyregions was not critical for the evolution of imprinted genes per se. Rather; it mayhave been responsible for the evolution of specialised epigenetic machinery whichwas primarily used to silence the new wave of therian repeats, then secondarilyrecruited to the regulation of imprinting.
12.5 The X-Chromosome
One spectacular, yet often ignored, example of mammalian imprinting is the inacti-vation of the paternally derived X chromosome in female marsupials (Cooper et al.,1971; Richardson et al., 1971). X inactivation balances gene dosage in male mar-supials that have only one X chromosome and a small gene poor Y chromosome.
244 T.A. Hore et al.
X-chromosome inactivation also occurs in humans and mice, but affects X chromo-somes originating from both parents by inactivating one or the other X randomlyduring early development. This leads to a mosaic phenotype that is observable infemale mice and cats that possess X-linked coat colour genes (Lyon, 1961) and inwomen suffering from X-linked skin diseases that display developmental “Lines ofBlascko” (Happle, 1985). Interestingly, in the extraembryonic tissue (including theyolk sac and allantoic placentae) of rodents (Takagi and Sasaki, 1975; Wake et al.,1976; West et al., 1977) and cattle (Dindot et al., 2004) (but apparently not humans;Migeon et al., 1985), it appears that the inactive X is paternally derived, perhapsindicating an evolutionary link with marsupial X inactivation.
Although X inactivation deserves discrete review in its own right (see Al Nadafet al., Chapter 13), it is important to recognise that the X does possess bona fideimprinted genes worthy of evolutionary analysis. Perhaps the most interesting ofthese belong to the X-inactivation centre that orchestrates silencing of the entireeutherian X chromosome, largely through the action of a large non-coding RNAcalled the X-inactive specific transcript (XIST) (reviewed Heard et al., 2004; Payerand Lee, 2008).
Marsupials lack XIST and the other non-coding RNAs from the eutherianX-inactivation centre (Duret et al., 2006; Davidow et al., 2007; Hore et al., 2007a;Shevchenko et al., 2007), so this locus must have evolved more recently in theeutherian lineage. It appears that XIST and at least some of the other imprintednon-coding RNAs from this locus have been derived from ancestral protein-codinggenes that succumbed to pseudogenistation during mammalian evolution (Duretet al., 2006; Elisaphenko et al., 2008). Since marsupials possess these protein codinggenes (albeit somewhat rearranged compared to chicken and frog; Davidow et al.,2007; Hore et al., 2007a; Shevchenko et al., 2007), it is thought that these pseu-dogenisation events occurred after the divergence of marsupials from eutherians.Concomitant with pseudogenisation and rearrangement was invasion of retroposedgenes, repeats and small non-coding RNAs. Thus the X-inactivation centre has beenconstructed in a manner surprisingly similar to that of other imprinted domains,including PWS-AS and Callipyge (Hore et al., 2007b).
Whether or not marsupial X inactivation is under the control of a non-homologous imprinted domain analogous to the eutherian X-inactivation centre, ordepends upon some other mechanism (such as meiotic sex-chromosome inactiva-tion in males – see Al Nadaf et al., Chapter 13) is currently a field of active researchand debate.
12.6 Regulators of Imprinting in Marsupials
12.6.1 Evolution of the DNA Methyltransferase 3 Family
In the same way that comparative genomics can shed light on the evolution ofimprinted gene clusters, similar approaches have recently elucidated the evolutionof genes that regulate imprinting.
12 The Evolution of Genomic Imprinting – A Marsupial Perspective 245
Imprinted genes undergo a generational “life-cycle”. In the germ cells there isremoval of imprint marks received from mother and father, and establishment ofnew sex-specific marks ready to be passed on to the offspring (Reik et al., 2001).To establish DNA methylation at non-methylated sites, mammals use the DNAmethyltransferase 3 family members DNMT3A and DNMT3B (Goll and Bestor,2005). There is a third member of the DNA methyltransferase 3 family in mam-mals called DNMT3L, which lacks the critical domain for DNA methyltransferaseability, but apparently enhances the function of the other DNMT3 members at a sub-set of methylated sites by connecting them to histone H3 tails that are unmethylatedat lysine 4 (Jia et al., 2007; Ooi et al., 2007). Male mice with Dnmt3L knocked-out are viable, but are sterile because of defects in meiosis, presumably due torepeat activation in the absence of methylation (Bourc’his et al., 2001; Hata et al.,2002; Kaneda et al., 2004; Webster et al., 2005). Interestingly, global methylationpatterns in female knockouts appear relatively unaffected, but they are also sterileand are unable to impart maternal specific methylation at ICRs in growing oocytes(Bourc’his et al., 2001; Hata et al., 2002; Kaneda et al., 2004).
Recently, the existence of the DNMT3 family was investigated in marsupials andnon-mammal vertebrates (Yokomine et al., 2006). DNMT3A and DNMT3B ortho-logues were discovered in all species examined, which is perhaps not surprisinggiven that they are the only de-novo methyltransferases detected in vertebrates.DNMT3L showed a reduced phylogenetic presence, being found only in eutheri-ans and marsupials, but not birds, amphibians or fish. The presence of DNMT3L inmarsupials as well as eutherians suggests that its role in establishing de-novo methy-lation at maternally imprinted clusters is conserved in therians (Yokomine et al.,2006; Smits et al., 2008). As DNMT3L was not detected in birds, amphibians orfish, it was originally proposed that DNMT3L arose in early therian mammals priorto the divergence of marsupials and eutherians, around the same time as imprinting.However, searches in the lizard genome (Anolis carolinensis) yield a clear ortho-logue of DNMT3L (assembly AnoCar 1.0, scaffold118), implying that DNMT3L ismuch more ancient than predicted, having arisen sometime before the divergence ofmammals from birds and reptiles.
12.6.2 Evolution of CTCF and BORIS
CCCTC-binding factor (CTCF) and its paralogue, Brother of Regulator of ImprintedSites (BORIS) are epigenetic regulators that share the same DNA-binding zinc-finger domain. However, outside the DNA binding domain they share almost no sim-ilarity and have completely different expression patterns – CTCF is expressed ubiq-uitously, whereas BORIS is expressed only in the germline (Loukinov et al., 2002;Jelinic et al., 2006; Kholmanskikh et al., 2008; Monk et al., 2008). Furthermore, theproducts of these genes appear to have quite different functions at the IGF2/H19ICR; BORIS is thought to establish paternal-specific methylation of this sitethrough interaction with members of the DNMT3 family and a histone modifiercalled PRMT7 (Jelinic et al., 2006), whereas CTCF interprets this imprint later in
246 T.A. Hore et al.
development, giving rise to parent-specific expression. CTCF does this by bindingthe ICR in a methylation-sensitive fashion. On the maternally derived, unmethylatedICR, CTCF insulates the nearby IGF2 gene from downstream enhancers, silencingits expression (Bell and Felsenfeld, 2000; Hark et al., 2000). On the paternallyderived chromosome, CTCF cannot bind the methylated ICR, leaving IGF2 openfor expression.
Recently, researchers have endeavoured to find out if CTCF and BORIS arepresent in marsupial genomes, and if there is anything related to their history thatcan shed light upon the evolution of imprinting. In line with its essential and variedfunctions within the vertebrate cell (reviewed Filippova, 2008) CTCF was foundto be highly conserved in sequence and expressed ubiquitously in all vertebrates(Klenova et al., 1993; Klenova et al., 1998; Burke et al., 2002; Moon et al., 2005;Pugacheva et al., 2006), including marsupials (Hore et al., 2008). Thus, there isnothing striking about the history of CTCF that correlates with the evolution ofimprinting.
However, BORIS shows a much reduced phylogenetic presence. Originally, itwas thought that it arose early in the mammal lineage, as BORIS orthologues werediscovered in humans and mice, but not chicken (Loukinov et al., 2002). However,a more recent analysis has revealed BORIS orthologues in all mammalian groupsand two lizard species (A. carolinensis and Pogona vitticeps), as well as traces ofa degraded BORIS sequence in bird genomes (Hore et al., 2008). Thus, in contrastto what was originally proposed, the genesis of BORIS is not correlated with theevolution of imprinting.
However, examination of BORIS expression showed that it is actively transcribedin somatic tissues of monotremes (platypus) and reptiles (bearded dragon lizard), yetin marsupials (tammar wallaby) and cattle, it is expressed only in the germline, justas in humans and mice. Thus, BORIS is specific to the germ-line in mammal groupsthat undergo imprinting, but shows wider expression in species without imprintingsuch as monotremes and non-mammalian vertebrates. This implies that, althoughBORIS arose well before imprinting, restriction of its expression to the germlinewas associated with its recruitment to the regulation of imprinted genes.
12.7 Why Did Genomic Imprinting Evolve?
So far we have reviewed what is known about marsupial orthologues of humanand mouse imprinted genes and their regulators. In doing so, we gather an under-standing of how they have been constructed over evolutionary time; a processapparently involving considerable genomic rearrangement, changes in repeat com-position, insertion of retroposed genes, evolution of epigenetic regulators and thegenesis of large and small non-coding RNAs (Fig. 12.3). However, it is of equalinterest to understand why imprinted genes have discarded biallelic expression,despite exposure to considerable mutational load. Although this topic is fiercelydebated, most agree that imprinting is related to the evolution of viviparity and theplacenta.
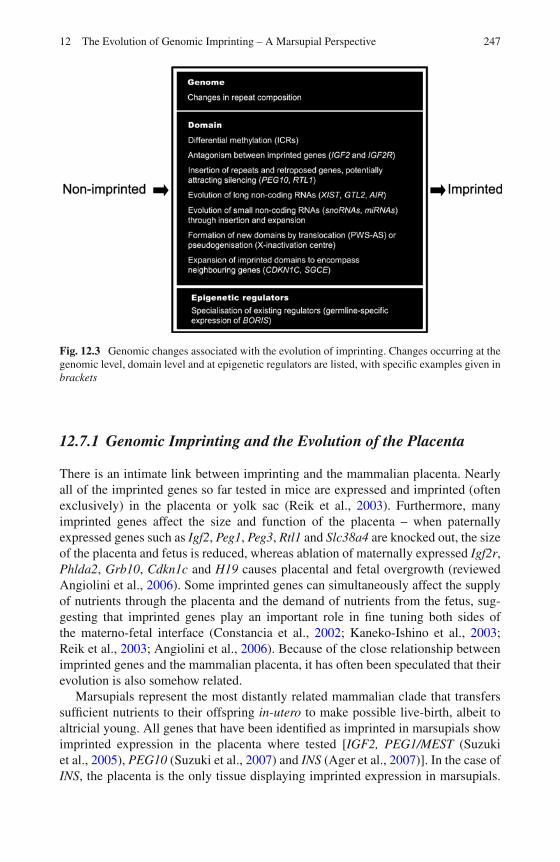
12 The Evolution of Genomic Imprinting – A Marsupial Perspective 247
Fig. 12.3 Genomic changes associated with the evolution of imprinting. Changes occurring at thegenomic level, domain level and at epigenetic regulators are listed, with specific examples given inbrackets
12.7.1 Genomic Imprinting and the Evolution of the Placenta
There is an intimate link between imprinting and the mammalian placenta. Nearlyall of the imprinted genes so far tested in mice are expressed and imprinted (oftenexclusively) in the placenta or yolk sac (Reik et al., 2003). Furthermore, manyimprinted genes affect the size and function of the placenta – when paternallyexpressed genes such as Igf2, Peg1, Peg3, Rtl1 and Slc38a4 are knocked out, the sizeof the placenta and fetus is reduced, whereas ablation of maternally expressed Igf2r,Phlda2, Grb10, Cdkn1c and H19 causes placental and fetal overgrowth (reviewedAngiolini et al., 2006). Some imprinted genes can simultaneously affect the supplyof nutrients through the placenta and the demand of nutrients from the fetus, sug-gesting that imprinted genes play an important role in fine tuning both sides ofthe materno-fetal interface (Constancia et al., 2002; Kaneko-Ishino et al., 2003;Reik et al., 2003; Angiolini et al., 2006). Because of the close relationship betweenimprinted genes and the mammalian placenta, it has often been speculated that theirevolution is also somehow related.
Marsupials represent the most distantly related mammalian clade that transferssufficient nutrients to their offspring in-utero to make possible live-birth, albeit toaltricial young. All genes that have been identified as imprinted in marsupials showimprinted expression in the placenta where tested [IGF2, PEG1/MEST (Suzukiet al., 2005), PEG10 (Suzuki et al., 2007) and INS (Ager et al., 2007)]. In the case ofINS, the placenta is the only tissue displaying imprinted expression in marsupials.
248 T.A. Hore et al.
These results suggest that in marsupials, as in eutherians, the placenta is a key tissuefor imprinted gene expression (Renfree et al., 2008).
In contrast to live-bearing therian mammals, no parental bias has so far beendiscovered in the expression of genes from the egg-laying monotremes, perhapsindicating that like other egg-laying vertebrates, they lack genomic imprinting(Killian et al., 2000; O’Neill et al., 2000; Killian et al., 2001b; Killian et al., 2001a;Nolan et al., 2001; Rapkins et al., 2006; Deakin et al., 2008; Edwards et al., 2008).Thus, the change in the mode of reproduction, as the livebearing therian mammalsdiverged from egg-laying progenitors, may have begun to apply the evolutionarypressure from which imprinting evolved.
What aspects of live-birth and the placenta promote the evolution of parent-specific expression? Currently, there is no accepted answer to this question, butseveral hypotheses have been discussed extensively in the literature. Perhaps themost widely discussed, and with the most relevance to marsupials, is the kinshiphypothesis.
12.7.2 The Kinship Hypothesis of Genomic Imprinting
The kinship hypothesis (also known as the parental-conflict, or parental tug-of-warhypothesis) states that imprinting evolved out of a conflict between the mother’sand father’s genomes over the provision of maternal resources (Haig and Westoby,1989; Moore and Haig, 1991; Haig, 2000; Wilkins and Haig, 2003). Specifically, afather can maximise his reproductive output by ensuring that his offspring receive asmuch maternal resources as possible, regardless of the expense to the mother and heroffspring fathered by other males. Conversely, a mother maximises her reproductiveoutput by sharing her maternal resources equally to all her offspring, regardless ofthe father. The disparity between these two selection pressures is expected to resultin parent-specific expression of genes which can modify the supply of maternalresources during development.
As the placenta is entirely fetally-derived, often invasive and can affect thesupply and demand of nutrients to offspring during pregnancy, it offers an idealarena for parental conflict. As previously discussed, many paternally expressedgenes promote growth of the placenta and offspring, whereas maternally expressedgenes act to suppress growth of the placenta and offspring (Angiolini et al., 2006).Thus, the function of imprinted genes in the placenta provides considerable supportfor the kinship hypothesis. Some imprinted genes with effects outside of the pla-centa also provide support for the kinship hypothesis. For instance, mutations in thepaternally expressed XLαs protein cause growth retardation and a failure to sucklein newborn humans and mice (Plagge et al., 2004; Genevieve et al., 2005), indicat-ing that parental conflict acting during lactation may also give rise to parent-specificexpression.
The phylogenetic distribution of imprinting provides solid support for the kin-ship hypothesis. Imprinting does not occur in birds, amphibians, reptiles andfish which are predominately egg-laying, so that paternally derived genes have
12 The Evolution of Genomic Imprinting – A Marsupial Perspective 249
little or no chance of affecting the supply of maternal resources. Paradoxically,non-mammalian vertebrates that possess placenta-like structures also support thekinship hypothesis. Live-bearing killifish Heteroandria formosa and Poeciliopsisprolifica exhibit accelerated positive selection of IGF2 sequence compared withtheir egg-laying relatives (O’Neill et al., 2007). Thus, although these fish are with-out imprinting, accelerated positive selection is thought to provide evidence forparental-conflict due to viviparity, being caused by successive selective sweeps ofantagonistic mutations that favour either the paternal or maternal lineage.
Marsupials represent an interesting case for the kinship hypothesis, as they arelive-bearing, but give birth to tiny altricial young. One would hypothesise thatparental-conflict would be a weaker selective force than in eutherian mammals thattypically give birth to offspring that are much larger relative to the mother (Renfreeet al., 2009). Perhaps this is why imprinting in marsupials is less pronounced: oftenthere is some degree of expression from silenced alleles in marsupials, and theirimprinted regions are smaller or, in some cases, absent. Moreover, the evolution ofeutherian-specific imprinted loci (e.g. Callipyge and PWS-AS) or the expansion ofexisting imprinted loci in eutherians (e.g., CDKN1C and PEG10) may be the resultof stronger selection for parent-specific expression due to greater parental conflictin-utero.
12.7.3 Alternative Theories: Ovarian Time-Bomband Co-adaptation
Although successful in explaining imprinting of genes involved in growth, the kin-ship hypothesis has trouble accounting for the function of all imprinted genes. Forinstance, the maternally expressed Slc22a2 and Slc22a3 are small solute carriers thatappear to have no impact on growth or acquisition of maternal resources, so are hardto explain by kinship (Haig, 2004). Furthermore, although interesting explanationshave been offered (Haig and Wharton, 2003; Ubeda, 2008), the largely neurologicaldisorders that arise from perturbation of the imprinted PWS-AS domain also do notneatly fit with the kinship hypothesis. Thus, other selective advantages which arethought to outweigh the costs of genomic imprinting have been proposed; includingintralocus sexual conflict (Day and Bonduriansky, 2004), protection against invasivetrophoblastic disease (Varmuza and Mann, 1994), and maternal-infant co-adaptation(Keverne and Curley, 2008).
Of these, marsupial imprinting is particularly relevant to the latter two, as theyboth require placentation and viviparity for their application. For instance, thehypothesis that imprinting protects against invasive trophoblastic disease (dubbedthe “Ovarian time-bomb” hypothesis) predicts that imprinting prevents eggs fromspontaneously developing by ensuring that essential growth factors are paternally-expressed and are therefore only active in the zygote post-fertilisation (Varmuzaand Mann, 1994). The risk that unfertilised eggs could spontaneously develop intoa cancerous growth capable of harming the mother is presumably much less inspecies without a placenta, potentially explaining why egg-laying species do not
250 T.A. Hore et al.
show imprinting. However, the ovarian time-bomb hypothesis falters in that it failsto explain why so many genes are imprinted, and why their mono-allelic expressionoften persists into adulthood, both of which are presumably unnecessary for theprevention of trophoblastic disease (Wilkins and Haig, 2003).
The maternal co-adaptation hypothesis for the evolution of imprinting bases itsarguments on the maternal-young interactions from fetus to neonate, so may applyto marsupials. A subset of imprinted genes are active in both the placenta (tissues offetal origin), and the brain (of offspring and mother). These genes can alter physio-logical and behavioural traits associated with in utero development, mothering andfeeding (Li et al., 1999; Curley et al., 2004). The developing brain is as equallysusceptible to imprinting as the placenta. Since both the placenta and the hypothala-mus are responsible for the regulation of gases, water and nutrients, these effectsoverlap in function and developmental timing. Thus they may be co-adapted toensure complementary functions between mother and offspring, rather than con-flict over maternal resources (Keverne and Curley, 2008). Despite the attractivenessof this hypothesis, maternal-infant co-adaptation cannot provide evolutionary rea-sons for all imprinted genes to have acquired monoallelic expression, because notall imprinted genes have overlapping functions in the mother and infant. Therefore,like all other theories regarding the evolution of imprinting, this area will requirefurther research.
12.8 Conclusions/Future Research
The hazy understanding of what selective pressures caused the evolution of genomicimprinting underlines the importance of studying imprinted genes in marsupials. Allmajor theories to explain the evolution of imprinting are levered on the same fulcrumof mammalian history – the evolution of placentation sufficient to support live-birth.Yet only the major imprinted loci have been investigated in marsupials, and often toa lower level than their human and mouse orthologues. Despite this, it is now clearthat imprinting in marsupials is less common and less penetrant than eutherians atthe well characterised loci. Perhaps this is a reflection of the lower dependence ofmarsupials on placentation to nurture their young, so they do not experience thesame selective pressures that eutherians do.
Alternatively, and perhaps more excitingly, we may soon discover that mar-supials possess a suite of imprinted genes that are specific to their taxa andreproductive lifecycles. For instance, since lactation is relatively more importantthan placental nutrition in marsupials, additional imprinted genes may be foundthat affect the supply and demand of milk. Moreover, there is potential for exag-gerated imprinting in the dasyurid and didelphid marsupials, certain members ofwhich are the only mammals to achieve near semelparity (i.e. single birth) andexperience mass die-off after breeding (Cockburn, 1997). Perhaps the best stud-ied of these is the broad-footed marsupial mouse (Antechinus spp). Males of thisspecies participate in only one breeding season, and only 7% of females sur-vive for two breeding seasons (Holleley et al., 2006). However, they make up for
12 The Evolution of Genomic Imprinting – A Marsupial Perspective 251
this by producing large litters that are sired by up to four fathers (Fisher et al.,2006). Fierce selection between half-sibs competing for the same maternal resourcesmight accelerate the evolution of imprinting to levels not yet observed in othermammals.
In either case, the study of marsupials is paramount if our understanding of theevolution and function of genomic imprinting is to be advanced and extended inthe forthcoming era of massively-parallel sequencing and epigenomics. Given thewealth of significant information already gleaned from the study of marsupial epi-genetics, it is almost certain these “alternative mammals” will yield many morefundamental insights critical to mammalian biology.
References
Ager E, Suzuki S, Pask AJ, et al. (2007) Insulin is imprinted in the placenta of the marsupial,Macropus eugenii. Dev Biol 309:317–328.
Ager EI, Pask AJ, Gehring HM, Shaw G, Renfree MB (2008a). Evolution of the CDKN1C-KCNQ1imprinted domain. BMC Evol Biol 8:163.
Ager EI, Pask AJ, Shaw G, Renfree MB (2008b). Expression and protein localisation of IGF2 inthe marsupial placenta. BMC Dev Biol 8:17.
Angiolini E, Fowden A, Coan P, et al. (2006) Regulation of placental efficiency for nutrienttransport by imprinted genes. Placenta 27(Suppl A):S98–S102.
Barlow DP (1993) Methylation and imprinting: from host defense to gene regulation? Science260:309–310.
Bartolomei MS, Zemel S, Tilghman SM (1991) Parental imprinting of the mouse H19 gene. Nature351:153–155.
Bell AC, Felsenfeld G (2000) Methylation of a CTCF-dependent boundary controls imprintedexpression of the Igf2 gene. Nature 405:482–485.
Bininda-Emonds OR, Cardillo M, Jones KE, et al. (2007) The delayed rise of present-daymammals. Nature 446:507–512.
Bourc’his D, Xu GL, Lin CS, Bollman B, Bestor TH (2001) Dnmt3L and the establishment ofmaternal genomic imprints. Science 294:2536–2539.
Burke LJ, Hollemann T, Pieler T, Renkawitz R (2002) Molecular cloning and expression of thechromatin insulator protein CTCF in Xenopus laevis. Mech Dev 113:95–98.
Cai X, Cullen BR (2007) The imprinted H19 noncoding RNA is a primary microRNA precursor.RNA 13:313–316.
Cavaille J, Seitz H, Paulsen M, Ferguson-Smith AC, Bachellerie JP (2002) Identification oftandemly-repeated C/D snoRNA genes at the imprinted human 14q32 domain reminiscent ofthose at the Prader-Willi/Angelman syndrome region. Hum Mol Genet 11:1527–1538.
Chabowski A, Coort SLM, Calles-Escandon J, et al. (2004) Insulin stimulates fatty acid trans-port by regulating expression of FAT/CD36 but not FABPpm. Am J Physiol Endocrinol Metab287:781–789.
Chaillet JR (1994) Genomic imprinting: lessons from mouse transgenes. Mutat Res 307:441–449.Charlier C, Segers K, Wagenaar D, et al. (2001) Human-ovine comparative sequencing of a 250-kb
imprinted domain encompassing the callipyge (clpg) locus and identification of six imprintedtranscripts: DLK1, DAT, GTL2, PEG11, antiPEG11, and MEG8. Genome Res 11:850–862.
Cockburn A (1997) Living slow and dying young: senescence in marsupials. In: Saunders N,Hinds L (eds) Marsupial Biology: Recent Research, New Perspectives. University of NewSouth Wales Press, Sydney.
Cockett NE, Jackson SP, Shay TL, et al. (1996) Polar overdominance at the ovine callipyge locus.Science 273:236–238.
252 T.A. Hore et al.
Colosi DC, Martin D, More K, Lalande M (2006) Genomic organization and allelic expression ofUBE3A in chicken. Gene 383:93–98.
Constancia M, Hemberger M, Hughes J, et al. (2002) Placental-specific IGF-II is a major modulatorof placental and fetal growth. Nature 417:945–948.
Cooper DW, VandeBerg JL, Sharman GB, Poole WE (1971) Phosphoglycerate kinase polymor-phism in kangaroos provides further evidence for paternal X inactivation. Nat New Biol230:155–157.
Curley JP, Barton S, Surani A, Keverne EB (2004) Coadaptation in mother and infant regulated bya paternally expressed imprinted gene. Proc Biol Sci 271:1303–1309.
da Rocha ST, Edwards CA, Ito M, Ogata T, Ferguson-Smith AC (2008) Genomic imprinting at themammalian Dlk1-Dio3 domain. Trends Genet 24:306–316.
Davidow LS, Breen M, Duke SE, et al. (2007) The search for a marsupial XIC reveals a break withvertebrate synteny. Chromosome Res 15:137–146.
Davis E, Caiment F, Tordoir X, et al. (2005) RNAi-mediated allelic trans-interaction at theimprinted Rtl1/Peg11 locus. Curr Biol 15:743–749.
Day T, Bonduriansky R (2004) Intralocus sexual conflict can drive the evolution of genomicimprinting. Genetics 167:1537–1546.
Deakin JE, Hore TA, Koina E, Graves JAM (2008) The status of dosage compensation in themultiple X chromosomes of the platypus. PLoS Genet 4:e1000140.
DeChiara TM, Robertson EJ, Efstratiadis A (1991) Parental imprinting of the mouse insulin-likegrowth factor II gene. Cell 64:849–859.
Deltour L, Montagutelli X, Guenet JL, Jami J, Paldi A (1995) Tissue- and developmental stage-specific imprinting of the mouse proinsulin gene, Ins2. Dev Biol 168:686–688.
Dindot SV, Farin PW, Farin CE, et al. (2004) Epigenetic and genomic imprinting analy-sis in nuclear transfer derived Bos gaurus/Bos taurus hybrid fetuses. Biol Reprod 71:470–478.
Dunzinger U, Nanda I, Schmid M, Haaf T, Zechner U (2005) Chicken orthologues of mammalianimprinted genes are clustered on macrochromosomes and replicate asynchronously. TrendsGenet 21:488–492.
Duret L, Chureau C, Samain S, Weissenbach J, Avner P (2006) The Xist RNA gene evolved ineutherians by pseudogenization of a protein-coding gene. Science 312:1653–1655.
Edwards CA, Mungall AJ, Matthews L, et al. (2008) The evolution of the DLK1-DIO3 imprinteddomain in mammals. PLoS Biol 6:e135.
Elisaphenko EA, Kolesnikov NN, Shevchenko AI, et al. (2008) A dual origin of the Xist gene froma protein-coding gene and a set of transposable elements. PLoS ONE 3:e2521.
Fehlmann M, Le Cam A, Freychet P (1979) Insulin and glucagon stimulation of amino acid trans-port in isolated rat hepatocytes. Synthesis of a high affinity component of transport. J BiolChem 254:10431–10437.
Filippova GN (2008) Genetics and epigenetics of the multifunctional protein CTCF. Curr Top DevBiol 80:337–360.
Fisher DO, Double MC, Blomberg SP, Jennions MD, Cockburn A (2006) Post-mating sexualselection increases lifetime fitness of polyandrous females in the wild. Nature 444:89–92.
Freeman SJ (1990) Functions of extraembryonic membranes. In: Postimplantation MammalianEmbryos: A Practical Approach. Oxford University Press, New York.
Genevieve D, Sanlaville D, Faivre L, et al. (2005) Paternal deletion of the GNAS imprinted locus(including Gnasxl) in two girls presenting with severe pre- and post-natal growth retardationand intractable feeding difficulties. Eur J Hum Genet 13:1033–1039.
Giddings SJ, King CD, Harman KW, Flood JF, Carnaghi LR (1994) Allele specific inactivation ofinsulin 1 and 2, in the mouse yolk sac, indicates imprinting. Nat Genet 6:310–313.
Goll MG, Bestor TH (2005) Eukaryotic cytosine methyltransferases. Annu Rev Biochem 74:481–514.
Graves JAM (1996) Mammals that break the rules: genetics of marsupials and monotremes. AnnuRev Genet 30:233–260.
12 The Evolution of Genomic Imprinting – A Marsupial Perspective 253
Gray TA, Saitoh S, Nicholls RD (1999a). An imprinted, mammalian bicistronic transcript encodestwo independent proteins. Proc Natl Acad Sci USA 96:5616–5621.
Gray TA, Smithwick MJ, Schaldach MA, et al. (1999b). Concerted regulation and molec-ular evolution of the duplicated SNRPB’/B and SNRPN loci. Nucleic Acids Res 27:4577–4584.
Gray TA, Hernandez L, Carey AH, et al. (2000) The ancient source of a distinct gene familyencoding proteins featuring RING and C(3)H zinc-finger motifs with abundant expression indeveloping brain and nervous system. Genomics 66:76–86.
Gulbis B, Jauniaux E, Cotton F, Stordeur P (1998) Protein and enzyme patterns in the fluid cavitiesof the first trimester gestational sac: relevance to the absorptive role of secondary yolk sac. MolHum Reprod 4:857–862.
Haig D, Westoby M (1989) Parent-specific gene-expression and the triploid endosperm. AmericanNaturalist 134:147–155.
Haig D (2000) The kinship theory of genomic imprinting. Ann Rev Ecol Syst 31:9–32.Haig D, Wharton R (2003) Prader-Willi syndrome and the evolution of human childhood. Am J
Hum Biol 15:320–329.Haig D (2004) Genomic imprinting and kinship: how good is the evidence? Annu Rev Genet
38:553–585.Han L, Lee DH, Szabo PE (2008) CTCF is the master organizer of domain-wide allele-specific
chromatin at the H19/Igf2 imprinted region. Mol Cell Biol 28:1124–1135.Happle R (1985) Lyonization and the lines of Blaschko. Hum Genet 70:200–206.Hark AT, Schoenherr CJ, Katz DJ, et al. (2000) CTCF mediates methylation-sensitive enhancer-
blocking activity at the H19/Igf2 locus. Nature 405:486–489.Hata K, Okano M, Lei H, Li E (2002) Dnmt3L cooperates with the Dnmt3 family of de novo DNA
methyltransferases to establish maternal imprints in mice. Development 129:1983–1993.Heard E, Chaumeil J, Masui O, Okamoto I (2004) Mammalian X-chromosome inactivation: an
epigenetics paradigm. Cold Spring Harb Symp Quant Biol 69:89–102.Hernandez-Sanchez C, Mansilla A, de la Rosa EJ, de Pablo F (2006) Proinsulin in development:
new roles for an ancient prohormone. Diabetologia 49:1142–1150.Holleley CE, Dickman CR, Crowther MS, Oldroyd BP (2006) Size breeds success: multiple pater-
nity, multivariate selection and male semelparity in a small marsupial, Antechinus stuartii. MolEcol 15:3439–3448.
Hore TA, Koina E, Wakefield MJ, Graves JAM (2007a). The region homologous to theX-chromosome inactivation centre has been disrupted in marsupial and monotreme mammals.Chromosome Res 15:147–161.
Hore TA, Rapkins RW, Graves JAM (2007b). Construction and evolution of imprinted loci inmammals. Trends Genet 23:440–448.
Hore TA (2008) The Evolution of Genomic Imprinting and X-Chromosome Inactivation inMammals. PhD thesis, Research School of Biological Sciences, Canberra.
Hore TA, Deakin JE, Graves JAM (2008) The evolution of epigenetic regulators CTCF andBORIS/CTCFL in amniotes. PLoS Genet 4:e1000169.
Jelinic P, Stehle JC, Shaw P (2006) The testis-specific factor CTCFL cooperates with the proteinmethyltransferase PRMT7 in H19 imprinting control region methylation. PLoS Biol 4:e355.
Jia D, Jurkowska RZ, Zhang X, Jeltsch A, Cheng X (2007) Structure of Dnmt3a bound to Dnmt3Lsuggests a model for de novo DNA methylation. Nature 449:248–251.
Jones CJ, Jauniaux E (1995) Ultrastructure of the materno-embryonic interface in the first trimesterof pregnancy. Micron 26:145–173.
Kaneda M, Okano M, Hata K, et al. (2004) Essential role for de novo DNA methyltransferaseDnmt3a in paternal and maternal imprinting. Nature 429:900–903.
Kaneko-Ishino T, Kohda T, Ishino F (2003) The regulation and biological significance of genomicimprinting in mammals. J Biochem 133:699–711.
Kawahara M, Wu Q, Takahashi N, et al. (2007) High-frequency generation of viable mice fromengineered bi-maternal embryos. Nat Biotechnol 25:1045–1050.
254 T.A. Hore et al.
Keverne EB, Curley JP (2008) Epigenetics, brain evolution and behaviour. Front Neuroendocrinol29:398–412.
Kholmanskikh O, Loriot A, Brasseur F, De Plaen E, De Smet C (2008) Expression ofBORIS in melanoma: lack of association with MAGE-A1 activation. Int J Cancer 122:777–784.
Killian JK, Byrd JC, Jirtle JV, et al. (2000) M6P/IGF2R imprinting evolution in mammals. MolCell 5:707–716.
Killian JK, Nolan CM, Wylie AA, et al. (2001a). Divergent evolution in M6P/IGF2R imprintingfrom the Jurassic to the Quaternary. Hum Mol Genet 10:1721–1728.
Killian JK, Nolan CM, Stewart N, et al. (2001b). Monotreme IGF2 expression and ancestral originof genomic imprinting. J Exp Zool 291:205–212.
Klenova EM, Nicolas RH, Paterson HF, et al. (1993) CTCF, a conserved nuclear factor requiredfor optimal transcriptional activity of the chicken c-myc gene, is an 11-Zn-finger proteindifferentially expressed in multiple forms. Mol Cell Biol 13:7612–7624.
Klenova EM, Fagerlie S, Filippova GN, et al. (1998) Characterization of the chicken CTCFgenomic locus, and initial study of the cell cycle-regulated promoter of the gene. J Biol Chem273:26571–26579.
Kono T, Obata Y, Wu Q, et al. (2004) Birth of parthenogenetic mice that can develop to adulthood.Nature 428:860–864.
Kornfeld S (1992) Structure and function of the mannose 6-phosphate/insulinlike growth factor IIreceptors. Annu Rev Biochem 61:307–330.
Lawton BR, Sevigny L, Obergfell C, et al. (2005) Allelic expression of IGF2 in live-bearing,matrotrophic fishes. Dev Genes Evol 215:207–212.
Lawton BR, Carone BR, Obergfell CJ, et al. (2008) Genomic imprinting of IGF2 in marsupials ismethylation dependent. BMC Genomics 9:205.
Li L, Keverne EB, Aparicio SA, et al. (1999) Regulation of maternal behavior and offspring growthby paternally expressed Peg3. Science 284:330–333.
Livesey G, Williams KE (1981) Rates of pinocytic capture of simple proteins by rat yolk sacsincubated in vitro. Biochem J 198:581–586.
Loukinov DI, Pugacheva E, Vatolin S, et al. (2002) BORIS, a novel male germ-line-specific proteinassociated with epigenetic reprogramming events, shares the same 11-zinc-finger domain withCTCF, the insulator protein involved in reading imprinting marks in the soma. Proc Natl AcadSci USA 99:6806–6811.
Luo ZX, Ji Q, Wible JR, Yuan CX (2003) An Early Cretaceous tribosphenic mammal andmetatherian evolution. Science 302:1934–1940.
Lyle R, Watanabe D, Vruchte D, et al. (2000) The imprinted antisense RNA at the Igf2r locusoverlaps but does not imprint Mas1. Nat Genet 25:19–21.
Lyon MF (1961) Gene action in the X-chromosome of the mouse (Mus musculus L). Nature190:372–373.
Mann JR, Lovell-Badge RH (1984) Inviability of parthenogenones is determined by pronuclei, notegg cytoplasm. Nature 310:66–67.
Matsuoka S, Thompson JS, Edwards MC, et al. (1996) Imprinting of the gene encoding a humancyclin-dependent kinase inhibitor, p57KIP2, on chromosome 11p15. Proc Natl Acad Sci USA93:3026–3030.
McGrath J, Solter D (1984) Completion of mouse embryogenesis requires both the maternal andpaternal genomes. Cell 37:179–183.
McGrath KE, Palis J (2005) Hematopoiesis in the yolk sac:more than meets the eye. Exp Hematol33:1021–1028.
Migeon BR, Wolf SF, Axelman J, Kaslow DC, Schmidt M (1985) Incomplete X chromosomedosage compensation in chorionic villi of human placenta. Proc Natl Acad Sci USA 82:3390–3394.
Monk M, Hitchins M, Hawes S (2008) Differential expression of the embryo/cancer geneECSA(DPPA2), the cancer/testis gene BORIS and the pluripotency structural gene OCT4, inhuman preimplantation development. Mol Hum Reprod 14:347–355.
12 The Evolution of Genomic Imprinting – A Marsupial Perspective 255
Moon H, Filippova G, Loukinov D, et al. (2005) CTCF is conserved from Drosophila to humansand confers enhancer blocking of the Fab-8 insulator. EMBO Rep 6:165–170.
Moore GE, Abu-Amero SN, Bell G, et al. (2001) Evidence that insulin is imprinted in the humanyolk sac. Diabetes 50:199–203.
Moore T, Haig D (1991) Genomic imprinting in mammalian development: a parental tug-of-war.Trends Genet 7:45–49.
Morison IM, Ramsay JP, Spencer HG (2005) A census of mammalian imprinting. Trends Genet21:457–465.
Nahkuri S, Taft RJ, Korbie DJ, Mattick JS (2008) Molecular Evolution of the HBII-52 snoRNACluster. J Mol Biol 381:810–815.
Nicholls RD, Knepper JL (2001) Genome organization, function, and imprinting in Prader-Williand Angelman syndromes. Annu Rev Genomics Hum Genet 2:153–175.
Nolan CM, Killian JK, Petitte JN, Jirtle RL (2001) Imprint status of M6P/IGF2R and IGF2 inchickens. Dev Genes Evol 211:179–183.
O’Neill MJ, Ingram RS, Vrana PB, Tilghman SM (2000) Allelic expression of IGF2 in marsupialsand birds. Dev Genes Evol 210:18–20.
O’Neill MJ, Lawton BR, Mateos M, et al. (2007) Ancient and continuing Darwinian selection oninsulin-like growth factor II in placental fishes. Proc Natl Acad Sci USA 104:12404–12409.
O’Sullivan FM, Murphy SK, Simel LR, et al. (2007) Imprinted expression of the canine IGF2R, inthe absence of an anti-sense transcript or promoter methylation. Evol Dev 9:579–589.
Ogawa O, Eccles MR, Szeto J, et al. (1993) Relaxation of insulin-like growth factor II geneimprinting implicated in Wilms’ tumour. Nature 362:749–751.
Ono R, Kobayashi S, Wagatsuma H, et al. (2001) A retrotransposon-derived gene, PEG10, is anovel imprinted gene located on human chromosome 7q21. Genomics 73:232–237.
Ooi SK, Qiu C, Bernstein E, et al. (2007) DNMT3L connects unmethylated lysine 4 of histone H3to de novo methylation of DNA. Nature 448:714–717.
Otto SP, Goldstein DB (1992) Recombination and the evolution of diploidy. Genetics 131:745–751.
Oudejans CB, Westerman B, Wouters D, et al. (2001) Allelic IGF2R repression does not correlatewith expression of antisense RNA in human extraembryonic tissues. Genomics 73:331–337.
Pask AJ, Papenfuss AT, Ager EI, et al. (2009) Analysis of the platypus genome suggests atransposon origin for mammalian imprinting. Genome Biol 10:R1.
Payer B, Lee JT (2008) X chromosome dosage compensation: how mammals keep the balance.Annu Rev Genet 42:733–772.
Plagge A, Gordon E, Dean W, et al. (2004) The imprinted signaling protein XL alpha s is requiredfor postnatal adaptation to feeding. Nat Genet 36:818–826.
Pugacheva EM, Kwon YW, Hukriede NA, et al. (2006) Cloning and characterization of zebrafishCTCF: developmental expression patterns, regulation of the promoter region, and evolutionaryaspects of gene organization. Gene 375:26–36.
Pugliese A, Zeller M, Fernandez A Jr., et al. (1997) The insulin gene is transcribed in the humanthymus and transcription levels correlated with allelic variation at the INS VNTR-IDDM2susceptibility locus for type 1 diabetes. Nat Genet 15:293–297.
Rainier S, Johnson LA, Dobry CJ, et al. (1993) Relaxation of imprinted genes in human cancer.Nature 362:747–749.
Rapkins RW, Hore T, Smithwick M, et al. (2006) Recent assembly of an imprinted domain fromnon-imprinted components. PLoS Genet 2:e182.
Reik W, Dean W, Walter J (2001) Epigenetic reprogramming in mammalian development. Science293:1089–1093.
Reik W, Constancia M, Fowden A, et al. (2003) Regulation of supply and demand for maternalnutrients in mammals by imprinted genes. J Physiol 547:35–44.
Renfree MB (1972) Influence of the embryo on the marsupial uterus. Nature 240:475–477.Renfree MB (1982) Implantation and placentation. Reprod Mamm 2:26–69.Renfree MB, Ager EI, Shaw G, Pask AJ (2008) Genomic imprinting in marsupial placentation.
Reproduction 136:523–531.
256 T.A. Hore et al.
Renfree MB, Hore TA, Shaw G, Marshall Graves JAM, Pask AJ (2009) Evolution of genomicimprinting: insights from marsupials and monotremes. Annu Rev Genomics Hum Genet.10:241–262.
Richardson BJ, Czuppon AB, Sharman GB (1971) Inheritance of glucose-6-phosphate dehydroge-nase variation in kangaroos. Nat New Biol 230:154–155.
Runte M, Huttenhofer A, Gross S, et al. (2001) The IC-SNURF-SNRPN transcript serves as ahost for multiple small nucleolar RNA species and as an antisense RNA for UBE3A. Hum MolGenet 10:2687–2700.
Runte M, Kroisel PM, Gillessen-Kaesbach G, et al. (2004) SNURF-SNRPN and UBE3A transcriptlevels in patients with Angelman syndrome. Hum Genet 114:553–561.
Russo VEA, Martienssen RA, Riggs AD (1996) Epigenetic Mechanisms of Gene Regulation. ColdSpring Harbor Laboratory Press, Plainview.
Scott RJ, Spielman M (2006) Genomic imprinting in plants and mammals: how life historyconstrains convergence. Cytogenet Genome Res 113:53–67.
Seitz H, Royo H, Bortolin ML, et al. (2004) A large imprinted microRNA gene cluster at the mouseDlk1-Gtl2 domain. Genome Res 14:1741–1748.
Shevchenko AI, Zakharova IS, Elisaphenko EA, et al. (2007) Genes flanking Xist in mouse andhuman are separated on the X chromosome in American marsupials. Chromosome Res 15:127–136.
Sleutels F, Zwart R, Barlow DP (2002) The non-coding Air RNA is required for silencingautosomal imprinted genes. Nature 415:810–813.
Smits G, Mungall AJ, Griffiths-Jones S, et al. (2008) Conservation of the H19 noncoding RNA andH19-IGF2 imprinting mechanism in therians. Nat Genet 40:971–976.
Surani MA, Barton SC, Norris ML (1984) Development of reconstituted mouse eggs suggestsimprinting of the genome during gametogenesis. Nature 308:548–550.
Suzuki S, Renfree MB, Pask AJ, et al. (2005) Genomic imprinting of IGF2, p57(KIP2) andPEG1/MEST in a marsupial, the tammar wallaby. Mech Dev 122:213–222.
Suzuki S, Ono R, Narita T, et al. (2007) Retrotransposon silencing by DNA methylation can drivemammalian genomic imprinting. PLoS Genet 3:e55.
Takagi N, Sasaki M (1975) Preferential inactivation of the paternally derived X chromosome in theextraembryonic membranes of the mouse. Nature 256:640–642.
Tremblay KD, Duran KL, Bartolomei MS (1997) A 5′ 2-kilobase-pair region of the imprintedmouse H19 gene exhibits exclusive paternal methylation throughout development. Mol CellBiol 17:4322–4329.
Ubeda F (2008) Evolution of genomic imprinting with biparental care: implications for Prader-Willi and Angelman syndromes. PLoS Biol 6:e208.
Vafiadis P, Bennett ST, Todd JA, et al. (1997) Insulin expression in human thymus is modulated byINS VNTR alleles at the IDDM2 locus. Nat Genet 15:289–292.
Varmuza S, Mann M (1994) Genomic imprinting–defusing the ovarian time bomb. Trends Genet10:118–123.
Wake N, Takagi N, Sasaki M (1976) Non-random inactivation of X chromosome in the rat yolksac. Nature 262:580–581.
Warren WC, Hillier LW, Graves JAM, et al. (2008) Genome analysis of the platypus reveals uniquesignatures of evolution. Nature 453:175–183.
Webster KE, O’Bryan MK, Fletcher S, et al. (2005) Meiotic and epigenetic defects in Dnmt3L-knockout mouse spermatogenesis. Proc Natl Acad Sci USA 102:4068–4073.
Weidman JR, Dolinoy DC, Maloney KA, Cheng JF, Jirtle RL (2006a). Imprinting of OpossumIgf2r in the absence of differential methylation and air. Epigenetics 1:49–54.
Weidman JR, Maloney KA, Jirtle RL (2006b). Comparative phylogenetic analysis reveals multiplenon-imprinted isoforms of opossum Dlk1. Mamm Genome 17:157–167.
West JD, Frels WI, Chapman VM, Papaioannou VE (1977) Preferential expression of thematernally derived X chromosome in the mouse yolk sac. Cell 12:873–882.
Wilkins JF, Haig D (2003) What good is genomic imprinting: the function of parent-specific geneexpression. Nat Rev Genet 4:359–368.

12 The Evolution of Genomic Imprinting – A Marsupial Perspective 257
Yokomine T, Kuroiwa A, Tanaka K, et al. (2001) Sequence polymorphisms, allelic expressionstatus and chromosome locations of the chicken IGF2 and MPR1 genes. Cytogenet Cell Genet93:109–113.
Yokomine T, Hata K, Tsudzuki M, Sasaki H (2006) Evolution of the vertebrate DNMT3 genefamily: a possible link between existence of DNMT3L and genomic imprinting. CytogenetGenome Res 113:75–80.
Yotova IY, Vlatkovic IM, Pauler FM, et al. (2008) Identification of the human homolog of theimprinted mouse Air non-coding RNA. Genomics 92:464–473.

Chapter 13Marsupial Genetics Reveals Insights intoEvolution of Mammalian X ChromosomeInactivation
Shafagh Al Nadaf, Paul D. Waters, Janine E. Deakin,and Jennifer A. Marshall Graves
Abstract X chromosome inactivation (X-inactivation; XCI) in mammals equalizesX gene dosage between XX females and XY males. It is the prime example ofepigenetic repression on a grand scale. This regulatory process differentially treatshomologous chromosomes within the same nucleus to ensure that only a singleX chromosome remains active in a diploid female cell. The best-studied modelsof X-inactivation, humans and mice, represent only one of four clades of placental(eutherian) mammals. Comparisons of dosage compensation mechanisms in dis-tantly related eutherian mammals, marsupial and monotreme mammals, and evenbirds, will offer entirely new insights to the mechanisms and evolution of dosagecompensation. In order to reconstruct what dosage compensation mechanisms mighthave been functioning in the mammalian ancestor, we highlight the molecular sim-ilarities and differences between X-inactivation in marsupials and eutherians, andcompare them with the partial dosage compensation system observed in monotrememammals, which appears more similar to bird dosage compensation. We draw par-allels between these mechanisms, which may well have evolved independentlyby drawing from a common epigenetic “toolbox”, and therefore utilize similarmolecular mechanisms to down-regulate gene expression.
Keywords Dosage compensation · Epigenetics · Evolution · Marsupials ·X inactivation
S. Al Nadaf (B)Evolution, Ecology and Genetics, Research School of Biology, The Australian National University,Canberra, ACT 2601, Australiae-mail: [email protected]
259J.E. Deakin et al. (eds.), Marsupial Genetics and Genomics,DOI 10.1007/978-90-481-9023-2_13, C© Springer Science+Business Media B.V. 2010
260 S. Al Nadaf et al.
13.1 Introduction
One of the most intriguing discoveries in mammalian genetics during the last50 years is an epigenetic gene regulation event referred to as X chromosomeinactivation (X-inactivation; XCI).
The evolution of X-inactivation is inextricably linked to the emergence of het-erogamety and the evolution of sex chromosomes. In mammals, sex is normallydetermined by an XX/female XY/male sex chromosome system in which the Ybears the dominant male determining gene (SRY) that sets off a cascade of eventsleading to testis development. Suppression of recombination with the X to pre-serve the male specificity of nearby male beneficial loci resulted in Y chromosomedegradation. Thus, in many species sex chromosomes are morphologically distinct.Outside of mammals, vertebrates have a variety of genetic and environmental sexdetermining systems. Birds have female heterogamety, with a ZZ male: ZW femalesystem. The ZW sex pair is completely non-homologous to the mammal XY pair(Fridolfsson et al., 1998; Nanda et al., 1999; Graves, 2001), but there are strong par-allels in that the small and gene poor heterochromatic Y/W is a degraded relic of thegene-rich highly conserved X/Z chromosome (Charlesworth, 1996; Graves, 2006).
Since the sex determining chromosome is often small and gene-poor, males andfemales have different gene dosage from the X (in XY systems) or Z (in ZWsystems). A dosage compensation mechanism equalizes this imbalance of geneexpression between the sexes. In female therian (marsupial and eutherian) mam-mals, one X chromosome becomes transcriptionally inactive at an early stage ofembryogenesis, a stable and somatically heritable state. This mechanism, whichresults in differential activity of the two homologous chromosomes in the samenucleus, is an important model system for epigenetic silencing.
13.2 Evolution of Mammalians Sex Chromosomes
Therian mammals have an XX female XY male sex determining system in whichthe X is large and bears many genes, and the Y chromosome is small, gene-poorand bears the male determining gene SRY. Comparative gene mapping betweenthe three extant lineages of mammals shows that the most basal lineage, subclassPrototheria (monotremes), possess a complex of serially translocated sex chromo-somes (Grützner et al., 2004; Rens et al., 2004) that share no homology to the sexchromosomes of therian mammals. Monotreme sex chromosomes do not bear theSRY gene, but share extensive sequence homology with the bird ZW sex chromo-some system (Veyrunes et al., 2008). This dates the emergence of the therian XYpair, and the SRY gene, to after the divergence of monotremes from therian mam-mals 166MYA (million years ago) (Ezaz et al., 2006; Veyrunes et al., 2008), butbefore the marsupial/eutherian split.
Mapping between the two infraclass of the therian mammals, Eutheria (placentalmammals) and Metatheria (marsupials), has revealed extensive homology of their
13 Marsupial Genetics Reveals Insights into Evolution of Mammalian 261
sex chromosomes (reviewed in Graves, 1995). Genes on the long arm (Xq) andproximal short arm (Xp) of human X chromosome map to the X in marsupials,implying that this X conserved region (XCR) has been part of the X chromosomesince before the marsupial/eutherian divergence. However, a large region of theeutherian X chromosome (represented by much of human Xp) is orthologous tomarsupial autosomes (Graves et al., 1998; Sinclair et al., 1988; Spencer et al., 1991).This region was added to the eutherian X (therefore named the X added region;XAR) after the divergence of eutherians from marsupials (Graves, 1995), but priorto eutherian radiation (Rodriguez Delgado et al., 2009).
Although therian X and Y chromosomes arose from an ordinary autosomal pair,they have undergone a lengthy evolutionary process that has resulted in strikinglydifferent morphology and gene content. Initially, one member of the autosomal pair(the proto-Y) acquired a testis-determining locus (SRY). Genes that were advanta-geous to males then accumulated nearby this new sex-determining locus, either bytransposition from autosomal sites or by mutations in existing genes. Subsequentselection to keep this male-advantageous gene cassette together resulted in the sup-pression of recombination with the X. In the absence of recombination, the malespecific region of the Y (MSY) was vulnerable to drift and inefficient selection, lead-ing to accumulation of slightly deleterious mutations (reviewed in Graves, 2006).Ultimately, the Y chromosome degraded over time to become small and gene poor(Charlesworth and Charlesworth, 2000).
The human X chromosome is large (165 Mb) (Ross et al., 2005) and bears1,529 genes (NCBI database, http://www.ncbi.nlm.nih.gov). Gene content and orderare highly conserved between even distantly related eutherian lineages (Murphyet al., 2007; Quilter et al., 2002; Raudsepp et al., 2004); with the exception ofthe rodent X, which has undergone several rearrangements (Amar et al., 1988;Waterston et al., 2002). In contrast, the human Y chromosome is 65 Mb in size,about half of which is heterochromatic, and codes for only 27 distinct proteins(Skaletsky et al., 2003). The Y varies in size and gene content between mammalianspecies, consistent with independent degradation and gene loss in different lineages(Graves, 2006; Waters et al., 2007).
This progressive loss of gene activity from the newly minted mammalian proto-Yresulted in dosage imbalance of X-linked genes between XX and XY individuals,for which a dosage compensation mechanism evolved to equalize.
13.3 Evolution of Dosage Compensation
The evolution of heteromorphic sex chromosomes in a wide range of taxa presentsa similar problem, regardless of the sex chromosome system in question. Allanimals with differentiated sex chromosomes will exhibit different levels of Xor Z gene dosage between the sexes. It is expected that such differences mustbe compensated for by a series of genetic and epigenetic regulatory mecha-nism that equalizes gene dosage. Dosage compensation is a common feature
262 S. Al Nadaf et al.
of heteromorphic sex chromosomes in many diverse taxa, such as the fruitflyDrosophila melanogaster, the roundworm Caenorhabditis elegans, and most mam-mals. In mammals, X-inactivation effectively balances gene expression from theX chromosome between the sexes by means of a complex epigenetic pathway thatleads to the transcriptional silencing of one X chromosome in the somatic cells offemales.
13.4 X Chromosome Inactivation
Fifty years ago the observation of mosaic coat colour in female mice, heterozygousfor the X-linked coat colour gene, lead to the hypothesis that one of two X chro-mosomes in females is inactivated early in embryogenesis (Lyon, 1961). It wasproposed that inactivation was stable, and that both the active X (Xa) and inac-tive X (Xi) maintained their states through successive cell generations. Thus, thissomatically heritable epigenetic change (Lyon, 1961) produces a mosaic of cellswith either one or the other X chromosome transcriptionally silenced.
Several manifestations of XCI were observed at the cytogenetic level. Theseinclude the observation of a heterochromatic sex chromatin body (a Barr body; Barrand Carr, 1962) in female, but not male, interphase cells. In females with more thentwo X chromosomes extra Barr bodies were observed (Chu et al., 1960). It wasalso discovered that the two X chromosomes replicate asynchronously in femalecells during mitosis (Taylor, 1960). Delayed replication timing is perhaps the mostuniversal characteristic of the Xi chromosome, and is still one of the most reliablemarkers of inactivation. The Xi as a whole, and individual genes on the inactivechromosome, replicate late in S phase (Hansen et al., 1996; Priest et al., 1967;Schmidt and Migeon, 1990; Taylor, 1960; Torchia et al., 1994).
Not surprisingly, most information about X-inactivation comes from studies onhumans and mice. Although these mammals belong to the same eutherian clade,their mechanism of X-inactivation is different, so it is hard to generalize to all mam-mals. Sporadic information available from other eutherians, such as cattle, horseand elephant, suggests that similar modes of X-inactivation operate in all euthe-rians. However, comparisons between eutherians and their most distantly relatedcousins that display X-inactivation, the marsupials, reveal marked differences thathelp to answer many fundamental questions about sex chromosome organization,function and evolution, and allows us to deduce how the X-inactivation system firstevolved. Significantly, parallels of therian X-inactivation can be drawn with dosagecompensation systems of other vertebrates.
13.4.1 Eutherian X-Inactivation
A master regulator locus, called the X-inactivation centre (XIC), controls the euthe-rian X-inactivation process (Avner and Heard, 2001). The XIC contains severaltranscribed non-coding RNA genes, whose sequences are poorly conserved between
13 Marsupial Genetics Reveals Insights into Evolution of Mammalian 263
species. As such, multiple sequence comparisons of the XIC in human, mouse,vole and cow have revealed little sequence conservation of non-coding elements(Chureau et al., 2002; Hendrich et al., 1993; Nesterova et al., 2001). Only 3.4% ofthe intergenic region within the XIC shows sequence conservation between mouseand human, yet the intron-exon structure and the exonic repeats of a non-codinggene, XIST (X-Inactive Specific Transcript) are maintained between human, mouseand cow (Chureau et al., 2002; Hendrich et al., 1993; Nesterova et al., 2001). It hasbeen demonstrated that even the most distantly related eutherian lineage (Afrotheria;represented by the elephant) has an XIST orthologue, although the integrity of theelephant XIC is not known (Duret et al., 2006).
13.4.1.1 X-Inactivation in Eutherian Development
The original hypothesis put forward by Lyon suggested that X-inactivation was ran-dom, giving rise to a mosaic of cells expressing either the paternally or maternallyderived X chromosome (Lyon, 1961). However, during the earliest stages of femaleembryogenesis, both X chromosomes remain active. X-inactivation is first observedin the trophectodermal tissue of the early blastocyst, which gives rise to early dif-ferentiating extra-embryonic tissues. In these cells the choice of which parentallyderived X chromosome becomes inactive is parent specific (imprinted), whereby thepaternally derived X chromosome is always inactivated in some eutherian species.The earliest sign of an Xi chromosome in the cells that give rise to the embryo properis during the pre-implantation blastocyst, where either the maternally or paternallyderived X is chosen randomly for inactivation.
13.4.1.2 Imprinted X-Inactivation
Paternal X-inactivation has been demonstrated to occur in the extraembryonic tissueof both mouse and cow (Harper et al., 1982; Dindot et al., 2004; Takagi and Sasaki,1975; Wake et al., 1976; West et al., 1977). However, most studies report no pref-erential expression from the paternal X in human extraembryonic material (Migeonet al., 1985; Mohandas et al., 1989), but there have been some suggestions of animprint in an early extraembryonic lineage (Goto et al., 1997; Harrison, 1989).
Imprinted X-inactivation of mice and cattle requires expression of Xist from thepaternal X early in the preimplantation embryo, possibly as early as the 2-cell stage(Dindot et al., 2004; Kay et al., 1993). Interestingly, it has recently been shown thatinitiation of imprinted X-inactivation in mice is not Xist dependent but that the inac-tivation signal will not stabilize in the absence of Xist (Kalantry et al., 2009). By the8-cell stage an Xist coated repressive domain has formed, from which gene expres-sion is excluded (Okamoto et al., 2005). The nature of the paternal specific imprintis currently unknown. There are two alternative possibilities; either the maternal Xis marked to remain active (Lyon and Rastan, 1984), or the paternal X is predisposedto inactivation (McLaren and Monk, 1981). The latter is supported by demonstra-tions that the paternal X is inactivated in cleavage stage embryos (Okamoto et al.,2004). This led to the suggestion that the paternal X is inherited by the zygote
264 S. Al Nadaf et al.
in a pre-inactivated state, which is acquired at male meiosis during meiotic sexchromosome inactivation (MSCI) (reviewed in Turner, 2007). However, the obser-vation of post meiotic transcription of several X-linked genes indicates reversal ofMSCI before fertilization (Mahahevaiah et al., 2009; Okamoto et al., 2004).
This imprinted X-inactivation appears to be erased or become ineffective, atthe time of implantation, in the inner cell mass that gives rise to embryonic tissue(Okamoto et al., 2004). This is followed by the random choice to inactivate eitherthe paternal or maternal X chromosome (Reik and Lewis, 2005).
13.4.1.3 Random X-Inactivation
In contrast to extra embryonic tissue, X-inactivation is random in cells of the embryoproper and always occurs in a mutually exclusive manner. Random X-inactivationis also controlled by the XIC. Xist deletion studies demonstrated that it is essentialfor initiation of silencing, and that it plays a role in the choice of which X is inacti-vated (Marahrens et al., 1998, 1997; Penny et al., 1996; Wutz and Jaenisch, 2000).Furthermore, a point mutation in the human XIST promoter (in two unrelated fami-lies) is associated with the primary skewing of X-inactivation choice (Plenge et al.,1997), suggesting that in humans XIST itself participates in choice. Consequently,genomic regions that regulate Xist expression also influence the fate of chromosomeX-inactivation status. For instance, deletion of the Tsix (the antisense of Xist) tran-scription start site was shown to abolish choice, in that the mutated chromosome wasalways inactivated (Lee and Lu, 1999). Moreover, deletion of an element at the 5′end of the Tsix gene (Vigneau et al., 2006) named DXPas34, resulted in non-randomX-inactivation due to disruption of choice (Migeon, 2003).
In mouse, a locus called X controlling element (XCE), which affects choice, wasalso mapped to the XIC (Johnston and Cattanach, 1981), but it remains possible thatmore control sequences lie in this region. One such element is a cluster of bindingsites at the DXPas34 locus and the Tsix promoter region for CTCF, a transcriptionfactor that possibly regulates Tsix and /or Xist (Chao et al., 2002; Clerc and Avner,2003). It is still debated whether the human orthologue of Tsix shares the samefunctions (Migeon, 2003).
13.4.1.4 Transcriptional Silencing of the Inactive X Chromosome
A fundamental assumption of X-inactivation was that genes on the Xi were silencedby transcriptional repression. This was eventually demonstrated by finding that theinactive wild-type HPRT allele was not expressed in cells cloned from a womanheterozygous for HPRT deficiency (Graves and Gartler, 1986). This has since beenrepeatedly confirmed by the finding that genes on an inactive human X in a rodent-human cell hybrid are not transcribed (Carrel et al., 1999), and is consistent with thefinding that DNA polymerase II is excluded from the Xi domain (Chaumeil et al.,2006).
The earliest step of initiation of X-inactivation is thought to be a counting event,by which the ratio of X chromosomes to autosomes is measured, ensuring that
13 Marsupial Genetics Reveals Insights into Evolution of Mammalian 265
the single X chromosome in XY males is not inactivated, and that in female cellsall X chromosomes in excess of one are silenced. At the onset of X-inactivation,Xist RNA expression is increased and coats the future Xi. However, Xist inducedsilencing is reversible (Chadwick and Willard, 2003); and in order to establishan inactive state, Xist RNA is required to spread along the entire length of theX chromosome. Spreading only initiates from the XIC and is strictly limited incis (Avner and Heard, 2001). The attenuation of inactivation spreading, when Xistwas moved to and expressed from some (but not all) autosomes, indicates thatalthough not essential for spreading, X chromatin is somehow more favourable tothe X-inactivation machinery (Lyon, 1998b). It has been proposed that long inter-spersed repeat elements (LINEs) could act as booster elements for Xist RNA tobind to, thereby spreading along the chromosome (Hansen, 2003; Lyon, 1998a).Evidence for the role of LINEs in spreading of the inactivation signal includethe observation that these elements are concentrated on the human and mouse X(Korenberg and Rykowski, 1988; Boyle et al., 1990; Bailey et al., 2000), and arecorrelate with susceptibility to and escape from inactivation (Carrel et al., 2006;Wang et al., 2006).
Once spreading of Xist RNA along the Xi has been achieved, several epi-genetic modifications occur to maintain a heterochromatic and transcriptionallysilent state throughout the cell cycle. The first changes in histone variants andmodifications to Xi include the loss of histones associated with transcriptionalactivity, such as H3K4me and H3K9ac (reviewed in Heard, 2005). Next, the Xigains specific repressive marks, H3K9me2, H3K27me3, H4K20me1, H2AK119ub(reviewed in Heard, 2005). Finally, concentration of variant histones such as macro-H2A1, and hypoacetylation on histone H4 appears (reviewed in Heard, 2005).Experiments using 5-azacytidine to reactivate repressed genes provided the first evi-dence for the role that methylation plays in X-inactivation (Graves, 1982; Mohandaset al., 1981). It was later demonstrated that it was preferential methylation ofCpG islands upstream of inactive genes on the inactive X, when compared toactive X (Lock et al., 1986). DNA methylation seems to occur at a late stageof the XCI process, at least in teratocarcinoma and embryonic stem cells, sois thought to be involved in stabilizing the inactive eutherian X (Lock et al.,1987).
13.4.1.5 Escape from Inactivation
It was originally proposed that all genes were coordinately silenced on the Xi.Inactivation of X-specific genes appears to be nearly ubiquitous for mouse, withjust a few exceptions. However, research on different mammalian species has shownthat inactivation is not complete. Approximately 15% of genes on the human Xescape inactivation in fibroblasts (Carrel and Willard, 2005) and somewhat fewerin lymphoblastoid cell lines (Johnston et al., 2008). These “escapee” genes lackthe chromatin modifications characteristic of the Xi, and can be either clusteredtogether, or interspersed with genes known to be subject to inactivation. The mecha-nism that mediates escape from X-inactivation remains unclear, but non-inactivated
266 S. Al Nadaf et al.
domains appear to be protected from the inactivation signal by CTCF-containinginsulator elements (Disteche, 1995).
The distribution of XCI for escapee genes, with genes located largely on the shortarm of the human X, is a reflection of the evolutionary history of the X chromosome.This region was recently added to the eutherian X, so genes within it did not requiredosage compensate prior to marsupial/eutherian divergence. The addition of thisregion to the X and Y, followed by degradation of Y homologues, resulted in dosagedifferences of X-linked genes between the sexes and selection for recruitment intothe X-inactivation system (Graves et al., 1998; Graves and Schmidt, 1992). Thus,an understanding of X chromosome evolution presents an important opportunity inunderstanding the origin and mechanism of X-inactivation.
Little is known about the nature and molecular mechanisms of X-inactivationin eutherian mammals outside of humans and mice. This is unfortunate becausemice and human X-inactivation differs in several important respects, includingthe extent to which the X is silenced, and the mechanism by which Xist func-tions. Furthermore, rodents and primates belong to the same eutherian superordinalclade, and as a result our understanding of X-inactivation lacks evolutionary depth.Therefore, it is not clear whether the mouse model of X-inactivation is applicable toother eutherian species, so the study of marsupial dosage compensation is importantin understanding the evolution of X-inactivation mechanisms.
13.4.2 Marsupial X-Inactivation
Like eutherian mammals, dosage compensation in marsupials is achieved via tran-scriptional silencing of one X in female somatic cells. Early work on marsupiallymphocytes showed that the two X chromosomes replicate asynchronously infemale somatic cells, with the Xa replicating earlier in S phase than the Xi (Graves,1967). Barr bodies are more difficult to detect in marsupials than in eutherian mam-mals, and have only been observed in some species and tissues. Barr bodies wereabsent in adult brush-tail possum (Trichosurus vulpecula) (McKay et al., 1987),although they were observed in bilaminar and trilaminar blastocysts of a marsupialmouse (Antechinus stuartii) (Johnston and Robinson, 1987). Barr bodies have alsobeen observed in Monodelphis embryo cells, and at a low frequency in nuclei ofT. vulpecula corneal epitheium cells (Robinson et al., 1994; McKay et al., 1987).
13.4.2.1 X-Inactivation in Marsupial Development
Studies of the expression of isozyme variants in female kangaroo heterozygous forX-linked markers confirmed that genes on one X chromosome were inactivated(reviewed in Cooper et al., 1993). For instance, it was demonstrated that the classicX-borne genes PGK and G6PD were inactivated on the marsupial X chromosome(Richardson et al., 1971). However, these studies also revealed striking differencesbetween eutherian and marsupial X-inactivation.
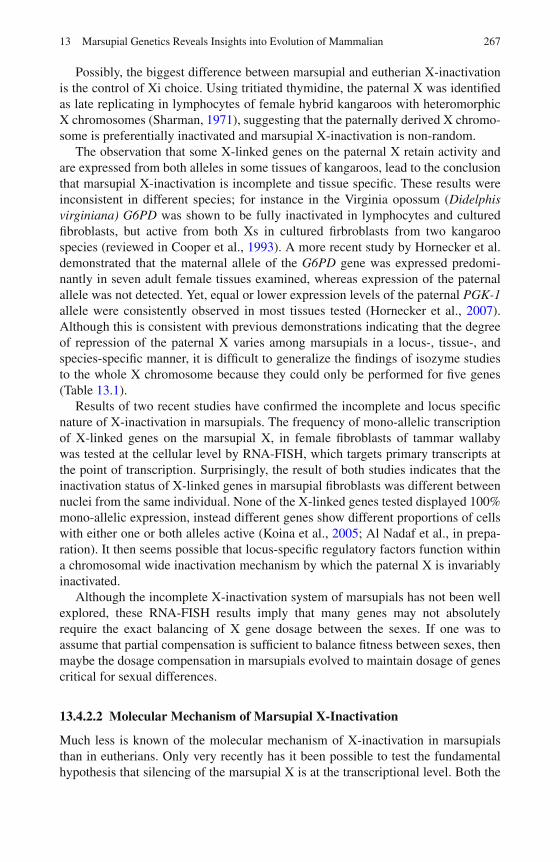
13 Marsupial Genetics Reveals Insights into Evolution of Mammalian 267
Possibly, the biggest difference between marsupial and eutherian X-inactivationis the control of Xi choice. Using tritiated thymidine, the paternal X was identifiedas late replicating in lymphocytes of female hybrid kangaroos with heteromorphicX chromosomes (Sharman, 1971), suggesting that the paternally derived X chromo-some is preferentially inactivated and marsupial X-inactivation is non-random.
The observation that some X-linked genes on the paternal X retain activity andare expressed from both alleles in some tissues of kangaroos, lead to the conclusionthat marsupial X-inactivation is incomplete and tissue specific. These results wereinconsistent in different species; for instance in the Virginia opossum (Didelphisvirginiana) G6PD was shown to be fully inactivated in lymphocytes and culturedfibroblasts, but active from both Xs in cultured firbroblasts from two kangaroospecies (reviewed in Cooper et al., 1993). A more recent study by Hornecker et al.demonstrated that the maternal allele of the G6PD gene was expressed predomi-nantly in seven adult female tissues examined, whereas expression of the paternalallele was not detected. Yet, equal or lower expression levels of the paternal PGK-1allele were consistently observed in most tissues tested (Hornecker et al., 2007).Although this is consistent with previous demonstrations indicating that the degreeof repression of the paternal X varies among marsupials in a locus-, tissue-, andspecies-specific manner, it is difficult to generalize the findings of isozyme studiesto the whole X chromosome because they could only be performed for five genes(Table 13.1).
Results of two recent studies have confirmed the incomplete and locus specificnature of X-inactivation in marsupials. The frequency of mono-allelic transcriptionof X-linked genes on the marsupial X, in female fibroblasts of tammar wallabywas tested at the cellular level by RNA-FISH, which targets primary transcripts atthe point of transcription. Surprisingly, the result of both studies indicates that theinactivation status of X-linked genes in marsupial fibroblasts was different betweennuclei from the same individual. None of the X-linked genes tested displayed 100%mono-allelic expression, instead different genes show different proportions of cellswith either one or both alleles active (Koina et al., 2005; Al Nadaf et al., in prepa-ration). It then seems possible that locus-specific regulatory factors function withina chromosomal wide inactivation mechanism by which the paternal X is invariablyinactivated.
Although the incomplete X-inactivation system of marsupials has not been wellexplored, these RNA-FISH results imply that many genes may not absolutelyrequire the exact balancing of X gene dosage between the sexes. If one was toassume that partial compensation is sufficient to balance fitness between sexes, thenmaybe the dosage compensation in marsupials evolved to maintain dosage of genescritical for sexual differences.
13.4.2.2 Molecular Mechanism of Marsupial X-Inactivation
Much less is known of the molecular mechanism of X-inactivation in marsupialsthan in eutherians. Only very recently has it been possible to test the fundamentalhypothesis that silencing of the marsupial X is at the transcriptional level. Both the
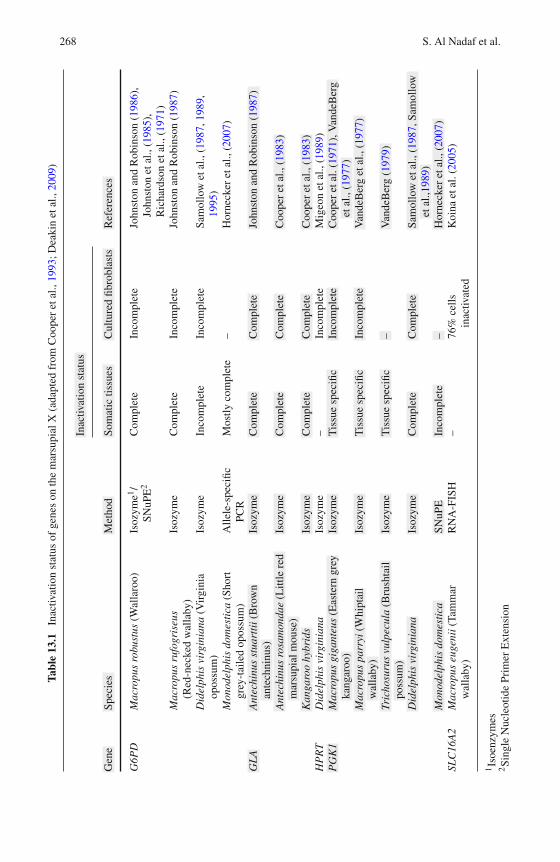
268 S. Al Nadaf et al.Ta
ble
13.1
Inac
tivat
ion
stat
usof
gene
son
the
mar
supi
alX
(ada
pted
from
Coo
per
etal
.,19
93;D
eaki
net
al.,
2009
)
Inac
tivat
ion
stat
us
Gen
eSp
ecie
sM
etho
dSo
mat
ictis
sues
Cul
ture
dfib
robl
asts
Ref
eren
ces
G6P
DM
acro
pus
robu
stus
(Wal
laro
o)Is
ozym
e1/
SNuP
E2
Com
plet
eIn
com
plet
eJo
hnst
onan
dR
obin
son
(198
6),
John
ston
etal
.,(1
985)
,R
icha
rdso
net
al.,
(197
1)M
acro
pus
rufo
gris
eus
(Red
-nec
ked
wal
laby
)Is
ozym
eC
ompl
ete
Inco
mpl
ete
John
ston
and
Rob
inso
n(1
987)
Did
elph
isvi
rgin
iana
(Vir
gini
aop
ossu
m)
Isoz
yme
Inco
mpl
ete
Inco
mpl
ete
Sam
ollo
wet
al.,
(198
7,19
89,
1995
)M
onod
elph
isdo
mes
tica
(Sho
rtgr
ey-t
aile
dop
ossu
m)
Alle
le-s
peci
ficPC
RM
ostly
com
plet
e–
Hor
neck
eret
al.,
(200
7)
GL
AA
ntec
hinu
sst
uart
tii(
Bro
wn
ante
chni
nus)
Isoz
yme
Com
plet
eC
ompl
ete
John
ston
and
Rob
inso
n(1
987)
Ant
echi
nus
rosa
mon
dae
(Litt
lere
dm
arsu
pial
mou
se)
Isoz
yme
Com
plet
eC
ompl
ete
Coo
per
etal
.,(1
983)
Kan
garo
ohy
brid
sIs
ozym
eC
ompl
ete
Com
plet
eC
oope
ret
al.,
(198
3)H
PR
TD
idel
phis
virg
inia
naIs
ozym
e–
Inco
mpl
ete
Mig
eon
etal
.,(1
989)
PG
K1
Mac
ropu
sgi
gant
eus
(Eas
tern
grey
kang
aroo
)Is
ozym
eT
issu
esp
ecifi
cIn
com
plet
eC
oope
ret
al.(
1971
),V
ande
Ber
get
al.,
(197
7)M
acro
pus
parr
yi(W
hipt
ail
wal
laby
)Is
ozym
eT
issu
esp
ecifi
cIn
com
plet
eV
ande
Ber
get
al.,
(197
7)
Tric
hosu
rus
vulp
ecul
a(B
rush
tail
poss
um)
Isoz
yme
Tis
sue
spec
ific
–V
ande
Ber
g(1
979)
Did
elph
isvi
rgin
iana
Isoz
yme
Com
plet
eC
ompl
ete
Sam
ollo
wet
al.,
(198
7,Sa
mol
low
etal
.,198
9)M
onod
elph
isdo
mes
tica
SNuP
EIn
com
plet
e–
Hor
neck
eret
al.,
(200
7)SL
C16
A2
Mac
ropu
seu
geni
i(Ta
mm
arw
alla
by)
RN
A-F
ISH
–76
%ce
llsin
activ
ated
Koi
naet
al.(
2005
)
1Is
oenz
ymes
2Si
ngle
Nuc
leot
ide
Prim
erE
xten
sion
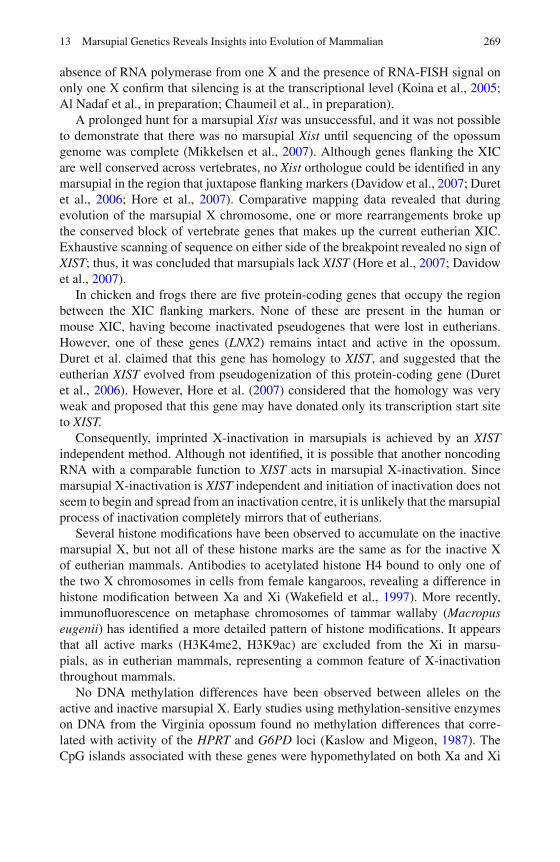
13 Marsupial Genetics Reveals Insights into Evolution of Mammalian 269
absence of RNA polymerase from one X and the presence of RNA-FISH signal ononly one X confirm that silencing is at the transcriptional level (Koina et al., 2005;Al Nadaf et al., in preparation; Chaumeil et al., in preparation).
A prolonged hunt for a marsupial Xist was unsuccessful, and it was not possibleto demonstrate that there was no marsupial Xist until sequencing of the opossumgenome was complete (Mikkelsen et al., 2007). Although genes flanking the XICare well conserved across vertebrates, no Xist orthologue could be identified in anymarsupial in the region that juxtapose flanking markers (Davidow et al., 2007; Duretet al., 2006; Hore et al., 2007). Comparative mapping data revealed that duringevolution of the marsupial X chromosome, one or more rearrangements broke upthe conserved block of vertebrate genes that makes up the current eutherian XIC.Exhaustive scanning of sequence on either side of the breakpoint revealed no sign ofXIST; thus, it was concluded that marsupials lack XIST (Hore et al., 2007; Davidowet al., 2007).
In chicken and frogs there are five protein-coding genes that occupy the regionbetween the XIC flanking markers. None of these are present in the human ormouse XIC, having become inactivated pseudogenes that were lost in eutherians.However, one of these genes (LNX2) remains intact and active in the opossum.Duret et al. claimed that this gene has homology to XIST, and suggested that theeutherian XIST evolved from pseudogenization of this protein-coding gene (Duretet al., 2006). However, Hore et al. (2007) considered that the homology was veryweak and proposed that this gene may have donated only its transcription start siteto XIST.
Consequently, imprinted X-inactivation in marsupials is achieved by an XISTindependent method. Although not identified, it is possible that another noncodingRNA with a comparable function to XIST acts in marsupial X-inactivation. Sincemarsupial X-inactivation is XIST independent and initiation of inactivation does notseem to begin and spread from an inactivation centre, it is unlikely that the marsupialprocess of inactivation completely mirrors that of eutherians.
Several histone modifications have been observed to accumulate on the inactivemarsupial X, but not all of these histone marks are the same as for the inactive Xof eutherian mammals. Antibodies to acetylated histone H4 bound to only one ofthe two X chromosomes in cells from female kangaroos, revealing a difference inhistone modification between Xa and Xi (Wakefield et al., 1997). More recently,immunofluorescence on metaphase chromosomes of tammar wallaby (Macropuseugenii) has identified a more detailed pattern of histone modifications. It appearsthat all active marks (H3K4me2, H3K9ac) are excluded from the Xi in marsu-pials, as in eutherian mammals, representing a common feature of X-inactivationthroughout mammals.
No DNA methylation differences have been observed between alleles on theactive and inactive marsupial X. Early studies using methylation-sensitive enzymeson DNA from the Virginia opossum found no methylation differences that corre-lated with activity of the HPRT and G6PD loci (Kaslow and Migeon, 1987). TheCpG islands associated with these genes were hypomethylated on both Xa and Xi
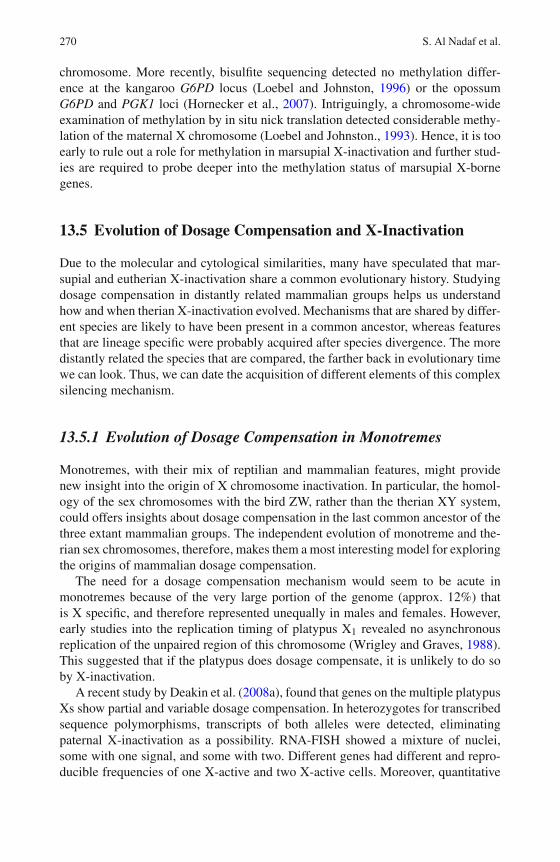
270 S. Al Nadaf et al.
chromosome. More recently, bisulfite sequencing detected no methylation differ-ence at the kangaroo G6PD locus (Loebel and Johnston, 1996) or the opossumG6PD and PGK1 loci (Hornecker et al., 2007). Intriguingly, a chromosome-wideexamination of methylation by in situ nick translation detected considerable methy-lation of the maternal X chromosome (Loebel and Johnston., 1993). Hence, it is tooearly to rule out a role for methylation in marsupial X-inactivation and further stud-ies are required to probe deeper into the methylation status of marsupial X-bornegenes.
13.5 Evolution of Dosage Compensation and X-Inactivation
Due to the molecular and cytological similarities, many have speculated that mar-supial and eutherian X-inactivation share a common evolutionary history. Studyingdosage compensation in distantly related mammalian groups helps us understandhow and when therian X-inactivation evolved. Mechanisms that are shared by differ-ent species are likely to have been present in a common ancestor, whereas featuresthat are lineage specific were probably acquired after species divergence. The moredistantly related the species that are compared, the farther back in evolutionary timewe can look. Thus, we can date the acquisition of different elements of this complexsilencing mechanism.
13.5.1 Evolution of Dosage Compensation in Monotremes
Monotremes, with their mix of reptilian and mammalian features, might providenew insight into the origin of X chromosome inactivation. In particular, the homol-ogy of the sex chromosomes with the bird ZW, rather than the therian XY system,could offers insights about dosage compensation in the last common ancestor of thethree extant mammalian groups. The independent evolution of monotreme and the-rian sex chromosomes, therefore, makes them a most interesting model for exploringthe origins of mammalian dosage compensation.
The need for a dosage compensation mechanism would seem to be acute inmonotremes because of the very large portion of the genome (approx. 12%) thatis X specific, and therefore represented unequally in males and females. However,early studies into the replication timing of platypus X1 revealed no asynchronousreplication of the unpaired region of this chromosome (Wrigley and Graves, 1988).This suggested that if the platypus does dosage compensate, it is unlikely to do soby X-inactivation.
A recent study by Deakin et al. (2008a), found that genes on the multiple platypusXs show partial and variable dosage compensation. In heterozygotes for transcribedsequence polymorphisms, transcripts of both alleles were detected, eliminatingpaternal X-inactivation as a possibility. RNA-FISH showed a mixture of nuclei,some with one signal, and some with two. Different genes had different and repro-ducible frequencies of one X-active and two X-active cells. Moreover, quantitative
13 Marsupial Genetics Reveals Insights into Evolution of Mammalian 271
PCR showed that the male:female ratio differed for different genes, ranging between1:1 (full compensation) and 1:2 (no dosage compensation). This surprising resultsuggested that the partial compensation results, not from partial expression in eachcell, but from a stochastic regulation of expression, such that different genes havedifferent probabilities of expression from one or both alleles.
This partial and variable dosage compensation is similar to that observed forgenes on the bird Z chromosome, which also display incomplete and locus-specificdosage compensation (Itoh et al., 2007). Measurement of male:female expressionratios for all Z-borne genes on microarrays produced a distribution of ratios varyingbetween complete compensation (1:1) and no compensation (1:2). Dosage compen-sation in birds does not appear to be achieved by Z inactivation in ZZ males, asbiallelic expression has been shown for six Z-borne genes by either RNA-FISH orSNP analysis (Kuroda et al., 2001; Kuroiwa et al., 2002). However, four of thesegenes showing biallelic expression do not appear to be subject to dosage compensa-tion based on quantitative PCR (Kuroiwa et al., 2002) or microarray data (Itoh et al.,2007), with further work required to determine if Z inactivation exists in birds.
Thus, the platypus and bird sex chromosomes not only share homology, theyseem to share at least some features of dosage compensation, which is distinct tothe X-inactivation system of therian mammals. This effectively dates the origin ofthe therian X-inactivation system to after 165MYA, when the therian mammal XYchromosome pair began its differentiation.
13.5.2 Evolution of X-Inactivation in Therian Mammals
While the precise routes by which X-inactivation has evolved are not known,plausible models have been put forward. One evolutionary scenario considers thepossibility of independent genesis of X-inactivation systems in eutherian and mar-supials after the two groups diverged. In this scenario the sex chromosomes of thetherian ancestor are not sufficiently degraded to require a chromosome wide dosagecompensation system (Duret et al., 2006). After separation, the marsupial and euthe-rian sex chromosomes degraded independently, thus requiring independent genesisof dosage compensation systems. This hypothesis is supported by the differencesobserved between marsupials and eutherians X-inactivation, including the absenceof a marsupial XIST and some differences in molecular machinery, including lackof DNA methylation and accumulation of inactive histone marks in marsupials(Table 13.2).
Additional support for this hypothesis came recently from a bioinformatic anal-ysis examining the effects of MSCI upon gene movements. This study reportedsignificantly elevated rates of gene retroposition off the X chromosome to auto-somes, in both marsupials and eutherians, relative to the expected retroposition rate(Potrzebowski et al., 2008). However, not one of the 46 X to autosome retropo-sition events identified by Potrzebowski et al. (2008) occurred in the ancestor ofall therian mammals, instead occurring independently in marsupials and eutherians.
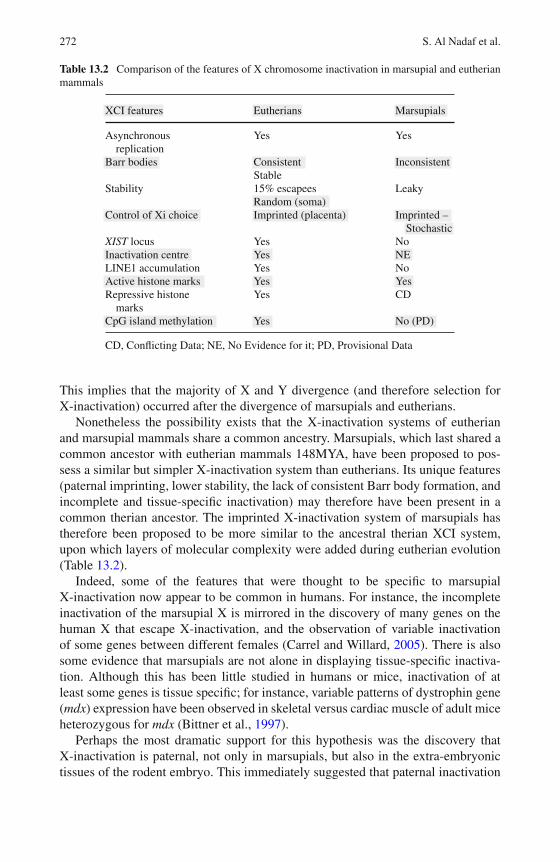
272 S. Al Nadaf et al.
Table 13.2 Comparison of the features of X chromosome inactivation in marsupial and eutherianmammals
XCI features Eutherians Marsupials
Asynchronousreplication
Yes Yes
Barr bodies Consistent InconsistentStable
Stability 15% escapees LeakyRandom (soma)
Control of Xi choice Imprinted (placenta) Imprinted –Stochastic
XIST locus Yes NoInactivation centre Yes NELINE1 accumulation Yes NoActive histone marks Yes YesRepressive histone
marksYes CD
CpG island methylation Yes No (PD)
CD, Conflicting Data; NE, No Evidence for it; PD, Provisional Data
This implies that the majority of X and Y divergence (and therefore selection forX-inactivation) occurred after the divergence of marsupials and eutherians.
Nonetheless the possibility exists that the X-inactivation systems of eutherianand marsupial mammals share a common ancestry. Marsupials, which last shared acommon ancestor with eutherian mammals 148MYA, have been proposed to pos-sess a similar but simpler X-inactivation system than eutherians. Its unique features(paternal imprinting, lower stability, the lack of consistent Barr body formation, andincomplete and tissue-specific inactivation) may therefore have been present in acommon therian ancestor. The imprinted X-inactivation system of marsupials hastherefore been proposed to be more similar to the ancestral therian XCI system,upon which layers of molecular complexity were added during eutherian evolution(Table 13.2).
Indeed, some of the features that were thought to be specific to marsupialX-inactivation now appear to be common in humans. For instance, the incompleteinactivation of the marsupial X is mirrored in the discovery of many genes on thehuman X that escape X-inactivation, and the observation of variable inactivationof some genes between different females (Carrel and Willard, 2005). There is alsosome evidence that marsupials are not alone in displaying tissue-specific inactiva-tion. Although this has been little studied in humans or mice, inactivation of atleast some genes is tissue specific; for instance, variable patterns of dystrophin gene(mdx) expression have been observed in skeletal versus cardiac muscle of adult miceheterozygous for mdx (Bittner et al., 1997).
Perhaps the most dramatic support for this hypothesis was the discovery thatX-inactivation is paternal, not only in marsupials, but also in the extra-embryonictissues of the rodent embryo. This immediately suggested that paternal inactivation
13 Marsupial Genetics Reveals Insights into Evolution of Mammalian 273
was ancestral in both groups of mammals, and randomness evolved later ineutherians and was selected for because it conferred the benefits of heterozygousityin females (Cooper et al., 1993). Furthermore, there is at least one study that showsparent of origin influencing X-inactivation not only in extra embryonic tissue, butalso in the mouse embryo proper, where differences in the ratio of inactivationbetween the paternal and maternal Xs have been observed in cardiac and skeletalmuscle cells (Bittner et al., 1997). The inability to demonstrate paternal inactivationin human extraembryonic tissues was thought to contradict this hypothesis (Zengand Yankowitz, 2003) and point to independent evolution of paternal inactivationin marsupials and rodents (perhaps to mitigate the maternal-fetal incompatibility).However, the recent discovery of paternal inactivation in the bovine embryo estab-lished that it was a more widespread eutherian state, and makes it more likely thatpaternal inactivation was an ancestral therian character. In addition, X-inactivationin extraembryonic tissues of mouse, as in marsupials, is less stable, incomplete anddoes not involve DNA methylation.
Thus the hypothesis that the X-inactivation systems of marsupials and eutheri-ans have been achieved by recruitment, in a common ancestor, of a pre-existingchromatin regulatory system to modulate expression of an entire chromosome isa very attractive model. This model suggests imprinted X-inactivation in mar-supials represents a carryover of MSCI through fertilization to the embryo thatresults in inheritance of an already silent X chromosome from the father. Thisview has recently gained support by the demonstration of transcriptional inactiva-tion of the paternal X during gametogenesis (Hornecker et al., 2007). Results of tworecent studies confirmed that MSCI occurs in Monodelphis domestica, where thesex chromosomes accumulate marks of meiotic silencing and exclude markers ofactive transcription (Namekawa et al., 2007; Hornecker et al., 2007). In addition,Hornecker et al. (2007) observed no indication of postmeiotic reactivation of theX chromosome in M. domestica. In the absence of any evidence for reactivation insperm, or in the early embryo, it is possible that the paternal X is inactivated at meio-sis and simply remains inactive in the embryo. The partial inactivation of some lociin some tissues would therefore represent a tissue- and locus-specific reactivationof the paternal X. Due to the similarities observed between MSCI in marsupi-als and eutherian mammals, MSCI could be the ancestral force behind imprintedX-inactivation.
This makes it critical to resolve whether or not the paternal X enters the egg inan inactive state in marsupials and mice, and emphasizes the need for observationsof X-inactivation in early marsupial embryos. Without knowing the state of the X inthe marsupial embryo, it is not possible to distinguish between the hypotheses thatthe initial inactivating event was incomplete, or alternatively that the entire X wasinactive and particular genes were reactivated in different tissues.
Evolution and refinement of X-inactivation mechanisms might also explain someof the differences in the structure and organization of the X chromosome in eutheri-ans and marsupials. The conserved order of genes on the X chromosome in mosteutherian species (except mice) contrasts with the several major rearrangementsbetween the opossum and the wallaby X (Deakin et al., 2008b), and suggests that
274 S. Al Nadaf et al.
there is selection against structural rearrangement of the eutherian (but not the mar-supial) X, perhaps because of the need for Xist transcripts to spread along the X fromthe XIC. Lower LINE1 density on the opossum X, in comparison to the eutherian X(Mikkelsen et al., 2007), suggests that LINEs have accumulated only to the extentexpected because of the lower recombination rate of the X, and are not involved inthe propagation of inactivation along the marsupial X. Yet, recent research suggeststhat LINEs might have a less critical role in the eutherian X-inactivation process.X-inactivation in a group of South American rodents shows X-inactivation stilloccurs in spite of extinction of LINE activity (Cantrell et al., 2009).
Perhaps most significant of all the differences between marsupial and eutherianX-inactivation is the absence of XIST in marsupials. The significance of XIST inX-inactivation must be re-examined, since its absence in marsupials contradicts itsseemingly fundamental role in eutherian X chromosome inactivation, both randomand imprinted (Marahrens et al., 1997). The evolution of XIST might explain whyfeatures of eutherian X-inactivation initiation, spreading and maintenance are notshared with marsupials, and could explain why marsupials have a less stable and“leaky” inactivation mechanism compared to the hyper-stable system in human andmouse. However, mice may well be an exception, and X-inactivation may prove tobe leaky for many therian mammals, as is apparent for many genes that escape inac-tivation on the human X. This supports the idea that partial inactivation represents amore basic form of mammalian X-inactivation, which became subject to tighter con-trol during eutherian and particularly rodent evolution. Koina et al. (2009) suggestedthat XIST binding to the Xi is responsible for DNA methylation differences, theaccumulation of active histone marks, and the molecular differences that are lack-ing from the inactive marsupial X. Perhaps the features of X-inactivation observedin eutherians but not marsupials – randomness and hyper-stability – are conferredby XIST.
13.6 Conclusion
The gradual loss of genes from the proto-Y chromosome during sex chromosomedifferentiation is believed to have driven inactivation of homologous X-linked genes.The sex chromosome dosage compensation in the therian ancestor might then havebeen more like the variable and partial dosage compensation observed in birds andmonotremes. The elements of silencing, known to be shared between marsupialand eutherian X-inactivation were established in this therian ancestor, possibly byutilising a pre-existing chromatin regulatory system, such as MSCI. This resultedin a co-ordinated transcription from only one of the sex chromosomes, however,inactivation of the homologous X-linked genes was achieved in a piecemeal fashion.In marsupials no additional epigenetic events evolved to change the inactive stateduring embryogenesis, whereas in eutherians the benefits of heterozygousity andstability perhaps resulted in evolution of random X-inactivation and further layersof epigenetic silencing.
13 Marsupial Genetics Reveals Insights into Evolution of Mammalian 275
References
Amar LC, Dandolo L, Hanauer A, et al. (1988) Conservation and reorganization of loci on themammalian X chromosome: a molecular framework for the identification of homologoussubchromosomal regions in man and mouse. Genomics 2:220–230.
Avner P, Heard E (2001) X-chromosome inactivation: counting, choice and initiation. Nat RevGenet 2:59–67.
Bailey JA, Carrel L, Chakravarti A, Eichler EE (2000) Molecular evidence for a relationshipbetween LINE-1 elements and X chromosome inactivation: the Lyon repeat hypothesis. ProcNatl Acad Sci U S A 97:6634–6639.
Barr ML, Carr DH (1962) Correlations between sex chromatin and sex chromosomes. Acta Cytol6:34–45.
Bittner RE, Popoff I, Shorny S, Hoger H, Wachtler F (1997) Dystrophin expression in heterozygousmdx/+ mice indicates imprinting of X chromosome inactivation by parent-of-origin-, tissue-,strain- and position-dependent factors. Anat Embryol 195:175–182.
Boyle AL, Ballard SG Ward DC (1990) Differential distribution of long and short interspersedelement sequences in the mouse genome: chromosome karyotyping by fluorescence in situhybridization. Proc Natl Acad Sci U S A 87:7757–7761.
Cantrell MA, Cartens BC, Wihcman HA (2009) X chromosome inactivation and Xist evolution ina rodent lacking LINE-1 activity. PLoS One 4:e6252.
Carrel L, Cottle AA, Goglin KC, Willard HF (1999) A first-generation X-inactivation profile of thehuman X chromosome. Proc Natl Acad Sci U S A 96:14440–14444.
Carrel L, Park C, Tyekucheva S, Dunn J, Chiaromonte F, Mokova KD (2006) Genomic envi-ronment predicts expression patterns on the human inactive X chromosome. PLoS Genet2:e151.
Carrel L, Willard HF (2005) X-inactivation profile reveals extensive variability in X-linked geneexpression in females. Nature 434:400–404.
Chadwick BP, Willard HF (2003) Barring gene expression after XIST: maintaining facultativeheterochromatin on the inactive X. Semin Cell Dev Biol 14:359–367.
Chao W, Huynh KD, Spencer RJ, Davidow LS, Lee JT (2002) CTCF, a candidate trans-actingfactor for X-inactivation choice. Science 295:345–347.
Charlesworth B (1996) The evolution of chromosomal sex determination and dosage compensa-tion. Curr Biol 6:149–162.
Charlesworth B, Charlesworth D (2000) The degeneration of Y chromosomes. Philos Trans R SocLond B Biol Sci 355:1563–1572.
Chaumeil J, Le Baccon P, Wutz A, Heard E (2006) A novel role for Xist RNA in the formationof a repressive nuclear compartment into which genes are recruited when silenced. Genes Dev20:2223–2237.
Chu E, Grumbach EH, Morishima A (1960) Karyotypic analysis of a male pseudohermaphroditewith the syndrome of feminizing testes. J Clin Endocrinol Metab 20:1608–1613.
Chureau C, Prissette M, Bourdet A, et al. (2002) Comparative sequence analysis of theX-inactivation center region in mouse, human, and bovine. Genome Res 12:894–908.
Clerc P, Avner P (2003) Multiple elements within the Xic regulate random X inactivation in mice.Semin Cell Dev Biol 14:85–92.
Cooper DW, Johnston PG, Watson JM, Graves JAM (1993) X-inactivation in marsupials andmonotremes. Semin Dev Biol 4:117–128.
Cooper DW, VandeBerg JL, Sharman GB, Poole WE (1971) Phosphoglycerate kinase polymor-phism in kangaroos provides further evidence for paternal X inactivation. Nat New Biol230:155–157.
Cooper DW, Woolley PA, Maynes GM, Herman FS, Poole WE (1983) Studies onmetatherian sex chromosomes. XII. Sex-linked inheritance and probable paternalX-inactivation of alpha-galactosidase A in Australian marsupials. Aust J Biol Sci36:511–517.
276 S. Al Nadaf et al.
Davidow LS, Breen M, Duke SE, Samollow PB, McCarrey JR, Lee JT (2007) The search for amarsupial XIC reveals a break with vertebrate synteny. Chromosome Res 15:137–146.
Deakin JE, Hore TA, Koina E, Graves JAM (2008a) The status of dosage compensation in themultiple X chromosomes of the platypus. PLoS Genet 4:e1000140.
Deakin JE, Koina E, Waters PD, et al. (2008b) Physical map of two tammar wallaby chromosomes:a strategy for mapping in non-model mammals. Chromosome Res 16:1159–1175.
Deakin JE, Chaumeil J, Hore TA, Graves JAM (2009) Unravelling the evolutionary originsof X chromosome inactivation in mammals: insights from marsupials and monotremes.Chromosome Res 17:671–685
Dindot SV, Farin PW, Farin CE, et al. (2004) Epigenetic and genomic imprinting analysis in nucleartransfer derived Bos gaurus/Bos taurus hybrid fetuses. Biol Reprod 71:470–478.
Disteche CM (1995) Escape from X inactivation in human and mouse. Trends Genet 11:17–22.Duret L, Chureau C, Samain S, Weissenbach J, Avner P (2006) The Xist RNA gene evolved in
eutherians by pseudogenization of a protein-coding gene. Science 312:1653–1655.Ezaz T Stiglec R, Veyrunes F, Graves JAM (2006) Relationships between vertebrate ZW and XY
sex chromosome systems. Curr Biol 16:R736–R743.Fridolfsson AK, Cheng H, Copeland NG, et al. (1998) Evolution of the avian sex chromosomes
from an ancestral pair of autosomes. Proc Natl Acad Sci U S A 95:8147–8152.Goto T, Wright E, Monk M (1997) Paternal X-chromosome inactivation in human trophoblastic
cells. Mol Hum Reprod 3:77–80.Graves JAM (1967) DNA synthesis in chromosomes of cultured leucocytes from two marsupial
species. Exp Cell Res 46:37–57.Graves JAM (1982) 5-azacytidine-induced re-expression of alleles on the inactive X chromosome
in a hybrid mouse cell line. Exp Cell Res 141:99–105.Graves JAM (1995) The evolution of mammalian sex chromosomes and the origin of sex
determining genes. Philos Trans R Soc Lond B Biol Sci 350:305–311.Graves JAM (2001) From brain determination to testis determination: evolution of the mammalian
sex-determining gene. Reprod Fertil Dev 13:665–672.Graves JAM (2006) Sex chromosome specialization and degeneration in mammals. Cell
124:901–914.Graves JAM, Gartler SM (1986) Mammalian X chromosome inactivation: testing the hypothesis
of transcriptional control. Somat Cell Mol Genet 12:275–280.Graves JAM, Schmidt MM (1992) Mammalian sex chromosomes: design or accident? Curr Opin
Genet Dev 2:890–901.Graves JAM, Wakefield MJ, Toder R (1998) The origin and evolution of the pseudoautosomal
regions of human sex chromosomes. Hum Mol Genet 7:1991–1996.Grützner F, Rens W, Tsend-Ayush E, El-Morgharbel N, et al. (2004) In the platypus a meiotic
chain of ten sex chromosomes shares genes with the bird Z and mammal X chromosomes.Nature 432:913–917.
Hansen RS (2003) X inactivation-specific methylation of LINE-1 elements by DNMT3B: implica-tions for the Lyon repeat hypothesis. Hum Mol Genet 12:2559–2567.
Hansen RS, Canfield TK, Fjeld AD, Garlter SM (1996) Role of late replication timing in thesilencing of X-linked genes. Hum Mol Genet 5:1345–1353.
Harper MI Fosten M, Monk M (1982) Preferential paternal X inactivation in extraembryonictissues of early mouse embryos. J Embryol Exp Morphol 67:127–135.
Harrison KB (1989) X-chromosome inactivation in the human cytotrophoblast. Cytogenet CellGenet 52:37–41.
Heard E (2005) Delving into the diversity of facultative heterochromatin: the epigenetics of theinactive X chromosome. Curr Opin Genet Dev 15:482–489.
Hendrich BD, Brown CJ, Willard HF (1993) Evolutionary conservation of possible functionaldomains of the human and murine XIST genes. Hum Mol Genet 2:663–672.
Hore TA, Koina E, Wakefield MJ, Graves JA (2007) The region homologous to the X-chromosomeinactivation centre has been disrupted in marsupial and monotreme mammals. ChromosomeRes 15:147–161.
13 Marsupial Genetics Reveals Insights into Evolution of Mammalian 277
Hornecker JL, Samollow PB, Robinson ES, VandeBerg JL, McCarrey JR (2007) Meiotic sexchromosome inactivation in the marsupial Monodelphis domestica. Genesis 45:696–708.
Itoh Y, Melamed E, Yang X (2007) Dosage compensation is less effective in birds than in mammals.J Biol 6:2.
Johnston PG, Cattanach BM (1981) Controlling elements in the mouse. IV. Evidence of non-random X-inactivation. Genet Res 37:151–160.
Johnston CM, Lovell FL, Leongamornlert DA, Stranger BE, Dermitzakis ET, Ross MT (2008)Large-scale population study of human cell lines indicates that dosage compensation is virtuallycomplete. PLoS Genet 4:e9.
Johnston PG, Robinson ES (1986) Lack of correlation between Gpd expression and X chromosomelate replication in cultured fibroblasts of the kangaroo Macropus robustus. Aust J Biol Sci39:37–45.
Johnston PG, Robinson ES (1987) X chromosome inactivation in female embryos of a marsupialmouse (Antechinus stuartii). Chromosoma 95:419–423.
Johnston PG, Robinson ES Johnston DM (1985) Dictyate oocytes of a kangaroo (Macropusrobustus) show paternal inactivation at the X-linked Gpd locus. Aust J Biol Sci 38:79–84.
Kalantry S, Purushothaman S, Bowen RB, Starmer J, Magnuson T (2009) Evidence of Xist RNA-independent initiation of mouse imprinted X-chromosome inactivation. Nature 460:647–651.
Kaslow DC, Migeon BR (1987) DNA methylation stabilizes X chromosome inactivation in euthe-rians but not in marsupials: evidence for multistep maintenance of mammalian X dosagecompensation. Proc Natl Acad Sci U S A 84:6210–6214.
Kay GF Penny GD, Patel D, Ashworth A, Brockdorff N, Rastan S (1993) Expression of Xistduring mouse development suggests a role in the initiation of X chromosome inactivation. Cell72:171–182.
Koina E, Chaumeil J, Greaves I, Tremethick D, Graves JAM (2009) Specific patterns ofhistone marks accompany X chromosome inactivation in a marsupial. Chromosome Res17:115–126.
Koina E, Wakefield MJ, Walcher C, et al. (2005) Isolation, X location and activity of the marsu-pial homologue of SLC16A2, an XIST-flanking gene in eutherian mammals. Chromosome Res13:687–698.
Korenberg JR, Rykowski MC (1988) Human genome organization: Alu, lines, and the molecularstructure of metaphase chromosome bands. Cell 53:391–400.
Kuroda Y, Arai N, Arita M, Teranishi M, Hori T, Harata M, Mizuno S (2001). Absence ofZ-chromosome inactivation for five genes in male chickens. Chromosome Res 9:457–468.
Kuroiwa A, Yokomine T, Sasaki H, et al. (2002) Biallelic expression of Z-linked genes in malechickens. Cytogenet Genome Res 99:310–314.
Lee JT, Lu N (1999) Targeted mutagenesis of Tsix leads to nonrandom X inactivation. Cell99:47–57.
Lock LF, Melton DW, Caskey CT, Martin GR (1986) Methylation of the mouse hprt gene differson the active and inactive X chromosomes. Mol Cell Biol 6:914–924.
Lock LF, Takagi N, Martin GR (1987) Methylation of the Hprt gene on the inactive X occurs afterchromosome inactivation. Cell 48:39–46.
Loebel DA, Johnston PG (1993) Analysis of DNase 1 sensitivity and methylation of activeand inactive X chromosomes of kangaroos (Macropus robustus) by in situ nick translation.Chromosoma 102:81–87.
Loebel DA, Johnston PG (1996) Methylation analysis of a marsupial X-linked CpG island bybisulfite genomic sequencing. Genome Res 6:114–123.
Lyon MF (1961) Gene action in the X-chromosome of the mouse (Mus musculus L.). Nature190:372–373.
Lyon MF (1998a) X-chromosome inactivation spreads itself: effects in autosomes. Am J HumGenet 63:17–19.
Lyon MF (1998b) X-chromosome inactivation: a repeat hypothesis. Cytogenet Cell Genet80:133–137.
278 S. Al Nadaf et al.
Lyon MF Rastan S (1984) Parental source of chromosome imprinting and its relevance for Xchromosome inactivation. Differentiation 26:63–67.
Mahahevaiah SK, Royo H, VandeBerg JL, McCarrey JR, MacKay S, Turner JM (2009) Key fea-tures of the X inactivation process are conserved between Marsupials and Eutherians. Curr Biol19:1478–1484.
Marahens Y, Loring J, Jaenisch R (1998) Role of the Xist gene in X chromosome choosing. Cell92:657–664.
Marahens Y, Panning B, Dausman J, Strauss W, Jaenisch R (1997) Xist-deficient mice are defectivein dosage compensation but not spermatogenesis. Genes Dev 11:156–166.
McKay LM, Wrigley JM, Graves JAM (1987) Evolution of mammalian X-chromosome inactiva-tion: sex chromatin in monotremes and marsupials. Aust J Biol Sci 40:397–404.
McLaren A, Monk M (1981) X-chromosome activity in the germ cells of sex-reversed mouseembryos. J Reprod Fertil 63:533–537.
Migeon BR (2003) Is Tsix repression of Xist specific to mouse? Nat Genet 33:337.Migeon BR, Jan de Beur S, Axelman J (1989) Frequent derepression of G6PD and HPRT on
the marsupial inactive X chromosome associated with cell proliferation in vitro. Exp Cell Res182:597–609.
Migeon BR, Wolf SF, Axelman J, Kaslow DC, Schmidt M (1985) Incomplete X chromosomedosage compensation in chorionic villi of human placenta. Proc Natl Acad Sci U S A82:3390–3394.
Mikkelsen TS, Wakefield MJ, Aken B, et al. (2007) Genome of the marsupial Monodelphisdomestica reveals innovation in non-coding sequences. Nature 447:167–177.
Mohandas TK, Passage MB, Williams JW, Sparkes RS, Yen PH, Shapiro LJ (1989) X-chromosomeinactivation in cultured cells from human chorionic villi. Somat Cell Mol Genet 15:131–136.
Mohandas T, Sparkes RS, Shapiro LJ (1981) Reactivation of an inactive human X chromosome:evidence for X inactivation by DNA methylation. Science 211:393–396.
Murphy WJ, Davis B, David VA, et al. (2007) A 1.5-Mb-resolution radiation hybrid map ofthe cat genome and comparative analysis with the canine and human genomes. Genomics93:299–304.
Namekawa SH, VandeBerg JL, McCarrey JR, Lee JT (2007) Sex chromosome silencing in themarsupial male germ line. Proc Natl Acad Sci U S A 104:9730–9735.
Nanda I, Shan Z, Schartl M, et al. (1999) 300 million years of conserved synteny between chickenZ and human chromosome 9. Nat Genet 21:258–259.
Nesterova TB, Slobodyanyuk SY, Elisaphenko EA, et al. (2001) Characterization of the genomicXist locus in rodents reveals conservation of overall gene structure and tandem repeats but rapidevolution of unique sequence. Genome Res 11:833–849.
Okamoto I, Arnaud D, Le Baccon P, et al. (2005) Evidence for de novo imprinted X-chromosomeinactivation independent of meiotic inactivation in mice. Nature 438:369–373.
Okamoto I, Otte AP, Allis CD, Reinberg D, Heard E (2004) Epigenetic dynamics of imprinted Xinactivation during early mouse development. Science 303:644–649.
Penny GD, Kay GF, Sheardown SA, Rastan S, Brockdorff N (1996) Requirement for Xist in Xchromosome inactivation. Nature 379:131–137.
Plenge RM, Hendrich BD, Schwartz C, et al. (1997) A promoter mutation in the XIST gene in twounrelated families with skewed X-chromosome inactivation. Nat Genet 17:353–356.
Potrzebowski L, Vinckenbosch N, Marques AC, et al. (2008) Chromosomal gene movementsreflect the recent origin and biology of therian sex chromosomes. PLoS Biol 6:e80
Priest JH, Heady JE, Priest RE (1967) Delayed onset of replication of human X chromosomes.J Cell Biol 35:483–487.
Quilter CR, Blott SC, Mileham AJ, Affara NA, Sargent CA, Griffin DK (2002) A mapping andevolutionary study of porcine sex chromosome genes. Mamm Genome 13:588–594.
Raudsepp T. Lee EJ, Kata SR, et al. (2004) Exceptional conservation of horse-human gene orderon X chromosome revealed by high-resolution radiation hybrid mapping. Proc Natl Acad SciU S A 101:2386–2391.
13 Marsupial Genetics Reveals Insights into Evolution of Mammalian 279
Reik W, Lewis A (2005) Co-evolution of X-chromosome inactivation and imprinting in mammals.Nat Rev Genet 6:403–410.
Rens W, Grutzner F, O’Brien PC, Fairclogh H, Graves JAM, Ferguson-Smith MA(2004) Resolution and evolution of the duck-billed platypus karyotype with anX1Y1X2Y2X3Y3X4Y4X5Y5 male sex chromosome constitution. Proc Natl Acad Sci U SA 101:16257–16261.
Richardson BJ, Czuppon AB, Sharman GB (1971) Inheritance of glucose-6-phosphate dehydroge-nase variation in kangaroos. Nat New Biol 230:154–155.
Robinson ES, Samollow PB, VandeBerg JL, Johnston PG (1994) X-chromosome replicationpatterns in adult, newborn and prenatal opossums. Reprod Fertil Dev 6:533–540.
Rodriguez Delgado CL, Waters PD, Gilbert C, Robinson TJ, Graves JAM (2009) Physical map-ping of the elephant X chromosome: conservation of gene order over 105 million years.Chromosome Res DOI:10.1007/s10577-009-9079-1.
Ross MT, Grafham DV, Coffey AJ, et al. (2005) The DNA sequence of the human X chromosome.Nature 434:325–337.
Samollow PB, Ford AL, VandeBerg JL (1987) X-linked gene expression in the Virginia opossum:differences between the paternally derived Gpd and Pgk-A loci. Genetics 115:185–195.
Samollow PB, Johnston PG, Ford AL, VandeBerg JL (1989) X-linked gene expression in metathe-rian fibroblasts: evidence from the Gpd and Pgk-A loci of the Virginia opossum and thered-necked wallaby. Biochem Genet 27:313–320.
Samollow PB, Robinson ES, Ford AL, VandeBerg JL (1995) Developmental progression ofGpd expression from the inactive X chromosome of the Virginia opossum. Dev Genet16:367–378.
Schmidt M, Migeon BR (1990) Asynchronous replication of homologous loci on human activeand inactive X chromosomes. Proc Natl Acad Sci U S A 87:3685–3689.
Sharman GB (1971) Late DNA replication in the paternally derived X chromosome of femalekangaroos. Nature 230:231–232.
Sinclair AH, Foster JW, Spencer JA (1988) Sequences homologous to ZFY, a candidate humansex-determining gene, are autosomal in marsupials. Nature 336:780–783.
Skaletsky H, Kuroda-Kawaguchi T, Minx PJ, et al. (2003) The male-specific region of the humanY chromosome is a mosaic of discrete sequence classes. Nature 423:825–837.
Spencer JA, Watson JM, Graves JA (1991) The X chromosome of marsupials shares a highlyconserved region with eutherians. Genomics 9:598–604.
Takagi N, Sasaki M (1975) Preferential inactivation of the paternally derived X chromosome in theextraembryonic membranes of the mouse. Nature 256:640–642.
Taylor JH (1960) Asynchronous duplication of chromosomes in cultured cells of Chinese hamster.J Biophys Biochem Cytol 7:455–464.
Torchia BS, Call LM, Migeon BR (1994) DNA replication analysis of FMR1, XIST, and factor 8Cloci by FISH shows nontranscribed X-linked genes replicate late. Am J Hum Genet 55:96–104.
Turner JM (2007) Meiotic sex chromosome inactivation. Development 134:1823–1831.VandeBerg JL, Thiel JE, Hope RM, Cooper DW (1979) Expression of PGK-A in the Australian
brush-tailed possum, Trichosurus vulpecula (Kerr), consistent with paternal X inactivation.Biochem Genet 17:325–332.
VandeBerg JL, Cooper DW, Sharman GB, Poole WE (1977) Studies on metatherian sex chromo-somes. IV. X linkage of PGK-A with paternal X inactivation confirmed in erythrocytes of greykangaroos by pedigree analysis. Aust J Biol Sci 30:115–125.
Veyrunes F, Waters PD, Miethke P, et al. (2008) Bird-like sex chromosomes of platypus implyrecent origin of mammal sex chromosomes. Genome Res 18:965–973.
Vigneau S, Augui S, Navarro P, Avner P, Clerc P (2006) An essential role for the DXPas34 tandemrepeat and Tsix transcription in the counting process of X chromosome inactivation. Proc NatlAcad Sci U S A 103:7390–7395.
Wake N, Takagi N, Sasaki M (1976) Non-random inactivation of X chromosome in the rat yolksac. Nature 262:580–581.

280 S. Al Nadaf et al.
Wakefield MJ, Keohane AM, Turner BM, Graves JAM (1997) Histone underacetylation is anancient component of mammalian X chromosome inactivation. Proc Natl Acad Sci U S A94:9665–9668.
Wang Z, Willard HF, Mukherjee S, Furey TS (2006) Evidence of influence of genomic DNAsequence on human X chromosome inactivation. PLoS Comput Biol 2:e113.
Waters PD, Wallis MC, Graves JAM (2007) Mammalian sex-Origin and evolution of the Ychromosome and SRY. Semin Cell Dev Biol 18:389–400.
Waterston RH, Lindblad-Toh K, Birney E, et al. (2002) Initial sequencing and comparative analysisof the mouse genome. Nature 420:520–562.
West JD, Frels WI, Chapman VM, Papaioannou VE (1977) Preferential expression of thematernally derived X chromosome in the mouse yolk sac. Cell 12:873–882.
Wrigley JM, Graves JAM (1988) Sex chromosome homology and incomplete, tissue-specificX-inactivation suggest that monotremes represent an intermediate stage of mammalian sexchromosome evolution. J Hered 79:115–118.
Wutz A, Jaenisch R (2000) A shift from reversible to irreversible X inactivation is triggered duringES cell differentiation. Mol Cell 5:695–705.
Zeng SM, Yankowitz J (2003) X-inactivation patterns in human embryonic and extra-embryonictissues. Placenta 24:270–275.
Part VIMarsupial Reproductive and
Developmental Genetics
Jennifer A. Marshall Graves
If anything defines a marsupial in the popular literature, it is their distinctive repro-duction, most obviously the development of the young externally in a pouch, ratherthan internally in the uterus. Indeed, the popular name of mammalian InfracalassMetatheria is taken from “marsupium”, meaning pouch. Although not all marsupialspecies are pouched, the young of every species are born tiny and at a much lessadvanced stage (“altricial”) than are eutherian young, and are suckled with milk forproportionately longer. This profound difference in the developmental program isthe result of constraint in the size and location of the uteri, which are preventedfrom fusing into one large uterus by the position of the ureters (Tyndale-Biscoe,2005).
This rather minor difference in plumbing has profound consequences for thedevelopment and nurture of the young, affecting every aspect of the nutrition anddevelopment of marsupial mammals. There is a fully functional yolk sac placentathat regulates carbohydrate and protein supply to the fetus and makes hormonesrequited for birth (making dubious the claim of uniqueness for “placental” mam-mals), but it is short lived and less developed, and does not secrete progesteroneas does the placenta of eutherians. Marsupial nutrition is largely via the milk ratherthan the umbilical cord, so it is no surprise that marsupials have an extremely sophis-ticated and complex lactation system. In this part these two aspects of marsupialdevelopment are explored in detail.
As has been extensively documented in classic studies (Tyndale-Biscoe andRenfree, 1987) the earliest stages of marsupial development are different in criticalways from development in placental mammals; in particular the marsupial embryodoes not develop an inner cell mass as do eutherian embryos, and the position ofstem cells is enigmatic. However, the genes that are critical for early development ineutherians evidently all have important roles in marsupials, and Pask and Renfree,in Chapter 14 describe studies of the expression profiles in the tammar wallabyof genes that are known to be critical for development in eutherians. These genesinclude the big four; OCT4, SOX2, NANOG and CDX2 that are believed to be thecritical cues that define the differentiation of the trophectoderm and inner cell massin mouse.
282 Part VI Marsupial Reproductive and Developmental Genetics
Amongst the many special features of marsupial development is the rare abilityto switch embryonic development on and off. Although some eutherians also sub-scribe to this embryonic diapause, it has been best studied in the tammar wallaby,and the signals to resume development are well understood. Not so the signals toenter diapause, and suspend development, up to 11 months, and Pask and Renfreespeculate that LIF1 is critical in this step.
One extremely beneficial consequence of the external development of themarsupial young is that they are accessible to view, and even to experimental manip-ulation, at much earlier developmental stages than, say, mouse embryos. Growth anddevelopment of organs takes place in the pouch and can be investigated directly. Forinstance, the undifferentiated gonad does not differentiate into testis until a day afterbirth in kangaroos (O et al., 1988). Marsupials offer, therefore, a unique model forobserving and experimenting on mammalian development (Renfree et al., 1995).Pask and Renfree describe how these differences in developmental plan have beenexploited to discover fundamental truths about fetal and placental development,germcell development, sex determination, and embryonic growth and developmentin marsupials. This has immediate relevance to understanding development in allmammals, including humans. Several breakthroughs in mammalian developmenthave been made using marsupials; for instance, the discovery that oestrogen can sexreverse an XY embryo in mammals as well as reptiles, delineation of a new path-way of steroid hormone biosynthesis (Wilson et al., 1999) and the discovery thatSRY, not ZFY, is the sex determining gene in marsupials (Sinclair et al., 1988), andeutherian mammals including humans.
Not surprisingly, marsupial milk is complex and its composition changes dur-ing lactation as the young progresses from fetus to newborn to joey. As detailedby Sharp et al., in Chapter 15, the composition changes from protein-rich to car-bohydrate and lipid rich as many of these components wax and wane during theyear-long lactation cycle in tammar wallabies. These milk components, and thecomplex genetic control that orchestrates their concentrations, provide a model forcontrol of lactation that is of considerable interest to the dairy industry, as well asfor the fundamental knowledge of mammalian nutrition and growth (Brennan et al.,2007). Marsupial lactation is now going genomic (Lefèvre et al., 2007), raising thepossibilities of an understanding at the molecular level.
However, marsupial milk is also loaded with growth factors that have very spe-cific phenotypic effects on the pouch young. Cross-fostering experiments show thatmilk contains growth factors specific to the stage of development. For instance, milkfrom an advanced stage teat initiates fur growth in a much younger animal. Many ofthese factors are likely to be homologous to factors that regulate growth and devel-opment of eutherian embryos, and are delivered through the umbilical cord withinthe uterus.
Both papers make the point that marsupial reproduction, though very differentfrom eutherian reproduction, is in no way to be considered a second-rate evolution-ary intermediate. The short gestation of an altricial young, and the nurturing of anexpendable pouch young through a prolonged lactation period, makes great sensefor an animal living in the dry and uncertain conditions that Australia affords.
Part VI Marsupial Reproductive and Developmental Genetics 283
References
Brennan AJ, Sharp JA, Digby MR, Nicholas KR (2007) The tammar wallaby: amodel to examine endocrine and local control of lactation. IUBMB Life 59:146–150.
Lefèvre CM, Digby MR, Whitley JC, Strahm Y, Nicholas KR (2007) Lactation tran-scriptomics in the Australian marsupial, Macropus eugenii: transcript sequencingand quantification. BMC Genomics 8:417.
Renfree MB, Harry JL, Shaw G (1995) The marsupial male: a role model for sexualdevelopment. Philos Trans R Soc Lond B Biol Sci 350:243–251.
Sinclair AH, Foster JW, Spencer JA, et al. (1988) Sequences homologous to ZFY,a candidate human sex-determining gene, are autosomal in marsupials. Nature336:780–783.
Tyndale-Biscoe H (2005) Life of Marsupials. CSIRO Publishing, Collingwood.Tyndale-Biscoe H, Renfree MB (1987) Reproductive Physiology of Marsupials.
Cambridge University Press, Cambridge.O WS, Short RV, Renfree MB, Shaw G (1988) Primary genetic control of somatic
sexual differentiation in a mammal. Nature 331:716–717.Wilson JD, George FW, Shaw G, Renfree MB (1999) Virilisation of the male
pouch young of the tammar wallaby does not appear to be mediated by plasmaandrogens. Biol Reprod 61:471–475.

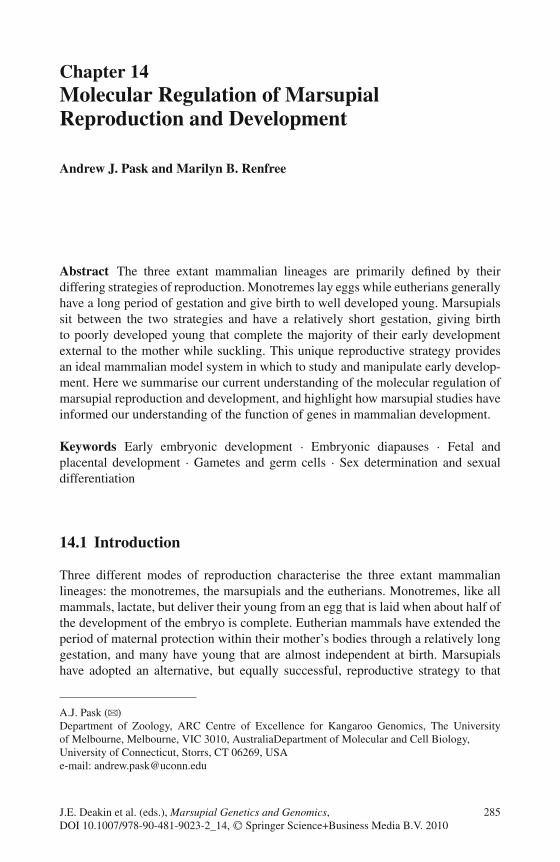
Chapter 14Molecular Regulation of MarsupialReproduction and Development
Andrew J. Pask and Marilyn B. Renfree
Abstract The three extant mammalian lineages are primarily defined by theirdiffering strategies of reproduction. Monotremes lay eggs while eutherians generallyhave a long period of gestation and give birth to well developed young. Marsupialssit between the two strategies and have a relatively short gestation, giving birthto poorly developed young that complete the majority of their early developmentexternal to the mother while suckling. This unique reproductive strategy providesan ideal mammalian model system in which to study and manipulate early develop-ment. Here we summarise our current understanding of the molecular regulation ofmarsupial reproduction and development, and highlight how marsupial studies haveinformed our understanding of the function of genes in mammalian development.
Keywords Early embryonic development · Embryonic diapauses · Fetal andplacental development · Gametes and germ cells · Sex determination and sexualdifferentiation
14.1 Introduction
Three different modes of reproduction characterise the three extant mammalianlineages: the monotremes, the marsupials and the eutherians. Monotremes, like allmammals, lactate, but deliver their young from an egg that is laid when about half ofthe development of the embryo is complete. Eutherian mammals have extended theperiod of maternal protection within their mother’s bodies through a relatively longgestation, and many have young that are almost independent at birth. Marsupialshave adopted an alternative, but equally successful, reproductive strategy to that
A.J. Pask (B)Department of Zoology, ARC Centre of Excellence for Kangaroo Genomics, The Universityof Melbourne, Melbourne, VIC 3010, AustraliaDepartment of Molecular and Cell Biology,University of Connecticut, Storrs, CT 06269, USAe-mail: [email protected]
285J.E. Deakin et al. (eds.), Marsupial Genetics and Genomics,DOI 10.1007/978-90-481-9023-2_14, C© Springer Science+Business Media B.V. 2010
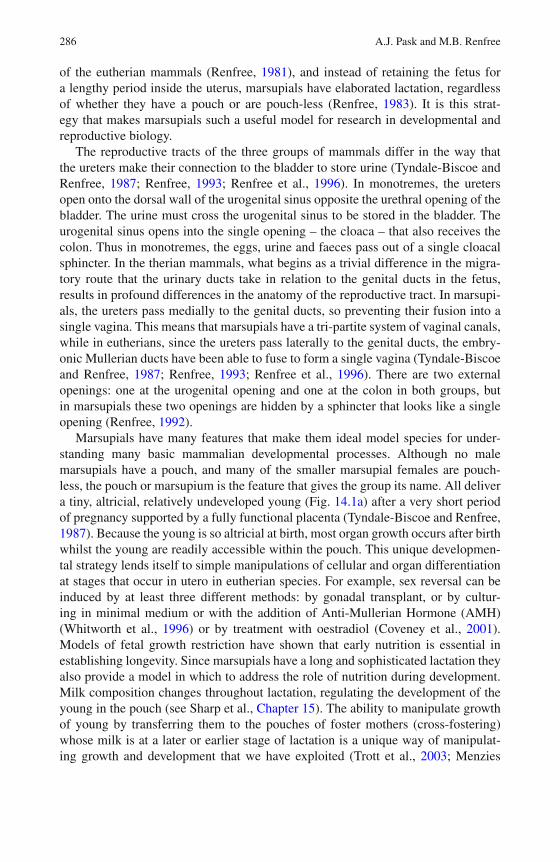
286 A.J. Pask and M.B. Renfree
of the eutherian mammals (Renfree, 1981), and instead of retaining the fetus fora lengthy period inside the uterus, marsupials have elaborated lactation, regardlessof whether they have a pouch or are pouch-less (Renfree, 1983). It is this strat-egy that makes marsupials such a useful model for research in developmental andreproductive biology.
The reproductive tracts of the three groups of mammals differ in the way thatthe ureters make their connection to the bladder to store urine (Tyndale-Biscoe andRenfree, 1987; Renfree, 1993; Renfree et al., 1996). In monotremes, the uretersopen onto the dorsal wall of the urogenital sinus opposite the urethral opening of thebladder. The urine must cross the urogenital sinus to be stored in the bladder. Theurogenital sinus opens into the single opening – the cloaca – that also receives thecolon. Thus in monotremes, the eggs, urine and faeces pass out of a single cloacalsphincter. In the therian mammals, what begins as a trivial difference in the migra-tory route that the urinary ducts take in relation to the genital ducts in the fetus,results in profound differences in the anatomy of the reproductive tract. In marsupi-als, the ureters pass medially to the genital ducts, so preventing their fusion into asingle vagina. This means that marsupials have a tri-partite system of vaginal canals,while in eutherians, since the ureters pass laterally to the genital ducts, the embry-onic Mullerian ducts have been able to fuse to form a single vagina (Tyndale-Biscoeand Renfree, 1987; Renfree, 1993; Renfree et al., 1996). There are two externalopenings: one at the urogenital opening and one at the colon in both groups, butin marsupials these two openings are hidden by a sphincter that looks like a singleopening (Renfree, 1992).
Marsupials have many features that make them ideal model species for under-standing many basic mammalian developmental processes. Although no malemarsupials have a pouch, and many of the smaller marsupial females are pouch-less, the pouch or marsupium is the feature that gives the group its name. All delivera tiny, altricial, relatively undeveloped young (Fig. 14.1a) after a very short periodof pregnancy supported by a fully functional placenta (Tyndale-Biscoe and Renfree,1987). Because the young is so altricial at birth, most organ growth occurs after birthwhilst the young are readily accessible within the pouch. This unique developmen-tal strategy lends itself to simple manipulations of cellular and organ differentiationat stages that occur in utero in eutherian species. For example, sex reversal can beinduced by at least three different methods: by gonadal transplant, or by cultur-ing in minimal medium or with the addition of Anti-Mullerian Hormone (AMH)(Whitworth et al., 1996) or by treatment with oestradiol (Coveney et al., 2001).Models of fetal growth restriction have shown that early nutrition is essential inestablishing longevity. Since marsupials have a long and sophisticated lactation theyalso provide a model in which to address the role of nutrition during development.Milk composition changes throughout lactation, regulating the development of theyoung in the pouch (see Sharp et al., Chapter 15). The ability to manipulate growthof young by transferring them to the pouches of foster mothers (cross-fostering)whose milk is at a later or earlier stage of lactation is a unique way of manipulat-ing growth and development that we have exploited (Trott et al., 2003; Menzies
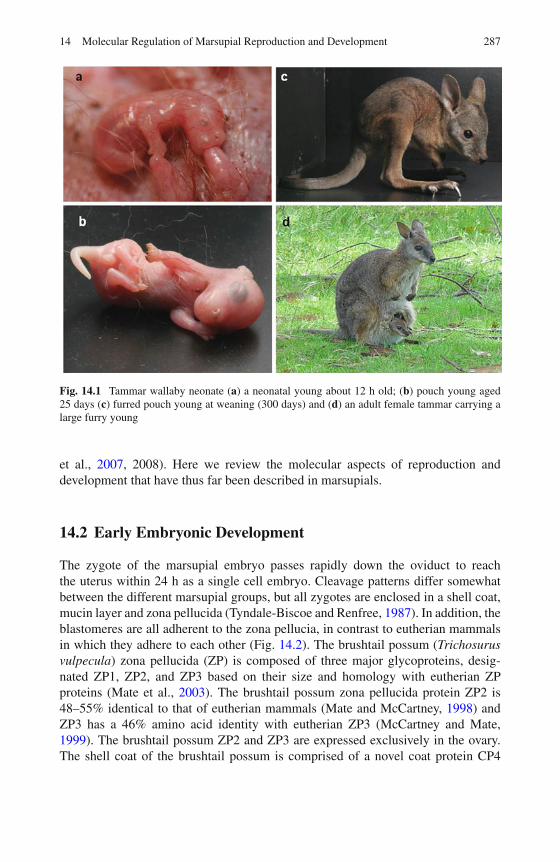
14 Molecular Regulation of Marsupial Reproduction and Development 287
Fig. 14.1 Tammar wallaby neonate (a) a neonatal young about 12 h old; (b) pouch young aged25 days (c) furred pouch young at weaning (300 days) and (d) an adult female tammar carrying alarge furry young
et al., 2007, 2008). Here we review the molecular aspects of reproduction anddevelopment that have thus far been described in marsupials.
14.2 Early Embryonic Development
The zygote of the marsupial embryo passes rapidly down the oviduct to reachthe uterus within 24 h as a single cell embryo. Cleavage patterns differ somewhatbetween the different marsupial groups, but all zygotes are enclosed in a shell coat,mucin layer and zona pellucida (Tyndale-Biscoe and Renfree, 1987). In addition, theblastomeres are all adherent to the zona pellucia, in contrast to eutherian mammalsin which they adhere to each other (Fig. 14.2). The brushtail possum (Trichosurusvulpecula) zona pellucida (ZP) is composed of three major glycoproteins, desig-nated ZP1, ZP2, and ZP3 based on their size and homology with eutherian ZPproteins (Mate et al., 2003). The brushtail possum zona pellucida protein ZP2 is48–55% identical to that of eutherian mammals (Mate and McCartney, 1998) andZP3 has a 46% amino acid identity with eutherian ZP3 (McCartney and Mate,1999). The brushtail possum ZP2 and ZP3 are expressed exclusively in the ovary.The shell coat of the brushtail possum is comprised of a novel coat protein CP4
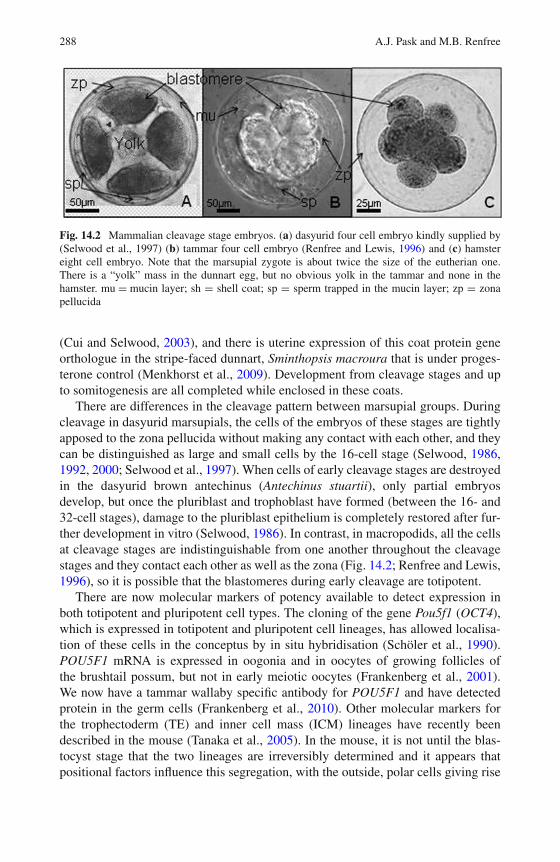
288 A.J. Pask and M.B. Renfree
Fig. 14.2 Mammalian cleavage stage embryos. (a) dasyurid four cell embryo kindly supplied by(Selwood et al., 1997) (b) tammar four cell embryo (Renfree and Lewis, 1996) and (c) hamstereight cell embryo. Note that the marsupial zygote is about twice the size of the eutherian one.There is a “yolk” mass in the dunnart egg, but no obvious yolk in the tammar and none in thehamster. mu = mucin layer; sh = shell coat; sp = sperm trapped in the mucin layer; zp = zonapellucida
(Cui and Selwood, 2003), and there is uterine expression of this coat protein geneorthologue in the stripe-faced dunnart, Sminthopsis macroura that is under proges-terone control (Menkhorst et al., 2009). Development from cleavage stages and upto somitogenesis are all completed while enclosed in these coats.
There are differences in the cleavage pattern between marsupial groups. Duringcleavage in dasyurid marsupials, the cells of the embryos of these stages are tightlyapposed to the zona pellucida without making any contact with each other, and theycan be distinguished as large and small cells by the 16-cell stage (Selwood, 1986,1992, 2000; Selwood et al., 1997). When cells of early cleavage stages are destroyedin the dasyurid brown antechinus (Antechinus stuartii), only partial embryosdevelop, but once the pluriblast and trophoblast have formed (between the 16- and32-cell stages), damage to the pluriblast epithelium is completely restored after fur-ther development in vitro (Selwood, 1986). In contrast, in macropodids, all the cellsat cleavage stages are indistinguishable from one another throughout the cleavagestages and they contact each other as well as the zona (Fig. 14.2; Renfree and Lewis,1996), so it is possible that the blastomeres during early cleavage are totipotent.
There are now molecular markers of potency available to detect expression inboth totipotent and pluripotent cell types. The cloning of the gene Pou5f1 (OCT4),which is expressed in totipotent and pluripotent cell lineages, has allowed localisa-tion of these cells in the conceptus by in situ hybridisation (Schöler et al., 1990).POU5F1 mRNA is expressed in oogonia and in oocytes of growing follicles ofthe brushtail possum, but not in early meiotic oocytes (Frankenberg et al., 2001).We now have a tammar wallaby specific antibody for POU5F1 and have detectedprotein in the germ cells (Frankenberg et al., 2010). Other molecular markers forthe trophectoderm (TE) and inner cell mass (ICM) lineages have recently beendescribed in the mouse (Tanaka et al., 2005). In the mouse, it is not until the blas-tocyst stage that the two lineages are irreversibly determined and it appears thatpositional factors influence this segregation, with the outside, polar cells giving rise
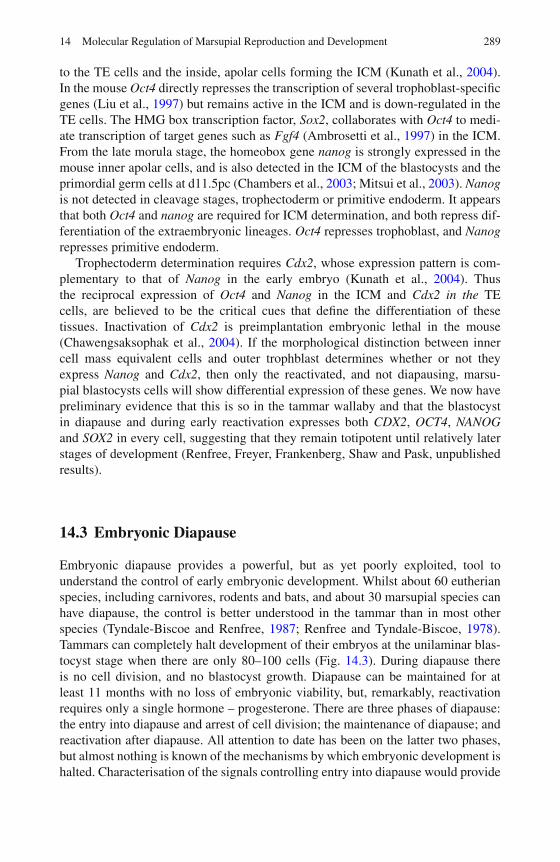
14 Molecular Regulation of Marsupial Reproduction and Development 289
to the TE cells and the inside, apolar cells forming the ICM (Kunath et al., 2004).In the mouse Oct4 directly represses the transcription of several trophoblast-specificgenes (Liu et al., 1997) but remains active in the ICM and is down-regulated in theTE cells. The HMG box transcription factor, Sox2, collaborates with Oct4 to medi-ate transcription of target genes such as Fgf4 (Ambrosetti et al., 1997) in the ICM.From the late morula stage, the homeobox gene nanog is strongly expressed in themouse inner apolar cells, and is also detected in the ICM of the blastocysts and theprimordial germ cells at d11.5pc (Chambers et al., 2003; Mitsui et al., 2003). Nanogis not detected in cleavage stages, trophectoderm or primitive endoderm. It appearsthat both Oct4 and nanog are required for ICM determination, and both repress dif-ferentiation of the extraembryonic lineages. Oct4 represses trophoblast, and Nanogrepresses primitive endoderm.
Trophectoderm determination requires Cdx2, whose expression pattern is com-plementary to that of Nanog in the early embryo (Kunath et al., 2004). Thusthe reciprocal expression of Oct4 and Nanog in the ICM and Cdx2 in the TEcells, are believed to be the critical cues that define the differentiation of thesetissues. Inactivation of Cdx2 is preimplantation embryonic lethal in the mouse(Chawengsaksophak et al., 2004). If the morphological distinction between innercell mass equivalent cells and outer trophblast determines whether or not theyexpress Nanog and Cdx2, then only the reactivated, and not diapausing, marsu-pial blastocysts cells will show differential expression of these genes. We now havepreliminary evidence that this is so in the tammar wallaby and that the blastocystin diapause and during early reactivation expresses both CDX2, OCT4, NANOGand SOX2 in every cell, suggesting that they remain totipotent until relatively laterstages of development (Renfree, Freyer, Frankenberg, Shaw and Pask, unpublishedresults).
14.3 Embryonic Diapause
Embryonic diapause provides a powerful, but as yet poorly exploited, tool tounderstand the control of early embryonic development. Whilst about 60 eutherianspecies, including carnivores, rodents and bats, and about 30 marsupial species canhave diapause, the control is better understood in the tammar than in most otherspecies (Tyndale-Biscoe and Renfree, 1987; Renfree and Tyndale-Biscoe, 1978).Tammars can completely halt development of their embryos at the unilaminar blas-tocyst stage when there are only 80–100 cells (Fig. 14.3). During diapause thereis no cell division, and no blastocyst growth. Diapause can be maintained for atleast 11 months with no loss of embryonic viability, but, remarkably, reactivationrequires only a single hormone – progesterone. There are three phases of diapause:the entry into diapause and arrest of cell division; the maintenance of diapause; andreactivation after diapause. All attention to date has been on the latter two phases,but almost nothing is known of the mechanisms by which embryonic development ishalted. Characterisation of the signals controlling entry into diapause would provide
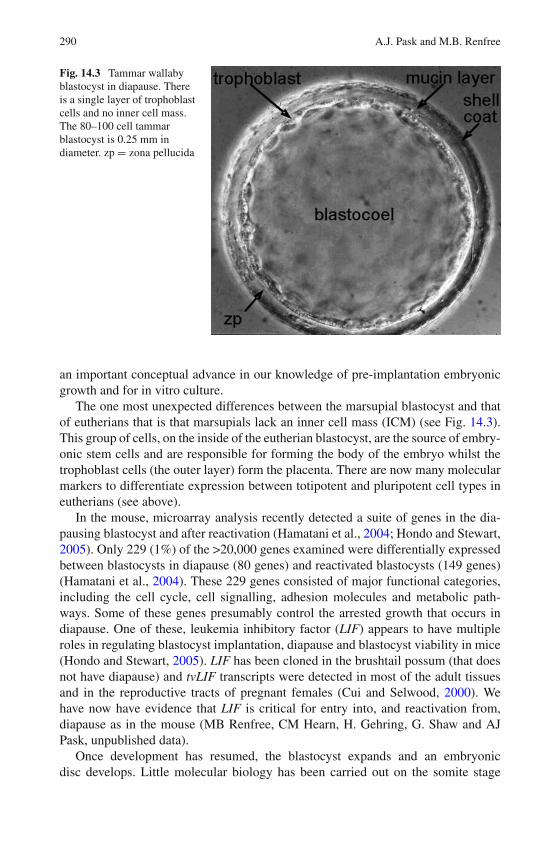
290 A.J. Pask and M.B. Renfree
Fig. 14.3 Tammar wallabyblastocyst in diapause. Thereis a single layer of trophoblastcells and no inner cell mass.The 80–100 cell tammarblastocyst is 0.25 mm indiameter. zp = zona pellucida
an important conceptual advance in our knowledge of pre-implantation embryonicgrowth and for in vitro culture.
The one most unexpected differences between the marsupial blastocyst and thatof eutherians that is that marsupials lack an inner cell mass (ICM) (see Fig. 14.3).This group of cells, on the inside of the eutherian blastocyst, are the source of embry-onic stem cells and are responsible for forming the body of the embryo whilst thetrophoblast cells (the outer layer) form the placenta. There are now many molecularmarkers to differentiate expression between totipotent and pluripotent cell types ineutherians (see above).
In the mouse, microarray analysis recently detected a suite of genes in the dia-pausing blastocyst and after reactivation (Hamatani et al., 2004; Hondo and Stewart,2005). Only 229 (1%) of the >20,000 genes examined were differentially expressedbetween blastocysts in diapause (80 genes) and reactivated blastocysts (149 genes)(Hamatani et al., 2004). These 229 genes consisted of major functional categories,including the cell cycle, cell signalling, adhesion molecules and metabolic path-ways. Some of these genes presumably control the arrested growth that occurs indiapause. One of these, leukemia inhibitory factor (LIF) appears to have multipleroles in regulating blastocyst implantation, diapause and blastocyst viability in mice(Hondo and Stewart, 2005). LIF has been cloned in the brushtail possum (that doesnot have diapause) and tvLIF transcripts were detected in most of the adult tissuesand in the reproductive tracts of pregnant females (Cui and Selwood, 2000). Wehave now have evidence that LIF is critical for entry into, and reactivation from,diapause as in the mouse (MB Renfree, CM Hearn, H. Gehring, G. Shaw and AJPask, unpublished data).
Once development has resumed, the blastocyst expands and an embryonicdisc develops. Little molecular biology has been carried out on the somite stage
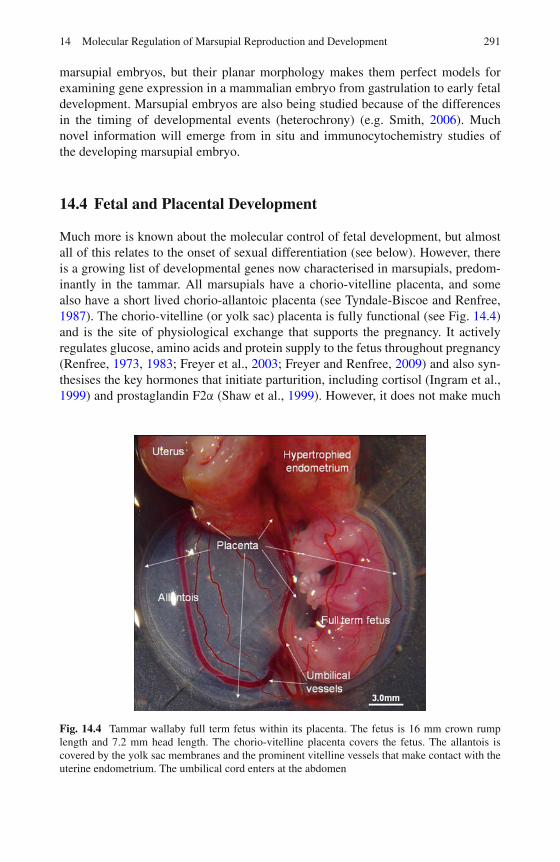
14 Molecular Regulation of Marsupial Reproduction and Development 291
marsupial embryos, but their planar morphology makes them perfect models forexamining gene expression in a mammalian embryo from gastrulation to early fetaldevelopment. Marsupial embryos are also being studied because of the differencesin the timing of developmental events (heterochrony) (e.g. Smith, 2006). Muchnovel information will emerge from in situ and immunocytochemistry studies ofthe developing marsupial embryo.
14.4 Fetal and Placental Development
Much more is known about the molecular control of fetal development, but almostall of this relates to the onset of sexual differentiation (see below). However, thereis a growing list of developmental genes now characterised in marsupials, predom-inantly in the tammar. All marsupials have a chorio-vitelline placenta, and somealso have a short lived chorio-allantoic placenta (see Tyndale-Biscoe and Renfree,1987). The chorio-vitelline (or yolk sac) placenta is fully functional (see Fig. 14.4)and is the site of physiological exchange that supports the pregnancy. It activelyregulates glucose, amino acids and protein supply to the fetus throughout pregnancy(Renfree, 1973, 1983; Freyer et al., 2003; Freyer and Renfree, 2009) and also syn-thesises the key hormones that initiate parturition, including cortisol (Ingram et al.,1999) and prostaglandin F2α (Shaw et al., 1999). However, it does not make much
Fig. 14.4 Tammar wallaby full term fetus within its placenta. The fetus is 16 mm crown rumplength and 7.2 mm head length. The chorio-vitelline placenta covers the fetus. The allantois iscovered by the yolk sac membranes and the prominent vitelline vessels that make contact with theuterine endometrium. The umbilical cord enters at the abdomen
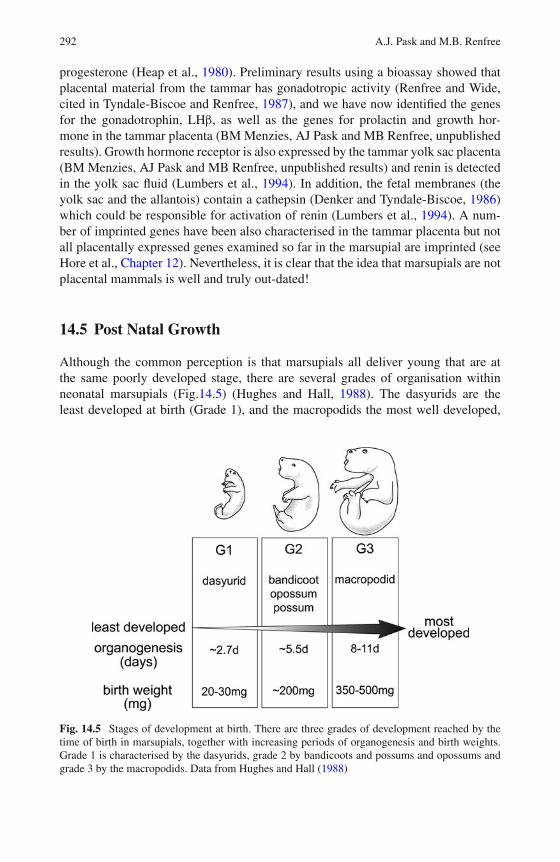
292 A.J. Pask and M.B. Renfree
progesterone (Heap et al., 1980). Preliminary results using a bioassay showed thatplacental material from the tammar has gonadotropic activity (Renfree and Wide,cited in Tyndale-Biscoe and Renfree, 1987), and we have now identified the genesfor the gonadotrophin, LHβ, as well as the genes for prolactin and growth hor-mone in the tammar placenta (BM Menzies, AJ Pask and MB Renfree, unpublishedresults). Growth hormone receptor is also expressed by the tammar yolk sac placenta(BM Menzies, AJ Pask and MB Renfree, unpublished results) and renin is detectedin the yolk sac fluid (Lumbers et al., 1994). In addition, the fetal membranes (theyolk sac and the allantois) contain a cathepsin (Denker and Tyndale-Biscoe, 1986)which could be responsible for activation of renin (Lumbers et al., 1994). A num-ber of imprinted genes have been also characterised in the tammar placenta but notall placentally expressed genes examined so far in the marsupial are imprinted (seeHore et al., Chapter 12). Nevertheless, it is clear that the idea that marsupials are notplacental mammals is well and truly out-dated!
14.5 Post Natal Growth
Although the common perception is that marsupials all deliver young that are atthe same poorly developed stage, there are several grades of organisation withinneonatal marsupials (Fig.14.5) (Hughes and Hall, 1988). The dasyurids are theleast developed at birth (Grade 1), and the macropodids the most well developed,
Fig. 14.5 Stages of development at birth. There are three grades of development reached by thetime of birth in marsupials, together with increasing periods of organogenesis and birth weights.Grade 1 is characterised by the dasyurids, grade 2 by bandicoots and possums and opossums andgrade 3 by the macropodids. Data from Hughes and Hall (1988)
14 Molecular Regulation of Marsupial Reproduction and Development 293
with peramelids intermediate. The young of all groups spend a relatively longtime dependent on lactation when most organ systems complete their developmentand mature (Tyndale-Biscoe and Janssens, 1988) (see Fig. 14.1). Lactation and itsgenetic control is now well characterised (see Sharp et al., Chapter 15) but lessattention has been directed to the growth and maturation of the young.
There is a gradual development of the endocrine growth axis and growth hormone(GH)-regulated growth over the course of an extended lactation period, in contrastto the peri-natal period of development in eutherian mammals, providing a mech-anism by which the young can develop nutritional independence from the mothergradually. Growth hormone (GH) release from the pituitary can be stimulated byghrelin, a hormone that regulates appetite in mammals, and appears in the cellsof the stomach during late fetal life. The altricial marsupial young must feed anddigest milk at a comparatively immature stage of development, so it is perhaps notsurprising that gastric ghrelin cells appear in the developing mesenchyme of thestomach from day 10 post partum (pp) to day 150 pp, but only remain in the hind-stomach after day 150 pp (Menzies et al., 2009). Pituitary ghsr-1alpha expressionand plasma concentrations of ghrelin increase significantly up to day 70–120 pp,while GH expression also becomes elevated, declining with GH to reach adult lev-els by day 180 pp. Thus neonatal marsupials have an early onset of gastric ghrelinexpression in concert with a functional stomach at a relatively earlier stage than thatof developmentally more mature eutherian young (Menzies et al., 2009; Kwek et al.,2009).
14.6 Gonadotrophic Control of Reproductionand the Developing Pituitary
Gonadotrophin-releasing hormone (GnRH) plays a pivotal role in the endocrinecontrol of both reproduction and embryonic development. The marsupial GnRHreceptor (GnRH-R) gene in the tammar is composed of 328 amino acid residues withseven transmembrane domains and is a member of the G protein-coupled receptorfamily (Cheung and Hearn, 2002). There is a putative protein kinase A phospho-rylation site and a putative protein kinase C (PKC) phosphorylation site in the firstintracellular loop, and an additional PKC phosphorylation site was located in thethird intracellular loop. Comparisons with the eutherian GnRH-Rs show a greaterdiversity in the N-terminal extracellular domain. Tammar GnRH-R has approxi-mately 80% amino acid sequence homology with eutherian GnRH-Rs and 93%homology with the brushtail possum.
Gonadotropin-releasing hormone receptor (GnRH-R) consists of two splice vari-ants (GnRH-R γ1 and GnRH-R γ2) Tammar GnRH-R, like eutherian GnRH-Rs,contains three exons and two introns. GnRH-R γ1 has a 291 bp deletion fromnucleotide positions 232–522 within exon 1. This transcript appears to be distinctivein the wallaby and has not been reported in other species. GnRH-R γ2 has a 220 bpdeletion from nucleotide positions 523–742, corresponding to exon 2. Both the
294 A.J. Pask and M.B. Renfree
wild type receptor and the splice variants are membrane-associated molecules. Thedifferent pattern of expression of the wild type receptor and the variants transcriptsfound in adult and neonatal tissues suggests a specific developmental regulation ofthe GnRH-R γ2 transcript. The timing of expression suggests that GnRH-R may beinvolved in the regulation of early development in the testis and ovary of the devel-oping pouch young (Cheung and Hearn, 2003, 2005). Similarly, the tammar FSH-Rhas 94% amino acid similarity with human FSH-R and is expressed in both the adulttestis and ovary suggesting a similar function for this gene in both marsupials andeutherians (Mattiske et al., 2002). There are alternate splices of tFSH-R that pro-duces four transcripts consistent with the splice variants seen in eutherians. Thisalternate splicing appears to be of functional significance in the mammalian ovary(Mattiske et al., 2002). Thus the gonadotrophic genes that control reproduction inmammals are highly conserved.
In eutherian mammals, the gonadotrophins (LH and FSH) are synthesized andstored in gonadotroph cells under the regulation of multiple mechanisms includ-ing GnRH. Very little is known about the regulation of gonadotrophin secretionand storage in pituitary glands of marsupials. In the brushtail possum, LHβ mRNAexpression levels are constant over the oestrous cycle, regardless of the presence ofa pre-ovulatory LH surge. There is a positive correlation between gene expressionof FSHβ and plasma levels of FSH at different stages of the oestrous cycle. LHβ
and FSHβ mRNA are both expressed in the pituitary, and there is protein storageof gonadotrophins within the pituitary gland (Crawford et al., 2009). The marsupialcDNAs encoding the follicle stimulating hormone β subunit, α-subunit of LH (alsoshared by a number of other glycoprotein hormones) and the LH-specific β-subunitare all highly conserved with their orthologues in eutherian species (Belov et al.,1998; Harrison et al., 1998; Fidler et al., 1998).
The developing pituitary of the pouch young is immunopositive for pituitaryhormones (Leatherland and Renfree, 1983). In the pars distalis of pouch-young,presumptive somatotrops constitute up to 70% of the gland. There are smallnumbers (together representing less than 30% of the pars distalis) of immunoreac-tive mammotrophs, thyrotrophs, gonadotrophs and corticotrophs. The presumptivemammotrophs, gonadotrophs and thyrotrophs increase in number and apparentactivity during the first 50 days postpartum. Presumptive corticotroph cells in25–30 day-old animals were relatively most numerous, and apparently more activethan at any other stage of pouch, but it is not known why this should be so. Thechanges in number and activity of cell types in the pars distalis correlate well withmajor developmental events such as the onset of adrenal activity, the rapid growthphase in the first 100 days postpartum, and the generally low thyroid activity inpouch-young of less than 50 days of age (Leatherland and Renfree, 1983).
Prolactin is a key regulator of reproduction in macropodid marsupials and criticalfor the long lactation. Analysis of the molecular evolution of the marsupial prolactingene has shown that among vertebrates, is most closely related to the prolactin ofeutherian mammals (as expected) but since it branched off from eutherian prolactinit has shown reduced rates of evolution compared to those seen in eutherian species(Curlewis et al., 1998).
14 Molecular Regulation of Marsupial Reproduction and Development 295
14.7 Gametes and Germ Cells
Germ cells (the progenitors of the egg and sperm), are the only potentially immortalcells in the body since they are the only ones capable of transmitting DNA to thenext generation (Short, 2003). In order to maintain their specialised state, germ cellshave unique, and sex specific, developmental pathways. Almost all our informationon the origin and fate of the germ cells has been derived from the mouse, where theyarise in the embryonic epiblast and then leave the embryo, moving into the extra-embryonic tissues. This may protect them from the DNA methylation by which theother cells of the embryo are genomically imprinted and lineage restricted. Germcells later return to the embryo and migrate to the developing gonad, controlled bya suite of cytokines, growth factors and cell adhesion molecules. They proliferateduring their migration from their extra-embryonic location to the gonadal ridges.Once in the gonads, the germ cells continue to proliferate before initiating meiosis(in the developing ovary) or mitotic arrest (in the developing testis); in most speciesno further development of germ cells occurs until puberty.
Marsupials have several advantages as models for the study of germ cell biol-ogy. Their planar embryonic development makes it easier to visualise germ cellsand trace the events involved in their specification. Furthermore, in contrast to themouse and human, germ cell proliferation and subsequent entry into meiosis occurspost-natally in marsupials, making these processes easy to study. However, there isrelatively little information on marsupial germ cells at a genetic level.
Migration of PGCs from their position outside the embryo to the gonads is crit-ical for their survival and function. In the mouse, PGCs migrate from the primitivestreak into the endoderm, which forms the gut. They then migrate via the anterioraspect of the gut into the gonads (Anderson et al., 2000). In the tammar, they neverenter the gut but instead migrate via the gut mesentery (Ullmann et al., 1997; Jianget al., 1997), but as yet we know nothing of the signals that direct them. Germ cellshave been identified at the 17 somite stage embryo with alkaline phosphatase stain-ing and with POU5F1 (Ullmann et al., 1997; Frankenberg et al., 2010) but earlieridentification is currently under investigation (Hickford, Shaw, Pask Frankenbergand Renfree). In the brushtail possum, c-kit gene expression is detected in thegerm cells and somatic cells during the first 15 days of life (Eckery et al., 2002a).However, after Day 30 and into adult life, c-kit expression becomes exclusive togerm cells. This pattern of ovarian development is similar in marsupials to eutheri-ans, and suggests that c-kit may play a key role in germ cell development at variousstages throughout life.
Although the sex-chromosome composition of a germ cell influences gametefunction (McLaren, 1981, 2003), the decision as to whether a germ cell enters mei-otic or mitotic arrest depends on the surrounding somatic cell environment of theovary or testis. Murine germ cells enter the gonads between E10.5 and 11.5, whengonadal differentiation is occurring (Fig. 14.1). Similarly in the tammar germ cellsenter the gonads during early gonadal differentiation (Alcorn and Robinson, 1983).In mice, they continue to proliferate until around E13.5, when oogonia stop prolifer-ating and enter prophase of the first meiotic division while spermatogonia undergo
296 A.J. Pask and M.B. Renfree
mitotic arrest until early puberty when they enter meiosis. Entry into meiosis isinduced by retinoic acid (RA), which activates the expression of Stra8, a cytoplas-mic protein required for pre-meiotic DNA replication (Koubova et al., 2006). Earlyentry into meiosis in males is prevented by expression in the testis of Cyp26b1,an enzyme in the cytochrome P450 family that degrades RA (Bowles et al., 2006;Koubova et al., 2006; Vernet et al., 2006). We have cloned and characterised tammarStra8 and Cyp26b1 in the tammar, but do not yet have functional studies to confirmthat a similar pathway exists in the tammar.
14.7.1 The Ooctye and the Adult Ovary
The marsupial oocyte is larger than that of eutherians, averaging around 0.25 mmcompared to the 0.135 mm oocyte of the mouse (see also Fig. 14.2). Marsupialoocytes are surrounded by a zona pellucida, a proteinaceous mucin layer and a shellcoat. Each of these three egg coats contains specific proteins. Vap1 is a proteinisolated from the vesicle-rich hemisphere of the brushtail possum oocyte, possi-bly ovary-specific, which occurs during follicle formation and growth and in adultovaries (Cui et al., 2005). VAP1 is being trialled as an immune target in contracep-tive studies of the possum (Cui et al., 2005; Nation et al., 2008). Two other oocyteproteins ZP2 and c-mos have ovary-specific expression in the dunnart (Au et al.,2008): ZP2 is expressed in the cytoplasm of oocytes of primordial, primary and sec-ondary follicles but expression is highest in oocytes of primary follicles. ZP2 and isnot expressed in granulosa cells of any follicles (Au et al., 2008).
Both LH and FSH play a central role in controlling ovarian function in mammals.However, little is known about the type of ovarian cells that are responsive to LH andFSH in marsupials. The receptors for LH and FSH in ovaries of brushtail possumsare found in granulosa cells of healthy follicles containing at least two completelayers of cells at the time of antrum formation (Eckery et al., 2002b). Cells of thetheca interna expressed LH-R mRNA but not FSH-R mRNA. Neither FSH-R norLH-R mRNA was detected in atretic follicles. Both FSH-R and LH-R mRNAs arefound in the luteal cells, but only LH-R mRNA was observed in interstitial cells(Eckery et al., 2002b).
Interstitial tissue is a prominent feature of the marsupial ovary, occupying morethan 2/3 of its volume (Tyndale-Biscoe and Renfree, 1987). In the tammar, the cellsof the interstitial tissue resemble those of the corpora lutea and have the appear-ance of a steroid secreting tissue (Renfree and Tyndale-Biscoe, 1973). They dohave some steroid synthetic capacity and can metabolise precursors to form proges-terone (Renfree et al., 1984). In the brushtail possum, both the luteal cells and theinterstitial tissue cells express receptors for prolactin and luteinising hormone (LH),suggesting that prolactin and LH may be important in the regulation of steroidoge-nesis in these cells (Eckery et al., 2002b). In the tammar, prolactin inhibits lutealgrowth during diapause (Tyndale-Biscoe and Renfree, 1987).
The oocyte derived growth differentiation factor 9 (GDF9) and bonemorphogenetic protein 15 (BMP15; also known as GDF9b) are essential for normal
14 Molecular Regulation of Marsupial Reproduction and Development 297
follicular growth. These two proteins are present in the developing follicles ofthe brushtail possum, and the mRNAs encoding GDF9 and BMP15 are detectedin oocytes of newly-formed primordial follicles (i.e. days 78–85) (Eckery et al.,2002c). Expression of both mRNAs is restricted to the oocyte and persists throughall stages of folliculogenesis, from non-growing primordial follicles to folliclesundergoing preantral or antral development. GDF9 and BMP15 may have a possi-ble role in the maintenance of primordial follicles and during follicular development(Eckery et al., 2002c).
The ovary of the brushtail possum secretes steroids, and the expression ofnumerous steroidogenic genes have been investigated. Steroidogenic factor-1(SF-1), steroidogenic acute regulatory protein (StAR), cytochrome p450 side chaincleavage (P450scc), 3β-hydroxysteroid dehydrogenase/Delta5, Delta4 isomerase(3βHSD), cytochrome p45017alphahydroxylase (p45017αOH), and p450 aromatase(p450arom) are not expressed in oocytes at any stage of follicular development(Whale et al., 2003). However, SF-1 is detected in granulosa cells from the type 2or the primary stage of development and thereafter to the preovulatory stage. Inaddition, the theca interna of small and medium-size antral, but not preovula-tory, follicles and the interstitial glands and corpora lutea expressed SF-1 mRNA.Granulosa cells of preantral and small to medium-size antral follicles do not con-tain p450scc mRNA. The corpus luteum expresses p450arom, indicating that thistissue also has the potential to secrete estrogens in the brushtail possum (Whaleet al., 2003) as it does in the tammar wallaby (Fletcher and Renfree, 1988). Corporalutea of tammar wallabies contained oestradiol-17 β and oestrone during embryonicdiapause and at all stages of pregnancy studied after blastocyst activation (Renfreeet al., 1984). Aromatase is undetectable in corpora lutea or in interstitial tissue, butwas present in the ovarian tissues (including follicles) which remained after removalof corpora lutea (Renfree et al., 1984). Oestrogen (ERα and ERβ), androgen (AR)and progesterone (PR) receptors are present during ovarian and follicular devel-opment in the brushtail possum (Haydon et al., 2008) and of the tammar wallaby(Calatayud et al., 2010; Butler et al., 1998).
Inhibin α in the brushtail possum is expressed throughout all stages of folliculargrowth and is also detected in cells of the corpus luteum (Vanmontfort et al., 1998).Inhibin α-subunit protein has been highly conserved since the divergence of themarsupial and eutherian mammalian lineages. Inhibin α and β have also been clonedin the tammar, and are more highly expressed in the ovary than in any other tissue(C Borchers, G Shaw, D Robinson and M Renfree, unpublished results).
14.7.2 Spermatozoa and the Adult Testis
Marsupials offer a unique model to examine spermatogenic gene function and evo-lution. While there are many similarities in the spermatogenesis process betweeneutherians and marsupials, there are also many differences. These similarities anddifferences can be exploited to gain a greater understanding of the molecularcontrol of this process. One of the key differences between marsupial and eutherian
298 A.J. Pask and M.B. Renfree
spermatozoa is their morphology and the position of the acrosome. Americanmarsupials, with the exception of Dromiciops gliroides, have sperm that are paired,joining at their heads at the acrosomal surfaces (Tyndale-Biscoe and Renfree, 1987).There are eight stages of spermatogenesis and 14 stages of spermiogenesis recog-nized in the tammar and the spermatogenic cycle takes 16 days (Setchell, 1977;Harris and Rodger, 2005). Spermatogonia undergo a series of mitoses to produce theprimary spermatocytes. Sperm maturation follows a similar pattern to that seen ineutherians (Harris and Rodger, 2005; Tyndale-Biscoe and Renfree, 1987). However,in marsupials the process of spermiogenesis, when the spermatids become sper-matozoa, is complicated and dynamic and differs in some respects from that ofeutherians (Lin et al., 1997). Sperm of most marsupials have a dorso-ventrally flat-tened nuclear surface (Temple-Smith, 1994) and there is an acrosome on the dorsalnuclear surface (Mate and Rodger, 1991; Sistina et al., 1993). During epididymaltransit and capacitation, there is a distinct reorientation of the sperm head whichrotates on its axis from a T-shape relative to the tail (Temple-Smith, 1994; Bedfordand Breed, 1994; Lin and Rodger, 1999). The marsupial sperm head becomes com-pact but there does not appear to be any special stabilization of chromatin in thenucleus by disulphide bonding or in the sperm head membranes (Cummins, 1980;Temple-Smith and Bedford, 1976). In vitro capacitation cannot be achieved unlessthe sperm are co-cultured with oviductal cells (Sidhu et al., 1999). cAMP inducestyrosine phosphorylation of sperm proteins and the “T”-shaped orientation is asso-ciated with capacitation in marsupials (Sidhu et al., 2004). These differences instructural organization suggest that there may also be differences in the genes con-trolling spermatogenesis and sperm function and motility. GAPDs was identifiedas a conserved mammalian energy source for sperm motility in marsupials (Ricciand Breed, 2005), suggesting that marsupials employ similar molecular regulatorsas eutherians during spermatogenesis. For example, at fertilisation, spermatozoabind to the zona pellucida, and in eutherian mammals, β1,4-galactosyltransferase-I(GalTase-I) is one of the key molecules on the sperm surface that is likely to beinvolved. This protein is also present in possum spermatozoa, suggesting a similarrole as a gamete receptor molecule on the sperm surface of the brushtail possum(Braundmeier et al., 2008).
In further characterising the molecular controls of the spermatogenesis process inmarsupials, research has focused so far on the role of X-linked genes in the process.The mammalian X-chromosome has long been suspected to contain a dispropor-tionate number of genes associated with sex, compared to the rest of the genome(Ohno, 1967). Recent analyses suggests that the eutherian X contains, in particu-lar, a high number of genes involved in early spermatogenesis, while it is deficientin those that control late spermatogenesis (Khil et al., 2004). Since marsupialshave a smaller X-chromosome then eutherians it is possible to examine whethergenes that are spermatogenic and X-linked in eutherians but autosomal in marsupi-als evolved their spermatogenic role after their recruitment to the X-chromosome,or if genes that already had a function in spermatogenesis were selectively movedto the X-chromosome in eutherian evolution. We can also determine if genes that
14 Molecular Regulation of Marsupial Reproduction and Development 299
are conserved on both the marsupial and eutherian X have maintained a role inspermatogenesis through therian evolution.
AKAP4 is an X-linked member of AKAP gene family (Turner et al., 1998) thatencodes the most abundant protein so far identified on the sperm fibrous sheath, andis present in all mammals so far examined (Carrera et al., 1994, 1996; Colledge andScott, 1999; Eddy et al., 2003; Fulcher et al., 1995; Turner et al., 1998). AKAP4anchors cAMP-dependent protein kinase A to the fibrous sheath, where it is thoughtto be required for the regulation of spermatozoal motility (Brown et al., 2003;Edwards and Scott, 2000). Akap4 mRNA is expressed only in the post-meioticphase of spermatogenesis and AKAP4 protein is restricted to the spermatogeniccells from the round spermatid stage (Miki et al., 2002). Akap4 deletions result inshorter sperm flagellum with an incomplete fibrous sheath causing infertility dueto loss of motility, suggesting AKAP4 is a scaffold protein involved in regulatingflagellum function (Miki et al., 2002). In the tammar wallaby, AKAP4 gene struc-ture, sequence and predicted protein was highly conserved with that of eutherianorthologues. As expected from its location on the long arm of the eutherian X, it islocated on the marsupial X-chromosome. There is no AKAP4 expression detectedin the developing young but in the adult, AKAP4 expression is abundant and limitedto the testis. AKAP4 mRNA is detected in the cytoplasm of round and elongatedspermatids while AKAP4 protein is found on the principal piece of the flagellum inthe sperm tail. This is consistent with its expression in other mammals. Thus AKAP4appears to have had a conserved role in spermatogenesis for at least the last 166 mil-lion years of mammalian evolution (Hu et al., 2009), so is presumed to have had thisrole on the original therian X-chromosome.
14.8 Sex Determination and Sexual Differentiation
Disorders of gonadal development are among the most common birth defects inhumans (1 in 4,000 births). These disorders frequently result in infertility and canhave profound psychological and medical consequences upon the individual, family,and society. Some intersexual conditions are the result of inappropriate exposure tohormones during fetal life, while others are due to spontaneous or inherited genemutations. Dysregulation of the gonadal differentiation pathway may play a role ingonadal cancer since ovarian tissue can form in testicular tumours, and testicularcords can form in ovarian tumours. Defining the genes and their interactions duringgonad organogenesis will inform us about the causes and consequences of normaland abnormal sexual development, infertility, and gonadal malignancies.
The gonad is also an ideal model tissue in which to study the process of organo-genesis, since two completely different organs arise from a bipotential primordium.Any errors in development are readily identifiable because of the resulting inter-sexual phenotypes. The process that results in the sexually dimorphic developmentof the gonad is one of the most fundamental, yet surprisingly poorly understood,
300 A.J. Pask and M.B. Renfree
areas of developmental biology. The majority of studies to date on mammalian sexdetermination and differentiation have been carried out in mice. While mice aregreatly amenable to genetic manipulation their embryonic development is complexand extremely rapid. The gonad forms in mice around E10.5 and differentiates intoa testis just 24 h later in XY males. The rapid process of development makes itextremely difficult to dissect the progression and relative expression of genes dur-ing this process. In the tammar wallaby the gonad forms around day 22 of gestationand does not differentiate into a testis until around 6 days later and an ovary around10 days later. Furthermore, both testicular and ovarian differentiation occur afterbirth, making them accessible for experimental manipulations both in vivo and invitro. Studies of the expression and function of sex determining genes in the tam-mar have revealed some exciting findings that expanded our understanding of theirfunction in the sex determination pathway of all mammals.
14.8.1 Localisation and Characterisation of the Testis DeterminingFactor SRY
The SRY (Sex determining region of the Y) gene is the testis determining genein both humans (Sinclair et al., 1990) and mice (Koopman et al., 1991) and islocated on the Y chromosome of most eutherian mammals (Sinclair et al., 1990), andmarsupials (Foster et al., 1992). Although it is poorly conserved with human SRY(around 70% in the HMG box and almost none in the flanking arms), and deletionor mutation analysis is not possible, expression of tammar SRY is consistent witha conserved role as the testis determining factor in marsupials. In the mouse SRYreaches peak levels of expression shortly before testis formation at around E11–11.5(Koopman et al., 1990) and acts as a switch to initiate Sertoli cell differentiation andthe expression of Sox9 and Amh (both critical for male development). In the tammarwallaby SRY was broadly expressed in the developing embryo (Harry et al., 1995),unlike eutherians where it is restricted mainly to the testis. However, these earlystudies examined SRY expression only by PCR, so it is possible that there is a morerestricted expression pattern. In the developing tammar testis, SRY reaches a peak inexpression just before testis cord formation (as in mice and humans) but SOX9 andAMH have a sexually dimorphic expression up to 3 days prior to the SRY peak (AJPask and MB Renfree, unpublished data). This suggests that in the extended devel-opmental timing of the tammar gonad, SRY expression begins to induce a sexuallydimorphic expression before cord formation and the peak in its own expression (AJPask and MB Renfree, unpublished data).
14.8.2 Pouch and Scrotum
Unlike eutherians, not all aspects of marsupial male development depend on forma-tion of a testis as a result of SRY action and the production of androgens. There are atleast four structures that depend on a gene or genes on the X-chromosome, namely
14 Molecular Regulation of Marsupial Reproduction and Development 301
the processus vaginalis, that lines the inguinal canal, the gubernaculum, the ligamentthat directs the testis into the scrotum, the scrotum itself, and the pouch within whichthe mammary primordial develop. On the day of birth, these four structures are sex-ually dimorphic, despite the absence of a differentiated testis, suggesting that theirdifferentiation is directly genetically controlled and independent of testicular hor-mones (O et al., 1988). Taking this further back into the fetal stages, we found thatthe scrotal bulges in males and mammary primordial in females are present on theabdominal wall of the fetus by d22 of the 26.5 day pregnancy in the tammar, a timewhen the gonadal ridge is barely formed. Examination of the intersexual pheno-types of animals with abnormal sex chromosome constitutions led to the conclusionthat a single X chromosome directs the appearance of a scrotum, while two X-chromosomes are correlated with the development of a pouch (Renfree and Short,1988). XXY marsupials have abdominal testes and a penis, but no scrotum, andhave a pouch, while XO marsupials have ovaries, but no pouch and they develop ascrotum (Renfree and Short, 1988). This hormonal independence of sexual dimor-phism is confirmed by treatment of young with exogenous steroids that had effectson the genital tract but did not induce or prevent scrotum, mammary and pouch for-mation (Shaw et al., 1988). The mechanism of this X-dosage is not clear, and analternative that Cooper (1993) suggested is that it could relate to the parent of originof the X chromosome. The most puzzling of all are the intersexes those marsupialsthat are bilateral gynandromorphs, with half a pouch on one side of the body andhalf a scrotum on the other (Sharman et al., 1970, 1990). These examples of sex-ual dimorphisms that are not under the influence of androgens overturned the Jost(1947, 1970) paradigm that a testis, once formed, controlled all sexual dimorphisms.Subsequently, the description of other previously unrecognised sexual dimorphismsthat occur before gonad formation emerged. In eutherian mammals, it was noted thatY bearing blastocysts are larger than XX counterparts in both rat and cattle, further-more there is sexually dimorphic timing of neural tube development in the rat (seeShaw et al., 1990; Burgoyne et al., 1995). Later, a bilateral gynandromorphic birdwas also described with male characteristics on one side and female on the otherdefining plumage and song development in the brain, again suggesting that is alsounder genetic, and not hormonal, control (Arnold, 2009).
14.8.3 X-Linked Genes Involved in Sexual Differentiation
As mentioned above, a disproportionate number of genes involved in sex and repro-duction reside on the eutherian X-chromosome. Many of these have been nowcharacterised in marsupials (Fig. 14.6) and all have provided new insights into theevolution of sex-linked genes.
ATRX: The X-linked alpha-thalassemia and mental retardation gene (ATRX) isessential for normal testicular development in humans. Marsupial have two ortho-logues of this gene, one on the X and the other on the Y. Marsupial ATRX is widelyexpressed as in eutherians, but unlike its eutherian orthologue, it is not expressed in
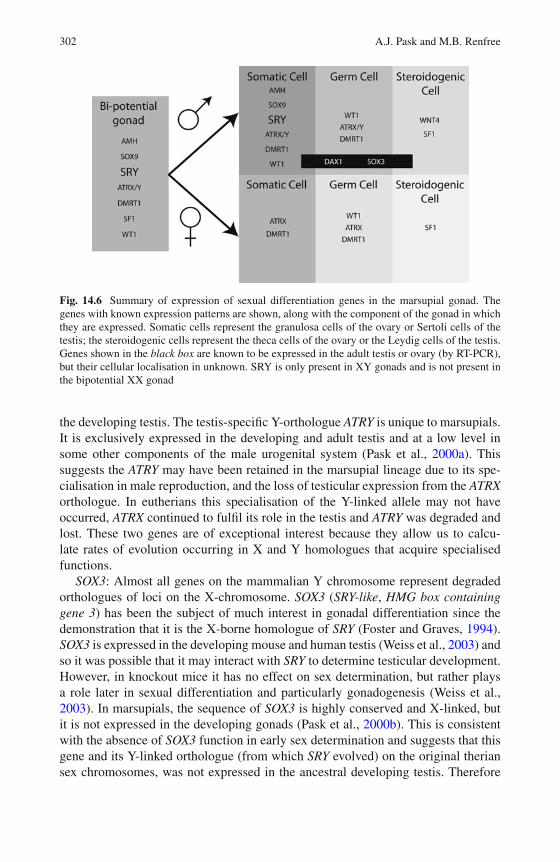
302 A.J. Pask and M.B. Renfree
Fig. 14.6 Summary of expression of sexual differentiation genes in the marsupial gonad. Thegenes with known expression patterns are shown, along with the component of the gonad in whichthey are expressed. Somatic cells represent the granulosa cells of the ovary or Sertoli cells of thetestis; the steroidogenic cells represent the theca cells of the ovary or the Leydig cells of the testis.Genes shown in the black box are known to be expressed in the adult testis or ovary (by RT-PCR),but their cellular localisation in unknown. SRY is only present in XY gonads and is not present inthe bipotential XX gonad
the developing testis. The testis-specific Y-orthologue ATRY is unique to marsupials.It is exclusively expressed in the developing and adult testis and at a low level insome other components of the male urogenital system (Pask et al., 2000a). Thissuggests the ATRY may have been retained in the marsupial lineage due to its spe-cialisation in male reproduction, and the loss of testicular expression from the ATRXorthologue. In eutherians this specialisation of the Y-linked allele may not haveoccurred, ATRX continued to fulfil its role in the testis and ATRY was degraded andlost. These two genes are of exceptional interest because they allow us to calcu-late rates of evolution occurring in X and Y homologues that acquire specialisedfunctions.
SOX3: Almost all genes on the mammalian Y chromosome represent degradedorthologues of loci on the X-chromosome. SOX3 (SRY-like, HMG box containinggene 3) has been the subject of much interest in gonadal differentiation since thedemonstration that it is the X-borne homologue of SRY (Foster and Graves, 1994).SOX3 is expressed in the developing mouse and human testis (Weiss et al., 2003) andso it was possible that it may interact with SRY to determine testicular development.However, in knockout mice it has no effect on sex determination, but rather playsa role later in sexual differentiation and particularly gonadogenesis (Weiss et al.,2003). In marsupials, the sequence of SOX3 is highly conserved and X-linked, butit is not expressed in the developing gonads (Pask et al., 2000b). This is consistentwith the absence of SOX3 function in early sex determination and suggests that thisgene and its Y-linked orthologue (from which SRY evolved) on the original theriansex chromosomes, was not expressed in the ancestral developing testis. Therefore
14 Molecular Regulation of Marsupial Reproduction and Development 303
ATRY, and not SRY, is the earliest known Y-linked gene with conserved expressionin the developing gonad, and could represent an ancestral sex determining gene thatwas later supplanted by SRY, before the marsupial/eutherian divergence.
14.8.4 Autosomal Genes Involved in Sexual Differentiation
The majority of genes critical for gonad development and its subsequent differentia-tion are autosomal in mammals. Again, marsupial sexual differentiation is typicallymammalian, and the genes so far described for eutherian sexual differentiation areessentially the same as in marsupials (Fig. 14.6).
SF1: Steroidogenic factor 1 is critical for the formation of the early gonadalprimordia, and later for gonadal function in both mice and humans (reviewed inParker, 1998). The amino acid sequence of SF1 is highly conserved among verte-brate species, and marsupials are no exception. Tammar SF1 is expressed by bothovaries and testes on the day of birth, just prior to the onset of testicular differen-tiation, and persists until at least 8 days after birth in both sexes. SF1 mRNA ispredominant in the Sertoli cells of the developing testis and the pre-granulosa cellsof the developing ovary, as in mice and humans (Whitworth et al., 2001). In the adultovary SF1 is detected in the steroidogenic corpus luteum, and in the granulosa cellsand theca of small to medium-sized antral follicles, but is absent from large antralfollicles. These findings are consistent with a conserved role for SF1 in both earlygonad formation in marsupials and gonadal development and steroidogenesis.
WT1: Another gene critical for early gonad formation in mammals is Wilmstumor 1 (WT1). WT1 is expressed in the early developing gonad in mouse and isbelieved to be important for initiating SRY transcription in the developing malegonad (Matsuzawa-Watanabe et al., 2003). Wt1 also plays an essential role in mousegerm cell survival (Natoli et al., 2004). Like SF1, WT1 is exceptionally conserved inmarsupials with its eutherian orthologue at both the nucleotide and amino acid level.However, tammar WT1 is predominantly expressed as a novel isoform in which aportion of exon 1 is removed, partially deleting the RNA recognition motif (RRM),believed to be important for WT1 function (Pask et al., 2007). Expression of tam-mar WT1 is similar to mouse and human, and protein is detected in the Sertoli andgranulosa cells of the developing testis and ovary, respectively. In contrast to euthe-rians, WT1 is also localised in the germ cells of both males and females at all stagesof gonadal development, and appears to be dynamically regulated during spermato-genesis and oogenesis. Despite partial absence of the RRM, WT1 is still localisedto RNA rich regions of the tammar oocyte including speckled bodies within thenucleus, in the nucleolus and the perinucleolar compartment (Pask et al., 2007). Theperinucleolar compartment is important for RNA processing and metabolism withinthe cell. The location of WT1 in this region in the tammar suggests that the RRM isnot required for WT1 co-localisation with RNA.
AMH: Anti-Müllerian hormone (AMH), also known as Müllerian inhibiting sub-stance (MIS) is critical for the regression of the female urogenital ducts in thedeveloping male. Müllerian duct regression occurs in utero in eutherian mammals,
304 A.J. Pask and M.B. Renfree
but occurs entirely postnatally in marsupials. The tammar AMH gene is highlyconserved both within the protein coding domain and 5′ promoter sequence. Likeeutherian AMH, the tammar orthologue contains binding sites for SF1, SOX9, andGATA factors but also contains a putative SRY-binding site (Pask et al., 2004). AMHexpression in the developing testis begins shortly after Sertoli cell differentiationand seminiferous cord formation at around 2 days post partum (Hutson et al., 1988;Pask et al., 2004). Müllerian duct regression is first apparent in male pouch youngof the tammar wallaby 6–7 days after birth and, as in eutherian mammals, is char-acterised by a condensation of the periductal mesenchyme into a whorl around theductal epithelial cells (Whitworth et al., 1997) and it is not fully regressed untilaround day 13 pp in males (Renfree et al., 1996). AMH is localized in the cytoplasmof the Sertoli cells in the developing testis, as in mice and humans, and is lost byadulthood. There is no detectable AMH expression in the developing ovary at thetimes examined (days 0–8 pp), but in adults it is produced by the granulosa cells ofprimary and secondary follicles (Pask et al., 2004). This expression pattern is consis-tent with a conserved role for AMH during mammalian evolution and is intimatelylinked to upstream sex determination mechanisms. A similar pattern of expressionoccurs in the brushtailed possum (Juengel et al., 2002). Half of the neonatal pouchyoung examined have AMH mRNA in the neonatal ovary, but it rapidly diminishesand is not seen again until after day 78 pp when follicles first form in the possumovary. AMH mRNA is limited to the granulosa cells once follicles have formed. Inthe possum testis, there is strong expression of AMH in Sertoli cells around the timeof sexual differentiation of the gonad, but expression decreases to very low levels inadult possums (Juengel et al., 2002).
SOX9: SRY-like HMG box containing gene 9 is one of the most critical genesin testicular development in all vertebrates. SRY may do little more than to ensureSOX9 is upregulated in the developing XY gonad. Once activated, SOX9 triggersthe rest of the testicular development pathway. However, SRY could not be the soleregulator, since SOX9 is also upregulated in the developing male gonad of chick-ens, turtles, alligators, and rainbow trout, all species that lack SRY (Oreal et al.,1998; Western et al., 1999; Spotila et al., 1998; Takamatsu et al., 1997). In themouse SOX9 is upregulated by synergistic binding of Sry and Sf1 to a testis specificenhancer element TESCO. Once Sry expression decreases, Sox9 can bind to its ownpromoter and maintain its expression (Sekido and Lovell-Badge, 2008).
The expression of both SF1 and SRY in the tammar is consistent with a similarsynergistic role in upregulating SOX9 (AJ Pask and MB Renfree, unpublished data)and TESCO is conserved in marsupials (Bagheri-Fam et al., 2009). However, inthe tammar SOX9 mRNA levels are sexually dimorphic 4 days before the peak inSRY expression (AJ Pask and MB Renfree, unpublished data). This could reflectthe extended duration of SRY expression in the tammar compared to the 1 dayof expression seen in mouse (Morais de Silva et al., 1996); as a result SOX9upregulation is switched on much earlier in tammar males. Alternatively, it couldreflect a gradual increase to reach threshold levels to effect its action. In the tammargonad, SOX9 expression can be detected in pre-Sertoli cells and then in the matureSertoli cells of the testicular cords throughout development, as in the mouse andhuman (Pask et al., 2002; Hanley et al., 2000; de Santa Barbara et al., 2000).
14 Molecular Regulation of Marsupial Reproduction and Development 305
Tammar SOX9 is also detected in the developing Wolffian duct epithelium in themale mesonephros (Pask et al., 2002). This has not been previously described inother mammals and suggests that SOX9 has additional roles in the differentiationof the marsupial reproductive system.
DMRT1: Doublesex and mab3 related transcript (DMRT1) is one of the mostconserved genes in sexual differentiation, showing homology to both doublesexand mab3 from Drosophila melanogaster and Caenorhabditis elegans respectively(Raymond et al., 1998), and is now known to be the long sought sex determin-ing gene in birds (Smith et al., 2009). In humans DMRT1 maps to 9p24.3, withina region whose deletion is know to cause human sex reversal. In the tammar,DMRT1 is highly conserved at the genetic level and as in eutherian mammals,DMRT1 protein is detected in the germ cells and the Sertoli cells of the develop-ing testis (Pask et al., 2003; Raymond et al., 1999a, 1999b). In the differentiatedtestis, DMRT1 was also detected in the Leydig cells, peri-tubular myoid cells andthe acrosome of the sperm heads. In tammar females, DMRT1 occurs in the fetal andadult ovary in the pre-granulosa, granulosa and germ cells. This report of DMRT1expression in the mature ovary prompted further investigations in mice where it wasalso present in the germ and granulosa cells (Pask et al., 2003). Marsupial investi-gations have therefore helped to uncover a wider role for this gene in mammals inboth testicular and ovarian function.
WNT4: Wingless-type MMTV integration site family, member 4 (WNT4) is akey regulator of early embryogenesis and in the development of the gonadal inboth humans and mice (Vainio et al., 1999). Wnt4 knockout mice have masculinisedgonads (Vainio et al., 1999) and endothelial and steroidogenic cells migrate intothe developing ovary (Jeays-Ward et al., 2003). Over-expression of Wnt4 in thedeveloping testis interferes with testicular vascular development and Sertoli celldifferentiation, demonstrating that Wnt4 has specific and distinct roles in bothmale and female gonadal development (Jordan et al., 2003; Jeays-Ward et al.,2003).
The expression of WNT4 in the tammar gonads supports a dual role for thisgene in testicular and ovary development. In the XX gonad, levels rise during earlydevelopment, reaching a peak during the time the ovary is undergoing differentia-tion and then steadily declines. In males the level of WNT4 decreases and is basalduring the time the testis is differentiating and then steadily rises (Yu et al., 2006).Prior to the tammar wallaby study, WNT4 had not been immuno-localised in thedeveloping gonads of any species. In the tammar, WNT4 protein localised to theLeydig cells of the testis (the site of testosterone production) consistent with a role insteroidogenesis. This suggests WNT4 acts to directly block male steroidogenesis inthe developing ovary. Comparative analyses using tammar WNT4 was also used todefine the core promoter region required for its transcription. Marsupials are partic-ularly useful for promoter analysis in mammals and provide a powerful comparativemodel to mice and humans when looking for conserved and potentially functionalelements. In addition the function of promoters can be examined in primary tam-mar cell lines and even in human cell lines using standard reporter assays (Yu et al.,2009). Using this approach, a highly conserved 89 bp minimal promoter region inboth tammar and human WNT4 was defined. Conserved transcription factor binding
306 A.J. Pask and M.B. Renfree
sites in the proximal promoter were also determined, including sites for SP1, MyoD,NFκB and AP2. Furthermore, there is a highly conserved CpG island within thehuman, mouse and marsupial promoters, indicating that DNA methylation may playan important role in WNT4 transcriptional regulation, explaining the absence of atraditional TATA box from this gene (Yu et al., 2009). Here, comparative tammarstudies were able to provide new information on the transcriptional regulation ofthis essential mammalian developmental gene.
NR0B1: Nuclear receptor subfamily 0, group B, member 1, also known asDAX1; Dosage sensitive sex reversal, adrenal hypoplasia congenita gene on theX-chromosome 1 gene maps to a region of the human X-chromosome that, whenduplicated, causes male to female sex reversal (Zanaria et al., 1994). Nr0b1 appearsto be crucial for testis differentiation by regulating the development of peritubu-lar myoid cells and the formation of intact testis cords (Meeks et al., 2003). Itwas suggested to represent a vestige of an ancestral sex determining mechanismthat was controlled by X-chromosome dosage and not the Y-chromosome or SRY.However, NR0B1 resides in a region of the X-chromosome added recently duringeutherian evolution. Cloning and mapping in the tammar confirmed that NR0B1resides on chromosome 5 alongside many other genes that are on the eutherianX-chromosome (Pask et al., 1997). This suggests that NR0B1 was autosomal in themammalian ancestor, and therefore cannot represent an ancestral sex-determininggene. Furthermore, testicular development can clearly occur normally in marsu-pials in the presence of two active copies of the gene, suggesting NR0B1 onlydeveloped the ability to block normal testis development after its recruitment tothe X-chromosome.
14.8.5 The Effect of Oestrogen on Sex Determination
In the lower vertebrates gonadal sex is primarily determined by the presence ofabsence of oestrogen. Aromatase is produced in the early female (but not the male)gonad causing the production of oestrogen, which drives the formation of the ovary.In the absence of aromatase (and therefore the absence of oestrogen production) atestis develops. The importance of oestrogen in non-mammlaian vertebrate sexualdevelopment was further demonstrated by experimental manipulations. Oestrogenadministration to male embryos, or a block of oestrogen production in femaleembryos, results in sex reversal in almost all cases examined (Ramsey and Crews,2009). In contrast, oestrogen is not needed for early sexual differentiation in mam-mals. Instead, sex is determined by the presence or absence of the SRY gene. Inthe presence of SRY a testis will develop, while ovarian development occurs in itsabsence. Marsupials are a useful tool to examine how or why mammals made aswitch from primarily hormonal control of sex determination.
Mice missing one or both of the oestrogen receptors or the oestrogen synthesiz-ing enzyme aromatase show normal early gonadal development (Couse and Korach,1999). However, in adulthoood the gonads later fail in both male and female mice.The most severely affected is the aromatase knockout mouse. Shortly after birth,
14 Molecular Regulation of Marsupial Reproduction and Development 307
germ cells are lost in the aromatase deficient mouse, and the stromal tissue isremodelled to form cord-like structures that show increased SOX9 and AMH expres-sion, indicative of Sertoli cell development (Britt et al., 2004). Exogenous oestrogenadministered to these animals transdifferentiated the tissue back to an ovarian archi-tecture, and suppressed SOX9 levels (Britt et al., 2004). Thus, while oestrogendeprivation does not affect early sex determination in mice, oestrogen still playsan essential role in maintaining ovarian somatic cell fate.
Marsupials provide a unique developmental system in which to examine theeffect of exogenous oestrogen during early development. As sexual differentiation inmarsupials occurs after birth when the young are readily accessible in the mother’spouch, administration of carefully measured doses can be performed directly on thedeveloping young (Renfree et al., 1995). Daily oral administration of oestradiol-17β to male pouch young can induce ovarian differentiation from an XY gonad andentry of XY germ cells into meiosis (Coveney et al., 2001; Renfree et al., 2001).A similar response is also seen in opossum young painted with estradiol dipropi-onate on the abdomen (Burns, 1955, 1961). This provides a novel model to examinethe effects of early oestrogen administration of the molecular biology of the devel-oping gonads. It is now clear that oestrogen can prevent male specific upregulationof SRY, and as a consequence AMH also fails to upregulate. Interestingly, SOX9mRNA levels are not affected by oestrogen but the protein localisation is criticallyaffected. In the presence of oestrogen, SOX9 is restricted to the cytoplasm of thesomatic cells of the gonad and therefore could not initiate the male developmentalprogram. In the absence of oestrogen, SOX9 rapidly becomes nuclear and initiatestestis development (AJ Pask, N Calatayud, W Wood, G Shaw and MB Renfree,unpublished results).
Thus these sex reversal studies have revealed many similarities with mice andhumans, but also some important differences that can help us better define theprecise function and role of genes in mammalian sexual differentiation pathways.
14.8.6 Androgens and Virilization
A great deal is now known about the endocrine control of sexual differentiationin the postnatal stages of marsupial development (Wilson et al., 2003). Again, thetammar wallaby is perfectly suited for studies of virilisation, since the entire processoccurs postnatally, unlike most eutherian species that show clear virilisation at birth.Each of the key structures and processes – the formation of the Wolffian ducts, theprostate, the phallus and testicular descent – all occur at different post-natal ages,making it possible to examine the hormonal and genetic control of each of theseorgans separately (Renfree et al., 1995).
The tammar androgen receptor protein is similar to that of other mammals. Itis expressed in the fetal gonad and brain as early as Day 19 of the 26.5-day ges-tation, 7 days earlier than the first rise in testicular testosterone (Butler et al.,1998). Immunoreactive AR is detected in all the developing male tissues exceptthe scrotum, and in the female urogenital sinus tissues. Similarly, AR is present in
308 A.J. Pask and M.B. Renfree
the vas deferens, gubernaculum, testis, inguinal and scrotal areas, in the urogenitalsinus and in the genital tubercle of the grey short tailed opossum (Sonea et al., 1997),although Russell et al. (2003) report that androgen receptor immunoreactivity canbe detected in the scrotal anlagen of male opossum pups as early as 1 day followingbirth.
However, despite the importance of AR, it is not the initiating signal for viril-ization of the marsupial male (Butler et al., 1998) and the signal does not appear tobe testosterone. This enigma was solved by a detailed study of androgen control ofvirilisation in the tammar which uncovered a new, alternate pathway of androgenbiosynthesis that forms dihydrotestosterone (DHT), and in which the potent andro-gen androstanediol (adiol) is the key circulating androgen in the developing younginstead of testosterone (Wilson et al., 2003). Androstanediol is back-converted toDHT in the target tissues, and then binds to the androgen receptor (Shaw et al.,2000). This is the first new pathway of steroid hormone biosynthesis described inthe last 50 years. This alternate pathway also functions in the mouse (Mahendrooet al., 2004; Wilson et al., 2005) and explains some rare cases of virilization seen ingirls with P450 oxidoreductase deficiency and congenital adrenal hyperplasia (Arltet al., 2004; Homma et al., 2006). Investigations are now underway to characterizethe expression profiles of androgen biosynthesis enzyme production during thesecritical stages of virilisation during development of the tammar pouch young.
14.9 Conclusions
Marsupials form a unique class of mammals that are especially valuable for studiesof mammalian developmental biology. Their unique reproductive strategy providesaccess to young at developmental stages that occur entirely in utero in eutherianmammals. By exploiting this unique situation, we and others have provided newinformation about the processes of sex determination and sexual differentiation inall mammals. Such investigations have helped identify the sex-determining geneSRY, uncover novel roles for genes in mammalian sexual development, determinethe ancestry of key developmental genes and shed further light on pathways of dif-ferentiation in humans. The evolutionary position of marsupials makes comparisonsof gene and promoter structure exceptionally powerful and they will continue to playa critical role in defining key regulatory elements for mammalian gene function.
References
Alcorn GT, Robinson ES (1983) Germ cell development in female pouch young of the tammarwallaby (Macropus eugenii). J Reprod Fertil 67:319–325.
Ambrosetti DC, Basilico C, Dailey L (1997) Synergistic activation of the fibroblast growth factor 4enhancer by Sox2 and Oct-3 depends on protein-protein interactions facilitated by a specificspatial arrangement of factor binding sites. Mol Cell Biol 17:6321–6329.
Anderson R, Copeland TK, Scholer H, Heasman J, Wylie C (2000) The onset of germ cellmigration in the mouse embryo. Mech Dev 91:61–68.
14 Molecular Regulation of Marsupial Reproduction and Development 309
Arlt W, Walker EA, Draper N, et al. (2004) Congenital adrenal hyperplasia caused bymutant P450 oxidoreductase and human androgen synthesis: analytical study. Lancet 363:2128–2135.
Arnold AP (2009) The organizational-activational hypothesis as the foundation for a unified theoryof sexual differentiation of all mammalian tissues. Horm Behav 55:570–578.
Au PC, Whitley J, Vaux D, Selwood L, Familari M (2008) Identification of novel and knownovary-specific genes including ZP2, in a marsupial, the stripe-faced dunnart. Mol Reprod Dev75:318–325.
Bagheri-Fam S, Sinclair AH, Koopman P, Harley VR (2009) Conserved regulatory modules inthe Sox9 testis-specific enhancer predict roles for SOX TCF/LEF Forkhead DMRT and GATAproteins in vertebrate sex determination. Int J Biochem Cell Biol 42:472–477.
Bedford JM, Breed WG (1994) Regulated storage and subsequent transformation of spermato-zoa in the fallopian tubes of an Australian marsupial Sminthopsis crassicaudata. Biol Reprod50:845–854.
Belov K, Harrison GA, Cooper DW (1998) Cloning of the red kangaroo (Macropus rufus) folliclestimulating hormone beta subunit. Reprod Fertil Dev 10:289–291.
Bowles J, Knight D, Smith C, et al. (2006) Retinoid signaling determines germ cell fate in mice.Science 312:596–600.
Braundmeier AG, Breed WG, Miller DJ (2008) Spermatozoa from a marsupial the brushtailpossum contain beta14-galactosyltransferase. Reprod Fertil Dev 20:402–407.
Britt KL, Stanton PG, Misso M, Simpson ER, Findlay JK (2004) The effects of estrogen onthe expression of genes underlying the differentiation of somatic cells in the murine gonad.Endocrinology 145:3950–3960.
Brown PR, Miki K, Harper DB, Eddy EM (2003) A-kinase anchoring protein 4 binding proteinsin the fibrous sheath of the sperm flagellum. Biology Reprod 68:2241–2248.
Burgoyne PS, Thornhill AR, Boudrean SK, Darling SM, Bishop CE, Evans EP (1995) The geneticbasis of XX–XY differences present before gonadal sex differentiation in the mouse Philos.Trans R Soc Lond B Biol Sci 350:253–260.
Burns RK (1955) Experimental reversal of sex in the gonads of the opossum Didelphis virginiana.PNAS 41:669–676.
Burns RK (1961) Role of hormones in the differentiation of sex. In: Young WC (eds) Sex andInternal Secretions, Vol 1. Williams and Wilkins, Baltimore, pp. 76–158.
Butler CM, Harry JL, Deakin JE, Cooper DW, Renfree MB (1998) Developmental expression ofthe androgen receptor during virilization of the urogenital system of a marsupial. Biol Reprod59:725–732.
Calatayud NE, Pask AJ, Shaw G, Renfree MB (2010) Oestrogen receptors ERα and ERb in thetammar wallaby. Reproduction 139:599–611.
Carrera A, Gerton GL, Moss SB (1994) The major fibrous sheath polypeptide of mouse sperm:structural and functional similarities to the A-kinase anchoring proteins. Dev Biol 165:272–284.
Carrera A, Moos J, Ning XP, et al. (1996) Regulation of protein tyrosine phosphorylation in humansperm by a calcium/calmodulin-dependent mechanism: identification of A kinase anchorproteins as major substrates for tyrosine phosphorylation. Dev Biol 180:284–296.
Chambers I, Colby D, Robertson M, et al. (2003) Functional expression cloning of Nanog, apluripotency sustaining factor in embryonic stem cells. Cell 113:643–655.
Chawengsaksophak K, de Graaff W, Rossant J, Deschamps J, Beck F (2004) Cdx2 is essential foraxial elongation in mouse development. Proc Natl Acad Sci USA 101:7641–7645.
Cheung TC, Hearn JP (2002) Molecular cloning and tissue expression of the gonadotrophin-releasing hormone receptor in the tammar wallaby (Macropus eugenii). Reprod Fertil Dev14:157–164.
Cheung TC, Hearn JP (2003) Developmental expression and subcellular localization of wal-laby gonadotropin-releasing hormone receptor and its splice variants. Gen Comp Endocrinol133:88–99.
310 A.J. Pask and M.B. Renfree
Cheung TC, Hearn JP (2005) Dimerizations of the wallaby gonadotropin-releasing hormonereceptor and its splice variants. Gen Comp Endocrinol 144:280–288.
Colledge M, Scott JD (1999) AKAPs: from structure to function. Trends Cell Biol 9:216–221.Cooper DW (1993) The evolution of sex determination sex chromosome dimorphism and
X-inactivation in Therian mammals: a comparison of metatherians (marsupials) and eutheri-ans (‘placentals’). In: Reed KC Graves JAM (eds) Sex Chromosomes and Sex DeterminingGenes. Harwood Academic Publishers, GmbH Chur, Switzerland.
Couse JF, Korach KS (1999) Estrogen receptor null mice: what have we learned and where willthey lead us? Endocr Rev 20:358–417.
Coveney D, Shaw G, Renfree MB (2001) Estrogen-induced gonadal sex reversal in the tammarwallaby. Biol Reprod 65:613–621.
Crawford JL, Heath DA, Haydon LJ, Thomson BP, Eckery DC (2009) Gene expression andsecretion of LH and FSH in relation to gene expression of GnRH receptors in the brushtailpossum (Trichosurus vulpecula) demonstrates highly conserved mechanisms. Reproduction137:129–140.
Cui S, Selwood L (2000) cDNA cloning characterization expression and recombinant proteinproduction of leukemia inhibitory factor (LIF) from the marsupial the brushtail possum(Trichosurus vulpecula). Gene 243:167–178.
Cui S, Selwood L (2003) Cloning and expression of a novel cDNA encoding shell coat protein cp4from the brushtail possum (Trichosurus vulpecula). Mol Reprod Dev 65:141–147.
Cui S, Nikolovski S, Nanayakkara K, Selwood L (2005) VAP1 with cystatin C motif an oocyteprotein encoded by a novel ovarian-specific gene during oogenesis in the common brushtailpossum (Trichosurus vulpecula). Mol Reprod Dev 71:19–28.
Cummins JM (1980) Decondensation of sperm nuclei of Australian marsupials: effects of airdrying and of calcium and magnesium. Gamete Res 3:351–367.
Curlewis JD, Saunders MC, Kuang J, Harrison GA, Cooper DW (1998) Cloning and sequenceanalysis of a pituitary prolactin cDNA from the brushtail possum (Trichosurus vulpecula). GenComp Endocrinol 111:61–67.
de Santa Barbara P, Moniot B, Poulat F, Berta P (2000) Expression and subcellular localisationof SF1 SOX9 WT1 and AMH proteins during early human testicular development. Dev Dyn217:293–298.
Denker HW, Tyndale-Biscoe CH (1986) Embryo implantation and proteinase activities in a mar-supial (Macropus eugenii). Histochemical patterns of proteinases in various gestational stages.Cell Tissue Res 246:279–291.
Eckery DC, Lawrence SB, Juengel JL, Greenwood P, McNatty KP, Fidler AE (2002a) Gene expres-sion of the tyrosine kinase receptor c-kit during ovarian development in the brushtail possum(Trichosurus vulpecula). Biol Reprod 66:346–353.
Eckery DC, Lun S, Thomson BP, Chie WN, Moore LG, Juengel JL (2002b) Ovarian expression ofmessenger RNA encoding the receptors for luteinizing hormone and follicle-stimulating hor-mone in a marsupial the brushtail possum (Trichosurus vulpecula). Biol Reprod 66: 1310–1317.
Eckery DC, Whale LJ, Lawrence SB, Wylde KA, McNatty KP, Juengel JL (2002c) Expressionof mRNA encoding growth differentiation factor 9 and bone morphogenetic protein 15 duringfollicular formation and growth in a marsupial the brushtail possum (Trichosurus vulpecula).Mol Cell Endocrinol 192:115–126.
Eddy EM, Toshimori K, O’Brien DA (2003) Fibrous sheath of mammalian spermatozoa. MicroscRes Tech 61:103–115.
Edwards AS, Scott JD (2000) A-kinase anchoring proteins: protein kinase A and beyond. CurrOpin Cell Biol 12:217–221.
Fidler AE, Lawrence SB, Vanmontfort DM, Tisdall DJ, McNatty KP (1998) The Australian brush-tail possum (Trichosurus vulpecula) gonadotrophin alpha-subunit: analysis of cDNA sequenceand pattern of expression. J Mol Endocrinol 20:345–353.
Fletcher TP, Renfree MB (1988) Effects of corpus luteum removal on progesterone estradiol-17beta and LH in early pregnancy of the tammar wallaby Macropus eugenii. J Reprod Fertil83:185–191.
14 Molecular Regulation of Marsupial Reproduction and Development 311
Foster JW, Brennan FE, Hampikian GK, Goodfellow PN, Sinclair AH, Lovell-Badge R, SelwoodL, Renfree MB, Cooper DW, Graves JA (1992) Evolution of sex determination and the Ychromosome: SRY-related sequences in marsupials. Nature 359:531–533.
Foster JW, Graves JAM (1994) An SRY-related sequence on the marsupial X chromosome: impli-cations for the evolution of the mammalian testis-determining gene. Proc Natl Acad Sci USA91:1927–1931.
Frankenberg S, Tisdall D, Selwood L (2001) Identification of a homologue of POU5F1 (OCT3/4)in a marsupial the brushtail possum. Mol Reprod Dev 58:255–261.
Frankenberg S, Pask AJ, Renfree MB (2010) The evolution of class V POU domain transcrip-tion factors in vertebrates and their characterisation in a marsupial Developmental Biology337:162–170.
Freyer C, Renfree MB (2009) The mammalian yolk sac placenta. J Exp Zool B Mol Dev Evol312:545–554.
Freyer C, Zeller U, Renfree MB (2003) The marsupial placenta: a phylogenetic analysis. J ExpZool A Comp Exp Biol 299:59–77.
Fulcher KD, Mori C, Welch JE, O’Brien DA, Klapper DG, Eddy EM (1995) Characterization ofFsc1 cDNA for a mouse sperm fibrous sheath component. Biol Reprod 52:41–49.
Hamatani T, Daikoku T, Wang H, et al. (2004) Global gene expression analysis identifies molec-ular pathways distinguishing blastocyst dormancy and activation. Proc Natl Acad Sci USA101:10326–10331.
Hanley NA, Hagan DM, Clement-Jones M, et al. (2000) SRY SOX9 and DAX1 expression patternsduring human sex determination and gonadal development. Mech Dev 91: 403–407.
Harris MS, Rodger JC (2005) Characterisation of an epitope shared by an acrosomal acrosin-likeprotein and the surface of tammar wallaby (Macropus eugenii) spermatozoa. J Exp Zool AComp Exp Biol 303:713–721.
Harrison GA, Deane EM, Cooper DW (1998) cDNA cloning of luteinizing hormone subunits frombrushtail possum and red kangaroo. Mamm Genome 9:638–642.
Harry JL, Koopman P, Brennan FE, Graves JAM, Renfree MB (1995) Widespread expression ofthe testis determining gene SRY in a marsupial. Nat Genet 11:347–349.
Haydon LJ, Juengel JL, Thomson BP, Eckery DC (2008) Expression of mRNAs encoding oestro-gen receptor (ER) alpha and ERbeta, androgen receptor and progesterone receptor duringgonadal and follicular development in the marsupial brushtail possum (Trichosurus vulpecula).Fertil Dev 20:335–349.
Heap RB, Renfree MB, Burton RD (1980) Steroid metabolism in the yolk sac placenta andendometrium of the tammar wallaby, Macropus eugenii. J Endocrinol 87:339–349.
Homma K, Hasegawa T, Nagai T, et al. (2006) Urine steroid hormone profile analysis incytochrome P450 oxidoreductase deficiency: implication for the backdoor pathway to dihy-drotestosterone. J Clin Endocrinol Metab 91:2643–2649.
Hondo E, Stewart CL (2005) Profiling gene expression in growth-arrested mouse embryos indiapause. Genome Biol 6:202.
Hu Y, Yu H, Pask AJ, O’Brien DA, Shaw G, Renfree MB (2009) A-kinase anchoring protein 4 hasa conserved role in mammalian spermatogenesis. Reproduction 137:645–653.
Hughes RL, Hall LS (1988) Structural adaptations of the newborn marsupial. In: Tyndale-BiscoeCH Janssens PA (eds) The Developing Marsupial. Springer, Berlin, pp. 8–27.
Hutson JM, Shaw G, O WS, Short RV, Renfree MB (1988) The ontogeny of Mullerian inhibitingsubstance production and testicular differentiation migration and descent in the pouch youngof a marsupial. Development 104:549–556.
Ingram JN, Shaw G, Renfree MB (1999) Cortisol in fetal fluids and the fetal adrenal at parturitionin the tammar wallaby (Macropus eugenii). Biol Reprod 60:651–655.
Jeays-Ward K, Hoyle C, Brennan J, et al. (2003) Endothelial and steroidogenic cell migration areregulated by WNT4 in the developing mammalian gonad. Development 130:3663–3670.
Jiang FX, Clark J, Renfree MB (1997) Ultrastructural characteristics of primordial germ cellsand their amoeboid movement to the gonadal ridges in the tammar wallaby. Anat Embryol195:473–481.
312 A.J. Pask and M.B. Renfree
Jordan BK, Shen JH, Olaso R, Ingraham HA, Vilain E (2003) Wnt4 over-expression disrupts nor-mal testicular vasculature and inhibits testosterone synthesis by repressing steroidogenic factor1/ beta-catenin synergy. Proc Natl Acad Sci USA 100:10866–10871.
Jost A (1947) Recherches sur la differenciation sexuelle de l’embryon de lapin. J Arch AnatMicrosc Morphol Exp 36:117–121.
Jost A (1970) Hormonal factors in the sex differentiation of the mammalian foetus. Philos Trans RSoc Lond B Biol Sci 259:119–130.
Juengel JL, Whale LJ, Wylde KA, Greenwood P, McNatty KP, Eckery DC (2002) Expressionof anti-Müllerian hormone mRNA during gonadal and follicular development in the brushtailpossum (Trichosurus vulpecula). Reprod Fertil Dev 14:345–353.
Khil PP, Smirnova NA, Romanienko PJ, Camerini-Otero RD (2004) The mouse X chromosome isenriched for sex-biased genes not subject to selection by meiotic sex chromosome inactivation.Nat Genet 36:642–646.
Koopman P, Münsterberg A, Capel B, Vivian N, Lovell-Badge R (1990) Expression of a candidatesex-determining gene during mouse testis differentiation. Nature 348:450–452.
Koopman P, Gubbay J, Vivian N, Goodfellow P, Lovell-Badge R (1991) Male development ofchromosomal female mice transgenic for SRY. Nature 351:117–121.
Koubova J, Menke DB, Zhou Q, Capel B, Griswold MD, Page DC (2006) Retinoic acid regulatessex-specific timing of meiotic initiation in mice. Proc Natl Acad Sci USA 103:2474–2479.
Kunath T, Strumpf D, Rossant J (2004) Early trophoblast determination and stem cell maintenancein the mouse–a review. Placenta 25:S32–S38.
Kwek JHL, De Iongh R, Digby MR, Renfree MB, Nicholas KR, Familari M (2009) Cross-fosteringof the tammar wallaby (Macropus eugenii) pouch young accelerates fore-stomach maturation.MOD 126:449–463.
Leatherland JF, Renfree MB (1983) Structure of the pars distalis in pouch-young tammar wallabies(Macropus eugenii). Cell Tissue Res 230:587–603.
Lin M, Harman A, Rodger JC (1997) Spermiogenesis and spermiation in a marsupial the tammarwallaby (Macropus eugenii). J Anat 190:377–395.
Lin M, Rodger JC (1999) Acrosome formation during sperm transit through the epididymis intwo marsupials the tammar wallaby (Macropus eugenii) and the brushtail possum (Trichosurusvulpecula). J Anat 194:223–232.
Liu L, Leaman D, Villalta M, Roberts RM (1997) Silencing of the gene for the alpha-subunit ofhuman chorionic gonadotropin by the embryonic transcription factor Oct-3/4. Mol Endocrinol11:1651–1658.
Lumbers ER, Menzies RI, Gibson KJ, Tyndale-Biscoe CH (1994) Levels of active and inactivereninlike enzymes in plasma and reproductive tract of the pregnant wallaby. Am J Physiol266:R1353–R1358.
Mahendroo M, Wilson JD, Richardson JA, Auchus RJ (2004) Steroid 5alpha-reductase 1 promotes5alpha-androstane-3alpha17beta-diol synthesis in immature mouse testes by two pathways.Mol Cell Endocrinol 222:113–120.
Mate KE, McCartney CA (1998) Sequence and analysis of zona pellucida 2 cDNA (ZP2) from amarsupial the brushtail possum Trichosurus vulpecula. Mol Reprod Dev 51:322–329.
Mate KE, Rodger JC (1991) Stability of the acrosome of the brush-tailed possum (Trichosurusvulpecula) and tammar wallaby (Macropus eugenii) in vitro and after exposure to conditionsand agents known to cause capacitation or acrosome reaction of eutherian spermatozoa.J Reprod Fertil 91:41–48.
Mate KE, Buist JM, Duckworth JA (2003) Expression in Escherichia coli and immunologicalcharacterization of three zona pellucida proteins (ZP1 ZP2 and ZP3) from a marsupial thebrushtail possum (Trichosurus vulpecula). Mol Reprod Dev 64:136–143.
Matsuzawa-Watanabe Y, Inoue J, Semba K (2003) Transcriptional activity of testis-determiningfactor SRY is modulated by the Wilms’ tumor 1 gene product WT1. Oncogene 22:7900–7904.
Mattiske D, Pask AJ, Shaw JM, Shaw G (2002) Structure and expression of the follicle-stimulatinghormone receptor gene in a marsupial Macropus eugenii. Mol Reprod Dev 63:24–31.
14 Molecular Regulation of Marsupial Reproduction and Development 313
McCartney CA, Mate KE (1999) Cloning and characterisation of a zona pellucida 3 cDNA from amarsupial the brushtail possum Trichosurus vulpecular. Zygote 7:1–9.
McLaren A (1981) The fate of germ cells in the testis of fetal Sex-reversed mice. J Reprod Fertil61:461–467.
McLaren A (2003) Primordial germ cells in mice. Dev Biol 262:1–15.Meeks JJ, Crawford SE, Russell TA, Morohashi K, Weiss J, Jameson JL (2003) Dax1 regulates
testis cord organization during gonadal differentiation. Development 130:1029–1036.Menkhorst E, Selwood L, Cui S (2009) Uterine expression of cp4 gene homolog in the Stripe-faced
Dunnart Sminthopsis macroura: relationship with conceptus development and progesteroneprofile. Mol Reprod Dev 76:863–872.
Menzies BR, Shaw G, Fletcher TP, Renfree MB (2007) Perturbed growth and developmentin marsupial young after reciprocal cross-fostering between species. Reprod Fertil Dev 19:976–983.
Menzies BR, Shaw G, Fletcher TP, Pask AJ, Renfree MB (2008) Exon 3 of the growth hormonereceptor (GH-R) is specific to eutherian mammals. Mol Cell Endocrinol 296:64–68.
Menzies BR, Shaw G, Fletcher TP, Renfree MB (2009) Early onset of ghrelin production in amarsupial. Mol Cell Endocrinol 299:266–273.
Miki K, Willis WD, Brown PR, Goulding EH, Fulcher KD, Eddy EM (2002) Targeted disruptionof the Akap4 gene causes defects in sperm flagellum and motility. Dev Biol 248:331–342.
Mitsui K, Tokuzawa Y, Itoh H, et al. (2003) The homeoprotein Nanog is required for maintenanceof pluripotency in mouse epiblast and ES cells. Cell 113:631–642.
Morais da Silva S, Hacker A, Harley V, et al. (1996) SOX9 expression during gonadal developmentimplies a conserved role for the gene in Sertoli cell differentiation in mammals and birds. NatGenet 14:62–68.
Nation A, Cui S, Selwood L (2008) Vesicle-associated protein 1: a novel ovarian immuno-contraceptive target in the common brushtail possum Trichosurus vulpecula. Reproduction136:657–665.
Natoli TA, Alberta JA, Bortvin A, et al. (2004) Wt1 functions in the development of germ cells inaddition to somatic cell lineages of the testis. Dev Biol 268:429–440.
O WS, Short RV, Renfree MB, Shaw G (1988) Primary genetic control of somatic sexualdifferentiation in a mammal. Nature 332:716–717.
Ohno S (1967) Sex Chromosomes and Sex Linked Genes. Springer, Berlin.Oreal E, Pieau C, Mattei M, Picard J, Carre-eusebe D, Magre S (1998) MIS in chicken embryonic
gonads precedes testicular SOX9 expression. Dev Dyn 21:522–532.Parker KL (1998) The roles of steroidogenic factor 1 in endocrine development and function. Mol
Cell Endocrinol 140:59–63.Pask A, Renfree MB, Graves JAM (2000a) The human sex reversing ATRX gene has a homo-
logue on the marsupial Y chromosome ATRY: implications for the evolution of mammaliansex determination. Proc Natl Acad Sci USA 97:13198–13202.
Pask A, Harry JL, Renfree MB, Graves JAM (2000b) Genesis 27:145–152.Pask A, Toder R, Wilcox SA, Camerino G, Graves JAM (1997) The candidate sex-reversing
DAX1 gene is autosomal in marsupials: implications for the evolution of sex determinationin mammals. Genomics 41:422–426.
Pask AJ, Harry JL, Graves JAM, et al. (2002) SOX9 has both conserved and novel roles inmarsupial sexual differentiation. Genesis 33:131–139.
Pask AJ, Behringer RR, Renfree MB (2003) Expression of DMRT1 in the mammalian ovary andtestis – from marsupials to mice. Cytogenet Genome Res 101:229–236.
Pask AJ, Whitworth DJ, Mao C-A, et al. (2004) Marsupial anti-Müllerian hormone gene structureregulatory elements and expression. Biol Reprod 70:160–167.
Pask AJ, Paplinska JZ, Shaw G, Graves JAM, Renfree MB (2007) Marsupial WT1 has a novelisoform and is expressed in both somatic and germ cells in the developing ovary and testis. SexDev 1:169–180.
314 A.J. Pask and M.B. Renfree
Ramsey M, Crews D (2009) Steroid signaling and temperature-dependent sex determination-Reviewing the evidence for early action of estrogen during ovarian determination in turtles.Semin Cell Dev Biol 20:283–292.
Raymond CS, Shamu CE, Shen MM, et al. (1998) Evidence for evolutionary conservation of sex-determining genes. Nature 391:691–695.
Raymond CS, Parker ED, Kettlewell JR (1999a) A region of human chromosome 9p required fortestis development contains two genes related to known sexual regulators. Hum molec Genet8:989–996.
Raymond CS, Kettlewell JR, Hirsch B, Bardwell VJ, Zarkower D (1999b) Expression of Dmrt1in the genital ridge of mouse and chicken embryos suggests a role in vertebrate sexualdevelopment. Dev Biol 215:208–220.
Renfree MB (1973) The composition of fetal fluids of the marsupial Macropus eugenii. Dev Biol33:62–79.
Renfree MB (1981) Marsupials: alternative mammals. Nature 293:100–101.Renfree MB (1983) Marsupial reproduction: the choice between placentation and lactation. In:
Finn CA (ed) Oxford Reviews of Reproductive Biology, Vol 5. Oxford University Press,New York, pp. 1–29.
Renfree MB (1992) The role of genes and hormones in marsupial sexual differentiation. J ZoolLond 226:165–173.
Renfree MB (1993) Ontogeny genetic control and phylogeny of female reproduction in monotremeand therian mammals. In: Szalay FS Novacek JJ McKenna MC (eds) Mammal Phylogeny.Springer, New York, pp. 4–20.
Renfree MB, Lewis AM (1996) Cleavage in vivo and in vitro in the marsupial Macropus eugenii.Reprod Fertil Dev 8:725–742.
Renfree MB, Short RV (1988) Sex determination in marsupials: evidence for a marsupial-eutheriandichotomy. Phil Trans R Soc Lond B 322:41–54.
Renfree MB, Tyndale-Biscoe CH (1973) Intrauterine development after diapause in the marsupialMacropus eugenii. Devl Biol 32:28–40.
Renfree MB, Tyndale-Biscoe CH (1978) Manipulation of marsupial embryos and pouchyoung. In: Daniel JC (ed) Methods of Mammalian Reproduction, Academic Press, pp.307–331.
Renfree MB, Flint AP, Green SW, Heap RB (1984) Ovarian steroid metabolism and oestrogens inthe corpus luteum of the tammar wallaby. J Endocrinol 101:231–240.
Renfree MB, Harry JL, Shaw G (1995) The marsupial male: a role model for sexual development.Phil Trans R Soc Lond B 350:243–251.
Renfree MB, O WS, Short RV, Shaw G (1996) Sexual differentiation of the urogenitalsystem of the fetal and neonatal tammar wallaby Macropus eugenii. Anat Embryol 194:111–134.
Renfree MB, Coveney D, Shaw G (2001) The influence of estrogen on the developing malemarsupial. Reprod Fertil Dev 13:231–240.
Ricci M, Breed WG (2005) Morphogenesis of the fibrous sheath in the marsupial spermatozoon.J Anat 207:155–164.
Russell AJ, Gilmore DP, Mackay S, Ullmann SL, Baker PJ, Payne AP (2003) The role of andro-gens in development of the scrotum of the grey short-tailed Brazilian opossum (Monodelphisdomestica). Anat Embryol (Berl) 206:381–389.
Schöler HR, Dressler GR, Balling R, Rohdewohld R, Gruss P (1990) Oct-4: a germline-specifictranscription factor mapping to the mouse t-complex. EMBO J 9:2185–2195.
Sekido R, Lovell-Badge R (2008) Sex determination involves synergistic action of SRY and SF1on a specific Sox9 enhancer. Nature 453:930–9344.
Selwood L (1986) Cleavage in vitro following destruction of some blastomeres in the marsupialAntechinus stuartii (Macleay). J Embryol Exp Morphol 92:71–84.
Selwood L (1992) Mechanisms underlying the development of pattern in marsupial embryos. CurrTop Dev Biol 27:175–233.
14 Molecular Regulation of Marsupial Reproduction and Development 315
Selwood L (2000) Mechanisms for pattern formation leading to axis formation and lineageallocation in mammals: a marsupial perspective. Reproduction 121:677–683.
Selwood L, Robinson ES, Pedersen RA, Vandeberg JL (1997) Development in vitro of Marsupials:a comparative review of species and a timetable of cleavage and early blastocyst stages ofdevelopment in Monodelphis domestica. Int J Dev Biol 41:397–410.
Setchell BBP (1977) Reproduction in male marsupials. In: Stonehouse B Gilmorepp D (eds) TheBiology of Marsupials. Macmillan, London, pp. 411–457.
Sharman GB, Robinson ES, Walton SM, Berger RJ (1970) Sex chromosomes and reproductiveanatomy of some intersexual marsupials. J Reprod Fertil 21:57–68.
Sharman GB, Hughes RL, Cooper DW (1990) The chromosomal basis of sex differentiation inmarsupials. Aust J Zool 37:443–450.
Shaw G, Renfree MB, Short RV, O WS (1988) Experimental manipulation of sexual differentiationin wallaby pouch young treated with exogenous steroids. Development 104:689–701.
Shaw G, Renfree MB, Short RV (1990) Primary genetic control of sexual differentiation inmarsupials. Aust J Zool 37:443–450.
Shaw G, Gehring HM, Bell EC (1999) Production of prostaglandin f2alpha and its metabolite byendometrium and yolk sac placenta in late gestation in the tammar wallaby Macropus Eugenii.Biol Reprod 60:611–614.
Shaw G, Renfree MB, Leihy MW, Shackleton CHL, Roitman E, Wilson JD (2000) Prostate for-mation in a marsupial is mediated by the testicular androgen 5α-androstane-3α, 17β-diol. ProcNatl Acad Sci USA 97:12256–12259.
Short RV (2003) The magic and mystery of the oocyte: ex ovo omnia. In: Trounson AO GosdenRG (eds) The Biology and Pathology of the Oocyte. Cambridge University Press, New York.
Sidhu KS, Mate KE, Molinia FC, Rodger JC (1999) Induction of thumbtack sperm during cocul-ture with oviduct epithelial cell monolayers in a marsupial the brushtail possum (Trichosurusvulpecula). Biol Reprod 61:1356–1361.
Sidhu KS, Mate KE, Gunasekera T, et al. (2004) A flow cytometric assay for global estimationof tyrosine phosphorylation associated with capacitation of spermatozoa from two marsu-pial species the tammar wallaby (Macropus eugenii) and the brushtail possum (Trichosurusvulpecula). Reproduction 127:95–103.
Sinclair AH, Berta P, Palmer MS, et al. (1990) A gene from the human sex-determining regionencodes a protein with homology to a conserved DNA binding motif. Nature 346:240–244.
Sistina Y, Lin M, Mate KE, Robinson ES, Rodger JC (1993) The unique stability of the marsupialsperm acrosomal membranes examined by unprotected freeze-thawing and treatment with thedetergent Triton X-100. Reprod Fertil Dev 5:1–14.
Smith CA, Roeszler KN, Ohnesorg T, et al. (2009) The avian Z-linked gene DMRT1 is requiredfor male sex determination in the chicken. Nature 461:267–271.
Smith KK (2006) Craniofacial development in marsupial mammals: developmental origins ofevolutionary change. Dev Dyn 235:1181–1193.
Sonea IM, Iqbal J, Prins GS, Jacobson CD (1997) Ontogeny of androgen receptor-likeimmunoreactivity in the reproductive tract of male Monodelphis domestica. Biol Reprod 56:852–860.
Spotila L, Spotila JR, Hall SE (1998) Sequence and expression analysis of WT-1 and SOX9 in thered-eared slider turtle Trachemys scripta. J Exp Zool 281:417–427.
Takamatsu N, Kanda H, Ito M, Yamashita A, Yamashita S, Shiba T (1997) Rainbow trout SOX9:cDNA cloning gene structure and expression. Gene 202:167–170.
Tanaka SS, Yamaguchi YL, Tsoi B, Lickert H, Tam PP (2005) IFITM/Mil/fragilis family proteinsIFITM1 and IFITM3 play distinct roles in mouse primordial germ cell homing and repulsion.Dev Cell 9:745–756.
Temple-Smith PD (1994) Comparative structure and function of marsupial spermatozoa. ReprodFertil Dev 6:421–435.
Temple-Smith PD, Bedford JM (1976) The features of sperm maturation in the epididymis of amarsupial the brushtailed possum Trichosurus vulpecula. Am J Anat 147:471–499.
316 A.J. Pask and M.B. Renfree
Trott JF, Simpson KJ, Moyle RL, et al. (2003) Maternal regulation of milk composition milkproduction and pouch young development during lactation in the tammar wallaby (Macropuseugenii). Biol Reprod 68:929–936.
Turner RM, Johnson LR, Haig-Ladewig L, Gerton GL, Moss SB (1998) An X-linked geneencodes a major human sperm fibrous sheath protein hAKAP82 Genomic organization pro-tein kinase A-RII binding and distribution of the precursor in the sperm tail. J Biol Chem 273:32135–32141.
Tyndale-Biscoe CH, Janssens PA (eds) (1988) The Developing Marsupial. Models for BiomedicalResearch. Springer, Berlin.
Tyndale-Biscoe H, Renfree M (1987) Reproductive Physiology of Marsupials. CambridgeUniversity Press, Cambridge, 476 pp.
Ullmann SL, Shaw G, Alcorn GT, Renfree MB (1997) Migration of primordial germ cells tothe developing gonadal ridges in the tammar wallaby Macropus eugenii. J Reprod Fertil 110:135–143.
Vainio S, Heikkila M, Kispert A, Chin N, McMahon AP (1999) Female development in mammalsis regulated by Wnt-4 signalling. Nature 397:405–409.
Vanmontfort D, Fidler AE, Heath DA, et al. (1998) cDNA sequence analysis gene expression andprotein localisation of the inhibin alpha-subunit of Australian brushtail possum (Trichosurusvulpecula). J Mol Endocrinol 21:141–152.
Vernet N, Dennefeld C, Rochette-Egly C, et al. (2006) Retinoic acid metabolism and signalingpathways in the adult and developing mouse testis. Endocrinology 147:96–110.
Weiss J, Meeks JJ, Hurley L, Raverot G, Frassetto A, Jameson JL (2003) Sox3 is required forgonadal function but not sex determination in males and females. Mol Cell Biol 23:8084–8091.
Western PS, Harry JL, Graves JAM, Sinclair AH (1999) Temperature dependent sex determina-tion: upregulation of SOX9 expression after commitment to male development. Dev Dyn 214:171–177.
Whale LJ, Eckery DC, Juengel JL (2003) Determination of steroidogenic potential of ovarian cellsof the brushtail possum (Trichosurus vulpecula). Biol Reprod 69:947–958.
Whitworth DJ, Shaw G, Renfree MB (1996) Gonadal sex reversal of the developing marsupialovary in vivo and in vitro. Development 122:4057–4063.
Whitworth DJ, Shaw G, Renfree MB (1997) Müllerian duct regression in a marsupial the tammarwallaby. Anat Embryol 196:39–46.
Wilson JD, Leihy MW, Shaw G, Renfree MB (2003) Unsolved problems in male physiology:studies in a marsupial. Mol Cell Endocrinol 211:33–36.
Whitworth DJ, Pask AJ, Shaw G, Marshall Graves JA, Behringer RR, Renfree MB (2001)Characterization of steroidogenic factor 1 during sexual differentiation in a marsupial. Gene277:209–219.
Wilson JD, Shaw G, Renfree MB, Auchus RJ, Leihy MW, Eckery DC (2005) Ontogeny andpathway of formation of 5alpha-androstane-3alpha, 17beta-diol in the testes of the immaturebrushtail possum Trichosurus vulpecula. Reprod Fertil Dev 17:603–609.
Yu H, Pask AJ, Shaw G, Renfree MB (2006) Differential expression of WNT4 in testicular andovarian development in a marsupial. BMC Dev Biol 6:44.
Yu H, Pask AJ, Shaw G, Renfree MB (2009) Comparative analysis of the mammalian WNT4promoter. BMC Genomics 10:416.
Zanaria E, Muscatelli F, Bardoni B, et al. (1994) An unusual member of the nuclear hormonereceptor super family responsible for X-linked adrenal hypoplasia congenita. Nature 372:635–641.
Chapter 15Marsupial Milk – Identifying Signalsfor Regulating Mammary Functionand Development of the Young
Julie A. Sharp, Christophe Lefevre, Joly Kwek, Denijal Topcic,Laurine Buscara, Cate Pooley, Robb de Iongh, Mary Familari,and Kevin R. Nicholas
Abstract The role of milk in providing nutrition for the young is well established.However, it is becoming apparent that milk has a more comprehensive role in pro-gramming and regulating growth and development of the suckled young, and anautocrine impact on the mammary gland so that it functions appropriately duringthe lactation cycle. This central role of milk is best studied in animal models, suchas marsupials that have evolved a different lactation strategy to eutherians and allowresearchers to more easily identify regulatory mechanisms that are not as readilyapparent in eutherian species. For example, the tammar wallaby (Macropus eugenii)has evolved with a unique reproductive strategy of a short gestation, birth of analtricial young and a relatively long lactation during which the mother progressivelychanges the composition of the major, and many of the minor components of milk.Thus, in contrast to eutherians, there is a far greater investment in development ofthe young during lactation and it is likely that many of the signals that regulatedevelopment of eutherian embryos in utero are delivered by the milk. This requiresthe co-ordinated development and function of the mammary gland. Inappropriatetiming of these signalling events in mammals may result in either limited or abnor-mal development of the young, and potentially a higher incidence of mature onsetdisease. The tammar is emerging as an attractive model to better understand the roleof milk factors in these processes.
Keywords Milk · Mammary · Stomach · Development · Neonate
K.R. Nicholas (B)Institute of Technology Research and Innovation, Deakin University, Geelong,VIC 3214, Australiae-mail: [email protected]
317J.E. Deakin et al. (eds.), Marsupial Genetics and Genomics,DOI 10.1007/978-90-481-9023-2_15, C© Springer Science+Business Media B.V. 2010
318 J.A. Sharp et al.
15.1 Introduction
Milk is no longer simply considered a source of nutrients. Milk has a more com-prehensive role in regulating growth and development of the suckled young, andautocrine control of the mammary gland so that it functions appropriately dur-ing the lactation cycle. Identification of regulatory factors in milk is more readilyachieved in animal models that have evolved extended lactation strategies comparedto eutherians (Brennan et al., 2007; Sharp et al., 2009).
Marsupials have evolved a unique reproductive strategy consisting of a shortgestation, birth of an altricial young and a relatively long lactation, during whichthe mother progressively changes the composition of all the major, and many of theminor components of milk (Brennan et al., 2007; Sharp et al., 2009). These changesin milk composition are required for development of the suckled young (Trott et al.,2003). Thus there is a far greater investment in development of the young during lac-tation. In contrast, early development of the eutherian young is largely programmedand regulated in utero. Inappropriate signalling results in either limited or abnormaldevelopment, and potentially a higher incidence of mature onset disease. Therefore,the timing of delivery of these signals is crucial to setting biological clocks for tissuedevelopment.
The newborn tammar is similar to a late stage eutherian foetus, and must rapidlydevelop gut and lung function to successfully thrive. The neonatal stomach is notmature, and considerable development occurs in the pouch following birth of theyoung (Kwek et al., 2009b). Many of the necessary signals that regulate develop-ment of eutherian embryos in utero appear to be mediated by milk, and requireco-ordinated development and function of the mammary gland (Brennan et al.,2007). Indeed, many studies have reported the capacity of the macropod marsu-pial to practise concurrent asynchronous lactation whereby the mother produces twovery different milks from adjacent mammary glands (Nicholas, 1988a). These datasuggest that, in addition to the well described endocrine regulation of milk synthesisand secretion (Nicholas et al., 1995), the tammar utilises a local, intrinsic, mecha-nism to regulate milk composition and rate of milk production. Moreover, this localregulation in the mammary gland determines the rate of pouch young (PY) growthand development, irrespective of the age of the PY (Trott et al., 2003; Waite et al.,2005; Kwek et al., 2009b).
15.2 The Lactation Cycle in the Tammar Wallaby(Macropus eugenii)
The lactation cycle is common to all mammals, although marsupials have evolved areproductive strategy that is very different from that of most eutherians (Tyndale-Biscoe and Janssens, 1988). Eutherians have a long gestation relative to theirlactation period, and the composition of the milk does not change substantially.In contrast, reproduction in marsupials such as the tammar wallaby (Macropus
15 Identifying Signals for Regulating Mammary Function 319
eugenii) is characterized by a short gestation followed by a long lactation, and allthe major milk constituents change progressively during lactation (Tyndale-Biscoeand Janssens, 1988). The altricial tammar neonate remains attached to the teat forthe first 100 days of lactation, and may be considered as a foetus that is maintainedin the pouch rather than the uterus (Fig. 15.1a). The conversion of milk to bodymass in marsupials is similar to the conversion of nutrients to body mass observedin the eutherian foetus (Tyndale-Biscoe and Janssens, 1988). Therefore, examina-tion of marsupial milk provides a unique opportunity to identify specific moleculesthat play a primary role in regulating the development of the young.
Lactation in the tammar has been divided into phases (Fig. 15.1b) defined bythe composition of milk and apparent sucking pattern of the young (Nicholas et al.,1997b). Phase 1 is comprised of a 26.5-day pregnancy followed by parturition, andthe subsequent 200 days of Phase 2 is characterized by lactogenesis and the secre-tion of small volumes of dilute milk high in complex carbohydrate and low in fatand protein. The PY remains attached to the teat for approximately the first 100 days(Phase 2A), after which it relinquishes permanent attachment to the teat and presum-ably sucks less frequently while remaining in the pouch (Phase 2B). The onset ofPhase 3 of lactation (200–330 days) is characterized by temporary exit from thepouch by the young, a large increase in milk production and a change in the com-position of milk to include elevated levels of protein and lipid and low levels ofcarbohydrate. There is a progressive increase in protein concentration (Nicholas,1988a) and protein production during lactation, and the composition of the proteinschanges considerably (Nicholas, 1988a, b; Nicholas et al., 1997a; Simpson et al.,2000; Trott et al., 2002) (Fig. 15.1b). As mentioned previously, macropodids such asthe tammar can practice concurrent asynchronous lactation whereby the mother pro-vides a concentrated milk high in protein and fat for an older animal which is out ofthe pouch, and a dilute milk low in fat and protein but high in complex carbohydratefrom an adjacent mammary gland for a newborn in the pouch (Nicholas, 1988a,1988b). This phenomenon suggests the mammary gland is controlled locally, andit is consistent with the concept that specific milk factors contribute to this process(Trott et al., 2003; Sharp et al., 2008; Kwek et al., 2009b).
To provide more detailed information on changes in milk protein during lactationin the tammar we recently developed a database of 15,000 sequenced tammar mam-mary ESTs (Lefèvre et al., 2007) and a custom tammar mammary EST microarrayprinted with 10,000 sequenced cDNAs representing >7,000 genes expressed acrossthe lactation cycle (Sharp et al., 2009). The microarray was used to transcript pro-file the mammary gland at all the major stages of pregnancy and lactation (Sharpet al., 2009) (Fig. 15.1c). In addition the ESTs sequenced from mammary cDNAlibraries prepared from tammars in pregnancy and lactation were analysed to pro-vide a greater understanding of the mammary transcriptome during the lactationcycle (Lefèvre et al., 2007). The transcriptome data and the microarray analysisconfirmed earlier published results using northern blot analysis examining the tim-ing and level of expression of the major milk protein genes (Sharp et al., 2009) ateach phase of the lactation cycle (Fig. 15.1d). There were two temporally-differentpatterns of milk protein gene expression during the lactation cycle; one group
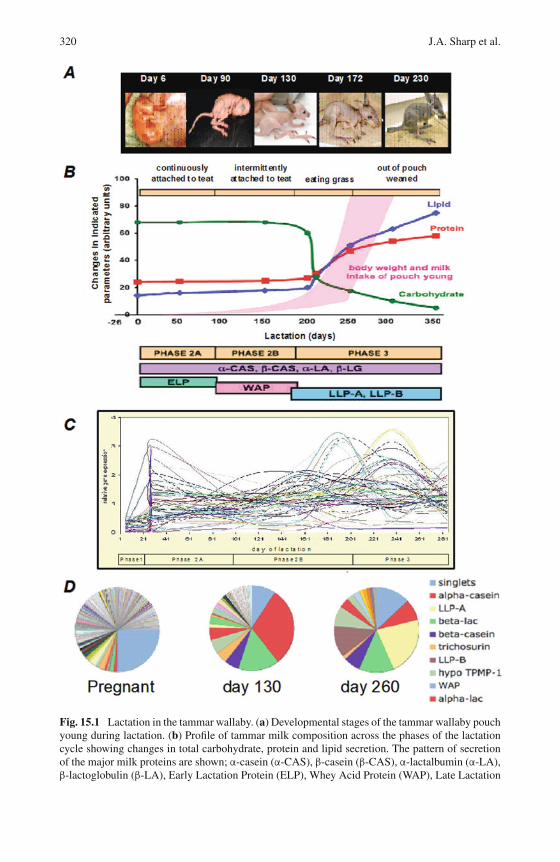
320 J.A. Sharp et al.
Fig. 15.1 Lactation in the tammar wallaby. (a) Developmental stages of the tammar wallaby pouchyoung during lactation. (b) Profile of tammar milk composition across the phases of the lactationcycle showing changes in total carbohydrate, protein and lipid secretion. The pattern of secretionof the major milk proteins are shown; α-casein (α-CAS), β-casein (β-CAS), α-lactalbumin (α-LA),β-lactoglobulin (β-LA), Early Lactation Protein (ELP), Whey Acid Protein (WAP), Late Lactation
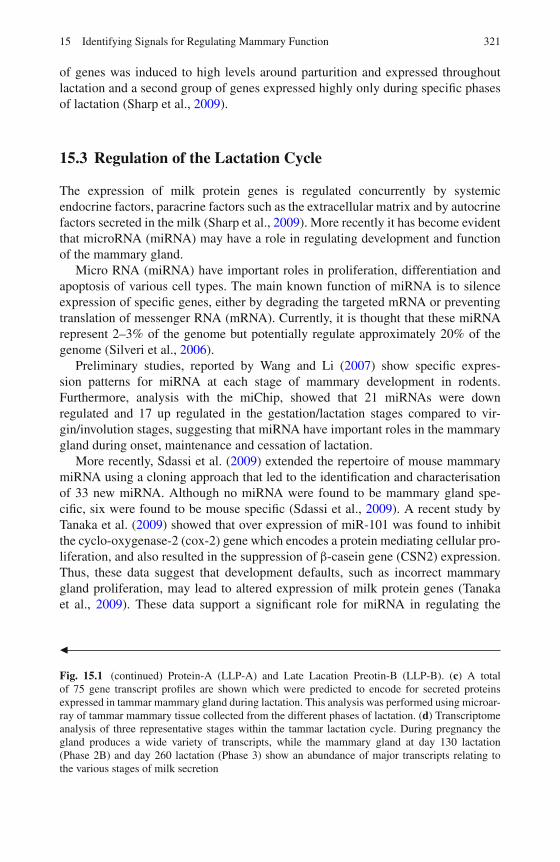
15 Identifying Signals for Regulating Mammary Function 321
of genes was induced to high levels around parturition and expressed throughoutlactation and a second group of genes expressed highly only during specific phasesof lactation (Sharp et al., 2009).
15.3 Regulation of the Lactation Cycle
The expression of milk protein genes is regulated concurrently by systemicendocrine factors, paracrine factors such as the extracellular matrix and by autocrinefactors secreted in the milk (Sharp et al., 2009). More recently it has become evidentthat microRNA (miRNA) may have a role in regulating development and functionof the mammary gland.
Micro RNA (miRNA) have important roles in proliferation, differentiation andapoptosis of various cell types. The main known function of miRNA is to silenceexpression of specific genes, either by degrading the targeted mRNA or preventingtranslation of messenger RNA (mRNA). Currently, it is thought that these miRNArepresent 2–3% of the genome but potentially regulate approximately 20% of thegenome (Silveri et al., 2006).
Preliminary studies, reported by Wang and Li (2007) show specific expres-sion patterns for miRNA at each stage of mammary development in rodents.Furthermore, analysis with the miChip, showed that 21 miRNAs were downregulated and 17 up regulated in the gestation/lactation stages compared to vir-gin/involution stages, suggesting that miRNA have important roles in the mammarygland during onset, maintenance and cessation of lactation.
More recently, Sdassi et al. (2009) extended the repertoire of mouse mammarymiRNA using a cloning approach that led to the identification and characterisationof 33 new miRNA. Although no miRNA were found to be mammary gland spe-cific, six were found to be mouse specific (Sdassi et al., 2009). A recent study byTanaka et al. (2009) showed that over expression of miR-101 was found to inhibitthe cyclo-oxygenase-2 (cox-2) gene which encodes a protein mediating cellular pro-liferation, and also resulted in the suppression of β-casein gene (CSN2) expression.Thus, these data suggest that development defaults, such as incorrect mammarygland proliferation, may lead to altered expression of milk protein genes (Tanakaet al., 2009). These data support a significant role for miRNA in regulating the
�
Fig. 15.1 (continued) Protein-A (LLP-A) and Late Lacation Preotin-B (LLP-B). (c) A totalof 75 gene transcript profiles are shown which were predicted to encode for secreted proteinsexpressed in tammar mammary gland during lactation. This analysis was performed using microar-ray of tammar mammary tissue collected from the different phases of lactation. (d) Transcriptomeanalysis of three representative stages within the tammar lactation cycle. During pregnancy thegland produces a wide variety of transcripts, while the mammary gland at day 130 lactation(Phase 2B) and day 260 lactation (Phase 3) show an abundance of major transcripts relating tothe various stages of milk secretion
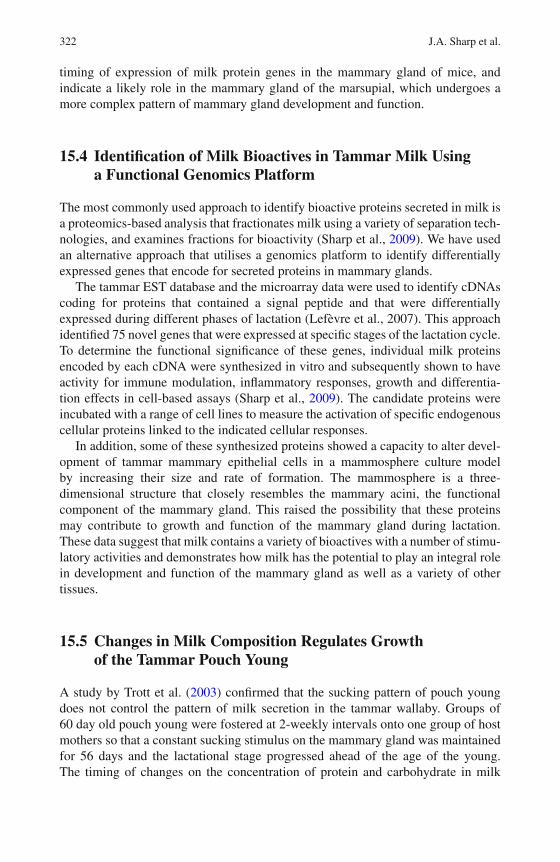
322 J.A. Sharp et al.
timing of expression of milk protein genes in the mammary gland of mice, andindicate a likely role in the mammary gland of the marsupial, which undergoes amore complex pattern of mammary gland development and function.
15.4 Identification of Milk Bioactives in Tammar Milk Usinga Functional Genomics Platform
The most commonly used approach to identify bioactive proteins secreted in milk isa proteomics-based analysis that fractionates milk using a variety of separation tech-nologies, and examines fractions for bioactivity (Sharp et al., 2009). We have usedan alternative approach that utilises a genomics platform to identify differentiallyexpressed genes that encode for secreted proteins in mammary glands.
The tammar EST database and the microarray data were used to identify cDNAscoding for proteins that contained a signal peptide and that were differentiallyexpressed during different phases of lactation (Lefèvre et al., 2007). This approachidentified 75 novel genes that were expressed at specific stages of the lactation cycle.To determine the functional significance of these genes, individual milk proteinsencoded by each cDNA were synthesized in vitro and subsequently shown to haveactivity for immune modulation, inflammatory responses, growth and differentia-tion effects in cell-based assays (Sharp et al., 2009). The candidate proteins wereincubated with a range of cell lines to measure the activation of specific endogenouscellular proteins linked to the indicated cellular responses.
In addition, some of these synthesized proteins showed a capacity to alter devel-opment of tammar mammary epithelial cells in a mammosphere culture modelby increasing their size and rate of formation. The mammosphere is a three-dimensional structure that closely resembles the mammary acini, the functionalcomponent of the mammary gland. This raised the possibility that these proteinsmay contribute to growth and function of the mammary gland during lactation.These data suggest that milk contains a variety of bioactives with a number of stimu-latory activities and demonstrates how milk has the potential to play an integral rolein development and function of the mammary gland as well as a variety of othertissues.
15.5 Changes in Milk Composition Regulates Growthof the Tammar Pouch Young
A study by Trott et al. (2003) confirmed that the sucking pattern of pouch youngdoes not control the pattern of milk secretion in the tammar wallaby. Groups of60 day old pouch young were fostered at 2-weekly intervals onto one group of hostmothers so that a constant sucking stimulus on the mammary gland was maintainedfor 56 days and the lactational stage progressed ahead of the age of the young.The timing of changes on the concentration of protein and carbohydrate in milk
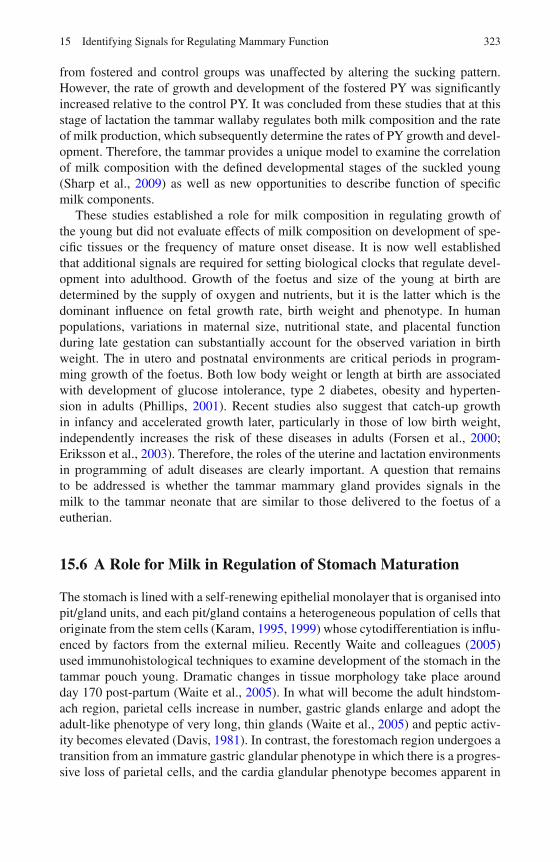
15 Identifying Signals for Regulating Mammary Function 323
from fostered and control groups was unaffected by altering the sucking pattern.However, the rate of growth and development of the fostered PY was significantlyincreased relative to the control PY. It was concluded from these studies that at thisstage of lactation the tammar wallaby regulates both milk composition and the rateof milk production, which subsequently determine the rates of PY growth and devel-opment. Therefore, the tammar provides a unique model to examine the correlationof milk composition with the defined developmental stages of the suckled young(Sharp et al., 2009) as well as new opportunities to describe function of specificmilk components.
These studies established a role for milk composition in regulating growth ofthe young but did not evaluate effects of milk composition on development of spe-cific tissues or the frequency of mature onset disease. It is now well establishedthat additional signals are required for setting biological clocks that regulate devel-opment into adulthood. Growth of the foetus and size of the young at birth aredetermined by the supply of oxygen and nutrients, but it is the latter which is thedominant influence on fetal growth rate, birth weight and phenotype. In humanpopulations, variations in maternal size, nutritional state, and placental functionduring late gestation can substantially account for the observed variation in birthweight. The in utero and postnatal environments are critical periods in program-ming growth of the foetus. Both low body weight or length at birth are associatedwith development of glucose intolerance, type 2 diabetes, obesity and hyperten-sion in adults (Phillips, 2001). Recent studies also suggest that catch-up growthin infancy and accelerated growth later, particularly in those of low birth weight,independently increases the risk of these diseases in adults (Forsen et al., 2000;Eriksson et al., 2003). Therefore, the roles of the uterine and lactation environmentsin programming of adult diseases are clearly important. A question that remainsto be addressed is whether the tammar mammary gland provides signals in themilk to the tammar neonate that are similar to those delivered to the foetus of aeutherian.
15.6 A Role for Milk in Regulation of Stomach Maturation
The stomach is lined with a self-renewing epithelial monolayer that is organised intopit/gland units, and each pit/gland contains a heterogeneous population of cells thatoriginate from the stem cells (Karam, 1995, 1999) whose cytodifferentiation is influ-enced by factors from the external milieu. Recently Waite and colleagues (2005)used immunohistological techniques to examine development of the stomach in thetammar pouch young. Dramatic changes in tissue morphology take place aroundday 170 post-partum (Waite et al., 2005). In what will become the adult hindstom-ach region, parietal cells increase in number, gastric glands enlarge and adopt theadult-like phenotype of very long, thin glands (Waite et al., 2005) and peptic activ-ity becomes elevated (Davis, 1981). In contrast, the forestomach region undergoes atransition from an immature gastric glandular phenotype in which there is a progres-sive loss of parietal cells, and the cardia glandular phenotype becomes apparent in
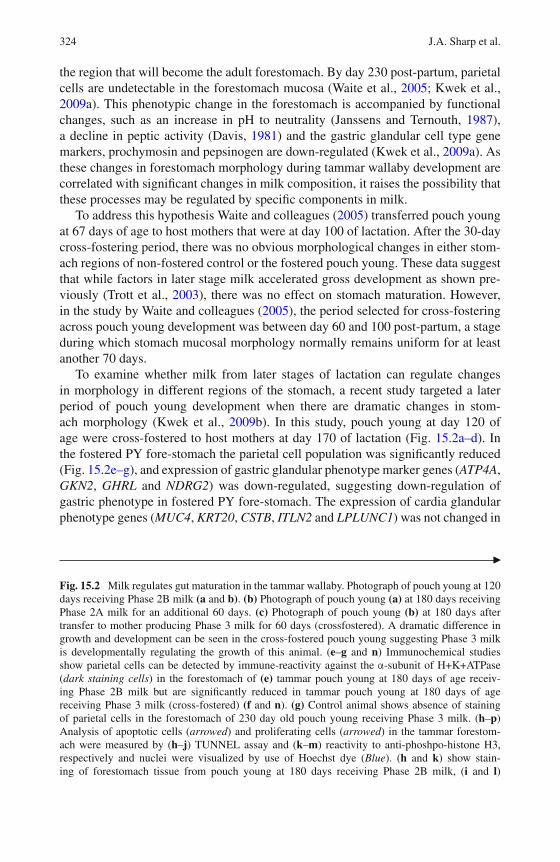
324 J.A. Sharp et al.
the region that will become the adult forestomach. By day 230 post-partum, parietalcells are undetectable in the forestomach mucosa (Waite et al., 2005; Kwek et al.,2009a). This phenotypic change in the forestomach is accompanied by functionalchanges, such as an increase in pH to neutrality (Janssens and Ternouth, 1987),a decline in peptic activity (Davis, 1981) and the gastric glandular cell type genemarkers, prochymosin and pepsinogen are down-regulated (Kwek et al., 2009a). Asthese changes in forestomach morphology during tammar wallaby development arecorrelated with significant changes in milk composition, it raises the possibility thatthese processes may be regulated by specific components in milk.
To address this hypothesis Waite and colleagues (2005) transferred pouch youngat 67 days of age to host mothers that were at day 100 of lactation. After the 30-daycross-fostering period, there was no obvious morphological changes in either stom-ach regions of non-fostered control or the fostered pouch young. These data suggestthat while factors in later stage milk accelerated gross development as shown pre-viously (Trott et al., 2003), there was no effect on stomach maturation. However,in the study by Waite and colleagues (2005), the period selected for cross-fosteringacross pouch young development was between day 60 and 100 post-partum, a stageduring which stomach mucosal morphology normally remains uniform for at leastanother 70 days.
To examine whether milk from later stages of lactation can regulate changesin morphology in different regions of the stomach, a recent study targeted a laterperiod of pouch young development when there are dramatic changes in stom-ach morphology (Kwek et al., 2009b). In this study, pouch young at day 120 ofage were cross-fostered to host mothers at day 170 of lactation (Fig. 15.2a–d). Inthe fostered PY fore-stomach the parietal cell population was significantly reduced(Fig. 15.2e–g), and expression of gastric glandular phenotype marker genes (ATP4A,GKN2, GHRL and NDRG2) was down-regulated, suggesting down-regulation ofgastric phenotype in fostered PY fore-stomach. The expression of cardia glandularphenotype genes (MUC4, KRT20, CSTB, ITLN2 and LPLUNC1) was not changed in
�
Fig. 15.2 Milk regulates gut maturation in the tammar wallaby. Photograph of pouch young at 120days receiving Phase 2B milk (a and b). (b) Photograph of pouch young (a) at 180 days receivingPhase 2A milk for an additional 60 days. (c) Photograph of pouch young (b) at 180 days aftertransfer to mother producing Phase 3 milk for 60 days (crossfostered). A dramatic difference ingrowth and development can be seen in the cross-fostered pouch young suggesting Phase 3 milkis developmentally regulating the growth of this animal. (e–g and n) Immunochemical studiesshow parietal cells can be detected by immune-reactivity against the α-subunit of H+K+ATPase(dark staining cells) in the forestomach of (e) tammar pouch young at 180 days of age receiv-ing Phase 2B milk but are significantly reduced in tammar pouch young at 180 days of agereceiving Phase 3 milk (cross-fostered) (f and n). (g) Control animal shows absence of stainingof parietal cells in the forestomach of 230 day old pouch young receiving Phase 3 milk. (h–p)Analysis of apoptotic cells (arrowed) and proliferating cells (arrowed) in the tammar forestom-ach were measured by (h–j) TUNNEL assay and (k–m) reactivity to anti-phoshpo-histone H3,respectively and nuclei were visualized by use of Hoechst dye (Blue). (h and k) show stain-ing of forestomach tissue from pouch young at 180 days receiving Phase 2B milk, (i and l)
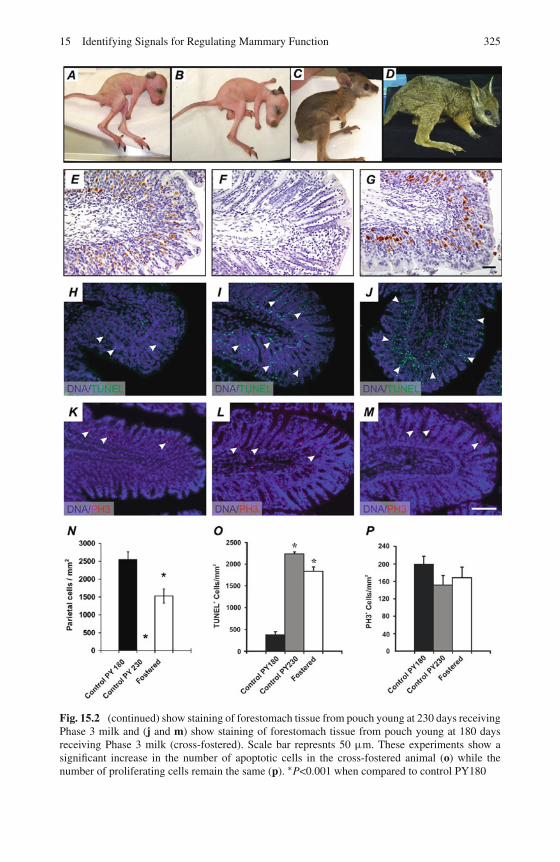
15 Identifying Signals for Regulating Mammary Function 325
Fig. 15.2 (continued) show staining of forestomach tissue from pouch young at 230 days receivingPhase 3 milk and (j and m) show staining of forestomach tissue from pouch young at 180 daysreceiving Phase 3 milk (cross-fostered). Scale bar represnts 50 μm. These experiments show asignificant increase in the number of apoptotic cells in the cross-fostered animal (o) while thenumber of proliferating cells remain the same (p). ∗P<0.001 when compared to control PY180
326 J.A. Sharp et al.
fostered PY. In fostered PY fore-stomach, there was also an increased apoptosis, butno change in cell proliferation (Kwek et al., 2009b) (Fig. 15.2 h–p). These data sug-gest that fore-stomach maturation proceeds via two temporally distinct processes:down-regulation of gastric glandular phenotype and initiation of cardia glandu-lar phenotype. In fostered PY, these two processes appear uncoupled, as gastricglandular phenotype was down-regulated but cardia glandular phenotype was notinitiated. It remains to be determined what factors regulate these two apparentlydistinct processes. Candidate contributory factors include molecular factors in latestage lactation milk, or even contributions from herbage consumed by the pouchyoung during later lactation stage and the attendant colonisation of the stomach bymicro-organisms.
In addition to the loss of parietal cells, there may also be other gastric glandu-lar type cells undergoing apoptosis in the fostered PY forestomach, as many of thecells reactive for active caspase-3 or TUNEL did not co-localise with H+K+ATPase(Atp4b). Moreover, qPCR analysis showed down-regulated expression of other gas-tric glandular specialised cell marker genes such as GHRL and GKN2. Severalstudies indicate that normal parietal cell development is critical for homeostasisof other gastric epithelial cell types in the mucosa (Li et al., 1995, 1996; Franicet al., 2001; Jain et al., 2008). Mice deficient in the β-subunit of Atp4b genelacked functional parietal cells and had a depleted number of zymogenic cellsand increased number of immature gastric glandular cells undergoing apoptosis(Franic et al., 2001). Similarly, mice deficient for Huntington interacting protein 1related (an F-actin binding protein expressed on canalicular membranes of pari-etal cell) also had abnormal parietal cell morphology, reduced numbers of parietaland chief cells and increased apoptosis (Jain et al., 2008). As much of the celldeath occurs in the isthmus region of the mucosal gland of the tammar wallabyforestomach, it is possible that undifferentiated progenitors, as well as differenti-ated cells are affected and thus may contribute to the altered differentiation profileof the forestomach epithelium. However, the identity of other gastric glandular celltypes lost from the forestomach of control PY 230 and fostered PY remains to bedetermined.
15.7 The Role of Gastric Microflora in Regulating StomachDevelopment
The mammalian gastrointestinal tract harbours a complex microbiota consisting ofaround 500–1,000 distinct microbial species (Backhed et al., 2005). Various animalmodels have provided convincing evidence that the inter-relationships between thehost gastrointestinal tract and gut bacteria are important in regulating immune sys-tem development (Kelly et al., 2007) and lipid metabolism of the host (Backhedet al., 2004). Most importantly, there are now many studies that show that theestablishment of gut microbiota plays a critical role in cytodifferentiation of thedeveloping gut (Uribe et al., 1994; Bry et al., 1996; Bates et al., 2006).
15 Identifying Signals for Regulating Mammary Function 327
At the end of the 60-day transfer period in the experiments described by Kweket al. (2009b), the fostered PY were still consuming milk with high levels ofcarbohydrates and some parietal cells were still present in the fostered PY forestom-ach, suggesting the presence of acidic contents in the forestomach. In addition,expression of genes involved in bacterial recognition (e.g. ITLN2) and gut immu-nity (e.g. CSTB and LPLUNC1) were extremely low in forestomach of the fosteredPY. It is possible that specific carbohydrates prevent establishment of specific micro-bial populations in the forestomach of the fostered PY (Kunz et al., 2000; Kunz andRudloff, 2008) as some milk oligosaccharides can reduce microbial colonisationby acting as receptor analogues to inhibit adhesion of pathogens or microorgan-isms on the gut mucosal epithelial surface (Holmgren et al., 1983; Andersson et al.,1986; Kunz et al., 2000; Kunz and Rudloff, 2008). Complex carbohydrate andoligosaccharides found in human milk demonstrate prebiotic roles in the main-tenance of gut microbiota (Boehm et al., 2004; Ward et al., 2006), and stronglysuggests that there are specific factors within the breast milk that can promote thegrowth of beneficial bacteria and suppress the colonisation of harmful bacteria inthe gastrointestinal tract of the infant (Newburg, 1996, 1997; Kunz and Rudloff,2008).
In studies using the germ-free zebrafish, differentiation of the larval gut epithe-lium was arrested (Bates et al., 2006). Similarly, in studies with the germ-free rats,a lack of microbiota resulted in greatly reduced numbers of goblet cells (Ishikawaet al., 1986). Another study by Bry and colleagues (1996), using germ-free micemodel, clearly demonstrated that development in the intestine was affected in theabsence of microflora. Importantly, re-introduction of microflora to these germ-free animals restored the normal gut phenotype and function comparable to theconventionally-reared animals (Bry et al., 1996; Bates et al., 2006). This suggeststhat microbiota can regulate cytodifferentiation of the gut by directly influencingcell fate decisions in the gut epithelium, and that milk carbohydrate may play a rolein this process.
15.8 A Role for Milk in the Control of Mammary Functionin the Tammar
There is increasing evidence to suggest that milk plays an important role in reg-ulating mammary epithelial function and survival, and this is particularly evidentduring involution (Brennan et al., 2007). For example, apoptosis was induced pref-erentially in the sealed teats of lactating mice (Li et al., 1997; Marti et al., 1997),whereas the litter suckled successfully on the remaining teats, indicating that celldeath is stimulated by an intra-mammary mechanism sensitive to milk accumula-tion (Quarrie et al., 1996). A protein known as the feedback inhibitor of lactation(FIL), suggested as a candidate, is also secreted in the milk of the tammar (Hendryet al., 1998; Marti et al., 1999) and other species. It acts specifically through interac-tion with the apical surface of the mammary epithelial cell to reduce milk secretion
328 J.A. Sharp et al.
(Wilde et al., 1995; Hendry et al., 1998). An alternative hypothesis has proposedthat engorgement of the mammary gland signals a down regulation of secretion andonset of apoptosis by a mechanism of physico-chemical signalling (Boudreau et al.,1995; Clark and Brugge, 1995).
Recent studies using the tammar mammary explant culture model (Nicholas andTyndale-Biscoe, 1985) to examine the process of involution has confirmed the likelyrole of milk, and particularly of putative autocrine factors, for directly controllingmammary function during involution (Brennan et al., 2007). Mammary explants,small (1–2 mg) pieces of mammary tissue prepared from pregnant tammars, werecultured on siliconised lens paper in Medium 199 with lactogenic hormones (insulin,cortisol and prolactin) to induce milk protein gene expression; subsequent removalof all hormones for 10 days down-regulated expression of the milk protein genes andmimicked involution. Surprisingly, the explants retained the same level of lactogenicresponse during a subsequent challenge with lactogenic hormones. The maintenanceof epithelial cell viability and hormone responsiveness in explants cultured in theabsence of hormones is consistent with the idea that accumulation of local factorsin the milk is the primary stimulus for apoptosis of mammary epithelial cells in thetammar wallaby mammary gland. This model will permit analysis of how hormoneand milk regulation of involution are uncoupled, and will provide evidence for theextraordinary capacity for survival and maintenance of hormone responsiveness bytammar mammary epithelial cells cultured in a chemically defined medium in theabsence of exogenous hormones and growth factors. Other studies in our laboratory,using the fur seal as a model to examine the uncoupling of involution from cessa-tion of suckling by the young, have identified the milk protein α-lactalbumin as acandidate for initiating phase one involution and apoptosis (Sharp et al., 2008).
The functions of milk proteins such as β-lactoglobulin (BLG) and Whey AcidicProtein (WAP) in mammary development have remained elusive. WAP is a majorwhey protein and is secreted throughout lactation in many eutherian species includ-ing rat, mouse, rabbit, camel and pig (Simpson et al., 2000; Simpson and Nicholas,2002). WAP is also secreted in the milk of all marsupials studied to date includingthe tammar (Simpson et al., 2000), red kangaroo (Nicholas et al., 2001), brush-tailedpossum (Demmer et al., 2001), and the fat-tailed dunnart (De Leo et al., 2006).In addition, WAP mRNA has been detected in the lactating mammary gland of a
�
Fig. 15.3 Analysis of Whey Acidic Protein function in the mammary gland. (a) Recombinanttammar WAP (tWAP) constructs were transfected into HEK-293 cells. The constructs comprisedfull length tWAP, 4-DSC domain I and II, and 4DSC domain III cloned into the pCMV expres-sion vector. Evidence of production of recombinants proteins was measured by collection ofconditioned media and Western blot analysis (right side panel) showing the correct recombinantprotein sizes (tWAP = 22.13 kDa, DI–II = 15.3 kDa and DIII = 8.9 kDa). (b) Proliferation ofprimary cultures of wallaby cells (Wall-MEC) and HC11 cells grown in conditioned mediumcontaining tWAP or DIII was significantly increased at 72 h compared to cells in conditionedmedia containing DI–II or media alone. (c) The rate of DNA synthesis, as measued by [3H]-thymidine incorporation, was significantly higher in both Wall-MEC and HC11 cells grown
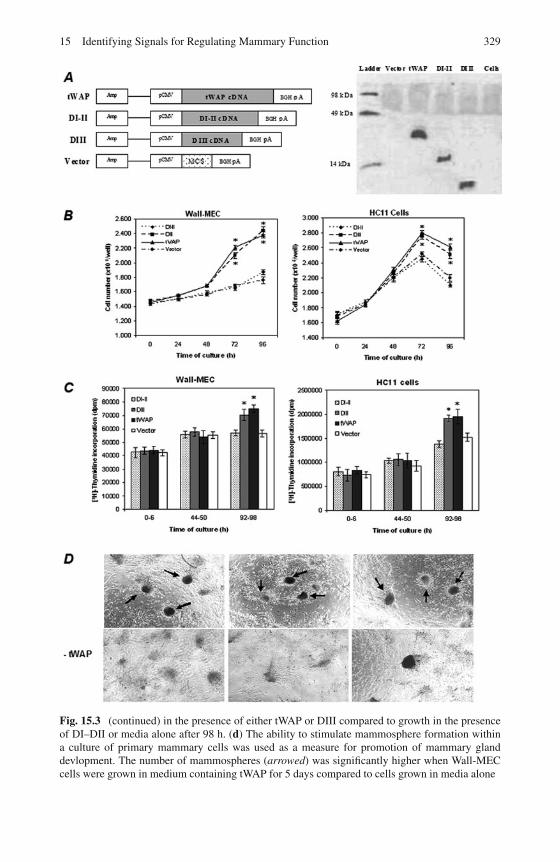
15 Identifying Signals for Regulating Mammary Function 329
Fig. 15.3 (continued) in the presence of either tWAP or DIII compared to growth in the presenceof DI–DII or media alone after 98 h. (d) The ability to stimulate mammosphere formation withina culture of primary mammary cells was used as a measure for promotion of mammary glanddevlopment. The number of mammospheres (arrowed) was significantly higher when Wall-MECcells were grown in medium containing tWAP for 5 days compared to cells grown in media alone
330 J.A. Sharp et al.
stripe faced dunnart and short-tailed opossum (Topcic and Nicholas, unpublished).However, in these species the secretion of the protein is specific to a phase oflactation and therefore the tammar provides a naturally occurring, transient geneknockout model to assess the role of this protein in regulating either specific stagesof development of the young, the mammary gland or potentially both. The aminoacid sequence of WAP from two monotremes, platypus and echidna, has beenreported (Sharp et al., 2007; Simpson et al., 2000) but it is unknown whether thepattern of secretion in these species is similar to the marsupial.
Alignment of the amino acid sequence of WAPs from marsupial, monotremeand eutherian species shows limited sequence identity (Sharp et al., 2007; Simpsonet al., 2000). However, these proteins are recognized by the presence of the WAPmotif and a four disulphide core (4-DSC) domain (Ranganathan et al., 1999). WAPsecreted in the milk of eutherians has two 4-DSC domains (Simpson and Nicholas,2002), whereas WAP in all marsupials and monotremes studied to date has threedomains (Simpson et al., 2000; Demmer et al., 2001; De Leo et al., 2006; Sharpet al., 2007). The five exons of the marsupial and monotreme WAP genes contrastwith the eutherian WAP genes, which have only four exons (De Leo et al., 2006;Sharp et al., 2007). The significance of the loss of the third domain in eutheriansremains unclear, particularly as a biological function of milk WAP remains to beestablished.
Recent studies have shown that mouse WAP added to culture medium of mouseHC-11 cells (a mammary epithelial cell line) is antiproliferative, and may act by anautocrine or paracrine mechanism (Nukumi et al., 2004). This is consistent withreports showing that over-expression of WAP in transgenic mice inhibits devel-opment of the mammary gland and secretion of milk (Burdon et al., 1991). Incontrast, studies in our laboratory using full length tammar WAP and the individ-ual 4-DSC tammar WAP domains (Fig. 15.3a) have shown that tammar WAP addedto culture media stimulates proliferation of tammar mammary epithelial cells andincreases expression of the cell cycle genes cyclin D1 and CDK-4 (Topcic et al.,2009) (Fig. 15.3b). The studies also show that this stimulation is entirely due tothe presence of the third tammar WAP domain (DIII) which is absent from euthe-rian WAP genes. Earlier studies have shown that DNA synthesis in the tammarmammary gland is higher in Phase 2 than Phase 3 (Nicholas, 1988b), which is con-sistent with a potential role of tammar WAP in development of the mammary gland.This is further supported by studies showing that tammar WAP stimulates DNAsynthesis in primary cultures of tammar mammary epithelial cells (Topcic et al.,2009) (Fig. 15.3c) and promotes in vitro growth of 3D alveoli-like structures (ormammospheres), which mimic in vivo mammary gland development and function(Fig. 15.3d). Interestingly, studies using a WAP gene knock-out mouse have shownmammary development is normal. However, the pups had decreased development atthe later stages of lactation (Triplett et al., 2005). As tammar WAP is a major milkprotein secreted during the middle third of lactation when the pouch young’s dietcomprises only milk, it could be speculated that this protein plays a specific role indevelopment of both the mammary gland and the suckled young at this time. Themilk WAP gene in human, cow, ewe and goat has been sequenced and mutations
15 Identifying Signals for Regulating Mammary Function 331
within these genes suggest the gene is a non-functional psuedogene (Hajjoubi et al.,2006). It is conceivable that a putative function for WAP in mammary developmentis only relevant in marsupials and monotremes. The activity has most likely beenlost in human, cow, ewe and goat due to loss of evolutionary pressure on this pro-tein that relates to the changes in reproductive strategy of eutherians. Therefore,the marsupial may be a more appropriate model to explore the potential of othermajor milk proteins such as β-lactoglobulin, which, like WAP, is not expressed inall eutherians.
15.9 Conclusion
Early development of the eutherian young is programmed and regulated in utero.Developmental signals may be provided to the young, either continually or at spe-cific times during development, and be provided by the amniotic fluid, placenta,colostrum and milk. Changes in the timing of these signals may result in abnor-mal development and a higher frequency of mature onset disease. The marsupialgives birth to an altricial young and much of the early development is regulated bymilk. It is now apparent that new roles for milk are emerging, and future studiesusing the marsupial model will allow researchers to more fully understand the cen-tral role of milk to deliver time-dependent signals for both growth and developmentof the young, protect the young and mammary gland from infection and regulatethe development and function of the mammary gland. A better understanding of thetemporal delivery of these signals may provide new opportunities for treatment andprevention of disease.
References
Andersson B, Porras O, Hanson LA, Lagergard T, Svanborg-Eden C (1986) Inhibition of attach-ment of Streptococcus pneumoniae and Haemophilus influenzae by human milk and receptoroligosaccharides. J Infect Dis 153:232–237.
Backhed F, Ding H, Wang T, et al. (2004) The gut microbiota as an environmental factor thatregulates fat storage. Proc Natl Acad Sci USA 101:15718–15723.
Backhed F, Ley RE, Sonnenburg JL, Peterson DA, Gordon JI (2005) Host-bacterial mutualism inthe human intestine. Science 307:1915–1920.
Bates JM, Mittge E, Kuhlman J, Baden KN, Cheesman SE, Guillemin K (2006) Distinct sig-nals from the microbiota promote different aspects of zebrafish gut differentiation. Dev Biol297:374–386.
Boehm G, Jelinek J, Stahl B, et al. (2004) Prebiotics in infant formulas. J Clin Gastroenterol38:S76–S79.
Boudreau N, Sympson CJ, Werb Z, Bissell MJ (1995) Suppression of ICE and apoptosis inmammary epithelial cells by extracellular matrix. Science 267:891–893.
Brennan AJ, Sharp JA, Lefevre C, et al. (2007) The tammar wallaby and fur seal: models toexamine local control of lactation. J Dairy Sci 90:E66–E75.
Bry L, Falk PG, Midtvedt T, Gordon JI (1996) A model of host-microbial interactions in an openmammalian ecosystem. Science 273:1380–1383.
332 J.A. Sharp et al.
Burdon T, Sankaran L, Wall RJ, Spencer M, Hennighausen L (1991) Expression of a wheyacidic protein transgene during mammary development. Evidence for different mechanismsof regulation during pregnancy and lactation. J Biol Chem 266:6909–6914.
Clark EA, Brugge JS (1995) Integrins and signal transduction pathways: the road taken. Science268:233–239.
Davis PH (1981) The Post-natal Development of Digestive Proteinases in the Rat (Rattus rattus)and the Tammar Wallaby (Macropus eugenii). University of Sydney, Australia.
De Leo AA, Lefevre C, Topcic D, et al. (2006) Characterization of two whey protein genes inthe Australian dasyurid marsupial, the stripe-faced dunnart (Sminthopsis macroura). CytogenetGenome Res 115:62–69.
Demmer J, Stasiuk SJ, Grigor MR, Simpson KJ, Nicholas KR (2001) Differential expression ofthe whey acidic protein gene during lactation in the brushtail possum (Trichosurus vulpecula).Biochim Biophys Acta 1522:187–194.
Eriksson JG, Forsen T, Tuomilehto J, Osmond C, Barker DJ (2003) Early adiposity rebound inchildhood and risk of type 2 diabetes in adult life. Diabetologia 46:190–194.
Forsen T, Eriksson J, Tuomilehto J, Reunanen A, Osmond C, Barker D (2000) The fetal andchildhood growth of persons who develop type 2 diabetes. Ann Intern Med 133:176–182.
Franic TV, Judd LM, Robinson D, et al. (2001) Regulation of gastric epithelial cell develop-ment revealed in H(+)/K(+)-ATPase beta-subunit- and gastrin-deficient mice. Am J PhysiolGastrointest Liver Physiol 281:G1502–G1511.
Hajjoubi S, Rival-Gervier S, Hayes H, et al. (2006) Ruminants genome no longer contains WheyAcidic Protein gene but only a pseudogene. Gene 370:104–112.
Hendry KA, Simpson KJ, Nicholas KR, Wilde CJ (1998) Autocrine inhibition of milk secretion inthe lactating tammar wallaby (Macropus eugenii). J Mol Endocrinol 21:169–177.
Holmgren J, Svennerholm AM, Lindblad M (1983) Receptor-like glycocompounds in humanmilk that inhibit classical and El Tor Vibrio cholerae cell adherence (hemagglutination). InfectImmun 39:147–154.
Ishikawa K, Satoh Y, Tanaka H, Ono K (1986) Influence of conventionalization on small-intestinalmucosa of germ-free Wistar rats: quantitative light microscopic observations. Acta Anat127:296–302.
Jain RN, Al-Menhali AA, Keeley TM, et al. (2008) Hip1r is expressed in gastric parietal cellsand is required for tubulovesicle formation and cell survival in mice. J Clin Invest 118:2459–2470.
Janssens PA, Ternouth JH (1987) The transition from milk to forage diets. In: Hacker JB, TernouthJH (eds) The Nutrition of Herbivores. Academic Press, London and New York.
Karam SM (1995) New insights into the stem cells and the precursors of the gastric epithelium.Nutrition 11:607–613.
Karam SM (1999) Lineage commitment and maturation of epithelial cells in the gut. Front Biosci4:D286–D298.
Kelly D, King T, Aminov R (2007) Importance of microbial colonization of the gut in early life tothe development of immunity. Mutat Res 622:58–69.
Kunz C, Rudloff S (2008) Potential anti-inflammatory and anti-infectious effects of human milkoligosaccharides. Adv Exp Med Biol 606:455–465.
Kunz C, Rudloff S, Baier W, Klein N, Strobel S (2000) Oligosaccharides in human milk: structural,functional, and metabolic aspects. Annu Rev Nutr 20:699–722.
Kwek J, De Iongh R, Nicholas K, Familari M (2009a) Molecular insights into evolution of thevertebrate gut: focus on stomach and parietal cells in the marsupial, Macropus eugenii. J ExpZool B Mol Dev Evol 312:613–624.
Kwek JH, Iongh RD, Digby MR, Renfree MB, Nicholas KR, Familari M (2009b) Cross-fosteringof the tammar wallaby (Macropus eugenii) pouch young accelerates fore-stomach maturation.Mech Dev 126:449–463.
Lefèvre CM, Digby MR, Whitley JC, Strahm Y, Nicholas KR (2007) Lactation transcriptomicsin the Australian marsupial, Macropus eugenii: transcript sequencing and quantification. BMCGenomics 8:417–425.
15 Identifying Signals for Regulating Mammary Function 333
Li M, Liu X, Robinson G, et al. (1997) Mammary-derived signals activate programmed cell deathduring the first stage of mammary gland involution. Proc Natl Acad Sci USA 94:3425–3430.
Li Q, Karam SM, Gordon JI (1995) Simian virus 40 T antigen-induced amplification of pre-parietalcells in transgenic mice. Effects on other gastric epithelial cell lineages and evidence for ap53-independent apoptotic mechanism that operates in a committed progenitor. J Biol Chem270:15777–15788.
Li Q, Karam SM, Gordon JI (1996) Diphtheria toxin-mediated ablation of parietal cells in thestomach of transgenic mice. J Biol Chem 271:3671–3676.
Marti A, Feng Z, Altermatt HJ, Jaggi R (1997) Milk accumulation triggers apoptosis of mammaryepithelial cells. Eur J Cell Biol 73:158–165.
Marti A, Lazar H, Ritter P, Jaggi R (1999) Transcription factor activities and gene expressionduring mouse mammary gland involution. J Mammary Gland Biol 4:145–152.
Newburg DS (1996) Oligosaccharides and glycoconjugates in human milk: their role in hostdefense. J Mammary Gland Biol 1:271–283.
Newburg DS (1997) Do the binding properties of oligosaccharides in milk protect human infantsfrom gastrointestinal bacteria? J Nutr 127:980S–984S.
Nicholas K, Simpson K, Wilson M, Trott J, Shaw D (1997a) The tammar wallaby: a model to studyputative autocrine-induced changes in milk composition. J Mammary Gland Biol 2:299–310.
Nicholas KR (1988a) Asynchronous dual lactation in a marsupial, the tammar wallaby (Macropuseugenii). Biochem Biophys Res Commun 154:529–536.
Nicholas KR (1988b) Control of milk protein synthesis in the tammar wallaby:a model systemto study prolactin-dependent development. In: Tyndale-Biscoe CH, Janssens PA (eds) TheDeveloping Marsupial: Models for Biomedical Research. Springer, Heidelberg.
Nicholas KR, Tyndale-Biscoe CH (1985) Prolactin-dependent accumulation of alpha-lactalbuminin mammary gland explants from the pregnant tammar wallaby (Macropus eugenii).J Endocrinol 106:337–342.
Nicholas KR, Wilde C, Bird K, Hendry K, Tregenza K, Warner B (1995) Asynchronous concurrentsecretion of milk proteins in the tammar wallaby (Macropus eugenii). In: Wilde C, Knight C,Peaker M (eds) Intercellular Signalling in the Mammary Gland. Plenum Press, London.
Nicholas KR, Simpson K, Wilson M, Trott J, Shaw D (1997b) The tammar wallaby: a modelto study putative autocrine-induced changes in milk composition. J Mammary Gland Biol 2:299–310.
Nicholas KR, Fisher JA, Muths E, et al. (2001) Secretion of whey acidic protein and cystatin isdown regulated at mid-lactation in the red kangaroo (Macropus rufus). Comp Biochem PhysiolA Mol Integr Physiol 129:851–858.
Nukumi N, Ikeda K, Osawa M, Iwamori T, Naito K, Tojo H (2004) Regulatory function of wheyacidic protein in the proliferation of mouse mammary epithelial cells in vivo and in vitro. DevBiol 274:31–44.
Phillips DIW (2001) Non-insulin-dependent diabetes and obesity. In: Barker DJ (ed) Fetal Originsof Cardiovascular and Lung Disease. Marcel Dekker, New York.
Quarrie LH, Addey CVP, Wilde CJ (1996) Programmed cell death during mammary tissueinvolution induced by weaning, litter removal and milk stasis. J Cell Physiol 168:559–569.
Ranganathan S, Simpson KJ, Shaw DC, Nicholas KR (1999) The whey acidic protein family: anew signature motif and three-dimensional structure by comparative modeling. J Mol GraphModel 17:106–113, 134–136.
Sdassi N, Silveri L, Laubier J, et al. (2009) Identification and characterization of new miRNAscloned from normal mouse mammary gland. BMC Genomics 10:149.
Silveri L, Tilly G, Vilotte JL, Le Provost F (2006) MicroRNA involvement in mammary glanddevelopment and breast cancer. Reprod Nutr Dev 5:549.
Sharp JA, Lefevre C, Nicholas KR (2007) Molecular evolution of monotreme and marsupial wheyacidic protein genes. Evol Dev 9:378–392.
Sharp JA, Lefevre C, Nicholas KR (2008) Lack of functional alpha-lactalbumin prevents involu-tion in Cape fur seals and identifies the protein is an apoptotic milk factor in mammary glandinvolution. BMC Biol 6:48.
334 J.A. Sharp et al.
Sharp JA, Digby M, Lefevre C, et al. (2009) The comparative genomics of tammar wallaby andfur seal lactation; models to examine function of milk proteins. In: Thompson A, Boland M,Singh H (eds) Milk Proteins: From Expression to Food. Academic Press, New York.
Simpson KJ, Ranganathan S, Fisher JA, Janssens PA, Shaw DC, Nicholas KR (2000) The gene fora novel member of the whey acidic protein family encodes three four-disulfide core domainsand is asynchronously expressed during lactation. J Biol Chem 275:23074–23081.
Simpson KJ, Nicholas KR (2002) The comparative biology of whey proteins. J Mammary GlandBiol 7:313–326.
Tanaka T, Haneda S, Imakawa K, Sakai S, Nagaoka K (2009) A microRNA, miR-101a, con-trols mammary gland development by regulating cyclooxygenase-2 expression. Differentiation77:181–187.
Topcic D, Auguste A, De Leo AA, Lefevre C, Digby MR, Nicholas KR (2009) Characterizationof the tammar wallaby (Macropus eugenii) whey acidic protein gene: new insights into thefunction of the protein. Evol Dev 11:363–375.
Triplett AA, Sakamoto K, Matulka LA, Shen L, Smith GH, Wagner KU (2005) Expression ofthe whey acidic protein (Wap) is necessary for adequate nourishment of the offspring but notfunctional differentiation of mammary epithelial cells. Genesis 43:1–11.
Trott JF, Wilson MJ, Hovey RC, Shaw DC, Nicholas KR (2002) Expression of novel lipocalin-like milk protein gene is developmentally-regulated during lactation in the tammar wallaby,Macropus eugenii. Gene 283:287–297.
Trott JF, Simpson KJ, Moyle RL, et al. (2003) Maternal regulation of milk composition, milkproduction, and pouch young development during lactation in the tammar wallaby (Macropuseugenii). Biol Reprod 68:929–936.
Tyndale-Biscoe CH, Janssens PA (1988) The Developing Marsupial: Models for BiomedicalResearch. Springer, Heidelberg.
Uribe A, Alam M, Johansson O, Midtvedt T, Theodorsson E (1994) Microflora modulatesendocrine cells in the gastrointestinal mucosa of the rat. Gastroenterology 107:1259–1269.
Waite R, Giraud A, Old J, et al. (2005) Cross-fostering in Macropus eugenii leads to increasedweight but not accelerated gastrointestinal maturation. J Exp Zool Part A 303:331–344.
Wang C, Li Q (2007) Identification of differentially expressed microRNAs during the developmentof Chinese murine mammary gland. J Genet Genomics 34:966–973.
Ward RE, Ninonuevo M, Mills DA, Lebrilla CB, German JB (2006) In vitro fermentation of breastmilk oligosaccharides by Bifidobacterium infantis and Lactobacillus gasseri. Appl EnvironMicrob 72:4497–4499.
Wilde CJ, Addey CVP, Boddy-Finch L, Peaker M (1995) Autocrine control of milk secretion:from concept to application. In: Intercellular Signalling in the Mammary Gland. Plenum Press,New York.
Part VIIMarsupial Immune Genes
Janine E. Deakin
Marsupial young are born without an immune system, and yet survive in anenvironment filled with potentially harmful microorganisms. Determining howthese immature young survive in the absence of an immune system has been thesubject of a number of studies over the past several decades. Likewise, compar-isons of the adult immune response of marsupials with that of eutherian mammalshave been carried out in attempt to gain insight into the similarities and differencesbetween immune responses in these two mammalian lineages. The amazing survivalof the “altricial” young would suggest that marsupials are amply able to immunolog-ically protect themselves. However, early studies in this field, hampered by a lack ofmarsupial-specific reagents and sequence information for key immune genes, con-cluded that the immune response of marsupials was inferior to that of their eutheriancounterparts (Jurd, 1994; Wilkinson et al., 1994; Stone et al., 1998). With the releaseof the grey short-tailed opossum and tammar wallaby genome sequences, majoradvances have been made in the field, overturning this idea of inferiority.
The first genomics study of immune genes in marsupials was carried out onthe Major Histocompatibility Complex (MHC), a region of the genome essentialto the immune response. In the first chapter of this part by Cheng et al. we learnof the complexity and organisation of this region in the opossum and wallaby, andhow sequence information from these two model organisms has aided studies intogenetic diversity at MHC loci. Such diversity studies are essential when species con-servation is a concern due to the threat of disease, with the Tasmanian devil beingan obvious example due to its recent addition to the endangered species list as aresult of devil facial tumour disease (DFTD). These studies are equally importantfor determining the efficacy of immunocontraception as an approach to controllingpest populations of marsupials, such as the brushtail possum in New Zealand.
Immunoglobulins (Igs), antigen receptors central to the adaptive immuneresponse, have been studied for over 30 years in marsupials, with initial studiesisolating some of immunoglobulin proteins from several different species (reviewedin Miller and Belov, 2000). Over the past decade, further advances into the char-acterisation of marsupial Igs were made by sequencing the genes encoding Igs,and examining the genomic context of these loci as reviewed here by Baker andcolleagues (Chapter 17). Marsupial-specific antisera to the different types of Igshave now been developed from these sequence data (Rawson et al., 2002) and
336 Part VII Marsupial Immune Genes
have been used to characterise the immune response of tammar wallabies andbrushtail possums (Deakin et al., 2005). Undoubtedly, these antisera will continueto be a tremendous resource for immunological studies in marsupials and furthercharacterisation of the immune response.
Early studies of the marsupial immune response hypothesised that T cell medi-ated responses were inferior to those of eutherian mammals due mainly to poormixed lymphocyte responses and sluggish antibody isotype switching. Despite theseobservations, one of the most interesting findings from genomic studies into mar-supial immune genes comes from an investigation of the receptors found on thesurface of T cells. In addition to four T cell receptors (TCRs) traditionally found ineutherian mammals and other jawed vertebrates, marsupials have a novel TCR, asdiscussed by Baker et al. (Chapter 17).
Perhaps one of the greatest advances in this field is highlighted in Chapter 18,where Morris et al. describe the recent identification of many of the divergentimmune genes, such as the cytokines and antimicrobials. These genes were virtuallyimpossible to isolate by standard laboratory methods due to low levels of sequencesimilarity across taxa. With the release of genomic sequence data for both the opos-sum and wallaby, and the use of sophisticated bioinformatics, the identification ofthese genes has been made possible with remarkable results.
Overall, genomic studies of marsupial immune genes have shown that the mar-supial immune gene repertoire is just as complex as that of eutherians, dispellingthe insinuation of marsupial inferiority (Belov et al., 2007). This perceived “prim-itive” nature of the immune response in marsupials could be attributed to the useof reagents raised against components of the eutherian immune response, whichgene sequencing has shown, are often too divergent to be detected by such reagents.Thanks to the marsupial genome projects, many more marsupial-specific reagentscan now be generated.
Two key areas of continued research are highlighted by the chapters in this part.Firstly, the protection of the altricial young will continue to be a primary focusas it is likely that research in this area could have implications for humans, suchas identifying potential antimicrobial therapies. Secondly, the fate of the Tasmaniandevil population, which is under threat of extinction due to DFTD, may rely not onlyon studies investigating the diversity of MHC genes but determining how the tumourevades detection by the devil’s immune system. Marsupial genomics studies havegreatly advanced our understanding of the genes involved in the immune responsein marsupials. Now we are able to move from simply generating a catalogue ofmarsupial immune genes to determining the function and physiology of the immunesystem in marsupials.
References
Belov K, Sanderson CE, Deakin JE, et al. (2007) Characterization of the opossum immunegenome provides insights into the evolution of the mammalian immune system. Genome Res 17:982–991.

Part VII Marsupial Immune Genes 337
Deakin JE, Belov K, Curach NC, Green P, Cooper DW (2005) High levels of variability in immuneresponse using antigens from two reproductive proteins in brushtail possums. Wildl Res 32:1–6.
Jurd RD (1994) “Not proper mammals”: Immunity in monotremes and marsupials. Comp ImmunolMicrobiol Infect Dis 7:41–52.
Miller RD, Belov K (2000) Immunoglobulin genetics of marsupials. Developmental and compar-ative immunology 24:485–490.
Rawson RR, Belov K, Gidley-Baird AA, Cooper DW (2002) Characterisation of antisera torecombinant IgA of the common brushtail possum (Trichosurus vulpecula). Vet ImmunolImmunopathol 88:89–95.
Stone WH, Brunn DA, Foster EB, et al. (1998) Absence of a significant mixed lymphocyte reactionin a marsupial (Monodelphis domestica). Lab Anim Sci 48:184–189.
Wilkinson R, Kotlarski I, Barton M (1994) Further characterisation of the immune response of thekoala. Vet Immunol Immunopathol 40:325–339.

Chapter 16The Marsupial Major HistocompatibilityComplex
Yuanyuan Cheng, Hannah V. Siddle, and Katherine Belov
Abstract The major histocompatibility complex (MHC) contains genes that playessential roles in the innate and adaptive immune responses, and has been oneof the most studied genomic regions among vertebrates. The marsupial MHC hasbeen intensively investigated in several species, with the genomic organization hav-ing been characterized in the gray short-tailed opossum and tammar wallaby, andgene sequences and genetic diversity examined in a number of representative mar-supials. These studies have significantly contributed to our understanding of themarsupial immune system, evolution of MHC, and wildlife health and conserva-tion. This review will provide a comprehensive summary of current knowledge onthe marsupial MHC.
Keywords Marsupials · MHC · Immunogenetics · Wildlife health
16.1 Introduction
The major histocompatibility complex (MHC) is a gene-dense region found in alljawed vertebrate genomes which contains a large number of genes involved in theimmune response. This cluster of genes was first identified for its critical role indetermining tissue compatibility in transplantation, for which it received its name.Based on the structure and function of their encoded proteins, the MHC genes aregrouped into three classes (class I, class II and class III), and class I and class IIgenes are further classified by function as classical and nonclassical (Parham andStrominger, 1982). Classical class I and class II molecules are involved in anti-gen presentation and have high levels of genetic polymorphism within their peptidebinding regions in most species. Classical class I (class Ia) genes are ubiquitouslyexpressed and encode antigens that function in the recognition and destruction offoreign, virus-infected or malignant cells by cytotoxic T cells (reviewed in Cresswell
K. Belov (B)Faculty of Veterinary Science, The University of Sydney, Sydney, NSW 2006, Australiae-mail: [email protected]
339J.E. Deakin et al. (eds.), Marsupial Genetics and Genomics,DOI 10.1007/978-90-481-9023-2_16, C© Springer Science+Business Media B.V. 2010
340 Y. Cheng et al.
et al., 2005). Therefore, they are also believed to be the major antigens involved inself/nonself discrimination and graft rejection. Nonclassical class I (class Ib) genesencode class I-like molecules, but have varied functions. Compared to class Ia genes,they also have lower expression levels, tissue specific expression and lower levelsof polymorphism (Stroynowski and Lindahl, 1994). MHC class II molecules areresponsible for presenting antigens derived from intravesicular and extracellularpathogens to CD4 helper T cells, which produce chemical signals triggering theproduction of antigen-specific antibodies and an inflammatory response that killsthe pathogens (reviewed in Pieters, 2000). The class III region consists of a hetero-geneous mixture of genes and is classified primarily basing on the location of thesegenes, which is between class I and class II regions in eutherian mammals, ratherthan functional commonality (Klein, 1986).
Early studies of MHC-related immune responses in marsupials, which comprisestudies of skin allograft and mixed lymphocyte culture responses, date back to threeto four decades ago (LaPlante et al., 1969; Yadav et al., 1974; Rowlands, 1976;Wilson et al., 1976). Marsupial MHC genes were not clearly defined until 1987,when Stone and co-workers identified for the first time a marsupial class I locusin the gray short-tailed opossum (Mododelphis domestica) (Stone et al., 1987).Since then, more studies on the marsupial MHC have been undertaken, drivenby the establishment of new marsupial model species and advances in experimen-tal technology. The strong research interest in the marsupial MHC has arisen notonly from its essential role in the immune response and disease resistance, butalso because of its important position phylogenetically in the field of comparativegenomics. This review will present and summarize our current understanding of themarsupial MHC.
16.2 Marsupial MHC Class I Genes
An MHC class I molecule is a heterodimer of a membrane-spanning α chain anda β2-microglobulin chain. The α chain is encoded by the MHC class I gene, com-prised of eight exons translating to three extracellular domains, transmembrane andcytoplasmic domains. The extracellular α1 and α2 domains comprise the peptidebinding domains. The β2-microglobulin chain is not encoded in the MHC region.Under selection pressure from changes in pathogens and environment, MHC genesevolve rapidly in a “birth and death” manner (Nei et al., 1997). A new copy of anMHC gene is “born” from gene duplication, and then subsequently accumulatesmutations, which may provide the gene with a change in function or cause it tobecome a pseudogene (“death” of the gene). As a consequence of this mode of geneevolution, there are multiple copies of class I genes (including classical and nonclas-sical genes and pseudogenes) in the genome of most vertebrate species, which hasalso been observed in marsupials. In addition to their rapid evolution, MHC classI genes undergo species-specific expansions and orthologous relationships betweenclass I genes of different species are difficult to detect.
MHC class I genes and sequences that have been reported in marsupial speciesare summarized in Table 16.1. Up to now, cDNA transcripts of MHC class I genes
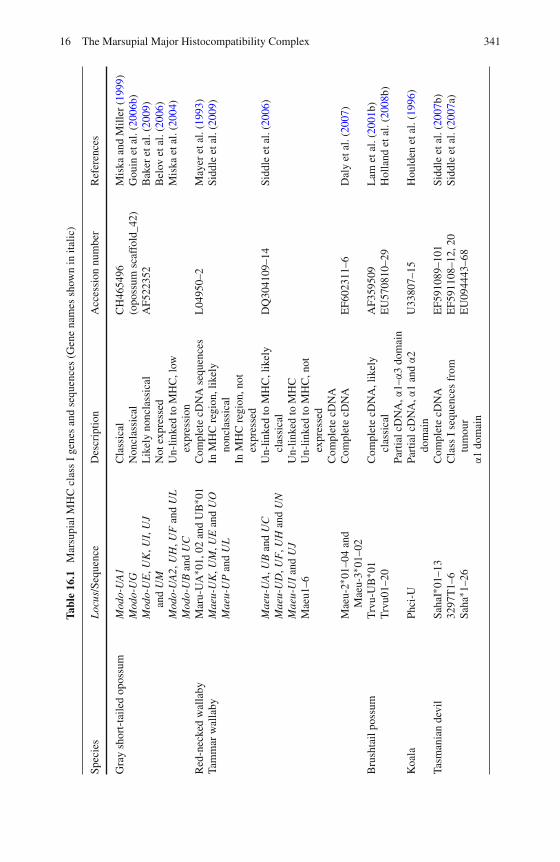
16 The Marsupial Major Histocompatibility Complex 341
Tabl
e16
.1M
arsu
pial
MH
Ccl
ass
Ige
nes
and
sequ
ence
s(G
ene
nam
essh
own
inita
lic)
Spec
ies
Loc
us/S
eque
nce
Des
crip
tion
Acc
essi
onnu
mbe
rR
efer
ence
s
Gra
ysh
ort-
taile
dop
ossu
mM
odo-
UA
1M
odo-
UG
Mod
o-U
E,U
K,U
I,U
Jan
dU
MM
odo-
UA
2,U
H,U
Fan
dU
LM
odo-
UB
and
UC
Cla
ssic
alN
oncl
assi
cal
Lik
ely
nonc
lass
ical
Not
expr
esse
dU
n-lin
ked
toM
HC
,low
expr
essi
on
CH
4654
96(o
poss
umsc
affo
ld_4
2)A
F522
352
Mis
kaan
dM
iller
(199
9)G
ouin
etal
.(20
06b)
Bak
eret
al.(
2009
)B
elov
etal
.(20
06)
Mis
kaet
al.(
2004
)
Red
-nec
ked
wal
laby
Mar
u-U
A∗ 0
1,02
and
UB
∗ 01
Com
plet
ecD
NA
sequ
ence
sL
0495
0–2
May
eret
al.(
1993
)Ta
mm
arw
alla
byM
aeu-
UK
,UM
,UE
and
UO
Mae
u-U
Pan
dU
LIn
MH
Cre
gion
,lik
ely
nonc
lass
ical
InM
HC
regi
on,n
otex
pres
sed
Sidd
leet
al.(
2009
)
Mae
u-U
A,U
Ban
dU
CM
aeu-
UD
,UF
,UH
and
UN
Mae
u-U
Ian
dU
JM
aeu1
–6
Un-
linke
dto
MH
C,l
ikel
ycl
assi
cal
Un-
linke
dto
MH
CU
n-lin
ked
toM
HC
,not
expr
esse
dC
ompl
ete
cDN
A
DQ
3041
09–1
4Si
ddle
etal
.(20
06)
Mae
u-2∗
01–0
4an
dM
aeu-
3∗01
–02
Com
plet
ecD
NA
EF6
0231
1–6
Dal
yet
al.(
2007
)
Bru
shta
ilpo
ssum
Trv
u-U
B∗ 0
1T
rvu0
1–20
Com
plet
ecD
NA
,lik
ely
clas
sica
lPa
rtia
lcD
NA
,α1–
α3
dom
ain
AF3
5950
9E
U57
0810
–29
Lam
etal
.(20
01b)
Hol
land
etal
.(20
08b)
Koa
laPh
ci-U
Part
ialc
DN
A,α
1an
dα
2do
mai
nU
3380
7–15
Hou
lden
etal
.(19
96)
Tasm
ania
nde
vil
Saha
I∗01
–13
3297
T1–
6Sa
ha∗ 1
–26
Com
plet
ecD
NA
Cla
ssI
sequ
ence
sfr
omtu
mou
rα
1do
mai
n
EF5
9108
9–10
1E
F591
108–
12,2
0E
U09
4443
–68
Sidd
leet
al.(
2007
b)Si
ddle
etal
.(20
07a)
342 Y. Cheng et al.
have been identified and sequenced in the following marsupial species: red-neckedwallaby (Macropus rufogriseus) (Mayer et al., 1993), koala (Phascolarctoscinereus) (Houlden et al., 1996), gray short-tailed opossum (Monodelphis domes-tica) (Miska and Miller, 1999), brushtail possum (Trichosurus vulpecula) (Lamet al., 2001b; Holland et al., 2008b), tammar wallaby (Macropus eugenii) (Siddleet al., 2006; Daly et al., 2007) and Tasmanian devil (Sarcophilus harrisii) (Siddleet al., 2007a, b). It has been estimated that there are at least two, three and sevenclass I loci in the red-necked wallaby (Mayer et al., 1993), koala (Houlden et al.,1996) and Tasmanian devil (Siddle et al., 2007b), respectively. Due to the extensivelevel of polymorphism in the sequences and the high degree of similarity betweengenes, it is usually impossible to determine whether two cDNA sequences repre-sent different genes or alleles from a single locus. Fortunately, the availability of thegenome sequence of gray short-tailed opossum and tammar wallaby has allowedinvestigation into the MHC genes at the genomic level in these two species andprovided better understanding of marsupial class I genes.
In the opossum, there are 13 MHC class I loci: Modo-UA1, UA2, UB, UC, UE,UF, UG, UH, UI, UJ, UK, UL and UM (Belov et al., 2006). These genes can bedivided into three groups by expression level. (1) Of all opossum class I genes,Modo-UA1 is the only confirmed classical locus, which is ubiquitously expressedand highly polymorphic. Transcripts of Modo-UA1 have been detected in all tis-sues tested and account for all class Ia cDNAs reported earlier (Miska and Miller,1999). (2) Six genes, Modo-UG, UE, UK, UI, UJ and UM, are proposed to beexpressed class Ib loci. Modo-UG is expressed as three alternatively spliced mRNAvariants, encoding a short cytoplasmic tail that lacks the phosphorylation sites con-served in classical class I molecules, and showing no polymorphism in the peptidebinding regions (Gouin et al., 2006b). Modo-UE, UK, UI, UJ and UM all havetissue-specific expression and show limited levels of polymorphism in peptide bind-ing grooves; Modo-UJ and UM are expressed as alternative splice variants (Bakeret al., 2009). Another two genes, Modo-UB and UC, are suggested to be productsof recent gene duplication events (Miska et al., 2004). They are highly similar toModo-UA1 in sequence, but have much lower expression levels and are unlinked tothe MHC. Without data showing the polymorphism levels, whether they are classi-cal or nonclassical genes remains to be determined. (3) The remaining four class Iloci (Modo-UA2, UH, UF and UL) have not been found expressed in any tissue.Lacking a predicted open reading frame (ORF), UA2 and UH are predicted to bepseudogenes. In addition, orthologues of several human class Ib genes have beenidentified in the opossum, including a MIC gene and a CD1 pseudogene (Baker andMiller, 2007).
The number of class I loci in the tammar wallaby is similar to that observed in theopossum. The wallaby has 15 class I loci, 11 of which are transcribed (Siddle et al.,2009). Investigations on the expression pattern, polymorphism level, phylogeneticrelationship and promoter elements have provided independent lines of evidencesupporting that three (Maeu-UA, UB and UC) of the 15 class I loci are likely clas-sical class I genes. Four loci, Maeu-UK, UM, UE and UO, have characteristics ofclass Ib genes. First, Maeu-UK was found expressed in all tissues examined except
16 The Marsupial Major Histocompatibility Complex 343
skin, whereas Maeu-UM, UE and UO showed tissue specific expression patterns.Second, all four genes have extremely low levels of polymorphism. Finally, the pro-moter elements of these genes show little sequence similarity to the wallaby or opos-sum class Ia genes. The remaining four transcribed loci, Maeu-UD, UF, UH and UN,are expressed at low levels and whether they are class Ia or class Ib genes remainsto be determined. Maeu-UL, UP, UI and UJ show no evidence of expression.
The phylogenetic relationship between marsupial class I genes is shown inFig. 16.1. As mentioned previously, MHC class I genes evolve rapidly, which gen-erates species-specific expansions of genes. As a result, class I genes of marsupial,avian, monotreme and eutherian species form separate clades upon phylogeneticanalysis. The marsupial class I genes form three distinct clades. Clade 1 consists ofclass I sequences from Australian marsupials, including the three class Ia genes(Maeu-UA, UB and UC) of tammar wallaby as well as class I transcripts fromred-necked wallaby (MaruUB∗01), brushtail possum (TrvuUB∗01) and Tasmaniandevil (Saha-I∗01 and Saha-I∗12) that are presumed to be classical. Class Ia genes ofthe opossum, representing the American marsupial species, fall into a sister clade(clade 2) to clade 1, which is not surprising as these species belong to differentorders and are separated by ∼64 million years of evolution in different environments(Nilsson et al., 2003). Clade 3 is of particular interest as it contains all the wallabyclass Ib genes (Maeu-UK, UM, UE and UO), three opossum class Ib genes (Modo-UK, UM and UE) and two class I sequences isolated from brushtail possum (Trvu19and Trvu20). Trvu19 and Trvu20 are highly divergent from the possum classicalTrvuUB∗01 (Holland et al., 2008b). The close phylogenetic relationships betweenTrvu19 and Trvu20 and class Ib genes of the opossum and the wallaby suggest thatthese two sequences may represent class Ib genes of the brushtail possum. It is inter-esting to notice that, within clade 3, the wallaby Maeu-UM and Maeu-UK show clearorthologous relationships with the opossum Modo-UM and Modo-UK. Such orthol-ogy between class Ib genes of distantly related species is highly unusual (Hughesand Nei, 1989). Furthermore, the existence of a UK orthologue in the brushtail pos-sum (Trvu19) suggests that all Australian marsupials may share this class Ib locus.This long-term conservation of UM and UK loci throughout marsupial species maybe an indication of a certain critical, marsupial-specific function of these genes,such as providing immunological protection to the marsupial pouch young, whichare born immuno-naïve (Siddle et al., 2009).
16.3 Marsupial MHC Class II Genes
The MHC class II molecule consists of an α chain and a β chain, which are encodedby an α chain gene (A) and a β chain gene (B) located in the MHC. MHC class IIgenes also evolve in the manner of gene “birth and death”, but at a slower ratecompared to class I genes (Hughes and Nei, 1990; Nei et al., 1997). For this reason,unlike class I genes, which usually show no clear orthology between species, class IIgenes from different species group together into several gene families. Five class IIgene families have been identified in eutherian mammals, designated DM, DN, DP,
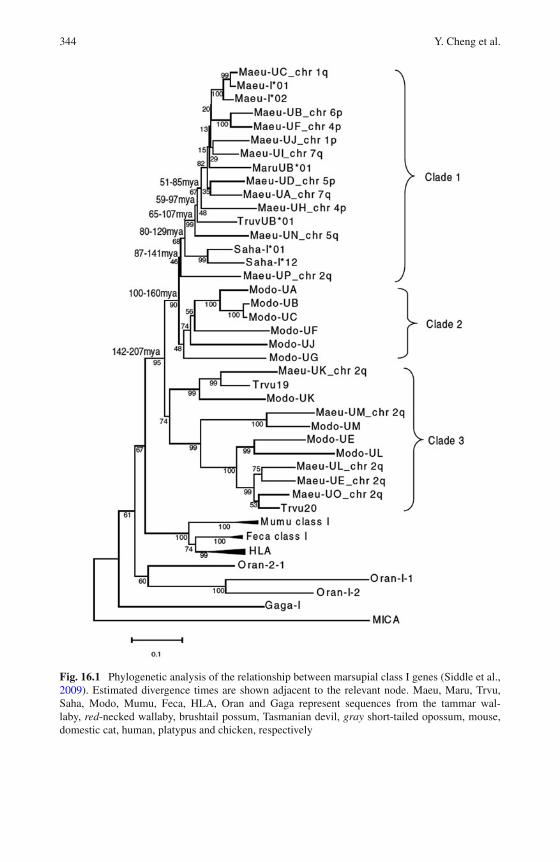
344 Y. Cheng et al.
Fig. 16.1 Phylogenetic analysis of the relationship between marsupial class I genes (Siddle et al.,2009). Estimated divergence times are shown adjacent to the relevant node. Maeu, Maru, Trvu,Saha, Modo, Mumu, Feca, HLA, Oran and Gaga represent sequences from the tammar wal-laby, red-necked wallaby, brushtail possum, Tasmanian devil, gray short-tailed opossum, mouse,domestic cat, human, platypus and chicken, respectively
16 The Marsupial Major Histocompatibility Complex 345
DQ and DR, and the copy number of genes of each family can vary considerablybetween species. In marsupials, there has been a debate upon the nomenclature ofMHC class II gene families. The nomenclature of marsupial DAB and DBB geneswas introduced in the first article to report marsupial class II β sequences, whereSchneider and co-workers (1991) suggested that marsupial class II β genes rep-resent new gene families that are not orthologous to eutherian β gene families.This suggestion was challenged by several authors, who argued that the DAB genesshould belong to the eutherian DRB family (Stone et al., 1999; Lam et al., 2001a).However, an intensive phylogenetic analysis using full-length marsupial class IIsequences from the opossum, red-necked wallaby and brushtail possum, supportsthe distinction of DAB and DBB from eutherian class II gene families (Belov et al.,2004). Since then, the DA and DB nomenclature has been reinstated and adopted inmarsupial MHC class II studies.
Immunohistological studies have demonstrated the expression of MHC class IImolecules in several marsupial species, including the Brazilian white-belly opos-sum (Didelphis albiventris) (Coutinho et al., 1993, 1994), koala (Canfield et al.,1996), northern brown bandicoot (Isoodon macrourus) (Cisternas and Armati, 2000)and the endangered red-tailed phascogale (Phascogale calura) (Old et al., 2006).At the sequence level, MHC class II genes or cDNA transcripts have been iso-lated and characterized in a number of Australian and American marsupial species(Table 16.2). Until now, four class II gene families have been defined in marsu-pial species – DA, DB, DC and DM. Marsupial DM genes, which are orthologousto the eutherian nonclassical class II DM, have been reported in gray short-tailedopossum (O’hUigin et al., 1998; Gouin et al., 2006a) and tammar wallaby (Siddleet al., 2009). DC is a third marsupial-specific class II gene family that has onlybeen identified in the opossum, while the classical DA and DB genes have beencharacterized in most marsupial species studied. Similar to eutherian class II genes,the copy number of DA and DB genes varies greatly between marsupial species asa result of species-specific gene expansion. For instance, there is one pair of DAgenes (DAA and DAB) in the opossum (Belov et al., 2006), whereas there are up to11 DAB loci in the tammar wallaby (Personal Communication), one DAA and at leastthree DAB in the brushtail possum (Holland et al., 2008c), at least five DAB genesin the Tasmanian devil (Personal Communication), and at least four and two DABin the Brazilian gracile mouse opossum (Gracilinanus microtarsus) and gray slen-der mouse opossum (Marmosops incanus) respectively (Meyer-Lucht et al., 2008).Similarly, the number of DB loci also varies between species, with four in the opos-sum (Belov et al., 2006), at least four β chain genes in the tammar wallaby (Chenget al., 2009a), and at least two α chain and two β chain genes in the brushtail possum(Holland et al., 2008c).
16.4 Marsupial Class III Genes
The MHC class III region contains a number of genes involved in the inflamma-tory response and includes members of the tumour necrosis family. Forty-eightclass III genes have been identified in the opossum MHC (Belov et al., 2006). In
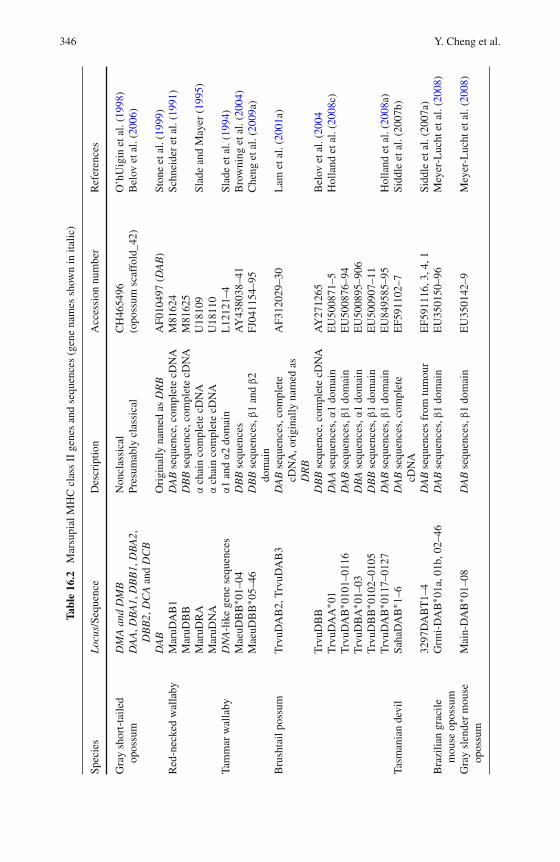
346 Y. Cheng et al.
Tabl
e16
.2M
arsu
pial
MH
Ccl
ass
IIge
nes
and
sequ
ence
s(g
ene
nam
essh
own
inita
lic)
Spec
ies
Loc
us/S
eque
nce
Des
crip
tion
Acc
essi
onnu
mbe
rR
efer
ence
s
Gra
ysh
ort-
taile
dop
ossu
mD
MA
and
DM
BN
oncl
assi
cal
CH
4654
96O
’hU
igin
etal
.(19
98)
DA
A,D
BA
1,D
BB
1,D
BA
2,D
BB
2,D
CA
and
DC
BPr
esum
ably
clas
sica
l(o
poss
umsc
affo
ld_4
2)B
elov
etal
.(20
06)
DA
BO
rigi
nally
nam
edas
DR
BA
F010
497
(DA
B)
Ston
eet
al.(
1999
)R
ed-n
ecke
dw
alla
byM
aruD
AB
1D
AB
sequ
ence
,com
plet
ecD
NA
M81
624
Schn
eide
ret
al.(
1991
)M
aruD
BB
DB
Bse
quen
ce,c
ompl
ete
cDN
AM
8162
5M
aruD
RA
αch
ain
com
plet
ecD
NA
U18
109
Slad
ean
dM
ayer
(199
5)M
aruD
NA
αch
ain
com
plet
ecD
NA
U18
110
Tam
mar
wal
laby
DN
A-l
ike
gene
sequ
ence
sα
1an
dα
2do
mai
nL
1212
1–4
Slad
eet
al.(
1994
)M
aeuD
BB
∗ 01–
04D
BB
sequ
ence
sA
Y43
8038
–41
Bro
wni
nget
al.(
2004
)M
aeuD
BB
∗ 05–
46D
BB
sequ
ence
s,β
1an
dβ
2do
mai
nFJ
0411
54–9
5C
heng
etal
.(20
09a)
Bru
shta
ilpo
ssum
Trv
uDA
B2,
Trv
uDA
B3
DA
Bse
quen
ces,
com
plet
ecD
NA
,ori
gina
llyna
med
asD
RB
AF3
1202
9–30
Lam
etal
.(20
01a)
Trv
uDB
BD
BB
sequ
ence
,com
plet
ecD
NA
AY
2712
65B
elov
etal
.(20
04T
rvuD
AA
∗ 01
DA
Ase
quen
ces,
α1
dom
ain
EU
5008
71–5
Hol
land
etal
.(20
08c)
Trv
uDA
B∗ 0
101–
0116
DA
Bse
quen
ces,
β1
dom
ain
EU
5008
76–9
4T
rvuD
BA
∗ 01–
03D
BA
sequ
ence
s,α
1do
mai
nE
U50
0895
–906
Trv
uDB
B∗ 0
102–
0105
DB
Bse
quen
ces,
β1
dom
ain
EU
5009
07–1
1T
rvuD
AB
∗ 011
7–01
27D
AB
sequ
ence
s,β
1do
mai
nE
U84
9585
–95
Hol
land
etal
.(20
08a)
Tasm
ania
nde
vil
Saha
DA
B∗ 1
–6D
AB
sequ
ence
s,co
mpl
ete
cDN
AE
F591
102–
7Si
ddle
etal
.(20
07b)
3297
DA
BT
1–4
DA
Bse
quen
ces
from
tum
our
EF5
9111
6,3,
4,1
Sidd
leet
al.(
2007
a)B
razi
lian
grac
ilem
ouse
opos
sum
Grm
i-D
AB
∗ 01a
,01b
,02–
46D
AB
sequ
ence
s,β
1do
mai
nE
U35
0150
–96
Mey
er-L
ucht
etal
.(20
08)
Gra
ysl
ende
rm
ouse
opos
sum
Mai
n-D
AB
∗ 01–
08D
AB
sequ
ence
s,β
1do
mai
nE
U35
0142
–9M
eyer
-Luc
htet
al.(
2008
)
16 The Marsupial Major Histocompatibility Complex 347
the tammar wallaby, a 165 kb BAC (bacterial artificial chromosome) clone contain-ing the tammar class III region has been sequenced and 14 class III genes (MCCD1,BAT1, ATP6V1G2, NFKBIL1, LTA, TNF, LTB, NCR3, AIF1, BAT2, BAT3, APOMand C6orf47) have been characterized (Cross et al., 2005; Deakin et al., 2006). Theorganization and sequence of these marsupial class III genes are highly conservedcompared to their eutherian orthologues, with some genes remaining clustered forover 450 million years, predating the divergence of mammals from fish (Deakinet al., 2006). Details of the marsupial cytokine genes that are located in the MHCclass III region are reviewed by Morris et al. (Chapter 18).
16.5 Genetic Organization of Marsupial MHC
The MHC is a mosaic of stretches of conserved framework genes, serving as land-marks in comparative genomic analyses, and stretches of nonconserved class Iand class II genes, which evolve rapidly through species-specific duplications anddiversification (reviewed in Kumanovics et al., 2003; Kelley et al., 2005). In mostvertebrate species studied, the overall organization of the MHC is well conserved,with class I, class II and class III genes clustered together. It has been suggested thatclustering of MHC genes is functionally significant (Trowsdale and Powis, 1992).However, the exception of bony fishes, whose class I, class II and class III regionsare not linked (Fig. 16.2), demonstrates that linkage is not obligatory for gene func-tion (Sato et al., 2000). Comparisons between eutherian and non-mammalian MHCsreveal a major difference in gene organization. The eutherian MHC is organized inthe order of class I-III-II regions, whereas in the non-mammalian MHC, class I andclass II regions are adjacent (reviewed in Kelley et al., 2005).
The opossum MHC has been physically mapped to the centromeric region ofopossum Chromosome 2q (Belov et al., 2006). It is similar to the eutherian MHCin both size (3.95 Mb) and gene complexity (114 genes). However, there is a majordifference between the opossum and eutherian MHC – within the eutherian MHC,class I and class II regions are separated by the class III region and class I genes areinterspersed among a set of framework genes; in the opossum MHC, class I genesare located in the class II region instead of the framework region, giving rise to aclass I/II region, which also contains the antigen processing genes (Fig. 16.2). Suchorganization resembles that seen in non-mammals. In contrast to class I and class IIloci, the gene organization in class III and framework regions is highly conservedcompared to that of eutherian mammals. Based on these findings, a MHC model of atherian ancestor of marsupials and eutherians has been constructed, in which class Iand class II loci are located together (Fig. 16.2) (Belov et al., 2006). It was alsodeduced that a relocation of class I genes from the class II region to the frameworkregion took place after the divergence of marsupials and eutherians, but prior to thedivergence of primates and rodents.
The tammar wallaby MHC is also located on Chromosome 2q (Deakin et al.,2007; Siddle et al., 2009). The genetic organization of the tammar wallaby MHCshows some similarity with that of the opossum MHC as it has a region that
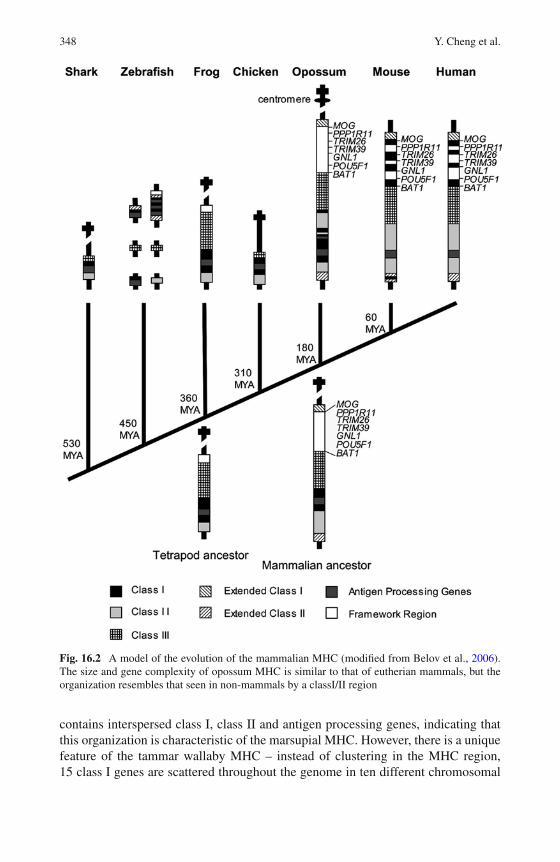
348 Y. Cheng et al.
Fig. 16.2 A model of the evolution of the mammalian MHC (modified from Belov et al., 2006).The size and gene complexity of opossum MHC is similar to that of eutherian mammals, but theorganization resembles that seen in non-mammals by a classI/II region
contains interspersed class I, class II and antigen processing genes, indicating thatthis organization is characteristic of the marsupial MHC. However, there is a uniquefeature of the tammar wallaby MHC – instead of clustering in the MHC region,15 class I genes are scattered throughout the genome in ten different chromosomal
16 The Marsupial Major Histocompatibility Complex 349
locations, across six different chromosomes. Of the 15 tammar class I loci, six arelocated within the MHC region, while the other nine are un-linked to the MHC.In addition, it has been found that the six MHC-linked class I loci are either non-classical or not expressed, while all un-linked class I genes share high levels ofsequence identity and include the three putatively classical class I (Maeu-UA, UBand UC). It has been proposed that the Kangaroo Endogenous RetroViral elements(KERVs) flanking the MHC un-linked class I genes may have been involved inthe duplication and movement of these class I loci. Further studies on the MHCof other marsupials are needed to determine whether class I loci are similarlydistributed in other species. Since the relocation events have been roughly esti-mated to have taken place between 107 and 15 million years ago by moleculardating, we predict that class I loci that are un-linked to the MHC also exist inmany other marsupial species. In fact, in the opossum, there are two class I genes(Modo-UB and UC) that have been mapped to the telomere of Chromosome 2p,distant from the MHC at Chromosome 2q centromere (Belov et al., 2006). Thesetwo genes are highly similar to the opossum classical class I gene and have beenfound expressed. These MHC un-linked classical class I genes of marsupials haveagain raised questions regarding the functional significance of clustering of MHCgenes.
16.6 The Level of MHC Diversity in Marsupials
MHC gene diversity, referring to the genetic variation and polymorphism of MHCmolecules, is a key factor in the successful defence of a host immune systemagainst pathogen infection. In an individual, such genetic diversity is generated bythe expression of multiple functional MHC genes and/or polymorphisms in theseexpressed genes, particularly in the peptide binding region (PBR). A substantialvariety of MHC molecules enable a population to recognize an extensive range ofpathogenic antigens (reviewed in Potts and Slev, 1995).
High levels of class I diversity have been observed in most marsupial speciesstudied. Based on skin graft experiments, Stone and co-workers (1997) suggestedthat the opossum has a high degree of class I polymorphism and rejects allogeneicskin grafts in a manner similar to, though more slowly than, the eutherian mammals.Consistently, high variability at class I loci has been reported for the brushtail pos-sum (Holland et al., 2008b) and tammar wallaby (Siddle et al., 2009), supported bysequencing data.
It has been proposed that marsupials have low MHC class II variability(McKenzie and Cooper, 1994). This suspicion primarily came from the results ofmixed lymphocyte reaction experiments in several marsupial species. Mixed lym-phocyte reactions are a cellular assay that is used to detect differences in MHCalleles between individuals. No or extremely low mixed lymphocyte response wasobserved in the opossum (Wilson et al., 1976; Infante et al., 1991; Stone et al.,1997), koala (Wilkinson et al., 1992) and wallaby (Cooper and McKenzie, 1997),suggesting limited diversity of class II molecules in these species. It was also
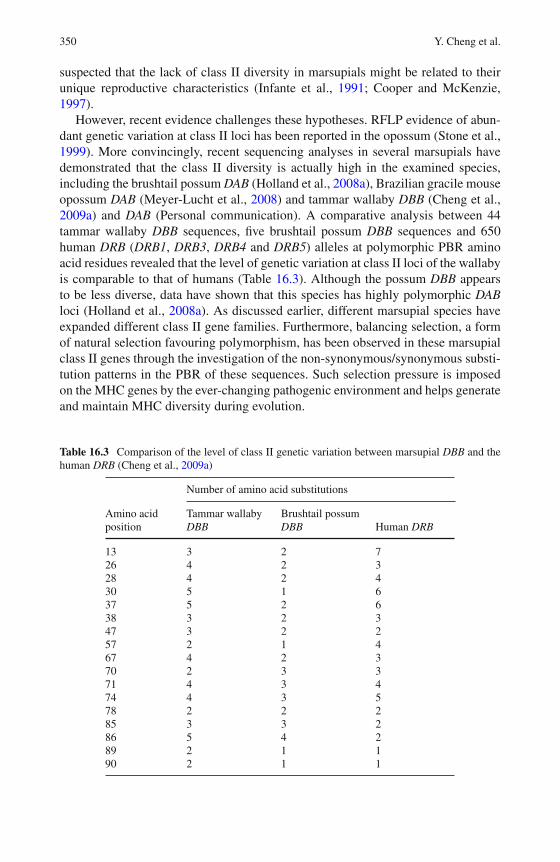
350 Y. Cheng et al.
suspected that the lack of class II diversity in marsupials might be related to theirunique reproductive characteristics (Infante et al., 1991; Cooper and McKenzie,1997).
However, recent evidence challenges these hypotheses. RFLP evidence of abun-dant genetic variation at class II loci has been reported in the opossum (Stone et al.,1999). More convincingly, recent sequencing analyses in several marsupials havedemonstrated that the class II diversity is actually high in the examined species,including the brushtail possum DAB (Holland et al., 2008a), Brazilian gracile mouseopossum DAB (Meyer-Lucht et al., 2008) and tammar wallaby DBB (Cheng et al.,2009a) and DAB (Personal communication). A comparative analysis between 44tammar wallaby DBB sequences, five brushtail possum DBB sequences and 650human DRB (DRB1, DRB3, DRB4 and DRB5) alleles at polymorphic PBR aminoacid residues revealed that the level of genetic variation at class II loci of the wallabyis comparable to that of humans (Table 16.3). Although the possum DBB appearsto be less diverse, data have shown that this species has highly polymorphic DABloci (Holland et al., 2008a). As discussed earlier, different marsupial species haveexpanded different class II gene families. Furthermore, balancing selection, a formof natural selection favouring polymorphism, has been observed in these marsupialclass II genes through the investigation of the non-synonymous/synonymous substi-tution patterns in the PBR of these sequences. Such selection pressure is imposedon the MHC genes by the ever-changing pathogenic environment and helps generateand maintain MHC diversity during evolution.
Table 16.3 Comparison of the level of class II genetic variation between marsupial DBB and thehuman DRB (Cheng et al., 2009a)
Number of amino acid substitutions
Amino acidposition
Tammar wallabyDBB
Brushtail possumDBB Human DRB
13 3 2 726 4 2 328 4 2 430 5 1 637 5 2 638 3 2 347 3 2 257 2 1 467 4 2 370 2 3 371 4 3 474 4 3 578 2 2 285 3 3 286 5 4 289 2 1 190 2 1 1
16 The Marsupial Major Histocompatibility Complex 351
In addition to sequencing analysis, microsatellite loci that are located in the MHCregion have also been applied in the investigation of MHC diversity in marsupials.Due to their linkage to MHC genes and ease of use, MHC-linked microsatelliteshave been increasingly employed as proxies for inferring the level of polymorphismat MHC loci (Aguilar et al., 2004; Doxiadis et al., 2007; Santucci et al., 2007; deGroot et al., 2008; Cheng et al., 2009a). Up to now, ten class I-linked and twoclass II DBB-linked microsatellites have been isolated and characterized in the tam-mar wallaby, some of which can also be used cross-species (Cheng et al., 2009a, b).Consistent with sequencing results obtained from their linked MHC genes, geno-typing data at these microsatellites showed high levels of genetic variation at MHCloci in the tammar wallaby.
16.6.1 MHC Diversity and Wildlife Health
Because of the significant role of MHC genes in immune response and diseaseresistance, the level of MHC diversity can be an important indicator of the immuno-logical fitness of wild populations (Edwards and Potts, 1996). Populations with lowMHC polymorphism will have limited capability to respond to changes in the envi-ronment, such as new diseases (O’Brien and Evermann, 1988). The example ofTasmanian devil and devil facial tumour disease (DFTD) has vividly demonstratedthat a high level of genetic variation at MHC loci is crucial for wildlife populationhealth.
Triggered by the newly emerged and fast spreading DFTD (see Bender,Chapter 23), a great deal of effort has been put into characterizing the immunesystem of devils in recent years. DFTD cells are transferred between individ-uals as allografts without inducing immune rejection (Pearse and Swift, 2006).Investigations on devil MHC genes, especially the class I genes, which play a cen-tral role in the self/nonself recognition and graft rejection, have provided valuableinsights into understanding this unusual disease. Using mixed lymphocyte culture,single strand conformation polymorphism (SSCP) and gene sequencing approaches,it has been shown that Tasmanian devil populations have low levels of genetic vari-ation at MHC class I loci (Siddle et al., 2007a). As the host shares similar class Imolecules with the tumour cells, the host immune system fails to recognize theDFTD cells as foreign tissue. It is believed that a lack of sufficient MHC diver-sity is the most likely explanation for the spread of DFTD in devil populations.A recent large-scale MHC diversity study of devil populations has revealed varia-tion in MHC class I copy number in Tasmanian devils and raises hopes that someanimals have MHC types that are sufficiently different from those of DFTD cells toallow immunological recognition of tumour cells (Siddle et al., 2010).
MHC genetic diversity studies have also been carried out in the koala, with diver-sity studies in class II gene families in different koala populations being evaluated inour laboratory (Jobbins et al., unpublished data). The study of MHC class II genes inthe koala is particularly important, because infectious diseases, such as chlamydialconjunctivitis and lower urogenital tract disease, are highly prevalent and have been
352 Y. Cheng et al.
major causes of morbidity and mortality in koala populations (Brown et al., 1987;Hemsley and Canfield, 1997).
Reduced MHC diversity in wild populations can be caused by genetic bottle-necks, such as in the Tasmanian devil, which has undergone population crashesin recent history and has a low overall genetic diversity level (Jones et al., 2004),and through genetic drift, especially in populations that are confined to islands(Frankham, 1997; Miller and Lambert, 2004). There are many populations of mar-supial species located on offshore islands in Australia. Investigations into MHCdiversity in these populations will facilitate the evaluation of disease susceptibilityand genetic fitness of the population. Such studies have been carried out on tammarwallabies on Kangaroo Island in South Australia. Results have suggested that thiswallaby population is highly genetically diverse at both MHC class I and class IIloci and capable of responding to new disease threats (Cheng et al., 2009a; Siddleet al., 2009).
16.6.2 MHC Diversity and Immunocontraception
Immunocontraception is a method of fertility control that occurs through thegeneration of an autoimmune response to a self-antigen resulting in infertility.Immunocontraceptive approaches are currently being developed to control the num-ber of brushtail possums in New Zealand (Cowan, 2000). The brushtail possum wasintroduced from Australia and is now considered as a major invasive pest in NewZealand. Possums are not only causing extensive damage to native plants and ani-mals, but are also the main wildlife host for bovine tuberculosis and are spreadingthe infection to farm animals (Coleman and Caley, 2000). Genetic variation canlead to the variability of responses to immunocontraceptive vaccines between indi-viduals (Cooper and Larsen, 2006). Therefore, together with the development ofimmunocontraceptive vaccines, a series of in-depth studies have been carried out toinvestigate the genetic variation of possum MHC genes (Holland et al., 2008a–c).High levels of MHC diversity were observed at possum class I and class II loci andthis variation needs to be taken into account during the design of immunocontra-ceptive vaccines. To any vaccine, some individuals in the population are likely tobe resistant. These individuals will be able to breed, rapidly leading to selection fornon-responders (Cooper and Larsen, 2006).
16.7 Future Perspectives
So far, the MHC has only been well characterized for two marsupial species,the gray short-tailed opossum and tammar wallaby. The difference in gene orga-nization between these species highlights the importance of comparative studies.Further investigations of the MHC from other marsupial species will improve ourunderstanding of the marsupial MHC and the evolutionary history of MHC genefamilies. Currently, two Tasmanian devil BAC libraries are under construction and
16 The Marsupial Major Histocompatibility Complex 353
will be used to characterize the devil MHC. MHC diversity studies will continue toexpand our understanding of wildlife health and conservation, especially for mar-supial species or populations constrained to small islands or threatened by disease.Future studies will need to focus on characterization of MHC gene function, withTasmanian devil specific anti-MHC antibodies currently being developed (Siddleet al., unpublished data).
Acknowledgments This work was funded by the Australian Research Council. We thank ourfabulous collaborators Stephan Beck (University College London), Janine Deakin (AustralianNational University), Rob Miller (University of New Mexico) and Michelle Baker (Universityof New Mexico) for their contributions to this work.
References
Aguilar A, Roemer G, Debenham S, Binns M, Garcelon D, Wayne RK (2004) High MHC diversitymaintained by balancing selection in an otherwise genetically monomorphic mammal. ProcNatl Acad Sci USA 101:3490–3494.
Baker ML, Miller RD (2007) Evolution of mammalian CD1: marsupial CD1 is not ortholo-gous to the eutherian isoforms and is a pseudogene in the opossum Monodelphis domestica.Immunology 121:113–121.
Baker ML, Melman SD, Huntley J, Miller RD (2009) Evolution of the opossum major histocompat-ibility complex: evidence for diverse alternative splice patterns and low polymorphism amongclass I genes. Immunology 128:e418–e431.
Belov K, Lam MKP, Colgan DJ (2004) Marsupial MHC class II beta genes are not orthologous tothe eutherian beta gene families. J Hered 95:338–345.
Belov K, Deakin JE, Papenfuss AT, et al. (2006) Reconstructing an ancestral mammalianimmune supercomplex from a marsupial Major Histocompatibility Complex. PLoS Biology4:e46.
Brown AS, Girjes AA, Lavin MF, Timms P, Woolcock JB (1987) Chlamydial disease in koalas.Aust Vet J 64:346–350.
Browning TL, Belov K, Miller RD, Eldridge MDB (2004) Molecular cloning and characteriza-tion of the polymorphic MHC class II DBB from the tammar wallaby (Macropus eugenii).Immunogenetics 55:791–795.
Canfield PJ, Hemsley S, Connolly J (1996) Histological and immunohistological study of thedeveloping and involuting superficial cervical thymus in the koala (Phascolarctos cinereus).J Anat 189:159–169.
Cheng Y, Siddle HV, Beck S, Eldridge MDB, Belov K (2009a) High levels of genetic varia-tion at MHC class II DBB loci in the tammar wallaby (Macropus eugenii). Immunogenetics61:111–118.
Cheng Y, Wakefield M, Siddle HV, et al. (2009b) Isolation and characterization of 10 MHCClass I-associated microsatellite loci in tammar wallaby (Macropus eugenii). Mol Ecol Resour9:346–349.
Cisternas PA, Armati PJ (2000) Immune system cell markers in the northern brown bandicoot,Isoodon macrourus. Dev Comp Immunol 24:771–782.
Coleman J, Caley P (2000) Possums as a reservoir of bovine TB. In: Montague TL (ed) TheBrushtail Possum: Biology, Impact and Management of an Introduced Marsupial. ManaakiWhenua, Lincoln.
Cooper DW, Larsen E (2006) Immunocontraception of mammalian wildlife: ecological andimmunogenic issues. Reproduction 132:821–828.
Cooper DW, McKenzie LM (1997) Genetics of tammar wallabies. In: Saunders N, Hinds L (eds)Marsupial Biology: Recent Research, New Perspectives. UNSW Press, Sydney.
354 Y. Cheng et al.
Coutinho HB, King G, Sewell HF, et al. (1993) Immunocytochemical study of Peyer’s patchesfollicular-associated epithelium in the marsupial, Didelphis albiventris. Dev Comp Immunol17:537–548.
Coutinho HB, Nogueira JC, King G, et al. (1994) Immunocytochemical study of the ontogeny ofPeyer’s patches in the Brazilian marsupial Didelphis albiventris. J Anat 185:347–354.
Cowan E (2000) Biological control of possums. In: Montague TL (ed) The Brushtail Possum:Biology, Impact and Management of an Introduced Marsupial. Manaaki Whenua, Lincoln.
Cresswell P, Ackerman AL, Giodini A, Peaper DR, Wearsch PA (2005) Mechanisms of MHC classI-restricted antigen processing and cross-presentation. Immunol Rev 207:145–157.
Cross JGR, Harrison GA, Coggill P, et al. (2005) Analysis of the genomic region containing thetammar wallaby (Macropus eugenii) orthologues of MHC class III genes. Cytogenet GenomeRes 111:110–117.
Daly K, Church WB, Nicholas K, Williamson P (2007) Comparative modeling of marsupial MHCclass I molecules identifies structural polymorphisms affecting functional motifs. J Exp Zool307A:611–624.
de Groot N, Doxiadis GGM, de Vos-Rouweler AJM, de Groot NG, Verschoor EJ, Bontrop RE(2008) Comparative genetics of a highly divergent DRB microsatellite in different macaquespecies. Immunogenetics 60:737–748.
Deakin JE, Papenfuss AT, Belov K, et al. (2006) Evolution and comparative analysis of the MHCClass III inflammatory region. BMC Genomics 7:281.
Deakin JE, Siddle HV, Cross JGR, Belov K, Graves JAM (2007) Class I genes have split from theMHC in the tammar wallaby. Cytogenet Genome Res 116:205–211.
Doxiadis GGM, de Groot N, Claas FHJ, Doxiadis IIN, van Rood JJ, Bontrop RE (2007) A highlydivergent microsatellite facilitating fast and accurate DRB haplotyping in humans and rhesusmacaques. Proc Natl Acad Sci USA 104:8907–8912.
Edwards SV, Potts WK (1996) Polymorphism of genes in the major histocompatibility complex:implications for conservation genetics of vertebrates. In: Smith TB, Wayne RK (eds) MolecularGenetic Approaches in Conservation. Oxford University Press, Oxford.
Frankham R (1997) Do island populations have less genetic variation than mainland populations?Heredity 78:311–327.
Gouin N, Deakin JE, Miska KB, et al. (2006a) Linkage mapping and physical localization of themajor histocompatibility complex region of the marsupial Monodelphis domestica. CytogenetGenome Res 112:277–285.
Gouin N, Wright AM, Miska KB, et al. (2006b) Modo-UG, a marsupial nonclassical MHC class Ilocus. Immunogenetics 58:396–406.
Hemsley S, Canfield PJ (1997) Histopathological and immunohistochemical investigation of natu-rally occurring chlamydial conjunctivitis and urogenital inflammation in koalas (Phascolarctoscinereus). J Comp Pathol 116:273–290.
Holland OJ, Cowan PE, Gleeson DM, Chamley LW (2008a) High variability in the MHCclass II DA beta chain of the brushtail possum (Trichosurus vulpecula). Immunogenetics 60:775–781.
Holland OJ, Cowan PE, Gleeson DM, Chamley LW (2008b) Identification of novel major his-tocompatibility complex class I sequences in a marsupial, the brushtail possum (Trichosurusvulpecula). Immunogenetics 60:609–619.
Holland OJ, Cowan PE, Gleeson DM, Chamley LW (2008c) Novel alleles in classical majorhistocompatibility complex class II loci of the brushtail possum (Trichosurus vulpecula).Immunogenetics 60:449–460.
Houlden B, Greville W, Sherwin W (1996) Evolution of MHC class I loci in marsupials: charac-terization of sequences from Koala (Phascolarctos cinerus). Mol Biol Evol 13:1119–1127.
Hughes AL, Nei M (1989) Evolution of the major histocompatibility complex: independent originof nonclassical class I genes in different groups of mammals. Mol Biol Evol 6:559–579.
Hughes AL, Nei M (1990) Evolutionary relationships of class II major-histocompatibility-complexgenes in mammals. Mol Biol Evol 7:491–514.
16 The Marsupial Major Histocompatibility Complex 355
Infante AJ, Samples NK, Croix DA, Redding TS, VandeBerg JL, Stone WH (1991) Cellularimmune response of a marsupial, Monodelphis domestica. Dev Comp Immunol 15:189–199.
Jones ME, Paetkau D, Geffen E, Moritz C (2004) Genetic diversity and population structure ofTasmanian devils, the largest marsupial carnivore. Mol Ecol 13:2197–2209.
Kelley J, Walter L, Trowsdale J (2005) Comparative genomics of major histocompatibilitycomplexs. Immunogenetics 56:683–695.
Klein J (1986) Natural History of the Major Histocompatibility Complex. Wiley, New York.Kumanovics A, Takada T, Lindahl KF (2003) Genomic organization of the mammalian MHC.
Annu Rev Immunol 21:629–657.Lam MKP, Belov K, Harrison GA, Cooper DW (2001a) Cloning of the MHC class II DRB cDNA
from the brushtail possum (Trichosurus vulpecula). Immunol Letters 76:31–36.Lam MKP, Belov K, Harrison GA, Cooper DW (2001b) An Mhc class I gene in the Australian
brushtail possum (Trichosurus vulpecula). Immunogenetics 53:430–433.LaPlante ES, Burrell R, Watre AL, Taylor DL, Zimmermann B (1969) Skin allograft studies in the
pouch of the young opossum. Transplantation 7:67–72.Mayer WE, Williams NS, O’hUigin C, Vincek V, Zaleska-Rutczynska Z, Klein J (1993) Class I
major histocompatibility complex genes of the red-necked wallaby, Macropus rufogriseus. MolPhylogenet Evol 2:23–30.
McKenzie LM, Cooper DW (1994) Low MHC class II variability in a marsupial. Reprod Fert Dev6:721–726.
Meyer-Lucht Y, Otten C, Puttker T, Sommer S (2008) Selection, diversity and evolutionary patternsof the MHC class II DAB in free-ranging Neotropical marsupials. BMC Genetics 9:39.
Miller HC, Lambert DM (2004) Genetic drift outweighs balancing selection in shaping post-bottleneck major histocompatibility complex variation in New Zealand robins (Petroicidae).Mol Ecol 13:3709–3721.
Miska KB, Miller RD (1999) Marsupial Mhc class I: classical sequences from the opossum,Monodelphis domestica. Immunogenetics 50:89–93.
Miska KB, Wright AM, Lundgren R, et al. (2004) Analysis of a marsupial MHC region containingtwo recently duplicated class I loci. Mamm Genome 15:851–864.
Nei M, Gu X, Sitnikova T (1997) Evolution by the birth-and-death process in multigene familiesof the vertebrate immune system. Proc Natl Acad Sci USA 94:7799–7806.
Nilsson MA, Gullberg A, Spotorno AE, Arnason U, Janke A (2003) Radiation of extant marsu-pials after the K/T boundary: evidence from complete mitochondrial genomes. J Mol Evol57:S3–S12.
O’Brien S, Evermann J (1988) Interactive influence of infectious disease and genetic diversity innatural populations. Trends Ecol Evol 3:254–259.
O’hUigin C, Sultmann H, Tichy H, Murray BW (1998) Isolation of Mhc class II DMA and DMBcDNA sequences in a marsupial: the gray short-tailed opossum (Monodelphis domestica).J Mol Evol 47:578–585.
Old JM, Carman RL, Fry G, Deane EM (2006) The immune tissues of the endangered red-tailedphascogale (Phascogale calura). J Anat 208:381–387.
Parham P, Strominger JL (eds) (1982) Histocompatibility Antigens Structure and Function.Receptors and Recognition Series B, Vol 14. Chapman and Hall, New York.
Pearse AM, Swift K (2006) Allograft theory: transmission of devil facial-tumour disease. Nature439:549–549.
Pieters J (2000) MHC class II-restricted antigen processing and presentation. Adv Immunol75:159–208.
Potts WK, Slev PR (1995) Pathogen-based models favoring MHC genetic diversity. Immunol Rev143:181–197.
Rowlands DT (1976) Immunity in prototherian and metatherian mammals. In: Marchalonis JJ (ed)Comparative Immunology. Blackwell Scientific, London, pp. 367–389.
Santucci F, Ibrahim KM, Bruzzone A, Hewit GM (2007) Selection on MHC-linked microsatelliteloci in sheep populations. Heredity 99:340–348.
356 Y. Cheng et al.
Sato A, Figueroa F, Murray BW, et al. (2000) Nonlinkage of major histocompatibility complexclassI and classII loci in bony fishes. Immunogenetics 51:108–116.
Schneider S, Vincek V, Tichy H, Figueroa F, Klein J (1991) MHC class II genes of a marsupial,the red-necked wallaby (Macropus rufogriseus): identification of new gene families. Mol BiolEvol 8:753–766.
Siddle HV, Deakin JE, Baker ML, Miller RD, Belov K (2006) Isolation of major histocompati-bility complex Class I genes from the tammar wallaby (Macropus eugenii). Immunogenetics58:487–493.
Siddle HV, Kreiss A, Eldridge MDB, et al. (2007a) Transmission of a fatal clonal tumor by bitingoccurs due to depleted MHC diversity in a threatened carnivorous marsupial. Proc Natl AcadSci USA 104:16221–16226.
Siddle HV, Marzec J, Cheng Y, Jones M, Belov K (2010) MHC gene copy number variation inTasmanian devils: implications for the spread of a contagious cancer. Proc Biol Sci. Publishedonline March 10, 2010 doi:10.1098/rspb.2009.2362.
Siddle HV, Sanderson C, Belov K (2007b) Characterization of major histocompatibility complexclass I and class II genes from the Tasmanian devil (Sarcophilus harrisii). Immunogenetics59:753–760.
Siddle HV, Deakin JE, Coggill P, et al. (2009) MHC-linked and un-linked class I genes in thewallaby. BMC Genomics 10:310.
Slade RW, Mayer WE (1995) The expressed class II alpha-chain genes of the marsupialmajor histocompatibility complex belong to eutherian mammal gene families. Mol Biol Evol12:441–450.
Slade RW, Hale PT, Francis DI, Graves JAM, Sturm RA (1994) The marsupial MHC: the tammarwallaby, Macropus eugenii, contains an expressed DNA-like gene on chromosome 1. J MolEvol 38:496–505.
Stone WH, Samples NK, Kraig E, VandeBerg JL (1987) Definition of class I antigens of the MHCof a marsupial (Monodelphis domestica). Arch Zootec 36:219–235.
Stone WH, Manis GS, Hoffman ES, Saphire DG, Hubbard GB, VandeBerg JL (1997) Fateof allogeneic skin transplantations in a marsupial (Monodelphis domestica). Lab Anim Sci47:283–287.
Stone WH, Bruun DA, Fuqua C, et al. (1999) Identification and sequence analysis of an Mhc classII B gene in a marsupial (Monodelphis domestica). Immunogenetics 49:461–463.
Stroynowski I, Lindahl KF (1994) Antigen presentation by non-classical class I molecules. CurrOpin Immunol 6:38–44.
Trowsdale J, Powis SH (1992) The Mhc: relationship between linkage and function. Curr OpinGenet Dev 2:492–497.
Wilkinson R, Kotlarski I, Barton M (1992) Koala lymphoid cells: analysis of antigen-specificresponses. Vet Immunol Immunop 33:237–247.
Wilson DB, Fox DH, Rowlands DT (1976) Proliferative reactivity of opossum peripheral bloodleukocytes to allogeneic cells, mitogens and specific antigens. Transplantation 21:164–167.
Yadav M, Waring H, Stanley NF (1974) Effect of thymectomy on skin allograft survival in amacropod marsupial Setonix brachyurus. Transplantation 17:30–36.
Chapter 17Marsupial Immunoglobulin and T Cell ReceptorGenomics
Michelle L. Baker, Xinxin Wang, and Robert D. Miller
Abstract The development of marsupial genomic resources has provided a wealthof information for the study of the development and function of the adaptive immunesystem in these remarkable mammals. Here is reviewed the organization, content,and evolutionary history of the genes encoding the antigen specific receptors of theadaptive immune system, the immunoglobulins and T cell receptors. Included isone of the more unexpected outcomes of marsupial genomics, the discovery of apreviously unknown TCR chain, not found in eutherian mammals. In addition, howthe genomic complexity of the Ig and TCR genes influences their expression and itsrelationship to what is known about marsupial immune responses is also presented.Although this review focuses primarily on work done for Monodelphis domestica,research on other marsupial species is also included.
Keywords Genomics · Immunity · Immunoglobulin · Marsupial · T cell receptor
17.1 Introduction
The evolution of the gnathostomata, or jawed vertebrates, was accompanied by anumber of innovations in the adaptive immune system, the hallmarks of whichare antigen specific responses resulting not only in the control and elimination ofpathogens but also the establishment of immune memory. Unique to the jawedvertebrates are two antigen receptor systems that mediate specific recognition ofantigens: the immunoglobulins and the T cell receptors. Immunoglobulins (Ig) aresynthesized by B lymphocytes and are expressed both as cell surface molecules (theB cell receptor [BCR]) where they participate in antigen recognition and cell activa-tion, and also as secreted forms (antibodies) where they directly mediate pathogen
R.D. Miller (B)Department of Biology, Center for Evolutionary and Theoretical Immunology, The Universityof New Mexico, Albuquerque, NM 87131, USAe-mail: [email protected]
357J.E. Deakin et al. (eds.), Marsupial Genetics and Genomics,DOI 10.1007/978-90-481-9023-2_17, C© Springer Science+Business Media B.V. 2010
358 M.L. Baker et al.
clearance. T cell receptors (TCR) on the other hand exist solely as recognition andactivating receptors on the surface of T lymphocytes. The mode of antigen recog-nition also differs between Ig and TCR. Ig generally bind intact, native antigenstructures, whereas TCR bind antigens that have been processed into typically smallpeptide fragments that are presented on the cell surface bound by molecules of theMajor Histocompatibility Complex (MHC).
The protein domains of both Ig and TCR that directly contact antigens arecalled the variable (V) domains. A unique feature of these domains is that theyare encoded by exons that exist as incomplete or fragmented gene segments in thegerm-line genome (Tonegawa, 1983). The gene segments, named V, D (diversity),and J (joining) genes, are assembled into a complete exon through somatic DNArearrangements in developing lymphocytes, the so-called V(D)J recombination.This process is dependent on the recombination activating gene (RAG) recombi-nase system, which is an endonuclease complex that recognizes specific nucleotidesequences, called the recombination signal sequences (RSS), that flank each genesegment (reviewed in Sekiguchi et al., 2004). The possible combinations of genesegments, along with variation in nucleotides at the junctions between recombinedsegments, results in the typical mammalian Ig and TCR loci being able to encode onthe order of 1015–1017 different receptor specificities. It is this vast potential recep-tor repertoire that is the basis for having clonally diverse B and T cells, providing abroad recognition coverage of rapidly evolving pathogens.
The V, D, and J gene segments, along with the exon encoding the constant (C)regions of the Ig and TCR, are generally found organized in two possible ways:translocon or cluster. The translocon organization is the most common and the V,D, and J gene segments exist in distinct arrays as (V)n – (D)n – (J)n – C. This orga-nization is found in all conventional TCR genes analyzed so far, and the Ig genesof bony fish and tetrapods (Flajnik, 2002). Based on recent analysis of the genomicorganization TCRγ chain in a cartilaginous fish it appears that the translocon is theancestral form for TCR (Chen et al., 2009). For clarification, the term “conven-tional” TCR is meant to denote the four TCR chains that are known to be present inall jawed-vertebrates, α, β, γ and δ, and to distinguish them from the atypical TCRμ,found only so far in marsupials and monotremes (Parra et al., 2007, 2008). Geneswith the cluster organization have the gene segments organized in cassettes of (V –[D] – J – C)n with multiple, sometimes hundreds of such cassettes or clusters beingfound throughout the genome. This organization has mostly been found in the Iggenes of cartilaginous fishes, and the number of D segments per cluster can vary(Flajnik, 2002).
Although clearly sharing a common origin, Ig and TCR have followed distinctevolutionary paths, resulting in contrasting degrees of conservation and plasticitybetween the two receptor systems. For example, two isotypes of TCR have beenidentified in all jawed vertebrates: the αβTCR, composed of a heterodimer of analpha and beta chain, and the γδTCR composed of gamma and delta chains. Theconservation of these two isotypes across the whole of jawed vertebrates may bea reflection of their use solely as receptors for antigen recognition. Only recentlyhave TCR isotypes other than the conventional α, β, γ, and δ chains been discovered.
17 Marsupial Immunoglobulin and T Cell Receptor Genomics 359
These include the TCRμ chain found in marsupials and monotremes, but apparentlylacking in eutherian mammals, as well as the NAR-TCR chain in cartilaginous fishes(Baker et al., 2005a; Criscitiello et al., 2006; Parra et al., 2007, 2008).
In contrast to the relatively conserved nature of the TCR, the Ig have evolved awider array of isotypes, some of which appear to be specific to particular vertebratelineages. The typical Ig is composed of four proteins, two identical heavy chainsand two identical light chains, with the isotype of the secreted antibody being deter-mined by its heavy chain. Differences in the C regions of the heavy chains impartdifferent functional roles on the isotype of the secreted antibody. Some isotypes,such as IgM, have been conserved throughout gnathostome evolution, whereas oth-ers such as IgG and IgE are lineage specific (mammalian in this case). IgD, onthe other hand, is an apparently ancient Ig isotype but appears to have a spottydistribution across vertebrate lineages (Ohta and Flajnik, 2006).
In addition to there being a greater diversity of effector functions associated withIg heavy chain C regions, there is also greater variation in the genetic contribu-tions to diversity of binding specificities in antibodies among species. Notably thereis an association between genomic organization and complexity of the Ig genesand patterns of B cell ontogeny (reviewed in Butler, 1997). In rabbits and chickensfor example, V(D)J recombination alone is not sufficient to produce a diverse pri-mary antibody repertoire and in both these species developing B cells migrate toa secondary site (the appendix in rabbits and the Bursa of Fabricius in chickens)where the rearranged V(D)J segments are further mutated before the B cells enterthe primary pool. In contrast mice and humans are able to generate diverse antibodyspecificities solely through V(D)J recombination due to a diverse and complex arrayof gene segments (reviewed in Butler, 1997). Therefore, even lineages as closelyrelated as lagomorphs (rabbits) and rodents (mice) can be distinctly different in howtheir primary antibody repertoires are constructed and these are a direct reflectionof the genomic content and organization of their Ig genes.
The altricial nature of the newborn marsupial makes them ideal models to studyearly development in the immune system and the evolution of maternal immunity.Some cross-reactive antibodies directed against evolutionarily conserved peptidesequences present in human T and B cells and a limited number of marsupial spe-cific reagents have been used successfully for immunohistochemistry on marsupialtissues and cells from adults (Jones et al., 1993; Wilkinson et al., 1995; Hemsleyet al., 1995; Baker et al., 1999) and developing marsupials (Coutinho et al., 1993,1995; Canfield et al., 1996; Baker et al., 1999; Cisternas and Armati, 2000). Overall,these studies have demonstrated a pattern of T and B cell distribution in lymphoidtissues similar to that of eutherian mammals. However, overall such research hasbeen limited by a scarcity of marsupial specific reagents.
The completion of the first marsupial genome project along with extensive anal-ysis of expressed Ig and TCR chains has provided a near complete picture of thegenomic contributions to Ig and TCR diversity and expression in the gray short-tailed opossum, Monodelphis domestica (Mikkelsen et al., 2007; Parra et al., 2008,2009; Wang et al., 2009). The level of detail available helps put this species onpar with more developed eutherian model organisms such as mice and humans.
360 M.L. Baker et al.
In addition, the Ig and TCR genes of several other marsupial species have beenanalyzed at least at the level of cDNA clones providing the opportunity to makesome generalizations regarding the evolution and function of these receptors inmetatherians.
17.2 Marsupial B Cell Development, Antibody Responses,and Ig Genetics
Some of the earliest experiments performed on marsupial immune systems weremeasuring antibody responses (Kalmutz, 1962). This is not surprising given that themethods for detection and quantification of serum Ig were developed by the earlytwentieth century. Early studies of antibody responses in marsupials were consistentwith differences in both the kinetics and magnitude of primary and secondary anti-body responses compared with eutherian mammals. Prolonged primary antibodyresponses have been reported in M. domestica, Setonix brachyurus and Trichosurusvulpecula, with elevated IgG responses lasting 37, 26 and 15 weeks respectively(Yadav, 1971; Croix et al., 1989; Deakin et al., 2005). Secondary responses havebeen described as being delayed and lower in magnitude compared with those ofeutherian mammals. In addition, the presence of a substantial amount of IgM inthe secondary response supports poor isotype switching in marsupials (Croix et al.,1989; Stanley et al., 1972; Wilkinson et al., 1992a; Shearer et al., 1995). Morerecently, studies using variations on the traditional immunization protocols used foreutherian mammals have reported more comparable antibody responses to those ofeutherian mammals (Kitchener et al., 2002; Deakin et al., 2005; McLelland et al.,2005; Asquith et al., 2006).
17.2.1 The Immunoglobulin Heavy Chain Locus
From the analysis of cDNA sequences it was determined that marsupials have atypically mammalian repertoire of Ig isotypes. Four Ig heavy chain (IgH) isotypes(M, G, E, and A) have been described in marsupials (Miller et al., 1998; Aveskoghand Hellman, 1998; Aveskogh et al., 1999; Belov et al., 1999a, b, c; Daly et al.,2007). The only isotype that appears to be missing is IgD, which is found in theother two mammalian lineages, the eutherians and the monotremes, and some non-mammalian lineages (Ohta and Flajnik, 2006; Wang et al., 2009).
Prior to the completion of the M. domestica genome, the locations of the genesencoding the IgH chains (IGH) were localized to chromosome (chr) 1 using in situhybridization on metaphase chromosomes (Deakin et al., 2006a). The availabilityof the opossum whole genome sequence has provided a more detailed view of thegenomic landscape surrounding the IGH locus and its overall organization. The locion the centromeric side of IGH share a high degree of conserved synteny betweenopossum chr 1 and human and mouse chr 14 and 12, respectively (Fig. 17.1). Genes
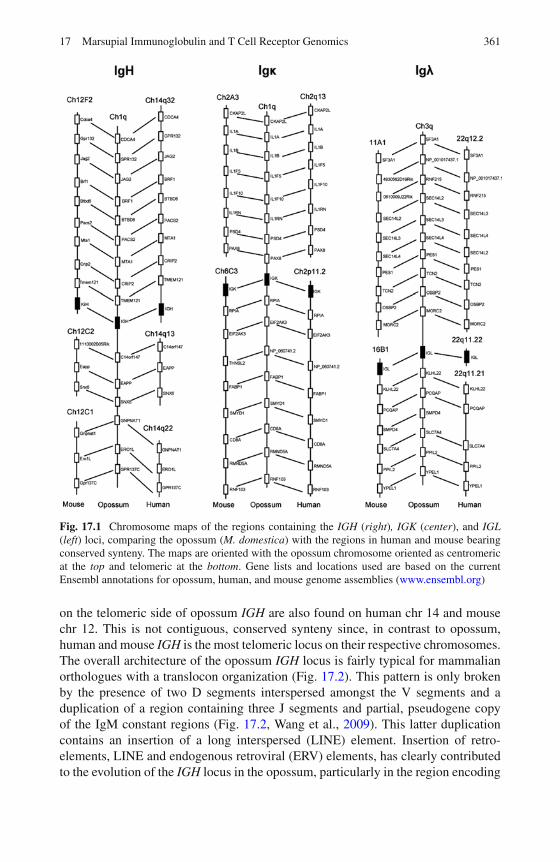
17 Marsupial Immunoglobulin and T Cell Receptor Genomics 361
Fig. 17.1 Chromosome maps of the regions containing the IGH (right), IGK (center), and IGL(left) loci, comparing the opossum (M. domestica) with the regions in human and mouse bearingconserved synteny. The maps are oriented with the opossum chromosome oriented as centromericat the top and telomeric at the bottom. Gene lists and locations used are based on the currentEnsembl annotations for opossum, human, and mouse genome assemblies (www.ensembl.org)
on the telomeric side of opossum IGH are also found on human chr 14 and mousechr 12. This is not contiguous, conserved synteny since, in contrast to opossum,human and mouse IGH is the most telomeric locus on their respective chromosomes.The overall architecture of the opossum IGH locus is fairly typical for mammalianorthologues with a translocon organization (Fig. 17.2). This pattern is only brokenby the presence of two D segments interspersed amongst the V segments and aduplication of a region containing three J segments and partial, pseudogene copyof the IgM constant regions (Fig. 17.2, Wang et al., 2009). This latter duplicationcontains an insertion of a long interspersed (LINE) element. Insertion of retro-elements, LINE and endogenous retroviral (ERV) elements, has clearly contributedto the evolution of the IGH locus in the opossum, particularly in the region encoding
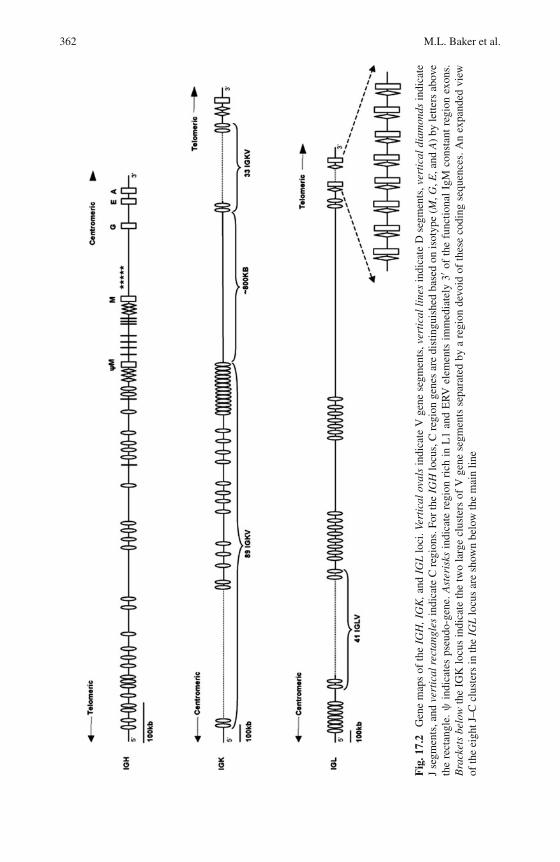
362 M.L. Baker et al.
Fig
.17.
2G
ene
map
sof
the
IGH
,IG
K,a
ndIG
Llo
ci.V
erti
calo
vals
indi
cate
Vge
nese
gmen
ts,v
erti
call
ines
indi
cate
Dse
gmen
ts,v
erti
cald
iam
onds
indi
cate
Jse
gmen
ts,a
ndve
rtic
alre
ctan
gles
indi
cate
Cre
gion
s.Fo
rth
eIG
Hlo
cus,
Cre
gion
gene
sar
edi
stin
guis
hed
base
don
isot
ype
(M,G
,E,a
ndA
)by
lette
rsab
ove
the
rect
angl
e.ψ
indi
cate
sps
eudo
-gen
e.A
ster
isks
indi
cate
regi
onri
chin
L1
and
ER
Vel
emen
tsim
med
iate
ly3′
ofth
efu
nctio
nal
IgM
cons
tant
regi
onex
ons.
Bra
cket
sbe
low
the
IGK
locu
sin
dica
teth
etw
ola
rge
clus
ters
ofV
gene
segm
ents
sepa
rate
dby
are
gion
devo
idof
thes
eco
ding
sequ
ence
s.A
nex
pand
edvi
ewof
the
eigh
tJ–C
clus
ters
inth
eIG
Llo
cus
are
show
nbe
low
the
mai
nlin
e
17 Marsupial Immunoglobulin and T Cell Receptor Genomics 363
the constant genes (Wang et al., 2009). They are not only associated with both anunusual duplication that resulted in a pseudogene copy of IgM but also may havecontributed to the loss of IgD in M. domestica (see below). The exons encoding theconstant regions are also in the conserved order of 5′-M > G > E > A-3′ (Fig. 17.2).
From the analysis of Ig heavy chain transcripts in the opossum and other marsu-pial species there appeared to be only a single IgG. This is in contrast to predictionsmade from analysis of serum Ig in M. domestica and other marsupials (Bell et al.,1974; Bell, 1977; Shearer et al., 1995). Analysis of the whole genome assemblyrevealed only a single set of exons encoding conserved IgG constant regions. Thegenomic organization and content are consistent with what was predicted fromthe cDNA analysis of there being three extra-cellular constant region domains anda single hinge region encoding exon in marsupial IgG (Aveskogh and Hellman,1998; Belov et al., 1999a). The discrepancy between the serum protein data and thegenomic data may have a number of possible explanations. First Ig heavy chains areoften glycosylated and it is possible that there are distinct patterns of glycosylationthat made it appear that there was more than one IgG subclass based on molecularweight. Alternatively, the methods used to purify the serum IgG may have led tofalse conclusions. The majority of these experiments used Staphylococcal ProteinA (SpA) based purification that is expected to preferentially enrich for IgG throughbinding to its C domain. However, marsupial IgM has also been shown to bindSpA, so it is possible that this purification method inadvertently enriches for mul-tiple heavy chain isotypes. SpA has also been shown to act as a super-antigen forhuman Ig containing clan III V domains (Silverman and Goodyear, 2002). Sinceall marsupial VH are also clan III it is possible that SpA is binding the V domainsof some marsupial Ig rather than the C domains (Baker et al., 2005b; Wang et al.,2009).
The exons encoding IgD are typically immediately downstream of those encod-ing IgM and IgD and IgM can be co-expressed in some species through alternativemRNA splicing. A thorough search of the M. domestica genome sequence failedto identify any coding sequences with homology to IgD (Wang et al., 2009).Furthermore, the region of the opossum genome expected to contain IgD containstwo large repetitive insertions, each over 15 kb in length composed of a mixture ofLINE and ERV elements (Wang et al., 2009). Whether a similar insertion is presentin other marsupials isn’t known. How old these insertions are and if they contributedto the loss of IgD in the opossum lineage are also not known. Nonetheless, it is prettyclear that the absence of IgD in the opossum is due to a gene loss given the ancientnature of this isotype and its presence in the other mammalian lineages (Ohta andFlajnik, 2006; Wang et al., 2009).
The diversity of expressed IgH V domains (VH) has been published for two mar-supial species, M. domestica and the brushtail possum T. vulpecula (Miller et al.,1998; Aveskogh et al., 1999; Baker et al., 2005b). In addition the VH repertoireof the tammar wallaby Macropus eugenii has also been extensively sampled at thecDNA level (Fig. 17.3). Several general conclusions could be drawn from the analy-sis of the diversity of marsupial Ig cDNA clones. The first is all expressed marsupialVH belong to a single evolutionary clan, called clan III. This is an ancient and
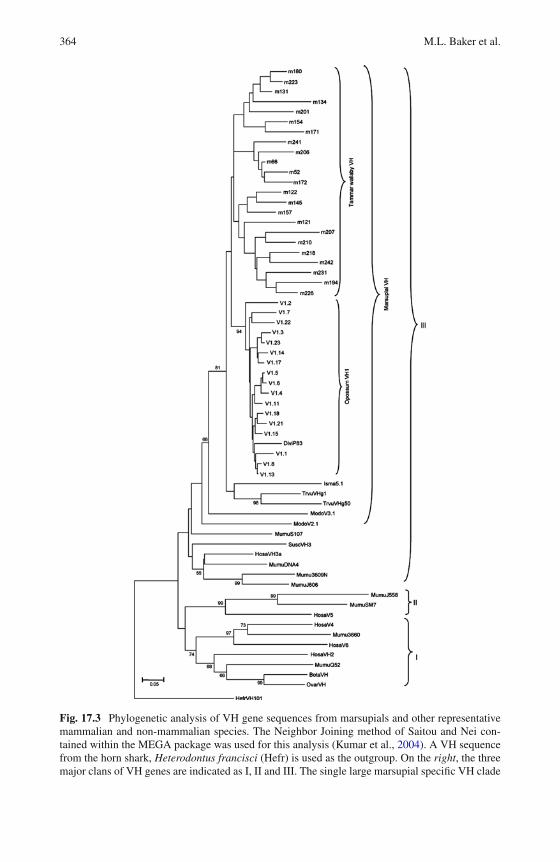
364 M.L. Baker et al.
Fig. 17.3 Phylogenetic analysis of VH gene sequences from marsupials and other representativemammalian and non-mammalian species. The Neighbor Joining method of Saitou and Nei con-tained within the MEGA package was used for this analysis (Kumar et al., 2004). A VH sequencefrom the horn shark, Heterodontus francisci (Hefr) is used as the outgroup. On the right, the threemajor clans of VH genes are indicated as I, II and III. The single large marsupial specific VH clade
17 Marsupial Immunoglobulin and T Cell Receptor Genomics 365
ubiquitous clan and is the most conserved of all the VH clans so it is not surpris-ing that they are present in marsupials (Tutter and Riblet, 1989). What is surprisingis that all marsupials species studied so far have only clan III VH genes and theyare all highly similar, forming a “marsupial-only” monophyletic clade (Baker et al.,2005b). This is not due to the analyses being performed on species that are closelyrelated. The divergence times for M. domestica, T. vulpecula, and M. eugenii are onpar with that of eutherian lineages such as humans and mice that have more diverseVH repertoires (Baker et al., 2005b; Das et al., 2008).
One of the more unusual features in the opossum IGH locus is the presence of apartially germ-line joined V gene, designated VH3.1 (Wang et al., 2009). This genesegment is longer than a typical V gene by 14 codons and appears to be a V segmentalready fused to a D segment in the germ-line DNA. The sequence and genomicorganization of this VH gene segment has been confirmed by direct sequencingof M. domestica genomic DNA to ensure that it is not an assembly artifact (seeGenBank accession no. EU592040). Typical Ig and TCR V gene segments are com-posed of two exons separated by a short intron. Exon 1 encodes most of the leader(L) sequence and exon 2 encodes most of the extracellular V domain and ends atthe RSS. The partially germ-line joined VH3.1 gene segment retains both the intronand RSS and the latter contains a 12 base pair spacer typical of DH segments, ratherthan the 23 bp spacer of a VH segment RSS. VH3.1, therefore, appears to be theresult of RAG-mediated recombination (Wang et al., 2009). Partial or fully germ-line joined gene segments have been found in the Ig loci of cartilaginous and bonyfishes and birds, however this is the first such Ig gene segment to be described ina mammal (Kokubu et al., 1988; Reynaud et al., 1989; Ventura-Holman and Lobb,2002). Their origin is thought to be due to ectopic activation of V(D)J recombina-tion in germ cells (Lee et al., 2000). Full or partially germ-line joined V genes havebeen shown to contribute to the antibody repertoires in non-mammalian species. Insharks they are used in the early neonatal antibody repertoire (Rumfelt et al., 2001).In chicken they contribute by being a source of sequence variation by modifying theprimary antibody repertoire through gene conversion mechanisms (Reynaud et al.,1989). Interestingly the structure of VH3.1 resembles that of V pseudogenes foundin the chicken IGH locus, which are also partially germline joined V to D genesegments (Reynaud et al., 1989). VH3.1 appears to be completely functional, withan open reading frame (ORF) and canonical RSS (Wang et al., 2009). Whetherit contributes to antibody diversity in the opossum is not known, however, andtranscripts containing VH3.1 in adult opossum splenic RNA have not been found
�
Fig. 17.3 (continued) is also indicated and has high bootstrap value. The two large clades contain-ing tammar wallaby and opossum VH1 are also bracketed. Other species included are: the Northernbrown bandicoot Isoodon macrourus (Isma), brushtail possum Trichosurus vulpecula (Trvu), M.domestica (Modo) VH that are not VH1, Virginia opossum Didelphis virginiana (Divi), mouseMus musculus (Mumu), human Homo sapien (Hosa), cow Bos taurus (Bota), and sheep Ovis aries(Ovar)
366 M.L. Baker et al.
(unpublished observation). So far there also does not appear to evidence of geneconversion influencing the opossum repertoire either.
17.2.2 The Ig Light Chain Loci
Marsupials, like all mammals investigated so far, have two Ig light chain isotypes:kappa (Igκ) and lambda (Igλ). Light chain gene sequences have been reported forM. domestica, T. vulpecula, and M. eugenii (Lucero et al., 1998; Miller et al., 1999:Belov et al., 2001, 2002a; Baker et al., 2005b; Daly et al., 2007). The IGK and IGLloci have been localized to the long arms of chromosomes 1 and 3, respectively, inM. domestica (Deakin et al., 2006a). The region of opossum chr 3 containing IGLhas conserved synteny with human chr 22 (Fig. 17.1). This conservation is not aswell maintained in mice, however, where chr 16 has conserved synteny with humanchr 22 and opossum chr 3 on the telomeric side of IGL, and 11 on the centromericside. The IGK locus in opossum is also at a break point in synteny with eutherianmammals. This region of opossum chr 1 is conserved with regions on both short andlong arms of human chr 2 and with mouse chr 2 and 6 (Fig. 17.1).
The overall genomic organization of the opossum IGK and IGL loci are typical ofmammalian light chain genes and match what was predicted from analysis of cDNAclones (Miller et al., 1999; Lucero et al., 1998; Wang et al., 2009). This includes asingle C region and only two J gene segments in IGK, and eight J and C pairs in IGL(Fig. 17.2). The V gene segments in IGK are organized in two large clusters, withinverted reading orientation, separated by an approximately 800 kb region. InvertedV genes are not a problem since V(D)J recombination can occur through inversionrather than deletion of intervening DNA (Sekiguchi et al., 2004). This organizationis similar to that seen in human IGK where it is clear that a large inverted duplicationoccurred during the evolution of this locus (Zachau, 2004). This does not appearto be what has occurred in M. domestica, however. Phylogenetic analysis of theV gene segments in each cluster reveal that they belong to distantly relatedsubgroups (Miller et al., 1999; Wang et al., 2009).
In contrast to the limited diversity of marsupial VH genes, the light chainV region genes, Vκ and Vλ, are highly diverse and the different marsupial Vκ andVλ clades intersperse amongst that of other mammalian lineages suggesting theretention of a more ancient diversity than in VH (Miller et al., 1999; Lucero et al.,1998; Baker et al., 2005b; Wang et al., 2009). This has resulted in speculation thatIg light chains contribute more to the overall antibody diversity in marsupials thando heavy chains (Baker et al., 2005b).
17.2.3 Marsupial B Cell Ontogeny and Immuno-Competence
The availability of fully annotated IGH, IGK and IGL has facilitated the analysis ofboth B cell ontogeny and diversity. Transcripts containing IgM heavy chains with
17 Marsupial Immunoglobulin and T Cell Receptor Genomics 367
completely recombined V genes can be detected within the first 24 h of postnatallife in M. domestica (unpublished observation). This is significantly earlier thanwhat has been reported previously for the brushtail possum T. vulpecula, where theearliest time-point investigated was day 10 (Belov et al., 2002b). The diversity of theIgH chains at these early time-points is limited and the V-D-J junctions are devoid ofadditional nucleotides added by the enzyme terminal deoxynucleotidyl transferase,which adds N nucleotides without the use of a template. N nucleotides are foundin the adult repertoire (Miller et al., 1998; unpublished observations). Whether thislimited diversity is due to limited numbers of B cells in the newborn, or representsa programmed bias, as has been seen in eutherian fetal antibodies, is not known.The absence of N nucleotides in early opossum IgH chains is similar to what hasbeen seen for mouse neonatal antibodies and may be an analogous ontogenic pattern(Feeney, 1992; Benedict et al., 2000).
In contrast to IgH, light chain gene transcription is not detectable until day 8of postnatal life in M. domestica (unpublished observation). This suggests that,although B cell ontogeny is initiated peri-natally, mature functional B cells are notpresent until the second week. These results support that mature B cells also appearlater in development than mature conventional T cells in the opossum (Parra et al.,2009). These results are also consistent with early studies of antibody responses in arelated marsupial species, the Virginia opossum Didelphis virginiana, which foundantibody responses to a T dependent antigen not being detectable until the newbornopossums were at least two weeks of age (Kalmutz, 1962; Rowlands et al., 1964).Therefore, the newborn marsupial is fully dependent on maternal antibodies for pro-tection during the first week, which, in M. domestica, are entirely transferred via themilk (Samples et al., 1986).
17.3 T Cell Receptor Genomics
Critical to the function of T cells are their TCR, which establish not only the anti-gen specificity of individual clones but also their phenotype and function. T cellsthat utilize αβ TCR differentiate into the well-known helper, cytotoxic (killer), andregulatory (suppressor) phenotypes. This differentiation is determined by selectionfor combinations of binding affinity for self-peptides and self-MHC molecules inthe thymus. The random combinations of V, D and J segments encoded at the TCRloci establish these binding affinities. Hence, understanding the structure and orga-nization of the TCR genes in any given species is critical to understanding T cellfunction and fate.
Marsupial T cell mediated responses have attracted attention, in part, because ofa general sense that they are deficient relative to that of eutherian mammals. Forexample, rejection of primary skin grafts occurs with similar kinetics in marsupialsand eutherians, however, marsupial second set rejection is relatively slower (Infanteet al., 1991; Stone et al., 1997). Delayed type hypersensitivity (DTH) responsesare also slower and weaker in magnitude than those of eutherians (Turner et al.,1972; Taylor and Burrell, 1968). In vitro mitogenic responses in all marsupials
368 M.L. Baker et al.
tested to date are similar to eutherian mammals, however, mixed lymphocyte reac-tions (MLR) are negligible or absent (Fox et al., 1976; Wilkinson et al., 1992a, b;Stone et al., 1997, 1998; Baker et al., 1998; Baker and Gemmell, 1999; Baker et al.,1999; Turner et al., 1972; Woods et al., 2007). There is no clear explanation forthe weak MLR or slow DTH responses in marsupials. Low MHC polymorphismcould account for the absence of MLR observed in Tasmanian devils, which haveundergone a considerable population bottleneck (Woods et al., 2007). However, inat least one other marsupial, M. domestica, polymorphism at classical MHC genesis comparable to human HLA, so absence of MHC diversity in this species is nota likely explanation for poor MLR (Gouin et al., 2006). In addition, antibody iso-type switch in secondary immune responses in marsupials are not as robust as theyare in eutherian mammals (Stanley et al., 1972; Croix et al., 1989; Wilkinson et al.,1992a; Stone et al., 1996). Since isotype switching is also T cell dependent, a num-ber of investigators have questioned the sufficiency of T cells in humoral immuneresponses in marsupials as well. The availability of marsupial genomic resourceshas provided the means to investigate T cell development and diversity to gain someinsight into marsupial T cell biology.
T cell maturation in all gnathostomes is dependent on a functional thymus, thegland-like lymphoid organ typically located in the upper thoracic region. It is inthe thymus where T cells commit to a lineage, αβ or γδ, and where they undergoV(D)J recombination and selection to establish their antigen specificity and MHCrestriction. A unique, and so far not fully understood, aspect of thymus biologyin marsupials is the presence of an extra set of thymuses in the cervical verte-brae region in some family groups. The diprotodont species, including Burramydae,Phalangeridae, Tarsipedidae and Macropodidae, have both cervical and thoracicthymuses with the exception of the koala that possesses only a cervical thymus.The polyprotodont species, including Caenolestidae, Dasyuridae, Thylacinidae,Notoryctidae and Peramelidae, possess only a thoracic thymus, and Didelphidaemarsupials have paired thoracic thymuses (Yadav, 1973; Deane and Cooper, 1988;Hubbard et al., 1991; Haynes, 2001).
Although the thymus is present in newborn marsupials it is generally undifferen-tiated and undergoes much of its development during postnatal life. In marsupialswith both cervical and thoracic thymuses, both appear to be histologically identicaland to have the same function, but the development of the thoracic thymus gen-erally lags behind that of the cervical thymus (Kathiresan, 1969; Stanley et al.,1972). T lymphocytes differentiate in the thymus before populating other sitesin the body. Peripheral lymphoid organs such as the spleen, lymph nodes andgut associated lymphoid tissue typically develop into functional lymphoid tissueonly after the thymus has reached maturity. T cell responses are correspondinglylow at birth, and neonates are dependent on maternal antibody for protectionuntil their immune systems are functional (Samples et al., 1986; Hubbard et al.,1991).
Immunohistochemistry using cross-reactive antibodies on developing lymphoidtissue from marsupials has provided evidence for the appearance of T cells soonafter birth. CD3+ T cells have been identified in the thoracic thymus as early as
17 Marsupial Immunoglobulin and T Cell Receptor Genomics 369
day 2 postpartum in T. vulpecula and D. albiventris (Coutinho et al., 1995; Bakeret al., 1999). In contrast, the thymus of M. eugenii does not have CD3 positiveT cells earlier than day 12 postpartum (Old and Deane, 2003). Subsequent appear-ance of CD3+ T cells appear in the spleen by day 21 and 25 postpartum inM. eugenii and T. vulpecula respectively (Baker et al., 1999; Old and Deane, 2003).These immunohistochemistry results are somewhat consistent with recent analysisof T cell ontogeny in the opossum M. domestica based on expression of mature,rearranged TCR transcripts described below (Parra et al., 2009).
As with the Ig genes, the annotation of the TCR loci was greatly assisted by thepublished analysis of marsupial cDNAs encoding TCR chains, analysis which hasalready revealed considerable homology between marsupial TCRα, β, γ and δ chainsto those of eutherian mammals. TCR genes encoding the α and β chains of the αβ
TCR have been characterized in M. domestica, T. vulpecula and M. eugenii, and forthe γδ TCR, the δ chain has been characterized in M. eugenii, M. domestica andIsoodon macrourus and the γ chain has been identified among expressed sequencetags (EST) from I. macrourus (Zuccolotto et al., 2000; Baker et al., 2001; Harrisonet al., 2003; Baker et al., 2005a, 2007). The diversity of expressed V domains incDNAs has been described only for the TCRδ chain from M. eugenii and the TCRα
and β chains of developing M. domestica. At least three different subfamilies ofM. eugenii Vδ genes were expressed in cDNA from mammary gland associatedlymphoid tissue, consistent with a high level of V segment diversity in M. eugenii(Harrison et al., 2003). In M. domestica, a highly diverse Vα and Vβ repertoirewas observed, with preferential use of V segments during development as discussedbelow (Parra et al., 2009).
Physical mapping of the conventional TCR loci in M. domestica has localizedTCRα/δ to chromosome 1p, TCRβ to chr 8q, and TCRγ to chr 6q by in situhybridization of metaphase chromosomes (Deakin et al., 2006b). The availabilityof the whole genome sequence of M. domestica has provided a more detailed viewof the genomic organization of TCR loci in this marsupial, demonstrating a highdegree of synteny with TCR loci from other mammals and a translocon arrangement(Figs. 17.4 and 17.5, Parra et al., 2008).
17.3.1 TCR α/δ Locus
Consistent with physical mapping of the TCR loci, the TCRδ genes in the genomeassembly are clustered within the TCRα locus, resembling the organization foundin other amniotes (Fig. 17.5, Chien et al., 1987; Kubota et al., 1999; Deakin et al.,2006b). The TCRα/δ locus is the largest and most complex of the conventional TCRloci. The V segments within the TCRα/δ locus are either utilized exclusively byTCRα or by both TCRα and TCRδ chains (Parra et al., 2008, 2009).
The number and complexity of D and J segments in the opossum’s TCR loci alsoappears to be comparable to eutherian mammals and non-mammalian vertebrates(Fig. 17.5, Partula et al., 1996; Parra et al., 2008). For example, there are 53 TCRα
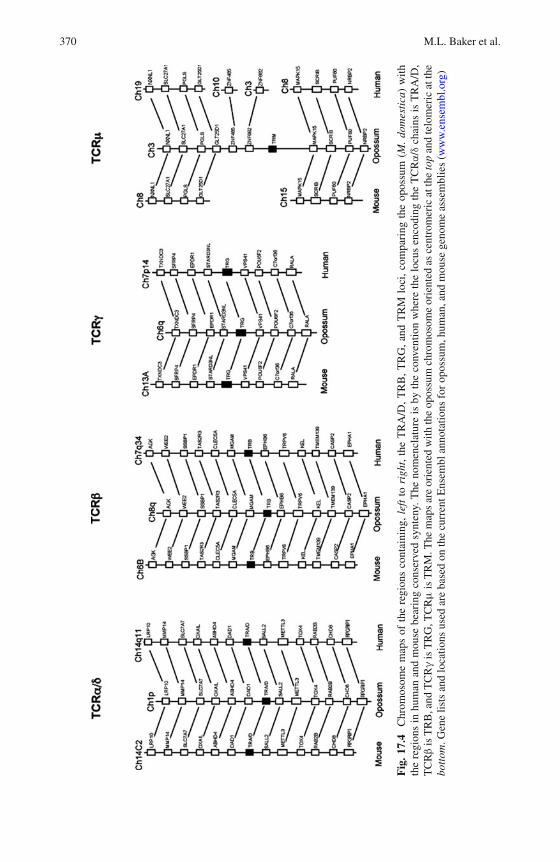
370 M.L. Baker et al.
Fig
.17.
4C
hrom
osom
em
aps
ofth
ere
gion
sco
ntai
ning
,le
ftto
righ
t,th
eT
RA
/D,
TR
B,
TR
G,
and
TR
Mlo
ci,
com
pari
ngth
eop
ossu
m(M
.do
mes
tica
)w
ithth
ere
gion
sin
hum
anan
dm
ouse
bear
ing
cons
erve
dsy
nten
y.T
heno
men
clat
ure
isby
the
conv
entio
nw
here
the
locu
sen
codi
ngth
eT
CR
α/δ
chai
nsis
TR
A/D
,T
CR
βis
TR
B,a
ndT
CRγ
isT
RG
,TC
Rμ
isT
RM
.The
map
sar
eor
ient
edw
ithth
eop
ossu
mch
rom
osom
eor
ient
edas
cent
rom
eric
atth
eto
pan
dte
lom
eric
atth
ebo
ttom
.Gen
elis
tsan
dlo
catio
nsus
edar
eba
sed
onth
ecu
rren
tEns
embl
anno
tatio
nsfo
rop
ossu
m,h
uman
,and
mou
sege
nom
eas
sem
blie
s(w
ww
.ens
embl
.org
)
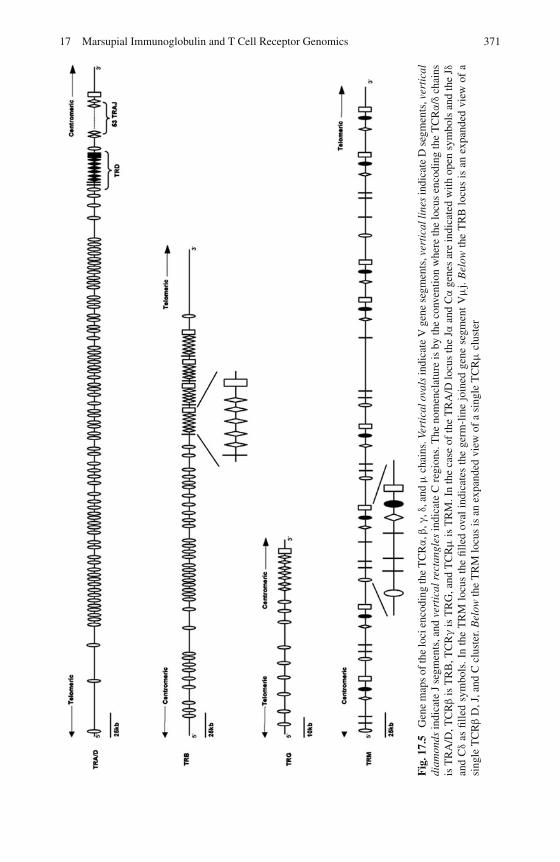
17 Marsupial Immunoglobulin and T Cell Receptor Genomics 371
Fig
.17.
5G
ene
map
sof
the
loci
enco
ding
the
TC
Rα
,β,γ
,δ,a
ndμ
chai
ns.V
erti
calo
vals
indi
cate
Vge
nese
gmen
ts,v
erti
call
ines
indi
cate
Dse
gmen
ts,v
erti
cal
diam
onds
indi
cate
Jse
gmen
ts,a
ndve
rtic
alre
ctan
gles
indi
cate
Cre
gion
s.T
heno
men
clat
ure
isby
the
conv
entio
nw
here
the
locu
sen
codi
ngth
eT
CR
α/δ
chai
nsis
TR
A/D
,TC
Rβ
isT
RB
,TC
Rγ
isT
RG
,and
TC
Rμ
isT
RM
.In
the
case
ofth
eT
RA
/Dlo
cus
the
Jαan
dC
αge
nes
are
indi
cate
dw
ithop
ensy
mbo
lsan
dth
eJδ
and
Cδ
asfil
led
sym
bols
.In
the
TR
Mlo
cus
the
fille
dov
alin
dica
tes
the
germ
-lin
ejo
ined
gene
segm
ent
Vμ
j.B
elow
the
TR
Blo
cus
isan
expa
nded
view
ofa
sing
leT
CR
βD
,J,a
ndC
clus
ter.
Bel
owth
eT
RM
locu
sis
anex
pand
edvi
ewof
asi
ngle
TC
Rμ
clus
ter
372 M.L. Baker et al.
J segments located between the TCRδ C and TCRα C all of which appear to befunctional. This high number of Jα segments is thought to confer the ability of devel-oping T cells to undergo secondary V to J rearrangements, increasing the possibilityof successfully generating a functional TCRα chain (Marolleau et al., 1988).
17.3.2 TCR β Locus
In addition to the high level of conserved synteny surrounding the TCRβ locus, thestructure of the locus is also highly conserved (Figs. 17.4 and 17.5). As in humansand mice, the opossum TCRβ D, J and C segments are arranged in tandem cas-settes each containing a single D, four or five J, and a single C. There are foursuch cassettes in the M. domestica TCRβ locus, all of which appear to be functional(Fig. 17.5; Parra et al., 2008). Noteworthy is the presence of a single V gene segmenton the 3′ side of the terminal C region exon in the opossum (Fig. 17.5). This Vβ genesegment is in the opposite transcriptional orientation to the D, J, and C segments andcan and is used by V(D)J recombination creating an inversion rather than a deletion(Parra et al., 2008). This gene segment is conserved in eutherians as well, consistentwith this arrangement being ancient in therian mammals (Parra et al., 2008).
17.3.3 TCR γ Locus
The locus encoding TCRγ chains is the smallest of the conventional TCR loci inM. domestica, with the fewest number of V gene segments and only a single Cregion gene. It is also highly generic in its organization, a model for the definitionof the translocon organization (Fig. 17.5).
17.3.4 Genomic Organization Influences Early Diversityof αβT Cells
Once the content and organization of the conventional TCR has been determined,both the germ-line and somatic contributions to T cell diversity can be determinedduring ontogeny. Such studies have been conducted using M. domestica as the modelspecies. mRNA transcribed from functionally recombined TCRα and TCRβ genesare both detectable within the first postnatal day in newborn opossums, indicatingthat they are born with T cells that have at least reached the point of developmentwhen they can undergo selection for binding MHC molecules and self-peptides(Parra et al., 2009). This development is taking place prior to histological evidenceof a clear thymus in this species (Hubbard et al., 1991). TCRδ transcripts werealso detectable within the first postnatal 24 h. In contrast to the other three conven-tional TCR chains, TCRγ is the last to be expressed during postnatal development inM. domestica, not detected until the second postnatal week (Parra et al., 2009). Thiswas a surprising finding since it suggests that αβT cells appear in ontogeny prior to
17 Marsupial Immunoglobulin and T Cell Receptor Genomics 373
γδT cells, which is the reverse of eutherian mammals where γδT cells develop first(Allison and Havran, 1991; Parra et al., 2009). What biological significance theremay be to this difference is not known.
Developing αβT cells rearrange their TCRβ chain genes prior to TCRα and anal-ysis of the V gene segments being used in these early rearrangements indicates thattheir genomic position in the TCRβ locus does not influence their use. However,there is a preferential use of TCRβ gene segments that share micro-homologybetween the V, D and J (Parra et al., 2009). This micro-homology is evident inthe rearrangements as nucleotides at the VD and/or DJ junctions that could be con-tributed by either germ-line gene segment. This is not unlike what has been seen infetal Ig and TCR repertoires in some eutherian species (Feeney, 1992; Zhang et al.,1995). In contrast, micro-homology does not appear to bias the rearranged gene seg-ments in TCRα chains. Rather, genomic position of V segments appears to have aninfluence in early TCRα rearrangements, with there being a bias for the most 3′ orC proximal V genes. By the second week of life both TCRα and TCRβ chains arerandom and diverse, and similar to adult (Parra et al., 2009).
In summary, having spatial information as well as content has revealed dif-ferences in the way V(D)J rearrangements are being biased in early developingmarsupial T cells, in this case even between different TCR loci within the same cell.The bias in gene segment use early in development clearly limits the diversity ofT cells, but how this influences function during the first week of postnatal liferemains to be determined. The presence of completely rearranged TCR loci does notnecessarily indicate that there are functionally mature T cells present. Early studiesof early immuno-competence in marsupials have found T dependent responses, bothhumoral and cell mediated, lacking during the first week of postnatal life (Kalmutz,1962; La Via et al., 1963; Rowlands et al., 1964; Ashman et al., 1975). This wasthought to be due to lack of functional T cells at the earlier time-points, but mayalso be explained by limited diversity in the pool of functional T cells available inthe neonate (Parra et al., 2009).
17.3.5 A Novel TCR in Marsupials
One of the more remarkable discoveries made while examining marsupial genomes,at least from an immunological perspective, was presence of a fifth TCR chain,TCRμ (Baker et al., 2005a; Parra et al., 2007). TCRμ has all the canonical aminoacid residues necessary to form a heterodimer with another chain, however, whatpartner it pairs with remains unknown. TCRμ was originally described as a diver-gent TCRδ chain due to the homology of its C region (Baker et al., 2005a). However,the genes encoding this chain are a separate locus from the conventional TCR loci(Parra et al., 2007). In addition to sequence homology to other TCR, it is clear thatTCRμ is a bona fide TCR in that it undergoes V(D)J recombination in develop-ing thymocytes (Parra et al., 2007). Based on limited phylogenetic surveys TCRμ
also appears to be common to all marsupials but is absent from all eutherian specieschecked so far (Parra et al., 2007, 2008). Not surprisingly then, the region that flanks
374 M.L. Baker et al.
the opossum’s TCRμ locus on chromosome 3 shares no conserved synteny with thegenomes of eutherian mammals (Fig. 17.4; Parra et al., 2008). This lack of con-servation between the chromosomal regions in the opossum that contains TCRμ
genes with that of non-marsupial species has confounded uncovering the evolution-ary history of this locus. This is particularly unfortunate given the apparent hybridnature of this unusual TCR chain; TCRμ appears, based on sequence similarity,to be a hybrid between a TCR and an Ig (Parra et al., 2007). The constant regionof TCRμ is most closely related to TCRδ, while the variable domain is homolo-gous to the variable domains of immunoglobulin heavy chains. It is therefore likelythat TCRμ may have been the result of a recombination between ancient TCRδ
and Ig loci (Parra et al., 2008). Any evidence of such a recombination, however,appears to be lost in that the regions flanking the TCRα/δ locus in amniotes ishighly conserved, showing no sign of a break in synteny (Fig. 17.4, Parra et al.,2008).
In addition to its apparent hybrid features, M. domestica TCRμ is also the first,and so far only, TCR to have a clear cluster style organization, rather than translo-con (Fig. 17.5). The number of clusters may vary between species with the opossumhaving eight and the Northern brown bandicoot, I. macrourus, likely having onlytwo for example (Baker et al., 2005a; Parra et al., 2008). In the opossum six of theeight clusters are complete with each containing two classes of V segments, as wellas D, J and C genes. The two classes of V segments are a single non-rearranged Vgene segment (Vμ) that can be somatically recombined with the D and J segments,and pre-joined V segment (Vμj) that is a complete exon that appears to be derivedfrom V, D, and J gene segments already recombined in the germ-line DNA. The twopartial clusters lack Vμ and Dμ gene segments. Phylogenetic analysis of the genesegments in each cluster reveals that the clusters are due to whole cluster duplica-tions. Unlike the Ig genes of cartilaginous fishes, which are arranged in clusters thatare scattered throughout the genome, the opossum TCRμ clusters are in a tandemarray (Parra et al., 2008).
TCRμ is also unusual for a TCR in that it is expressed in at least two mRNAisoforms, designated TCRμ1.0 and TCRμ2.0. Both isoforms are transcribed inthe thymus and spleen but TCRμ2.0 appears to predominate in peripheral lym-phoid tissue (Parra et al., 2007). The chain predicted to be encoded by theTCRμ2.0 isoform contains two V domains; one that is somatically recombinedand another that is Vμj. TCRμ1.0 contains only the pre-joined Vμj domain andis predicted to be structurally more similar to conventional TCR chains (Parraet al., 2007). The TCRμ2.0 isoform is generated when the unrearranged Vμ
gene segment is recombined to the D and J segments and this exon is splicedto the Vμj exon during mRNA processing (Parra et al., 2007). The TCRμ1.0isoform is generated by initiated transcription upstream of the Vμj exon anddoes not require V(D)J recombination. Given the paucity of TCRμ1.0 tran-scripts in peripheral lymphoid tissues it is not clear if this is a functionallytranslated form. Furthermore, only two of the eight opossum TCRμ clusters arecapable of producing the TCRμ1.0 isoform due to in frame stops in the leader
17 Marsupial Immunoglobulin and T Cell Receptor Genomics 375
sequence of Vμj in the other six clusters. All six complete clusters are capable ofgenerating the TCRμ2.0 isoform, and one of the partial clusters is capable of pro-ducing the TCRμ2.0 isoform by using Vμ gene segments from upstream clusters(Parra et al., 2007). This latter observation may explain the evolutionary advantageto maintaining the clusters as a tandem array even though they can function indepen-dently. It is possible that inter-cluster V(D)J recombination provides the opportunityto generate additional diversity that would not be possible if the clusters were notclosely physically linked.
Vμj is the first, and so far only germ-line joined V segment to be described in aTCR. It and the VH3.1 gene segment in the M. domestica IGH locus are the onlygerm-line joined V genes to be described in mammals for either TCR or Ig, althoughVH3.1 is a partially joined gene. In contrast to VH3.1, which clearly appears to bedue to the action of RAG based recombination on the DNA in a germ cell, Vμjappears to be the result of retro-transposition, involving an RNA intermediate (Parraet al., 2007; Wang et al., 2009). How or where this took place is not clear, althoughit seems likely to also have been in a germ cell for it to be in the germ-line. Therecent discovery of a TCRμ homologue in the duckbill platypus genome, lackingthe germ-line joined Vμj gene segment will hopefully give some insight into itsorigins (Parra et al., 2008, unpublished observations).
The discovery of TCRμ in the marsupial genome illustrates not only the dynamicnature of the evolution of the antigen receptor loci but also the value of investigat-ing the genomes of more, distantly related species. Not long ago, the TCR appearedto be fairly static with all jawed vertebrates having a similar, if not identical, com-plement of receptor chains. This view is more likely due to the fact that much ofcomparative immunology was proceeded by discoveries being made first in humansand mice followed by identifying homologues in other species. It is harder to ask thequestion “what does a non-model species have that is lacking in humans and mice?”Comparative genomics makes asking such questions feasible. What does TCRμ do?Now that’s a tough question to answer.
17.4 Conclusion
Comparative genomics provides not only the fodder for understanding the evo-lution of organisms and their genomes, but also the resources for physiologicalstudies of non-model species that do not always have as sufficient a tool-kitas would be desired. The genomic analysis of at least one marsupial species,M. domestica, has put this species on par with humans, mice and a very short list ofother gnathostomate species in regards to being able to study their adaptive immuneresponses. In 1977 Ashman lamented the scarcity of research on marsupial immunesystems and asked if this field would have a brighter future (Ashman, 1977). Thepast decade has seen amazing growth and discoveries in the studies of marsupialimmunity. Given the emerging problems such as the Tasmanian devil facial tumordisease, it is hopefully not too late (McCallum and Jones, 2006).
376 M.L. Baker et al.
Acknowledgments The authors acknowledge support from the U.S. National ScienceFoundation.
References
Allison JP, Havran WL (1991) The immunobiology of T cells with invariant gamma delta antigenreceptors. Ann Rev Immunol 9:679–705.
Ashman RB (1977) Marsupial immunology: a brighter future? Dev Comp Immunol 1:283–284.Ashman R, Keast D, Stanley NF, Waring H (1975) The immunological responses of marsupials.
Am Nat 15:155–166.Asquith KL, Kitchener AL, Kay DJ (2006) Immunisation of the male tammar wallaby (Macropus
eugenii) with spermatozoa elicits epididymal antigen-specific antibody secretion and compro-mised fertilisation rate. J Reprod Immunol 69:127–147.
Aveskogh M, Hellman L (1998) Evidence for an early appearance of modern post-switch iso-types in mammalian evolution; cloning of IgE, IgG and IgA from the marsupial Monodelphisdomestica. Eur J Immunol 28:2738–2750.
Aveskogh M, Pilström L, Hellman L (1999) Cloning and structural analysis of IgM (μ chain)and the heavy chain V region repertoire in the marsupial Monodelphis domestica. Dev CompImmunol 23:597–606.
Baker ML, Gemmell RT (1999) Physiological changes in brushtail possums relocated fromArmidale into captivity in Brisbane, Australia. J Exper Zool 284:42–49.
Baker ML, Gemmell E, Gemmell RT (1998) Physiological changes in brushtail possums,Trichosurus vulpecula, transferred from the wild to captivity. J Exper Zool 280:203–212.
Baker ML, Gemmell E, Gemmell RT (1999) Ontogeny of the immune system of the brushtailpossum, Trichosurus vulpecula. Anat Record 256:354–365.
Baker ML, Rosenberg GH, Zuccolotto P, Harrison G, Deane EM, Miller RD (2001) Furthercharacterization of T cell receptor chains of marsupials. Dev Comp Immunol 25:495–507.
Baker ML, Osterman AK, Brumburgh S (2005a) Divergent T cell receptor delta chains frommarsupials. Immunogenetics 57:665–673.
Baker ML, Belov K, Miller RD (2005b) Unusually similar patterns of antibody V segment diversityin distantly related marsupials. J Immunol 174:5665–5671.
Baker ML, Indiviglio S, Nyberg AM, et al. (2007) Analysis of a set of Australian northern brownbandicoot expressed sequence tags with comparison to the genome sequence of the SouthAmerican grey short tailed opossum. BMC Genomics 8:50.
Bell RG (1977) Marsupial immunglobulins: the distribution and evolution of macropod IgG2, IgMand light chain antigenic markers within the sub-class metatheria. Immunol 33:917–924.
Bell RG, Lynch NR, Turner KJ (1974) Immunoglobulins of the marsupial Setonix brachyurus(quokka). Immunol 27:1103–1115.
Belov K, Harrison GA, Miller RD, Cooper DW (1999a) Isolation and sequence of a cDNA codingfor the heavy chain constant region of IgG from the Australian brushtail possum, Trichosurusvulpecula. Mol Immunol 36:535–541.
Belov K, Harrison GA, Miller RD, Cooper DW (1999b) Molecular cloning of the brushtail pos-sum (Trichosurus vulpecula) immunglobulin E heavy chain constant region. Mol Immunol 36:1255–1261.
Belov K, Harrison GA, Rosenberg GH, Miller RD, Cooper DW (1999c) Isolation and comparisonof the IgM heavy chain constant region from Australian (Trichosurus vulpecula) and American(Monodelphis domestica) marsupials. Dev Comp Immunol 23:649–656.
Belov K, Harrison GA, Miller RD, Cooper DW (2001) Characterisation of the kappa light chainof the brushtail possum (Trichosurus vulpecula). Vet Immunol Immunopathol 78:317–324.
Belov K, Harrison GA, Miller RD, Cooper DW (2002a) Molecular cloning of four lambdalight chain cDNAs from the Australian brushtail possum (Trichosurus vulpecula). Eur JImmunogenet 29:95–99.
17 Marsupial Immunoglobulin and T Cell Receptor Genomics 377
Belov K, Nguyen M-AT, Zenger KR, Cooper DW (2002b) Ontogeny of immunoglobulin expres-sion in the brushtail possum (Trichosurus vulpecula). Dev Comp Immunol 26:599–602.
Benedict CL, Gillian S, Thai T, Kearney JF (2000) Terminal deoxynucleotidyl transferase andrepertoire development. Immunol Rev 175:150–157.
Butler JE (1997) Immunoglobulin gene organization and the mechanism of repertoire development.Scand J Immunol 45:455–462.
Canfield P, Hemsley S, Connolly J (1996) Histological and immunohistological study of the devel-oping and involuting superficial cervical thymus in the koala (Phascolarctos cinereus). J Anat189:159–169.
Chen H, Kshirsagar S, Jensen I, et al. (2009) Characterization of arrangement and expression ofthe T cell receptor γ locus in the sandbar shark. Proc Natl Acad Sci U S A 106:8591–8596.
Chien YH, Iwashima M, Kaplan KB, Elliot JF, Davis MM (1987) A new T-cell receptor genelocated within the alpha locus and expressed early in T-cell differentiation. Nature 327:677–682.
Cisternas PA, Armati PJ (2000) Immune system cell markers in the northern brown bandicoot,Isoodon macrourus. Dev Comp Immunol 24:771–782.
Coutinho HB, King G, Sewell HF, et al. (1993) Immunocytochemical study of Peyer’s patchesfollicular-associated epithelium in the marsupial, Didelphis albiventris. Dev Comp Immunol17:537–548.
Coutinho HB, Sewell HF, Tighe P, et al. (1995) Immunocytochemical study of the ontogeny of themarsupial Didelphis albiventris immune system. J Anat 187:37–46.
Criscitiello MF, Saltis M, Flajnik MF (2006) An evolutionarily mobile antigen receptor vari-able region gene: doubly rearranging NAR-TcR genes in sharks. Proc Natl Acad Sci U S A103:5036–5041.
Croix DA, Samples NK, VandeBerg JL, Stone WH (1989) Immune response of a marsupial(Monodelphis domestica) to sheep red blood cells. Dev Comp Immunol 13:73–78.
Daly KA, Digby M, Lefèvre C, et al. (2007) Analysis of the expression of immunoglobulinsthroughout lactation suggests two periods of immune transfer in the tammar wallaby (Macropuseugenii). Vet Immunol Immunopathol 120:187–200.
Das S, Nozawa M, Klein J, Nei M (2008) Evolutionary dynamics of the immunoglobulin heavychain variable region genes in vertebrates. Immunogenetics 60:47–55.
Deakin JE, Belov K, Curach NC, Green P, Cooper DW (2005) High levels of variability in immuneresponse using antigens from two reproductive proteins in brushtail possums. Wild Res 32:1–6.
Deakin JE, Olp JJ, Graves JAM, Miller RD (2006a) Physical mapping of immunoglobulin lociIGH@, IGK@, and IGL@ in the opossum (Monodelphis domestica). Cytogenet Genome Res114:94.
Deakin JE, Parra ZE, Graves JAM, Miller RD (2006b) Physical Mapping of T cell receptor loci(TRA@, TRB@, TRD@ and TRG@) in the opossum (Monodelphis domestica). CytogenetGenome Res 112:342 K.
Deane EM, Cooper DW (1988) Immunological development in pouch young marsupials. In:Tyndale-Biscoe CH, Janssens PA (eds) The Developing Marsupial. Springer, Berlin.
Feeney AJ (1992) Predominance of VH-D-JH junctions occurring at sites of short sequence homol-ogy results in limited junctional diversity in neonatal antibodies. J Immunol 149:222–229.
Fox DH, Rowlands DT Jr, Wilson DB (1976) Proliferative reactivity of opossum peripheral bloodleukocytes allogeneic cells, mitogens, and specific antigens. Transplantation 21:164–168.
Flajnik MF (2002) Comparative analyses of immunoglobulin genes: surprises and portents. NatRev Immunol 2:688–698.
Gouin N, Wright AM, Miska KB, et al. (2006) Modo-UG, a marsupial non-classical MHC classI locus. Immunogenetics 58:396–406.
Harrison GA, Taylor CL, Miller RD, Deane EM (2003) Primary Structure and Variation of theT-Cell Receptor δ Chain from a Marsupial, Macropus eugenii. Immunol Lett 88:117–125.
Haynes JI (2001) The marsupial and monotreme thymus, revisited. J Zool Lond 253:167–173.
378 M.L. Baker et al.
Hemsley SW, Canfield PJ, Husband AJ (1995) Immunohistological staining of lymphoid tissue infour Australian marsupial species using species cross-reactive antibodies. Immunol Cell Biol73:321–325.
Hubbard GB, Saphire DG, Hackleman SM, Silva MV, VandBerg JL, Stone WH (1991) Ontogenyof the thymus gland of a marsupial (Monodelphis domestica). Lab Anim Sci 41:227–232.
Infante AJ, Samples NK, Croix DA, Redding TS, VandeBerg JL, Stone WH (1991) Cellularimmune response of a marsupial, Monodelphis domestica. Dev Comp Immunol 15:189–199.
Jones M, Cordell JL, Beyers A, Tse AGD, Mason DY (1993) Detection of T and B cells in manyanimal species using cross-reactive antipeptide antibodies. J Immunol 150:5429–5435.
Kalmutz SE (1962) Antibody production in the opossum embryo. Nature 193:851–853.Kathiresan S (1969) Morphological studies on the thymus. Part I. Thymus of the marsupial
Trichosurus vulpecula. Indian J Med Res 57:939–945.Kitchener AL, Edds LM, Molinia FC, Kay DJ (2002) Porcine zonae pellucidae immunization
of tammar wallabies (Macropus eugenii): fertility and immune responses. Reprod Fertil Dev14:215–223.
Kokubu F, Litman R, Shamblott MJ, Hinds K, Litman GW (1988) Diverse organization ofimmunoglobulin VH gene loci in a primitive vertebrate. EMBO J 7:3413–3422.
Kubota T, Wang JY, Gobel TWF, Hockett RD, Cooper MD, Chen CH (1999) Characterization ofan avian (Gallus gallus domesticus) TCR α/δ locus. J Immunol 163:3858–3866.
Kumar S, Tamura K, Nei M (2004) MEGA3: integrated software for molecular evolutionarygenetics analysis and sequence alignment. Brief Bioinform 5:150–163.
La Via MF, Rowlands DT, Block M (1963) Antibody formation in embryos. Science 140:1219–1220.
Lee SS, Fitch D, Flajnik MF, Hsu E (2000) Rearrangement of immunoglobulin genes in shark germcells. J Exp Med 191:1637–1648.
Lucero JE, Rosenberg GH, Miller RD (1998) Marsupial light chains: complexity and conservationof Igl in the opossum Monodelphis domestica. J Immunol 161:6724–6732.
Marolleau JP, Fondell JD, Malissen M, et al. (1988) The joining of germ-line Vα to Jα genesreplaces the preexisting Vα-Jα complex in a T cell receptor alpha and beta positive T cell line.Cell 55:291–300.
McCallum H, Jones M (2006) To lose both would look like carelessness: tasmanian devil facialtumour disease. PLoS Biology 4:e342.
McLelland DJ, Kirkland PD, Rose KA, Dixon RJ, Smith N (2005) Serologic responses of Barbarysheep (Ammotragus lervia), Indian antelope (Antilope cervicapra), wallaroos (Macropus robus-tus), and chimpanzees (Pan troglodytes) to an inactivated encephalomyocarditis virus vaccine.J Zoo Wildl Med 36:69–73.
Mikkelsen TS, Wakefield MJ, Aken B, et al. (2007) Genome of the marsupial Monodelphisdomestica reveals lineage-specific innovation in coding sequences. Nature 447:167–178.
Miller RD, Grabe H, Rosenberg GH (1998) The VH repertoire of a marsupial: Monodelphisdomestica. J Immunol 160:259–265.
Miller RD, Bergemann ER, Rosenberg GH (1999) Marsupial light chains: IGK with four Vfamilies in the opossum Monodelphis domestica. Immunogenetics 50:329–335.
Ohta Y, Flajnik M (2006) IgD, like IgM, is a primordial immunoglobulin class perpetuated in mostjawed vertebrates. Proc Natl Acad Sci U S A 103:10723–10728.
Old JM, Deane EM (2003) The detection of mature T- and B-cells during development of thelymphoid tissues of the tammar wallaby (Macropus eugenii). J Anat 203:123–131.
Parra ZE, Baker ML, Schwarz R, Deakin JE, Lindblad-Toh K, Miller RD (2007) Discovery of anew T cell receptor in marsupials. Proc Natl Acad Sci U S A 104:9776–9781.
Parra ZE, Baker ML, Hathaway J, et al. (2008) Comparative genomic analysis and evolution of theT cell receptor loci in the opossum Monodelphis domestica. BMC Genomics 9:111.
Parra ZE, Baker ML, Lopez AM, Trujillo J, Volpe JM, Miller RD (2009) TCRm recombinationand transcription relative to the conventional TCR during postnatal development in opossums.J Immunol 182:154–163.
17 Marsupial Immunoglobulin and T Cell Receptor Genomics 379
Partula S, de Guerra A, Fellah JS, Charlemagne J (1996) Structure and diversity of the TCR alpha-chain in a teleost fish. J Immunol 157:207–212.
Reynaud CA, Dahan A, Anquez V, Weill JC (1989) Somatic hyperconversion diversifies the singleVh gene of the chicken with a high incidence in the D region. Cell 59:171–183.
Rowlands DT, Lavia MF, Block MH (1964) The blood forming tissues and blood of the new-born opossum (Didelphys virginiana). II. Ontogenesis of antibody formation to flagella ofSalmonella typhi. J Immunol 93:157–164.
Rumfelt LL, Avila D, Diaz M, Bartl S, McKinney EC, Flajnik MF (2001) A shark antibodyheavy chain encoded by a nonsomatically rearranged VDJ is preferentially expressed in earlydevelopment and is convergent with mammalian IgG. Proc Natl Acad Sci U S A 98:1775–1780.
Samples NK, VandeBerg JL, Stone WH (1986) Passively acquired immunity in the newborn of amarsupial (Monodelphis domestica). Am J Reprod Immunol Microb 11:94–97.
Sekiguchi J, Alt FW, Oettinger M (2004) The mechanisms of V(D)J recombination. In: Honjo T,Alt FW, Neuberger M (eds) Molecular Biology of B Cells. Academic Press, London.
Shearer MH, Robinson ES, VandeBerg JL, Kennedy RC (1995) Humoral immune responsein a marsupial Monodelphis domestica: anti-isotypic and anti-idiotypic responses detectedby species-specific monoclonal anti-immunoglobulin reagents. Dev Comp Immunol 19:237–246.
Silverman GJ, Goodyear CS (2002) A model B-cell superantigen and the immunobiology of Blymphocytes. Clin Immunol 102:117–134.
Stanley NF, Yadav M, Waring H, Eadie M (1972) The effect of thymectomy on response to variousantigens of a marsupial Setonix brachyrus (Quokka). Aust J Exp Biol Med Sci 50:689–702.
Stone WH, Manis GH, Hoffman ES, Saphire DG, Hubbard GB, VandeBerg JL (1997) Fateof allogeneic skin transplantations in a marsupial (Monodelphis domestica). Lab Anim Sci47:283–287.
Stone WH, Bruun DA, Manis GS (1996) The immunobiology of the marsupial Monodelphisdomestica. In: Stolen JS, Fletcher TC Bayne CJ, et al. (eds) Modulators of Immune Responses,The Evolutionary Trail, Breckenridge Series 2, Vol 11. SOS Publications, Fairhaven.
Stone WH, Bruun DA, Foster EB, et al. (1998) Absence of a significant mixed lymphocyte reactionin a marsupial (Monodelphis domestica). Lab Anim Sci 48:184–189.
Taylor DL, Burrell R (1968) The immunological responses of the North American opossum(Didelphis virginiana). J Immunol 101:1207–1216.
Tonegawa S (1983) Somatic generation of antibody diversity. Nature 302:575–581.Turner KJ, Alpers MP, Wight AM (1972) Delayed hypersensitivity in the marsupial Setonix
brachyurus (Quokka). J Immunol 108:1675–1680.Tutter A, Riblet R (1989) Conservation of an immunoglobulin variable-region gene family
indicates a specific, noncoding function. Proc Natl Acad Sci U S A 86:7460–7464.Ventura-Holman T, Lobb CJ (2002) Structural organization of the immunoglobulin heavy chain
locus in the channel catfish: the IgH locus represents a composite of two gene clusters. MolImmunol 38:557–564.
Wang X, Olp JJ, Miller RD (2009) On the genomics of immunoglobulins in the gray, short-tailedopossum Monodelphis domestica. Immunogenetics 61:581–596.
Wilkinson R, Kotlarski I, Barton M (1992a) Koala lymphoid cells: analysis of antigen-specificresponses. Vet Immunol Immunopathol 33:237–247.
Wilkinson R, Kotlarski I, Barton M, Phillips P (1992b) Isolation of koala lymphoid cells and theirin vitro responses to mitogens. Vet Immunol Immunopathol 31:21–33.
Wilkinson R, Barton M, Kotlarski I (1995) Identification of koala lymphocytes using an anti-humanCD3 antibody. Dev Comp Immunol 19:537–545.
Woods GM, Kreiss A, Belov K, Siddle HV, Obendorf DL, Muller HK (2007) The immune responseof the Tasmanian devil (Sarcophilus harrisii) and devil facial tumour disease. EcoHealth 4:338–345.
Yadav M (1971) The transmissions of antibodies across the gut of pouch-young marsupials.Immunology 21:839–851.

380 M.L. Baker et al.
Yadav M (1973) The presence of the cervical and thoracic thymus lobes in marsupials. Aust J Zool21:285–301.
Zachau HG (2004) Immunoglobulin kappa genes of human and mouse. In: Honjo T, Alt FW,Neuberger M (eds) Molecular Biology of B Cells. Academic Press, London.
Zhang Y, Cado D, Asarnow DM, Komori T, Alt FW, Raulet DH, Allison JP (1995) The role ofshort homology repeats and TdT in generation of the invariant γδ antigen receptor repertoire inthe fetal thymus. Immunity 3:439–447.
Zuccolotto PD, Harrison GA, Deane EM (2000) Cloning of marsupial T cell receptor α and β
constant region cDNAs. Immunol Cell Biol 78:103–109.
Chapter 18Use of Genomic Information to Gain Insightsinto Immune Function in Marsupials: A Reviewof Divergent Immune Genes
Katrina Morris, Emily S.W. Wong, and Katherine Belov
Abstract Marsupial immune genes, including cytokines, Natural Killer cellreceptors and antimicrobial peptides, have been difficult to isolate due to the widedivergence of these genes from their eutherian counterparts. Early studies usingconventional laboratory techniques only isolated the most conserved genes. Withthe sequencing of opossum and tammar wallaby genomes, many of these divergentgenes have now been identified. Knowledge of these gene sequences will enable usto study immune function in marsupials. We can develop immunological reagentsfor studying the immune system of healthy marsupials and look at the immuneresponse of diseased marsupials. We can also investigate marsupial specific immunefunctions such as the immune protection of pouch young. Additionally, antimicro-bial therapies for both humans and marsupials may be designed around some ofthese immune peptides.
Keywords Marsupial · Opossum · Cytokine · Antimicrobial peptide ·Natural killer cell
18.1 Introduction
For many decades our understanding of the marsupial immune system has laggedwell behind that of the eutherian immune system. This is due, in part, to the diffi-culty of isolating divergent immune genes in marsupials. Genes for immune peptidesincluding cytokines, Natural Killer cell receptors and antimicrobial peptides aresome of the most rapidly evolving genes within the vertebrate genome. Conventionallaboratory techniques have only identified the most conserved immune genes.However, in the last few years, with the sequencing of the South American opossum
K. Belov (B)Faculty of Veterinary Science, The University of Sydney, Sydney, NSW 2006, Australiae-mail: [email protected]
381J.E. Deakin et al. (eds.), Marsupial Genetics and Genomics,DOI 10.1007/978-90-481-9023-2_18, C© Springer Science+Business Media B.V. 2010
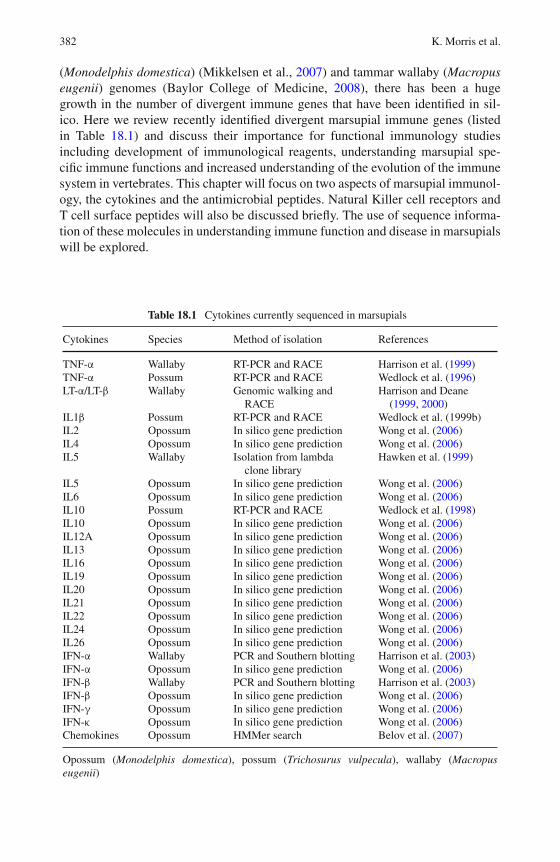
382 K. Morris et al.
(Monodelphis domestica) (Mikkelsen et al., 2007) and tammar wallaby (Macropuseugenii) genomes (Baylor College of Medicine, 2008), there has been a hugegrowth in the number of divergent immune genes that have been identified in sil-ico. Here we review recently identified divergent marsupial immune genes (listedin Table 18.1) and discuss their importance for functional immunology studiesincluding development of immunological reagents, understanding marsupial spe-cific immune functions and increased understanding of the evolution of the immunesystem in vertebrates. This chapter will focus on two aspects of marsupial immunol-ogy, the cytokines and the antimicrobial peptides. Natural Killer cell receptors andT cell surface peptides will also be discussed briefly. The use of sequence informa-tion of these molecules in understanding immune function and disease in marsupialswill be explored.
Table 18.1 Cytokines currently sequenced in marsupials
Cytokines Species Method of isolation References
TNF-α Wallaby RT-PCR and RACE Harrison et al. (1999)TNF-α Possum RT-PCR and RACE Wedlock et al. (1996)LT-α/LT-β Wallaby Genomic walking and
RACEHarrison and Deane
(1999, 2000)IL1β Possum RT-PCR and RACE Wedlock et al. (1999b)IL2 Opossum In silico gene prediction Wong et al. (2006)IL4 Opossum In silico gene prediction Wong et al. (2006)IL5 Wallaby Isolation from lambda
clone libraryHawken et al. (1999)
IL5 Opossum In silico gene prediction Wong et al. (2006)IL6 Opossum In silico gene prediction Wong et al. (2006)IL10 Possum RT-PCR and RACE Wedlock et al. (1998)IL10 Opossum In silico gene prediction Wong et al. (2006)IL12A Opossum In silico gene prediction Wong et al. (2006)IL13 Opossum In silico gene prediction Wong et al. (2006)IL16 Opossum In silico gene prediction Wong et al. (2006)IL19 Opossum In silico gene prediction Wong et al. (2006)IL20 Opossum In silico gene prediction Wong et al. (2006)IL21 Opossum In silico gene prediction Wong et al. (2006)IL22 Opossum In silico gene prediction Wong et al. (2006)IL24 Opossum In silico gene prediction Wong et al. (2006)IL26 Opossum In silico gene prediction Wong et al. (2006)IFN-α Wallaby PCR and Southern blotting Harrison et al. (2003)IFN-α Opossum In silico gene prediction Wong et al. (2006)IFN-β Wallaby PCR and Southern blotting Harrison et al. (2003)IFN-β Opossum In silico gene prediction Wong et al. (2006)IFN-γ Opossum In silico gene prediction Wong et al. (2006)IFN-κ Opossum In silico gene prediction Wong et al. (2006)Chemokines Opossum HMMer search Belov et al. (2007)
Opossum (Monodelphis domestica), possum (Trichosurus vulpecula), wallaby (Macropuseugenii)
18 A Review of Divergent Immune Genes 383
18.2 Cytokines
The immune system of mammals is highly complex with many different immunecells being coordinated together to enable the prompt and effective removal of any-thing recognised as non-self. This system involves a vast array of cells types eachwith unique functions and a similarly vast array of chemical signals required tocoordinate the function and interaction of these cells. The adaptive immune systemin mammals can be broadly divided into two branches; the cell mediated arm andthe humoural arm. Cell mediated immune defense is primarily directed to intracellu-lar pathogens, especially viruses. When viral peptides are presented on the surfaceof cells by Major Histocompatibility Complex (MHC) class I molecules they arerecognised by cytotoxic T cells. These cytotoxic T cells have CD8 peptides on theirsurface to enable binding of antigen and T cell receptor. The cytotoxic T cells canthen mediate destruction of infected cells. The humoural immune system is primar-ily directed to the removal of extracellular pathogens. Peptides from phagocytisedpathogens will be presented using MHC class II molecules, which are recognised byT helper cells expressing CD4 peptides on their surface. This will lead to activationof B cells and the production of antibodies to destroy the extracellular pathogens(reviewed in Abbas and Janeway, 2000).
T helper cells are often subdivided into T helper 1 (Th1) and T helper 2(Th2) cells. Th1 cells are required for activation of cytotoxic T cells and pro-mote macrophage activation and so are important for the destruction of intracellularpathogens. Th2 cells stimulate B cell proliferation and immunoglobulin secre-tion and, as such, are important for humoural immunity. These two subsets of Thelper cells are distinguished by the cytokines that they express (reviewed in Abbaset al., 1996).
Cytokines are small glycoproteins that are involved in the regulation of all aspectsof the immune system. The cytokine family is a large heterogeneous group withproteins performing a diverse array of functions (reviewed in Dinarello, 2007).These proteins are unified in that they all mediate intra-cellular communicationbetween immune cells, allowing for the highly sophisticated immune response seenin higher vertebrates. Cytokine signaling is involved in immune responses includ-ing phagocytosis, degranulation, complement mediated destruction, apoptosis andcytolysis. Cytokine molecules belong to several families based on their structureand function. Interleukins (ILs) are a highly diverse group of cytokines whichare grouped together as they regulate interactions between lymphocytes and otherleukocytes. Interferons (IFNs) are a group of antiviral cytokines able to interferewith viral RNA and protein synthesis. Tumour Necrosis Factors (TNFs) are pro-duced by macrophages and T cells and are important in inflammation. Chemokinesare cytokines that are able to induce directed chemotaxis in nearby cells and serveas leukocyte activators. Other cytokines including GM-CSF and TGF-β serve asgrowth factors and regulate leukocyte production.
Cytokines are expressed by T helper cells in order to coordinate immuneresponse (Fig. 18.1). Th1 cells are characterised by their production of IL-2, IFN-γand TNF-β while Th2 cells express IL-4, IL-5, IL-6, IL-10 and IL-13. Through
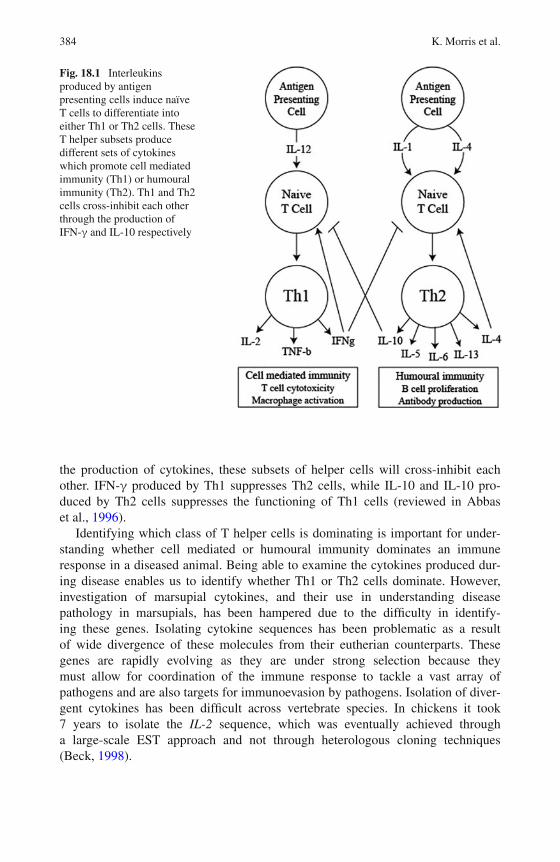
384 K. Morris et al.
Fig. 18.1 Interleukinsproduced by antigenpresenting cells induce naïveT cells to differentiate intoeither Th1 or Th2 cells. TheseT helper subsets producedifferent sets of cytokineswhich promote cell mediatedimmunity (Th1) or humouralimmunity (Th2). Th1 and Th2cells cross-inhibit each otherthrough the production ofIFN-γ and IL-10 respectively
the production of cytokines, these subsets of helper cells will cross-inhibit eachother. IFN-γ produced by Th1 suppresses Th2 cells, while IL-10 and IL-10 pro-duced by Th2 cells suppresses the functioning of Th1 cells (reviewed in Abbaset al., 1996).
Identifying which class of T helper cells is dominating is important for under-standing whether cell mediated or humoural immunity dominates an immuneresponse in a diseased animal. Being able to examine the cytokines produced dur-ing disease enables us to identify whether Th1 or Th2 cells dominate. However,investigation of marsupial cytokines, and their use in understanding diseasepathology in marsupials, has been hampered due to the difficulty in identify-ing these genes. Isolating cytokine sequences has been problematic as a resultof wide divergence of these molecules from their eutherian counterparts. Thesegenes are rapidly evolving as they are under strong selection because theymust allow for coordination of the immune response to tackle a vast array ofpathogens and are also targets for immunoevasion by pathogens. Isolation of diver-gent cytokines has been difficult across vertebrate species. In chickens it took7 years to isolate the IL-2 sequence, which was eventually achieved througha large-scale EST approach and not through heterologous cloning techniques(Beck, 1998).
18 A Review of Divergent Immune Genes 385
18.2.1 Marsupial Tumour Necrosis Factors
The first marsupial cytokines were identified using conventional molecular exper-imental strategies such as using degenerate primers for RT-PCR or heterologousprobes for screening genetic libraries. These methods were only able to identifythe most conserved cytokine sequences. For instance, some of the earliest iso-lated marsupial cytokine sequences were those belonging to the Tumour NecrosisFactor (TNF) family. This family includes the genes TNF, Lymphotoxin α (LTA)and Lymphototoxin β (LTB). These proteins have a wide range of roles in inflam-mation and immune regulation. The sequence for TNF has been isolated in both thetammar wallaby (Harrison et al., 1999) and brushtail possum (Trichosurus vulpec-ula) (Wedlock et al., 1996). The possum TNF cDNA was isolated by RT-PCR usingprimers designed from conserved regions of eutherian cDNAs. The complete cDNAsequence was isolated from lymphocyte RNA using 5′ and 3′ RACE. The tammarwallaby cDNA sequence was isolated using a similar method. As expected, the twomarsupial sequences are more closely related to one another than to eutherians,with 70% sequence identity at the amino acid level. However, the wallaby showsgreater sequence identity than the possum to eutherians at the amino acid level(65–70% and 56–68%, respectively). Moreover, the wallaby amino acid sequenceis only slightly more similar to the possum (70%) than to eutherians (65–70%).By comparing the rates of substitution at synonymous and non-synonymous sites,Harrison et al. (1999) indicated that the possum gene appears to have been evolv-ing more rapidly at non-synonymous sites than the wallaby gene. The reason forthis observation is not clear but it has been suggested that this could be caused bypositive selection in response to particular disease outbreaks (Harrison et al., 1999).
Structurally, TNF is very similar in eutherians and marsupials with importantstructural features being conserved (Harrison and Wedlock, 2000). This includesthe conservation of the His15 and Tyr56 residues which are important for receptorbinding (Cha et al., 1998). Recombinant TNF has been produced in possums andits effect on possum physiology investigated (Wedlock et al., 1999a). RecombinantTNF administered to possums caused a profound increase in the number of cir-culating leukocytes and increased the possums’ body temperature. In eutherians,administration of TNF has also been found to increase blood leukocyte counts(Rothel et al., 1998) and cause fever (Dinarello, 1999). TNF is also being inves-tigated for its potential use as an adjuvant in biocontrol vaccines in possums. Ineutherians it has been shown that cytokines are capable of increasing the antibodyresponse when used as an adjuvant in vaccines. A study by Wedlock et al. (1999a)demonstrated that recombinant TNF successfully enhanced antibody response whenco-administered with the model antigen keyhole limpet hemocyanin (KLH).
LT-α is a cytokine which is secreted as a homotrimer of the LT-α peptide. LT-αcan also form a complex on the surface of activated lymphocytes with the mem-brane bound LT-β peptide. Both LTA and LTB have been cloned and sequencedfrom the tammar wallaby (Harrison and Deane, 1999, 2000). This was achievedusing a method that utilised the proximity of LTA and LTB to TNF in the genome.
386 K. Morris et al.
In eutherians these genes are tightly clustered together. Using sequence informationfrom TNF, a PCR based “genomic walking” approach was used to obtain partialsequences for LTA and LTB. These partial sequences were used to design primerswhich were then used in RACE PCR to derive the entire cDNA sequences. TheLT-α and LT-β peptides share 70 and 61% sequence identity to eutherian mammalsrespectively. Structurally, LT-α and LT-β appear to be very similar to their eutheriancounterparts. In eutherian mammals TNF, LTA and LTB lie in close proximity toone another within the class III inflammatory region of the MHC. These genes arelocated in the same position in both the opossum and tammar wallaby (Deakin et al.,2006), and therefore it is likely that these genes are located within the MHC classIII in all marsupials.
18.2.2 Marsupial Interleukins
Interleukin 1β (IL-1β) was the first interleukin to be studied in marsupials. IL-1β is astrong pro-inflammatory cytokine and is also involved in cell differentiation, prolif-eration and apoptosis. IL-1β activity was first shown in the opossum when the IL-1β
peptide was extracted from lippopolysaccharide (LPS) stimulated macrophages(Brozek and Ley, 1991). Subsequently, the cDNA encoding IL-1β in the brushtailpossum was sequenced (Wedlock et al., 1999b). Primers based on conserved regionsfrom eutherian sequences were used to amplify cDNA prepared from brushtail pos-sum LPS-stimulated alveolar macrophages. RACE was employed in order to obtainthe complete cDNA sequence. IL-1β shared 46% amino acid identity with humanIL-1β. Experiments on opossum IL-1β (Brozek and Ley, 1991) and recombinantpossum IL-1β (Wedlock et al., 1999b), demonstrate that there is very little serolog-ical or functional cross reactivity between the marsupial and eutherian IL-1β. TheIL-1β peptide is another possible candidate for use as an adjuvant in biocontrol vac-cines in possums. Recombinant possum IL-1β caused an increase in serum antibodylevels to KLH when used as an adjuvant (Harrison and Wedlock, 2000).
IL-10 is a cytokine which has an immunosuppressive effect on macrophages andT cell antigen specific proliferation but also has an immunostimulatory effect on Bcells. IL10 was sequenced in the brushtail possum using a similar method to IL-1β
(Wedlock et al., 1998). IL-10 is one of the most conserved interleukins and the pos-sum protein shared 53–60% homology with eutherian sequences. An unusual longperfect palindromic sequence 42 base pairs long was found in the 3′ UTR of thepossum sequence. Although the function of this is unknown it has been suggestedthat it may be involved in regulation of IL-10 expression (Harrison and Wedlock,2000). IL-5, a cytokine which stimulates B cell growth and increases immunoglob-ulin secretion, was sequenced in the tammar wallaby (Hawken et al., 1999). Primersdesigned on conserved sequences between mice and humans were used to amplifypart of the gene from genomic DNA of the striped faced dunnart (Sminthopsismacroura). The PCR product was used as a probe to identify the tammar wallabyIL5 sequence from a lambda clone library. FISH was then used to localise this geneto chromosome 1. The IL-5 protein shares 48–63% identity with eutherians. Many
18 A Review of Divergent Immune Genes 387
important features in eutherian IL-5 sequences were conserved in the possum IL-5 including two cysteine residues thought to be essential for biological activity aswell as key residues involved in the interaction between the protein and its receptor(Hawken et al., 1999). These features suggest that IL-5 has a conserved immunefunction across mammals.
18.2.3 Interferons
In mammals, interferons are divided into two types. Type I interferons belong toone of several classes including IFN-α, IFN-β, IFN-δ, IFN-ω, IFN-τ and IFN-κ.The number of genes within these classes varies from species to species. In euthe-rians, IFN-α and IFN-β genes produce distinct clusters in phylogenies, with -δ, -ωand -τ classes clustering with the -α class (Roberts et al., 1998). These -δ, -ω and -τclasses are only found in some species of eutherians and there has been disagree-ment between authors to whether the -δ and -ω classes are ancient classes or whetherthese classes have recently diverged from the -α class. IFN-κ sequences are onlyfound in some eutherian species and cluster separately from the –α and –β sequences(Wong et al., 2006). Type II interferons are represented by a single class, IFN-γ,which contains only a single gene. A PCR based survey of interferons in the tam-mar wallaby revealed a large number of interferon genes rivaling that of eutherianspecies (Harrison et al., 2003). This survey indicated the presence of ten to twelveIFN-α genes and four IFN-β genes. The authors suggest that the diversification ofinterferons in marsupials and eutherians may be related to the evolution of viviparity,as echidnas and other vertebrates lack diversification of interferons. Southern blot-ting and phylogenetic analyses indicated that tammar wallaby interferons showedorthology with both IFN-α and IFN-β sequences from eutherians. This indicatesthat the divergence of the IFN-α and IFN-β classes occurred prior to the divergenceof marsupials and eutherians. However none of the tammar interferons showedhomology to the -δ, -ω or -τ subtypes.
18.2.4 Identifying Marsupial Cytokines In Silico
The above studies, using PCR based approaches, have only identified the most con-served cytokines. Many of the more divergent cytokines, including the majority ofthe interleukins and IFN-γ, have not been successfully sequenced using these lab-oratory methods due to the lack of sequence similarity with eutherians. Attemptsto identify divergent interleukins such as 2, 4, 6 and 12 and IFN-γ using molec-ular approaches have failed (Harrison and Wedlock, 2000). However, with therecent sequencing of the opossum and tammar wallaby genomes, in silico methodshave been utilised in order to identify the sequences of these divergent cytokines.Automated annotation techniques have been used to identify many interleukins inthe genomes of the opossum and tammar wallaby. The previously unidentified inter-leukins 1α, 8, 15, 16, 17α, 19, 21, 22, 25, and 27 have all been identified in the
388 K. Morris et al.
opossum genome sequence by the automated annotation techniques of Ensembl.Interleukins 15, 16, 17α, 19, 21, 25, and 27 have also been identified in the tam-mar wallaby genome by Ensembl, though the full sequence is only available forinterleukins 17α and 25 due to gaps in the tammar genome sequence.
However, these automated annotation techniques have still been unable to iden-tify the most divergent cytokines as these techniques are not sensitive enough.Instead, a manual, expert curated approach has been used, utilizing a synteny basedstrategy to identify the most divergent cytokines in the opossum genome (Wonget al., 2006). This approach involved identifying the genomic region containingthe gene of interest by locating conserved flanking segments. After identifying thisregion, gene prediction was performed. Finally, the predicted genes were comparedto known eutherian sequences to identify genes that are similar to the gene of inter-est. This method was used to successfully identify many highly divergent cytokinesin the opossum including many previously unsequenced in marsupials includingIL-2, IL-4, IL-13, IFN-γ and IFN-κ.
Thirteen interleukins were identified in this study (Wong et al., 2006), includ-ing four that had not been previously sequenced in marsupials. These interleukinshad amino acid identity to human sequences ranging from 36.3% (IL-6) to 59.7%(IL-20). Many of the interleukins identified including IL-6, IL-2 and IL-13 hadamino acid identities with human which were less than 45%, highlighting the needof new approaches such as these in silico methods to identify divergent cytokines inmarsupials. The interleukin sequences in opossums share many features with euthe-rians that are crucial for the biological activity of these molecules. This includesthe conserved leucine and aspartic acid amino acids within helix A of IL-2 whichis critical for ligand binding in humans (Eckenberg et al., 2000) and the disulfidebonds which join helix B to the CD loop in IL-4 (Kruse et al., 1991).
This study identified seven IFN–α genes and a single IFN–β gene in the opossumgenome (Wong et al., 2006). An IFN–κ gene, previously unidentified in marsupi-als, was identified in the opossum genome. The highly divergent type II interferon,IFN-γ, was also identified in the opossum genome with amino acid identity of 47%compared to eutherian sequence. This demonstrates that marsupials retain both typeI and type II interferon genes. The presence of –α, –β and –κ subclasses indicatesthat the most divergent interferon subclasses are common to both eutherians andmarsupials while the lack of –τ, –ω and –δ sequences in both opossum and tam-mar indicate that these are likely to have arisen recently within particular eutherianlineages.
Chemokine sequences within the opossum genome have also been identifiedbioinformatically (Belov et al., 2007). Hidden Markov model (HMM) searches wereperformed to identify the chemokine sequences (see Papenfuss et al., Chapter 6for a detailed explanation of this approach). Chemokines are small peptides whichare involved in cell activation, migration and differentiation. Thirty-one chemokinesequences were identified in the opossum genome, compared to 47 and 24 in humansand chickens respectively. The opossum sequences have the same conserved cys-teine motif that is common to chemokines in all vertebrates (Belov et al., 2007).Chemokines are traditionally divided into four subgroups based on the position of
18 A Review of Divergent Immune Genes 389
cysteine residues; these are the C, CC, CXC and CX3C subgroups. The largest sub-group of chemokines in eutherians and birds is the CC group. In opossums there are22 members of this subfamily. Within this subfamily are five genes which phyloge-netic analyses suggest have arisen by a marsupial or opossum specific lineage geneexpansion (Belov et al., 2007). The role of these cytokines is unknown, but they mayhave an important marsupial specific role. The CXC family in opossums containsseven genes. Some genes within this family in opossum appear to be orthologousto chemokine genes in humans. Many of the chemokines in this family in eutheri-ans have a three residue motif that is important for neutrophil attraction (Laing andSecombes, 2004). Three opossum cytokines also contained this feature. A singlemember of the C and the CX3C families were identified in the opossum genome.
Chemokine genes have also been identified within the tammar wallaby genomeby Ensembl. 18 CC family chemokines and 3 CXC chemokines have been anno-tated in the wallaby genome. There are likely to be more chemokines within thetammar wallaby genome including CX3C and C family chemokines, though a morecomplete wallaby genome and more sensitive searches may be required to identifythese.
Another important set of genes for studying immune response in marsupials arethe genes encoding the CD4 and CD8 peptides. These peptides are found on thesurface of T helper cells and cytotoxic T cells respectively. Generation of marsu-pial specific reagents to these peptides in order to distinguish the classes of T cellsis important to gain a better understanding of the response of marsupial immunesystems to disease. The ratio of CD4/CD8 cells is commonly used to understandhow the immune system responds to a pathogenic challenge and is also used in dis-ease diagnostics. Identification of the sequence for CD4, CD8α and CD8β was firstachieved by Wong et al. (2006), by performing TBLASTN searches on the opossumgenome. However, this method was unable to predict the terminal exon of thesegenes. In two subsequent studies, the full opossum and tammar cDNAs for CD4(Duncan et al., 2007) and CD8α/CD8β (Duncan et al., 2009) were isolated. Thesestudies identified the CD4 and CD8 sequences from the opossum genome sequenceand then used these sequences to isolate full length opossum and tammar cDNAsusing RT-PCR and 5′ and 3′ RACE. Both the CD4 and CD8 sequences showed con-served synteny and structural similarity to human and mouse sequences. In both thetammar and opossum CD4 and CD8, the sequences were shown to be truncated atthe terminal end of the cytoplasmic tail. The functional significance of this is as yetunknown.
Sequencing of marsupial cytokines and CD4/CD8 peptides will provide a spring-board for future studies in immunology and disease in marsupials. Studies into theimmune response to marsupial diseases have been hampered due to the lack of mar-supial specific immune reagents. Previous studies have attempted to used antibodiesdeveloped in eutherians to measure cytokines or CD4/CD8 (Higgins et al., 2004;Old and Deane, 2002), but many of these do not show cross-reactivity with marsu-pial species and they can be unreliable. The sequencing of CD4 and CD8 cDNAswill allow us to distinguish cytotoxic and helper T cells. This will be important forestablishing baseline information on normal lymphoid tissue in healthy animals and
390 K. Morris et al.
will allow us to characterise the pathogenesis of marsupial diseases. Key cytokinesfrom all cytokine families have now be identified in marsupials including the mem-bers of the TNF family, many interleukins, both type I and type II interferons andchemokines from all of the four chemokine families. Cytokines that are associatedwith a Th1 response including IL-2, IFN-γ and TNF and those associated with Th2response including IL-4, IL-5, IL-6, IL-10 and IL-13 have now been sequencedin marsupial species. This will allow us to examine Th1/Th2 cytokine profiles indiseased animals to understand the immune response of these animals.
18.2.5 Uses for Marsupial Cytokine Sequence Data
The development of cytokine sequence information in marsupials can be used formany purposes. The opossum in an important model for cancer immunology sinceopossums can be induced to accept melanoma cells (Wang and Vandeberg, 2005).With the expanding knowledge of cytokines, researchers can more easily investigatetumour suppression in the opossum. Another use of this sequence information willbe in investigating the purpose of the two thymuses which is seen in many mar-supials, especially within the diprotodont lineage. Also, researchers can continue toinvestigate the potential of marsupial cytokines to be used as adjuvants in biocontrolvaccines in overpopulated species such as the brushtail possum and koala. Howeverthe most important use of cytokine sequence information is likely to be in studyinginfectious diseases in marsupials. Two examples of this are in the devil facial tumourdisease in Tasmanian devils and Chlamydia in koalas.
The devil facial tumour disease (DFTD) is caused by a transmissible tumourwhich is spread from one devil to another by biting (see Bender, Chapter 23). Thisdisease has caused the decline of the population by about 70% in the last decade.This form of disease, where cancer cells themselves are the transmissible agent, isvery rare as under normal circumstances these cells would be recognised as foreignand cleared by the immune system of the infected individual. There is only oneother known naturally occurring transmissible cancer. This is the canine transmissi-ble venereal tumour which is found in domestic and wild canines. One strategy thatthis tumour uses in order to avoid the immune response is by secreting immunosup-pressive cytokines (Hsiao et al., 2004). Secretion of immunosuppressive cytokines iscommon in cancers and includes cytokines such as IL-10 (Garcia-Hernandez et al.,2002), IL-6 (Wei et al., 2003), IL-4 (Todaro et al., 2007) and TGF-β (Gold, 1999). InTasmanian devils, there are no documented cases in which devils have been able toovercome the DFTD tumour and no signs of lymphocyte infiltration of the tumour(Loh et al., 2006a, b). One reason for this lack of immune response may be thatDFTD cells are producing immunosuppressive cytokines. With sequence informa-tion now available for cytokines in marsupials we can investigate whether DFTDcells are producing any immunosuppressive cytokines. Through designing primersbased on conserved regions of opossum or tammar cDNAs we can create probesto isolate Tasmanian devil cytokine cDNAs from cDNA libraries. We can then usethe devil cDNA sequences in order to perform RT-PCR to determine the level of
18 A Review of Divergent Immune Genes 391
expression of these cytokines in DFTD cells. Marsupial cytokine sequences can alsobe used to develop marsupial specific antibodies against cytokines. By determiningwhether DFTD cells produce immunosuppressive cytokines we can better under-stand the pathology of this disease and this will help us in designing treatments orvaccines.
Another use of marsupial cytokine sequence data will be to investigate the pathol-ogy of Chlamydia in koalas. Chlamydial infection in koalas is considered to bewidespread with both Chlamydophila pecorum and Chlamydophila pneumoniaeinfecting koalas. Studies in human Chlamydia have shown that a Th1 dominatedhost response is important for elimination of disease (Lampe et al., 1998) while Th2dominated host response results in the persistence of Chlamydia bodies and resultsin chronic hypersensitivity and fibrosis (Beatty et al., 1995; Darville et al., 1997).Investigation into the balance of Th1/Th2 response during infection of Chlamydiain koalas will be important to understand host and environmental factors whichaffect susceptibility of koalas to Chlamydial disease. In the past, bovine antibod-ies have been tested for the efficacy to label IL-4 and IFN-γ, in order to study theTh1/Th2 response of koalas to Chlamydia (Higgins et al., 2004). While the IFN-γantibody showed some success in labeling marsupial IFN-γ, the IL-4 antibody didnot show cross-reactivity to marsupial IL-4. Now that these cytokines, as well asother cytokines that form part of the Th1 and Th2 profiles, have been sequencedin marsupials we can develop marsupial specific antibodies. These will enable usto effectively assess the dominance of Th1 or Th2 response in koalas infected withChlamydia. This will give us a better understanding of the koala’s immune responseto the disease and may be important for treating Chlamydia in koalas.
18.3 Natural Killer Cell Receptors
Natural Killer (NK) cells are cytotoxic lymphocytes that play an important rolein the innate immune system. These cells play a major part in the destruction oftumour cells and virally infected cells. NK cells’ cytotoxicity is controlled by acti-vating and inhibitory signals. MHC class I molecules expressed in normal healthycells inhibit NK cytotoxicity, while cells not expressing MHC class I such as somevirally infected cells or tumour cells will be destroyed. Additionally, the MHC ClassI associated (MIC) proteins will activate NK cytotoxicity. MIC proteins are notexpressed in healthy cells but are upregulated in tumour cells and virally infectedcells (reviewed in Cerwenka and Lanier, 2001). The detection of activating orinhibiting targets in NK cells is mediated by two major classes of receptors. Theseare the immunoglobulin superfamily (IgSF) which in eutherians is found in theleukocyte receptor complex (LRC) and the C-type lectin superfamily (CLSF) whichin eutherians is found in the Natural Killer complex (NKC) (Kelley and Trowsdale,2005).
NK receptor genes were first described in marsupials in 2005 by Hao and col-leagues. This study identified eight putative NKC genes in the opossum genome.Five of these genes showed orthology to eutherian NKC genes. Following on from
392 K. Morris et al.
this, a study by Belov and colleagues (2007) constructed a gene map of the NKCand identified genes using HMMer and GenomeScan. The location of the LRC wasidentified using BLAST and then receptor genes within this region were identifiedusing HMMer. In opossums the NKC is located on chromosome 8 and encodes nineC-lectin type receptor genes. Based on orthology of these genes to eutherian NKCgenes, at least seven of these C-lectin type receptor genes predated divergence of theeutherian and marsupial lineages. This indicates that the NKC evolved prior to theseparation of these lineages. However, expansion in the NKC genes appears to haveoccurred only within the eutherian lineage and particularly in the rodents. While theopossum NKC only contains nine receptor genes the human NKC contains 29 andrats contain 75 (Hao et al., 2006).
The opossum LRC is located on chromosome 4 and contains five separate clus-ters of Ig domains (Belov et al., 2007). The LRC contains 154 Ig-like domainswhile a further 22 Ig-like domains are located on the unordered chromosome. Whenexamined phylogentically, Ig domains from eutherians and avians cluster into twobranches (Nikoladis et al., 2005) with mammalian MI and avian CI domains clus-tering together and mammalian MII and avian CII domains clustering separately.Opossum Ig domains fall into three distinct clades in this phylogenetic tree, desig-nated clade I, Ia and II. Clade I clusters with eutherian MI and avian CI sequenceswhile clade II clusters with MII and CII sequences. Clade Ia forms a sister groupto the MI and CI clades and contains only opossum sequences. This clade rep-resents a large expansion of Ig domains within opossums. This diversification islikely to be the result of different pathogenic pressures, particularly on the new-born marsupial which relies on innate immune mechanisms for protection frompathogens.
18.4 Antimicrobial Peptides
Another important group of immunological proteins are the antimicrobial peptides(AMPs). These molecules have a broad spectrum antibiotic effect and as such arean important mediator of the innate immune response. Antimicrobial peptides havea conserved structure usually containing both a hydrophobic and a hydrophilic sideenabling them to be soluble in water but also penetrate lipid membranes. Once insidethe target microbe, AMPs kill the target through diverse mechanisms. The two maingroups of antimicrobial peptides are the defensins and the cathelicidins.
Defensins are cationic peptides with three conserved cysteine sulfide bonds.These peptides are found in epithelial cells, neutrophils and Paneth cells. Defensinsfunction by disrupting the membrane of a microbial target cells causing an efflux ofions and nutrients leading to death of the cell (Ganz, 2003). In mammals defensinsare classified into either α, β, or θ families based on their structure. β defensins arethe most widely distributed defensins, while α defensins are mostly secreted by neu-trophils and Paneth cells (Ganz et al., 1985; Jones and Bevins, 1992). θ defensinshave only been discovered in a few primate species (Tang et al. 1999). It has beendemonstrated that all mammalian defensins evolved from a common β-defensin like
18 A Review of Divergent Immune Genes 393
ancestor with β defensins having been found in a wide range of vertebrates includingfish and birds (Xiao et al., 2004).
18.4.1 Defensins
Defensins are one of the most rapidly evolving families in the genome makingthem difficult to isolate in marsupials. Identification of marsupial defensins hasonly occurred since the sequencing of the opossum genome. Although defensinsare rapidly evolving, they have a highly conserved structure based on six cysteineresidues (Selsted, 2004). This conserved feature has been utilised by researchers toidentify defensins within the opossum genome. α defensins were previously thoughtonly to have evolved in the branch of eutherian mammals containing rodents and pri-mates, as α defensins could not be identified in the cow, dog or chicken (Bals et al.,1998; Patil et al., 2004). However, two studies (Belov et al., 2007 Lynn and Bradley,2007) both utilising hidden Markov models to identify defensins, demonstrated thatthere is a single α gene present in the opossum genome. This gene is expressed inthe small intestine epithelium, a tissue in which α defensins are expressed in euthe-rians, suggesting that this defensin has a similar function (Lynn and Bradley, 2007).The opossum α defensin is located in a region syntenic to the human chromoso-mal region containing α defensins (Belov et al., 2007; Lynn and Bradley, 2007).There are two types of α defensins found in eutherian mammals; myeloid which areprimarily expressed in bone marrow and enteric which are primarily expressed inPaneth cells (Patil et al., 2004). Phylogenetic analysis places the sole opossum α
defensin at the base of the eutherian myeloid and enteric α defensin lineages (Belovet al., 2007). This suggests that the myeloid and enteric lineages may have evolvedwithin eutherians from the ancestral α defensin seen in opossums.
In the opossum genome, 32 β-defensin genes have been identified (Belov et al.,2007). This is similar to the number of β-defensins in humans (39) (Patil et al.,2005). The opossum β-defensins are arranged in three chromosomal clusters whichare orthologous to β-defensin clusters in eutherian mammals. Through the con-struction of a phylogenetic tree and synteny map it was demonstrated that someopossum β-defensins are orthologous to eutherian β-defensins, while other opos-sum β-defensins have been produced by lineage specific expansions (Belov et al.,2007). A large opossum specific expansion is seen within one of the chromosomalclusters and it is possible that these genes may have a marsupial-specific immuno-logical role. β-defensins are encoded by two exons in eutherian mammals, but areencoded by three and four exons in birds and fish respectively. It has been suggestedthat the fusion of defensin exons occurred as an adaptive event in mammals, allow-ing for faster mobilisation of these defensins to better cope with invading microbes(Xiao et al., 2004). The β-defensins identified in the opossum genome were allencoded by two exons, indicating that this fusion occurred prior to the divergenceof eutherians and marsupials. This also suggests a similar function of β-defensins inmarsupials and eutherians. The presence of both α and β defensins in the opossumindicates that the differentiation between α and β defensins occurred much earlier
394 K. Morris et al.
than once suspected, prior to the divergence of the eutherian and marsupial lineages.θ defensins have only been identified in some primate species and were not foundin the opossum genome. These θ defensins are likely to have arisen recently withinthe primate lineage. The presence of defensins in other marsupial lineages has yetto been investigated.
18.4.2 Cathelicidins
Cathelicidins, like defensins, have a cationic amphipathic structure which allowsthem to disrupt the membrane of pathogens. Peptides in this family are characterisedby a highly conserved cathelin-like prosequence containing four cysteine residues.Cathelicidins are predominately expressed in neutrophils and epithelial cells andare expressed in response to inflammation, cell injury and microbial infection. Aswell as their antimicrobial effects cathelicidins have an immunomodulatory role(Braff et al. 2005). Cathelicidins can induce changes in cytokine expression, bindneutralise endotoxins and induce chemotaxis of T cells and neutrophils (Bals andWilson, 2003).
The first marsupial cathelicidin sequences were identified in the opossumgenome using HMMer searches (Belov et al., 2007 and Papenfuss et al., Chapter 6).Twelve cathelicidin genes were located in the opossum genome, in a single clusteron chromosome 6. This region shows synteny with the region containing catheli-cidins in mammals and birds. Like all other cathelicidin genes in vertebrates, thesegenes are composed of four exons. The opossum cathelicidin genes do not showorthology to eutherian genes and are clustered separately in a phylogeny. There aremore genes in the cathelicidin family in the opossum then in any eutherian mammalstudied to date, with many species including humans and mice having only a sin-gle cathelicidin gene. While most eutherian cathelicidin sequences cluster closelywithin species, indicating that they have arisen from recent gene expansions, opos-sum sequences form at least three distinct clusters in a phylogeny with long branchesseparating them. The amino acid identity of the mature peptides ranges from 1to 94%. The level of heterogeneity of these opossum cathelcidins is much higherthan in other species, including bird and fish species. The expansion in this genefamily suggests that these genes may have an important marsupial-specific role ininnate immunity. The high level of heterogeneity may suggest that these genes pro-vide protection against a diverse array of microbial pathogens, which has led to themaintenance of diverse cathelicidin alleles.
Cathelicidin genes have also been identified in the tammar wallaby by usingmolecular based approaches. A study in 2008 (Daly et al., 2008) identified sevencathelicidin peptides from a tammar wallaby EST mammary gland cDNA library.The average percentage identities of the cathelin-like domain of these peptides was86%. The identity to eutherians was 46% in wallaby, which was higher than the36% identity seen in the opossum sequences (Belov et al., 2007). The expressionof these cathelicidins was increased in adult wallaby leukocytes when exposed tolippopolysaccharides or lipoteichoic acid (Daly et al., 2008). This suggests that the
18 A Review of Divergent Immune Genes 395
wallaby cathelicidins, like eutherian cathelicidins, have an important role in defenseand recognition of both gram positive and gram negative bacteria. The wallabypeptides also have many conserved features with eutherians including conservedcysteine residues, a hydrophobic C-terminus and cationic charge. Conservation ofthese features also suggests that the role of cathelicidins is similar in both lineages.
Cathelicidins have been of particular interest to marsupial researchers due totheir potential role in protecting marsupial neonates. In eutherian mammals, includ-ing humans and mice, cathelicidins are found at much higher levels in the skin ofneonates than in the skin of healthy adults (Dorshner et al., 2003). Human milk(Lipeke et al., 2001) and tracheal aspirates of newborn infants (Schaller-Bals et al.,2002) also contain antimicrobial peptides. Marsupials have a very short gestationand their young undergo the majority of their development in the non-sterile pouch.They are born without a functional immune system and underdeveloped lymphoidtissue. Despite this lack of adult immune function, the marsupial neonates are pro-tected against pathogens, and researchers have observed that surgical incisions inneonatal young do not become infected when returned to the pouch (Renfree andTyndale-Biscoe, 1978). Cathelicidins have been suggested to play an important rolein the protection of marsupial neonates in the pouch. In the study of wallaby cathe-licidins by Daly and colleagues (2008) it was found that one cathelicidin, namedMaeucath1, was expressed in the primary and secondary lymphoid tissue of wal-laby neonates. Furthermore, it was found that the expression of this cathelicidinwas increased in the liver, spleen, bone marrow, skin, gut and lungs in the first 25days post-partum. By 90–120 days, the approximate time of immune maturation oftammar neonates, expression had stabilized or decreased in these tissues. A sub-sequent study isolated a new cathelicidin using RACE-PCR (Carmen et al., 2009).This new cathelicidin was found to be expressed in the spleen and GIT of newbornsand was observed in most of the neonates’ tissues by day 7 post-partum. These stud-ies demonstrate that cathelicidins are being synthesised by neonates. This finding,along with the observation of expansion and diversification of cathelicidin genes inboth opossums and tammar wallabies suggest that cathelicidins play a key role inprotecting the young prior to development of an adult-like humoural immune sys-tem. The expression of defensins in neonatal tissue has not yet been investigated butthese peptides may also be important in protecting pouch young.
18.4.3 Potential Uses for Marsupial Antimicrobial Peptides
Cathelicidins and defensins are also of interest to researchers due to their potentialuse as therapeutic agents. Antimicrobial peptides have a broad range antimicrobialactivity but do not appear to induce antibiotic resistance. A number of natu-rally occurring antimicrobial peptides and their derivatives have been developedas novel antibiotic therapies. Pexiganan, an analog of the naturally occurring mag-ainin extracted from the skin of Xenopus laevius frogs, has been developed for usein treating diabetic foot infection (Gottler and Ramamoorthy, 2009). Other AMPsextracted from animals have been investigated for their use in treating buco-dental
396 K. Morris et al.
infection, ocular infections (Andreu and Rivas, 1998) and lower respiratory tractinfections (Cazzola et al., 2003). Additionally, some AMPs have also been found tohave anti-cancer effects (Hoskin and Ramamoorthy, 2008). Pharmaceutical compa-nies are currently developing AMP based therapies for treatment of diseases such asmeningitis, acne, sepsis and HIV (Koczulla and Bals, 2003). As marsupials appearto have a wide diversity of AMPs, with many of these peptides being very uniquefrom those found from other vertebrates, marsupials AMPs may be a new target fordeveloping antimicrobial therapies. With continued investigation and experimen-tation into marsupial antimicrobial peptides new antimicrobial therapies may bediscovered for treating both marsupials and humans.
18.5 Conclusion
Research into the immunology of marsupials has provided insight into the evolu-tion of the mammalian immune system. All the main peptides within the cytokinefamilies are conserved in marsupials and eutherians including members of the TNFfamily, Th1 and Th2 associated interleukins, both Type I and Type II interferons anda diverse array of chemokines. Major divergences within these families are com-mon to both eutherians and marsupials. Studies on marsupial cytokines have shownthat the divergence of IFN-κ, IFN-α and IFN-β occurred prior to the separation ofthe eutherian and marsupial lineages (Harrison et al., 2003; Wong et al., 2006).Additionally both Type I and Type II interferons are preserved in both lineages, asare the four different families of chemokines. These studies have also suggestedthat some sub-classes within these families are likely to be eutherian specific, suchas the IFN-δ and IFN-ω classes. Studies on antimicrobial peptides have shown thatthe development of α and β defensins occurred prior to the divergence of marsupialsand eutherians (Belov et al., 2007).
Investigations into divergent immune molecules have demonstrated that marsu-pials possess a very similar immune architecture to eutherian mammals. The AMPcomplement of marsupials is comparable to that of eutherians in terms of the num-ber of peptides within the defensin and cathelicidin families and diversity of thesepeptides. Important cytokines across all cytokine families are conserved betweeneutherians and marsupials. Structural and functional analyses on these cytokinesand AMPs suggest that they play an equivalent role in marsupials and eutherianmammals. While these studies have demonstrated the similarity between marsupialand eutherian immunology, the sequencing of these molecules will allow for futurestudies to further investigate difference between the immune system in marsupialsand eutherians. One of the most important distinguishing features between marsupi-als and eutherians are that marsupials are born at very premature stage and undergomost of their development, including their immune development in the non-sterilepouch. Cathelicidins are produced by neonatal young as soon as day 1 postpartumand so these peptides are likely to play an important role in defending the youngfrom pathogens prior to immune development. However, these molecules are likelyto be only one of many factors protecting the young during this stage.
18 A Review of Divergent Immune Genes 397
The development of sequence information for the divergent immune genes dis-cussed in this chapter will have a huge range of potential uses in understandingmarsupial immunology and treating marsupial diseases. Development of reagentsagainst CD4 and CD8 will enable researchers to distinguish cytotoxic T cells andhelper T cells, while the sequencing of many cytokines will enable the differenti-ation of Th1 and Th2 dominated immune responses. This will enable researchersto better understand the immune response of marsupials to disease and will leadto better treatment of diseased animals and prevention of disease. Some of thesedivergent immune genes may lead to treatment not only of marsupials but also ofhumans. Research into both defensins and cathelicidins may yield new antimicro-bial or anticancer therapies for both humans and animals. Through the increase inthe genomic information available for divergent immune sequence our understand-ing of marsupial immunity and our ability to treat disease in marsupials will improvein the future.
References
Abbas AK, Janeway CA Jr (2000) Immunology: improving on nature in the twenty-first century.Cell 100:129–138.
Abbas AK, Murphy KM, Sher A (1996) Functional diversity of helper T lymphocytes. Nature383:787–793.
Andreu D, Rivas L (1998) Animal antimicrobial peptides: An overview. Biopolymers 47:415–433.Bals R, Wilson JM (2003) Cathelicidins – a family of multifunctional antimicrobial peptides. Cell
Mol Life Sci 60:711–720.Bals R, Goldman MJ, Wilson JM (1998) Mouse beta-defensin 1 is a salt-sensitive antimicrobial
peptide present in epithelia of the lung and urogenital tract. Infect Immun 66:1225–1232.Baylor College of Medicine (2008) Retrieved from http://www.hgsc.bcm.tmc.edu/project-species-
m-Wallaby.hgsc?pageLocation=Wallaby 20/11/09Beatty WL, Morrison RP, Byrne GI (1995) Reactivation of persistent Chlamydia trachomatis
infection in cell culture. Infect Immun 63:199–205.Beck G (1998) Macrokines: invertebrate cytokine-like molecules? Front Biosci 3:559–569.Belov K, Sanderson CE, Deakin JE, et al. (2007) Characterization of the opossum immune genome
provides insights into the evolution of the mammalian immune system. Genome Res 17:982–991.
Braff MH, Hawkins MA, Di Nardo A, et al. (2005) Structure–function relationships among humancathelicidin peptides: dissociation of antimicrobial properties from host immunostimulatoryactivities. J Immunol 174:4271–7278.
Brozek CM, Ley RD (1991) Production of interleukin-1 in a South American opossum(Monodelphis domestica). Dev Comp Immunol 15:401–412.
Carman RL, Old JM, Baker M, Jacques NA, Deane EM (2009) Identification and expression ofa novel marsupial cathelicidin from the tammar wallaby (Macropus eugenii). Vet ImmunolImmunopathol 127:269–275.
Cazzola M, Sanduzzi A, Matera MG (2003) Novelties in the field of antimicrobial compounds forthe treatment of lower respiratory tract infections. Pulm Pharmacol Ther 16:131–145.
Cha SS, Kim JS, Cho HS, et al. (1998) High resolution crystal structure of a human tumor necrosisfactor-alpha mutant with low systemic toxicity. J Biol Chem 273:2153–2160.
Cerwenka A, Lewis LL (2001) Natural killer cells, viruses and cancer. Nat Rev Immunol 1:41–49.Daly KA, Digby MR, Lefévre C, Nicholas KR, Deane EM, Williamson P (2008) Identification,
characterization and expression of cathelicidin in the pouch young of tammar wallaby(Macropus eugenii). Comp Biochem Physiol 149:524–533.
398 K. Morris et al.
Darville T, Andrews CW Jr, Laffoon KK, Shymasani W, Kishen LR, Rank RG (1997) Mousestrain-dependent variation in the course and outcome of chlamydial genital tract infection isassociated with differences in host response. Infect Immun 65:3065–3073.
Deakin JE, Papenfuss AT, Belov K, et al. (2006) Evolution and comparative analysis of the MHCClass III inflammatory region. BMC Genomics 7:281.
Dinarello CA (1999) Cytokines as endogenous pyrogens. J Infect Dis 179:S294–S304.Dinarello CA (2007) Historical insights into cytokines. Eur J Immunol 37:S.Dorshner RA, Lin KH, Murakami M, Gallo RL (2003) Neonatal skin in mice and humans expresses
increased levels of antimicrobial peptides: innate immunity during development of the adaptiveresponse. Pediatr Res 53:566–572.
Duncan LG, Nair SV, Deane NM (2007) Molecular characterisation and expression of CD4 intwo distantly related marsupials: the gray short-tailed opossum (Monodelphis domestica) andtammar wallaby (Macropus eugenii). Mol Immunol 44:3641–3652.
Duncan LG, Nair SV, Deane EM (2009) The marsupial CD8 gene locus: molecular cloningand expression analysis of the alpha and beta sequences in the gray short-tailed opos-sum (Monodelphis domestica) and the tammar wallaby (Macropus eugenii). Vet ImmunolImmunopathol 129:14–27.
Eckenberg R, Rose T, Moreau JL, et al. (2000) The first alpha helix of interleukin (IL)-2 folds asa homotetramer, acts as an agonist of the IL-2 receptor beta chain, and induces lymphokine-activated killer cells. J Exp Med 191:529–540.
Ganz T, Selsted ME, Szlarek D, et al. (1985) Defensins – natural peptide antibiotics of humanneutrophils. J Clin Invest 76:1427–1435.
Ganz T (2003) Defensins: antimicrobial peptides of innate immunity. Nat Rev Immunol 3:710–720.
Garcia-Hernandez ML, Hernandez-Pando R, Gariglio P, Berumen J (2002) Interleukin-10 pro-motes B16-melanoma growth by inhibition of macrophage functions and induction of tumourand vascular cell proliferation. Immunology 105:231–243.
Gold LI (1999) The role for transforming growth factor-beta (TGF-beta) in human cancer. Crit RevOncogen 10:303–360.
Gottler LM, Ramamoorthy A (2009) Structure, membrane orientation, mechanism, and functionof pexiganan – A highly potent antimicrobial peptide designed from magainin. Biochimica etBiophysica Acta 1788:1680–1686.
Hao L, Klein J, Nei M (2006) Heterogeneous but conserved natural killer receptor gene complexesin four major orders of mammals. Proc Natl Acad Sci U S A 103:3192–3197.
Harrison GA, Deane EM (1999) cDNA sequence of the lymphotoxin beta chain from a marsupial:Macropus eugenii (tammar wallaby). J Interferon Cytokine Res 19:1099–1102.
Harrison GA, Deane EM (2000) cDNA Cloning of lymphotoxin alpha (LT-α) from a marsupial,Macropus eugenii. Mitochondrial DNA 10:399–403.
Harrison GA, Wedlock DN (2000) Marsupial cytokines; structure, function and evolution. DevComp Immunol 24:473–484.
Harrison GA, Broughton MJ, Young LJ, Cooper DW, Deane EM (1999) Conservation of 3′ untrans-lated region elements in tammar wallaby (Macropus eugenii) TNF-αmRNA. Immunogenetics49:464–467.
Harrison GA, Young LJ, Watson CM, Miska KB, Miller RD, Deane EM (2003) A survey of typeI interferons from a marsupial and monotreme: implications for the evolution of the type Iinterferon gene family in mammals. Cytokine 21:105–119.
Hawken RJ, Maccarone P, Toder R, Graves JAM, Maddox JF (1999) Isolation and characterizationof marsupial IL5 genes. Immunogenetics 49:942–948.
Higgins DP, Hemsley S, Canfield PJ (2004) Assessment of anti-bovine IL4 and IFN gamma anti-bodies to label IL4 and IFN gamma in lymphocytes of the koala and brushtail possum. VetImmunol Immunopathol 101:153–160.
Hoskin DW, Ramamoorthy A (2008) Studies on anticancer activities of antimicrobial peptides.BBA-Biomembranes 1778: 357–375.
18 A Review of Divergent Immune Genes 399
Hsiao YW, Liao KW, Hung SW, Chu RM (2004) Tumor-infiltrating lymphocyte secretion of IL-6antagonizes tumor-derived TGF-beta 1 and restores the lymphokine-activated killing activity.J Immunol 172:1508–1514.
Jones DE, Bevins CL (1992) Paneth cells of the human small intestine express an antimicrobialpeptide gene. J Biol Chem 267:23216–23225.
Kelley J, Trowsdale J (2005) Features of MHC and NKC gene clusters. Transpl Immunol 14:129–134.
Koczulla AR, Bals R (2003) Antimicrobial peptides – current status and therapeutic potential.Drugs 63:389–406.
Kruse N, Lehrnbecher T, Sebald W (1991) Site-directed mutagenesis reveals the importanceof disulfide bridges and aromatic residues for structure and proliferative activity of humaninterleukin-4. FEBS Lett 286:58–60.
Laing KJ, Secombes CJ (2004) Chemokines. Dev Comp Immunol 28:443–460.Lampe MF, Wilson CB, Bevan MJ, Starnbach MN (1998) Gamma interferon production by cyto-
toxic T lymphocytes is required for resolution of Chlamydia trachomatis infection. InfectImmun 66:5457–5461.
Liepke C, Zucht H-D, Forssmann W-G, Standerker L (2001) Purification of novel peptideantibiotics from human milk. J Chromatogr 752:369–377.
Loh R, Bergfeld J, Hayes D, et al. (2006a) The pathology of devil facial tumor disease (DFTD) inTasmanian devils (Sarcophilus harrisii). Vet Pathol 43:890–895.
Loh R, Hayes D, Mahjoor A, O’Hara A, Pyecroft S, Raidal S (2006b) The immunohistochemicalcharacterization of devil facial tumor disease (DFTD) in the Tasmanian Devil (Sarcophilusharrisii). Vet Pathol 43:896–903.
Lynn DJ, Bradley DG (2007) Discovery of a-defensins in basal mammals. Dev Comp Immunol31:963–967.
Mikkelsen TS, Wakefield MJ, Aken B, et al. (2007) Genome of the marsupial Monodelphisdomestica reveals innovation in non-coding sequences. Nature 447:167–177.
Nikolaidis N, Klein J, Nei M (2005) Origin and evolution of the Ig-like domains present in mam-malian leukocyte receptors: insights from chicken, frog, and fish homologues. Immunogenetics57:151–157.
Old JM, Deane EM (2002) Immunohistochemistry of the lymphoid tissues of the tammar wallaby,Macropus eugenii. J Anat 201:257–266.
Patil A, Hughes AL, Zhang G (2004) Rapid evolution and diversification of mammalian alpha-defensins as revealed by comparative analysis of rodent and primate genes. Physiol Genomics20:1–11.
Patil A, Cai Y, Sang Y, Blecha F, Zhang G (2005) Cross-species analysis mammalian beta-defensin gene family: presence of syntenic gene clusters and preferential expression in themale reproductive tract. Physiol Genomics 23:5–17.
Renfree MB, Tyndale-Biscoe CH (1978) Manipulation of marsupial embryos and pouch young.In: Daniel JC (ed) Methods in Mammalian Reproduction. Academic Press, New York.
Roberts RM, Liu L, Guo Q, Leaman D, Bixby J (1998) The evolution of the type I interferons.J Interferon Cytokine Res 18:805–816.
Rothel JS, Seow H-F, Lightowlers MW, et al. (1998) The use of recombinant ovine IL-1βand TNF-α as natural adjuvants and their physiological effects in vivo. Immunol Cell Biol 76:167–172.
Schaller-Bals S, Schulze A, Bals R (2002) Increased levels of antimicrobial peptides in trachealaspirates of newborn infants during infection. Am J Respir Crit Care Med 165:992–995.
Selsted ME (2004) Theta-defensins: cyclic antimicrobial peptides produced by binaligation oftruncated alpha-defensins. Curr Protein Pept Sci 5:365–371.
Tang YQ, Yuan J, Osapay G, et al. (1999) A cyclic antimicrobial peptide produced in primateleukocytes by the ligation of two truncated alpha-defensins. Science 286:498–502.
Todaro M, Alea MP, Di Stefano AB (2007) Colon cancer stem cells dictate tumor growth and resistcell death by production of interleukin-4. Cell Stem Cell 1:389–402.
Wang Z, Vandeberg JL (2005) Immunotolerance in the laboratory opossum (Monodelphis domes-tica) to xenografted mouse melanoma. Contemp Top Lab Anim Sci 44:39–42.

400 K. Morris et al.
Wedlock DN, Aldwell FE, Buddle BM (1996) Molecular cloning and characterization of tumournecrosis factor alpha (TNF-α) from the Australian common brushtail possum, Trichosurusvulpecula. Immunol Cell Biol 74:151–158.
Wedlock DN, Aldwell FE, Buddle BM (1998) Nucleotide sequence of a marsupial interleukin-10cDNA from the Australian brushtail possum (Trichosurus vulpecula). DNA Seq 9:239–244.
Wedlock DN, Goh LP, McCarthy AR, Midwinter RG, Parlane NA, Buddle BM (1999a)Physiological effects and adjuvanticity of recombinant brushtail possum TNF-α. Immunol CellBiol 77:28–33.
Wedlock DN, Goh LP, Parlane NA, Buddle BM (1999b) Molecular cloning and physiologicaleffects of brushtail possum interleukin-1β. Vet Immunol Immunopathol 67:359–372.
Wei L-H, Kuo M-L, Chen C-A (2003) Interleukin-6 promotes cervical tumor growth by VEGF-dependent angiogenesis via a STAT3 pathway. Oncogene 22:1517–1527.
Wong ESW, Young LJ, Papenfuss AT, Belov K (2006) In silico identification of opossum cytokinegenes suggests the complexity of the marsupial immune system rivals that of eutherianmammals. Immunome Res 2:4.
Xiao Y, Hughes AL, Ando J, Matsuda Y, Cheng JF, Skinner-Noble D, Zhang G (2004) A genome-wide screen identifies a single beta-defensin gene cluster in the chicken: implications for theorigin and evolution of mammalian defensins. BMC Genomics 5:56.
Part VIIIMarsupial Genes and Gene Evolution
Paul D. Waters and Janine E. Deakin
All gene families have unique evolutionary histories characterized by duplications,transpositions, pseudogenization and selection for retention. Understanding theoften complex evolutionary history of gene families can shed light on their functionand organization in humans. However, the goal of completely understanding theevolution of genes and gene families cannot be reached without data from diversevertebrate (and even invertebrate) representatives. The inclusion of marsupials andthe most basal mammals, the monotremes, in comparative studies of gene familyorganization has led to very interesting and surprising findings which are highlightedin these next three chapters.
In this part, Deeb reviews colour vision and opsin gene evolution in mammals.Most mammals have dichromatic colour vision with the opsin genes short-wave-sensitive 1 (SWS1) and either middle-wave-sensitive (MWS) or long-wave sensitive(LWS); whereas birds, reptiles and fish generally have tri- or even tetra-chromaticvision (reviewed in Collin et al., 2009). It is thought that this was lost in earlymammalian evolution in response to selection for more sensitive vision in low lightconditions for nocturnal foraging. Trichromatic vision evolved again in the ancestorof old world primates by the duplication of LWS to give MWS. Interestingly, therehas also been an independent duplication of LWS in the howler monkey (a new worldmonkey) (Jacobs et al., 1996). Like the majority of eutherian mammals, most mar-supials appear to have dichromatic colour vision, and also like eutherian mammals,some Australian marsupials have evolved trichromatic colour vision. Trichromaticvisions appears to have arisen independently several times in therian mammals, andcomparing the opsin repertoire of marsupials and therians with monotremes andother vertebrates has allowed for the dating of when these opsin genes arose indifferent lineages.
Patel and Deakin discuss globin genes and their evolution in Chapter 20.Haemoglobin molecules, consisting of two alpha- and two beta-globin polypeptides,are essential for oxygen transport in vertebrates. These polypeptides are encoded bygenes occurring in two distinct clusters in human but occur as a single cluster in fishand amphibians. In the past, several different hypotheses had been put forward toexplain the evolution of the two clusters. However, it was the discovery of a novelglobin gene in marsupials and monotremes, HBW, and closer inspection of regions
402 Part VIII Marsupial Genes and Gene Evolution
flanking the α- and β-globin clusters in representative amniotes that shed light onthe evolution of these gene clusters (Patel et al., 2008).
Olfactory receptors, the mediators of olfaction, belong to the largest gene familyfound in vertebrates with over 1,000 members in some species (reviewed in Kratzet al., 2002), making it one of the most challenging gene families to study. InChapter 21, Delbridge and colleagues discuss olfactory receptor (OR) genes andtheir evolution. This review examines the physical structures and the genes involvedin olfaction. It compares olfactory receptor gene families in a wide variety ofvertebrate species, and explains what marsupials have revealed about lineage spe-cific expansion and contractions of these families in different mammalian groups.There is considerable variation of olfactory receptors between species, and theexpansion/contractions of different OR families reflects the niche (i.e how it detectsfood, evades predators, communicates with other individuals, attracts mates) aparticular animal fills in its environment.
These reviews highlight the importance of understanding gene families acrossall mammals, and indeed all vertebrates, to gain a more complete understanding oftheir evolution and function. Research on marsupials has led to the discovery ofnovel genes in the eutherian genome, along with lineage specific genes (and geneorganization) that has helped reconstruct the ancestral state and the steps requiredto reach the patterns observed today in different taxa.
References
Collin SP, Davies WL, Hart NS, Hunt DM (2009) The evolution of early vertebrate photoreceptors.Philos Trans R Soc Lond B Biol Sci 364:2925–2940.
Jacobs GH, Neitz M, Deegan JF, Neitz J (1996) Trichromatic colour vision in New World monkeys.Nature 382:156–158.
Kratz E, Dugas JC, Ngai J (2002) Odorant receptor gene regulation: implications from genomicorganization. Trends Genet 18:29–34.
Patel VS, Cooper SJ, Deakin JE, et al. (2008) Platypus globin genes and flanking loci suggest anew insertional model for beta-globin evolution in birds and mammals. BMC Biol 6:34.
Chapter 19Visual Pigments and Colour Visionin Marsupials and Monotremes
Samir S. Deeb
Abstract The sequences and spectral characteristics of the cone visual pigmentsof several Australian and a few South American marsupials have been deter-mined. Based on genomic and mRNA sequence analyses, it was found that all ofthese species have only two cone-specific photopigments: one belonging to theshort-wave-sensitive 1 (SWS1 ultraviolet or violet), and the second belonging toeither the middle-wave-sensitive (MWS) or long-wave-sensitive (LWS) visual pig-ments. This predicted that colour vision in these species is dichromatic. However,behavioural studies have indicated that at least some Australian marsupials havetrichromatic colour vision. This is consistent with the observation by microspec-trophotometry that three classes of cone photoreceptors exist in the retinae of someof the Australian marsupials. Retinal mRNA and genomic DNA sequence analysisapproaches did not find a third cone photopigment. These approaches used PCRprimers that are specific to cone photopigments. Based on spectral sensitivity, itwas suggested that a rod photopigment could be expressed in some cones to estab-lish trichromacy. Sequence analysis of the photopigment genes and correspondingmRNAs in the platypus and echidna indicated the presence of only two opsins:SWS2, typically found in reptiles, birds and fish, instead of the SWS1 pigment typ-ically found in most mammals, and a LWS, suggesting that monotremes also havedichromatic colour vision. Unlike in other mammals, the monotreme SWS2 and LWSgenes were tandemly arranged and separated by a locus control region, indicatingretention of ancestral reptilian opsin genes. The gene structure and expression ofmonotreme cone opsin genes bridge the phylogenetic gap between reptiles and othermammals. A proposed evolutionary pathway of the opsin genes is described.
Keywords Colour vision · Genetics · Marsupials · Monotremes · Evolution
S.S. Deeb (B)Division of Medical Genetics, Department of Medicine, University of Washington, Seattle, WA,USAe-mail: [email protected]
403J.E. Deakin et al. (eds.), Marsupial Genetics and Genomics,DOI 10.1007/978-90-481-9023-2_19, C© Springer Science+Business Media B.V. 2010
404 S.S. Deeb
19.1 Introduction
The retina contains two types of photoreceptors: rods and cones. Rods containrhodopsin and mediate vision in dim light (scotopic vision). Cones mediate visionin daylight (photopic vision) and colour vision. Rods are usually more numerousthan cones in mammalian retinae. The rod-to-cone ratio in the retina varies widelyamong species. Some species have rod-dominated retinae (rats and mice) while oth-ers have cone-dominated retinae (ground squirrels and tree-shrews). No colour isperceived under scotopic conditions. Colour vision is achieved by comparing therates at which photons are absorbed by cone photoreceptors that have different,but overlapping, spectra. The quantity and distribution of cones in the retinae alsoplay an important role in colour perception. The photoreceptors are composed ofthe 11-cis-retinal chromophore that is bound by proteins, called opsins. The num-ber of colour hues that an animal can discriminate is dependent on the number ofcone photoreceptors classes in their retinae. For example, humans can discriminatebetween ∼2.3 million colours using three classes of cones. Most other mammalswho have two classes of cones can distinguish between only ∼1,000 colours. Thedevelopment of different classes of cones relies on mutually exclusive expressionof photoreceptor pigments in single cone cells. Animals have evolved regulatorymechanisms that underlie mutually exclusive expression of cone pigment genes.An evolutionarily conserved enhancer motif, referred to as the locus control region(LCR), plays an important role in mutually exclusive expression of opsin genes insingle cone cells. The LCR is commonly located upstream of the LWS or MWS pig-ment genes on the X chromosome of mammals (Wang et al., 1999; Smallwood et al.,2002).
The evolution of cone opsins and colour vision has been thoroughly investigatedin many eutherian mammals, reptiles, birds and fish (Yokoyama, 2002; Jacobs,2008). Monotremes and marsupials have evolutionarily diverged from eutherianmammals about 166 and 148 million years ago (MYA), respectively (Fig. 19.1)(Bininda-Emonds et al., 2007). Characterization of the genes and photoreceptorsthat predict colour vision in these species would be very important in filling the gapbetween eutherian mammals and reptiles, birds (diverged about 310 MYA) and fish(∼450 MYA) (Fig. 19.1). This will provide new insights into the evolution of opsingenes and colour vision in vertebrates.
Colour vision in vertebrates is based on visual pigments that exhibit a widerange of spectral sensitivity, ranging from ultraviolet to far red. Adaptations ofvertebrates to different environments included selection for visual pigments withthe appropriate spectral absorption (Yokoyama, 2002; Jacobs and Rowe, 2004).The evolution of visual pigment tuning towards adaptation to various environ-ments involved gene duplication, translocation to other chromosomes, mutationsthat altered amino acids that contribute to spectral tuning and acquisition of appro-priate gene-regulating motifs. Most eutherian mammals have only two types of conephotoreceptors (SWS1 and either MWS or LWS) in their retinae, and therefore,have dichromatic colour vision. In contrast, reptiles, birds and fish have much richer(trichromatic and perhaps tetrachromatic) colour vision. Their retinae contain four
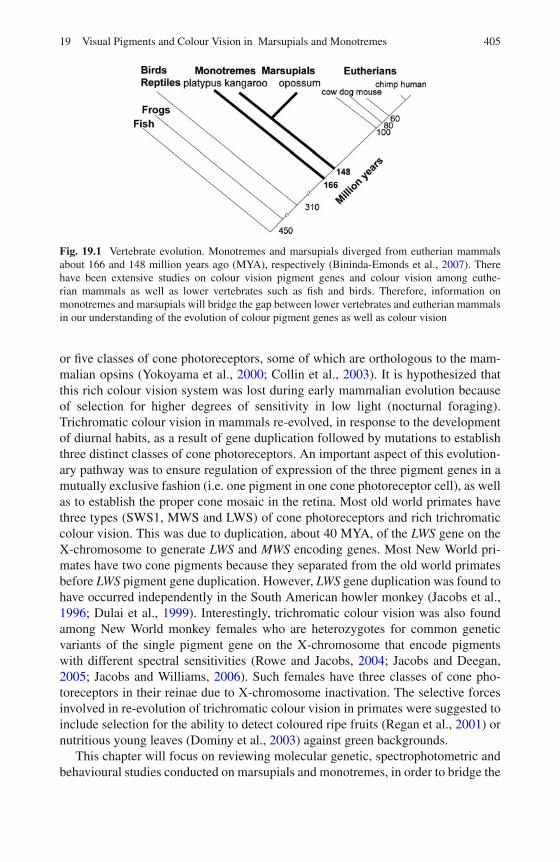
19 Visual Pigments and Colour Vision in Marsupials and Monotremes 405
Fig. 19.1 Vertebrate evolution. Monotremes and marsupials diverged from eutherian mammalsabout 166 and 148 million years ago (MYA), respectively (Bininda-Emonds et al., 2007). Therehave been extensive studies on colour vision pigment genes and colour vision among euthe-rian mammals as well as lower vertebrates such as fish and birds. Therefore, information onmonotremes and marsupials will bridge the gap between lower vertebrates and eutherian mammalsin our understanding of the evolution of colour pigment genes as well as colour vision
or five classes of cone photoreceptors, some of which are orthologous to the mam-malian opsins (Yokoyama et al., 2000; Collin et al., 2003). It is hypothesized thatthis rich colour vision system was lost during early mammalian evolution becauseof selection for higher degrees of sensitivity in low light (nocturnal foraging).Trichromatic colour vision in mammals re-evolved, in response to the developmentof diurnal habits, as a result of gene duplication followed by mutations to establishthree distinct classes of cone photoreceptors. An important aspect of this evolution-ary pathway was to ensure regulation of expression of the three pigment genes in amutually exclusive fashion (i.e. one pigment in one cone photoreceptor cell), as wellas to establish the proper cone mosaic in the retina. Most old world primates havethree types (SWS1, MWS and LWS) of cone photoreceptors and rich trichromaticcolour vision. This was due to duplication, about 40 MYA, of the LWS gene on theX-chromosome to generate LWS and MWS encoding genes. Most New World pri-mates have two cone pigments because they separated from the old world primatesbefore LWS pigment gene duplication. However, LWS gene duplication was found tohave occurred independently in the South American howler monkey (Jacobs et al.,1996; Dulai et al., 1999). Interestingly, trichromatic colour vision was also foundamong New World monkey females who are heterozygotes for common geneticvariants of the single pigment gene on the X-chromosome that encode pigmentswith different spectral sensitivities (Rowe and Jacobs, 2004; Jacobs and Deegan,2005; Jacobs and Williams, 2006). Such females have three classes of cone pho-toreceptors in their reinae due to X-chromosome inactivation. The selective forcesinvolved in re-evolution of trichromatic colour vision in primates were suggested toinclude selection for the ability to detect coloured ripe fruits (Regan et al., 2001) ornutritious young leaves (Dominy et al., 2003) against green backgrounds.
This chapter will focus on reviewing molecular genetic, spectrophotometric andbehavioural studies conducted on marsupials and monotremes, in order to bridge the
406 S.S. Deeb
gap in evolution of colour vision between basal vertebrates and mammals. Thereis evidence suggesting that some of the marsupials may have trichromatic colourvision.
19.2 Marsupial Cone Visual Pigments and Colour Vision
The molecular genetic approaches that were used to determine the sequences of conevisual pigments involved PCR amplification of opsin genes using genomic DNAor retinal mRNA templates with oligonucleotide primers that are highly conservedamong many vertebrate species (Deeb et al., 2003; Strachan et al., 2004; Cowinget al., 2008). The spectral characteristics of the pigments were either inferred fromthe sequence or determined by in vitro expression and spectral measurements. Theother approaches that were used to characterize the classes of cones in marsupialretinas included immunohistochemistry, microspectrophotometry, electroretinogra-phy (flicker-photometry) and behavioural chromatic discrimination testing.
Most of the data on visual pigments and colour vision so far published havebeen obtained from studies on the following Australian marsupials: polyprotodonts(fat-tailed dunnart, stripe-faced dunnart and quenda) and diprotodonts (tammarwallaby, honey possum, brush-tailed possum, and quokka). Recently the cone opsinsequences of two species of South American marsupials (the big-eared opossum andthe gray short-tailed opossum) have been determined.
19.2.1 Australian Marsupials
The first marsupial cone visual pigments (SWS and MWS) were sequenced in thetammar wallaby (Macropus eugenii) (Deeb et al., 2003). This is consistent withbehavioural evidence using colour discrimination tests, the tammar wallaby hasdichromatic colour vision (Hemmi, 1999). Subsequently the sequence of the conepigment genes and mRNAs of the stripe-faced dunnart (Sminthopsis macroura),fat-tailed dunnart (Sminthopsis crassicaudata) (Strachan et al., 2004), the brush-tailed possum (Trichosurus vulpecula) and the long-nosed bandicoot (Peramelesnasuta) (Anderson et al., in preparation) were determined. The classes and wave-lengths of maximum absorption (λmax) of these pigments are shown in Table 19.1.Interestingly, in contrast with the behavioural finding of dichromatic colour visionin the tammar wallaby (Hemmi, 1999), behavioural tests on the fat-tailed dunnartindicated the presence of trichromatic colour vision (Arrese et al., 2006). Onlytwo cone pigment genes were detected in each of the above five species that weanalysed: SWS1 and either MWS or LWS. The SWS1 pigments fall into the ultra-violet (360 nm) or the violet (420 nm) classes. Similar findings were made usingmolecular genetic approaches on the cone visual pigments of the fat-tailed dun-nart and the honey possum (Tarsipes rostratus) (Table 19.1) (Cowing et al., 2008).The above results suggest that marsupials may generally have dichromatic colour
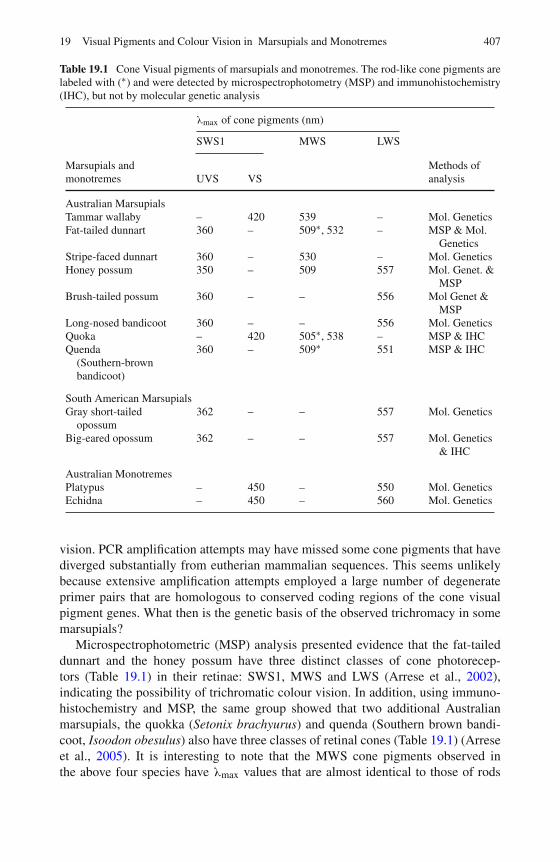
19 Visual Pigments and Colour Vision in Marsupials and Monotremes 407
Table 19.1 Cone Visual pigments of marsupials and monotremes. The rod-like cone pigments arelabeled with (∗) and were detected by microspectrophotometry (MSP) and immunohistochemistry(IHC), but not by molecular genetic analysis
λmax of cone pigments (nm)
SWS1 MWS LWS
Marsupials andmonotremes UVS VS
Methods ofanalysis
Australian MarsupialsTammar wallaby – 420 539 – Mol. GeneticsFat-tailed dunnart 360 – 509∗, 532 – MSP & Mol.
GeneticsStripe-faced dunnart 360 – 530 – Mol. GeneticsHoney possum 350 – 509 557 Mol. Genet. &
MSPBrush-tailed possum 360 – – 556 Mol Genet &
MSPLong-nosed bandicoot 360 – – 556 Mol. GeneticsQuoka – 420 505∗, 538 – MSP & IHCQuenda
(Southern-brownbandicoot)
360 – 509∗ 551 MSP & IHC
South American MarsupialsGray short-tailed
opossum362 – – 557 Mol. Genetics
Big-eared opossum 362 – – 557 Mol. Genetics& IHC
Australian MonotremesPlatypus – 450 – 550 Mol. GeneticsEchidna – 450 – 560 Mol. Genetics
vision. PCR amplification attempts may have missed some cone pigments that havediverged substantially from eutherian mammalian sequences. This seems unlikelybecause extensive amplification attempts employed a large number of degenerateprimer pairs that are homologous to conserved coding regions of the cone visualpigment genes. What then is the genetic basis of the observed trichromacy in somemarsupials?
Microspectrophotometric (MSP) analysis presented evidence that the fat-taileddunnart and the honey possum have three distinct classes of cone photorecep-tors (Table 19.1) in their retinae: SWS1, MWS and LWS (Arrese et al., 2002),indicating the possibility of trichromatic colour vision. In addition, using immuno-histochemistry and MSP, the same group showed that two additional Australianmarsupials, the quokka (Setonix brachyurus) and quenda (Southern brown bandi-coot, Isoodon obesulus) also have three classes of retinal cones (Table 19.1) (Arreseet al., 2005). It is interesting to note that the MWS cone pigments observed inthe above four species have λmax values that are almost identical to those of rods
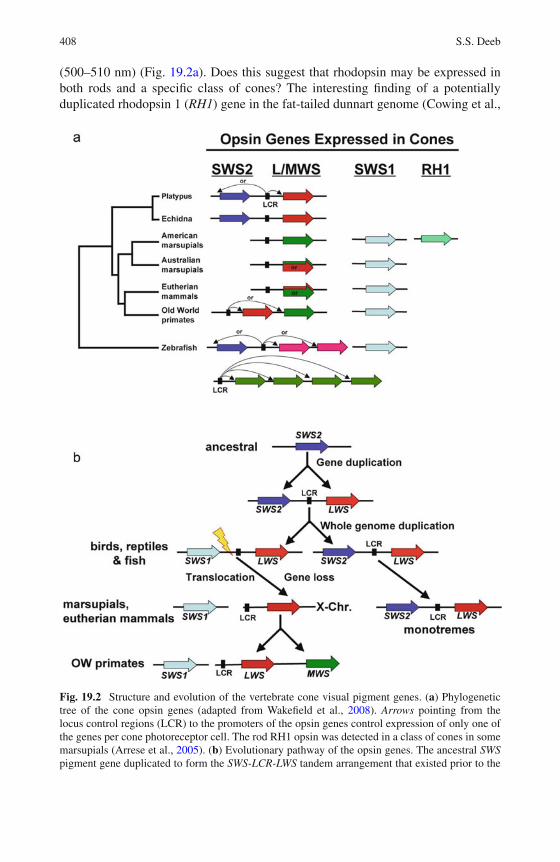
408 S.S. Deeb
(500–510 nm) (Fig. 19.2a). Does this suggest that rhodopsin may be expressed inboth rods and a specific class of cones? The interesting finding of a potentiallyduplicated rhodopsin 1 (RH1) gene in the fat-tailed dunnart genome (Cowing et al.,
Fig. 19.2 Structure and evolution of the vertebrate cone visual pigment genes. (a) Phylogenetictree of the cone opsin genes (adapted from Wakefield et al., 2008). Arrows pointing from thelocus control regions (LCR) to the promoters of the opsin genes control expression of only one ofthe genes per cone photoreceptor cell. The rod RH1 opsin was detected in a class of cones in somemarsupials (Arrese et al., 2005). (b) Evolutionary pathway of the opsin genes. The ancestral SWSpigment gene duplicated to form the SWS-LCR-LWS tandem arrangement that existed prior to the
19 Visual Pigments and Colour Vision in Marsupials and Monotremes 409
2008) supports the possibility that one of these RH1 genes may be expressed inrods and the other specifically in cones. The duplicate RH1 genes encode visual pig-ments with identical amino acid (but differ in intronic sequence) sequences and λmaxvalue. One would have to assume that some changes had occurred in the regulatorysequences of one of the RH1 genes to direct its expression, in a mutually exclu-sive fashion, in cones. As shown in Table 19.1, some of the marsupials have LWScone pigments with λmax values of 551–557 nm, while others have cone pigmentsclose to the MWS pigments in other mammals with λmax values of 530–54 nm.Does this difference correlate with adaptation to a specific visual behaviour, such asbeing able to target food with a particular colour? This was explored by studying thebehaviour of the honey possum, which has a LWS pigment with a λmax of 557 nm(Sumner et al., 2005). The honey possum targets a specific flower because it feedsalmost exclusively on nectar and pollen. It was found that the longer-wavelengthcone pigment offered the honey possum an advantage in detecting its targetflower against their natural environment. More studies are needed to verify theseresults.
19.2.2 South American Marsupials
The Australian marsupials separated from the South American marsupials about 80MYA (Wakefield and Graves, 2005). It would be valuable to investigate differencesin the visual pigment sequences and gene structures and locations between thesemarsupials.
Immunohistochemistry, using monoclonal antibodies that have been proven toconsistently label MWS/LWS and SWS1 cones in eutherian mammals, revealedthe presence of only two classes of cone photoreceptors in the retina of the SouthAmerican big-eared opossum (Didelphis aurita) (Ahnelt et al., 1996). Molecularanalysis of the coding sequences of cone opsins of two South American marsu-pial species revealed that the big-eared opossum and the gray short-tailed opossum(Monodelphis domestica) only had two classes of cone opsin genes that areexpressed in the retinae of both species: SWS1 and LWS (Hunt et al., 2009)
�Fig. 19.2 (continued) whole-genome duplication in vertebrates. After genome-wide duplication,a large fraction of genes were lost and some evolved to encode different proteins such as the SWS1gene. The SWS2-LCR-LWS cluster was transmitted to monotremes after loss of the SWS1 pigmentgene. Subsequently, the LCR-LWS gene was translocated to the X-chromosome in marsupials andother mammals, while the SWS1 gene remained on an autosome. Finally, the X-linked LWS genewas duplicated, about 40 MYA, to form the LCR-LWS-MWS array in the Old World (OW) primates.The LCR sequence is highly conserved and plays a crucial role in mutually exclusive expressionof the genes in a cluster. Most New World (NW) primates have only two types of photoreceptorsand dichromatic colour vision. However, in the howler monkey gene duplication and evolutionhave generated three opsin genes and trichromatic colour vision. Interestingly, trichromatic colourvision also exists among female heterozygotes for common alleles of the single pigment gene onthe X-chromosome that encode pigments with different absorption spectra
410 S.S. Deeb
(Table 19.1). Analysis of the short-tailed opossum genome sequence showed that, asin other mammals, the LWS gene is located on the X-chromosome, with an upstream(1.75 kb) locus control region (LCR); the SWS1 gene is located in the same positionon chromosome 8 as that in other vertebrates (Hunt et al., 2009). So far, no MSP orbehavioural studies have been performed on these species to determine the potentialof trichromatic colour vision.
19.2.3 Topography of Retinal Photoreceptors in Marsupialsand Colour Vision
The topography and spectral characteristics of photoreceptors correlate with ecolog-ical adaptations and evolutionary history of sensory systems. Colour vision requirescomparison between signal outputs of signals from different types of photorecep-tors and proper neural wiring. The distribution and relative number of cones in theretina contribute to colour vision. In primates, each of the MWS and LWS cones inthe fovea privately transmit signals to midget bipolar cells and then to midget gan-glion cells. This is thought to be required for comparing signal outputs from thesetwo types of photoreceptors in order to perceive colours (Mollon, 1989; Boycottand Wassle, 1999: Wassle, 2004). However, non-primate mammals do not pos-sess midget bipolar cells, and therefore, it was thought that the addition of extratypes of cones into the retina would not result in acquisition of enhanced colourdiscrimination. This was tested in a genetically engineered mouse that expressedboth SWS, MWS, along with a LWS transgene (Jacobs et al., 2007). It was observedthat additional chromatic discrimination was acquired, but only when the MWS:LWS cones were in about equal ratios in the retinae. It was proposed that plasticityin the mammalian visual system allows acquisition of additional colour vision dueto acquisition of only visual pigment genes. This is consistent with the observedtrichromatic colour vision in some marsupials.
The ratio between rods and cones varies widely among mammals. Mammalianretinea contain relatively low numbers of SWS cones compared to MWS and LWScones. In general, due to adaptation, nocturnal mammals have a high rod: coneratio (∼100:1), while diurnal mammals have a lower rod: cone ratio (∼1:19 in thetree-shrew). The echidna and platypus are crepuscular, primarily active during twi-light; the short-billed echidna is nocturnal or diurnal. Most marsupials are nocturnal(bandicoot, wombat, Australian possums and American opossums) (McMenamin,2007). Some are crepuscular or nocturnal (honey possum, tammar wallaby, redkangaroo, fat-tailed dunnart), and very few are diurnal (the numbat).
Does the cone photoreceptor topography in the retinae of these marsupialsand monotremes correlate with the reported trichromatic colour vision? In thefat-tailed dunnart, SWS1 cones are concentrated in the dorso-temporal regionof the retina (max of 2,300/mm2) and decrease in number in a gradient to theperiphery (2,300–1,500), while MWS cones form a horizontal streak (31,000–21,000/mm2). In the honey possum, SWS1 cones are uniformly distributed inthe retina (2,700/mm2); MWS cones form a mid-ventral to peripheral gradient(37,000–26,000/mm2) (Arrese et al., 2003).
19 Visual Pigments and Colour Vision in Marsupials and Monotremes 411
The SWS1 cones in the quokka are located in the dorso-temporal region of theretina, while in the quenda; two peaks were identified in the naso-ventral and dorso-temporal regions. In both species, MWS cones were located essentially all overthe retina (Arrese et al., 2005). As in the honey possum, quokka and quenda, highenough density and co-localization of SWS1 and MWS/LWS cones in the centralretina would contribute to enhanced colour vision. However, in the fat-tailed dun-nart, regions of high density of SWS and MWS/LWS cones do not overlap and thismay make it difficult to have trichromatic colour vision.
The retina of the tammar wallaby has three distinct cone regions: the dorsal retinahas low cone density but a high percentage of SWS cones; the central horizontalband of the retina contains a high MWS cone density; the ventral retina containshigh MWS cone density with few S-cones (Hemmi and Grunert, 1999; Arrese et al.,2003). However, the distribution of SWS1 and MWS cone photoreceptors in thehoney possum retina is uniform (Arrese et al., 2003). This cone topography is alsonot likely to support high levels of chromatic discrimination.
The retina of the South American opossum is rod-dominated (∼400,000/mm2)and SWS1 and MWS cones (∼3,000/mm2) (Ahnelt et al., 1995), some of whichcontained colourless oil droplets, as observed in other marsupials. These oil dropletshave no contribution to colour vision, but they function in attracting and focusinglight on the retina. The SWS1 and MWS cones (without oil droplets) were evenlydistributed all over the retina. However, the MWS cones bearing oil droplets wereconcentrated in the ventral half of the retina.
19.3 Cone Visual Pigments and Genes of Monotremes
The monotreme lineage is comprised of only the duck-billed platypus(Ornithorhynchus anatinus) and two genera of the spiny ant-eaters or echidna:Tachyglossus and Zaglossus, found in Australia and New Guinea. The platypus andechidna are the only egg-laying mammals and occupy a unique position in the mam-malian phylogeny. They are the most basal mammal group, and share phenotypicand genotypic characteristics with more distantly related vertebrates (Daish andGrutzner, 2009), including the colour vision genes (Davies et al., 2007; Wakefield,2008). Therefore, these species provide an important evolutionary link to decipherthe evolution of the mammalian genome. Monotremes diverged from the therianmammals about 166 MYA (Woodburne et al., 2003; Bininda-Emonds et al., 2007)(Fig. 19.1).
Spectrophotometric, MSP, electroretinographic or behavioural studies regardingcolour vision phenotype in the monotremes have not been performed. We have per-formed genomic DNA and retinal RNA analyses to determine the sequence andgenomic organization of the genes encoding the cone visual pigments of the platy-pus and the echidna (Wakefield et al., 2008). We performed PCR amplificationsusing primers designed in coding sequences that are highly conserved among mam-mals, including marsupials, to target SWS1, MWS, and LWS. This means thatany cone pigment sequences that had diverged from other mammalian sequences
412 S.S. Deeb
would not have been amplified. Amplification using retinal RNA revealed that LWSpigment mRNA, and the encoded opsin, is homologous in sequence and spectralproperties to the primate LWS visual pigments. However, we were unable to amplifythe mammalian SWS1 pigment from these two species. At the same time, the platy-pus genome sequence became available. Examining the genome sequence, we founda LWS pigment gene, but surprisingly we found an adjacent (20 kb) SWS2 pig-ment gene in the opposite orientation. Interestingly, an LCR regulatory motif thatis homologous to that found in other mammals was found between these two genes(Wakefield et al., 2008). It is predicted that this LCR regulates mutually exclusiveexpression of the adjacent LWS and SWS2 in cone photoreceptors. We obtained thesame arrangement of the LWS and SWS2 pigment genes after sequencing these inthe echidna. The SWS2 and LWS pigments of the platypus were expressed in vitroand their spectra had λmax values of 451 and 550 nm, respectively (Davies et al.,2007). The SWS2 pigment is paralogous to the SWS2 pigments typically found inreptiles, birds, and fish but not to the SWS1 of other mammals (Davies et al., 2007;Wakefield, 2008). The SWS1 gene in the monotremes has been lost, except for exon5 (Davies et al., 2007). The presence of SWS1 exon 5 sequence in the genome ofboth the platypus and echidna dates the deletion of the other exons prior to theechidna and platypus divergence ∼21 MYA. No remnant sequences SWS2 of thegene were found in the tammar wallaby, opossum or eutherian mammals. This indi-cates that the therian ancestor lost the SWS2 gene prior to marsupial and eutheriandivergence (Fig. 19.2a) (Wakefield et al., 2008). Based on these data, a pathwayof evolution of the visual pigment genes is outlined in Fig. 19.2b. The tandem genepair of SWS2-LWS, with the LCR in between, was formed by gene duplication of theSWS2 gene followed by mutations in amino acids that interact with the chromophoreand changed the λmax value of one of these genes to that of a LWS. This arrangementmost likely existed before duplication of the vertebrate genome (Ohno, 1970; Dehaland Boore, 2005). After whole-genome duplication the SWS genes diverged intoSWS1 and SWS2. The LWS and LCR were translocated to the X-chromosome. Theleftover LWS was duplicated in primates to form the LCR-LWS-MWS gene arraysand the re-evolution of trichromatic colour vision.
19.4 Future Experiments
1. Investigate whether duplication of the RH1 gene exists in other marsupials thatwere shown to have three cone opsin classes, and potentially trichromatic colourvision.
2. Analyze genome sequences of marsupials for presence of novel opsin genes orremnants of known genes.
3. Extend behavioural studies to test colour vision of additional marsupials andmonotremes.
4. Investigate the relationship between ecological adaptations and spectral charac-teristics of marsupial visual pigments and their retinal topography.
19 Visual Pigments and Colour Vision in Marsupials and Monotremes 413
Acknowledgments This work was supported by National Institutes of Health (National EyeInstitute) grant number EY008395.
References
Ahnelt PK, Hokoc J, Rohlich P (1995) Photoreceptors in a primitive mammal, the South Americanopossum, Didelphis marsupialis aurita: characterization with anti-opsin immunolabeling. VisNeurosc 12:793–804.
Ahnelt PK, Hokoc J, Rohlich P (1996) The opossum photoreceptors–a model for evolutionarytrends in early mammalian retina. Rev Bras Biol 56(Suppl 1(2)):199–207.
Arrese CA, Hart NS, Thomas N, Beazley LD, Shand J (2002) Trichromacy in Australianmarsupials. Curr Biol 12:657–660.
Arrese CA, Rodger J, Beazley LD, Shand J (2003) Topographies of retinal cone photoreceptors intwo Australian marsupials. Vis Neurosci 20:307–311.
Arrese CA, Oddy AY, Runham PB, Hart NS, Shand J, Hunt DM, Beazley LD (2005) Cone topog-raphy and spectral sensitivity in two potentially trichromatic marsupials, the quokka (Setonixbrachyurus) and quenda (Isoodon obesulus). Proc Biol Sci 272:791–796.
Arrese CA, Beazley LD, Neumeyer C (2006) Behavioural evidence for marsupial trichromacy.Curr Biol 16:R.
Bininda-Edmonds OR, Cardillo M, Jones KE, Macphee RD, Beck RM, Grenyer R, Price SA,Vos RA, Gittleman JL, Purvis A (2007) The delayed rise of present-day mammals. Nature446:507–512.
Boycott B, Wassle H (1999) Parallel processing in the mammalian retina: the Proctor Lecture.Invest Ophthalmol Vis Sci 40:1313–1327.
Collin SP, Knight MA, Davies WL, Potter IC, Hunt DM, Trezise AE (2003) Ancient colour vision:multiple opsin genes in the ancestral vertebrates. Curr Biol 13:R.
Cowing JA, Arrese CA, Davies WL, Beazley LD, Hunt DM (2008) Cone visual pigments in twomarsupial species: the fat-tailed dunnart (Sminthopsis crassicaudata) and the honey possum(Tarsipes rostratus). Proc Biol Sci 275:1491–1499.
Daish T, Grutzner F (2009) Location, location, location! Monotremes provide unique insightsinto the evolution of sex chromosome silencing in mammals. DNA Cell Biol 28:91–100.
Davies WL, Carvalho LS, Cowing JA, Beazley LD, Hunt DM, Arrese CA (2007) Visual pigmentsof the platypus: a novel route to mammalian colour vision. Curr Biol 17:R161–R163.
Deeb SS, Wakefield MJ, Tada T, Marotte L, Yokoyama S, Graves JAM (2003) the cone visual pig-ments of an Australian marsupial, the tammar wallaby (Macropus eugenii): sequence, spectraltuning, and evolution. Mol Biol Evol 20:1642–1649.
Dehal P, Boore JL (2005) Two rounds of whole genome duplication in the ancestral vertebrate.PLoS Biol 3:e314.
Dominy NJ, Svenning JC, Li WH (2003) Historical contingency in the evolution of primate colorvision. J Hum Evol 44:25–45.
Dulai KS, Von Dornum M, Mollon JD, Hunt DM (1999) The evolution of trichromatic color visionby opsin gene duplication in New World and Old World primates. Genome Res 9:629–638.
Hemmi JM (1999) Dichromatic colour vision in an Australian marsupial, the tammar wallaby.J Comp Physiol A 185:509–515.
Hemmi JM, Grunert U (1999) Distribution of photoreceptor types in the retina of a marsupial, thetammar wallaby (Macropus eugenii). Vis Neurosci 16:291–302.
Hunt DM, Chan J, Carvalho LS, Hokoc JN, Ferguson MC, Arrese CA, Beazley LD (2009) Conevisual pigments in two species of South American marsupials. Gene 433:50–55.
Jacobs GH (2008) Primate color vision: a comparative perspective. Vis Neurosci 25:619–633.Jacobs GH, Deegan JF (2005) Polymorphic New World monkeys with more than three M/L cone
types. J Opt Soc Am A Opt Image Sci Vis 22:2072–2080.
414 S.S. Deeb
Jacobs GH, Williams GA (2006) L and M cone proportions in polymorphic New World monkeys.Vis Neurosci 23:365–370.
Jacobs GH, Neitz M, Deegan JF, Neitz J (1996) Trichromatic colour vision in New World monkeys.Nature 382:156–158.
Jacobs GH, Rowe MP (2004) Evolution of vertebrate colour vision. Clin Exp Optom 87:206–216.Jacobs GH, Williams GA, Cahill H, Nathans J (2007) Emergence of novel color vision in mice
engineered to express a human cone photopigment. Science 315:1723–1725.McMenamin PG (2007) The unique paired retinal vascular pattern in marsupials: structural,
functional and evolutionary perspectives based on observations in a range of species. BrJ Ophthalmo 91:1399–1405.
Mollon JD (1989) “Tho’ she kneel’d in that place where they grew.” The uses and origins ofprimate colour vision. J Exp Biol 146:21–38.
Ohno S (1970) Evolution of by Gene Duplication. Springer, New York.Regan BC, Julliot C, Simmen B, Vienot F, Charles-Dominique P, Mollon JD (2001) Fruits, foliage
and the evolution of primate colour vision. Philos Trans R Soc Lond B Biol Sci 356:229–283.Rowe MP, Jacobs GH (2004) Cone pigment polymorphism in New World monkeys: are all
pigments created equal? Vis Neurosci 21:217–222.Smallwood PM, Wang Y, Nathans J (2002) Role of a locus control region in the mutually exclu-
sive expression of human red and green cone pigment genes. Proc Natl Acad Sci U S A 99:1008–1011.
Strachan J, Chang LY, Wakefield MJ, Graves JAM, Deebs SS (2004) Cone visual pigments of theAustralian marsupials, the stripe-faced and fat-tailed dunnarts: sequence and inferred spectralproperties. Vis Neurosci 21:223–229.
Sumner P, Arrese CA, Partridge JC (2005) The ecology of visual pigment tuning in an Australianmarsupial: the honey possum Tarsipes rostratus. J Exp Biol 208:1803–1815.
Wakefield MJ, Graves JAM (2005) Marsupials and monotremes sort genome treasures from junk.Genome Biol 6:218.
Wakefield MJ, Anderson M, Chang E, Wei KJ, Kaul R, Graves JAM, Grutzner F, Deeb SS (2008)Cone visual pigments of monotremes: filling the phylogenetic gap. Vis Neurosci 25:257–264.
Wang Y, Smallwood PM, Cowan M, Blesh D, Lawler A, Nathans J (1999) Mutually exclusiveexpression of human red and green visual pigment-reporter transgenes occurs at high frequencyin murine cone photoreceptors. Proc Natl Acad Sci U S A 96:5251–5256.
Wassle H (2004) Parallel processing in the mammalian retina. Nat Rev Neurosci 5:747–757.Woodburne MO, Rich TH, Springer MS (2003) The evolution of tribospheny and the antiquity of
mammalian clades. Mol Phylogenet Evol 28:360–385.Yokoyama S (2002) Molecular evolution of color vision in vertebrates. Gene 300:69–78.Yokoyama S, Blow NS, Radlwimmer FB (2000) Molecular evolution of color vision of zebra finch.
Gene 259:17–24.
Chapter 20The Evolutionary History of Globin Genes:Insights from Marsupials and Monotremes
Vidushi S. Patel and Janine E. Deakin
Abstract Haemoglobin, which is required for oxygen transportation in the blood,is encoded by members of the alpha (α) and beta (β) globin gene families. Theyare highly regulated throughout different stages of development in a tissue-specificmanner. The number and type of α- and β-globin genes varies between jawed verte-brates. In teleosts and amphibians α- and β-like globin genes are clustered together,but in birds and mammals these genes form distinct clusters on different chro-mosomes. This chapter reviews how data from marsupials and monotremes havecontributed in discovering novel globin genes, which in turn has clarified how globingenes have evolved throughout amniote evolution. We also provide a detailed viewof how the duplication of a single primordial globin gene (about 500 million yearsago) along with other subsequent events have resulted in more complex α- and β-globin clusters in extant vertebrates. In addition, how this has impacted the currentfate and regulation of α- and β-genes in mammals will also be discussed.
Keywords α-globin · β-globin · Evolution · Haemoglobin · Marsupials ·Monotremes · Transposition
20.1 Introduction
Haemoglobin is vital for the survival of all species, and originated as an iron-complexed protein at about the time when cellular life originated on earth (Hardison,2001). It is found in all living organisms including prokaryotes, fungi, plants andanimals, and its function ranges from catabolic metabolism in bacteria, yeast andalgae, to intercellular oxygen transportation in vertebrates (reviewed in Hardison,1998). All globin genes are thought to have evolved from a single common ancestralglobin via a series of gene duplications, which, due to selective pressures and
V.S. Patel (B)ARC Centre of Excellence for Kangaroo Genomics, Evolution, Ecology and Genetics, ResearchSchool of Biology, The Australian National University, Canberra, ACT 0200, Australiae-mail: [email protected]
415J.E. Deakin et al. (eds.), Marsupial Genetics and Genomics,DOI 10.1007/978-90-481-9023-2_20, C© Springer Science+Business Media B.V. 2010
416 V.S. Patel and J.E. Deakin
changes in atmospheric oxygen levels, led to the diversity of specialised forms andfunctions of haemoglobin across all kingdoms of organisms (Hardison, 1998).
In vertebrates, haemoglobin is a major component in blood, but its structure dif-fers from species to species and among isoforms. In agnatha (jawless vertebrates),such as lamprey and hagfish, the haemoglobin molecule is a monomer in the oxy-genated form, but changes to heterodimers and heterotetromers in the deoxygenatedform (Qiu et al., 2000; Muller et al., 2003). In all gnathostomes (jawed vertebrates),it is always found as a heterotetrameric molecule composed of two alpha (α)-globinand two beta (β)-globin polypeptides, with a heme tightly bound to a pocket in eachglobin monomer. In highly oxygenated surroundings, i.e. in lungs or gills, the inter-action between each globin polypeptide chain allows heme to cooperatively bind tooxygen and unloads it efficiently in the peripheral respiring tissues that need oxygenfor efficient metabolism.
Most gnathostomes possess multiple variants of α-like and β-like globin genesthat are located in clusters, and upon activation constitute different forms ofhaemoglobin during different stages of ontogeny. The multiplicity of these geneshas the advantage of producing different haemoglobin molecules with distinct oxy-gen binding affinity during different stages of development and in different tissues.This enables the organism to cope with environmental changes in oxygen tension(Coates, 1975). For example, early expressed haemoglobins in embryos lack coop-erative oxygen binding and have a higher oxygen affinity than adult haemoglobin.It allows the embryo to extract more oxygen with greater efficiency from their sur-roundings or maternal circulation (Hofmann et al., 1997; Brownlie et al., 2003). Asthe gas exchange structures develop and environmental conditions improve aroundfishes and amphibians, or placental barriers are reduced in eutherian mammals,these high oxygen affinity haemoglobins are then slowly replaced by lower affin-ity haemoglobins with greater cooperative binding (Iuchi, 1973; Brittain et al.,1997). Thus, there is a huge demand for coordinating and regulating these α- andβ-globin genes during different stages of ontogeny and tissues in gnathostomes fortheir balanced production in forming proper haemoglobin molecules, which other-wise if altered could lead to haemoglobinopathies such as sickle cell amenia andthalassemia (Wells, 1999).
20.2 Unique Globin Properties in Marsupial Newborns
In marsupial embryos and newborns, the red blood cells and haemoglobin propertiesare quite different to those in older pouch young or adult marsupials. At birth, thered blood cells of marsupials are all nucleated and larger, whereas in more maturepouch young and adults the red blood cells lack nuclei and are smaller (Hollandand Gooley, 1997). Haemoglobin in marsupial embryos from species such as thetammar wallaby (Macropus eugenii) and brush-tail possum (Trichosurus vulpecula)have lower affinity for oxygen than other vertebrate embryos and foetuses (Tibbenet al., 1991; Calvert et al., 1994). This allows marsupial embryos to extract lessoxygen from maternal circulation (Holland and Gooley, 1997). The lower affinity
20 The Evolutionary History of Globin Genes 417
for oxygen is really interesting, particularly given that marsupials have a shortperiod of gestation and are born at a very pre-mature stage of development withan underdeveloped respiratory system. In the tammar wallaby neonate, there arefour different types of haemoglobin molecules in embryonic blood, which are dif-ferent from those found in adults (Holland et al., 1998). These molecules are alsolarger than the adult haemoglobin molecules, containing probably eight sub-unitsrather than the normal four sub-units (Holland and Gooley, 1997; Holland et al.,1998). These specialised forms of haemoglobin may play a role in the transitionfrom placental respiration in utero to pulmonary respiration in the pouch, since theydisappear a few days after birth once the nucleated red blood cells are replaced byadult-like non-nucleated red blood cells (Tyndale-Biscoe, 2005).
These unique properties make studying marsupial globin genes of particularinterest. Genomic studies on genes encoding haemoglobin molecules have led tothe discovery of novel globin genes in marsupials, which then sparked new interestin determining the evolutionary history of jawed vertebrate α- and β-globin genes.
20.3 How Did α- and β-Globin Clusters Evolve in JawedVertebrates?
20.3.1 History of Globin Gene Evolution
Globin gene evolution can be traced by studying organisational gene structure andfunction of α- and β-globin genes in different jawed vertebrate lineages (i.e. fromcartilaginous fishes to humans). In cartilaginous fishes such as sharks and ray fishes,although the whole organisational gene structure has not yet been studied, the struc-ture of their haemoglobin molecules is similar to that of other fishes and tetrapods,being composed of two α and two β globin polypeptide chains (Chong et al., 1999;Naoi et al., 2001; Verde et al., 2005). These α and β chains have many structural sim-ilarities with human α- and β-globin genes respectively (Chong et al., 1999; Naoiet al., 2001), and therefore the sequence and structure of these chains have beenconserved across all jawed vertebrates and evolved from a common ancestral globingene before fish-tetrapod divergence (∼500 MYA).
In teleosts and amphibians, α- and β-globin gene families, each containing a setof differentially expressed genes, are closely linked. The main difference betweenthese two species are that in teleosts the globin genes are linked in a “head to head”orientation (α, 3′–5′; β, 5′–3′), so that they are transcribed in opposite directions(Wagner et al., 1994; Chan et al., 1997; Miyata and Aoki, 1997; Brownlie et al.,2003), whereas in amphibians the globin genes are arranged in a “head to tail” ori-entation (α, 5′–3′, β, 5′–3′) (Jeffreys et al., 1980; Patient et al., 1980; Hosbach et al.,1983; Fuchs et al., 2006). Also, in the amphibians (Xenopus laevis and X. tropicalis),a new member of the globin superfamily was recently discovered adjacent (3′) to theα-β cluster. This gene called Globin Y (GBY) encoded a bona fide functional globinpeptide of 156 amino acid and bore sequence hallmarks of a functional respiratory
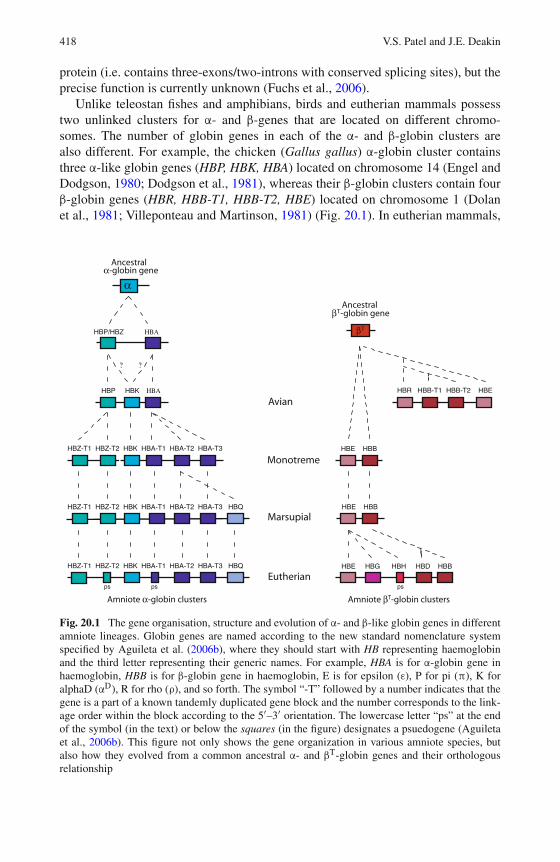
418 V.S. Patel and J.E. Deakin
protein (i.e. contains three-exons/two-introns with conserved splicing sites), but theprecise function is currently unknown (Fuchs et al., 2006).
Unlike teleostan fishes and amphibians, birds and eutherian mammals possesstwo unlinked clusters for α- and β-genes that are located on different chromo-somes. The number of globin genes in each of the α- and β-globin clusters arealso different. For example, the chicken (Gallus gallus) α-globin cluster containsthree α-like globin genes (HBP, HBK, HBA) located on chromosome 14 (Engel andDodgson, 1980; Dodgson et al., 1981), whereas their β-globin clusters contain fourβ-globin genes (HBR, HBB-T1, HBB-T2, HBE) located on chromosome 1 (Dolanet al., 1981; Villeponteau and Martinson, 1981) (Fig. 20.1). In eutherian mammals,
Avian
Monotreme
Marsupial
Eutherian
HBZ-T1 HBZ-T2 HBK HBA-T1 HBA-T2 HBA-T3 HBE HBB
α
Ancestral α-globin gene
Ancestral βΤ-globin gene
βΤHBP/HBZ ΗΒΑ
? ?
HBP HBK ΗΒΑ
HBZ-T1 HBZ-T2 HBK HBA-T1 HBA-T2 HBA-T3 HBQ
HBZ-T1 HBZ-T2 HBK HBA-T1 HBA-T2 HBA-T3 HBQ
HBE HBB
HBE HBG HBH HBD HBB
ps ps ps
HBR HBB-T1 HBB-T2 HBE
Amniote α-globin clusters Amniote βT-globin clusters
Fig. 20.1 The gene organisation, structure and evolution of α- and β-like globin genes in differentamniote lineages. Globin genes are named according to the new standard nomenclature systemspecified by Aguileta et al. (2006b), where they should start with HB representing haemoglobinand the third letter representing their generic names. For example, HBA is for α-globin gene inhaemoglobin, HBB is for β-globin gene in haemoglobin, E is for epsilon (ε), P for pi (π), K foralphaD (αD), R for rho (ρ), and so forth. The symbol “-T” followed by a number indicates that thegene is a part of a known tandemly duplicated gene block and the number corresponds to the link-age order within the block according to the 5′–3′ orientation. The lowercase letter “ps” at the endof the symbol (in the text) or below the squares (in the figure) designates a psuedogene (Aguiletaet al., 2006b). This figure not only shows the gene organization in various amniote species, butalso how they evolved from a common ancestral α- and βT-globin genes and their orthologousrelationship
20 The Evolutionary History of Globin Genes 419
all of these genes are present but their numbers have expanded due to many tandemduplications within the cluster. For example, the human (Homo sapiens) α-globincluster contains seven genes arranged in the order HBZ-T1, HBZ-T2ps, HBK, HBA-T1ps, HBA-T2, HBA-T3, HBQ and located on chromosome 16 (Orkin, 1978; Laueret al., 1980; Proudfoot and Maniatis, 1980; Goh et al., 2005), whereas their β-globincluster (HBE, HBG-T1, HBG-T2, HBHps, HBD, HBB) is located on chromosome11 (Bernard et al., 1979; Fritsch et al., 1980). Irrespective of their chromosomallocations, the amino acid sequences of α and β-globin genes display at least 50%similarity, with similar structures (three-exons/two-introns) to that of fishes andamphibians, suggesting that the structure of globin genes has been conserved sinceprior to fish-tetrapod divergence.
There are a lot of sequence and structural similarities between the avian andeutherian α-globin clusters, but not between their β-globin clusters. The genes in theavian α-globin cluster show high sequence similarities to their orthologous coun-terparts in the mammalian α-globin cluster (Proudfoot et al., 1982). For example,HBP from chicken is orthologous to HBZ from mammals (Fig. 20.1) with 71%sequence identity at protein level. Moreover, the genes in both clusters are arrangedin their order of expression, that is, HBP/HBZ are first expressed during embryonicstages, followed by HBK during late embryonic/fetal and adult stages, and finallyHBA is dominantly expressed during adult life (Bruns and Ingram, 1973; Proudfootet al., 1980). However, these properties are not seen for their β-globin clusters. Thealignment score between the avian and mammalian β-globin sequences are poor(Reitman et al., 1993). For instance, the avian HBE is as equally similar to its euthe-rian orthologue (HBE) as it is to other members of the eutherian β-globin cluster.The genes are also not arranged in their order of expression in aves (Dodgson et al.,1981) but are in mammals (Lacy et al., 1979; Lauer et al., 1980; Maniatis et al.,1980). These differences are believed to be a result of independent duplications ofan ancestral β-globin gene in the avian and mammalian lineages (Proudfoot et al.,1982; Reitman et al., 1993).
The fact that α- and β-genes are closely linked in teleosts and amphibians, theirstructures are similar to eutherian globin genes, and the eutherian α- and β-globinamino acid sequences are homologous, suggests that these genes evolved by a tan-dem duplication of the ancestral primordial globin gene some time prior to thedivergence of gnathostomes ∼500 MYA (Fig. 20.2; Dayhoff et al., 1972; Jeffreyset al., 1980; Goodman et al., 1987). Therefore, the duplicated ancestral proto α-βglobin genes were closely linked in fishes and frogs, but became separated in thecommon ancestor of all amniotes (315 MYA).
Jeffreys et al. (1980) were the first to hypothesize two possible models forthe evolution of separate α- and β-globin clusters in amniotes. One model sug-gested that the separation of these genes occurred by translocation between theα- and β-globin genes, possibly by chromosomal rearrangements after amphibian-amniote divergence, resulting in two unlinked clusters (Pisano et al., 2003). Thealternative model suggested that two distinct clusters arose via chromosomalduplication, where the duplicate copies would then have evolved to the presentarrangement found in birds and mammals by tandem duplications and silencing of
420 V.S. Patel and J.E. Deakin
the linked α- or β-globin genes within each cluster. According to this model, someevolutionary remnants of inactivated globin genes would be present near contempo-rary amniote globin gene clusters. For instance, a “fossil” β-like globin gene wouldbe present within the amniote α-globin cluster and likewise, a “fossil” α-like globingene would be present within the amniote β-globin cluster.
20.3.2 The Discovery of a Novel Marsupial Globin Gene:Implications for Globin Gene Evolution
Early work focused on studying globin genes in birds and eutherian mammals leav-ing a void in our knowledge of globin genes from lineages falling between thesetwo divergent groups of animals. Studies of α- and β-globin genes in marsupials,thus, provided useful information not only about the organization of α- and β-globinclusters, but also led to the discovery of novel globin genes. This has permitted thereconstruction of the ancestral α- and β-globin clusters in the therian ancestor.
Characterisation of marsupial globin genes showed that their α-globin clusterswere similar to humans (i.e. HBZ-T1, HBZ-T2, HBK, HBA-T1, HBA-T2, HBA-T3,HBQ; Fig. 20.1) and located on chromosome 1 in the tammar wallaby and striped-faced dunnart (Sminthopsis macroura) (De Leo et al., 2005; Cooper et al., 2006).The HBK (known as αD-globin or μ-globin) was previously thought only to bepresent in birds and reptiles, and lost from the genomes of mammals. However,the discovery of HBK in marsupials led to the discovery of HBK in eutherian mam-mals (Goh et al., 2005; Cooper et al., 2006; Hoffmann and Storz, 2007). On theother hand, marsupials have much simpler β-globin clusters than do birds and euthe-rian mammals, being comprised of only two β-globin genes (HBE, HBB; Fig. 20.1)(Koop and Goodman, 1988; Cooper et al., 1996) located on chromosomes 5 and3 in the tammar wallaby and dunnart respectively (De Leo et al., 2005; Deakinet al., 2008). Since both the α- and β-globin clusters were located on differentchromosomes and were orthologous to their respective eutherian α- and β-globincounterparts, it provided support for the Jeffreys et al. (1980) translocation hypoth-esis where the proto α-β separated from each other by a possible split between themsometime before the radiation of amniotes (>315 MYA).
The recent discovery of a third β-like globin gene called HBW in marsupialssparked new interested into determining the evolutionary history of globin genes.The marsupial-specific HBW was an extremely interesting discovery since HBWwas not linked to the main β-globin cluster, but instead was found at the 3′ endof the α-globin cluster (Wheeler et al., 2001, 2004). This “fossil” β-like gene, likeother marsupial β-globin genes, was expressed in tammar wallaby neonates andbound with α globin polypeptides to form functional haemoglobin (Holland andGooley, 1997; Holland et al., 1998). However, the phylogenetic analysis surprisinglyindicated that the HBW was more closely related to bird β-globin genes rather thanmammalian β-globin genes (Wheeler et al., 2001, 2004).
Since HBW was seen as an “orphan” (i.e. separated from the other β-globingenes), it provided support for the Jeffreys et al. (1980) chromosome duplication
20 The Evolutionary History of Globin Genes 421
hypothesis where the whole proto α-β cluster duplicated to another region of thegenome and underwent differential gene silencing in different amniote lineages. Oneof the two globin gene clusters became the β-globin cluster in birds, but the β-globingenes within this cluster became redundant and inactive, and finally deleted in mam-mals, except for the marsupial HBW, which was seen as the last mammalian relicβ-globin gene in this cluster (Wheeler et al., 2001, 2004). The other cluster divergedand duplicated to form the β-globin cluster of marsupials and eutherian mammals.Thus, under this model, the avian β-globin genes were orthologous to marsupialHBW, and both were paralogous to the mammalian β globin genes (Wheeler et al.,2001, 2004), contradicting previous claims that the β-globin clusters of birds andmammals were orthologous.
The chromosome duplication hypothesis answered some questions but ignitednew ones. It made it clear why a “fossil” and “orphaned” β-like HBW gene wasfound adjacent (3′) to the α-globin cluster. This also partially explained why chickenβ-globin genes did not show high sequence similarities to mammalian β-globingenes (Reitman et al., 1993). However, the HBW gene was not a pseudogene, buta transcriptionally active gene that encoded a functional haemoglobin molecule(reviewed in Hardison, 2008). Also, no evidence has been found for a fossil orfunctional α-like globin gene adjacent to any amniote β-globin cluster, nor haveorthologues of the chicken β-globin gene cluster and marsupial HBW gene beenfound in eutherian mammals. It also failed to explain why the regions spanningthe duplicated globin clusters are so different, i.e. the mammalian α-globin clus-ters reside in a G+C-rich region that contains a CpG island, whereas their β-globinclusters are in an A+T-rich region (reviewed in Hardison, 1998). If the whole α-βcluster duplicated, then one would expect to see some flanking genes and regula-tory regions common to both clusters. Therefore, the model proposed by Wheeleret al. (2001, 2004) explained the presence of the HBW gene beside the marsupial α-globin cluster, but failed to explain the differences between α- and β-globin clustersin amniotes.
20.3.3 A New Model for Globin Gene Evolution: Insights fromMonotremes
The discovery of the marsupial HBW gene and the poor explanation of globin evo-lution by chromosome duplication sparked further interest in solving the mysteryof globin gene evolution by looking at the most basal lineage of mammals, themonotremes. This particular mammalian lineage has unique characteristics distinctfrom other mammals, such being the only egg-laying mammals.
Studies of globin genes in the platypus (Ornithorhynchus anatinus) revealed that,like marsupials, the α-globin cluster contains the HBW gene, with the entire clusterconsisting of a similar arrangement to other therian mammals i.e. HBZ-T1, HBZ-T2, HBK, HBA-T1, HBA-T2, HBA-T3, HBW, GBY (Fig. 20.1; Patel et al., 2008).The only two differences are that it does not possess HBQ between HBA-T3 andHBW, suggesting that it evolved by a duplication of HBA-T2 after the divergence of
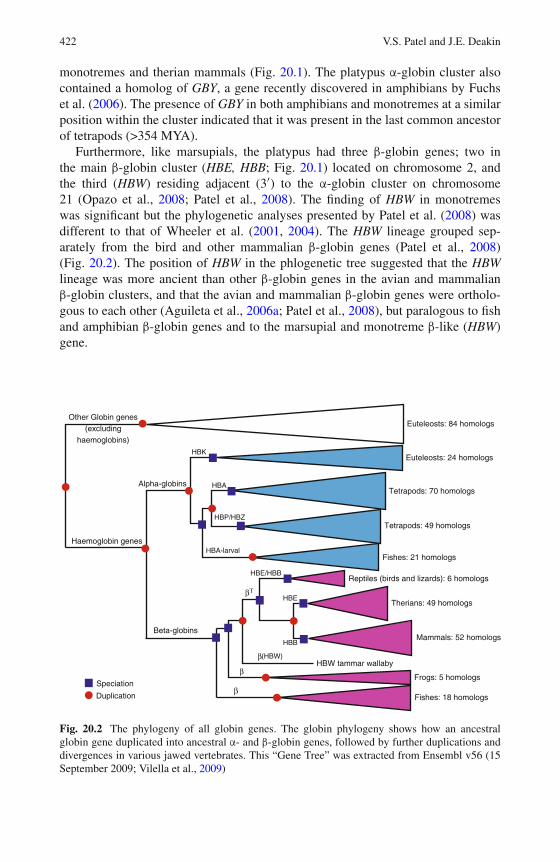
422 V.S. Patel and J.E. Deakin
monotremes and therian mammals (Fig. 20.1). The platypus α-globin cluster alsocontained a homolog of GBY, a gene recently discovered in amphibians by Fuchset al. (2006). The presence of GBY in both amphibians and monotremes at a similarposition within the cluster indicated that it was present in the last common ancestorof tetrapods (>354 MYA).
Furthermore, like marsupials, the platypus had three β-globin genes; two inthe main β-globin cluster (HBE, HBB; Fig. 20.1) located on chromosome 2, andthe third (HBW) residing adjacent (3′) to the α-globin cluster on chromosome21 (Opazo et al., 2008; Patel et al., 2008). The finding of HBW in monotremeswas significant but the phylogenetic analyses presented by Patel et al. (2008) wasdifferent to that of Wheeler et al. (2001, 2004). The HBW lineage grouped sep-arately from the bird and other mammalian β-globin genes (Patel et al., 2008)(Fig. 20.2). The position of HBW in the phlogenetic tree suggested that the HBWlineage was more ancient than other β-globin genes in the avian and mammalianβ-globin clusters, and that the avian and mammalian β-globin genes were ortholo-gous to each other (Aguileta et al., 2006a; Patel et al., 2008), but paralogous to fishand amphibian β-globin genes and to the marsupial and monotreme β-like (HBW)gene.
Euteleosts: 84 homologs
Euteleosts: 24 homologs
Fishes: 18 homologs
Fishes: 21 homologs
Frogs: 5 homologs
HBW tammar wallaby
Tetrapods: 70 homologs
Tetrapods: 49 homologs
Reptiles (birds and lizards): 6 homologs
Mammals: 52 homologs
Therians: 49 homologs
Other Globin genes(excluding
haemoglobins)
Haemoglobin genes
Alpha-globins
Beta-globins
Speciation
Duplication
HBK
HBA
HBP/HBZ
HBA-larval
HBE/HBB
HBE
HBB
(HBW)
β
β
β
βΤ
Fig. 20.2 The phylogeny of all globin genes. The globin phylogeny shows how an ancestralglobin gene duplicated into ancestral α- and β-globin genes, followed by further duplications anddivergences in various jawed vertebrates. This “Gene Tree” was extracted from Ensembl v56 (15September 2009; Vilella et al., 2009)
20 The Evolutionary History of Globin Genes 423
Further evidence for this came through flanking analysis of α- and β-globin clus-ters in other vertebrates. The avian and mammalian α-globin clusters were flankedby MPG and C16orf35 on the 5′ end, and GBY and LUC7L on the 3′ end. These5′ flanking markers were also present adjacent to the α-β cluster of teleosts andamphibians (including GBY), supporting its orthology to the α-globin cluster of allamniotes. Therefore, this ancient α-β cluster (and flanking regions) has been con-served for more than 500 MYA, since before the divergence of gnathostomes (Patelet al., 2008).
After the evolution of gnathostomes and the duplication of an ancestral single pri-mordial globin gene into the ancestral proto α-β globin genes (Fig. 20.3), the proto-αglobin gene underwent further tandem duplications, subsequent divergence and spe-cialisation of embryonic and adult globin complexes in different vertebrate lineages.It first duplicated sometime before the teleost-tetrapod divergence more than 450MYA into the progenitors of embryonic globin genes HBP/HBZ and adult globingenes HBA (Czelusniak et al., 1982; Goodman et al., 1987; Fig. 20.1). In teleostsand amphibians, further tandem duplications, followed by sequence divergence,expanded the embryonic and adult α- and β-globin genes. Then after amphibian-amniote divergence, there was an additional tandem duplication of either HBP/HBZor HBA to result in the HBK lineage (Fig. 20.1), since all three genes are presentin aves (Engel and Dodgson, 1978; Dodgson et al., 1981; Alev et al., 2009) andmammals (Goh et al., 2005; Cooper et al., 2006; Hoffmann and Storz, 2007). Theorder, timing and origin of these duplications are still unknown. For example, HBKmay have evolved by duplication of an adult HBA (Cooper et al., 2006) or of anembryonic HBP/HBZ and this duplication may have occurred before (and not after)tetrapod divergence with HBK lost secondarily in amphibians (Hoffmann and Storz,2007).
After the divergence of birds and mammals, there were further tandem dupli-cations of embryonic and adult α-like globin genes to produce a six-gene cluster(HBZ-T1, HBZ-T2, HBK, HBA-T1, HBA-T2, HBA-T3; Fig. 20.1) in monotremes,with ongoing gene conversion events homogenising the two embryonic (HBZ-T1and HBZ-T2) and three adult (HBA-T1,2,3) genes (Patel et al., 2008). There wasan additional tandem duplication of HBA-T2 to generate HBQ after monotreme andtherian divergence, thus giving rise to a seven-gene cluster (HBZ-T1, HBZ-T2, HBK,HBA-T1, HBA-T2, HBA-T3, HBQ; Fig. 20.1) in marsupial (Cooper et al., 2006) andeutherian mammals (Orkin, 1978; Lauer et al., 1980; Proudfoot and Maniatis, 1980;Goh et al., 2005).
The amniote β-globin cluster resides in a completely different genomic contextto that of the α-globin cluster, sharing none of its flanking markers with the amnioteα-globin cluster, or even the α-β cluster of teleosts and amphibians. Instead, they aresurrounded by many olfactory receptor (OR) genes (Bulger et al., 1999). Since ORgenes are a huge superfamily in vertebrates (reviewed in Delbridge et al., Chapter21; Niimura and Nei, 2005), it was necessary to look at more distant flankingregions for single-copy genes to make genomic context comparisons. In this case,Patel et al. (2008) used the markers ILK and CCKBR, which were located 5′ of theβ-globin cluster, and RRM1 that was located 3′. These three flanking markers were
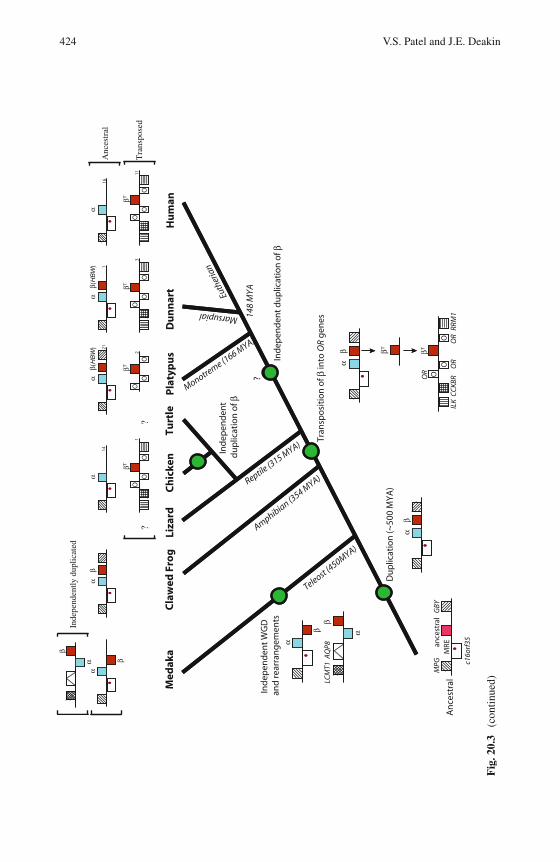
424 V.S. Patel and J.E. Deakin
Pla
typ
us
Du
nn
art
Hu
man
Ch
icke
nLi
zard
Turt
leC
law
ed F
rog
Med
aka
Teleost (450MYA)
Amphibian (354 M
YA)Reptile (3
15 MYA)
Monotreme (1
66 MYA)
Marsupial
Euth
eria
n
Du
plic
atio
n (~
500
MY
A)
ance
stra
l
αβ
GBY
c16o
rf35
MPG
Ind
epen
den
t W
GD
an
d re
arra
ng
emen
ts
Tran
spo
siti
on
of β
into
OR
gen
es
OR
OR
O
CC
KBR
RRM
1IL
K
βΤ
OO
OR
α
β
αβ
OβΤ
OO
α
OβΤ
OO
α
β(H
BW
)
OβΤ
OO
α
β(H
BW
)
OO
O
βΤ
αα
β
β
??
Ind
epen
den
t d
up
licat
ion
of β
Ind
epen
den
t d
up
licat
ion
of β
α
βLC
MT1
AQ
P8
αα
β
An
cest
ral
148
MYA
MRE
βΤ
Tra
nspo
sed
Anc
estr
al
Inde
pend
ently
dup
licat
ed
16
11
1
3
21
2
14
1
?
Fig
.20.
3(c
ontin
ued)
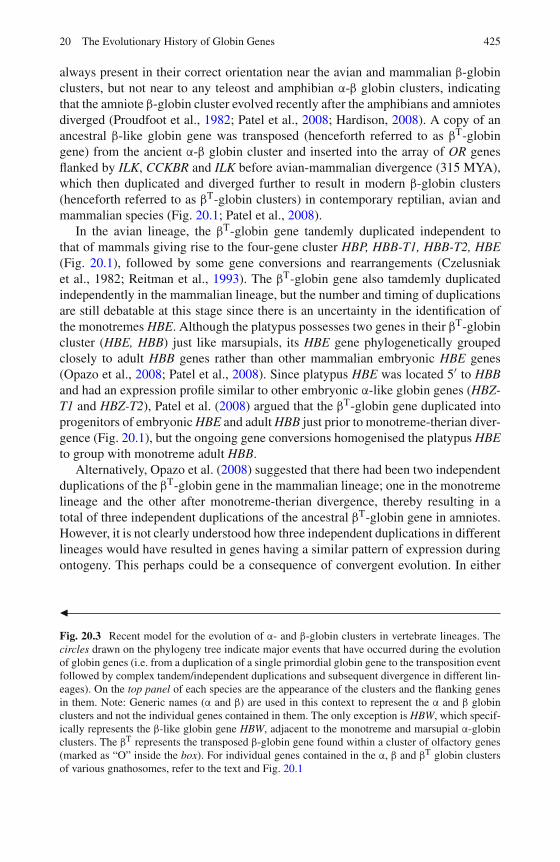
20 The Evolutionary History of Globin Genes 425
always present in their correct orientation near the avian and mammalian β-globinclusters, but not near to any teleost and amphibian α-β globin clusters, indicatingthat the amniote β-globin cluster evolved recently after the amphibians and amniotesdiverged (Proudfoot et al., 1982; Patel et al., 2008; Hardison, 2008). A copy of anancestral β-like globin gene was transposed (henceforth referred to as βT-globingene) from the ancient α-β globin cluster and inserted into the array of OR genesflanked by ILK, CCKBR and ILK before avian-mammalian divergence (315 MYA),which then duplicated and diverged further to result in modern β-globin clusters(henceforth referred to as βT-globin clusters) in contemporary reptilian, avian andmammalian species (Fig. 20.1; Patel et al., 2008).
In the avian lineage, the βT-globin gene tandemly duplicated independent tothat of mammals giving rise to the four-gene cluster HBP, HBB-T1, HBB-T2, HBE(Fig. 20.1), followed by some gene conversions and rearrangements (Czelusniaket al., 1982; Reitman et al., 1993). The βT-globin gene also tamdemly duplicatedindependently in the mammalian lineage, but the number and timing of duplicationsare still debatable at this stage since there is an uncertainty in the identification ofthe monotremes HBE. Although the platypus possesses two genes in their βT-globincluster (HBE, HBB) just like marsupials, its HBE gene phylogenetically groupedclosely to adult HBB genes rather than other mammalian embryonic HBE genes(Opazo et al., 2008; Patel et al., 2008). Since platypus HBE was located 5′ to HBBand had an expression profile similar to other embryonic α-like globin genes (HBZ-T1 and HBZ-T2), Patel et al. (2008) argued that the βT-globin gene duplicated intoprogenitors of embryonic HBE and adult HBB just prior to monotreme-therian diver-gence (Fig. 20.1), but the ongoing gene conversions homogenised the platypus HBEto group with monotreme adult HBB.
Alternatively, Opazo et al. (2008) suggested that there had been two independentduplications of the βT-globin gene in the mammalian lineage; one in the monotremelineage and the other after monotreme-therian divergence, thereby resulting in atotal of three independent duplications of the ancestral βT-globin gene in amniotes.However, it is not clearly understood how three independent duplications in differentlineages would have resulted in genes having a similar pattern of expression duringontogeny. This perhaps could be a consequence of convergent evolution. In either
�
Fig. 20.3 Recent model for the evolution of α- and β-globin clusters in vertebrate lineages. Thecircles drawn on the phylogeny tree indicate major events that have occurred during the evolutionof globin genes (i.e. from a duplication of a single primordial globin gene to the transposition eventfollowed by complex tandem/independent duplications and subsequent divergence in different lin-eages). On the top panel of each species are the appearance of the clusters and the flanking genesin them. Note: Generic names (α and β) are used in this context to represent the α and β globinclusters and not the individual genes contained in them. The only exception is HBW, which specif-ically represents the β-like globin gene HBW, adjacent to the monotreme and marsupial α-globinclusters. The βT represents the transposed β-globin gene found within a cluster of olfactory genes(marked as “O” inside the box). For individual genes contained in the α, β and βT globin clustersof various gnathosomes, refer to the text and Fig. 20.1
426 V.S. Patel and J.E. Deakin
case, further research into the gene structure and function of β-like globin genes inother birds, reptiles and monotremes would clarify this evolutionary step.
Data from marsupials gave strong evidence that the duplication of the βT-globingene into progenitors of embryonic HBE and adult HBB occurred at least before thedivergence of marsupials and eutherian mammals since these two genes are presentin all therian mammals studied to date (Koop and Goodman, 1988; Cooper andHope, 1993; Cooper et al., 1996; De Leo et al., 2005). After marsupial-eutheriandivergence, the progenitors of HBE and HBB tandemly duplicated to produce afive-gene ancestral cluster (HBE, HBG, HBH, HBD, HBB; Fig. 20.1) in euthe-rian mammals (Goodman et al., 1984). In some mammals, additional events suchas block duplications, gene conversions and transpositions have resulted in morecomplex β-globin clusters.
20.3.4 What Was the Mechanism Behind Transposition?
The evolution of the βT-globin cluster in amniotes was most likely due to a singletransposition event that moved a copy of the β-globin gene to a new site containingOR genes. The exact mechanism for this recruitment remains unclear at this stagebut it is likely to have involved transposable elements for the gene’s survival. It alsoseems possible that the region in which the βT-globin cluster became embedded inamniotes was a “hot-spot” for transposition events. In marsupials, such as the tam-mar wallaby and South American opossum (Monodelphis domestica), the FTSJ1gene, found on the X chromosome in humans, has also transposed into this regionbeside the βT-globin cluster on opossum chromosome 4 and tammar wallaby chro-mosome 5 (Deakin et al., 2008). Therefore, this region appears to have recruitedgenes from various parts of the genome.
20.4 Regulation of α- and β-Globin Genes
The switching of the α and β globin genes at various developmental stages iscommon across gnathostomes, indicating a highly conserved regulatory system.The α-globin clusters of birds and therian mammals and the βT-globin clusters oftherian mammals have distal cis-regulatory elements called the major regulatoryregion (MRE) located in the intron of C16orf35 for α-globin clusters (Higgs et al.,1990), and locus control region (LCR) for βT-globin clusters (Forrester et al., 1986;Grosveld et al, 1987). These regulatory regions contain conserved binding sites fortranscription factors that control the high level, copy number-dependent, position-independent expression of associated globin gene in transgenic mice (Grosveldet al., 1987; Higgs et al., 1990).
Both these regulatory regions differ from each other in many ways: the MREis about 0.4 kb long, contains only one DNase hypersensitive site and is locatedabout 20–60 kb upstream of the α-globin loci; whereas the LCR comprises fiveDNase hypersensitive sites (HS 1–5), is located about 6–20 kb upstream of the
20 The Evolutionary History of Globin Genes 427
βT-globin locus and is about 20–25 kb long. Each HS site in the LCR has acore sequence of ∼250 bp and contain binding sites for the transcription factors(Stamatoyannopoulos, 2005). The βT-globin LCR is also required for tissue-specificchromosomal domain opening, whereas no such function has been defined for α-globin MRE (reviewed in Hardison et al., 1997; Higgs and Wood, 2008). The onlysimilarity between them is that α-globin MRE shares many of the structural featuresof the HS2 site of the βT-globin LCR (Jarman et al., 1991). Furthermore, the tissue-specific and developmental-specific expression of α- and β-like globin genes are notonly controlled by MRE and LCR, but also by other promoters and local enhancerslocated near them (Stamatoyannopoulos, 1991).
The α-globin MRE is well conserved in amniotes but the βT-globin LCR is not.The MRE sequences of eutherian mammals show some similarities to those of mar-supials (Hughes et al., 2005) and birds, and even to fish, acting as active enhancers(Flint et al., 2001). Although MRE has not been studied in monotremes to date, itis expected that their MRE would be conserved with other mammalian and avianMREs. It has therefore been conserved since the evolution of α-globin genes, priorto the divergence of fish and tetrapods (>450 MYA).
On the other hand, the LCR of eutherian mammals shows conservation onlywith marsupials (De Leo et al., 2005) and not chickens (Reitman et al., 1993). Datafrom marsupials show that, although they contain a much simpler βT-globin clusterthan eutherian mammals, their LCR (HS 1–5) is equivalent to that of eutherians.It therefore supports the holocomplex theory that the LCR acts as an integral unitto regulate the β-globin genes, by activating the transcriptional apparatus at theglobin gene promoters (reviewed in Engel and Tanimoto, 2000; De Leo et al.,2005). The conservation of these regulatory regions across taxa indicates thattheir function has also been conserved, even in marsupials whose haemoglobinmolecules have different properties in embryos and newborns. Chickens, on theother hand, although they have four HS sites located upstream of their β-globin loci,they do not have major enhancing activities to confer copy number-dependent andhigh-expression of the β-globin gene in transgenic mice nor the sequences showany conservation with therian HS sites (Reitman and Felsenfeld, 1990; Reitmanet al., 1993; Abruzzo and Reitman, 1994; Mason et al., 1995). Instead, chickenshave a strong tissue-specific enhancer located within its β-globin loci called βA/εenhancer (Choi and Engel, 1986; Hesse et al., 1986) that together with upstreamHS sites and local promoters regulate the high expression of β-globin genes in them(Mason et al., 1995). The lack of conservation between the chicken and therianβ-globin regulatory regions (Reitman et al., 1993; Abruzzo and Reitman, 1994)suggests that they evolved independently in the avian and mammalian lineages.
20.4.1 How Did Transposition Affect the Regulation of the GlobinClusters?
In amniotes, the α- and β-globin genes are expressed specifically in erythroid cellsand require a complex coordinated regulatory network for the balanced expression
428 V.S. Patel and J.E. Deakin
of α and β globin genes to form functional haemoglobin. Given that a βT-globin genetransposed into a region containing OR genes that are expressed only in nasal epithe-lium, raises the question of how has it maintained its erythroid-specific expression.All amniote species studied to date (except monotremes) have a cis-regulatory ele-ment (LCR for mammals and βA/ε enhancer for chickens) regulating the expressionof genes in their βT-globin clusters. How this has evolved is a challenging question.Perhaps during transposition of the βT-globin gene sufficient regulatory sequencesfrom the α-globin MRE were also transposed, which subsequently duplicated anddiverged further in amniotes, thus making it quite different to the α-globin MRE.Alternatively, amniotes evolved their own regulatory regions for βT-globin lociafter the transposition event followed by duplications and divergence (reviewed inHardison, 2008).
In either case, it would be predicted that βT-globin regulatory regions of aves andmammals would be conserved but indeed they are not. Eutherian LCR share sim-ilarities with marsupials only (De Leo et al., 2005), but not with aves (Reitmanet al., 1993). The status of the monotreme LCR is debateable at this stage. DeLeo et al. (2005) claim to have isolated the platypus HS2 and HS3 sites byamplification using the primers that have been conserved with all other therianmammals. According to De Leo et al. (2005), the sequences of these two hyper-sensitive sites show high similarities to other marsupial and eutherian HS sitesbut not to chicken HS sites. Now that the platypus genome assembly (OrnAna1– March 2007; http://genome.ucsc.edu/cgi-bin/hgGateway) and the bacterial artifi-cial chromosome clones containing the βT-globin cluster (Patel et al., 2008) havebeen sequenced, one would assume that these platypus HS2 and HS3 sites wouldclearly be present. However, the HS2 and HS3 sequences isolated by De Leoet al. (2005) could not be found in the proximity of the platypus βT-globin clus-ter, or anywhere else in the platypus genome assembly (OrnAna1). Even attemptsto re-isolate these two regions using the same primer sequences and the samemethod described by De Leo et al. (2005) have failed to amplify any fragments(Patel et al., in preparation). These recent results suggest that there was poten-tially a contamination issue with the experiments described in De Leo et al.(2005). It is therefore, uncertain if platypus does contain conserved HS2 and HS3sites or contains a different LCR region that controls the expression of βT-globingenes.
Given that the transposition event occurred before avian-mammalian diver-gence (315 MYA), it is possible that the regulatory regions would havediverged significantly, resulting in the low similarity observed between avesand mammals (reviewed in Hardison, 2008). Alternatively, since there has beenindependent duplications of the βT-globin gene in avian and mammalian lineages,it is equally likely that their regulatory regions would have evolved indepen-dently with them as well, thereby resulting in different HS sites, enhancers andpromoters. Further research into the LCR of monotremes and reptilian specieswould be useful in clarifying the evolution of βT-globin regulatory regions inamniotes.
20 The Evolutionary History of Globin Genes 429
20.5 Unsolved Questions and Future Work
In conclusion, many studies into the gene structures of α- and β-globin clustersin various vertebrates have provided clues about their evolution and regulation. Itwasn’t until the discovery of the marsupial HBW gene (Wheeler et al., 2001, 2004),and the subsequent genomic context analysis in monotremes and other species(Patel et al., 2008), that a simplified model for globin gene evolution was proposed.In the ancestor of jawed vertebrates (500 MYA), a single primordial globin geneduplicated into proto α-β globin genes linked together, followed by further tan-dem duplications, subsequent sequence divergence and specialisation to result inthe modern α-β globin cluster in contemporary teleosts and amphibians, and theα-globin cluster in all amniotes (Fig. 20.3).
In amniotes, a distinct and unlinked β-globin cluster is found on a separate chro-mosome from that of α-globin cluster. Of all proposed models, the transpositionmodel proposed by Patel et al. (2008) provided the most parsimonious explanationof how a copy of β-globin gene, was transposed into a sea of olfactory receptorgenes before the evolution of amniotes. The transposed βT-globin gene duplicatedand diverged independently in contemporary aves and mammals to form a dominantβT-globin cluster. As a consequence, the avian and mammalian βT-globin clustersare quite different to each other. Furthermore, this transposition event also explainedwhy both α- and βT-globin clusters in amniotes were so different to each other inrespect to their flanking regions, regulatory regions and locations. Research intomarsupials and monotremes globin genes have been instrumental in this study, as ithas clarified the timing of when many globin genes arose in mammals.
We have come a step closer to understanding globin genes, their evolution andregulation in jawed vertebrates. Based on the studied species, models are pro-posed to gain insight into what might have happened over the course of evolution.However, all models, including the transposition model demonstrated here, needfurther validation from other species that have not yet been studied. Sequencing thegenomes of various species, including the Australian model tammar wallaby, haveadvanced and could facilitate research into globin studies. The genome of the tam-mar wallaby could answer questions such as: (1) Does it contain GBY? (2) What arethe structures of the MRE and LCR of its α- and βT-globin clusters respectively?(3) and does the region in close proximity to the βT-globin cluster show signs oftransposable elements? The data from marsupials also need to be compared to otherspecies such as monotremes and reptiles to provide constructive evaluation of thedata, and potentially answer how and why the transposition event took place and theconsequences of such movement.
In addition, more intensive research into the expression and regulation of globingenes in marsupials, especially in the embryos and newborns is needed. This wouldperhaps hold the answer to why some marsupial embryos and newborns have uniquehaemoglobin properties compared to other amniote embryos. Research into globingenes in marsupials has been, and will continue to be, very valuable not only to studyglobin gene evolution, but also to study their unique properties and regulation.
430 V.S. Patel and J.E. Deakin
Acknowledgments We thank Hardip Patel for his assistance with drawing Fig. 20.2.
References
Abruzzo LV, Reitman M (1994) Enhancer activity of upstream hypersensitive site 2 of the chickenbeta-globin cluster is mediated by GATA sites. J Biol Chem 269:32565–32571.
Aguileta G, Bielawski JP, Yang Z (2006a) Evolutionary rate variation among vertebrate beta globingenes: implications for dating gene family duplication events. Gene 380:21–29.
Aguileta G, Bielawski JP, Yang Z (2006b) Proposed standard nomenclature for the alpha- andbeta-globin gene families. Genes Genet Syst 81:367–371.
Alev C, Shinmyozu K, McIntyre BA, et al. (2009) Genomic organization of zebra finch alpha andbeta globin genes and their expression in primitive and definitive blood in comparison withglobins in chicken. Dev Genes Evol 219:353–360.
Bernard R, Little PFR, Annison G, et al. (1979) Structure of the human gammaG-gammaA-delta-beta-globin gene locus. Proc Natl Acad Sci U S A 76:4827–4831.
Brittain T, Hofmann OM, Watmough NJ, et al. (1997) A two-state analysis of co-operative oxygenbinding in the three human embryonic haemoglobins. Biochem J 326:299–303.
Brownlie A, Hersey C, Oates AC, et al. (2003) Characterization of embryonic globin genes of thezebrafish. Dev Biol 255:48–61.
Bruns GA, Ingram VM (1973) Erythropoiesis in the developing chick embryo. Dev Biol30:455–459.
Bulger M, van Doorninck JH, Saitoh N, et al. (1999) Conservation of sequence and structure flank-ing the mouse and human beta-globin loci: the beta-globin genes are embedded within an arrayof odorant receptor genes. Proc Natl Acad Sci U S A 96:5129–5134.
Calvert SJ, Holland RAB, Gemmell RT (1994) Respiratory Properties of the Neonatal Blood ofthe Common Brushtail Possum (Trichosurus vulpecula). Physiol Zool 67:407–417.
Chan FY, Robinson J, Brownlie A, et al. (1997) Characterization of adult alpha- and beta-globingenes in the zebrafish. Blood 89:688–700.
Choi OR, Engel JD (1986) A 3′enhancer is required for temporal and tissue-specific transcriptional
activation of the chicken adult beta-globin gene. Nature 323:731–734.Chong KT, Miyazaki G, Morimoto H, et al. (1999) Structures of the deoxy and CO forms of
haemoglobin from Dasyatis akajei, a cartilaginous fish. Acta Crystallogr D Biol Crystallogr55:1291–1300.
Coates ML (1975) Hemoglobin function in the vertebrates: an evolutionary model. J Mol Evol6:285–307.
Cooper SJ, Hope RM (1993) Evolution and expression of a beta-like globin gene of the Australianmarsupial Sminthopsis crassicaudata. Proc Natl Acad Sci U S A 90:11777–11781.
Cooper SJ, Murphy R, Dolman G, et al. (1996) A molecular and evolutionary study of the beta-globin gene family of the Australian marsupial Sminthopsis crassicaudata. Mol Biol Evol13:1012–1022.
Cooper SJ, Wheeler D, De Leo A, et al. (2006) The mammalian alphaD-globin gene lineageand a new model for the molecular evolution of alpha-globin gene clusters at the stem of themammalian radiation. Mol Phylogenet Evol 38:439–448.
Czelusniak J, Goodman M, Hewett-Emmett D, et al. (1982) Phylogenetic origins and adaptiveevolution of avian and mammalian haemoglobin genes. Nature 298:297–300.
Dayhoff MO, Hunt LT, McLaughlin PJ, et al. (1972) Gene duplications in evolution. In: DayhoffMO (ed) Atlas of Protein Sequence and Structure. National Biomedical Research Foundation,Washington, DC, pp. 17–30.
De Leo AA, Wheeler D, Lefevre C, et al. (2005) Sequencing and mapping hemoglobin gene clus-ters in the Australian model dasyurid marsupial Sminthopsis macroura. Cytogenet Genome Res108:333–341.
Deakin JE, Koina E, Waters PD, et al. (2008) Physical map of two tammar wallaby chromosomes:a strategy for mapping in non-model mammals. Chromosome Res 16:1159–1175.
20 The Evolutionary History of Globin Genes 431
Dodgson JB, McCune KC, Rusling DJ, et al. (1981) Adult chicken alpha-globin genes alpha A andalpha D: no anemic shock alpha-globin exists in domestic chickens. Proc Natl Acad Sci U S A78:5998–6002.
Dolan M, Sugarman BJ, Dodgson JB, et al. (1981) Chromosomal arrangement of the chickenbeta-type globin genes. Cell 24:669–677.
Engel JD, Dodgson JB (1978) Analysis of the adult and embryonic chicken globin genes inchromosomal DNA. J Biol Chem 253:8239–8246.
Engel JD, Dodgson JB (1980) Analysis of the closely linked adult chicken alpha-globin genes inrecombinant DNAs. Proc Natl Acad Sci U S A 77:2596–2600.
Engel JD, Tanimoto K (2000) Looping, linking, and chromatin activity: new insights into beta-globin locus regulation. Cell 100:499–502.
Flint J, Tufarelli C, Peden J, et al. (2001) Comparative genome analysis delimits a chromosomaldomain and identifies key regulatory elements in the alpha globin cluster. Hum Mol Genet10:371–382.
Forrester WC, Thompson C, Elder JT, et al. (1986) A developmentally stable chromatin structurein the human beta-globin gene cluster. Proc Natl Acad Sci U S A 83:1359–1363.
Fritsch EF, Lawn RM, Maniatis T (1980) Molecular cloning and characterization of the humanbeta-like globin gene cluster. Cell 19:959–972.
Fuchs C, Burmester T, Hankeln T (2006) The amphibian globin gene repertoire as revealed by theXenopus genome. Cytogenet Genome Res 112:296–306.
Goh SH, Lee YT, Bhanu NV, et al. (2005) A newly discovered human alpha-globin gene. Blood106:1466–1472.
Goodman M, Koop BF, Czelusniak J, et al. (1984) The eta-globin gene. Its long evolutionaryhistory in the beta-globin gene family of mammals. J Mol Biol 180:803–823.
Goodman M, Czelusniak J, Koop BF, et al. (1987) Globins: a case study in molecular phylogeny.Cold Spring Harb Symp Quant Biol 52:875–890.
Grosveld F, van Assendelft GB, Greaves DR, et al. (1987) Position-independent, high-levelexpression of the human beta-globin gene in transgenic mice. Cell 51:975–985.
Hardison R (1998) Hemoglobins from bacteria to man: evolution of different patterns of geneexpression. J Exp Biol 201:1099–1117.
Hardison R, Slightom JL, Gumucio DL, et al. (1997) Locus control regions of mammalianbeta-globin gene clusters: combining phylogenetic analyses and experimental results to gainfunctional insights. Gene 205:73–94.
Hardison RC (2001) Organization, evolution and regulation of the globin genes. In: Steinberg MC,Forget BG, Higgs D, et al. (eds) Disorders of Hemoglobin: Genetics, Pathophysiology, ClinicalManagement. Cambridge University Press, Cambridge.
Hardison RC (2008) Globin genes on the move. J Biol 7:35.Hesse JE, Nickol JM, Lieber MR, et al. (1986) Regulated gene expression in transfected primary
chicken erythrocytes. Proc Natl Acad Sci U S A 83:4312–4316.Higgs DR, Wood WG (2008) Long-range regulation of alpha globin gene expression during
erythropoiesis. Curr Opin Hematol 15:176–183.Higgs DR, Wood WG, Jarman AP, et al. (1990) A major positive regulatory region located far
upstream of the human alpha-globin gene locus. Genes Dev 4:1588–1601.Hoffmann FG, Storz JF (2007) The αD-globin gene originated via duplication of an embryonic
α-like globin gene in the ancestor of tetrapod vertebrates. Mol Biol Evol 24:1982–1990.Hofmann OM, Brittain T, Wells RM (1997) The control of oxygen affinity in the three
human embryonic haemoglobins by respiration linked metabolites. Biochem Mol Biol Int42:553–566.
Holland RA, Gooley AA (1997) Characterization of the embryonic globin chains of the marsupialTammar wallaby, Macropus eugenii. Eur J Biochem 248:864–871.
Holland RA, Gooley AA, Hope RM (1998) Embryonic globins of the marsupial the TammarWallaby (Macropus eugenii): bird like and mammal like. Clin Exp Pharmacol Physiol25:740–744.
432 V.S. Patel and J.E. Deakin
Hosbach HA, Wyler T, Weber R (1983) The Xenopus laevis globin gene family: chromosomalarrangement and gene structure. Cell 32:45–53.
Hughes JR, Cheng JF, Ventress N, et al. (2005) Annotation of cis-regulatory elements by identifi-cation, subclassification, and functional assessment of multispecies conserved sequences. ProcNatl Acad Sci U S A 102:9830–9835.
Iuchi I (1973) The post-hatching transition of erythrocytes from larval to adult type in the rainbowtrout, Salmo gairdnerii irideus. J Exp Zool 184:383–396.
Jarman AP, Wood WG, Sharpe JA, et al. (1991) Characterization of the major regulatory elementupstream of the human alpha-globin gene cluster. Mol Cell Biol 11:4679–4689.
Jeffreys AJ, Wilson V, Wood D, et al. (1980) Linkage of adult alpha- and beta-globin genes in X.laevis and gene duplication by tetraploidization. Cell 21:555–564.
Koop BF, Goodman M (1988) Evolutionary and developmental aspects of two hemoglobinbeta-chain genes (epsilon M and beta M) of opossum. Proc Natl Acad Sci U S A85:3893–3897.
Lacy E, Hardison RC, Quon D, et al. (1979) The linkage arrangement of four rabbit beta-likeglobin genes. Cell 18:1273–1283.
Lauer J, Shen CK, Maniatis T (1980) The chromosomal arrangement of human alpha-like globingenes: sequence homology and alpha-globin gene deletions. Cell 20:119–130.
Maniatis T, Fritsch EF, Lauer J, et al. (1980) The molecular genetics of human hemoglobins. AnnuRev Genet 14:145–178.
Mason MM, Lee E, Westphal H, et al. (1995) Expression of the chicken beta-globin gene clusterin mice: correct developmental expression and distributed control. Mol Cell Biol 15:407–414.
Miyata M, Aoki T (1997) Head-to-head linkage of carp alpha- and beta-globin genes. BiochimBiophys Acta 1354:127–133.
Muller G, Fago A, Weber RE (2003) Water regulates oxygen binding in hagfish (Myxine glutinosa)hemoglobin. J Exp Biol 206:1389–1395.
Naoi Y, Chong KT, Yoshimatsu K, et al. (2001) The functional similarity and structural diversityof human and cartilaginous fish hemoglobins. J Mol Biol 307:259–270.
Niimura Y, Nei M (2005) Evolutionary dynamics of olfactory receptor genes in fishes andtetrapods. Proc Natl Acad Sci U S A 102:6039–6044.
Opazo JC, Hoffmann FG, Storz JF (2008) Genomic evidence for independent origins ofbeta-like globin genes in monotremes and therian mammals. Proc Natl Acad Sci U S A105:1590–1595.
Orkin SH (1978) The duplicated human alpha globin genes lie close together in cellular DNA. ProcNatl Acad Sci U S A 75:5950–5954.
Patel VS, Cooper SJ, Deakin JE, et al. (2008) Platypus globin genes and flanking loci suggest anew insertional model for beta-globin evolution in birds and mammals. BMC Biol 6:34.
Patient RK, Elkington JA, Kay RM, et al. (1980) Internal organization of the major adult alpha-and beta-globin genes of X. laevis. Cell 21:565–573.
Pisano E, Cocca E, Mazzei F, et al. (2003) Mapping of alpha- and beta-globin genes on Antarcticfish chromosomes by fluorescence in-situ hybridization. Chromosome Res 11:633–640.
Proudfoot NJ, Gil A, Maniatis T (1982) The structure of the human zeta-globin gene and a closelylinked, nearly identical pseudogene. Cell 31:553–563.
Proudfoot NJ, Maniatis T (1980) The structure of a human alpha-globin pseudogene and itsrelationship to alpha-globin gene duplication. Cell 21:537–544.
Proudfoot NJ, Shander MH, Manley JL, et al. (1980) Structure and in vitro transcription of humanglobin genes. Science 209:1329–1336.
Qiu Y, Maillett DH, Knapp J, et al. (2000) Lamprey hemoglobin. Structural basis of the bohr effect.J Biol Chem 275:13517–13528.
Reitman M, Felsenfeld G (1990) Developmental regulation of topoisomerase II sites and DNaseI-hypersensitive sites in the chicken beta-globin locus. Mol Cell Biol 10:2774–2786.
Reitman M, Grasso JA, Blumenthal R, et al. (1993) Primary sequence, evolution, and repetitiveelements of the Gallus gallus (chicken) beta-globin cluster. Genomics 18:616–626.
Stamatoyannopoulos G (1991) Human haemoglobin switching. Science 252:383.
20 The Evolutionary History of Globin Genes 433
Stamatoyannopoulos G (2005) Control of globin gene expression during development anderythroid differentiation. Exp Hematol 33:259–271.
Tibben EA, Holland RA, Tyndale-Biscoe CH (1991) Blood oxygen carriage in the marsu-pial, tammar wallaby (Macropus eugenii), at prenatal and neonatal stages. Respir Physiol84:93–104.
Tyndale-Biscoe H (2005) Life Of Marsupials. CSIRO Publishing, Collingwood.Verde C, De Rosa MC, Giordano D, et al. (2005) Structure, function and molecular adaptations of
haemoglobins of the polar cartilaginous fish Bathyraja eatonii and Raja hyperborea. BiochemJ 389:297–306.
Vilella AJ, Severin J, Ureta-Vidal A, et al. (2009) EnsemblCompara GeneTrees: complete,duplication-aware phylogenetic trees in vertebrates. Genome Res 19:327–335.
Villeponteau B, Martinson H (1981) Isolation and characterization of the complete chicken beta-globin gene region: frequent deletion of the adult beta-globin genes in lambda. Nucleic AcidsRes 9:3731–3746.
Wagner A, Deryckere F, McMorrow T, et al. (1994) Tail-to-tail orientation of the Atlantic salmonalpha- and beta-globin genes. J Mol Evol 38:28–35.
Wells RMG (1999) Evolution of haemoglobin function: Molecular adaptations to environment.Clinical and Experimental Pharmacology and Physiology, 26:591–595.
Wheeler D, Hope R, Cooper SB, et al. (2001) An orphaned mammalian beta-globin gene of ancientevolutionary origin. Proc Natl Acad Sci U S A 98:1101–1106.
Wheeler D, Hope RM, Cooper SJ, et al. (2004) Linkage of the beta-like omega-globin gene toalpha-like globin genes in an Australian marsupial supports the chromosome duplication modelfor separation of globin gene clusters. J Mol Evol 58:642–652.

Chapter 21The Olfactory Receptor Gene Familyof Marsupials
Margaret L. Delbridge, Amir Mohammadi, and Jennifer A. Marshall Graves
Abstract Olfaction in vertebrates is mediated mainly by a large family of olfac-tory receptors in the olfactory epithelium that belong to the superfamily of Gprotein-coupled receptors. Olfactory systems are well conserved among vertebrates,including marsupials, but there is a large variation in the numbers of olfactory genesin different animals. Most marsupials are nocturnal so depend on their sense of smellto locate food, avoid predators and identify potential mates in similar ways to othermammals. The olfactory bulbs are quite large in adult marsupials, suggesting thatthe sense of smell is very important in these animals. In addition, very undevelopednewborn marsupials have the special challenge of locating the pouch unassisted. It islikely that these newborns utilise their sense of smell for this unique pouch-findingtask. The olfactory system is one of the few systems that is sufficiently developedin newborn marsupials to accomplish the task of finding the pouch. The opossumOR repertoire of one marsupial, the American opossum, is one of the largest charac-terised in mammals so far, containing over 1,500 genes. Interestingly comparisonsof the opossum OR repertoire with the repertoire in an Australian marsupial, thetammar wallaby, suggests that a large conserved OR repertoire may be a feature ofmarsupials. The OR repertoires of the two marsupials show a high degree of simi-larity in total gene numbers and range of genes. This is unlike placental mammals,where the OR repertoires show a greater range. Results from these comparisons pro-vide evidence for both the major forces (adaptation and genomic drift) behind the“birth-and-death” theory for the evolution of OR genes.
Keywords Olfactory receptor genes · Marsupials · Olfaction
M.L. Delbridge (B)ARC Centre of Excellence for Kangaroo Genomics, Evolution, Ecology and Genetics, ResearchSchool of Biology, The Australian National University, Canberra, ACT 0200, Australiae-mail: [email protected]
435J.E. Deakin et al. (eds.), Marsupial Genetics and Genomics,DOI 10.1007/978-90-481-9023-2_21, C© Springer Science+Business Media B.V. 2010
436 M.L. Delbridge
21.1 Introduction
21.1.1 The Importance of Olfaction
The sense of smell is so sensitive that it can detect and discriminate thousands ofodours at very low concentration. Most animals rely on their sense of smell to findfood and water, and avoid environmental dangers such as fire and predators. Animalsuse body odours to convey information about their identity, sex, health, and repro-ductive status to other individuals, and signal their home territories to other animalsof the same and different species. Mammals also utilize their sense of smell to iden-tify individuals and the mating readiness of other animals (Knapp et al., 2006).Olfaction therefore, is one of the most important senses animals utilize to learnabout their environment.
21.1.2 Structure of the Olfactory Epithelium
Olfaction is mediated by the olfactory receptors that are located in the cilia of olfac-tory sensory neurons in the olfactory epithelium of mammals. Olfactory sensoryneurons are bipolar neurons that span the olfactory epithelium and terminate exter-nally in a number of fine cilia. Like other epithelial cells, olfactory sensory neuronshave only a very short life and are constantly being regenerated from the basal cellsof the olfactory epithelium approximately every 30 days (Moulton, 1974).
Odorant molecules become immersed in a layer of mucus, then bind to olfac-tory receptor proteins on the surface of the cilia. Binding of an odour molecule tothe olfactory receptor activates the coupled G protein inside the olfactory sensoryneuron. This event activates the conversion of ATP to the second messenger, cyclicAMP (cAMP), in the cytosol. cAMP opens up ligand-gated sodium (Na+) channels,reduces the potential across the plasma membrane, and produces an action potentialto be sent to the olfactory bulb in forebrain (reviewed by Menini et al., 2004).
21.1.3 The Organization of the Olfactory System
One of the features of the olfactory system in all animals from insects to mammalsis the specificity of the olfactory receptor cells. It is a widely held view that mostolfactory neurons express only one olfactory receptor gene, whereas all the otherolfactory receptor genes in that neuron (over 1,000 in some mammalian species)are silent. Initial mapping of receptors in the olfactory epithelium suggested thatolfactory neurons expressing a single type of receptor were distributed in one of fouranterior-posterior bands or expression “zones” in the olfactory epithelium (Vassaret al., 1993). More recently it has been shown that single types of olfactory receptorsare not confined to these four zones, but are found in multiple overlapping zonesin the olfactory epithelium. Therefore a given olfactory receptor type is generally
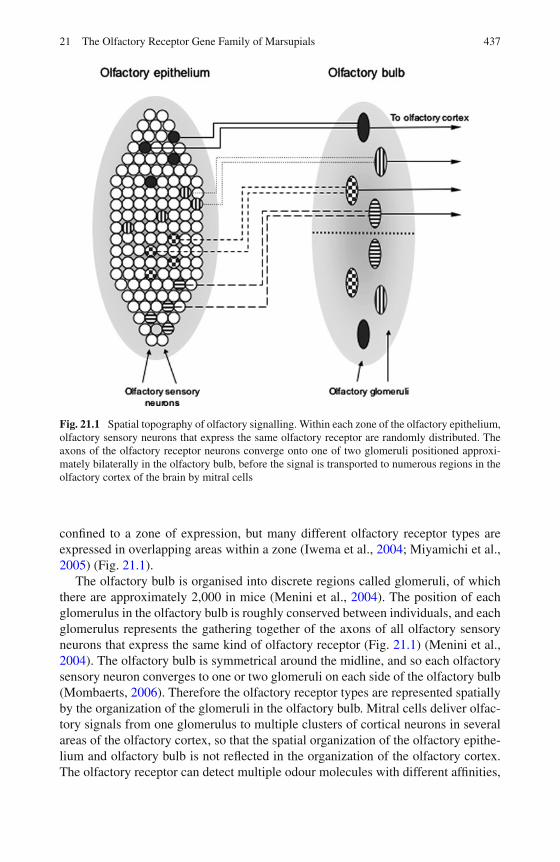
21 The Olfactory Receptor Gene Family of Marsupials 437
Fig. 21.1 Spatial topography of olfactory signalling. Within each zone of the olfactory epithelium,olfactory sensory neurons that express the same olfactory receptor are randomly distributed. Theaxons of the olfactory receptor neurons converge onto one of two glomeruli positioned approxi-mately bilaterally in the olfactory bulb, before the signal is transported to numerous regions in theolfactory cortex of the brain by mitral cells
confined to a zone of expression, but many different olfactory receptor types areexpressed in overlapping areas within a zone (Iwema et al., 2004; Miyamichi et al.,2005) (Fig. 21.1).
The olfactory bulb is organised into discrete regions called glomeruli, of whichthere are approximately 2,000 in mice (Menini et al., 2004). The position of eachglomerulus in the olfactory bulb is roughly conserved between individuals, and eachglomerulus represents the gathering together of the axons of all olfactory sensoryneurons that express the same kind of olfactory receptor (Fig. 21.1) (Menini et al.,2004). The olfactory bulb is symmetrical around the midline, and so each olfactorysensory neuron converges to one or two glomeruli on each side of the olfactory bulb(Mombaerts, 2006). Therefore the olfactory receptor types are represented spatiallyby the organization of the glomeruli in the olfactory bulb. Mitral cells deliver olfac-tory signals from one glomerulus to multiple clusters of cortical neurons in severalareas of the olfactory cortex, so that the spatial organization of the olfactory epithe-lium and olfactory bulb is not reflected in the organization of the olfactory cortex.The olfactory receptor can detect multiple odour molecules with different affinities,
438 M.L. Delbridge
and a single odour is detected by multiple olfactory receptors. The combination ofolfactory receptors reacting to a single odour and the transmission of signals frommultiple glomeruli to similar areas in the olfactory cortex results in the process-ing and recognition of complex odour signals (Malnic et al., 1999; Menini et al.,2004).
The olfactory receptor expressed by the neuron has been shown to have a rolein the specification of the neurons for particular glomeruli. Rather than a particu-lar type of olfactory receptor-containing neuron “targeting” a specific glomerulus,one model proposes that during development it is the coalescence of the axons ofolfactory sensory neurons in a self-sorting mechanism that results in the forma-tion of glomeruli. This self-sorting mechanism is perhaps mediated by interactionsbetween olfactory receptor protein fragments located within the axon growth cones.This model is not inconsistent with a mechanism that would allow constant renewalof the olfactory neurons in the olfactory epithelium. The processes by which thecomplex connections between the olfactory neurons, glomeruli and regions of theolfactory cortex are laid down during development and throughout adult life are stillnot well understood (reviewed by Mombaerts, 2006).
In addition the evidence in support of the “one receptor-one neuron” hypothesis isnot rigorously conclusive (Mombaerts, 2004), but there are only a limited number ofexceptions that have been reported (Rawson et al., 2000; Sato et al., 2007; Tian andMa, 2008). A variation on this hypothesis suggests that each neuron expresses justa few olfactory receptors, perhaps zero, one or two (Mombaerts, 2004). Neuronsthat express zero receptors would be negatively selected, neurons expressing oneor more olfactory neurons would be positively selected. Neurons that express twoor more olfactory receptors may persist only if there is no conflict between theexpressed receptors; otherwise they will be selected against. This hypothesis pro-poses that immature olfactory sensory neurons would be likely to express more thanone olfactory receptor with differing levels of expression, and that down-regulationof all other olfactory receptors would occur following coalescence of an axon intoa glomerulus. This hypothesis also proposes that an olfactory sensory neuron canswitch between the olfactory receptors that it expresses, so that it expresses dif-ferent olfactory receptors sequentially during its lifespan (reviewed in Mombaerts,2004). The choice of olfactory receptor expression in the olfactory sensory neuronsis therefore proposed to be governed by selective forces similar to those proposedfor the choice of alleles expressed by T and B lymphocytes (reviewed in Cedar andBergman, 2008).
21.2 Olfactory Receptor Genes
The olfactory epithelium of vertebrates has a well conserved structure (Stoddart,1980; Ache and Young, 2005). Olfactory receptors are a subfamily of the G protein-coupled receptor (GPCR) family. Olfactory receptors were first identified by theirexpression in the olfactory epithelium of the rat (Rattus norvegicus) (Buck and Axel,
21 The Olfactory Receptor Gene Family of Marsupials 439
1991). Like other members of the GPCR family, they are transmembrane proteins,with seven α-helical transmembrane domains composed of 20–28 hydrophobicamino acids each (Feingold et al., 1999). The third, fourth and fifth transmem-brane domains, and the third extracellular loop are the most variable regions ofthe olfactory receptor protein, and are suggested to be the regions that play a rolein binding to external odour molecules (Ngai et al., 1993; Pilpel and Lancet, 1999;Irie-Kushiyama et al., 2004). The first, second, sixth and seventh transmembranedomains, and the second intracellular loop of the olfactory receptors contain highlyconserved motifs, that are proposed to be involved in protein-membrane interac-tions, and may initiate the intracellular signaling pathways to the brain (Malnic et al.,2004).
Olfactory receptor proteins are encoded by genes of the olfactory receptor (OR)gene family. This gene family is the largest in vertebrates, having between 700 and1,500 members in different mammals, and accounting for 3–5% of all genes in thegenome (Ben-Arie et al., 1993; Glusman et al., 1996). The vertebrate OR gene fam-ily has no homology to the olfactory genes of invertebrates, despite the similarity inthe nervous pathways to the brain and similarities in the patterns of evolution of eachgene superfamily (reviewed in Sanchez-Gracia et al., 2009). Vertebrate OR genesare short, intronless sequences, approximately 1 kb in length, that are organized inclusters and are present on almost all chromosomes. There is a large variation in thenumber of OR genes and the fraction of pseudogenes identified within a family indifferent species, and up to 50% of OR genes are non-functional in some species(Table 21.1).
21.2.1 Regulation of OR Gene Expression
The expression of olfactory receptors in the olfactory epithelium is not restricted tofunctional genes. There is widespread expression of human olfactory receptor pseu-dogenes in the olfactory epithelium (Zhang et al., 2007). It has been suggested thatthis indicates that the choice of olfactory receptor to be expressed in a given neuronis largely stochastic, whereby different OR genes are expressed and the expressionis stabilised only once a functional gene is expressed (reviewed in Fuss and Ray,2009).
It has also been demonstrated that OR genes are mono-allelically expressed. Theexpression of the paternally and maternally inherited allele is random. As for themammalian X chromosome, which also undergoes random epigenetic silencing,active and inactive alleles replicate asynchronously (Singh et al., 2003). The mam-malian OR gene loci are enriched in long interspersed nuclear elements (LINEs)to a level similar to that of the LINE-rich X chromosome, and it has been sug-gested that the LINE elements at the OR loci contribute to allelic exclusion, in thesame way they are proposed to act as way-stations for spreading inactivation alongthe X chromosome (Kambere and Lane, 2009). However, unlike X inactivation orgenomic imprinting (Goldmit and Bergman, 2004) silencing of OR alleles does not
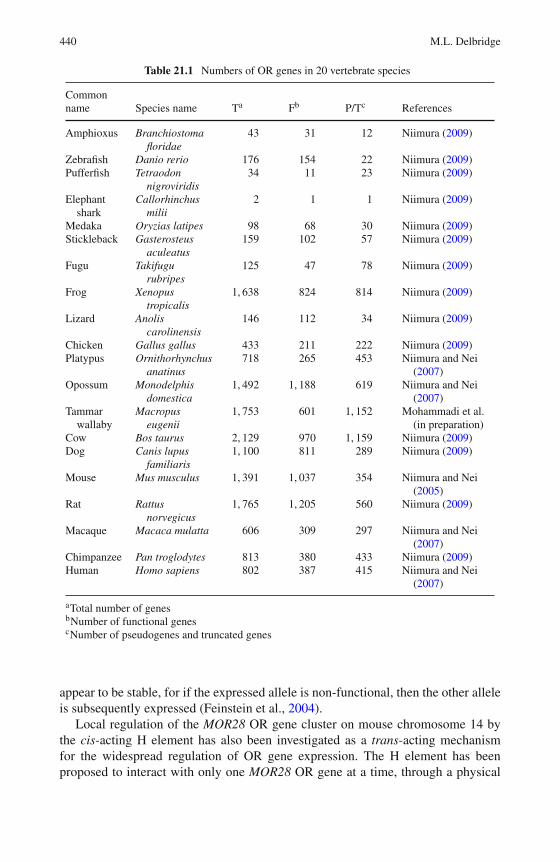
440 M.L. Delbridge
Table 21.1 Numbers of OR genes in 20 vertebrate species
Commonname Species name Ta Fb P/Tc References
Amphioxus Branchiostomafloridae
43 31 12 Niimura (2009)
Zebrafish Danio rerio 176 154 22 Niimura (2009)Pufferfish Tetraodon
nigroviridis34 11 23 Niimura (2009)
Elephantshark
Callorhinchusmilii
2 1 1 Niimura (2009)
Medaka Oryzias latipes 98 68 30 Niimura (2009)Stickleback Gasterosteus
aculeatus159 102 57 Niimura (2009)
Fugu Takifugurubripes
125 47 78 Niimura (2009)
Frog Xenopustropicalis
1, 638 824 814 Niimura (2009)
Lizard Anoliscarolinensis
146 112 34 Niimura (2009)
Chicken Gallus gallus 433 211 222 Niimura (2009)Platypus Ornithorhynchus
anatinus718 265 453 Niimura and Nei
(2007)Opossum Monodelphis
domestica1, 492 1, 188 619 Niimura and Nei
(2007)Tammar
wallabyMacropus
eugenii1, 753 601 1, 152 Mohammadi et al.
(in preparation)Cow Bos taurus 2, 129 970 1, 159 Niimura (2009)Dog Canis lupus
familiaris1, 100 811 289 Niimura (2009)
Mouse Mus musculus 1, 391 1, 037 354 Niimura and Nei(2005)
Rat Rattusnorvegicus
1, 765 1, 205 560 Niimura (2009)
Macaque Macaca mulatta 606 309 297 Niimura and Nei(2007)
Chimpanzee Pan troglodytes 813 380 433 Niimura (2009)Human Homo sapiens 802 387 415 Niimura and Nei
(2007)
aTotal number of genesbNumber of functional genescNumber of pseudogenes and truncated genes
appear to be stable, for if the expressed allele is non-functional, then the other alleleis subsequently expressed (Feinstein et al., 2004).
Local regulation of the MOR28 OR gene cluster on mouse chromosome 14 bythe cis-acting H element has also been investigated as a trans-acting mechanismfor the widespread regulation of OR gene expression. The H element has beenproposed to interact with only one MOR28 OR gene at a time, through a physical
21 The Olfactory Receptor Gene Family of Marsupials 441
association of the H element with an OR gene promoter (Serizawa et al., 2003).This association then regulates the expression of the MOR28 gene cluster. Thismechanism does not appear to be transferable as the H element on chromosome14 does not regulate any other OR genes, either on chromosome 14 outside theMOR28 cluster or other chromosomes (Fuss et al., 2007; Nishizumi et al., 2007;reviewed by Fuss and Ray, 2009).
The most likely model for the determination of which OR gene will be expressedby any particular neuron is probably stochastic. As all neurons express a functionalOR gene, there is the possibility that immature olfactory neurons switch betweenexpression of OR genes before the neuron has established a stable connection tothe brain. A negative feedback signal has been proposed to prevent continuation ofthe olfactory receptor choice process as soon as a functional olfactory receptor isexpressed. This permits a second choice if, for example, a non-functional pseudo-gene was expressed. Interestingly it also appears that the second choice of receptorfor expression is not random, but is restricted to the class of gene from which thefirst OR gene was expressed. The negative feedback of an expressed functional ORgene prevents the further expression of other OR genes and ensures that only a sin-gle gene will be expressed from each olfactory sensory neuron (Shykind et al., 2004,reviewed in Fuss and Ray, 2009).
It is not known if the cis-regulation of the MOR28 cluster by a locus controlregion (LCR) such as the H element, will be generally applicable to the regulation ofother OR gene clusters, or if this type of regulation is a consequence of the proximityof this cluster to the T-cell receptor α locus. Multiple LCRs may be present in azebrafish OR gene cluster (Nishizumi et al., 2007), but the H element is the firstLCR identified so far in mammals. It remains to be seen whether multiple LCRsand this type of cis-acting regulation also exist in other OR gene clusters. It is notyet known whether mechanisms of silencing such as methylation and/or histonemodification have a role in the regulation of olfactory receptor choice, but it may bethat modifications such as these are involved in the feedback mechanism to stabilisegene expression rather than be involved in OR gene switching (reviewed in Fuss andRay, 2009).
21.2.2 Vertebrate Olfactory Receptor Gene Families
There are four major families of GPCR genes that encode olfactory receptor pro-teins. The neurons of the olfactory epithelium in the nose express two of the genefamilies; the OR and trace amine-associated receptor (TAAR) gene families. Thevomeronasal organ is a specialised region of the nasal epithelium in mammals thatis thought to be largely responsible for the detection of pheromones, and it expressesthe other two gene families; the vomeronasal receptor type 1 and 2 (V1R and V2R)gene families. The four families of olfactory receptors are expressed in functionallydifferent types of neurons, and use different signal transduction pathways (Nei et al.,2008). The TAAR receptors share sequence similarity with the OR receptors, andalso are expressed in different zones within the olfactory epithelium, and so have
442 M.L. Delbridge
been classified as a second class of olfactory receptors (Liberles and Buck, 2006).TAARs may have a role in detecting social cues and may be a separate group ofreceptors in the nasal epithelium responsible for detecting pheromones (Stephen,2009).
Olfactory gene repertoires are characterised by species-specific and lineage-specific expansion and reduction of specific gene families. The mammalianvomeronasal organ seems to be specialised for the detection of pheromones, andanalysis of the morphology of the vomeronasal organ and the functional repertoireof the V1R and V2R gene families suggests that the function of this organ has beengreatly enhanced in the rodents. V1R genes are intronless like OR genes, but theV2R genes contain introns and their proteins have a long extracellular N-terminus(Nei et al., 2008). The mouse expresses over 150 functional V1R genes, whilst therat genome contains over 100 V1R genes. In contrast, humans have only five V1Rgenes, chimpanzees have none, and the dog and cow have only 8 and 32 V1R genesrespectively. Like the rodent V1R repertoire, the V2R repertoire also seems to beenhanced particularly in the rodents, consisting of over 100 intact genes in bothmouse and rat (Hasin-Brumshtein et al., 2009).
In fish, which have no vomeronasal organ, there is a single V1R-like gene that isexpressed in the main olfactory epithelium (Pfister and Rodriguez, 2005), but therehas been a lineage-specific expansion of V2R-like genes (Hashiguchi and Nishida,2006). This suggests that the V1R and V2R gene repertoires have undergone specificexpansions in the rodent lineage, along with the development of the vomeronasalorgan. Interestingly, the South American grey, short-tailed opossum (Monodelphisdomestica) also has well developed V1R and V2R repertoires, consistent with hav-ing a well-developed vomeronasal organ in this marsupial mammal (Grus et al.,2005; Young and Trask, 2007). Another mammal in which there has been a lineagespecific expansion of the V1R gene repertoire is the platypus. This semi-aquaticmonotreme has undergone the largest lineage-specific V1R gene expansion of anymammal so far investigated, and it also has a large V2R repertoire. In contrast, themain olfactory system of the platypus seems to be somewhat reduced. This suggeststhat the vomeronasal system is a more important sensory organ than the main olfac-tory system of the nose in the platypus, which forages underwater with the eyes,ears and nostrils closed (Grus et al., 2007).
Olfactory receptors in the main nasal epithelium are encoded by the OR genefamily that is found in all vertebrates. In eutherian mammals, the OR gene familycan contain between 700 and 1,500 genes in different species. In contrast, the ORgene family is much smaller in fish, ranging from about 40–140 genes in differ-ent fish species. The fish OR gene family is more divergent than the mammalianOR gene repertoire, suggesting that fish might be able to detect a wider range ofodorants, but that the mammalian OR repertoire might be capable of discriminatingbetween more structurally similar odorants (Niimura and Nei, 2005). It is unlikelythat the number of OR genes is directly related to the sensitivity of the sense ofsmell. Comparisons of olfactory abilities must also take into account the size ofthe olfactory epithelium, the fraction of the brain devoted to processing olfactoryinformation, and the ability to memorize the signals from new odours.
21 The Olfactory Receptor Gene Family of Marsupials 443
The OR gene family is classified into two major classes: Class I and Class II.In mammals, Class I olfactory receptors represent only 10% of the total olfac-tory receptor repertoire, whereas Class II contains approximately 90% of the totalrepertoire. Class I receptors have been proposed to be responsible for detectingwater-soluble odorants, whereas Class II receptors are thought to bind air-borneodorants. In support of this hypothesis is evidence that in goldfish, the only func-tional OR genes have homology to Class I genes, and all Class II genes arenon-functional pseudogenes (Freitag et al., 1998). In amphibians olfaction occursin two anatomically separate nasal cavities, and both Class I and Class II olfactoryreceptors are expressed. Class I OR genes are expressed in a water-filled nasal cav-ity and Class II OR genes are expressed in the air-filled nasal cavity (Freitag et al.,1995). Further evidence for the distinction between the functions of the two classesis provided by studies of the dolphin, in which a large array of Class II OR geneswere found to be nonfunctional pseudogenes. It was suggested that the Class II ORgenes were lost in these aquatic mammals when they evolved from land mammalsand lost the ability to detect air-borne odorants (Freitag et al., 1998). It is unlikelyhowever that there is a functional distinction between Class I and Class II OR genes.High numbers of functional Class I OR genes were found in the human and mousegenomes (Glusman et al., 2001; Zhang and Firestein, 2002), suggesting that ClassI OR genes are likely to respond to additional ligands in these species, as well aswater-soluble odour molecules in aquatic animals.
The blurring of the distinction between Class I and Class II OR genes hasprompted a reclassification of the OR gene family in vertebrates, although the wellestablished Class I and Class II nomenclature is still in common usage. The avail-ability of genome sequence data and its use for phylogenetic analysis of vertebrateOR gene families led to classification into nine groups (α, β, γ, δ, ε, ζ, η, θ), eachof which had a single or small number of founding genes prior to the divergence offish and tetrapods. The α and γ groups are the only groups that have been retainedby, and greatly expanded in, the tetrapods, and these two groups represent the ClassI and Class II genes respectively in mammals (Niimura and Nei, 2005; Niimura andNei, 2006; Nei et al., 2008; Niimura, 2009).
21.2.3 Ectopic Expression of OR Genes
The discovery of olfactory receptor genes was based partly on the observation thatthey were specifically expressed in the olfactory epithelium (Buck and Axel, 1991).They are also expressed in the olfactory bulb, where they are likely to play a rolein the coalescence of olfactory sensory neurons into glomeruli (Mombaerts, 2006).Several studies have shown that OR genes can be expressed in tissues other than theolfactory epithelium, which may suggest other roles for these receptors. Expressionof various OR genes has been reported in the testis and germ cells, as well as awide range of other tissues such as the tongue, erythroid cells, prostate, placenta,brain, and peripheral nervous system (see Feldmesser et al., 2006). Expression ofOR genes in the testis has been proposed to play a role in sperm chemotaxis or
444 M.L. Delbridge
olfaction-driven mate choice, whereas expression of OR genes in a wide range oftissues has been suggested to indicate a role for the OR genes in cell-cell recognition(Ziegler et al., 2002; Dreyer, 1998; Fukuda et al., 2004).
Database mining and microarray experiments (Feldmesser et al., 2006; Zhanget al., 2007) have now shown that widespread expression of OR genes in non-olfactory tissues may be a consequence of transcription from leaky promoters duringthe decondensation of chromatin that is required for transcriptional regulation.Leaky expression of genes may be evolutionarily important by generating poten-tial diversity (Rodriguez-Trelles et al., 2005; Feldmesser et al., 2006). However,microarray analysis of OR gene expression shows that ectopic patterns of expres-sion of orthologous OR genes are conserved between chimpanzee and human,suggesting that they evolved more slowly because they serve a selectable function(Branscomb et al., 2000; De la Cruz et al., 2009). This is circumstantial evidencethat at least some OR genes may have gained new functions in non-olfactorytissues.
21.2.4 Evolution of OR Genes
The OR gene family in vertebrates is characterized by lineage-specific expansionsand contractions in the numbers of OR genes, described as a “birth-and-death” pat-tern of evolution (reviewed in Nei and Rooney, 2005). This model predicts that thecomposition of a gene family may be unique in different lineages. For example,in one species, particular genes may be duplicated one or more times, resulting inexpansion of the family, whereas in another species the same genes may be lostor become pseudogenes, resulting in contraction of the family. For example, themost recent common ancestor of human and mouse is estimated to have had 754functional OR genes, but there has been a lineage-specific contraction in the ORrepertoire to 388 functional genes in humans and a lineage-specific expansion of therepertoire to 1,037 functional genes in the mouse. Of the 754 ancestral OR genes,193 and 267 genes have become new non-functional pseudogenes in human andmouse, respectively, whilst humans have lost 249 of the ancestral pseudogenes thathave been proposed to be part of the OR repertoire of their most recent commonancestor with mice (Nei and Rooney, 2005).
Class I and Class II OR genes are further subdivided based on protein sequencesimilarity. OR gene families encode proteins with more than 40% protein similarity,and OR gene subfamilies encode proteins with more than 60% protein similarity.Currently there are 18 gene families and 300 subfamilies that have been char-acterised in humans (Olender et al., 2008), but the publication of whole genomesequences has made it possible to characterise OR gene families bioinformaticallyin a number of vertebrate species. This has shown that there are large numbersof OR genes that vary widely between different species. Another hallmark of theOR gene families in vertebrates is that in addition to functional gene members,they all contain significant numbers of disrupted genes, the numbers of which also
21 The Olfactory Receptor Gene Family of Marsupials 445
vary widely between species. The disrupted genes have interruptions to their codingregion, suggesting that they are non-functional pseudogenes.
Another feature of the OR gene family is that the genes are located in a number ofclusters on nearly all chromosomes in the genome. Fish have one of the smallest ORrepertoires, and it has been proposed that one of the major events in the evolutionof the OR gene families was the adaptation of the olfactory system to a non-aquaticenvironment (Glusman et al., 2001). Early duplications in the land mammals gaverise to the major families of Class II OR genes found in all mammals. Subsequentlythere have been local expansions of different OR families and subfamilies to formlarge gene clusters (Glusman et al., 2001). This pattern of duplication means that ORgenes are found at many chromosomal locations, and related OR genes are oftenpresent in the same clusters (Sullivan et al., 1996; Rouquier et al., 1998; Zhangand Firestein, 2002), many of which are conserved across species (Aloni et al.,2006).
Segmental duplications between chromosomes have also contributed to the widedistribution of OR gene clusters, resulting in the location of members of differentsubfamilies on different chromosomes. Other mechanisms that are likely to havecontributed to the evolution of this gene family are tandem duplication, which hasgenerated long tandem arrays of closely related genes, gene conversion and recom-bination which may allow conversion of non-functional to functional genes or viceversa, and retrotransposition (reviewed in Kambere and Lane, 2007). Some ORgene clusters are broken up by many interspersed non-OR genes (Olender et al.,2008), whereas other clusters contain OR genes exclusively (Glusman et al., 2001;Lane et al., 2002). The presence of related OR genes in single clusters suggeststhat different clusters may largely represent different subfamilies of OR genes andtherefore might be responsible for detecting different types of odorant molecules. Itmay be that gene clusters are preserved so that all the genes within a cluster can betranscriptionally regulated by common control elements (Krumlauf, 1992).
Variation in the total numbers of functional and non-functional OR genes in therepertoires of different animals has been suggested to reflect an adaptive responseto the environment. It has been suggested that there have been three major events inthe evolution of the vertebrate olfactory system; first, the expansion of the olfactorysystem as a response to the adaptation to a terrestrial environment, secondly, thereduction in the olfactory system in the primate lineage along with the developmentof trichromatic vision, and thirdly the development of the pheromone system inthe rodent lineage (Kambere and Lane, 2007; Olender et al., 2008). This theory ofadaptive evolution is supported by the relatively few genes in the OR repertoire of allfish species (approximately 100 OR genes) compared to a 8–10 times larger numberof genes in the OR repertoires of terrestrial mammals (between approximately 800and 1,500), suggesting an expansion of the OR repertoire has occurred during theadaptation of vertebrates to a terrestrial existence (Niimura and Nei, 2006; Saraivaand Korsching, 2007; Nei et al., 2008). In addition, there are many fewer OR genesin aquatic mammals (dolphins, whales), consistent with loss of OR genes followingthe readaptation of these mammalian species to the water (Freitag et al., 1998). Thisdoes not explain, though, why a smaller number of fish OR genes can detect the
446 M.L. Delbridge
same range of odorants as the larger mammalian OR repertoire (Niimura and Nei,2005).
In primates, lower numbers of functional OR genes and higher numbers of pseu-dogenes seems to have resulted from increased pseudogenisation of OR genes. Thismay have occurred when the olfactory system became relatively less important withthe increasing reliance of primates on the development of trichromatic colour vision,or the development of higher brain mechanisms such as memory. However, thisdoes not explain why cattle with dichromatic colour vision have a high proportionof pseudogenisation in their OR repertoires, or why the numbers of functional ORgenes varies so much among terrestrial mammals (Nei et al., 2008).
Diversity of the OR repertoire in different animals was clearly generated by geneduplication and deletion events, then adaptation of species to different environ-mental niches with different requirements for olfaction. Such gene duplication anddeletion events occur more or less randomly, so genomic drift may play an impor-tant role in the generation of diverse OR gene repertoires, and may wholly accountfor instances in which species-specific expansions and contractions are difficult toexplain by adaptation (Nei et al., 2008). Random gene duplication can increase thenumber of genes which are then fixed by positive selection or chance (Nei et al.,2008).
If genetic drift has a significant effect on the OR gene repertoire of mammals,it would be expected that copy number variation should exist among individuals ofthe same species. Indeed, up to 30% of functional genes in the human and mouseOR repertoires are polymorphic for copy number (Young et al., 2008; Nozawa et al.,2007). There is also a high degree of allelic variation in human and mouse OR genes,which may account for the variation observed in sensitivity to odours observedbetween different individuals. Selection for a diverse repertoire can explain whythe exceptionally large numbers of functional OR genes and pseudogenes are tol-erated in vertebrate genomes. Gene conversion between different functional andnon-functional OR copies could rapidly generate new functional genes (reviewed inKeller and Vosshall, 2008; Hasin-Brumshtein et al., 2009).
The size of OR gene families, as well as the proportions of intact OR genes andpseudogenes, varies widely among vertebrate species (Table 21.1). Different subsetsof pseudogenes are found even between different human populations, or differentdog breeds (Tacher et al., 2005; Rouquier and Giorgi, 2007), implying very rapidevolution.
21.3 The Olfactory System in Marsupials
Most marsupials are nocturnal, and forage alone or in small groups at night,although some marsupials, such as the kangaroos, may continue to forage at eitherend of the day. During the night therefore, the auditory and olfactory senses aremore important than vision for these animals. The relative importance of the senseof smell for the marsupials is confirmed by the observation that all marsupials have
21 The Olfactory Receptor Gene Family of Marsupials 447
a relatively large olfactory bulb. Like most other vertebrates, marsupials use theirsense of smell to find food, avoid predators, and to identify animals and marked ter-ritories of their own and other species. This is particularly important for species thatlive a solitary existence and meet only to mate (reviewed by Croft and Eisenberg,2006).
A unique feature of marsupial reproduction is the birth of the young at a veryearly developmental stage. The tiny newborn marsupial young manages to moveunaided from the urogenital opening to the pouch some distance away, where itattaches to a teat (reviewed in Pask and Renfree, Chapter 14 ). At birth, the eyesand ears of the pouch young are very undeveloped, but the olfactory system is rela-tively well developed, suggesting that both gravity and the sense of smell guide thenewborn marsupials to the pouch (Gemmell and Rose, 1989; Hughes et al., 1989).
21.4 Olfactory Apparatus of Marsupials
Exactly which signals guide the newborn marsupial to the pouch is still unclear, andthe relative importance of different stimuli may be different for different marsupialspecies. At birth, the olfactory epithelium of a number of marsupials, including thebrush-tailed possum (Trichosurus vulpecula), rat-kangaroo (Potorous tridactylus)and quoll (Dasyurus hallucatus), is well developed. Olfactory receptor neurons withcilia are observed in the olfactory epithelium of the newborn possum, and may becapable of responding to odours. However, the apparent maturity of the olfactoryepithelium contrasts with the morphological immaturity of the olfactory bulb inthese species (Gemmell and Rose, 1989; Gemmell and Nelson, 2004). Indeed inboth the opossum (M. domestica) and the tammar wallaby (Macropus eugenii), theolfactory bulb appears to be relatively undeveloped at birth, and there is no evidencefor the presence of glomeruli (Ashwell et al., 2008; Schneider et al., 2009) untilapproximately 15 days after birth in the opossum and 25 days after birth in thetammar wallaby. It is not until approximately 54 days after birth that the olfactorybulb seems to be fully developed in the tammar wallaby (Ashwell et al., 2008). Inthe tammar wallaby, the vomeronasal organ, which is responsible for the detectionof pheromones, is very immature in appearance at birth and does not have neuronsextending to the olfactory bulb until day 5 after birth (Ashwell et al., 2008).
The olfactory system of most marsupials undergoes further development anddifferentiation during the first 25–40 days of pouch life. Although the olfactoryepithelium of marsupials appears to be functional at birth, it has been suggestedthat the olfactory bulb and signaling pathway to the brain is too immature at birth toallow the newborn to detect odour and use this sense to locate the pouch (Gemmelland Rose, 1989; Ashwell et al., 2008). However, behavioural studies have shownthat newborn tammar wallabies are attracted toward the smell of the mother’s pouch,indicating that these newborns have a functional olfactory system (Schneider et al.,2009). This suggests that although the olfactory system is not fully developed atbirth, it may be sufficiently developed to contribute to finding the pouch.
448 M.L. Delbridge
21.5 Marsupial OR Repertoire
The koala (Phascolarctos cinereus) was the first marsupial from which OR geneswere isolated (Glusman et al., 2000). Twenty-five OR genes were identified, all ofwhich belonged to the class II OR genes, and five of which were pseudogenes. Fromthese limited numbers, it was estimated that marsupials must have a very small ORrepertoire of up to 50 genes (Glusman et al., 2000).
The availability of genome sequence of the opossum (M. domestica) providedthe first opportunity to isolate almost the whole OR repertoire from a marsupial.Surveying the first genome assembly of the opossum resulted in the detection of1,518 OR genes, more than 60% of which are functional (Aloni et al., 2006).Somewhat different estimates have since been reported for the opossum OR generepertoire, ranging from 1,492 genes of which 80% are functional (Niimura andNei, 2007), to 1,548 genes of which 77% are functional (Kishida, 2008). Howeverthese differences are small and mostly attributable to different methodologies and/ordifferent versions of the assembled genome being used.
The availability of genome data from the opossum and the platypus enables amore complete account of the evolution of OR gene repertoire. Examination of theOR repertoires of several mammalian species reveals several major duplications dur-ing vertebrate evolution that led to differences in the total number of OR genes indifferent lineages. In the monotremes, as well as amphibians, birds and fish, thereare fewer than 1,000 OR genes, suggesting that the OR repertoire was relativelysmall prior to the mammalian radiation. The large OR repertoire in the opossumimplies that there was a sudden burst of OR gene duplication and diversificationbetween the divergence of the monotremes from Theria (marsupials and eutheri-ans), and the divergence of marsupials from eutherians. During this short period(between 166 and 148 million years ago, Bininda-Emonds et al., 2007), there wasa gain of approximately 350 genes to increase the total number of OR genes in themost recent common ancestor of the therian mammals from 152 to 492. A further350 genes were gained in the eutherian lineage between 145 and 105 million yearsago, between the divergence of the marsupials from the Eutheria and prior to theradiation of eutherian mammals. There was a remarkable gain of approximately750 genes in the marsupial lineage, and further significant increases (up to 1,500)in the number of genes then occurred in the OR repertoires of the rodent lineages,whilst significant decreases (down to about 300) in the number of genes occurred inthe primate lineage (Niimura and Nei, 2007) (Fig. 21.2).
Most of the expansion in the marsupial lineage can be accounted for by expan-sion in a small number (four or five) of gene lineages. The majority (80–90%)of the mammalian OR repertoire is made up of Class II OR genes, leaving only10–20% represented by the Class I OR genes. Niimura and Nei (2007) dividedthe Class II genes into 34 subgroups by constructing phylogenetic trees, so thateach clade contained genes that had the greatest sequence similarity both withinand between species. They found that the representation of the Class II sub-groups can be quite different between species (Niimura and Nei, 2007). SomeClass II subgroups appeared to be quite stable throughout mammalian evolution,
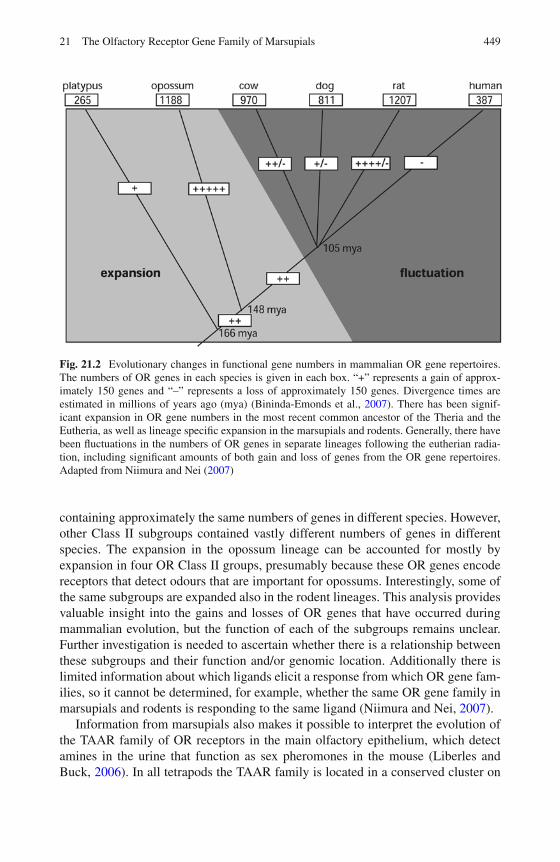
21 The Olfactory Receptor Gene Family of Marsupials 449
Fig. 21.2 Evolutionary changes in functional gene numbers in mammalian OR gene repertoires.The numbers of OR genes in each species is given in each box. “+” represents a gain of approx-imately 150 genes and “–” represents a loss of approximately 150 genes. Divergence times areestimated in millions of years ago (mya) (Bininda-Emonds et al., 2007). There has been signif-icant expansion in OR gene numbers in the most recent common ancestor of the Theria and theEutheria, as well as lineage specific expansion in the marsupials and rodents. Generally, there havebeen fluctuations in the numbers of OR genes in separate lineages following the eutherian radia-tion, including significant amounts of both gain and loss of genes from the OR gene repertoires.Adapted from Niimura and Nei (2007)
containing approximately the same numbers of genes in different species. However,other Class II subgroups contained vastly different numbers of genes in differentspecies. The expansion in the opossum lineage can be accounted for mostly byexpansion in four OR Class II groups, presumably because these OR genes encodereceptors that detect odours that are important for opossums. Interestingly, some ofthe same subgroups are expanded also in the rodent lineages. This analysis providesvaluable insight into the gains and losses of OR genes that have occurred duringmammalian evolution, but the function of each of the subgroups remains unclear.Further investigation is needed to ascertain whether there is a relationship betweenthese subgroups and their function and/or genomic location. Additionally there islimited information about which ligands elicit a response from which OR gene fam-ilies, so it cannot be determined, for example, whether the same OR gene family inmarsupials and rodents is responding to the same ligand (Niimura and Nei, 2007).
Information from marsupials also makes it possible to interpret the evolution ofthe TAAR family of OR receptors in the main olfactory epithelium, which detectamines in the urine that function as sex pheromones in the mouse (Liberles andBuck, 2006). In all tetrapods the TAAR family is located in a conserved cluster on
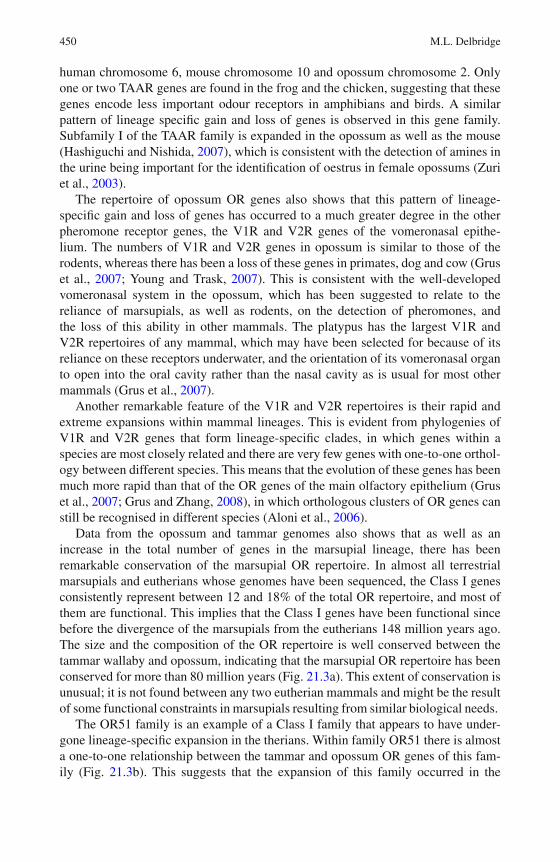
450 M.L. Delbridge
human chromosome 6, mouse chromosome 10 and opossum chromosome 2. Onlyone or two TAAR genes are found in the frog and the chicken, suggesting that thesegenes encode less important odour receptors in amphibians and birds. A similarpattern of lineage specific gain and loss of genes is observed in this gene family.Subfamily I of the TAAR family is expanded in the opossum as well as the mouse(Hashiguchi and Nishida, 2007), which is consistent with the detection of amines inthe urine being important for the identification of oestrus in female opossums (Zuriet al., 2003).
The repertoire of opossum OR genes also shows that this pattern of lineage-specific gain and loss of genes has occurred to a much greater degree in the otherpheromone receptor genes, the V1R and V2R genes of the vomeronasal epithe-lium. The numbers of V1R and V2R genes in opossum is similar to those of therodents, whereas there has been a loss of these genes in primates, dog and cow (Gruset al., 2007; Young and Trask, 2007). This is consistent with the well-developedvomeronasal system in the opossum, which has been suggested to relate to thereliance of marsupials, as well as rodents, on the detection of pheromones, andthe loss of this ability in other mammals. The platypus has the largest V1R andV2R repertoires of any mammal, which may have been selected for because of itsreliance on these receptors underwater, and the orientation of its vomeronasal organto open into the oral cavity rather than the nasal cavity as is usual for most othermammals (Grus et al., 2007).
Another remarkable feature of the V1R and V2R repertoires is their rapid andextreme expansions within mammal lineages. This is evident from phylogenies ofV1R and V2R genes that form lineage-specific clades, in which genes within aspecies are most closely related and there are very few genes with one-to-one orthol-ogy between different species. This means that the evolution of these genes has beenmuch more rapid than that of the OR genes of the main olfactory epithelium (Gruset al., 2007; Grus and Zhang, 2008), in which orthologous clusters of OR genes canstill be recognised in different species (Aloni et al., 2006).
Data from the opossum and tammar genomes also shows that as well as anincrease in the total number of genes in the marsupial lineage, there has beenremarkable conservation of the marsupial OR repertoire. In almost all terrestrialmarsupials and eutherians whose genomes have been sequenced, the Class I genesconsistently represent between 12 and 18% of the total OR repertoire, and most ofthem are functional. This implies that the Class I genes have been functional sincebefore the divergence of the marsupials from the eutherians 148 million years ago.The size and the composition of the OR repertoire is well conserved between thetammar wallaby and opossum, indicating that the marsupial OR repertoire has beenconserved for more than 80 million years (Fig. 21.3a). This extent of conservation isunusual; it is not found between any two eutherian mammals and might be the resultof some functional constraints in marsupials resulting from similar biological needs.
The OR51 family is an example of a Class I family that appears to have under-gone lineage-specific expansion in the therians. Within family OR51 there is almosta one-to-one relationship between the tammar and opossum OR genes of this fam-ily (Fig. 21.3b). This suggests that the expansion of this family occurred in the
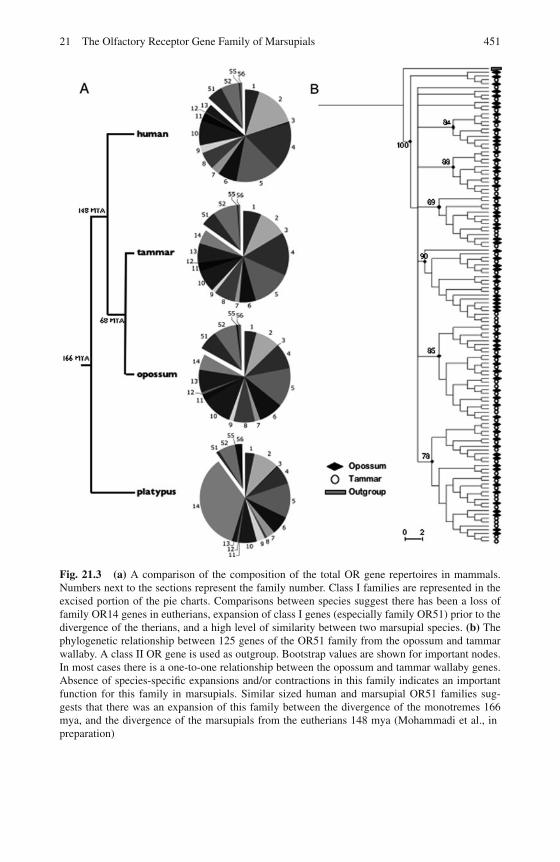
21 The Olfactory Receptor Gene Family of Marsupials 451
Fig. 21.3 (a) A comparison of the composition of the total OR gene repertoires in mammals.Numbers next to the sections represent the family number. Class I families are represented in theexcised portion of the pie charts. Comparisons between species suggest there has been a loss offamily OR14 genes in eutherians, expansion of class I genes (especially family OR51) prior to thedivergence of the therians, and a high level of similarity between two marsupial species. (b) Thephylogenetic relationship between 125 genes of the OR51 family from the opossum and tammarwallaby. A class II OR gene is used as outgroup. Bootstrap values are shown for important nodes.In most cases there is a one-to-one relationship between the opossum and tammar wallaby genes.Absence of species-specific expansions and/or contractions in this family indicates an importantfunction for this family in marsupials. Similar sized human and marsupial OR51 families sug-gests that there was an expansion of this family between the divergence of the monotremes 166mya, and the divergence of the marsupials from the eutherians 148 mya (Mohammadi et al., inpreparation)
452 M.L. Delbridge
marsupial lineage prior to the divergence of these two marsupials approximately80 million years ago (Mohammadi et al., in preparation). Similar numbers of OR51genes are found in human and marsupials, whereas low numbers of family OR51 arefound in platypus, suggesting that the expansion of the family occurred in the the-rian lineage following its divergence from the monotremes, between 148 and 166million years ago. Comparisons with an outgroup, such as the counterpart of theOR51 family in another vertebrate, would be necessary to confirm the expansion ofthis lineage in therians. The analysis of therian Class I OR genes such as this maybe an opportunity to examine the role of olfactory receptors in detecting airbornemolecules and/or gaining new functions in land-living mammals.
Data from the opossum and tammar genomes also shows that as well as anincrease in the total number of genes, the diversity of the OR genes has increasedsince the divergence of Theria from the monotremes. There are only 130 subfamiliesin the platypus genome, compared to 240 OR gene subfamilies in the opossum and286 in the tammar wallaby. These duplications have affected mostly the gene fami-lies OR8, OR11, OR13 and OR51, which have expanded up to 20 times compared totheir counterparts in platypus. Further analysis including a vertebrate outgroup willconfirm whether these expansions are specific to therians, or whether the contrastbetween platypus and therian OR family sizes are the result of lineage specific lossof genes in the platypus (Mohammadi et al., in preparation).
In contrast, the Class II OR14 gene family may have undergone a significantloss of genes during therian evolution; the platypus genome contains more than 250members of the OR14 gene family, but only one third of them have been retained inmarsupials, and this family has been completely lost from the eutherian genome.As all the OR14 genes of platypus belong to only six subfamilies, this impliescoincidental tandem duplications of a few ancestral genes. Further analysis usinga vertebrate outgroup will confirm whether this is the case, or if there has been anexpansion of these Class II genes in platypus (Mohammadi et al., in preparation)(Fig. 21.3a).
21.6 Conclusion
The sense of smell is an important means by which vertebrates receive informa-tion from the environment and communicate with each other. The olfactory systemresponds to airborne odour molecules and pheromones. One important area ofresearch in this field examines how the connections between the olfactory epithe-lium, olfactory bulb and olfactory cortex of the brain are established and regulated.Olfactory neurons contain positional information within in the epithelial layer, theyexpress one or a few olfactory receptors, and their axons can coalesce with otherneurons of the same type to form glomeruli in the olfactory bulb. Genomic imprint-ing mechanisms may play a role in the regulation of olfactory gene expressioninfluencing the construction of the olfactory system as well as detection of odourmolecules, so the investigation of epigenetic regulation in marsupials is likely to
21 The Olfactory Receptor Gene Family of Marsupials 453
provide valuable insight into the regulation of olfactory genes as it has other genesystems in mammals (reviewed in Hore et al., Chapter 12). Marsupials are idealorganisms in which to study the development of the olfactory connections throughthe olfactory bulb to the olfactory cortex, as they are born at an undeveloped stageand a significant proportion of the complexity of olfactory bulb development takesplace in the pouch.
The marsupial genome harbours one of the largest mammalian OR repertoires,containing up to 1,500 olfactory receptor genes, that respond in combinatorial codesto odour molecules to allow marsupials to process and recognise an almost unlim-ited range of odours. Comparisons between the repertoires of different animals hassuggested that different families and subfamilies of OR genes have been expanded inresponse to the adaptation of animals to different environments. In marsupials therehas been expansion of both the OR repertoire of the main olfactory epithelium andthe V1R and V2R repertoires of the vomeronasal organ, similar to that observed inrodents. This suggests that the sense of smell and detection of pheromone signals areat least as important to marsupials as they are to rodents, perhaps due to marsupialsnocturnal habits and unique reproductive biology. These unique evolutionary adap-tations of the marsupials make the characterisation of the marsupial OR repertoireessential to any comprehensive study of the olfactory system.
References
Ache BW, Young JM (2005) Olfaction: diverse species, conserved principles. Neuron 48: 417–430.Aloni R, Olender T, Lancet D (2006) Ancient genomic architecture for mammalian olfactory
receptor clusters. Genome Biol 7:R88.Ashwell KWS, Marotte LR, Cheng G (2008) Development of the olfactory system in a wallaby
(Macropus eugenii). Brain Behav Evol 71:216–230.Ben-Arie N, Khen M, Lancet D (1993) Glutathione S-transferases in rat olfactory epithe-
lium: purification, molecular properties and odorant biotransformation. Biochem J 292:379–384.
Bininda-Emonds OR, Cardillo M, Jones KE, et al. (2007) The delayed rise of present-daymammals. Nature 446:507–512.
Branscomb A, Seger J, White RL (2000) Evolution of odorant receptors expressed in mammaliantestes. Genetics 156:785–797.
Buck L, Axel R (1991) A novel multigene family may encode odorant receptors: a molecular basisfor odor recognition. Cell 65:175–187.
Cedar H, Bergman Y (2008) Choreography of Ig allelic exclusion. Curr Opin Immunol 20:308–317.
Croft DB, Eisenberg JF (2006) Behaviour. In: Armati PJ, Dickman CR, Hume ID (eds) Marsupials.Cambridge University Press, Cambridge.
De la Cruz O, Blekhman R, Zhang XH, et al. (2009) A signature of evolutionary constraint on asubset of ectopically expressed olfactory receptor genes. Mol Biol Evol 26:491–494.
Dreyer WJ (1998) The area code hypothesis revisited: olfactory receptors and other related trans-membrane receptors may function as the last digits in a cell surface code for assemblingembryos. Proc Natl Acad Sci USA 95:9072–9077.
Feingold EA, Penny LA, Nienhuis AW, Forget BG (1999) An olfactory receptor gene is locatedin the extended human beta-globin gene cluster and is expressed in erythroid cells. Genomics61:15–23.
454 M.L. Delbridge
Feinstein P, Bozza T, Rodriguez I, Vassalli A, Mombaerts P (2004) Axon guidance of mouseolfactory sensory neurons by odorant receptors and the beta2 adrenergic receptor. Cell117:833–846.
Feldmesser E, Olender T, Khen M, et al. (2006) Widespread ectopic expression of olfactoryreceptor genes. BMC Genomics 7:121.
Freitag J, Krieger J, Strotmann J, Breer H (1995) Two classes of olfactory receptors in Xenopuslaevis. Neuron 15:1383–1392.
Freitag J, Ludwig G, Andreini I, Rossler P, Breer H (1998) Olfactory receptors in aquatic andterrestrial vertebrates. J Comp Physiol A 183:635–650.
Fukuda N, Yomogida K, Okabe M, Touhara K (2004) Functional characterization of a mousetesticular olfactory receptor and its role in chemosensing and in regulation of sperm motility. JCell Sci 117:5835–5845.
Fuss SH, Omura M, Mombaerts P (2007) Local and cis effects of the H element on expression ofodorant receptor genes in mouse. Cell 130:373–384.
Fuss SH, Ray A (2009) Mechanisms of odorant receptor gene choice in Drosophila and vertebrates.Mol Cell Neurosci 41:101–112.
Gemmell RT, Nelson J (2004) The birth and subsequent development of the common brushtailpossum Trichosurus vulpecula. In: Goldingay RL, Jackson SM (eds) The Biology of AustralianPossums and Gliders. Surrey Beatty & Sons, Chipping Norton.
Gemmell RT, Rose RW (1989) The senses involved in movement of some newborn Macropodidaeand other marsupials from cloaca to pouch. In Grigg G, Jarman P, Hume I (eds) Kangaroos,Wallabies and Rat-Kangaroos. Surrey Beatty & Sons, Chipping Norton.
Glusman G, Bahar A, Sharon D, et al. (2000) The olfactory receptor gene superfamily: data mining,classification, and nomenclature. Mamm Genome 11:1016–1023.
Glusman G, Clifton S, Roe B, Lancet D (1996) Sequence analysis in the olfactory receptorgene cluster on human chromosome 17: recombinatorial events affecting receptor diversity.Genomics 37:147–160.
Glusman G, Yanai I, Rubin I, Lancet D (2001) The complete human olfactory subgenome. GenomeRes 11:685–702.
Goldmit M, Bergman Y (2004) Monoallelic gene expression: a repertoire of recurrent themes.Immunol Rev 200:197–214.
Grus WE, Shi P, Zhang J (2007) Largest vertebrate vomeronasal type 1 receptor gene repertoire inthe semiaquatic platypus. Mol Biol Evol 24:2153–2157.
Grus WE, Shi P, Zhang YP, Zhang J (2005) Dramatic variation of the vomeronasal pheromonereceptor gene repertoire among five orders of placental and marsupial mammals. Proc NatlAcad Sci USA 102:5767–5772.
Grus WE, Zhang J (2008) Distinct evolutionary patterns between chemoreceptors of 2 vertebrateolfactory systems and the differential tuning hypothesis. Mol Biol Evol 25:1593–1601.
Hashiguchi Y, Nishida M (2006) Evolution and origin of vomeronasal-type odorant receptor generepertoire in fishes. BMC Evol Biol 6:76.
Hashiguchi Y, Nishida M (2007) Evolution of trace amine associated receptor (TAAR) gene familyin vertebrates: lineage-specific expansions and degradations of a second class of vertebratechemosensory receptors expressed in the olfactory epithelium. Mol Biol Evol 24:2099–2107.
Hasin-Brumshtein Y, Lancet D, Olender T (2009) Human olfaction: from genomic variation tophenotypic diversity. Trends Genet 25:178–184.
Hughes RL, Hall LS, Tyndale-Biscoe CH, Hinds LA (1989) Evolutionary implication ofmacropodid organogenesis. In Grigg G, Jarman P, Hume I (eds) Kangaroos, Wallabies andRat-Kangaroos. Surrey Beatty & Sons, Chipping Norton.
Irie-Kushiyama S, Asano-Miyoshi M, Suda T, Abe K, Emori Y (2004) Identification of 24 genesand two pseudogenes coding for olfactory receptors in Japanese loach, classified into four sub-families: a putative evolutionary process for fish olfactory receptor genes by comprehensivephylogenetic analysis. Gene 328:203–204.
21 The Olfactory Receptor Gene Family of Marsupials 455
Iwema CL, Fang H, Kurtz DB, Youngentob SL, Schwob JE (2004) Odorant receptor expressionpatterns are restored in lesion-recovered rat olfactory epithelium. J Neurosci 24:356–369.
Kambere MB, Lane RP (2007) Co-regulation of a large and rapidly evolving repertoire of odorantreceptor genes. BMC Neurosci 8(Suppl 3):S2.
Kambere MB, Lane RP (2009) Exceptional LINE density at V1R loci: the Lyon repeat hypothesisrevisited on autosomes. J Mol Evol 68:145–159.
Keller A, Vosshall LB (2008) Better smelling through genetics: mammalian odor perception. CurrOpin Neurobiol 18:364–369.
Kishida T (2008) Pattern of the divergence of olfactory receptor genes during tetrapod evolution.PLoS One 3:e2385.
Knapp LA, Robson J, Waterhouse JS (2006) Olfactory signals and the MHC: a review and a casestudy in Lemur catta. Am J Primatol 68:568–584.
Krumlauf R (1992) Evolution of the vertebrate Hox homeobox genes. Bioessays 14:245–252.Lane RP, Roach JC, Lee IY, et al. (2002) Genomic analysis of the olfactory receptor region of the
mouse and human T-cell receptor alpha/delta loci. Genome Res 12:81–87.Liberles SD, Buck LB (2006) A second class of chemosensory receptors in the olfactory
epithelium. Nature 442:645–650.Malnic B, Godfrey PA, Buck LB (2004) The human olfactory receptor gene family. Proc Natl Acad
Sci USA 101:2584–2589.Malnic B, Hirono J, Sato T, Buck LB (1999) Combinatorial receptor codes for odours. Cell 96:
713–723.Menini A, Lagostena L, Boccaccio A (2004) Olfaction: from odorant molecules to the olfactory
cortex. News Physiol Sci 19:101–104.Miyamichi K, Serizawa S, Kimura H M, Sakano H (2005) Continuous and overlapping expression
domains of odorant receptor genes in the olfactory epithelium determine the dorsal/ventralpositioning of glomeruli in the olfactory bulb. J Neurosci 25:3586–3592.
Mombaerts P (2004) Odorant receptor gene choice in olfactory sensory neurons: the one receptor-one neuron hypothesis revisited. Curr Opin Neurobiol 14:31–36.
Mombaerts P (2006) Axonal wiring in the mouse olfactory system. Annu Rev Cell Dev Biol22:713–737.
Moulton DG (1974) Dynamics of cell populations in the olfactory epithelium. Ann NY Acad Sci237:52–61.
Nei M, Niimura Y, Nozawa M (2008) The evolution of animal chemosensory receptor generepertoires: roles of chance and necessity. Nat Rev Genet 9:951–963.
Nei M, Rooney AP (2005) Concerted and birth-and-death evolution of multigene families. AnnuRev Genet 39:121–152.
Ngai J, Chess A, Dowling MM, et al. (1993) Coding of olfactory information: topography ofodorant receptor expression in the catfish olfactory epithelium. Cell 72:667–680.
Niimura Y (2009) On the origin and evolution of vertebrate olfactory receptor genes: comparativegenome analysis among 23 chordate species. Genome Biol Evol 2009:34–44.
Niimura Y, Nei M (2005) Evolutionary dynamics of olfactory receptor genes in fishes andtetrapods. Proc Natl Acad Sci USA 102:6039–6044.
Niimura Y, Nei M (2006) Evolutionary dynamics of olfactory and other chemosensory receptorgenes in vertebrates. J Hum Genet 51:505–517.
Niimura Y, Nei M (2007) Extensive gains and losses of olfactory receptor genes in Mammalianevolution. PLoS One 2:e708.
Nishizumi H, Kumasaka K, Inoue N, Nakashima A, Sakano H (2007) Deletion of the core-Hregion in mice abolishes the expression of three proximal odorant receptor genes in cis. ProcNatl Acad Sci USA 104:20067–20072.
Nozawa M, Kawahara Y, Nei M (2007) Genomic drift and copy number variation of sensoryreceptor genes in humans. Proc Natl Acad Sci USA 104:20421–20426.
Olender T, Lancet D, Nebert DW (2008) Update on the olfactory receptor (OR) gene superfamily.Hum Genomics 3:87–97.
456 M.L. Delbridge
Pfister P, Rodriguez I (2005) Olfactory expression of a single and highly variable V1R pheromonereceptor-like gene in fish species. Proc Natl Acad Sci USA 102:5489–5494.
Pilpel Y, Lancet D (1999) The variable and conserved interfaces of modeled olfactory receptorproteins. Protein Sci 8:969–977.
Rawson NE, Eberwine J, Dotson R, et al. (2000) Expression of mRNAs encoding for two differentolfactory receptors in a subset of olfactory receptor neurons. J Neurochem 75:185–195.
Rodriguez-Trelles F, Tarrio R, Ayala FJ (2005) Is ectopic expression caused by deregulatorymutations or due to gene-regulation leaks with evolutionary potential? Bioessays 27:592–601.
Rouquier S, Giorgi D (2007) Olfactory receptor gene repertoires in mammals. Mutat Res 616:95–102.
Rouquier S, Taviaux S, Trask BJ, et al. (1998) Distribution of olfactory receptor genes in the humangenome. Nat Genet 18:243–250.
Sanchez-Gracia A, Vieira FG, Rozas J (2009) Molecular evolution of the major chemosensorygene families in insects. Heredity 103:208–216.
Saraiva LR, Korsching SI (2007) A novel olfactory receptor gene family in teleost fish. GenomeRes 17:1448–1457.
Sato Y, Miyasaka N, Yoshihara Y (2007) Hierarchical regulation of odorant receptor genechoice and subsequent axonal projection of olfactory sensory neurons in zebrafish. J Neurosci27:1606–1615.
Schneider N, Fletcher T, Shaw G, Renfree MB (2009) The olfactory system of the tammar wal-laby is developed at birth and directs the neonate to its mother’s pouch odours. Reproduction138:849–857.
Serizawa S, Miyamichi K, Nakatani H, et al. (2003) Negative feedback regulation ensures the onereceptor-one olfactory neuron rule in mouse. Science 302:2088–2094.
Shykind BM, Rohani SC, O’Donnell S, et al. (2004) Gene switching and the stability of odorantreceptor gene choice. Cell 117:801–815.
Singh N, Ebrahimi FA, Gimelbrant AA, et al. (2003) Coordination of the random asynchronousreplication of autosomal loci. Nat Genet 33:339–341.
Stephen DL (2009) Trace amine-associated receptors are olfactory receptors in vertebrates. AnnNY Acad Sci 1170:168–172.
Stoddart DM (1980) The Ecology of Vertebrate Olfaction. Chapman and Hall, London andNew York.
Sullivan SL, Adamson MC, Ressler KJ, Kozak CA Buck LB (1996) The chromosomal distributionof mouse odorant receptor genes. Proc Natl Acad Sci USA 93:884–888.
Tacher S, Quignon P, Rimbault M, et al. (2005) Olfactory receptor sequence polymorphism withinand between breeds of dogs. J Hered 96:812–816.
Tian H, Ma M (2008) Activity plays a role in eliminating olfactory sensory neurons expressingmultiple odorant receptors in the mouse septal organ. Mol Cell Neurosci 38:484–488.
Vassar R, Ngai, J, Axel R (1993) Spatial segregation of odorant receptor expression in themammalian olfactory epithelium. Cell: 74:309–318.
Young JM, Endicott RM, Parghi SS, et al. (2008) Extensive copy-number variation of the humanolfactory receptor gene family. Am J Hum Genet 83:228–242.
Young JM, Trask BJ (2007) V2R gene families degenerated in primates, dog and cow, but expandedin opossum. Trends Genet 23:212–215.
Zhang X, De la Cruz O, Pinto JM, et al. (2007) Characterizing the expression of the humanolfactory receptor gene family using a novel DNA microarray. Genome Biol 8:R86.
Zhang X, Firestein S (2002) The olfactory receptor gene superfamily of the mouse. Nat Neurosci5:124–133.
Ziegler A, Dohr G, Uchanska-Ziegler B (2002) Possible roles for products of polymorphic MHCand linked olfactory receptor genes during selection processes in reproduction. Am J ReprodImmunol 48:34–42.
Zuri I, Su W, Halpern M (2003) Conspecific odor investigation by gray short-tailed opossums(Monodelphis domestica). Physiol Behav 80:225–232.
Part IXMarsupial Conservation Genetics
Jennifer A. Marshall Graves
The preceding parts have detailed what marsupials can do for genetics. In thispart we address the question of what genetics can do for marsupials (Sherwin andGraves, 2006).
There are about 270 extant species of marsupials, most living in Australia. Manyare endangered or vulnerable, including such icons as the bilby (the Australian“Easter bunny”), the fabulous koala and gliding possums, and the Tasmanian devil.In contrast, several species are in danger from overbreeding, for instance the koalalays waste to limited tree habitat and the population would crash if there wereno intervention. Australia has a truly horrible record for marsupial extinctions(Johnson, 2006).
Molecular markers have armed conservation geneticists with powerful new toolsto study marsupial population structure, numbers and subdivisions. Starting fromrestriction fragment length polymorphisms (RFLPs) in the 1980s (Sherwin andMurray, 1990) even limited information was of use in the management of koalas,which, though numerous, were almost invariant in the south, where they were almostextincted by fire and trapping. Mitochondrial sequence variation, particularly in theD-loop region also provided useful information about the maternal lineage, andlimited use of Y chromosome markers has been made to track the contribution ofindividual males. These techniques produced useful data, but were not easy to applyto many marsupial species because of the large samples that were required.
Conservation genetic research has become much more accessible and powerfulsince Sherwin and Murray’s contribution to the 1990 Boden Conference (Sherwinand Murray, 1990). The development of PCR-based assays completely changed theease and scope of mammal population studies. Almost unlimited supplies of usefulmarkers can be easily attained by high throughput screening methods. Non-invasivesampling of populations is now a possibility with the increased reliability of detec-tion methods. These methods are now being applied to marsupials to produce agreat spurt in population studies. The availability of genomic sequences from twomarsupials also makes it possible to target regions of the genome for variation.
In Chapter 22 Eldridge reviews the types of marker now available, their isolationand use. He summarises the literature on frequency of polymorphisms in marsu-pial populations, and provides some case studies attesting to their usefulness in
458 Part IX Marsupial Conservation Genetics
marsupials and their potential for filling in the considerable gaps. Eldridge notesthat only 15% of marsupial species have so far been the subject of molecular pop-ulation studies to date, and there is a dearth of knowledge, particularly about largeand secure populations, which would be a useful backdrop for studies of endangeredspecies.
The necessity for studying the populations of apparently secure and widespreadspecies of marsupials has been thrown into stark relief by the calamitous decline ofthe Tasmanian devil population due to the ravages of a unique facial cancer that istransmitted from animal to animal by biting (Bender, Chapter 23). The populationstructure, and even the numbers of this species, was almost unknown until the scaleof the decline became obvious just a few years ago.
Using new genetic technology it has been possible rapidly to screen the genomefor microsatellite markers, and to deploy these to examine genetic variation withinand between populations all over Tasmania. In particular, the major histocompat-ibility locus MHC, usually the most variable locus in many mammals, has fewalleles, suggesting that the population bottlenecked, probably multiple times. Thelack of genetic variation underlies the potential of cancer cells to colonise unrelatedanimals, since they will not mount an immune response (Siddle et al., 2007).
These findings substantiate the long-held view (O’Brien et al., 1983) that limitedgenetic variability renders a species vulnerable to pathogens and declining fertility.While holding out little hope for natural immunity of devils to the tumour, the MHCand microsatellite typing is proving crucial for maximising genetic variability ininsurance populations of devils that are now being set up in case the species becomesextinct in the wild.
High throughput genomics may yet come to the rescue of the beleaguered devil.Very recently, the sequences of all transcripts (“transcriptome”) in normal devil tis-sues, and of the tumour, have been determined and compared (Murchison et al.,2010). The expression profile of the tumour resembles that of Schwann cells,enabling us, for the first time, to determine that the tumour cell that entered a lifeof its own originally derived from a Schwann cell in a single animal. Not only doesthis information help to know the enemy, potentially with the aim of developinga vaccine directed against some unique protein of the tumour, but also deliversus a valuable diagnostic marker. We have truly entered the era of genomic andevolutionary approaches to animal, as well as human health.
References
Johnson C (2006) Australia’s Mammal Extinctions. Cambridge University Press, Cambridge.Murchison EP, Tovar C, Hsu A, et al. (2010) The Tasmanian devil transcriptome reveals Schwann
cell origins of a clonally transmissible cancer. Science 327:84–87.O’Brien SJ, Wildt DE, Goldman D, Merril CR, Busch M (1983) The cheetah is depauperate in
genetic variation. Science 221:459–462.Sherwin WB, Graves JAM (2006) What Marsupials can do for genetics and what genetics can do
for marsupials. In: Armati P, Dickman CR, Hume ID (eds) Marsupials. Cambridge UniversityPress, Cambridge.

Part IX Marsupial Conservation Genetics 459
Sherwin WB, Murray ND (1990) Population and conservation genetics of marsupials. Aust J Zool37:161–180.
Siddle HV, Kreiss A, Eldridge MD, et al. (2007) Transmission of a fatal clonal tumor by bitingoccurs due to depleted MHC diversity in a threatened carnivorous marsupial. Proc Natl AcadSci USA 104:16221–16226.

Chapter 22Marsupial Population and ConservationGenetics
Mark D.B. Eldridge
Abstract Recent technological advances have resulted in a dramatic renaissanceof population genetics and its application to species ecology and conservation.This review summarizes the progress made in applying these new techniques,notably hypervariable genetic markers (microsatellite loci and mitochondrial con-trol region), to the study of marsupials. Since 1990, population genetic studies haveoverwhelmingly been of marsupial species from eastern and southern Australia,largely focusing on threatened species or those with restricted distributions. Todate, over 500 polymorphic microsatellite loci have been isolated from 38 marsupialspecies (six American, 32 Australian), including representatives from 13 of the 18extant marsupial families. Levels of microsatellite diversity identified within the 209marsupial populations (43 species) so far examined have varied greatly, although therange is similar to those reported from eutherians and other vertebrates. Marsupialpopulations with high levels of genetic diversity tend to be those from relativelyabundant or widespread species, while those with lower levels are typically specieswith restricted distributions, that are threatened, found on islands or have been estab-lished via translocation. Although data for most families are still limited, bandicoots,koalas and wombats appear less and phalangerids more diverse than the marsupialaverage. The application of these hypervariable genetic markers to investigate mar-supial species ecology has substantially improved our understanding of populationbiology, behaviour and reproduction in many species, as well as informing conser-vation initiatives and management plans for many threatened marsupial taxa. It ishoped that in the future, marsupial population genetic studies can be expanded toinclude a larger number of South American and New Guinean species, as well as abetter representation of arid, tropical, widespread and abundant Australian species.
Keywords Marsupial · Microsatellite · Mitochondrial DNA · Geneticdiversity · Wildlife management
M.D.B. Eldridge (B)Australian Museum, Sydney, NSW 2010, Australiae-mail: [email protected]
461J.E. Deakin et al. (eds.), Marsupial Genetics and Genomics,DOI 10.1007/978-90-481-9023-2_22, C© Springer Science+Business Media B.V. 2010
462 M.D.B. Eldridge
22.1 Introduction
Population genetics is the study of the distribution and abundance of geneticdiversity and how it is impacted through time by gene flow, genetic drift, mutationand selection. It is therefore able to offer unique insights into the ecological and evo-lutionary processes that have shaped populations and species, as well as providing ameans for examining the influence of contemporary forces and predicting the impactof future changes. As such, population genetics is able to increase our understand-ing of fundamental biological processes, as well as species behaviour, reproductionand ecology, and increasingly is being used to inform wildlife management.
The unique biology of marsupials has made them of enduring international sci-entific interest and the focus of ongoing research. Population genetic studies ofmarsupials have historically been hampered, as for other mammals, by difficultiesin detecting sufficient genetic variation. Throughout the 1970s and 1980s a series ofallozyme electrophoresis studies revealed that marsupials contained the relativelylow levels of genetic diversity (average heterozygosity He = 0.040±0.012 fromover 25 species) typically detected with this technique (reviewed in Sherwin andMurray, 1990). These studies, however, made some progress in clarifying speciesboundaries and determining broad-scale population structure (e.g., Johnston andSharman, 1979; Seebeck and Johnston, 1980; Baverstock et al., 1984; Dickmanet al., 1988).
Since the last major review of marsupial population and conservation genetics(Sherwin and Murray, 1990) a series of technological discoveries and innova-tions have transformed molecular genetics and lead to a dramatic renaissance inpopulation genetics. Central to this revolution was the development of the poly-merase chain reaction (PCR) (reviewed in Avise, 1994) and the identification ofhypervariable segments of the genome (both nuclear and mitochondrial) whichcould be accessed, and variation assessed, via PCR (reviewed in Sunnucks, 2000).Coupled with this dramatic increase in the information content of genetic data,which enabled individuals to be routinely and unequivocally identified for thefirst time, were some equally innovative developments in methods of data analy-sis (reviewed in Excoffier and Heckel, 2006; Majoram and Tavare, 2006), allowingthe potential of these data to be more fully realised.
This review seeks to summarise the progress made to date in applying themost commonly used of these new generation of hypervariable genetic markers(microsatellites and the mtDNA control region) to marsupial populations and toillustrate how these studies have enhanced our knowledge of marsupial biologyand conservation. For a summary of Major Histocompatibility Complex (MHC)diversity studies in marsupials see Belov (Chapter 16).
22.2 Microsatellites
Microsatellites are tandem repeats of DNA sequences 2–5 base pairs in length thathave become the marker of choice in population genetics studies. They are hyper-variable in repeat length, widespread in the genome and mostly show codominant
22 Marsupial Population and Conservation Genetics 463
Mendelian inheritance and selective neutrality (reviewed in Bruford et al., 1996;Oliveira et al., 2006).
To date, 506 polymorphic microsatellite loci have been isolated from 38 mar-supial species (six American, 32 Australian), including representatives from 13of the 18 extant marsupial families (Table 22.1). Loci are yet to be publishedfor any representative of the South American families Microbiotheridae andCaenolestidae, as well as the Australian families Myrmecobiidae, Notoryctidaeand Hypsiprymnodontidae. Almost half (205/506, 41%) of published loci havebeen isolated from just two species, the South American gray short-tailed opossum(Monodelphis domestica), and the Australian tammar wallaby (Macropus eugenii)(Table 22.1). This bias is unsurprising as both species are model marsupials forgenetic and genomic research (Deakin, Chapter 5; Papenfuss et al., Chapter 6;Samollow, Chapter 4). Of the remaining loci characterised, most are from Australianspecies although the overall coverage within families remains quite patchy anduneven.
Although microsatellite loci have been isolated from only 38 of the ∼320 recentmarsupial species, many loci exhibit remarkable cross-species utility, successfullyamplifying homologous polymorphic loci in congeneric as well as inter-genericspecies within families (Table 22.1) and occasionally extending to other families(Table 22.1). Even though a decrease in successful cross-species amplification withincreasing genetic distance has been observed, as well as some reduction in diver-sity in non-source species (Zenger et al., 2003c), the loci currently available appearsufficiently versatile to enable population genetic studies for most living marsupialspecies. Microsatellite-based population genetic studies have so far been conductedon 43 marsupial species (Table 22.2); all from Australia (almost entirely eastern andsouthern) and predominantly (44%) macropodoids. Comparatively few widespreador common species have been examined, with most studies focusing on threatenedspecies or those with relatively restricted distributions (Table 22.2).
22.2.1 Genetic Diversity at Microsatellite Loci
The levels of genetic diversity identified within the 209 marsupial populations exam-ined to date using microsatellite loci have varied enormously (Table 22.2). Allelicdiversity (A), that is the average numbers of alleles per locus, was found to vary from1.2 to 18.2 (average ± se = 7.0±0.2); while reported values of average heterozy-gosity (He) have ranged from 0.05 to 0.90 (average ± se = 0.66±0.01). This rangeof values is similar to those reported from eutherians (Garner et al., 2005) and othervertebrates (DeWoody and Avise, 2000). Garner et al. (2005) reported that on aver-age marsupials (0.765±0.002, n=11) had significantly higher heterozygosity valuesthan eutherians (0.677±0.01, n=74). However, this reported difference appearsto be an artefact of the small number of marsupial populations included in theirstudy.
As might be predicted, marsupial populations with the highest microsatel-lite diversity tend to be those from widespread and abundant or high-densityspecies (e.g., medium-large macropodoids, small dasyurids, one phalangerid:
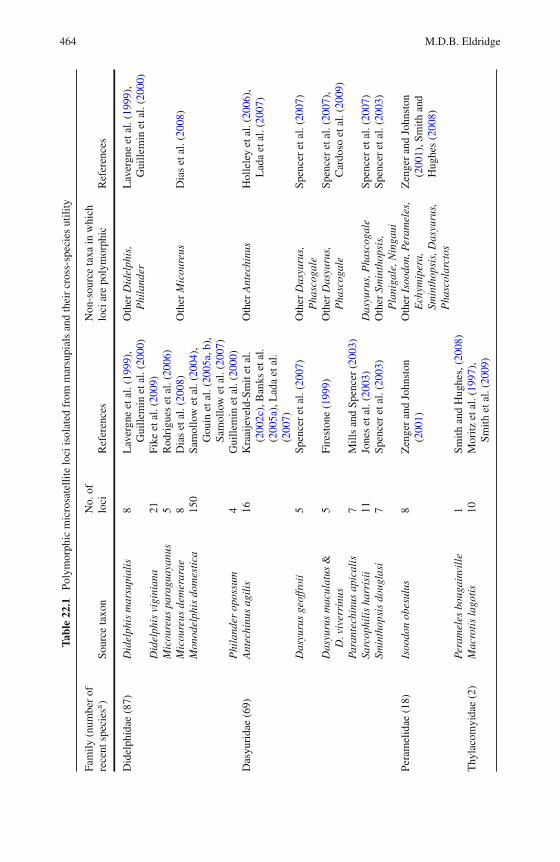
464 M.D.B. Eldridge
Tabl
e22
.1Po
lym
orph
icm
icro
sate
llite
loci
isol
ated
from
mar
supi
als
and
thei
rcr
oss-
spec
ies
utili
ty
Fam
ily(n
umbe
rof
rece
ntsp
ecie
sa )So
urce
taxo
nN
o.of
loci
Ref
eren
ces
Non
-sou
rce
taxa
inw
hich
loci
are
poly
mor
phic
Ref
eren
ces
Did
elph
idae
(87)
Did
elph
ism
arsu
pial
is8
Lav
ergn
eet
al.(
1999
),G
uille
min
etal
.(20
00)
Oth
erD
idel
phis
,P
hila
nder
Lav
ergn
eet
al.(
1999
),G
uille
min
etal
.(20
00)
Did
elph
isvi
gini
ana
21Fi
keet
al.(
2009
)M
icou
reus
para
guay
anus
5R
odri
gues
etal
.(20
06)
Mic
oure
usde
mer
arae
8D
ias
etal
.(20
08)
Oth
erM
icou
reus
Dia
set
al.(
2008
)M
onod
elph
isdo
mes
tica
150
Sam
ollo
wet
al.(
2004
),G
ouin
etal
.(20
05a,
b),
Sam
ollo
wet
al.(
2007
)P
hila
nder
opos
sum
4G
uille
min
etal
.(20
00)
Das
yuri
dae
(69)
Ant
echi
nus
agil
is16
Kra
aije
veld
-Sm
itet
al.
(200
2c),
Ban
kset
al.
(200
5a),
Lad
aet
al.
(200
7)
Oth
erA
ntec
hinu
sH
olle
ley
etal
.(20
06),
Lad
aet
al.(
2007
)
Das
yuru
sge
offr
oii
5Sp
ence
ret
al.(
2007
)O
ther
Das
yuru
s,P
hasc
ogal
eSp
ence
ret
al.(
2007
)
Das
yuru
sm
acul
atus
&D
.viv
erri
nus
5Fi
rest
one
(199
9)O
ther
Das
yuru
s,P
hasc
ogal
eSp
ence
ret
al.(
2007
),C
ardo
soet
al.(
2009
)Pa
rant
echi
nus
apic
alis
7M
ills
and
Spen
cer
(200
3)Sa
rcop
hili
sha
rris
ii11
Jone
set
al.(
2003
)D
asyu
rus,
Pha
sco g
ale
Spen
cer
etal
.(20
07)
Smin
thop
sis
doug
lasi
7Sp
ence
ret
al.(
2003
)O
ther
Smin
thop
sis,
Pla
niga
le,N
inga
uiSp
ence
ret
al.(
2003
)
Pera
mel
idae
(18)
Isoo
don
obes
ulus
8Z
enge
ran
dJo
hnst
on(2
001)
Oth
erIs
oodo
n,Pe
ram
eles
,E
chym
iper
a,Sm
inth
opsi
s,D
asyu
rus,
Pha
scol
arct
os
Zen
ger
and
John
ston
(200
1),S
mith
and
Hug
hes
(200
8)
Pera
mel
esbo
ugai
nvil
le1
Smith
and
Hug
hes,
(200
8)T
hyla
com
yida
e(2
)M
acro
tis
lago
tis
10M
oritz
etal
.(19
97),
Smith
etal
.(20
09)
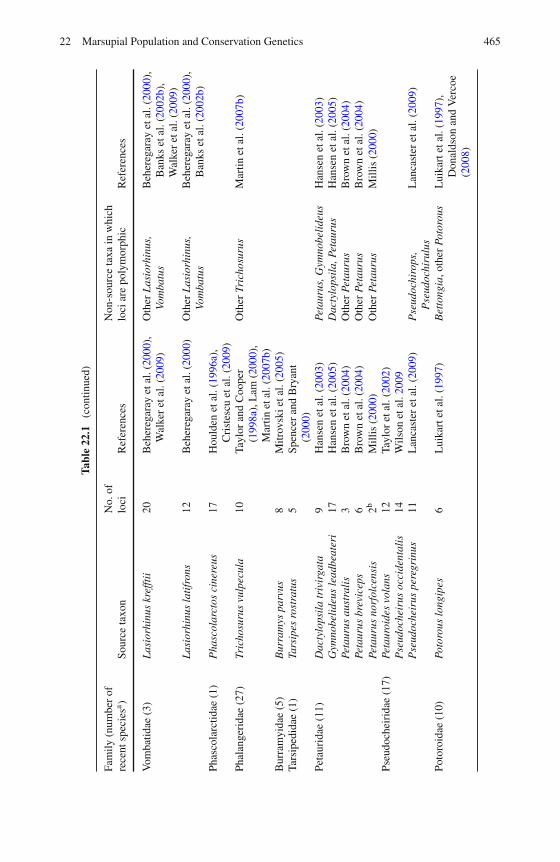
22 Marsupial Population and Conservation Genetics 465
Tabl
e22
.1(c
ontin
ued)
Fam
ily(n
umbe
rof
rece
ntsp
ecie
sa )So
urce
taxo
nN
o.of
loci
Ref
eren
ces
Non
-sou
rce
taxa
inw
hich
loci
are
poly
mor
phic
Ref
eren
ces
Vom
batid
ae(3
)L
asio
rhin
uskr
efft
ii20
Beh
ereg
aray
etal
.(20
00),
Wal
ker
etal
.(20
09)
Oth
erL
asio
rhin
us,
Vom
batu
sB
eher
egar
ayet
al.(
2000
),B
anks
etal
.(20
02b)
,W
alke
ret
al.(
2009
)L
asio
rhin
usla
tifr
ons
12B
eher
egar
ayet
al.(
2000
)O
ther
Las
iorh
inus
,Vo
mba
tus
Beh
ereg
aray
etal
.(20
00),
Ban
kset
al.(
2002
b)Ph
asco
larc
tidae
(1)
Pha
scol
arct
osci
nere
us17
Hou
lden
etal
.(19
96a)
,C
rist
escu
etal
.(20
09)
Phal
ange
rida
e(2
7)Tr
icho
suru
svu
lpec
ula
10Ta
ylor
and
Coo
per
(199
8a),
Lam
(200
0),
Mar
tinet
al.(
2007
b)
Oth
erTr
icho
suru
sM
artin
etal
.(20
07b)
Bur
ram
yida
e(5
)B
urra
mys
parv
us8
Mitr
ovsk
ieta
l.(2
005)
Tars
iped
idae
(1)
Tars
ipes
rost
ratu
s5
Spen
cer
and
Bry
ant
(200
0)Pe
taur
idae
(11)
Dac
tylo
psil
atr
ivir
gata
9H
anse
net
al.(
2003
)Pe
taur
us,G
ymno
beli
deus
Han
sen
etal
.(20
03)
Gym
nobe
lide
usle
adbe
ater
i17
Han
sen
etal
.(20
05)
Dac
tylo
psil
a,Pe
taur
usH
anse
net
al.(
2005
)Pe
taur
usau
stra
lis
3B
row
net
al.(
2004
)O
ther
Peta
urus
Bro
wn
etal
.(20
04)
Peta
urus
brev
icep
s6
Bro
wn
etal
.(20
04)
Oth
erPe
taur
usB
row
net
al.(
2004
)Pe
taur
usno
rfol
cens
is2b
Mill
is(2
000)
Oth
erPe
taur
usM
illis
(200
0)Ps
eudo
chei
rida
e(1
7)Pe
taur
oide
svo
lans
12Ta
ylor
etal
.(20
02)
Pse
udoc
heir
usoc
cide
ntal
is14
Wils
onet
al.2
009
Pse
udoc
heir
uspe
regr
inus
11L
anca
ster
etal
.(20
09)
Pse
udoc
hiro
ps,
Pse
udoc
hiru
lus
Lan
cast
eret
al.(
2009
)
Poto
roid
ae(1
0)Po
toro
uslo
ngip
es6
Lui
kart
etal
.(19
97)
Bet
tong
ia,o
ther
Poto
rous
Lui
kart
etal
.(19
97),
Don
alds
onan
dV
erco
e(2
008)
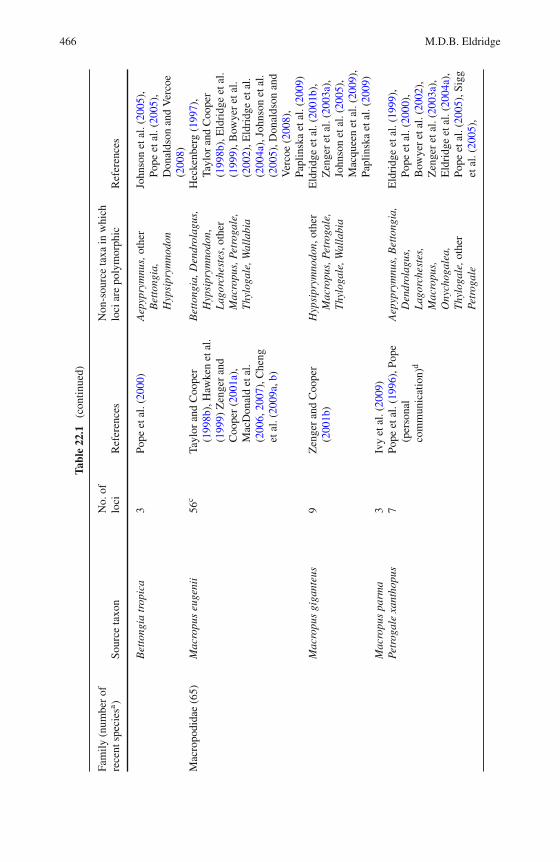
466 M.D.B. Eldridge
Tabl
e22
.1(c
ontin
ued)
Fam
ily(n
umbe
rof
rece
ntsp
ecie
sa )So
urce
taxo
nN
o.of
loci
Ref
eren
ces
Non
-sou
rce
taxa
inw
hich
loci
are
poly
mor
phic
Ref
eren
ces
Bet
tong
iatr
opic
a3
Pope
etal
.(20
00)
Aep
ypry
mnu
s,ot
her
Bet
tong
ia,
Hyp
sipr
ymno
don
John
son
etal
.(20
05),
Pope
etal
.(20
05),
Don
alds
onan
dV
erco
e(2
008)
Mac
ropo
dida
e(6
5)M
acro
pus
euge
nii
56c
Tayl
oran
dC
oope
r(1
998b
),H
awke
net
al.
(199
9)Z
enge
ran
dC
oope
r(2
001a
),M
acD
onal
det
al.
(200
6,20
07),
Che
nget
al.(
2009
a,b)
Bet
tong
ia,D
endr
olag
us,
Hyp
sipr
ymno
don,
Lag
orch
este
s,ot
her
Mac
ropu
s,Pe
trog
ale,
Thy
loga
le,W
alla
bia
Hec
kenb
erg
(199
7),
Tayl
oran
dC
oope
r(1
998b
),E
ldri
dge
etal
.(1
999)
,Bow
yer
etal
.(2
002)
,Eld
ridg
eet
al.
(200
4a),
John
son
etal
.(2
005)
,Don
alds
onan
dV
erco
e(2
008)
,Pa
plin
ska
etal
.(20
09)
Mac
ropu
sgi
gant
eus
9Z
enge
ran
dC
oope
r(2
001b
)H
ypsi
prym
nodo
n,ot
her
Mac
ropu
s,Pe
trog
ale,
Thy
loga
le,W
alla
bia
Eld
ridg
eet
al.(
2001
b),
Zen
ger
etal
.(20
03a)
,Jo
hnso
net
al.(
2005
),M
acqu
een
etal
.(20
09),
Papl
insk
aet
al.(
2009
)M
acro
pus
parm
a3
Ivy
etal
.(20
09)
Petr
ogal
exa
ntho
pus
7Po
peet
al.(
1996
),Po
pe(p
erso
nal
com
mun
icat
ion)
d
Aep
ypry
mnu
s,B
etto
ngia
,D
endr
olag
us,
Lag
orch
este
s,M
acro
pus,
Ony
chog
alea
,T
hylo
gale
,oth
erPe
trog
ale
Eld
ridg
eet
al.(
1999
),Po
peet
al.(
2000
),B
owye
ret
al.(
2002
),Z
enge
ret
al.(
2003
a),
Eld
ridg
eet
al.(
2004
a),
Pope
etal
.(20
05),
Sigg
etal
.(20
05),
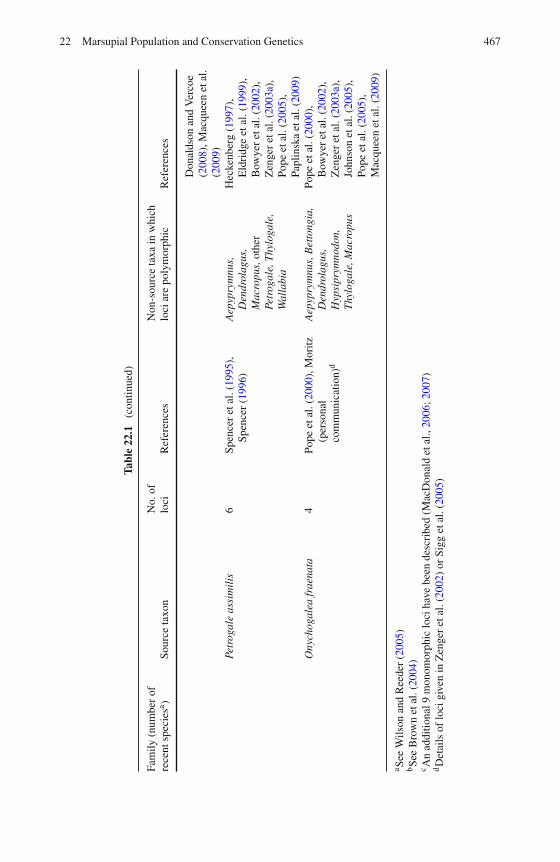
22 Marsupial Population and Conservation Genetics 467
Tabl
e22
.1(c
ontin
ued)
Fam
ily(n
umbe
rof
rece
ntsp
ecie
sa )So
urce
taxo
nN
o.of
loci
Ref
eren
ces
Non
-sou
rce
taxa
inw
hich
loci
are
poly
mor
phic
Ref
eren
ces
Don
alds
onan
dV
erco
e(2
008)
,Mac
quee
net
al.
(200
9)Pe
trog
ale
assi
mil
is6
Spen
cer
etal
.(19
95),
Spen
cer
(199
6)A
epyp
rym
nus,
Den
drol
agus
,M
acro
pus,
othe
rPe
trog
ale,
Thy
loga
le,
Wal
labi
a
Hec
kenb
erg
(199
7),
Eld
ridg
eet
al.(
1999
),B
owye
ret
al.(
2002
),Z
enge
ret
al.(
2003
a),
Pope
etal
.(20
05),
Papl
insk
aet
al.(
2009
)O
nych
ogal
eafr
aena
ta4
Pope
etal
.(20
00),
Mor
itz(p
erso
nal
com
mun
icat
ion)
d
Aep
ypry
mnu
s,B
etto
ngia
,D
endr
olag
us,
Hyp
sipr
ymno
don,
Thy
loga
le,M
acro
pus
Pope
etal
.(20
00),
Bow
yer
etal
.(20
02),
Zen
ger
etal
.(20
03a)
,Jo
hnso
net
al.(
2005
),Po
peet
al.(
2005
),M
acqu
een
etal
.(20
09)
a See
Wils
onan
dR
eede
r(2
005)
bSe
eB
row
net
al.(
2004
)c A
nad
ditio
nal9
mon
omor
phic
loci
have
been
desc
ribe
d(M
acD
onal
det
al.,
2006
;200
7)dD
etai
lsof
loci
give
nin
Zen
ger
etal
.(20
02)
orSi
gget
al.(
2005
)
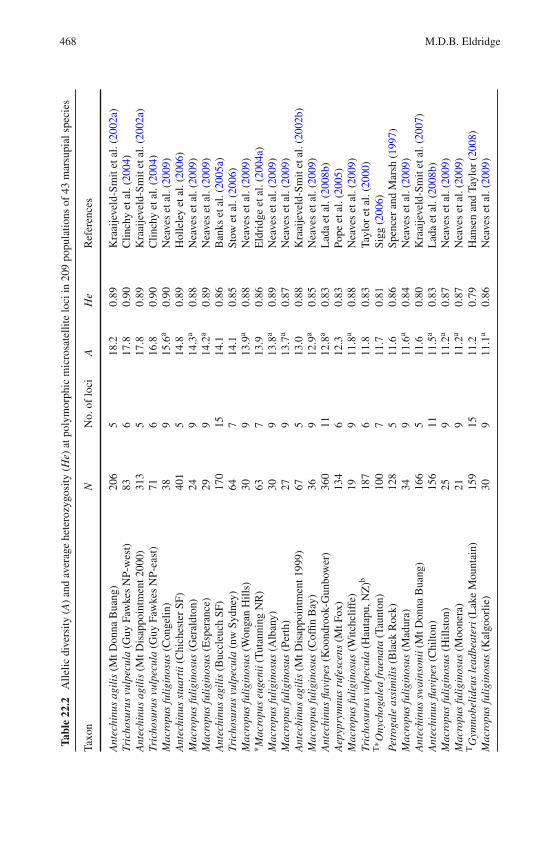
468 M.D.B. Eldridge
Tabl
e22
.2A
llelic
dive
rsity
(A)
and
aver
age
hete
rozy
gosi
ty(H
e)at
poly
mor
phic
mic
rosa
telli
telo
ciin
209
popu
latio
nsof
43m
arsu
pial
spec
ies
Taxo
nN
No.
oflo
ciA
He
Ref
eren
ces
Ant
echi
nus
agil
is(M
tDon
naB
uang
)20
65
18.2
0.89
Kra
aije
veld
-Sm
itet
al.(
2002
a)Tr
icho
suru
svu
lpec
ula
(Guy
Faw
kes
NP-
wes
t)83
617
.80.
90C
linch
yet
al.(
2004
)A
ntec
hinu
sag
ilis
(MtD
isap
poin
tmen
t200
0)31
35
17.8
0.89
Kra
aije
veld
-Sm
itet
al.(
2002
a)Tr
icho
suru
svu
lpec
ula
(Guy
Faw
kes
NP-
east
)71
616
.80.
90C
linch
yet
al.(
2004
)M
acro
pus
fuli
gino
sus
(Con
gelin
)38
915
.6a
0.90
Nea
ves
etal
.(20
09)
Ant
echi
nus
stua
rtii
(Chi
ches
ter
SF)
401
514
.80.
89H
olle
ley
etal
.(20
06)
Mac
ropu
sfu
ligi
nosu
s(G
eral
dton
)24
914
.3a
0.88
Nea
ves
etal
.(20
09)
Mac
ropu
sfu
ligi
nosu
s(E
sper
ance
)29
914
.2a
0.89
Nea
ves
etal
.(20
09)
Ant
echi
nus
agil
is(B
uccl
euch
SF)
170
1514
.10.
86B
anks
etal
.(20
05a)
Tric
hosu
rus
vulp
ecul
a(n
wSy
dney
)64
714
.10.
85St
owet
al.(
2006
)M
acro
pus
fuli
gino
sus
(Won
gan
Hill
s)30
913
.9a
0.88
Nea
ves
etal
.(20
09)
∗ Mac
ropu
seu
geni
i(T
utan
ning
NR
)63
713
.90.
86E
ldri
dge
etal
.(20
04a)
Mac
ropu
sfu
ligi
nosu
s(A
lban
y)30
913
.8a
0.89
Nea
ves
etal
.(20
09)
Mac
ropu
sfu
ligi
nosu
s(P
erth
)27
913
.7a
0.87
Nea
ves
etal
.(20
09)
Ant
echi
nus
agil
is(M
tDis
appo
intm
ent1
999)
675
13.0
0.88
Kra
aije
veld
-Sm
itet
al.(
2002
b)M
acro
pus
fuli
gino
sus
(Cof
finB
ay)
369
12.9
a0.
85N
eave
set
al.(
2009
)A
ntec
hinu
sfla
vipe
s(K
oond
rook
-Gun
bow
er)
360
1112
.8a
0.83
Lad
aet
al.(
2008
b)A
epyp
rym
nus
rufe
scen
s(M
tFox
)13
46
12.3
0.83
Pope
etal
.(20
05)
Mac
ropu
sfu
ligi
nosu
s(W
itchc
liffe
)19
911
.8a
0.88
Nea
ves
etal
.(20
09)
Tric
hosu
rus
vulp
ecul
a(H
auta
pu,N
Z)b
187
611
.80.
83Ta
ylor
etal
.(20
00)
T∗ O
nych
ogal
eafr
aena
ta(T
aunt
on)
100
711
.70.
81Si
gg(2
006)
Petr
ogal
eas
sim
ilis
(Bla
ckR
ock)
128
511
.60.
86Sp
ence
ran
dM
arsh
(199
7)M
acro
pus
fuli
gino
sus
(Mad
ura)
349
11.6
a0.
84N
eave
set
al.(
2009
)A
ntec
hinu
ssw
ains
onii
(MtD
onna
Bua
ng)
166
511
.60.
80K
raai
jeve
ld-S
mit
etal
.(20
07)
Ant
echi
nus
flavi
pes
(Chi
lton)
156
1111
.5a
0.83
Lad
aet
al.(
2008
b)M
acro
pus
fuli
gino
sus
(Hill
ston
)25
911
.2a
0.87
Nea
ves
etal
.(20
09)
Mac
ropu
sfu
ligi
nosu
s(M
oone
ra)
219
11.2
a0.
87N
eave
set
al.(
2009
)T
Gym
nobe
lide
usle
adbe
ater
i(L
ake
Mou
ntai
n)15
915
11.2
0.79
Han
sen
and
Tayl
or(2
008)
Mac
ropu
sfu
ligi
nosu
s(K
algo
orlie
)30
911
.1a
0.86
Nea
ves
etal
.(20
09)
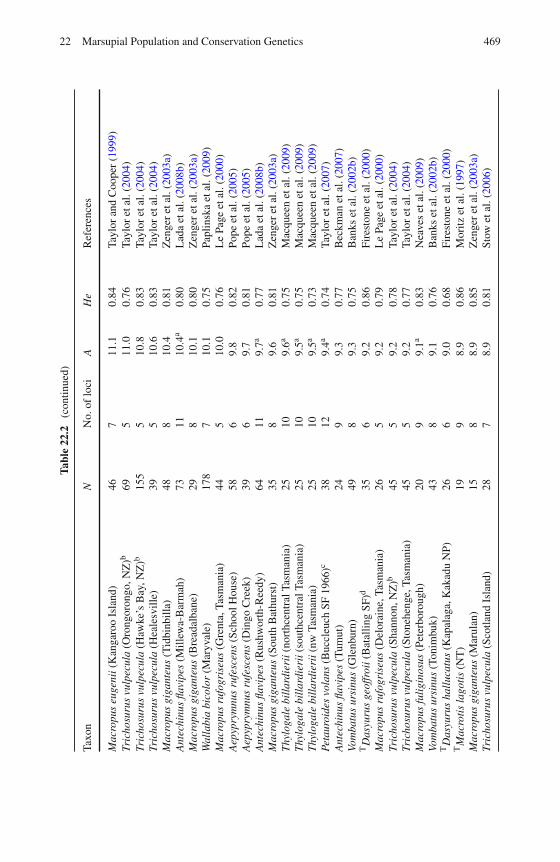
22 Marsupial Population and Conservation Genetics 469
Tabl
e22
.2(c
ontin
ued)
Taxo
nN
No.
oflo
ciA
He
Ref
eren
ces
Mac
ropu
seu
geni
i(K
anga
roo
Isla
nd)
467
11.1
0.84
Tayl
oran
dC
oope
r(1
999)
Tric
hosu
rus
vulp
ecul
a(O
rong
oron
go,N
Z)b
695
11.0
0.76
Tayl
oret
al.(
2004
)Tr
icho
suru
svu
lpec
ula
(Haw
ke’s
Bay
,NZ
)b15
55
10.8
0.83
Tayl
oret
al.(
2004
)Tr
icho
suru
svu
lpec
ula
(Hea
lesv
ille)
395
10.6
0.83
Tayl
oret
al.(
2004
)M
acro
pus
giga
nteu
s(T
idbi
nbill
a)48
810
.40.
81Z
enge
ret
al.(
2003
a)A
ntec
hinu
sfla
vipe
s(M
illew
a-B
arm
ah)
7311
10.4
a0.
80L
ada
etal
.(20
08b)
Mac
ropu
sgi
gant
eus
(Bre
adal
bane
)29
810
.10.
80Z
enge
ret
al.(
2003
a)W
alla
bia
bico
lor
(Mar
yval
e)17
87
10.1
0.75
Papl
insk
aet
al.(
2009
)M
acro
pus
rufo
gris
eus
(Gre
nta,
Tasm
ania
)44
510
.00.
76L
ePa
geet
al.(
2000
)A
epyp
rym
nus
rufe
scen
s(S
choo
lHou
se)
586
9.8
0.82
Pope
etal
.(20
05)
Aep
ypry
mnu
sru
fesc
ens
(Din
goC
reek
)39
69.
70.
81Po
peet
al.(
2005
)A
ntec
hinu
sfla
vipe
s(R
ushw
orth
-Ree
dy)
6411
9.7a
0.77
Lad
aet
al.(
2008
b)M
acro
pus
giga
nteu
s(S
outh
Bat
hurs
t)35
89.
60.
81Z
enge
ret
al.(
2003
a)T
hylo
gale
bill
ardi
erii
(nor
thce
ntra
lTas
man
ia)
2510
9.6a
0.75
Mac
quee
net
al.(
2009
)T
hylo
gale
bill
ardi
erii
(sou
thce
ntra
lTas
man
ia)
2510
9.5a
0.75
Mac
quee
net
al.(
2009
)T
hylo
gale
bill
ardi
erii
(nw
Tasm
ania
)25
109.
5a0.
73M
acqu
een
etal
.(20
09)
Peta
uroi
des
vola
ns(B
uccl
euch
SF19
66)c
3812
9.4a
0.74
Tayl
oret
al.(
2007
)A
ntec
hinu
sfla
vipe
s(T
umut
)24
99.
30.
77B
eckm
anet
al.(
2007
)Vo
mba
tus
ursi
nus
(Gle
nbur
n)49
89.
30.
75B
anks
etal
.(20
02b)
TD
asyu
rus
geof
froi
i(B
atal
ling
SF)d
356
9.2
0.86
Fire
ston
eet
al.(
2000
)M
acro
pus
rufo
gris
eus
(Del
orai
ne,T
asm
ania
)26
59.
20.
79L
ePa
geet
al.(
2000
)Tr
icho
suru
svu
lpec
ula
(Sha
nnon
,NZ
)b45
59.
20.
78Ta
ylor
etal
.(20
04)
Tric
hosu
rus
vulp
ecul
a(S
tone
heng
e,Ta
sman
ia)
455
9.2
0.77
Tayl
oret
al.(
2004
)M
acro
pus
fuli
gino
sus
(Pet
erbo
roug
h)20
99.
1a0.
83N
eave
set
al.(
2009
)Vo
mba
tus
ursi
nus
(Ton
imbu
k)43
89.
10.
76B
anks
etal
.(20
02b)
TD
asyu
rus
hall
ucat
us(K
apal
aga,
Kak
adu
NP)
266
9.0
0.68
Fire
ston
eet
al.(
2000
)T
Mac
roti
sla
goti
s(N
T)
199
8.9
0.86
Mor
itzet
al.(
1997
)M
acro
pus
giga
nteu
s(M
arul
an)
158
8.9
0.85
Zen
ger
etal
.(20
03a)
Tric
hosu
rus
vulp
ecul
a(S
cotla
ndIs
land
)28
78.
90.
81St
owet
al.(
2006
)
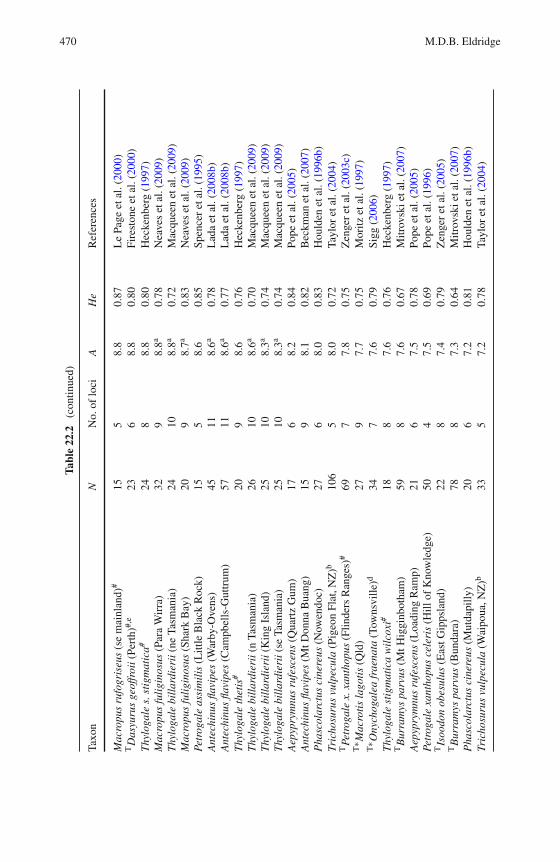
470 M.D.B. Eldridge
Tabl
e22
.2(c
ontin
ued)
Taxo
nN
No.
oflo
ciA
He
Ref
eren
ces
Mac
ropu
sru
fogr
iseu
s(s
em
ainl
and)
#15
58.
80.
87L
ePa
geet
al.(
2000
)T
Das
yuru
sge
offr
oii(
Pert
h)#,
e23
68.
80.
80Fi
rest
one
etal
.(20
00)
Thy
loga
les.
stig
mat
ica#
248
8.8
0.80
Hec
kenb
erg
(199
7)M
acro
pus
fuli
gino
sus
(Par
aW
irra
)32
98.
8a0.
78N
eave
set
al.(
2009
)T
hylo
gale
bill
ardi
erii
(ne
Tasm
ania
)24
108.
8a0.
72M
acqu
een
etal
.(20
09)
Mac
ropu
sfu
ligi
nosu
s(S
hark
Bay
)20
98.
7a0.
83N
eave
set
al.(
2009
)Pe
trog
ale
assi
mil
is(L
ittle
Bla
ckR
ock)
155
8.6
0.85
Spen
cer
etal
.(19
95)
Ant
echi
nus
flavi
pes
(War
by-O
vens
)45
118.
6a0.
78L
ada
etal
.(20
08b)
Ant
echi
nus
flavi
pes
(Cam
pbel
ls-G
uttr
um)
5711
8.6a
0.77
Lad
aet
al.(
2008
b)T
hylo
gale
thet
is#
209
8.6
0.76
Hec
kenb
erg
(199
7)T
hylo
gale
bill
ardi
erii
(nTa
sman
ia)
2610
8.6a
0.70
Mac
quee
net
al.(
2009
)T
hylo
gale
bill
ardi
erii
(Kin
gIs
land
)25
108.
3a0.
74M
acqu
een
etal
.(20
09)
Thy
loga
lebi
llar
dier
ii(s
eTa
sman
ia)
2510
8.3a
0.74
Mac
quee
net
al.(
2009
)A
epyp
rym
nus
rufe
scen
s(Q
uart
zG
um)
176
8.2
0.84
Pope
etal
.(20
05)
Ant
echi
nus
flavi
pes
(MtD
onna
Bua
ng)
159
8.1
0.82
Bec
kman
etal
.(20
07)
Pha
scol
arct
usci
nere
us(N
owen
doc)
276
8.0
0.83
Hou
lden
etal
.(19
96b)
Tric
hosu
rus
vulp
ecul
a(P
igeo
nFl
at,N
Z)b
106
58.
00.
72Ta
ylor
etal
.(20
04)
TPe
trog
ale
x.xa
ntho
pus
(Flin
ders
Ran
ges)
#69
77.
80.
75Z
enge
ret
al.(
2003
c)T∗ M
acro
tis
lago
tis
(Qld
)27
97.
70.
75M
oritz
etal
.(19
97)
T∗ O
nych
ogal
eafr
aena
ta(T
owns
ville
)d34
77.
60.
79Si
gg(2
006)
Thy
loga
lest
igm
atic
aw
ilco
xi#
188
7.6
0.76
Hec
kenb
erg
(199
7)T
Bur
ram
yspa
rvus
(MtH
iggi
nbot
ham
)59
87.
60.
67M
itrov
skie
tal.
(200
7)A
epyp
rym
nus
rufe
scen
s(L
oadi
ngR
amp)
216
7.5
0.78
Pope
etal
.(20
05)
Petr
ogal
exa
ntho
pus
cele
ris
(Hill
ofK
now
ledg
e)50
47.
50.
69Po
peet
al.(
1996
)T
Isoo
don
obes
ulus
(Eas
tGip
psla
nd)
228
7.4
0.79
Zen
ger
etal
.(20
05)
TB
urra
mys
parv
us(B
unda
ra)
788
7.3
0.64
Mitr
ovsk
ieta
l.(2
007)
Pha
scol
arct
usci
nere
us(M
utda
pilly
)20
67.
20.
81H
ould
enet
al.(
1996
b)Tr
icho
suru
svu
lpec
ula
(Wai
poua
,NZ
)b33
57.
20.
78Ta
ylor
etal
.(20
04)
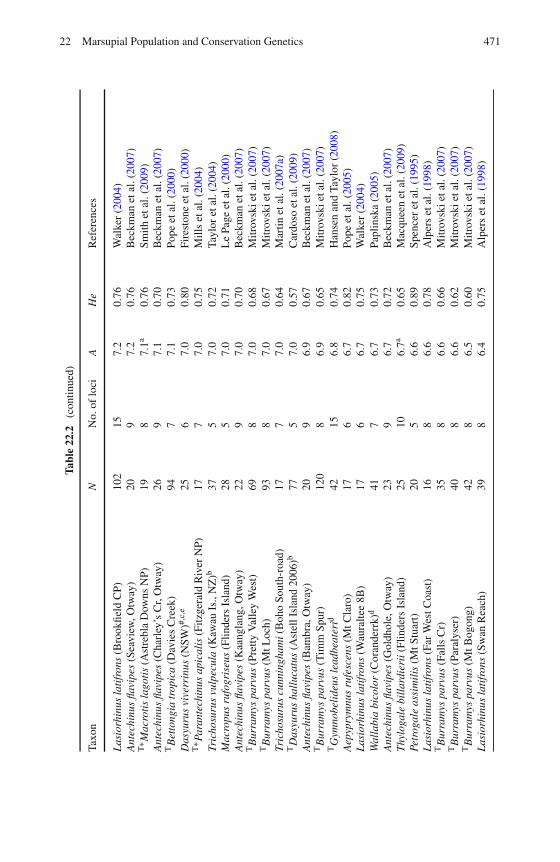
22 Marsupial Population and Conservation Genetics 471
Tabl
e22
.2(c
ontin
ued)
Taxo
nN
No.
oflo
ciA
He
Ref
eren
ces
Las
iorh
inus
lati
fron
s(B
rook
field
CP)
102
157.
20.
76W
alke
r(2
004)
Ant
echi
nus
flavi
pes
(Sea
view
,Otw
ay)
209
7.2
0.76
Bec
kman
etal
.(20
07)
T∗ M
acro
tis
lago
tis
(Ast
rebl
aD
owns
NP)
198
7.1a
0.76
Smith
etal
.(20
09)
Ant
echi
nus
flavi
pes
(Cha
rley
’sC
r,O
tway
)26
97.
10.
70B
eckm
anet
al.(
2007
)T
Bet
tong
iatr
opic
a(D
avie
sC
reek
)94
77.
10.
73Po
peet
al.(
2000
)D
asyu
rus
vive
rrin
us(N
SW)#,
c,e
256
7.0
0.80
Fire
ston
eet
al.(
2000
)T∗ P
aran
tech
inus
apic
alis
(Fitz
gera
ldR
iver
NP)
177
7.0
0.75
Mill
set
al.(
2004
)Tr
icho
suru
svu
lpec
ula
(Kaw
auIs
.,N
Z)b
375
7.0
0.72
Tayl
oret
al.(
2004
)M
acro
pus
rufo
gris
eus
(Flin
ders
Isla
nd)
285
7.0
0.71
Le
Page
etal
.(20
00)
Ant
echi
nus
flavi
pes
(Kaa
ngla
ng,O
tway
)22
97.
00.
70B
eckm
anet
al.(
2007
)T
Bur
ram
yspa
rvus
(Pre
ttyV
alle
yW
est)
698
7.0
0.68
Mitr
ovsk
ieta
l.(2
007)
TB
urra
mys
parv
us(M
tLoc
h)93
87.
00.
67M
itrov
skie
tal.
(200
7)Tr
icho
suru
scu
nnin
gham
i(B
oho
Sout
h-ro
ad)
177
7.0
0.64
Mar
tinet
al.(
2007
a)T
Das
yuru
sha
lluc
atus
(Ast
ellI
slan
d20
06)b
775
7.0
0.57
Car
doso
etal
.(20
09)
Ant
echi
nus
flavi
pes
(Bam
bra,
Otw
ay)
209
6.9
0.67
Bec
kman
etal
.(20
07)
TB
urra
mys
parv
us(T
imm
Spur
)12
08
6.9
0.65
Mitr
ovsk
ieta
l.(2
007)
TG
ymno
beli
deus
lead
beat
erid
4215
6.8
0.74
Han
sen
and
Tayl
or(2
008)
Aep
ypry
mnu
sru
fesc
ens
(MtC
laro
)17
66.
70.
82Po
peet
al.(
2005
)L
asio
rhin
usla
tifr
ons
(Wau
ralte
e8B
)17
66.
70.
75W
alke
r(2
004)
Wal
labi
abi
colo
r(C
oran
derr
k)d
417
6.7
0.73
Papl
insk
a(2
005)
Ant
echi
nus
flavi
pes
(Gol
dhol
e,O
tway
)23
96.
70.
72B
eckm
anet
al.(
2007
)T
hylo
gale
bill
ardi
erii
(Flin
ders
Isla
nd)
2510
6.7a
0.65
Mac
quee
net
al.(
2009
)Pe
trog
ale
assi
mil
is(M
tStu
art)
205
6.6
0.89
Spen
cer
etal
.(19
95)
Las
iorh
inus
lati
fron
s(F
arW
estC
oast
)16
86.
60.
78A
lper
set
al.(
1998
)T
Bur
ram
yspa
rvus
(Fal
lsC
r)35
86.
60.
66M
itrov
skie
tal.
(200
7)T
Bur
ram
yspa
rvus
(Par
alys
er)
408
6.6
0.62
Mitr
ovsk
ieta
l.(2
007)
TB
urra
mys
parv
us(M
tBog
ong)
428
6.5
0.60
Mitr
ovsk
ieta
l.(2
007)
Las
iorh
inus
lati
fron
s(S
wan
Rea
ch)
398
6.4
0.75
Alp
ers
etal
.(19
98)
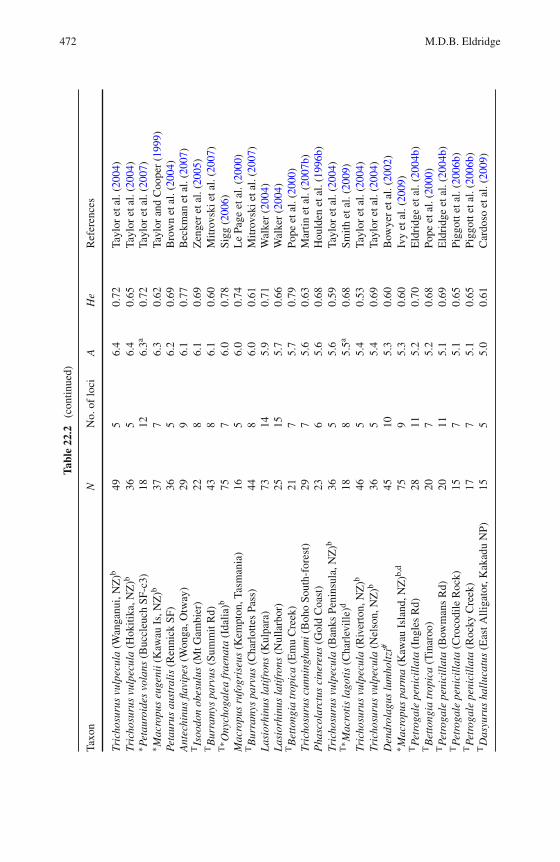
472 M.D.B. Eldridge
Tabl
e22
.2(c
ontin
ued)
Taxo
nN
No.
oflo
ciA
He
Ref
eren
ces
Tric
hosu
rus
vulp
ecul
a(W
anga
nui,
NZ
)b49
56.
40.
72Ta
ylor
etal
.(20
04)
Tric
hosu
rus
vulp
ecul
a(H
okiti
ka,N
Z)b
365
6.4
0.65
Tayl
oret
al.(
2004
)∗ P
etau
roid
esvo
lans
(Buc
cleu
chSF
-c3)
1812
6.3a
0.72
Tayl
oret
al.(
2007
)∗ M
acro
pus
euge
nii(
Kaw
auIs
,NZ
)b37
76.
30.
62Ta
ylor
and
Coo
per
(199
9)Pe
taur
usau
stra
lis
(Ren
nick
SF)
365
6.2
0.69
Bro
wn
etal
.(20
04)
Ant
echi
nus
flavi
pes
(Won
ga,O
tway
)29
96.
10.
77B
eckm
anet
al.(
2007
)T
Isoo
don
obes
ulus
(MtG
ambi
er)
228
6.1
0.69
Zen
ger
etal
.(20
05)
TB
urra
mys
parv
us(S
umm
itR
d)43
86.
10.
60M
itrov
skie
tal.
(200
7)T∗ O
nych
ogal
eafr
aena
ta(I
dalia
)b75
76.
00.
78Si
gg(2
006)
Mac
ropu
sru
fogr
iseu
s(K
empt
on,T
asm
ania
)16
56.
00.
74L
ePa
geet
al.(
2000
)T
Bur
ram
yspa
rvus
(Cha
rlot
tes
Pass
)44
86.
00.
61M
itrov
skie
tal.
(200
7)L
asio
rhin
usla
tifr
ons
(Kul
para
)73
145.
90.
71W
alke
r(2
004)
Las
iorh
inus
lati
fron
s(N
ulla
rbor
)25
155.
70.
66W
alke
r(2
004)
TB
etto
ngia
trop
ica
(Em
uC
reek
)21
75.
70.
79Po
peet
al.(
2000
)Tr
icho
suru
scu
nnin
gham
i(B
oho
Sout
h-fo
rest
)29
75.
60.
63M
artin
etal
.(20
07b)
Pha
scol
arct
usci
nere
us(G
old
Coa
st)
236
5.6
0.68
Hou
lden
etal
.(19
96b)
Tric
hosu
rus
vulp
ecul
a(B
anks
Peni
nsul
a,N
Z)b
365
5.6
0.59
Tayl
oret
al.(
2004
)T∗ M
acro
tis
lago
tis
(Cha
rlev
ille)
d18
85.
5a0.
68Sm
ithet
al.(
2009
)Tr
icho
suru
svu
lpec
ula
(Riv
erto
n,N
Z)b
465
5.4
0.53
Tayl
oret
al.(
2004
)Tr
icho
suru
svu
lpec
ula
(Nel
son,
NZ
)b36
55.
40.
69Ta
ylor
etal
.(20
04)
Den
drol
agus
lum
holt
zi#
4510
5.3
0.60
Bow
yer
etal
.(20
02)
∗ Mac
ropu
spa
rma
(Kaw
auIs
land
,NZ
)b,d
759
5.3
0.60
Ivy
etal
.(20
09)
TPe
trog
ale
peni
cill
ata
(Ing
les
Rd)
2811
5.2
0.70
Eld
ridg
eet
al.(
2004
b)T
Bet
tong
iatr
opic
a(T
inar
oo)
207
5.2
0.68
Pope
etal
.(20
00)
TPe
trog
ale
peni
cill
ata
(Bow
man
sR
d)20
115.
10.
69E
ldri
dge
etal
.(20
04b)
TPe
trog
ale
peni
cill
ata
(Cro
codi
leR
ock)
157
5.1
0.65
Pigg
otte
tal.
(200
6b)
TPe
trog
ale
peni
cill
ata
(Roc
kyC
reek
)17
75.
10.
65Pi
ggot
teta
l.(2
006b
)T
Das
yuru
sha
lluc
atus
(Eas
tAlli
gato
r,K
akad
uN
P)15
55.
00.
61C
ardo
soet
al.(
2009
)
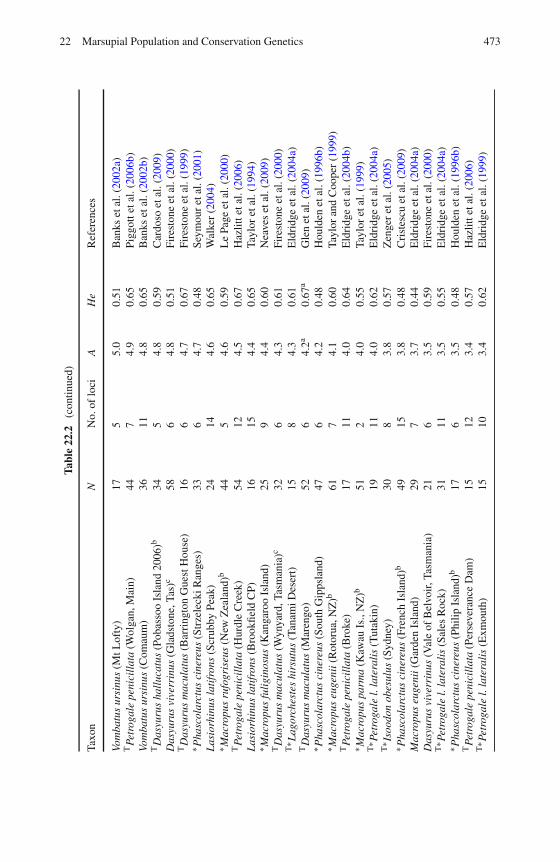
22 Marsupial Population and Conservation Genetics 473
Tabl
e22
.2(c
ontin
ued)
Taxo
nN
No.
oflo
ciA
He
Ref
eren
ces
Vom
batu
sur
sinu
s(M
tLof
ty)
175
5.0
0.51
Ban
kset
al.(
2002
a)T
Petr
ogal
epe
nici
llat
a(W
olga
n,M
ain)
447
4.9
0.65
Pigg
otte
tal.
(200
6b)
Vom
batu
sur
sinu
s(C
omau
m)
3611
4.8
0.65
Ban
kset
al.(
2002
b)T
Das
yuru
sha
lluc
atus
(Pob
asso
oIs
land
2006
)b34
54.
80.
59C
ardo
soet
al.(
2009
)D
asyu
rus
vive
rrin
us(G
lads
tone
,Tas
)c58
64.
80.
51Fi
rest
one
etal
.(20
00)
TD
asyu
rus
mac
ulat
us(B
arri
ngto
nG
uest
Hou
se)
166
4.7
0.67
Fire
ston
eet
al.(
1999
)∗ P
hasc
olar
ctus
cine
reus
(Str
zele
ckiR
ange
s)33
64.
70.
48Se
ymou
ret
al.(
2001
)L
asio
rhin
usla
tifr
ons
(Scr
ubby
Peak
)24
144.
60.
65W
alke
r(2
004)
∗ Mac
ropu
sru
fogr
iseu
s(N
ewZ
eala
nd)b
445
4.6
0.59
Le
Page
etal
.(20
00)
TPe
trog
ale
peni
cill
ata
(Hur
dle
Cre
ek)
5412
4.5
0.67
Haz
litte
tal.
(200
6)L
asio
rhin
usla
tifr
ons
(Bro
okfie
ldC
P)16
154.
40.
65Ta
ylor
etal
.(19
94)
∗ Mac
ropu
sfu
ligi
nosu
s(K
anga
roo
Isla
nd)
259
4.4
0.60
Nea
ves
etal
.(20
09)
TD
asyu
rus
mac
ulat
us(W
ynya
rd,T
asm
ania
)c32
64.
30.
61Fi
rest
one
etal
.(20
00)
T∗ L
agor
ches
tes
hirs
utus
(Tan
amiD
eser
t)15
84.
30.
61E
ldri
dge
etal
.(20
04a)
TD
asyu
rus
mac
ulat
us(M
aren
go)
526
4.2a
0.67
aG
len
etal
.(20
09)
∗ Pha
scol
arct
usci
nere
us(S
outh
Gip
psla
nd)
476
4.2
0.48
Hou
lden
etal
.(19
96b)
∗ Mac
ropu
seu
geni
i(R
otor
ua,N
Z)b
617
4.1
0.60
Tayl
oran
dC
oope
r(1
999)
TPe
trog
ale
peni
cill
ata
(Bro
ke)
1711
4.0
0.64
Eld
ridg
eet
al.(
2004
b)∗ M
acro
pus
parm
a(K
awau
Is.,
NZ
)b51
24.
00.
55Ta
ylor
etal
.(19
99)
T∗ P
etro
gale
l.la
tera
lis
(Tut
akin
)19
114.
00.
62E
ldri
dge
etal
.(20
04a)
T∗ I
sood
onob
esul
us(S
ydne
y)30
83.
80.
57Z
enge
ret
al.(
2005
)∗ P
hasc
olar
ctus
cine
reus
(Fre
nch
Isla
nd)b
4915
3.8
0.48
Cri
stes
cuet
al.(
2009
)M
acro
pus
euge
nii(
Gar
den
Isla
nd)
297
3.7
0.44
Eld
ridg
eet
al.(
2004
a)D
asyu
rus
vive
rrin
us(V
ale
ofB
elvo
ir,T
asm
ania
)21
63.
50.
59Fi
rest
one
etal
.(20
00)
T∗ P
etro
gale
l.la
tera
lis
(Sal
esR
ock)
3111
3.5
0.55
Eld
ridg
eet
al.(
2004
a)∗ P
hasc
olar
ctus
cine
reus
(Phi
lipIs
land
)b17
63.
50.
48H
ould
enet
al.(
1996
b)T
Petr
ogal
epe
nici
llat
a(P
erse
vera
nce
Dam
)15
123.
40.
57H
azlit
teta
l.(2
006)
T∗ P
etro
gale
l.la
tera
lis
(Exm
outh
)15
103.
40.
62E
ldri
dge
etal
.(19
99)
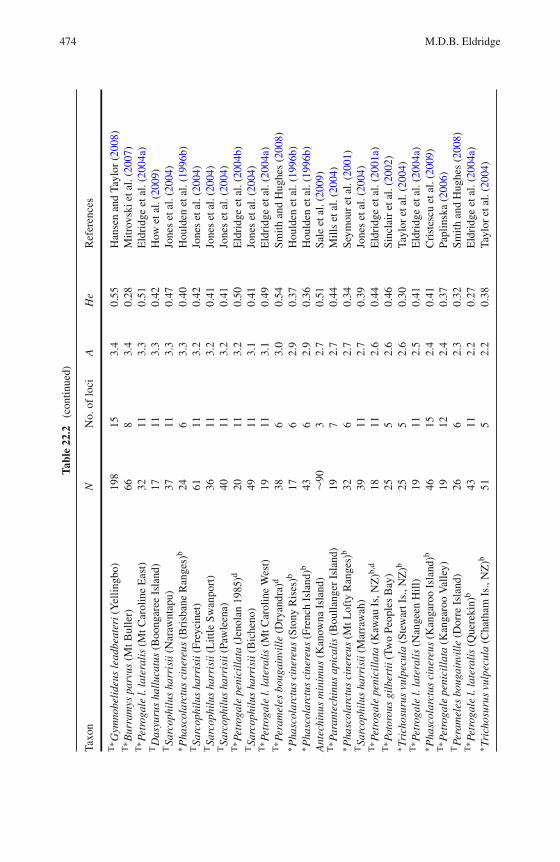
474 M.D.B. Eldridge
Tabl
e22
.2(c
ontin
ued)
Taxo
nN
No.
oflo
ciA
He
Ref
eren
ces
T∗ G
ymno
beli
deus
lead
beat
eri(
Yel
lingb
o)19
815
3.4
0.55
Han
sen
and
Tayl
or(2
008)
T∗ B
urra
mys
parv
us(M
tBul
ler)
668
3.4
0.28
Mitr
ovsk
ieta
l.(2
007)
T∗ P
etro
gale
l.la
tera
lis
(MtC
arol
ine
Eas
t)32
113.
30.
51E
ldri
dge
etal
.(20
04a)
TD
asyu
rus
hall
ucat
us(B
oong
aree
Isla
nd)
1711
3.3
0.42
How
etal
.(20
09)
TSa
rcop
hilu
sha
rris
ii(N
araw
ntap
u)37
113.
30.
47Jo
nes
etal
.(20
04)
∗ Pha
scol
arct
usci
nere
us(B
risb
ane
Ran
ges)
b24
63.
30.
40H
ould
enet
al.(
1996
b)T
Sarc
ophi
lus
harr
isii
(Fre
ycin
et)
6111
3.2
0.42
Jone
set
al.(
2004
)T
Sarc
ophi
lus
harr
isii
(Litt
leSw
anpo
rt)
3611
3.2
0.41
Jone
set
al.(
2004
)T
Sarc
ophi
lus
harr
isii
(Paw
leen
a)40
113.
20.
41Jo
nes
etal
.(20
04)
T∗ P
etro
gale
peni
cill
ata
(Jen
olan
1985
)d20
113.
20.
50E
ldri
dge
etal
.(20
04b)
TSa
rcop
hilu
sha
rris
ii(B
iche
no)
4911
3.1
0.41
Jone
set
al.(
2004
)T∗ P
etro
gale
l.la
tera
lis
(MtC
arol
ine
Wes
t)19
113.
10.
49E
ldri
dge
etal
.(20
04a)
T∗ P
eram
eles
boug
ainv
ille
(Dry
andr
a)d
386
3.0
0.54
Smith
and
Hug
hes
(200
8)∗ P
hasc
olar
ctus
cine
reus
(Sto
nyR
ises
)b17
62.
90.
37H
ould
enet
al.(
1996
b)∗ P
hasc
olar
ctus
cine
reus
(Fre
nch
Isla
nd)b
436
2.9
0.36
Hou
lden
etal
.(19
96b)
Ant
echi
nus
min
imus
(Kan
owna
Isla
nd)
∼90
32.
70.
51Sa
leet
al.(
2009
)T∗ P
aran
tech
inus
apic
alis
(Bou
llang
erIs
land
)19
72.
70.
44M
ills
etal
.(20
04)
∗ Pha
scol
arct
usci
nere
us(M
tLof
tyR
ange
s)b
326
2.7
0.34
Seym
our
etal
.(20
01)
TSa
rcop
hilu
sha
rris
ii(M
arra
wah
)39
112.
70.
39Jo
nes
etal
.(20
04)
T∗ P
etro
gale
peni
cill
ata
(Kaw
auIs
,NZ
)b,d
1811
2.6
0.44
Eld
ridg
eet
al.(
2001
a)T∗ P
otor
ous
gilb
erti
i(Tw
oPe
ople
sB
ay)
255
2.6
0.46
Sinc
lair
etal
.(20
02)
∗ Tri
chos
urus
vulp
ecul
a(S
tew
artI
s.,N
Z)b
255
2.6
0.30
Tayl
oret
al.(
2004
)T∗ P
etro
gale
l.la
tera
lis
(Nan
geen
Hill
)19
112.
50.
41E
ldri
dge
etal
.(20
04a)
∗ Pha
scol
arct
usci
nere
us(K
anga
roo
Isla
nd)b
4615
2.4
0.41
Cri
stes
cuet
al.(
2009
)T∗ P
etro
gale
peni
cill
ata
(Kan
garo
oV
alle
y)19
122.
40.
37Pa
plin
ska
(200
6)T
Pera
mel
esbo
ugai
nvil
le(D
orre
Isla
nd)
266
2.3
0.32
Smith
and
Hug
hes
(200
8)T∗ P
etro
gale
l.la
tera
lis
(Que
reki
n)b
4311
2.2
0.27
Eld
ridg
eet
al.(
2004
a)∗ T
rich
osur
usvu
lpec
ula
(Cha
tham
Is.,
NZ
)b51
52.
20.
38Ta
ylor
etal
.(20
04)
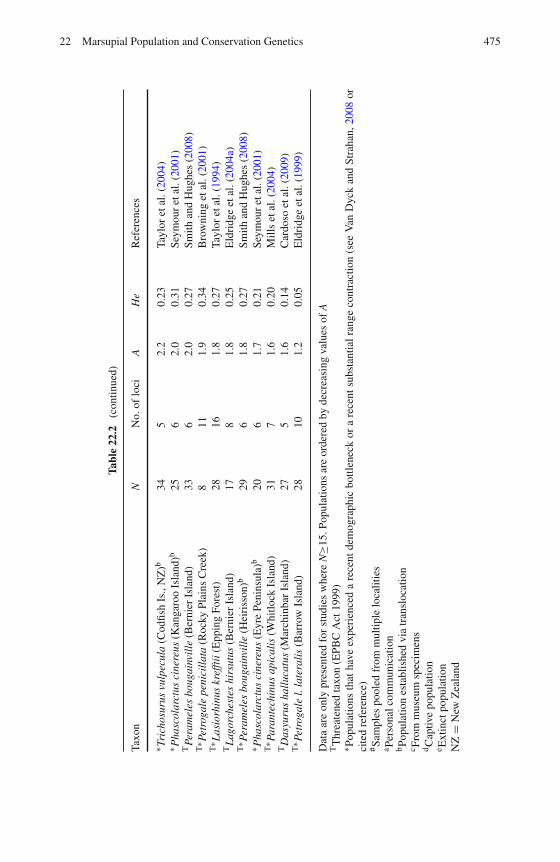
22 Marsupial Population and Conservation Genetics 475
Tabl
e22
.2(c
ontin
ued)
Taxo
nN
No.
oflo
ciA
He
Ref
eren
ces
∗ Tri
chos
urus
vulp
ecul
a(C
odfis
hIs
.,N
Z)b
345
2.2
0.23
Tayl
oret
al.(
2004
)∗ P
hasc
olar
ctus
cine
reus
(Kan
garo
oIs
land
)b25
62.
00.
31Se
ymou
ret
al.(
2001
)T
Pera
mel
esbo
ugai
nvil
le(B
erni
erIs
land
)33
62.
00.
27Sm
ithan
dH
ughe
s(2
008)
T∗ P
etro
gale
peni
cill
ata
(Roc
kyPl
ains
Cre
ek)
811
1.9
0.34
Bro
wni
nget
al.(
2001
)T∗ L
asio
rhin
uskr
efft
ii(E
ppin
gFo
rest
)28
161.
80.
27Ta
ylor
etal
.(19
94)
TL
agor
ches
tes
hirs
utus
(Ber
nier
Isla
nd)
178
1.8
0.25
Eld
ridg
eet
al.(
2004
a)T∗ P
eram
eles
boug
ainv
ille
(Hei
riss
on)b
296
1.8
0.27
Smith
and
Hug
hes
(200
8)∗ P
hasc
olar
ctus
cine
reus
(Eyr
ePe
nins
ula)
b20
61.
70.
21Se
ymou
ret
al.(
2001
)T∗ P
aran
tech
inus
apic
alis
(Whi
tlock
Isla
nd)
317
1.6
0.20
Mill
set
al.(
2004
)T
Das
yuru
sha
lluc
atus
(Mar
chin
bar
Isla
nd)
275
1.6
0.14
Car
doso
etal
.(20
09)
T∗ P
etro
gale
l.la
tera
lis
(Bar
row
Isla
nd)
2810
1.2
0.05
Eld
ridg
eet
al.(
1999
)
Dat
aar
eon
lypr
esen
ted
for
stud
ies
whe
reN
≥15.
Popu
latio
nsar
eor
dere
dby
decr
easi
ngva
lues
ofA
TT
hrea
tene
dta
xon
(EPB
CA
ct19
99)
∗ Pop
ulat
ions
that
have
expe
rien
ced
are
cent
dem
ogra
phic
bottl
enec
kor
are
cent
subs
tant
ialr
ange
cont
ract
ion
(see
Van
Dyc
kan
dSt
raha
n,20
08or
cite
dre
fere
nce)
#Sa
mpl
espo
oled
from
mul
tiple
loca
litie
sa Pe
rson
alco
mm
unic
atio
nbPo
pula
tion
esta
blis
hed
via
tran
sloc
atio
nc Fr
omm
useu
msp
ecim
ens
dC
aptiv
epo
pula
tion
e Ext
inct
popu
latio
nN
Z=
New
Zea
land
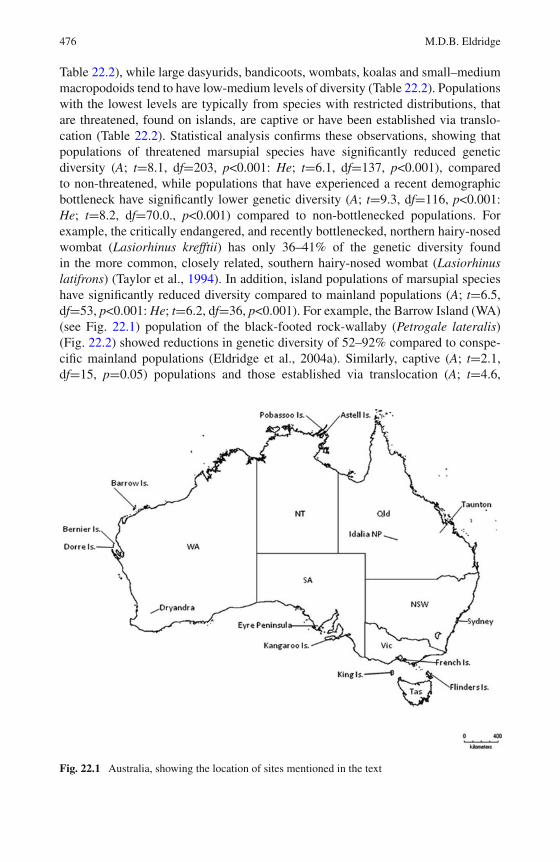
476 M.D.B. Eldridge
Table 22.2), while large dasyurids, bandicoots, wombats, koalas and small–mediummacropodoids tend to have low-medium levels of diversity (Table 22.2). Populationswith the lowest levels are typically from species with restricted distributions, thatare threatened, found on islands, are captive or have been established via translo-cation (Table 22.2). Statistical analysis confirms these observations, showing thatpopulations of threatened marsupial species have significantly reduced geneticdiversity (A; t=8.1, df=203, p<0.001: He; t=6.1, df=137, p<0.001), comparedto non-threatened, while populations that have experienced a recent demographicbottleneck have significantly lower genetic diversity (A; t=9.3, df=116, p<0.001:He; t=8.2, df=70.0., p<0.001) compared to non-bottlenecked populations. Forexample, the critically endangered, and recently bottlenecked, northern hairy-nosedwombat (Lasiorhinus krefftii) has only 36–41% of the genetic diversity foundin the more common, closely related, southern hairy-nosed wombat (Lasiorhinuslatifrons) (Taylor et al., 1994). In addition, island populations of marsupial specieshave significantly reduced diversity compared to mainland populations (A; t=6.5,df=53, p<0.001: He; t=6.2, df=36, p<0.001). For example, the Barrow Island (WA)(see Fig. 22.1) population of the black-footed rock-wallaby (Petrogale lateralis)(Fig. 22.2) showed reductions in genetic diversity of 52–92% compared to conspe-cific mainland populations (Eldridge et al., 2004a). Similarly, captive (A; t=2.1,df=15, p=0.05) populations and those established via translocation (A; t=4.6,
Fig. 22.1 Australia, showing the location of sites mentioned in the text
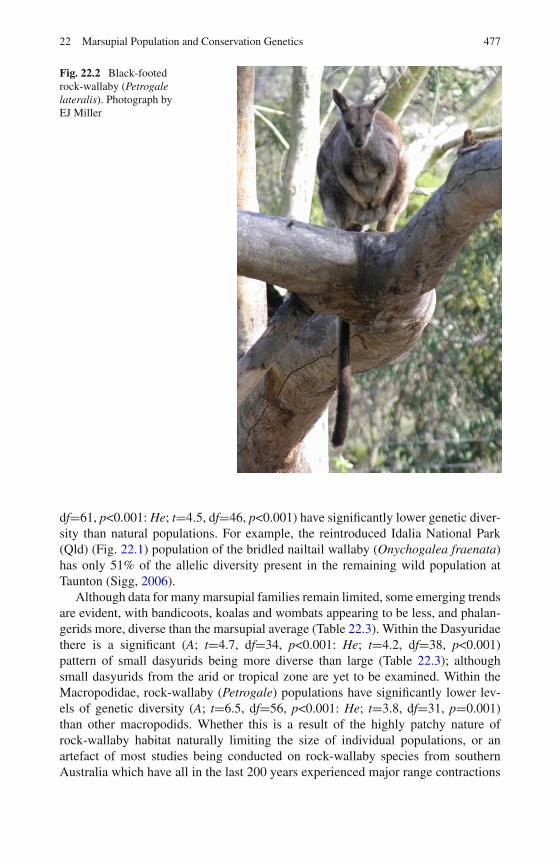
22 Marsupial Population and Conservation Genetics 477
Fig. 22.2 Black-footedrock-wallaby (Petrogalelateralis). Photograph byEJ Miller
df=61, p<0.001: He; t=4.5, df=46, p<0.001) have significantly lower genetic diver-sity than natural populations. For example, the reintroduced Idalia National Park(Qld) (Fig. 22.1) population of the bridled nailtail wallaby (Onychogalea fraenata)has only 51% of the allelic diversity present in the remaining wild population atTaunton (Sigg, 2006).
Although data for many marsupial families remain limited, some emerging trendsare evident, with bandicoots, koalas and wombats appearing to be less, and phalan-gerids more, diverse than the marsupial average (Table 22.3). Within the Dasyuridaethere is a significant (A; t=4.7, df=34, p<0.001: He; t=4.2, df=38, p<0.001)pattern of small dasyurids being more diverse than large (Table 22.3); althoughsmall dasyurids from the arid or tropical zone are yet to be examined. Within theMacropodidae, rock-wallaby (Petrogale) populations have significantly lower lev-els of genetic diversity (A; t=6.5, df=56, p<0.001: He; t=3.8, df=31, p=0.001)than other macropodids. Whether this is a result of the highly patchy nature ofrock-wallaby habitat naturally limiting the size of individual populations, or anartefact of most studies being conducted on rock-wallaby species from southernAustralia which have all in the last 200 years experienced major range contractions
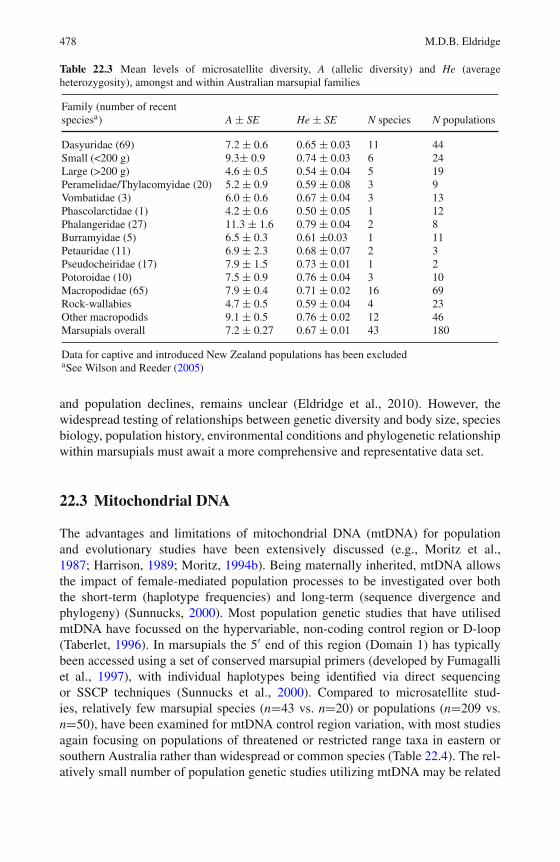
478 M.D.B. Eldridge
Table 22.3 Mean levels of microsatellite diversity, A (allelic diversity) and He (averageheterozygosity), amongst and within Australian marsupial families
Family (number of recentspeciesa) A ± SE He ± SE N species N populations
Dasyuridae (69) 7.2 ± 0.6 0.65 ± 0.03 11 44Small (<200 g) 9.3± 0.9 0.74 ± 0.03 6 24Large (>200 g) 4.6 ± 0.5 0.54 ± 0.04 5 19Peramelidae/Thylacomyidae (20) 5.2 ± 0.9 0.59 ± 0.08 3 9Vombatidae (3) 6.0 ± 0.6 0.67 ± 0.04 3 13Phascolarctidae (1) 4.2 ± 0.6 0.50 ± 0.05 1 12Phalangeridae (27) 11.3 ± 1.6 0.79 ± 0.04 2 8Burramyidae (5) 6.5 ± 0.3 0.61 ±0.03 1 11Petauridae (11) 6.9 ± 2.3 0.68 ± 0.07 2 3Pseudocheiridae (17) 7.9 ± 1.5 0.73 ± 0.01 1 2Potoroidae (10) 7.5 ± 0.9 0.76 ± 0.04 3 10Macropodidae (65) 7.9 ± 0.4 0.71 ± 0.02 16 69Rock-wallabies 4.7 ± 0.5 0.59 ± 0.04 4 23Other macropodids 9.1 ± 0.5 0.76 ± 0.02 12 46Marsupials overall 7.2 ± 0.27 0.67 ± 0.01 43 180
Data for captive and introduced New Zealand populations has been excludedaSee Wilson and Reeder (2005)
and population declines, remains unclear (Eldridge et al., 2010). However, thewidespread testing of relationships between genetic diversity and body size, speciesbiology, population history, environmental conditions and phylogenetic relationshipwithin marsupials must await a more comprehensive and representative data set.
22.3 Mitochondrial DNA
The advantages and limitations of mitochondrial DNA (mtDNA) for populationand evolutionary studies have been extensively discussed (e.g., Moritz et al.,1987; Harrison, 1989; Moritz, 1994b). Being maternally inherited, mtDNA allowsthe impact of female-mediated population processes to be investigated over boththe short-term (haplotype frequencies) and long-term (sequence divergence andphylogeny) (Sunnucks, 2000). Most population genetic studies that have utilisedmtDNA have focussed on the hypervariable, non-coding control region or D-loop(Taberlet, 1996). In marsupials the 5′ end of this region (Domain 1) has typicallybeen accessed using a set of conserved marsupial primers (developed by Fumagalliet al., 1997), with individual haplotypes being identified via direct sequencingor SSCP techniques (Sunnucks et al., 2000). Compared to microsatellite stud-ies, relatively few marsupial species (n=43 vs. n=20) or populations (n=209 vs.n=50), have been examined for mtDNA control region variation, with most studiesagain focusing on populations of threatened or restricted range taxa in eastern orsouthern Australia rather than widespread or common species (Table 22.4). The rel-atively small number of population genetic studies utilizing mtDNA may be related
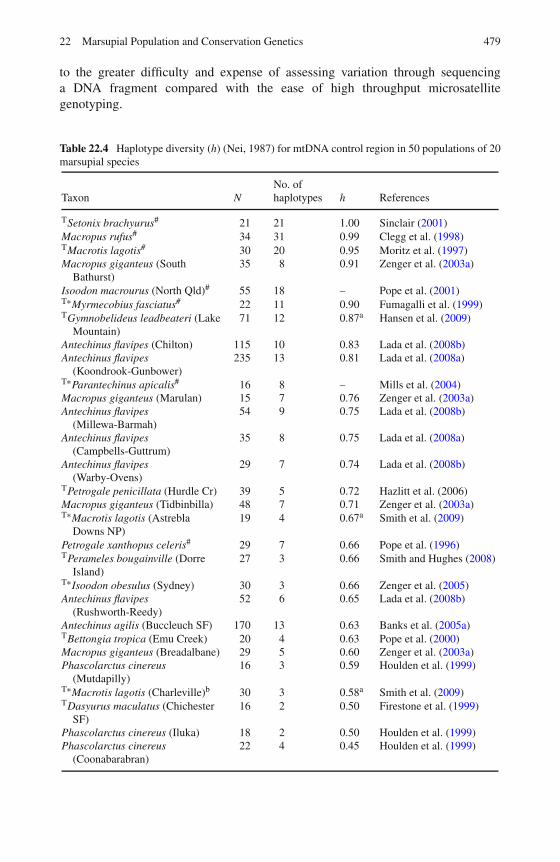
22 Marsupial Population and Conservation Genetics 479
to the greater difficulty and expense of assessing variation through sequencinga DNA fragment compared with the ease of high throughput microsatellitegenotyping.
Table 22.4 Haplotype diversity (h) (Nei, 1987) for mtDNA control region in 50 populations of 20marsupial species
Taxon NNo. ofhaplotypes h References
TSetonix brachyurus# 21 21 1.00 Sinclair (2001)Macropus rufus# 34 31 0.99 Clegg et al. (1998)TMacrotis lagotis# 30 20 0.95 Moritz et al. (1997)Macropus giganteus (South
Bathurst)35 8 0.91 Zenger et al. (2003a)
Isoodon macrourus (North Qld)# 55 18 – Pope et al. (2001)T∗Myrmecobius fasciatus# 22 11 0.90 Fumagalli et al. (1999)TGymnobelideus leadbeateri (Lake
Mountain)71 12 0.87a Hansen et al. (2009)
Antechinus flavipes (Chilton) 115 10 0.83 Lada et al. (2008b)Antechinus flavipes
(Koondrook-Gunbower)235 13 0.81 Lada et al. (2008a)
T∗Parantechinus apicalis# 16 8 – Mills et al. (2004)Macropus giganteus (Marulan) 15 7 0.76 Zenger et al. (2003a)Antechinus flavipes
(Millewa-Barmah)54 9 0.75 Lada et al. (2008b)
Antechinus flavipes(Campbells-Guttrum)
35 8 0.75 Lada et al. (2008a)
Antechinus flavipes(Warby-Ovens)
29 7 0.74 Lada et al. (2008b)
TPetrogale penicillata (Hurdle Cr) 39 5 0.72 Hazlitt et al. (2006)Macropus giganteus (Tidbinbilla) 48 7 0.71 Zenger et al. (2003a)T∗Macrotis lagotis (Astrebla
Downs NP)19 4 0.67a Smith et al. (2009)
Petrogale xanthopus celeris# 29 7 0.66 Pope et al. (1996)TPerameles bougainville (Dorre
Island)27 3 0.66 Smith and Hughes (2008)
T∗Isoodon obesulus (Sydney) 30 3 0.66 Zenger et al. (2005)Antechinus flavipes
(Rushworth-Reedy)52 6 0.65 Lada et al. (2008b)
Antechinus agilis (Buccleuch SF) 170 13 0.63 Banks et al. (2005a)TBettongia tropica (Emu Creek) 20 4 0.63 Pope et al. (2000)Macropus giganteus (Breadalbane) 29 5 0.60 Zenger et al. (2003a)Phascolarctus cinereus
(Mutdapilly)16 3 0.59 Houlden et al. (1999)
T∗Macrotis lagotis (Charleville)b 30 3 0.58a Smith et al. (2009)TDasyurus maculatus (Chichester
SF)16 2 0.50 Firestone et al. (1999)
Phascolarctus cinereus (Iluka) 18 2 0.50 Houlden et al. (1999)Phascolarctus cinereus
(Coonabarabran)22 4 0.45 Houlden et al. (1999)
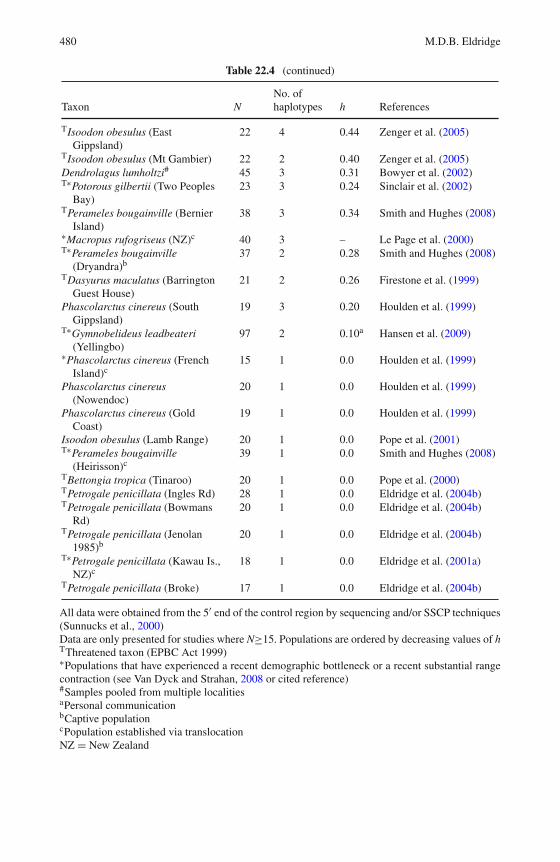
480 M.D.B. Eldridge
Table 22.4 (continued)
Taxon NNo. ofhaplotypes h References
TIsoodon obesulus (EastGippsland)
22 4 0.44 Zenger et al. (2005)
TIsoodon obesulus (Mt Gambier) 22 2 0.40 Zenger et al. (2005)Dendrolagus lumholtzi# 45 3 0.31 Bowyer et al. (2002)T∗Potorous gilbertii (Two Peoples
Bay)23 3 0.24 Sinclair et al. (2002)
TPerameles bougainville (BernierIsland)
38 3 0.34 Smith and Hughes (2008)
∗Macropus rufogriseus (NZ)c 40 3 – Le Page et al. (2000)T∗Perameles bougainville
(Dryandra)b37 2 0.28 Smith and Hughes (2008)
TDasyurus maculatus (BarringtonGuest House)
21 2 0.26 Firestone et al. (1999)
Phascolarctus cinereus (SouthGippsland)
19 3 0.20 Houlden et al. (1999)
T∗Gymnobelideus leadbeateri(Yellingbo)
97 2 0.10a Hansen et al. (2009)
∗Phascolarctus cinereus (FrenchIsland)c
15 1 0.0 Houlden et al. (1999)
Phascolarctus cinereus(Nowendoc)
20 1 0.0 Houlden et al. (1999)
Phascolarctus cinereus (GoldCoast)
19 1 0.0 Houlden et al. (1999)
Isoodon obesulus (Lamb Range) 20 1 0.0 Pope et al. (2001)T∗Perameles bougainville
(Heirisson)c39 1 0.0 Smith and Hughes (2008)
TBettongia tropica (Tinaroo) 20 1 0.0 Pope et al. (2000)TPetrogale penicillata (Ingles Rd) 28 1 0.0 Eldridge et al. (2004b)TPetrogale penicillata (Bowmans
Rd)20 1 0.0 Eldridge et al. (2004b)
TPetrogale penicillata (Jenolan1985)b
20 1 0.0 Eldridge et al. (2004b)
T∗Petrogale penicillata (Kawau Is.,NZ)c
18 1 0.0 Eldridge et al. (2001a)
TPetrogale penicillata (Broke) 17 1 0.0 Eldridge et al. (2004b)
All data were obtained from the 5′ end of the control region by sequencing and/or SSCP techniques(Sunnucks et al., 2000)Data are only presented for studies where N≥15. Populations are ordered by decreasing values of hTThreatened taxon (EPBC Act 1999)∗Populations that have experienced a recent demographic bottleneck or a recent substantial rangecontraction (see Van Dyck and Strahan, 2008 or cited reference)#Samples pooled from multiple localitiesaPersonal communicationbCaptive populationcPopulation established via translocationNZ = New Zealand
22 Marsupial Population and Conservation Genetics 481
22.3.1 Genetic Diversity at the mtDNA Control Region
Levels of mtDNA control region diversity identified within the 50 marsupialpopulations examined to date vary considerably (Table 22.4). Haplotype diver-sity (h), varies across its full range from 0.0 to 1.0 (average ± se = 0.47±0.05);while the number of haplotypes identified ranged from 1 to 31 (average ± se =5.8±0.9). These values are similar to those reported in populations of eutherians(Fernando et al., 2000; Nyakaana et al., 2002; Arrendal et al., 2004). The limitednumber of marsupial population studies that have utilized the control region cur-rently limits detailed and conclusive analyses. Analysis is further compromisedby the fact that in many studies (including the three reporting the highest val-ues), samples were pooled from multiple localities (Table 22.4) which is likely toinflate the value of diversity parameters. Although trends in the levels of diversityappear broadly similar (Table 22.4) to those observed for the microsatellite data(Table 22.2), only differences between the number of haplotypes for bottleneckedvs. non-bottlenecked populations (t=2.2, df=42, p=0.03), as well as differencesbetween h (t=2.5, df=13.1, p=0.03) for rock-wallabies vs. other macropodids weresignificant.
22.4 Managing Genetic Diversity
A priority of conservation genetics is to understand and address the impact of lossof genetic diversity and therefore evolutionary potential, increased inbreeding andreduced fitness, that are usually a consequence of isolation and small populationsize, which act to increase the likelihood of population extinction (Saccheri et al.,1998; Frankham et al., 2002; Briskie and Mackingtosh, 2004; Frankham, 2005).The loss of genetic diversity, the raw material of evolution, reduces a population’sability to evolve and adapt to changing environmental conditions (Frankham et al.,2002). Inbreeding (mating between relatives) increases homozygosity throughoutthe genome and so elevates the expression of deleterious recessive alleles. Thistypically results in the production of offspring with reduced fitness (ie, inbreed-ing depression) and so increases an inbred population’s vulnerability to extinction(Frankham et al., 2002). It is important then that genetic factors are taken intoaccount when managing marsupial populations, especially those that typically havereduced diversity (threatened species, bottlenecked, island, translocated and cap-tive populations; Tables 22.2 and 22.4) and to avoid management strategies (limitedfounders, serial bottlenecking, lack of ongoing supplementation) that will furtherdeplete variation. Koala (Phascolarctos cinereus) populations in southern Australiaprovide a good example of the consequences of poor management, with manypopulations established historically via small numbers of founders and serial bot-tlenecking now showing significantly reduced diversity, and some, high levelsof inbreeding and reduced fitness (Houlden et al., 1996b; Seymour et al., 2001;Cristescu et al., 2009). For example, the Eyre Peninsula (SA) (Fig. 22.1) koala
482 M.D.B. Eldridge
population has an effective inbreeding coefficient of 0.75, and 24% of males showtesticular aplasia (Seymour et al., 2001). Koalas (n=6) where introduced to EyrePeninsula from Kangaroo Island (SA) in the 1960s. The Kangaroo Island popu-lation had itself been introduced in the 1920s using 18 individuals sourced fromFrench Island (Vic), where a population had originally been established in the 1880susing 2–3 mainland animals as founders (Seymour et al., 2001). By contrast, thepopulations of northern quoll (Dasyurus hallucatus) recently introduced to Astelland Pobassoo Islands (NT) (Fig. 22.1) and the captive western barred bandicoot(Perameles bougainville) population established at Dryandra (WA) (Fig. 22.1), wereestablished using founders from multiple wild populations and have resulted in newrelatively diverse populations (Smith and Hughes, 2008; Cardoso et al., 2009).
The significantly reduced diversity observed in threatened marsupial species ismost likely a direct consequence of their persistence at small effective populationsize for multiple generations (Spielman et al., 2004), but this is also likely to makepopulation recovery more difficult (Evans and Sheldon, 2008) and increase their vul-nerability to extinction in the future (Frankham et al., 2002). In some cases however,a lack of genetic diversity may be the cause of their endangerment. For example, theTasmanian devil (Sarcophilis harrisii) provides an alarming and salutary exampleof a formerly abundant, but ultimately genetically compromised, population beingrapidly brought to the edge of extinction by widespread susceptibility to a novel dis-ease (McCallum et al., 2007; Siddle et al., 2007). In the late 1990s the Tasmaniandevil was widespread and common in Tasmanian (McCallum, 2008) and regardedas secure (Maxwell et al., 1996). However, the emergence in 1996 of the invariablyfatal contagious cancer DFTD (devil facial tumour disease; see Bender, Chapter 23),and its subsequent rapid spread, has decimated devil populations, with extinction inthe wild now seeming likely (Jones et al., 2007). Although devils do have moder-ately low diversity at microsatellite loci (Jones et al., 2004) (Table 22.2), the spreadof DFTD appears specifically linked to reduced diversity at MHC loci which pre-vent the devils’ immune system from recognising the DFTD cells as foreign and sorejecting them (Siddle et al., 2007). This example highlights that the genetic qualityof individuals can be more important in ensuring long term survival than simplythe quantity of individuals, and that numerically numerous but genetically uniformpopulations are likely to be inherently vulnerable to extinction.
Although reduced diversity is also typical of bottlenecked marsupial populations,there are some notable exceptions (Tables 22.2 and 22.4), where bottlenecked pop-ulation retain high levels of diversity (e.g., bridled nailtail wallaby, tammar wallaby,numbat (Myrmecobius fasciatus)). These exceptions illustrate that not all demo-graphic bottlenecks are sufficiently severe or prolonged to result in a major lossof genetic diversity, as population genetic theory predicts (Frankham et al., 2002).Nevertheless the overall pattern in the marsupial (Table 22.2) and other data (Briskieand Mackingtosh, 2004; Garner et al., 2005) is clear and it would remain prudent topay close attention to the management of bottlenecked populations, many of whichare already of conservation concern.
Also of conservation concern are island populations of Australian marsupials,especially those that currently preserve at least 10 marsupial species most of which
22 Marsupial Population and Conservation Genetics 483
disappeared from the Australian mainland in the last 200 years (Eldridge, 1998;Burbidge, 1999; Abbott, 2000). Increasingly, these island populations are beingused to source conservation initiatives including captive breeding, reintroductionsand translocations (Christensen and Burrows, 1994; Maxwell et al., 1996; Finlaysonand Moseby, 2004; Smith and Hughes, 2008). For example, since 1990 burrowingbettongs (Bettongia lesueur) from Bernier and Dorre Islands (WA) (Fig. 22.1) havebeen translocated to six sites in western and central Australia (Finlayson et al., 2010)in attempts to re-establish populations. In addition, threatened species are still beingactively introduced to islands as a management strategy to established “back-up”populations isolated from mainland threatening processes such as introduced preda-tors/competitors, changed fire regimes and poisoning by introduced cane toads (e.g.,Gilbert’s potoroo (Potorous gilbertii), northern quoll, golden bandicoot (Isoodonauratus), Van Dyck and Strahan (2008)). Although islands and island populationscurrently play a significant role in biodiversity conservation in Australia (and inter-nationally, e.g., Lloyd and Powlesland, 1994; Daltry et al., 2001; Boessenkoolet al., 2007; Cheke and Hume, 2008), it is becoming clear that the unique islandenvironment (e.g., isolation, limited size, reduced ecological complexity etc.) canalso negatively impact the long-term evolutionary potential of resident populations,through the erosion of genetic diversity (as a consequence of finite size and isola-tion Frankham et al., 2002), inbreeding (Frankham, 1998; Eldridge et al., 2004a),reduced fitness (Eldridge et al., 1999) and adaptations to the island environment(reduced dispersal and fecundity, predator naivety etc. (Grant, 1998)). These fac-tors make most island populations inherently vulnerable to extinction, as historyhas powerfully demonstrated with island taxa being significantly over-representedin recorded extinctions (Frankham, 1998), and caution against an over reliance onislands and islands population for conservation (Eldridge, 1998).
The predicted pattern of reduced genetic diversity in island populations(Frankham, 1997) is strongly supported by the marsupial data, with reduction upto 90% compared to conspecific mainland populations being observed (Table 22.2).The only exceptions (Table 22.2) were some high density macropodid populationinhabiting large (>100,000 ha), temperate, fertile islands (Kangaroo, Flinders, KingIslands) where presumably large effective population sizes have enabled moderateto high levels of genetic diversity to be maintained. However for most island popu-lations, erosion of diversity, increased inbreeding and an increased risk of extinctionis inevitable and populations recently marooned on islands as a conservation strat-egy will, in the absence of gene flow, follow a similar trajectory. The same is truefor any small isolated population, whether inhabiting an isolated patch of habitatin a fragmented landscape, a fenced enclosure or a captive colony, and makes theregular exchange of individuals or the reestablishment of gene flow a high priorityand a major challenge for wildlife managers and conservation biologists.
For those marsupial species naturally found on multiple islands, the potentialexists to recreate more genetically diverse and robust populations for use in conser-vation initiatives. For although individual islands retain little diversity, each islandis likely to preserve a different subsets of mainland alleles (e.g., Eldridge et al.,1999; Cardoso et al., 2009; How et al., 2009), due to the random nature of genetic
484 M.D.B. Eldridge
drift. As a consequence, a population established with founders from multiple islandpopulations will have significantly increased diversity (e.g., Smith and Hughes,2008), while the addition of unrelated individuals is also likely to increase the fitnessof those populations suffering inbreeding depression (Eldridge et al., 1999). as hasbeen reported in a wide variety of species (Saccheri et al., 1996; Westemeier et al.,1998; Madsen et al., 1999; Vila et al., 2003; Pimm et al., 2006).
22.5 Genetics Informing Management
As well as assessing a population’s “genetic health”, molecular genetics techniques,especially when coupled with detailed ecological, behavioural or geographic data,can also be harnessed as a powerful tool to inform the management of marsupi-als by increasing knowledge of their often cryptic behaviour ecology, reproductionand evolutionary history. For South American marsupials most recent populationgenetics studies have explored phylogeography (Steiner and Catzeflis, 2004; Himeset al., 2008), as well as clarifying taxonomy, species identification and speciesboundaries (Lavergne et al., 1997; Patton and Costa, 2003; Lavergne et al., 2010).For Australian species population genetics studies have addressed a broader arrayof questions (Table 22.5) and have fundamentally transformed our understanding ofmany aspects of species biology and greatly enhanced the effective management ofpopulations and entire species.
An aim of many molecular studies has been the use of genetic markers to deter-mine the most appropriate population units and geographic scale for within speciesmanagement. These are usually based around the concept of management units(MUs) and evolutionary significant units (ESUs) of Moritz (1994a) which seekto ensure that major evolutionary lineages and unique diversity within species isidentified and managed appropriately. While for some marsupials the presence orabsence of major contemporary or historic barriers to gene flow is predictable (e.g.,Houlden et al., 1999; Pope et al., 2000; Spencer et al., 2001; Brown et al., 2006)for many it is not (e.g., Cooper et al., 2000; Neaves et al., 2009) and significantunexpected divergence or lack of divergence is regularly reported. For example,the Tasmanian population of the spot-tailed quoll (Dasyurus maculatus) unexpect-edly shows significant genetic divergence from the mainland population (Firestoneet al., 1999), while the in the eastern grey kangaroo (Macropus giganteus) thereverse was reported, with the difference between the Tasmania and mainland popu-lations being trivial, when it was expected to be significant (Zenger et al., 2003a). Insouth-eastern Australia, significant divergence was surprisingly identified within thebrush-tailed rock-wallaby (Petrogale penicillata) with a major discontinuity, sug-gestive of long term isolation, present in mtDNA haplotypes south of Sydney, NSW(Eldridge et al., 2001a). Intriguingly in this same area the distributions of siblingspecies of Antechinus and Trichosurus abut (Dickman et al., 1998; Lindenmayeret al., 2002), suggesting that a major (and previously unknown) barrier to gene flowwas present in this area millennia ago, resulting in substantial divergence and genetic
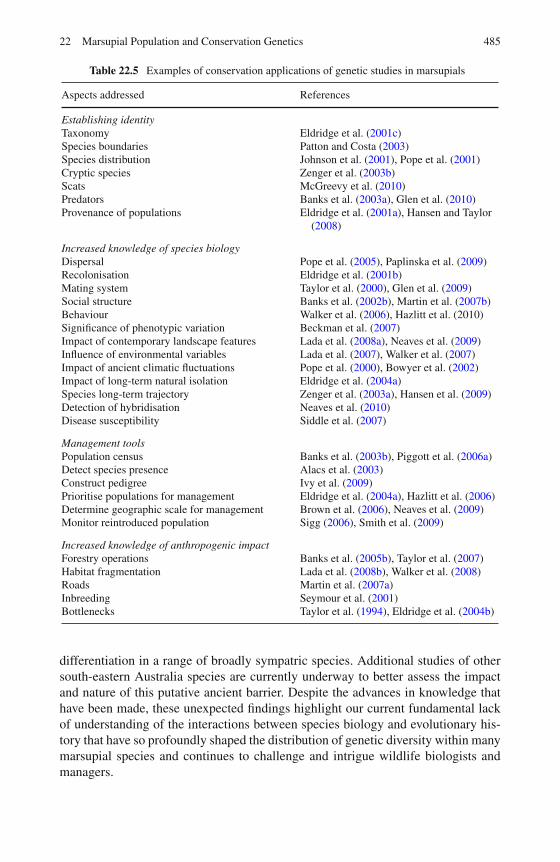
22 Marsupial Population and Conservation Genetics 485
Table 22.5 Examples of conservation applications of genetic studies in marsupials
Aspects addressed References
Establishing identityTaxonomy Eldridge et al. (2001c)Species boundaries Patton and Costa (2003)Species distribution Johnson et al. (2001), Pope et al. (2001)Cryptic species Zenger et al. (2003b)Scats McGreevy et al. (2010)Predators Banks et al. (2003a), Glen et al. (2010)Provenance of populations Eldridge et al. (2001a), Hansen and Taylor
(2008)
Increased knowledge of species biologyDispersal Pope et al. (2005), Paplinska et al. (2009)Recolonisation Eldridge et al. (2001b)Mating system Taylor et al. (2000), Glen et al. (2009)Social structure Banks et al. (2002b), Martin et al. (2007b)Behaviour Walker et al. (2006), Hazlitt et al. (2010)Significance of phenotypic variation Beckman et al. (2007)Impact of contemporary landscape features Lada et al. (2008a), Neaves et al. (2009)Influence of environmental variables Lada et al. (2007), Walker et al. (2007)Impact of ancient climatic fluctuations Pope et al. (2000), Bowyer et al. (2002)Impact of long-term natural isolation Eldridge et al. (2004a)Species long-term trajectory Zenger et al. (2003a), Hansen et al. (2009)Detection of hybridisation Neaves et al. (2010)Disease susceptibility Siddle et al. (2007)
Management toolsPopulation census Banks et al. (2003b), Piggott et al. (2006a)Detect species presence Alacs et al. (2003)Construct pedigree Ivy et al. (2009)Prioritise populations for management Eldridge et al. (2004a), Hazlitt et al. (2006)Determine geographic scale for management Brown et al. (2006), Neaves et al. (2009)Monitor reintroduced population Sigg (2006), Smith et al. (2009)
Increased knowledge of anthropogenic impactForestry operations Banks et al. (2005b), Taylor et al. (2007)Habitat fragmentation Lada et al. (2008b), Walker et al. (2008)Roads Martin et al. (2007a)Inbreeding Seymour et al. (2001)Bottlenecks Taylor et al. (1994), Eldridge et al. (2004b)
differentiation in a range of broadly sympatric species. Additional studies of othersouth-eastern Australia species are currently underway to better assess the impactand nature of this putative ancient barrier. Despite the advances in knowledge thathave been made, these unexpected findings highlight our current fundamental lackof understanding of the interactions between species biology and evolutionary his-tory that have so profoundly shaped the distribution of genetic diversity within manymarsupial species and continues to challenge and intrigue wildlife biologists andmanagers.
486 M.D.B. Eldridge
22.6 Future Directions
Population genetic studies utilising microsatellites or the mtDNA control regionhave so far been conducted on less than 15% of marsupial species. However, thepotential of these hypervariable markers has been powerfully demonstrated as thesestudies have begun to transform our understanding of marsupial population biology,ecology, behaviour, reproduction and evolution. They have also been instrumen-tal in formulating and guiding conservation initiatives and management plans formany threatened taxa. It is hoped that in the future, population genetic studiescan be expanded to include a larger number of South American species as well aswidespread and abundant Australian species, especially those in northern Australiathat have been less severely impacted by European settlement. Another priorityshould be an examination of the unique marsupial fauna of New Guinea and theislands of eastern Indonesia which remains virtually unknown from a populationgenetics perspective (but see McGreevy, 2009).
The scale and scope of marsupial population genetic studies is becoming increas-ingly easy through the continuing development of novel genetic markers, methodsof high through-put genotypic screening and sequencing and the increasing reliabil-ity of non-invasive sampling. In particular, the availability of the DNA sequencefor the entire genome of two marsupials (see Papenfuss et al., Chapter 6) willdramatically increase the ease with which additional microsatellite loci, and othergenetic markers (e.g., SNPs – single nucleotide polymorphisms), can be identifiedand developed. The availability of marsupial genome sequences and linkage maps(Deakin, Chapter 5; Samollow, Chapter 4) will also enable genetic markers to betargeted to link to specific genes or genome region of interest (e.g., MHC), allow-ing the detailed exploration of life history, behavioural and reproductive strategies(e.g., mate choice, kin recognition, sociality, disease/parasite susceptibility etc.).The recently developed X and Y chromosome-specific (MacDonald et al., 2006;2007) and MHC-linked (Cheng et al., 2009a, b) microsatellite loci are examplesof the evolving molecular tools available to researchers and managers. The sci-entific and conservation community can expect to see continued growth in thenumber of population and conservation genetics studies of marsupials and a cor-responding increase in our detailed knowledge of the biology of these uniquemammals.
Glossary
Allele Alternate versions of a locus that differ in DNA sequence.
Allelic diversity (A) A standard measure of population genetic diversity: theaverage number of alleles per locus.
Allozyme Different forms of a blood or tissue enzyme/protein detected byelectrophoresis.
22 Marsupial Population and Conservation Genetics 487
Average heterozygosity (He) A standard measure of population genetic diversity:the sum of heterozygosities at all loci, divided by the number of loci examined.Range 0–1.
Codominant Where both alleles at a locus are expressed.
Control region or D-loop A non-coding segment of the circular mitochondrialDNA molecular that is the initiation/regulation site for replication. Commonly usedin population genetic studies because its DNA sequence is typically highly variable.
Demographic bottleneck A major reduction in population size.
Effective inbreeding coefficient (Fe) An indirect estimate of the inbreedingcoefficient (F) obtained by measuring the loss of genetic diversity over time.Range 0-1.
Evolutionary potential The genetic diversity present within a population thatenables it to evolve in response to environmental changes.
Founders The individuals used to establish a new population.
Genetic bottleneck A major reduction in population size that results in asignificant loss of genetic diversity.
Genetic drift Changes in allele frequency, including the loss of diversity, due tothe effects of random sampling from one generation to the next in small populations.
Haplotype diversity (h) A standard measure of genetic diversity in mitochon-drial DNA studies: the probability that two randomly selected individuals will havedifferent haplotypes. Range 0–1.
Haplotype A haploid genotype; the allelic combination at different loci on a singlechromosome.
Heterozygote A diploid individual having two copies of the same allele at a locus.
Homozygote A diploid individual having two different alleles at a locus.
Inbreeding depression A reduction in fitness due to inbreeding.
Inbreeding Mating between related individuals.
Locus A specific gene or location on a chromosome.
Non-coding A sequence of DNA that does not code for a protein.
Non-invasive sampling Obtaining a genetic sample without capture and handling(e.g., using scats, hairs etc.).
Population structure The differences in genetic composition amongst popula-tions within a species as the consequence of restrictions/limitations to gene flow.
Recessive An allele whose phenotype is not expressed when heterozygous with adominant allele.
488 M.D.B. Eldridge
Selectively neutral An allele that is not subject to strong natural selection.
Serial bottleneck A sequence of multiple independent demographic bottlenecks.
SSCP (single-strand conformation polymorphism) A method to detect muta-tions in a DNA sequence through differences in the electrophoretic mobility ofdenatured DNA, which arises from the different folding pattern of the individualstrands.
Supplementation The addition of unrelated individuals into an existingpopulation.
Sympatric Species/populations that have overlapping distributions.
Testicular aplasia A failure in testicular development leading to the absence ofone (unilateral) or both (bilateral) mature testes from the scrotum.
References
Abbott I (2000) Improving the conservation of threatened and rare mammal species throughtranslocation to islands: case study Western Australia. Biol Conserv 93:195–201.
Alacs E, Alpers D, de Tores PJ, Dillon MJ, Spencer PBS (2003) Identifying the presence ofquokkas (Setonix brachyurus) and other macropods using cytochrome b analyses from faeces.Wildl Res 30:41–47.
Alpers DL, Taylor AC, Sherwin WB (1998) Genetic structure of populations of the southern hairy-nosed wombat Lasiorhinus latifrons. In: Wells RT, Pridmore PA (eds) Wombats. Surrey Beattyand Sons, Sydney, pp. 192–197.
Arrendal J, Walker CW, Sundqvist A-K, Hellborg L, Vila C (2004) Genetic evaluation of an otterprogram. Conserv Genet 5:79–88.
Avise JC (1994) Molecular Markers, Natural History and Evolution. Chapman and Hall, New Yorkand London.
Banks SC, Piggott MP, Hansen BD, Robinson NA, Taylor AC (2002a) Wombat coprogenetics:enumerating a common wombat population by microsatellite analysis of faecal DNA. Aust JZool 50:193–204.
Banks SC, Skerratt LF, Taylor AC (2002b) Female dispersal and relatedness structure in commonwombats (Vombatus ursinus) J Zool Lond 256:389–399.
Banks SC, Horsup A, Wilton AN, Taylor AC (2003a) Genetic marker investigation of the sourceand impact of predation on a highly endangered mammal. Mol Ecol 12:192–197.
Banks SC, Hoyle SD, Horsup A, Sunnucks P, Taylor AC (2003b) Demographic monitoring of anentire species (the northern hairy-nosed wombat, Lasiorhinus krefftii) by genetic analysis ofnon-invasively collected material. Anim Conserv 6:101–107.
Banks SC, Finlayson GR, Lawson SJ, et al. (2005a) The effects of habitat fragmentation dueto forestry plantation establishment on the demography and genetic variation of a marsupialcarnivore, Antechinus agilis. Biol Conserv 122:581–597.
Banks SC, Ward SJ, Lindenmayer DB, Finlayson GR, Lawson SJ, Taylor AC (2005b) The effectsof habitat fragmentation on the social kin structure and mating system of the agile antechinus,Antechinus agilis. Mol Ecol 14:1789–1801.
Baverstock PR, Adams M, Archer M (1984) Electrophoretic resolution of species boundaries inthe Sminthopsis murina complex (Dasyuridae). Aust J Zool 32:823–832.
Beckman J, Banks SC, Sunnucks P, Lill A, Taylor AC (2007) Phylogeography and environmentalcorrelates of a cap on reproduction: teat number in a small marsupial, Antechinus agilis. MolEcol 16:1069–1083.
22 Marsupial Population and Conservation Genetics 489
Beheregaray LB, Sunnucks P, Alpers D, Banks SC, Taylor AC (2000) A set of microsatelliteloci for the hairy-nosed wombats (Lasiorhinus krefftii and L. latifrons). Conserv Genet 1:89–92.
Boessenkool S, Taylor SS, Tepolt CK, Komdeur J, Jamieson IG (2007) Large mainland populationsof South Island robins retain greater genetic diversity than offshore island refuges. ConservGenet 8:705–714.
Bowyer JC, Newell GR, Eldridge MDB (2002) Genetic effects of habitat contraction onLumholtz’s tree-kangaroo (Dendrolagus lumholtzi) in the Australian Wet Tropics. ConservGenet 3:61–69.
Briskie JV, Mackingtosh M (2004) Hatching failure increases with severity of population bottle-necks in birds. Proc Natl Acad Sci USA 101:558–561.
Brown M, Kendal TA, Cooksley H, et al. (2004) Polymorphic microsatellite markers for the glidingmarsupials Petaurus australis and Petaurus breviceps. Mol Ecol Notes 4:704–706.
Brown M, Cooksley H, Carthew SM, Cooper SJB (2006) Conservation units and phylogeographicstructure of an arboreal marsupial, the yellow-bellied glider (Petaurus australis). Aust J Zool54:305–317.
Browning TL, Taggart DA, Rummery C, Close RL, Eldridge MDB (2001) Multifaceted geneticanalysis of the “Critically Endangered” brush-tailed rock-wallaby Petrogale penicillata inVictoria, Australia: implications for management. Conserv Genet 2:145–156.
Bruford MW, Cheesman DJ, Coote T, et al. (1996) Microsatellites and their application toconservation genetics. In: Smith TB, Wayne RK (eds) Molecular Genetic Approaches inConservation. Oxford University Press, New York, pp. 278–297.
Burbidge AA (1999) Conservation values and management of Australian islands for non-volantmammal conservation. Aust Mammal 21:67–74.
Cardoso M, Eldridge MDB, Oakwood M, Rankmore B, Sherwin WB, Firestone KB (2009) Effectsof founder events on the genetic variation of translocated island populations: implications forconservation management of the northern quoll. Conserv Genet 10:1719–1733.
Cheke A, Hume J (eds) (2008) Lost Land of the Dodo. An Ecological History of Mauritius,Reunion and Rodrigues. T & A Poyser, London.
Cheng Y, Siddle HV, Beck S, Eldridge MDB, Belov K (2009a) High levels of variation atMHC class II DBB loci in the tammar wallaby (Macropus eugenii). Immunogenetics 61:111–118.
Cheng Y, Wakefield MJ, Siddle HV, et al. (2009b) Isolation and characterization of 10 MHCClass I-associated microsatellite loci in tammar wallaby (Macropus eugenii). Mol Ecol Resour9:346–349.
Christensen P, Burrows N (1994) Project Desert Dreaming: an experimental reintroduction ofmammals to the Gibson Desert, Western Australia. In: Serena M (ed) Reintroduction Biologyof Australian and New Zealand Fauna. Surrey Beatty and Sons, Sydney, pp. 199–207.
Clegg SM, Hale P, Moritz C (1998) Molecular population genetics of the red kangaroo (Macropusrufus): mtDNA variation. Mol Ecol 7:679–686.
Clinchy M, Taylor AC, Zanette LY, Krebs CJ, Jarman PJ (2004) Body size, age and paternity incommon brushtail possums (Trichosurus vulpecula). Mol Ecol 13:195–202.
Cooper SJB, Adams M, Labrinidis A (2000) Phylogeography of the Australian dunnartSminthopsis crassicaudata (Marsupialia: Dasyuridae). Aust J Zool 48:461–473.
Cristescu R, Cahill V, Sherwin WB, et al. (2009) Inbreeding and testicular abnormalities in abottlenecked population of (Phascolarctos cinereus). Wildl Res 36:299–308.
Daltry JC, Blooxam Q, Cooper G, et al. (2001) Five years of conserving the ‘world’s rarest snake’,the Antiguan racer Alsophis antiguae. Oryx 35:119–127.
DeWoody JA, Avise JC (2000) Microsatellite variation in marine, freshwater and anadromousfishes compared with other animals. J Fish Biol 56:461–473.
Dias IMG, Amato G, Carvalho MRS, et al. (2008) Characterization of eight microsatellite loci inthe woolly mouse opossum Micoureus paraguayanus, isolated from Micoureus demerare. MolEcol Resour 8:345–347.
490 M.D.B. Eldridge
Dickman CR, King DH, Adams M, Baverstock PR (1988) Electrophoretic identification of anew species of Antechinus (Marsupialia: Dasyuridae) in south-eastern Australia. Aust J Zool36:455–463.
Dickman CR, Parnaby HE, Crowther MS, King DH (1998) Antechinus agilis (Marsupialia:Dasyuridae), a new species from the A. stuartii complex in south-eastern Australia. Aust JZool 46:1–26.
Donaldson FR, Vercoe PE (2008) Cross-family amplification: microsatellites isolated fromMacropodidae are polymorphic in Potoroidae. Mol Ecol Resour 8:452–454.
Eldridge MDB (1998) Trouble in paradise? Nat Aust 26:24–31.Eldridge MDB, King JM, Loupis AK, et al. (1999) Unprecedented low levels of genetic variation
and inbreeding depression in an island population of the black-footed rock-wallaby. ConservBiol 13:531–541.
Eldridge MDB, Browning TL, Close RL (2001a) Provenance of a New Zealand brush-tailedrock-wallaby (Petrogale penicillata) population determined by mitochondrial DNA sequenceanalysis. Mol Ecol 10:2561–2567.
Eldridge MDB, Kinnear JE, Onus ML (2001b) Source population of dispersing rock-wallabies(Petrogale lateralis) identified by assignment tests on multilocus genotypic data. Mol Ecol10:2867–2876.
Eldridge MDB, Wilson AC, Metcalfe CJ, et al. (2001c) Taxonomy of rock-wallabies, Petrogale(Marsupialia: Macropodidae). III. Molecular data confirms the species status of the purple-necked rock-wallaby Petrogale purpureicollis Le Souef 1924. Aust J Zool 49:323–343.
Eldridge MDB, Kinnear JE, Zenger KR, McKenzie LM, Spencer PBS (2004a) Genetic diversity inremnant mainland and ‘pristine’ island populations of three endemic Australian macropodids(Marsupialia): Macropus eugenii, Lagorchestes hirsutus and Petrogale lateralis. Conserv Genet5:325–338.
Eldridge MDB, Rummery C, Bray C, Zenger K, Browning TL, Close RL (2004b) Genetic con-sequences of a population crash in brush-tailed rock-wallabies (Petrogale penicillata) fromJenolan Caves, south-eastern Australia. Wildl Res 31:229–240.
Eldridge MDB, Piggott MP, Hazlitt SL (2010) Population genetic studies of the Macropodoidea: areview. In: Coulson G, Eldridge MDB (eds) Macropods: The Biology of Kangaroos, Wallabiesand Rat-Kangaroos. CSIRO Publishing, Melbourne, pp. 35–51.
Evans SR, Sheldon BC (2008) Interspecific patterns of genetic diversity in birds: correlations withextinction risk. Conserv Biol 22:1016–1025.
Excoffier L, Heckel G (2006) Computer programs for population genetics data analysis. Nat RevGenet 7:745–748.
Fernando P, Pfrender ME, Encalada SE, Lande R (2000) Mitochondrial DNA variation, phylo-geography and population structure of the Asian elephant. Heredity 84:362–372.
Fike JA, Beasley JC, Rhodes OE Jr (2009) Isolation of 21 polymorphic microsatellite markers forthe Virginia opossum (Didelphis virginiana). Mol Ecol Resour 9:1200–1202.
Finlayson GR, Moseby KE (2004) Managing confined populations: the influence of density on thehome range and habitat use of burrowing bettongs (Bettongia lesueur). Wildl Res 31:457–463.
Finlayson GR, Finlayson ST, Dickman CR (2010) Returning the rat-kangraoos: translocationattempts in the family Potoroidae (superfamily Macropodoidea) and recommendations forconservation. In: Coulson G, Eldridge MDB (eds) Macropods: The Biology of Kangaroos,Wallabies and Rat-Kangaroos. CSIRO Publishing, Melbourne, pp. 245–262.
Firestone KB (1999) Isolation and characterization of microsatellites from carnivorous marsupials(Dasyuridae: Marsupialia). Mol Ecol 8:1084–1086.
Firestone KB, Elphinstone MS, Sherwin WB, Houlden BA (1999) Phylogeographical popula-tion structure of tiger quolls Dasyurus maculatus (Dasyuridae: Marsupialia), an endangeredcarnivorous marsupial. Mol Ecol 8:1613–1625.
Firestone KB, Houlden BA, Sherwin WB, Geffen E (2000) Variability and differentiation ofmicrosatellites in the genus Dasyurus and conservation implications for large Australiancarnivorous marsupials. Conserv Genet 1:115–133.
22 Marsupial Population and Conservation Genetics 491
Frankham R (1997) Do island populations have less genetic variation than mainland populations?Heredity 78:311–327.
Frankham R (1998) Inbreeding and extinction: island populations. Conserv Biol 12:665–675.Frankham R (2005) Genetics and extinction. Biol Conserv 126:131–140.Frankham R, Ballou JD, Briscoe DA (2002) Introduction to Conservation Genetics. Cambridge
University Press, Cambridge.Fumagalli L, Pope LC, Taberlet P, Moritz C (1997) Versatile primers for the amplification of the
mitochondrial DNA control region in marsupials. Mol Ecol 6:1199–1201.Fumagalli L, Moritz C, Taberlet P, Friend JA (1999) Mitochondrial DNA sequence variation
within the remnant populations of the endangered (Marsupialia: Myrmecobiidae: Myrmecobiusfasciatus). Mol Ecol 8:1545–1549.
Garner A, Rachlow JL, Hicks JF (2005) Patterns of genetic diversity and its loss in mammalianpopulations. Conserv Biol 19:1215–1221.
Glen AS, Berry O, Sutherland DR, Garretson S, Robinson TJ, de Tores PJ (2010) Forensic DNAconfirms intraguild killing of a chuditch (Dasyurus geoffroii) by a feral cat (Felis catus).Conserv Genet 11 (in press).
Glen AS, Cardoso MJ, Dickman CR, Firestone KB (2009) Who’s your daddy? Paternity testingreveals promiscuity and multiple paternity in the carnivorous marsupial Dasyurus maculatus(Marsupialia: Dasyuridae). Biol J Linn Soc 96:1–7.
Gouin N, Westenberger SJ, Mahaney SM, Lindley P, VandeBerg JL, Samollow PB (2005a)Development, inheritance, and linkage-group assignment of 60 novel microsatellite markersfor the gray short-tailed opossum Monodelphis domestica. Genome 48:1019–1027.
Gouin N, Westenberger SJ, Mahaney SM, Samollow PB (2005b) Isolation and characterization ofpolymorphic microsatellite markers in the gray short-tailed opossum (Monodelphis domestica).Mol Ecol Notes 5:87–89.
Grant PR (1998) Patterns on islands and microevolution. In: Grant PR (ed) Evolution on Islands.Oxford University Press, Oxford, pp. 1–17.
Guillemin M-L, Lavergne A, Catzeflis FM (2000) Microsatellite markers in the common greyfour-eyed opossum (Philander opossum: Didelphidae, Marsupialia). Mol Ecol 9:1440–1442.
Hansen BD, Taylor AC (2008) Isolated remnant or recent introduction? Estimating the provenanceof Yellingbo Leadbeater’s possums by genetic analysis and bottleneck simulation. Mol Ecol17:4039–4052.
Hansen BD, French J, Handasyde KA, Kendal TA, Taylor AC (2003) A set of microsatelliteprimers for the striped possum, Dactylopsila trivirgata (Petauridae: Marsupialia). Mol EcolNotes 3:212–214.
Hansen BD, Sunnucks P, Blacket M, Taylor AC (2005) A set of microsatellite markers for anendangered arboreal marsupial Leadbeater’s possum. Mol Ecol Notes 5:796–799.
Hansen BD, Harley DKP, Lindenmayer DB, Taylor AC (2009) Population genetic analysis revealsa long-term decline of a threatened endemic Australian marsupial. Mol Ecol 18:3346–3362.
Harrison RG (1989) Animal mitochondrial DNA as a genetic marker in population and evolution-ary biology. Trends Ecol Evol 4:6–11.
Hawken RJ, Maccarone P, Toder R, Graves JAM, Maddox JF (1999) Isolation and characterisationof marsupial IL5 genes. Immunogenetics 49:942–948.
Hazlitt SL, Goldizen AW, Eldridge MDB (2006) Significant patterns of population genetic struc-ture and limited gene flow in a threatened macropodid marsupial despite continuous habitat insoutheast Queensland, Australia. Conserv Genet 7:675–689.
Hazlitt SL, Eldridge MDB, Goldizen AW (2010) Strong matrilineal structuring in the brush-tailedrock-wallaby (Petrogale penicillata) confirmed by spatial patterns of mtDNA. In: Coulson G,Eldridge MDB (eds) Macropods: The Biology of Kangaroos, Wallabies and Rat-Kangaroos.CSIRO Publishing, Melbourne, pp. 87–95.
Heckenberg KA (1997) DNA studies of Thylogale: relationships and potential hybridisation ofspecies and subspecies. Honours thesis, University of Western Sydney.
492 M.D.B. Eldridge
Himes CT, Gallardo MH, Kenagy GJ (2008) Historical biogeography and post-glacial recoloniza-tion of South American temperate rainforest by the relictual marsupial Dromiciops gliroides.J Biogeogr 35:1415–1424.
Holleley CE, Dickman CR, Crowther MS, Oldroyd BP (2006) Size breeds success: multiple pater-nity, multivariate selection and male semelparity in a small marsupial, Antechinus stuartii. MolEcol 15:3439–3448.
Houlden BA, England PA, Sherwin WB (1996a) Paternity exclusion in koalas using hypervariablemicrosatellites. J Hered 87:149–152.
Houlden BA, England PR, Taylor AC, Greville WD, Sherwin WB (1996b) Low genetic variabilityof the koala Phascolarctos cinereus in south-eastern Australia following a severe populationbottleneck. Mol Ecol 5:269–281.
Houlden BA, Costello BH, Sharkey D, et al. (1999) Phylogeographic differentiation in the mito-chondrial control region in the koala, Phascolarctos cinereus (Goldfuss 1817). Mol Ecol8:999–1011.
How RA, Spencer PBS, Schmitt LH (2009) Island populations have high conservation valuefor northern Australia’s top marsupial predator ahead of a threatening process. J Zool Lond278:206–217.
Ivy JA, Miller A, Lacy RC, DeWoody JA (2009) Methods and prospects for using molecular datain captive breeding programs: an empirical example using parma wallabies (Macropus parma).J Hered 100:441–454.
Johnson PM, Eldridge MDB, Kiernan V, Cupitt RJ (2001) A significant range extension of thepurple-necked rock-wallaby Petrogale purpureicollis. Aust Mammal 23:71–73.
Johnson PM, Lloyd S, Vallance T, Eldridge MDB (2005) First record of quadruplets in the muskyrat-kangaroo Hypsiprymnodon moschatus. Aust Mammal 27:95–97.
Johnston PG, Sharman GB (1979) Electrophoretic, chromosomal and morphometric studies on thered-necked wallaby Macropus rufogriseus (Desmarest). Aust J Zool 27:433–441.
Jones ME, Paetkau D, Geffen E, Moritz C (2003) Microsatellites for the Tasmanian devil(Sarcophilus laniarius). Mol Ecol Notes 3:277–279.
Jones ME, Paetkau D, Geffen E, Moritz C (2004) Genetic diversity and population structure ofTasmanian devils, the largest marsupial carnivore. Mol Ecol 13:2197–2209.
Jones ME, Jarman PJ, Lees CM, et al. (2007) Conservation management of Tasmanian devils in thecontext of an emerging, extinction-threatening disease: devil facial tumour disease. EcoHealth4:326–337.
Kraaijeveld-Smit FJL, Lindenmayer DB, Taylor AC (2002a) Dispersal patterns and populationstructure in a small marsupial, Antechinus agilis, from two forests analysed using microsatellitemarkers. Aust J Zool 50:325–338.
Kraaijeveld-Smit FJL, Ward SJ, Temple-Smith PD (2002b) Multiple paternity in a field populationof a small carnivorous marsupial, the agile antechinus, Antechinus agilis. Behav Ecol Sociobiol52:84–91.
Kraaijeveld-Smit FJL, Ward SJ, Temple-Smith PD, Paetkau D (2002c) Factors influencing pater-nity success in Antechinus agilis: last-male sperm precedence, timing of mating and geneticcompatibility. J Evol Biol 15:325–338.
Kraaijeveld-Smit FJL, Lindenmayer DB, Taylor AC, MacGregor C, Wertheim B (2007)Comparative genetic structure reflects underlying life histories of three sympatric smallmammal species in continuous forest of south-eastern Australia. Oikos 116:1819–1830.
Lada H, Mac Nally R, Taylor AC (2007) Genetic reconstruction of the population dynamics of acarnivorous marsupial (Antechinus flavipes) in response to floods. Mol Ecol 16:2934–2947.
Lada H, Mac Nally R, Taylor AC (2008a) Distinguishing past from present gene flow alongand across a river: the case of the carnivorous marsupial (Antechinus flavipes) on southernAustralian floodplains. Conserv Genet 9:569–580.
Lada H, Thomson JR, Mac Nally R, Taylor AC (2008b) Impacts of massive landscape change on acarnivorous marsupial in south-eastern Australia: inferences from landscape genetics analysis.J Appl Ecol 45:1732–1741.
22 Marsupial Population and Conservation Genetics 493
Lam M (2000) A major histocompatability (MHC) microsatellite locus in brushtail possums(Trichosurus vulpecula). Online J Vet Res 4:139–141.
Lancaster ML, Cooper SJB, Carthew SM, Taylor AC (2009) Microsatellite markers for thecommon ringtail possum (Pseudocheirus peregrinus) and their amplification in other psue-docheirids. Mol Ecol Resour 9:1535–1537.
Lavergne A, Verneau O, Patton JL, Catzeflis FM (1997) Molecular discrimination of two sym-patric species of opossum (genus Didelphis: Didelphidae) in French Guiana. Mol Ecol6:889–891.
Lavergne A, Douady C, Catzeflis FM (1999) Isolation and characterization of microsatellite lociin Didelphis marsupialis (Marsupialia: Didelphidae). Mol Ecol 8:517–518.
Lavergne A, Verneau O, Patton JL, Catzeflis FM (2010) Delineating geographic bound-aries of the woolly mouse opossums, Micoureus demerarae and Micoureus paraguayanus(Didelphimorphia: Didelphidae). Conserv Genet 11 (in press).
Le Page SL, Livermore RA, Cooper DW, Taylor AC (2000) Genetic analysis of a documentedpopulation bottleneck: introduced Bennett’s wallabies (Macropus rufogriseus rufogriseus) inNew Zealand. Mol Ecol 9:753–763.
Lindenmayer DB, Dubach J, Viggers KL (2002) Geographic dimorphism in the mountain brushtailpossum (Trichosurus caninus): the case for a new species. Aust J Zool 50:369–393.
Lloyd BD, Powlesland RG (1994) The decline of the kakapo Strigops habroptilus and attempts atconservation by translocation. Biol Conserv 69:75–85.
Luikart G, Painter J, Crozier RH, Westerman M, Sherwin WB (1997) Characterization ofmicrosatellite loci in the endangered long-footed potoroo Potorous longipes. Mol Ecol 6:497–498.
MacDonald AJ, Sankovic N, Sarre SD, et al. (2006) Y chromosome microsatellite markers iden-tified from the tammar wallaby (Macropus eugenii) and their amplification in three othermacropod species. Mol Ecol Notes 6:1202–1204.
MacDonald AJ, Sarre SD, Fitzsimmons NN, Marshall Graves JA (2007) Chromosome-specificmicrosatellites from the tammar wallaby X chromosome and chromosome 2. Mol Ecol Notes7:1063–1066.
Macqueen P, Goldizen AW, Seddon JM (2009) Response of a southern temperate marsupial,the Tasmanian pademelon (Thylogale billardierii), to historical and contemporary forestfragmentation. Mol Ecol 18:3291–3306.
Madsen T, Shine R, Olsson M, Wittzell H (1999) Restoration of an inbred adder population. Nature402:34–35.
Majoram P, Tavare S (2006) Modern computational approaches for analysing molecular geneticvariation data. Nat Rev Genet 7:759–770.
Martin JK, Handasyde KA, Taylor AC (2007a) Linear roadside remnants: their influence on den-use, home range and mating system in bobucks (Trichosurus cunninghami). Austral Ecol32:686–696.
Martin JK, Handasyde KA, Taylor AC, Coulson G (2007b) Long-term pair-bonds without matingfidelity in a mammal. Behaviour 144:1419–1445.
Maxwell S, Burbidge AA, Morris K (eds) (1996) The 1996 Action Plan for Australian Marsupialsand Monotremes. Wildlife Australia, Canberra.
McCallum HI (2008) Tasmanian devil facial tumour disease: lessons for conservation biology.Trends Ecol Evol 23:631–637.
McCallum HI, Tompkins DM, Jones ME, et al. (2007) Distribution and impacts of Tasmanian devilfacial tumour disease. EcoHealth 4:318–325.
McGreevy Jr, TJ (2009) Genetic diversity in captive and wild Matschie’s tree-kangaroo(Dendrolagus matschiei) from Huon Peninsula, Papua New Guinea, based on mtDNA controlregion sequences. Zoo Biol 28:183–196.
McGreevy TJ Jr, Dabek L, Husband TP (2010) A multiplex PCR assay to distinguish amongthree sympatric marsupial taxa from Huon Peninsula, Papua New Guinea, using mitochondrialcontrol region. Mol Ecol Resour 9:397–400.
494 M.D.B. Eldridge
Millis AL (2000) Isolation and characterization of microsatellite loci in marsupial gliders (Petaurusnorfolcensis, P. breviceps and P. gracilis). Mol Ecol 9:1681–1683.
Mills HR, Spencer PBS (2003) Polymorphic microsatellites identified in an endangered dasyuridmarsupial, the dibbler (Parantechinus apicalis). Mol Ecol Notes 3:218–220.
Mills HR, Moro D, Spencer PBS (2004) Conservation significance of island versus mainland pop-ulations: a case study of dibblers (Parantechinus apicalis) in Western Australia. Anim Conserv7:387–395.
Mitrovski P, Heinze DA, Guthridge K, Weeks AR (2005) Isolation and characterization ofmicrosatellite loci from the Australian endemic mountain pygmy-possum, Burramys parvusBroom. Mol Ecol Notes 5:395–397.
Mitrovski P, Heinze DA, Broome L, Hoffmann AA, Weeks AR (2007) High levels of varia-tion despite genetic fragmentation in populations of the endangered mountain pygmy-posum,Burramys parvus, in alpine Australia. Mol Ecol 16:75–87.
Moritz C (1994a) Defining “Evolutionary Significant Units” for conservation. Trends Ecol Evol9:373–375.
Moritz C (1994b) Applications of mitochondrial DNA analysis in conservation: a critical review.Mol Ecol 3:401–411.
Moritz C, Dowling TE, Brown WM (1987) Evolution of animal mitochondrial DNA: relevance forpopulation biology and systematics. Annu Rev Ecol Syst 18:269–292.
Moritz C, Heideman A, Geffen E, McRae P (1997) Genetic population structure of the greaterbilby Macrotis lagotis, a marsupial in decline. Mol Ecol 6:925–936.
Neaves LE, Zenger KR, Cooper DW, Eldridge MDB (2010) Molecular detection of hybridizationbetween sympatric kangaroo species in south-eastern Australia. Heredity (in press).
Neaves LE, Zenger KR, Prince RIT, Eldridge MDB, Cooper DW (2009) Landscape discontinu-ities influence gene flow and genetic structure in a large, vagile Australian mammal, Macropusfuliginosus. Mol Ecol 18:3363–3378.
Nei M (1987) Molecular evolutionary genetics. Columbia University Press, New York.Nyakaana S, Arctander P, Siegismund HR (2002) Population structure of the African savannah
elephant inferred from mitochondrial control region sequences and nuclear microsatellite loci.Heredity 89:90–98.
Oliveira EJ, Padua JG, Zucchi MI, Vencovsky R, Vieira MLC (2006) Origin, evolution and genomedistribution of microsatellites. Genet Mol Biol 29:294–307.
Paplinska JZ (2005) Seasonal breeding, puberty and population genetics of the swamp wallaby(Wallabia bicolor). Ph.D. thesis, University of Melbourne.
Paplinska JZ (2006) Final Report of Faecal DNA Analysis of Petrogale penicillata in KangarooValley for NSW National Parks and Wildlife Service. New South Wales National Parks andWildlife Service, Hurstville.
Paplinska JZ, Eldridge MDB, Cooper DW, Temple-Smith PD, Renfree MB (2009) Use of geneticmethods to establish male-biased dispersal in a cryptic mammal, the swamp wallaby (Wallabiabicolor). Aust J Zool 57:65–72.
Patton JL, Costa LP (2003) Molecular phylogeography and species limits in rainforest didelphidmarsupials of South America. In: Jones M, Dickman C, Archer M (eds) Predators with Pouchesthe Biology of Carnivorous Marsupials. CSIRO Publishing, Melbourne, pp. 63–81.
Piggott MP, Banks SC, Stone N, Banffy C, Taylor AC (2006a) Estimating population size of endan-gered brush-tailed rock-wallaby (Petrogale penicillata) colonies using faecal DNA. Mol Ecol15:81–91.
Piggott MP, Banks SC, Taylor AC (2006b) Population structure of brush-tailed rock-wallaby(Petrogale penicillata) colonies inferred from analysis of faecal DNA. Mol Ecol 15:93–105.
Pimm SL, Dollar L, Bass OL Jr (2006) The genetic rescue of the Florida panther. Anim Conserv9:115–122.
Pope LC, Sharp A, Moritz C (1996) Population structure of the yellow-footed rock-wallabyPetrogale xanthopus (Gray, 1854) inferred from mtDNA sequences and microsatellite loci. MolEcol 5:629–640.
22 Marsupial Population and Conservation Genetics 495
Pope LC, Estoup A, Moritz C (2000) Phylogeography and population structure of an ectonalmarsupial, Bettongia tropica, determined from mtDNA and microsatellites. Mol Ecol 9:2041–2053.
Pope LC, Storch D, Adams M, Moritz C, Gordon G (2001) A phylogeny for the genus Isoodonand a range extension for Isoodon obesulus peninsulae based on mtDNA control region andmorphology. Aust J Zool 49:411–434.
Pope LC, Blair D, Johnson CN (2005) Dispersal and population structure of the rufous bettong,Aepyprymnus rufescens (Marsupialia: Potoroidae). Austral Ecol 30:572–580.
Rodrigues FP, Rocha FS, Garcia JE, Garcia JF, De Vivo M, Matioli SR (2006) Isolation andcharacterization of microsatellite loci in the woolly mouse opossum, Micoureus paraguayanus(Marsupialia: Didelphimorphia). Mol Ecol Resour 6:686–688.
Saccheri I, Brakefield PM, Nichols RA (1996) Severe inbreeding depression and rapid fitnessrebound in the butterfly Bicyclus anynana (Satyridae). Evolution 50:2000–2013.
Saccheri I, Kuussaari M, Kankare M, Vikman P, Fortelius W, Hanski I (1998) Inbreeding andextinction in a butterfly metapopulation. Nature 392:491–494.
Sale MG, Kraaijeveld-Smit FJL, Arnould JPY (2009) Natal dispersal and social organization ofthe swamp antechinus (Antechinus minimus) in a high-density island population. Can J Zool87:262–272.
Samollow PB, Kammerer CM, Mahaney SM, et al. (2004) First-generation linkage map of thegray, short-tailed opossum, Monodelphis domestica, reveals genome-wide reduction in femalerecombination rates. Genetics 166:307–329.
Samollow PB, Gouin N, Miethke P, et al. (2007) A microsatellite-based, physically anchoredlinkage map for the gray short-tailed opossum (Monodelphis domestica). Chromosome Res15:269–281.
Seebeck JH, Johnston PG (1980) Potorous longipes (Marsupialia: Macropodidae): a new speciesfrom eastern Victoria. Aust J Zool 28:119–134.
Seymour AM, Montgomery ME, Costello BH, et al. (2001) High effective inbreeding coeffi-cients correlate with morphological abnormalities in populations of South Australian koalas(Phascolarctos cinereus). Anim Conserv 4:211–219.
Sherwin WB, Murray ND (1990) Population and conservation genetics of marsupials. Aust J Zool37:161–180.
Siddle HV, Kreiss A, Eldridge MDB, et al. (2007) Transmission of a fatal clonal tumor by bitingoccurs due to depleted MHC diversity in a threatened carnivorous marsupial. Proc Natl AcadSci USA 104:16221–16226.
Sigg DP (2006) Reduced genetic diversity and significant genetic differentiation after translo-cation: comparison of the remnant and translocated populations of bridled nailtail wallabies(Onychogalea fraenata). Conserv Genet 7:577–589.
Sigg DP, Goldizen AW, Pople AR (2005) The importance of mating system in translocationprograms: reproductive success of released male bridled nailtail wallabies. Biol Conserv123:289–300.
Sinclair AH (2001) Phylogeographic variation in the quokka, Setonix brachyu-rus (Marsupialia: Macropodidae): implications for management. Anim Conserv4:325–333.
Sinclair EA, Costello B, Courtenay JM, Crandall KA (2002) Detecting a genetic bottleneck inGilbert’s potoroo, Potorous gilbertii (Marsupialia: Potoroidae), inferred from microsatellite andmitochondrial DNA sequence data. Conserv Genet 3:191–196.
Smith S, Hughes J (2008) Microsatellite and mitochondrial DNA variation defines island geneticreservoirs for reintroductions of an endangered Australian marsupial, Perameles bougainville.Conserv Genet 9:547–557.
Smith S, McRae P, Hughes J (2009) Faecal DNA analysis enables genetic monitoring of the speciesrecovery program for an arid-dwelling marsupial. Aust J Zool 57:139–148.
Spencer PBS (1996) Coping with a naturally fragmented environment: a genetic and ecolog-ical study of the allied rock-wallaby, Petrogale assimilis. James Cook University of NorthQueensland.
496 M.D.B. Eldridge
Spencer PBS, Bryant KA (2000) Characterization of highly polymorphic microsatellite markers inthe marsupial honey possum (Tarsipes rostrastus). Mol Ecol 9:492–494.
Spencer PBS, Marsh HD (1997) Microsatellite DNA fingerprinting confirms dizygotic twinningand paternity in the Allied Rock-wallaby, Petrogale assimilis (Marsupialia: Macropodidae).Aust Mammal 19:279–280.
Spencer PBS, Odorico DM, Jones SJ, Marsh HD, Miller DJ (1995) Highly variable microsatellitesin isolated colonies of the rock-wallaby (Petrogale assimilis). Mol Ecol 4:523–525.
Spencer PBS, Rhind SG, Eldridge MDB (2001) Phylogeographic structure within Phascogale(Marsupialia: Dasyuridae) based on partial cytochrome b sequence. Aust J Zool 49:369–377.
Spencer PBS, Fletcher TP, Woolley PA (2003) Microsatellite markers from the Julia Creek dunnart,Sminthopsis douglasi (Marsupialia: Dasyuridae). Mol Ecol Notes 3:570–571.
Spencer PBS, Cardoso M, How RA, Williams J, Bunce M, Schmitt LH (2007) Cross-species ampli-fication at microsatellite loci in Australian quolls including the description of five new markersfrom the chuditch (Dasyurus geoffroii). Mol Ecol Notes 7:1100–1103.
Spielman D, Brook BW, Frankham R (2004) Most species are not driven to extinction beforegenetic factors impact them. Proc Natl Acad Sci USA 101:15261–15264.
Steiner C, Catzeflis FM (2004) Genetic variation and geographical structure of five, mouse-sized opposums (Marsupialia, Didelphoidae) throughout the Guiana region. J Biogeogr 31:959–973.
Stow AJ, Minarovic N, Eymann J, Cooper DW, Webley LS (2006) Genetic structure infer gener-ally high philopatry and male-biased diapersal of brushtail possums (Trichosurus vulpecula) inurban Australia. Wildl Res 33:409–415.
Sunnucks P (2000) Efficient genetic markers for population biology. Trends Ecol Evol 15:199–203.Sunnucks P, Wilson AC, Beheregaray LB, Zenger K, French J, Taylor AC (2000) SSCP is
not so difficult: the application and utility of single-stranded conformation polymorphism inevolutionary biology and molecular ecology. Mol Ecol 9:1699–1710.
Taberlet P (1996) The use of mitochondrial DNA control region sequencing in conservation genet-ics. In: Smith TB, Wayne RK (eds) Molecular Genetic Approaches in Conservation. OxfordUniversity Press, New York, pp. 125–142.
Taylor AC, Cooper DW (1998a) Microsatellite markers for the Phalangerid marsupial, the commonbrushtail possum (Trichosurus vulpecula). Mol Ecol 7:1780–1782.
Taylor AC, Cooper DW (1998b) A set of tammar wallaby (Macropus eugenii) microsatellites testedfor genetic linkage. Mol Ecol 7:925–926.
Taylor AC, Cooper DW (1999) Microsatellites identify introduced New Zealand tammar wallabies(Macropus eugenii) as an “extinct” taxon. Anim Conserv 2:41–49.
Taylor AC, Sherwin WB, Wayne RK (1994) Genetic variation of microsatellite loci in a bottle-necked species: the northern hairy-nosed wombat Lasiorhinus krefftii. Mol Ecol 3:277–290.
Taylor AC, Sunnucks P, Cooper DW (1999) Retention of reproductive barriers and ecologicaldifferences between two introduced sympatric Macropus spp. in New Zealand. Anim Conserv2:195–202.
Taylor AC, Cowan PE, Fricke BL, Cooper DW (2000) Genetic analysis of the mating system ofthe common brushtail possum (Trichosurus vulpecula) in New Zealand farmland. Mol Ecol9:869–879.
Taylor AC, Kraaijeveld K, Lindenmayer DB (2002) Microsatellites for the greater glider,Petauroides volans. Mol Ecol Notes 2:57–59.
Taylor AC, Cowan PE, Fricke BL, et al. (2004) High microsatellite diversity and differential struc-turing among populations of the introduced common brushtail possum, Trichosurus vulpecula,in New Zealand. Genet Res 83:101–111.
Taylor AC, Tyndale-Biscoe CH, Lindenmayer DB (2007) Unexpected persistence on habitatislands: genetic signatures reveal dispersal of a eucalypt-dependent marsupial through a hostilepine matrix. Mol Ecol 16:2655–2666.
Van Dyck S, Strahan R (eds) (2008) The Mammals of Australia, 3rd edn. Reed New Holland,Sydney.
22 Marsupial Population and Conservation Genetics 497
Vila C, Sundqvist A-K, Flagstad O, et al. (2003) Rescue of a severely bottlenecked wolf (Canislupus) population by a single immigrant. Proc R Soc Lond B 270:91–97.
Walker FM (2004) Sociobiology inferred from relatedness structure via remotely-collected DNAin Southern Hairy-nosed Wombats (Lasiorhinus latifrons). Ph.D. thesis, Monash University,Clayton.
Walker FM, Sunnucks P, Taylor AC (2006) Genotyping of “captured” hairs reveals burrow-use andranging behavior of southern hairy-nosed wombats. J Mammal 87:690–699.
Walker FM, Taylor AC, Sunnucks P (2007) Does soil type drive social organization in southernhairy-nosed wombats. Mol Ecol 16:199–208.
Walker FM, Sunnucks P, Taylor AC (2008) Evidence for habitat fragmentation altering within-population processes in wombats. Mol Ecol 17:1674–1684.
Walker FM, Horsup A, Taylor AC (2009) Leader of the pack: faecal pellet deposition order impactsPCR amplification in wombats. Mol Ecol Resour 9:720–724.
Westemeier RL, Brawn JD, Simpson SA, et al. (1998) Tracking the long-term decline and recoveryof an isolated population. Science 282:1695–1698.
Wilson DE, Reeder DM (eds) (2005) Mammal Species of the World: A Taxonomic and GeographicReference, 3rd edn. Johns Hopkins University Press, Baltimore.
Wilson K, de Tores P, Spencer PBS (2009) Isolation and characterisation of polymor-phic microsatellite markers in the western ringtail possum, Pseudocheirus occidentalis.Conservation Genetics Resources 1:123–125.
Zenger KR, Cooper DW (2001a) Characterization of 14 macropod microsatellite genetic markers.Anim Genet 32:160–167.
Zenger KR, Cooper DW (2001b) A set of highly polymorphic microsatellite markers developedfor the eastern grey kangaroo (Macropus giganteus). Mol Ecol Notes 1:98–100.
Zenger KR, Johnston PG (2001) Isolation and characterisation of microsatellite loci in the southernbrown bandicoot (Isoodon obesulus), and their applicability to other marsupial species. MolEcol Notes 1:149–151.
Zenger KR, McKenzie LM, Cooper DW (2002) The first comprehensive genetic linkage map fora marsupial: the tammar wallaby (Macropus eugenii). Genetics 162:321–330.
Zenger KR, Eldridge MDB, Cooper DW (2003a) Intraspecific variation, sex-biased dispersal andphylogeography of the eastern grey kangaroo (Macropus giganteus). Heredity 92:153–162.
Zenger KR, Eldridge MDB, Johnston PG (2003b) A rapid PCR-RFLP diagnostic test for distin-guishing sympatric bandicoot species (Marsupialia: Peramelidae) in south-eastern Australia.Conserv Genet 4:655–657.
Zenger KR, Eldridge MDB, Pope LC, Cooper DW (2003c) Characterisation and cross-speciesutility of microsatellite markers within kangaroos, wallabies and rat kangaroo (Macropodoidae:Marsupialia). Aust J Zool 51:587–596.
Zenger KR, Eldridge MDB, Johnston PG (2005) Phylogenetics, population structure and geneticdiversity of the endangered southern brown bandicoot (Isoodon obesulus) in south-easternAustralia. Conserv Genet 6:193–204.

Chapter 23Devil Facial Tumour Disease (DFTD): UsingGenetics and Genomics to Investigate InfectiousDisease in an Endangered Marsupial
Hannah S. Bender
Abstract The Tasmanian devil (Sarcophilus harrisii), so named for itsblood-curdling, nocturnal shrieks and snarls, is the largest of the carnivorous mar-supials. Although once widely persecuted, concerted efforts are now being madeto save the devil from extinction following the emergence of a fatal transmissiblemalignancy known as devil facial tumour disease (DFTD). DFTD is unusual in thatthe infectious agent is the cancer cell itself. This chapter discusses the aetiology andpathogenesis of DFTD as well as the profound impact the spread of DFTD has hadon the devil’s conservation status. Strategies for managing DFTD and conservingthe devil will be explored and the contribution of new sequencing technology to thefield of conservation genetics and genomics will be examined with regard to theTasmanian devil and DFTD.
Keywords Tasmanian devil · Devil facial tumour disease · Wildlifedisease · Conservation genetics · Genomics
23.1 The Tasmanian Devil and the Emergence of DFTD
The Tasmanian devil (Sarcophilus harrisii), is the largest of the Dasyuridae, aspeciose and morphologically diverse family of carnivorous marsupials that are rep-resented in most terrestrial habitats in Australia and New Guinea (Crowther andBlacket, 2003). S. harrisii diverged in the mid Miocene, approximately 12.4 mil-lion years ago, and originally thrived on the Australian mainland (Krajewski et al.,2000). Tasmanian populations were separated from their mainland conspecifics afterthe formation of the Bass Strait 14,000 years ago (Lambeck and Chappell, 2001).Now the devil is confined to the island state; their extinction on mainland Australia
H.S. Bender (B)Department of Evolution, Ecology and Genetics, Research School of Biology, The AustralianNational University, Canberra, ACT 0200, Australiae-mail: [email protected]
499J.E. Deakin et al. (eds.), Marsupial Genetics and Genomics,DOI 10.1007/978-90-481-9023-2_23, C© Springer Science+Business Media B.V. 2010
500 H.S. Bender
approximately 400 years ago was likely associated with the introduction and estab-lishment of the dingo (Jones et al., 2003). Since the extinction of the devil’s larger,sympatric relative, the thylacine (Thylacinus cynocephalus), the Tasmanian devilhas held the mantle of World’s Largest Remaining Marsupial Carnivore.
Tasmanian devils are non-territorial, nocturnal, hunter-scavengers. Adults typi-cally inhabit wide ranges throughout open sclerophyll forest and coastal scrub andare found at low densities in alpine areas, extensively cleared agricultural landand dense forests (Guiler, 1970; Jones et al., 2004). Although occasionally preda-tory, devils are largely specialised scavengers and opportunistic feeders (Owen andPemberton, 2005). Devils are a relatively short-lived species, living for 5–6 yearsin the wild. Mature devils are sexually dimorphic; males weigh up to 13 kg andfemales are considerably smaller at around 9 kg. Female devils are monoestrus withmating usually occurring in March. Four pouch young can be accommodated in thefemale’s rear-facing pouch and weaning success is high in the wild. Joeys leave thepouch at about 105 days, are independent at 9 months and reach sexual maturitythemselves at 2 years of age (Guiler, 1970).
There is anecdotal evidence that devil populations have suffered from severalfluctuations in the 200 years since European settlement (Guiler, 1970). No reliabledata exist to verify the extent or cause of these population fluxes, however infectiousdisease, the extinction of the thylacine and anthropogenic factors, such as habitatdestruction and culling, have all been implicated (Jones et al., 2004; Bradshaw andBrook, 2005). Certainly both the devil and the thylacine were singled out as “stock-destroying vermin” and were the subject of intense persecution by graziers for over100 years (Owen and Pemberton, 2005). Molecular marker profiling of devils acrossTasmania has revealed poor population structuring and a distinct lack of geneticdiversity at microsatellite and MHC loci, consistent with periods of low populationdensity (Jones et al., 2004; Siddle et al., 2007). Prior to the emergence of DFTD,however, devil populations were robust and widespread across Tasmania with theexception of the southwest where population density was and remains low (Joneset al., 2004).
In 1996 a devil with a large facial lesion was photographed at Mt William inthe state’s northeast (Hawkins et al., 2006). Although striking, the tumour was notthought to be particularly unusual as devils seem to be particularly susceptible toneoplasia (Griner, 1979; Canfield et al., 1990). In subsequent years, however, anincreasing number of devils from northeast Tasmania presented to the Departmentof Primary Industries and Water’s Animal Health Laboratories with grossly similarfacial tumours. As tumour cases appeared further afield it became apparent that thedeveloping tumour epidemic was due to an infectious process.
23.2 DFTD Pathogenesis
DFTD is an aggressive, debilitating malignancy. Tumorigenesis is characterisedby the proliferation of round to spindle-shaped cells in the dermis of the headand neck or the submucosal tissue of the oral cavity. Small nodules rapidly
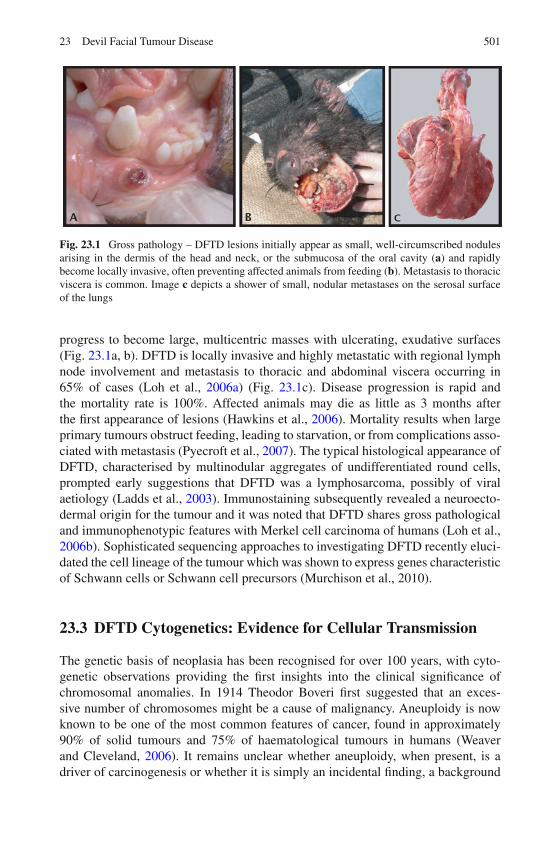
23 Devil Facial Tumour Disease 501
Fig. 23.1 Gross pathology – DFTD lesions initially appear as small, well-circumscribed nodulesarising in the dermis of the head and neck, or the submucosa of the oral cavity (a) and rapidlybecome locally invasive, often preventing affected animals from feeding (b). Metastasis to thoracicviscera is common. Image c depicts a shower of small, nodular metastases on the serosal surfaceof the lungs
progress to become large, multicentric masses with ulcerating, exudative surfaces(Fig. 23.1a, b). DFTD is locally invasive and highly metastatic with regional lymphnode involvement and metastasis to thoracic and abdominal viscera occurring in65% of cases (Loh et al., 2006a) (Fig. 23.1c). Disease progression is rapid andthe mortality rate is 100%. Affected animals may die as little as 3 months afterthe first appearance of lesions (Hawkins et al., 2006). Mortality results when largeprimary tumours obstruct feeding, leading to starvation, or from complications asso-ciated with metastasis (Pyecroft et al., 2007). The typical histological appearance ofDFTD, characterised by multinodular aggregates of undifferentiated round cells,prompted early suggestions that DFTD was a lymphosarcoma, possibly of viralaetiology (Ladds et al., 2003). Immunostaining subsequently revealed a neuroecto-dermal origin for the tumour and it was noted that DFTD shares gross pathologicaland immunophenotypic features with Merkel cell carcinoma of humans (Loh et al.,2006b). Sophisticated sequencing approaches to investigating DFTD recently eluci-dated the cell lineage of the tumour which was shown to express genes characteristicof Schwann cells or Schwann cell precursors (Murchison et al., 2010).
23.3 DFTD Cytogenetics: Evidence for Cellular Transmission
The genetic basis of neoplasia has been recognised for over 100 years, with cyto-genetic observations providing the first insights into the clinical significance ofchromosomal anomalies. In 1914 Theodor Boveri first suggested that an exces-sive number of chromosomes might be a cause of malignancy. Aneuploidy is nowknown to be one of the most common features of cancer, found in approximately90% of solid tumours and 75% of haematological tumours in humans (Weaverand Cleveland, 2006). It remains unclear whether aneuploidy, when present, is adriver of carcinogenesis or whether it is simply an incidental finding, a background
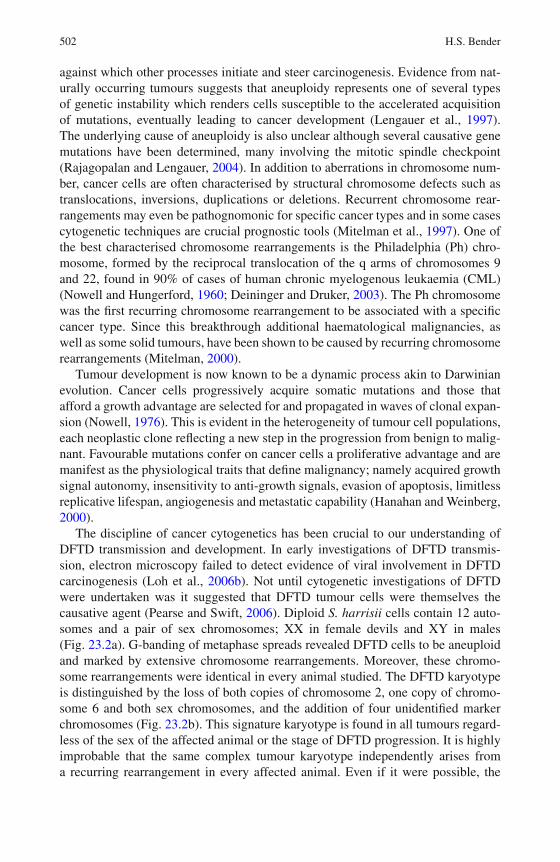
502 H.S. Bender
against which other processes initiate and steer carcinogenesis. Evidence from nat-urally occurring tumours suggests that aneuploidy represents one of several typesof genetic instability which renders cells susceptible to the accelerated acquisitionof mutations, eventually leading to cancer development (Lengauer et al., 1997).The underlying cause of aneuploidy is also unclear although several causative genemutations have been determined, many involving the mitotic spindle checkpoint(Rajagopalan and Lengauer, 2004). In addition to aberrations in chromosome num-ber, cancer cells are often characterised by structural chromosome defects such astranslocations, inversions, duplications or deletions. Recurrent chromosome rear-rangements may even be pathognomonic for specific cancer types and in some casescytogenetic techniques are crucial prognostic tools (Mitelman et al., 1997). One ofthe best characterised chromosome rearrangements is the Philadelphia (Ph) chro-mosome, formed by the reciprocal translocation of the q arms of chromosomes 9and 22, found in 90% of cases of human chronic myelogenous leukaemia (CML)(Nowell and Hungerford, 1960; Deininger and Druker, 2003). The Ph chromosomewas the first recurring chromosome rearrangement to be associated with a specificcancer type. Since this breakthrough additional haematological malignancies, aswell as some solid tumours, have been shown to be caused by recurring chromosomerearrangements (Mitelman, 2000).
Tumour development is now known to be a dynamic process akin to Darwinianevolution. Cancer cells progressively acquire somatic mutations and those thatafford a growth advantage are selected for and propagated in waves of clonal expan-sion (Nowell, 1976). This is evident in the heterogeneity of tumour cell populations,each neoplastic clone reflecting a new step in the progression from benign to malig-nant. Favourable mutations confer on cancer cells a proliferative advantage and aremanifest as the physiological traits that define malignancy; namely acquired growthsignal autonomy, insensitivity to anti-growth signals, evasion of apoptosis, limitlessreplicative lifespan, angiogenesis and metastatic capability (Hanahan and Weinberg,2000).
The discipline of cancer cytogenetics has been crucial to our understanding ofDFTD transmission and development. In early investigations of DFTD transmis-sion, electron microscopy failed to detect evidence of viral involvement in DFTDcarcinogenesis (Loh et al., 2006b). Not until cytogenetic investigations of DFTDwere undertaken was it suggested that DFTD tumour cells were themselves thecausative agent (Pearse and Swift, 2006). Diploid S. harrisii cells contain 12 auto-somes and a pair of sex chromosomes; XX in female devils and XY in males(Fig. 23.2a). G-banding of metaphase spreads revealed DFTD cells to be aneuploidand marked by extensive chromosome rearrangements. Moreover, these chromo-some rearrangements were identical in every animal studied. The DFTD karyotypeis distinguished by the loss of both copies of chromosome 2, one copy of chromo-some 6 and both sex chromosomes, and the addition of four unidentified markerchromosomes (Fig. 23.2b). This signature karyotype is found in all tumours regard-less of the sex of the affected animal or the stage of DFTD progression. It is highlyimprobable that the same complex tumour karyotype independently arises froma recurring rearrangement in every affected animal. Even if it were possible, the
23 Devil Facial Tumour Disease 503
Fig. 23.2 Tumour cytogenetics – (a) The diploid Tasmanian devil karyotype consists of 14chromosomes, including two sex chromosomes (X and Y in this male devil). (b) The DFTD kary-otype (strain 1) is aneuploid and distinguished by stable chromosome rearrangements. Severalchromosomes are rearranged, identifiable only as four marker chromosomes
stepwise accumulation of progressive chromosome aberrations should be evidentwithin individual tumours and between animals. However, no intermediate stagesof karyotypic evolution have been observed; all affected animals studied so far havea homogeneous tumour cell population that is more or less identical to the originalG-banded tumour. Additional subtle chromosome rearrangements have been recog-nised in some animals and also appear to be stable and conserved (Department ofPrimary Industries, 2009). The clinical significance of these karyotypic “strains” isnot known, nor whether they represent selection for mutations that confer favourabletumour traits. Nevertheless, the basic clonality of DFTD strongly suggests thattumours are not endogenously derived but are transplanted between animals, muchlike a tissue allograft. Pearse and Swift’s serendipitous discovery of one animalwith a pericentric inversion of chromosome 5 confirmed that DFTD could not behost derived, as the inversion was present only in the devil’s lymphocyte prepara-tions and not his tumour (Pearse and Swift, 2006). Genotyping of host and tumourtissue at microsatellite and MHC loci has verified that DFTD is a clonal cell linethat is genetically different from the animals it is grafted to (Siddle et al., 2007).The infectious nature of DFTD has been confirmed by transmission trials, in whichDFTD pathogenesis was reproduced after subcutaneous inoculation of naïve ani-mals with culture-derived tumour cells (Pyecroft et al., 2007). The manner in whichcellular transmission occurs is yet to be definitively identified, however, the devil’stendency to bite during mating and communal feeding (Hamede et al., 2008), andthe friable consistency of the facial tumours suggests that DFTD is transplanted bybiting (Pearse and Swift, 2006).
Although it is tempting to speculate about the possible causes of DFTD, itis unlikely that we will ever know whether the initiating event was exogenouslyinduced or a spontaneously arising somatic mutation. By the time DFTD was
504 H.S. Bender
discovered in 1996, the tumour was already a transmissible cell line; a thrivingclone that out-competed its precursors to become the sole cell type in a highlymalignant tumour.
23.4 Immunogenetics of Transmissible Tumours
Naturally occurring cellular transmission of an infectious tumour has been reportedin only one other disease. Canine transmissible venereal tumour (CTVT) is a sex-ually transmitted histiocytic tumour of domestic dogs (Cohen, 1985; Mozos et al.,1996). The tumour has a global distribution with a higher prevalence in countrieswith large populations of free-roaming dogs. Transplantation of tumour cells occursduring coitus when primary tumours of the external genitalia make direct con-tact with vaginal or penile mucosa. Metastasis is uncommon (<5%) and tumoursare responsive to vincristine chemotherapy. There are variable reports of naturallyoccurring remission in immunocompetent dogs; these animals develop a robust anti-body response that is protective upon subsequent re-exposure (Das and Das, 2000).Like DFTD, CTVT is characterised by a conserved, highly rearranged karyotypethat is found in tumours worldwide (Fujinaga et al., 1989). In addition to its char-acteristic cytogenetic aberrations, CTVT cells can be distinguished from host cellsby the insertion of a LINE (long interspersed nuclear element) transposable elementupstream of the c-myc oncogene (Katzir et al., 1987). CTVT is a much older cellline than DFTD, having arisen up to 15,000 years ago in a wolf or early breed of dog(Rebbeck et al., 2009). The common ancestor of existing CTVT clones existed longafter the tumour’s origin, until about 200 years ago, indicating that today’s cell lineis a particularly successful clone that has overtaken the original cell line. Indeed,CTVT has evolved an effective means of escaping the host immune response, modi-fying cell surface expression of major histocompatibility complex (MHC) moleculesin order to invade by stealth. The MHC locus is comprised of a highly polymorphicset of genes that encode two classes of antigen-presenting molecules found on thesurface of cells. Class I and II MHC molecules bind the targets of antibody and cyto-toxic T cell responses and are important in the adaptive immune response againstpathogens, tumours and foreign grafts (Parham et al., 1989). Class I molecules areexpressed on the surface of all cells and are responsible for recognition of endoge-nous antigens, whereas class II molecules recognise exogenous antigens and areonly found on the surface of antigen presenting cells. Structurally, MHC moleculesconsist of conserved lengths of amino acids that stabilise the protein, and a rapidlyevolving, highly polymorphic peptide binding region (PBR) that enables recogni-tion of a diverse range of antigens (Bjorkman et al., 1987; Hughes and Nei, 1988).Modulation of MHC expression is commonly employed by tumour cells to over-come host immunity and achieve uninhibited growth (Garcia-Lora et al., 2003).CTVT cells downregulate MHC (or DLA; dog leukocyte antigen) class I and IIantigen expression during transplantation and progression so that tumour growthcan occur in the absence of a host immune response (Murgia et al., 2006; Hsiao
23 Devil Facial Tumour Disease 505
et al., 2008). Those tumours that spontaneously regress do so because MHC expres-sion is reinstated, provoking infiltration by lymphocytes and macrophages, whichaid in graft rejection through cytokine secretion (Cohen, 1985; Hsiao et al., 2008).
How then has DFTD managed to out-manoeuvre the devil’s immune system inorder to become a thriving somatic cell parasite? Unlike CTVT, DFTD does notappear to manipulate its MHC expression to escape the host immune response,as it has been shown to express both class I and II MHC genes (Siddle et al.,2007). Nevertheless, DFTD transplants do not activate host T cells as inflamma-tory cell infiltration of tumours is limited (Loh et al., 2006a). This aspect of DFTDprompted a number of studies of the basic functionality of the Tasmanian devilimmune system.
Devils have a full complement of lymphoid organs and a typical range of cir-culating white blood cells (Woods et al., 2007). They are able to produce a robustantibody response and their neutrophils effectively phagocytose and digest bacteria(Kreiss et al., 2008; Kreiss et al., 2009). Lymphocytes isolated from the periph-eral blood of healthy devils proliferate when stimulated by T-cell mitogens (PHAand Con A), however, pooling of lymphocytes from different devils fails to inducea lymphocyte response (Siddle et al., 2007; Woods et al., 2007). The devil, there-fore, is immunologically competent, except when challenged with allogeneic tissue.In an outbred population, polymorphism of MHC class I genes enables recogni-tion and rejection of tissue transplants from unrelated individuals (Hughes and Nei,1988). Conversely, poor MHC diversity impedes recognition of non-self and hasbeen shown to facilitate allograft acceptance in inbred wild populations of chee-tah (Acinonyx jubatus) (Yuhki and O’Brien 1990) and pocket gopher (Thomomysbottae) (Sanjayan et al., 1996). Genotyping of MHC genes from 21 Tasmaniandevils demonstrated extremely low diversity, particularly at class I loci (Siddleet al., 2007). Low MHC polymorphism and failure of mixed lymphocyte responsesstrongly suggest that DFTD is transmitted due to histocompatibility between tumourand host devils. CTVT may have similarly emerged when the domestication processcaused a genetic bottleneck, facilitating allograft acceptance due to host-graft com-patibility. In the following 15,000 years the canine tumour has evolved strategiesthat enable it to affect outbred hosts (Murgia et al., 2006). Another transmissibletumour, which has arisen in inbred laboratory populations of the Syrian hamster isalso thought to be due to a paucity of MHC diversity (Banfield et al., 1965; McGuireet al., 1985). DFTD, however, is the first transmissible tumour to threaten a wildspecies with extinction and provides a conclusive link between MHC polymorphismand population health.
23.5 DFTD Epidemiology and Impact
Wildlife extinction due solely to infectious disease is considered a rare event. In fact,species extirpation due to disease outbreaks has been conclusively shown in veryfew vertebrate species: Taudactylus acutirostris, an Australian frog (Schloegel et al.,
506 H.S. Bender
2006); and the Christmas Island rats, Rattus macleari and Rattus nativitatis (Wyattet al., 2008). The causative agents in these cases, respectively, Batrachochytriumdendrobatidis and Trypanosoma lewisi, are both able to affect more than one speciesor persist in an unaffected reservoir host, an important factor in their success aspathogens. According to standard epidemiological models, it is unlikely for a host-specific pathogen to cause the extinction of a wild species as transmission ratestend to decrease as host density decreases (McCallum and Dobson, 1995). Yet, theemergence of DFTD, a single-host pathogen, has profoundly affected the conserva-tion status of the Tasmanian devil. This is due in large part to the manner in whichthe disease is transmitted. DFTD transmission is frequency-dependent, meaning therate of transmission depends on the frequency of host contact, not on host density(McCallum, 2008; Lachish et al., 2009). This important epidemiological detail wasdetermined from mark recapture data in northeast Tasmania. In the Mt William areawhere DFTD was first reported, tumour prevalence remains as high as 33% despitedevil population declines of 90% (Lachish et al., 2007). This model of diseasetransmission is consistent with our understanding of devil behaviour and DFTD dis-semination. The tumour is transmitted by direct contact, most likely via bite wounds.Mating interactions are associated with a higher incidence of penetrating facial bites(Hamede et al., 2008) and DFTD may therefore be considered a sexually transmit-ted disease, most of which, in humans, are transmitted in a frequency-dependentmanner.
One of the major implications of frequency-dependent transmission is that DFTDis propagated even when devil populations are low. Density-dependent diseases(infectious disease such as influenza viruses are modelled in this manner) requirehost population density to remain above a certain threshold for disease maintenance.When host density decreases to a critical level disease transmission is no longer pos-sible. It is therefore considered improbable for density-dependent disease to causeextinction, except in the presence of other contributing factors (Hilker et al., 2009).By contrast, DFTD is unlikely to peter out even when devil densities are extremelylow. It is this aspect of DFTD transmission that has had such a strong impact ondevil numbers. In 1996, when the first case of DFTD was observed, the devil wasat a low risk of extinction (Maxwell et al., 1996). Since then, the state-wide devilpopulation is thought to have diminished by more than 60%. The impact of DFTDhas been modelled from data collected on the Freycinet Peninsula on Tasmania’seast coast where devil populations were closely monitored before and after DFTD’sappearance there in 2001. The arrival of DFTD on the peninsula coincided witha profound decline in devil numbers and caused acute changes to the life-historyand age structure of the population. Because transmission of DFTD usually occursduring mating interactions, the devils most at risk are those of breeding age. Eightyears after DFTD first swept through Freycinet National Park, the devil populationis almost completely comprised of animals younger than 3 years of age, with adultdevils accounting for a mere 20% of the population (Lachish et al., 2009). Therehas been an increase in precocial breeding throughout the peninsula, with femalesproducing their first litter at 1 year of age instead of 2 (Jones et al., 2008). Thecompensatory value of this reproductive response is limited however; in affected
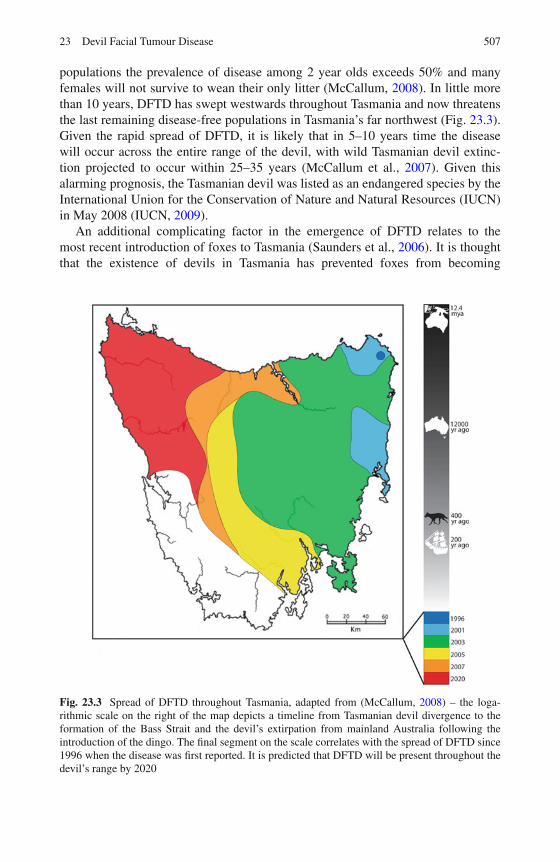
23 Devil Facial Tumour Disease 507
populations the prevalence of disease among 2 year olds exceeds 50% and manyfemales will not survive to wean their only litter (McCallum, 2008). In little morethan 10 years, DFTD has swept westwards throughout Tasmania and now threatensthe last remaining disease-free populations in Tasmania’s far northwest (Fig. 23.3).Given the rapid spread of DFTD, it is likely that in 5–10 years time the diseasewill occur across the entire range of the devil, with wild Tasmanian devil extinc-tion projected to occur within 25–35 years (McCallum et al., 2007). Given thisalarming prognosis, the Tasmanian devil was listed as an endangered species by theInternational Union for the Conservation of Nature and Natural Resources (IUCN)in May 2008 (IUCN, 2009).
An additional complicating factor in the emergence of DFTD relates to themost recent introduction of foxes to Tasmania (Saunders et al., 2006). It is thoughtthat the existence of devils in Tasmania has prevented foxes from becoming
Fig. 23.3 Spread of DFTD throughout Tasmania, adapted from (McCallum, 2008) – the loga-rithmic scale on the right of the map depicts a timeline from Tasmanian devil divergence to theformation of the Bass Strait and the devil’s extirpation from mainland Australia following theintroduction of the dingo. The final segment on the scale correlates with the spread of DFTD since1996 when the disease was first reported. It is predicted that DFTD will be present throughout thedevil’s range by 2020
508 H.S. Bender
established following previous incursions over the last 100 years. The loss of anapex predator can precipitate widespread ecosystem disturbances with effects onmesopredator abundance being of particular concern (Ritchie and Johnson, 2009).The wild extinction of Tasmanian devils would leave their predatory niche vul-nerable to appropriation by foxes or feral cats. Foxes have been implicated in thewidespread extinction of small mammals on the Australian mainland, a catastrophethat Tasmania’s biodiversity has hitherto been free from (Kinnear et al., 2002).
23.6 Disease Management
The emergence of DFTD has highlighted the importance of early, decisive responsesin the management of wildlife disease outbreaks. Humane destruction of infectedanimals may have limited transmission sufficiently to achieve disease eradicationwhen the tumour first emerged, however, DFTD was not immediately suspectedto be an infectious disease and culling of infected animals remained contentiouseven after overwhelming evidence indicated that the tumours were transmissible.As a single-host pathogen transmitted by direct contact in a population containedon a relatively small island, DFTD constituted a comparably manageable pathogen(Cousins and Roberts, 2001). Nevertheless, field monitoring was prioritised andby the time it was agreed that intervention was urgently required, DFTD was toowidespread to eradicate by culling. Studies on the Forestier Peninsula on the eastcoast of Tasmania indicate that some disease suppression can be achieved by sys-tematically removing infected animals from the population (Jones et al., 2007).Although widespread euthanasia of infected devils is not a pragmatic manage-ment solution at this stage, strategic culling may still be employed in high prioritydevil populations, such as those near the advancing disease front, or in infectedpopulations thought to be genetically valuable.
Management options are now focused on conserving “insurance” stocks ofdisease-free animals for re-release in the event of wild extinction. The insurancestrategy aims to conserve as much genetic diversity as possible in a DFTD-freepopulation that will be physically and behaviourally fit for eventual release (DPIWand ARAZPA, 2007). The strategy recommends sourcing founder devils fromDFTD-free wild populations according to a strict protocol that minimises the risk ofintroducing an infected devil into the insurance population. Founder devils are quar-antined to verify their DFTD-free status before being transferred to mainland zoosfor intensively managed breeding. Based on conservative modelling, a founder baseof 150 individuals is predicted to conserve 95% of wild source genetic diversity(Jones et al., 2007). The successful rehabilitation of species such as the black-footed ferret have demonstrated that wild species may be rescued from extinctionby breeding from much smaller founding populations (Grenier et al., 2009).
If devils were to become extinct in the wild, the ecosystem-wide impacts of theirabsence could be catastrophic. Even the transient loss of devils from their predatoryniche may facilitate mesopredator release with dire consequences for Tasmania’s
23 Devil Facial Tumour Disease 509
biodiversity. The maintenance of free-ranging devils in fenced-off, disease-freeexclosures or off-shore Tasmanian islands has been discussed as a managementstrategy to ensure that insurance devils remain an “ecologically functional” species(Jones et al., 2007). Neither strategy has as yet been employed; a fencing strategyis likely to be expensive and difficult to engineer, and the release of devils onto anisland ecosystem that has not previously supported them remains contentious.
Vaccine production remains a long-term solution for DFTD control. Vaccinationis a cornerstone of disease prevention in veterinary and human medicine, and is play-ing an increasingly important role in wildlife disease control (Plumb et al., 2007).The age of targeted cancer therapy was heralded by the development of imatinib,a tyrosine kinase inhibitor that acts directly on the fusion gene product created bythe Ph chromosome rearrangement in CML patients (Deininger and Druker, 2003).Like CML, DFTD is associated with a pathognomonic karyotype, however, withlittle known about the clinical significance of DFTD-associated chromosome rear-rangements, no targets have been identified for treatment or prevention. One of thedifficulties in developing cancer vaccines lies in the antigenicity of tumour cells.Unlike virus-associated cancers, spontaneously arising tumour cells may be onlyweakly immunogenic and unless a tumour-specific antigen can be identified there isa risk of inducing autoimmunity (Rice et al., 2008). At this stage DFTD has not beencharacterised sufficiently to identify tumour-specific therapeutic targets. Should thischallenge be negotiated, the stability of the DFTD genome may lend itself to vac-cine development. Chromosomally unstable tumours present a therapeutic challengeas CIN provides an adaptive mechanism by which tumours are able to evolve drugresistance (Rajagopalan et al., 2003). Cytogenetic observations of DFTD indicatethat the karyotype is stable, suggesting that a targeted therapy might be successfulin treating disease. The failure of DFTD to elicit any immune response in the devil,however, may limit attempts to induce immunity through vaccination (Woods et al.,2007). Additionally, the development of a novel vaccine that is safe and efficaciousis a lengthy and expensive process, and the successful delivery of vaccines to free-ranging wildlife presents yet another challenge (Haydon et al., 2006). At this stage itis unlikely that a vaccine will be produced in time to prevent DFTD from spreadingthroughout the range of devil. Nevertheless, even 10 years from now, a DFTD vac-cine would be a valuable management resource for demographically strategic usein habitat corridors and along the frontline of the disease, as well as protection ofinsurance devils prior to release. Further research is required in order to determinewhether vaccination remains a viable option in the management of DFTD.
One possible, though improbable, outcome of DFTD emergence is natural selec-tion for resistance to infection (McCallum, 2008). It is not known whether thefaint genetic variation between east and west coast devils correlates with sufficientMHC diversity to enable antigen recognition and antibody production in westernTasmanian devils. This seems unlikely as no resistant devils have been observed inany of the widespread mark-recapture programs. The rate at which DFTD contin-ues to sweep through Tasmania leaves little time for the evolution of resistance andthe likelihood of adaptive variation occurring in an endangered species with poorgenetic diversity is low (Kohn et al., 2006).
510 H.S. Bender
23.7 A Role for Genomics in Tasmanian Devil Conservation
Advances in the development of genetic markers have been of great value to con-servation programs and are now essential tools in the management of endangeredpopulations. Traditionally these markers have been used to gauge genetic variationand population structure, estimate effective population size, resolve phylogeneticand phylogeographic queries and guide captive breeding programs (Primmer, 2009).Rapid developments in sophisticated new genome sequencing technology and theexplosion of genomic resources available to non-model organisms have already hada significant impact on the management of some endangered species. The endan-gered California condor (Gymnogyps californianus), largest of the North Americanland birds, suffered an acute population bottleneck associated with severe habitatloss and lead poisoning. Genetic variation within the tiny founder population wasassessed from restriction fragment length polymorphism (RFLP), mitochondrialDNA and microsatellite studies and was used to advise a successful captive breedingprogram. A high prevalence of autosomal recessive chondrodystrophy complicatedconservation efforts by causing an unacceptable incidence of embryonic mortality.In the absence of an assay to identify carrier birds it was impossible to eliminatethe condition without compromising genetic diversity in the breeding popula-tion. Cross-species fluorescent in situ hybridisation (FISH) of condor metaphasespreads with chicken chromosome paints indicated strong homology between thetwo species (Raudsepp et al., 2002). Subsequently, a comparative chicken-condormap was generated by screening a condor BAC library using overgo probes obtainedfrom the zebra finch and chicken genome projects. In total 93 loci were mapped,including several candidates for inherited chondrodystrophy (Romanov et al., 2006).A candidate gene approach to mining the BAC library is being complemented bysingle nucleotide polymorphism (SNP) screening of the condor transcriptome, gen-erated by 454 sequencing of fibroblast cDNA libraries (Romanov et al., 2009).The California condor conservation program has demonstrated how sophisticatedgenomic resources, and in particular new sequencing technology, are enabling rapidadvances in threatened species conservation. Even those species where the resourcesare not available for large scale sequencing projects may eventually be “genome-enabled”; nearly 1,000 IUCN red-listed mammals are within the same order orgroup of a sequenced species (Kohn et al., 2006). Therefore the genome of thedomestic cat (Felis catus) will not only contribute to the health and well-being ofcompanion animals but will also benefit the management of endangered wild felids(O’Brien et al., 2008).
Like the condor, the Tasmanian devil will benefit from the application of newgenomic resources to disease management. Genetic and genomic approaches havealready been instrumental in demonstrating the aetiology and pathogenesis ofDFTD. The disease was thought to be virally or environmentally induced until cyto-genetic and genotyping studies convincingly showed that DFTD was a clonal cellline. The genomic toolkit is gradually being expanded to include genome sequenceand gene expression data that will contribute greatly to management of insurancepopulations and laboratory investigations of DFTD carcinogenesis.
23 Devil Facial Tumour Disease 511
Next generation sequencing technologies have revolutionised cancer genomics.Shotgun sequencing provides an unbiased approach to rapidly discovering patho-logically significant mutations. Whereas candidate gene approaches have provedlaborious and protracted, tumour genome sequencing has dramatically increasedthe catalogue of cancer-associated somatic mutations, even for those malignanciesthat have been rigorously studied for decades (Ding et al., 2008; Ley et al., 2008).Deep sequencing of the DFTD transcriptome sequence revealed a pattern of geneexpression consistent with that of myelinating cells (Murchison et al., 2010). Itwas subsequently determined that the tumour expresses the Schwann cell-specificmyelin protein periaxin (PRX), suggesting that DFTD arose from a Schwann cellor a Schwann cell precursor. Using new sequencing technology to refine DFTD cellclassification beyond its broad immunostaining characteristics has therefore gener-ated a new, specific diagnostic marker (PRX) and will provide crucial insights intothe molecular pathways involved in carcinogenesis, possibly revealing therapeutictargets. The catalogue of expressed genes yielded by the devil transcriptome pro-vides a framework with which to investigate gene expression across a large numberof tumours at different stages of progression and from various locations in Tasmania.The significance of the various cytogenetic strains of DFTD may be clarified andsurveillance for tumour evolution that is not cytogenetically evident will be possi-ble. Sequencing projects evidently make critical contributions to endangered speciesmanagement programs and should continue to be a priority in the conservation ofthe Tasmanian devil.
23.8 Implications of DFTD for Conservation Biology and FutureDirections
Emerging diseases of wildlife are increasingly underlining the relationship betweenenvironmental, human and wildlife health. The emergence of zoonotic diseases suchas severe acute respiratory syndrome (SARS) and Hendra virus have highlightedthe importance of conservation medicine to global health (Daszak and Karesh).The resources pouring into wildlife disease are largely directed at those zoonoticpathogens that pose a spill-over risk to the public. Although cancer is an impor-tant cause of mortality in wild species, resources tend to be limited for investigatingsuch diseases (McAloose and Newton, 2009). Regardless, considerable progress hasbeen made in DFTD research. An integrated approach has elucidated the immuno-genetic and epidemiological background against which such an unusual pathogenhas been able to emerge and take hold. Continued efforts towards understandingDFTD tumorigenesis and conserving genetic diversity may yet rescue this iconicspecies from extinction.
Three particularly important lessons have emerged from the outbreak of DFTD.Firstly, DFTD has illustrated the vulnerability of inbred wild populations to theemergence of new pathogens and the importance of maintaining genetic diver-sity at functionally important loci such as the MHC. Genetic variation is crucial
512 H.S. Bender
to population fitness in the event of emerging infectious disease (O’Brien andEvermann, 1988). The profound impact of DFTD on Tasmanian devil numbers pro-vides an alarming example of the potential consequences of inbreeding and loss ofgenetic diversity in wild populations. Secondly, DFTD has challenged our under-standing of the dynamics of infectious disease in free-living wildlife. It is clear nowthat, counter to prevailing theory, single-host pathogens can pose a major extinctionrisk when disease transmission is frequency-dependent. Finally and perhaps mostimportantly, the DFTD outbreak underscores the importance of rapid responsesto wildlife disease, even when very little is known about the causative pathogenor mode of transmission. In the case of DFTD, considerable progress has beenmade in a short amount of time, however, the outlook for the devil is tenuous atbest. New high-throughput sequencing platforms are proving essential to conserva-tion genomics. In the case of the devil, a well-stocked genomic toolkit will equipconservationists with the means to judiciously manage insurance populations andwill provide a gene-level insight into DFTD pathogenesis, bringing us closer to thedevelopment of preventative or curative therapy.
References
Banfield WG, Woke PA, Mackay CM, Cooper HL (1965) Mosquito transmission of a reticulumcell sarcoma of hamsters. Science 148:1239–1240.
Bjorkman PJ, Saper MA, Samraoui B, et al. (1987) Structure of the human class I histocompatibi-lity antigen, HLA-A2. Nature 329:506–512.
Bradshaw CJA, Brook BW (2005) Disease and the devil: density-dependent epidemiologicalprocesses explain historical population fluctuations in the Tasmanian devil. Ecogeography28:181–190.
Canfield P, Hartley W, Reddacliff G (1990) Spontaneous proliferations in Australian marsupials –a survey and review. 2. Dasyurids and bandicoots. J Comp Pathol 103:149–158.
Cohen D (1985). The canine transmissible venereal tumor: a unique result of tumor progression.Adv Cancer Res 43:75–112.
Cousins DV, Roberts JL (2001) Australia’s campaign to eradicate bovine tuberculosis: the battlefor freedom and beyond. Tuberculosis 81:5–15.
Crowther MS, Blacket MJ (2003) Biogeography and speciation in the dasyuridae: why are thereso many kinds of dasyurids? In: Jones M, Dickman C, Archer M (eds) Predators with Pouches:The Biology of Carnivorous Marsupials. CSIRO, Collingwood.
Das U, Das AK (2000) Review of canine transmissible venereal sarcoma. Vet Res Commun24:545–556.
Deininger MW, Druker BJ (2003) Specific targeted therapy of chronic myelogenous leukemia withimatinib. Pharmacol Rev 55:401–423.
Department of Primary Industries and Water (2009) New Strains of DFTD Emerging. Retrieved21 November 2009, from http://www.tassiedevil.com.au
Ding L, Getz G, Wheeler DA, et al. (2008) Somatic mutations affect key pathways in lungadenocarcinoma. Nature 455:1069–1075.
DPIW and ARAZPA (2007) Save the Tasmanian Devil Program – Insurance Population Strategy.Retrieved 30th August 2009, from http://www.dpiw.tas.gov.au/inter.nsf/Attachments/EKOE-75M8ET/$FILE/STTD_IPS_v1_290707.pdf
Fujinaga T, Yamashita M, Yoshida MC, et al. (1989) Chromosome analysis of canine transmissiblesarcoma cells. Zentralbl Veterinarmed A 36:481–489.
23 Devil Facial Tumour Disease 513
Garcia-Lora A, Algarra I, Collado A, Garrido F (2003) Tumour immunology, vaccination andescape strategies. Eur J Immunogenet 30:177–183.
Grenier MB, McDonald DB, Buskirk SW (2009) Rapid population growth of a criticallyendangered carnivore. Science 317:779.
Griner LA (1979) Neoplasms in Tasmanian devils (Sarcophilus harrisii). J Natl Cancer Inst62:589–595.
Guiler ER (1970) Observations of the Tasmanian devil, Sarcophilus harrisii (Marsupialia:Dasyuridae) I. Numbers, home range, movements and food in two populations. Aust J Zool18:49–62.
Hamede RK, McCallum H, Jones M (2008) Seasonal, demographic and density-related patterns ofcontact between Tasmanian devils (Sarcophilus harrisii): implications for transmission of devilfacial tumour disease. Austral Ecol 33:614–622.
Hanahan D, Weinberg RA (2000) The hallmarks of cancer. Cell 100:57–70.Hawkins CE, Baars C, Hesterman H, et al. (2006) Emerging disease and population decline of an
island endemics, the Tasmanian devil Sarcophilus harrisii. Biol Conserv 131:307–324.Haydon DT, Randall DA, Matthews L, et al. (2006) Low-coverage vaccination strategies for the
conservation of endangered species. Nature 443:692–695.Hilker FM, Langlais M, Malchow H (2009) The Allee effect and infectious diseases: extinction,
multistability, and the (dis-)appearance of oscillations. Am Nat 173:72–88.Hsiao YW, Liao KW, Chung TF, et al. (2008) Interactions of host IL-6 and IFN-gamma and cancer-
derived TGF-beta1 on MHC molecule expression during tumor spontaneous regression. CancerImmunol Immunother 57:1091–1104.
Hughes AL, Nei M (1988) Pattern of nucleotide substitution at major histocompatibility complexclass I loci reveals overdominant selection. Nature 335:167–170.
IUCN (2009) IUCN Red List of Threatened Species. Version 2009.1. Retrieved 25 August 2009,from www.iucnredlist.org
Jones ME, Cockburn A, Hamede R, et al. (2008) Life-history change in disease-ravaged Tasmaniandevil populations. Proc Natl Acad Sci USA 105:10023–10027.
Jones ME, Jarman PJ, Lees CM, et al. (2007) Conservation management of Tasmanian devils in thecontext of an emerging, extinction-threatening disease: devil facial tumor disease. EcoHealth4:326–337.
Jones M, Oakwood M, Belcher CA, et al. (2003). Carnivore concerns: problems, issues and solu-tions for conserving Australia’s marsupial carnivores. In: Jones M, Dickman C, Archer M (eds)Predators with Pouches: The Biology of Carnivorous Marsupials. CSIRO, Collingwood.
Jones ME, Paetkau D, Geffen E, Moritz C (2004) Genetic diversity and population structure ofTasmanian devils, the largest marsupial carnivore. Mol Ecol 13:2197–2209.
Katzir N, Arman E, Cohen D, Givol D, Rechavi G (1987) Common origin of transmissible venerealtumors (TVT) in dogs. Oncogene 1:445–448.
Kinnear JE, Sumner NR, Onus ML (2002) The red fox in Australia – an exotic predator turnedbiocontrol agent. Biol Conserv 108:335–359.
Kohn MH, Murphy WJ, Ostrander EA, Wayne RK (2006) Genomics and conservation genetics.Trends Ecol Evol 21:629–637.
Krajewski C, Wroe S, Westerman M (2000) Molecular evidence for the pattern and timing ofcladogenesis in dasyurid marsupials. Zool J Linn Soc 130:375–404.
Kreiss A, Fox N, Bergfeld J, et al. (2008) Assessment of cellular immune responses of healthy anddiseased Tasmanian devils (Sarcophilus harrisii). Dev Comp Immunol 32:544–553.
Kreiss A, Wells B, Woods GM (2009) The humoral immune response of the Tasmanian devil(Sarcophilus harrisii) against horse red blood cells. Vet Immunol Immunopathol 130:135–137.
Lachish S, Jones M, McCallum H (2007) The impact of disease on the survival and populationgrowth rate of the Tasmanian devil. J Anim Ecol 76:926–936.
Lachish S, McCallum H, Jones M (2009) Demography, disease and the devil: life-history changesin a disease-affected population of Tasmanian devils (Sarcophilus harrisii). J Anim Ecol78:427–436.
514 H.S. Bender
Ladds P, Loh R, Jones M, Tucker P (2003). Probable Lymphosarcoma in the Tasmaniandevil (Sarcophilus harrisii). Proceedings of the Australian Society for Veterinary PathologyAnnual Conference, Elizabeth Macarthur Agricultural Institute, Menangle, New South Wales,Australia.
Lambeck K, Chappell J (2001) Sea level change through the last glacial cycle. Science 292:679–686.
Lengauer C, Kinzler KW, Vogelstein B (1997) Genetic instability in colorectal cancers. Nature386:623–627.
Ley TJ, Mardis ER, Ding L, et al. (2008) DNA sequencing of a cytogenetically normal acutemyeloid leukaemia genome. Nature 456:66–72.
Loh R, Bergfeld J, Hayes D, et al. (2006a) The pathology of devil facial tumor disease (DFTD) inTasmanian devils (Sarcophilus harrisii). Vet Pathol 43:890–895.
Loh R, Hayes D, Mahjoor A, et al. (2006b) The immunohistochemical characterization of devilfacial tumor disease (DFTD) in the Tasmanian devil (Sarcophilus harrisii). Vet Pathol 43:896–903.
Maxwell S, Burbridge AA, Morris K (1996). The 1996 Action Plan for Australian Marsupials andMonotremes. Environment Australia, Canberra.
McAloose D, Newton AL (2009) Wildlife cancer: a conservation perspective. Nat Rev Cancer9:517–526.
McCallum H (2008) Tasmanian devil facial tumour disease: lessons for conservation biology.Trends Ecol Evol 23:631–637.
McCallum H, Dobson A (1995) Detecting disease and parasite threats to endangered species andecosystems. Trends Ecol Evol 10:190–194.
McCallum H, Tompkins DM, Jones M, et al. (2007) Distribution and impacts of Tasmanian devilfacial tumor disease. EcoHealth 4:318–325.
McGuire KL, Duncan WR, Tucker PW (1985) Syrian hamster DNA shows limited polymorphismat class I-like loci. Immunogenetics 22:257–268.
Mitelman F (2000) Recurrent chromosome aberrations in cancer. Mutat Res 462:247–253.Mitelman F, Johansson B, Mandahl N, Mertens F (1997) Clinical significance of cytogenetic
findings in solid tumors. Cancer Genet Cytogenet 95:1–8.Mozos E, Mendez A, Gomez-Villamandos JC, Martin De Las Mulas J, Perez J (1996)
Immunohistochemical characterization of canine transmissible venereal tumor. Vet Pathol3:257–263.
Murchison E, Tovar C, Hsu A, et al. (2010) The Tasmanian devil transcriptome reveals Schwanncell origins of a clonally transmissible cancer. Science 327:84–87.
Murgia C, Pritchard JK, Kim SY, Fassati A, Weiss RA (2006) Clonal origin and evolution of atransmissible cancer. Cell 126:477–487.
Nowell PC (1976) The clonal evolution of tumor cell populations. Science 194:23–28.Nowell PC, Hungerford DA (1960) A minute chromosome in human chronic granulocytic
leukemia. Science 132:1497.Owen D, Pemberton D (2005). Tasmanian Devil: A Unique and Threatened Animal. Allen &
Unwin, Crows Nest.O’Brien SJ, Evermann JF (1988) Interactive influences of infectious disease and genetic diversity
in natural populations. Trends Ecol Evol 3:254–259.O’Brien SJ, Johnson W, Driscoll C, et al. (2008) State of cat genomics. Trends Genet 24:268–279.Parham P, Lawlor DA, Lomen CE, Ennis PD (1989) Diversity and diversification of HLA-A,B,C
alleles. J Immunol 142:3937–3950.Pearse AM, Swift K (2006) Allograft theory: transmission of devil facial-tumour disease. Nature
439:549.Plumb G, Babiuk L, Mazet J, et al. (2007) Vaccination in conservation medicine. Rev Sci Tech
26:229–241.Primmer CR (2009) From conservation genetics to conservation genomics. Ann NY Acad Sci
1162:357–368.
23 Devil Facial Tumour Disease 515
Pyecroft SB, Pearse A-M, Loh R, et al. (2007) Towards a case definition for devil facial tumourdisease: what is it? EcoHealth 4:336–351.
Rajagopalan H, Lengauer C (2004) Aneuploidy and cancer. Nature 432:338–341.Rajagopalan H, Nowak MA, Vogelstein B, Lengauer C (2003) The significance of unstable
chromosomes in colorectal cancer. Nat Rev Cancer 3:695–701.Raudsepp T, Houck ML, O’Brien PC, et al. (2002) Cytogenetic analysis of California con-
dor (Gymnogyps californianus) chromosomes: comparison with chicken (Gallus gallus)macrochromosomes. Cytogenet Genome Res 98:54–60.
Rebbeck CA, Thomas R, Breen M, Leroi AM, Burt A (2009) Origins and evolution of atransmissible cancer. Evolution 63:2340–2349
Rice J, Ottensmeier CH, Stevenson FK (2008) DNA vaccines: precision tools for activatingeffective immunity against cancer. Nat Rev Cancer 8:108–120.
Ritchie EG, Johnson CN (2009) Predator interactions, mesopredator release and biodiversityconservation. Ecol Lett 12:982–998
Romanov MN, Koriabine M, Nefedov M, de Jong PJ, Ryder OA (2006) Construction of aCalifornia condor BAC library and first-generation chicken-condor comparative physical mapas an endangered species conservation genomics resource. Genomics 88:711–718.
Romanov MN, Tuttle EM, Houck ML, et al. (2009) The value of avian genomics to theconservation of wildlife. BMC Genomics 10(Suppl 2):S10.
Sanjayan MA, Crooks K, Zegers G, Foran D (1996) Genetic variation and the immune response innatural populations of pocket gophers. Conserv Biol 10:1519–1527.
Saunders G, Lane C, Harris S, Dickman C (2006). Foxes in Tasmania. A Report on an Incursionof an Invasive Species, Invasive Animals Cooperative Research Centre, Canberra.
Schloegel L, Hero J-M, Berger L, et al. (2006) The decline of the sharp-snouted day frog(Taudactylus acutirostris): the first documented case of extinction by infection in a free-rangingwildlife species? EcoHealth 3:35–40.
Siddle HV, Kreiss A, Eldridge MD, et al. (2007) Transmission of a fatal clonal tumor by bitingoccurs due to depleted MHC diversity in a threatened carnivorous marsupial. Proc Natl AcadSci USA 104:16221–16226.
Weaver BA, Cleveland DW (2006) Does aneuploidy cause cancer? Curr Opin Cell Biol 18:658–667.
Woods GM, Kreiss A, Belov K, et al. (2007) The immune response of the Tasmanian devil(Sarcophilus harrisii) and devil facial tumour disease. EcoHealth 4:338–345.
Wyatt KB, Campos PF, Gilbert MT, et al. (2008) Historical mammal extinction on Christmas Island(Indian Ocean) correlates with introduced infectious disease. PLoS One 3:e3602.
Yuhki N, O’Brien SJ (1990) DNA variation of the mammalian major histocompatibility complexreflects genomic diversity and population history. Proc Natl Acad Sci USA 87:836–840.

Index
AAntimicrobial, 130, 336, 381–382, 392,
394–396
BBioinformatics, 118, 121–122, 124, 126, 129,
131, 133, 336
CCaptive breeding, 1–2, 5–7, 9, 14, 18, 20–21,
24, 26–27, 102, 483, 510Centromere, 33–34, 37–38, 44, 48–49, 55–66,
68, 91–92, 109, 155, 161, 189, 194, 196,349
Chromosome, 2, 19, 33–34, 37–51, 55–61,65–68, 76–79, 81–83, 85, 87–95, 101–113,118, 133, 135, 141–143, 147–148,151–167, 173–183, 187–200, 207–222,229–230, 234, 237–238, 241–244, 246,259–267, 269–271, 273–274, 300–302,306, 347, 349, 360–361, 366, 369–370,374, 386, 392, 394, 404–405, 409–410,412, 415, 418–422, 426, 428–429,439–441, 445, 450, 457, 486, 501–503,509–510
Chromosome evolution, 33, 37–38, 40–44,46–47, 49–50, 56–57, 143, 148, 187, 200,211, 226
Chromosome painting, 33–34, 37, 39, 41–45,47, 49–51, 57, 66, 102, 107–109, 152–154,159–160, 213
Colour vision, 401, 403–407, 409–412, 446Conservation, 2, 5–9, 14, 18, 26, 33, 40, 56, 60,
62, 81, 109, 138–139, 141, 157, 159, 162,174, 188, 200, 217, 219, 239, 263, 335,339, 343, 358, 366, 374, 385, 395, 427,450, 457, 461–462, 465–467, 469, 471,473, 475, 477, 479, 481–483, 485–486,499, 506–507, 510–512
Cytogenetic, 33, 101–102, 111–112, 160–162,200, 230, 262, 501–504, 509–511
Cytokine, 295, 336, 347, 381–391, 394,396–397, 505
DDense plate, 148, 177–178, 187, 192, 194, 196,
214Devil facial tumour disease-DFTD, 2, 8, 104,
112, 122, 335, 351, 390, 482, 491, 501,503, 505, 507, 509, 511
Diapause, 10–13, 25, 282, 285, 289–290,296–297
Dosage compensation, 156–157, 158, 164,167, 187, 200, 230, 259–262, 266–267,270–271, 274
EEmbryonic development, 13, 282, 285, 287,
289, 293, 295, 300Epigenetic, 56, 63, 66, 68, 95–96, 101, 136,
141, 157, 165, 199, 229–230, 233–234,243, 245–247, 259–262, 265, 274, 439, 452
Exaptation, 118, 133, 139–144
GGametes, 77–78, 154, 174, 190, 285, 295G-banding, 77–78, 154, 174, 190, 285, 295Gene family, 129, 154, 179, 181, 299, 345,
394, 401–402, 435, 437, 439, 441–445,447, 449–452
Gene regulation, 133, 135, 137, 139, 141, 143,260
Genetic diversity, 2, 5, 9, 14, 18–22, 24–26,81, 335, 339, 349, 351–352, 461–463,477–478, 481–483, 485–486, 500, 508–512
Genome evolution, 34, 79, 101, 104, 106–107,113, 133, 139, 143, 152
J.E. Deakin et al. (eds.), Marsupial Genetics and Genomics,DOI 10.1007/978-90-481-9023-2, C© Springer Science+Business Media B.V. 2010
517
518 Index
Genomic imprinting, 51, 79, 101, 106,112, 229–230, 233–237, 239–241, 243,245–250, 439, 452
Genomics, 1, 5–6, 33, 37, 51, 68, 101,103–104, 117–118, 121, 130, 133–134,138–139, 151, 200, 207, 244, 251, 322,335–336, 340, 357, 359, 361, 363, 365,367, 369, 371, 373, 375, 458–499, 510–512
Germ cells, 218, 245, 285, 288–289, 295, 303,305, 307, 365, 443
α-Globin, 415–416, 418–423, 425–429β-Globin, 401–402, 415–423, 425–429
HHaemoglobin, 401, 415–418, 420–422,
427–429
IImmune response, 19, 335–336, 339–340,
351–352, 357, 368, 375, 381, 383–384,389–392, 397, 458, 504, 509
Immunity, 128, 327, 357, 359, 375, 383–384,394, 397, 458, 504, 509
Immunoglobulin, 129–130, 335, 357, 359, 361,363, 365–367, 369, 371, 373–375, 383,386, 391
Inbreeding, 5, 9, 14, 18–25, 481, 483, 485, 512
KKaryotype, 34, 37–51, 58–59, 61–62, 101–102,
106, 113, 152–153, 189, 190, 502–504, 509KERV, 33, 49, 55, 61–66, 110
LLinkage mapping, 2, 34, 75–77, 84, 102, 135
MMajor Histocompatibility Complex-MHC, 2,
335, 339, 341, 343, 345, 347, 349, 351,353, 358, 383, 462, 504
Mammary, 215, 301, 317–319, 321, 323, 325,327–331, 369, 394
Mating system, 5, 9, 14–18, 24–26Meiosis, 76–78, 89–90, 143, 148, 153–156,
166, 173–179, 181, 187, 189–191, 193,195–200, 210, 212–214, 245, 264, 273,295–296, 307
Meiotic sex chromosome inactivation-MSCI,143, 147, 166, 173, 176, 178, 187, 192,197, 244, 264
Mental retardation, 173, 181, 219–220, 222,231
Microsatellite, 19, 24, 77, 82, 85, 87, 351, 458,461, 463–464, 468, 478, 481–482, 486,503, 510
Milk, 123, 127, 250, 281–282, 286, 293,317–328, 330–331, 367, 395
Mitochondrial DNA, 19, 461, 478, 510Monotreme, 121, 134, 145, 159–160, 167,
174, 190, 210, 230, 233, 240, 242–243,259, 260, 270, 330, 343, 403, 411, 418,422–425, 428, 442
NNatural killer cell, 381–382, 391Next generation sequencing, 104, 121–123,
125, 130, 230, 511
OOlfaction, 402, 435–436, 443–444, 446Olfactory receptor, 402–423, 429, 435–439,
441, 443, 445, 447, 449, 451, 453Opossum, 1, –367, 5–6, 12–13, 34, 37–38,
40, 46, 50, 75, 77, 81, 84–96, 101–102,104–113, 117–118, 121, 123, 125–130,133–139, 141–144, 147, 154–163, 165,174, 176–177, 179, 218, 220, 222,239–240, 267–269, 273, 307–308, 330,335–336, 339–350, 352, 359, 360–361,363, 365, 369–370, 372, 374, 381–382,386–394, 406–407, 409–412, 426, 435,440, 442, 447–452, 463–464
Opsin, 401, 403–404, 406, 408–409, 412
PParental conflict, 229–230, 233, 248–249Physical map, 1, 101, 107, 109–110, 112–113,
162Placenta, 10–11, 112, 229–230, 235, 237–239,
246–250, 272, 281, 286, 290–292,331, 443
Platypus, 90, 134, 151, 156, 160–161, 174,190, 210, 240–243, 246, 270–271, 330,344, 375, 403, 407, 410–412, 421–422,424–425, 428, 440, 442, 448, 450, 452
Population genetics, 19, 461–462, 484, 486
RRecombination, 34, 68, 75–86, 88–92,
95, 110, 133, 135–137, 139, 143, 147,152, 155, 175–176, 179–180, 187–188,190–191, 196–197, 207–209, 211–213,221, 260–261, 274, 358–359, 365, 368,372–375, 445
Retroelement, 55, 63, 66, 139
Index 519
SSex chromosomes, 34, 46, 58–60, 103,
147–148, 152–156, 159–161, 165, 167,174, 177, 179, 187–200, 208–217, 220,223, 260–261, 271, 273–274, 302, 502–503
Sex determination, 79, 152, 167, 175, 190,207–208, 211, 214–215, 217, 220, 222,282, 285, 299–300, 302, 304, 306–308
Sex and reproduction related-SRR, 173, 176Sexual differentiation, 215–216, 285, 291, 299,
301–308Small RNA, 55, 63–64, 66, 139SRY, 104, 147–148, 152–153, 167, 174–175,
188, 190, 207, 210–211, 215–218,221–223, 260–261, 282, 300, 302–304,306–308
Synapsis, 187, 190–191, 197, 199, 214
TTammar wallaby, 1, 5–8, 13, 25–26, 34, 42–43,
48–50, 57, 64, 68, 75, 77, 81–83, 101–104,107–110, 117–118, 122–123, 126–128,134, 142, 147–148, 154–156, 159,161–163, 174, 176, 179, 216–221, 237,239, 246, 267–269, 281–282, 287–291,297, 299–300, 304–305, 307, 317–318,320, 322–324, 326, 328, 335, 339,341–352, 363, 365, 381–382, 385–389,394, 406–407, 410–412, 416, 420, 422,426, 429, 435, 440, 447, 450–452, 463, 482
Tasmanian devil, 1–2, 7, 9, 15, 104, 112,118, 122–123, 126, 335–336, 341–346,351–352, 375, 390, 457–458, 482,499–500, 503, 505–507, 510–512
T cell receptor, 106, 357, 359, 361, 363, 365,367, 369, 371, 373, 375, 383, 441
Telomere, 55, 67–68, 160, 196, 349Transcriptome, 121–123, 125, 127–128, 137,
319, 321, 458, 510–511Transposable elements, 66, 133, 135, 138–144,
426, 429Transposition, 66, 105, 139–141, 213, 261,
375, 415, 424–429
WWildlife disease, 499, 508–509, 511–512Wildlife health, 339, 351–353, 511Wildlife management, 462
XX chromosome, 2, 34, 48, 57–58, 79, 81–82,
85, 89–90, 101–102, 104, 106, 107, 109,111–112, 118, 133, 141–143, 147–148,151–167, 173–176, 179–183, 188, 192,198–200, 210–212, 215–218, 221–223,229–230, 234, 243–244, 259–267,269–271, 273–274, 298–302, 306,404–405, 409–410, 412, 426, 439
X chromosome inactivation-XCI, 2, 79, 101,106, 109, 112, 118, 133, 141–143, 162,164, 166–167, 198–200, 229–230, 244,259–260, 262, 270, 272, 274, 405
XIST, 106, 109, 118, 141, 143, 151, 162–167,182, 197–199, 244, 263–266, 269,271–272, 274
YY chromosome, 19, 104, 123, 124, 147–148,
152–153, 155–156, 163, 165–167,174–180, 187–191, 193, 199–200, 207,209–223, 230, 243, 260–261, 271, 274,300, 302, 306, 421, 426, 457, 486


