Embed Size (px)
Citation preview
Abstract Galectins are a family of animal lectins with
specificity for b-galactosides and are involved in a host
of cellular activities, ranging from development to
cancer. The molecules are expressed by neural and
non-neural cells intracellularly as well as extracellu-
larly. Using two-dimensional gel electrophoresis cou-
pled to tandem mass spectrometry, the present work
aimed to identify and characterize galectins in primary
rat cerebellar astrocytes. The protein-chemical method
identified nine spots representing two members of the
galectin family, namely galectin-1 and galectin-3.
These findings suggest that high abundant expression
of galectin in astrocytes is limited to the two abundant
galectin family members. As these family members are
linked to human astrocytic tumors, their reliable
detection in astrocytes by proteomic techniques would
enable us to further understand their role in neural
development, injury, and regeneration in general and
astrocytoma in particular.
Keywords Galectin Æ Astrocytes Æ Two-dimensional
gel electrophoresis Æ Mass spectrometry
Introduction
Galectins are a major family of lectins, carbohydrate-
binding proteins that can recognize various carbohy-
drates attached to proteins and lipids known as
glycoconjugates on cell surfaces and extracellular
matrices. They are defined by their homing in on
distinct b-galactoside structures and by their conserved
sequence elements in the carbohydrate-binding site [1].
The carbohydrate-binding site contains about 130
amino acids and is designated as the carbohydrate
recognition domain (CRD). Galectins show a high
level of evolutionary conservation and members of this
family are present in organisms ranging from fungi
through nematodes to mammals [2].
To date, 15 mammalian galectins have been identi-
fied, numbered sequentially according to the accepted
numbers for their genes in the Genome database, and
classified into three different subfamilies based on the
number and organization of the CRDs [3, 4]. The
prototype group contains one CRD (galectin-1, -2, -5,
-7, -10, -11, -13, -14 and -15): the chimera group con-
tains unusual proline- and glycine-rich repeats onto the
CRD (galectin-3): and the tandem repeat group con-
tains two CRDs (galectin-4, -6, -8, -9, and -12).
Galectins interact with b-galactoside residues of sev-
eral cell surface and matrix glycoproteins through the
CRD and are also capable of peptide-peptide associa-
tions mediated by their N-terminus domain. These
structural properties endow galectins with multiple
functions, including modulation of cell adhesions,
control of the cell cycle, modulation of the immune and
inflammatory responses, and mRNA splicing [4–6].
Galectins can be located intracellularly or secreted
into the extracellular space. Their expression could be
J. W. Yang Æ S. U. Kang Æ E. Engidawork Æ G. Lubec (&)Department of Paediatrics, Medical University of Vienna,Waehringer Guertel 18-20, A-1090Vienna, Austriae-mail: [email protected]
E. EngidaworkDepartment of Pharmacology, School of Pharmacy, AddisAbaba University, Addis Ababa, Ethiopia
R. Rodrigo Æ V. FelipoLaboratory of Neurobiology, Fundacion Valenciana deInvestigaciones Biomedicas, Valencia, Spain
Neurochem Res (2006) 31:945–955
DOI 10.1007/s11064-006-9100-4
123
ORIGINAL PAPER
Mass Spectrometrical Analysis of Galectin Proteins in PrimaryRat Cerebellar Astrocytes
J. W. Yang Æ S. U. Kang Æ E. Engidawork ÆR. Rodrigo Æ V. Felipo Æ G. Lubec
Accepted: 8 June 2006 / Published online: 28 June 2006� Springer Science+Business Media, Inc. 2006
tissue-specific or developmentally regulated, and one
important fact is that almost every cell can express at
least one galectin [3]. As far as the nervous system is
concerned, it is the mammalian proto-type galectin-1
that has been thoroughly studied. Several lines of
evidence suggested that galectin-1 is expressed widely
in nervous tissues at embryonic stages but becomes
restricted mainly to peripheral nervous tissues with
maturation. Indeed, galectin-1 is selectively expressed
in sensory neurons and motoneurons [7] and it mediates
the contacts to laminin/merosin and to olfactory neu-
rons [8]. It has been shown as well that galectin-1
stimulates neurite outgrowth in an olfactory neuron line
[9] and regulates sorting and fasciculation of olfactory
axons [10]. Galectin-3 has been detected in the primary
olfactory system, probably involved in sorting of axons
as they converge towards their target [11]. It is also
expressed by a subset of dorsal root ganglion neurons
[12] and by microglial cells and/or macrophages infil-
trating in vivo at sites of brain injury [13].
Currently available data regarding galectins estab-
lish a clear link between its carbohydrate-binding
capacity and its physiological function in the nervous
system [14]. According to these data, it is a promising
concept that galectins act as effectors of neuronal
functions and that, due to their carbohydrate-binding
specificity, they can be used as optimal tools for the
systematic dissection of b-galactoside involvement in
neuronal development. To address this issue, the
selection of a suitable analytical tool is required. In this
manuscript, we show the robustness of two-dimensional
gel electrophoresis (2-DE) coupled to matrix-assisted
laser desorption/ionization (MALDI) mass spectrom-
etry (MS) followed by tandem mass spectrometry
(MS/MS) and Nano-HPLC-ESI-Q-TOF for detection
of galectins in the primary rat cerebellar astrocytes.
Material and methods
Primary cultures of rat cerebellar astrocytes
All animal procedures were approved and meet the
guidelines of the European Union for care and man-
agement of experimental animals. Astrocyte-enriched
primary cultures were prepared from cerebellum of 7-
day-old Wistar rats. Briefly, rats were killed by
decapitation and the cerebella were removed rapidly.
The dissected cerebella were then finely minced and
mechanically disrupted by pipetting in Dulbecco’s
modified Eagle’s medium (DMEM). The cell suspen-
sion was vortexed at maximum speed for 1 min and
filtered through sterile nylon mesh of 90-lm pore size,
to remove non-dissociated tissue. Dissociated cells
were re-suspended in DMEM containing 10% heat-
inactivated fetal bovine serum (FBS), 2 mM glutamine,
20 U/ml penicillin, 20 lg/ml streptomycin and 5 mg/ml
fungizone and were seeded on polystyrene plates (60-
diameter) at 20 ml/cerebellum, and were kept in
humidified atmosphere of 5% CO2 and 95% air at
37�C. Medium was changed once a week and cells were
used after 10–13 days in vitro. All reagents for cell
culture were purchased from GIBCO BRL (Life
Technologies S.A., Barcelona, Spain).
Two-dimensional gel electrophoresis (2-DE)
After three times washing with cold PBS, harvested
cells were suspended in 1 ml of sample buffer con-
sisting of 7 M urea, 2 M thiourea, 4% CHAPS (3-
[(3-cholamidopropyl)dimethylammonio]-1-propane-
sulfonate), 10 mMDL-dithiothreitol (DTT), 1 mM
EDTA, 1 mM phenylmethylsulfonyl fluoride (PMSF)
and a mixture of protease inhibitors (Roche Diagnos-
tics, Mannheim, Germany). After sonication for
approximately 15 s, the suspension was left at room
temperature for 1 h and centrifuged at 14,000 · g for
60 min at 12�C. Desalting was done with Ultrafree-4
centrifugal filter unit (Millipore, Bedford, MA, USA).
The protein content of the supernatant was determined
by the Coomassie blue method. 2-DE was performed
essentially as reported [15]. Samples of 1 mg protein
were applied on immobilized pI 3–10 non-linear gra-
dient strips (Amersham Bioscience, Uppsala, Sweden).
Focusing started at 200 V and the voltage was gradu-
ally increased to 8000 V at 4 V/min and kept constant
for a further 3 h (approximately 150,000 Vh in total).
The second-dimensional separation was performed on
9–16% gradient sodium SDS polyacrylamide gels.
After protein fixation for 12 h in 50% methanol and
10% acetic acid, the gels were stained with colloidal
Coomassie blue (Novex, San Diego, CA, USA) for 8 h
and excess of dye was washed out from the gels with
distilled water. Molecular masses were determined by
running standard protein markers (Bio-Rad Labora-
tories, Hercules, CA, USA) covering the range 10–
250 kDa. pI values were used as given by the supplier
of the immobilized pH gradient strips.
MALDI-TOF/TOF
Spots were excised with a spot picker (PROTEINEER
spTM, Bruker Daltonics), placed into 96-well microtiter
plates. In-gel digestion and sample preparation for
MALDI analysis were performed by an auto-
mated procedure (PROTEINEER dpTM, Bruker
946 Neurochem Res (2006) 31:945–955
123
Daltonics)[16, 17]. Briefly, spots were excised and
washed with 10 mM ammonium bicarbonate and 50%
acetonitrile in 10 mM ammonium bicarbonate. After
washing, gel plugs were shrunk by addition of aceto-
nitrile and dried by blowing out the liquid through the
pierced well bottom. The dried gel pieces were
reswollen with 40 ng/ll trypsin (Promega, Madison,
WI, USA) in enzyme buffer, consisting of 5 mM octyl
b-D-glucopyranoside (OGP) and 10 mM ammonium
bicarbonate and incubated for 4 h at 30�C. Peptide
extraction was performed with 10 ll of 1% trifluoro-
acetic acid in 5 mM OGP. Extracted peptides were
directly applied onto a target (AnchorChipTM, Bruker
Daltonics) that was loaded with a-cyano-4-hydroxy-
cinnamic acid (Bruker Daltonics) matrix thinlayer. The
mass spectrometer used in this work was an Ultra-
flexTM TOF/TOF (Bruker Daltonics) operated in the
reflector mode for MALDI-TOF peptide mass finger-
print (PMF) and LIFT mode for MALDI-TOF/TOF.
An accelerating voltage of 25 kV was used for PMF.
Calibration of the instrument was performed externally
with [M+H]+ ions of angiotensin I, angiotensin II,
substance P, bombesin, and adrenocorticotropic hor-
mones (clip 1–17 and clip 18–39). Each spectrum was
produced by accumulating data from 200 consecutive
laser shots for PMF. Those samples, which were ana-
lyzed by PMF from MALDI-TOF, were additionally
analyzed using LIFT-TOF/TOF MS/MS from the same
target. In the TOF1 stage, all ions were accelerated to
8 kV under conditions promoting metastable frag-
mentation. After selection of jointly migrating parent
and fragment ions in a timed ion gate, ions were lifted
by 19 kV to high potential energy in the LIFT cell.
After further acceleration of the fragment ions in the
second ion source, their masses could be simulta-
neously analyzed in the reflector with high sensitivity.
PMF and LIFT spectra were interpreted with the
Mascot software (version 2.1; Matrix Science Ltd,
London, UK). Database searches, through Mascot,
using combined PMF and MS/MS datasets were per-
formed via BioTools 2.2 software. A mass tolerance of
25 ppm for PMF and an MS/MS tolerance of 0.5 Da
and 1 missing cleavage site were allowed and oxidation
of methionine residues and/or phosphorylation of ser-
ine, threonine and tyrosine was considered. The
probability score calculated by the software was used
as criterion for correct identification [18].
Database searches
Database searches were performed based on in-house
Mascot server (version 2.1) with PMF and TOF/TOF
dataset. Prediction of phosphorylation sites in protein
was performed via the NetPhos 2.0 server http://
www.cbs.dtu.dk/services/NetPhos/) and information on
phosphorylated galectins was searched in PhosphoSite
(version 1.0; http://www.phosphosite.org/).
Nano-HPLC-ESI-Q-TOF
Excised gel spots were washed with 50 mM ammo-
nium bicarbonate and two times with 50% acetonitrile
in 50 mM ammonium bicarbonate for 30 min with
occasional vortexing. After washing, the gel pieces
were shrunk by 100 ll of 100% acetonitrile and dried
completely in a vacuum centrifuge (Eppendorf,
Hamburg, Germany). Reducing cysteines was per-
formed with 10 mM DTT in 0.1 M ammonium bicar-
bonate for 60 min at 56�C and alkylation of cysteine
residues was performed with 55 mM iodoacetamide in
0.1 M ammonium bicarbonate for 45 min at 25�C. The
reduction/alkylation solutions were removed and
washed with 50 mM ammonium bicarbonate for 10 min.
The dried gel pieces in acetonitrile followed by a
vacuum centrifugation were reswollen with 12.5 ng/ml
trypsin (Promega) in 25 mM ammonium bicarbonate
and incubated for 16 h at 37�C. Peptide extraction was
performed twice with 50 ll of 0.5% formic acid/20%
acetonitrile for 15 min in a sonication bath and
reduced to 10 ll by evaporation in a vacuum centri-
fuge and then mixed with 20 ll water. LC-MS/MS
analyses were carried out with an UltiMate 3000 sys-
tem (LC Packings, Amsterdam, Netherlands) inter-
faced to the QSTAR Pulsar mass spectrometer
(Applied Biosystems, Foster City, CA, USA). The
gradient was (A = 0.05% TFA in water, B = 80%
ACN/0.04% TFA in water) from 0% to 50% B in
30 min, 90% B in 5 min, 0% B in 25 min. Peptide
spectra were recorded over the mass range of m/z
400–1600, and MS/MS spectra were recorded in
information dependent data acquisition over the mass
range of m/z 50–1600. One peptide spectrum was
recorded and followed by three MS/MS spectra on the
QSTAR Pulsar instrument; the accumulation time was
1 s for peptide spectra and 2 s for MS/MS spectra. The
collision energy was set automatically according to the
mass and charge state of the peptides chosen for
fragmentation. Doubly or triply charged peptides were
chosen for MS/MS experiments due to their good
fragmentation characteristics. MS/MS spectra were
interpreted by the MASCOT software (Matrix
Science). A mass tolerance of 500 ppm for MS and an
MS/MS tolerance of 0.15 Da and 1 missing cleav-
age site were allowed and oxidation of methionine
Neurochem Res (2006) 31:945–955 947
123
residues and/or phosphorylation of serine, threonine
and tyrosine was considered.
Results
Total protein extracts derived from primary rat cere-
bellar astrocytes were separated by 2-DE and several
hundred spots were visualized by colloidal Coomassie
blue staining in partial 2-DE image with pI spanning
from 4 to 10 and molecular weight (MW) ranging from
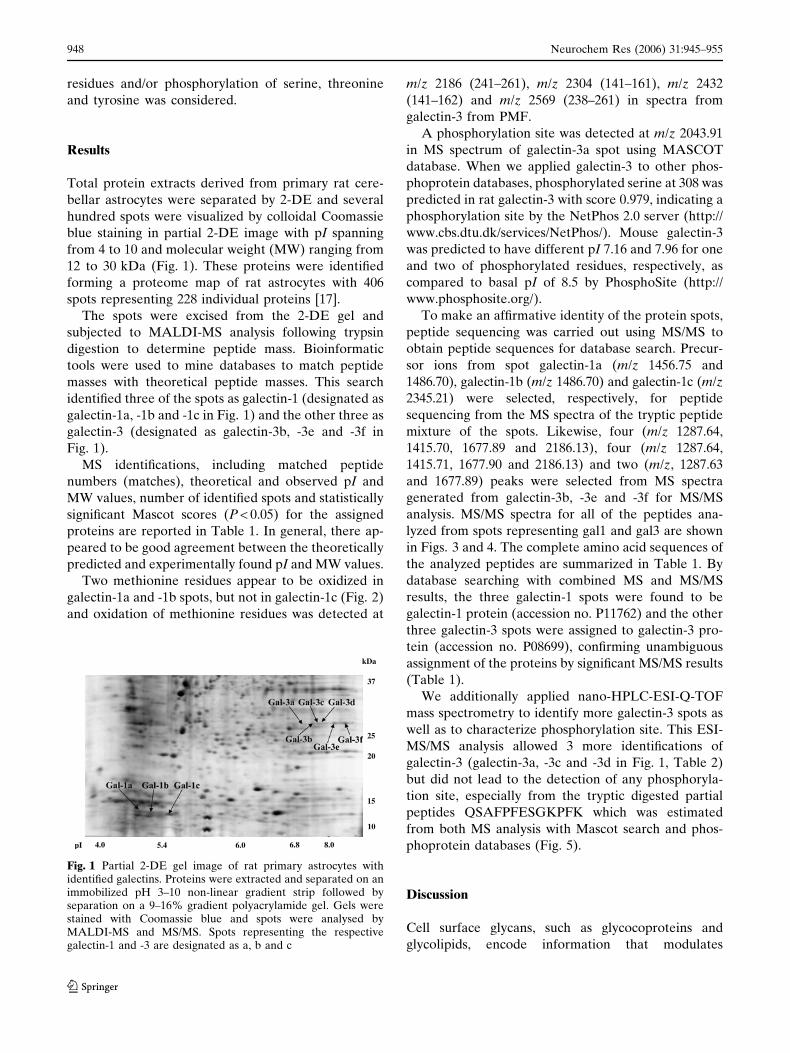
12 to 30 kDa (Fig. 1). These proteins were identified
forming a proteome map of rat astrocytes with 406
spots representing 228 individual proteins [17].
The spots were excised from the 2-DE gel and
subjected to MALDI-MS analysis following trypsin
digestion to determine peptide mass. Bioinformatic
tools were used to mine databases to match peptide
masses with theoretical peptide masses. This search
identified three of the spots as galectin-1 (designated as
galectin-1a, -1b and -1c in Fig. 1) and the other three as
galectin-3 (designated as galectin-3b, -3e and -3f in
Fig. 1).
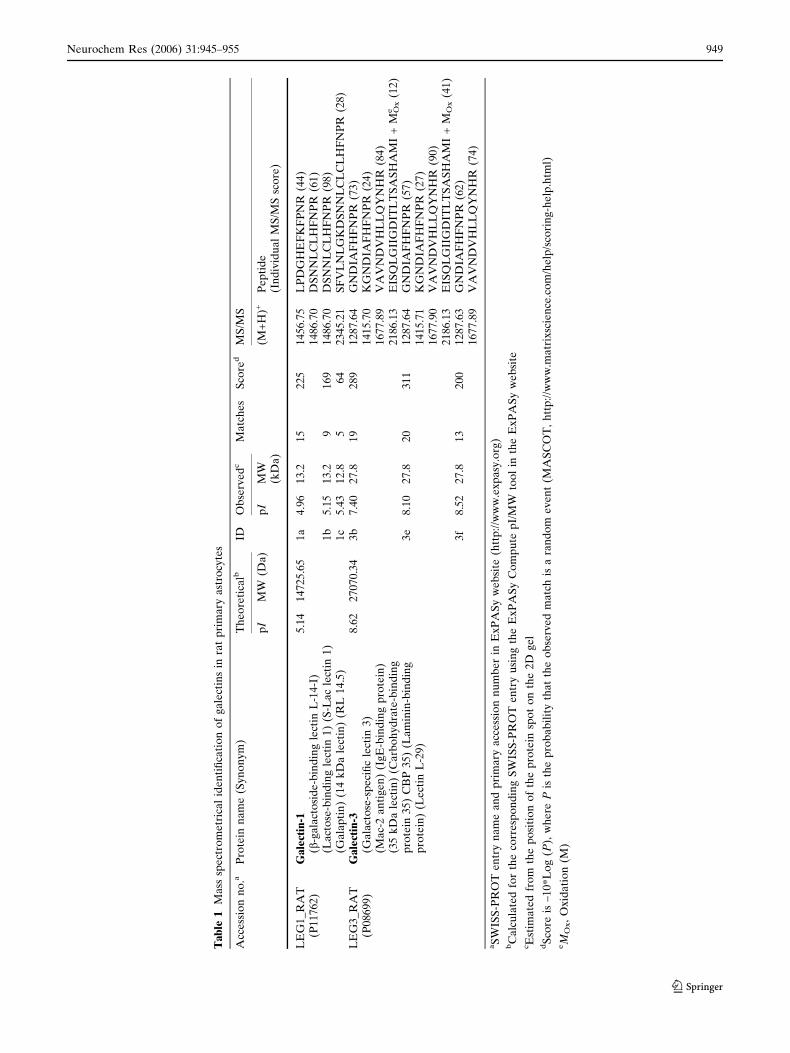
MS identifications, including matched peptide
numbers (matches), theoretical and observed pI and
MW values, number of identified spots and statistically
significant Mascot scores (P < 0.05) for the assigned
proteins are reported in Table 1. In general, there ap-
peared to be good agreement between the theoretically
predicted and experimentally found pI and MW values.
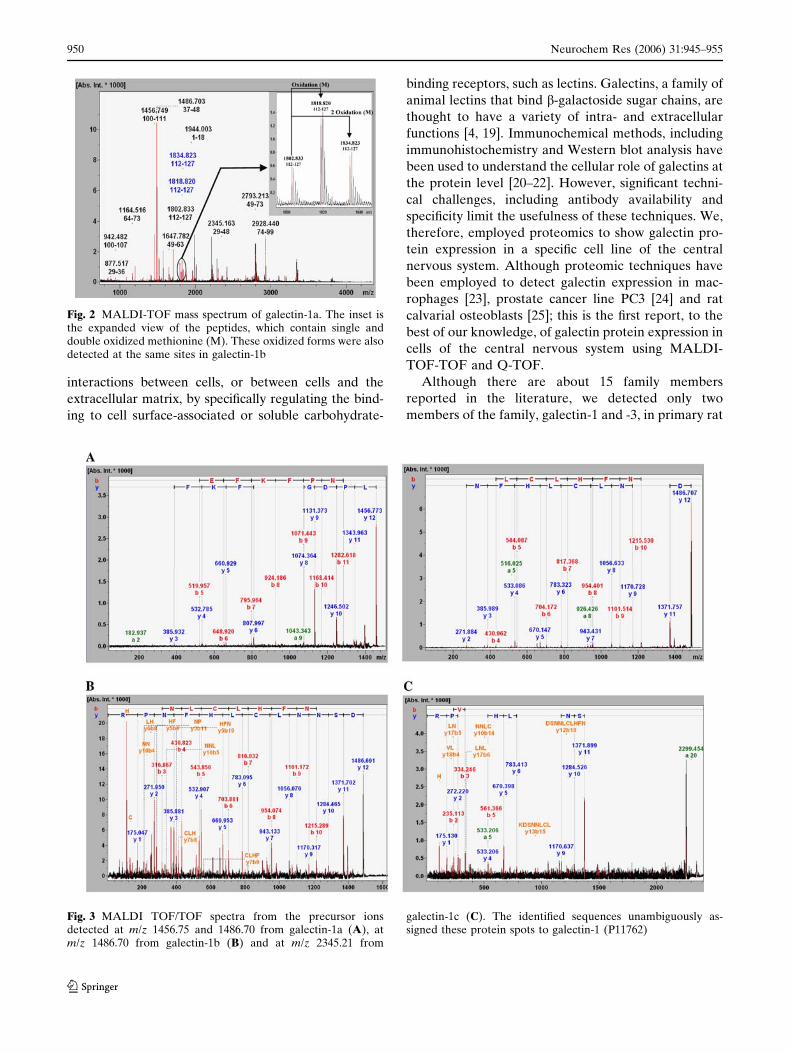
Two methionine residues appear to be oxidized in
galectin-1a and -1b spots, but not in galectin-1c (Fig. 2)
and oxidation of methionine residues was detected at
m/z 2186 (241–261), m/z 2304 (141–161), m/z 2432
(141–162) and m/z 2569 (238–261) in spectra from
galectin-3 from PMF.
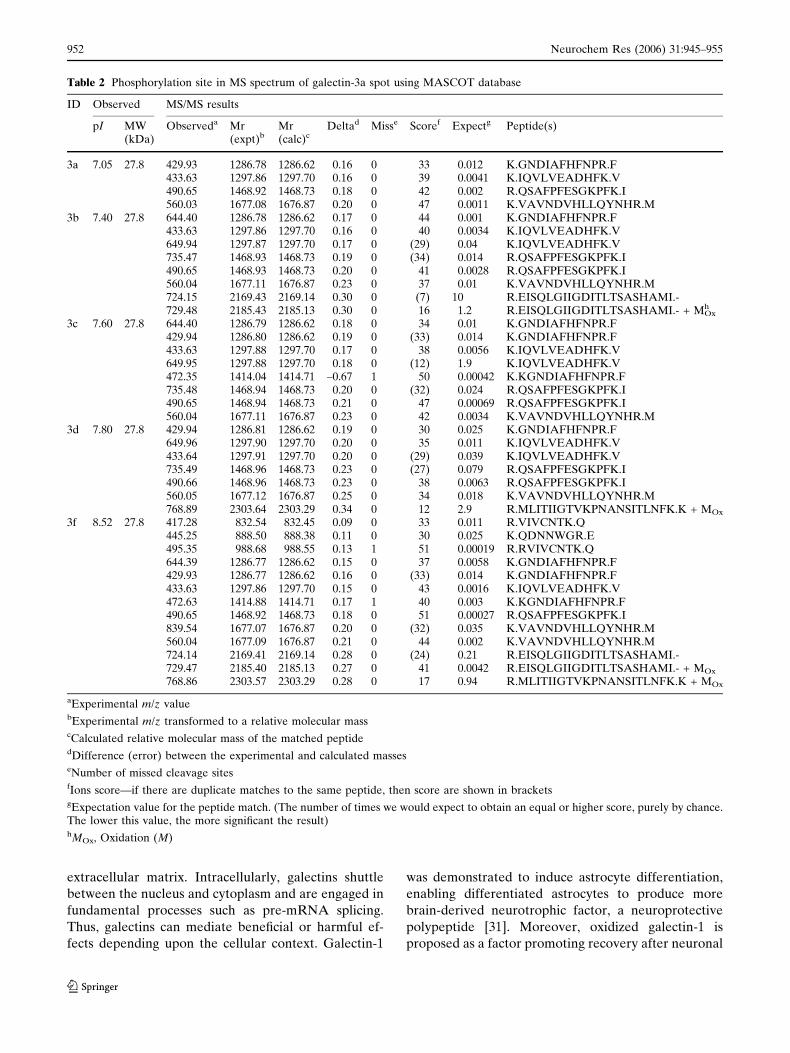
A phosphorylation site was detected at m/z 2043.91
in MS spectrum of galectin-3a spot using MASCOT
database. When we applied galectin-3 to other phos-
phoprotein databases, phosphorylated serine at 308 was
predicted in rat galectin-3 with score 0.979, indicating a
phosphorylation site by the NetPhos 2.0 server (http://
www.cbs.dtu.dk/services/NetPhos/). Mouse galectin-3
was predicted to have different pI 7.16 and 7.96 for one
and two of phosphorylated residues, respectively, as
compared to basal pI of 8.5 by PhosphoSite (http://
www.phosphosite.org/).
To make an affirmative identity of the protein spots,
peptide sequencing was carried out using MS/MS to
obtain peptide sequences for database search. Precur-
sor ions from spot galectin-1a (m/z 1456.75 and
1486.70), galectin-1b (m/z 1486.70) and galectin-1c (m/z
2345.21) were selected, respectively, for peptide
sequencing from the MS spectra of the tryptic peptide
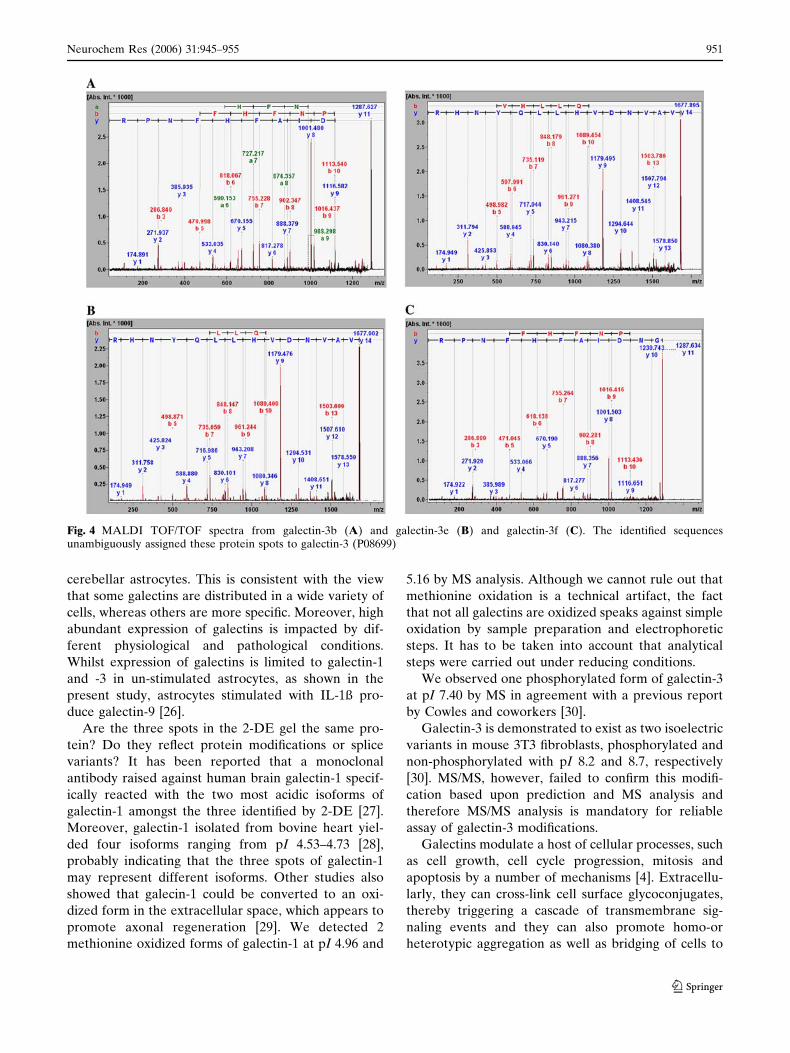
mixture of the spots. Likewise, four (m/z 1287.64,
1415.70, 1677.89 and 2186.13), four (m/z 1287.64,
1415.71, 1677.90 and 2186.13) and two (m/z, 1287.63
and 1677.89) peaks were selected from MS spectra
generated from galectin-3b, -3e and -3f for MS/MS
analysis. MS/MS spectra for all of the peptides ana-
lyzed from spots representing gal1 and gal3 are shown
in Figs. 3 and 4. The complete amino acid sequences of
the analyzed peptides are summarized in Table 1. By
database searching with combined MS and MS/MS
results, the three galectin-1 spots were found to be
galectin-1 protein (accession no. P11762) and the other
three galectin-3 spots were assigned to galectin-3 pro-
tein (accession no. P08699), confirming unambiguous
assignment of the proteins by significant MS/MS results
(Table 1).
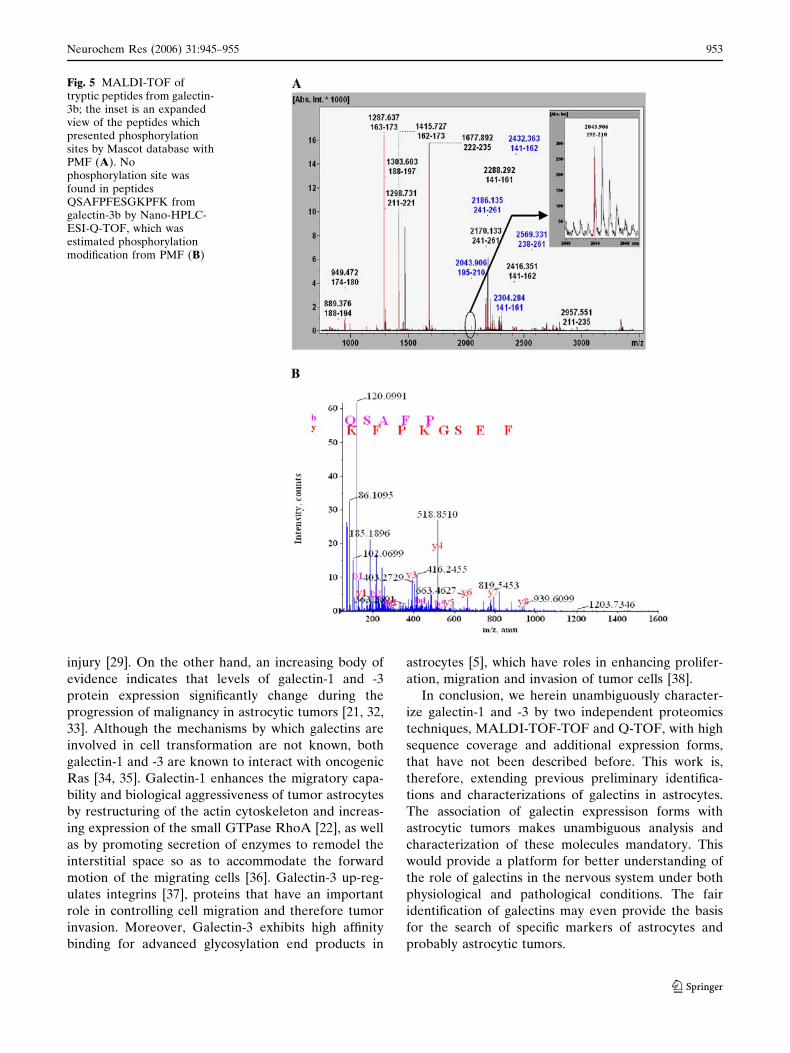
We additionally applied nano-HPLC-ESI-Q-TOF
mass spectrometry to identify more galectin-3 spots as
well as to characterize phosphorylation site. This ESI-
MS/MS analysis allowed 3 more identifications of
galectin-3 (galectin-3a, -3c and -3d in Fig. 1, Table 2)
but did not lead to the detection of any phosphoryla-
tion site, especially from the tryptic digested partial
peptides QSAFPFESGKPFK which was estimated
from both MS analysis with Mascot search and phos-
phoprotein databases (Fig. 5).
Discussion
Cell surface glycans, such as glycocoproteins and
glycolipids, encode information that modulates
kDa
37
25
20
15
10
pI 4.0 6.0 8.05.4 6.8
Fig. 1 Partial 2-DE gel image of rat primary astrocytes withidentified galectins. Proteins were extracted and separated on animmobilized pH 3–10 non-linear gradient strip followed byseparation on a 9–16% gradient polyacrylamide gel. Gels werestained with Coomassie blue and spots were analysed byMALDI-MS and MS/MS. Spots representing the respectivegalectin-1 and -3 are designated as a, b and c
948 Neurochem Res (2006) 31:945–955
123
Ta
ble
1M
ass
spe
ctro
me
tric
al
ide
nti
fica
tio
no
fg
ale
ctin
sin
rat
pri
ma
rya
stro
cyte
s
Acc
ess
ion
no
.aP
rote
inn
am
e(S
yn
on
ym
)T
he
ore
tica
lbID
Ob
serv
ed
cM
atc
he
sS
core
dM
S/M
S
pI
MW
(Da
)p
IM
W(k
Da
)(M
+H
)+P
ep
tid
e(I
nd
ivid
ua
lM
S/M
Ssc
ore
)
LE
G1
_R
AT
(P1
17
62
)G
ale
ctin
-1(b
-ga
lact
osi
de
-bin
din
gle
ctin
L-1
4-I
)(L
act
ose
-bin
din
gle
ctin
1)
(S-L
ac
lect
in1
)(G
ala
pti
n)
(14
kD
ale
ctin
)(R
L1
4.5
)
5.1
41
47
25
.65
1a
4.9
61
3.2
15
22
51
45
6.7
5L
PD
GH
EF
KF
PN
R(4
4)
14
86
.70
DS
NN
LC
LH
FN
PR
(61
)1
b5
.15
13
.29
16
91
48
6.7
0D
SN
NL
CL
HF
NP
R(9
8)
1c
5.4
31
2.8
56
42
34
5.2
1S
FV
LN
LG
KD
SN
NL
CL
CL
HF
NP
R(2
8)
LE
G3
_R
AT
(P0
86
99
)G
ale
ctin
-3(G
ala
cto
se-s
pe
cifi
cle
ctin
3)
(Ma
c-2
an
tig
en
)(I
gE
-bin
din
gp
rote
in)
(35
kD
ale
ctin
)(C
arb
oh
yd
rate
-bin
din
gp
rote
in3
5)
CB
P3
5)
(La
min
in-b
ind
ing
pro
tein
)(L
ect
inL
-29
)
8.6
22
70
70
.34
3b
7.4
02
7.8
19
28
91
28
7.6
4G
ND
IAF
HF
NP
R(7
3)
14
15
.70
KG
ND
IAF
HF
NP
R(2
4)
16
77
.89
VA
VN
DV
HL
LQ
YN
HR
(84
)2
18
6.1
3E
ISQ
LG
IIG
DIT
LT
SA
SH
AM
I+
MO
xe
(12
)3
e8
.10
27
.82
03
11
12
87
.64
GN
DIA
FH
FN
PR
(57
)1
41
5.7
1K
GN
DIA
FH
FN
PR
(27
)1
67
7.9
0V
AV
ND
VH
LL
QY
NH
R(9
0)
21
86
.13
EIS
QL
GII
GD
ITL
TS
AS
HA
MI
+M
Ox
(41
)3
f8
.52
27
.81
32
00
12
87
.63
GN
DIA
FH
FN
PR
(62
)1
67
7.8
9V
AV
ND
VH
LL
QY
NH
R(7
4)
aS
WIS
S-P
RO
Te
ntr
yn
am
ea
nd
pri
ma
rya
cce
ssio
nn
um
be
rin
Ex
PA
Sy
we
bsi
te(h
ttp
://w
ww
.ex
pa
sy.o
rg)
bC
alc
ula
ted
for
the
corr
esp
on
din
gS
WIS
S-P
RO
Te
ntr
yu
sin
gth
eE
xP
AS
yC
om
pu
tep
I/M
Wto
ol
inth
eE
xP
AS
yw
eb
site
cE
stim
ate
dfr
om
the
po
siti
on
of
the
pro
tein
spo
to
nth
e2
Dg
el
dS
core
is–
10
*L
og
(P),
wh
ere
Pis
the
pro
ba
bil
ity
tha
tth
eo
bse
rve
dm
atc
his
ara
nd
om
ev
en
t(M
AS
CO
T,
htt
p:/
/ww
w.m
atr
ixsc
ien
ce.c
om
/he
lp/s
cori
ng
-he
lp.h
tml)
eM
Ox,
Ox
ida
tio
n(M
)
Neurochem Res (2006) 31:945–955 949
123
interactions between cells, or between cells and the
extracellular matrix, by specifically regulating the bind-
ing to cell surface-associated or soluble carbohydrate-
binding receptors, such as lectins. Galectins, a family of
animal lectins that bind b-galactoside sugar chains, are
thought to have a variety of intra- and extracellular
functions [4, 19]. Immunochemical methods, including
immunohistochemistry and Western blot analysis have
been used to understand the cellular role of galectins at
the protein level [20–22]. However, significant techni-
cal challenges, including antibody availability and
specificity limit the usefulness of these techniques. We,
therefore, employed proteomics to show galectin pro-
tein expression in a specific cell line of the central
nervous system. Although proteomic techniques have
been employed to detect galectin expression in mac-
rophages [23], prostate cancer line PC3 [24] and rat
calvarial osteoblasts [25]; this is the first report, to the
best of our knowledge, of galectin protein expression in
cells of the central nervous system using MALDI-
TOF-TOF and Q-TOF.
Although there are about 15 family members
reported in the literature, we detected only two
members of the family, galectin-1 and -3, in primary rat
Fig. 3 MALDI TOF/TOF spectra from the precursor ionsdetected at m/z 1456.75 and 1486.70 from galectin-1a (A), atm/z 1486.70 from galectin-1b (B) and at m/z 2345.21 from
galectin-1c (C). The identified sequences unambiguously as-signed these protein spots to galectin-1 (P11762)
Fig. 2 MALDI-TOF mass spectrum of galectin-1a. The inset isthe expanded view of the peptides, which contain single anddouble oxidized methionine (M). These oxidized forms were alsodetected at the same sites in galectin-1b
950 Neurochem Res (2006) 31:945–955
123
cerebellar astrocytes. This is consistent with the view
that some galectins are distributed in a wide variety of
cells, whereas others are more specific. Moreover, high
abundant expression of galectins is impacted by dif-
ferent physiological and pathological conditions.
Whilst expression of galectins is limited to galectin-1
and -3 in un-stimulated astrocytes, as shown in the
present study, astrocytes stimulated with IL-1ß pro-
duce galectin-9 [26].
Are the three spots in the 2-DE gel the same pro-
tein? Do they reflect protein modifications or splice
variants? It has been reported that a monoclonal
antibody raised against human brain galectin-1 specif-
ically reacted with the two most acidic isoforms of
galectin-1 amongst the three identified by 2-DE [27].
Moreover, galectin-1 isolated from bovine heart yiel-
ded four isoforms ranging from pI 4.53–4.73 [28],
probably indicating that the three spots of galectin-1
may represent different isoforms. Other studies also
showed that galecin-1 could be converted to an oxi-
dized form in the extracellular space, which appears to
promote axonal regeneration [29]. We detected 2
methionine oxidized forms of galectin-1 at pI 4.96 and
5.16 by MS analysis. Although we cannot rule out that
methionine oxidation is a technical artifact, the fact
that not all galectins are oxidized speaks against simple
oxidation by sample preparation and electrophoretic
steps. It has to be taken into account that analytical
steps were carried out under reducing conditions.
We observed one phosphorylated form of galectin-3
at pI 7.40 by MS in agreement with a previous report
by Cowles and coworkers [30].
Galectin-3 is demonstrated to exist as two isoelectric
variants in mouse 3T3 fibroblasts, phosphorylated and
non-phosphorylated with pI 8.2 and 8.7, respectively
[30]. MS/MS, however, failed to confirm this modifi-
cation based upon prediction and MS analysis and
therefore MS/MS analysis is mandatory for reliable
assay of galectin-3 modifications.
Galectins modulate a host of cellular processes, such
as cell growth, cell cycle progression, mitosis and
apoptosis by a number of mechanisms [4]. Extracellu-
larly, they can cross-link cell surface glycoconjugates,
thereby triggering a cascade of transmembrane sig-
naling events and they can also promote homo-or
heterotypic aggregation as well as bridging of cells to
Fig. 4 MALDI TOF/TOF spectra from galectin-3b (A) and galectin-3e (B) and galectin-3f (C). The identified sequencesunambiguously assigned these protein spots to galectin-3 (P08699)
Neurochem Res (2006) 31:945–955 951
123
extracellular matrix. Intracellularly, galectins shuttle
between the nucleus and cytoplasm and are engaged in
fundamental processes such as pre-mRNA splicing.
Thus, galectins can mediate beneficial or harmful ef-
fects depending upon the cellular context. Galectin-1
was demonstrated to induce astrocyte differentiation,
enabling differentiated astrocytes to produce more
brain-derived neurotrophic factor, a neuroprotective
polypeptide [31]. Moreover, oxidized galectin-1 is
proposed as a factor promoting recovery after neuronal
Table 2 Phosphorylation site in MS spectrum of galectin-3a spot using MASCOT database
ID Observed MS/MS results
pI MW(kDa)
Observeda Mr(expt)b
Mr(calc)c
Deltad Misse Scoref Expectg Peptide(s)
3a 7.05 27.8 429.93 1286.78 1286.62 0.16 0 33 0.012 K.GNDIAFHFNPR.F433.63 1297.86 1297.70 0.16 0 39 0.0041 K.IQVLVEADHFK.V490.65 1468.92 1468.73 0.18 0 42 0.002 R.QSAFPFESGKPFK.I560.03 1677.08 1676.87 0.20 0 47 0.0011 K.VAVNDVHLLQYNHR.M
3b 7.40 27.8 644.40 1286.78 1286.62 0.17 0 44 0.001 K.GNDIAFHFNPR.F433.63 1297.86 1297.70 0.16 0 40 0.0034 K.IQVLVEADHFK.V649.94 1297.87 1297.70 0.17 0 (29) 0.04 K.IQVLVEADHFK.V735.47 1468.93 1468.73 0.19 0 (34) 0.014 R.QSAFPFESGKPFK.I490.65 1468.93 1468.73 0.20 0 41 0.0028 R.QSAFPFESGKPFK.I560.04 1677.11 1676.87 0.23 0 37 0.01 K.VAVNDVHLLQYNHR.M724.15 2169.43 2169.14 0.30 0 (7) 10 R.EISQLGIIGDITLTSASHAMI.-729.48 2185.43 2185.13 0.30 0 16 1.2 R.EISQLGIIGDITLTSASHAMI.- + MOx
h
3c 7.60 27.8 644.40 1286.79 1286.62 0.18 0 34 0.01 K.GNDIAFHFNPR.F429.94 1286.80 1286.62 0.19 0 (33) 0.014 K.GNDIAFHFNPR.F433.63 1297.88 1297.70 0.17 0 38 0.0056 K.IQVLVEADHFK.V649.95 1297.88 1297.70 0.18 0 (12) 1.9 K.IQVLVEADHFK.V472.35 1414.04 1414.71 –0.67 1 50 0.00042 K.KGNDIAFHFNPR.F735.48 1468.94 1468.73 0.20 0 (32) 0.024 R.QSAFPFESGKPFK.I490.65 1468.94 1468.73 0.21 0 47 0.00069 R.QSAFPFESGKPFK.I560.04 1677.11 1676.87 0.23 0 42 0.0034 K.VAVNDVHLLQYNHR.M
3d 7.80 27.8 429.94 1286.81 1286.62 0.19 0 30 0.025 K.GNDIAFHFNPR.F649.96 1297.90 1297.70 0.20 0 35 0.011 K.IQVLVEADHFK.V433.64 1297.91 1297.70 0.20 0 (29) 0.039 K.IQVLVEADHFK.V735.49 1468.96 1468.73 0.23 0 (27) 0.079 R.QSAFPFESGKPFK.I490.66 1468.96 1468.73 0.23 0 38 0.0063 R.QSAFPFESGKPFK.I560.05 1677.12 1676.87 0.25 0 34 0.018 K.VAVNDVHLLQYNHR.M768.89 2303.64 2303.29 0.34 0 12 2.9 R.MLITIIGTVKPNANSITLNFK.K + MOx
3f 8.52 27.8 417.28 832.54 832.45 0.09 0 33 0.011 R.VIVCNTK.Q445.25 888.50 888.38 0.11 0 30 0.025 K.QDNNWGR.E495.35 988.68 988.55 0.13 1 51 0.00019 R.RVIVCNTK.Q644.39 1286.77 1286.62 0.15 0 37 0.0058 K.GNDIAFHFNPR.F429.93 1286.77 1286.62 0.16 0 (33) 0.014 K.GNDIAFHFNPR.F433.63 1297.86 1297.70 0.15 0 43 0.0016 K.IQVLVEADHFK.V472.63 1414.88 1414.71 0.17 1 40 0.003 K.KGNDIAFHFNPR.F490.65 1468.92 1468.73 0.18 0 51 0.00027 R.QSAFPFESGKPFK.I839.54 1677.07 1676.87 0.20 0 (32) 0.035 K.VAVNDVHLLQYNHR.M560.04 1677.09 1676.87 0.21 0 44 0.002 K.VAVNDVHLLQYNHR.M724.14 2169.41 2169.14 0.28 0 (24) 0.21 R.EISQLGIIGDITLTSASHAMI.-729.47 2185.40 2185.13 0.27 0 41 0.0042 R.EISQLGIIGDITLTSASHAMI.- + MOx
768.86 2303.57 2303.29 0.28 0 17 0.94 R.MLITIIGTVKPNANSITLNFK.K + MOx
aExperimental m/z valuebExperimental m/z transformed to a relative molecular masscCalculated relative molecular mass of the matched peptidedDifference (error) between the experimental and calculated masseseNumber of missed cleavage sitesfIons score—if there are duplicate matches to the same peptide, then score are shown in bracketsgExpectation value for the peptide match. (The number of times we would expect to obtain an equal or higher score, purely by chance.The lower this value, the more significant the result)hMOx, Oxidation (M)
952 Neurochem Res (2006) 31:945–955
123
injury [29]. On the other hand, an increasing body of
evidence indicates that levels of galectin-1 and -3
protein expression significantly change during the
progression of malignancy in astrocytic tumors [21, 32,
33]. Although the mechanisms by which galectins are
involved in cell transformation are not known, both
galectin-1 and -3 are known to interact with oncogenic
Ras [34, 35]. Galectin-1 enhances the migratory capa-
bility and biological aggressiveness of tumor astrocytes
by restructuring of the actin cytoskeleton and increas-
ing expression of the small GTPase RhoA [22], as well
as by promoting secretion of enzymes to remodel the
interstitial space so as to accommodate the forward
motion of the migrating cells [36]. Galectin-3 up-reg-
ulates integrins [37], proteins that have an important
role in controlling cell migration and therefore tumor
invasion. Moreover, Galectin-3 exhibits high affinity
binding for advanced glycosylation end products in
astrocytes [5], which have roles in enhancing prolifer-
ation, migration and invasion of tumor cells [38].
In conclusion, we herein unambiguously character-
ize galectin-1 and -3 by two independent proteomics
techniques, MALDI-TOF-TOF and Q-TOF, with high
sequence coverage and additional expression forms,
that have not been described before. This work is,
therefore, extending previous preliminary identifica-
tions and characterizations of galectins in astrocytes.
The association of galectin expressison forms with
astrocytic tumors makes unambiguous analysis and
characterization of these molecules mandatory. This
would provide a platform for better understanding of
the role of galectins in the nervous system under both
physiological and pathological conditions. The fair
identification of galectins may even provide the basis
for the search of specific markers of astrocytes and
probably astrocytic tumors.
Fig. 5 MALDI-TOF oftryptic peptides from galectin-3b; the inset is an expandedview of the peptides whichpresented phosphorylationsites by Mascot database withPMF (A). Nophosphorylation site wasfound in peptidesQSAFPFESGKPFK fromgalectin-3b by Nano-HPLC-ESI-Q-TOF, which wasestimated phosphorylationmodification from PMF (B)
Neurochem Res (2006) 31:945–955 953
123
Acknowledgments Dr. Ephrem Engidawork is grateful for thesupport of Austrian Embassy Development Cooperation, AddisAbaba, Ethiopia.
References
1. Barondes SH, Castronovo V, Cooper DNW, Cummings RD,Drickamer K, Feizi T, Gitt MA, Hirabayashi J, Hughes C,Kasai K (1994) Galectins: a family of animal beta-galacto-side-binding lectins. Cell 76:597–598
2. Kasai K, Hirabayashi J (1996) Galectins: a family of animallectins that decipher glycocodes. J Biochem 119:1–8
3. Wang JL, Gray RM, Haudeck KC, Patterson RJ (2004)Nucleocytoplasmic lectins. Biochimi Biophys Acta1673:75–93
4. Liu FT, Rabinovich GA (2005) Galectins as modulators oftumor progression. Nat Rev Cancer 5:29–41
5. Pricci F, Leto G, Amadio L, Iacobini C, Romeo G, CordoneS, Gradini R, Barsotti P, Liu FT, Di Mario U, Pugliese G(2000) Role of galectin-3 as a receptor for advanced glyco-sylation end products. Kidney Int (Suppl) 77:S31–S39
6. Califice S, Castronovo V, Van Den Brule F (2004) Galectin-3and cancer. Int J Oncol 25:983–992
7. Hynes MA, Gitt M, Barondes SH, Jessell TM, Buck LB(1990) Selective expression of an endogenous lactose-bind-ing lectin gene in subsets of central and peripheral neurons.J Neurosci 10:1004–1013
8. Crandall JE, Dibble C, Butler D, Pays L, Ahmad N, KostekC, Puschel AW, Schwarting GA (2000) Patterning of olfac-tory sensory connections is mediated by extracellular matrixproteins in the nerve layer of the olfactory bulb. J Neurobiol45:195–206
9. Mahanthappa NK, Cooper DN, Barondes SH, SchwartingGA (1994) Rat olfactory neurons can utilize the endogenouslectin, L-14, in a novel adhesion mechanism. Development120:1373–1384
10. Puche AC, Poirier F, Hair M, Bartlett PF, Key B (1996) Roleof galectin-1 in the developing mouse olfactory system. DevBiol 179:274–287
11. Storan MJ, Magnaldo T, Biol-N’Garagba MC, Zick Y, Key B(2004) Expression and putative role of lactoseries carbohy-drates present on NCAM in the rat primary olfactory path-way. J Comp Neurol 475:289–302
12. Pesheva P, Kuklinski S, Biersack HJ, Probstmeier R (2000)Nerve growth factor-mediated expression of galectin-3 inmouse dorsal root ganglion neurons. Neurosci Lett 293:37–40
13. Probstmeier R, Montag D, Schachner M (1995) Galectin-3, aß-galactoside-binding animal lectin, binds to neural recog-nition molecules. J Neurochem 64:2465–2472
14. Zanetta JP (1998) Structure and functions of lectins in thecentral and peripheral nervous system. Acta Anat 161:180–195
15. Yang JW, Czech T, Yamada J, Csaszar E, Baumgartner C,Slavc I, Lubec G (2004) Aberrant cytosolic acyl-CoA thio-ester hydrolase in hippocampus of patients with mesialtemporal lobe epilepsy. Amino Acids 27:269–275
16. Suckau D, Resemann A, Schuerenberg M, Hufnagel P,Franzen J, Holle A (2003) A novel MALDI LIFT-TOF/TOFmass spectrometer for proteomics. Anal Bioanal Chem376:952–965
17. Yang JW, Rodrigo R, Felipo V, Lubec G (2005) Proteomeanalysis of primary neurons and astrocytes from rat cere-bellum. J Proteome Res 4:768–788
18. Perkins DN, Pappin DJ, Creasy DM, Cottrell JS (1999)Probability-based protein identification by searchingsequence databases using mass spectrometry data. Electro-phoresis 20:3551–3567
19. Hsu DK, Liu FT (2004) Regulation of cellular homeostasisby galectins. Glycoconj J 19:507–515
20. Walther M, Kuklinski S, Pesheva P, Guntinas-Lichius O,Angelov DN, Neiss WF, Asou H, Probstmeier R (2000)Galectin-3 is upregulated in microglial cells in response toischemic brain lesions, but not to facial nerve axotomy.J Neurosci Res 61:430–435
21. Camby I, Belot N, Rorive S, Lefranc F, Maurage CA, LahmH, Kaltner H, Hadari Y, Ruchoux MM, Brotchi J, Zick Y,Salmon I, Gabius HJ, Kiss R (2001) Galectins are differen-tially expressed in supratentorial pilocytic astrocytomas,astrocytomas, anaplastic astrocytomas and glioblastomas,and significantly modulate tumor astrocyte migration. BrainPathol 11:12–26
22. Camby I, Belot N, Lefranc F, Sadeghi N, de Launoit Y,Kaltner H, Musette S, Darro F, Danguy A, Salmon I, GabiusHJ, Kiss R (2002) Galectin-1 modulates human glioblastomacell migration into the brain through modifications to theactin cytoskeleton and levels of expression of small GTPases.J Neuropathol Exp Neurol 61:585–596
23. van den Berg TK, Honing H, Franke N, van Remoortere A,Schiphorst WE, Liu FT, Deelder AM, Cummings RD,Hokke CH, van Die I (2004) LacdiNAc-glycans constitute aparasite pattern for galectin-3-mediated immune recognition.J Immunol 173:1902–1907
24. Andersen H, Jensen ON, Moiseeva EP, Eriksen EF (2003) Aproteome study of secreted prostatic factors affectingosteoblastic activity: galectin-1 is involved in differentiationof human bone marrow stromal cells. J Bone Miner Res18:195–203
25. Choi JY, van Wijnen AJ, Aslam F, Leszyk JD, Stein JL,Stein GS, Lian JB, Penman S (1998) Developmental asso-ciation of the beta-galactoside-binding protein galectin-1with the nuclear matrix of rat calvarial osteoblasts. J Cell Sci111:3035–3043
26. Yoshida H, Imaizumi T, Kumagai M, Kimura K, Satoh C,Hanada N, Fujimoto K, Nishi N, Tanji K, Matsumiya T, MoriF, Cui XF, Tamo W, Shibata T, Takanashi S, Okumura K,Nakamura T, Wakabayashi K, Hirashima M, Sato Y, SatohK (2001) Interleukin-1beta stimulates galectin-9 expressionin human astrocytes. Neuroreport 12:3755–3758
27. Cornillot JD, Pontet M, Dupuy C, Chadli A, Caron M,Joubert-Caron R, Bourin P, Bladier D (1998) Productionand characterization of a monoclonal antibody able to dis-criminate galectin-1 from galectin-2 and galectin-3. Glyco-biology 8:425–432
28. Ahmed H, Fink NE, Pohl J, Vasta GR (1996) Galectin-1from bovine spleen: biochemical characterization, carbohy-drate specificity and tissue-specific isoform profiles. J Bio-chem 120:1007–1019
29. Horie H, Kadoya T (2004) Galectin-1 plays essential roles inadult mammalian nervous tissues Roles of oxidized galectin-1. Glycoconj J 19:479–489
30. Cowles EA, Agrwal N, Anderson RL, Wang JL (1990)Carbohydrate-binding protein 35 Isoelectric points of thepolypeptide and a phosphorylated derivative. J Biol Chem265:17706–17712
31. Sasaki T, Hirabayashi J, Manya H, Kasai K, Endo T (2004)Galectin-1 induces astrocyte differentiation, which leads toproduction of brain-derived neurotrophic factor. Glycobiol-ogy 14:357–363
954 Neurochem Res (2006) 31:945–955
123
32. Gordower L, Decaestecker C, Kacem Y, Lemmers A, Gus-man J, Burchert M, Danguy A, Gabius H, Salmon I, Kiss R,Camby I (1999) Galectin-3 and galectin-3-binding siteexpression in human adult astrocytic tumors and relatedangiogenesis. Neuropathol Appl Neurobiol 25:319–330
33. Kuklinski S, Pesheva P, Heimann C, Urschel S, Gloor S,Graeber S, Herzog V, Pietsch T, Wiestler OD, ProbstmeierR (2000) Expression pattern of galectin-3 in neural tumorcell lines. J Neurosci Res 60:45–57
34. Paz A, Haklai R, Elad-Sfadia G, Ballan E, Kloog Y (2001)Galectin-1 binds oncogenic H-Ras to mediate Ras membraneanchrage and cell transformation. Oncogene 20:7486–7493
35. Elad-Sfadia G, Haklai R, Ballan E, Kloog Y (2004) Galectin-3 augments K-Ras activation and triggers a Ras signal that
attenuates ERK but not phosphoinositide 3-kinase activity.J Biol Chem 279:34922–34930
36. Giese A, Rief MD, Loo MA, Berens ME (1994) Determi-nants of human astrocytoma migration. Cancer Res 54:3897–3904
37. Matarrese P, Fusco O, Tinari N, Natoli C, Liu FT, SemeraroML, Malorni W, Iacobelli S (2000) Galectin-3 overexpres-sion protects from apoptosis by improving cell adhesionproperties. Int J Cancer 85:545–554
38. Abe R, Shimizu T, Sugawara H, Watanabe H, Nakamura H,Choei H, Sasaki N, Yamagishi S, Takeuchi M, Shimizu H(2004) Regulation of human melanoma growth and metas-tasis by AGE-AGE receptor interactions. J Invest Dermatol122:461–467
Neurochem Res (2006) 31:945–955 955
123


