Embed Size (px)
Citation preview
shortstandardlong
FIELD ANALYTICAL CHEMISTRY AND TECHNOLOGY 5(3): 121–130, 2001
Fact WILEY-Interscience RIGHT INTERACTIVE
� 2001 John Wiley & Sons, Inc.
In-Water Field Analytical Technology: Underwater MassSpectrometry, Mobile Robots, and Remote Intelligence forWide and Local Area Chemical Profiling
D. P. Fries, 1 R. T. Short, 1 L. L. Langebrake, 1 J. T. Patten, 1 M. L. Kerr, 1 G. Kibelka, 1 D. C. Burwell, 2 andJ. C. Jalbert 3
1Center for Ocean Technology, College of Marine Science, University of South Florida, 140 Seventh AvenueSouth, St. Petersburg, Florida 337012College of Marine Science, University of South Florida, 140 Seventh Avenue South, St. Petersburg, Florida337013Department of Ocean Engineering, Florida Atlantic University, 101 North Beach Road, Boca Raton, Florida33004
Received 17 December 2000; revised 16 February 2001; accepted 25 February 2001
Abstract: An automated field analysis strategy for aque-ous environments is proposed with the use of a mobilerobot equipped with an underwater mass spectrometeraided by linked remote numerical models or natural in-telligence. Intelligent search strategies were made pos-sible through the use of numerical models, and naturalintelligence was in the form of a man in the loop. Thefield-analysis strategy is useful for local- and wide-areain situ chemical surveying for environmental and eco-nomical tasks. The operation of chemoreceptive field un-derwater robots is demonstrated during two field trials,one using numerical models to aid in characterization ofchemical dispersion, and the other discriminating achemical gradient in the field. � 2001 JohnWiley & Sons,Inc. Field Analyt Chem Technol 5: 121–130, 2001
Introduction
Chemical source localization and vehicle navigation withthe help of chemical sensors in turbulent media is a subjectthat is of both technological and scientific importance. It isoften necessary to locate a source of chemicals from pollu-tion or natural processes or because the source may have aneconomic value (e.g., oil prospecting). Chemical navigationin the natural setting may allow elucidation of chemical-based search strategies used by biological organisms, it mayprovide chemical information needed to supplement physi-
Correspondence to:D. P. Fries ([email protected])Contract grant sponsor: Office of Naval ResearchContract grant number: N00014-98-1-0154
cal circulation models, or it may yield information aboutlarge scale geochromatography of chemicals in the environ-ment.
Mobile robots (mobots) have been used for tracking andunderstanding the transport of chemicals in a dispersive airenvironment. Ishida utilized an autonomous robot and anodor compass (a gas and wind-direction sensor) for labora-tory studies of plume visualization in air.1–3 In addition, theuse of odor trails for robot navigation has also been treatedin separate studies.4–6These studies have focused on volatilechemical transport in the atmosphere or detection of chem-ical markers on the ground. A very limited amount of workhas been done for chemicals in the water. Grasso and co-workers have studied chemo-orientation in water with theuse of an underwater wheeled robotic lobster equipped witha pair of conductivity sensors and have made progress inunderstanding biological search strategies and search algo-rithms.7
Chemical signals in the field are unlike light and soundsignals. Chemical information is multidimensional; that is,each chemical channel (i.e., parent molecule) contains addedchemical information available in the fragments that makeup the molecule. This applies in both atmospheric and un-derwater chemical dynamics. Ideally, a sensor suitable forsuch numerous input signals would be capable of flexible,simultaneous signal detection with unique chemical identi-fication information. Because mass spectrometry is arguablythe most versatile of chemical sensors, we have undertakendevelopment of in situ mass-spectrometry systems capableof real-time, dynamic, in-water field analysis.8,9
FACT WILEY-Interscience LEFT INTERACTIVE
shortstandardlong
122 FIELD ANALYTICAL CHEMISTRY AND TECHNOLOGY—2001
In general, field chemical analysis must account for thephysics of fluid transport, which affects and can dominatethe chemical stimuli distribution. This in turn necessitatesmatched sensor design and construction and influences thechoice of signal-acquisition parameters. From the physicalperspective, distribution of chemical stimuli depends on dif-fusion and the turbulent dispersion of the bulk fluid. Diffu-sion dominates on the spatial scale of micrometers and mil-limeters and on the time scale of seconds. Larger scales(meters to kilometers) are dominated by dispersion via fluidmotion. Numerical circulation models are one of the prom-ising techniques for estimating the residual flow field in thecoastal ocean (i.e., large scale) with the use of observed wa-ter salinity, temperature, and wind data.10 Despite the factthat numerical solutions sometimes include large errors dueto their approximate nature, when the desire is to forecastdispersion of a material, numerical modeling is probably themost powerful method available today.
A needed component for successful deployment of anyadvanced sensor such as an underwater mass spectrometeris a platform, either roving or moored, for location of thesensor in the chemical field. Autonomous underwater vehi-cles (AUV) have been recently advancing in maturity andcapability and can be considered to be an emerging optionfor field analytics.11 We have successfully deployed massspectrometers in the field in an AUV for general surveyingand completed preliminary exercises for chemical localiza-tion.12,13 An untethered autonomous guided vehicle (AGV)has been developed for more flexible sensor route planningand more real-time control, which has resulted from inser-tion of a man in the loop. The present article proposes local-and wide-area chemical profiling and localization in the fieldwith the use of either remote numerical simulation programsor a human controller as external aids for chemical naviga-tion of MS-equipped roving vehicles. Included is the inte-gration of lab-based hindcast/forecast numerical models (orlab-based human controllers) as search-pathmentors for mo-bile guided and autonomous vehicles and the bridging of theland-based remote processing with the field analyzers usingwireless technology.
Underwater Mass Spectrometry
Underwater Membrane Introduction/Quadrupole MassFilter System
For volatile organic compounds in water, a linear quad-rupole mass filter, Transpector 2 Residual Gas Analyzer (In-ficon, Syracuse, NY) is used, coupled to a membrane intro-duction interface (MIMS Technology, Inc., Palm Bay, FL).Themembranematerial was constructed frommedical-gradehollow-fiber polydimethylsiloxane (PDMS), 15-mm length,0.64-mm i.d., and 1.19-mm o.d. connected in aU configu-ration to inlet and outlet 1.59-mm o.d. stainless-steel tubing.The hollow fiber is physically located within the vacuumnext to the ion source.
Fluid sampling is controlled by amulti-channel peristaltic
pump (Pump Express/ALITEA AB, Chicago, IL), and a two-position rotary switch valve (Valco Instruments, Houston,TX) that is used to switch between sample stream and ref-erence HPLC-grade water from a reservoir. Narrow-borePEEK tubing (Upchurch Scientific, Oak Harbor, WA) isused for fluid interconnects. Flow rates typically used duringexperiments were from 0.5 to 1.0 ml/min. The sample isheated to 60�C with the use of an in-line heater (ModelCN491A-D1, Omega, Stamford, CT).
The vacuum housing for the mass analyzer was designedto direct sample through the ion source. Vacuum is main-tained by a V70LP MacroTorr turbo pump (Varian, Lexing-ton, MA) exhausting to two diaphragm pumps (KNF Neu-berger, Trenton, NJ) that are placed in series. Pressures inthe mass analyzer region typically realized were 10�3 Pa.
The Transpector 2 RGA (mass range 1–100 amu) is typ-ically operated in a selected mass monitoring mode and iscontrolled by an embedded 166-MHz CardPC (Cell Com-puting) with 144-MB flash memory. Communication andcontrol of the embedded PC occurs by either hard-wired orwireless rf link Ethernet. In the typical configuration, theanalyzer cycles through 18 selected masses in�10 s.
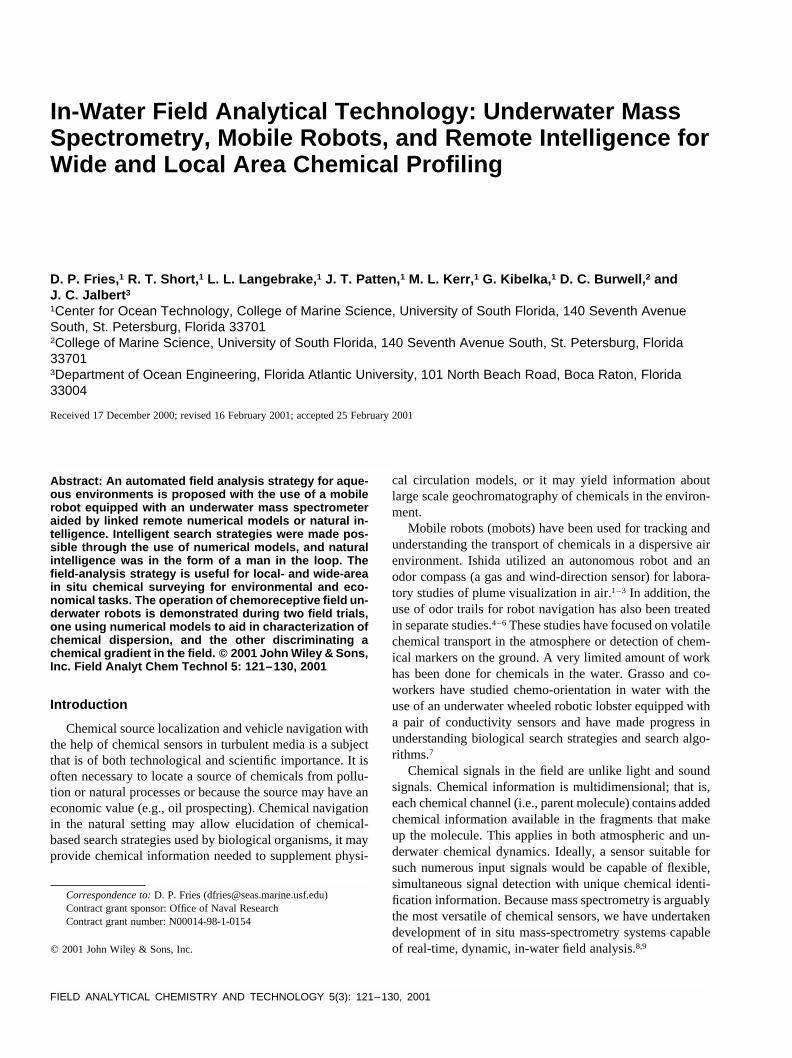
For deployment underwater (Figure 1), the system ispackaged in a series of three pressure-vessel modules: fluidcontrol, analyzer section, and diaphragm pump module. Thesystem runs on 24-V dc, consumes 100 W during operation,is 1.4 m in length, weighs 39 kg in air, and is neutrallybuoyant in water. The system is designed to be capable ofoperation to depths of 70 m of water. The unit can also beoperated in air with the pressure vessel acting as a weath-erproof housing. The vacuum system can be operated in aclosed environment for up to 12 days by partially evacuatingthe diaphragm section to 0.25 atm prior to deployment.
Underwater Membrane Introduction/Ion-Trap MassSpectrometer System
For a more analytically powerful system, an underwatermass spectrometer based on an ion-trap MS analyzer wasdeveloped. The ion trap allows a wider mass range (up to650 amu), increased sensitivity up to a factor of 20 times, afull mass spectrum capture during each cycle, and multiple-stage mass spectrometry (MSn).
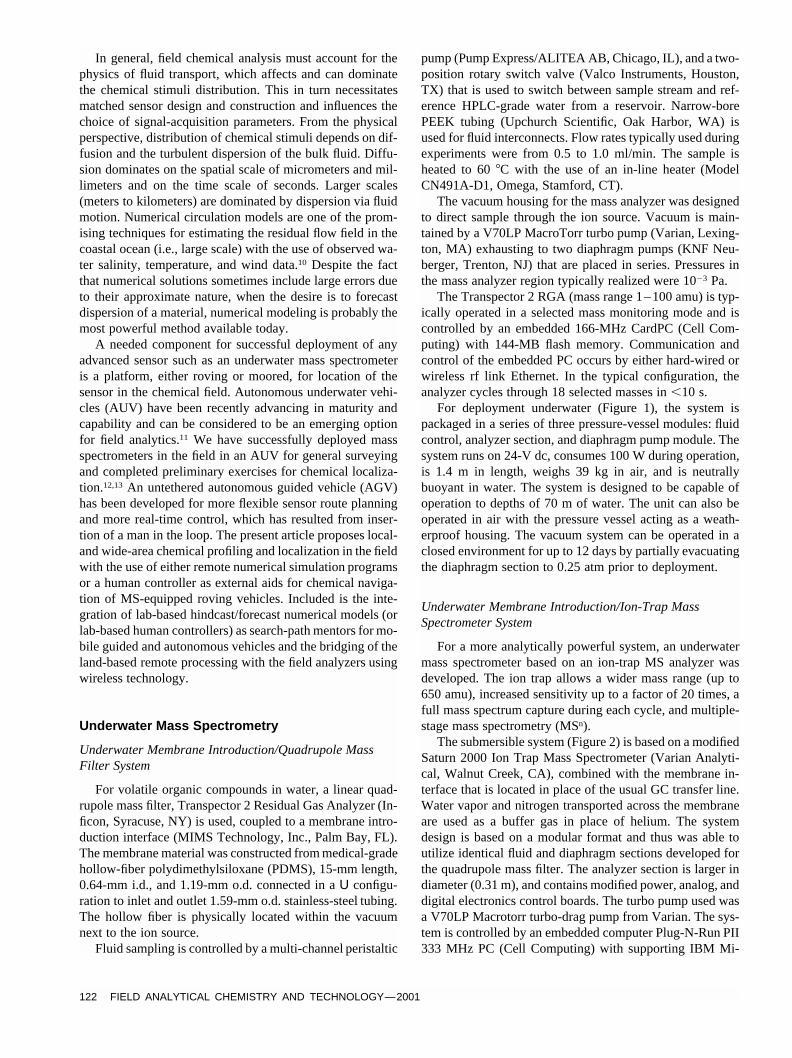
The submersible system (Figure 2) is based on amodifiedSaturn 2000 Ion Trap Mass Spectrometer (Varian Analyti-cal, Walnut Creek, CA), combined with the membrane in-terface that is located in place of the usual GC transfer line.Water vapor and nitrogen transported across the membraneare used as a buffer gas in place of helium. The systemdesign is based on a modular format and thus was able toutilize identical fluid and diaphragm sections developed forthe quadrupole mass filter. The analyzer section is larger indiameter (0.31 m), and contains modified power, analog, anddigital electronics control boards. The turbo pump used wasa V70LP Macrotorr turbo-drag pump from Varian. The sys-tem is controlled by an embedded computer Plug-N-Run PII333 MHz PC (Cell Computing) with supporting IBM Mi-
shortstandardlong
FIELD ANALYTICAL CHEMISTRY AND TECHNOLOGY—2001 123
FACT WILEY-Interscience RIGHT INTERACTIVE
FIG. 1. Underwater membrane introduction quadrupole mass spectrometer.Left,CAD schematic of instrument in nose cone;right, actual instrument.The main compartments are (1) fluid introduction system, (2) analyzer portion, and (3) forepump section. The system runs on 24-V dc, uses 90 W, weighs39 kg, and is 1.4-m long. [Color figure can be viewed in the online issue, which is available at www.interscience.wiley.com.]
crodrive hard-disk memory. The total system, including thefluid and diaphragm sections, weighs 68 kg in air, is neu-trally buoyant in water, and is 1.35 m in length. Power con-sumed is 150 W at 24-V dc.
Mobile Robots
Autonomous Underwater Vehicles—Ocean Explorer(OEX)
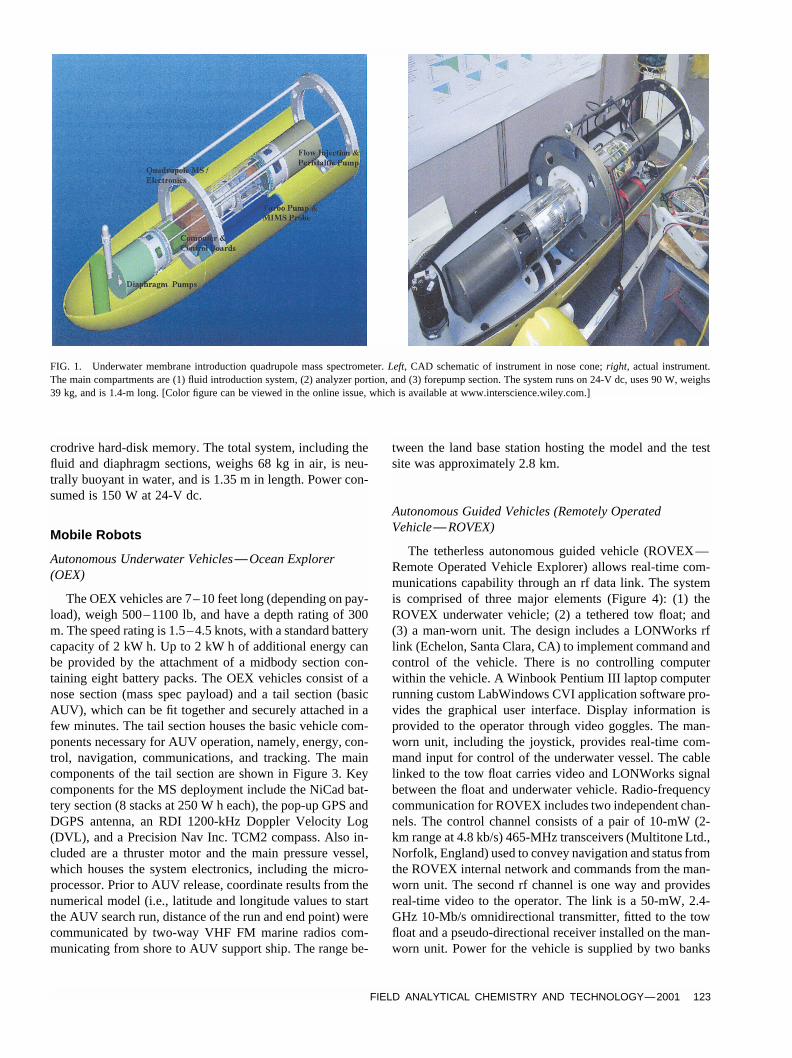
The OEX vehicles are 7–10 feet long (depending on pay-load), weigh 500–1100 lb, and have a depth rating of 300m. The speed rating is 1.5–4.5 knots, with a standard batterycapacity of 2 kW h. Up to 2 kW h of additional energy canbe provided by the attachment of a midbody section con-taining eight battery packs. The OEX vehicles consist of anose section (mass spec payload) and a tail section (basicAUV), which can be fit together and securely attached in afew minutes. The tail section houses the basic vehicle com-ponents necessary for AUV operation, namely, energy, con-trol, navigation, communications, and tracking. The maincomponents of the tail section are shown in Figure 3. Keycomponents for the MS deployment include the NiCad bat-tery section (8 stacks at 250 W h each), the pop-up GPS andDGPS antenna, an RDI 1200-kHz Doppler Velocity Log(DVL), and a Precision Nav Inc. TCM2 compass. Also in-cluded are a thruster motor and the main pressure vessel,which houses the system electronics, including the micro-processor. Prior to AUV release, coordinate results from thenumerical model (i.e., latitude and longitude values to startthe AUV search run, distance of the run and end point) werecommunicated by two-way VHF FM marine radios com-municating from shore to AUV support ship. The range be-
tween the land base station hosting the model and the testsite was approximately 2.8 km.
Autonomous Guided Vehicles (Remotely OperatedVehicle—ROVEX)
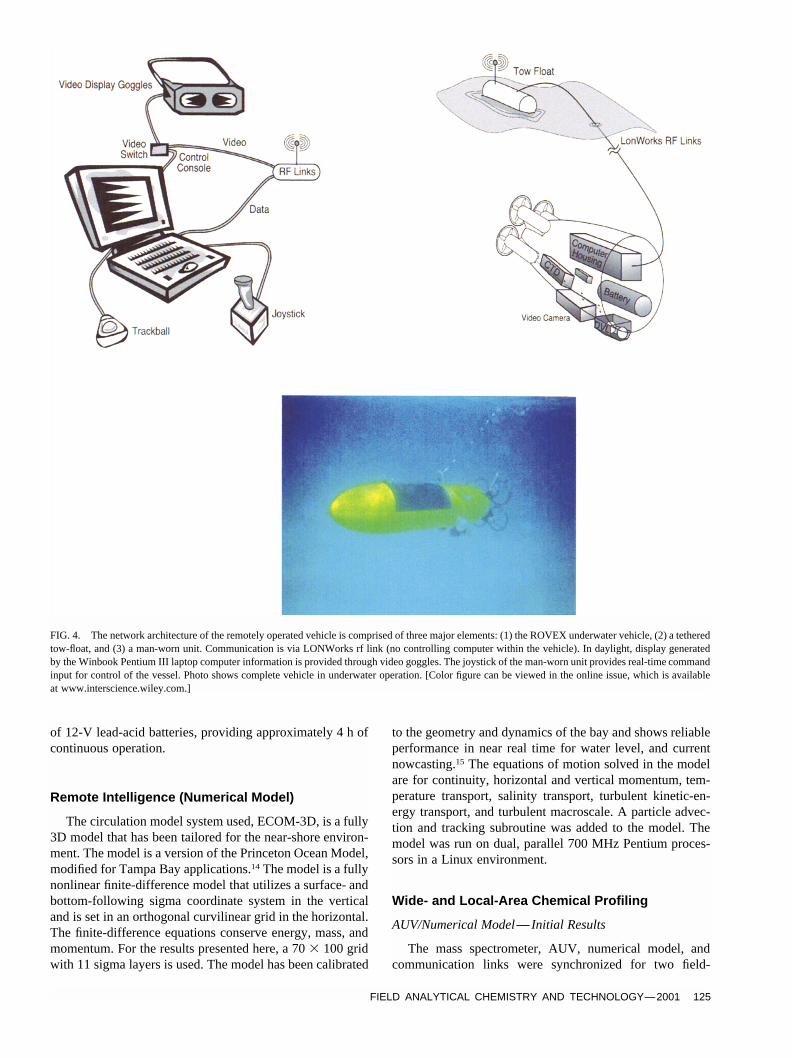
The tetherless autonomous guided vehicle (ROVEX—Remote Operated Vehicle Explorer) allows real-time com-munications capability through an rf data link. The systemis comprised of three major elements (Figure 4): (1) theROVEX underwater vehicle; (2) a tethered tow float; and(3) a man-worn unit. The design includes a LONWorks rflink (Echelon, Santa Clara, CA) to implement command andcontrol of the vehicle. There is no controlling computerwithin the vehicle. A Winbook Pentium III laptop computerrunning custom LabWindows CVI application software pro-vides the graphical user interface. Display information isprovided to the operator through video goggles. The man-worn unit, including the joystick, provides real-time com-mand input for control of the underwater vessel. The cablelinked to the tow float carries video and LONWorks signalbetween the float and underwater vehicle. Radio-frequencycommunication for ROVEX includes two independent chan-nels. The control channel consists of a pair of 10-mW (2-km range at 4.8 kb/s) 465-MHz transceivers (Multitone Ltd.,Norfolk, England) used to convey navigation and status fromthe ROVEX internal network and commands from the man-worn unit. The second rf channel is one way and providesreal-time video to the operator. The link is a 50-mW, 2.4-GHz 10-Mb/s omnidirectional transmitter, fitted to the towfloat and a pseudo-directional receiver installed on the man-worn unit. Power for the vehicle is supplied by two banks
FACT WILEY-Interscience LEFT INTERACTIVE
shortstandardlong
124 FIELD ANALYTICAL CHEMISTRY AND TECHNOLOGY—2001
FIG. 2. Underwater membrane introduction ion-trap mass spectrometer. Left, CAD schematic; right, actual instrument (analyzer section exposed andfluidsection removed). The main modules are (1) fluid introduction system, (2) analyzer portion, and (3) forepump section. The system runs on 24-V dc, uses150 W, weighs 68 kg, and is 1.35-m long. [Color figure can be viewed in the online issue, which is available at www.interscience.wiley.com.]
FIG. 3. Ocean Explorer (OEX) vehicle from Florida Atlantic University. The tail section, housing the basic vehicle components necessary for AUVoperation: energy, control, navigation, communications, and tracking, is 1.4-m long, weighs 500–1100 lb, and has a depth rating of 300 m. The speedrating is 1.5–4.5 knots, with a standard battery capacity of 2 kW h. [Color figure can be viewed in the online issue, which is available atwww.interscience.wiley.com.]
shortstandardlong
FIELD ANALYTICAL CHEMISTRY AND TECHNOLOGY—2001 125
FACT WILEY-Interscience RIGHT INTERACTIVE
FIG. 4. The network architecture of the remotely operated vehicle is comprised of three major elements: (1) the ROVEX underwater vehicle, (2) a tetheredtow-float, and (3) a man-worn unit. Communication is via LONWorks rf link (no controlling computer within the vehicle). In daylight, display generatedby the Winbook Pentium III laptop computer information is provided through video goggles. The joystick of the man-worn unit provides real-time commandinput for control of the vessel. Photo shows complete vehicle in underwater operation. [Color figure can be viewed in the online issue, which is availableat www.interscience.wiley.com.]
of 12-V lead-acid batteries, providing approximately 4 h ofcontinuous operation.
Remote Intelligence (Numerical Model)
The circulation model system used, ECOM-3D, is a fully3D model that has been tailored for the near-shore environ-ment. The model is a version of the Princeton Ocean Model,modified for Tampa Bay applications.14 The model is a fullynonlinear finite-difference model that utilizes a surface- andbottom-following sigma coordinate system in the verticaland is set in an orthogonal curvilinear grid in the horizontal.The finite-difference equations conserve energy, mass, andmomentum. For the results presented here, a 70� 100 gridwith 11 sigma layers is used. The model has been calibrated
to the geometry and dynamics of the bay and shows reliableperformance in near real time for water level, and currentnowcasting.15 The equations of motion solved in the modelare for continuity, horizontal and vertical momentum, tem-perature transport, salinity transport, turbulent kinetic-en-ergy transport, and turbulent macroscale. A particle advec-tion and tracking subroutine was added to the model. Themodel was run on dual, parallel 700 MHz Pentium proces-sors in a Linux environment.
Wide- and Local-Area Chemical Profiling
AUV/Numerical Model— Initial Results
The mass spectrometer, AUV, numerical model, andcommunication links were synchronized for two field-
FACT WILEY-Interscience LEFT INTERACTIVE
shortstandardlong
126 FIELD ANALYTICAL CHEMISTRY AND TECHNOLOGY—2001
deployment exercises on two consecutive days. The modelwas run in conjunction with a continuous point-source re-lease of 6 l of dimethylsulfide (DMS) at a known latitude,longitude, and time. Dimethylsulfide has typical concentra-tion values in the eastern Gulf of Mexico of approximately50 ppt. We chose DMS because it is a naturally occurringsulfur compound generated within the water column by bio-logical production, and our limit of detection is approxi-mately 500 ppt using the diagnostic ion ofm/z 62. At en-riched levels, any signal detected should be associated withthe controlled release; however, in the future, under morerigorous testing, we will take samples from the area back tothe lab benchmarking system to establish the initial condi-tions prior to release.
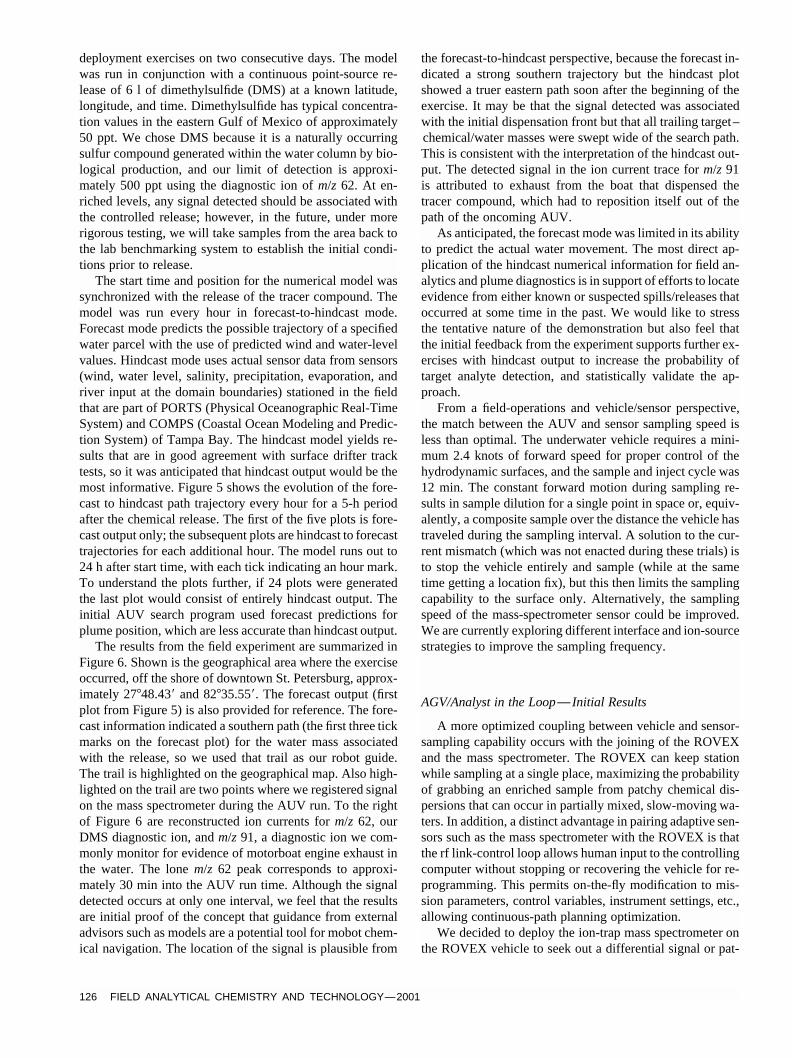
The start time and position for the numerical model wassynchronized with the release of the tracer compound. Themodel was run every hour in forecast-to-hindcast mode.Forecast mode predicts the possible trajectory of a specifiedwater parcel with the use of predicted wind and water-levelvalues. Hindcast mode uses actual sensor data from sensors(wind, water level, salinity, precipitation, evaporation, andriver input at the domain boundaries) stationed in the fieldthat are part of PORTS (Physical Oceanographic Real-TimeSystem) and COMPS (Coastal Ocean Modeling and Predic-tion System) of Tampa Bay. The hindcast model yields re-sults that are in good agreement with surface drifter tracktests, so it was anticipated that hindcast output would be themost informative. Figure 5 shows the evolution of the fore-cast to hindcast path trajectory every hour for a 5-h periodafter the chemical release. The first of the five plots is fore-cast output only; the subsequent plots are hindcast to forecasttrajectories for each additional hour. The model runs out to24 h after start time, with each tick indicating an hour mark.To understand the plots further, if 24 plots were generatedthe last plot would consist of entirely hindcast output. Theinitial AUV search program used forecast predictions forplume position, which are less accurate than hindcast output.
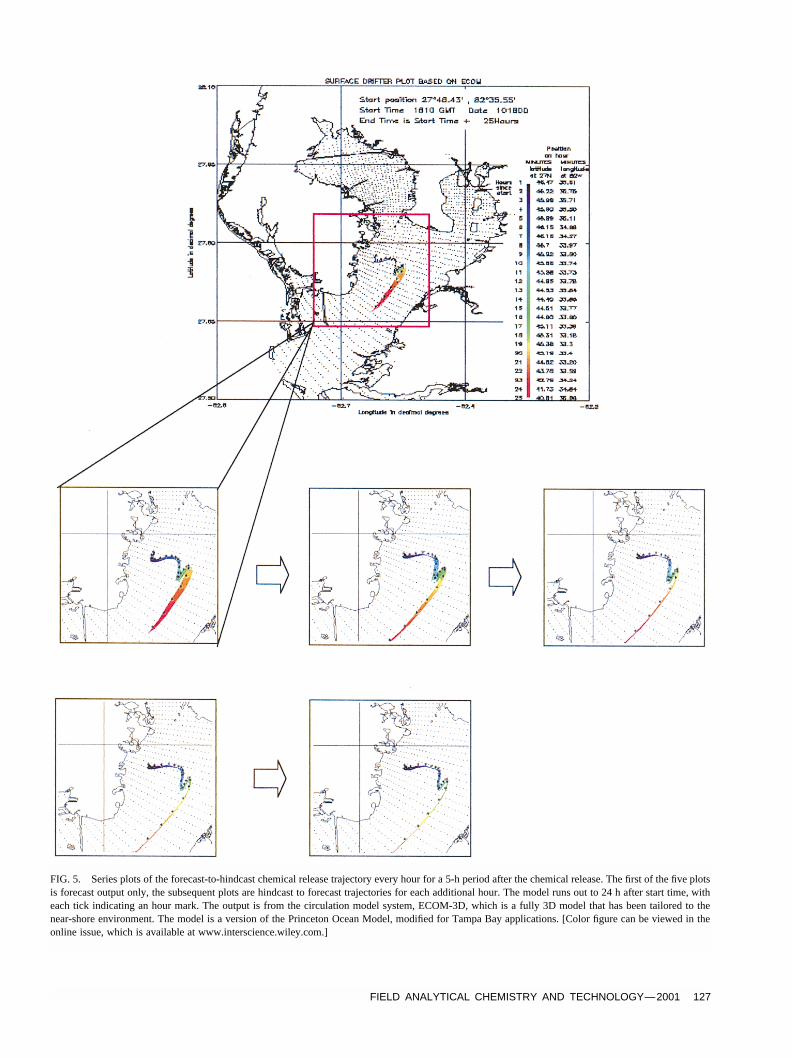
The results from the field experiment are summarized inFigure 6. Shown is the geographical area where the exerciseoccurred, off the shore of downtown St. Petersburg, approx-imately 27�48.43� and 82�35.55�. The forecast output (firstplot from Figure 5) is also provided for reference. The fore-cast information indicated a southern path (the first three tickmarks on the forecast plot) for the water mass associatedwith the release, so we used that trail as our robot guide.The trail is highlighted on the geographical map. Also high-lighted on the trail are two points where we registered signalon the mass spectrometer during the AUV run. To the rightof Figure 6 are reconstructed ion currents form/z 62, ourDMS diagnostic ion, andm/z 91, a diagnostic ion we com-monly monitor for evidence of motorboat engine exhaust inthe water. The lonem/z 62 peak corresponds to approxi-mately 30 min into the AUV run time. Although the signaldetected occurs at only one interval, we feel that the resultsare initial proof of the concept that guidance from externaladvisors such as models are a potential tool for mobot chem-ical navigation. The location of the signal is plausible from
the forecast-to-hindcast perspective, because the forecast in-dicated a strong southern trajectory but the hindcast plotshowed a truer eastern path soon after the beginning of theexercise. It may be that the signal detected was associatedwith the initial dispensation front but that all trailing target–chemical/water masses were swept wide of the search path.This is consistent with the interpretation of the hindcast out-put. The detected signal in the ion current trace form/z 91is attributed to exhaust from the boat that dispensed thetracer compound, which had to reposition itself out of thepath of the oncoming AUV.
As anticipated, the forecast mode was limited in its abilityto predict the actual water movement. The most direct ap-plication of the hindcast numerical information for field an-alytics and plume diagnostics is in support of efforts to locateevidence from either known or suspected spills/releases thatoccurred at some time in the past. We would like to stressthe tentative nature of the demonstration but also feel thatthe initial feedback from the experiment supports further ex-ercises with hindcast output to increase the probability oftarget analyte detection, and statistically validate the ap-proach.
From a field-operations and vehicle/sensor perspective,the match between the AUV and sensor sampling speed isless than optimal. The underwater vehicle requires a mini-mum 2.4 knots of forward speed for proper control of thehydrodynamic surfaces, and the sample and inject cycle was12 min. The constant forward motion during sampling re-sults in sample dilution for a single point in space or, equiv-alently, a composite sample over the distance the vehicle hastraveled during the sampling interval. A solution to the cur-rent mismatch (which was not enacted during these trials) isto stop the vehicle entirely and sample (while at the sametime getting a location fix), but this then limits the samplingcapability to the surface only. Alternatively, the samplingspeed of the mass-spectrometer sensor could be improved.We are currently exploring different interface and ion-sourcestrategies to improve the sampling frequency.
AGV/Analyst in the Loop— Initial Results
A more optimized coupling between vehicle and sensor-sampling capability occurs with the joining of the ROVEXand the mass spectrometer. The ROVEX can keep stationwhile sampling at a single place, maximizing the probabilityof grabbing an enriched sample from patchy chemical dis-persions that can occur in partially mixed, slow-moving wa-ters. In addition, a distinct advantage in pairing adaptive sen-sors such as the mass spectrometer with the ROVEX is thatthe rf link-control loop allows human input to the controllingcomputer without stopping or recovering the vehicle for re-programming. This permits on-the-fly modification to mis-sion parameters, control variables, instrument settings, etc.,allowing continuous-path planning optimization.
We decided to deploy the ion-trap mass spectrometer onthe ROVEX vehicle to seek out a differential signal or pat-
shortstandardlong
FIELD ANALYTICAL CHEMISTRY AND TECHNOLOGY—2001 127
FACT WILEY-Interscience RIGHT INTERACTIVE
FIG. 5. Series plots of the forecast-to-hindcast chemical release trajectory every hour for a 5-h period after the chemical release. The first of the five plotsis forecast output only, the subsequent plots are hindcast to forecast trajectories for each additional hour. The model runs out to 24 h after start time, witheach tick indicating an hour mark. The output is from the circulation model system, ECOM-3D, which is a fully 3D model that has been tailored to thenear-shore environment. The model is a version of the Princeton Ocean Model, modified for Tampa Bay applications. [Color figure can be viewed in theonline issue, which is available at www.interscience.wiley.com.]
FACT WILEY-Interscience LEFT INTERACTIVE
shortstandardlong
128 FIELD ANALYTICAL CHEMISTRY AND TECHNOLOGY—2001
FIG. 6. Results from dimethylsulfide dispersion AUV-MS experiment shown in geographical area off shore of downtown St. Petersburg, Florida. Trailfollowed by AUV highlighted. Forecast output from Figure 5 provided for reference (used for mission planning). The forecast information indicatesdownward Southern path (the first three tick marks on the forecast plot) for water mass associated with release. Reconstructed ion currents form/z 62,DMS andm/z91 (motorboat engine exhaust) are shown. Them/z62 peak corresponds to approximately 30 min into the AUV run time. Subsequent hindcastoutput showed water moving eastward, that is, away from the survey zone. [Color figure can be viewed in the online issue, which is available atwww.interscience.wiley.com.]
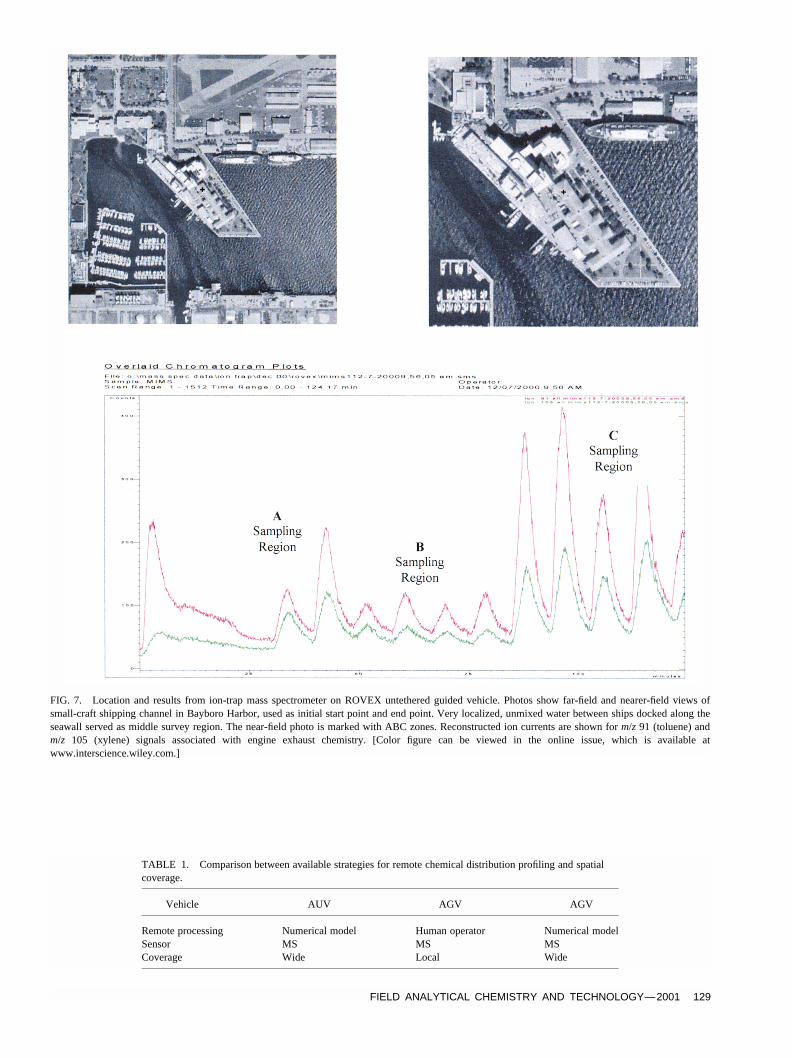
tern in the field. The trap was used because of its increasedsensitivity. The search exercise was intended to act as a sim-ulation of a chemical leak or spill. The goal was to see adifference in chemical concentration between two points inspace separated by a nominal amount of time. For this ex-ercise, we again chose the local environment for conve-nience. A small-craft shipping channel in Bayboro Harborwas used as the initial start and end point. Very localized,low-velocity water in between docked ships along a seawallserved as the middle survey region. The desire was to see ifthere were differences in the signals between the shippingchannel, which should contain injected engine exhaust vol-atiles from passing craft, and the unmixed water, which wasexpected to have a minimal amount of carryover of volatilesfrom the main channel due to the lack of both turbulenceand advective flow.
Figure 7 displays the location of and results from theV-shaped route. Reconstructed ion currents are shown form/z91(toluene) andm/z105 (xylene) that signals associatedwithengine-exhaust chemistry. The peak heights from samplingin the channel were greater than those from outside of thechannel next to the seawall. Also registered (but not shown)are signals for benzaldehyde andmethyl benzaldehyde, otherexhaust chemicals that showed the same relative peakheights between locations. We separately took samples bypaddled boat and analyzed them to ensure that engine self-contamination was not occurring from the ROVEX chase
boat. Peak heights from the grab samples were consistentwith peak heights detected in water in real time by ROVEX-MS.
We view the differences in the chemical concentrationsbetween the channel and seawall as a simulated, but real-world, chemical localization exercise. The lack of signal atthe seawall could be the starting point (i.e., vertex) of asearch triangle seeking to determine the direction of astreaming chemical. Alternatively, the higher to lower andback to higher concentrations detected simply illustrate asource localization for both negative and positive chemicalconcentration gradients.
This is believed to be the first successful demonstrationof field mass spectrometry with the use of underwater massspectrometers and human remotely controlled vehicles. Thisdemo acts as supplement to the wide-area coverage de-scribed previously and can be described as local-area cov-erage. The area profiled is beyond the current resolution ofthe numerical model and a human in the loop is needed forpath planning optimization. Table 1 is provided to comparethe different strategies available to do remote-processorguided chemical distribution profiling.
Conclusion
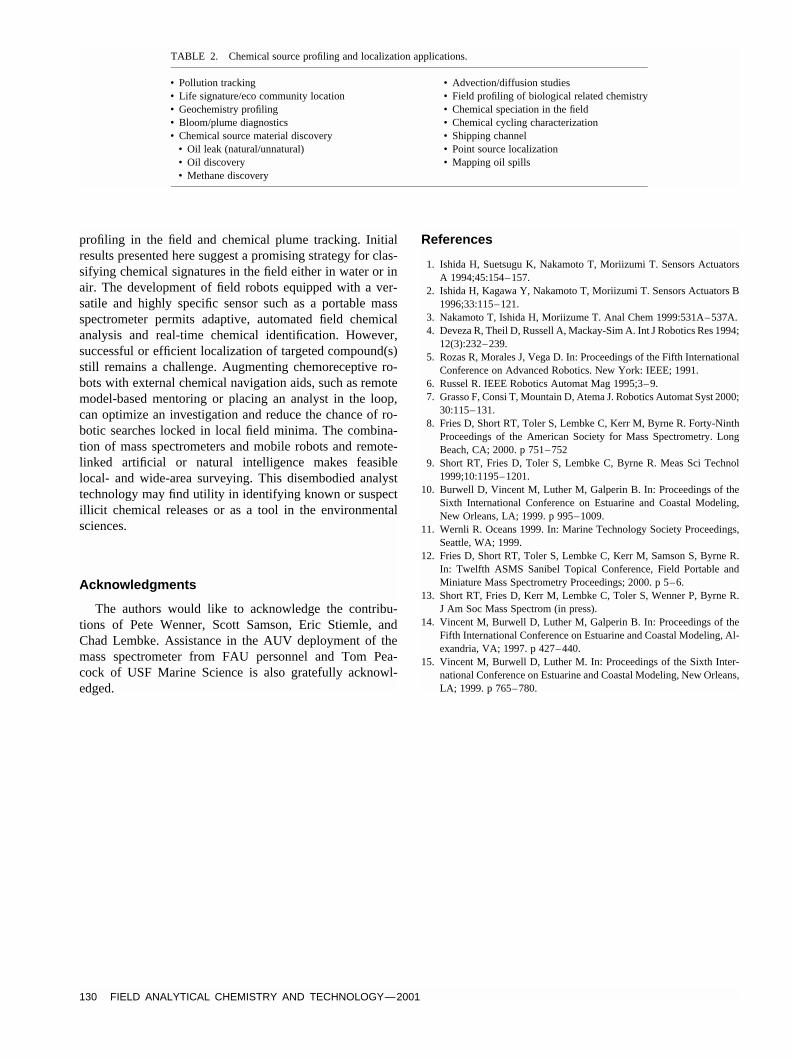
Table 2 shows the potential applications that wouldemerge, be impacted by, or involve underwater chemical
shortstandardlong
FIELD ANALYTICAL CHEMISTRY AND TECHNOLOGY—2001 129
FACT WILEY-Interscience RIGHT INTERACTIVE
FIG. 7. Location and results from ion-trap mass spectrometer on ROVEX untethered guided vehicle. Photos show far-field and nearer-field views ofsmall-craft shipping channel in Bayboro Harbor, used as initial start point and end point. Very localized, unmixed water between ships docked along theseawall served as middle survey region. The near-field photo is marked with ABC zones. Reconstructed ion currents are shown form/z 91 (toluene) andm/z 105 (xylene) signals associated with engine exhaust chemistry. [Color figure can be viewed in the online issue, which is available atwww.interscience.wiley.com.]
TABLE 1. Comparison between available strategies for remote chemical distribution profiling and spatialcoverage.
Vehicle AUV AGV AGV
Remote processing Numerical model Human operator Numerical modelSensor MS MS MSCoverage Wide Local Wide
FACT WILEY-Interscience LEFT INTERACTIVE
shortstandardlong
130 FIELD ANALYTICAL CHEMISTRY AND TECHNOLOGY—2001
TABLE 2. Chemical source profiling and localization applications.
• Pollution tracking• Life signature/eco community location• Geochemistry profiling• Bloom/plume diagnostics• Chemical source material discovery
• Oil leak (natural/unnatural)• Oil discovery• Methane discovery
• Advection/diffusion studies• Field profiling of biological related chemistry• Chemical speciation in the field• Chemical cycling characterization• Shipping channel• Point source localization• Mapping oil spills
profiling in the field and chemical plume tracking. Initialresults presented here suggest a promising strategy for clas-sifying chemical signatures in the field either in water or inair. The development of field robots equipped with a ver-satile and highly specific sensor such as a portable massspectrometer permits adaptive, automated field chemicalanalysis and real-time chemical identification. However,successful or efficient localization of targeted compound(s)still remains a challenge. Augmenting chemoreceptive ro-bots with external chemical navigation aids, such as remotemodel-based mentoring or placing an analyst in the loop,can optimize an investigation and reduce the chance of ro-botic searches locked in local field minima. The combina-tion of mass spectrometers and mobile robots and remote-linked artificial or natural intelligence makes feasiblelocal- and wide-area surveying. This disembodied analysttechnology may find utility in identifying known or suspectillicit chemical releases or as a tool in the environmentalsciences.
Acknowledgments
The authors would like to acknowledge the contribu-tions of Pete Wenner, Scott Samson, Eric Stiemle, andChad Lembke. Assistance in the AUV deployment of themass spectrometer from FAU personnel and Tom Pea-cock of USF Marine Science is also gratefully acknowl-edged.
References
1. Ishida H, Suetsugu K, Nakamoto T, Moriizumi T. Sensors ActuatorsA 1994;45:154–157.
2. Ishida H, Kagawa Y, Nakamoto T, Moriizumi T. Sensors Actuators B1996;33:115–121.
3. Nakamoto T, Ishida H, Moriizume T. Anal Chem 1999:531A–537A.4. Deveza R, Theil D, Russell A, Mackay-Sim A. Int J Robotics Res 1994;
12(3):232–239.5. Rozas R, Morales J, Vega D. In: Proceedings of the Fifth International
Conference on Advanced Robotics. New York: IEEE; 1991.6. Russel R. IEEE Robotics Automat Mag 1995;3–9.7. Grasso F, Consi T, Mountain D, Atema J. Robotics Automat Syst 2000;
30:115–131.8. Fries D, Short RT, Toler S, Lembke C, Kerr M, Byrne R. Forty-Ninth
Proceedings of the American Society for Mass Spectrometry. LongBeach, CA; 2000. p 751–752
9. Short RT, Fries D, Toler S, Lembke C, Byrne R. Meas Sci Technol1999;10:1195–1201.
10. Burwell D, Vincent M, Luther M, Galperin B. In: Proceedings of theSixth International Conference on Estuarine and Coastal Modeling,New Orleans, LA; 1999. p 995–1009.
11. Wernli R. Oceans 1999. In: Marine Technology Society Proceedings,Seattle, WA; 1999.
12. Fries D, Short RT, Toler S, Lembke C, Kerr M, Samson S, Byrne R.In: Twelfth ASMS Sanibel Topical Conference, Field Portable andMiniature Mass Spectrometry Proceedings; 2000. p 5–6.
13. Short RT, Fries D, Kerr M, Lembke C, Toler S, Wenner P, Byrne R.J Am Soc Mass Spectrom (in press).
14. Vincent M, Burwell D, Luther M, Galperin B. In: Proceedings of theFifth International Conference on Estuarine and Coastal Modeling, Al-exandria, VA; 1997. p 427–440.
15. Vincent M, Burwell D, Luther M. In: Proceedings of the Sixth Inter-national Conference on Estuarine and Coastal Modeling, New Orleans,LA; 1999. p 765–780.