Embed Size (px)
Citation preview
Master of Sustainable Business Leadership - Group 2B
1
Analysis of practices and organizational awareness of sustainability – the
case of Thule AB _________________________________________________________
A Corporate wide analysis and investigation on the existing and upcoming sustainable practices, general awareness on sustainability among employees and Carbon footprint Calculation of a bike rack.
MASTER THESIS (MGTM04) MASTER OF SUSTAINABLE BUSINESS LEADERSHIP
June 2010
Authors Koray Kivanc
Roubesh Yajnish Jhumun Rajesh Venkata Ratna Chitturi
___________________________________________________________________________ Internal advisors (LUSEM) External advisor (Thule Inc.)
Stein Kleppestø Patrick Monahan Christine Blomqvist
Master of Sustainable Business Leadership - Group 2B
2
Foreword
This thesis has been written as a part of the degree project course in the Masters program “Sustainable Business Leadership” at the School of Economics and Management, Lund University.
The course was based on the methodology of action learning and self-managed learning. The students were all assigned to an in-company project, having a role as consultants. This project constituted the main part of the course. As a minor part the students were responsible for organizing several learning events addressing relevant issues related to the in-company projects. The students continuously documented their learning in learning journals and participated in tutorials on these journals.
The assessments of the students were done partly on the written thesis, partly on the consultancy process and report to the client company, partly on performance in learning events and partly on ability to document and discuss the students’ individual learning and development.
Master of Sustainable Business Leadership - Group 2B
3
Acknowledgements We take this privilege to express our profound gratitude to THULE AB for giving us an opportunity to work on this project. This was a rewarding experience for us and we hope that our project work and results would help Thule in some way or other. There are some key people who helped and supported us throughout this project. They have also provided many critical inputs and data, without which this project could not have been completed. We take this opportunity to express our gratitude to our supervisor's Prof. Stein Kleppestø and Prof. Christine Blomqvist. Special thanks to Patrick Monahan (Pat), Vice President Operations, Vehicle Accessories North America, Thule Inc. for his indispensable support and kind cooperation throughout this project. We would also like to thank our classmates and opponents for their help and feedback. Lund, 1st of June 2010. _______________________________ Koray Kivanc Roubesh Yajnish Jhumun Rajesh Venkata Ratna Chitturi
Master of Sustainable Business Leadership - Group 2B
4
Abstract
Aim
The aim of this degree project is to carry out the corporate wide analysis and investigation to identify the existing and upcoming sustainable practices in Thule AB, general awareness and perception on sustainability among employees and to calculate carbon footprint of a bike rack, a Thule product produced at Seymour plant, USA.
Approach
We embarked on this project by dividing it into two different tasks.
1) Corporate wide analysis and investigation of all processes and systems to identify sustainable practices in Thule and an investigation on the awareness & perception on sustainability among its employees
2) Calculating the carbon footprint of a bike rack, a Thule product produced at Seymour plant, USA.
Methodology
The first task is a combination of qualitative analysis to a large extent and some quantitative analysis. Online Questionnaires were made and sent out to appropriate people to get the inputs for the analysis. There were both closed ended and open ended questions. This received data has been analyzed and represented in charts for lucid comprehension. Wherever possible the charts have also been represented in terms of business areas and country wise in addition to the overall representation. We have also included our remarks and observations wherever necessary.
The second task, the calculation of a carbon footprint envelops both qualitative and quantitative approach. An existing method PAS 2050 has been identified and worked out to use it for the calculation of carbon footprint of bike rack. Then the data required has been identified and the appropriate questionnaires were made. These questionnaires were then sent to the client (Thule AB) to obtain the data from the client. After a back and forth consultation sufficient data was acquired to embark on the calculation process. Through the calculation process some approximations and assumptions had to be made to overcome data constraints, the reason and basis of such approximations and assumptions was explained clearly. As a result of the calculation process we arrived at an estimate of the carbon footprint of a bike rack.
Results
All the sustainable practices and awareness & perceptions have been identified through the practices and awareness questionnaires respectively have been compiled, analyzed and presented in charts and tables. The carbon footprint of a bike rack is estimated to be 32.889 kg of Co2 equivalent.
Master of Sustainable Business Leadership - Group 2B
5
Table of Contents Page Number
1. Introduction................................................................................................. 8 1.1 What is Sustainability? ........................................................................... 9 1.2 THULE and Sustainability...................................................................... 10 1.3 Background Work.................................................................................. 10 1.4 Problem Discussion................................................................................. 11 1.5 Focus and delimitations......................................................................... 11 2. What is currently being done at THULE concerning sustainability?......... 13 2.1 Practices and Awareness......................................................................... 13 2.2 Methodology........................................................................................... 14 2.2.1 Steps in Process of the Research Questionnaires.............................. 14 2.3 The Data Type......................................................................................... 15 2.4 Advantage and Disadvantage of Questionnaires..................................... 15 2.5 Validity and Reliability........................................................................... 15 2.6 Reflections and Criticisms..................................................................... 15 3. Empirical Study and Analysis of Results from Questionnaires.................. 16 3.1 The Practices Questionnaire.................................................................. 16 3.1.1 Sample Selection............................................................................. 16 3.1.2 Analysis of Questionnaires.............................................................. 17 3.1.2.1 Recent Sustainability Activities................................................... 17 3.1.2.2 Incentive to engage in sustainability............................................ 19 3.1.2.3 Barriers for engaging in sustainability......................................... 20 3.1.2.4 Environmental Policy................................................................... 21 3.1.2.5 Resource Efficiency..................................................................... 22 3.1.2.6 Environmental Burden................................................................. 23 3.1.2.7 Life Cycle assessment.................................................................. 24 3.1.2.8 Raw Material Efficiency.............................................................. 25 3.1.2.9 Sustainable Packaging/Shipping................................................. 25 3.1.2.10 Question 10: Green Transportation.......................................... 26 3.1.2.11 Solid Waste and Water (Measurement and Reduction Targets) 27 3.1.2.12 Sustainable Purchasing............................................................... 29 3.1.2.13 Social Compliance..................................................................... 30 3.1.2.14: Community Development Activities........................................ 30
3.1.2.15 Possibilities where THULE can perform better in terms of sustainability........................................................................................... 31
3.1.3 Conclusions of the Practices Questionnaire.................................... 32 3.2 The Awareness Questionnaire........................................................... 33 3.2.1 Sample Selection............................................................................ 33 3.2.2 Reliability and Validity.................................................................. 34 3.2.3 Analysis of Results......................................................................... 34 3.2.3.1 Personal Definition of Sustainability........................................... 34 3.2.3.2 Definition of Sustainability in Business......................................... 36
Master of Sustainable Business Leadership - Group 2B
6
3.2.3.3 Sustainability Focus for THULE.................................................... 38 3.2.3.4 Where the focus currently is........................................................... 40 3.2.3.5 Motivation for Sustainability......................................................... 42 3.2.3.6 Existing sustainability practices at work........................................ 44 3.2.3.7 Possibilities to perform better in terms of Sustainability................ 48 3.2.3.8 General Level of Awareness about sustainability........................... 53 4. Conclusion from the Awareness Questionnaires................................... 54 5. Carbon Footprint Calculation...................................................................... 55 5.1 Introduction to Carbon foot print........................................................... 55 5.1.1 Product Carbon footprint..................................................................... 55 5.1.2 Benefits from measuring a product carbon footprint........................... 56 5.2. Methodology to calculate product carbon footprint.............................. 56 5.3. Carbon footprint of bike rack................................................................. 59 6. Conclusion................................................................................................... 68 7.APPENDIX................................................................................................. 72 8. Reference.................................................................................................... 86
Table of Figures
Master of Sustainable Business Leadership - Group 2B
7
Table 1: Respondents of the Practices Questionnaire.................................................... 16 Table 2 : Summary of Sustainability Practices by Plants.............................................. 18 Figure 1: Incentive to engage in sustainability – Country wise.................................... 19 Table 3: Barriers for engaging in Sustainability............................................................ 20 Table 4. Environmental Policy summary....................................................................... 21 Table 5. Existence of an Environmental Policy............................................................. 22 Table 6. Areas in which the environmental burden has been decreased....................... 23 Table 7. LCA assessment by certitified testing organization........................................ 24 Table 8. Measures to promote raw material efficiency................................................. 25 Table 9. Packaging/shipping material type.................................................................... 26 Table 10. Activities to reduce GHG emissions from Transportation............................ 26 Table 11. Solid waste and water (measurement and reduction targets)........................ 28 Table 12. Purchasing guidelines.................................................................................... 29 Table 13: Managing Social Compliance........................................................................ 30 Table 14. Community Development Activities............................................................. 30 Table 15. Possibilities where THULE can perform better in terms of sustainability.... 31 Table 16. Awareness questionnaire responses............................................................... 33 Figure 2. Representation of responses by Business Area (%)...................................... 33 Figure 3. Personal definition of Sustainability in General............................................. 34 Figure 4. Personal definition of Sustainability by Business Areas............................... 35 Figure 5. Definition of Sustainability in Business (THULE in general)....................... 36 Figure 6. Definition of Sustainability in Business (THULE in general)....................... 37 Figure 7. Sustainability Focus for THULE in general................................................... 38 Figure 8. Economic focus by Business Area................................................................. 38 Figure 9. Social Dimension by Business Area............................................................... 39 Figure 10 Environmental dimensions by Business Area............................................... 39 Figure 11. Current Focus in General.............................................................................. 40 Figure 12. Current focus on Economic issues.............................................................. 41 Figure 13. Current focus on Social Issues..................................................................... 41 Figure 14. Current focus on Environmental issues........................................................ 41 Figure 15 current focus on internal issues..................................................................... 41 Figure 16. Motivation for sustainability for THULE in general.................................... 42 Figure 17. Motivation for sustainability by Business Areas.......................................... 42 Table 17. Categories for sustainability developed for THULE..................................... 44 Figure 18. Level of awareness for THULE employees in general................................ 53 Figure 19. Level of awareness by Business Areas......................................................... 53 Figure20. Process Map for Bike Rack………………………………………………... 60
Master of Sustainable Business Leadership - Group 2B
8
1. Introduction _____________________________________________________________________ This chapter aims to give the reader an understanding and perspective of the concept of sustainability and its three different dimensions. This is followed by a brief discussion relating THULE and sustainability. The background gives an initial vision of the project which is then narrowed down to our two research questions. _____________________________________________________________________ 1.1 What is Sustainability? Today the business sector is increasingly expected to respond to the demands of society for improved environmental, societal and ethical performance. The global sustainability debate has evolved to the point where business must consider the impacts of products and services throughout the life-cycles and supply chains1. One of the most frequently quoted definition of sustainability is derived from the ‘Our Common Future’ book, which was produced by the World Commission on Environment and Development (WCED), chaired by Norwegian Prime Minister Gro Harlem Brundtland in 1987: “Humanity has the ability to make development sustainable – to ensure that it meets the needs of the present without compromising the ability of future generations to meet their own needs.’’2 The core mainstream idea of sustainability3 is seen as having three overlapping and mutually dependent4 dimensions: economic, environmental and social. Economic For businesses, sustainability should be about understanding the fundamental changes in the long term and looking at them as opportunities. Companies that adopt a strategy which embraces the three above mentioned dimensions are very likely to gain competitive advantage in the long run.5 Environmental Companies should redesign the way they operate so that the damage done to the environment is as minimal as possible. Sustainability is about learning to value, maintain and develop our environmental asset so that we can live off its income and not its capital. There should be a
1 Charter, Martin and Tischner, Ursula, ‘Sustainable Solutions : Developing Products and Services for the Future’, Greenleaf Publishing 2001 2 World Commission on Environment Development, ‘Our Common Future’ , New York : Oxford University Press, 1987 3 Adams, W.M, “The Future of Sustainability :Re-thinking Environment and Development in the Twenty-first Century”, ICUN, The World Conservation Union 4 Dillard, Jesse, Dujon Veronica, King, C, Mary, “Understanding the Social Dimension of Sustainability”, Routledge Publishing, (2009), ISBN10 :0-203-89297-6, Google Book Search, Retrieved on 1st June 2010 5 Willums, Jan-Olaf, The World Business Council for Sustainable Development, ‘The Sustainable Business Challenge : A briefing for tomorrow’s business leaders’, Greenleaf Publishing, 1998
Master of Sustainable Business Leadership - Group 2B
9
shift from seeing environmental responsibilities only for technical departments or experts to seeing these issues as company wide responsibilities.6 Social Philip Kotler defines Corporate Social Responsibility as making decisions in business related to “ethical values, legal requirements, as well as respect for people, communities and the environment7”. The basic ethical or social responsibility of any firm is to make an effort to compensate for the negative impact it has created to the communities in which it operates or to the society on the whole. It is in the long-term well being of the company to adhere to a fair level of social sustainability. Social sustainability if often regarded as corporate social responsibility (CSR). Research has shown that if CSR is carried out properly it also brings financial benefit to the firms in the long-run8. 1.2 THULE and Sustainability Corporate Sustainability can be seen as a transfer of the overall idea of sustainable development to a business level9. It can thus be defined analogously to the definition of WCED ‘’as meeting the needs of a firm’s direct and indirect stakeholders […] without compromising its ability to meet the needs of future stakeholders as well’’10. Corporate sustainability means adding the environmental and the social aspects to the set of business objectives. This requires overcoming conflicts of goals between economic, environmental and social issues in the long run, thus combining economic success with conserving the biophysical environment and social responsible actions. Due to short-term orientation in business activities, businesses might find that the objectives are conflicting. When goal conflicts are changed into goal congruencies a win-win situation between the dimensions of sustainability is realized. As a result the overall performance of a corporation is not only determined by financial results but also its environmental and social performance.11 For THULE: The business sector is beginning to realize that financial and social benefits will arise from incorporating practices of sustainability. Energy efficiency, recycling and maximizing use of raw materials can all deliver profitable returns, as can clean, efficient production processes and innovative ‘sustainable’ products.
6 Willums, Jan-Olaf, The World Business Council for Sustainable Development, ‘The Sustainable Business Challenge : A briefing for tomorrow’s business leaders’, Greenleaf Publishing, 1998 7 Kotler, Phillip & Lee, Nancy, “Corporate Social Responsibility: Doing the most good for Your Company”, Pg4, Wiley & Sons, 2005 8 Berger et al, 2007, “Mainstreaming Corporate Social Responsibility: Developing Markets for Virtue”, California Management Review, VOL. 49, NO. 4, (132-157) 9 Zink J, Klaus, Steimle Ulrich, Fisher Klaus, ‘Human Factors, Business Excellence and Corporate Sustainability : Differing Perspectives, Joint Objectives’ , 2008 10 Dyllick T, Hockerts K , ‘Beyond the Business Case for Corporate Sustainability. Business Strategy and the Environment 11:130-141’, 2002 11 Stimle U, Zink KJ, ‘Sustainable Development and Human Factors.’ International Encyclopaedia of Ergonomics and Human Factors, 2nd edn, Taylor & Francis, pp2258-3363, (2006)
Master of Sustainable Business Leadership - Group 2B
10
Thule AB is a multinational company with operations in various countries. Thule is the world leader in sports and utility transportation. Thule delivers safe, easy and stylish solutions for active families, professionals and other outdoor enthusiasts to transport their gear. It offers load carriers for vehicles such as rooftop boxes, roof rails and bike carriers. Plus, the company offers snow chains, trailers, towing systems, organization solutions and accessories for RVs as well.
1.3 Background Work The ever changing market dynamics and the current business environment have prompted Thule to show more interest in sustainability aspects. At this stage Thule is not fully aware to what extent sustainable practices are employed in its business and how it has to tread towards becoming a sustainable company. Currently their main focus is on environmental sustainability. In this project we attempted to help Thule understand its current situation concerning various aspects of sustainability. The results of this project can also aid Thule in making decisions on treading towards sustainability.12 Thule has approximately 3,100 employees at over 30 production and sales locations in North America, Europe and Asia. Net sales for 2008 amounted to SEK 6.2 billion (approx 620 M Euro or 800 MUSD).
Based from the company presentation and THULE’s website we were able to gather information about some initiatives related to sustainability and their Business Areas Initiatives related to sustainability: • 2008 - (August) Installed 318-kilowatt solar array on the roof of Thule’s Connecticut
facility. 13 • 2007 - (June) Thule employees spent a day cleaning up the Housatonic River in
Stratford, Connecticut. Thule AB has five Business Areas. • Vehicle Accessories Europe/Asia (VAEA) Headquarters: Malmö, Sweden • Vehicle Accessories North America (VANA)
Headquarters: Seymour, Connecticut, USA
• Trailers Headquarters: Malmö, Sweden
• Towing Systems Europe/Asia (TSEA) Headquarters: Staphorst, Netherlands
12 THULE Sweden Official Website http://www.thule.com/en/US/About%20Thule/Company%20Facts/Our%20Structure.aspx, Retrieved 1st June 2010 13 Ibid.,
Master of Sustainable Business Leadership - Group 2B
11
• Organization Solutions
Headquarters: Longmont, Colorado, USA
Throughout this project we will be using the following abbreviations for the Business Areas in our charts and tables. Business Area Abbreviation Malmo Corporate Headquarters HQ Thule Towing Systems Towing Trailers Trailers Vehicles Accessories Europe/Asia VAEA Vehicle Accessories North America VANA 1.4 Problem Discussion For THULE to engage in sustainability abilities it has to first know where it stands as a company in terms of sustainability practices. To do so, the organization needs data from all its plants and business areas to have a clear about the ongoing and planned initiative and determine if any of them are related to sustainable practices. With this project the aim is to carry out a corporate wide analysis on THULE’s plants to see how their activities are related to sustainability. The organization also wants to know how well aware its employees are regarding the concept of sustainability. Engaging in sustainability would mean that THULE would have to ensure minimum environmental damage in its production processes. As a starting point, THULE requires the carbon footprint calculation of one of its products. 1.5 Focus and delimitations For the first task we made two questionnaires, one to collect the information on all processes and systems related to sustainability in all plants of Thule and the second questionnaire to investigate the level of awareness of sustainability in the company. These questionnaires consist of both closed-end and open-ended questions. Most of them are qualitative questions with some exceptions. We represented the collected data in the form of charts by Business areas, country and on the whole. This way it is easily comprehensible and these representations would aid THULE to make decisions regarding the aspects of sustainability. We forward our questionnaires to THULE who in turn distributed it among its employees. We did not receive questionnaires from the Organization Solutions business area and out of total 70 respondents for the awareness questionnaire 35 of them were from the VANA business area. We have done our best to work with data we had at hand and we hope to be able to present a fair analysis for our project For the second task we chose PAS2050 method to calculate product carbon footprint. PAS 2050 is a publicly available specification for assessing product life cycle GHG emissions,
Master of Sustainable Business Leadership - Group 2B
12
prepared by BSI British Standards and co-sponsored by the Carbon Trust and the Department for Environment, Food and Rural Affairs (Defra), UK. We studied the method carefully and tried our best to adapt it to Thule's products and ecosystem. After working through the process we could identify the proper set of data that is required. We made a questionnaire based on the required data that would aid in the calculation of product carbon footprint. At some points approximations & assumptions had to be made due to the data constraints. Wherever possible, we have mentioned why they are made and how they are made. In spite of these shortcomings we hope that our result is a nearest approximate that could be reached for the given conditions.
Master of Sustainable Business Leadership - Group 2B
13
2. What is currently being done at THULE concerning sustainability? _____________________________________________________________________ This chapter aims to look at the first research task of this project, which is about the ongoing practices at THULE and how they are related to sustainability. We present the research methodology of the Practices and Awareness Questionnaires. _____________________________________________________________________ 2.1 Practices and Awareness Assessing one’s environmental and socioeconomic footprint is the first step for a company in trying to embrace sustainability. The materials, energy and human resource input involved with every step of the organizations workflow needs to be indentified14. The Practices questionnaire will try to assess the impacts generated throughout the value chain of THULE plants, from the raw material purchased to the way to the disposal of waste materials. To make the move towards sustainability, everyone associated with the organization should have a clear definition of sustainability and the goals of the company for trying to be more sustainable. As a first step, to see what the level of awareness is about sustainability among its employees, we have formulated an Awareness Questionnaire. 2.2 Methodology THULE had suggested that we make use of questionnaires for the data collection therefore already supplying us with a coherent methodology to go about the task at hand. Below we have provided a step by step approach that was followed when preparing the 2 questionnaires. The same framework applies to the both of them, since they are similar in format, question types and only differ in content. 2.2.1 Steps in Process of the Research Questionnaires Step 1. The first step was to formulate our hypothesis: To determine what is THULE already doing with respect to sustainability and finding the level of awareness about sustainability among the THULE employees. Since it had been suggested to us by THULE to carry out those interviews by questionnaire, we proposed to make online questionnaires which would ease distribution and data collection. Step 2. The second step was figuring out how the data would be recorded. The use of online questionnaires, made it possible for the data to be collected in real time. This data was then exported from the online questionnaires’ website database and put on Microsoft Excel sheets for analysis.
14 Doppelt, Bob, “Leading Change Towards Sustainability : A Chang e-Management Guide for Business, Government and Civil Society”, Chapter 7, GreenLeaf Publishing, (2003)
Master of Sustainable Business Leadership - Group 2B
14
Step 3. Deciding the target population was the next logical step. For the practices questionnaire, the questionnaire was targeted to the plants managers in the different business areas in the different countries. The awareness questionnaire was targeted at THULE employees from all the various Business Areas and all its departments within. Step 4 Test interviews were made after which small corrections and clarifications were made. Next step was to make sure that the questionnaire had been forwarded to the different plants in the different business areas. Step 5 Final step was to extract the collected data from the online questionnaires’ website into MS Excel Sheets for statistical analysis. Most results are presented in form tables and charts to facilitate understanding and readability. To ensure data consistency, we always checked whether the exported data matched those on the website. 2.3 The Data Type The data captured from the Practices and Awareness questionnaires will be a mixture of qualitative and quantitative data. The qualitative data from the questionnaires will come from open ended questions where the opinions and views of the respondents are being asked. The quantitative data will come from the questions based on the likert15 scale and multiple choice questions. This quantitative data will then be analyzed using statistical methods and presented in form of charts and tables. Our objective was to guide the respondents in some questions by given them options through likert scales and also get data in form of narratives for the questions for which we could not anticipate the type of response. This would be our qualitative data that we are presenting verbatim most of the time. Different types of questions have been used in the questionnaires so that data can be successfully extracted from the respondents. We have made use of likert scales, narrative questions, contingency questions, closed ended multiple choice questions and also open ended questions. 2.4 Advantage and Disadvantage of Questionnaires These questionnaires were an advantage since they could be easily forwarded by email. Online questionnaires are also a very inexpensive way of reaching out to the respondents. Questionnaires in general16, avoid interviewer bias, guiding and cues that might have an 15 Neuman Lawrence, W. “Basics of Social Research : Qualitative and Quantitative Approaches”, Second Edition, Pearson Education Inc, Pg129 16University of Tennessee, Knoxville, Course IS 540: Research Methods, given by William C. Robinson <http://web.utk.edu/~wrobinso/540_lec_qaire.html>, accessed on 25th May 2010
Master of Sustainable Business Leadership - Group 2B
15
impact on the validity and reliability of the data being collected. Another advantage of the questionnaires is that they would give our respondents time to gather and consult sources needed to respond well, for example , the practices questionnaires requires the measurement of waste and water used. One disadvantage of the questionnaires is that some motivation is required from the respondents and also in general there is often a strong tendency for people to give answers that are socially desirable. Another issue that can arise is whether or not, the respondent knows enough to give a meaningful answer. To tackle these issues we tried to make our questions as clear and as simple as possible. 2.5 Validity and Reliability We have tried to ensure that the results and conclusion made from the data captured in our Practices and Awareness questionnaires have a high level of validity and reliability. A measure shows validity if it actually measures what it is intended to17. Since our project work consists of qualitative research we wanted our data to have a high level of authenticity18; i.e., fair, honest and balanced answers from the respondents. To ensure the validity of the practices questionnaires we tailored the questions in such a way that the responses would indicate whether the different activities and processes of THULE fall within the three dimensions of sustainability or not. Reliability refers to the consistency or the dependability of the data captured. Reliability for our questionnaires was ensured by the fact that all the respondents, for either the Practices or the Awareness, were presented with the same standardized set of questions and that they were answered in the exact same way. The reliability was also enhanced due to the fact that the questionnaires were sent to the different business areas in different countries and from the responses we could see a certain pattern, thus ensuring the consistency of the capture information. 2.6 Reflections and Criticisms The motivation of the respondents may influence the level of accuracy of our study, since their personal beliefs, ambitions and willingness to answer will influence the outcome. For our awareness questionnaires, the number of responses from the various business areas has been inconsistent. We failed to receive any responses from the Organization Solution Business Area. From the TRAILERS business area there were only 7 respondents whereas in Vehicle Accessories North America (VANA) we received 35 responses. The reliability of the responses from VANA would be higher and thus a better generalization could be made than the TRAILERS business area. This issue was out of our hands, since THULE took the responsibility of choosing, forwarding and motivating the respondents to fill in the questionnaires. 17 Venderstoep Scott, & Johnston Diedre, “Research Methods for Everyday life: Blending Qualitative and Quantitative Approaches” Pg 59 18 Neuman Lawrence, W. “Basics of Social Research : Qualitative and Quantitative Approaches”, Second Edition, Pearson Education Inc
Master of Sustainable Business Leadership - Group 2B
16
3. Empirical Study and Analysis of Results from Questionnaires _____________________________________________________________________ In this section we aim to present and analyze our empirical results from both questionnaires. The Practices Questionnaire is discussed first, followed by the Awareness Questionnaire. _____________________________________________________________________ 3.1 The Practices Questionnaire The main aim of the Practices Questionnaire was to capture data about the ongoing as well as planned practices and activities at THULE and determine whether these practices are related to sustainability. The intention of the questionnaire is gather data from the various THULE plants about:
• Any recent activities concerning sustainability • their existing environmental policy( if any) • incentives/barriers for THULE to embrace sustainability • programs for resource efficiency, waste management • any community development activities
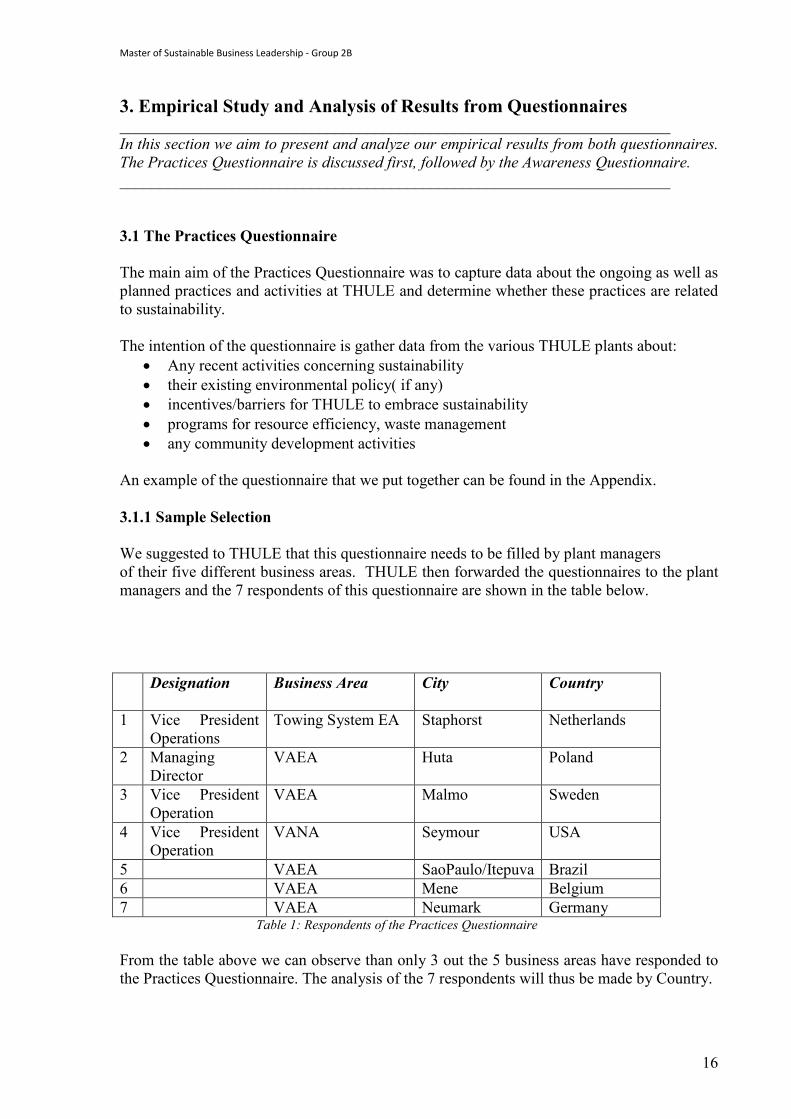
An example of the questionnaire that we put together can be found in the Appendix. 3.1.1 Sample Selection We suggested to THULE that this questionnaire needs to be filled by plant managers of their five different business areas. THULE then forwarded the questionnaires to the plant managers and the 7 respondents of this questionnaire are shown in the table below. Designation
Business Area City Country
1 Vice President Operations
Towing System EA Staphorst Netherlands
2 Managing Director
VAEA Huta Poland
3 Vice President Operation
VAEA Malmo Sweden
4 Vice President Operation
VANA Seymour USA
5 VAEA SaoPaulo/Itepuva Brazil 6 VAEA Mene Belgium 7 VAEA Neumark Germany Table 1: Respondents of the Practices Questionnaire From the table above we can observe than only 3 out the 5 business areas have responded to the Practices Questionnaire. The analysis of the 7 respondents will thus be made by Country.
Master of Sustainable Business Leadership - Group 2B
17
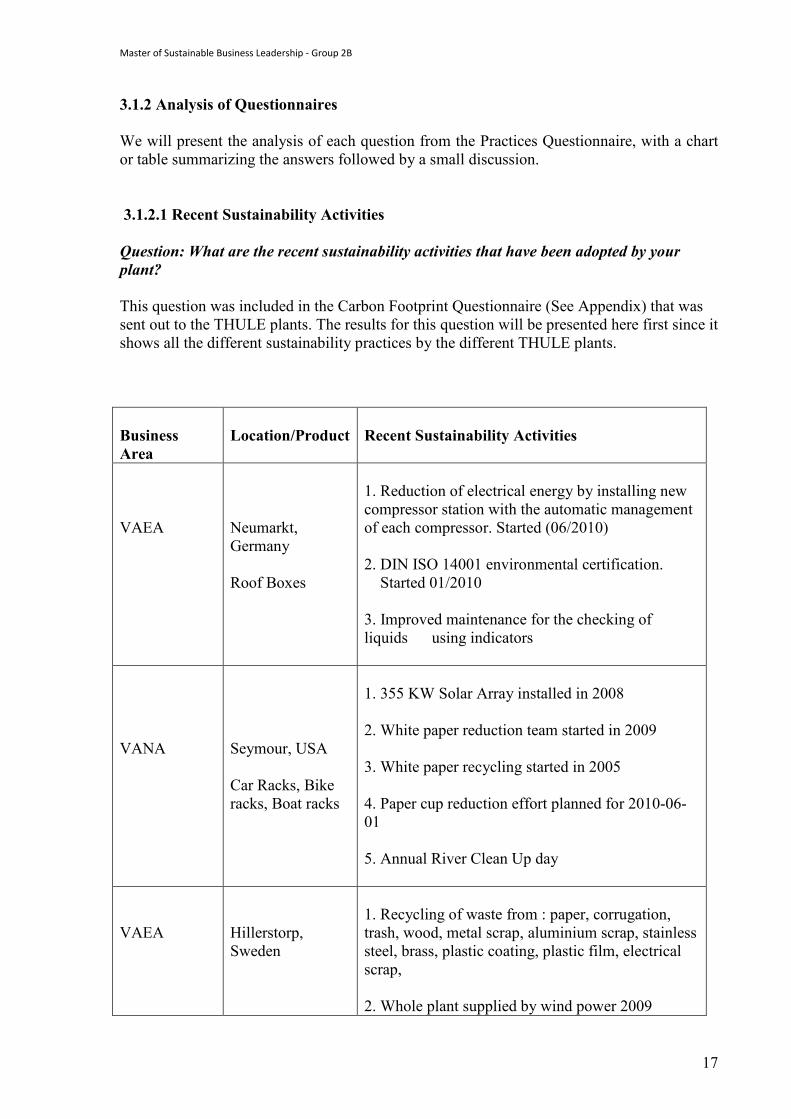
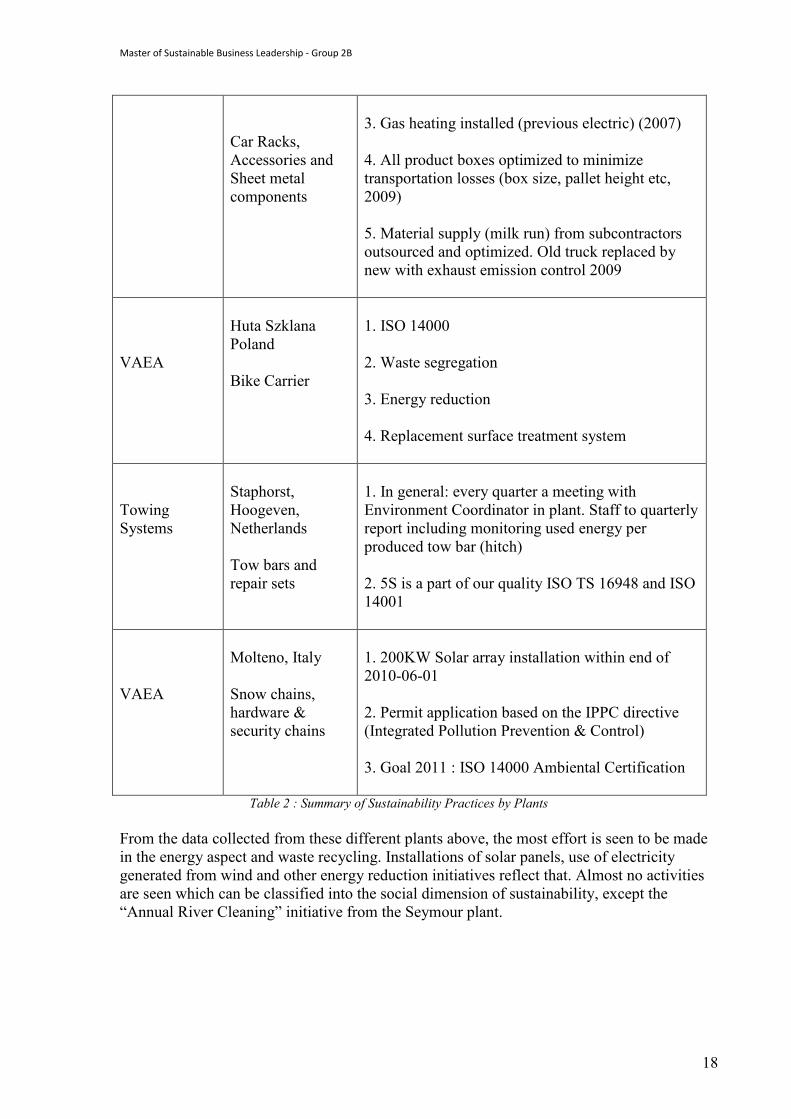
3.1.2 Analysis of Questionnaires We will present the analysis of each question from the Practices Questionnaire, with a chart or table summarizing the answers followed by a small discussion. 3.1.2.1 Recent Sustainability Activities Question: What are the recent sustainability activities that have been adopted by your plant? This question was included in the Carbon Footprint Questionnaire (See Appendix) that was sent out to the THULE plants. The results for this question will be presented here first since it shows all the different sustainability practices by the different THULE plants. Business Area
Location/Product
Recent Sustainability Activities
VAEA
Neumarkt, Germany Roof Boxes
1. Reduction of electrical energy by installing new compressor station with the automatic management of each compressor. Started (06/2010) 2. DIN ISO 14001 environmental certification. Started 01/2010 3. Improved maintenance for the checking of liquids using indicators
VANA
Seymour, USA Car Racks, Bike racks, Boat racks
1. 355 KW Solar Array installed in 2008 2. White paper reduction team started in 2009 3. White paper recycling started in 2005 4. Paper cup reduction effort planned for 2010-06-01 5. Annual River Clean Up day
VAEA
Hillerstorp, Sweden
1. Recycling of waste from : paper, corrugation, trash, wood, metal scrap, aluminium scrap, stainless steel, brass, plastic coating, plastic film, electrical scrap, 2. Whole plant supplied by wind power 2009
Master of Sustainable Business Leadership - Group 2B
18
Car Racks, Accessories and Sheet metal components
3. Gas heating installed (previous electric) (2007) 4. All product boxes optimized to minimize transportation losses (box size, pallet height etc, 2009) 5. Material supply (milk run) from subcontractors outsourced and optimized. Old truck replaced by new with exhaust emission control 2009
VAEA
Huta Szklana Poland Bike Carrier
1. ISO 14000 2. Waste segregation 3. Energy reduction 4. Replacement surface treatment system
Towing Systems
Staphorst, Hoogeven, Netherlands Tow bars and repair sets
1. In general: every quarter a meeting with Environment Coordinator in plant. Staff to quarterly report including monitoring used energy per produced tow bar (hitch) 2. 5S is a part of our quality ISO TS 16948 and ISO 14001
VAEA
Molteno, Italy Snow chains, hardware & security chains
1. 200KW Solar array installation within end of 2010-06-01 2. Permit application based on the IPPC directive (Integrated Pollution Prevention & Control) 3. Goal 2011 : ISO 14000 Ambiental Certification
Table 2 : Summary of Sustainability Practices by Plants From the data collected from these different plants above, the most effort is seen to be made in the energy aspect and waste recycling. Installations of solar panels, use of electricity generated from wind and other energy reduction initiatives reflect that. Almost no activities are seen which can be classified into the social dimension of sustainability, except the “Annual River Cleaning” initiative from the Seymour plant.
Master of Sustainable Business Leadership - Group 2B
19
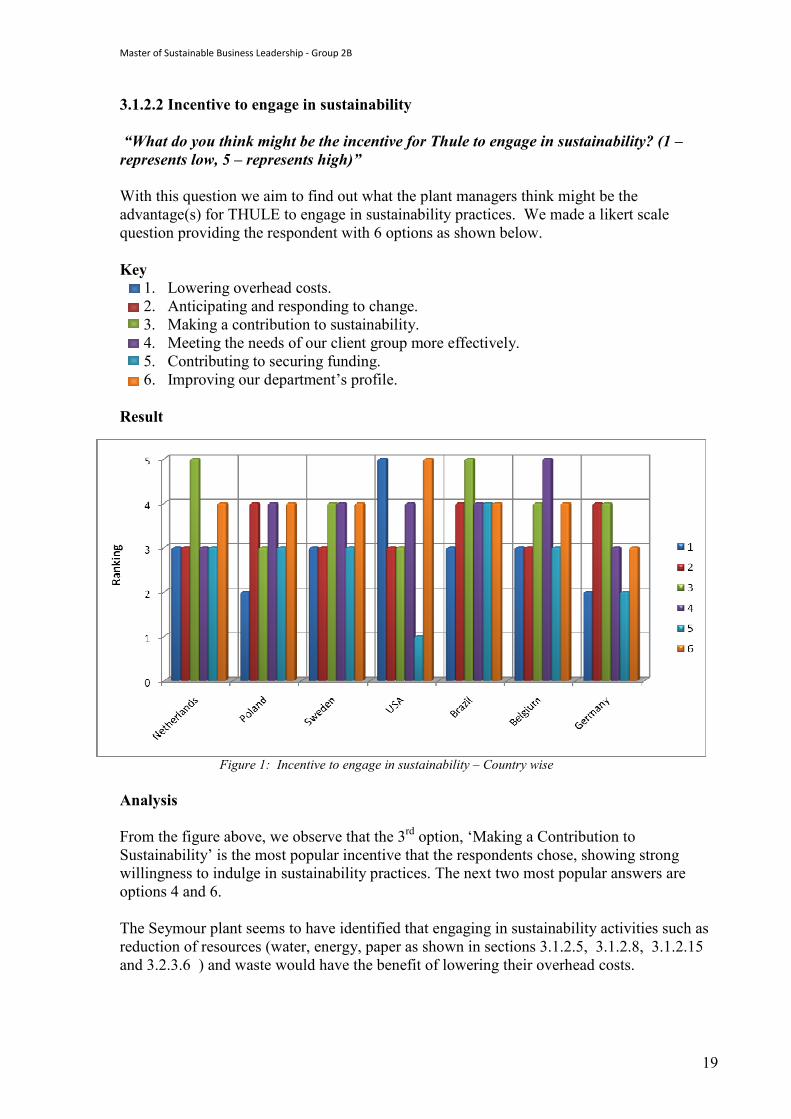
3.1.2.2 Incentive to engage in sustainability “What do you think might be the incentive for Thule to engage in sustainability? (1 – represents low, 5 – represents high)” With this question we aim to find out what the plant managers think might be the advantage(s) for THULE to engage in sustainability practices. We made a likert scale question providing the respondent with 6 options as shown below. Key
1. Lowering overhead costs. 2. Anticipating and responding to change. 3. Making a contribution to sustainability. 4. Meeting the needs of our client group more effectively. 5. Contributing to securing funding. 6. Improving our department’s profile.
Result
Figure 1: Incentive to engage in sustainability – Country wise Analysis From the figure above, we observe that the 3rd option, ‘Making a Contribution to Sustainability’ is the most popular incentive that the respondents chose, showing strong willingness to indulge in sustainability practices. The next two most popular answers are options 4 and 6. The Seymour plant seems to have identified that engaging in sustainability activities such as reduction of resources (water, energy, paper as shown in sections 3.1.2.5, 3.1.2.8, 3.1.2.15 and 3.2.3.6 ) and waste would have the benefit of lowering their overhead costs.
Master of Sustainable Business Leadership - Group 2B
20
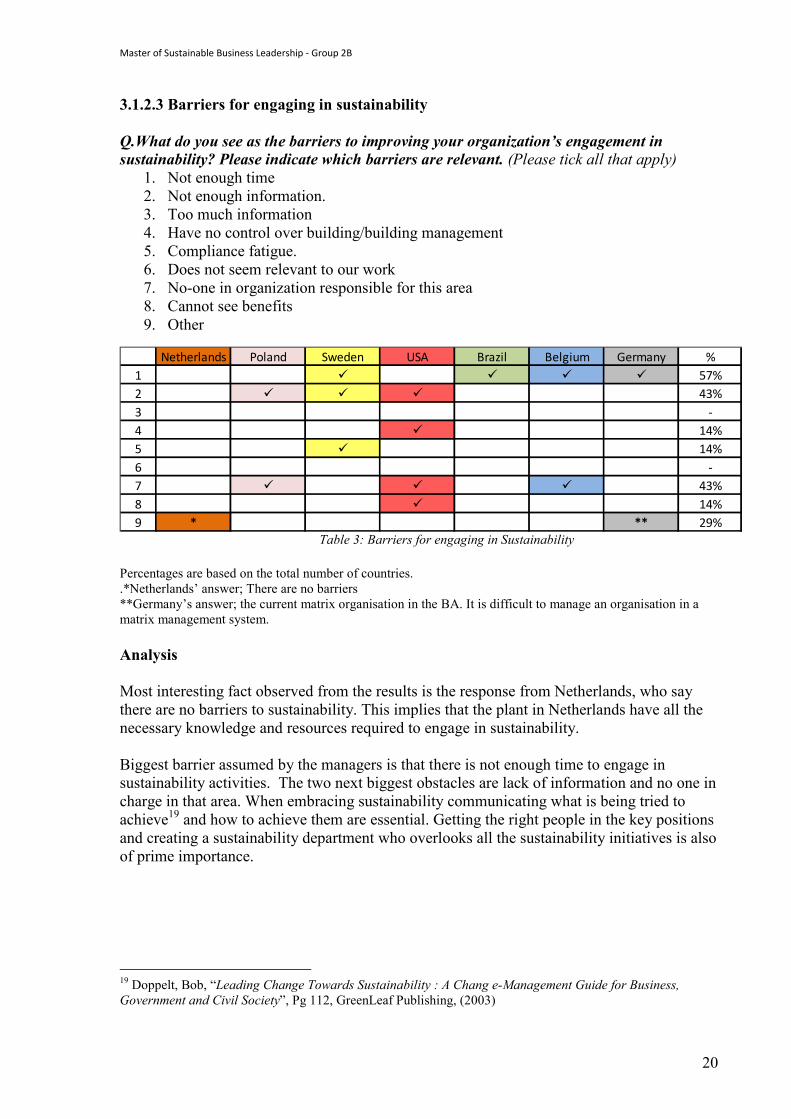
3.1.2.3 Barriers for engaging in sustainability Q.What do you see as the barriers to improving your organization’s engagement in sustainability? Please indicate which barriers are relevant. (Please tick all that apply)
1. Not enough time 2. Not enough information. 3. Too much information 4. Have no control over building/building management 5. Compliance fatigue. 6. Does not seem relevant to our work 7. No-one in organization responsible for this area 8. Cannot see benefits 9. Other
Netherlands Poland Sweden USA Brazil Belgium Germany %1 ü ü ü ü 57%2 ü ü ü 43%3 -4 ü 14%5 ü 14%6 -7 ü ü ü 43%8 ü 14%9 * ** 29%
Table 3: Barriers for engaging in Sustainability Percentages are based on the total number of countries. .*Netherlands’ answer; There are no barriers **Germany’s answer; the current matrix organisation in the BA. It is difficult to manage an organisation in a matrix management system. Analysis Most interesting fact observed from the results is the response from Netherlands, who say there are no barriers to sustainability. This implies that the plant in Netherlands have all the necessary knowledge and resources required to engage in sustainability. Biggest barrier assumed by the managers is that there is not enough time to engage in sustainability activities. The two next biggest obstacles are lack of information and no one in charge in that area. When embracing sustainability communicating what is being tried to achieve19 and how to achieve them are essential. Getting the right people in the key positions and creating a sustainability department who overlooks all the sustainability initiatives is also of prime importance.
19 Doppelt, Bob, “Leading Change Towards Sustainability : A Chang e-Management Guide for Business, Government and Civil Society”, Pg 112, GreenLeaf Publishing, (2003)
Master of Sustainable Business Leadership - Group 2B
21
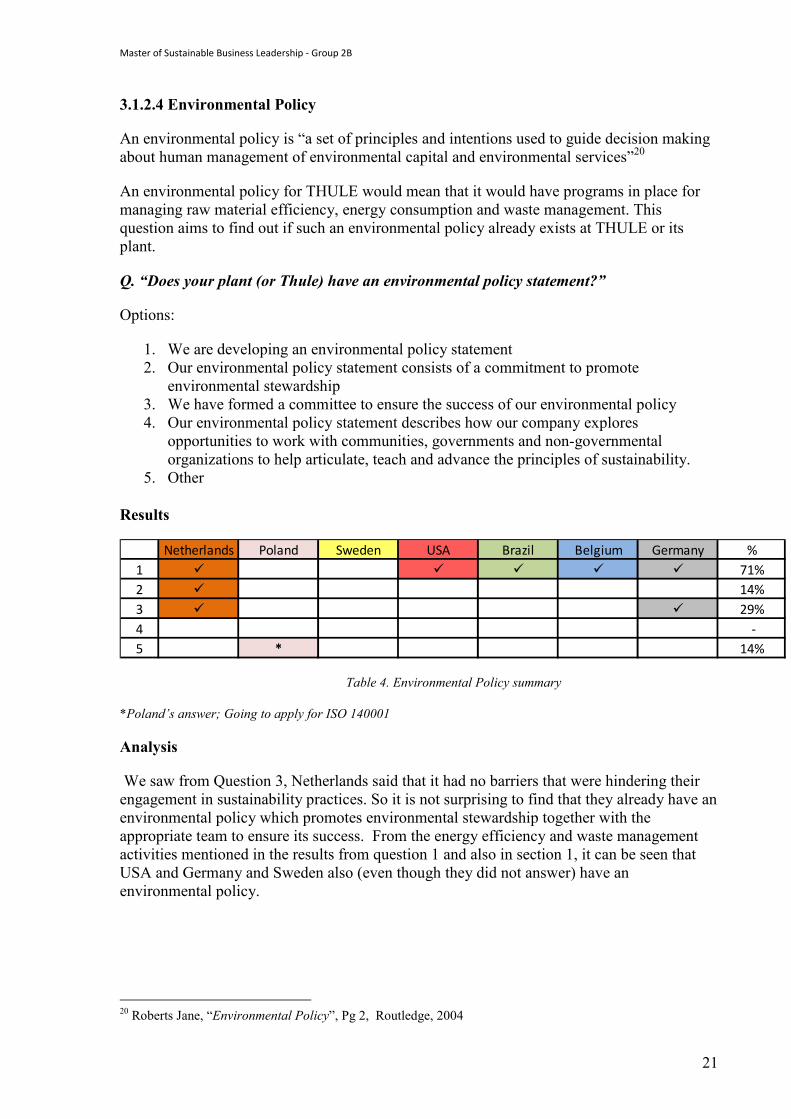
3.1.2.4 Environmental Policy
An environmental policy is “a set of principles and intentions used to guide decision making about human management of environmental capital and environmental services”20
An environmental policy for THULE would mean that it would have programs in place for managing raw material efficiency, energy consumption and waste management. This question aims to find out if such an environmental policy already exists at THULE or its plant.
Q. “Does your plant (or Thule) have an environmental policy statement?”
Options:
1. We are developing an environmental policy statement 2. Our environmental policy statement consists of a commitment to promote
environmental stewardship 3. We have formed a committee to ensure the success of our environmental policy 4. Our environmental policy statement describes how our company explores
opportunities to work with communities, governments and non-governmental organizations to help articulate, teach and advance the principles of sustainability.
5. Other
Results
Netherlands Poland Sweden USA Brazil Belgium Germany %1 ü ü ü ü ü 71%2 ü 14%3 ü ü 29%4 -5 * 14%
Table 4. Environmental Policy summary
*Poland’s answer; Going to apply for ISO 140001
Analysis
We saw from Question 3, Netherlands said that it had no barriers that were hindering their engagement in sustainability practices. So it is not surprising to find that they already have an environmental policy which promotes environmental stewardship together with the appropriate team to ensure its success. From the energy efficiency and waste management activities mentioned in the results from question 1 and also in section 1, it can be seen that USA and Germany and Sweden also (even though they did not answer) have an environmental policy.
20 Roberts Jane, “Environmental Policy”, Pg 2, Routledge, 2004
Master of Sustainable Business Leadership - Group 2B
22
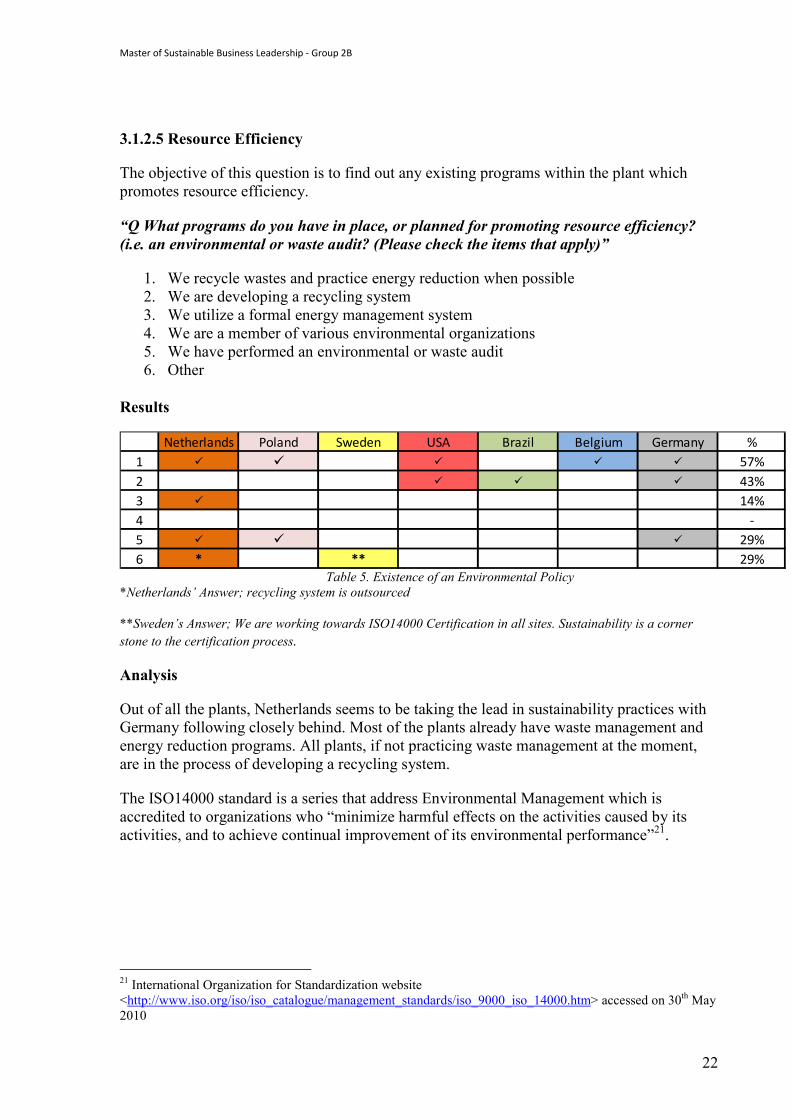
3.1.2.5 Resource Efficiency
The objective of this question is to find out any existing programs within the plant which promotes resource efficiency.
“Q What programs do you have in place, or planned for promoting resource efficiency? (i.e. an environmental or waste audit? (Please check the items that apply)”
1. We recycle wastes and practice energy reduction when possible 2. We are developing a recycling system 3. We utilize a formal energy management system 4. We are a member of various environmental organizations 5. We have performed an environmental or waste audit 6. Other
Results
Netherlands Poland Sweden USA Brazil Belgium Germany %1 ü ü ü ü ü 57%2 ü ü ü 43%3 ü 14%4 -5 ü ü ü 29%6 * ** 29%
Table 5. Existence of an Environmental Policy *Netherlands’ Answer; recycling system is outsourced
**Sweden’s Answer; We are working towards ISO14000 Certification in all sites. Sustainability is a corner stone to the certification process.
Analysis
Out of all the plants, Netherlands seems to be taking the lead in sustainability practices with Germany following closely behind. Most of the plants already have waste management and energy reduction programs. All plants, if not practicing waste management at the moment, are in the process of developing a recycling system.
The ISO14000 standard is a series that address Environmental Management which is accredited to organizations who “minimize harmful effects on the activities caused by its activities, and to achieve continual improvement of its environmental performance”21.
21 International Organization for Standardization website <http://www.iso.org/iso/iso_catalogue/management_standards/iso_9000_iso_14000.htm> accessed on 30th May 2010
Master of Sustainable Business Leadership - Group 2B
23
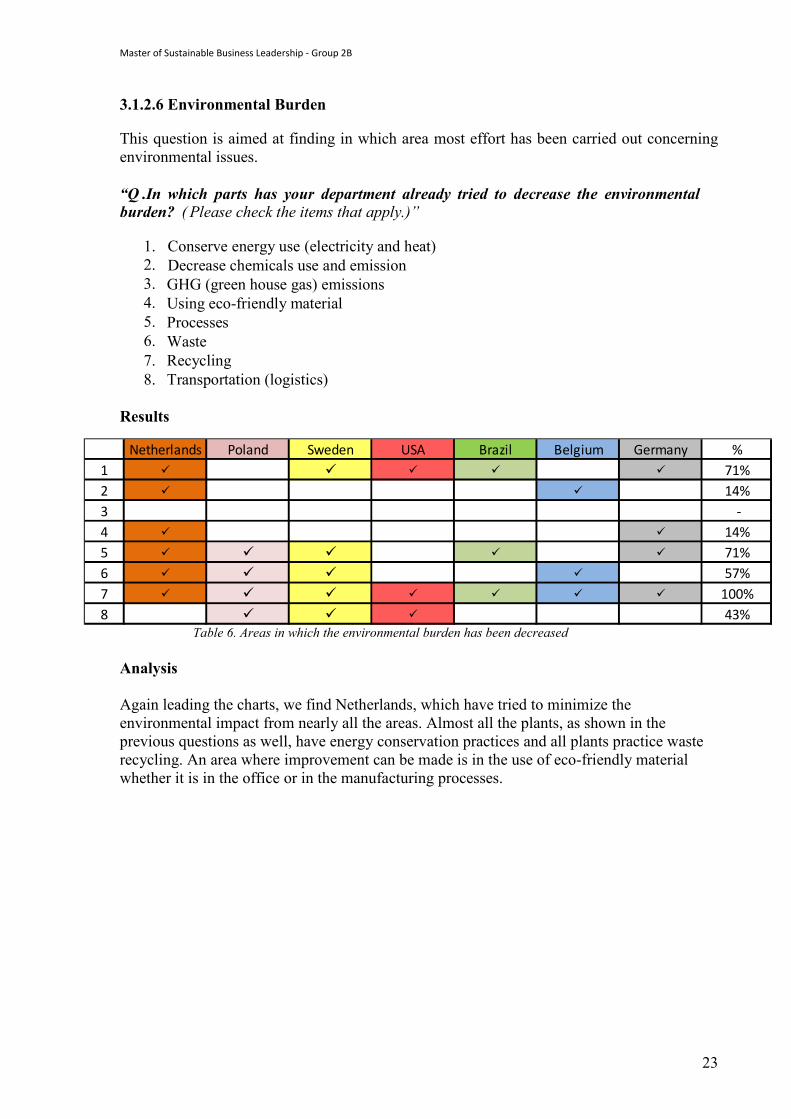
3.1.2.6 Environmental Burden
This question is aimed at finding in which area most effort has been carried out concerning environmental issues. “Q .In which parts has your department already tried to decrease the environmental burden? ( Please check the items that apply.)”
1. Conserve energy use (electricity and heat) 2. Decrease chemicals use and emission 3. GHG (green house gas) emissions 4. Using eco-friendly material 5. Processes 6. Waste 7. Recycling 8. Transportation (logistics)
Results
Netherlands Poland Sweden USA Brazil Belgium Germany %1 ü ü ü ü ü 71%2 ü ü 14%3 -4 ü ü 14%5 ü ü ü ü ü 71%6 ü ü ü ü 57%7 ü ü ü ü ü ü ü 100%8 ü ü ü 43%
Table 6. Areas in which the environmental burden has been decreased Analysis Again leading the charts, we find Netherlands, which have tried to minimize the environmental impact from nearly all the areas. Almost all the plants, as shown in the previous questions as well, have energy conservation practices and all plants practice waste recycling. An area where improvement can be made is in the use of eco-friendly material whether it is in the office or in the manufacturing processes.
Master of Sustainable Business Leadership - Group 2B
24
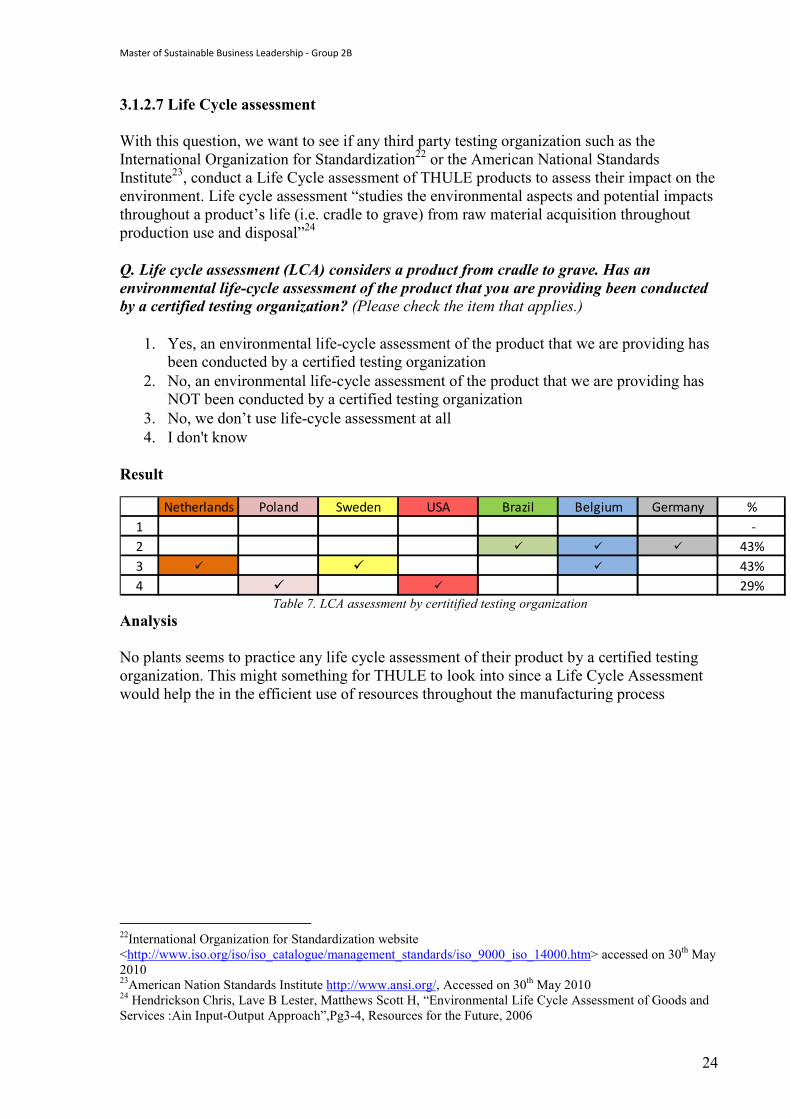
3.1.2.7 Life Cycle assessment With this question, we want to see if any third party testing organization such as the International Organization for Standardization22 or the American National Standards Institute23, conduct a Life Cycle assessment of THULE products to assess their impact on the environment. Life cycle assessment “studies the environmental aspects and potential impacts throughout a product’s life (i.e. cradle to grave) from raw material acquisition throughout production use and disposal”24 Q. Life cycle assessment (LCA) considers a product from cradle to grave. Has an environmental life-cycle assessment of the product that you are providing been conducted by a certified testing organization? (Please check the item that applies.)
1. Yes, an environmental life-cycle assessment of the product that we are providing has been conducted by a certified testing organization
2. No, an environmental life-cycle assessment of the product that we are providing has NOT been conducted by a certified testing organization
3. No, we don’t use life-cycle assessment at all 4. I don't know
Result
Netherlands Poland Sweden USA Brazil Belgium Germany %1 -2 ü ü ü 43%3 ü ü ü 43%4 ü ü 29%
Table 7. LCA assessment by certitified testing organization Analysis No plants seems to practice any life cycle assessment of their product by a certified testing organization. This might something for THULE to look into since a Life Cycle Assessment would help the in the efficient use of resources throughout the manufacturing process
22International Organization for Standardization website <http://www.iso.org/iso/iso_catalogue/management_standards/iso_9000_iso_14000.htm> accessed on 30th May 2010 23American Nation Standards Institute http://www.ansi.org/, Accessed on 30th May 2010 24 Hendrickson Chris, Lave B Lester, Matthews Scott H, “Environmental Life Cycle Assessment of Goods and Services :Ain Input-Output Approach”,Pg3-4, Resources for the Future, 2006
Master of Sustainable Business Leadership - Group 2B
25
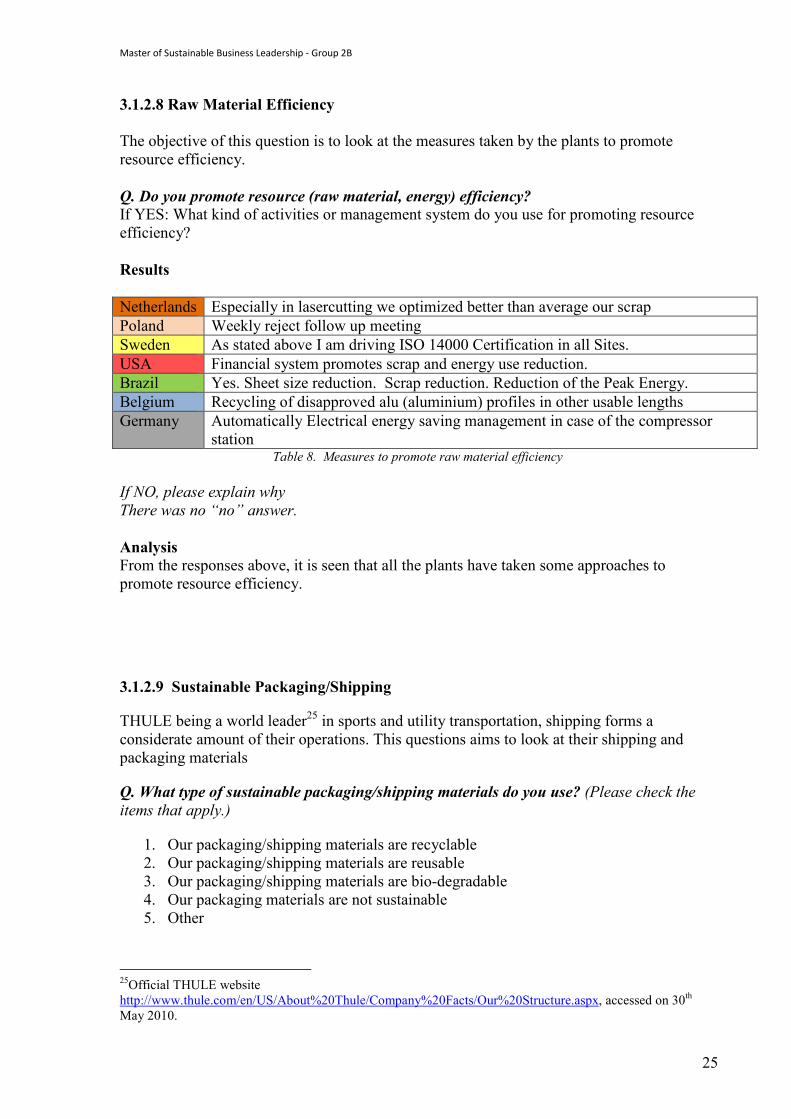
3.1.2.8 Raw Material Efficiency The objective of this question is to look at the measures taken by the plants to promote resource efficiency. Q. Do you promote resource (raw material, energy) efficiency? If YES: What kind of activities or management system do you use for promoting resource efficiency? Results Netherlands Especially in lasercutting we optimized better than average our scrap Poland Weekly reject follow up meeting Sweden As stated above I am driving ISO 14000 Certification in all Sites. USA Financial system promotes scrap and energy use reduction. Brazil Yes. Sheet size reduction. Scrap reduction. Reduction of the Peak Energy. Belgium Recycling of disapproved alu (aluminium) profiles in other usable lengths Germany Automatically Electrical energy saving management in case of the compressor
station Table 8. Measures to promote raw material efficiency If NO, please explain why There was no “no” answer. Analysis From the responses above, it is seen that all the plants have taken some approaches to promote resource efficiency.
3.1.2.9 Sustainable Packaging/Shipping
THULE being a world leader25 in sports and utility transportation, shipping forms a considerate amount of their operations. This questions aims to look at their shipping and packaging materials
Q. What type of sustainable packaging/shipping materials do you use? (Please check the items that apply.)
1. Our packaging/shipping materials are recyclable 2. Our packaging/shipping materials are reusable 3. Our packaging/shipping materials are bio-degradable 4. Our packaging materials are not sustainable 5. Other
25Official THULE website http://www.thule.com/en/US/About%20Thule/Company%20Facts/Our%20Structure.aspx, accessed on 30th May 2010.
Master of Sustainable Business Leadership - Group 2B
26
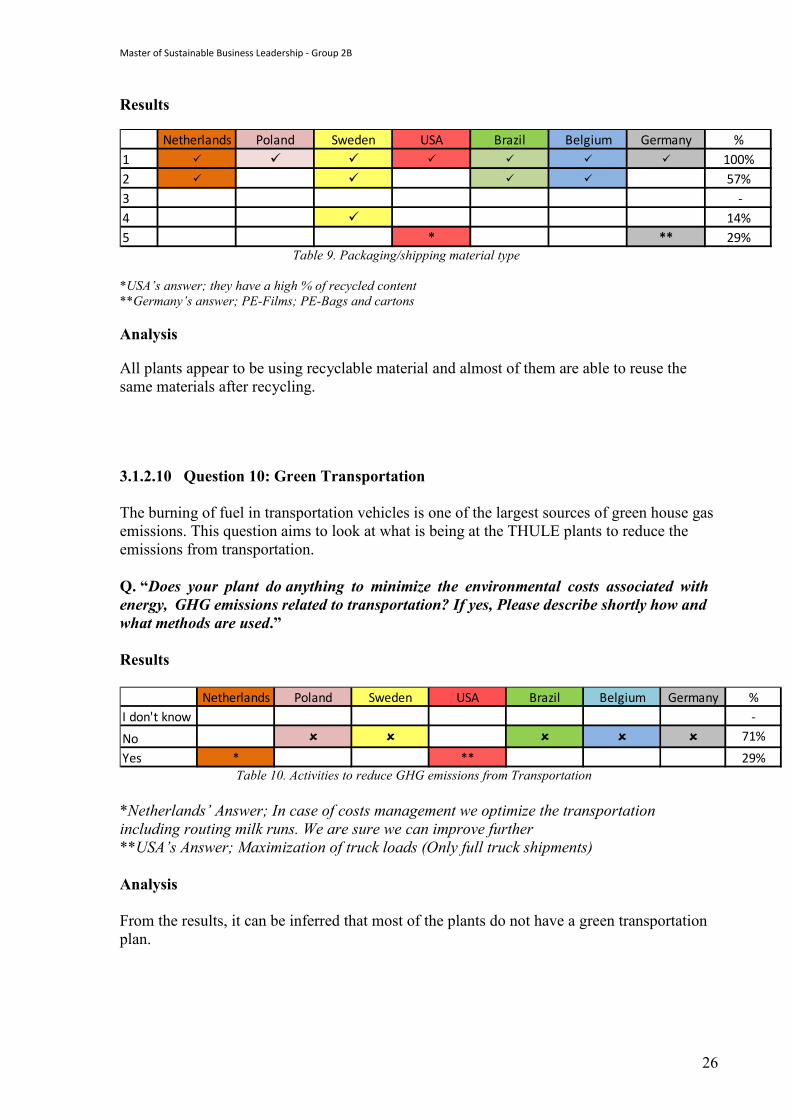
Results
Netherlands Poland Sweden USA Brazil Belgium Germany %1 ü ü ü ü ü ü ü 100%2 ü ü ü ü 57%3 -4 ü 14%5 * ** 29% Table 9. Packaging/shipping material type *USA’s answer; they have a high % of recycled content **Germany’s answer; PE-Films; PE-Bags and cartons
Analysis
All plants appear to be using recyclable material and almost of them are able to reuse the same materials after recycling.
3.1.2.10 Question 10: Green Transportation The burning of fuel in transportation vehicles is one of the largest sources of green house gas emissions. This question aims to look at what is being at the THULE plants to reduce the emissions from transportation. Q. “Does your plant do anything to minimize the environmental costs associated with energy, GHG emissions related to transportation? If yes, Please describe shortly how and what methods are used.” Results
Netherlands Poland Sweden USA Brazil Belgium Germany %I don't know -
No û û û û û 71%
Yes * ** 29% Table 10. Activities to reduce GHG emissions from Transportation *Netherlands’ Answer; In case of costs management we optimize the transportation including routing milk runs. We are sure we can improve further **USA’s Answer; Maximization of truck loads (Only full truck shipments) Analysis From the results, it can be inferred that most of the plants do not have a green transportation plan.
Master of Sustainable Business Leadership - Group 2B
27
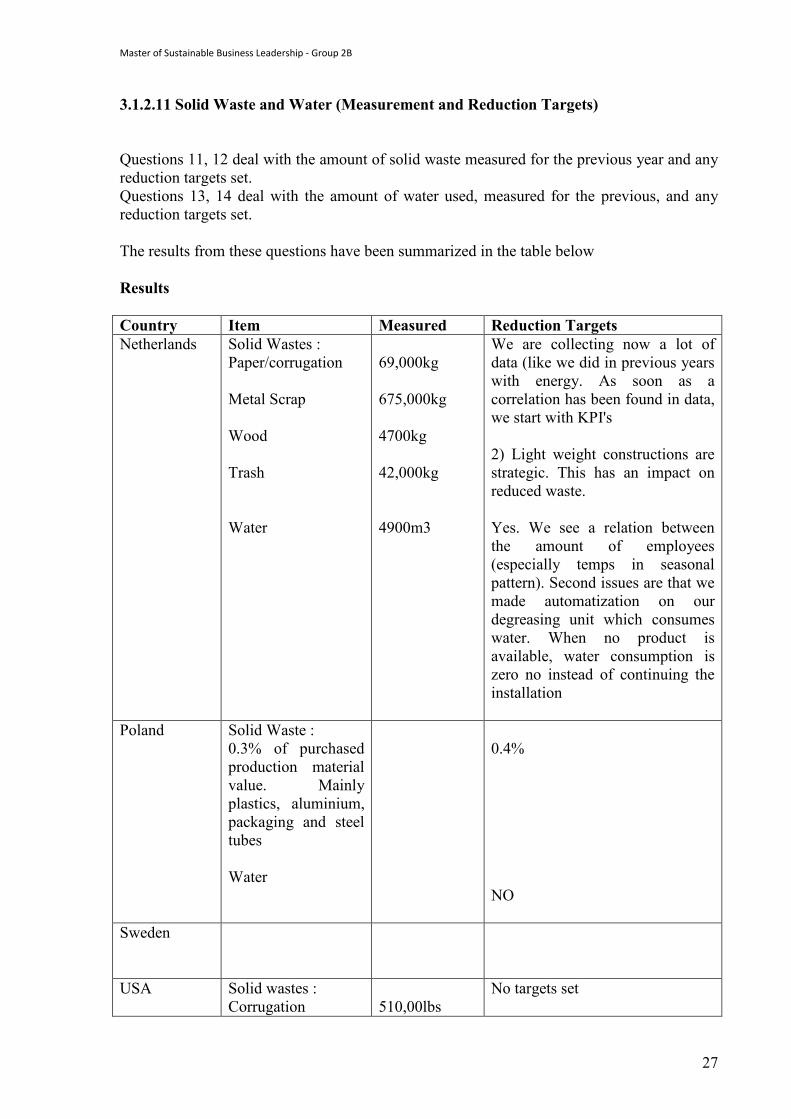
3.1.2.11 Solid Waste and Water (Measurement and Reduction Targets) Questions 11, 12 deal with the amount of solid waste measured for the previous year and any reduction targets set. Questions 13, 14 deal with the amount of water used, measured for the previous, and any reduction targets set. The results from these questions have been summarized in the table below Results Country Item Measured Reduction Targets Netherlands Solid Wastes :
Paper/corrugation Metal Scrap Wood Trash Water
69,000kg 675,000kg 4700kg 42,000kg 4900m3
We are collecting now a lot of data (like we did in previous years with energy. As soon as a correlation has been found in data, we start with KPI's 2) Light weight constructions are strategic. This has an impact on reduced waste. Yes. We see a relation between the amount of employees (especially temps in seasonal pattern). Second issues are that we made automatization on our degreasing unit which consumes water. When no product is available, water consumption is zero no instead of continuing the installation
Poland Solid Waste : 0.3% of purchased production material value. Mainly plastics, aluminium, packaging and steel tubes Water
0.4% NO
Sweden
USA Solid wastes : Corrugation
510,00lbs
No targets set
Master of Sustainable Business Leadership - Group 2B
28
Trash Wood Water not used in production process
93,600lbs 268,000lbs 236,000gallons
No targets set
Brazil Very low, not measured Water
400m3/year
Not yet No. There are not in our targets due to low consumption
Germany Various waste Water
83 to/a 650m3
No Not yet.
Belgium Alu Extrusions PVC Laminated Fabric Water
26 tons 4000m2 No
Alu 3.5% bought RM No
Table 11. Solid waste and water (measurement and reduction targets) Analysis From the above results, we what are the measurement practices in place for the different plants. Quoting an adage “What gets measured, gets done”, if the plants are able to measure the amount of waste produced or the amount of resource used, reduction targets could then be set.
Master of Sustainable Business Leadership - Group 2B
29
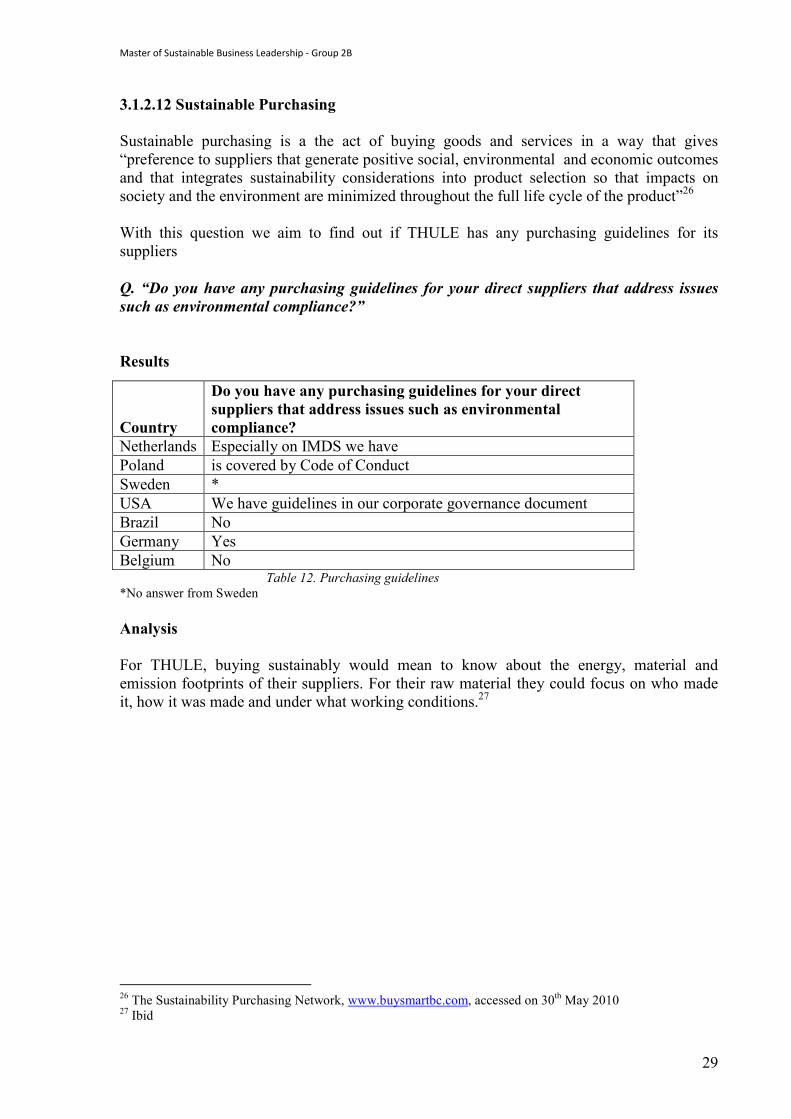
3.1.2.12 Sustainable Purchasing Sustainable purchasing is a the act of buying goods and services in a way that gives “preference to suppliers that generate positive social, environmental and economic outcomes and that integrates sustainability considerations into product selection so that impacts on society and the environment are minimized throughout the full life cycle of the product”26 With this question we aim to find out if THULE has any purchasing guidelines for its suppliers Q. “Do you have any purchasing guidelines for your direct suppliers that address issues such as environmental compliance?” Results
Table 12. Purchasing guidelines *No answer from Sweden Analysis For THULE, buying sustainably would mean to know about the energy, material and emission footprints of their suppliers. For their raw material they could focus on who made it, how it was made and under what working conditions.27
26 The Sustainability Purchasing Network, www.buysmartbc.com, accessed on 30th May 2010 27 Ibid
Country
Do you have any purchasing guidelines for your direct suppliers that address issues such as environmental compliance?
Netherlands Especially on IMDS we have Poland is covered by Code of Conduct Sweden * USA We have guidelines in our corporate governance document Brazil No Germany Yes Belgium No
Master of Sustainable Business Leadership - Group 2B
30
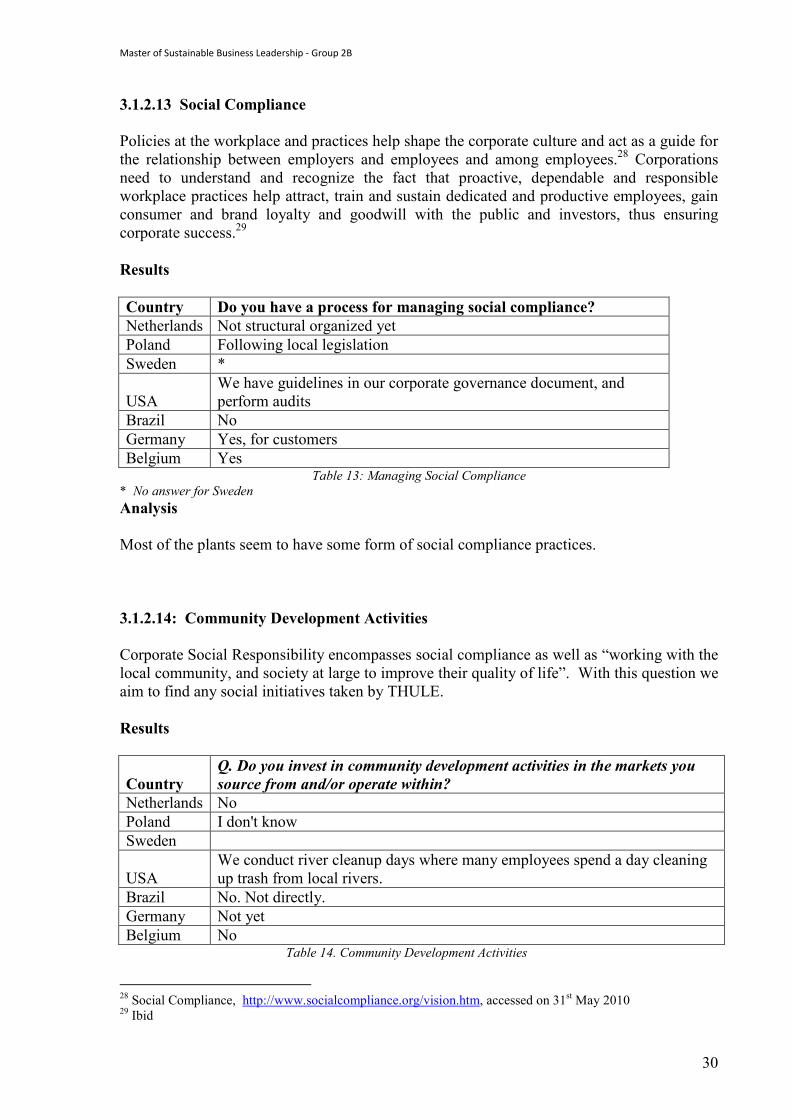
3.1.2.13 Social Compliance Policies at the workplace and practices help shape the corporate culture and act as a guide for the relationship between employers and employees and among employees.28 Corporations need to understand and recognize the fact that proactive, dependable and responsible workplace practices help attract, train and sustain dedicated and productive employees, gain consumer and brand loyalty and goodwill with the public and investors, thus ensuring corporate success.29 Results Country Do you have a process for managing social compliance? Netherlands Not structural organized yet Poland Following local legislation Sweden *
USA We have guidelines in our corporate governance document, and perform audits
Brazil No Germany Yes, for customers Belgium Yes
Table 13: Managing Social Compliance * No answer for Sweden Analysis Most of the plants seem to have some form of social compliance practices. 3.1.2.14: Community Development Activities Corporate Social Responsibility encompasses social compliance as well as “working with the local community, and society at large to improve their quality of life”. With this question we aim to find any social initiatives taken by THULE. Results
Country Q. Do you invest in community development activities in the markets you source from and/or operate within?
Netherlands No Poland I don't know Sweden
USA We conduct river cleanup days where many employees spend a day cleaning up trash from local rivers.
Brazil No. Not directly. Germany Not yet Belgium No Table 14. Community Development Activities
28 Social Compliance, http://www.socialcompliance.org/vision.htm, accessed on 31st May 2010 29 Ibid
Master of Sustainable Business Leadership - Group 2B
31
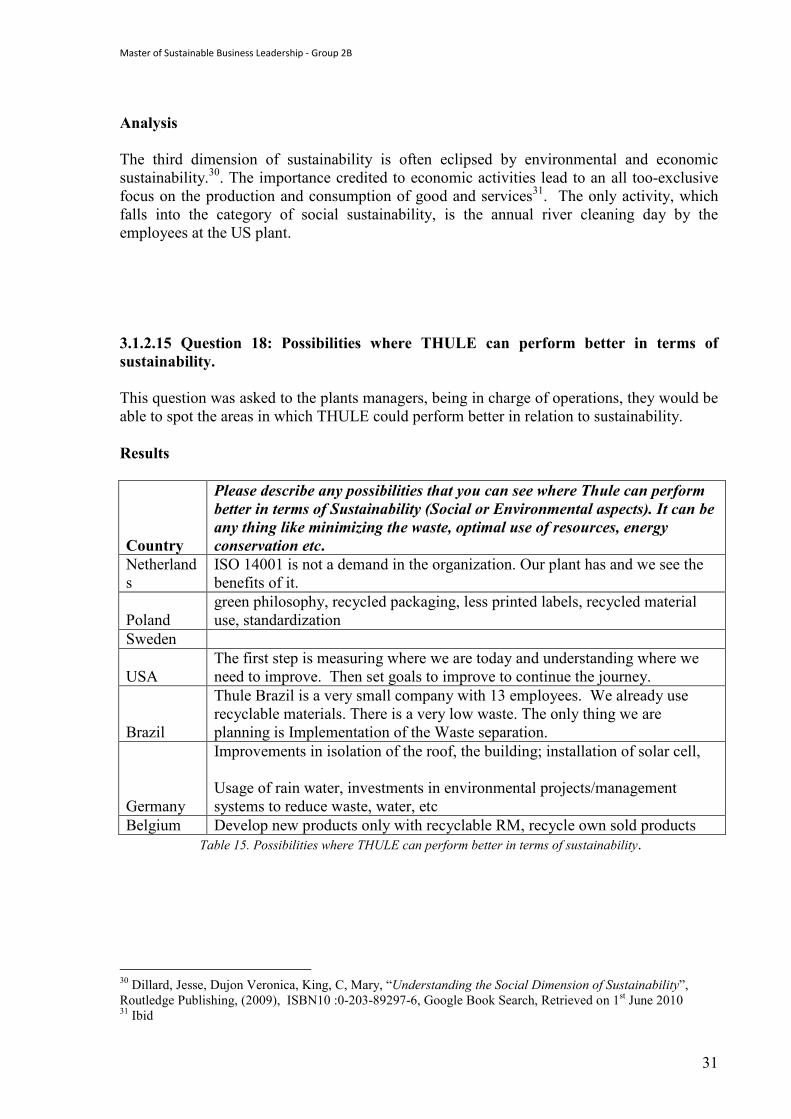
Analysis The third dimension of sustainability is often eclipsed by environmental and economic sustainability.30. The importance credited to economic activities lead to an all too-exclusive focus on the production and consumption of good and services31. The only activity, which falls into the category of social sustainability, is the annual river cleaning day by the employees at the US plant. 3.1.2.15 Question 18: Possibilities where THULE can perform better in terms of sustainability. This question was asked to the plants managers, being in charge of operations, they would be able to spot the areas in which THULE could perform better in relation to sustainability. Results
Country
Please describe any possibilities that you can see where Thule can perform better in terms of Sustainability (Social or Environmental aspects). It can be any thing like minimizing the waste, optimal use of resources, energy conservation etc.
Netherlands
ISO 14001 is not a demand in the organization. Our plant has and we see the benefits of it.
Poland green philosophy, recycled packaging, less printed labels, recycled material use, standardization
Sweden
USA The first step is measuring where we are today and understanding where we need to improve. Then set goals to improve to continue the journey.
Brazil
Thule Brazil is a very small company with 13 employees. We already use recyclable materials. There is a very low waste. The only thing we are planning is Implementation of the Waste separation.
Germany
Improvements in isolation of the roof, the building; installation of solar cell, Usage of rain water, investments in environmental projects/management systems to reduce waste, water, etc
Belgium Develop new products only with recyclable RM, recycle own sold products Table 15. Possibilities where THULE can perform better in terms of sustainability.
30 Dillard, Jesse, Dujon Veronica, King, C, Mary, “Understanding the Social Dimension of Sustainability”, Routledge Publishing, (2009), ISBN10 :0-203-89297-6, Google Book Search, Retrieved on 1st June 2010 31 Ibid
Master of Sustainable Business Leadership - Group 2B
32
Analysis Netherlands have adopted the ISO 14001, although it is not demanded by THULE. According to them, complying with these standards would benefit the whole organization. The rest of the responses indicate the improvements can be made regarding efficient use of resources. 3.1.3 Conclusions of the Practices Questionnaire. Out of the 7 plants that have answered this questionnaire we observe that the Netherlands plant is doing the most in terms of sustainability. The Netherlands plant seem to be have the knowledge about the issues that need to be dealt with and also give the impression that they are working in achieving sustainable practices. The rest of the plants have recycling and waste management activities in place. Awareness and training programs with issues regarding sustainability will help raise the issue’s profile among the employees and give them a better understanding on what needs to be done for further improvement. THULE seems to have initiated some practices related to sustainability, mostly in its production of goods. These activities are mostly concerned with the environmental dimension and maybe some more effort if possible could be put in societal aspect. The most important thing that can come out of this questionnaire is the fact that the plants can have idea where they stand and what they need to do.
Master of Sustainable Business Leadership - Group 2B
33
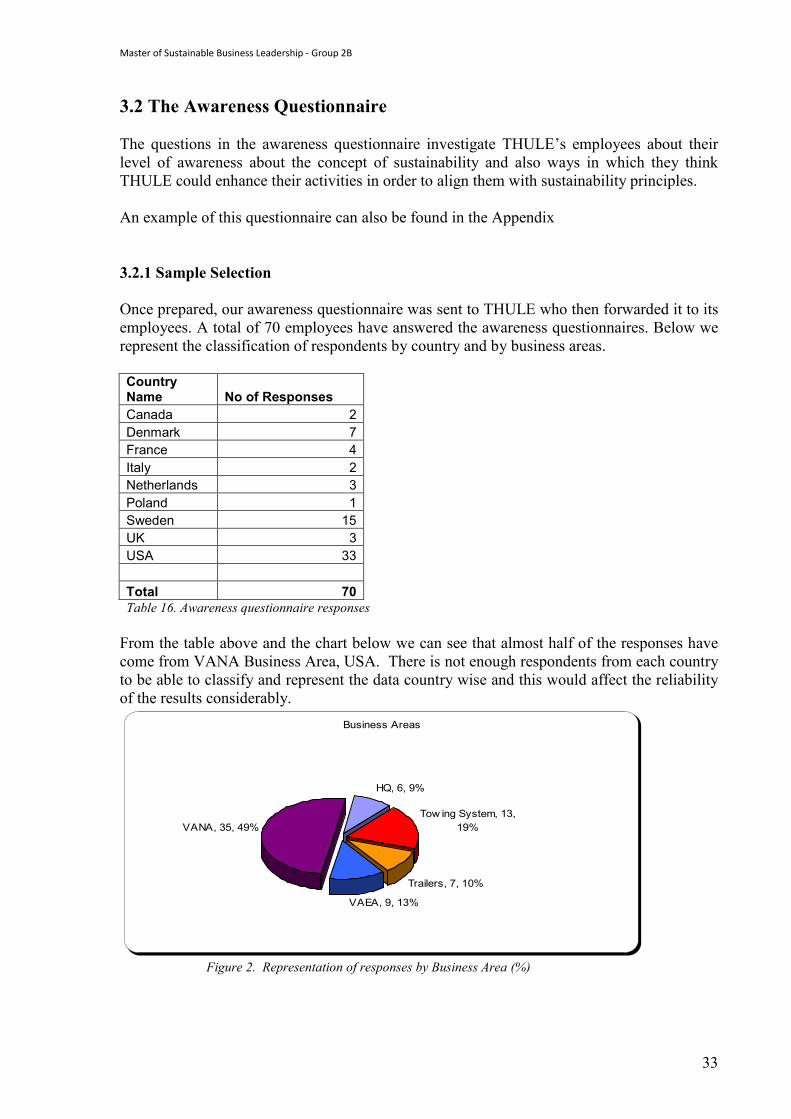
3.2 The Awareness Questionnaire The questions in the awareness questionnaire investigate THULE’s employees about their level of awareness about the concept of sustainability and also ways in which they think THULE could enhance their activities in order to align them with sustainability principles. An example of this questionnaire can also be found in the Appendix 3.2.1 Sample Selection Once prepared, our awareness questionnaire was sent to THULE who then forwarded it to its employees. A total of 70 employees have answered the awareness questionnaires. Below we represent the classification of respondents by country and by business areas. Country Name No of Responses Canada 2 Denmark 7 France 4 Italy 2 Netherlands 3 Poland 1 Sweden 15 UK 3 USA 33 Total 70 Table 16. Awareness questionnaire responses From the table above and the chart below we can see that almost half of the responses have come from VANA Business Area, USA. There is not enough respondents from each country to be able to classify and represent the data country wise and this would affect the reliability of the results considerably.
Business Areas
HQ, 6, 9%
Tow ing System, 13, 19%
Trailers, 7, 10%
VAEA, 9, 13%
VANA, 35, 49%
Figure 2. Representation of responses by Business Area (%)
Master of Sustainable Business Leadership - Group 2B
34
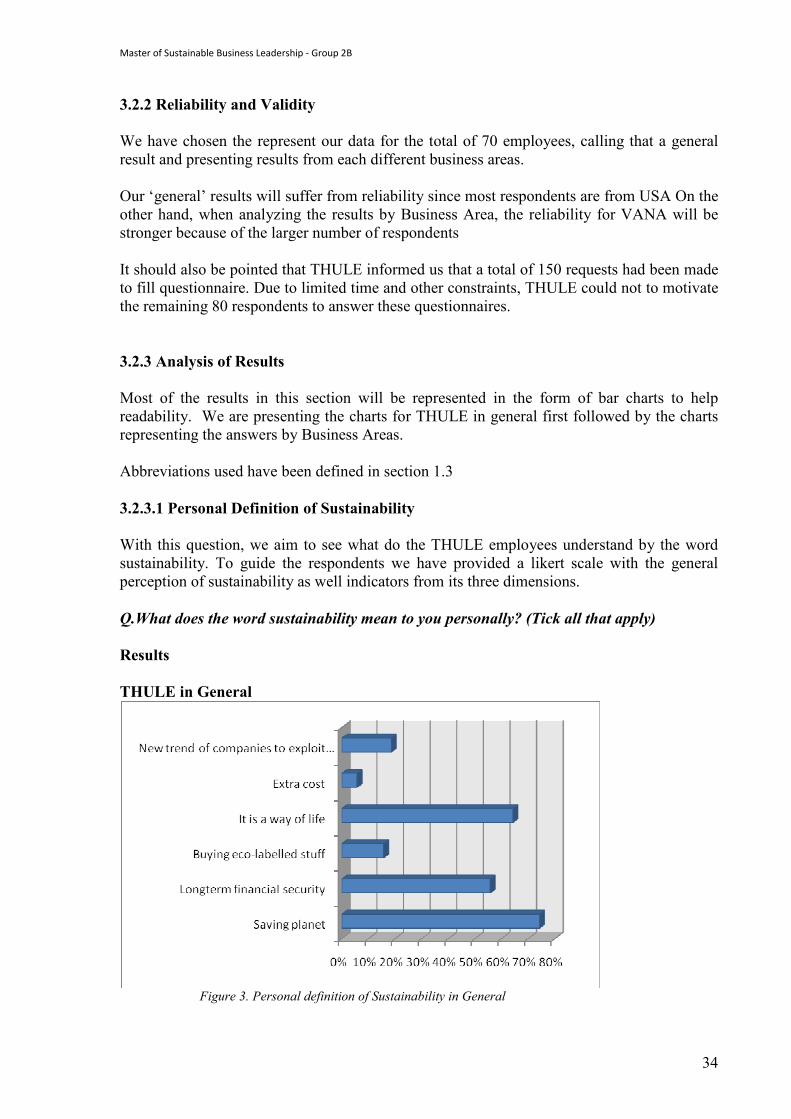
3.2.2 Reliability and Validity We have chosen the represent our data for the total of 70 employees, calling that a general result and presenting results from each different business areas. Our ‘general’ results will suffer from reliability since most respondents are from USA On the other hand, when analyzing the results by Business Area, the reliability for VANA will be stronger because of the larger number of respondents It should also be pointed that THULE informed us that a total of 150 requests had been made to fill questionnaire. Due to limited time and other constraints, THULE could not to motivate the remaining 80 respondents to answer these questionnaires. 3.2.3 Analysis of Results Most of the results in this section will be represented in the form of bar charts to help readability. We are presenting the charts for THULE in general first followed by the charts representing the answers by Business Areas. Abbreviations used have been defined in section 1.3 3.2.3.1 Personal Definition of Sustainability With this question, we aim to see what do the THULE employees understand by the word sustainability. To guide the respondents we have provided a likert scale with the general perception of sustainability as well indicators from its three dimensions. Q.What does the word sustainability mean to you personally? (Tick all that apply) Results THULE in General
Figure 3. Personal definition of Sustainability in General
Master of Sustainable Business Leadership - Group 2B
35
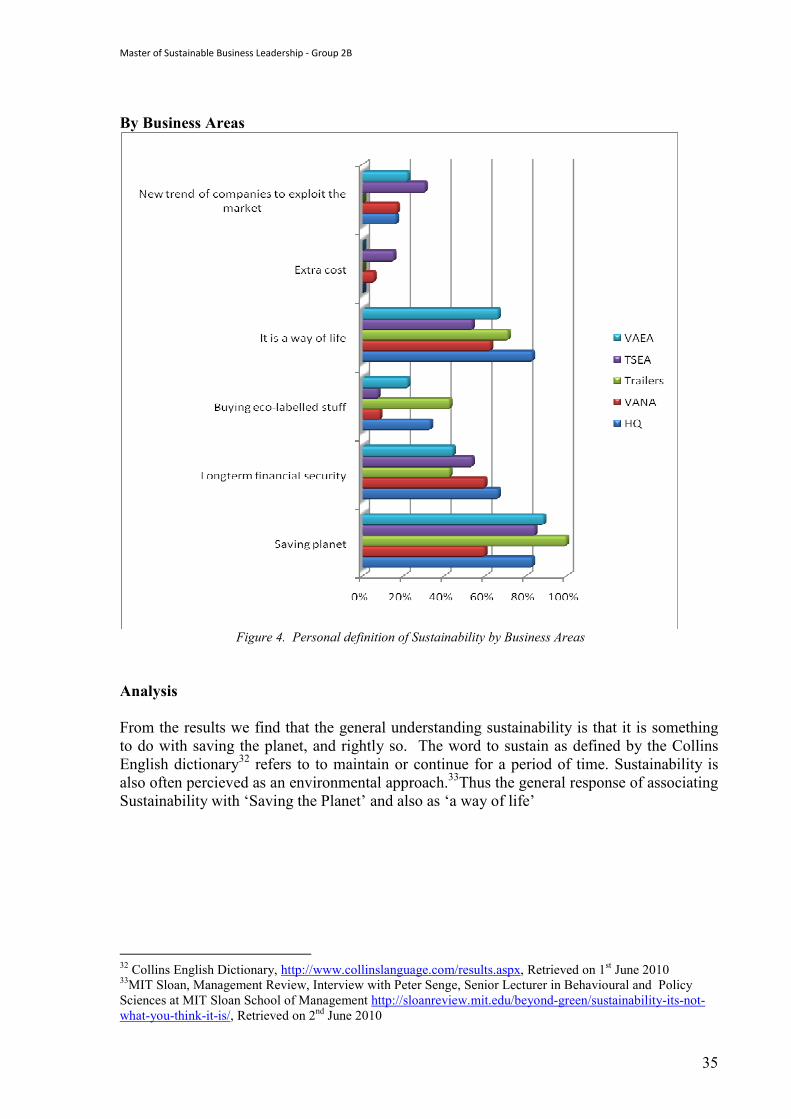
By Business Areas
Figure 4. Personal definition of Sustainability by Business Areas Analysis From the results we find that the general understanding sustainability is that it is something to do with saving the planet, and rightly so. The word to sustain as defined by the Collins English dictionary32 refers to to maintain or continue for a period of time. Sustainability is also often percieved as an environmental approach.33Thus the general response of associating Sustainability with ‘Saving the Planet’ and also as ‘a way of life’ 32 Collins English Dictionary, http://www.collinslanguage.com/results.aspx, Retrieved on 1st June 2010 33MIT Sloan, Management Review, Interview with Peter Senge, Senior Lecturer in Behavioural and Policy Sciences at MIT Sloan School of Management http://sloanreview.mit.edu/beyond-green/sustainability-its-not-what-you-think-it-is/, Retrieved on 2nd June 2010
Master of Sustainable Business Leadership - Group 2B
36
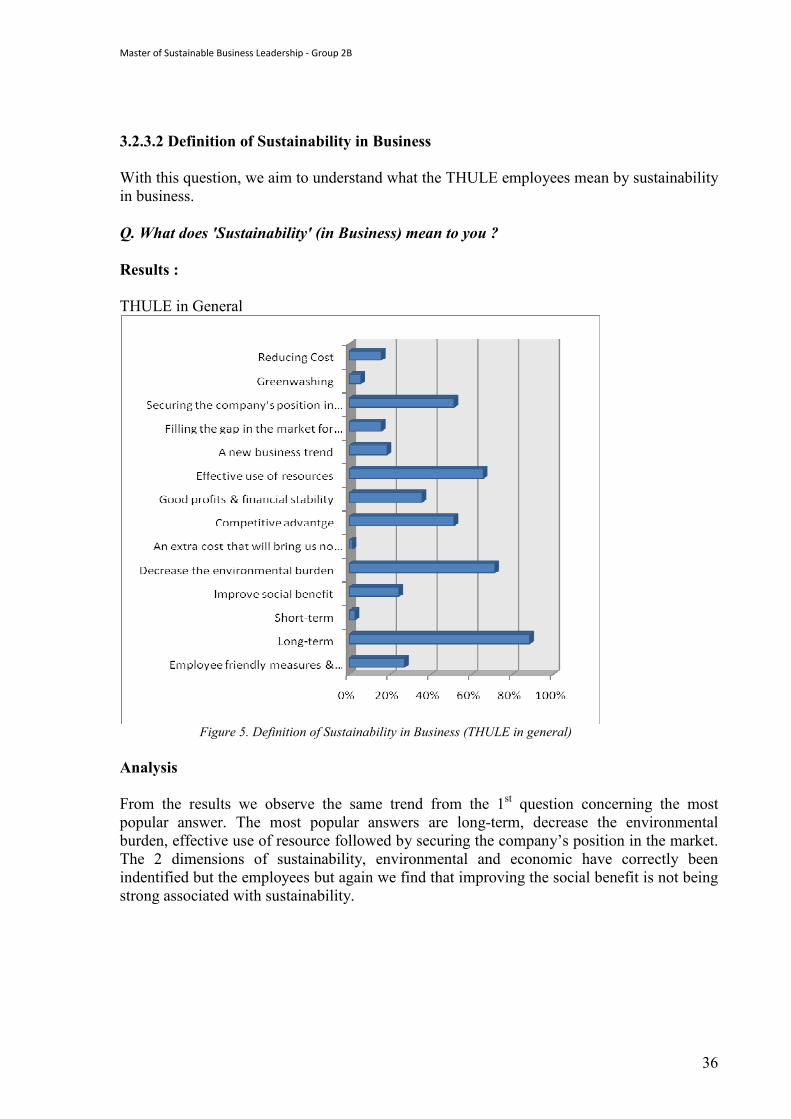
3.2.3.2 Definition of Sustainability in Business With this question, we aim to understand what the THULE employees mean by sustainability in business. Q. What does 'Sustainability' (in Business) mean to you ? Results : THULE in General
Figure 5. Definition of Sustainability in Business (THULE in general) Analysis From the results we observe the same trend from the 1st question concerning the most popular answer. The most popular answers are long-term, decrease the environmental burden, effective use of resource followed by securing the company’s position in the market. The 2 dimensions of sustainability, environmental and economic have correctly been indentified but the employees but again we find that improving the social benefit is not being strong associated with sustainability.
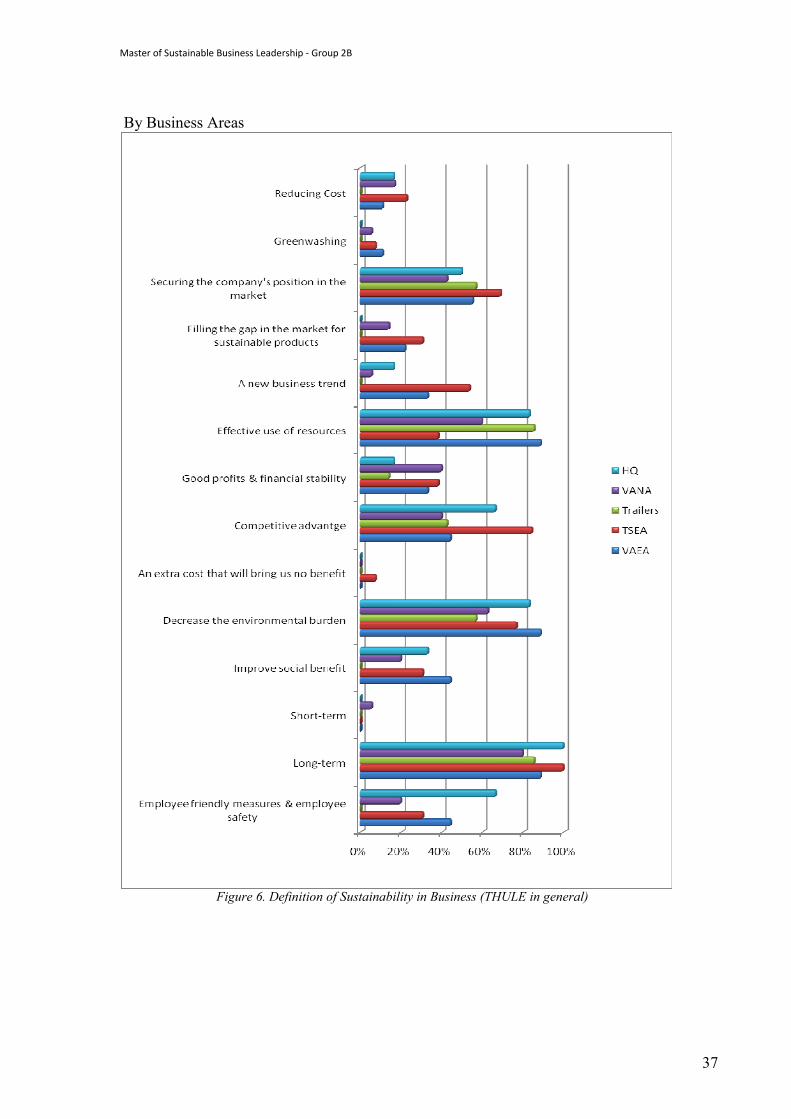
Master of Sustainable Business Leadership - Group 2B
37
By Business Areas
Figure 6. Definition of Sustainability in Business (THULE in general)
Master of Sustainable Business Leadership - Group 2B
38
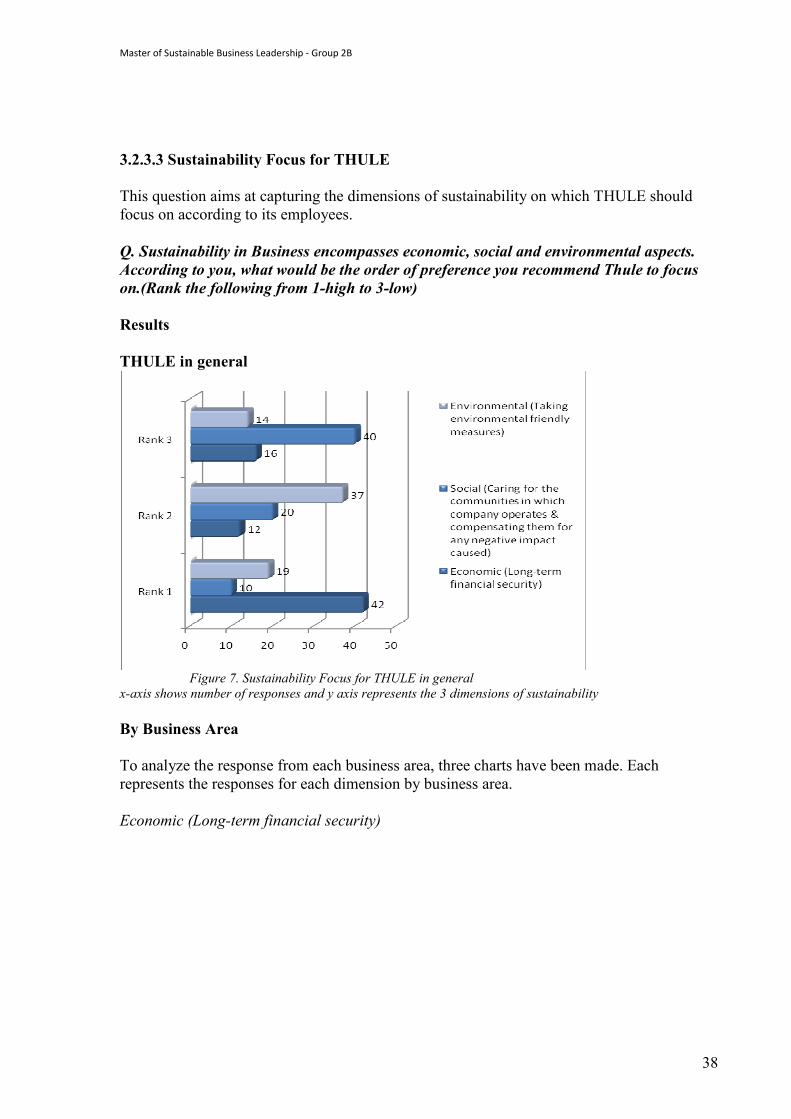
3.2.3.3 Sustainability Focus for THULE This question aims at capturing the dimensions of sustainability on which THULE should focus on according to its employees. Q. Sustainability in Business encompasses economic, social and environmental aspects. According to you, what would be the order of preference you recommend Thule to focus on.(Rank the following from 1-high to 3-low) Results THULE in general
Figure 7. Sustainability Focus for THULE in general x-axis shows number of responses and y axis represents the 3 dimensions of sustainability By Business Area To analyze the response from each business area, three charts have been made. Each represents the responses for each dimension by business area. Economic (Long-term financial security)
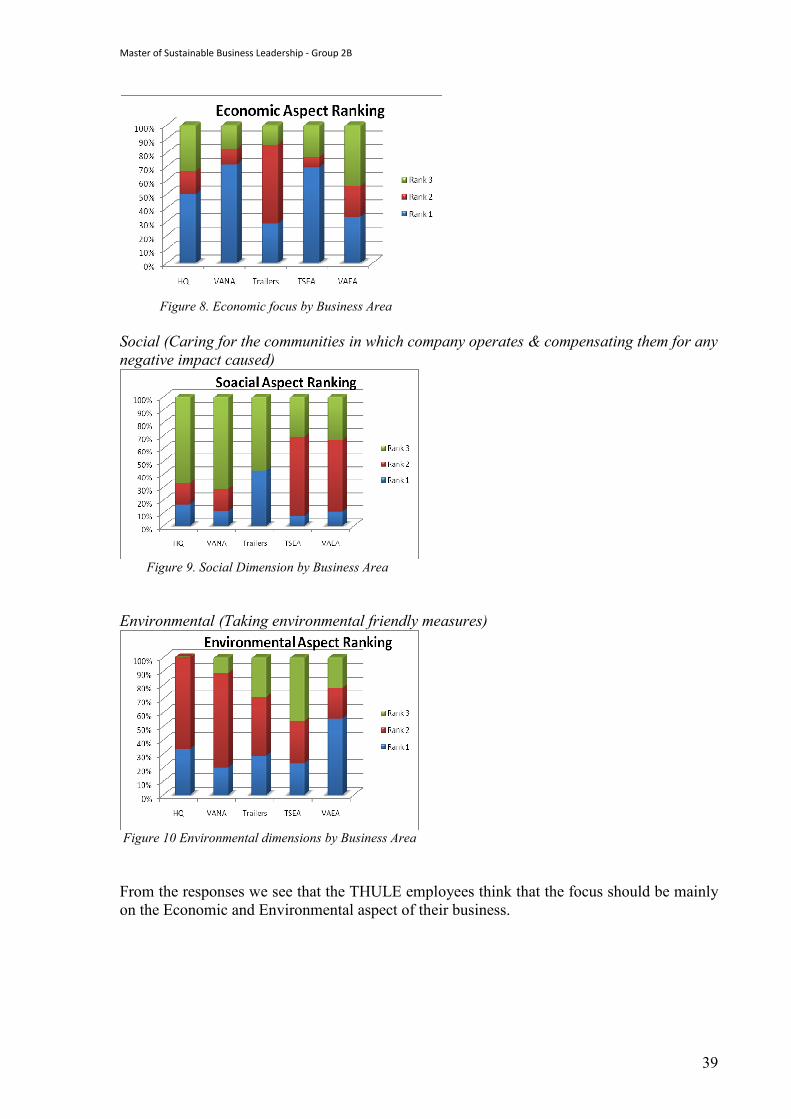
Master of Sustainable Business Leadership - Group 2B
39
Figure 8. Economic focus by Business Area Social (Caring for the communities in which company operates & compensating them for any negative impact caused)
Figure 9. Social Dimension by Business Area Environmental (Taking environmental friendly measures)
Figure 10 Environmental dimensions by Business Area From the responses we see that the THULE employees think that the focus should be mainly on the Economic and Environmental aspect of their business.
Master of Sustainable Business Leadership - Group 2B
40
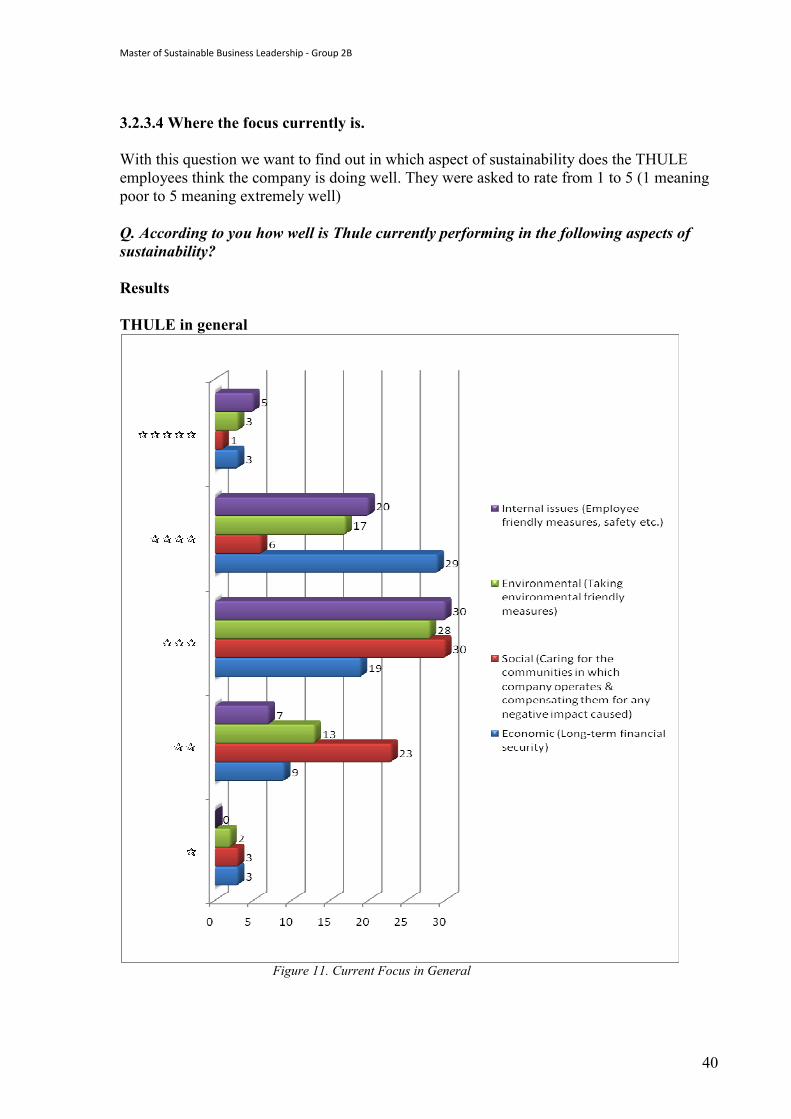
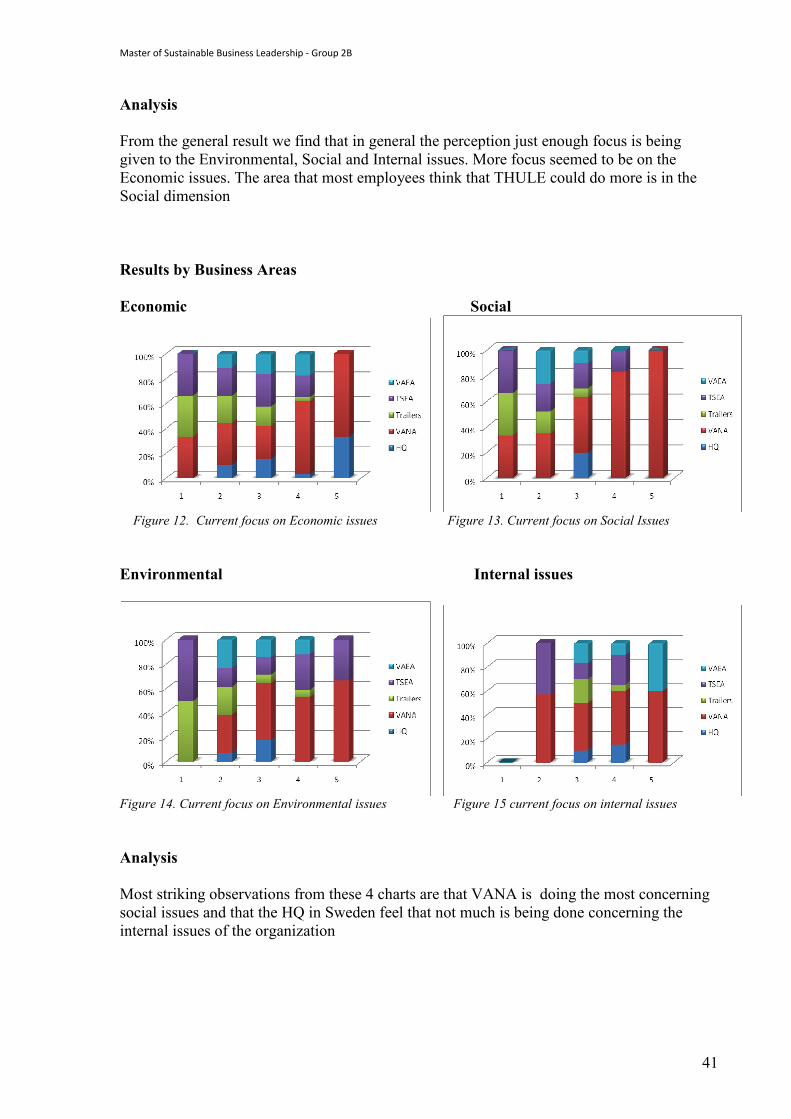
3.2.3.4 Where the focus currently is. With this question we want to find out in which aspect of sustainability does the THULE employees think the company is doing well. They were asked to rate from 1 to 5 (1 meaning poor to 5 meaning extremely well) Q. According to you how well is Thule currently performing in the following aspects of sustainability? Results THULE in general
Figure 11. Current Focus in General
Master of Sustainable Business Leadership - Group 2B
41
Analysis From the general result we find that in general the perception just enough focus is being given to the Environmental, Social and Internal issues. More focus seemed to be on the Economic issues. The area that most employees think that THULE could do more is in the Social dimension Results by Business Areas Economic Social
Figure 12. Current focus on Economic issues Figure 13. Current focus on Social Issues Environmental Internal issues
Figure 14. Current focus on Environmental issues Figure 15 current focus on internal issues Analysis Most striking observations from these 4 charts are that VANA is doing the most concerning social issues and that the HQ in Sweden feel that not much is being done concerning the internal issues of the organization
Master of Sustainable Business Leadership - Group 2B
42
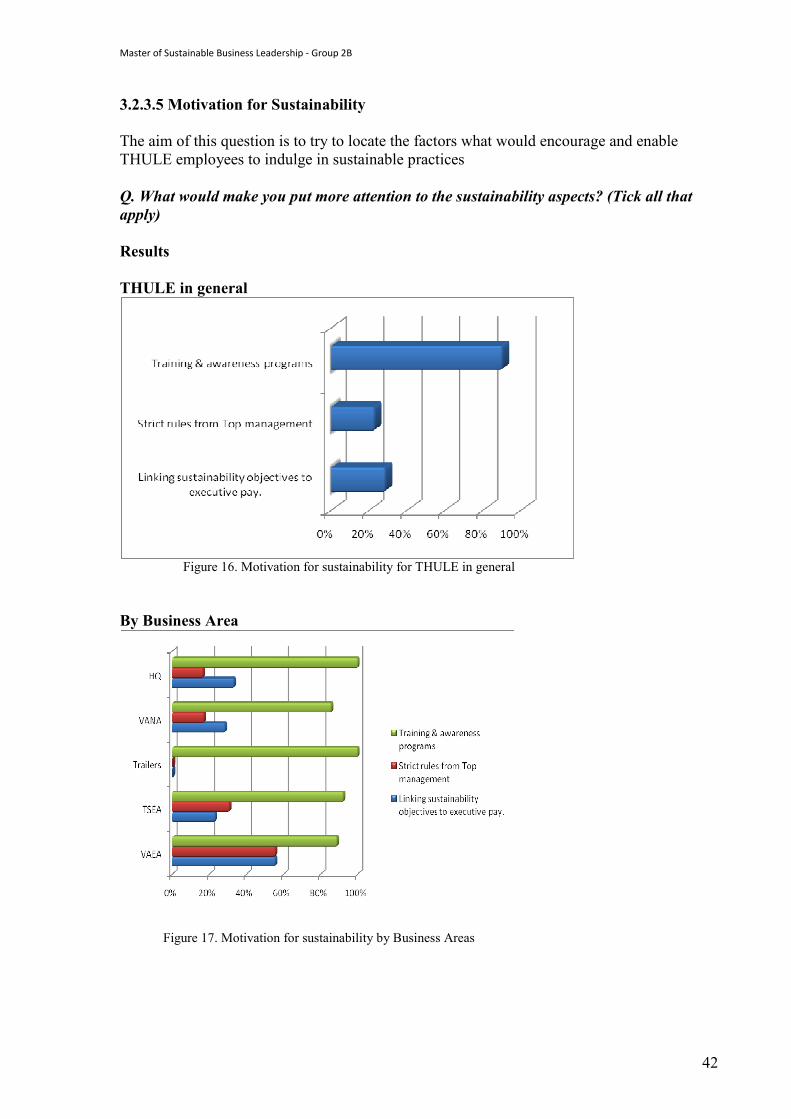
3.2.3.5 Motivation for Sustainability The aim of this question is to try to locate the factors what would encourage and enable THULE employees to indulge in sustainable practices Q. What would make you put more attention to the sustainability aspects? (Tick all that apply) Results THULE in general
Figure 16. Motivation for sustainability for THULE in general By Business Area
Figure 17. Motivation for sustainability by Business Areas
Master of Sustainable Business Leadership - Group 2B
43
Analysis By far, the most popular response to this question was that Training and Awareness programs would be the best way to promote sustainability within the organization. In his book34, Bob Doppelt mentions that for successful engagement in sustainability an organization must tirelessly be communicating the need, vision and strategies for achieving sustainability. Lack of effective communication on new concepts will hinder the move towards a more sustainable organization. 34 Doppelt, Bob, “Leading Change Towards Sustainability : A Chang e-Management Guide for Business, Government and Civil Society”, Chapter 10, Pg 173, GreenLeaf Publishing, (2003)
Master of Sustainable Business Leadership - Group 2B
44
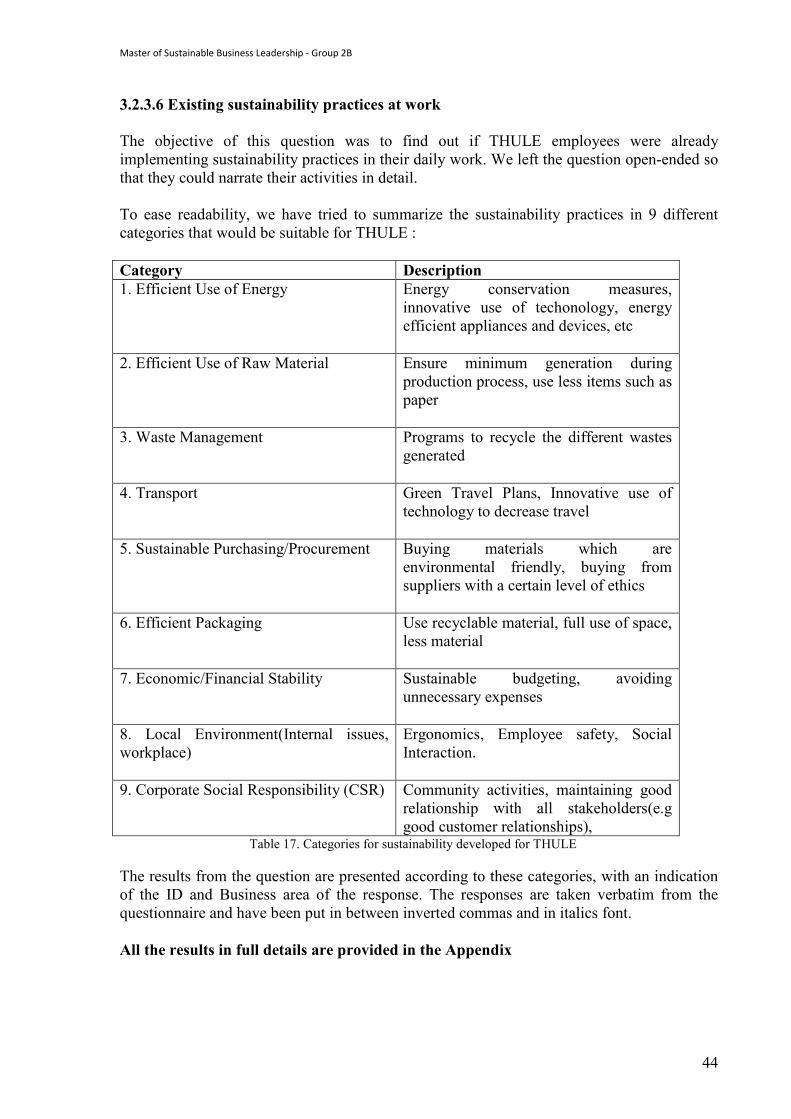
3.2.3.6 Existing sustainability practices at work The objective of this question was to find out if THULE employees were already implementing sustainability practices in their daily work. We left the question open-ended so that they could narrate their activities in detail. To ease readability, we have tried to summarize the sustainability practices in 9 different categories that would be suitable for THULE : Category Description 1. Efficient Use of Energy Energy conservation measures,
innovative use of techonology, energy efficient appliances and devices, etc
2. Efficient Use of Raw Material Ensure minimum generation during production process, use less items such as paper
3. Waste Management Programs to recycle the different wastes generated
4. Transport Green Travel Plans, Innovative use of technology to decrease travel
5. Sustainable Purchasing/Procurement Buying materials which are environmental friendly, buying from suppliers with a certain level of ethics
6. Efficient Packaging Use recyclable material, full use of space, less material
7. Economic/Financial Stability Sustainable budgeting, avoiding unnecessary expenses
8. Local Environment(Internal issues, workplace)
Ergonomics, Employee safety, Social Interaction.
9. Corporate Social Responsibility (CSR) Community activities, maintaining good relationship with all stakeholders(e.g good customer relationships),
Table 17. Categories for sustainability developed for THULE The results from the question are presented according to these categories, with an indication of the ID and Business area of the response. The responses are taken verbatim from the questionnaire and have been put in between inverted commas and in italics font. All the results in full details are provided in the Appendix
Master of Sustainable Business Leadership - Group 2B
45
Q. Are you taking sustainability aspects into account in your daily work? If so, in what type of work tasks? Result According to Category
• Efficient use of energy 1. “I’m trying to minimize the costs and negative environmental impact of my daily work. Reducing the use of electricity waste etc””. (Corporate, Malmo, Response ID1822486) 2. “Try to reduce the consumption of energy paper etc. Encourage my colleagues to think green”” (Trailers, Denmark, Response ID1823110) 3. “……… sending electronic documents, auto shutoffs for lights” (VANA, USA, Response ID1777100) 4. “Yes. … Have installed occupancy sensors in offices and restrooms…’’(VANA USA, ID1849370)”
• Efficient use of raw materials 1. “Trying not to use too much of paper and other stuff in the office.” (Malmo, HQ, Response ID1822392) 2. “Trying to print as few paper copies as possible.”” (Malmo, HQ, ID1823446) 3. “Yes normal issues like no environmental issues…, reduction of material content & waste transport”(Towing, Netherlands, Response ID 1825258) 4. “Reduction of weight product + packaging” (Towing Systems, France, ID1826427) 5. “Avoid paper copies at all costs. Use reusable cups rather than plastic bottles or paper cups.’’. (VANA, USA, ID1776815) 6.’’ When possible always trying not to waste to reuse to recycle in an effort not only to keep Thule costs down but also to help the environment.’’ (VANA, USA, ID1776874)
• Waste Management
1. “We are continuously improving the reduction of process scrap High focus on recycling all materials coming into the building; currently 85-90%.” (VAEA, UK, ID1823541) 2. “[...] Waste management Lean Manufacturing” (VANA, USA, ID1776859) 3. “reduce - reuse - recycle mindset”. (VANA, USA, ID1781957)
Master of Sustainable Business Leadership - Group 2B
46
4. “recycling all office materials.” (VANA, USA, ID1789633) 5. “Reducing the use of [...] waste etc.” (HQ, Sweden, ID1822486)
• Transport 1. “reduction of CO2 emissions by consolidation transport and reducing the transport network”. ( HQ, Sweden, ID1823513) 2. “I choose bike and train as means of transportation rather than going by car or by air [...].” (VAEA, Sweden, ID1824022) 3. “Trying to be smarter about travel plans - using more online meeting providers.” (VANA, USA, ID1802012) 4. “Conference call vs meeting [...] bike to work at times [...].” (VANA, USA, ID1777838)
• Sustainable Purchasing 1. “Environment friendly designs [...].” (THULE Towing systems, Sweden, ID1844935) 2. “Use reusable cups rather than plastic bottles or paper cups.” (VANA, USA, ID1776815) 3. “RECYCLABLES SUCH AS CARDBOARD STRETCH WRAP AND OFFICE PAPER.” (VANA, USA, ID1798657)
• Efficient Packaging 1. “[...] cooperate with customers to reduce freight weight etc.” (Towing, NL, ID1824972) 2. “[...] reduction of material content & waste transport.” (Towing, Netherlands, ID1825258) 3. “Reduction of weight product + packaging.” (Towing System, France, ID1826427) 4. “Yes - We try to limit use of packing materials.” (Trailers, Denmark, ID1823176) 5. “We also return used corrugate.” (VANA, USA, ID1849370)
• Economical/Financial Stability 1. “Yes especially in new developments Capex. Meetings with project teams etc.” (Towing Systems, Netherlands, ID1797435) 2. “Yes. Cash flow improvement.” (VANA, USA, ID1776854)
Master of Sustainable Business Leadership - Group 2B
47
3. “Best and fastest to market utilizing best practices of material choices and ingenuity to increase market share.” (VANA, USA, ID1789138)
• Local Environment 1. “[...] good ergonomics for customers and employees.” (Thule Towing system, Sweden, ID 1844935) 2. “Encourage my colleagues to think green.” (TRAILERS, Denmark, ID1823110) 3. “Focus on well-being of my employees both short term and long term.” (Trailers, Denmark, ID1823021) 4. “Environmental aspects and safety for employees.” (VAEA, Italy, ID1828899)
• CSR 1. “ [...] We are also working an a long term relation with our customers.” (Thule Towing System, Sweden,ID1844935) 2. “offering a solution which brings customer uses confident and reliable in time”. (Towing, France, ID1823276) 3. “[...] no child labour [...].” (Towing, Netherlands, ID1825258) 4. “Support local companies with business when possible.” (VANA, USA, ID1776815) 5. “[...] Strong customer service world class products employee relations”. (VANA, USA, ID1777371)
• No Sustainability Activities 1. “No” (HQ, Sweden, ID1823544) 2. “No” (Thule Towing System, Poland, ID1827092) 3. “NO” (VANA, USA, ID1776758) 4. “No not really” (Trailers, Sweden, ID1840749) 5. “No” (VAEA, Sweden, ID1822440)
Master of Sustainable Business Leadership - Group 2B
48
Analysis of Results As observed from the various accounts, there seem we observe practices which fall in all the 9 categories. Some respondents have also said that they have no sustainability activities in their daily tasks even though other employees from same business area have described sustainability activities in their daily tasks. We think that this might be attributed due to lack of communication from the departments in the same business areas or lack of knowledge about what exactly are sustainability practices. Another reason could be that the respondents who said no did not really want to fill in this question/questionnaire. 3.2.3.7 Possibilities to perform better in terms of Sustainability. The THULE employees were also asked about the possibilities where THULE could perform better in terms of sustainability Here also the comments from the employees are presented using the same methodology as mentioned in section 3.2.3.6 On top of the 9 categories, we have also presented some of the general comments put forward by the employees. Q. Please describe any possibilities that you can see where Thule can perform better in terms of Sustainability (Social or Environmental aspects). It can be any thing like minimizing the waste, optimal use of resources, energy conservation etc. Results General Comments 1. “Almost in all aspects’’ (HQ, Sweden, ID1822392) 2. ‘’make this an agenda point for senior management” (HQ, Sweden, ID 1822486) 3. “Thule needs to implement environmental and social accountability analysis in all sourcing, production and acquisition decisions. Too much is unexplored at this point in time.””(HQ, Sweden, ID1822486) 4. “Create a sharp "green" profile and culture. The active lifestyle which is our core value is strongly connected to nature and out door life. (it will give us brand recognition as well). Show environmental (and ethically) responsibility in all business aspects from sourcing to distribution.” (Trailers, Denmark, ID1823110) 5. ‘’Thule could improve how they utilize existing competences within the group across BA's. Especially when closing down organizations in one end and strengthen in another end.’’ (Towing Systems, Sweden, ID 1827342) 6. “We can start to talk about the matter more. Clearly define what we will focus on when it comes to sustainability during the coming years. I think we should focus on all of the above
Master of Sustainable Business Leadership - Group 2B
49
suggested areas (Economic, Social, Environmental and Internal Issues).”(VAEA, Sweden, ID1823252) 7. “Sharing successes from other BA's, best practice sharing...”(VANA, USA, ID1777838)
• Efficient use of energy
1. “Switch off the lights in offices…’’(HQ, Sweden, ID 1827759) 2. “Energy consumption specification for our products as well as specified in what type of energy that has been used.”(Towing Systems, Sweden, ID 1844935) 3. “Focus on saving energy from production, heating and lightening…..’’(Towing, Denmark, ID 1822995) 4.” - ease the usage of Scanners (would ease the electronic archiving) -encourage the video conferences vs. travels, - reduce heating/ air conditioning when offices are not utilized (holidays, week- ends) -turn off all computers, copiers, printers before leaving -put this into the Purchase requirement we expect from our Suppliers - utilize the roofs of the factories for Electrical power (or selling Green Electricity to the local Electric Company) “ (Towing Systems Europe/Asia, France, ID 1825983) 5. “Change our very old thermoforming oven to new, more efficient, design potentially saving 40% in energy. Utilising more renewable energy sources” (VAEA, UK, ID 1823541) 6. “Very happy to see the recent installation of solar panels - given our location on the top of a windy hill - it would be great to see a wind turbine...” (VANA, USA, 1802012) 7. “Our CT office installed solar panels on their roof to generate electrify and reduce reliance on the electric company. The opportunity is for other sites to rely more heavily on the sun for energy needs.” (VANA, USA, ID1849370)
Efficient use of raw material.
1. “Better planning and quality control at the beginning of the product development and production cycle. No up front quality control visibly in place at this time.””(VANA, Canada, ID1780081) 2.” Engineering end of life plans into each of our products. Eliminating of all PVC or other harmful materials from our products” (VANA, USA, ID 1789633) 3. “Eliminate use of plastic K-cups in coffee machine. Distribute re-usable coffee mugs and charge $0.25 for disposable cups” (VANA, USA, ID 1792060) 4. “Remove carpeting in all buildings to cut down on chemical cleaning and allergens; install environmentally-friendly solid surface flooring; work to provide more natural light to cut down on electrical needs; keep vents clean for employee well-being…” (VANA, USA, ID1776885)
Master of Sustainable Business Leadership - Group 2B
50
• Waste Management
1.”…recycle waste in the kitchen”(HQ, Sweden, ID 1827759) 2. “Waste reduction, product development is the big potential…”(HQ, Sweden, ID 1823544)” 3.” Thule can take direction on product recycling materials, for example by Thule box production.”(Towing Systems, Poland, ID 1827092) 4.” Recycling of used products/material” (VAEA, Sweden, ID1824022)” 5.” Where possible, I'd like to see a higher utilization of recycled materials (like we currently use in our cargo boxes).” (VANA, USA, ID1802012) 6. “Reducing our waste. From the production floor to becoming a more paperless company.”(VANA, USA, ID 1789138)” 7. “…implement a week-long program to weigh garbage per department with a goal to reduce waste as the week progresses” (VANA, USA, ID 1776885) 8. “Better communication between purchasing and product development would result fewer scrapped parts each year as products are changed or discontinued.” (VANA, USA, ID 1777091)
• Transport 1.” Company cars and company bikes available at Thule offices, making it easy to take your bike to the office even if you have to use a car during your working day and making it easy to use a bike for shorter trips during your working day even if you have to use the car to get to work”(VAEA, Sweden, ID1824022) 2. “Encourage alternative transportation and carpooling with incentive” (VANA, USA, ID1792060) 3. “provide employee incentives to ride their bike to work”(VANA, USA, ID1776885)
Master of Sustainable Business Leadership - Group 2B
51
• Sustainable Procurement/Purchasing 1.” I think Thule should define an environment policy towards our suppliers. ” 2. “Set requirements on SUPPLIERS for Sustainable actions and reaching certain objectives.”(VAEA, Sweden, ID1840980) 3. “Focus on local suppliers for components” (VANA, USA, ID 1776815) 4. “KEEP GOING ON A UPWARD TREND ON SUSTAINABILITY IN TERMS OF SUPPLIERS”(VANA, USA, ID 1776821)
• Efficient Packaging 1.” Recycling (re-use) of packing materials.”(Trailers, Denmark, ID1823176)
• Local Environment/Social Workplace 1.” Communication of present activities”(Towing Systems, Netherlands, ID1825258) 2. “Continue with environmental awareness and perhaps publicize efforts more within each location to gain 100% support and understanding from all employees which will spill into their lives and their communities outside of Thule.”(VANA, USA, ID 1776874) 3. “keep vents clean for employee well-being”(VANA, USA, ID 1776885) 4. “COMPOSTING BINS IN CAFETERIA'S, RECYLCING BINS IN ALL OFFICES AND CUBICLES, COMMUNITY GARDEN PLOTS WHERE EMPLOYEE KEEPS HALF AND THE OTHER HALF DONATED (WHERE THERE IS ENOUGH LAND).”(VANA, USA, ID1776912)
• Corporate Social Responsibility 1. “…show additional fuel consumption on car when roof box is in use to make customer aware and only use when necessary..”(VAEA, Sweden, ID 1845214) 2. “Aligning ourselves as a corporation with one or two social causes. for example: feeding hungry, habitat for humanity, cancer research, etc.” (VANA, USA, ID 1789633) 3. “Increase community involvement with sponsorships” (VANA, USA, ID 1792060) 4. “Social and environmental opportunities - more volunteer work with connection to environment” (VANA, USA, ID 1798258)
Master of Sustainable Business Leadership - Group 2B
52
5.” More community outreach. Becoming a better neighbor in the city of Seymour and the surrounding area.”(VANA, USA, ID 1776758) 6. “Create more jobs in our community by manufacturing and assembling more in house.”(VANA, USA, ID 1776815) Analysis of Results Some THULE employees are very aware about sustainability issues and have very clear ideas about how the company can move in that direction. Some of them also appear familiar with all the three dimensions of sustainability and from their responses they show a willingness to engage in those activities. The employees had suggestions for every different category and with the right support, a bunch of these ideas could be implemented in near future.
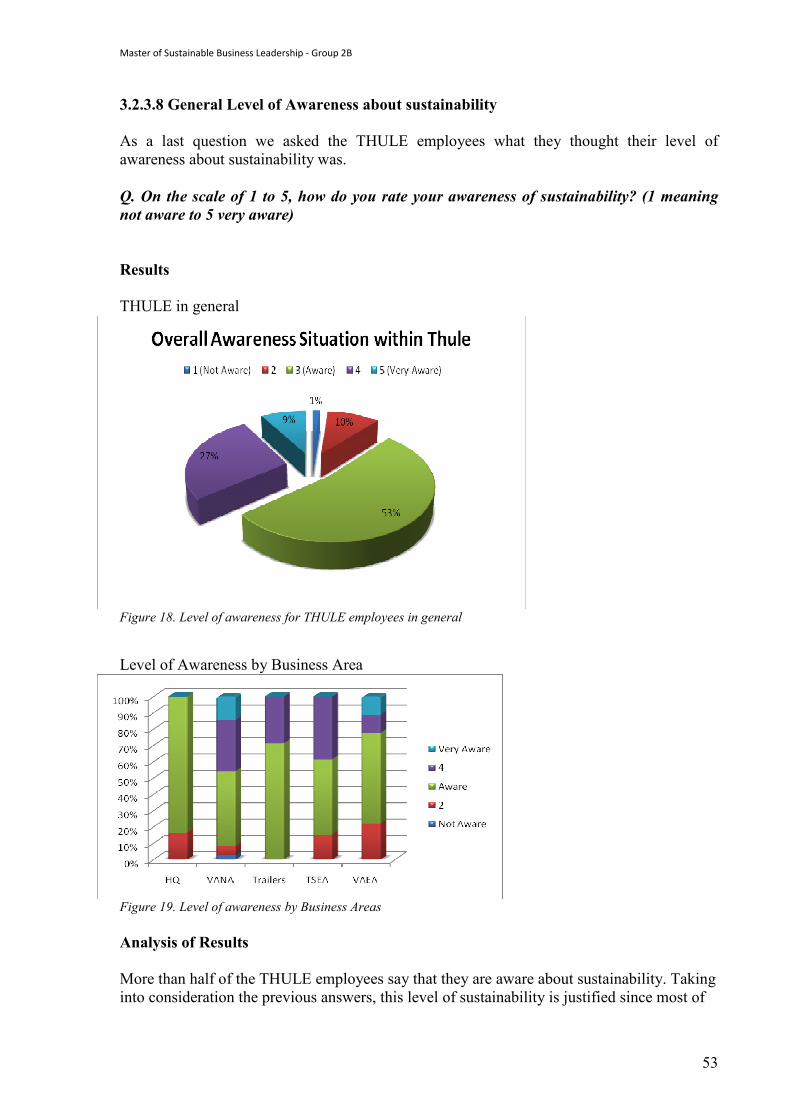
Master of Sustainable Business Leadership - Group 2B
53
3.2.3.8 General Level of Awareness about sustainability As a last question we asked the THULE employees what they thought their level of awareness about sustainability was. Q. On the scale of 1 to 5, how do you rate your awareness of sustainability? (1 meaning not aware to 5 very aware) Results THULE in general
Figure 18. Level of awareness for THULE employees in general Level of Awareness by Business Area
Figure 19. Level of awareness by Business Areas Analysis of Results More than half of the THULE employees say that they are aware about sustainability. Taking into consideration the previous answers, this level of sustainability is justified since most of
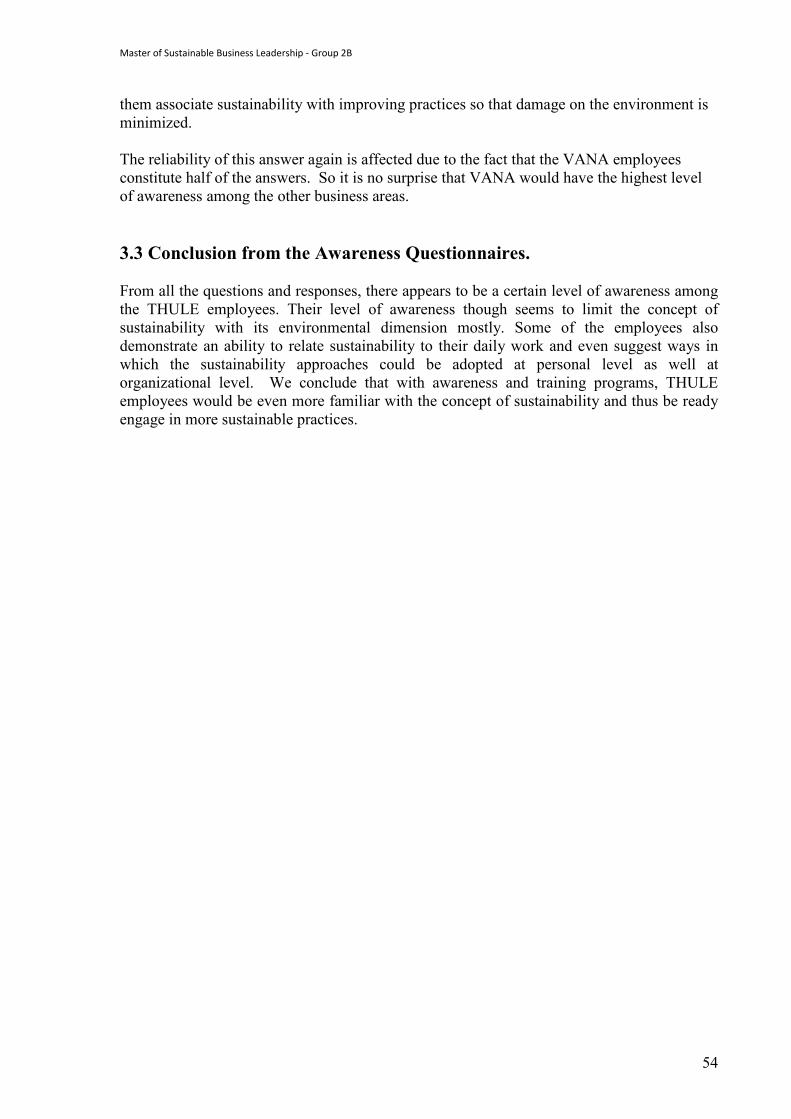
Master of Sustainable Business Leadership - Group 2B
54
them associate sustainability with improving practices so that damage on the environment is minimized. The reliability of this answer again is affected due to the fact that the VANA employees constitute half of the answers. So it is no surprise that VANA would have the highest level of awareness among the other business areas. 3.3 Conclusion from the Awareness Questionnaires. From all the questions and responses, there appears to be a certain level of awareness among the THULE employees. Their level of awareness though seems to limit the concept of sustainability with its environmental dimension mostly. Some of the employees also demonstrate an ability to relate sustainability to their daily work and even suggest ways in which the sustainability approaches could be adopted at personal level as well at organizational level. We conclude that with awareness and training programs, THULE employees would be even more familiar with the concept of sustainability and thus be ready engage in more sustainable practices.
Master of Sustainable Business Leadership - Group 2B
55
5. Carbon Footprint Calculation _____________________________________________________________________ In this chapter, we will present the framework and a method for calculating the carbon footprint of a Bike Rack, a THULE product. In following sections we present an introduction, methodology and calculation of the product carbon footprint. _____________________________________________________________________ 5.1 Introduction to Carbon foot print
A ‘carbon footprint’ measures the total greenhouse gas emissions caused directly and indirectly by a person, organization, event or product.35
The main types of carbon foot print are organizational carbon footprint and product carbon footprint. Throughout this project our focus is only on product carbon footprint.
5.1.1 Product Carbon footprint
Emissions over the whole life of a product or service, from the extraction of raw materials and manufacturing right through to its use and final reuse, recycling or disposal.36
Therefore Carbon footprint is a cradle to grave approach. In most cases, in addition to carbon dioxide, many other Green House Gases (GHG) are released into the environment during various activities. These GHG emissions are converted into the carbon dioxide equivalents (CO2e) by multiplying with their respective 100 year Global Warming Potentials (GWP). Carbon dioxide equivalent (CO2e) allows the different greenhouse gases to be compared on a like-for-like basis relative to one unit of CO2. This way the carbon footprint of any activity can be represented in terms of carbon dioxide emissions.
Calculation of a product carbon foot print requires unusual amount of data. Even the type of data that is required is not retained in most companies, it often requires product specific data through out and beyond the value chain. It can be calculated better by working on-site with active interaction with the client. In most cases approximations and logical assumptions are made to overcome the data constraints. The degree of this approximations and logical assumptions depend on various factors such as data availability, ecosystem etc. Therefore the carbon foot print calculation can be regarded as an estimate rather than exact. Wherever in this project an approximation or assumption is made, we had put our best effort to explain why it is made and how it is made.
35 http://www.carbontrust.co.uk/cut-carbon-reduce-costs/calculate/carbon-footprinting/pages/carbon-footprinting.aspx, retrieved on May 28th 2010 36 Ibid.,
Master of Sustainable Business Leadership - Group 2B
56
5.1.2 Benefits from measuring a product carbon footprint
Measuring a product carbon footprint can result in various benefits to organization. Some of benefits are listed below37.
Attracting customers
Customers are becoming increasingly aware of the environmental impact of the goods and services they use. This is clearly evident from the fact that the demand for eco-friendly products has been on the rise over the past few years. Demonstrating a lower carbon footprint of products than the competitor products might result in a competitive advantage.
Brand identity
Reporting product carbon footprint or getting a certification shows that an organization is environmentally and socially responsible organization. This improves its brand image and brand value.
Leadership
Reporting the products carbon footprint will support your corporate responsibility endeavors and improve your reputation. This can result in leadership advantage in market and industry. It helps to develop better relationships with your supply chain as they tend to relate themselves to your organization due to its reputation.
Cost savings
Ascertaining emissions at each stage of a product gives greater insight into all the processes and aides in identifying the areas where GHG emissions can be reduced. This often results in cost savings in terms of transport, energy, material usage, wastes, packaging etc.
Emission savings & integrating it into decision making
Looking at the whole supply chain will help you reduce your emissions from factors such as suppliers, choice of materials, production processes, product designs and modes of transport etc.
5.2. Methodology to calculate product carbon footprint
We chose PAS 2050 method to calculate product carbon footprint. PAS 2050 is a Publicly Available Specification for assessing product life cycle GHG emissions, prepared by BSI British Standards and co-sponsored by the Carbon Trust and the Department for Environment, Food and Rural Affairs (DEFRA), UK. PAS 2050 has been specially designed
37 http://www.carbontrust.co.uk/cut-carbon-reduce-costs/calculate/carbon-footprinting/pages/product-carbon-footprint.aspx retrieved May 29, 2010
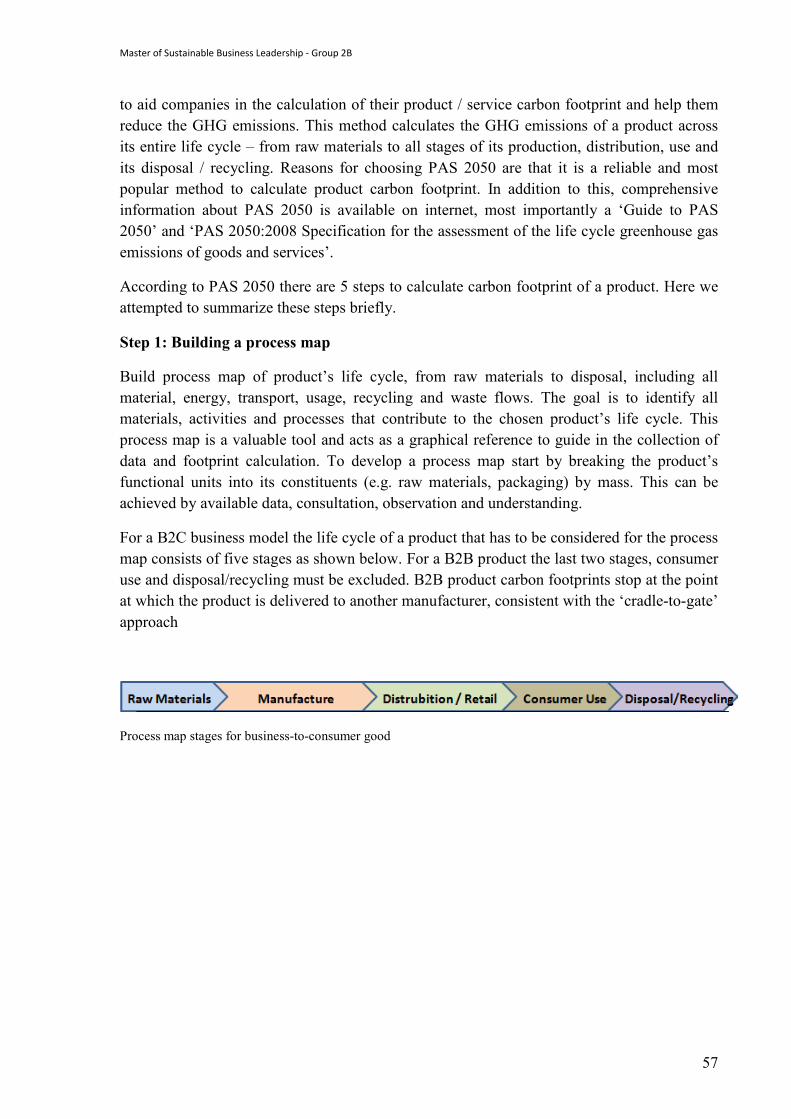
Master of Sustainable Business Leadership - Group 2B
57
to aid companies in the calculation of their product / service carbon footprint and help them reduce the GHG emissions. This method calculates the GHG emissions of a product across its entire life cycle – from raw materials to all stages of its production, distribution, use and its disposal / recycling. Reasons for choosing PAS 2050 are that it is a reliable and most popular method to calculate product carbon footprint. In addition to this, comprehensive information about PAS 2050 is available on internet, most importantly a ‘Guide to PAS 2050’ and ‘PAS 2050:2008 Specification for the assessment of the life cycle greenhouse gas emissions of goods and services’.
According to PAS 2050 there are 5 steps to calculate carbon footprint of a product. Here we attempted to summarize these steps briefly.
Step 1: Building a process map
Build process map of product’s life cycle, from raw materials to disposal, including all material, energy, transport, usage, recycling and waste flows. The goal is to identify all materials, activities and processes that contribute to the chosen product’s life cycle. This process map is a valuable tool and acts as a graphical reference to guide in the collection of data and footprint calculation. To develop a process map start by breaking the product’s functional units into its constituents (e.g. raw materials, packaging) by mass. This can be achieved by available data, consultation, observation and understanding.
For a B2C business model the life cycle of a product that has to be considered for the process map consists of five stages as shown below. For a B2B product the last two stages, consumer use and disposal/recycling must be excluded. B2B product carbon footprints stop at the point at which the product is delivered to another manufacturer, consistent with the ‘cradle-to-gate’ approach
Process map stages for business-to-consumer good
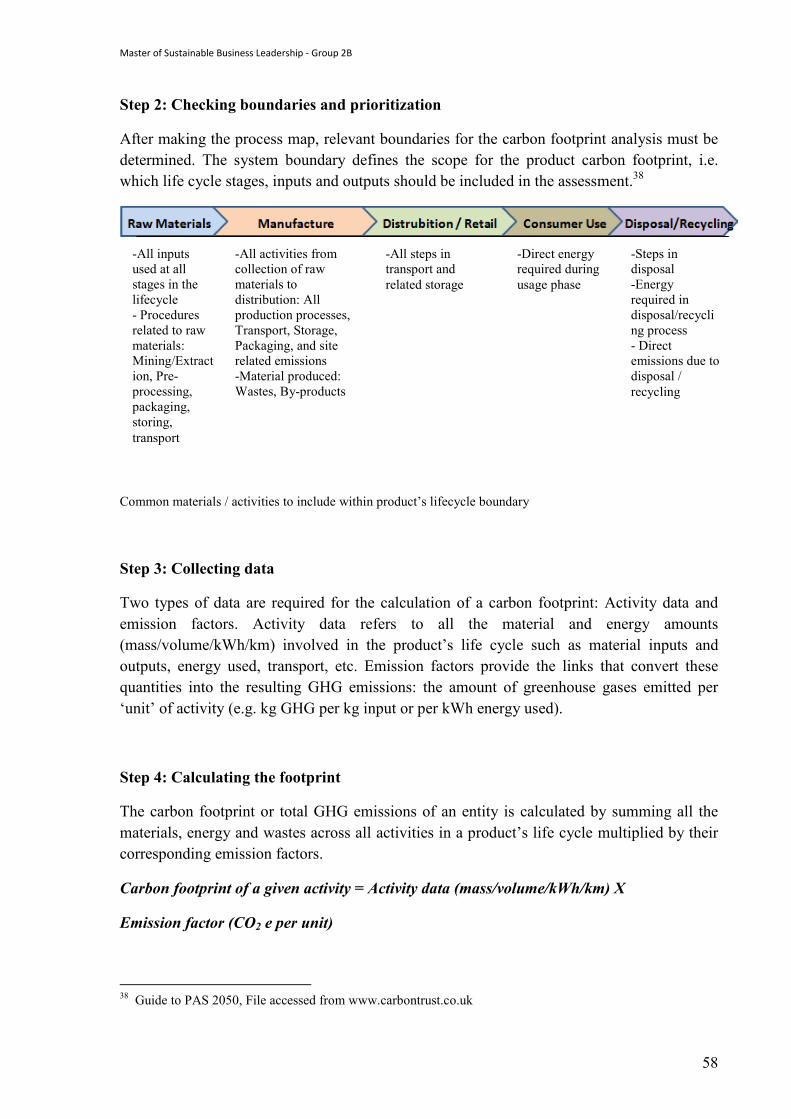
Master of Sustainable Business Leadership - Group 2B
58
Step 2: Checking boundaries and prioritization
After making the process map, relevant boundaries for the carbon footprint analysis must be determined. The system boundary defines the scope for the product carbon footprint, i.e. which life cycle stages, inputs and outputs should be included in the assessment.38
Common materials / activities to include within product’s lifecycle boundary
Step 3: Collecting data
Two types of data are required for the calculation of a carbon footprint: Activity data and emission factors. Activity data refers to all the material and energy amounts (mass/volume/kWh/km) involved in the product’s life cycle such as material inputs and outputs, energy used, transport, etc. Emission factors provide the links that convert these quantities into the resulting GHG emissions: the amount of greenhouse gases emitted per ‘unit’ of activity (e.g. kg GHG per kg input or per kWh energy used).
Step 4: Calculating the footprint
The carbon footprint or total GHG emissions of an entity is calculated by summing all the materials, energy and wastes across all activities in a product’s life cycle multiplied by their corresponding emission factors.
Carbon footprint of a given activity = Activity data (mass/volume/kWh/km) X
Emission factor (CO2 e per unit)
38 Guide to PAS 2050, File accessed from www.carbontrust.co.uk
-All inputs used at all stages in the lifecycle - Procedures related to raw materials: Mining/Extraction, Pre-processing, packaging, storing, transport
-All activities from collection of raw materials to distribution: All production processes, Transport, Storage, Packaging, and site related emissions -Material produced: Wastes, By-products
-All steps in transport and related storage
-Direct energy required during usage phase
-Steps in disposal -Energy required in disposal/recycling process - Direct emissions due to disposal / recycling
Master of Sustainable Business Leadership - Group 2B
59
Carbon emissions from all constituent activities are summed up to get the total GHG emissions or carbon footprint of an entity.
Step 5: Checking uncertainty (optional)
The objective of this step is to measure and minimize uncertainty in the footprint result and to improve the confidence in footprint comparisons and any decisions that are made based on the footprint. Uncertainty can be reduced by replacing secondary data with good quality primary activity data, using more specific, more recent and more reliable data and also by trying to use a realistic model. PAS 2050 does not explicitly require uncertainty analysis39 therefore this is an optional step.
5.3. Carbon footprint of bike rack
We estimated the carbon footprint of a bike rack (ROADWAY 4 BIKE 2" & 1.2, Item # 914), a product of Thule AB, Vehicle Accessories North America according to PAS2050. This product is manufactured at Seymour plant, USA. The other products that are produced in this plant include car racks and boat racks. In most cases, the method PAS2050 with all the prescribed steps cannot be used as it is, because of the data constraints that arise in practice. It has been adapted to this case and some approximations & assumptions had to be made to overcome the data constraints. Wherever an approximation or assumption is made, we had put our best efforts to explain why it is made and how it is made. However we hope that this is the best possible estimate that can be reached for the given conditions. Here we represented the whole process of calculation in few steps.
Process map of bike rack
This process map has been developed based on the data received, consultation and constant updating process until we got complete understanding of lifecycle of the product (Bike rack). All the materials, activities and processes that contribute to the chosen product’s life cycle have been identified and represented. This acted as a graphical reference throughout our calculation process.
39 Ibid.,
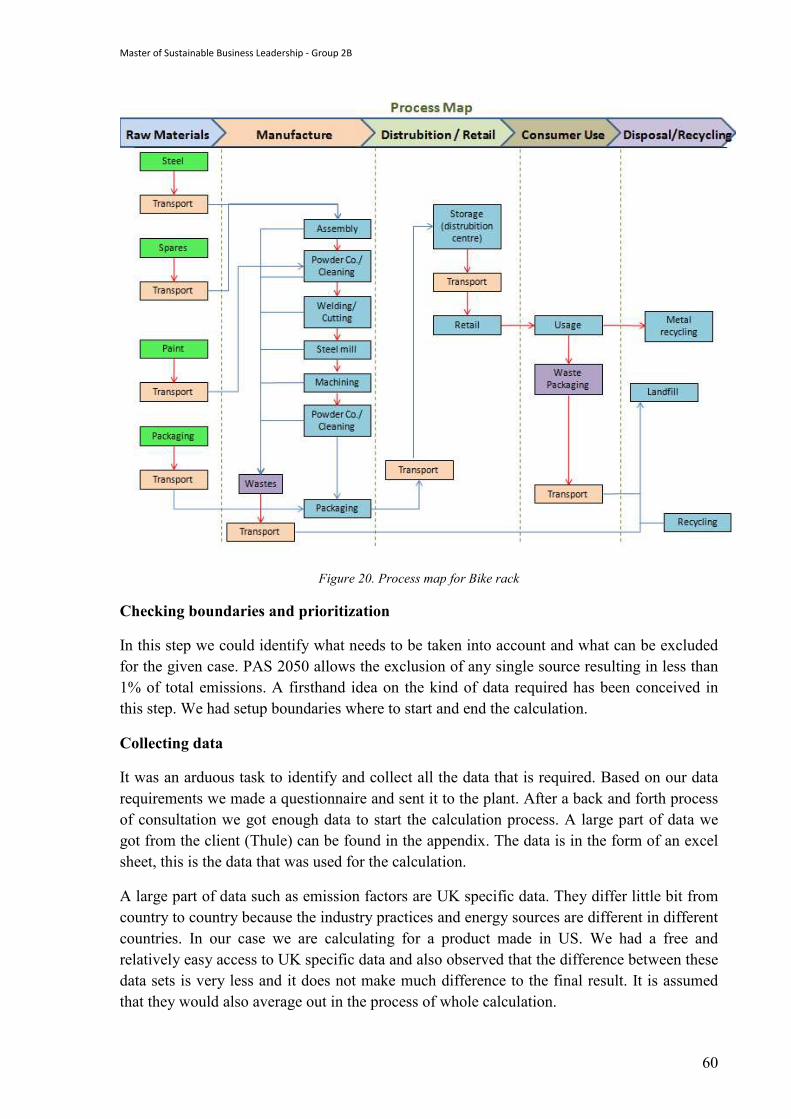
Master of Sustainable Business Leadership - Group 2B
60
Figure 20. Process map for Bike rack
Checking boundaries and prioritization
In this step we could identify what needs to be taken into account and what can be excluded for the given case. PAS 2050 allows the exclusion of any single source resulting in less than 1% of total emissions. A firsthand idea on the kind of data required has been conceived in this step. We had setup boundaries where to start and end the calculation.
Collecting data
It was an arduous task to identify and collect all the data that is required. Based on our data requirements we made a questionnaire and sent it to the plant. After a back and forth process of consultation we got enough data to start the calculation process. A large part of data we got from the client (Thule) can be found in the appendix. The data is in the form of an excel sheet, this is the data that was used for the calculation.
A large part of data such as emission factors are UK specific data. They differ little bit from country to country because the industry practices and energy sources are different in different countries. In our case we are calculating for a product made in US. We had a free and relatively easy access to UK specific data and also observed that the difference between these data sets is very less and it does not make much difference to the final result. It is assumed that they would also average out in the process of whole calculation.
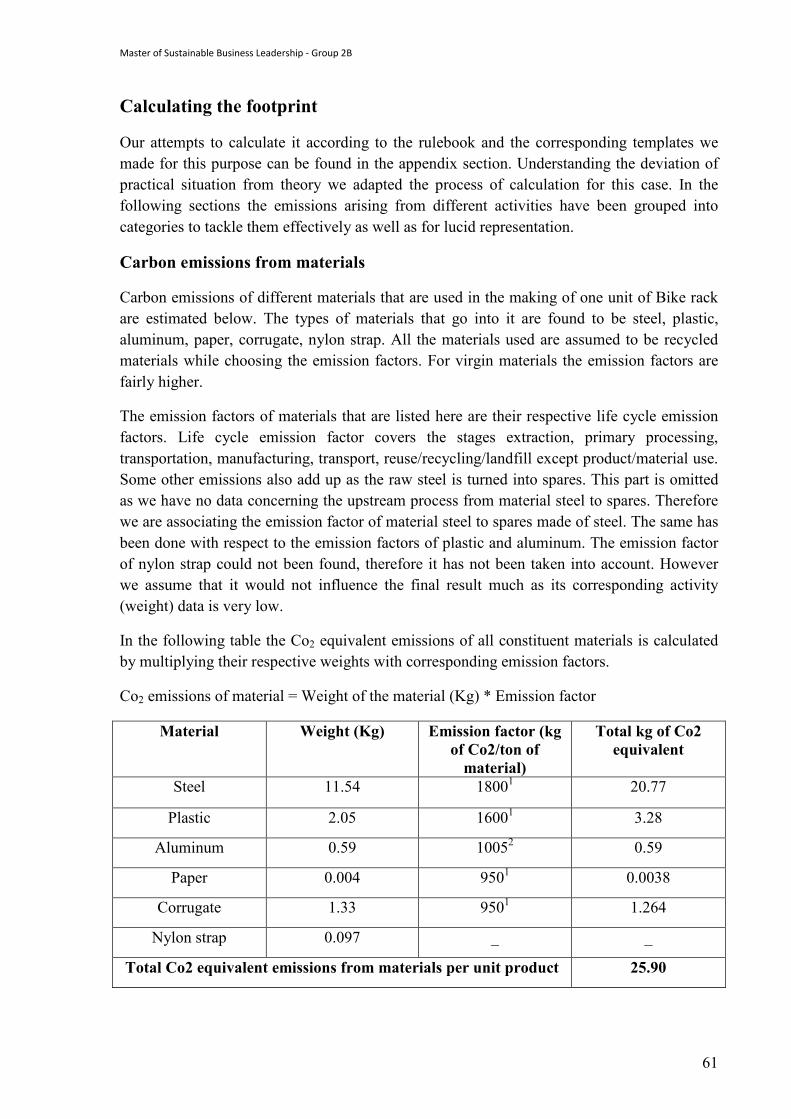
Master of Sustainable Business Leadership - Group 2B
61
Calculating the footprint
Our attempts to calculate it according to the rulebook and the corresponding templates we made for this purpose can be found in the appendix section. Understanding the deviation of practical situation from theory we adapted the process of calculation for this case. In the following sections the emissions arising from different activities have been grouped into categories to tackle them effectively as well as for lucid representation.
Carbon emissions from materials
Carbon emissions of different materials that are used in the making of one unit of Bike rack are estimated below. The types of materials that go into it are found to be steel, plastic, aluminum, paper, corrugate, nylon strap. All the materials used are assumed to be recycled materials while choosing the emission factors. For virgin materials the emission factors are fairly higher.
The emission factors of materials that are listed here are their respective life cycle emission factors. Life cycle emission factor covers the stages extraction, primary processing, transportation, manufacturing, transport, reuse/recycling/landfill except product/material use. Some other emissions also add up as the raw steel is turned into spares. This part is omitted as we have no data concerning the upstream process from material steel to spares. Therefore we are associating the emission factor of material steel to spares made of steel. The same has been done with respect to the emission factors of plastic and aluminum. The emission factor of nylon strap could not been found, therefore it has not been taken into account. However we assume that it would not influence the final result much as its corresponding activity (weight) data is very low.
In the following table the Co2 equivalent emissions of all constituent materials is calculated by multiplying their respective weights with corresponding emission factors.
Co2 emissions of material = Weight of the material (Kg) * Emission factor
Material Weight (Kg) Emission factor (kg of Co2/ton of material)
Total kg of Co2 equivalent
Steel 11.54 18001 20.77
Plastic 2.05 16001 3.28
Aluminum 0.59 10052 0.59
Paper 0.004 9501 0.0038
Corrugate 1.33 9501 1.264
Nylon strap 0.097 _ _
Total Co2 equivalent emissions from materials per unit product 25.90
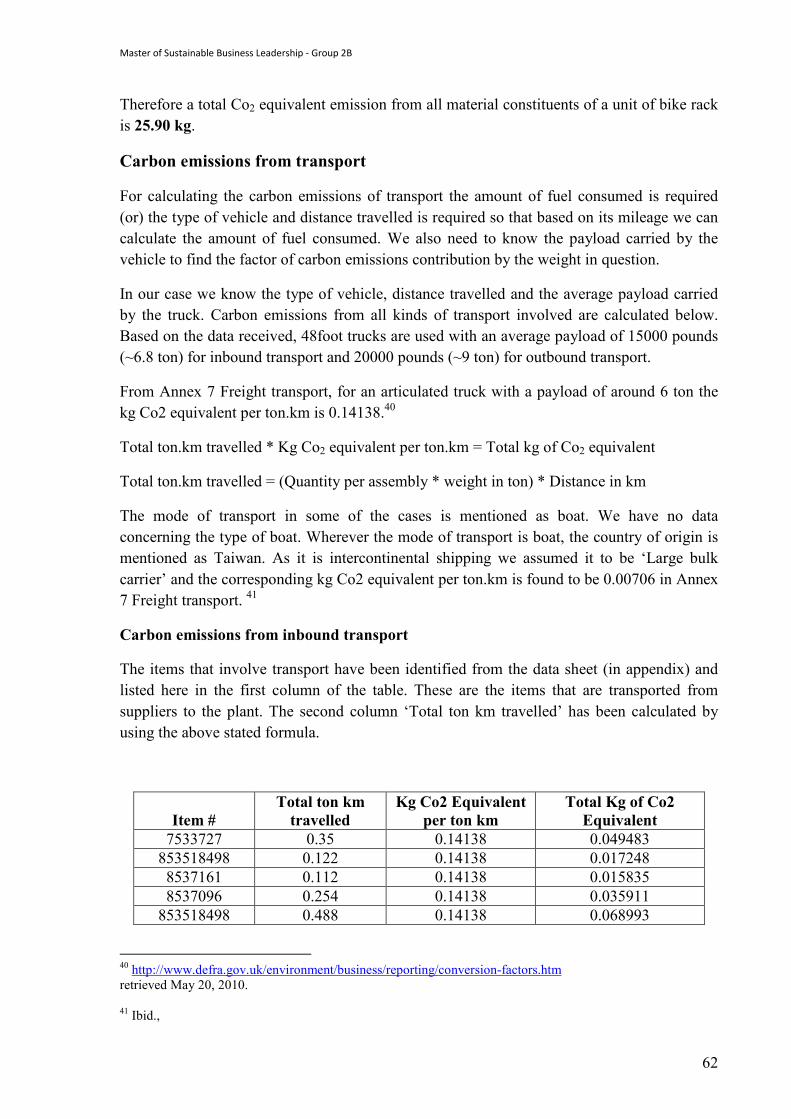
Master of Sustainable Business Leadership - Group 2B
62
Therefore a total Co2 equivalent emission from all material constituents of a unit of bike rack is 25.90 kg.
Carbon emissions from transport
For calculating the carbon emissions of transport the amount of fuel consumed is required (or) the type of vehicle and distance travelled is required so that based on its mileage we can calculate the amount of fuel consumed. We also need to know the payload carried by the vehicle to find the factor of carbon emissions contribution by the weight in question.
In our case we know the type of vehicle, distance travelled and the average payload carried by the truck. Carbon emissions from all kinds of transport involved are calculated below. Based on the data received, 48foot trucks are used with an average payload of 15000 pounds (~6.8 ton) for inbound transport and 20000 pounds (~9 ton) for outbound transport.
From Annex 7 Freight transport, for an articulated truck with a payload of around 6 ton the kg Co2 equivalent per ton.km is 0.14138.40
Total ton.km travelled * Kg Co2 equivalent per ton.km = Total kg of Co2 equivalent
Total ton.km travelled = (Quantity per assembly * weight in ton) * Distance in km
The mode of transport in some of the cases is mentioned as boat. We have no data concerning the type of boat. Wherever the mode of transport is boat, the country of origin is mentioned as Taiwan. As it is intercontinental shipping we assumed it to be ‘Large bulk carrier’ and the corresponding kg Co2 equivalent per ton.km is found to be 0.00706 in Annex 7 Freight transport. 41
Carbon emissions from inbound transport
The items that involve transport have been identified from the data sheet (in appendix) and listed here in the first column of the table. These are the items that are transported from suppliers to the plant. The second column ‘Total ton km travelled’ has been calculated by using the above stated formula.
Item # Total ton km travelled
Kg Co2 Equivalent per ton km
Total Kg of Co2 Equivalent
7533727 0.35 0.14138 0.049483 853518498 0.122 0.14138 0.017248 8537161 0.112 0.14138 0.015835 8537096 0.254 0.14138 0.035911
853518498 0.488 0.14138 0.068993
40 http://www.defra.gov.uk/environment/business/reporting/conversion-factors.htm retrieved May 20, 2010. 41 Ibid.,
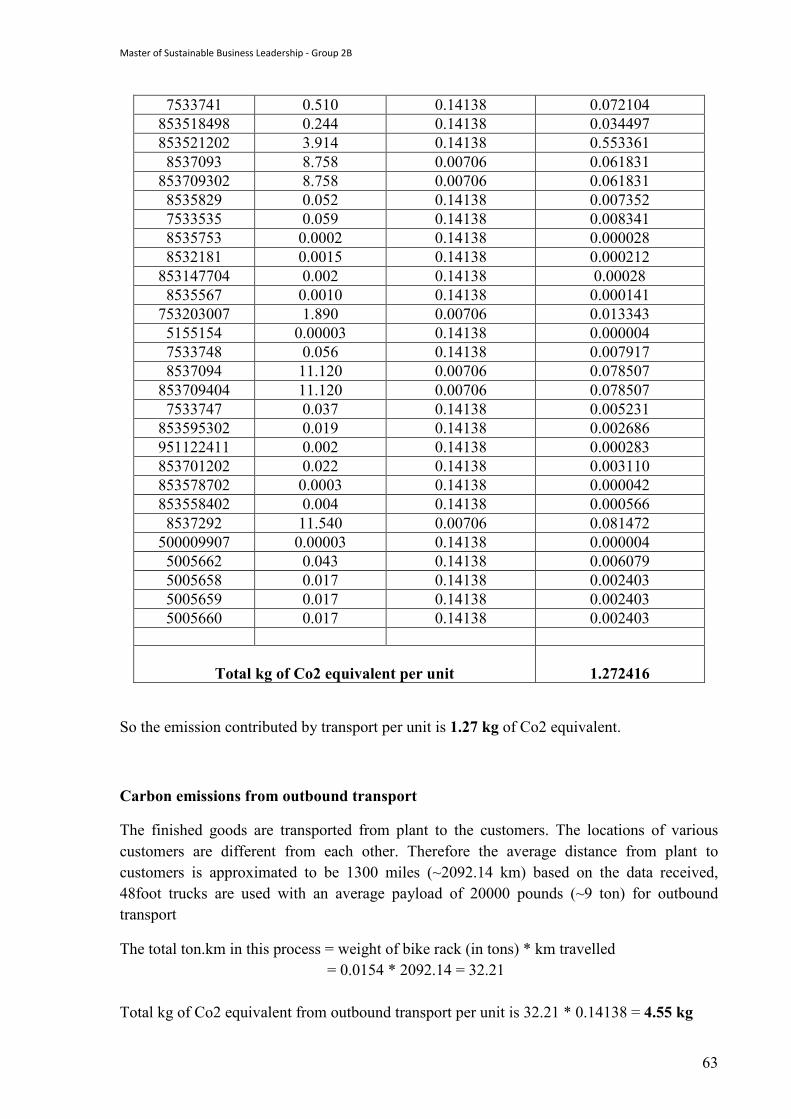
Master of Sustainable Business Leadership - Group 2B
63
7533741 0.510 0.14138 0.072104 853518498 0.244 0.14138 0.034497 853521202 3.914 0.14138 0.553361 8537093 8.758 0.00706 0.061831
853709302 8.758 0.00706 0.061831 8535829 0.052 0.14138 0.007352 7533535 0.059 0.14138 0.008341 8535753 0.0002 0.14138 0.000028 8532181 0.0015 0.14138 0.000212
853147704 0.002 0.14138 0.00028 8535567 0.0010 0.14138 0.000141
753203007 1.890 0.00706 0.013343 5155154 0.00003 0.14138 0.000004 7533748 0.056 0.14138 0.007917 8537094 11.120 0.00706 0.078507
853709404 11.120 0.00706 0.078507 7533747 0.037 0.14138 0.005231
853595302 0.019 0.14138 0.002686 951122411 0.002 0.14138 0.000283 853701202 0.022 0.14138 0.003110 853578702 0.0003 0.14138 0.000042 853558402 0.004 0.14138 0.000566 8537292 11.540 0.00706 0.081472
500009907 0.00003 0.14138 0.000004 5005662 0.043 0.14138 0.006079 5005658 0.017 0.14138 0.002403 5005659 0.017 0.14138 0.002403 5005660 0.017 0.14138 0.002403
Total kg of Co2 equivalent per unit 1.272416
So the emission contributed by transport per unit is 1.27 kg of Co2 equivalent.
Carbon emissions from outbound transport
The finished goods are transported from plant to the customers. The locations of various customers are different from each other. Therefore the average distance from plant to customers is approximated to be 1300 miles (~2092.14 km) based on the data received, 48foot trucks are used with an average payload of 20000 pounds (~9 ton) for outbound transport
The total ton.km in this process = weight of bike rack (in tons) * km travelled = 0.0154 * 2092.14 = 32.21 Total kg of Co2 equivalent from outbound transport per unit is 32.21 * 0.14138 = 4.55 kg
Master of Sustainable Business Leadership - Group 2B
64
Carbon emissions from transport of various wastes generated during the production process
The average distance from the source of these wastes to their respective destinations is 50 miles (80.46 km). Total annual quantity of all types of wastes generated is 395.34 tons. Based on the data received, 48foot trucks are used with an average payload of 20000 pounds (~9 ton) for outbound transport. Therefore 44 times the truck has to travel 80.46km to transport the wastes to their respective destinations. Total ton.km in this process is 9*44*80.46 = 31862.16
Total kg of Co2 equivalent is 31862.16 * 0.14138 = 4504.67 kg
Dividing the above result with the annual unit volume produced in the plant will give us the contribution of emissions by the wastes transport of each product. It is calculated to be 0.005kg
Carbon emissions during the production process
According to the rulebook, carbon emissions for each process step is calculated individually so that if higher emissions are observed in any of the steps corrective measures can be taken in that step to reduce the emissions. But such a calculation is almost impossible to make as the energy consumed for each process step is difficult to ascertain.
The next best alternative is to calculate the carbon emissions from the product specific energy data, which means the total energy consumed by the finished product all through the various stages of its production process. The carbon emissions can be correctly measured but it is not possible to estimate the emissions in each step and take corrective measures.
In our case only the annual energy consumption of the plant and annual unit volume of production are available. Dividing the annual energy consumption by annual unit volume give the energy consumed in the making of single unit. Even though different types of products (in our case car racks, bike racks, boat racks) in the plant consume energy in different proportions during the production process, the energy consumption of each unit is approximated to be same.
Water supply also has a carbon emission factor. From the data it can be inferred that in the Seymour plant water is used for sanitary purposes and not for production purpose. Therefore the GHG emissions of water supply can be excluded in this case. These emissions need to be taken into account while calculating organizational carbon footprint.
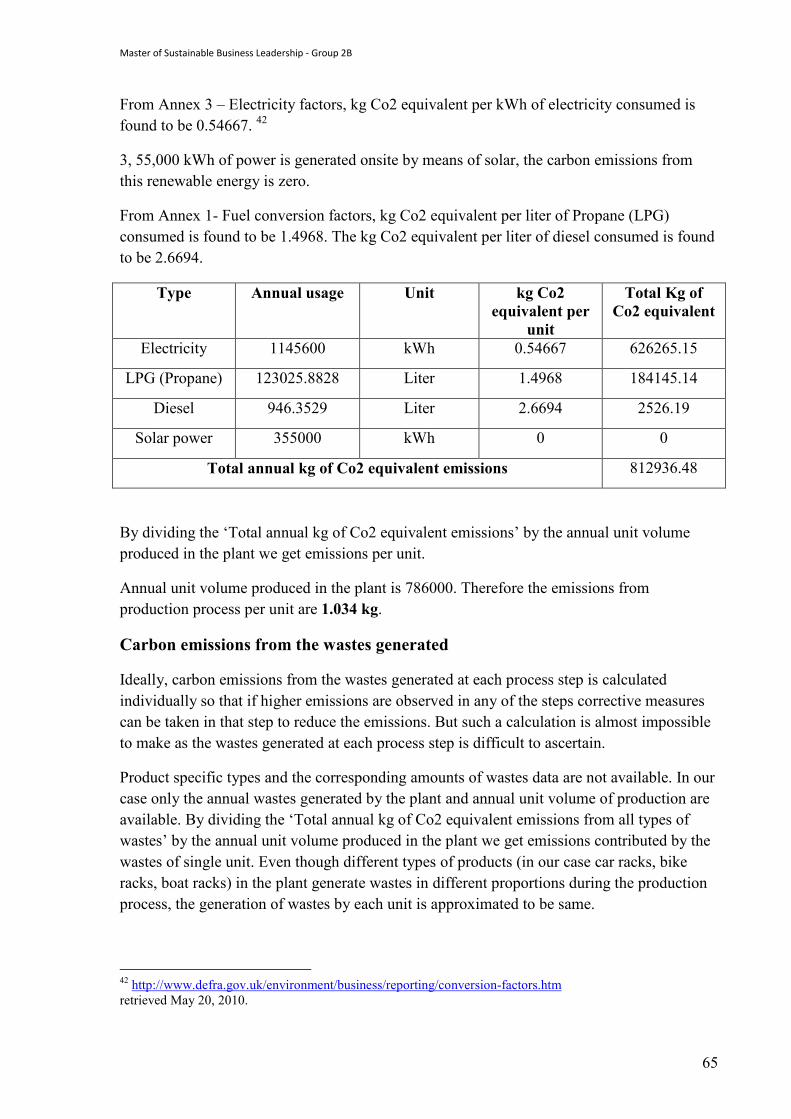
Master of Sustainable Business Leadership - Group 2B
65
From Annex 3 – Electricity factors, kg Co2 equivalent per kWh of electricity consumed is found to be 0.54667. 42
3, 55,000 kWh of power is generated onsite by means of solar, the carbon emissions from this renewable energy is zero.
From Annex 1- Fuel conversion factors, kg Co2 equivalent per liter of Propane (LPG) consumed is found to be 1.4968. The kg Co2 equivalent per liter of diesel consumed is found to be 2.6694.
Type Annual usage Unit kg Co2 equivalent per
unit
Total Kg of Co2 equivalent
Electricity 1145600 kWh 0.54667 626265.15
LPG (Propane) 123025.8828 Liter 1.4968 184145.14
Diesel 946.3529 Liter 2.6694 2526.19
Solar power 355000 kWh 0 0
Total annual kg of Co2 equivalent emissions 812936.48
By dividing the ‘Total annual kg of Co2 equivalent emissions’ by the annual unit volume produced in the plant we get emissions per unit.
Annual unit volume produced in the plant is 786000. Therefore the emissions from production process per unit are 1.034 kg.
Carbon emissions from the wastes generated
Ideally, carbon emissions from the wastes generated at each process step is calculated individually so that if higher emissions are observed in any of the steps corrective measures can be taken in that step to reduce the emissions. But such a calculation is almost impossible to make as the wastes generated at each process step is difficult to ascertain.
Product specific types and the corresponding amounts of wastes data are not available. In our case only the annual wastes generated by the plant and annual unit volume of production are available. By dividing the ‘Total annual kg of Co2 equivalent emissions from all types of wastes’ by the annual unit volume produced in the plant we get emissions contributed by the wastes of single unit. Even though different types of products (in our case car racks, bike racks, boat racks) in the plant generate wastes in different proportions during the production process, the generation of wastes by each unit is approximated to be same.
42 http://www.defra.gov.uk/environment/business/reporting/conversion-factors.htm retrieved May 20, 2010.
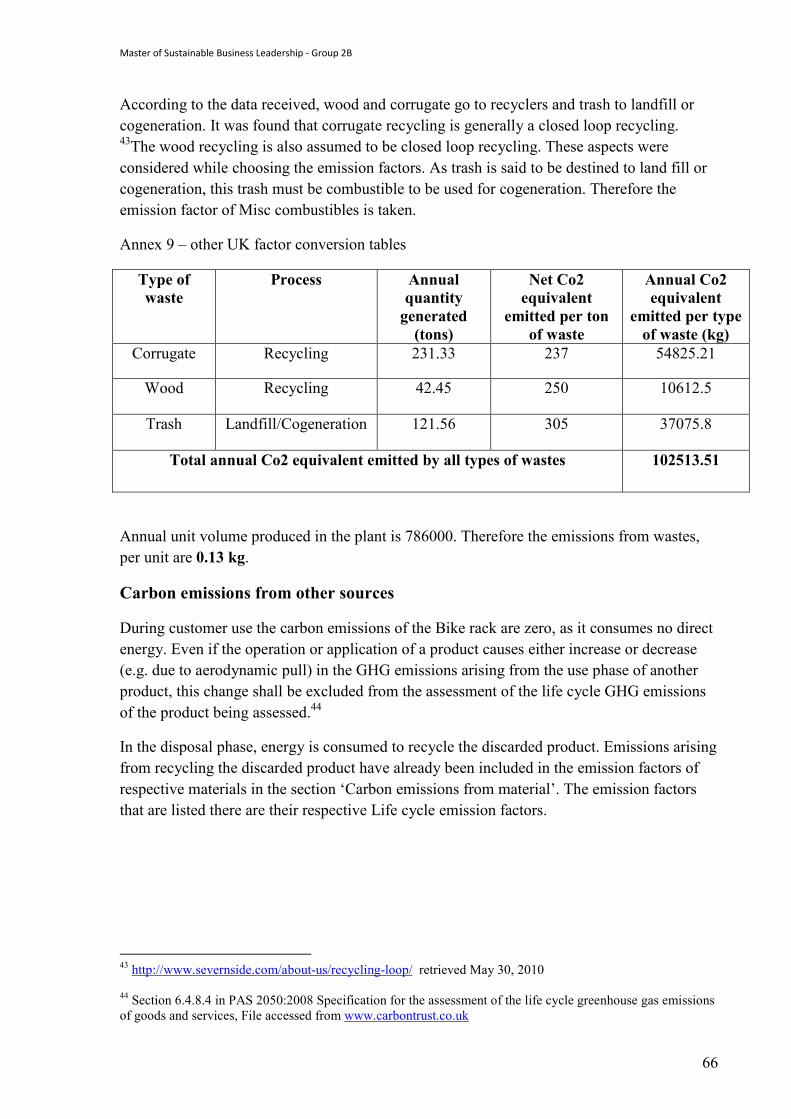
Master of Sustainable Business Leadership - Group 2B
66
According to the data received, wood and corrugate go to recyclers and trash to landfill or cogeneration. It was found that corrugate recycling is generally a closed loop recycling. 43The wood recycling is also assumed to be closed loop recycling. These aspects were considered while choosing the emission factors. As trash is said to be destined to land fill or cogeneration, this trash must be combustible to be used for cogeneration. Therefore the emission factor of Misc combustibles is taken.
Annex 9 – other UK factor conversion tables
Type of waste
Process Annual quantity generated (tons)
Net Co2 equivalent
emitted per ton of waste
Annual Co2 equivalent
emitted per type of waste (kg)
Corrugate Recycling 231.33 237 54825.21
Wood Recycling 42.45 250 10612.5
Trash Landfill/Cogeneration 121.56 305 37075.8
Total annual Co2 equivalent emitted by all types of wastes 102513.51
Annual unit volume produced in the plant is 786000. Therefore the emissions from wastes, per unit are 0.13 kg.
Carbon emissions from other sources
During customer use the carbon emissions of the Bike rack are zero, as it consumes no direct energy. Even if the operation or application of a product causes either increase or decrease (e.g. due to aerodynamic pull) in the GHG emissions arising from the use phase of another product, this change shall be excluded from the assessment of the life cycle GHG emissions of the product being assessed.44
In the disposal phase, energy is consumed to recycle the discarded product. Emissions arising from recycling the discarded product have already been included in the emission factors of respective materials in the section ‘Carbon emissions from material’. The emission factors that are listed there are their respective Life cycle emission factors.
43 http://www.severnside.com/about-us/recycling-loop/ retrieved May 30, 2010 44 Section 6.4.8.4 in PAS 2050:2008 Specification for the assessment of the life cycle greenhouse gas emissions of goods and services, File accessed from www.carbontrust.co.uk
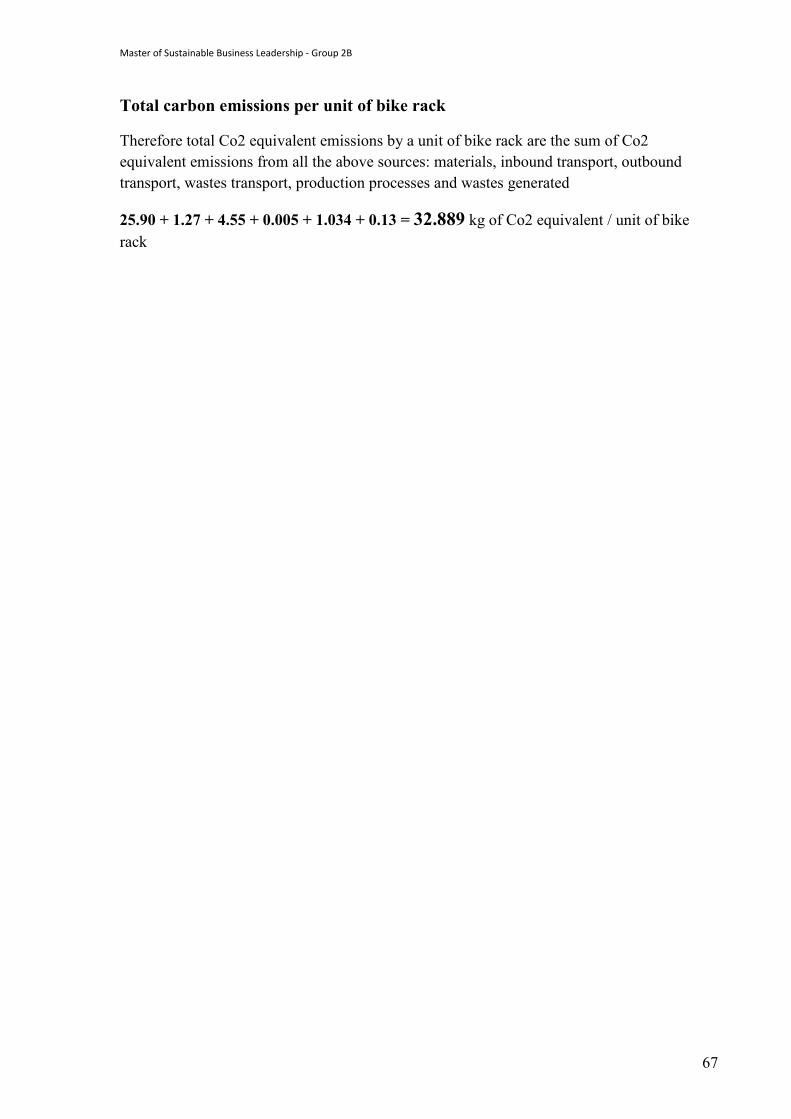
Master of Sustainable Business Leadership - Group 2B
67
Total carbon emissions per unit of bike rack
Therefore total Co2 equivalent emissions by a unit of bike rack are the sum of Co2 equivalent emissions from all the above sources: materials, inbound transport, outbound transport, wastes transport, production processes and wastes generated
25.90 + 1.27 + 4.55 + 0.005 + 1.034 + 0.13 = 32.889 kg of Co2 equivalent / unit of bike rack
Master of Sustainable Business Leadership - Group 2B
68
Conclusion Our task for this project was to act as sustainability consultants for THULE. We embarked on this project by gathering information required for building our practices and awareness questionnaire. We had to make sure to choose the right type of questions so that the data captured would be valid and reliable. Our data gathering, though a bit slow at the start, went well, thanks to the cooperation of THULE. The data captured through the Practices questionnaires illustrate that some of the THULE plants are already engaging in sustainable practices. Most of these efforts are seen to be directed towards efficient use of energy and waste management. The societal aspect of sustainability has proven to be the area where the least is being done. From the Awareness questionnaire, we observed that 50% of the THULE employees demonstrated a fair understanding of what the concept of sustainability is about. Most of the employees associated the word sustainability mostly with its environmental aspect. The THULE employees suggested that better awareness and training programs would provide them with the knowledge required to engage in more sustainable practices. Part of our consultancy task, required us to calculate the carbon footprint of a THULE product. This work required a lot of research and understanding about the methods and tools required for the carbon footprint calculation of a product. We hope that our work will provide THULE with a baseline for moving forward in the sustainability direction. Future work Practices questionnaire In this project, the sustainable practices at various plants have been identified, compiled, analyzed and represented in the form of charts & tables. This refined data can aid Thule to understand to what extent it has been following sustainable practices and what more can be done. Awareness questionnaire From the analysis, charts & tables represented in this project, the awareness level & perception of Thule employees on sustainability can be inferred. This inference would probably aid Thule in understanding and decision making concerning various aspects of sustainability and its effect on its employees. Carbon footprint calculation of bike rack From the calculation the carbon emissions from various sources all through the life cycle of a bike rack are clearly evident. Based on this emissions data, identify if any appropriate measures can be taken to decrease the carbon emissions at any of the stages.
Master of Sustainable Business Leadership - Group 2B
69
Bibliography:
1. Charter, Martin and Tischner, Ursula, ‘Sustainable Solutions : Developing Products and Services for the Future’, Greenleaf Publishing 2001
2. World Commission on Environment Development, ‘Our Common Future’ , New
York : Oxford University Press, 1987 3. Adams, W.M, “The Future of Sustainability :Re-thinking Environment and
Development in the Twenty-first Century”, ICUN, The World Conservation Union 4. Dillard, Jesse, Dujon Veronica, King, C, Mary, “Understanding the Social Dimension
of Sustainability”, Routledge Publishing, (2009), ISBN10 :0-203-89297-6, Google Book Search, Retrieved on 1st June 2010
5. Willums, Jan-Olaf, The World Business Council for Sustainable Development, ‘The
Sustainable Business Challenge : A briefing for tomorrow’s business leaders’, Greenleaf Publishing, 1998
6. Kotler, Phillip & Lee, Nancy, “Corporate Social Responsibility: Doing the most good
for Your Company”, Pg4, Wiley & Sons, 2005 7. Berger et al, 2007, “Mainstreaming Corporate Social Responsibility: Developing
Markets for Virtue”, California Management Review, VOL. 49, NO. 4, (132-157) 8. Zink J, Klaus, Steimle Ulrich, Fisher Klaus, ‘Human Factors, Business Excellence
and Corporate Sustainability : Differing Perspectives, Joint Objectives’ , 2008 9. Dyllick T, Hockerts K , ‘Beyond the Business Case for Corporate Sustainability.
Business Strategy and the Environment 11:130-141’, 2002 10. Stimle U, Zink KJ, ‘Sustainable Development and Human Factors.’ International
Encyclopaedia of Ergonomics and Human Factors, 2nd edn, Taylor & Francis, pp2258-3363, (2006)
11. THULE Sweden Official Website
http://www.thule.com/en/US/About%20Thule/Company%20Facts/Our%20Structure.aspx, Retrieved 1st June 2010
12. Neuman Lawrence, W. “Basics of Social Research : Qualitative and Quantitative
Approaches”, Second Edition, Pearson Education Inc, Pg129
13. University of Tennessee, Knoxville, Course IS 540: Research Methods, given by William C. Robinson <http://web.utk.edu/~wrobinso/540_lec_qaire.html>, accessed on 25th May 2010
14. Venderstoep Scott, & Johnston Diedre, “Research Methods for Everyday life:
Blending Qualitative and Quantitative Approaches” Pg 59
15. Roberts Jane, “Environmental Policy”, Pg 2, Routledge, 2004
Master of Sustainable Business Leadership - Group 2B
70
16. International Organization for Standardization website <http://www.iso.org/iso/iso_catalogue/management_standards/iso_9000_iso_14000.htm> accessed on 30th May 2010
17. American Nation Standards Institute http://www.ansi.org/, Accessed on 30th May
2010\
18. Hendrickson Chris, Lave B Lester, Matthews Scott H, “Environmental Life Cycle Assessment of Goods and Services :Ain Input-Output Approach”,Pg3-4, Resources for the Future, 2006
19. The Sustainability Purchasing Network, www.buysmartbc.com, accessed on 30th May 2010
20. Social Compliance, http://www.socialcompliance.org/vision.htm, accessed on 31st
May 2010
21. Dillard, Jesse, Dujon Veronica, King, C, Mary, “Understanding the Social Dimension of Sustainability”, Routledge Publishing, (2009), ISBN10 :0-203-89297-6, Google Book Search, Retrieved on 1st June 2010
22. Collins English Dictionary, http://www.collinslanguage.com/results.aspx, Retrieved
on 1st June 2010
23. MIT Sloan, Management Review, Interview with Peter Senge, Senior Lecturer in Behavioural and Policy Sciences at MIT Sloan School of Management http://sloanreview.mit.edu/beyond-green/sustainability-its-not-what-you-think-it-is/, Retrieved on 2nd June 2010
24. http://www.carbontrust.co.uk/cut-carbon-reduce-costs/calculate/carbon-
footprinting/pages/carbon-footprinting.aspx retrieved on May 28th 2010.
25. Annex 9 – Other UK conversion factor tableshttp://www.defra.gov.uk/environment/business/reporting/conversion-factors.htm retrieved May 20, 2010.
26. Emission factor database www.naei.org.uk/emissions/selection.php retrieved May 24,
2010 27. calculation: 420 kg of Co2 / ton + 102 kg of CO / ton + 0.9 kg of NO2 / ton, GWP of
CO is 3 and NO2 is 310. Therefore total Co2 equivalent is 420 + 3*102 + 310*0.9 = 1005 kg of Co2 eq/ton
28. http://www.severnside.com/about-us/recycling-loop/ retrieved May 30, 2010
29. http://www.carbontrust.co.uk/cut-carbon-reduce-costs/calculate/carbon-
footprinting/pages/product-carbon-footprint.aspx retrieved May 29, 2010 30. Guide to PAS 2050, File accessed from www.carbontrust.co.uk
Master of Sustainable Business Leadership - Group 2B
71
31. Section 6.4.8.4 in PAS 2050:2008 Specification for the assessment of the life cycle greenhouse gas emissions of goods and services, File accessed from www.carbontrust.co.uk
32. http://www.defra.gov.uk/environment/business/reporting/conversion-factors.htm retrieved May 20, 2010.
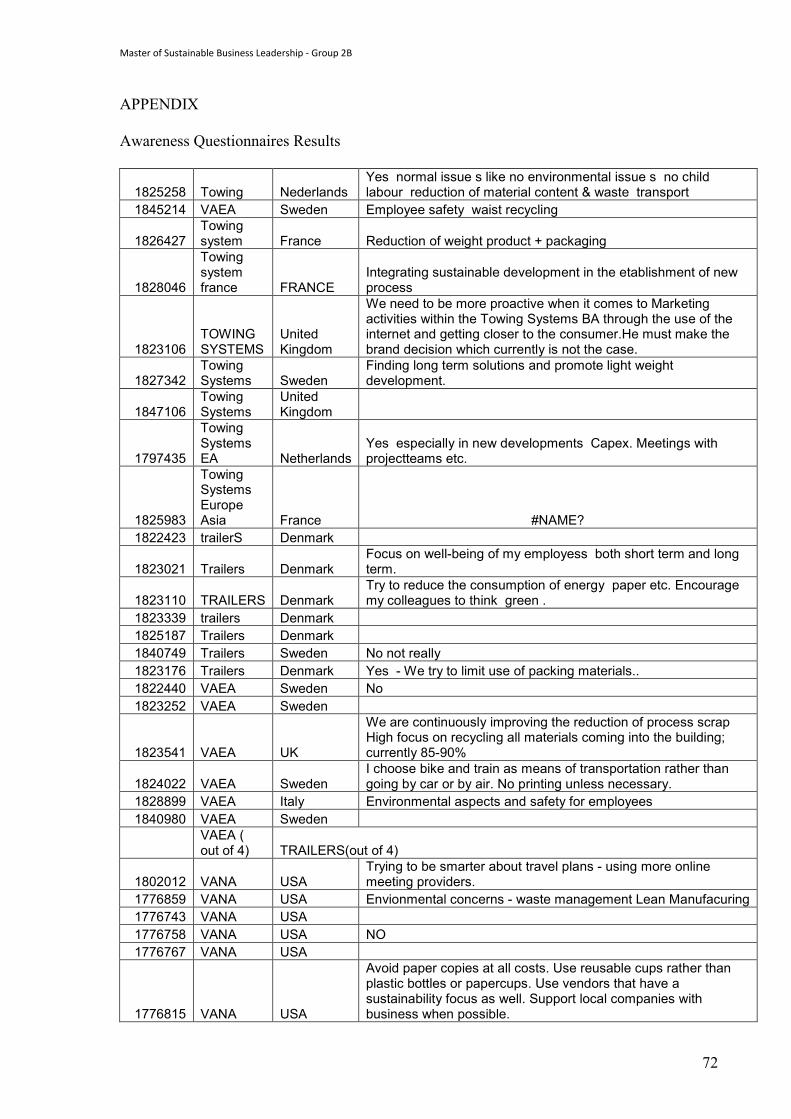
Master of Sustainable Business Leadership - Group 2B
72
APPENDIX Awareness Questionnaires Results
1825258 Towing Nederlands Yes normal issue s like no environmental issue s no child labour reduction of material content & waste transport
1845214 VAEA Sweden Employee safety waist recycling
1826427 Towing system France Reduction of weight product + packaging
1828046
Towing system france FRANCE
Integrating sustainable development in the etablishment of new process
1823106 TOWING SYSTEMS
United Kingdom
We need to be more proactive when it comes to Marketing activities within the Towing Systems BA through the use of the internet and getting closer to the consumer.He must make the brand decision which currently is not the case.
1827342 Towing Systems Sweden
Finding long term solutions and promote light weight development.
1847106 Towing Systems
United Kingdom
1797435
Towing Systems EA Netherlands
Yes especially in new developments Capex. Meetings with projectteams etc.
1825983
Towing Systems Europe Asia France #NAME?
1822423 trailerS Denmark
1823021 Trailers Denmark Focus on well-being of my employess both short term and long term.
1823110 TRAILERS Denmark Try to reduce the consumption of energy paper etc. Encourage my colleagues to think green .
1823339 trailers Denmark 1825187 Trailers Denmark 1840749 Trailers Sweden No not really 1823176 Trailers Denmark Yes - We try to limit use of packing materials.. 1822440 VAEA Sweden No 1823252 VAEA Sweden
1823541 VAEA UK
We are continuously improving the reduction of process scrap High focus on recycling all materials coming into the building; currently 85-90%
1824022 VAEA Sweden I choose bike and train as means of transportation rather than going by car or by air. No printing unless necessary.
1828899 VAEA Italy Environmental aspects and safety for employees 1840980 VAEA Sweden
VAEA ( out of 4) TRAILERS(out of 4)
1802012 VANA USA Trying to be smarter about travel plans - using more online meeting providers.
1776859 VANA USA Envionmental concerns - waste management Lean Manufacuring 1776743 VANA USA 1776758 VANA USA NO 1776767 VANA USA
1776815 VANA USA
Avoid paper copies at all costs. Use reusable cups rather than plastic bottles or papercups. Use vendors that have a sustainability focus as well. Support local companies with business when possible.
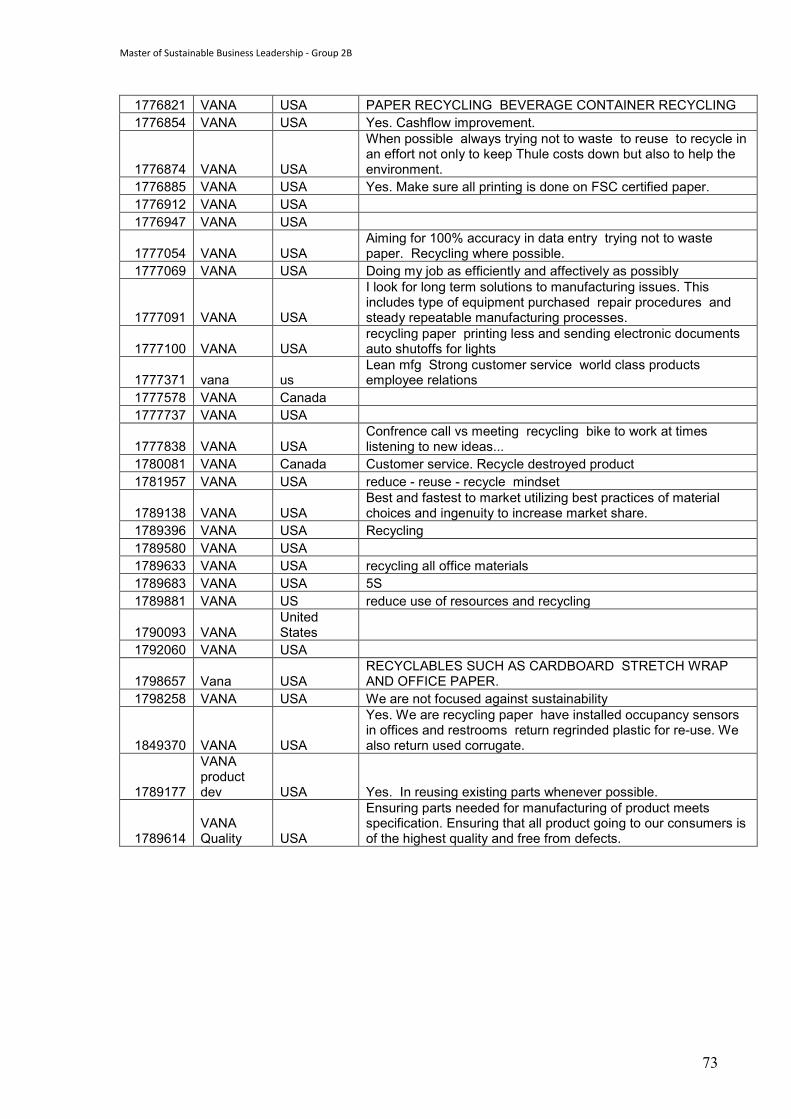
Master of Sustainable Business Leadership - Group 2B
73
1776821 VANA USA PAPER RECYCLING BEVERAGE CONTAINER RECYCLING 1776854 VANA USA Yes. Cashflow improvement.
1776874 VANA USA
When possible always trying not to waste to reuse to recycle in an effort not only to keep Thule costs down but also to help the environment.
1776885 VANA USA Yes. Make sure all printing is done on FSC certified paper. 1776912 VANA USA 1776947 VANA USA
1777054 VANA USA Aiming for 100% accuracy in data entry trying not to waste paper. Recycling where possible.
1777069 VANA USA Doing my job as efficiently and affectively as possibly
1777091 VANA USA
I look for long term solutions to manufacturing issues. This includes type of equipment purchased repair procedures and steady repeatable manufacturing processes.
1777100 VANA USA recycling paper printing less and sending electronic documents auto shutoffs for lights
1777371 vana us Lean mfg Strong customer service world class products employee relations
1777578 VANA Canada 1777737 VANA USA
1777838 VANA USA Confrence call vs meeting recycling bike to work at times listening to new ideas...
1780081 VANA Canada Customer service. Recycle destroyed product 1781957 VANA USA reduce - reuse - recycle mindset
1789138 VANA USA Best and fastest to market utilizing best practices of material choices and ingenuity to increase market share.
1789396 VANA USA Recycling 1789580 VANA USA 1789633 VANA USA recycling all office materials 1789683 VANA USA 5S 1789881 VANA US reduce use of resources and recycling
1790093 VANA United States
1792060 VANA USA
1798657 Vana USA RECYCLABLES SUCH AS CARDBOARD STRETCH WRAP AND OFFICE PAPER.
1798258 VANA USA We are not focused against sustainability
1849370 VANA USA
Yes. We are recycling paper have installed occupancy sensors in offices and restrooms return regrinded plastic for re-use. We also return used corrugate.
1789177
VANA product dev USA Yes. In reusing existing parts whenever possible.
1789614 VANA Quality USA
Ensuring parts needed for manufacturing of product meets specification. Ensuring that all product going to our consumers is of the highest quality and free from defects.
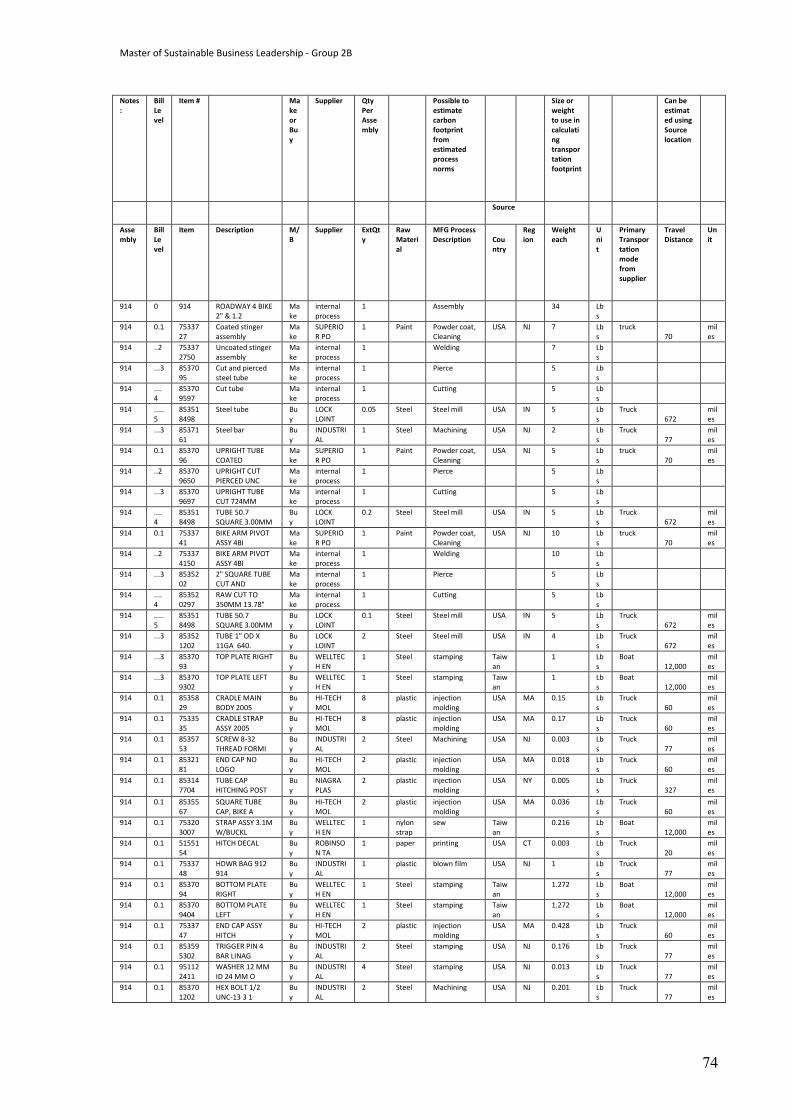
Master of Sustainable Business Leadership - Group 2B
74
Notes:
Bill Level
Item # Make or Buy
Supplier Qty Per Assembly
Possible to estimate carbon footprint from estimated process norms
Size or weight to use in calculating transportation footprint
Can be estimated using Source location
Source
Assembly
Bill Level
Item Description M/B
Supplier ExtQty
Raw Material
MFG Process Description
Country
Region
Weight each
Unit
Primary Transportation mode from supplier
Travel Distance
Unit
914 0 914 ROADWAY 4 BIKE 2" & 1.2
Make
internal process
1 Assembly 34 Lbs
914 0.1 7533727
Coated stinger assembly
Make
SUPERIOR PO
1 Paint Powder coat, Cleaning
USA NJ 7 Lbs
truck 70
miles
914 ..2 753372750
Uncoated stinger assembly
Make
internal process
1 Welding 7 Lbs
914 ...3 8537095
Cut and pierced steel tube
Make
internal process
1 Pierce 5 Lbs
914 ....4
853709597
Cut tube Make
internal process
1 Cutting 5 Lbs
914 .....5
853518498
Steel tube Buy
LOCK LOINT
0.05 Steel Steel mill USA IN 5 Lbs
Truck 672
miles
914 ...3 8537161
Steel bar Buy
INDUSTRIAL
1 Steel Machining USA NJ 2 Lbs
Truck 77
miles
914 0.1 8537096
UPRIGHT TUBE COATED
Make
SUPERIOR PO
1 Paint Powder coat, Cleaning
USA NJ 5 Lbs
truck 70
miles
914 ..2 853709650
UPRIGHT CUT PIERCED UNC
Make
internal process
1 Pierce 5 Lbs
914 ...3 853709697
UPRIGHT TUBE CUT 724MM
Make
internal process
1 Cutting 5 Lbs
914 ....4
853518498
TUBE 50.7 SQUARE 3.00MM
Buy
LOCK LOINT
0.2 Steel Steel mill USA IN 5 Lbs
Truck 672
miles
914 0.1 7533741
BIKE ARM PIVOT ASSY 4BI
Make
SUPERIOR PO
1 Paint Powder coat, Cleaning
USA NJ 10 Lbs
truck 70
miles
914 ..2 753374150
BIKE ARM PIVOT ASSY 4BI
Make
internal process
1 Welding 10 Lbs
914 ...3 8535202
2" SQUARE TUBE CUT AND
Make
internal process
1 Pierce 5 Lbs
914 ....4
853520297
RAW CUT TO 350MM 13.78"
Make
internal process
1 Cutting 5 Lbs
914 .....5
853518498
TUBE 50.7 SQUARE 3.00MM
Buy
LOCK LOINT
0.1 Steel Steel mill USA IN 5 Lbs
Truck 672
miles
914 ...3 853521202
TUBE 1" OD X 11GA 640.
Buy
LOCK LOINT
2 Steel Steel mill USA IN 4 Lbs
Truck 672
miles
914 ...3 8537093
TOP PLATE RIGHT Buy
WELLTECH EN
1 Steel stamping Taiwan
1 Lbs
Boat 12,000
miles
914 ...3 853709302
TOP PLATE LEFT Buy
WELLTECH EN
1 Steel stamping Taiwan
1 Lbs
Boat 12,000
miles
914 0.1 8535829
CRADLE MAIN BODY 2005
Buy
HI-TECH MOL
8 plastic injection molding
USA MA 0.15 Lbs
Truck 60
miles
914 0.1 7533535
CRADLE STRAP ASSY 2005
Buy
HI-TECH MOL
8 plastic injection molding
USA MA 0.17 Lbs
Truck 60
miles
914 0.1 8535753
SCREW 8-32 THREAD FORMI
Buy
INDUSTRIAL
2 Steel Machining USA NJ 0.003 Lbs
Truck 77
miles
914 0.1 8532181
END CAP NO LOGO
Buy
HI-TECH MOL
2 plastic injection molding
USA MA 0.018 Lbs
Truck 60
miles
914 0.1 853147704
TUBE CAP HITCHING POST
Buy
NIAGRA PLAS
2 plastic injection molding
USA NY 0.005 Lbs
Truck 327
miles
914 0.1 8535567
SQUARE TUBE CAP, BIKE A
Buy
HI-TECH MOL
2 plastic injection molding
USA MA 0.036 Lbs
Truck 60
miles
914 0.1 753203007
STRAP ASSY 3.1M W/BUCKL
Buy
WELLTECH EN
1 nylon strap
sew Taiwan
0.216 Lbs
Boat 12,000
miles
914 0.1 5155154
HITCH DECAL Buy
ROBINSON TA
1 paper printing USA CT 0.003 Lbs
Truck 20
miles
914 0.1 7533748
HDWR BAG 912 914
Buy
INDUSTRIAL
1 plastic blown film USA NJ 1 Lbs
Truck 77
miles
914 0.1 8537094
BOTTOM PLATE RIGHT
Buy
WELLTECH EN
1 Steel stamping Taiwan
1.272 Lbs
Boat 12,000
miles
914 0.1 853709404
BOTTOM PLATE LEFT
Buy
WELLTECH EN
1 Steel stamping Taiwan
1.272 Lbs
Boat 12,000
miles
914 0.1 7533747
END CAP ASSY HITCH
Buy
HI-TECH MOL
2 plastic injection molding
USA MA 0.428 Lbs
Truck 60
miles
914 0.1 853595302
TRIGGER PIN 4 BAR LINAG
Buy
INDUSTRIAL
2 Steel stamping USA NJ 0.176 Lbs
Truck 77
miles
914 0.1 951122411
WASHER 12 MM ID 24 MM O
Buy
INDUSTRIAL
4 Steel stamping USA NJ 0.013 Lbs
Truck 77
miles
914 0.1 853701202
HEX BOLT 1/2 UNC-13 3 1
Buy
INDUSTRIAL
2 Steel Machining USA NJ 0.201 Lbs
Truck 77
miles
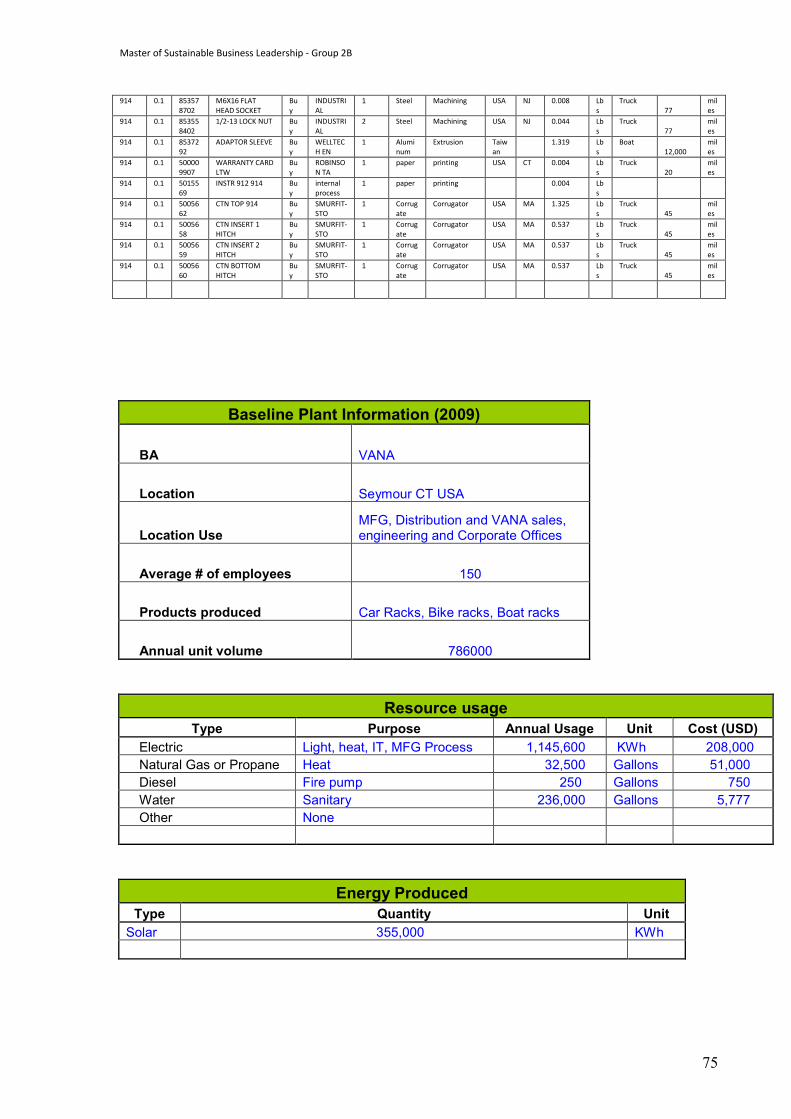
Master of Sustainable Business Leadership - Group 2B
75
914 0.1 853578702
M6X16 FLAT HEAD SOCKET
Buy
INDUSTRIAL
1 Steel Machining USA NJ 0.008 Lbs
Truck 77
miles
914 0.1 853558402
1/2-13 LOCK NUT Buy
INDUSTRIAL
2 Steel Machining USA NJ 0.044 Lbs
Truck 77
miles
914 0.1 8537292
ADAPTOR SLEEVE Buy
WELLTECH EN
1 Aluminum
Extrusion Taiwan
1.319 Lbs
Boat 12,000
miles
914 0.1 500009907
WARRANTY CARD LTW
Buy
ROBINSON TA
1 paper printing USA CT 0.004 Lbs
Truck 20
miles
914 0.1 5015569
INSTR 912 914 Buy
internal process
1 paper printing 0.004 Lbs
914 0.1 5005662
CTN TOP 914 Buy
SMURFIT-STO
1 Corrugate
Corrugator USA MA 1.325 Lbs
Truck 45
miles
914 0.1 5005658
CTN INSERT 1 HITCH
Buy
SMURFIT-STO
1 Corrugate
Corrugator USA MA 0.537 Lbs
Truck 45
miles
914 0.1 5005659
CTN INSERT 2 HITCH
Buy
SMURFIT-STO
1 Corrugate
Corrugator USA MA 0.537 Lbs
Truck 45
miles
914 0.1 5005660
CTN BOTTOM HITCH
Buy
SMURFIT-STO
1 Corrugate
Corrugator USA MA 0.537 Lbs
Truck 45
miles
Baseline Plant Information (2009)
BA VANA
Location Seymour CT USA
Location Use MFG, Distribution and VANA sales, engineering and Corporate Offices
Average # of employees 150
Products produced Car Racks, Bike racks, Boat racks
Annual unit volume 786000
Resource usage Type Purpose Annual Usage Unit Cost (USD)
Electric Light, heat, IT, MFG Process 1,145,600 KWh 208,000 Natural Gas or Propane Heat 32,500 Gallons 51,000 Diesel Fire pump 250 Gallons 750 Water Sanitary 236,000 Gallons 5,777 Other None
Energy Produced Type Quantity Unit Solar 355,000 KWh
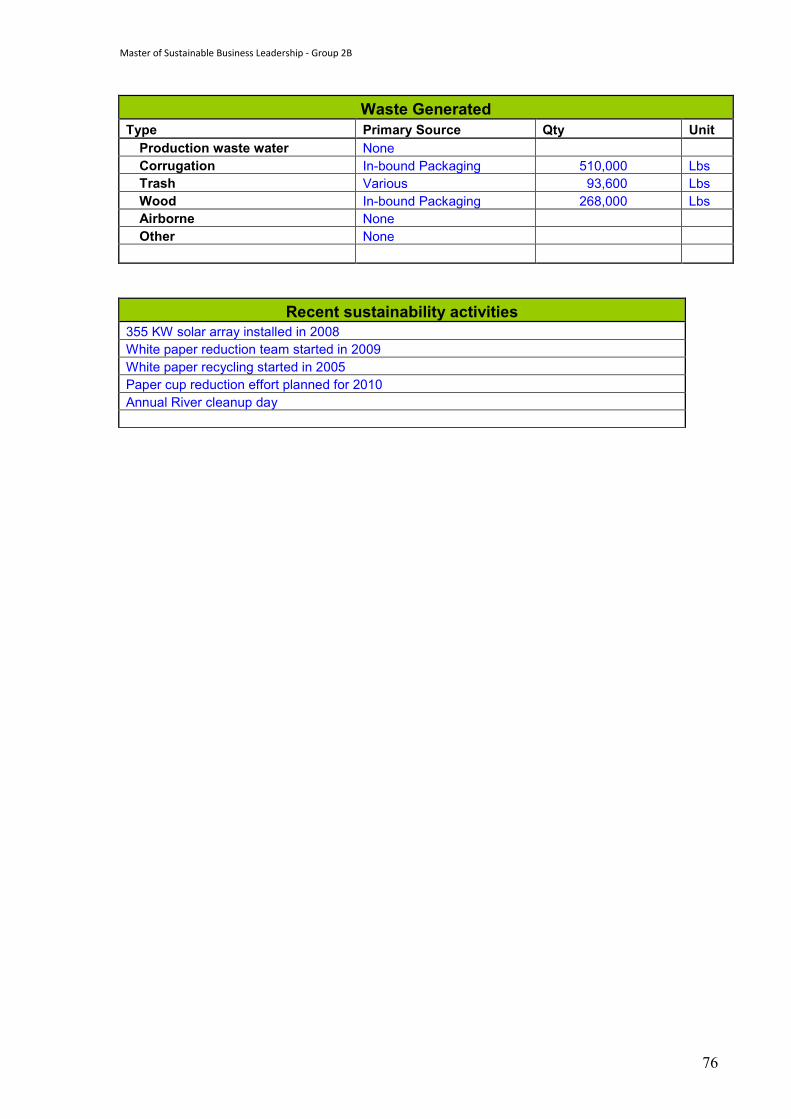
Master of Sustainable Business Leadership - Group 2B
76
Waste Generated Type Primary Source Qty Unit Production waste water None Corrugation In-bound Packaging 510,000 Lbs Trash Various 93,600 Lbs Wood In-bound Packaging 268,000 Lbs Airborne None Other None
Recent sustainability activities 355 KW solar array installed in 2008 White paper reduction team started in 2009 White paper recycling started in 2005 Paper cup reduction effort planned for 2010 Annual River cleanup day
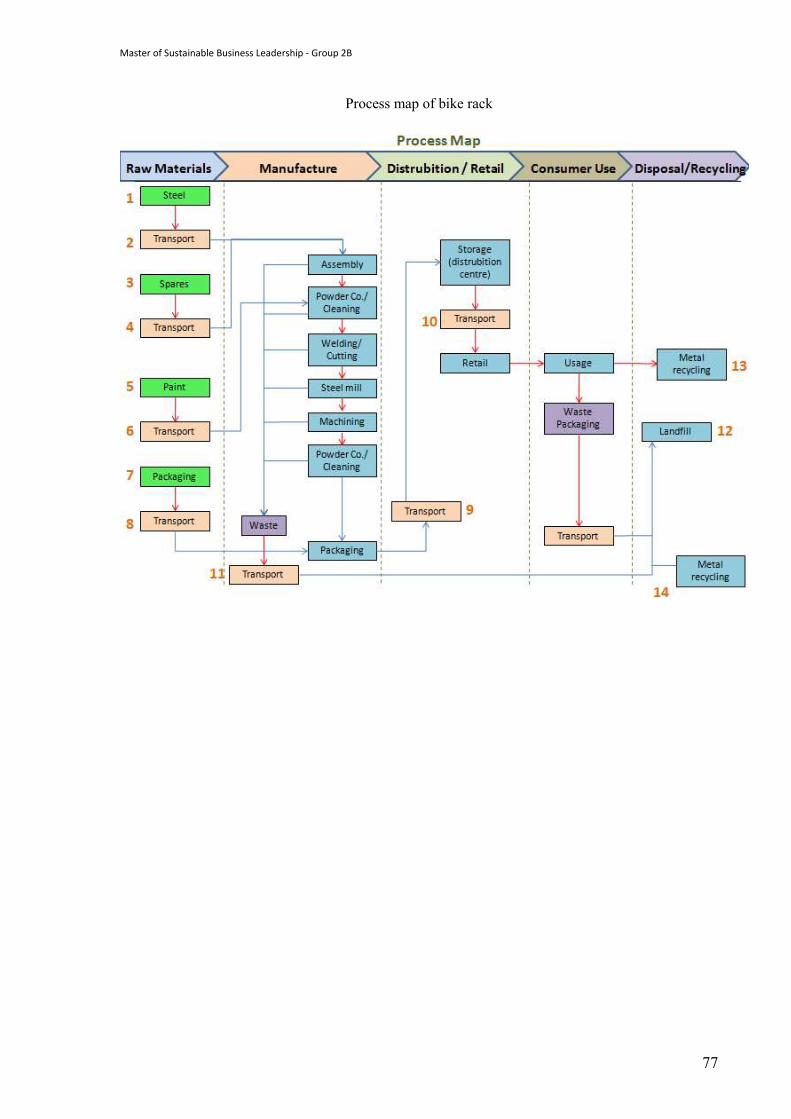
Master of Sustainable Business Leadership - Group 2B
77
Process map of bike rack
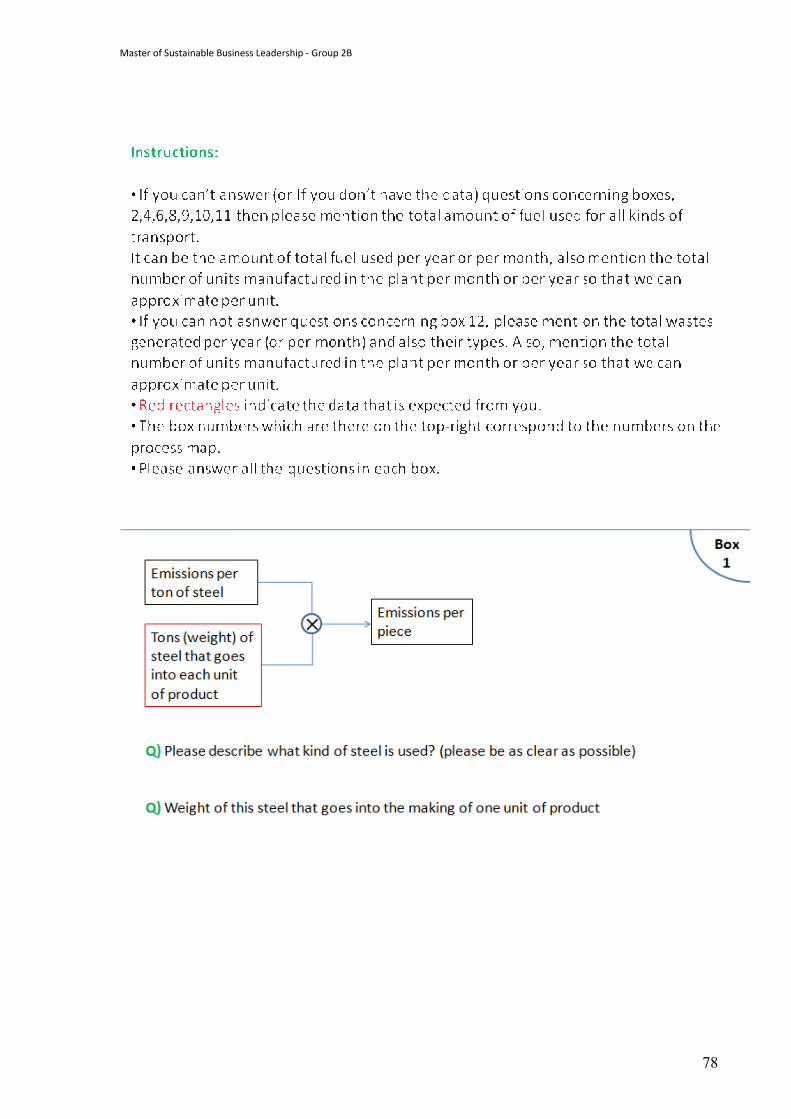
Master of Sustainable Business Leadership - Group 2B
78
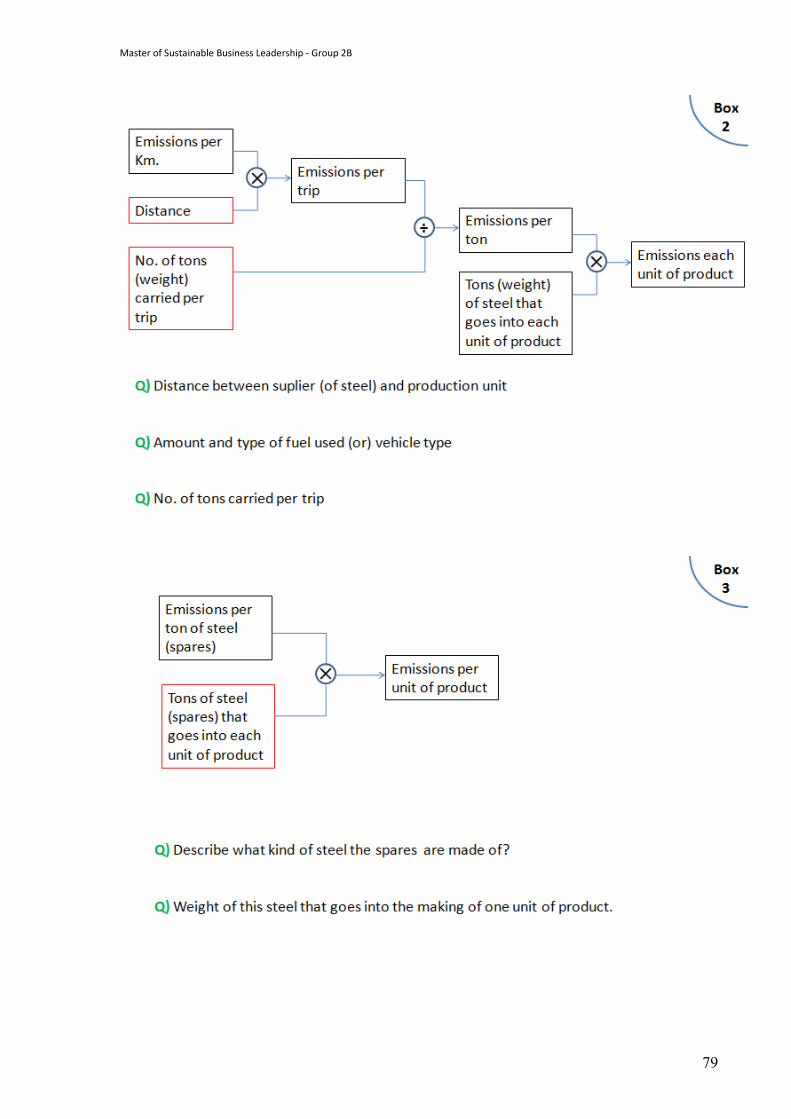
Master of Sustainable Business Leadership - Group 2B
79
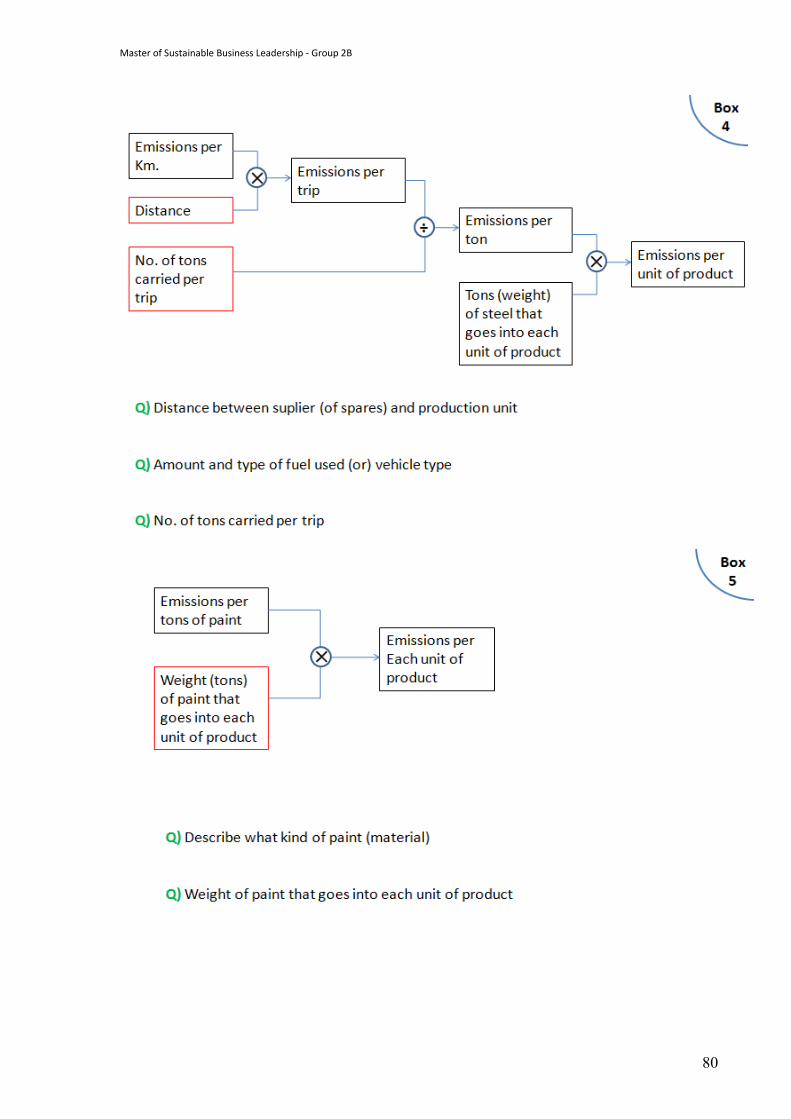
Master of Sustainable Business Leadership - Group 2B
80
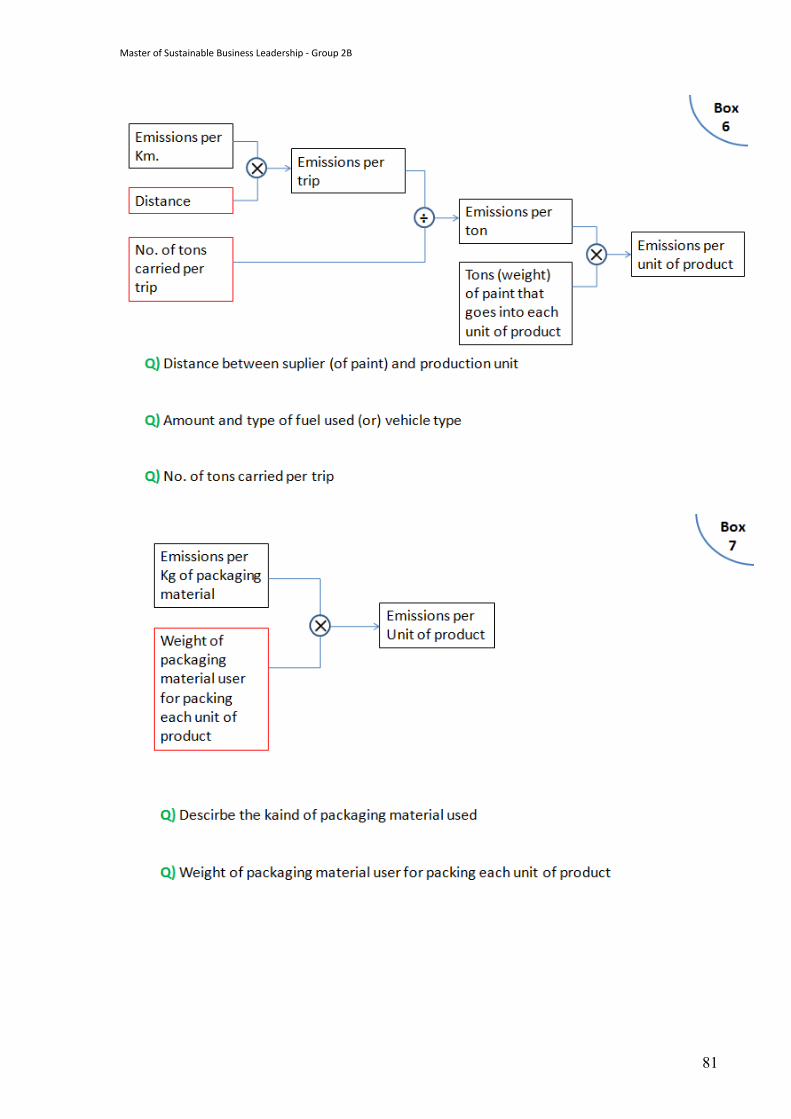
Master of Sustainable Business Leadership - Group 2B
81
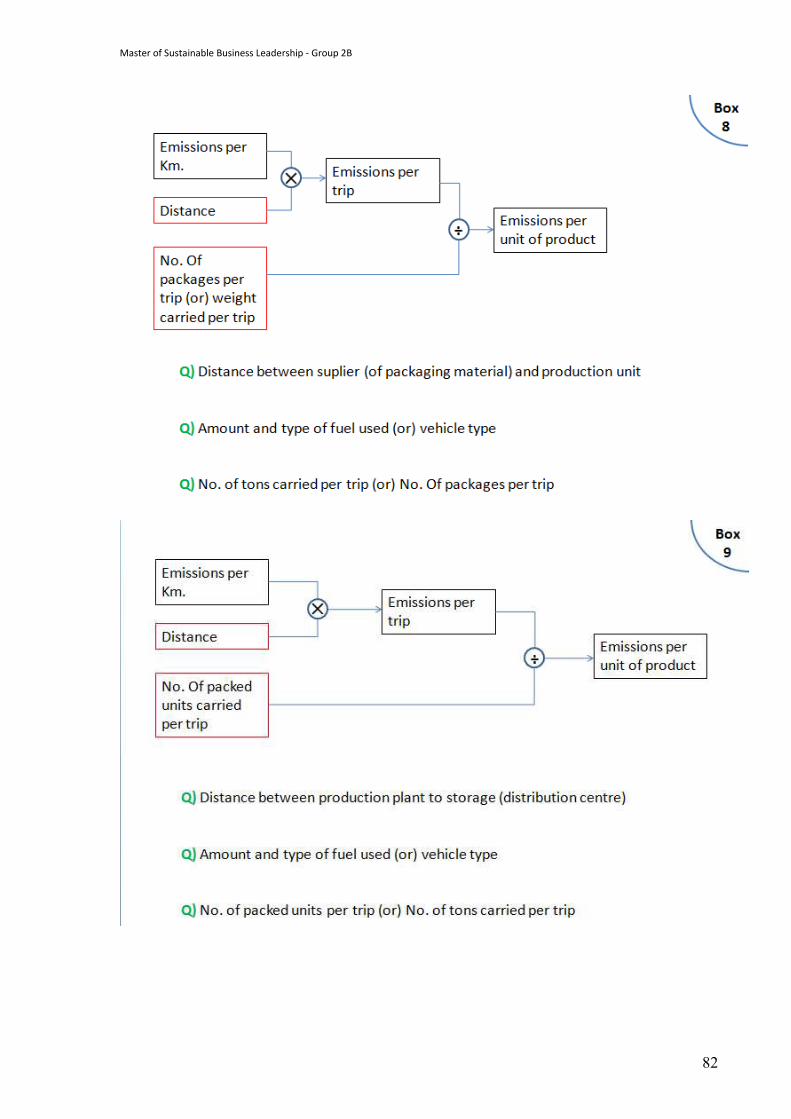
Master of Sustainable Business Leadership - Group 2B
82
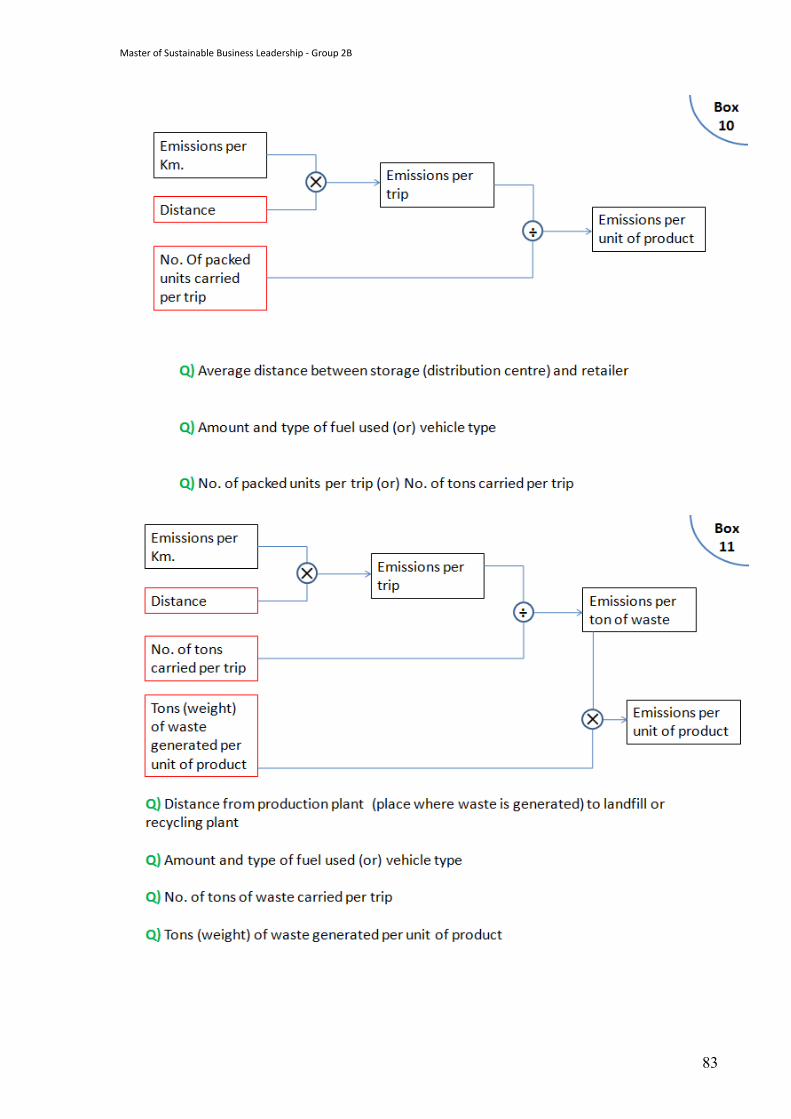
Master of Sustainable Business Leadership - Group 2B
83
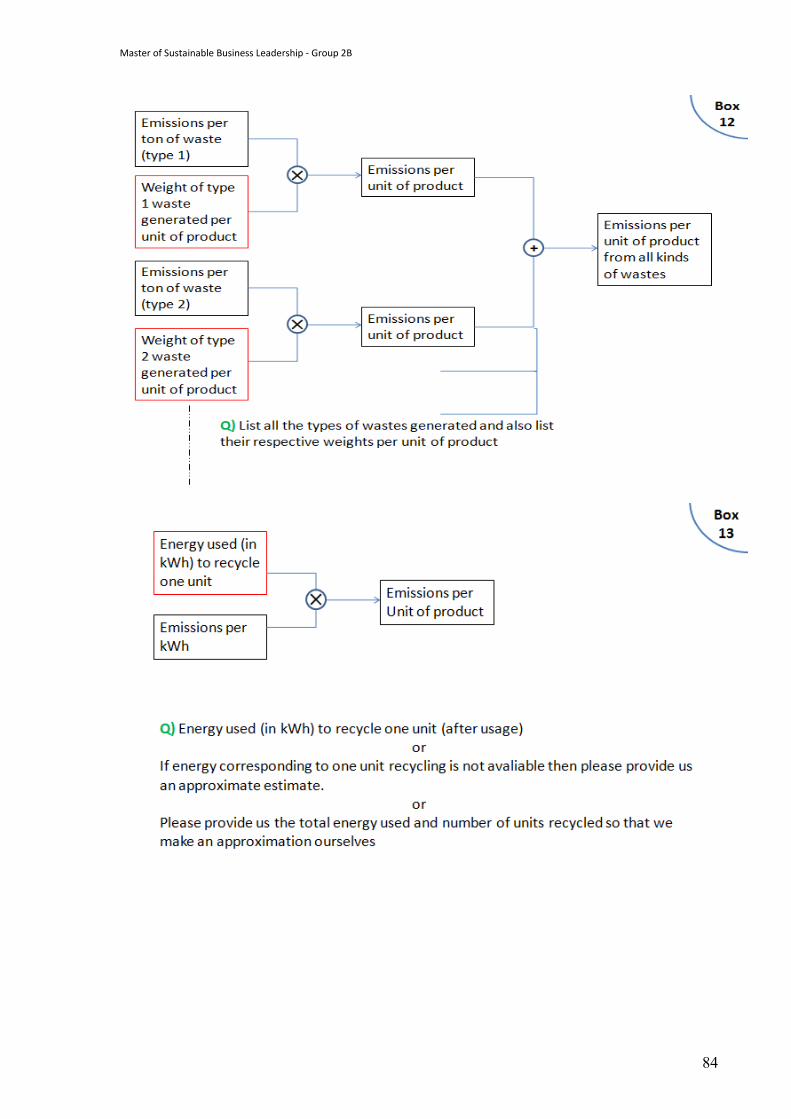
Master of Sustainable Business Leadership - Group 2B
84
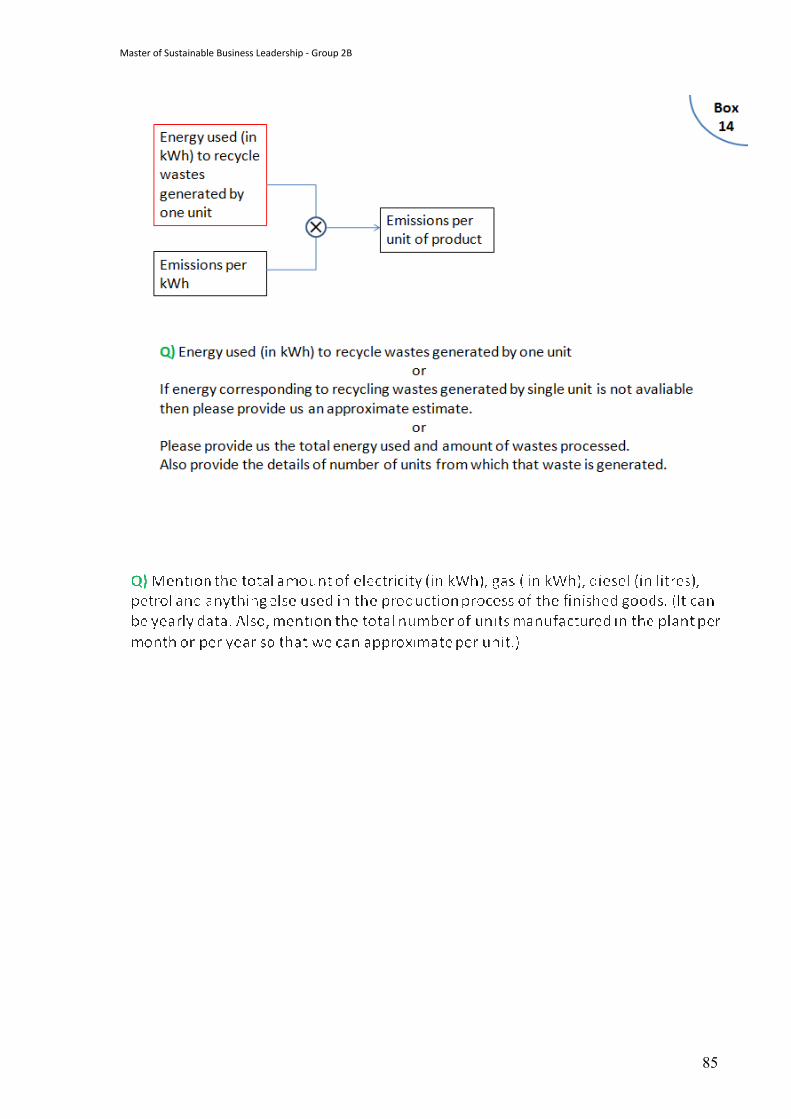
Master of Sustainable Business Leadership - Group 2B
85
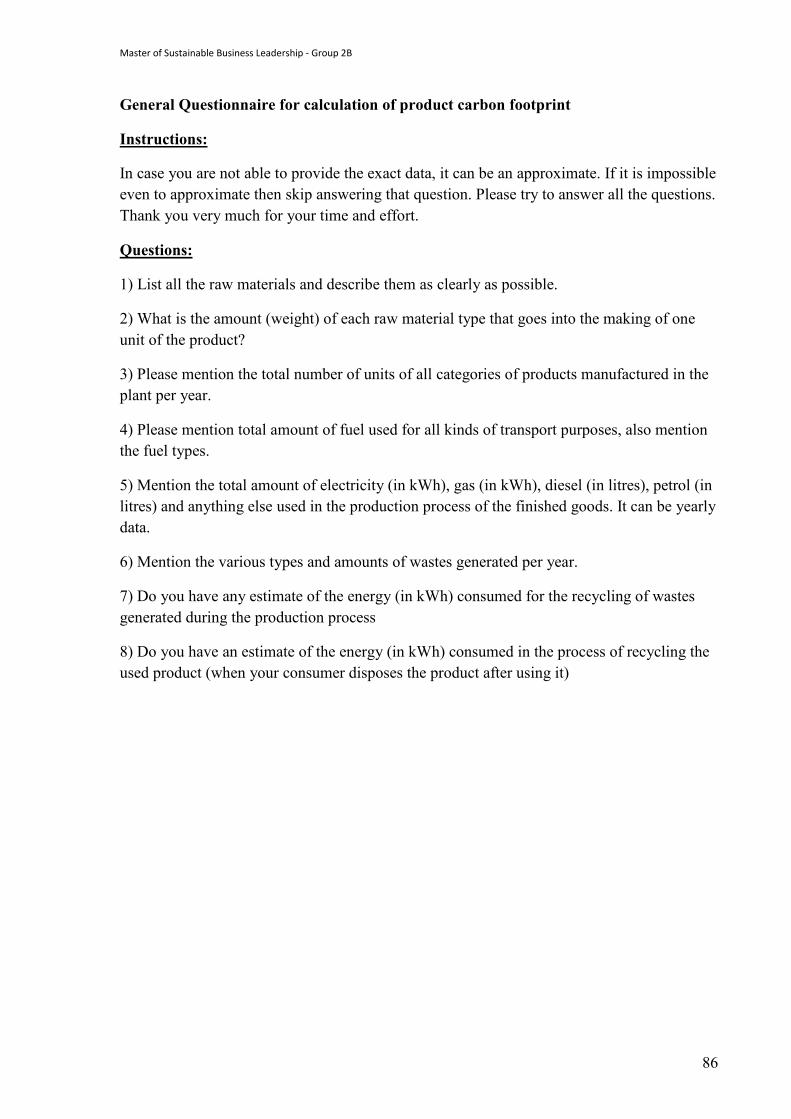
Master of Sustainable Business Leadership - Group 2B
86
General Questionnaire for calculation of product carbon footprint
Instructions:
In case you are not able to provide the exact data, it can be an approximate. If it is impossible even to approximate then skip answering that question. Please try to answer all the questions. Thank you very much for your time and effort.
Questions:
1) List all the raw materials and describe them as clearly as possible.
2) What is the amount (weight) of each raw material type that goes into the making of one unit of the product?
3) Please mention the total number of units of all categories of products manufactured in the plant per year.
4) Please mention total amount of fuel used for all kinds of transport purposes, also mention the fuel types.
5) Mention the total amount of electricity (in kWh), gas (in kWh), diesel (in litres), petrol (in litres) and anything else used in the production process of the finished goods. It can be yearly data.
6) Mention the various types and amounts of wastes generated per year.
7) Do you have any estimate of the energy (in kWh) consumed for the recycling of wastes generated during the production process
8) Do you have an estimate of the energy (in kWh) consumed in the process of recycling the used product (when your consumer disposes the product after using it)