Embed Size (px)
Citation preview
Master Thesis
MsC. Business Administration
Marketing Programme 2010-2011
Conceptualizing Customer Value in Property
Development for the Dutch Residential Housing
Market: an Exploratory study
Customer value in property development: an exploratory study Page 2
Conceptualizing Customer Value in Property
Development for the Dutch Residential Housing
Market: an Exploratory study
Name: Maurice van de Vreede
Student number: 0862304
Course: Master Study
Program: Master Marketing
Supervisor Radboud University: Dr. J. Henseler
In favor of internship firm: MAB Development Group B.V.
Supervisor firm: Drs. J.H. Smit
Table of content
Abstract 5
1. Introduction 6
1.1 Introduction 6
1.2 Motivation 6
1.3 Purpose 9
2. Literature study 10
2.1 Value in theoretical perspective 10
2.2 Value in practical perspective 13
2.3 Value in broader perspective 14
3. Qualitative study 15
3.1 Interview design 15
3.2 Results 16
4. Proposed conceptual model 22
4.1 Dominant logic 22 4.2 Delineating basic assumptions 22
5. Quantitative study 25
5.1 Methodology 25
5.2 Survey development 25
5.3 Data collection 26
6. Results 29
6.1 Factor analysis 29
6.2 Structural equation modeling 30
6.3 In-dept analysis 33
Customer value in property development: an exploratory study Page 4
7. Discussion 35
7.1 The role of components to customer value 35
7.2 Attitudes of the consumer 38
8. Conclusions and recommendations 40
8.1 Conclusions 40
8.2 Recommendations 42
9. Contribution, limitations and research directions 44
9.1 Contribution 44
9.2 Limitations 44
9.3 Research directions 45
10. Reflection 46
Reference list 47
Appendix A 52
Appendix B 58
Appendix C 60
Appendix D 63
Appendix E 67
Customer value in property development: an exploratory study Page 5
Abstract
The purpose of this study is to provide insight into which specific components lead to customer
value within the context of property development in the Dutch residential real estate market.
Recent market circumstances have created necessity for property developers to shift focus
towards the needs of the consumer and customer value has become a central issue in
contemporary property development. Literature study provided a formative higher order
construct to model the components (dimensions and drivers/cost-drivers) of customer value.
Subsequently, qualitative research was performed by conducting in-dept interviews with industry
professionals with the goal of gathering input for the quantitative study. The quantitative study
was performed through an online survey in which consumers, registered as active house-
searchers, participated. The formative construct was established from raw data through structural
equation modeling. Results indicate that drivers have far more contribution to differentiate on
customer value than costs. In particular, the driver-dimensions customer attention, conceptuals,
locations, co-creation and branding display considerable effect on customer value. In contrast:
the driver-dimensions installations, casco structure and outdoor space have only weak influence
on customer value. Acquisition-, direct- and operations costs display quite weak effects on
customer value as well. Furthermore, the results imply that service orientation of a developer is
becoming increasingly important with a substantial amount of intangible components focused on
the processes in which a house is created. It is recommended that a developer applies a service
orientation, concentrates on the development process for (mutual) value creation and places the
consumer as a central actor in this process. Moreover, it is recommended to focus strongly on
intangible drivers as customer attention, conceptuals, co-creation and branding. The focus on
locations, as a tangible driver remains important as well. It is recommended that a developer only
focuses on costs as complementary to the focus on drivers.
Customer value in property development: an exploratory study Page 6
1. Introduction 1.1 Introduction
The real estate industry is still governed by a supply regulated market mechanism, in particular in
its development and construction processes (Verveen 2009). This mechanism is based on the
concept that dictates a focus on tangible output and which dominated marketing beliefs in the
early industrial era (Vargo and Lusch 2004). For long, strategic ground positions and political
power fronts protected the industry and brought it financial prosperity (Rengers and van Uffelen
2006). In the Dutch market, a growing population, economic growth and governmental
legislation and incentives boosted the demand for housing. However, recent market conditions
caused high rates of project failure and large losses were incurred by property developers
(Rietdijk 2010). As a consequence, these market conditions urged actors within the industry to
reconsider their business-practices. The needs of the consumer are starting to become the central
focus of developers and the supply-regulated mechanism is becoming obsolete in contemporary
property development. More specifically, a developer has to fulfil those (relevant) needs which
are present in the consumers’ mindset if it wants to attain commitment from the consumer.
Consumer needs are a direct representation of their value-perceptions for a product or service
(Park, Jaworski and MacInnis 1986). Therefore, in the context of this study value for the
consumer (customer value) is the central focus. The choice for this focus stands to reason since
consumers are the ultimate decision makers and their (purchase) decisions have detrimental
consequences for project success. The context of this study is the Dutch residential real estate
market, to provide a wide context of applicability for this study. The research unit is limited to
newly build houses for the retail market (ground-dwelling houses and apartments), because
property developers concentrate on the development of new houses and/or the redevelopment
into new houses. The rental market for houses is not taken into consideration, because this
market is outside of the scope of this study.
1.2 Motivation
Recent developments indicate that the real estate industry is changing. There are causes which
place these developments into perspective. The economic downturn is the first of these causes.
Due to economic uncertainty, demand for houses drastically decreased. This trend was
strengthened by the tightening credit facilities available to consumers (Elsinga, de Jong-Tennekes
Customer value in property development: an exploratory study Page 7
and van der Heijden 2011; Sanders 2009). Strategic (ground) positions of developers dwindled as
well. As consumers, they found it increasingly difficult to attract credit facilities to finance ground
positions and project investments (Knol and Savelkoul 2009). This indicates that consumers who
are in the position to purchase a house are now more critical than ever because of the large
amount of houses available to them. The second cause is socio-economic: the increasing
individualization of the consumer (Gilmore and Pine 2000). For long manifest needs for housing
concealed consumers’ needs to distinguish themselves as individuals. Now that consumers have a
stronger position in the market, they will enforce their needs increasingly upon the developer
towards delivering more individualized solutions for their housing (Verveen 2009). The third
cause is more socio-political in nature. For long, nearly every new residential property project
aimed at increasing value for the developer and the municipality. Municipalities achieved this
through the expropriation of (mostly) agricultural land in urban environments. These lands were
sold to developers, who build large scale uniform housing projects: Vinex areas (Verveen 2009).
However, on national level regulation has been implemented to limit the strategic ground
positions of developers and the agricultural land available for development of these Vinex areas
has drastically been reduced (Knol and Savelkoul 2009). This is socio-political reasoned, since the
government is attempting to recover the unbalance between supply and demand and stabilize the
dislocated market- mechanism (Knol and Savelkoul 2009).
Beyond the scope of economics and politics
The fourth cause is socio-ecological, because environmental considerations affect and reinforce
changes within the industry as well. Collective awareness is growing that, considering the limited
amount of green landscape left in The Netherlands, the focus of property development must
shift from exploiting new land to redeveloping and revitalizing disregarded areas (Traa and
Knoben 2009). Furthermore, the emphasis on new housing projects will increasingly be on
durability. This durability not only translates to eco-friendliness in construction and energy in
housing, but also to the ability of creating comfortable environments for people to live in
(Urbanaviciene and Kaklauskas 2009). Moreover, since many property development projects are
becoming focused on inner-city, high density areas, multiple stakeholder groups will be involved
in the development process. This will increase the complexity of such projects (Michielsen 2010).
The fifth cause is socio-technological. Society is becoming increasingly transparent because
technological advances tighten social interaction among different stakeholder groups. This
enables stakeholder groups to join forces and increase their power towards societal issues
Customer value in property development: an exploratory study Page 8
(Maignan and Ferrell 2004). The days that a power front of a municipality and developer
overarched the interests of other stakeholders are passed behind, in particular because the
increasing importance of social media and communication technology reinforces the power of
stakeholder groups fast. These causes show that the strategic position of a developer has been
affected and necessitate a developer into the position in which it has to acknowledge the needs of
the consumer (and other stakeholder groups) and has to focus on mutual value creation: value for
the firm and value for its stakeholders. As earlier indicated, this study only focuses on value
(creation) for one specific, but important stakeholder group: consumers.
Current state of research
The real estate industry is gradually becoming aware of the shift in power from seller to buyer
and recognizes that is has to focus more on the consumer in property development (de
Lathauwer 2005; Kwee and Hacquebord 2005; Luchjenbroers 2007; Majaama et al. 2008; Tuns et
al. 2010; Verveen 2008). Although industry-specific studies have provided guidelines and models
for structuring processes to achieve and/or increase customer value, none of these studies really
capture the essence of value creation, because a) industry-specific studies are aimed at customer
value but do not conceptualize customer value as such, thereby leaving value as an ultimate but
unknown condition to be satisfied and b) none of these guidelines and models are based on
empirical validation. Mainstream literature (Anderson, Jain, and Chintagunta 1993; Grönroos and
Helle 2010; Heinonen et al. 2010; Lapierre 2000; Ulaga 2003; Ulaga and Eggert 2005; Vargo and
Lusch 2004) really captures the essence of (customer) value by disentangling value into
components and by giving well structured and founded recommendations by which management
can improve their value creation-processes. However, what this research stream lacks is that it
does not capture the essence and complexity of the property development process and does not
account for the industry characteristics that influence such value creation processes. The property
development process is characterized by its longevity, high transaction specific investments and
associated risks (Muller 2005). Each property development project necessitates a unique
approach, not only in the interaction with stakeholder groups but in all relevant technical,
commercial, political, financial and legal aspects of a project (Muller 2005). The unique character
of property development and the special deployment of resources that it brings with it along are
not accounted for in mainstream research. To conclude, mainstream research has provided
valuable insights in customer value, but its generalizability for property development is still too
Customer value in property development: an exploratory study Page 9
limited. As far as known, no earlier attempts have been made to incorporate customer value
empirically in this industry-specific context.
1.3 Purpose
Apparently, when value is reflected, a main generalization between industry-specific and non-
industry-specific research streams can be drawn. A generalization is that both research streams
consider value as some ultimate perception in the mindset of the consumer (Heinonen et al.
2010; Luchjenbroers 2007; Smeets 2010; Verveen 2008; Zeithaml 1988). The mainstream
literature described above indicates that (customer) value is disentangled in components. Without
those components, customer value could not exist. After all, a perception must be a composition
of certain components which cause a condition of customer value. Lapierre (2000) was the first
to confirm the validity of this claim by establishing a construct of components. Therefore, the
main purpose of this study is to provide insight into which specific components lead to customer
value in industry-specific context. The appropriate research question for this study becomes:
Which components of customer value can be identified in the residential property development market?
In the following section, literature study will provide the theoretical foundation(s) for (customer)
value to build further upon. The qualitative study will provide knowledge about the industry-
related components that will be used for modelling customer value. Subsequently, the
quantitative study will concern the modelling of customer value into a construct. The three
subsequent studies are chosen to provide an elaborate as possible methodological approach to
this study. After, results are discussed and conclusions are presented. To conclude,
recommendations and future research directions are provided.
Customer value in property development: an exploratory study Page 10
2. Literature study
2.1 Value in theoretical perspective
Conceptualizations of value
Value has undergone extensive review in academic literature to date. In the academic field, many
conceptualizations of customer value have been proposed. Zeithaml (1988) refers to customer
value as “the consumer’s overall assessment of the utility of a product based on a perception of
what is received and what is given”, while Monroe (1991) refers to customer value as a “ratio of
perceived benefits relative to perceived sacrifice”. Parallel to previous definitions, Flint,
Woodruff and Fisher-Gardial (1997) conceptualize customer value in a business-to-business
context as “the customers’ assessment of the value that has been created for them by a supplier
given the trade-offs between all relevant benefits and sacrifices in a specific-use situation”. Other
studies focus more on the relationship-aspect of value. Ulaga (2003) disentangles the concept of
(relationship) value into four characteristics: a) value is a subjective concept, b) it consists of a
trade-off between benefits and sacrifices, c) benefits and sacrifices can be multi-faceted and d)
value perceptions are relative to competition. Furthermore, Ulaga and Eggert (2005) augment to
the concept of relationship value by stipulating the difference between customer value and
relationship value. Customer value is value that is created from a transactional point of view and
focuses solely on the value and sacrifices that relate to the tangible output of the product or
service. The concept of relationship value, which is derived from relationship marketing, has a
broader perspective because it considers not only the value of the tangible output but also the
value of the relational aspects between customer and supplier. Anderson, Jain, and Chintagunta
(1993) recognize this perspective by implicating that relationship value is “the perceived worth in
monetary units of the set of economic, technical, service and social benefits received by a
customer firm in exchange for the price paid for a product offering, taking into consideration the
available alternative suppliers’ offerings and prices”.
Value identified in constructs
As before indicated, Lapierre (2000) was the first who attempted to establish a construct with 13
value drivers for customer value through quantitative validation. In his study, Eggert (2003)
contributed to the conceptualization of relationship value by introducing a construct for
Customer value in property development: an exploratory study Page 11
relationship value in a business-to-business (B2B) context. Through qualitative research he
distinguished eight relationship value drivers, two of which are costs. In their study, Ulaga and
Eggert (2005), proposed a formative (higher-order) construct of relationship value in B2B
context. In this construct: five relationship benefit dimensions were identified: a) product
benefits, b) service benefits, c) know how benefits, d) time-to-market benefits and e) social
benefits, as well as two relationship sacrifices: a) process costs and, b) price. An asymmetric effect
was confirmed between benefits and sacrifices, because the positive influence of the benefits on
relationship value is stronger than the negative effect of the sacrifices on relationship value. The
distinction between this study and the study of Ulaga (2003) is that this study models a negative
effect of costs to customer value, while Ulaga (2003) models a positive effect of costs to
customer value. Ulaga and Eggert (2005) consider costs as sacrifices, while Ulaga (2003)
considers costs as (alternative) value drivers. In their subsequent study, Ulaga and Eggert (2006)
again used the formative construct to identify which components most strongly influence
relationship value in B2B context. The deviation to the previous study is that the benefit
dimensions were reduced to three and the cost dimensions increased to three. Again, this study
confirmed the validity of the proposed formative construct for (relationship) value.
Dominant logic
Previous indicates that value has been conceptualized and modelled into constructs. Another
distinction among studies resides in the logic under which value is conceptualized. The study of
Vargo and Lusch (2004) indentifies that a shift is taking place: transactions in the market-place
are moving away from the goods-dominant (GD) logic towards the service-dominant (SD) logic.
Value resides decreasingly in tangible output and increasingly in intangible resources as skills,
knowledge, information and collaborative relationships with consumers. Woodruff (1997) reflects
on this by critically examining the concept of customer value. According to his study, ambiguity
exists in the conceptualizations of value because their underlying reasoning is similar but the
indicators from which they are composed and the context in which they operate differ.
Furthermore, Woodruff (1997) identifies a shifting focus in customers’ perceptions from GD-
logic to SD- or CD-logic and recognizes that many conceptualizations based on the GD-logic
seem to come obsolete. As a result of his critique: he introduces a conceptualization in which the
logic-shift in the customers’ perceptions is captured: “Customer value is a customers’ perceived
preference for and evaluation of those product attributes, attribute consequences and experiences
arising from use that facilitate (or block) achieving the customers’ goals and purposes in use
Customer value in property development: an exploratory study Page 12
situations”. Recent research has stretched the boundaries of value even further by placing
emphasis on the experiential value, or value-in-use. In their study, Heinonen et al. (2010) consider
an SD-logic still as a provider-dominant logic and propose value-in-use as the ultimate instrument
to create value. The value-in-use refers to the customer-dominant (CD) logic and reflects the aim
of business to create value by focussing not on which need a product or service satisfies, but on
what desired experience a product can create for the consumer. Soman and Marambi (2009)
stipulate the movement in willingness to pay for economic value (i.e. the value of the tangible
good) to experiential value.
Core assumption of value
It is in particular significant to identify that most mainstream research on value, regardless of
whether customer value or relationship value is addressed, focuses in particular on business
context and/or business-to-business relationships. Only the studies of Gutman (1982), Heinonen
et al. (2010), Vargo and Lusch (2004) and Woodall (2003) focus on business-to-consumer
relationships. However, this does not necessarily imply that value is perceived differently in the
context of consumer and business. Soman and Marambi (2009) support this assumption by
introducing a universally applicable value spectrum: a conceptualization of the value assessment
process in which customer value is shown as the value surplus when consumers (or customers)
compare incremental benefits with incremental costs. Although there is still disagreement about
the exact conceptualization for value, its dominant logic under which it operates and whether it
focuses on the consumer in B2C context (customer value) or the customer in B2B context
(relationship value), there is consensus among research about its core assumption. Value still
reflects the perception of surplus in relation to what consumers (customers in B2B context)
receive and what they have sacrificed, regardless of context and whether this surplus is reflected
as being tangible, intangible or experiential. This argument is also supported by Woodruff (1997),
who implies that there is no dominant logic, but instead they are complementary. Gutman (1982)
proposed such a view years ago by implying that product attributes (tangible), consequences
(intangible) and experiences (experiential) all create value on different levels in the means-end
chain of consumers and therefore function as complementary. Another interesting avenue of
research is provided by Woodall (2003). Woodall (2003) proposes a conceptual framework for
customer value based on extensive case-study. Value is dually based here: on the object (product)
and the subject (consumer). In that sense value is created both for the object based on usage
value and for the consumer based on the experience the object creates. This study therefore
Customer value in property development: an exploratory study Page 13
proposes value under GD/SD-logic and CD-logic simultaneously. Five value dimensions are
provided, two of which based on the object and three based on the subject.
2.2 Value in practical perspective
On the other hand, a diversity of studies has examined which particular activities lead to value.
Flint, Woodruff and Fisher-Gardial (1997) propose a conceptual model that guides customer
perceived-value. However, its purpose is not to provide strategy on how to shape customer value
but on how a supplier can identify events in a customers’ environment that are likely to change
their perceptions of value. From identification of these changing values, offerings that tap into
these (future) values can be created. This study strongly implies the importance of learning
capabilities of a supplier. Sharma and Sheth (1997) propose three ways to create value: a) value
creation through relationships with suppliers, b) value creation through alliance partnering and c)
value creation through relationships with customers. Both Vargo and Lusch (2004) and
Grönroos and Helle (2010) highlight the importance of co-creation initiatives. According to their
studies, it is necessary to create value through intensive collaboration with consumers (customers)
to jointly develop solutions for their needs. Continuing on co-creation, Alam (2006) stipulates
that customer interaction removes the fuzziness in the fuzzy front end of new service
development (NSD) and thereby increasing NSD-success. Hoyer et al. (2010) introduce a
conceptual model in which they identify stimulators and impediments to co-creation. As they
indicate, social media and community building activities are gaining importance as instruments in
the process of co-creation. Industry-specific research is also supportive of co-creation (Tuns et al.
2010), but the study by Verveen (2008) and the publication by Kwee and Hacquebord (2005)
expand the view on co-creation as an extensive collaboration among firm, consumers and
relevant parties in the supply-chain. Heinonen et al. (2010) argue that co-creation alone is not a
sufficient condition for creating (superior) value. This study indicates that co-creation is not an
end itself, but merely a (possible, but not necessary) supportive instrument in value creation.
They argue that instead of focussing on searching how a product fits in the context of the
consumer, a firm should focus on the consumers’ experience(s) to find solutions for problems
the consumer encounters. In industry-specific context Luchjenbroers (2007) indicates that
“consumer experience” in residential projects contributes to customer value, thereby supporting
the assumptions made by Heinonen et al. (2010).
Customer value in property development: an exploratory study Page 14
2.3 Value in broader perspective
Thus far, a diversity of studies has proposed theoretical and practical perspectives on value.
However, there is also a research stream which focuses on value as part of a network, modelling
antecedents and consequences of value in broader perspective. Ulaga and Eggert (2004) explored
what function relationship value has in the broader network of relationship marketing and
whether relationship value can be considered as an important antecedent to relationship quality.
What they found was that in B2B context, relationship value has a direct (positive) influence on
the decision of the customer to continue the relationship with the supplier and indirect (positive)
through the construct of relationship quality (with the dimensions: satisfaction, trust and
commitment). The results show: a) the necessity for business to create (superior) value for the
customer in order to continue its business-activities with the customer, b) to focus on creating
(mutual) trust between customer-supplier, because trust functions as a mediating variable in the
construct of relationship quality and c) that relationship value is an important antecedent to
relationship quality. Grönroos and Helle (2010) elaborate that trust is a necessary ingredient to
create successful relationships for mutual value creation between customer and supplier. The
distinction between both studies is that Ulaga and Eggert (2004) consider trust as part of a
construct that is a consequence of relationship value, while Grönroos and Helle (2010) consider
trust to be an important antecedent for the creation of value. Either way, trust seems to be a
variable that is closely related to value. Furthermore, Chiou and Droge (2006) confirm in B2C-
context that satisfaction leads to an increase by consumers to invest in specific asset investments
(SAI). Satisfaction resembles value to some degree, since both are considered as affective
attitudes in the mind of the consumer that lead to some form of consequence(s) (Chiou and
Droge 2006). SAI are investments done by consumers in the (acquisition of) product(s) or
service(s) of a firm that loose significant value when the consumer switches to competitive
offerings. This closely parallels the study by Ulaga and Eggert (2004) in which there exists a
positive relationship between value and the customers’ choice for continuation with the supplier,
because SAI are considered to be done only when the customer is satisfied with its supplier.
Moreover, Palmatier et al. (2006) have also contributed strongly to value. In their study, they
confirmed that relational mediators similar to those by established by Ulaga and Eggert (2004),
mediate the relationship(s) between value based antecedents and value based outcomes.
Customer value in property development: an exploratory study Page 15
3. Qualitative study
3.1 Interview design
In advance, certain themes to be discussed were set up for the interviews. These were derived
from a variety of (industry-related) sources (studies, publications and news-items) as well as from
the authors’ knowledge. In line with the studies of Lapierre (2000), Ulaga (2003), Ulaga and
Eggert (2005) and Ulaga and Eggert (2006), the themes reflected possible sources of benefits and
sacrifices (costs) for customer value. The interviews contained open questions about the themes.
The questions were formulated as neutral and uniform as possible to reduce response bias
(Robinson, Shaver and Wrightman 1991) Moreover, the open character of the interviews
stimulated participants to provide as rich as possible information about the discussed themes and
their attitudes towards these themes.
Sampling
Interviews were conducted with eight industry professionals from two different property
development firms in The Netherlands. Respondents were contacted either through telephone or
e-mail through the use of references provided by an employee of one of the firms. Respondents
were invited to a face to face interview or an interview conducted through telephone. Ultimately,
six interviews were done face to face and two interviews were conducted by telephone.
Sample
Both firms belong to one of the leading banking-conglomerates in The Netherlands. Although
both firms cooperate on a strategic level, they are autonomously managed. From the eight
interview participants, six of them are employed at firm A and two are employed at firm B. Firm
A specializes in commercial real estate (offices, retail, public functions etc.) and mixed-use
projects (combination of housing with commercial real estate). The development of housing is a
substantial part of the business, but is only initiated as part of mixed use projects. This firm is one
of the leading developers of commercial real estate in The Netherlands. Firm B is the leading
property developer of The Netherlands in the residential market and develops mostly stand-alone
residential projects.
In composing this sample of respondents, one criterion was most important: the multidisciplinary
background of the respondents. By including professionals with different backgrounds and
Customer value in property development: an exploratory study Page 16
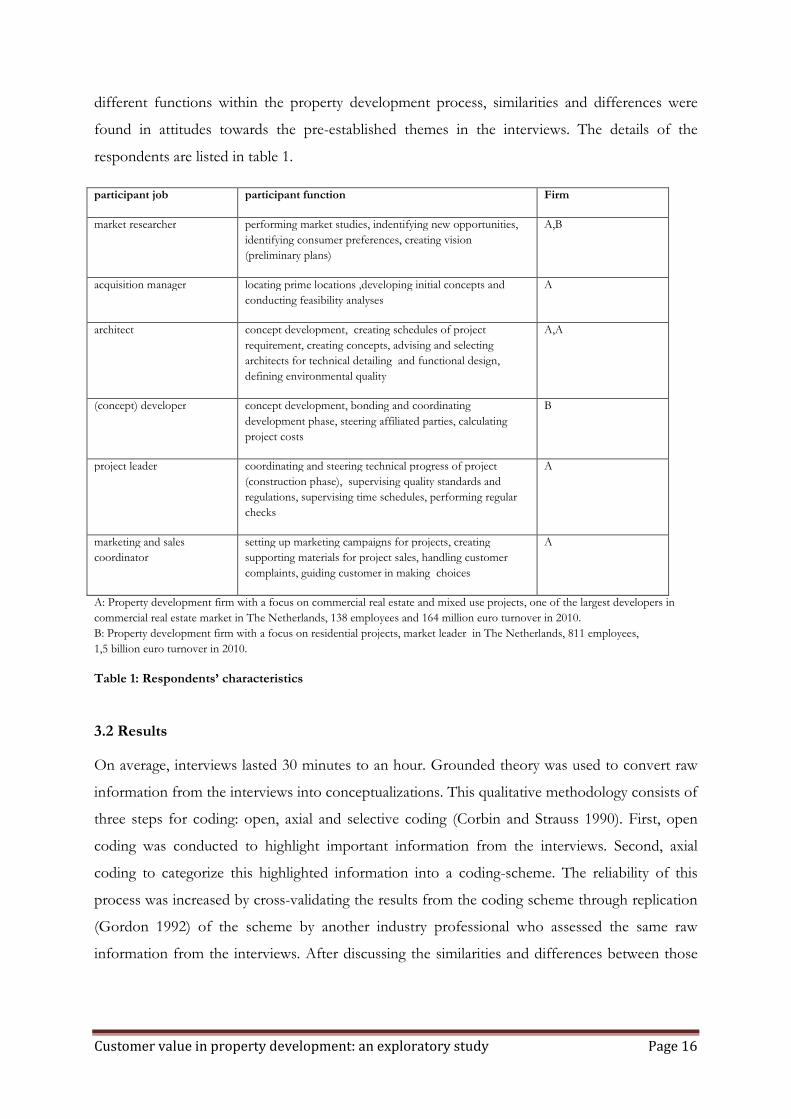
different functions within the property development process, similarities and differences were
found in attitudes towards the pre-established themes in the interviews. The details of the
respondents are listed in table 1.
participant job participant function Firm
market researcher performing market studies, indentifying new opportunities,
identifying consumer preferences, creating vision
(preliminary plans)
A,B
acquisition manager locating prime locations ,developing initial concepts and
conducting feasibility analyses
A
architect concept development, creating schedules of project
requirement, creating concepts, advising and selecting
architects for technical detailing and functional design,
defining environmental quality
A,A
(concept) developer concept development, bonding and coordinating
development phase, steering affiliated parties, calculating
project costs
B
project leader coordinating and steering technical progress of project
(construction phase), supervising quality standards and
regulations, supervising time schedules, performing regular
checks
A
marketing and sales
coordinator
setting up marketing campaigns for projects, creating
supporting materials for project sales, handling customer
complaints, guiding customer in making choices
A
A: Property development firm with a focus on commercial real estate and mixed use projects, one of the largest developers in
commercial real estate market in The Netherlands, 138 employees and 164 million euro turnover in 2010.
B: Property development firm with a focus on residential projects, market leader in The Netherlands, 811 employees,
1,5 billion euro turnover in 2010.
Table 1: Respondents’ characteristics
3.2 Results
On average, interviews lasted 30 minutes to an hour. Grounded theory was used to convert raw
information from the interviews into conceptualizations. This qualitative methodology consists of
three steps for coding: open, axial and selective coding (Corbin and Strauss 1990). First, open
coding was conducted to highlight important information from the interviews. Second, axial
coding to categorize this highlighted information into a coding-scheme. The reliability of this
process was increased by cross-validating the results from the coding scheme through replication
(Gordon 1992) of the scheme by another industry professional who assessed the same raw
information from the interviews. After discussing the similarities and differences between those
Customer value in property development: an exploratory study Page 17
schemes, a final coherent coding scheme was created. Finally, selective coding was performed in
order to build conceptualizations.
Axial coding
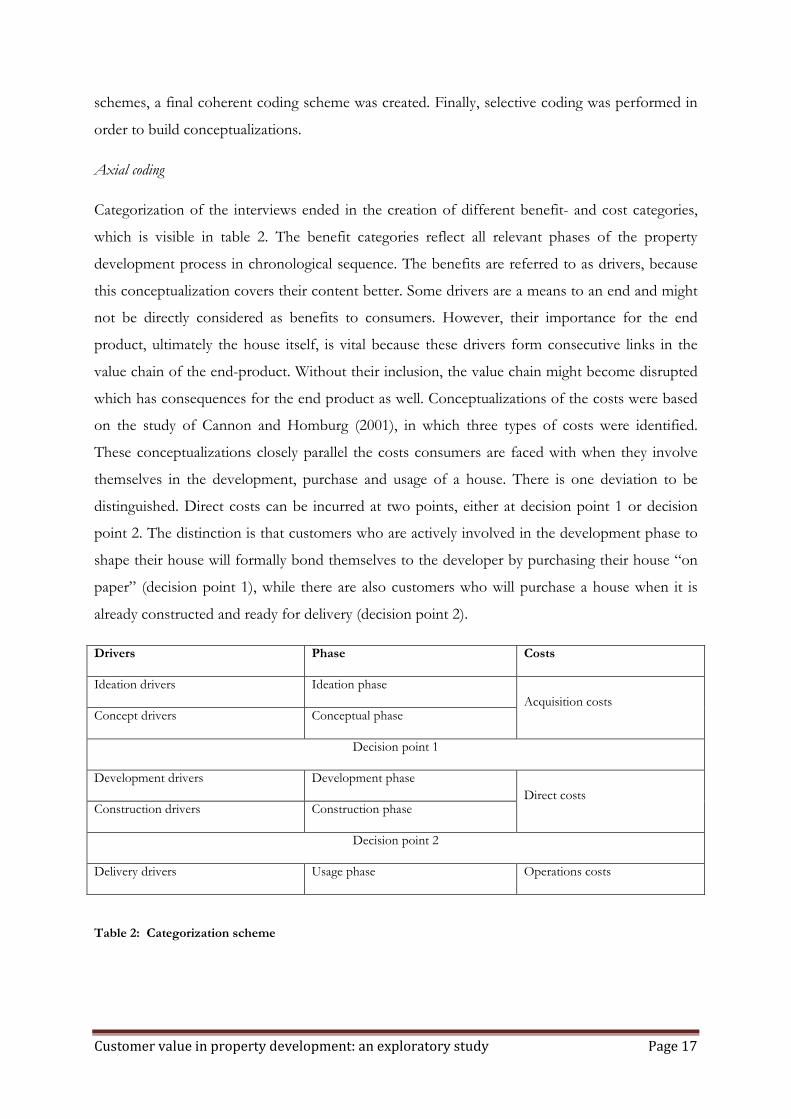
Categorization of the interviews ended in the creation of different benefit- and cost categories,
which is visible in table 2. The benefit categories reflect all relevant phases of the property
development process in chronological sequence. The benefits are referred to as drivers, because
this conceptualization covers their content better. Some drivers are a means to an end and might
not be directly considered as benefits to consumers. However, their importance for the end
product, ultimately the house itself, is vital because these drivers form consecutive links in the
value chain of the end-product. Without their inclusion, the value chain might become disrupted
which has consequences for the end product as well. Conceptualizations of the costs were based
on the study of Cannon and Homburg (2001), in which three types of costs were identified.
These conceptualizations closely parallel the costs consumers are faced with when they involve
themselves in the development, purchase and usage of a house. There is one deviation to be
distinguished. Direct costs can be incurred at two points, either at decision point 1 or decision
point 2. The distinction is that customers who are actively involved in the development phase to
shape their house will formally bond themselves to the developer by purchasing their house “on
paper” (decision point 1), while there are also customers who will purchase a house when it is
already constructed and ready for delivery (decision point 2).
Drivers Phase Costs
Ideation drivers Ideation phase
Acquisition costs Concept drivers Conceptual phase
Decision point 1
Development drivers Development phase
Direct costs Construction drivers Construction phase
Decision point 2
Delivery drivers Usage phase Operations costs
Table 2: Categorization scheme
Customer value in property development: an exploratory study Page 18
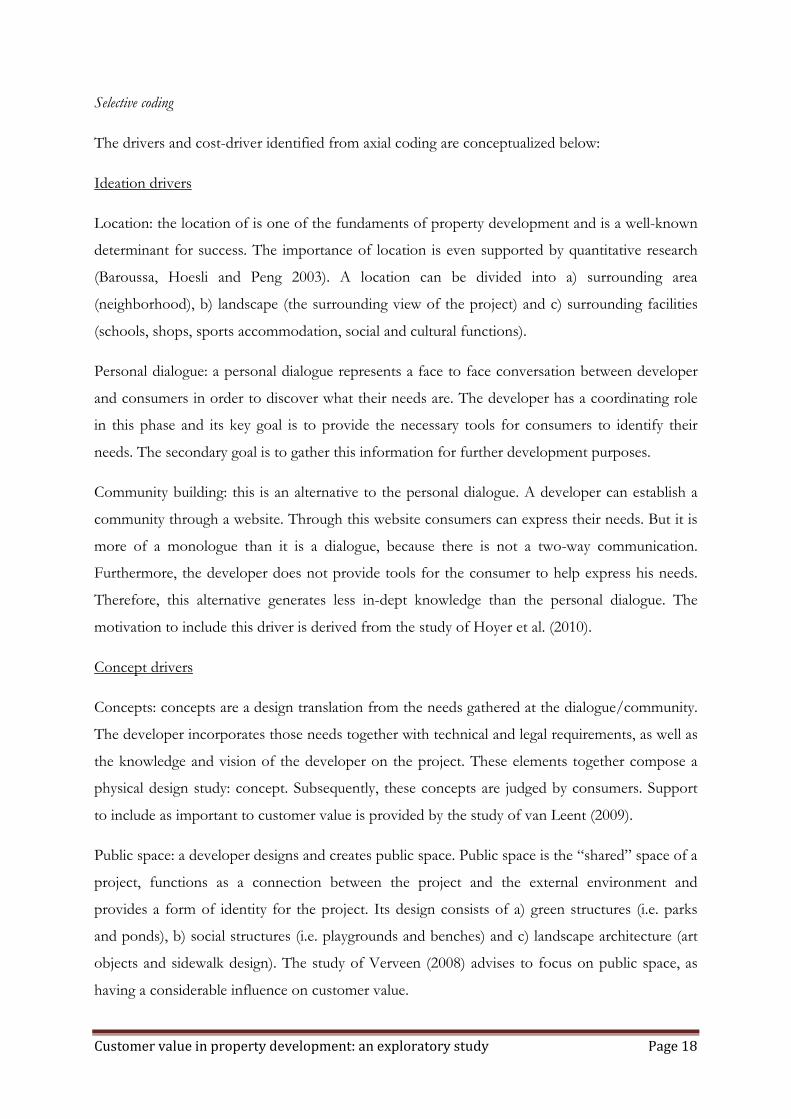
Selective coding
The drivers and cost-driver identified from axial coding are conceptualized below:
Ideation drivers
Location: the location of is one of the fundaments of property development and is a well-known
determinant for success. The importance of location is even supported by quantitative research
(Baroussa, Hoesli and Peng 2003). A location can be divided into a) surrounding area
(neighborhood), b) landscape (the surrounding view of the project) and c) surrounding facilities
(schools, shops, sports accommodation, social and cultural functions).
Personal dialogue: a personal dialogue represents a face to face conversation between developer
and consumers in order to discover what their needs are. The developer has a coordinating role
in this phase and its key goal is to provide the necessary tools for consumers to identify their
needs. The secondary goal is to gather this information for further development purposes.
Community building: this is an alternative to the personal dialogue. A developer can establish a
community through a website. Through this website consumers can express their needs. But it is
more of a monologue than it is a dialogue, because there is not a two-way communication.
Furthermore, the developer does not provide tools for the consumer to help express his needs.
Therefore, this alternative generates less in-dept knowledge than the personal dialogue. The
motivation to include this driver is derived from the study of Hoyer et al. (2010).
Concept drivers
Concepts: concepts are a design translation from the needs gathered at the dialogue/community.
The developer incorporates those needs together with technical and legal requirements, as well as
the knowledge and vision of the developer on the project. These elements together compose a
physical design study: concept. Subsequently, these concepts are judged by consumers. Support
to include as important to customer value is provided by the study of van Leent (2009).
Public space: a developer designs and creates public space. Public space is the “shared” space of a
project, functions as a connection between the project and the external environment and
provides a form of identity for the project. Its design consists of a) green structures (i.e. parks
and ponds), b) social structures (i.e. playgrounds and benches) and c) landscape architecture (art
objects and sidewalk design). The study of Verveen (2008) advises to focus on public space, as
having a considerable influence on customer value.
Customer value in property development: an exploratory study Page 19
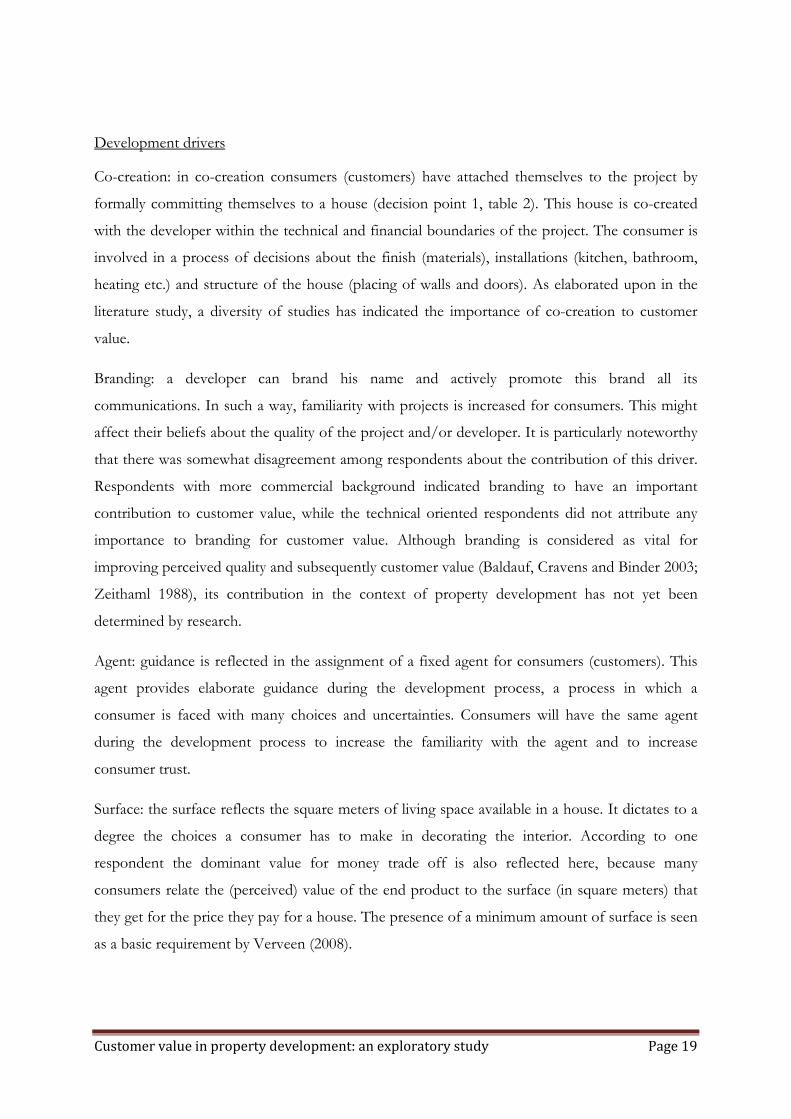
Development drivers
Co-creation: in co-creation consumers (customers) have attached themselves to the project by
formally committing themselves to a house (decision point 1, table 2). This house is co-created
with the developer within the technical and financial boundaries of the project. The consumer is
involved in a process of decisions about the finish (materials), installations (kitchen, bathroom,
heating etc.) and structure of the house (placing of walls and doors). As elaborated upon in the
literature study, a diversity of studies has indicated the importance of co-creation to customer
value.
Branding: a developer can brand his name and actively promote this brand all its
communications. In such a way, familiarity with projects is increased for consumers. This might
affect their beliefs about the quality of the project and/or developer. It is particularly noteworthy
that there was somewhat disagreement among respondents about the contribution of this driver.
Respondents with more commercial background indicated branding to have an important
contribution to customer value, while the technical oriented respondents did not attribute any
importance to branding for customer value. Although branding is considered as vital for
improving perceived quality and subsequently customer value (Baldauf, Cravens and Binder 2003;
Zeithaml 1988), its contribution in the context of property development has not yet been
determined by research.
Agent: guidance is reflected in the assignment of a fixed agent for consumers (customers). This
agent provides elaborate guidance during the development process, a process in which a
consumer is faced with many choices and uncertainties. Consumers will have the same agent
during the development process to increase the familiarity with the agent and to increase
consumer trust.
Surface: the surface reflects the square meters of living space available in a house. It dictates to a
degree the choices a consumer has to make in decorating the interior. According to one
respondent the dominant value for money trade off is also reflected here, because many
consumers relate the (perceived) value of the end product to the surface (in square meters) that
they get for the price they pay for a house. The presence of a minimum amount of surface is seen
as a basic requirement by Verveen (2008).
Customer value in property development: an exploratory study Page 20
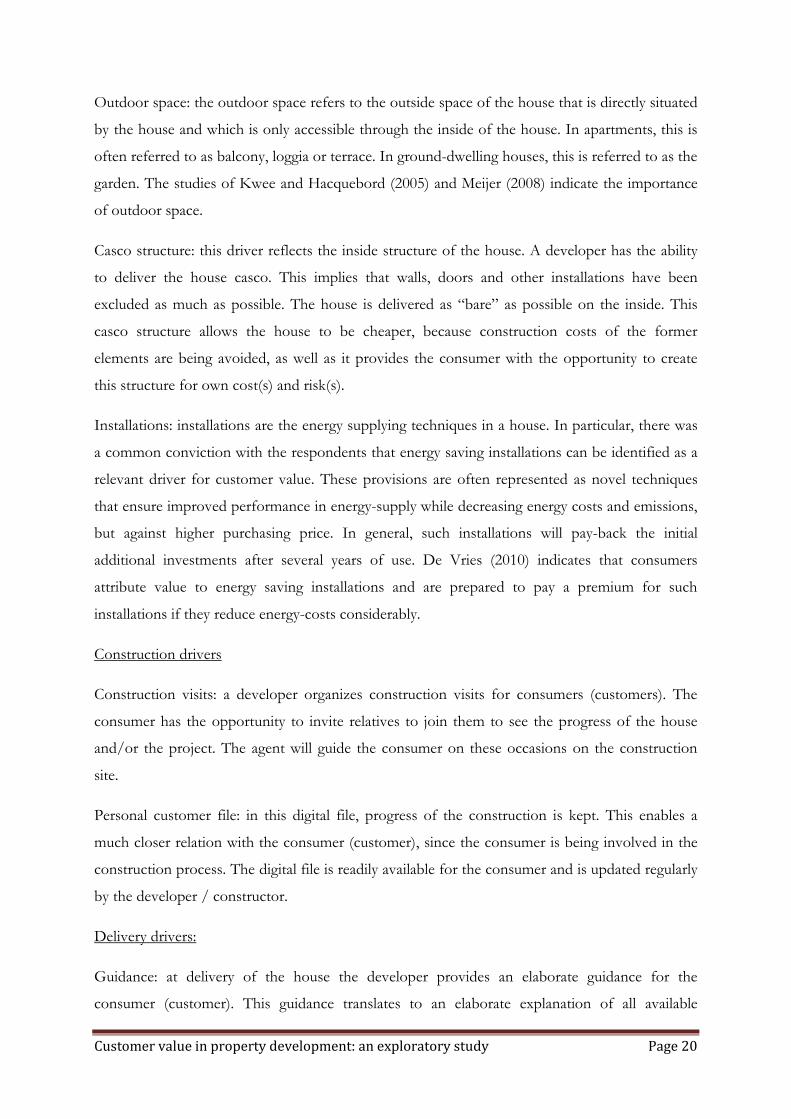
Outdoor space: the outdoor space refers to the outside space of the house that is directly situated
by the house and which is only accessible through the inside of the house. In apartments, this is
often referred to as balcony, loggia or terrace. In ground-dwelling houses, this is referred to as the
garden. The studies of Kwee and Hacquebord (2005) and Meijer (2008) indicate the importance
of outdoor space.
Casco structure: this driver reflects the inside structure of the house. A developer has the ability
to deliver the house casco. This implies that walls, doors and other installations have been
excluded as much as possible. The house is delivered as “bare” as possible on the inside. This
casco structure allows the house to be cheaper, because construction costs of the former
elements are being avoided, as well as it provides the consumer with the opportunity to create
this structure for own cost(s) and risk(s).
Installations: installations are the energy supplying techniques in a house. In particular, there was
a common conviction with the respondents that energy saving installations can be identified as a
relevant driver for customer value. These provisions are often represented as novel techniques
that ensure improved performance in energy-supply while decreasing energy costs and emissions,
but against higher purchasing price. In general, such installations will pay-back the initial
additional investments after several years of use. De Vries (2010) indicates that consumers
attribute value to energy saving installations and are prepared to pay a premium for such
installations if they reduce energy-costs considerably.
Construction drivers
Construction visits: a developer organizes construction visits for consumers (customers). The
consumer has the opportunity to invite relatives to join them to see the progress of the house
and/or the project. The agent will guide the consumer on these occasions on the construction
site.
Personal customer file: in this digital file, progress of the construction is kept. This enables a
much closer relation with the consumer (customer), since the consumer is being involved in the
construction process. The digital file is readily available for the consumer and is updated regularly
by the developer / constructor.
Delivery drivers:
Guidance: at delivery of the house the developer provides an elaborate guidance for the
consumer (customer). This guidance translates to an elaborate explanation of all available
Customer value in property development: an exploratory study Page 21
functions in the house and answering (remaining) questions from the consumer. In property
development, this practice is not common as one might guess.
Flaw minimization: flaws are often present in the house and/or project at delivery. The term
driver might not seem appropriate, because every consumer expects that his house will be
delivered without flaws (Boumeester, Lamain and Mariën 2006). Minimization of flaws at delivery
might therefore be more of a prevention of dissatisfaction (preserver of value), rather than a
value creating driver.
Acquisition costs
Time: acquisition costs refer to all the non-monetary costs that consumers have to make in order
to make the purchase of a house. It refers to all their efforts to bond with the firm as well as their
efforts to participate in the ideation, conceptual and development phase. The largest part of these
costs will be time-related and these costs will increase as the development process progresses. If a
consumer choosing to buy a house in a completed stage (decision point 2, table 2), these
acquisition costs are much lower because a consumer does not have to invest time in co-creation
efforts.
Direct costs
Purchase price: this cost-driver refers to the actual price consumers have to pay for a house.
Construction interest: this cost-driver can be considered as the costs that a consumer (customer)
is obliged to pay to the developer because the developer pre-financed the plot and the
construction of the house. The interest payable by the developer to its financer will be charged to
the consumer above the purchase price.
Operations costs:
Usage costs: the operations costs are reflected as the usage costs. These costs are incurred by the
consumer in daily use of the house and consist of energy – and maintenance costs. There is no
clear subdivision in cost-drivers here, because energy – and maintenance costs are not mutually
exclusive. In general, energy costs are normally higher with low efforts for maintenance and vice
versa.
Customer value in property development: an exploratory study Page 22
4. Proposed conceptual model
4.1 Dominant logic
The literature indicates that the concept of value has transitioned in the past two decades, when a
shift occurred from GD- to SD and from SD- to CD-logic. Although customer value under the
GD-logic is often conceptualized and provides a solid base to build further research on, it must
be recognized that this value is guided through a logic which focuses solely on tangible output of
offerings and neglects the importance of intangible capabilities that contribute to the creation of
value for the consumer (Vargo and Lusch 2004). Property developers are often seen as
manufacturers of tangible products. This is incorrectly assumed because a) the resources to create
the end-product are largely abstract in nature and b) there is a trend visible in which property
developers are only guiding processes for their customers. In these processes, the developer does
not have a financial interest and/or risk in the project, but is merely a service manufacturer for
consumers (Kwee and Hacquebord 2005). Verveen (2008) indicates: “a property developer has
the ability to create value for customers in the development process by applying its intangible
resources, knowledge and skills to guide long-term and complex processes”. This indicates that
the focus of the property development process is gradually shifting towards service-focus (SD-
logic). The CD-logic provides valuable input for further avenues in research on value, but
knowledge in this field is still too preliminary to consider industry-specific application as a real
option for this study. The strongest support is found for modelling customer value under SD-
logic: implying a service orientation for this study towards customer value.
4.2 Delineating basic assumptions
The (proposed) conceptual model will be based on the formative construct proposed by Ulaga
and Eggert (2005) and Ulaga and Eggert (2006). Support is found for this choice, because a) this
model gives a comprehensible interpretation about which components (indicators and
dimensions) constitute the construct of customer value, b) distinctions among the components
based on their effect on customer value are visible, c) the model allows modification to industry-
specific components without losing its core assumptions and d) the model allows the inclusion of
a diversity of components and still retains interpretable. Some distinctions should also be
considered. In contrast to above mentioned studies, customer value instead of relationship value
is the central construct of the conceptual model. While the literature study provides support that
Customer value in property development: an exploratory study Page 23
customer value and relationship value both share the core assumption that value is the offset
when the perceived benefits and costs of a product and/or service are considered, customer
value is more appropriate in the context of this study. This is based on the assumption that
relationship value is confounded and reinforced in an enduring relationship between customer
and supplier in which the relation is based on repetitive purchase of products (Ulaga and Eggert
2005; Ulaga and Eggert 2006). The studies of Arndt (1979), Gadde and Mattsson (1987) and
Wind (1970) provide further support for this assumption. In the context of this study, there is
not an enduring character between a firm and consumer because the purchase of a house is still a
discrete transaction. Vargo and Lusch (2004) and Grönroos and Helle (2010) indicate that the
relationship between consumer and firm is seen as key to achieve customer value, but that these
relationships are not characterized by an enduring character. Customer value is therefore more
appropriate, because it does not necessarily imply the enduring relationship between consumer
and firm (developer).
Industry-specific modeling
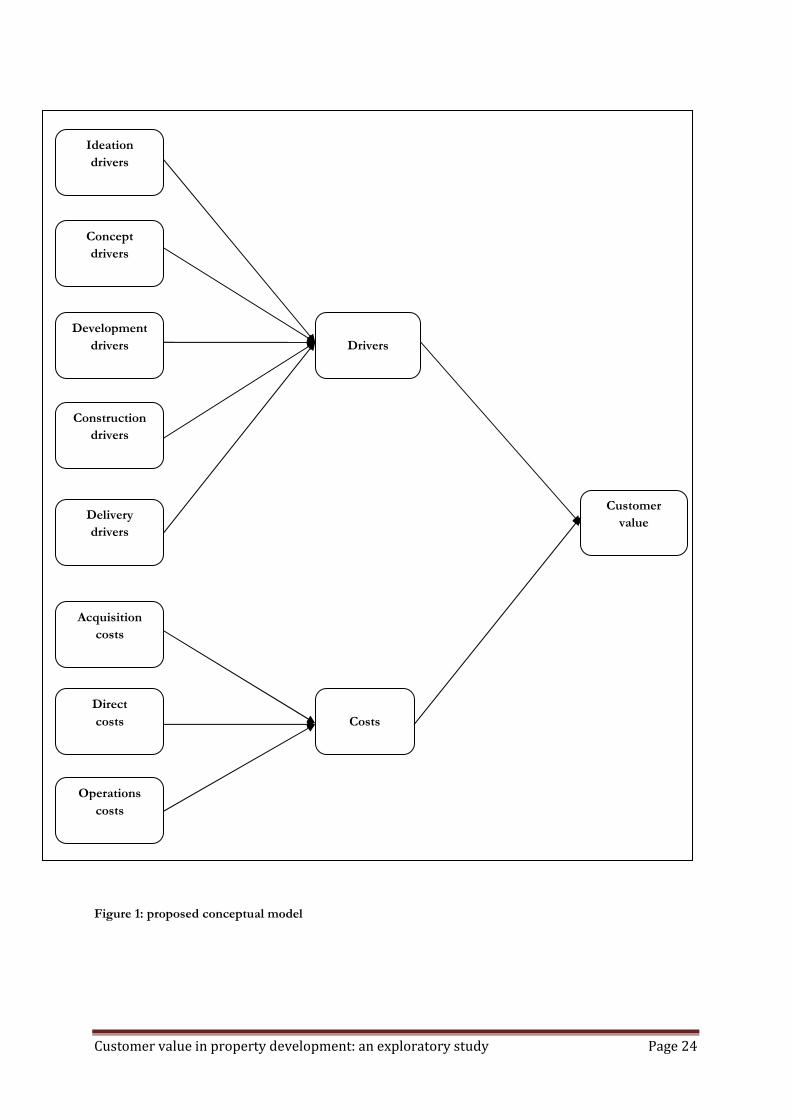
In the conceptual model, there are three-order dimensions. The identified drivers and costs-
drivers in the qualitative study will form the indicators which are connected to their categories of
drivers and costs. These categories represent the first-order dimensions. The choice to include
the identified categories as first order dimensions is made because every category reflects a
relevant phase of the property development process and every phase has its potential
contribution to customer value. The same applies to costs, since every category of costs reflects a
phase for a consumer in which costs are incurred. The second order dimensions Drivers and
Costs are composite dimensions: they represent all the first order dimensions for drivers and
costs together respectively. To prevent confusion between (cost-) drivers as indicators and
drivers/costs as second dimensions, the second order dimensions are indicated as Drivers and
Costs (capital letter in front). The third order dimension is customer value, representing the focal
construct of this study. Figure 1 displays the proposed conceptual model.
Customer value in property development: an exploratory study Page 24
Figure 1: proposed conceptual model
Construction
drivers
Delivery
drivers
Drivers
Development
drivers
Concept
drivers
Ideation
drivers
Costs
Customer
value
Operations
costs
Direct
costs
Acquisition
costs
Customer value in property development: an exploratory study Page 25
5. Quantitative study
5.1 Methodology
Structural equation modelling (SEM) was used to establish a construct for customer value. To
assess which indicators from the survey should be included in SEM, exploratory factor analysis
through principal components factoring (PCA) was performed first in SPSS. PCA was not
performed for the first order cost dimensions (and indicators), since previous research already
confirmed the validity of the proposed cost dimensions (Homburg and Cannon 2001). Since the
goal of the factor analysis is data reduction, PCA is considered as a suitable approach (Hair et al.
2006; Costello and Osborne 2005; Suhr 2006). With the data from PCA in place, Partial Least
Squares (PLS) was used for structural equation modelling with the use of SmartPLS 2.0 (2005).
PLS was chosen because its fits the purpose of prediction better than co-variance based structural
equation models and has more (predictive) accuracy when working with samples sizes below 200
(Henseler, Ringle and Sinkovics 2009). Furthermore, in contrast to co-variance based models,
PLS allows the possibility to simultaneously create formative and reflective models and offers
more robustness in formative modelling (Fornell and Bookstein 1982; Henseler, Ringle and
Sinkovics 2009).
5.2 Survey development
Survey design
Survey was chosen as a means to perform the quantitative study. The operationalizations of the
drivers from the qualitative study were translated into Dutch. To increase understanding from the
respondent, (industry-specific) terminology was changed and/or elaborately explained. This
process was conducted together with the industry professional who cross-validated the coding-
process in the qualitative study. All identified drivers and cost-drivers from the qualitative study
were decided to be incorporated in the survey as indicators. The survey was divided into eight
parts. The first five parts reflected the first order dimensions for drivers and the last three parts
reflected the relevant first cost dimensions for costs. Before each dimension was discussed, an
explanation was provided for respondents about its meaning and purpose. Within each
dimension, its underlying indicators were discussed. Before-mentioned operationalizations served
to provide meaning and content to the indicators.
Customer value in property development: an exploratory study Page 26
Measure development
The survey composed a total of 49 stands. Each stand represented an indicator. Respondents
had to indicate to which degree they agreed with a particular stand. A 7-point rating scale
(1=strongly agree and 7=strongly disagree) was used.
In the survey, 38 stands were designed to identify the validity of the proposed conceptual model
and 11 stands were included to acquire more information about the attitudes of the respondents.
More specifically, 8 out of 11 stands were incorporated to indicate to which degree respondents
are willing to pay extra for certain drivers or less when certain drivers are excluded. To envision
the financial consequences of incorporating drivers, consequent amounts were used. A price of €
200.000,- when the driver is included, a price of € 195.000,- when it is not included (premium of
€ 5.000,-). An exception was the premium for branding, this was set at € 2.500,- (€ 200.000,- and
€ 197.500,-) and the discount when choosing for casco structure at € 15.000,- (€180.000,- and €
195.000,-). The comparison-stands were included, because the meaning of value is really shown
when drivers have financial consequences for the consumer and choices have to be made based
on these consequences. Although the amounts are arbitrarily set, they do have the ability to
envision financial consequences to some degree. Also, 3 stands were incorporated to identify the
preference of respondents for certain drivers. In these stands, no financial sacrifices were
included. By including either/or choices for drivers, potential preferences could be revealed that
were not revealed in the stands for validation of the proposed conceptual model. The survey can
be found in Appendix A (in Dutch).
Survey pretest
The survey was pre-tested by two respondents who were non-industry related. From these pre-
tests some minor changes were made in the phrasing and wording of the survey. No major
changes were necessary to make.
5.3 Data collection
Sampling frame
For data collection, a sampling frame with two samples was available. The primary sample
consists of 603 consumers. What characterizes this sample is that it is collected though a CRM
system of a real estate agent. It consists of consumers who have submitted themselves as
“searchers”, meaning that they are (actively or passively) searching for a newly build ground-
dwelling house or apartment. The main advantage of using such a sample is that most of these
Customer value in property development: an exploratory study Page 27
respondents should have a clear view about their housing preferences and they should therefore
be able to indicate quite clearly what value they attribute to housing. This sample has also
limitations in that it only concerns respondents who are searching in a specific region. Nation-
wide preferences and local preferences might diverge.
The secondary sample was provided as a back-up when the response rate of the primary sample
would be insufficient for further analysis. This sample consists of a panel of maximum 500
respondents. A selection criterion was applied. Only respondents who were actively seeking for a
ground-dwelling house or apartment were obliged to take part in the survey. This sample consists
of nationwide consumers and therefore does not have the limitation of the primary sample.
However, the limitation from this sample is that there is no distinction between respondents
based on their preferences for an existing or newly build house. There could be deviation in
preferences based on this search criterion.
Data collection: sampling procedure
Respondents in the primary sample were contacted through email and invited to participate in the
survey, which was administered through an online survey programme. The purpose and relevance
of the survey was explained to the respondents in advance. To increase the willingness to
participate, an incentive was provided to every respondent who completed the survey. The
incentive is a digital book about art and architecture, which reflects the central theme of this
study to some degree.
Data collection: response
From the primary sample of 603 consumers, 110 responses were collected. This amounts to a
response rate of 18,2%. For online surveys, such a response rate is considered as average and
sufficient (Deutskens et al. 2004). However, 21 of those responses were removed because of
excessive missing data. The final sample of responses amounted to 89. Factor analysis requires a
minimum ratio of 5 observations (responses) per indicator (Hair et al. 2006). Since 38 indicators
are used for validation of the proposed conceptual model, the minimum amount of responses
required is 190. Therefore, the secondary sample was used to collect the required responses. 100
panel respondents were invited to participate in the survey. Ultimately all respondents
participated, amounting to a response rate of 100%. None of the responses had to be deleted due
to excessive missing data. From both samples, a total of 189 responses were collected. This is
almost equivalent to the minimum sample size required for factor analysis. It is the expectation
Customer value in property development: an exploratory study Page 28
that during the process some indicators will be deleted and that the required sample size will be
met.
Data collection: respondents’ characteristics
There are some basic respondents’ characteristics. In the final sample, 55% of the respondents
are male, 45% are female. The largest part of the respondents fall within the age-category of 25 to
35 (42%), while the mean age-category is 36 to 45. Furthermore, most of the respondents fall in
the income class of 50.001 to 70.000 euro, while the mean income category is the income
category of 35.001 to 50.000 euro. Moreover, most of the respondents have a higher educational
degree and the mean also lies within this group. Their housing situation also reveals some basic
characteristics about the respondents: 74% of the respondents currently own a house and from
this 74%, a majority of 75% owns a ground-dwelling house, while 25% owns an apartment.
However, the most important characteristic is the searching efforts. 132 of 189 (70%)
respondents indicated that they are still in active search for a newly build house. Of those 132
respondents, 71% are in active search for a ground-dwelling house and 29% are in active search
for an apartment.
Customer value in property development: an exploratory study Page 29
6. Results
First, response bias was assessed. To check whether significant differences exist between the
primary and the secondary sample, Levene’s test was performed using SPSS at 95% confidence
interval. Accordingly, all indicators except installations 1 and installations 2 are above the 0,05
significance level (Hair et al. 2006). The data displays strong signs of homoscedasticity, because
36 out of 38 indicators do not show a sign of inequality in population variance. It is concluded
that there are no significant differences between the responses from both samples of respondents
(at α = 0,05). Considering the large combined sample size in relation to the large amount of
indicators that show non-significant values, it is not necessary to apply remedies for both
indicators with significant values (Hair et al. 2006). Appendix B displays the output of Levene’s
test.
6.1 Factor analysis
The first step in the process was to check the normality of the data by looking at the skewness
and kurtosis. There do not seem to be extreme values in the data, since all indicators fall within
the statistical norms to assume normality. Excess kurtosis lies within the range of -3/6 and
skewness lies within the range of -3/3 (Fiori 2008; Hair et al. 2006). In the second step
parameters were set for PCA. PCA with varimax rotation was performed on the indicators.
Varimax as a rotational method is appropriate when choosing PCA, because orthogonal rational
methods do not assume correlations between factors. This is in line with the assumptions of PCA
(Hair et al. 2006; Suhr 2006). The third step consisted of judging the output shown by PCA. At
first glance there is a sufficient amount of correlations between indicators above the threshold of
0,4 indicating appropriateness for factor analysis (Hair et al. 2006). The Kaiser-Meyer-Olkin
(KMO) measure of sampling adequacy has a value of 0,747 and Bartlett’s test of sphericity
indicates a value of 0,00. Both values support the assumption of appropriateness for factor
analysis (Hair et al. 2006). The fourth step involves the judgement of the communalities. This
threshold is set at 0,6, following the assumptions made by Yeomans and Golder (1982) that
higher communalities improve the quality of factor analysis. Three indicators (community
building 1, surface and flaw minimization) became candidates for deletion based on their
communalities which were lower than 0,6. In the variance matrix, there are 8 factors retained
with an Eigenvalue above 1,0 according to the Kaiser-criterion (Hair et al. 2006). Together these
8 factors explain 69,7% of the variance. The final step involved the rotated component matrix.
All indicators have loadings of 0,5 or higher on their respective factors and no cross-loadings
Customer value in property development: an exploratory study Page 30
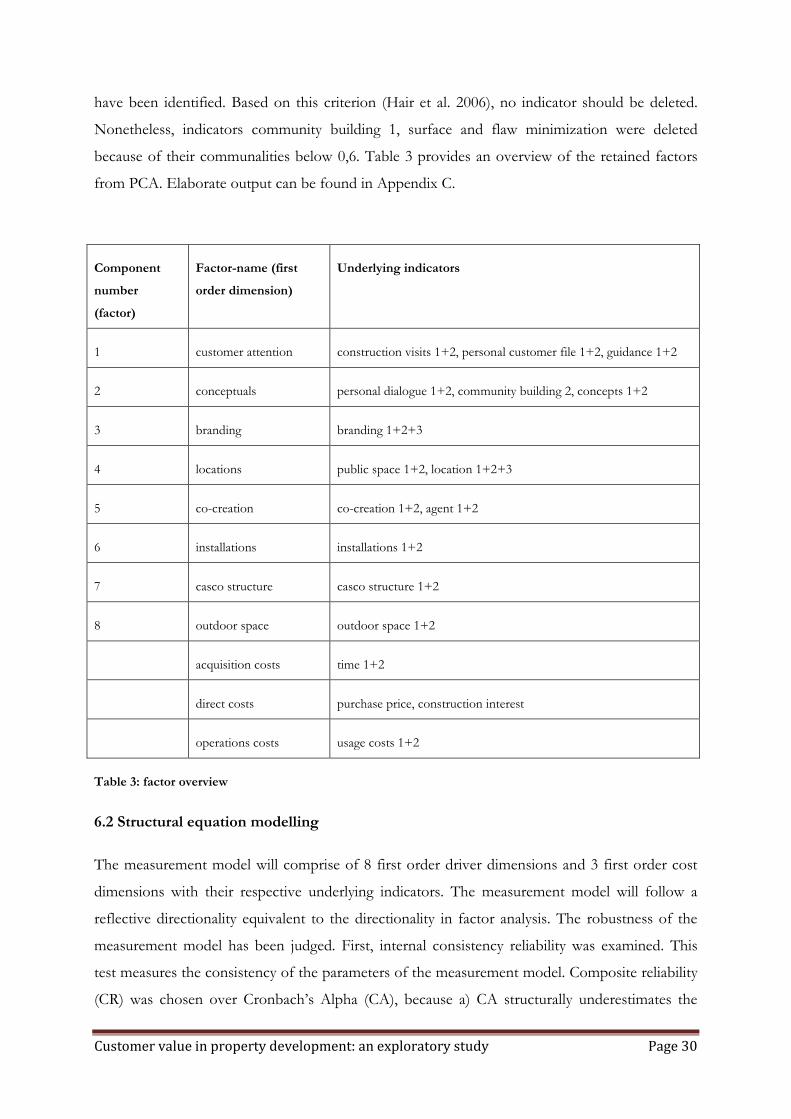
have been identified. Based on this criterion (Hair et al. 2006), no indicator should be deleted.
Nonetheless, indicators community building 1, surface and flaw minimization were deleted
because of their communalities below 0,6. Table 3 provides an overview of the retained factors
from PCA. Elaborate output can be found in Appendix C.
Component
number
(factor)
Factor-name (first
order dimension)
Underlying indicators
1 customer attention construction visits 1+2, personal customer file 1+2, guidance 1+2
2 conceptuals personal dialogue 1+2, community building 2, concepts 1+2
3 branding branding 1+2+3
4 locations public space 1+2, location 1+2+3
5 co-creation co-creation 1+2, agent 1+2
6 installations installations 1+2
7 casco structure casco structure 1+2
8 outdoor space outdoor space 1+2
acquisition costs time 1+2
direct costs purchase price, construction interest
operations costs usage costs 1+2
Table 3: factor overview
6.2 Structural equation modelling
The measurement model will comprise of 8 first order driver dimensions and 3 first order cost
dimensions with their respective underlying indicators. The measurement model will follow a
reflective directionality equivalent to the directionality in factor analysis. The robustness of the
measurement model has been judged. First, internal consistency reliability was examined. This
test measures the consistency of the parameters of the measurement model. Composite reliability
(CR) was chosen over Cronbach’s Alpha (CA), because a) CA structurally underestimates the
Customer value in property development: an exploratory study Page 31
reliability of the first order dimensions (factors) in the measurement model (Raykov 1998) and b)
the CR-coefficient is superior to the CA-coefficient, because CR does not assume that all
indicators in the measurement model are equally weighted (Fornell and Larcker 1981). All
dimensions have values above 0,7, except for the first order dimension operations costs and the
second order dimension Costs which have values of 0,63 and 0,68 respectively. Diamantopoulos
and Siguaw (2000) prescribe a threshold of 0,6 for CR. Since all dimensions denote values above
0,6, none of the constructs will be deleted based on CR. Second, convergent validity was
assessed. Convergent validity indicates the degree to which indicators in a dimension have
similarity in their meaning. There are two methods to assess this: a) through the average variance
each dimension extracts from its indicators (AVE) and b) by looking at the standardized loadings
of the indicators to their respective dimension. AVE has to exceed 0,5 (Fornell and Larcker 1981;
Hair et al. 2006) to show a sufficient amount of convergent validity. All first order dimensions
have AVE values above 0,5. If one looks at the standardized loadings, sufficient convergent
validity is shown when factor loadings exceed 0,5 and a good convergent validity is shown when
loadings exceed 0,7 (Hair et al. 2006). Of the 38 indicators, 34 indicators have loadings that
exceed 0,7, 3 indicators have loadings that exceed 0,5 and only one indicator (usage costs 2) has a
loading below 0,5. This indicator is not directly removed because of its potential contribution to
the model, but is critically monitored. Third, discriminant validity was assessed. Discriminant
validity represents the degree to which indicators actually belong to their respective dimensions.
Discriminant validity will be judged based on the Fornell-Larcker criterion (Fornell and Larcker
1981) which prescribes that the root of the AVE of one dimension has to exceed the correlations
that this dimension has with all other dimensions. This criterion is met. Another way to judge
discriminant validity is by assessing potential cross-loadings (Hair et al. 2006). However, this was
already performed during PCA during which no cross-loadings were indicated. To ensure that no
cross loadings exist in the cost-indicators, these indicators were separately assessed in PLS. Data
confirmed that there were no cross-loadings in the cost-indicators either. Finally, face validity
was reviewed. According to Hair et al. (2006), face validity represents “the extent to which the
content of the items is consistent with the construct definition”. The focus is here on the
coherence between the indicators’ meaning and the definition of their dimension. There are no
numerical criteria available to evaluate this. To ensure some validation, the definition of the
dimensions was discussed with the industry professional who participated earlier in this study. No
changes were required to make in the definition of the dimensions, providing support that there
is coherence between indicators and dimensions. Furthermore, there seems to be a logical
coherence in the grouping of indicators under factors, supporting face validity further. Since the
Customer value in property development: an exploratory study Page 32
purpose of PLS is prediction (as opposed to fit), no fit-indices are available for the measurement
model (Fornell and Cha 1994). All data used to assess the robustness of the measurement model
can be found in Appendix D.
Effects in the structural model
The structural model follows a formative directionality and envisions the relations among the
dimensions. First, the direct effects (regression coefficients) show that customer attention has the
strongest effect on drivers with a regression coefficient of 0,39. This is followed by conceptuals
(0,30), locations (0,24), co-creation (0,23) and branding (0,16). Installations (0,08), casco structure
(0,07) and outdoor space (0,04) have relatively weak effects on drivers. When the costs are
assessed, direct costs have the strongest influence on costs (0,66), followed by operations costs
(0,37) and acquisition costs (0,35). Second, where Drivers has a very strong direct effect on
customer value (0,95), Costs has a relatively weak direct effect on customer value (0,10).
However, the effect of Costs on customer value (its sign) is positive where a negative effect was
anticipated. Third, when the total effects (path coefficients) are taken account, the first order
dimension customer attention still has the strongest effect on customer value (0,37), followed by
conceptuals (0,28), locations (0,23), co-creation (0,22) and branding (0,16). Again, installations
(0,08), casco structure (0,07) and outdoor space (0,04) exhibit a relatively weak effect on
customer value. Because of the strong effect of Drivers on customer value, there is only minor
deviation in direct effects and total effects. When the costs are reviewed another image emerges.
The path coefficients indicate that the total effects of all three cost dimensions on customer value
are relatively weak: direct costs (0,06) provide the strongest effect on customer value, followed by
operations costs (0,04) and acquisition costs (0,03). There is a large deviation between direct and
total effects among the cost-dimensions, which is caused by the relatively weak direct effect of
Costs on customer value. A first measure to judge the structural model is the T-statistic.
Bootstrapping was performed to discover relevant T-statistics using the option “no significant
changes” in the SmartPLS 2.0 (2005) bootstrapping menu with a re-sampling number of 400. The
options construct level changes and individual sign changes were not used, because construct
level changes has the potential danger to increase the standard errors of the total effects (path
coefficients) to an unsatisfactory high level when different re-sampling numbers are used
(Tenenhaus et al. 2005), while the individual sign changes is avoided because of a lack of
coherence when the sign from the re-samples is made consistent to the original sample
(Tenenhaus et al. 2005). Support in the data is found that there are no large discrepancies
between the resample mean and original sample mean (only small values for the standard error of
Customer value in property development: an exploratory study Page 33
the mean). This indicates the appropriateness for the option no significant changes. The results
of the bootstrapping procedure indicate that all total effects (path coefficients) are significant at
95% (α = 0,05) confidence interval, except for the total effect of outdoor space on drivers. This
effect is only significant at 90% confidence interval (α = 0,10). The second measure to assess the
structural model is the R-square. The R-square value of Drivers is 0,999 and for Costs it is 0,998.
This results in an R-square for customer value of 0,999. These values seem to indicate that the
robustness of the structural equation model (SEM) is optimal (Chin 1998), since almost all
possible variance in customer value is explained by its underlying dimensions. Because these
values might seem quite extreme, the complete SEM was checked. No errors were found,
indicating support for the validity of these R-square values. A third measure to judge the
structural model is through the effect sizes (f2). The f2 compares the increase in explained
variance by the endogenous dimensions (R-square) with the increase in variance that is
unexplained explained by the endogenous dimensions (Henseler, Ringle and Sinkovics 2009).
This can be tested by excluding one of the second-order dimensions from the model (Wong
2006). When Costs are deleted, the f2 becomes 5 and when Drivers are deleted, the f2 becomes
453. These values are largely above the minimum threshold of 0,02 (Cohen 1988) and can be
considered as very strong. These extreme values are largely due to the fact that the R-square of
customer value has such a high value. Even fractional changes in this R-square result in high
values for f2, because these changes are divided by an even smaller value (1 - R-square included,
or 1 - 0,999). Elaborate output for structural assessment of PLS can be found in appendix D.
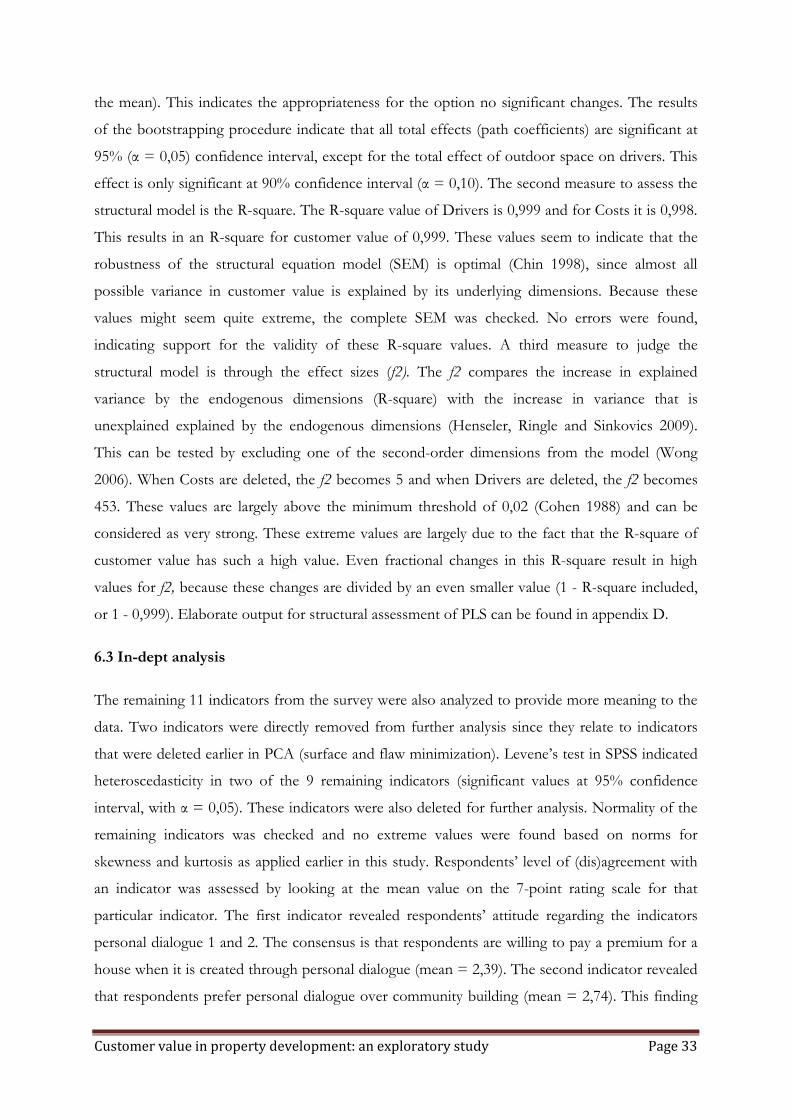
6.3 In-dept analysis
The remaining 11 indicators from the survey were also analyzed to provide more meaning to the
data. Two indicators were directly removed from further analysis since they relate to indicators
that were deleted earlier in PCA (surface and flaw minimization). Levene’s test in SPSS indicated
heteroscedasticity in two of the 9 remaining indicators (significant values at 95% confidence
interval, with α = 0,05). These indicators were also deleted for further analysis. Normality of the
remaining indicators was checked and no extreme values were found based on norms for
skewness and kurtosis as applied earlier in this study. Respondents’ level of (dis)agreement with
an indicator was assessed by looking at the mean value on the 7-point rating scale for that
particular indicator. The first indicator revealed respondents’ attitude regarding the indicators
personal dialogue 1 and 2. The consensus is that respondents are willing to pay a premium for a
house when it is created through personal dialogue (mean = 2,39). The second indicator revealed
that respondents prefer personal dialogue over community building (mean = 2,74). This finding
Customer value in property development: an exploratory study Page 34
is supported by the data from SEM, because the indicators personal dialogue 1 and 2 have larger
standardized loadings (0,767 and 0,783) than the indicator community building 2 (0,672) on
conceptuals. The third indicator revealed that respondents are willing to pay a premium for a
house when it is created through concepts (mean = 2,60). The fourth indicator revealed that
respondents are willing to pay a premium for the design of public space (mean = 2,66). The fifth
indicator revealed that respondents have only a very small tendency towards paying a premium
for a house when it is developed through co-creation (mean= 3,57). The sixth indicator pointed
out that respondents have a neutral attitude (neither agree, nor disagree) towards paying a
premium for installations (mean = 3,97). Finally, the seventh indicator revealed that respondents
have a neutral attitude towards paying a premium for a house from a developer which has a
brand(name) (mean = 3,97). Levene’s test for the indicators above is displayed in Appendix E.
Customer value in property development: an exploratory study Page 35
7. Discussion
The results of the three subsequent processes of the quantitative study each provide valuable
insights in customer value in industry-specific context. From the results of PCA, some insights
emerged. Compared to the proposed conceptual model of 5 first order driver-dimensions a
distinction is visible when the 8 factors retained from PCA form the first order driver-
dimensions. This distinction shows that a) the proposed dimensions that reflect relevant phases
of the property development process are not interpreted by respondents as such, b) respondents
distinguish between tangible drivers (indicators) that reflect physical characteristics of a house
and intangible drivers that reflect processes in which some form of interaction between
consumer and developer is present and c) respondents link drivers that have a means-ends
relation with each other. In example: the drivers co-creation and agent both load high on the
same dimension, the drivers personal dialogue, community building and concepts as well. The
exclusion of community building 1 has no major implications since community building 2 is kept
in the process. The exclusion of surface and flaw minimization has stronger implications. At first
glance, results might seem to imply that surface is not important to consumers. This is an
incorrect assumption. Inferred from the operationalization of this driver in the survey, the results
show that respondents do not necessarily indicate a bigger surface than their current house as a
driver for customer value. It is still plausible that consumers have basic expectations about the
minimum surface of a house, as implied as by Verveen (2008), but the results from this study do
not support or contradict this assumption. Also, it might seem that flaw minimization is not
important to respondents either. Inferred from the operationalization of this driver, respondents
do not seem to indicate that the presence of flaws at delivery of a house influences their
perception of quality. In this operationalization, flaw minimization is not a driver of customer
value. That does not mean that flaw minimization is not important to consumer value. The
assumptions made by Boumeester, Lamain and Mariën (2006) that because every consumer
expects that his house will be delivered without flaws cannot be supported or contradicted based
on the results of this study. Further research is required to provide insight into the true
contribution of surface and flaw minimization to customer value.
7.1 The role of components to customer value
When it comes to structural equation modelling, some insights emerge as well. First, one of the
most important findings is that the direct effect (regression coefficient) of Drivers (0,955) on
customer value is far stronger than the direct effect (0,10) of Costs on customer value. These
Customer value in property development: an exploratory study Page 36
results indicate that Drivers have far more potential than Costs to differentiate on customer
value, which is in line with previous studies (Ulaga and Eggert 2005; Ulaga and Eggert 2006).
However, in contrast with the studies of Ulaga and Eggert (2005) and Ulaga and Eggert (2006)
and in line with the study of Ulaga (2003) Costs does not have a negative effect on customer
value. The costs can be interpreted as (alternative) value drivers to customer value. The way in
which the indicators (stands) were operationalized in the survey has caused this deviation,
because costs were not interpreted by respondents as sacrifices, but as sources to differentiate on
customer value.
The influence of drivers
The total effects (correlation coefficients) of the first order dimensions on customer value display
some interesting insights. According to the results, customer attention displays the strongest
effect on customer value. These results provide evidence that consumers want to be (more)
involved during construction and delivery of their house. Two underlying drivers (construction
visits and guidance) provide evidence that consumers have a need for personal interaction. The
driver personal customer file implies that consumers attribute value to some sort of (distant)
control on the construction process. The dimension conceptuals displays a strong effect on
customer value as well, thereby providing support that conceptuals form a solid base to create
customer value. The results indicate the grouping of the (intangible) drivers personal dialogue/
community building and concepts, providing evidence that these processes are means to create
concepts. These findings also confirm the importance of community building (Hoyer et al. 2010)
and concepts (van Leent 2009) in property development. Locations also displays a considerable
effect on customer value, which is in line with the results of Baroussa, Hoesli and Peng (2003).
The location is operationalized as a comparison between aspects of the location of the current
house and the location of a new house. Respondents attribute considerable value to improving
the location of their new house. The public space is seen as equivalent important in the
perception of the consumer to increase customer value, providing support for the assumption(s)
made by Verveen (2008). Considerable effect on customer value is also displayed through co-
creation. The grouping of the underlying drivers co-creation and agent provides evidence that
consumers see co-creation and an agents’ guidance as (necessary) complements. The results from
this study support assumptions made by Vargo and Lusch (2004) and Grönroos and Helle (2010)
that co-creation is an effective tool for creating customer value. A moderate effect on customer
value is displayed by branding. Although results from the qualitative study indicate that there is
skepticism among some industry professional about its value in property development, branding
Customer value in property development: an exploratory study Page 37
seems to positively affect customer value. A possible explanation is that branding might increase
consumers’ awareness of a particular developer and thereby enhances the perception of image
and quality in the consumer mindset. This result supports earlier work by Baldauf, Cravens and
Binder (2003) and Zeithaml (1988) in industry-specific context. Furthermore, installations, casco
structure and outdoor space display a relatively weak effect on customer value. The data indicates
that respondents do not attribute strong value to installations. A possible explanation could be
that consumers seem to reason from their own financial situation and might not believe that
installations will decrease energy costs enough to compensate for the higher purchase price
associated with those installations. Therefore, only limited support is found for the study of de
Vries (2010). The same upholds for casco structure. The data seems to reveal that consumers do
not attribute considerable much value to a house delivered with casco structure. A possible
explanation is that consumers might not prefer to construct the inner-space of a house because
of the (potential) high costs and risks associated with such an endeavor. Apparently, the financial
advantage in the initial purchase price does not compensate the associated costs and risk(s)
sufficiently. Finally, outside space has the weakest effect on customer value and in contradiction
to all other dimensions this effect is only significant at a 90% confidence interval. This result
indicates that the presence of outdoor space in a house is not such an obvious driver to customer
value as previous publications (Kwee and Hacquebord 2005; Meijer 2008) imply.
The influence of costs
The effects of all three dimensions on customer value are considered to be relatively weak.
Among the cost dimensions, direct costs relatively offer the most grounds to differentiate on
customer value. Within the direct costs, differentiating on leveling the purchase price of the new
house towards the value of the current house of a consumer and omitting construction interest
from the purchase price might seem to influence direct costs quite strongly, but will eventually
not affect customer value to a large degree. In particular the leveling of the purchase price is very
hard to achieve by a developer, since consumers might not directly provide insights into the value
of their own house, as well as that consumers might start interaction with the developer when the
pricing is already set. It seems that omitting construction interest is the most promising avenue to
differentiate on direct costs, since it is relatively easy for a developer to deploy such a driver.
Differentiating on operations costs provides less ground to influence customer value. Results
indicate that, in line with the limited effect of installations on customer value, consumers are too
not keen on decreasing usage costs (energy- and maintenance costs) when such a decrease is
considered to be accompanied with an increase in purchasing price of a house. To conclude,
Customer value in property development: an exploratory study Page 38
acquisition costs offer the least grounds for differentiating on customer value. Apparently, time
(non-monetary costs) a consumer has to spend in order to develop and purchase a house is not
considered as evident. Therefore, initiatives of standardized houses which allow none or only
minor input from the consumer for the grace of saving consumers’ time will possibly only
marginally have an effect on customer value. Figure 2 shows the final conceptual model for
customer value. The final conceptual model shows the importance of the intangible dimensions
(and drivers) for customer value, implying that the service orientation (SD-logic) of a developer is
considered as (very) important for value creation. These results are in line with the study of
Vargo and Lusch (2004).
7.2 Attitudes of the consumer
First, consumers are actually willing to pay a premium for a house when it is developed through a
personal dialogue between consumer and developer. This indicates that consumers are more than
only willing to make non-monetary sacrifices in this process. A potential explanation could be
that consumers might see this initiative as an important means for them to increase value of their
house. Second, respondents prefer personal dialogue over community building. A possible
explanation is that community building is more distant and offers less interaction than personal
dialogue. Perhaps the consumer might have the impression that his needs are better translated by
the developer when such initiatives are exploited in a personal setting. Third, respondents are
willing to pay a premium when concepts are developed which can be judged by them. This
indicates a strong coherence between personal dialogue and concepts. Both processes have
strong potential for value creation as well that it are possible sources to generate alternative funds
for a developer. Fourth, the importance of the quality of public space is confirmed, because
respondents indicate that they are willing to pay extra for a house when they perceive that a
developer allocates sufficient resources to the design of a public space. Fifth, respondents have
only a small tendency towards paying extra for co-creation initiatives between consumer and
developer. Perhaps consumers see such a driver more as a fundamental requirement than as a
valuable option. Sixth, respondents have a neutral attitude towards paying extra for installations
and branding. Installations do not provide a solid base to increase additional funding because
results above indicate that installations have only limited potential to increase customer value.
Branding might have strong potential in convincing a consumer to choose for a house of a
certain developer over another house and/or developer. In that sense, it might be a stimulator for
consumers but it is not necessary a potential source to increase the purchase price of a house.
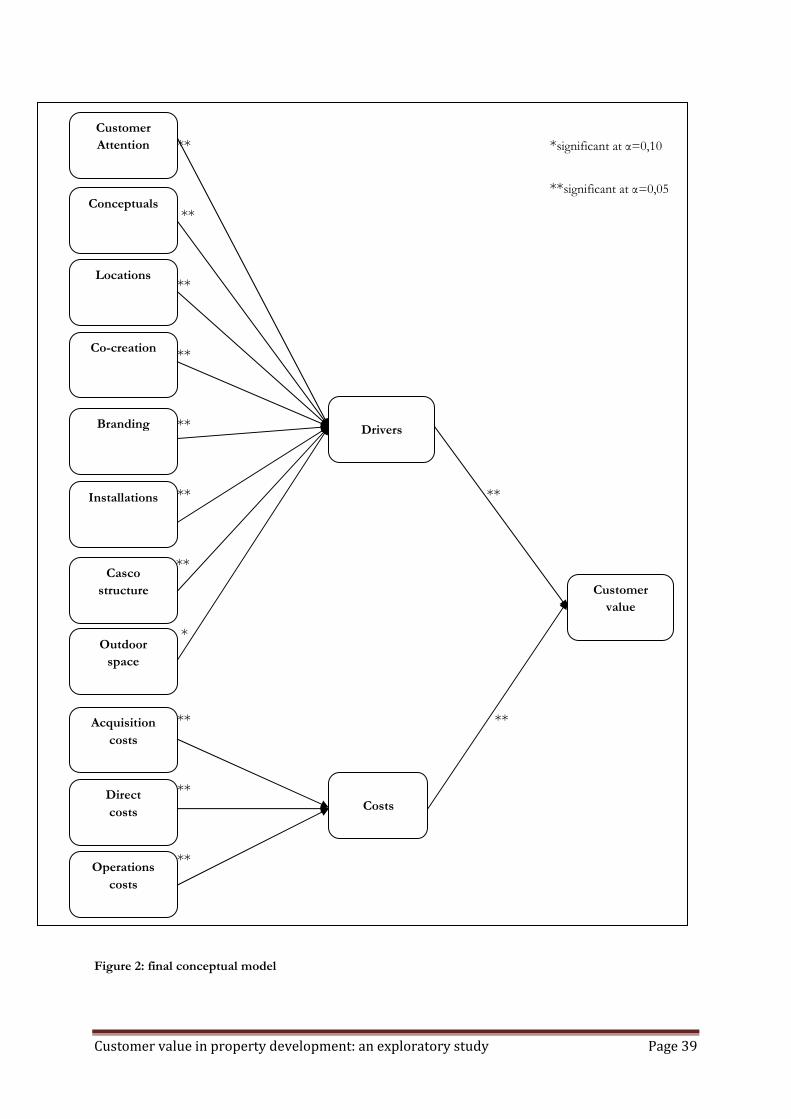
Customer value in property development: an exploratory study Page 39
** *significant at α=0,10
**significant at α=0,05
**
**
**
**
** **
* **
*
** **
**
**
Figure 2: final conceptual model
Branding
Casco
structure
Drivers
Co-creation
Locations
Conceptuals
Costs
Customer
value
Operations
costs
Direct
costs
Acquisition
costs
Customer
Attention
Installations
Outdoor
space
Customer value in property development: an exploratory study Page 40
8. Conclusions and recommendations
The discussion of the results has delivered interesting insights for customer value in industry-
specific context. Conclusions and recommendations are provided below.
8.1 Conclusions
The core components of customer value in (residential) property development are Drivers and
Costs. These components are the foundation for the formative construct customer value. In line
with the results from Ulaga and Eggert (2005) and Ulaga and Eggert (2006) Drivers have far
more potential than Costs for influencing customer value. However, contrary to previous studies
Costs does not have a negative effect on customer value. The effect is positive, implying that
costs represent an (alternative) source to increase customer value. This deviation has
consequences for the industry, because customer value can be increased by focusing on the
drivers or on the costs, or both. This creates a solid opportunity for a developer, because its value
proposition can be dually focused.
The main research question of this study becomes central again: Which components of customer value
can be identified in the residential property development market?
Instead of five driver dimensions, eight driver dimensions are established in the conceptual
model, while the three dimensions for costs are retained in the final model. The most important
consequence is that some drivers (indicators) have means-end relations with each other. This
means that the results point towards the necessity to combine certain drivers in order to create an
(desired) effect on customer value. The deployment of those drivers alone might not deliver an
(desired) effect in customer value.
When the model is taken into account all dimensions seem to influence customer value, although
there are differences in the effects among those dimensions. Customer attention has the strongest
potential to differentiate on customer value. These results imply that the strongest increase in
customer value can be achieved in the phases after development: during construction and
delivery. The drivers that compose customer attention are focused on acknowledging the
consumer as important by creating interaction between consumer and developer. This is in
particular interesting since these drivers are relatively easy to deploy in the current business
processes of a developer and therefore form low-cost instruments for influencing customer
value. Conceptuals displays a quite strong effect as well, indicating that consumers attribute value
to (actively) collaborating with the developer, either through dialogue or through an online
Customer value in property development: an exploratory study Page 41
community, in creating (project) ideas. These ideas are then translated into concepts that can be
judged by those same consumers. There is indication for a means-end relation between personal
dialogue and community building on the one hand and concepts on the other hand, which
supports the assumption that these drivers should be deployed together. Consumers indicate that
they prefer personal dialogue over community building. Integrating such efforts will be
challenging, but conceptuals have strong potential for project success (van Leent 2009) because
a) many of the core elements of a project will be shaped in this process, b) these initiatives
provide a base for bonding between consumer and developer in an early phase and c)
respondents indicate that they are willing to pay a premium for a house developed through
personal dialogue and through concepts. A developer could use these insights to create additional
funding to increase profit and/or to cover the costs for deploying these drivers. Locations has
considerable influence on customer value. The results indicate that consumers have preference
for a location that has better quality than the location of their current house. Public space is
important as well for consumers. A developer should deploy sufficient resources to design public
space, in particular because this driver has the potential to create additional funding for a
developer. Co-creation has a considerable influence on customer value as well. Another possible
means-end relation is identified here. When co-creation is offered to customers, data seems to
provide evidence that an agent should guide and support consumers in this process. In the end,
correcting mistakes made in this process because of a lack of guidance are often more expensive
than the extra costs for initial guidance. Furthermore, the agent can function as an image-builder
to consumers. However, there is only marginal support whether consumers are willing to pay
extra for a house created through co-creation. It is well possible that in the consumers’
perception such an initiative should be incorporated as standard by a developer, not as a
premium. Furthermore, branding has moderate influence on customer value, indicating that
consumers are sensitive towards the awareness and image of a developers’ brand(name). This
might influence their commitment towards a project and/or house based on the brand of the
developer. This could be a valuable asset for a developer to create commitment, but it is
questionable whether consumers are willing to pay a premium for the brand of a developer.
Casco structure has only a small effect on customer value, indicating that consumers are only
marginally prepared to create inside construction for own expenses and risk. Installations provide
small potential as well to influence customer value, perhaps because consumers are not
convinced that these installations will decrease energy costs enough to compensate for the
additional purchasing price compared to conventional installations. Charging a premium for
installations is questionable, considering the limited effect on customer value along with the
Customer value in property development: an exploratory study Page 42
neutral attitude of the respondents towards paying a premium for this. Outdoor space has the
smallest effect on customer value from all driver dimensions. Contradictory to what many
industry professionals believe, outdoor space is not seen by consumers as a strong source to
differentiate on customer value. Unfortunately, direct-, operations- and acquisition costs do not
offer much ground for differentiating on customer value either because of their relatively weak
effects on customer value. This implies that it is difficult for a developer to differentiate on
customer value based on direct costs through equal pricing of the new house in relation to the
(value of the) current house and the exclusion of construction interest from the purchase price.
Neither do consumers indicate that differentiating on usage costs (operations costs) affect their
perception of customer value strongly, nor does focusing on saving time (acquisition costs) for
consumers by offering them a standardized house and/or standardized housing solutions.
Service orientation
Finally, if one looks at the amount of dimensions and drivers with an intangible character,
applying a service orientation (SD-logic) towards creating customer value in property
development seems to be a promising avenue. In particular, the dimensions with the strongest
influence on customer value (customer attention and conceptuals) have a strong intangible,
service-oriented character. Although tangible output of the product is still important, as the
dimension locations indicates, the focus is shifting towards the service aspects provided by a
developer to a consumer. The development process of a house is not a distant and insignificant
process for a consumer. Rather, it is an integral part of their value creation. The development
process has huge influence for project success, since commitment is created early in this process
and is reinforced during the process (Grönroos and Helle 2010).
8.2 Recommendations
Applying a service orientation is strongly recommended for a developer, since the strongest
components of customer value have strong intangible character. A developer should recognize
the importance of the (development) process as such and should integrate the consumer as a
central actor in the process for mutual value creation. Furthermore, it is recommended to focus
stronger on Drivers to differentiate on customer value than Costs. Moreover, detailed
recommendations are also provided. First, customer attention should be one of the main focus
points of a developer. It is recommended that a developer enrolls the consumer in the
construction- and delivery phase, through a) organizing construction visits, b) creating personal
customer file for a consumer to keep track of the construction from a distance and c) providing
Customer value in property development: an exploratory study Page 43
elaborate guidance at delivery of the house. Second, conceptuals is more challenging to
implement into the current processes of a developer and demands significant financial and
organizational resources. It is recommended that personal dialogue is chosen over community
building as a means for value creation. The usage of concepts complementary to the personal
dialogue and/or community building is also strongly recommended. Furthermore, a developer
should exploit the consumers’ willingness to pay extra for houses developed through personal
dialogue and concepts by charging premiums for these drivers. Third, in locations there should
be a focus on the location and the public space(s) of a project. Both drivers have significant
potential for value creation and it is recommended that for both drivers sufficient resources are
deployed. Furthermore, it is recommended that a developer uses knowledge about the
consumers’ willingness to pay extra for the design of public space to create additional funding.
Fourth, co-creation is recommended as well and it is strongly recommended that an agent is
deployed to guide consumers in this process. This also requires considerable allocation of
financial and organizational resources, but it is advised not to save costs by providing co-creation
to consumers without an agents’ guidance. The charging of premiums for co-creation should be
done with some consideration. Fifth, it is recommended that a developer creates a brand(name)
to get awareness in the market and to actively manage this brand across its projects and all
communication towards (relevant) stakeholder groups. Charging a premium for a house based on
a developers’ brand(name) should be done with some consideration as well. Sixth, focusing on
casco structure, installations and outdoor space to differentiate on customer value is
recommended to a lesser degree, because of their limited potential to differentiate on customer
value. Charging premiums for installations should be done with strong consideration. Seventh,
focusing on costs as (alternative) drivers is also recommended to a lesser degree, because
differentiating based on acquisition costs, direct costs and operations costs will only weakly
influence customer value. Focusing on Costs should be complementary to focusing on Drivers,
but only under the condition that the deployment of cost-drivers is relatively easy and
inexpensive. When such deployment is accompanied with considerable financial investments
and/or organizational adjustments, the incremental advantage(s) from these cost-drivers to
customer value might not weigh up to the incremental costs to have to be made to deploy them.
Customer value in property development: an exploratory study Page 44
9. Contribution, limitations and research directions
9.1 Contribution
The contribution of this study is that is has provided insight into which components (dimensions
and drivers) lead to customer value within the property development process in the context of
the Dutch residential real estate market. Since no attempts have been made earlier to model
customer value as a formative construct in industry-specific context, a base has been established
to build further research on. By empirically examining which components contribute to customer
value in property development, assumptions based on theory or wishful thinking have been
replaced with quantitative data to support these assumptions. Furthermore, there has not been a
quantitative study (as far as known) that has measured a large diversity of (tangible and
intangible) components in property development process simultaneously. Most quantitative
studies in industry-specific context, if conducted at all, only focus on specific components. It is
the wide range of components included in this study that provides the bigger picture. It enables
management to scan a wide range of potential value drivers and to compare their contribution.
Moreover, this study has contributed to the understanding of consumers’ attitudes towards
(financial) sacrifices, thereby providing some insight(s) into the question how a developer can
attract additional funding by deploying certain resources in favour of the consumer.
9.2 Limitations
Despite the elaborate methodological approach of this study, there are some limitations which
have to be accounted for. First, there has not been made a distinction among consumers in
categories. The respondents, who represented the “consumer” in the quantitative study were not
divided into distinct categories. Between these categories, difference(s) might exist that influence
the results of the study, and subsequently customer value. This limitation has to be accounted for.
Second, the primary sample for the quantitative study comprised of respondents who were in
search of a newly build house in a particular region in The Netherlands. The secondary sample
comprised respondents from across The Netherlands. Although there were no differences
between the primary and secondary sample in this study, when other regions in the Netherlands
are being examined, results might diverge from the results in this study. This could affect
customer value. Therefore, the limitation of this study could be its generalizability in region-
specific context. Third, the operationalization of the survey has not accounted for competition.
Respondents were asked to indicate the importance of certain drivers, not to compare drivers
among multiple competitors. This limits the generalizability of the results, because it is still
Customer value in property development: an exploratory study Page 45
unknown what the relative (change in) competitive position would be for a developer compared
to direct competitors when certain drivers are in – or excluded or in- or decreased. Fourth,
because of the wide range of components included in the study, this study aimed at achieving
generalizibility at the expense of providing in-dept knowledge. This implies that the model for
customer value is generally applicable but does not offer much in-dept knowledge on the
included components. Finally, because of their operationalizations in the survey, flaw
minimization and surface were excluded as drivers for customer value. However, if these drivers
were operationalized in another way, they might have been distinguished as relevant drivers to
customer value. Their (lack of) meaning for customer value is therefore still not entirely clear.
9.3 Research directions
Some recommendations for future research are provided. First, further research is needed into
the (potential) contribution of the drivers flaw minimization and surface. They do not seem to be
part of the construct for customer value, but other operationalizations for these drivers might
deliver more insight(s) into their contribution to customer value. Second, a longitudinal study
could provide understanding how customer value develops over time. Third, there could be more
in-dept focus on the categories of consumers. Specifying the observation unit to consumers who
are actively searching for an apartment might deliver other results than consumers who are
searching for a ground-dwelling house for example. Fourth, there could be stronger focus
towards the individual components of the conceptual model, in particular if it concerns the
consumer attitudes towards paying a premium for drivers. Further research is needed to
distinguish to what degree consumers are actually willing to pay extra for certain drivers. Fifth, it
is advised to conduct this study again when a particular region in The Netherlands is being
examined, because of regional differences described in the limitations. Finally, customer value in
industry-specific context could deliver interesting insights when it is modelled under customer
dominant logic (CD-logic) as proposed by Heinonen et al. (2010) or under the construct
proposed by Woodall (2003).
Customer value in property development: an exploratory study Page 46
10. Reflection
To conclude, the author would like to reflect on his study shortly. From a marketing stand of
view, the author is pleased that some progress has been made in the field of customer value in
property development and that some empirical guidance becomes available for management. The
process in which this study has been developed has been extensive. The methodology has been as
elaborate as possible by conducting a qualitative and quantitative study. Since no attempts have
been made to envision customer value in industry-specific context through quantification, it was
particularly challenging to find a quantitative model from mainstream academic literature to
model customer value in this context. Additional challenges formed the vast variety of
components to be included in the study. The property development process is such a complex
process that it is very difficult to conceive an exhaustive set of model components that reflect all
relevant aspects of this development process. Eventually, the included set of components proved
to be a solid representative for the development process, which was a pleasant confirmation for
the author. It is the authors’ hope that this study will function as a complementary guideline for
management and that usage of this study will stimulate management to consider the consumer
and focuses on (mutual) value creation to achieve project success.
Customer value in property development: an exploratory study Page 47
Reference list
Alam, Ian (2006), ”Removing the fuzziness from the fuzzy-frond-end of service innovations
through customer interactions”, Industrial Marketing Management, 35, 468-480.
Anderson, James C., Dipak C. Jain and Pradeep K. Chintagunta (1993), ”Customer Value
Assessment in Business Markets: A State-of-Practice Study”, Journal of Business-to-Business
Marketing, 1 (1), 3-29.
Arndt, Johan (1979), ”Towards a concept of domesticated markets”, Journal of Marketing, 43(Fall),
69-75.
Baldauf, A., Karen S. Cravens and Gudrun Binder (2003), “Performance consequences of brand
equity management: evidence from organizations in the value chain”, Journal of Product & Brand
Management, 12 (4), 220-236.
Baroussa, Steven C., Martin Hoesli and Vincent S. Peng (2003), “Do housing submarkets really
matter?”, Journal of Housing Economics, 12, 12-28.
Boumeester, Henk J.F.M., Carlo J.M. Lamain and Annabel A.A. Mariën (2006), Huizenkopers in
profiel. Voorburg, The Netherlands: NVB.
Cannon, Joseph P. and Christian Homburg (2001), “Buyer-Supplier Relationships and Customer
Firm Costs”, Journal of Marketing, 65 (January), 29-43.
Chin, Wynne W. (1998), The partial least squares approach to structural equation modeling. In: G. A.
Marcoulides (Ed.). Mahwah, NJ: Lawrence Erlbaum Associates.
Chiou, Jyh S. and Cornelia Droge (2006), “Service Quality, Trust, Specific Asset Investment, and
Expertise: Direct and Indirect Effects in a Satisfaction-Loyalty Framework”, Academy of Marketing
Science, 34 (4), 613-627.
Cohen, Jacob (1988), Statistical power analysis for the behavioral sciences, 2nd Ed. Hillsdale, NJ: Lawrence
Erlbaum Associates.
Corbin, Juliet and Anselm Strauss (1990), “Grounded Theory Research: Procedures, Canons and
Evaluative Criteria”, Zeitschrift für Soziologie, 19 (6), 418-427.
Costello, Anna B. and Jason W. Osborne (2005), “Best Practices in Exploratory Factor Analysis: Four Recommendations for Getting the Most From Your Analysis”, Practical Assessment Research & Evaluation, 10 (7), 1-9. Deutskens, Elisabeth, Ko de Ruyter, Martin Wetzels and Paul Oosterveld (2004), “Response Rate and Response Quality of Internet Based Surveys: an Experimental Study”, Marketing Letters, 15 (1), 21-36. Diamantopoulos, Adamantios and Judy A. Siguaw (2000), Introducing LISREL. London, United Kingdom: SAGE Publications Ltd.
Customer value in property development: an exploratory study Page 48
Elsinga, Marja, Martijn de Jong-Tennekes and Harry van der Heijden (2011), “Crisis en Woningmarkt”, Onderzoeksinstituut OTB Technische Universiteit Delft, (June 15), (accessed at September 10, 2011), [available at http://abonneren.rijksoverheid.nl/media/dirs/436/data/crisis_en_woningmarkt.pdf]. Fiori, Anna M. (2008), “Simple tests for right, left and overall excess kurtosis in financial variables”, Department of Quantitative Methods for Economics and Business Science University of Milano-Bicocca, (March 26), (accessed September 8, 2011), [available at http://maf2008.unive.it/viewpaper.php?id=98]. Flint, Daniel J., Robert B. Woodruff and Sarah Fisher-Gardial (1997), ”Customer Value Change
in Industrial Marketing Relationships: A Call for New Strategies and Research”, Industrial
Marketing Management, 26, 163-175.
Fornell, Claes and David F. Larcker (1981), “Evaluating Structural Equation Models with
Unobservable Variables and Measurement Error”, Journal of Marketing Research, 18 (1), 39-50.
Fornell, Claes and Fred L. Bookstein (1982), “Two Structural Equation Models: LISREL and
PLS Applied to Consumer Exit-Voice Theory”, Journal of Marketing Research, 19 (4), 440-452.
Fornell, Claes and Jaesung Cha (1994), Partial least squares. In R. P. Bagozzi (Ed). Cambridge,
United Kingdom: Blackwell.
Gadde, Lars E. and Lars G. Mattsson (1987), “Stability and Change in Network Relationships”, International Journal of Research in Marketing, 4 (1), 29-41. Gilmore, James H. and B. Joseph Pine II (2000), Markets of one: creating customer-unique value through mass customization. Boston, MA: Harvard Business Press. Gordon, Raymond L. (1992), Basic Interviewing Skills. Itasca, IL: F.E. Peacock. Grönroos, Christian and Pekka Helle (2010), “Adopting a service logic in manufacturing: Conceptual foundation and metrics for mutual value creation”, Journal of Service Management, 21 (5), 564-590. Gutman, Jonathan (1982), “A Means-End Chain Model Based on Consumers’ Categorization Process”, Journal of Marketing, 46 (Spring), 46-60, 72. Hair, Joseph F., William C. Black, Barry J. Babin., Rolph E. Anderson and Ronald L. Tatham (2006), Multivariate data analysis, sixth edition. Upper Sadle River, NJ: Pearson Prentice Hall. Henseler, Jörg, Christian M. Ringle and Rudolf R. Sinkovics (2009), “The Use of Partial Least Squares Path Modeling in International Marketing”, Advances in International Marketing, 20, 277-319. Heinonen, Kristina, Tore Strandvik, Karl J. Mickelsson, Bo Edvardsson, Erik Sundström and Per
Andersson (2010), “A customer-dominant logic of service”, Journal of Service Management, 21 (4),
531-548.
Customer value in property development: an exploratory study Page 49
Hoyer, Wayne D., Rajesh Chandy, Matilda Dorotic, Manfred Krafft and Siddharth S. Singh (2010), “Consumer Co-Creation in New Product Development”, Journal of Service Research, 13( 3), 283-296. Knol, Marleen and Henk Savelkoul (2009), “Kredietcrisis en grondbeleid”, Real Estate Magazine, 62, 44-46. Kwee, Lex and Jeanet Hacquebord (2005), Wooninnovatiereeks. Abcoude, The Netherlands: Arko
Uitgeverij.
Lapierre, Jozée (2000), “Customer-Perceived Value in Industrial Contexts”, Journal of Business and Industrial Marketing, 15 (2/3), 122-145. Lathauwer, de, W.H.K. (2005), “Vastgoedmarketing: op weg naar marktgerichtheid”, Amsterdam School of Real Estate, (March 28), (accessed January 5, 2011), [available at http://www.vastgoedkennis.nl/docs/MSRE/05/Lathauwer.pdf]. Leent, van, Bianca L.M. (2009), “Theorie conceptontwikkeling voor de vastgoedsector”, Amsterdam School of Real Estate, (February 25), (accessed December 15, 2010), [available at http://www.vastgoedkennis.nl/docs/MSRE/09/Leent.pdf]. Luchjenbroers, M.H. (2007), “Imagine! Hoe kan een ontwikkelaar van woningbouw gestructureerd gebruikmaken van de beleveniseconomie?”, Amsterdam School of Real Estate, (August), (accessed January 8, 2011), [ available at http://www.vastgoedkennis.nl/docs/mre/07/Luchjenbroers.pdf]. Maignan, Isabelle and O.C. Ferrell (2004), “Corporate social responsibility: an integrative
framework”, Journal of the academy of marketing science, 32 (1), 3-19.
Majaama, Wisa, Seppo Junnila, Hemanta Doloi and Emma Niemestö (2008), ”End user oriented
Public-Private Partnerships in Real Estate Industry”, International Journal of Strategic Property
Management, 12, 1-17.
Meijer, Iddo (2005), Woonkennis Jaarrapport 2007. Rotterdam, The Netherlands: Bouwkennis B.V.
Michielsen, Piet (2010), ”Uitspraak legt Goese schans voorlopig lam”, Provinciale Zeeuwse Courant,
252 (301), 1.
Monroe, Kent B. (1991), Pricing - Making Profitable Decisions. New York, NY: McGraw Hill. Muller, Jasper M. (2005), “Het waarderen van een projectontwikkelaar: een vak apart”, Amsterdam School of Real Estate, (September), (accessed April 9, 2011), [available at http://www.vastgoedkennis.nl/docs/MRE/05/Muller.pdf]. Palmatier, Robert W., Rajiv P. Dant, Druh Grewal and Kenneth R. Evans (2006), ”Factors influencing the effectiveness of relationship marketing: a meta analysis”, Journal of Marketing, 70 (October), 136-153. Park, C. Whan, Bernard J. Jaworski and Deborah J. MacInnis (1986), “Strategic Brand Concept-Image Management”, Journal of Marketing, 50 (October), 135-145.
Customer value in property development: an exploratory study Page 50
Raykov, Tenko (1998), “Coefficient Alpha and Composite Reliability with Interrelated Nonhomogeneous Items”, Applied psychological Measurement, 22 (4), 375-385. Rengers, Merijn and Xander van Uffelen (2006), “Enorme winsten bij bouw Vinexwijk”, de Volkskrant, (April 19), (accessed at March 2, 2011), [available at http://www.volkskrant.nl/vk/nl/2680/Economie/article/detail/763676/2006/04/19/lsquo-Enorme-winsten-bij-bouw-Vinexwijk-rsquo.dhtml]. Ringle, Christian M., Sven Wende and Alexander Will (2005), “SmartPLS 2.0 (Beta)”, (accessed at August 28, 2011), [available at www.smartpls.de]. Rietdijk, Nico (2010), Thermometer koopwoningen. Voorburg, The Netherlands: NVB Robinson, John P., Phillip R. Shaver and Lawrence S. Wrightman (1991), Measures of personality and social psychological attitudes. San Diego, CA: Academic Press Inc. Sanders, Barbara (2009), “Banken ongenadig streng bij verstrekken hypotheek”, De Telegraaf, (October 9), (accessed April 6, 2011), [available at http://www.telegraaf.nl/overgeld/hypotheken/5030289/__Banken_streng_met_hypotheek__.html ]. Sharma, Arun and Jagdish N. Sheth (1997), “Relationship Marketing: An Agenda for Inquiry”, Industrial Marketing Management, 26, 87–89. Smeets, Joseph J.A.M. (2010), “Sturen op klantwaarde”, Technische Universiteit Eindhoven, (March
17), (accessed February 24, 2011), [available at http://alexandria.tue.nl/extra2/201010127.pdf].
Soman, Dilip and Sara N. Marandi (2009), Managing customer value: one stage at a time. London,
United Kingdom: World Scientific Publishing Company.
Suhr, Diana D. (2006), “Exploratory or Confirmatory Factor Analysis?”, Sugi 31 Proceedings,
(March 26), (accessed September 5, 2011), [available at
http://www2.sas.com/proceedings/sugi31/toc.html].
Tenenhaus, Michel, Vincenzo E. Vinzi, Yves-Marie Chatelin and Carlo Lauro (2005), ”PLS Path
Modeling”, Computational Statistics & Data Analysis, 48, 159-205.
Traa, Michel and Joris Knoben (2009), “Veroudering en herstructurering op bedrijventerreinen:
een verkenning”, Planbureau voor de leefomgeving, (September), (accessed at March 4, 2011), [available
at http://www.rivm.nl/bibliotheek/digitaaldepot/Veroudering-en-herstructurering-web.pdf].
Tuns, Remco, Lieneke de Boer, Guido van Beek, Jesse van Wayenburg and Leo Kranenburg
(2010), Whitepaper Woonwensen. Rotterdam, The Netherlands: Bouwkennis B.V.
Urbanaviciene, Vita and Arturas Kaklauskas (2009), “The conceptual model of construction and real estate negotiation”, International Journal of Strategic Property Management, 13, 53-70. Ulaga, Wolfgang (2003), “Capturing value creation in business relationships: A customer perspective”, Industrial Marketing Management, 32, 677-693.
Customer value in property development: an exploratory study Page 51
Ulaga, Wolfgang and Andreas Eggert (2004), “Relationship value and quality: broadening the nomological network of business-to-business relationships”, European Journal of Marketing, 40 (3/4), 311-327. Ulaga, Wolfgang and Andreas Eggert (2005), ”Relationship Value in Business Markets: The Construct and Its Dimensions”, Journal of Business-to-Business Marketing, 12 (1), 73-99. Ulaga, Wolfgang and Andreas Eggert (2006), “Value-Based Differentiation in Business Relationships: Gaining and Sustaining Key Supplier Status”, Journal of Marketing, 70 (January), 119-136. Vargo, Stephen L. and Robert F. Lusch (2004), ”Evolving to a new dominant logic for marketing”, Journal of Marketing, 68 (January), 1-17.
Verveen, Niek A. (2008), ”Consumentgerichte wooninnovatie”, Amsterdam school of real estate,
(February 1), (accessed at December 17, 2010), [available at
http://www.vastgoedkennis.nl/docs/MSRE/08/Verveen.pdf].
Verveen, Niek A. ( 2009), “Betere marketing vormt uitweg voor woningsector in terugvallende
markt”, Vastgoedmarkt, 36 (January), 20, 22.
Vries, de, J.W.J. (2010), “Onderzoek naar de financiering van duurzame energieconcepten bij
nieuwbouwkoopwoningen voor starters”, Amsterdam School of Real Estate, (August), (accessed at
August 28, 2011), [available at http://www.vastgoedkennis.nl/docs/msre/10/Vries.pdf].
Wind, Yoram (1970), “Industrial Source Loyalty”, Journal of Marketing Research, 7 (4), 450-457.
Wong, Yuk K. (2006), Modern software review: techniques and technologies. London, United Kingdom:
IRM Press.
Woodall, Tony (2003), “Conceptualizing Value for the Customer: An Attributional, Structural and Dispositional Analysis”, Academy of Marketing Science Review, 2003 (12), 1-44. Woodruff, Robert B. (1997), “Customer Value: The Next Source for Competitive Advantage”,
Journal of Academy of Marketing Science, 25 (2), 139-153.
Yeomans, Keith A. and Paul A. Golder (1982), “The Guttman-Kaiser Criterion as a Predictor of the Number of Common Factors”, Journal of Royal Statistical Society: The Statistician, 31 (3), 221-229. Zeithaml, Valerie A. (1988), “Consumer Perceptions of Price, Quality and Value: A Means-End
Model and Synstudy of Evidence”, Journal of Marketing, 52 (July), 2-22.
Customer value in property development: an exploratory study Page 52
Appendix A
IDEE VORMING: dit is de eerste fase van het ontwikkelproces. Hier worden ideëen gecreëerd over de
mogelijkheden voor een project op een bepaalde locatie.
Een ontwikkelaar kan ervoor kiezen om een persoonlijk dialoog aan te gaan met u. U wordt door de
ontwikkelaar betrokken in dit dialoog met als doel uit te vinden wat uw woonbehoeften zijn.
Vervolgens verzamelt de ontwikkelaar uw woonbehoeften en gebruikt deze gegevens als inbreng
voor verdere ontwikkeling van het project.
1. Ik verwacht dat een woning die is ontwikkeld middels een dialoog ten opzichte van een
woning die niet is ontwikkeld middels dit dialoog aan mijn woonbehoeften beter tegemoet
komt
2. Ik zou een woning verkiezen die is ontwikkeld middels een dialoog boven een woning die niet
is ontwikkeld middels dit dialoog
3. Stel dat u een keuze zou moeten maken: Ik zou een woning verkiezen van € 200.000,- die is
ontwikkeld middels een dialoog boven een woning van € 195.000,- die niet is ontwikkeld
middels dit dialoog
Een alternatief voor een persoonlijk dialoog is een online gemeenschap, opgezet door de
ontwikkelaar. Via een speciale website kunt u zo uw woonbehoeften kenbaar maken. Deze
behoeften worden verzameld door de ontwikkelaar als inbreng voor het ontwerp van een project.
Anders dan bij het hiervoor beschreven dialoog vindt er geen gesprek(ken) plaats tussen u en de
ontwikkelaar.
4. Ik verwacht dat een woning die is ontwikkeld met inbreng van een gemeenschap ten
opzichte van een woning die is niet is ontwikkeld met inbreng van deze gemeenschap aan
mijn woonbehoeften beter tegemoet komt
5. Ik zou een woning verkiezen die is ontwikkeld met inbreng van een gemeenschap boven een
woning die niet is ontwikkeld met inbreng van deze gemeenschap
6. Ik zou een woning verkiezen die is ontwikkeld middels een dialoog boven een woning die is
ontwikkeld met inbreng van een gemeenschap
CONCEPT ONTWIKKELING: in deze fase worden de verzamelde woonbehoeften en de ideëen van de
ontwikkelaar over een project vertaald naar ontwerpstudies die de mogelijkheden van een project
tonen.
Uw inbreng vanuit het dialoog en/of gemeenschap wordt door de ontwikkelaar vertaald naar
concrete ontwerpstudies. Deze studies worden ook wel concepten concepten. Deze concepten
worden vervolgens aan u ter beoordeling voorgelegd.
7. Ik verwacht dat een woning die is ontwikkeld middels concepten ten opzichte van een
woning die niet is ontwikkeld middels deze concepten aan mijn woonbehoeften beter
tegemoet komt
Customer value in property development: an exploratory study Page 53
8. Ik zou een woning verkiezen die is ontwikkeld middels concepten boven een woning die niet
is ontwikkeld middels concepten
9. Stel dat u een keuze zou moeten maken: Ik zou een woning verkiezen van € 200.000,- die is
ontwikkeld middels concepten boven een woning van € 195.000,- die niet is ontwikkeld
middels concepten.
Een ontwikkelaar maakt in deze fase tevens een studie voor de inrichting van de openbare ruimte.
Met openbare ruimte wordt hier bedoeld gemeenschappelijke ruimten in een project. De inrichting
heeft betrekking op het ontwerpen van deze gemeenschappelijke ruimten, zoals groenvoorzieningen
(vb: parken, vijvers), sociale voorzieningen (vb: speeltuinen, zitbanken) en landschapsarchitectuur
(vb: kunstobjecten, ontwerp van trottoir).
10. Ik verwacht dat een woning in een project met veel aandacht voor de inrichting van de
openbare ruimte ten opzichte van een woning in een project met weinig aandacht voor deze
inrichting aan mijn woonbehoeften beter tegemoet komt
11. Ik zou een woning verkiezen binnen een project met veel aandacht voor de inrichting van de
openbare ruimte boven een woning in een project met weinig aandacht voor inrichting van
de openbare ruimte
12. Stel dat u een keuze zou moeten maken: Ik zou een woning verkiezen van € 200.000,- die is
ontwikkeld in een project met veel aandacht voor de inrichting van de openbare ruimte
boven een woning van € 195.000,- die is ontwikkeld in een project met weinig aandacht voor
de inrichting van de openbare ruimte
PLANONTWIKKELING: in deze fase zal u samen met de ontwikkelaar uw woning gaan ontwikkelen en
komen de concrete zaken aan bod zoals locatie, oppervlakte, indeling en afwerking.
De locatie is één van de fundamenten van een woning. De locatie kan worden opgedeeld in
omgeving, aangrenzend landschap en aanwezige voorzieningen. Met omgeving wordt bedoeld de
buurt, wijk of stadsdeel van een woning, met landschap wordt bedoeld bij een woning aangrenzende
natuur en/of water en met voorzieningen wordt hier bedoeld de aanwezige scholen, winkels, sport
faciliteiten en cultuurvoorzieningen.
13. Om de overstap te maken naar een woning, dient de omgeving waarin die woning is
ontwikkeld kwalitatief beter te zijn dan de omgeving van mijn huidige woning.
14. Om de overstap te maken naar een woning, dient het aangrenzend landschap bij die woning
kwalitatief beter te zijn dan het aangrenzend landschap bij mijn huidige woning
15. Om de overstap te maken naar een woning, dienen er kwalitatief betere voorzieningen in de
omgeving aanwezig te zijn dan bij mijn huidige woning
In het proces van co-creatie stelt u met de ontwikkelaar uw woning samen binnen de mogelijkheden
van het project. U beslist daarbij in samenspraak met de ontwikkelaar over de afwerking van uw
woning (materiaalkeuze), installaties (keuken, badkamer etc.) en indeling (plaatsen van muren,
deuren etc.)
Customer value in property development: an exploratory study Page 54
16. Ik verwacht dat een woning ontwikkeld middels co-creatie ten opzichte van een woning die
niet is ontwikkeld middels co-creatie aan mijn woonbehoeften beter tegemoet komt.
17. Ik zou een woning verkiezen die is ontwikkeld met hulp met hulp van co-creatie boven een
woning die niet is ontwikkeld met hulp van co-creatie
18. Stel dat u een keuze zou moeten maken : Ik zou een woning verkiezen van € 220.000,- die is
ontwikkeld met hulp van co-creatie boven een woning van € 195.000,- die is ontwikkeld
zonder hulp van co-creatie.
Een projectontwikkelaar kan u ook een andere mogelijkheid bieden dan co-creatie. Zij kunnen de
woning bijvoorbeeld zo casco als mogelijk opleveren. Met casco wordt bedoeld dat uw woning
binnen zo kaal als mogelijk wordt opgeleverd. U kunt als zelf binnen de technische mogelijkheden
van een woning een eigen indeling en/of inrichting maken.
19. Ik verwacht dat een woning ontwikkeld met een casco structuur ten opzichte van een woning
met een vooraf ingedeelde structuur aan mijn woonbehoeften beter tegemoet komt.
20. Ik zou een woning verkiezen die is ontwikkeld met een casco structuur boven een woning die
is ontwikkeld met een vooraf ingedeelde structuur
21. Ik zou een woning verkiezen van € 180.000,- die is ontwikkeld met een casco structuur boven
een woning van € 195.000,- met een vooraf ingedeelde structuur
De oppervlakte van de woning bepaalt in grote mate de keuzes die u dient te maken met betrekking
tot inrichting en met de (on)mogelijkheden waarmee u bij de inrichting van de woning te maken
krijgt.
22. Om de overstap te maken naar een woning, dient de oppervlakte van die woning groter te
zijn dan de oppervlakte van mijn huidige woning
23. Ik zou een nieuwbouwwoning met een grotere oppervlakte maar die is ontwikkeld zonder
co-creatie verkiezen boven een woning die is ontwikkeld met co-creatie maar met een
kleinere oppervlakte
In dezelfde trend kunt u ook denken aan de buitenruimte. Met buitenruimtes wordt bedoeld: iedere
ruimte die alleen voor u toegankelijk is en die grenst aan uw (eigen) woning. Bij een grondgebonden
woning gaat het meestal om de tuin, bij een appartement gaat het om een balkon, loggia (inpandig
balkon) of terras.
24. Om de overstap te maken naar een woning, dient er een buitenruimte bij die woning
aanwezig te zijn
25. Om de overstap te maken naar een woning, dient de buitenruimte van die woning groter te
zijn dan de buitenruimte van mijn huidige woning
26. Ik zou een nieuwbouwwoning met een grotere buitenruimte maar die is ontwikkeld zonder
co-creatie verkiezen boven woning die is ontwikkeld met co-creatie maar met een kleinere
buitenruimte
Bij de afwerking van uw woning zult u ook een keuze moeten maken voor de energievoorziening.
Over het algemeen is onderscheid te maken in conventionele voorzieningen (vb c.v. ketels en
vloerwarming) en energiezuinige voorzieningen (vb....). Energiezuinige voorzieningen zijn duurder in
Customer value in property development: an exploratory study Page 55
aanschafwaarde, maar omdat zij zuiniger zijn in energieverbruik zullen zij op termijn voordeliger zijn.
De voorwaarde is wel, afhankelijk van het soort voorziening, dat deze na enkele jaren hun extra
aanschafwaarde terugverdiend zullen hebben.
27. Ik verwacht dat een woning ontwikkeld met energiezuinige voorzieningen ten opzichte van
een woning die is ontwikkeld met conventionele voorzieningen aan mijn woonbehoeften
beter tegemoet komt
28. Ik zou een woning verkiezen die is ontwikkeld met energiezuinige voorzieningen boven een
woning die is ontwikkeld met conventionele voorzieningen
29. Stel dat u een keuze zou moeten maken : Ik zou een woning verkiezen van € 200.000,- met
energiezuinige voorzieningen boven een woning van € 195.000,- zonder energiezuinige
voorzieningen
Bij de aanschaf van een woning moet u veel keuzes maken worden en komt er veel op u af, zeker als
u samen met de ontwikkelaar de woning samenstelt (co-creatie). Een ontwikkelaar kan u uitgebreid
begeleiden tijdens dit proces door het aanstellen van een vast contactpersoon. Deze contactpersoon
begeleid u gedurende het proces bij alle keuzes die gemaakt dienen te worden.
30. Ik verwacht dat het aanstellen van een vast contactpersoon ten opzichte van het niet
aanstellen van een vast contactpersoon zal leiden tot een betere integratie van mijn
woonbehoeften in de woning
31. Ik zou een woning verkiezen die is ontwikkeld met hulp van een vast contactpersoon boven
een woning die is ontwikkeld zonder hulp van een vast contactpersoon
Een ontwikkelaar kan van zijn naam een merknaam maken en dit merk actief uitdragen in zijn
projecten en in alle communicatie richting u. Op deze manier zou u direct een project en/of woning
kunnen herkennen van deze ontwikkelaar. Dit zou vertrouwen kunnen scheppen in de kwaliteit van
de projecten en/of woningen van de ontwikkelaar, omdat de ontwikkelaar een voor u bekende
merknaam heeft.
Stel, de situatie doet zich voor dat u bekend met de merknaam van ontwikkelaar X. U heeft een
positief beeld van ontwikkelaar X en weet dat zij kwalitatief goede woningen ontwikkeld.
Ontwikkelaar Y heeft geen merknaam en u bent niet bekend met deze ontwikkelaar.
32. Ik verwacht dat een woning van een ontwikkelaar X kwalitatief beter is dan een woning van
ontwikkelaar Y
33. Ik verwacht dat een woning van ontwikkelaar X aan mijn woonbehoeften beter tegemoet
komt dan een woning van een ontwikkelaar Y
34. Ik zou een woning verkiezen die is ontwikkeld door een ontwikkelaar X boven de woning die
is ontwikkeld door ontwikkelaar Y
35. Ik zou een woning verkiezen van € 200.000,- die is ontwikkeld door ontwikkelaar X boven een
woning van € 197.500.- die is ontwikkeld door ontwikkelaar Y
BOUWEN: nadat alle plannen zijn gemaakt en akkoord zijn bevonden door u en de ontwikkelaar, kan
het bouwproces starten. In dit proces wordt het project en/of de woning gebouwd.
Bij bouwbezoeken wordt u de mogelijkheid geboden door de ontwikkelaar om familie en vrienden uit
te nodigen om samen op locatie de vorderingen van de bouw van uw woning te bekijken. De vaste
Customer value in property development: an exploratory study Page 56
contactpersoon vanuit de ontwikkelaar zorgt op deze dagen voor een hapje en een drankje en leidt u
rond in de woning.
36. Een ontwikkelaar die bouwbezoeken organiseert heeft meer betrokkenheid met mij dan een
ontwikkelaar die geen bouwbezoeken organiseert
37. Ik zou een woning verkiezen waarbij bouwbezoeken worden georganiseerd door de
ontwikkelaar boven een woning waar bouwbezoeken niet worden georganiseerd door de
ontwikkelaar
Een digitaal bouwdossier geeft u op elk moment van de dag inzicht over de vorderingen van de bouw
van uw woning. Zo kunt u op digitaal en op afstand de bouw volgen. Het persoonlijk bouwdossier
wordt door de ontwikkelaar geupdate en alleen u heeft hierin inzicht.
38. Een ontwikkelaar die een digitaal bouwdossier beschikbaar stelt heeft meer betrokkenheid
met mij dan een ontwikkelaar die geen digitaal bouwdossier beschikbaar stelt
39. Ik zou een woning verkiezen waarbij de bouw plaatsvindt middels een digitaal bouwdossier
boven een woning waarbij de bouw niet plaatsvindt middels een digitaal bouwdossier
OPLEVERING: de formele overdracht van de woning vindt plaats en u mag de sleutels van uw woning
in ontvangst nemen.
Een ontwikkelaar kan bij de oplevering van uw woning een rondleiding verzorgen. U krijgt
uitgebreide begeleiding en u wordt bekend gemaakt met alle zaken die de woning u biedt. U kunt dit
het beste zien als de aflevering van een nieuwe auto, waarin u uitgebreid door de verkoper wordt
begeleid bij het ophalen van uw nieuwe auto.
40. Een ontwikkelaar die voorziet in een begeleiding bij oplevering van uw nieuwe woning heeft
meer betrokkenheid met mij dan een ontwikkelaar die geen begeleiding bij oplevering
voorziet
41. Ik zou een woning verkiezen waarin mij begeleiding wordt geboden bij oplevering boven een
woning waarin deze begeleiding niet wordt geboden bij oplevering
Helaas zijn er soms bij oplevering van een nieuwbouwwoning nog opleverfouten. In de meeste
gevallen zijn het kleine defecten of gebreken. Dit betekent dan dat de woning al wel aan u wordt
opgeleverd en dat de gebreken zo snel mogelijk moeten worden hersteld door de ontwikkelaar.
42. De aanwezigheid van opleverfouten heeft invloed op het kwaliteitsgevoel dat ik van de
woning heb
43. Als een ontwikkelaar de woning zou opleveren met opleverfouten, dan zou dat het beeld
beinvloeden wat ik van de ontwikkelaar heb
AANKOOPKOSTEN: Als klant zult u gedurende het ontwikkelproces ook kosten maken. Deze kosten
kunnen uit te drukken zijn in tijd of geld. De aankoopkosten zijn de eerste kosten waarmee u wordt
geconfronteerd.
U zult tijdens het ontwikkelproces veel keuzes moeten maken. U zult ook kosten moeten maken om
deze beslissingen te kunnen nemen. Deze kosten zijn het beste in tijd uit te drukken. Een alternatief
hierop is het kiezen voor een woning waarbij u niet wordt betrokken in het ontwikkelproces. U kiest
Customer value in property development: an exploratory study Page 57
een woning die al volledig is ontwikkeld en/of is gebouwd. Deze woning is al opgeleverd en is
instapklaar.
44. Ik verwacht dat het kiezen voor een woning die al is ontwikkeld ten opzichte van een woning
waarbij ik betrokken ben in het ontwikkelproces tijdsbesparing zal opleveren
45. Vanwege tijdsbesparing zou ik een woning verkiezen die al is ontwikkeld boven van een
woning waarbij ik betrokken ben in het ontwikkelproces
DIRECTE KOSTEN: de directe kosten zijn de tweede kosten waarmee u wordt geconfronteerd. Dit zijn
de kosten die u maakt om de woning in uw bezit te krijgen
De koopprijs van de woning is natuurlijk een cruciaal onderdeel voor uw beslissing: het is namelijk
direct voelbaar voor u en heeft bovendien een grote impact op uw financiële huishouden. Verder
kennen we naast de koopprijs ook nog de transactiekosten van een woning. Een voorbeeld hiervan is
de bouwrente . De bouwrente kan worden beschouwd als het rentepercentage dat u verschuldigt
bent aan een ontwikkelaar over de periode dat de ontwikkelaar de grond aankoopt en de woning
bouwt tot de uiteindelijke betaling die u aan de ontwikkelaar doet voor de woning. De ontwikkelaar
financiert de grond en de woning dus voor en rekent daarover rentekosten aan u door. De
bouwrente wordt vaak bovenop de koopprijs van de woning berekend.
46. Om de overstap te maken naar een woning, dient de koopprijs van die woning niet hoger te
zijn dan de verkoopwaarde van mijn huidige woning
47. Een bouwrente van € 5000,- op een koopprijs van € 200.000,- van een woning zou een sterke
invloed hebben op mijn beeld van de totale directe kosten van die woning
GEBRUIKSKOSTEN: de laatste kosten waarmee u wordt geconfronteerd zijn de gebruikskosten. Deze
gebruikskosten horen bij het dagelijks gebruik van de woning
Onder gebruikskosten wordt hier verstaan: de kosten die u dient te maken om in uw woning te
kunnen leven. De gebruikskosten zijn globaal te verdelen in onderhoudskosten en energiekosten.
48. Om de overstap te maken naar een woning, dienen de gebruikskosten van die woning lager
te zijn dan de gebruikskosten van mijn huidige woning
49. Stel dat u een keuze zou moeten maken: Ik zou een woning verkiezen met een koopprijs van
€ 200.000,- met € 2.500,- per jaar aan gebruikskosten boven een woning met een koopprijs
van € 195.000,- met € 3.000,- per jaar aan gebruikskosten
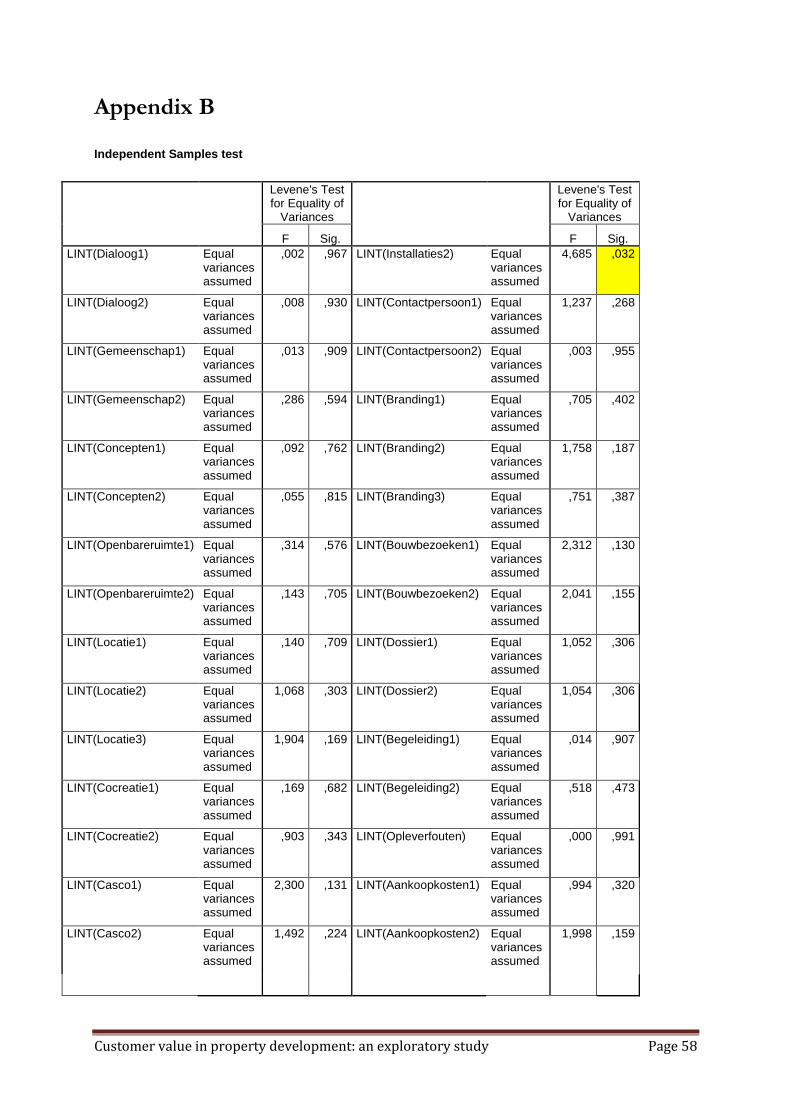
Customer value in property development: an exploratory study Page 58
Appendix B
Independent Samples test
Levene's Test for Equality of
Variances
Levene's Test for Equality of
Variances
F Sig. F Sig. LINT(Dialoog1) Equal
variances assumed
,002 ,967 LINT(Installaties2) Equal variances assumed
4,685 ,032
LINT(Dialoog2) Equal variances assumed
,008 ,930 LINT(Contactpersoon1) Equal variances assumed
1,237 ,268
LINT(Gemeenschap1) Equal variances assumed
,013 ,909 LINT(Contactpersoon2) Equal variances assumed
,003 ,955
LINT(Gemeenschap2) Equal variances assumed
,286 ,594 LINT(Branding1) Equal variances assumed
,705 ,402
LINT(Concepten1) Equal variances assumed
,092 ,762 LINT(Branding2) Equal variances assumed
1,758 ,187
LINT(Concepten2) Equal variances assumed
,055 ,815 LINT(Branding3) Equal variances assumed
,751 ,387
LINT(Openbareruimte1) Equal variances assumed
,314 ,576 LINT(Bouwbezoeken1) Equal variances assumed
2,312 ,130
LINT(Openbareruimte2) Equal variances assumed
,143 ,705 LINT(Bouwbezoeken2) Equal variances assumed
2,041 ,155
LINT(Locatie1) Equal variances assumed
,140 ,709 LINT(Dossier1) Equal variances assumed
1,052 ,306
LINT(Locatie2) Equal variances assumed
1,068 ,303 LINT(Dossier2) Equal variances assumed
1,054 ,306
LINT(Locatie3) Equal variances assumed
1,904 ,169 LINT(Begeleiding1) Equal variances assumed
,014 ,907
LINT(Cocreatie1) Equal variances assumed
,169 ,682 LINT(Begeleiding2) Equal variances assumed
,518 ,473
LINT(Cocreatie2) Equal variances assumed
,903 ,343 LINT(Opleverfouten) Equal variances assumed
,000 ,991
LINT(Casco1) Equal variances assumed
2,300 ,131 LINT(Aankoopkosten1) Equal variances assumed
,994 ,320
LINT(Casco2) Equal variances assumed
1,492 ,224 LINT(Aankoopkosten2) Equal variances assumed
1,998 ,159

Customer value in property development: an exploratory study Page 59
LINT(Oppervlakte) Equal variances assumed
2,762 ,098 LINT(Directekosten1) Equal variances assumed
,206 ,650
LINT(Buitenruimte1) Equal variances assumed
2,164 ,143 LINT(Directekosten2) Equal variances assumed
,396 ,530
LINT(Buitenruimte2) Equal variances assumed
2,646 ,105 LINT(Gebruikskosten) Equal variances assumed
1,537 ,217
LINT(Installaties1) Equal variances assumed
11,884 ,001 LINT(Gebruikskosten2) Equal variances assumed
2,976 ,086
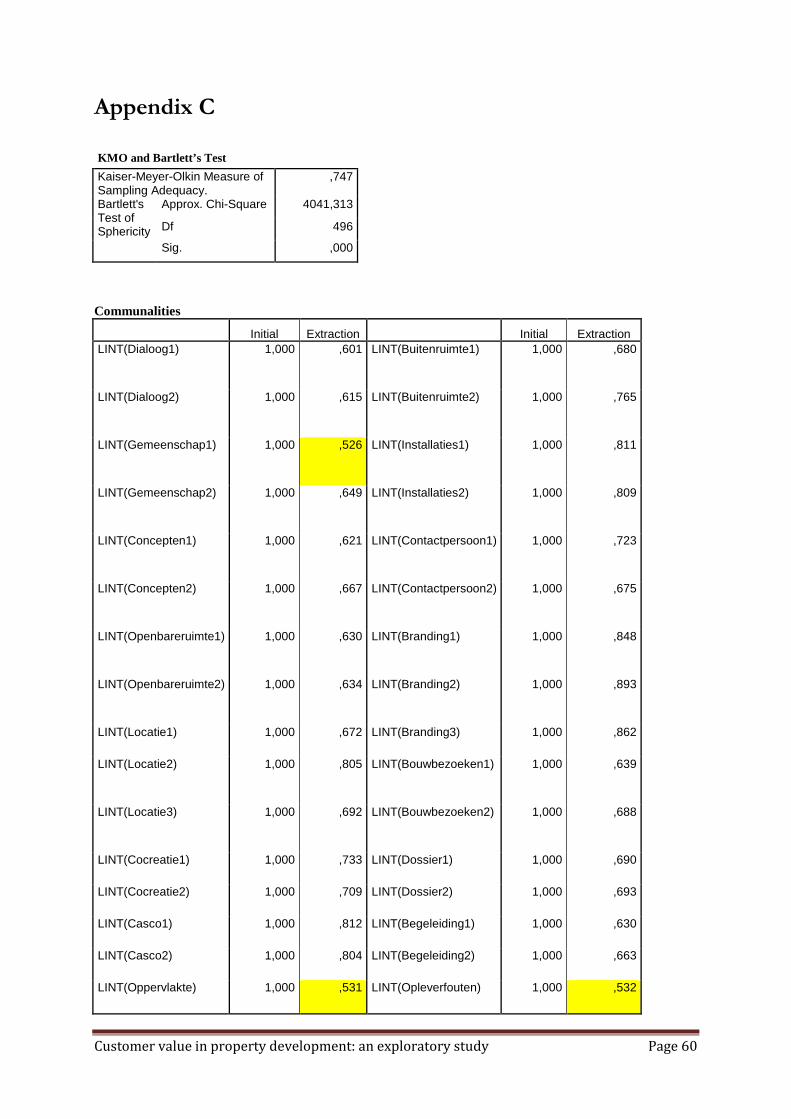
Customer value in property development: an exploratory study Page 60
Appendix C
KMO and Bartlett’s Test
Kaiser-Meyer-Olkin Measure of Sampling Adequacy.
,747
Bartlett's Test of Sphericity
Approx. Chi-Square 4041,313
Df 496
Sig. ,000
Communalities Initial Extraction Initial Extraction
LINT(Dialoog1) 1,000 ,601 LINT(Buitenruimte1) 1,000 ,680
LINT(Dialoog2) 1,000 ,615 LINT(Buitenruimte2) 1,000 ,765
LINT(Gemeenschap1) 1,000 ,526 LINT(Installaties1) 1,000 ,811
LINT(Gemeenschap2) 1,000 ,649 LINT(Installaties2) 1,000 ,809
LINT(Concepten1) 1,000 ,621 LINT(Contactpersoon1) 1,000 ,723
LINT(Concepten2) 1,000 ,667 LINT(Contactpersoon2) 1,000 ,675
LINT(Openbareruimte1) 1,000 ,630 LINT(Branding1) 1,000 ,848
LINT(Openbareruimte2) 1,000 ,634 LINT(Branding2) 1,000 ,893
LINT(Locatie1) 1,000 ,672 LINT(Branding3) 1,000 ,862
LINT(Locatie2) 1,000 ,805 LINT(Bouwbezoeken1) 1,000 ,639
LINT(Locatie3) 1,000 ,692 LINT(Bouwbezoeken2) 1,000 ,688
LINT(Cocreatie1) 1,000 ,733 LINT(Dossier1) 1,000 ,690
LINT(Cocreatie2) 1,000 ,709 LINT(Dossier2) 1,000 ,693
LINT(Casco1) 1,000 ,812 LINT(Begeleiding1) 1,000 ,630
LINT(Casco2) 1,000 ,804 LINT(Begeleiding2) 1,000 ,663
LINT(Oppervlakte) 1,000 ,531 LINT(Opleverfouten) 1,000 ,532
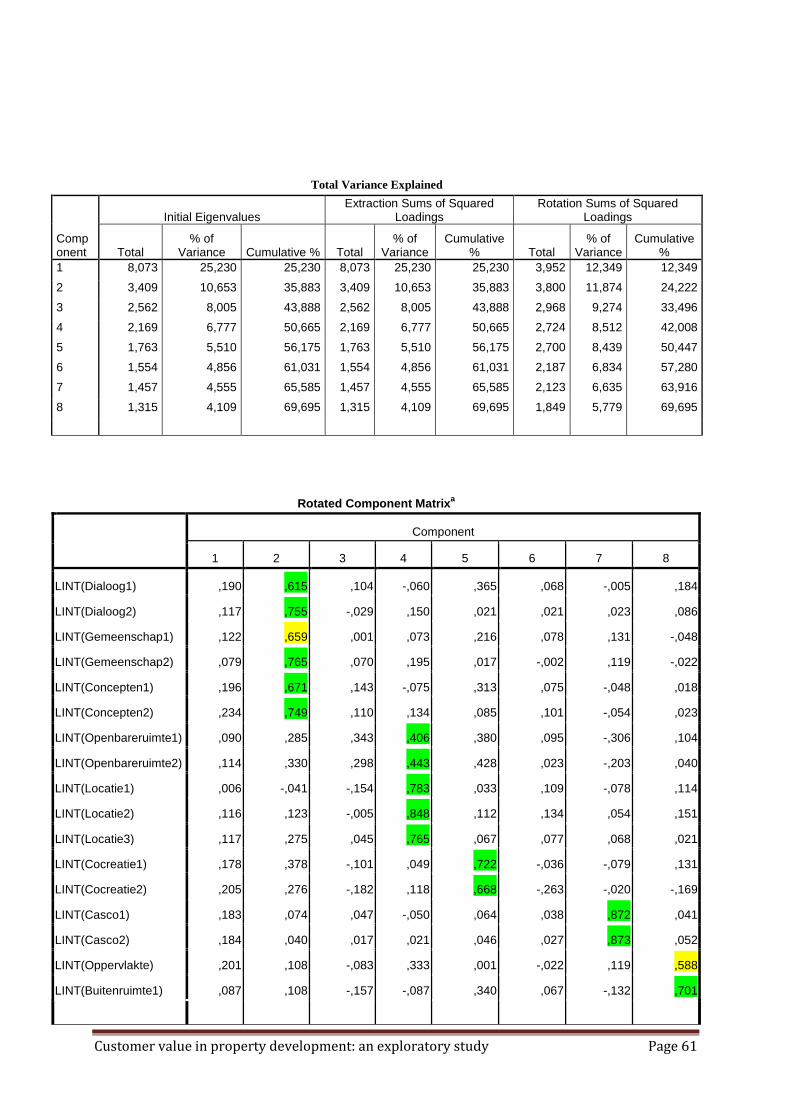
Customer value in property development: an exploratory study Page 61
Total Variance Explained
Component
Initial Eigenvalues Extraction Sums of Squared
Loadings Rotation Sums of Squared
Loadings
Total % of
Variance Cumulative % Total % of
Variance Cumulative
% Total % of
Variance Cumulative
% 1 8,073 25,230 25,230 8,073 25,230 25,230 3,952 12,349 12,349
2 3,409 10,653 35,883 3,409 10,653 35,883 3,800 11,874 24,222
3 2,562 8,005 43,888 2,562 8,005 43,888 2,968 9,274 33,496
4 2,169 6,777 50,665 2,169 6,777 50,665 2,724 8,512 42,008
5 1,763 5,510 56,175 1,763 5,510 56,175 2,700 8,439 50,447
6 1,554 4,856 61,031 1,554 4,856 61,031 2,187 6,834 57,280
7 1,457 4,555 65,585 1,457 4,555 65,585 2,123 6,635 63,916
8 1,315 4,109 69,695 1,315 4,109 69,695 1,849 5,779 69,695
Rotated Component Matrixa
Component
1 2 3 4 5 6 7 8
LINT(Dialoog1) ,190 ,615 ,104 -,060 ,365 ,068 -,005 ,184
LINT(Dialoog2) ,117 ,755 -,029 ,150 ,021 ,021 ,023 ,086
LINT(Gemeenschap1) ,122 ,659 ,001 ,073 ,216 ,078 ,131 -,048
LINT(Gemeenschap2) ,079 ,765 ,070 ,195 ,017 -,002 ,119 -,022
LINT(Concepten1) ,196 ,671 ,143 -,075 ,313 ,075 -,048 ,018
LINT(Concepten2) ,234 ,749 ,110 ,134 ,085 ,101 -,054 ,023
LINT(Openbareruimte1) ,090 ,285 ,343 ,406 ,380 ,095 -,306 ,104
LINT(Openbareruimte2) ,114 ,330 ,298 ,443 ,428 ,023 -,203 ,040
LINT(Locatie1) ,006 -,041 -,154 ,783 ,033 ,109 -,078 ,114
LINT(Locatie2) ,116 ,123 -,005 ,848 ,112 ,134 ,054 ,151
LINT(Locatie3) ,117 ,275 ,045 ,765 ,067 ,077 ,068 ,021
LINT(Cocreatie1) ,178 ,378 -,101 ,049 ,722 -,036 -,079 ,131
LINT(Cocreatie2) ,205 ,276 -,182 ,118 ,668 -,263 -,020 -,169
LINT(Casco1) ,183 ,074 ,047 -,050 ,064 ,038 ,872 ,041
LINT(Casco2) ,184 ,040 ,017 ,021 ,046 ,027 ,873 ,052
LINT(Oppervlakte) ,201 ,108 -,083 ,333 ,001 -,022 ,119 ,588
LINT(Buitenruimte1) ,087 ,108 -,157 -,087 ,340 ,067 -,132 ,701
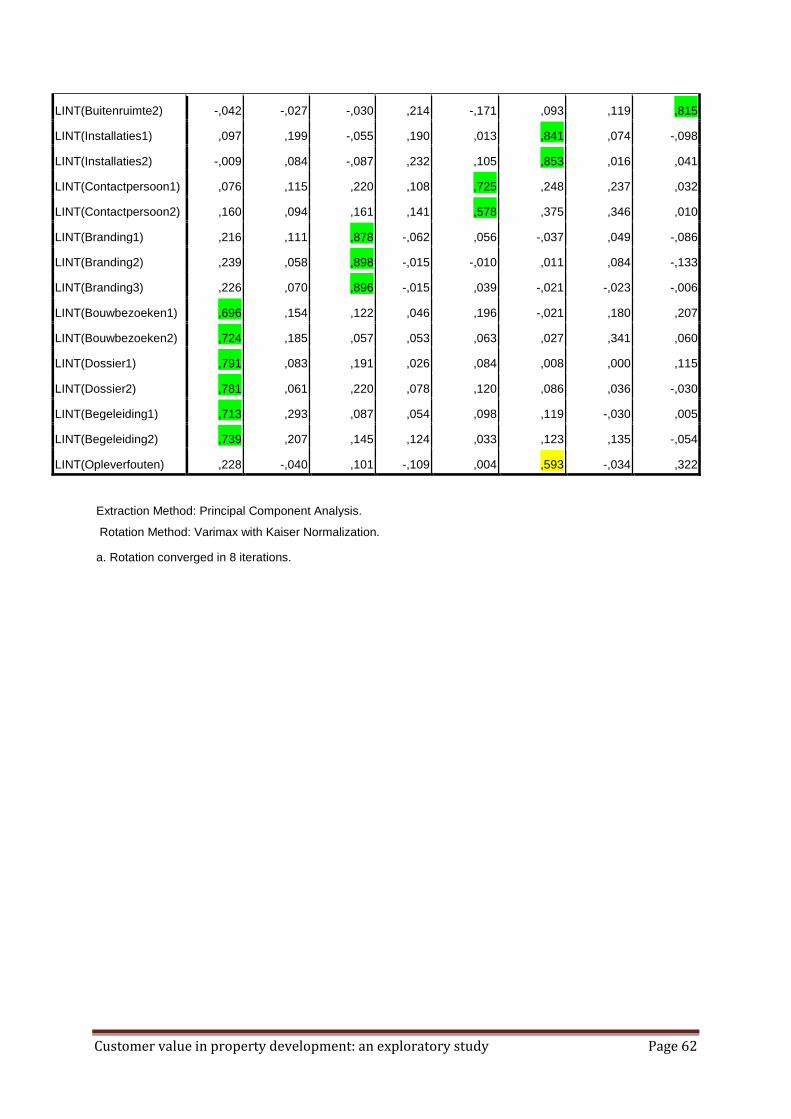
Customer value in property development: an exploratory study Page 62
Extraction Method: Principal Component Analysis.
Rotation Method: Varimax with Kaiser Normalization.
a. Rotation converged in 8 iterations.
LINT(Buitenruimte2) -,042 -,027 -,030 ,214 -,171 ,093 ,119 ,815
LINT(Installaties1) ,097 ,199 -,055 ,190 ,013 ,841 ,074 -,098
LINT(Installaties2) -,009 ,084 -,087 ,232 ,105 ,853 ,016 ,041
LINT(Contactpersoon1) ,076 ,115 ,220 ,108 ,725 ,248 ,237 ,032
LINT(Contactpersoon2) ,160 ,094 ,161 ,141 ,578 ,375 ,346 ,010
LINT(Branding1) ,216 ,111 ,878 -,062 ,056 -,037 ,049 -,086
LINT(Branding2) ,239 ,058 ,898 -,015 -,010 ,011 ,084 -,133
LINT(Branding3) ,226 ,070 ,896 -,015 ,039 -,021 -,023 -,006
LINT(Bouwbezoeken1) ,696 ,154 ,122 ,046 ,196 -,021 ,180 ,207
LINT(Bouwbezoeken2) ,724 ,185 ,057 ,053 ,063 ,027 ,341 ,060
LINT(Dossier1) ,791 ,083 ,191 ,026 ,084 ,008 ,000 ,115
LINT(Dossier2) ,781 ,061 ,220 ,078 ,120 ,086 ,036 -,030
LINT(Begeleiding1) ,713 ,293 ,087 ,054 ,098 ,119 -,030 ,005
LINT(Begeleiding2) ,739 ,207 ,145 ,124 ,033 ,123 ,135 -,054
LINT(Opleverfouten) ,228 -,040 ,101 -,109 ,004 ,593 -,034 ,322
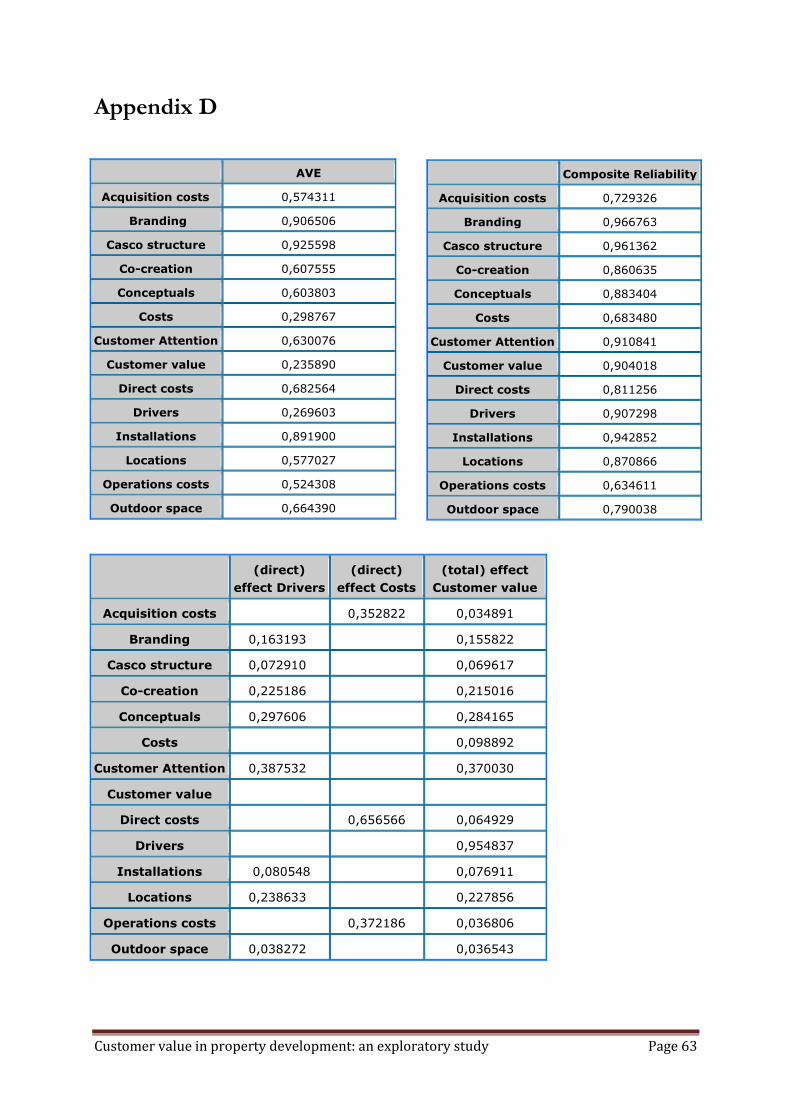
Customer value in property development: an exploratory study Page 63
Appendix D
(direct)
effect Drivers
(direct)
effect Costs
(total) effect
Customer value
Acquisition costs 0,352822 0,034891
Branding 0,163193 0,155822
Casco structure 0,072910 0,069617
Co-creation 0,225186 0,215016
Conceptuals 0,297606 0,284165
Costs 0,098892
Customer Attention 0,387532 0,370030
Customer value
Direct costs 0,656566 0,064929
Drivers 0,954837
Installations 0,080548 0,076911
Locations 0,238633 0,227856
Operations costs 0,372186 0,036806
Outdoor space 0,038272 0,036543
AVE
Acquisition costs 0,574311
Branding 0,906506
Casco structure 0,925598
Co-creation 0,607555
Conceptuals 0,603803
Costs 0,298767
Customer Attention 0,630076
Customer value 0,235890
Direct costs 0,682564
Drivers 0,269603
Installations 0,891900
Locations 0,577027
Operations costs 0,524308
Outdoor space 0,664390
Composite Reliability
Acquisition costs 0,729326
Branding 0,966763
Casco structure 0,961362
Co-creation 0,860635
Conceptuals 0,883404
Costs 0,683480
Customer Attention 0,910841
Customer value 0,904018
Direct costs 0,811256
Drivers 0,907298
Installations 0,942852
Locations 0,870866
Operations costs 0,634611
Outdoor space 0,790038
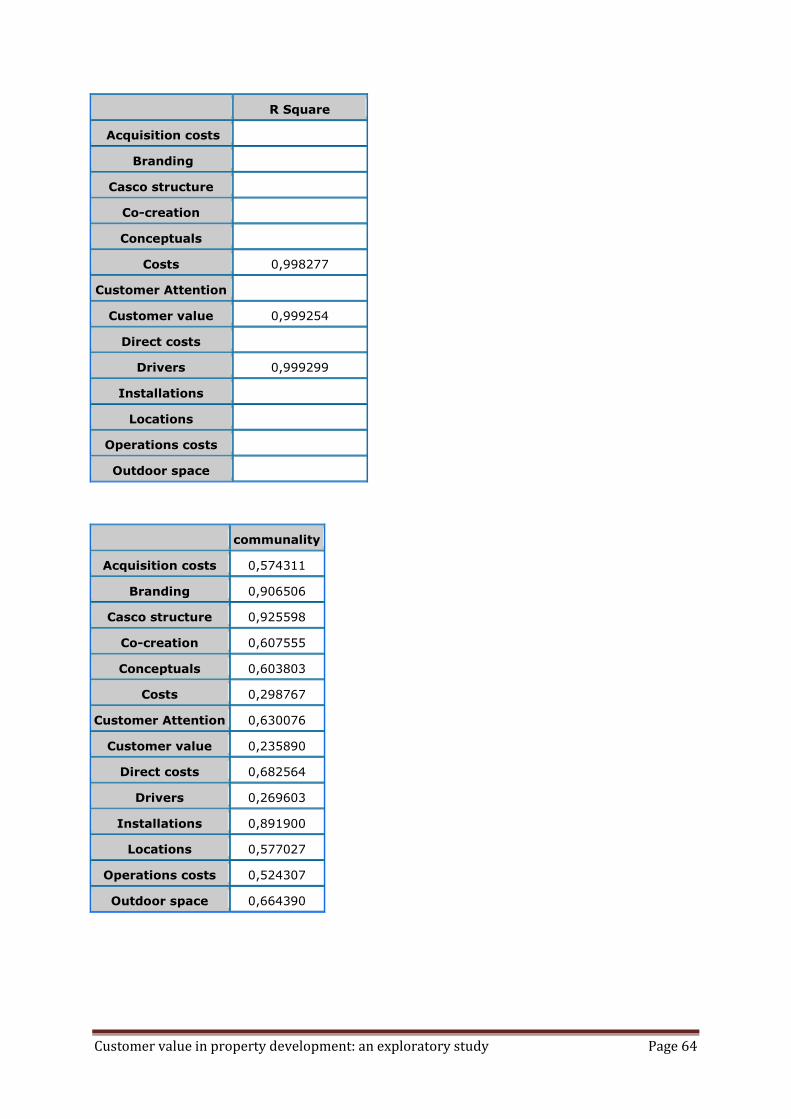
Customer value in property development: an exploratory study Page 64
R Square
Acquisition costs
Branding
Casco structure
Co-creation
Conceptuals
Costs 0,998277
Customer Attention
Customer value 0,999254
Direct costs
Drivers 0,999299
Installations
Locations
Operations costs
Outdoor space
communality
Acquisition costs 0,574311
Branding 0,906506
Casco structure 0,925598
Co-creation 0,607555
Conceptuals 0,603803
Costs 0,298767
Customer Attention 0,630076
Customer value 0,235890
Direct costs 0,682564
Drivers 0,269603
Installations 0,891900
Locations 0,577027
Operations costs 0,524307
Outdoor space 0,664390
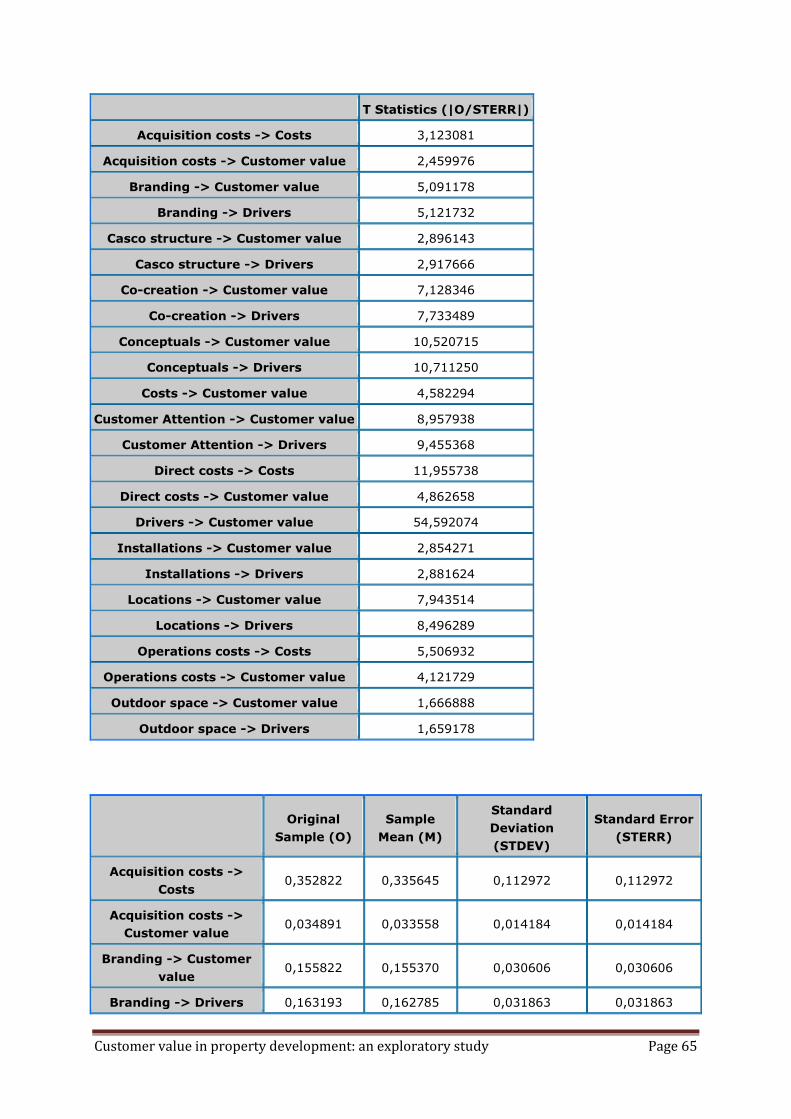
Customer value in property development: an exploratory study Page 65
T Statistics (|O/STERR|)
Acquisition costs -> Costs 3,123081
Acquisition costs -> Customer value 2,459976
Branding -> Customer value 5,091178
Branding -> Drivers 5,121732
Casco structure -> Customer value 2,896143
Casco structure -> Drivers 2,917666
Co-creation -> Customer value 7,128346
Co-creation -> Drivers 7,733489
Conceptuals -> Customer value 10,520715
Conceptuals -> Drivers 10,711250
Costs -> Customer value 4,582294
Customer Attention -> Customer value 8,957938
Customer Attention -> Drivers 9,455368
Direct costs -> Costs 11,955738
Direct costs -> Customer value 4,862658
Drivers -> Customer value 54,592074
Installations -> Customer value 2,854271
Installations -> Drivers 2,881624
Locations -> Customer value 7,943514
Locations -> Drivers 8,496289
Operations costs -> Costs 5,506932
Operations costs -> Customer value 4,121729
Outdoor space -> Customer value 1,666888
Outdoor space -> Drivers 1,659178
Original
Sample (O)
Sample
Mean (M)
Standard
Deviation
(STDEV)
Standard Error
(STERR)
Acquisition costs ->
Costs 0,352822 0,335645 0,112972 0,112972
Acquisition costs ->
Customer value 0,034891 0,033558 0,014184 0,014184
Branding -> Customer
value 0,155822 0,155370 0,030606 0,030606
Branding -> Drivers 0,163193 0,162785 0,031863 0,031863
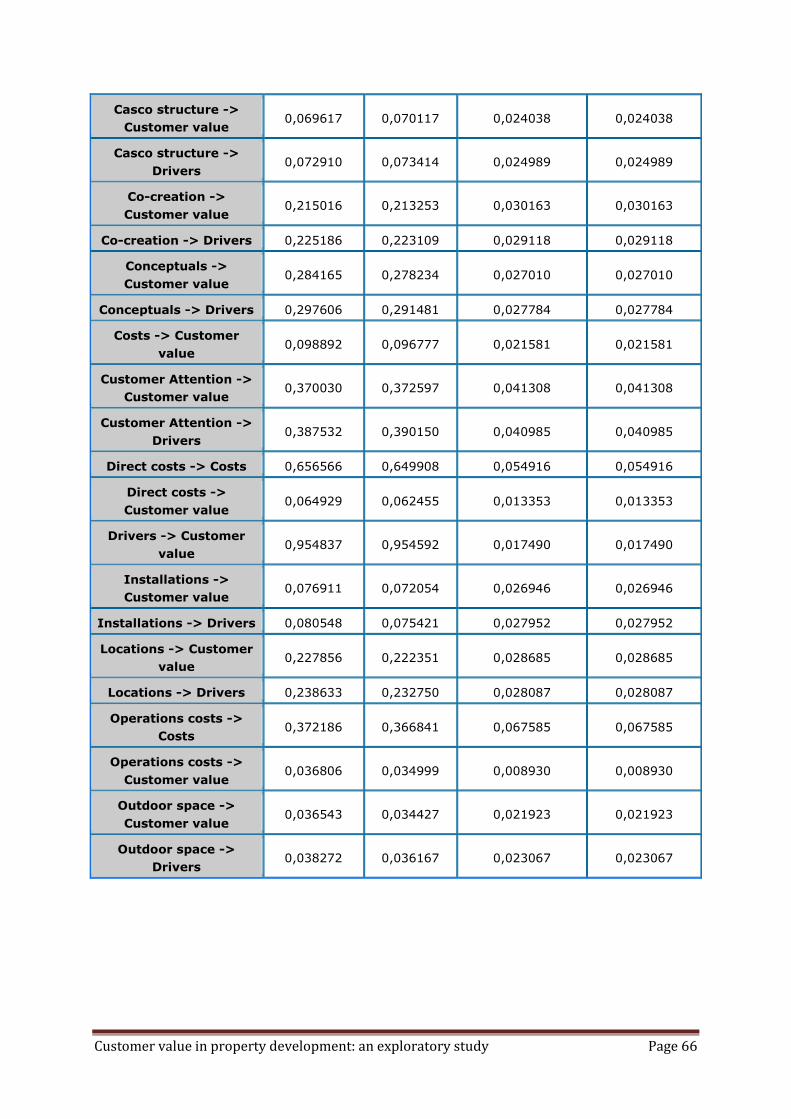
Customer value in property development: an exploratory study Page 66
Casco structure ->
Customer value 0,069617 0,070117 0,024038 0,024038
Casco structure ->
Drivers 0,072910 0,073414 0,024989 0,024989
Co-creation ->
Customer value 0,215016 0,213253 0,030163 0,030163
Co-creation -> Drivers 0,225186 0,223109 0,029118 0,029118
Conceptuals ->
Customer value 0,284165 0,278234 0,027010 0,027010
Conceptuals -> Drivers 0,297606 0,291481 0,027784 0,027784
Costs -> Customer
value 0,098892 0,096777 0,021581 0,021581
Customer Attention ->
Customer value 0,370030 0,372597 0,041308 0,041308
Customer Attention ->
Drivers 0,387532 0,390150 0,040985 0,040985
Direct costs -> Costs 0,656566 0,649908 0,054916 0,054916
Direct costs ->
Customer value 0,064929 0,062455 0,013353 0,013353
Drivers -> Customer
value 0,954837 0,954592 0,017490 0,017490
Installations ->
Customer value 0,076911 0,072054 0,026946 0,026946
Installations -> Drivers 0,080548 0,075421 0,027952 0,027952
Locations -> Customer
value 0,227856 0,222351 0,028685 0,028685
Locations -> Drivers 0,238633 0,232750 0,028087 0,028087
Operations costs ->
Costs 0,372186 0,366841 0,067585 0,067585
Operations costs ->
Customer value 0,036806 0,034999 0,008930 0,008930
Outdoor space ->
Customer value 0,036543 0,034427 0,021923 0,021923
Outdoor space ->
Drivers 0,038272 0,036167 0,023067 0,023067
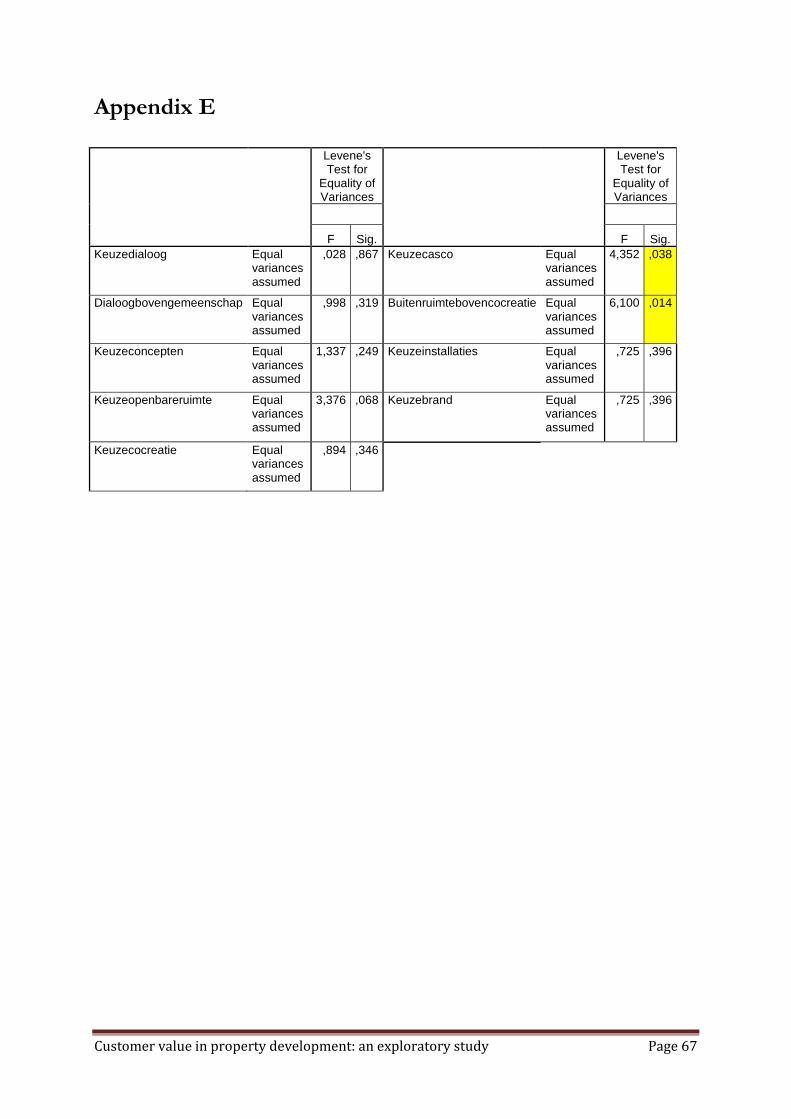
Customer value in property development: an exploratory study Page 67
Appendix E
Levene's Test for
Equality of Variances
Levene's Test for
Equality of Variances
F Sig. F Sig. Keuzedialoog Equal
variances assumed
,028 ,867 Keuzecasco Equal variances assumed
4,352 ,038
Dialoogbovengemeenschap Equal variances assumed
,998 ,319 Buitenruimtebovencocreatie
Equal variances assumed
6,100 ,014
Keuzeconcepten Equal variances assumed
1,337 ,249 Keuzeinstallaties Equal variances assumed
,725 ,396
Keuzeopenbareruimte Equal variances assumed
3,376 ,068 Keuzebrand Equal variances assumed
,725 ,396
Keuzecocreatie Equal variances assumed
,894 ,346