Embed Size (px)
Citation preview

Master’s thesis
Effects of biochar addition on anaerobic digestion and
comparison of different biochar qualities
Riku Sinervo
University of Jyväskylä
Department of Biological and Environmental Sciences
Environmental Science and Technology
14.1.2017

JYVÄSKYLÄN YLIOPISTO, Matemaattis-luonnontieteellinen tiedekunta
Bio- ja ympäristötieteiden laitos
Ympäristötiede ja -teknologia
Riku Sinervo: Biohiilen käyttö anaerobisessa mädätyksessä ja erilaisten bio-
hiilten ominaisuuksien tutkiminen
Pro gradu -tutkielma: 50 s., 3 liitettä (2 s.)
Työn ohjaajat: Prof. Tuula Tuhkanen ja FM Aino Kainulainen
Tarkastajat: Prof. Tuula Tuhkanen ja FT Leena Sivula
Tammikuu 2017
Hakusanat: anaerobinen mädätys, biohiili, pyrolyysi, hydrodermaalinen karbonisointi,
biokaasu, bioenergia, metaani, ammoniakki-inhibitio, jätteenkäsittely, ammo-
nium-adsorptio, orgaaninen jäte, mädäte, PAH-yhdisteet
TIIVISTELMÄ
Tässä pro gradu -työssä tutkittiin, voidaanko anaerobisen mädätyksen toimintaa parantaa
lisäämällä mädätysprosessiin pieniä määriä biohiiltä. Anaerobista mädätystä tutkittiin labo-
ratoriomittakaavan biokaasukokeilla, joissa biokaasureaktoreita käsiteltiin sekä pyrolyytti-
sesti että hydrodermaalisesti tuotetulla biohiilellä. Biohiilen mahdolliseen kykyyn lievittää
ammoniakki-inhibitiota kiinnitettiin huomiota. Seitsemän pyrolyyttisen ja yhden hydro-
dermaalisen hiilen ominaisuuksia vertailtiin, jotta voitaisiin määrittää soveltuvia biohiiliä
anaerobiseen mädätykseen. Biohiilistä analysoitiin ammonium-adsorptiokapasiteetti, irtoa-
van liukoisen orgaanisen kokonaishiilen (DOC) ja liukoisen kokonaistypen (DTN) määrä
sekä PAH-yhdisteiden määrä.
Ammonium-adsorptiokapasiteetin mittaukset osoittivat, että biohiilet kykenevät adsor-
boimaan ammonium-ioneja, mutta tunnettuun ammonium-adsorbenttiin zeoliittiin verrat-
tuna adsorptio oli vähäisempää. Zeoliitin ja biohiilten adsorptio vaihteli välillä 5,0–17,3
mg/g ja 0,8–4,4 mg/g adsorbentin konsentraatiosta riippuen. Korkea adsorptiokapasiteetti
olisi hyödyllinen ammoniakki-inhibition lievittämisen kannalta. Irtoavat DOC- ja DTN-
määrät olivat välillä 8,9–6397 mg/l ja 0,83–2705 mg/l. Biohiilten PAH-määrät vaihtelivat
välillä 1,6–190 mg/kg ja joidenkin näytteiden korkeat arvot osoittivat, että haitta-aineisiin
tulee kiinnittää huomiota, jos mädäte hyödynnetään maanparannusaineena. Biohiilten omi-
naisuuksien todettiin riippuvan valmistusprosessista ja –materiaalista, ja näitä optimoimal-
la voi olla mahdollista valmistaa anaerobiseen mädätykseen paremmin soveltuvia biohiiliä.
Biokaasukokeiden perusteella pyrolyyttisellä biohiilellä ei ollut merkittävää vaikutusta
metaanin tuotantoon, kun taas hydrodermaalinen biohiili paransi sitä. Hydrodermaalista
biohiiltä lisättiin sekä normaaliin että ammoniumilla lisättyyn syötteeseen. Molemmissa
olosuhteissa hydrodermaalinen biohiili lisäsi metaanintuotantoa kontrolleihin verrattuna
(15 % ja 26 %). Koska biohiilten ammonium-adsorptiokapasiteetti oli rajallinen, hyvät
vaikutukset voivat johtua muista mekanismeista. Hydrodermaalinen biohiili on biohajoa-
vampi pyrolyyttiseen biohiileen verrattuna, mikä voi selittää tuloksia. Lisätty hiilimäärä oli
4.5 % syötteen tuorepainoon verrattuna, ja tällaisella määrällä todettiin olevan vaikutuksia
metaanintuotantoon. Toisaalta kokeissa oli tilastollisia epävarmuustekijöitä, joiden vuoksi
tuloksia tulee tulkita varovaisesti. Jatkotutkimuksia useammilla rinnakkaisilla näytteillä
tulisi tehdä havaintojen varmistamiseksi ja tilastollisesti pätevien tulosten saamiseksi.
UNIVERSITY OF JYVÄSKYLÄ, Faculty of Science
Department of Biological and Environmental Science
Environmental Science and Technology
Riku Sinervo: Effects of biochar addition on anaerobic digestion and compari-
son of different biochar qualities
Master thesis: 50 p., 3 appendices (2 p.)
Supervisors: Prof. Tuula Tuhkanen and M.Sc. Aino Kainulainen
Inspectors: Prof. Tuula Tuhkanen and Ph.D. Leena Sivula
January 2017
Key words: anaerobic digestion, biochar, hydrochar, pyrolysis, hydrothermal carboniza-
tion, biogas, bioenergy, methane, ammonia inhibition, ammonium adsorption,
waste management, organic waste, digestate, PAH compounds
ABSTRACT
In this thesis, the effects of biochar addition on anaerobic digestion were studied to find
out could biochar enhance the methane production. Both pyrolytic biochar and hydrother-
mally carbonized hydrochar were applied to anaerobic digesters in laboratory scale biogas
experiments. The possible ability of biochar to mitigate ammonia inhibition was addressed.
Seven pyrolytic biochars and one hydrochar were compared to find suitable biochars for
anaerobic digestion. The ammonium adsorption capacity, nutrient release in respect of dis-
solved organic carbon (DOC) and dissolved total nitrogen (DTN), and polycyclic aromatic
hydrocarbons (PAHs) were analyzed from the biochar samples.
Ammonium adsorption capacities showed that biochars could adsorb ammonium ions but
compared with a well-known ammonium adsorbent zeolite the adsorption was lower. The
adsorption in zeolite varied between 5.0–17.3 mg/g and in biochars 0.8–4.4 mg/g depend-
ing on the adsorbent concentration. High adsorption capacity could be useful in mitigating
ammonia inhibition. All the biochars released DOC and DTN in the range of 8.9–6397
mg/l and 0.83–2705 mg/l. The PAHs in the biochars varied in the range of 1.6–190 mg/kg
and high levels in some biochars showed that focus on contaminants must be considered, if
the produced digestate is utilized as soil amendment. Characteristics of biochars seemed to
vary depending on the feedstock and manufacturing methods, and therefore the optimiza-
tion of biochars could be beneficial when considering their use in anaerobic digestion.
In biogas experiments the pyrolytic biochar did not have a significant effect on the me-
thane production, while the hydrochar seemed to enhance it. Hydrochar was applied to
normal feedstock and to feedstock with increased ammonium concentration. In both condi-
tions the cumulative methane production was higher in hydrochar treated groups (15 % and
26 % respectively). Due to the limited ammonium adsorption capacities of the biochars it
is possible that the good effects of the hydrochar were based on other mechanisms. Hydro-
char has higher biodegradability compared with pyrolytic biochar and this could explain
the better results. The applied hydrochar dosage was 4.5 % compared to the feedstock
fresh weight and with this kind of dosage differences in the methane production were ob-
served. On the other hand, the experiments have statistical limitations and the results must
be interpreted with a high caution. Further experiments with more replicates and statistical
analyses should be done to ensure the observations and get scientifically reliable results.

Table of contents
1 INTRODUCTION ........................................................................................................ 1
2 BACKGROUND AND THEORY ................................................................................ 3 2.1 Principles of biogas formation via anaerobic digestion .............................................. 3 2.2 Factors affecting the anaerobic digestion ................................................................... 4 2.3 Wet and dry digestion ............................................................................................... 7 2.4 Inhibition of the anaerobic digestion ......................................................................... 7 2.5 Biochars and their production and properties........................................................... 10 2.6 The use of additives and biochar in anaerobic digestion .......................................... 15 2.7 Biochars and the partial flow digestion process ....................................................... 18
3 OBJECTIVES ............................................................................................................ 19
4 MATERIALS AND METHODS ................................................................................ 20 4.1 Samples and sampling ............................................................................................. 20 4.2 Experimental setups of the biochar studies .............................................................. 22 4.3 Experimental setups of the biogas experiments ....................................................... 23 4.4 Analytical methods ................................................................................................. 25
5 RESULTS AND DISCUSSION.................................................................................. 27 5.1 Biowaste and feedstock characteristics .................................................................... 27 5.2 Process water characteristics ................................................................................... 28 5.3 The ability of biochars to adsorb ammonium ions ................................................... 29 5.4 Biochar nutrient release........................................................................................... 32 5.5 Biogas batch experiments with biochar treatments .................................................. 35 5.6 Hydrochar from anaerobically digested sewage sludge ............................................ 41 5.7 Biochar PAH-analysis ............................................................................................. 42
6 CONCLUSIONS ......................................................................................................... 43
ACKNOWLEDGEMENTS .......................................................................................... 45
REFERENCES .............................................................................................................. 45
APPENDICES
Appendix 1. The values of biochar ammonium adsorption capacities.
Appendix 2. The values of nutrient release (DOC and DTN) from biochars.
Appendix 3. The values and composition of 15 PAHs in biochars.

ABBREVIATIONS
BMP Biomethane potential
COD Chemical oxygen demand
DIET Direct interspecies electron transfer
DOC Dissolved organic carbon
DTN Dissolved total nitrogen
HTC Hydrothermal carbonization
ISR Inoculum to substrate ratio
SCOD Soluble chemical oxygen demand
PAH Polycyclic aromatic hydrocarbon
TAN Total ammoniacal nitrogen
TKN Total kjeldahl nitrogen
TS Total solids
TOC Total organic carbon
VFA Volatile fatty acid
VS Volatile solids
WWTP Waste water treatment plant

1 INTRODUCTION
Earth is facing major problems in the near future. A clear majority of the scientists in the
world approves that climate change is happening and that it can have severe effects on the
world we know today (Chiras 2013). Climate change results mainly from the anthropogen-
ic use of fossil fuels which has increased the amount of carbon dioxide, which acts as a
greenhouse gas in our atmosphere (Boyle 2004). To prevent the threatening climate
change, greenhouse gas reductions in the range of 60-80 % are needed in the end of the
21st century and ultimately, a switch to low- or zero-carbon energy sources (Boyle 2004).
Renewable energy sources include solar, wind, hydro, tidal, geothermal and bioenergy.
Bioenergy is energy that is produced from biological sources, for example from plants or
biological wastes (Wall et al. 2008). One form of bioenergy is biogas made with anaerobic
digestion from biological materials and it can be used in the production of heat and elec-
tricity or fuel in biogas cars (Abbassi et al. 2012). Additionally anaerobic digestion plays
an important role in the waste management since in addition of energy recovery it is a
method for organic waste management and pollution control (Chen et al. 2008). In Finland
since the beginning of 2016 the legislation (2013/331) has forbidden the placement of or-
ganic waste (over 10 % organic material) to the landfills, so there exist legal obligations to
treat the organic waste separately. Additionally, with separate treatment of the organic
waste and anaerobic digestion it is possible to reduce environmental impacts on the land-
fills and use waste to generate energy (Williams 2006). The remaining digestate from the
process can be used as a fertilizer or feedstock for composting since it is rich in nitrogen
and phosphorus (Holm-Nielsen et al. 2009).
Energy production with anaerobic digestion can be described as a mature technology, since
it has been established already for some decades and the research around the topic has been
intense (Mata-Alvarez et al. 2000). Even though the idea is not new, there still exists the
problem that commercial anaerobic digestion processes are often operated below their op-
timal performance (Ward et al. 2008). By optimizing the process in different ways, for
example controlling the carbon-nitrogen ratio of the feedstock or by using additive materi-
als, it is possible to improve the yield and the quality of produced biogas (Ward et al.
2008). These results as resource efficiency, improved economic sustainability, and in-
creased amount of renewable energy, and therefore the methods that improve the process
are worth to study.

2
Biochars are stable and solid carbon-rich material obtained from thermochemical conver-
sion of biomass in oxygen-limited environment (IBI 2012) and in recent years there has
been a lot of discussion about their applications related to soil amendment, waste manage-
ment, and energy production (Lehmann & Joseph 2015). Lately biochar has also been stud-
ied as an additive material in anaerobic digestion. This is relatively new topic but already
some research in this field exists. According to these studies (Cai et al. 2016, Luo et al.
2015, Mumme et al. 2014) the possible effects of biochar on anaerobic digestion process in
terms of stability, higher biogas yields and inhibition problems are worth studying.
The integration of biochar and biogas production promises several synergies, for example
the digestate from anaerobic digestion could be a suitable feedstock for biochar production
(Mumme et al. 2014) and the remaining biochar in the digestate could serve as a soil im-
prover if the digestate is composted (Luo et al. 2015). These kinds of systems would pro-
mote nutrient recovery and circular economy, which are important concepts in Finland and
globally at the moment. Together with the government the Finnish Ministry of Environ-
ment has launched a key project relating to nutrient recovery and one main theme is the
utilization of organic wastes and digestate derived soil amendments (Finnish Ministry of
Environment 2016). Also, the European Commission has set an action plan for the circular
economy, which highly promotes waste management, food waste utilization and from
waste to resources philosophy (2015/614/COM). Also these make the research of issues of
these kind relevant.
In this thesis, the effects of biochar addition to anaerobic digestion were studied and differ-
ent biochars were compared. The thesis was made as a collaboration between the Universi-
ty of Jyväskylä and the Helsinki Region Environmental Services Authority (HSY) and it
was a part of the Material Value Chains (ARVI) research program. The objective of ARVI
program is to research systemic assessment of material recovery and recycling opportuni-
ties. The program consists of 29 organizations and it includes both companies and research
and public organizations. In addition, the effects of biochar on composting had been stud-
ied before as a part of HSY Kombi-project and based on this the effects in anaerobic diges-
tion also wanted to investigate.

3
2 BACKGROUND AND THEORY
2.1 Principles of biogas formation via anaerobic digestion
Anaerobic digestion is a process, where micro-organism break down and convert organic
material into biogas in the absence of oxygen (Ryckebosch et al. 2011). Anaerobic diges-
tion occurs naturally in soils and in lake and ocean sediments (Koyama 1963) but nowa-
days industrial biogas is also produced for example in sewage treatment plants, landfills,
and waste digestion plants (Ryckebosch et al. 2011). Biogas consists mainly on methane
(55–70 %) and carbon dioxide (30–40 %) and small traces of other gases, for example ni-
trogen, water vapour, ammonia, and hydrogen sulphide (Rasi et al. 2007). Methane has a
high calorific value compared with the other components of the biogas and in some cases it
can be separated from the other gases to get biomethane, which is suitable for fuel or for
injection in the natural gas grid (Ryckebosch et al. 2011).
Biogas production with anaerobic digestion is a complex process that can be roughly di-
vided into four phases called hydrolysis, acidogenesis, acetogenesis, and methanogenesis
(Abbasi et al. 2012). Each phase is carried out by different micro-organism group (Deuble-
in & Steinhauser 2011).
Fig. 1. The phases of biogas production through anaerobic digestion (Abbasi et al. 2012).

4
In hydrolysis the complex compounds of organic material are broken down by micro-
organisms into smaller water soluble molecules called monomers (Angelidaki & Sanders
2004). Long-chain carbohydrates are broken down into short-chain sugars, proteins into
amino acids, and fats into fatty acids and glycerin (Deublein & Steinhauser 2011). In the
acidogenic phase, the monomers formed previously are degraded by anaerobic bacteria
(Deublein & Steinhauser 2011). The resulting products are short-chain organic acids, alco-
hols, hydrogen, carbon dioxide, nitrogen oxide, and hydrogen sulphide (Deublein & Stein-
hauser 2011). In the acetogenic phase, the previous products serve as substrates for aceto-
genic bacteria via two pathways (Deublein & Steinhauser 2011). Acetogenic bacteria can
reduce CO2 by H2 to acetic acid or they can formate acetate by oxidising short-chain or-
ganic acids or alcohols and as a by-product H2 and CO2 is formed (Deublein & Steinhauser
2011). The final phase is methanogenesis, where methane formation takes place via car-
bonate respiration (Abbasi et al. 2012). Two main pathways are aceticlastic and hydrogen-
otrophic methanogenesis (Wall et al. 2008). Hydrogenotrophic pathway occurs when me-
thane is generated by reduction from CO2 by H2 (27–30 % of production) and aceticlastic
pathway occurs when methane is generated by reduction from acetate in the presence of
water (70 % of production) (Deublein et al. 2011). Also some other minor pathways exist,
for example methyl-type formation (Wall et al. 2008).
2.2 Factors affecting the anaerobic digestion
2.2.1 Overview
The conditions in the anaerobic digester must be suitable for the micro-organism to keep
the process working properly (Deublein & Steinhauser 2011). Therefore, a variety of pa-
rameters must be taken into consideration and especially the needs of the methanogenic
bacteria must be fulfilled with care, since they are very sensitive to environmental factors
and have a low growth rate (Weiland 2010). The most important parameters include pH,
the temperature, substrate type and composition, and operational parameters like volume
load, cultivation and mixing (Zhang et al. 2014).
2.2.2 Temperature
Anaerobic digestion can be divided into mesophilic (35–42 °C) and thermophilic (45–60
°C) process because two temperature optimal for different micro-organisms exist (Weiland
2010). Methanogenic diversity is greater at mesophilic temperatures and therefore thermo-
philic process is more sensitive to rapid temperature changes (Deublein & Steinhauser
2011, Weiland 2010). Even variations in the range of ± 2 degrees °C can cause significant
5
changes in microbial activity (Deublein & Steinhauser 2011). Both thermophilic and mes-
ophilic conditions are widely used in anaerobic digestion plants. Thermophilic conditions
possess higher degradation rate of the organic solids (Kim et al. 2002) and better microbial
activity (Deublein & Steinhauser 2011), which result in higher biogas yields. It also serves
better in the deactivation of pathogens (Song et al. 2004) and additional hygienic proce-
dures are not necessarily needed (Deublein & Steinhauser 2011). On the other hand, meso-
philic conditions possess better process stability since micro-organisms are not so sensitive
to environmental changes (Zhang et al. 2014). Mesophilic process also has better energy
balance and reduced ammonia inhibition due to the lower free ammonia production (Deu-
blein & Steinhauser 2011).
2.2.3 pH
Methane formation occurs in the range of 6.5–8.5 and the optimal pH for the micro-
organisms is 7.0–8.0 (Weiland 2010). If the pH decrease below 6.0 or rises above 8.5 the
process is inhibited and microbial activity decreases, which result as lower biogas yields
(Weiland 2010). The main mechanism that affects the pH is the fermentation products that
release free hydrogen ions into solution, for example the acidification of hydrocarbons,
proteins and fatty acids (Deublein & Steinhauser 2011). There are natural buffering sys-
tems that resist the pH change. The bicarbonate buffering system prevents too strong acidi-
fication and the ammonia buffering system too strong basification (Deublein & Steinhauser
2011, Ward et al. 2008). Both systems can be overloaded for example by feeding too acid
or toxic substances, by a decrease in temperature, or by a too high loading rate (Deublein
et al., 2011). Increased pH value can often be linked to ammonia accumulation whereas
decreased pH results from VFA accumulation (Weiland, 2010). Usually, a first sign of
acidification is an increasing propionic acid concentration and ultimately this leads to a fall
in the pH-value and a rise in the CO2 in the biogas, which is a sign of inhibition in the pro-
cess (Deublein & Steinhauser 2011).
2.2.4 Substrate type and composition
All kinds of biomass that contain carbohydrates, proteins, fats, cellulose or hemicellulose
as the main components can be used in anaerobic digestion (Weiland 2010). The time and
difficulty of the degradation depends on the composition of substrate (Deublein & Stein-
hauser 2011) and determines whether they are suitable for anaerobic feedstock. For exam-
ple, lignified organic substances (e.g. wood) degrade very slowly and are not good feed-
stocks for anaerobic digestion (Weiland 2010). Some substances, for example short chain

6
sugars and carbohydrates, degrade in very short time while for others, like substances rich
in cellulose and hemicellulose, it might take as much as 20 days (Deublein & Steinhauser
2011). Different feedstocks provide different amounts of biogas and this can be estimated
with biomethane potential (BMP) test (Ward et al. 2008).
The composition of the feedstock is important since micro-organisms need enough macro-
nutrients (C, N, P, and S), micronutrients, and trace minerals (Deublein & Steinhauser
2011). If an important substrate component runs out, the micro-organisms stop their me-
tabolism and therefore it is useful to feed the process with possibly lacking substances
(Deublein & Steinhauser 2011). A rough estimate for the optimal nutrient balance is the
C:N ratio since these are the most important macronutrients in the process (Wang et al.
2014). The ratio should be well balanced to keep the process working properly and the
recommended value is 15:1–25:1 (Weiland 2010). A too low ratio can lead to ammonia
accumulation and inhibition and on the other hand too high ratio means the lack of nitro-
gen for the micro-organisms (Deublein & Steinhauser 2011).
2.2.5 Operation parameters
The most important operation parameters include reactor type, volume load, residence
time, and mixing (Deublein & Steinhauser 2011). Reactors are usually classified between
the batch and continuously fed reactors. In batch reactors, the digester is filled once and
during the residence time no substrate is added or taken out, whereas in the continuous
process the reactor is constantly fed and material is taken out (Deublein & Steinhauser
2011). The volume load in continuous processes is expressed as organic loading rate,
which is the daily recommended feedstock supply in TS or VS per digester volume. High
organic loading rates are ideal for the cost reasons and for the maximum volume of biogas
(Ward et al. 2008) but on the other hand they should be reasonable to prevent reactor over-
load and to get the best possible output (Deublein & Steinhauser 2011). Residence time is
expressed as hydraulic retention time and it tells how long the feedstock stays in the reac-
tor before it is taken out as a digestate (Abbasi et al. 2012). The retention time should be
long enough to cover the whole methanogenesis to prevent biogas losses (Deublein &
Steinhauser 2011). Usually hydraulic retention times of 15–20 days or even more are re-
quired, depending on the degradation rate of the feedstock (Deublein & Steinhauser 2011).
Mixing is usually applied to ensure the efficient transfer of organic material for the active
microbial biomass, to release gas bubbles and to prevent the sedimentation of denser mat-
ter (Ward et al. 2008).

7
2.3 Wet and dry digestion
Based on the medium total solids in the reactor anaerobic digestion can be separated into
wet and dry digestion. In wet digestion, the total solids content in the reactor is usually less
than 15 %, while in dry digestion the total solids in the reactor feed is 15–40 % (Bolzonella
et al. 2006). Wet digestion offers more possibilities for suitable substrates and is especially
applicable to substrates with high water content, whereas dry digestion is suitable for sub-
strates with higher dry matter content (Deublein & Steinhauser 2011). Wet digestion is
easier to regulate in terms of different process parameters, for example by pH and dry mat-
ter content (Deublein & Steinhauser 2011). Due to the greater water content, wet digestion
offers better mixing possibilities and the substrate is easier to transport using pumps and
allows easier application of multi-stage processes (Deublein & Steinhauser 2011).
A major drawback in wet digestion is the formation of digestate that requires dewatering
and the amount of wastewater, which are significantly larger than in dry digestion (Guen-
douz et al. 2010). The more solid digestate resulting from dry digestion is easier to handle
than liquid digestate from the wet process and it can be refined for example to the fertilizer
or pelletized fuel (Li et al. 2011). Dry digestion is less energy intensive and it consumes
less than 15 % of the energy produced, while in wet digestion this number can be 30–45 %
(Guendouz et al. 2010). Also the advantages of dry digestion include smaller reactor size
because it enables a higher organic loading rate (Guendouz et al. 2010). On the other hand,
the retention times are usually slower and the feedback of inoculum to the fresh feedstock
to speed up the reaction processes is sometimes necessary (Li et al. 2011).
2.4 Inhibition of the anaerobic digestion
2.4.1 Overview
Some substances even at very low concentrations have reported being inhibitory for anaer-
obic digestion (Chen et al. 2008). The inhibition depends on the concentration of the inhib-
itor, the composition of the substrate, and the adaption of the bacteria (Deublein & Stein-
hauser 2011). Usually, the bacteria needs the low concentrations of the inhibitors as their
trace elements but high concentrations lead to inhibition (Deublein & Steinhauser 2011).
Inhibition can disturb the anaerobic digestion and lead to the instability of the reactor, de-
creased biogas yield and even to a complete failure (Abbasi et al. 2012), which results in
economic losses. Inhibitory substances are often found out to be the leading cause for pro-
cess instability (Chen et al. 2008).

8
2.4.2 Ammonia inhibition
In the digestion of nitrogen rich substrates, for example source separated biowaste, ammo-
niacal compounds play a vital role in the performance and stability of the process (Ra-
jagopal et al. 2013). They are formed naturally in the degradation of nitrogen containing
compounds, for example proteins (Deublein & Steinhauser 2011). It has been showed that
small amounts of ammoniacal compounds are essential nutrients for bacterial growth but in
higher concentrations they may inhibit the process leading to smaller biogas yields (Ye-
nigün & Demirel 2013). Two principal ammoniacal compounds are free ammonia (NH3)
and ammonium ion (NH4+) and both can directly and indirectly cause inhibition (Yenigün
& Demirel 2013). Particularly free ammonia is a powerful inhibitor and with larger con-
centrations it can even be toxic, while ammonium ion is not so harmful (Deublein & Stein-
hauser 2011).
The most important factors affecting the ammonia inhibition are initial nitrogen concentra-
tions depending on the substrate, pH, and process temperature (Rajagopal et al. 2013). The
extent of ammoniacal compounds depends on the pH because in higher pH the proportion
of free ammonia increases, while in lower pH ammonium ion is the dominant form (Fig.
2). The equilibrium between free ammonia and ammonium ion is also temperature depend-
ent (Fig. 2). The increase in the temperature shifts the equilibrium for the favor of free
ammonia and therefore the inhibition increases with a rising temperature (Deublein &
Steinhauser 2011). Ammonia is a more powerful inhibitor than ammonium ion, and there-
fore the effects of pH and temperature must be considered carefully (Sung & Liu 2003).
Several methods of controlling the ammonia inhibition have been studied and the most
known solutions are pH and temperature control, acclimation of microflora, the adjustment
of the C:N ratio, and different additives (Rajagopal et al. 2013). According to Rajagopal et
al. (2013) ammonia inhibition can exist already with TAN concentrations of 1500 mg/kg.

9
Fig. 2. The pH dependency of free ammonia in solution at 20, 35, and 55 °C (Rajagopal et
al. 2013)
2.4.3 Organic acids and volatile fatty acids (VFAs)
VFAs are degraded into acetic acid that serves as a substrate for a major pathway of me-
thane production, but even though VFAs are essential for the process, too high concentra-
tions can lead to the inhibition (Wang et al. 2009). Inhibition might occur due to hypera-
cidity, where the pH of the reactor decreases (Deublein & Steinhauser 2011). This can re-
sult from the too intensive feeding of the bioreactor, which leads to the accumulation of
VFAs, which again leads to depletion in the buffering capacity and a decrease in pH (Chen
et al. 2008). Ultimately, this leads to the distortion of the degradation and methanogenic
microbial community (Chen et al. 2008). The phases of anaerobic digestion are closely
linked with each other and if the first and second phases run too fast, the acid concentration
rises due to fatty acids and pH-value drops (Deublein & Steinhauser 2011). It has been
showed that even if pH would remain quite normal due to buffering capacity, the accumu-
lation of VFAs may contribute to a reduced level of the hydrolysis of the solid substrate or
even to an inhibition at very high levels (Siegert & Banks 2005).
2.4.4 Other inhibition factors
In addition to these two main inhibition factors other sources of inhibition exists. Sulphur
compounds have been found inhibitory because sulfate reducing bacteria that naturally
occur in the system, competes over resources with methane forming micro-organisms
(Chen et al. 2008). In addition high amounts of sulfide are toxic to various bacteria groups
(Chen et al. 2008). Some light and heavy metal ions (for example sodium, potassium, lead,

10
and nickel) can also have toxic effects on higher concentrations, even though they are use-
ful as trace elements (Deublein & Steinhauser 2011). Other sources of inhibition also exist,
but they are not discussed further here.
2.5 Biochars and their production and properties
2.5.1 Overview and production methods
The International Biochar Initiative (IBI) has defined biochar as a stable and solid carbon-
rich material obtained from the thermochemical conversion of biomass in an oxygen-
limited environment (IBI 2012). Biochar is a relatively new scientific term, but the origins
of biochar are said to be in the ancient human populations in the Amazon region where
manmade rudimentary biochar was used to create dark soil called Terra Preta (Lehmann &
Joseph 2015). Later research in these soils has revealed that biochar truly can act as a soil
amendment and this has enhanced the research around biochars (Lehmann & Joseph 2015).
In addition to acting just as a soil amendment, biochar is recognized as a significant tool in
environmental management for example in the fields of waste management, climate
change mitigation, and energy production (Lehmann & Joseph 2015).
Usually two different methods called pyrolysis and hydrothermal carbonization (HTC) are
discussed when talking about the production of biochars. In addition of solid biochars, also
liquid bio-oil and gaseous syngas (Table 1) is co-produced in both processes (Libra et al.
2011, Mohan et al. 2006). Pyrolysis is the most well-known and the used method in bio-
char production and it means the thermal decomposition of biomass in the temperature of
200–1000 °C with little or no oxygen (Demirbas & Arin 2002). Pyrolysis can be divided
by the means of temperature and residence time and based on this it can be talked about
fast pyrolysis, where residence time is only seconds, and slow and intermediate pyrolysis,
where residence time is from a few minutes to several hours or even days (Mohan et al.
2006). The temperature between slow, intermediate and fast pyrolysis can vary, but in gen-
erally the faster the pyrolysis the higher the temperature (Table 1). Two special cases of
pyrolysis are torrefaction, which is mild pyrolysis in the temperature of 230–300 °C (Prins
et al. 2006) and gasification that happens in the temperatures above 800 °C in controlled
oxygen/steam environment and results mainly in gaseous end-products (Mohan et al.
2006).

11
Table 1. Pyrolysis processes and their product distribution (Ahmad et al. 2014).
Process Temp. (°C) Residence time Products
Liquid
(bio-oil) %
Solid (bio-
char) %
Gas (syn-
gas) %
Fast 300-1000 Short ( < 2 s) 75 12 13
Intermediate ≈ 500 Moderate (10-20 s) 50 25 25
Slow 100-1000 Long (5-30 min) 30 35 35
Gasification > 800 Moderate (10-20 s) 5 10 85
HTC, sometimes called liquid pyrolysis, is also a thermochemical decomposition of bio-
mass in the absence of oxygen but it is carried out under pressure and in the presence of a
subcritical liquid phase (Libra et al. 2011). Usually, the temperatures are 180–250 °C and
corresponding pressure up to approximately 20 bar (Libra et al. 2011). The biggest ad-
vantages of HTC are that the suitable feedstocks include biomasses with greater water con-
tent, for example sludge, and during the process the most of the feedstock used is trans-
ported into solids (Libra et al. 2011). Solids produced via HTC are usually referred to hy-
drochars to make a difference to biochars, because these two chars differ widely in chemi-
cal and physical properties (Bargmann et al. 2013).
Biochars made from different materials with different methods have unique properties, and
one type of biochar may not be suitable for all purposes. The properties of biochars are
mainly affected by production methods and these include pyrolysis temperature, residence
time, heat transfer rate, and feedstock type. The most important properties governing the
use of biochars are surface area, pore size distribution, and ion exchange capacity. In gen-
erally the high pyrolysis temperatures favor biochars that are effective in adsorbing organic
contaminants by increasing surface area, microporosity and hydrophobicity. On the other
hand, biochars produced in low temperatures are better in removing inorganics and polar
organic compounds by ion exchange capacity, electrostatic attraction, and precipitation
(Ahmad et al. 2014).
2.5.2 Hydrochar from anaerobically digested sewage sludge
In recent years, anaerobic digestate has been studied as a feedstock material for hydrochar
production and HTC is said to be a new and alternative method of treating different sludge
materials and improve their properties (Libra et al. 2011). In HSY region approximately
85 000 t/a of dried sewage sludge digestate are produced and the number is expected to
increase, since the population in the area grows (Castren et al. 2015). A new wastewater
treatment plant (WWTP) called Blominmäki with high treatment capacity will be complet-

12
ed at 2020, and it will replace the older Viikinmäki WWTP (Castren et al. 2015). Current-
ly, the dried sewage sludge digestate from WWTPs is composted and utilized as a soil
amendment (Castren et al. 2015). HTC treatment of sludge digestate would be an interest-
ing possibility alongside the traditional composting. It would not need an additional re-
moval of the water from the sludge (Berge et al. 2011) but on the other hand, the treatment
itself produces process water. Wirth & Mumme (2014) noted that the wastewater from
HTC could be treated anaerobically, but in their case it was derived from corn silage. If the
derived water has been subjected to anaerobic degradation before, probably the biogas
yields are not very remarkable. There still exist some unsolved challenges but implement-
ing the hydrochar production as a part of sludge and organic waste management could be
potential, especially if the value of hydrochar could be increased for example in anaerobic
digestion or composting.
According to the literature, it seems that anaerobically digested sludge is challenging feed-
stock, since the ash content of the sludge is usually high, which results in a low carbon
content of the hydrochar. Kim et al. (2014) studied the HTC treatment of anaerobically
digested sludge from a WWTP and their feedstock had carbon and ash contents of 38.55
and 26.06 %. The amounts of carbon and ash in the ultimate product were 39.98–48.45 %
and 29.35–40.02 % depending on the HTC temperature (Kim et al. 2014). They suggested
that 220 °C was the optimal temperature for HTC process based on the energy recovery
efficiency (Kim et al. 2014). Berge et al. (2011) studied the HTC of different municipal
waste streams including dried anaerobic digestate. The carbon and ash content in the feed-
stock were 32.6 and 35.9 % and in the hydrochar 27.8 and 55.8 % (Berge et al. 2011). On
the other hand Mumme et al. (2011) produced hydrochar with relatively high carbon con-
tent from anaerobically digested maize silage. Different temperatures were applied and
they found out that the yield and surface areas were the highest at 190 °C (Mumme et al.
2011). The carbon content in the feedstock was 45.8 % and in the hydrochar 59–79 %
(Mumme et al. 2011). It seems that certain optimization potential in manufacturing exists.
2.5.3 Biochars as ammonium adsorbents
The ability of biochars to remove ammonium ions from matrices with high concentration
has been addressed in few studies. This would be beneficial in anaerobic digestion since by
adsorbing ammonium ions biochars could reduce the effects of ammonia inhibition. Kizito
et al. (2015) studied the adsorption of ammonium nitrogen from piggery manure anaerobic
digestate slurry with slow pyrolyzed wood and rice husks. The adsorption was studied in

13
leachate water separated from piggery slurry and in pure NH4Cl-solution. They found out
that the maximum adsorbed amount and removal percentages by wood biochar were 54.84
mg/g (73 %) from pure solution and 44.64 mg/g (60 %) from piggery slurry and with rice
husk biochar 44.64 mg/g (60 %) and 39.8 mg/g (53 %) respectively (Kizito et al. 2015).
The initial ammonium concentrations were 1400 mg/l and added biochar dosages 1–20 g/l
(Kizito et al. 2015). On the other hand, some studies suggest lower values, so differences
between biochar adsorption capacities exists. Sarkhot et al. (2013) studied effectiveness of
biochar to adsorb ammonium from dairy effluent (ammonium concentration 0–1000 mg/l,
biochar dosage 5 g/l) and they found out that up to 5.3 mg/g (18 %) of ammonium was
adsorbed by the biochar. Also studies with lower initial ammonium concentration exist.
Zhu et al. (2012) studied the removal of ammonium from aqueous solution by using acti-
vated carbons made from rice husks with initial ammonium concentrations of 40 mg/l. In
their study, the adsorption varied between 2.04 and 0.97 mg/g depending on the biochar
dosage (1–20 g/l) (Zhu et al. 2012).
The difference between the biochar ability to adsorb ammonium ions can depend on vari-
ous factors. According to Kizito et al. (2015) increase in initial ammonium concentration,
the temperature, smaller particle size, and contact time increase the adsorption. The ad-
sorption decreased in low and alkaline pH and the best adsorption was found in the range
of 6.5–7 (Kizito et al. 2015). The decrease in alkaline conditions can result from the con-
version of ammonium to ammonia, which cannot be adsorbed very well onto biochars (Ki-
zito et al. 2015). The manufacturing and feedstock also have a significant role in biochar
characteristics (Ahmad et al. 2014) and especially biochars made in lower temperatures
(250–400 °C) has been found suitable for removing inorganic and polar contaminants (Gai
et al. 2014).
2.5.4 Biochar nutrient release
Lehmann et al. (2011) suggests that the positive effects of biochar as a fertilizer are usually
proposed due to biochar ability to adsorb and retain nutrients or also to nutrient release
straight from the biochars themselves. According to Chan & Xu (2009) biochars are ex-
tremely variable in nutrient composition and the availability of these depends highly on the
used feedstock and pyrolysis condition. If the biochars release useful nutrients in soil, the
same kind of approach could work in the anaerobic digestion environment. This could en-
hance the productivity of anaerobic micro-organisms in the digester.

14
Mukherjee & Zimmerman (2013) studied the organic carbon and nutrient release from
different biochars and they found out that biochars release nutrients into aqueous solution
and that most of these are in organic form. The amounts of released DOC, nitrogen and
phosphorus from three different biochars in simple horizontal shake experiment (0.5 g bio-
char in 40 ml leaching with speed of 150 rpm, 1 day incubation) were 355–4429 mg/kg, 0–
302 mg/kg, and 187–1255 mg/kg (Mukherjee & Zimmerman 2013). They also noted that
the release of nutrients depends on the manufacturing temperature and feedstock (Mukher-
jee & Zimmerman 2013). According to Knicker et al. (2010), the lower amounts of releas-
ing nitrogen have been related to the minor amounts of nitrogen present in biochar. Chan
& Xu (2009) suggest that to promote the use of biochars more consistent products with
higher nutrient values and improved nutrient retention are desired. These kinds of biochars
would probably be more beneficial also when considering the use in anaerobic digestion.
2.5.5 Polycyclic aromatic hydrocarbons in biochars
Recently the possible contaminants and their bioavailability in biochars have also gained
interest. Contaminants found in biochars are for example polycyclic aromatic hydrocar-
bons (PAH), polychlorinated biphenyls, and some dioxins (Bucheli et al. 2015). Especially
PAHs are the most widely discussed potential pollutant in biochars, since they are formed
during combustion and pyrolysis and biochars are known to contain them sometimes sig-
nificant amounts (Hale et al. 2012). Bucheli et al. (2015) highlights that if biochar is used
as a soil improver or in any other purpose it must meet all applicable legislator demands. In
recent years, IBI has published standards for the biochar definition and characteristics and
they suggest the PAH guideline value of 6 mg/kg for biochars (IBI 2012). European Bio-
char Certificate (EBC) has published its own voluntary certificates and their value is 12
mg/kg for a basic grade biochar (EBC 2016). In Finland, the legislative values for contam-
inated soil can regulate the use of biochar. The lower and upper guideline values for PAHs
are 30 and 100 mg/kg (2007/214). So far legislative values for PAHs in digestate and com-
post have not yet been implemented in Finland. According to Finnish Water Utilities As-
sociation (VVY 2013) the third draft of European Union directive 86/278/ETY suggests a
value of 6 mg/kg. These are the guidelines, that can regulate the use of biochar in anaero-
bic digestion.

15
2.6 The use of additives and biochar in anaerobic digestion
2.6.1 Overview
Additives are substances that are fed to the anaerobic digester in low amounts. Their main
task is to increase the efficiency of the process, but due to their low amount of biomass the
additives itself contribute only marginally to an increase in the biogas yield (Deublein &
Steinhauser 2011). Additives are for example trace minerals, micro- and macro-nutrients,
buffering agents, compounds able to mitigate ammonia inhibition, and substances with
high biomass immobilization capacity (Romero-Güiza et al. 2016). In generally it is possi-
ble to increase the biogas yield by 20–30 % by using additives (Deublein & Steinhauser
2011).
By adding trace minerals and micro- and macro-nutrients it is possible enhance the metab-
olism and promote the growth of bacteria, that results as an increase in the digester capaci-
ty, the general improvements of the digestion, and an increase in the biogas yield (Deuble-
in & Steinhauser 2011). From additives that prevent ammonia inhibition especially zeolite
has been studied and it has been found as a suitable material to improve the ammonia and
ammonium ion equilibrium via adsorption (Montalvo et al. 2012). In addition, zeolites
have proved to have high capacity for the immobilization of micro-organisms (Montalvo et
al. 2012). According to Tada et al. (2005) the application of natural zeolite for anaerobic
digestion containing high ammonia loads is beneficial. Almost all the natural zeolites stud-
ied could remove significant amounts of ammonium from the sludge and some of these
enhanced also the methane production (Tada et al. 2005). Especially with high ammonia
loads (4500 mg/l) natural modernite zeolite increased the biogas production more than four
times compared to the control (Tada et al. 2005). A variety of other materials, for example
carbon and charcoal, sand, polyurethane, and some synthetic membrane materials, has also
been introduced to promote biomass immobilization in anaerobic digesters (Montalvo et al.
2012). Watanabe et al. (2013) studied the effects of cedar charcoal on anaerobic digestion
of crude glycerol and found out improvement in microbial communities and the increase in
the biogas yield.
2.6.2 Biochar as an additive in anaerobic digestion
In recent years the research around biochars has been intense and focused especially in the
use of biochar as a soil amendment (Lehmann & Joseph 2015), but recently the use as an
additive in anaerobic digestion has also gained interest. According to Mumme et al. (2014)
the high costs of biochar production are a major drawback to their broader use and one

16
way to overcome this could be to expand the biochar value chain in other applications, like
as an additive in anaerobic digestion. Activated carbon has been studied as an additive ma-
terial in anaerobic digestion with good results and according to Luo et al. (2015) biochar
could have similar properties. Compared with activated carbon where the drawback is the
even higher price, biochar is made in lower temperatures without activation, which results
in less specific surface area but significantly cheaper price (Lehmann & Joseph 2015). Luo
et al. (2015) suggests that biochar could provide relatively high surface area to immobilize
micro-organisms and reduce inhibition via adsorption. In addition, the residual biochar in
digestate could serve as soil improver if the digestate is composted or used as a fertilizer
(Luo et al. 2015). The possible positive effects of biochar addition on biogas production
would result in terms of process stability, higher methane yields, and fewer inhibition
problems (Mumme et al. 2014).
The use of biochar in anaerobic digestion is a relatively new thing but already some re-
search in this field already exists. Possible mechanisms to promote anaerobic digestion are
for example the adsorption of inhibitive compounds, promoting direct interspecies electron
transfer (DIET), and acting as an effective microbial immobilization method (Luo et al.
2015). Similarly, Mumme et al. (2014) and Cai et al. (2016) suggested that biochar could
improve the immobilization of micro-organisms. Zhao et al. (2015) found out that biochar
improved the methane production and accelerated the syntrophic metabolism of ethanol.
Mumme et al. (2014) also pointed that biochar could be used to remove inhibitive ammo-
nia and ammonium ions through adsorption and ion exchange on their reactive surfaces
with feedstocks containing high amounts of nitrogen. Lü et al. (2016) also studied the ef-
fect of biochar on ammonium inhibition in anaerobic digester. Chen et al. (2014) suggested
that biochar can promote DIET and this can help explaining why biochar may enhance
methane production from organic wastes under anaerobic conditions.
In previous studies, the addition of pyrolytic biochar has usually had positive effects on
anaerobic digestion. Luo et al. (2015) found out that pyrolytic biochar shortens the meth-
anogenic lag phase and enhances the methane production rate and similar observations are
also noted by Cai et al. (2016) and Lu et al. (2016). On the other hand, the effects of bio-
char on the overall methane yield in available studies (Cai et al. 2016, Lü et al. 2016, Luo
et al. 2015) have been quite limited. Based on their results it seems that pyrolytic biochar
effects the process by selectively enhancing microbial activity but does not affect that
much the methane production. Studies also suggest that biochar could enhance the produc-

17
tion and degradation of intermediate and volatile fatty acids (Cai et al. 2016, Lü et al.
2016, Luo et al. 2015). In some studies, the biochar potential to mitigate ammonia inhibi-
tion has been addressed. Mumme et al. (2014) studied the effect of both pyrolytic and hy-
drochar to anaerobic digestion with several different TAN concentrations. Pyrolytic bio-
char had the ability to mitigate mild ammonia inhibition (2100 mg/kg TAN) but stronger
inhibitions (3100-6600 mg/kg TAN) were not mitigated and in some cases the biochar con-
taining fermentations followed the trend toward more serious inhibition (Mumme et al.
2014). The biochar-associated mechanisms that prevent ammonia inhibition are suggested
being limited in their capacity (Mumme et al. 2014). Lü et al. (2016) found out that bio-
chars of different particle sizes alleviate the ammonium inhibition up to 7 g-N/l during
anaerobic digestion of 6 g/l glucose.
Also studies with limited or no effect of pyrolytic biochar on the gas production exist.
Mumme et al. (2014) found out that pyrolytic biochar did not have clear effect on the bio-
gas production while hydrochar increased methane yields. On the other hand, pyrolytic
biochar had the ability to increase the bacterial and archaeal gene copy numbers and miti-
gate mild ammonia inhibition, but overall effects on the gas production were negligible
(Mumme et al. 2014). Mumme et al. (2014) suggested that the ability of hydrochar to en-
hance the methane production results mainly from the larger fraction of anaerobically de-
gradable carbon. According to their study, the hydrochar possessed a labile fraction of 10.4
% while for pyrolytic biochar this was 0.4 % (Mumme et al. 2014). Based on this hydro-
char could act as better additional feedstock in the reactor. Mumme et al. (2014) estimated
that their hydrochar made from anaerobically treated wheat straw digestate had a methane
yield of 19 ml/g VS. The value is relatively low, but on the other hand the feedstock has
already been subjected to the biogas production. The higher degradability of hydrochars
has also noted in other studies. Bai et al. (2013) studied the degradation kinetics of pyrolyt-
ic biochar and hydrochar in soils and found out that hydrochar was readily biodegradable
while pyrolytic biochar was more stable. Pyrolytic biochar had one order of magnitude
slower degradation compared with hydrochar (Bai et al. 2013).
The amounts of biochar applied to anaerobic digesters in previous studies has some varia-
tion and the experiments have been done in wet conditions. Luo et al. (2015) had a biochar
concentration of 10 g/l in a digester inoculated with crushed granules, and Lu et al. (2016)
used the same concentration. Zhao et al. (2015) had a biochar concentration of 2.5 g/l in an
up-flow anaerobic sludge blanket reactor. Mumme et al. (2014) applied biochar with a

18
mass based ratio of 6.67 % compared with the feedstock fresh weight. Cai et al. (2016)
used several biochar concentrations in the range of 0.25–2.5 g/g-TS waste. They suggested
that the optimal dose of biochar depends on inoculum amount (Cai et al. 2016).
2.7 Biochars and the partial flow digestion process
According to several sources (Libra et al. 2011, Mumme et al. 2011, Roberts et al. 2009)
the high costs of biochar production limits their wider use. Mumme et al. (2014) also adds
that to overcome this issue, new applications with economic benefits are needed. He sug-
gested that the use of biochar in anaerobic digestion could be one method of expanding the
value chain (Mumme et al. 2014). Luo et al. (2015) and some other studies related to bio-
char and anaerobic digestion highlights that the remaining biochar in the digestate can act
as a soil improver if it is composted. In HSY partial flow digestion (Fig. 3) the upcoming
biowaste is separated into two fractions, the fine and the coarse fraction, with a sieve with
a pore size of 80 mm. The fine fraction is treated in the anaerobic digester to produce bio-
gas for energy production and the coarse fraction is composted alongside with the digestate
and bulking materials to produce soil amendment (Mönkäre et al. 2015). The plant is a
mesophilic dry digestion plant and it is designed to treat up to 60 000 metric tons of source
separated municipal and commercial biowaste per year from Helsinki metropolitan area
(Mönkäre et al. 2015). In this case, the biochar could benefit both the anaerobic digestion
and composting. Additionally, biochar production from anaerobically digested sewage
sludge could be a new and innovative method for sludge utilization.
Fig. 3. The operation of the HSY partial flow digestion process (Mönkäre et al. 2015).
19
Meyer et al. (2011) made a comparison of the data costs of the biochar production and the
values varied from 51 US$/t (pyrolytic biochar from yard waste) to 386 US$/t (retort char-
coal). During that time, very little information about HTC with relevance was published
and no information on the production costs were available (Meyer et al. 2011). Nowadays
more research about HTC exists but still the manufacturing seems to be so small that the
values for the production costs are hard find. Therefore, the approximate estimations need
to be done with the prices of pyrolytic biochars. If the production costs are estimated ac-
cording to the values presented by Meyer et al. (2011) and the biochar is applied to the
feedstock (60 0000 t/a) by a mass based ratio of 5 % compared with fresh weight (based on
literature values), the annual need for biochar in the HSY digestion plant would be 3 000 t.
The production costs for this amount according to Meyer et al. (2011) would be 153 000–
1 158 000 US$. Therefore, it is essential, that the production costs are as low as possible.
The possibly increased biogas yield could at least for some part cover the biochar produc-
tion costs. Additionally Mäkinen (2016) studied the effects of biochar addition to the HSY
composting process with promising results. Biochar increased the degradation of organic
material and stabilization of the compost and reduced the ammonia volatilization (Mäkinen
2016). This could further increase the biochar value in HSY process.
3 OBJECTIVES
This thesis had two main objectives. One was to compare biochars produced from different
materials and based on this to evaluate what kind of biochars would be suitable for anaero-
bic digestion. This was done by determining three different characteristics of the biochars.
Ammonium adsorption capacity was studied to find out that could biochar stabilize the
ammonium levels in the anaerobic digester and thus prevent the formation of free ammo-
nia. Biochar nutrient release in respect of dissolved organic carbon (DOC) and dissolved
total nitrogen (DTN) were studied to find out could biochar enhance anaerobic digestion
by releasing nutrients and organically degradable material into digestate. PAHs were ana-
lyzed to describe the quality of the product against the guidelines.
Another main objective of this study was to find out how the addition of biochar affects to
the anaerobic digestion process. The issue was addressed especially from the perspective
of HSY anaerobic digestion process. Feedstocks were collected from the HSY biogas plant
and dry conditions were simulated. The biogas plant treats source separated biowaste and

20
therefore the possible ability of biochar to mitigate ammonia inhibition was addressed.
These issues were studied in the laboratory scale with biogas batch experiments, where
different amounts of biochars were applied to the digesters and the volume and composi-
tion of produced biogas and the characteristics of the feedstocks and digestates were de-
termined.
4 MATERIALS AND METHODS
4.1 Samples and sampling
4.1.1 Biowaste and feedstock samples
One biowaste sample (BIO) and the feedstocks (FEED1 and FEED2) used in the batch
biogas experiments were collected from the HSY biowaste processing plant. It is a meso-
philic dry digestion plant and treats source separated biowaste with partial flow digestion
(Fig. 3), as explained previously.
The BIO sample was taken from the fine fraction of the biowaste after the sieving and be-
fore the fine fraction was fed into the anaerobic plug flow reactor by an automatic convey-
er. Approximately 60 liters of biowaste was taken with a shovel from the conveyer and
placed in the plastic containers. The sample was taken on the 10th of May 2016. On the
next day from the sample taking the biowaste was homogenized with a meat grinder and
mixed carefully in the laboratory. Homogenized biowaste was weighted by accuracy of
(2000 ± 10) g into resealable 2 l plastic bags and put to the freezer in the temperature of -
20 °C. After a week, one bag was thawed and total solids (TS), volatile solids (VS), total
kjeldahl nitrogen (TKN), and total ammoniacal nitrogen (TAN) were measured. The feed-
stocks used in the batch biogas experiments (FEED1 and FEED2) were taken from the
beginning of the plug flow reactor via the sample taking pipe. The feedstock samples were
pretreated in the field by sieving them first through 32 mm sieve and after that through 16
mm sieve to make it as homogeneous as possible. Approximately 40 liters of feedstock
was sieved in both cases and they were placed in the plastic containers. FEED1 was taken
on the 7th of July 2016 and FEED2 on the 19th of October 2016. During the next two days
from the sample taking the TS, VS, TKN, TAN, and pH were measured for the feedstock
samples. Feedstock samples were stored in plastic containers at room temperature until the
start of the experiments (approximately one week). The biowaste and feedstock samples
were transported from Helsinki to Jyväskylä on the same day as the samples were taken.
21
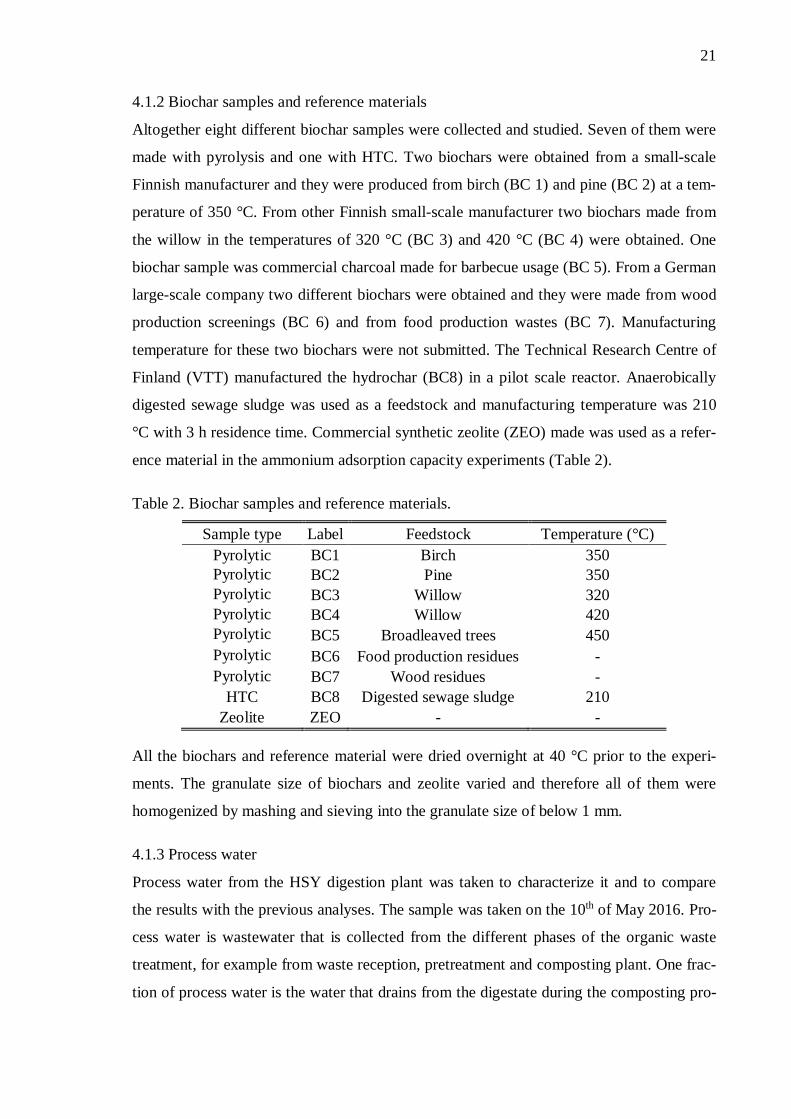
4.1.2 Biochar samples and reference materials
Altogether eight different biochar samples were collected and studied. Seven of them were
made with pyrolysis and one with HTC. Two biochars were obtained from a small-scale
Finnish manufacturer and they were produced from birch (BC 1) and pine (BC 2) at a tem-
perature of 350 °C. From other Finnish small-scale manufacturer two biochars made from
the willow in the temperatures of 320 °C (BC 3) and 420 °C (BC 4) were obtained. One
biochar sample was commercial charcoal made for barbecue usage (BC 5). From a German
large-scale company two different biochars were obtained and they were made from wood
production screenings (BC 6) and from food production wastes (BC 7). Manufacturing
temperature for these two biochars were not submitted. The Technical Research Centre of
Finland (VTT) manufactured the hydrochar (BC8) in a pilot scale reactor. Anaerobically
digested sewage sludge was used as a feedstock and manufacturing temperature was 210
°C with 3 h residence time. Commercial synthetic zeolite (ZEO) made was used as a refer-
ence material in the ammonium adsorption capacity experiments (Table 2).
Table 2. Biochar samples and reference materials.
Sample type Label Feedstock Temperature (°C)
Pyrolytic BC1 Birch 350
Pyrolytic BC2 Pine 350
Pyrolytic BC3 Willow 320
Pyrolytic BC4 Willow 420
Pyrolytic BC5 Broadleaved trees 450
Pyrolytic BC6 Food production residues -
Pyrolytic BC7 Wood residues -
HTC BC8 Digested sewage sludge 210
Zeolite ZEO - -
All the biochars and reference material were dried overnight at 40 °C prior to the experi-
ments. The granulate size of biochars and zeolite varied and therefore all of them were
homogenized by mashing and sieving into the granulate size of below 1 mm.
4.1.3 Process water
Process water from the HSY digestion plant was taken to characterize it and to compare
the results with the previous analyses. The sample was taken on the 10th of May 2016. Pro-
cess water is wastewater that is collected from the different phases of the organic waste
treatment, for example from waste reception, pretreatment and composting plant. One frac-
tion of process water is the water that drains from the digestate during the composting pro-

22
cess. A part of process water is used to irrigate the compost and the surplus is directed to
the WWTP. The water samples were taken from the collection pipe and stored in barrels
and transported from Helsinki to Jyväskylä on the same day as the samples were taken.
During the night, samples were stored in a cold room at the temperature of 4 °C and on the
next day they were filtrated with 0.125 mm sieve to remove the solids. The samples were
stored in a cold room at a temperature of 4 °C until analyzed (approximately one week).
4.2 Experimental setups of the biochar studies
4.2.1 Biochar ammonium adsorption experiments
One objective of this thesis was to study the possibility of biochar to mitigate ammonia
inhibition in anaerobic digestion especially when working with feedstocks containing high
nitrogen loads. This issue was addressed by studying the biochar ammonium adsorption
capacity in the liquid phase. The basic idea was that if biochar could act as adsorbent for
ammonium ions it could stabilize the ammonium levels in the anaerobic digester and thus
prevent the formation of free ammonia, which is a major inhibitor for the process. The ad-
sorption capacities were studied with simple horizontal shake experiments. Adsorption
experiments were also done with well know ammonium adsorbent zeolite to get reference
results.
The experiments were done in a synthetic ammonium solution in 250 ml erlenmeyer flasks
with a liquid volume of 100 ml. The solution was made by diluting ammonium chloride
into Milli-Q water. The biochar and zeolite concentrations in the adsorption experiments
were 20, 50, and 100 g/l. In the solution derived from the ammonium chloride the initial
ammonium nitrogen concentration was ≈ 600 mg/l due to the measuring range of the am-
monia selective electrode. This is rather high value, but also greater concentrations exist in
anaerobic digesters. Every concentration was sampled as a duplicate and measurements
were done in triplicates.
The samples were put into Heidolph Unimax 2010 shaker with a speed of 140 rpm. The
experiments were kept on for 24 hours in room temperature and a control group without
biochar was included to exclude the ammonium reduction from other reasons than adsorp-
tion. After the shaking the suspensions were filtrated on a vacuum through 1.6 µm filter
paper (VWR Glass Microfibres filter 691) to remove the solid biochar. The TAN was
measured from the solutions with an ammonia selective electrode.
23
4.2.2 Biochar nutrient release
Another hypothesis was that biochar could enhance anaerobic digestion by releasing nutri-
ents and organically degradable material into digestate. This issue was addressed by study-
ing the quality of biochar leachate in respect of DOC and DTN. Additionally, this gives
information about biochar stability in the liquid phase.
The biochar leachate quality was also studied with simple horizontal shake experiment.
The experimental design was similar as in ammonium adsorption experiments but the bio-
chars were extracted in Milli-Q water with a liquid-solid ratio of 2 (liquid volume 100 ml
and biochar concentration 100 g/l). After the experiments, the suspensions were filtrated
through 0.45 µm filters (Whatman ME 25) to leave only dissolved material originating
from biochars. DOC and DTN were measured from the solutions.
4.2.3 Other measured parameters
The PAHs were measured to describe the quality of the product against the guidelines. The
sum of 15 PAHs was measured for all the biochar qualities. From hydrochar, the manufac-
turer provided yields and elemental composition.
4.3 Experimental setups of the biogas experiments
4.3.1 Overview
Two different sets of mesophilic anaerobic batch experiments were made to study the ef-
fects of biochar to the biogas yield and composition. One was made with two pyrolytic
biochar concentrations and another with one hydrochar concentration and with normal
feedstock and feedstock with increased ammonium concentration. The increased ammoni-
um concentration was included because the ability of HTC biochar to mitigate strong am-
monia inhibition was tested. Control groups without the biochar or ammonium addition
were included. The volume and composition of produced biogas were determined and the
characteristics of the feedstocks and digestates were studied. BIO sample was first planned
to use in the biogas experiments with the presence of inoculum but ultimately they were
replaced with FEED1 and FEED2 that acted both as a substrate and inoculum in the reac-
tor. The use of FEED1 and FEED2 were thought to simulate the HSY biogas plant better.
4.3.2 Batch experiments with pyrolytic biochar treatments
FEED1 was used both as a substrate and as an inoculum in the first biogas batch experi-
ment. No additional inoculum was used because the feedstock was taken from biogas reac-

24
tor and it was already degrading and producing biogas. The FEED1 was assumed to pro-
duce enough substrate for the anaerobic digestion so therefore no additional substrate was
fed. TS, VS, TKN, TAN, and pH was measured from the feedstock prior to the experi-
ments. BC5 biochar was used in this experiment, because similar biochar was also used in
another HSY research project related to the use of biochar in composting (Mäkinen 2016).
Anaerobic digestion experiments were carried out in batch experiments with 5 l glass reac-
tors with a feedstock working weight of 4 kg (not including the biochar). The experiments
were carried out under mesophilic conditions (37 °C) and the temperature in the reactors
was maintained by keeping the reactors in the incubation room. Biochar treatments in the
reactors were applied at g-BC/g-TS-feedstock based ratios of 0.25 and 0.5, which equals
approximately mass based ratios of 3 % and 6 % compared with the fresh weight (labels
BC 3 % and BC 6 %). In addition, control reactors including only the feedstock was made
(label CTRL). Each treatment was sampled as a duplicate, so altogether six reactors were
in operation. The pH of the feedstock was adjusted to 7.3 ± 0.1 by adding 0.1 M HCl but
no additional buffer was used in the reactors, because the effect of the biochar was wanted
to study as natural conditions as possible. The reactors were mixed continuously with
magnetic stirrer and in addition manually for 30 seconds during the weekdays. The pro-
duced biogas was collected into 10-liter aluminum gas bags (Fig. 4).
Fig. 4. Picture of the biogas experiments set up.

25
The produced biogas volume and composition in respect of methane and carbon dioxide
were measured three times in a week for most of the experiment. When the gas production
started to decrease, the measurements were done less frequently. The experiments were
carried out until the daily biogas rate was less than 1% of the total biogas volume. After
the experiments pH, TS, VS, TKN, TAN, and VFAs were measured from the digestates.
4.3.3 Batch experiments with hydrochar treatments and ammonium addition
In the second batch experiments, FEED2 was used as feedstock. The experimental design
was similar to described above with some exceptions. The working weight in the reactors
was reduced to 3 kg, because the first experiment showed that with 4 kg the reactors were
pretty full. A little bit smaller working weight was thought to increase the mass transfer
between the biochar and the feedstock in the reactor. In this series, only hydrochar (BC8)
and one concentration were used. Treatments with additional TAN were included to simu-
late a situation with the ammonium overload and digestion of nitrogen rich substances.
The ability of hydrochar to mitigate strong ammonia inhibition was tested by increasing
the ammonium concentration artificially by adding of ammonium carbonate (reactors NH4+
CTRL and NH4+ HTC). The total ammonium concentration was increased by 3000 mg/kg.
The conditions without ammonium addition were included (reactors CTRL and HTC). For
both conditions control reactors were made. Hydrochar treatments in the reactors were
applied at a g-BC/g-TS-feedstock based ratio of 0.35, which equals approximately a mass
based ratio of 4.5 % compared to the fresh weight. Each treatment was sampled as a dupli-
cate, so altogether eight reactors were in operation.
The operation and measurements from the reactors and biogas were done similar as in the
first experiment except VFAs were not analyzed due to technical problems.
4.4 Analytical methods
4.4.1 Total solids and volatile solids
TS and VS for substrates, inoculum, and biochars were analyzed according to Finnish
standard methods (SFS 3008). All the measurements were done at least in triplicates. Glass
exicators were used to cool down the samples.

26
4.4.2 pH and COD
pH was measured with Metrohm 774 pH-meter using electrodes suitable for either liquid
or solid samples. Measurements were done immediately after each sampling. COD was
analyzed according to Finnish standard methods (SFS 5504).
4.4.3 Nitrogen and carbon analyses
TKN and TAN from solid samples and TKN from liquid samples were analyzed with
Tecator AB Kjeltec 1002 -distillation unit. Analyses were done according to Tecator appli-
cation note (Perstorp Analytical Tecator 1995). TAN from liquid samples was measured
with Thermo Scientific Orion High Performance Ammonia Electrode 9512HPBNWP.
DOC and DTN from liquid samples were analyzed with Shimadzu TOC-L analysator
equipped with a TNM-L total nitrogen unit.
4.4.4 Biochar PAH-analysis
The sum of 15 PAHs was analyzed from the biochars. Each biochar sample (1 g) was
weighted into the cellulose extraction thimble and soxhlet extracted in toluene (100 ml)
with Buchi B-811 soxhlet extraction device. A soxhlet warm method and 20 extraction
cycles were used. After the extraction the volume of the remaining extract was determined
and 1 ml sample was taken for the PAH-analysis. PAH-determination was done with gas
chromatographic mass spectroscopy (Shimadzu GCMS-QP2010, ZB5 capillary column 30
m x 0.25 mm x 0.25 µm). Oven temperature in the beginning was 60 °C with one-minute
hold and increased to 300 °C (20 °C min-1) with five-minute hold. The source temperature
of the mass selective detector was 200 °C and transfer line was 260 °C and it was operated
at single ion monitoring. Helium was used as a carrier gas.
4.4.5 Volatile fatty acids
VFAs were analyzed with a gas chromatograph equipped with flame ionization detector
(Perkin Elmer Autosystem XL, PE FFAP column 30 m x 0.32 mm x 0.25 µm). The opera-
tion conditions were following: oven temperature was 100-160 °C (25 °C min-1), detector
and injector temperature was 225 °C, and helium was used as a carrier gas. The preparation
of the samples were done as described by Bayr (2014).
4.4.6 Biogas volume and composition
The produced biogas volume was determined by the water displacement method. The bio-
gas collected to aluminum bags was pressed to water filled cylinder and the volume of the

27
gas was read from the graduation in the cylinder. The contents of methane and carbon di-
oxide in biogas were determined with a Geotech GA2000 portable gas analyser equipped
with infrared and electrochemical detector.
5 RESULTS AND DISCUSSION
5.1 Biowaste and feedstock characteristics
The characteristics of the biowaste sample (BIO) and two feedstock samples used in biogas
batch experiments (FEED1 and FEED2) were determined. Even though the BIO sample
was not used in the experiments, the data is still presented to make comparisons.
Table 3. Characteristics of biowaste samples and feedstocks used in the batch experiments
and their standard deviations.
BIO FEED1 FEED2
TS (%) 32.1 ± 0.7 12.8 ± 0.3 12.4 ± 0.6
VS (%) 23.6 ± 0.3 7.9 ± 0.1 7.5 ± 0.2
VS/TS-ratio (%) 73.7 ± 0.8 61.3 ± 1.3 61.1 ± 3.1
TKN (g/kg) 6.2 ± 0.3 7.0 ± 0.1 6.4 ± 0.1
TAN (mg/kg) 375 ± 7 3349 ± 60 3568 ± 90
BIO had higher total and volatile solids content compared with FEED1 and FEED2. The
nitrogen levels in the samples varied between 6.2–7.0 g/l. Compared with BIO both the
feedstock samples had a greater amount of ammoniacal nitrogen and lower VS/TS-ratio
(Table 3).
The characteristics of the feedstock samples (FEED1 and FEED2) were similar even
though the samples have been collected at different times. This indicates that there was not
so much seasonal variation in these samples, but on the other hand not all the possible
analyses were done. Feedstock samples could still differ in respect of some other parame-
ter. BIO sample differed from feedstock samples, because the sample type is different. BIO
was a biowaste sample while the feedstock samples were digestate taken straight from the
biogas reactor. The feedstock samples have been subjected to anaerobic degradation and
therefore they differ especially regarding the total and volatile solids. This explains also
the high TAN values in the feedstock samples, because when the organic nitrogen in bio-
waste is anaerobically degraded it transforms to ammoniacal form. The TAN concentration
in the feedstock samples varies around 3500 mg/kg, which exceeds the limit for ammonia

28
inhibition according to Rajagopal et al. (2013). Based on this it can be estimated that am-
monia inhibition occurs when using these feedstocks in biogas experiments.
Previously in HSY Kombi-project the characteristics of the organic fraction of municipal
solid waste coming to the Ämmässuo waste treatment center were studied. For the total
municipal biowaste the TS-value was 28.7 %, VS-value 25.5 %, VS/TS-ratio 89% and
TKN 6.7 g/kg for fresh matter, and the TAN values were not reported (Mönkäre et al.
2015). The BIO sample assayed in this study had overall similar values, but also some var-
iation existed. TS-value was slightly higher while VS-value was lower. As a result, the
overall VS/TS-ratio was lower and this could result from seasonal changes in biowaste
composition. In their report Mönkäre et al. (2015) also pointed that biowaste composition
may vary depending on the sampling date. The TKN-levels in both assays were in similar
range.
5.2 Process water characteristics
The characteristics of the process water were determined and the values were compared
with the previous measurements made in HSY Kombi-project.
Table 4. Characteristics of the process water (sampled in May 2016) and their standard
deviations.
Parameter and unit Value
pH 8,3
Conductivity (mS/cm) 42,2
COD (g/l) 4.6 ± 0.4
TKN (g/l) 8.4 ± 0.4
TAN (g/l) 5.6 ± 0.3
The process water had a slightly alkaline pH and high COD content. The amount of nitro-
gen was high and a large part from this was in ammoniacal form. The conductivity of the
water was high (Table 4).
The process water characteristics were sampled in HSY Kombi-report by Mönkäre et al.
(2015) before the anaerobic digestion plant was in operation. The TKN level in their report
was 1100 mg/l, which was much lower value than the result obtained in this study (8400
mg/l). TAN value was not reported in the Kombi-report. A major part of the nitrogen was
in ammoniacal form, which suggests that the nitrogen containing matter has been subjected
to degradation. According to these results, the introduction of anaerobic digestion has had

29
significant affects to the nitrogen levels of the process water and also the Kombi-report
(Mönkäre et al. 2015) noted that the operation of the plant might affect its composition.
There also could be seasonal variation in the characteristics of the process water and more
analyses should be applied in different dates to find out the changes and the average com-
position of the process water. In any case, the highly grown nitrogen levels of the process
water are critical information and they should be considered carefully for example from the
nutrient recovery point of view. It is worth to consider, that could the application of bio-
char in the anaerobic digestion process improve the nutrient (especially nitrogen) recovery
regarding the process water.
5.3 The ability of biochars to adsorb ammonium ions
The ammonium adsorption capacities and ammonium removal percentages for the biochar
samples and zeolite were calculated from the results of the shake experiments.
Fig. 5. Ammonium adsorption biochar samples and for the zeolite. Three biochar concen-
trations and control with no biochar addition was sampled.
The adsorption capacity values for zeolite were 5.0–17.3 mg /g depending on the zeolite
concentration. For the biochars the values were 0.8–4.4 mg/g depending on the biochar and
concentration. The highest adsorption capacities in biochars were in BC4 (2.5–4.4 mg/g)
and in BC6 (2.0–4.3 mg/g) while the lowest values were in BC2 (1.5–1.7 mg/g) and in
BC5 (0.8–1.7 mg/g). Other biochars had adsorption values in between these two ends. Zeo-
lite possessed higher capability to adsorb ammonium ions from aqueous solution compared
with the biochars (Fig. 5).
0
2
4
6
8
10
12
14
16
18
20
ZEO BC1 BC2 BC3 BC4 BC5 BC6 BC7 BC8
Am
mo
niu
m a
dso
rpti
on
(mg
NH
4+ /
g B
C)
Biochar sample
Adsorbentconc.
20 g/l
50 g/l
100 g/l
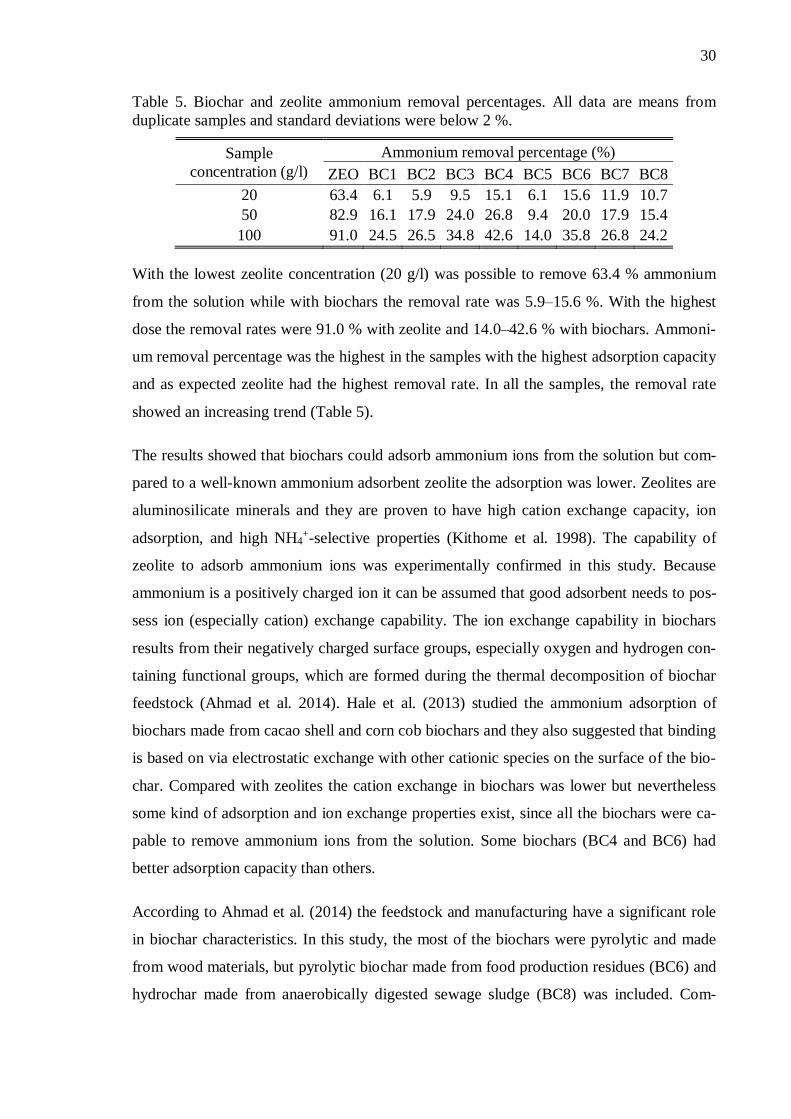
30
Table 5. Biochar and zeolite ammonium removal percentages. All data are means from
duplicate samples and standard deviations were below 2 %.
Sample
concentration (g/l)
Ammonium removal percentage (%)
ZEO BC1 BC2 BC3 BC4 BC5 BC6 BC7 BC8
20 63.4 6.1 5.9 9.5 15.1 6.1 15.6 11.9 10.7
50 82.9 16.1 17.9 24.0 26.8 9.4 20.0 17.9 15.4
100 91.0 24.5 26.5 34.8 42.6 14.0 35.8 26.8 24.2
With the lowest zeolite concentration (20 g/l) was possible to remove 63.4 % ammonium
from the solution while with biochars the removal rate was 5.9–15.6 %. With the highest
dose the removal rates were 91.0 % with zeolite and 14.0–42.6 % with biochars. Ammoni-
um removal percentage was the highest in the samples with the highest adsorption capacity
and as expected zeolite had the highest removal rate. In all the samples, the removal rate
showed an increasing trend (Table 5).
The results showed that biochars could adsorb ammonium ions from the solution but com-
pared to a well-known ammonium adsorbent zeolite the adsorption was lower. Zeolites are
aluminosilicate minerals and they are proven to have high cation exchange capacity, ion
adsorption, and high NH4+-selective properties (Kithome et al. 1998). The capability of
zeolite to adsorb ammonium ions was experimentally confirmed in this study. Because
ammonium is a positively charged ion it can be assumed that good adsorbent needs to pos-
sess ion (especially cation) exchange capability. The ion exchange capability in biochars
results from their negatively charged surface groups, especially oxygen and hydrogen con-
taining functional groups, which are formed during the thermal decomposition of biochar
feedstock (Ahmad et al. 2014). Hale et al. (2013) studied the ammonium adsorption of
biochars made from cacao shell and corn cob biochars and they also suggested that binding
is based on via electrostatic exchange with other cationic species on the surface of the bio-
char. Compared with zeolites the cation exchange in biochars was lower but nevertheless
some kind of adsorption and ion exchange properties exist, since all the biochars were ca-
pable to remove ammonium ions from the solution. Some biochars (BC4 and BC6) had
better adsorption capacity than others.
According to Ahmad et al. (2014) the feedstock and manufacturing have a significant role
in biochar characteristics. In this study, the most of the biochars were pyrolytic and made
from wood materials, but pyrolytic biochar made from food production residues (BC6) and
hydrochar made from anaerobically digested sewage sludge (BC8) was included. Com-
31
pared to others the adsorption of BC8 did not differ very much, so it can be estimated that
in this case the manufacturing type did not have very big effect. On the other hand, only
one hydrochar was sampled, so therefore no further conclusions can be made. According to
Gai et al. (2014) biochars made in lower temperatures (250-400 °C) has been found suita-
ble to produce biochars for removing inorganic and polar contaminants. In their study a
decrease in ammonium adsorption was found when the pyrolysis temperature (400, 500,
600 and 700 °C) was increased (2014). All the sampled biochars were manufactured in
relatively low temperatures. In any case variation in the biochar adsorption capacities ex-
ists and probably this results from differences in manufacturing parameters, temperatures
and feedstock materials.
As it can be seen from this study, differences between biochar ammonium adsorption ca-
pacities exist. Sarkhot et al. (2013) obtained the ammonium adsorption values of 5.3 mg/g,
which is in the similar range than in this study. Zhu et al. (2012) noted even lower adsorp-
tion, but on the other hand the initial ammonium concentrations in their study was lower.
Also biochars with high ammonium adsorption capacities exist. The biochar adsorbed
amounts were lower in comparison with the results obtained by Kizito et al. (2015), where
the maximum adsorbed amount was 54.84 mg/g. This value is even higher than the adsorp-
tion capacity of zeolite in this study. This suggests that biochars with relatively high am-
monium adsorption capacities exists. If the benefits of adsorption in anaerobic digestion
were considered, a high adsorption capacity could be a positive thing. This could limit the
ammonia inhibition by capturing the excess ammonium and preventing the conversion of
ammonium to more toxic ammonia. The benefits of well-known ammonium adsorbent
zeolite in anaerobic digestion have been scientifically proven (Montalvo et al. 2012) espe-
cially with high ammonium loads (Tada et al. 2015), so biochars with good ammonium
adsorption capacities could have similar positive effects. In this study, it was shown that
not all the biochars are as effective adsorbents as zeolites, but at least all the sampled bio-
chars could remove some amounts of ammonium ions from the solution. It can be assumed
that they at least have the possible ability to act as ion exchangers for ammonium removal
and balance the ammonium levels in the anaerobic digester. However, it was also pointed
out, that ammonium adsorption capacity can vary depending on the biochar, and biochars
with high adsorption values exist. If the manufacturing of biochars is optimized in a way
that ammonium adsorption is maximized, better effects could occur.

32
The differences between the biochar ability to adsorb ammonium ions can depend on other
reasons than the biochar itself and manufacturing. According to Kizito et al. (2015) in-
crease in initial ammonium concentration, the temperature, biochar particle size, contact
time, and pH affects to the adsorption. In this study different conditions were not applied,
but by optimizing the conditions biochars could have acted as better adsorbents. For exam-
ple, the temperature and pH could have been adjusted to match mesophilic conditions and
in these conditions the adsorption could have been higher. Also the biochar dosage affects
the adsorption and in this study the adsorption shows a decreasing trend when the dosage
of biochar is increasing. This can be explained by the increasing available adsorption sites
while the total ammonium concentration remains the same (Zhu et al. 2012).
In HSY partial flow digestion the digestate is composted alongside the coarse fraction of
biowaste and bulking materials and during the composting a certain amount of process
water drains to the waste water collection system (Mönkäre et al. 2015). As mentioned
before, the introduction of the anaerobic digestion plant has possibly increased the nitrogen
levels in the process water significantly, and especially the TAN levels are high. Regarding
to this, the biochar ammonium adsorption could serve as a nutrient recovery method. Ki-
zito et al. (2015) suggests that biochars has the potential to adsorb ammonium from pig-
gery manure and thus they can act as nutrient filters before discharging the effluents into
waste water collection. Biochar applied to the anaerobic digestion or composting process
could have similar effects by capturing the ammonium from the digestate and process wa-
ter, prevent the ammonia volatilization and reducing the nutrient loss to the process water.
The HSY Kombi-report (Mönkäre et al. 2015) suggests with some assumptions that 5000
m3/a of process water is used in the irrigation of composts (50 % of this evaporates or stays
in the final compost and 50 % ends to the leachate). The average amount of process water
directed to the WWTP in 2011–2014 was 3019 m3/a (Mönkäre et al. 2015). Based on these
results biochar could increase the restrain of nitrogen compounds in solid stage digestate
and prevent the leaching of them into process water, which is ultimately directed to the
WWTP.
5.4 Biochar nutrient release
From all the biochars the releasing DOC and DTN were measured with 24 h shake experi-
ments in MilliQ-water. One biochar concentration (100 g/l) was used.

33
Fig. 6. DOC (mg/kg BC) measured from biochar leachate in 24-hour horizontal shake ex-
periment in Milli-Q water.
Fig. 7. DTN (mg/kg BC) measured from biochar leachate in 24-hour horizontal shake ex-
periment in Milli-Q water. BC8 was excluded from the graph because the value was very
high compared to other samples (2705 ± 26 mg/l).
The DOC release in biochars was between 8.9–6397 mg/kg, so a lot of variation existed
between the samples. BC8 had the highest DOC value while BC5 and BC7 had the lowest
values. The same kind of trend of variation applied also regarding to DTN and the values
were in the range of 0.83–2705 mg/kg. BC8 had very high DTN value (2705 mg/kg), while
in other biochars this value was in between 0.83–41.3 mg/kg. Similarly than in DOC, BC5
and BC7 had the lowest values in DTN also (Fig. 6, Fig. 7).
0
1000
2000
3000
4000
5000
6000
7000
BC1 BC2 BC3 BC4 BC5 BC6 BC7 BC8
DO
C (
mg/
kg B
C)
Biochar treatment
0
5
10
15
20
25
30
35
40
45
50
BC1 BC2 BC3 BC4 BC5 BC6 BC7
DTN
(m
g/kg
BC
)
Biochar treatment

34
The results showed that all the biochars released both DOC and DTN but in very different
amounts. In generally the DOC release was higher in comparison with the DTN, which
probably results from the composition of biochars. The dominant element in biochars is
carbon, and therefore the amounts of released DOC are higher. Interestingly, BC8 released
significantly more DTN than other biochars and also the DOC value was the highest. BC8
was the only HTC treated biochar so according to this it is possible to speculate, that does
HTC treatment provide biochars releasing more nutrients compared with the pyrolytic bio-
chars. The biochar nutrient release into the liquid phase has not been studied very well, but
few studies on this issue exist. Compared with the experiments made by Mukherjee &
Zimmerman (2013) the results obtained in this study are similar. A lot of variation existed
between the samples and some biochars can release significantly more DOC than others.
The differences in the nutrient release can relate to biochar feedstocks or manufacturing
methods. Mukherjee & Zimmerman (2013) suggested that biochars made in lower temper-
atures release more nutrients, which supports the observations in this study. BC3 (320 °C)
and BC4 (420 °C) biochars are made from the same feedstock by the same manufacturer
and BC3 released more DOC and DTN than BC4. The highest DOC and DTN value in this
study was observed in BC8 (210 °C), which is hydrochar made from anaerobically digest-
ed sewage sludge. Chan & Xu (2009) also noted that the nutrient composition and availa-
bility depend highly on the used feedstock and pyrolysis condition. The feedstock in BC8
may serve as a good leachate source especially regarding the nitrogen release, since the
anaerobically treated digestate is rich in nitrogen (Tambone et al. 2010).
The benefits of biochar nutrient release for anaerobic digestion have not been studied spe-
cifically, but there could be similar good effects than in biochar used as soil fertilizer. Ac-
cording to Lehmann et al. (2011), biochars can release useful nutrients to the soil and bio-
chars are known to be extremely variable in nutrient composition (Chan & Xu 2009). If the
biochars release useful nutrients in soil, the same kind of approach could also work in the
anaerobic digestion environment. Additionally, if the releasing material is easily degrada-
ble, it could have some positive effects on the methane production. In any case, it must be
considered that the amount of biochar compared to the feedstock is low and therefore the
amounts of nutrient release may not have that significant effect on the bigger picture. On
the other hand, the high DOC and DTN values could also propose the easier degradation,
which could affect positively the methane production.

35
5.5 Biogas batch experiments with biochar treatments
5.5.1 The effects of pyrolytic biochar on dry anaerobic digestion of nitrogen rich feedstock
The first biogas experiment was made with pyrolytic biochar (BC5). Two different biochar
treatments (3 % and 6 % of biochar compared with the fresh weight) were applied and a
control treatment was included. The volume and the composition of the biogas were de-
termined and the characteristics of the digestate after the experiment were studied. The
treatments were done in duplicates, except the BC 6 % was tested only with one reactor
due to the technical problems. At the beginning of the experiment the gas siphon of anoth-
er BC 6 % reactor was blocked and too much pressure occurred inside and therefore it
needed to be discarded. The VS in the methane yields does not include the biochar, since it
is considered as an additive material that does not itself contribute to the methane yield.
Fig. 8. Cumulative methane production in batch experiments. All data are means from 2
reactors except BC 6 % from single reactor. ♦ = CTRL, ● = BC 3 %, and ▲ = BC 6 %.
The cumulative methane production was 155 ml/g VS in CTRL, 136 ml/g VS in BC 3 %,
and 142 ml/g VS in BC 6 %. CTRL had higher methane production compared with the
biochar treated groups (BC 3 % and BC 6 %). Methane production was higher throughout
the whole experiment. Between the biochar treated groups, the methane production was
similar in the beginning but over the whole experiment it seems that BC 6 % group had
slightly better methane production. (Fig. 8).
0
20
40
60
80
100
120
140
160
180
0 10 20 30 40 50 60 70
Met
han
e p
rod
uct
ion
(ml/
g V
S)
Time (d)

36
Table 6. Digestate characteristics, methane yields, and average methane contents for each
treatment.
CTRL BC 3 % BC 6%
pH 8.22 ± 0.03 8.23 ± 0.07 8.25
TS (%) 10.58 ± 0.07 13.36 ± 0.04 15.74 ± 0.06
VS (%) 5.78 ± 0.02 8.57 ± 0.04 11.02 ± 0.04
Methane yield (ml/g VS) 155 ± 6 136 ± 20 142
Average methane content (%) 63.4 ± 0.2 61.6 ± 0.8 61.5
TKN (g/kg) 7.5 ± 0.1 7.8 ± 0.2 8.3 ± 0.2
TAN (g/kg) 5.0 ± 0.02 4.5 ± 0.2 4.4 ± 0.2
VFAs (mg/l) 44.6 ± 1.4 39.8 ± 1.4 42.7
TS and VS on BC 3 % and BC 6 % groups were higher due to additional biochar in the
digestate. The average methane content in CTRL was also slightly better while between
BC 3% and BC 6% it is quite similar. VFA amounts in all the reactors were low and in the
similar range at the end of the experiment. The nitrogen levels in the reactors after the ex-
periments were in the same range but also minor variation existed. The greatest TKN lev-
els were in biochar treated groups but on the other hand, the TAN levels in biochar treated
groups were lower than in CTRL group (Table 6).
The results from this experiment suggest that the pyrolytic biochar did not affect the biogas
production. The overall cumulative methane production in biochar treated reactors was
lower in comparison to the control reactors but on the other hand the values are quite close
to each other and fall within the range of standard deviation. BC 6 % was tested only with
one reactor and therefore the standard deviation was not possible to measure. The cumula-
tive methane productions were lower compared to the methane potentials of municipal
solid waste, which are 215–482 ml/g VS according to Ward et al. (2008). The reason for
this could be that the feedstock samples have been taken straight from a biogas reactor and
they have already degraded and produced biogas for a while. As mentioned previously the
nitrogen levels of the feedstock are high in comparison with the ammonia inhibition values
presented by Rajagopal et al. (2013) already in the beginning (Table 3) and therefore it is
likely that ammonia inhibition occurs and affects the biogas yields. It is not possible to
analyze the differences between the groups statistically since the number of replicate sam-
ples is insufficient for studying the normality of the data or to use non-parametric tests. In
any case, these experiments provide useful data when assessing the possible effects of bio-
char in anaerobic digestion under dry conditions, but to get reliable scientific results, fur-
ther experiments with more replicates and statistical analyses should be done.

37
The addition of pyrolytic biochar to anaerobic digestion has had positive effects in previ-
ous studies but also evidence for limited effects exists, as noted by Mumme et al. (2014).
Therefore, the issue is not completely clear. Any clear explanation for the lower methane
production in biochar treatments in this study was not found. For some reason the biochar
could cause minor inhibition in the process, or the result could also be due to the uncertain-
ty in the experiments. Mumme et al. (2014) found out that in some cases the biochar con-
taining fermentations with strong ammonia inhibition followed the trend toward more seri-
ous inhibition, which is similar to the result obtained in this study. The amount of biochar
added in BC 6 % was similar in comparison with Mumme et al. (2014). Compared to other
available studies (Cai et al. 2016, Lü et al. 2016, Luo et al. 2015) the effect on the methane
production has at least been positive, even though it has not increased significantly. It is
suggested that biochar shortens the methanogenic lag phase, enhances the methane produc-
tion rate, and enhances the production and degradation of intermediate and volatile fatty
acids (Cai et al. 2016, Lü et al. 2016, Luo et al. 2015). In this experiment, the lag phase did
not exist since the feedstock was active and produced biogas straight from the beginning,
and therefore the effects on the lag phase could not be seen. If the biochar would have been
applied to a situation where fresh feedstock would start to degrade in the presence of inoc-
ulum, the possible effects could have been more noticeable. VFA levels in the end of the
experiment were low and in similar range and these are probably due to complete degrada-
tion, since the experiment was kept on over 60 days. The effects on VFAs could have been
better observed in continuous reactors.
BC5 used in this experiment possessed the lowest ammonium adsorption capacity from the
biochar samples and therefore was not the best option when considering the possible miti-
gation of ammonia inhibition. Biochars with higher adsorption capacities could have per-
formed better. On the other hand Lu et al. (2016) suggests that the alleviation of ammonia
inhibition by biochars is more based on biochemical than physiochemical reasons, because
the ammonium adsorption capacities in biochars are limited. According to their results,
biochar enriches micro-organism cultures (Lü et al. 2016). Cai et al. (2016) also found out
that there were no significant differences in nitrogen levels between control and biochar
treatments, which would suggest that biochar does not affect the degradation of proteins
and do not adsorb significant amounts of ammonium. The available research related to the
ability of biochars to mitigate ammonia inhibition is somewhat contradictory and this
could result from the different characteristics of the biochars. Porous biochars could work
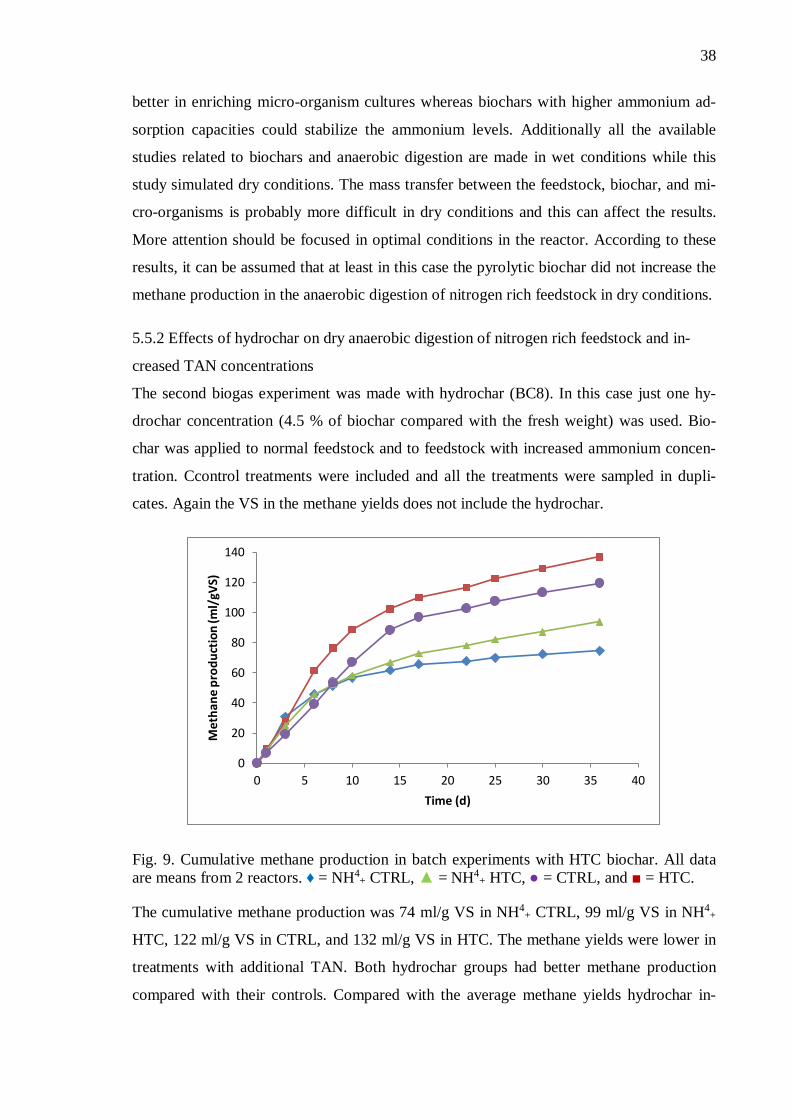
38
better in enriching micro-organism cultures whereas biochars with higher ammonium ad-
sorption capacities could stabilize the ammonium levels. Additionally all the available
studies related to biochars and anaerobic digestion are made in wet conditions while this
study simulated dry conditions. The mass transfer between the feedstock, biochar, and mi-
cro-organisms is probably more difficult in dry conditions and this can affect the results.
More attention should be focused in optimal conditions in the reactor. According to these
results, it can be assumed that at least in this case the pyrolytic biochar did not increase the
methane production in the anaerobic digestion of nitrogen rich feedstock in dry conditions.
5.5.2 Effects of hydrochar on dry anaerobic digestion of nitrogen rich feedstock and in-
creased TAN concentrations
The second biogas experiment was made with hydrochar (BC8). In this case just one hy-
drochar concentration (4.5 % of biochar compared with the fresh weight) was used. Bio-
char was applied to normal feedstock and to feedstock with increased ammonium concen-
tration. Ccontrol treatments were included and all the treatments were sampled in dupli-
cates. Again the VS in the methane yields does not include the hydrochar.
Fig. 9. Cumulative methane production in batch experiments with HTC biochar. All data
are means from 2 reactors. ♦ = NH4+ CTRL, ▲ = NH4
+ HTC, ● = CTRL, and ■ = HTC.
The cumulative methane production was 74 ml/g VS in NH4+ CTRL, 99 ml/g VS in NH4
+
HTC, 122 ml/g VS in CTRL, and 132 ml/g VS in HTC. The methane yields were lower in
treatments with additional TAN. Both hydrochar groups had better methane production
compared with their controls. Compared with the average methane yields hydrochar in-
0
20
40
60
80
100
120
140
0 5 10 15 20 25 30 35 40
Me
than
e p
rod
uct
ion
(ml/
gVS)
Time (d)

39
creased the methane production by 26 % in additional TAN treatments and by 15 % in
treatments without additional TAN. The standard deviation was higher in NH4+ CTRL
group compared with the others (Fig. 9).
Table 7. Digestate characteristics, methane yields, and average methane contents for each
treatment. N.A. stands for not analyzed.
CTRL HTC NH4
+ CTRL NH4+ HTC
pH 8.23 ± 0.03 8.27 ± 0.07 8.41 ± 0.01 8.41 ± 0.04
TS (%) 9.0 ± 0.2 11.6 ± 0.1 8.55 ± 0.03 11.24 ± 0.04
VS (%) 5.3 ± 0.2 6.37 ± 0.07 5.04 ± 0.01 6.31 ± 0.09
Methane yield (ml/g VS) 119 ± 7 137 ± 9 74 ± 23 94 ± 3
Average methane content (%) 57.4 ± 0.1 59.5 ± 1.1 47.6 ± 0.7 55.1 ± 1
TKN (g/kg) 7.15 ± 0.04 7.6 ± 0.2 9.6 ± 0.3 10.0 ± 0.2
TAN (g/kg) 4.2 ± 0.2 4.22 ± 0.05 6.3 ± 0.4 6.59 ± 0.05
VFAs (mg/l) N.A. N.A. N.A. N.A.
Again the TS and VS on hydrochar treated groups were higher due to additional biochar in
the digestate. The average methane content was higher in the both HTC biochar treated
groups compared to their controls. Between additional TAN treatments there was greater
difference in methane content (47.6 in NH4+ CTRL and 55.1 in NH4
+ HTC) compared with
treatments with no additional TAN (57.4 and 59.5 respectively). Nitrogen levels were
higher in additional TAN treatments (Table 7).
The results suggest that hydrochar had better effects on anaerobic digestion compared with
the pyrolytic biochar. Feedstock TAN concentrations were originally high and additional
TAN in the reactors caused inhibition and a clear decrease in the biogas production, as
expected. Hydrochar improved the methane production in both treatments (with and with-
out additional TAN) and it seems that the benefits were better with higher TAN concentra-
tions. On the other hand, the same limitations as in experiments with pyrolytic biochar
apply also in this case. Statistical analyses cannot be done and the standard deviation in
NH4+ CTRL group was high. Therefore, the results must be interpreted with high caution.
In any case the preliminary data from these experiments shows promising results and fur-
ther research should be done to solve the question.
The effects of hydrochar on anaerobic digestion have not yet been researched that much.
The only article found was by Mumme et al. (2014) where both pyrolytic biochar and hy-
drochar effects on anaerobic digestion was studied. They found out that hydrochar in-
creased the biogas production while pyrolytic biochar did not have a clear effect (Mumme

40
et al. 2014). Hydrochar increased methane production in low TAN concentrations (1626
mg/kg) 31 % and in high concentrations (6626 mg/kg) 21 % (Mumme et al. 2014). In this
study similar results were obtained regarding to additional TAN treatments, since the in-
crease was 26 % with initial TAN concentration of 6568 mg/kg (3568 mg/kg + additional
TAN). Interestingly with lower TAN concentrations (3568 mg/kg) the increase in methane
production was lower (15 %) as opposed to the observations by Mumme et al. (2014). This
could suggest that hydrochar mitigates strong ammonia inhibition even better than mid-
high inhibition but again the limitations of the study must be considered. Comparing pyro-
lytic biochar (BC5) and hydrochar (BC8) used in these biogas experiments, hydrochar
showed better ability to adsorb ammonium ions. The ammonium adsorption capacity in
both the biochars is still relatively low, so the good effects can also result from other
mechanisms. Mumme et al. (2014) studied the effects of biochar on the anaerobic micro-
flora and found out that both pyrolytic biochar and hydrochar increased the bacterial num-
bers slightly or moderately but compared with zeolite reactors the numbers were lower.
The benefits can also result from biochar ability to offer good environments for micro-
organisms. The applied hydrochar amount was 4.5 % compared to the fresh weight, which
is slightly lower than the amount applied by Mumme et al. (2014). This suggests that even
with this kind of amount it is possible to increase the methane production. To minimize the
biochar production costs, it would be useful to find the lowest dose that has positive ef-
fects.
Mumme et al. (2014) suggested that the ability of hydrochar to enhance methane produc-
tion in anaerobic digester could result mainly from the larger fraction of anaerobically de-
gradable carbon. According to their study, the hydrochar possessed a labile fraction of 10.4
% while for pyrolytic biochar this was 0.4 % (Mumme et al. 2014). Based on this the hy-
drochar could act as better additional feedstock in the reactor and, which could explain
why methane production was promoted only with hydrochar. Mumme et al. (2014) esti-
mated that their hydrochar made from anaerobically treated wheat straw digestate had a
methane yield of 19 ml/g VS. The value is relatively low, but on the other hand the feed-
stock has already been subjected to the biogas production. The higher degradability of hy-
drochars has also noted by Bai et al. (2013) and they suggest that hydrochar is readily bio-
degradable while pyrolytic biochar was more stable and that pyrolytic biochar had one
order of magnitude slower degradation compared with hydrochar. Considering the anaero-
bic digestion, it may not be desirable if the increase in the yields results mainly from the

41
biochar degradation. On the other hand only about 10 % of the hydrochar is subjected to
degradation (Mumme et al. 2014), so there still exist quite a large fraction that can benefit
the process in other ways.
These results suggest that hydrochar had better effects on the anaerobic digestion com-
pared to the pyrolytic biochar, but the mechanism still remains unclear. Hydrochar had
better ammonium adsorption capacity compared with the pyrolytic biochar used in this
study but on the other hand, the adsorption is still limited. The literature suggests that hy-
drochar could degrade faster and act as an additional feedstock in the reactor, which could
be the reason for the increased methane production. Further studies are needed to solve
mechanism and confirm the results. When considering the HSY partial flow digestion, it
should also be studied what kind of biochar is the best for both anaerobic digestion and
composting. Mäkinen (2016) studied the effects of pyrolytic biochars on composting and
found positive results, while in this study the hydrochars acted better than pyrolytic bio-
chars in anaerobic digestion.
5.6 Hydrochar from anaerobically digested sewage sludge
VTT provided the yields and elemental compositions of the hydrochar they manufactured.
The hydrochar was made from anaerobically digested sewage sludge in the temperature of
210 °C with a residence time of 3 hours.
Table 8. Hydrochar (BC8) yields from HTC treatment.
Feedstock TS (%) Hydrochar yields
From total weight (%) From TS (%)
13 11 82
Table 9. Elemental compositions of the feedstock and hydrochar (BC8).
C (%) H (%) O (%) S (%) N (%) Ash measured (%)
Feedstock 27.6 3.8 34.4 0.8 3.3 46.3
Hydrochar 23.8 2.9 26.4 2.6 1.9 58.8
The TS of the original feedstock (anaerobically digested sewage sludge) was 13 %. The
ultimate hydrochar yield was 11 % from the total feedstock weight, which stands for 82 %
from the original feedstock TS. The rest was a liquid yield, which was separated from the
product by centrifuging and drying. Both the feedstock and hydrochar have high ash con-
tents (46.3 and 58.8 %). Carbon and oxygen are the main elements of the feedstock (27.6
and 34.4) and the hydrochar (23.8 and 26.4 %) (Tables 8 and 9).

42
The initial ash content in the feedstock is quite high and this results as high ash content in
the product. In addition, the carbon content in the feedstock was relatively low and there-
fore the hydrochar is not very rich in it either. In other hydrochars produced from anaero-
bically digested sludge the feedstocks and products have similar charasteristics (Berge et
al. 2011, Kim et al. 2014). It seems that the hydrochars produced from anaerobically di-
gested biomasses possess lower carbon and higher ash contents compared with the hydro-
chars produced from other feedstocks. This can result from the lower initial organic mate-
rial in them, because they have a least to some degree degraded in anaerobic digestion. On
the other hand Mumme et al. (2011) managed to produce hydrochar from anaerobically
digested maize silage with relatively good carbon content, so certain optimization potential
can be assumed if optimal manufacturing parameters are found.
5.7 Biochar PAH-analysis
The sum of 15 PAHs was sampled from the biochars. Also two PAH guideline values are
presented in order to make comparisons.
Fig. 10. The sum of 15 PAHs in biochar samples and two biochar PAH guideline values.
IBI stands for International Biochar Initiative and EBC for European Biochar Certificate.
The sum of 15 PAHs was analyzed from all the biochar samples. The PAH concentration
varied in the range of 1.6–190 mg/kg. In recent years, IBI has published standards for the
0
20
40
60
80
100
120
140
160
180
200
BC1 BC2 BC3 BC4 BC5 BC6 BC7 BC8 IBI EBC
∑15
PA
Hs
(mg/
kg)
Biochar samples and reference guidelines

43
biochar definition and characteristics and they suggest the PAH guideline value of 6 mg/kg
for biochars (IBI 2012). In addition, EBC has published its own voluntary certificates and
their value is 12 mg/kg for a basic grade biochar (EBC 2016). BC 1 had by far the highest
PAH content (190 mg/kg) and BC4 had quite a high value (75 mg/kg) too. Some samples
had mid-high values and additionally biochar samples with low amounts of PAHs existed.
BC6 had only 1.6 mg/kg and BC8 4.3 mg/kg PAHs (Fig. 10).
BC6 and BC8 were the only biochars that underbid both IBI and EBC biochar guideline
values for PAHs. In BC5, the value was higher than the IBI guideline but lower than the
EBC guideline. All the other biochar samples exceeded both guideline values. High PAH
values in biochars are not unusual and in the literature the amounts vary greatly. Hale et al.
(2012) studied PAHs in 50 different biochars and the amounts varied between 0.07–45
mg/kg. Also significantly larger values exist. In a study conducted by Schimmelpfennig
and Glaser (2012) the average concentrations in five biochars samples were in the range of
3.9–2945 mg/kg. The results obtained from literature are in accordance with these results.
If the digestate is composted and the remaining biochar is expected to serve as soil
amendment, the PAH values probably need to be under the legislative guidelines
(2007/2014, 86/278/ETY). On the other hand, the ultimate PAH-values in the digestate
may still remain under the guidelines, since the amount of originally added biochar is mi-
nor in comparison with the amount of the feedstock in anaerobic digestion. However, the
possibility of a procedure like this should be legally examined, since the dilution of the
contaminant may be prohibited. Attention on the PAH content of biochars should be fo-
cused, since due to increased production it is possible that legislative values are set to
guide their production in the future. PAHs are the most important contaminants in bio-
chars, so probably these are among the firsts on the target list. According to current volun-
tary certificates and standards these values would be relatively low in comparison with
some high PAH values in biochars. So far the production of biochars is not controlled of
certified.
6 CONCLUSIONS
The results of this study showed that pyrolytic biochar did not have a significant effect on
anaerobic digestion, while hydrochar seemed to work better. Hydrochar increased the me-

44
thane yields in both normal and ammonium increased feedstock. The ammonium adsorp-
tion capacities of the biochars were limited and therefore it is possible that the good effects
were based on other mechanisms. Literature suggests that hydrochar has higher biodegra-
dability compared with pyrolytic biochar and therefore it could act as additional feedstock
in the digester, and this could explain the better results. There is also evidence, that hydro-
char could support the growth of anaerobic micro-organisms. The applied hydrochar dose
was 4.5 % compared with the feedstock fresh weight and with this kind of dosage differ-
ences in the methane production were observed. Due to the biochar production costs, it
would be beneficial, that good effects could be seen with as small biochar amount as pos-
sible. On the other hand, the limitations of these experiments must be considered carefully.
Statistical analyses were not done and therefore the results must be interpreted with a high
caution.
It was also shown that the characteristics of biochars vary depending on the feedstock and
manufacturing methods and therefore the optimization of biochars could be beneficial
when considering their use in anaerobic digestion. Ammonium adsorption capacities in the
sampled biochars were relatively low, but in the literature higher values exist. Studies of
zeolite addition to anaerobic digestion have proved that high ammonium adsorption ca-
pacity is beneficial in mitigating ammonia inhibition with high TAN concentration. If the
adsorption capacity of biochars is maximized by optimizing feedstocks and manufacturing,
they could act as cost-effective adsorbents in anaerobic digestion. Additionally, the adsorp-
tion of ammonium could retain the nutrients in the digestate and process water preventing
the nutrient loss to the WWTP. High PAH-levels in some biochars showed that focus on
the possible contaminants must also be considered, if the produced digestate is utilized as
soil amendment. There already exist guideline values for PAHs in biochars and additional-
ly the Finnish legislation for contaminated soils or PAHs in composts can limit the use of
biochars.
Hydrochar production from sewage sludge digestate could be a potential sludge manage-
ment method if the hydrochar value can be increased in anaerobic digestion and compost-
ing. Previous studies showed, that the use of biochar in composting has good effects. This
study carefully suggests that the use of hydrochar could be beneficial in anaerobic diges-
tion, but due to the statistical limitations the results must be interpreted with caution. Fur-
ther experiments with more replicates and statistical analyses should be done to ensure the
observations and get scientifically reliable results. Future studies should focus on finding

45
the biochar associated mechanisms that enhance the methane production. The biodegrada-
bility of hydrochars in anaerobic conditions could be studied with standard BMP tests. The
finding of biochar with high ammonium adsorption could be continued by sampling more
biochars. Also the smallest biochar dose with effects on the methane production would be
critical information in order to minimize the production costs. When considering the HSY
partial flow digestion, it would be essential that the biochar would suit both anaerobic di-
gestion and composting. Therefore, attention should also be focused on the production of a
suitable biochar for both processes.
ACKNOWLEDGEMENTS
First, I want to thank my supervisors Tuula Tuhkanen and Aino Kainulainen for the guid-
ance through the thesis. I am very grateful to the Helsinki Region Environmental Services
Authority for offering the possibility to collaborate and the funding through the Material
Value Chains project. Thank you also my former HSY colleagues Aino Moisio, Jukka
Salmela, and Christoph Gareis, who encouraged me to ask thesis possibilities from the
HSY and introduced me to the right people. Mervi Koistinen and Leena Siitonen assisted a
lot in the laboratory work, so huge thanks for their effort too. Lastly, I want to thank my
family, friends, and especially Elise Rehula for the very important support during my jour-
ney with this thesis.
REFERENCES
Abbasi, T., Tauseef, S. M. & Abbasi, S. A. 2012. Biogas energy. 169 p. –Springer, New
York, NY.
Ahmad, M., Rajapaksha, A. U., Lim, J. E., Zhang, M., Bolan, N., Mohan, D. & Ok, Y. S.
2014. Biochar as a sorbent for contaminant management in soil and water: A review.
–Chemosphere 99: 19 – 33.
Angelidaki, I. & Sanders, W. 2004. Assessment of the anaerobic biodegradability of
macropollutants. –Reviews in Environmental Science & Biotechnology 3 (2): 117 –
129.
Bai, M., Wilske, B., Buegger, F., Esperschtz, J., Kammann, C. I., Eckhardt, C. & Frede, H.
2013. Degradation kinetics of biochar from pyrolysis and hydrothermal carbonization
in temperate soils. –Plant and Soil 372: 375 – 387.
Bargmann, I., Rillig, M. C., Buss, W., Kruse, A. & Kuecke, M. 2013. Hydrochar and bio-
char effects on germination of spring barley. –Journal of Agronomy and Crop Science
199: 360 – 373.
Bayr, S. 2014. Biogas production from meat and pulp and paper industry by-products. 88
p. –Jyväskylä Studies in Biological and Environmental Science 280.
Berge, N. D., Ro, K. S., Mao, J., Flora, J. R., Chappell, M. A. & Bae, S. 2011. Hydrother-
mal carbonization of municipal waste streams. –Environmental Science & Technology
45 (13): 5696 – 5703.

46
Bolzonella, D., Pavan, P., Mace, S. & Cecchi, F. 2006. Dry anaerobic digestion of differ-
ently sorted organic municipal solid waste: A full-scale experience. –Water Science
and Technology 53 (8): 23 – 32.
Boyle, G. 2004. Renewable energy, 2nd ed. 584 p. –Oxford University Press, Oxford.
Bucheli, T. D., Hilber, I. & Schmidt, H. 2015. Polycyclic aromatic hydrocarbons and poly-
chlorinated aromatic compounds in biochar. In Lehmann, J. & Joseph, S. (editors),
Biochar for Environmental Management: Science and Technology. 448 p. –Earthscan,
London.
Cai, J., He, P., Wang, Y., Shao, L. & Lü, F. 2016. Effects and optimization of the use of
biochar in anaerobic digestion of food wastes. –Waste Management & Research 34
(5): 409 – 416.
Castren, J., Korhonen, R., Kuokkanen, A., Lallukka, S., Lehtinen, E. & Urho, A. 2015.
Jätevedenpuhdistus pääkaupunkiseudulla 2015 - Viikinmäen ja Suomenojan puhdis-
tamot. 69 p. –Helsingin seudun ympäristöpalvelujen julkaisuja 4/2016.
Chan, K. Y. & Xu, Z. 2009. Biochar: Nutrient properties and their enhancement.In Leh-
mann, J. & Joseph, S. (editors), Biochar for Environmental Management: Science and
Technology. 448 p. –Earthscan, London.
Chen, S., Rotaru, A., Shrestha, P. M., Malvankar, N. S., Liu, F., Fan, W. & Lovley, D. R.
2014. Promoting interspecies electron transfer with biochar. –Scientific Reports 4: ar-
ticle no. 5019.
Chen, Y., Cheng, J. J. & Creamer, K. S. 2008. Inhibition of anaerobic digestion process: A
review. –Bioresource Technology 99 (10): 4044 – 4064.
Chiras, D. D. 2013. Environmental science, 9th ed. -Jones and Bartlett Learning, Burling-
ton, MA.
European Comission 2015/614/COM: Closing the loop - an EU action plan for the circular
economy. Document 52015DC0614, 2.12.2015. Available from http://eur-
lex.europa.eu/legal-content/EN/TXT/?uri=CELEX:52015DC0614.
Demirbas, A. & Arin, G. 2002. An overview of biomass pyrolysis. –Energy Sources 24
(5): 471 – 482.
Deublein, D. & Steinhauser, A. 2011. Biogas from waste and renewable resources: An
introduction (2nd ed). 578 p. –Wiley, Weinheim.
EBC 2016: Guidelines for a sustainable production of biochars V.6.2. –European Biochar
Certificate. Available from http://www.european-biochar.org/biochar/media/doc/ebc-
guidelines.pdf.
Finnish Ministry of Environment 2016: Ravinteiden kierrätyksen edistämistä ja Saaristo-
meren tilan parantamista koskevan ohjelman toinen vaihe 2016-2019. –Finnish Mi-
nistry of Environment 1/2016. Available from http://www.ym.fi/ravinteidenkierratys.
Gai, X., Wang, H., Liu, J., Zhai, L., Liu, S., Ren, T. & Liu, H. 2014. Effects of feedstock
and pyrolysis temperature on biochar adsorption of ammonium and nitrate. –PLoS
ONE 9 (12): e113888.
Guendouz, J., Buffière, P., Cacho, J., Carrère, M. & Delgenes, J. 2010. Dry anaerobic di-
gestion in batch mode: Design and operation of a laboratory-scale, completely mixed
reactor. –Waste Management 30 (10): 1768 – 1771.

47
Hale, S. E., Alling, V., Martinsen, V., Mulder, J., Breedveld, G. D. & Cornelissen, G.
2013. The sorption and desorption of phosphate-P, ammonium-N and nitrate-N in ca-
cao shell and corn cob biochars. –Chemosphere 91 (11) 1612 – 1619.
Hale, S. E., Lehmann, J., Rutherford, D., Zimmerman, A. R., Bachmann, R. T.,
Shitumbanuma, V. & Cornelissen, G. 2012. Quantifying the total and bioavailable
polycyclic aromatic hydrocarbons and dioxins in biochars. –Environmental Science &
Technology 46 (5): 2830 – 2838.
Holm-Nielsen, J. B., Al Seadi, T. & Oleskowicz-Popiel, P. 2009. The future of anaerobic
digestion and biogas utilization. –Bioresource Technology 100 (22): 5478 – 5484.
IBI 2012: Standardized product definition and product testing guidelines for biochar that is
used in soil V.2.1. –International Biochar Initiative. Available from
http://www.biochar-
international.org/sites/default/files/IBI_Biochar_Standards_V2.1_Final.pdf.
Kim, D., Lee, K. & Park, K. Y. 2014. Hydrothermal carbonization of anaerobically digest-
ed sludge for solid fuel production and energy recovery. –Fuel 130: 120 – 125.
Kim, M., Ahn, Y. & Speece, R. E. 2002. Comparative process stability and efficiency of
anaerobic digestion; mesophilic vs. thermophilic. –Water Research 36 (17): 4369 –
4385.
Kithome, M., Paul, J. W., Lavkulich, L. M. & Bomke, A. A. 1998. Kinetics of ammonium
adsorption and desorption by the natural zeolite clinoptilolite. –Soil Science Society
of America Journal 62 (3): 622 – 629.
Kizito, S., Wu, S., Kipkemoi Kirui, W., Lei, M., Lu, Q., Bah, H. & Dong, R. 2015. Evalua-
tion of slow pyrolyzed wood and rice husks biochar for adsorption of ammonium ni-
trogen from piggery manure anaerobic digestate slurry. –Science of the Total Envi-
ronment 505: 102 – 112.
Knicker, H. (2010). “Black nitrogen” – an important fraction in determining the recalci-
trance of charcoal. –Organic Geochemistry 41 (9): 947 – 950.
Koyama, T. 1963. Gaseous metabolism in lake sediments and paddy soils and the produc-
tion of atmospheric methane and hydrogen. –Journal of Geophysical Research 68
(13): 3971 – 3973.
Lehmann, J. & Joseph, S. 2015. Biochar for environmental management (2nd ed.)
–Earthscan, London
Lehmann, J., Rillig, M. C., Thies, J., Masiello, C. A., Hockaday, W. C. & Crowley, D.
2011. Biochar effects on soil biota: a review. –Soil Biology and Biochemistry 43 (9):
1812 – 1836.
Li, Y., Park, S. Y., & Zhu, J. (2011). Solid-state anaerobic digestion for methane produc-
tion from organic waste. –Renewable and Sustainable Energy Reviews 15 (1): 821 –
826.
Libra, J. A., Ro, K. S., Kammann, C., Funke, A., Berge, N. D., Neubauer, Y. & Emmerich,
K. 2011. Hydrothermal carbonization of biomass residuals: A comparative review of
the chemistry, processes and applications of wet and dry pyrolysis. –Biofuels 2 (1): 71
– 106.
48
Lü, F., Luo, C., Shao, L. & He, P. 2016. Biochar alleviates combined stress of ammonium
and acids by firstly enriching methanosaeta and then methanosarcina. –Water Re-
search 90: 34 – 43.
Luo, C., Lü, F., Shao, L. & He, P. 2015. Application of eco-compatible biochar in anaero-
bic digestion to relieve acid stress and promote the selective colonization of functional
microbes. –Water Research 68: 710 – 718.
Mata-Alvarez, J., Macé, S. & Llabrés, P. 2000. Anaerobic digestion of organic solid
wastes. an overview of research achievements and perspectives. –Bioresource Tech-
nology 74 (1): 3 – 16.
Meyer, S., Glaser, B. & Quicker, P. 2011. Technical, economical, and climate-related as-
pects of biochar production technologies: A literature review. –Environmental Science
& Technology 45 (22): 9473 – 9483.
Mohan, D., Pittman, C. U. & Steele, P. H. 2006. Pyrolysis of wood-biomass for bio-oil: a
critical review. –Energy Fuels 20 (3): 848 – 889.
Montalvo, S., Guerrero, L., Borja, R., Sánchez, E., Milán, Z., Cortés, I. & Angeles de la
Rubia, M. 2012. Application of natural zeolites in anaerobic digestion processes: A
review. –Applied Clay Science 58: 125 – 133.
Mukherjee, A. & Zimmerman, A. R. 2013. Organic carbon and nutrient release from a
range of laboratory-produced biochars and biochar–soil mixtures. –Geoderma 193:
122 – 130.
Mumme, J., Eckervogt, L., Pielert, J., Diakité, M., Rupp, F. & Kern, J. 2011. Hydrothermal
carbonization of anaerobically digested maize silage. –Bioresource Technology, 102
(19): 9255 – 9260.
Mumme, J., Srocke, F., Heeg, K. & Werner, M. 2014. Use of biochars in anaerobic diges-
tion. –Bioresource Technology 164: 189 – 197.
Mäkinen, P. 2016. Biohiilen lisäyksen vaikutukset kompostointiprosessiin laitosmittakaa-
van tunnelikompostoinnissa. 59 p. –Master’s thesis. University of Helsinki, Helsinki.
Mönkäre, T., Kinnunen, V. & Rintala, J. 2015. Modelling reject water and nutrient flows
from biowaste treatment in a partial flow digestion. –Project report. Tampere Univer-
sity of Technology, Tampere.
Perstorp Analytical Tecator. 1995. Determination of nitrogen according to kjeldahl using
block digestion and steam distillation. –Tecator application note. Perstorp Analytical
Tecator Ab.
Prins, M. J., Ptasinski, K. J. & Janssen, Frans J. G. 2006. More efficient biomass gasifica-
tion via torrefaction. –Energy 31 (15): 3458 – 3470.
Rajagopal, R., Massé, D. I. & Singh, G. 2013. A critical review on inhibition of anaerobic
digestion process by excess ammonia. –Bioresource Technology 143: 632 – 641.
Rasi, S., Veijanen, A. & Rintala, J. 2007. Trace compounds of biogas from different biogas
production plants. –Energy 32 (8): 1375 – 1380.
Roberts, K. G., Gloy, B. A., Joseph, S., Scott, N. R. & Lehmann, J. 2009. Life cycle as-
sessment of biochar systems: estimating the energetic, economic, and climate change
potential. –Environmental Science & Technology 44 (2): 827 – 833.

49
Romero-Güiza, M. S., Vila, J., Mata-Alvarez, J., Chimenos, J. M. & Astals, S. 2016. The
role of additives on anaerobic digestion: a review. –Renewable and Sustainable Ener-
gy Reviews 58: 1486 – 1499.
Ryckebosch, E., Drouillon, M., & Vervaeren, H. 2011. Techniques for transformation of
biogas to biomethane. –Biomass and Bioenergy 35 (5): 1633 – 1645.
Sarkhot, D. V., Ghezzehei, T. A. & Berhe, A. A. (2013). Effectiveness of biochar for sorp-
tion of ammonium and phosphate from dairy effluent. –Journal of Environmental
Quality 42 (5): 1545 – 1554.
Schimmelpfennig, S. & Glaser, B. 2012. One step forward toward characterization: Some
important material properties to distinguish biochars. –Journal of Environmental
Quality 41 (4): 1001 – 1013.
SFS 3008. 1990. Determination of total solids and volatile solids in water, sludge and sed-
iment. –Finnish Standard Association, Helsinki, Finland.
SFS 5504. 1988. Determination of chemical oxygen demand (CODCr) in water with closed
tube method, oxidation with dichromate. –Finnish Standard Association, Helsinki,
Finland.
Siegert, I. & Banks, C. 2005. The effect of volatile fatty acid additions on the anaerobic
digestion of cellulose and glucose in batch reactors. –Process Biochemistry 40 (11):
3412 – 3418.
Song, Y., Kwon, S. & Woo, J. 2004. Mesophilic and thermophilic temperature co-phase
anaerobic digestion compared with single-stage mesophilic and thermophilic digestion
of sewage sludge. –Water Research 38 (7): 1653 – 1662.
Sung, S. & Liu, T. (2003). Ammonia inhibition on thermophilic anaerobic digestion.
–Chemosphere 53 (1): 43 – 52.
Tada, C., Yang, Y., Hanaoka, T., Sonoda, A., Ooi, K. & Sawayama, S. 2005. Effect of
natural zeolite on methane production for anaerobic digestion of ammonium rich or-
ganic sludge. –Bioresource Technology 96 (4): 459 – 464.
Tambone, F., Scaglia, B., D’Imporzano, G., Schievano, A., Orzi, V., Salati, S. & Adani, F.
2010. Assessing amendment and fertilizing properties of digestates from anaerobic di-
gestion through a comparative study with digested sludge and compost.
–Chemosphere 81 (5): 577 – 583.
Valtioneuvoston asetus kaatopaikoista 2.5.2013/331.
Valtioneuvoston asetus maaperän pilaantuneisuuden ja puhdistustarpeen arvioinnista
1.3.2007/214.
VVY 2013: Puhdistamolietteen käyttö maataloudessa. –Vesilaitosyhdistys 5/2013. Availa-
ble from http://www.vvy.fi/files/3870/Puhdistamolieteopas_2013(20032014s).pdf.
Wall, J., Harwood, C. S. & Demain, A. L. 2008. Bioenergy. 608 p. –ASM Press, Washing-
ton, DC.
Wang, X., Lu, X., Li, F. & Yang, G. 2014. Effects of temperature and carbon-nitrogen
(C/N) ratio on the performance of anaerobic co-digestion of dairy manure, chicken
manure and rice straw: Focusing on ammonia inhibition. –PLoS ONE 9 (5): e97265.

50
Wang, Y., Zhang, Y., Wang, J. & Meng, L. 2009. Effects of volatile fatty acid concentra-
tions on methane yield and methanogenic bacteria. –Biomass and Bioenergy 33 (5):
848 – 853.
Ward, A. J., Hobbs, P. J., Holliman, P. J. & Jones, D. L. 2008. Optimisation of the anaero-
bic digestion of agricultural resources. –Bioresource Technology 99 (17): 7928 –
7940.
Watanabe, R., Tada, C., Baba, Y., Fukuda, Y. & Nakai, Y. 2013. Enhancing methane pro-
duction during the anaerobic digestion of crude glycerol using japanese cedar char-
coal. –Bioresource Technology 150: 387 – 392.
Weiland, P. 2010. Biogas production: Current state and perspectives. –Applied Microbiol-
ogy and Biotechnology 85 (4): 849 – 60.
Williams, P. T. 2006. Waste treatment and disposal (2nd ed.). 392 p. –Wiley, Chichester.
Wirth, B. & Mumme, J. 2014. Anaerobic digestion of waste water from hydrothermal car-
bonization of corn silage. –Applied Bioenergy 1 (1): 1 – 10.
Yenigün, O. & Demirel, B. 2013. Ammonia inhibition in anaerobic digestion: A review.
–Process Biochemistry 48 (5): 901 – 911.
Zhang, C., Su, H., Baeyens, J. & Tan, T. 2014. Reviewing the anaerobic digestion of food
waste for biogas production. –Renewable and Sustainable Energy Reviews 38: 383 –
392.
Zhao, Z., Zhang, Y., Woodard, T. L., Nevin, K. P. & Lovley, D. R. 2015. Enhancing
syntrophic metabolism in up-flow anaerobic sludge blanket reactors with conductive
carbon materials. –Bioresource Technology 191: 140 – 145.
Zhu, K., Fu, H., Zhang, J., Lv, X., Tang, J., & Xu, X. (2012). Studies on removal of NH4+-
N from aqueous solution by using the activated carbons derived from rice husk.
–Biomass and Bioenergy 43: 18 – 25.

APPENDICES
Appendix 1. The values of biochar ammonium adsorption capacities.
Sample concentration
(g/l)
Ammonium adsorption capacity (mg NH4+/g BC)
ZEO BC1 BC2 BC3 BC4 BC5 BC6 BC7 BC8
20 17.3 ± 0.2 1.7 ± 0.2 1.7 ± 0.1 2.7 ± 0.2 4.4 ± 0.2 1.7 ± 0.1 4.3 ± 0.1 3.3 ± 0.3 3.0 ± 0.4
50 9.1 ± 0.1 1.8 ± 0.1 1.1 ± 0.1 2.8 ± 0.1 3.1 ± 0.1 1.0 ± 0.1 2.2 ± 0.1 2.0 ± 0.2 1.7 ± 0.1
100 5.0 ± 0.1 1.4 ± 1 1.5 ± 0.1 2.0 ± 0.1 2.5 ± 0.1 0.8 ± 0.1 2.0 ± 0.1 1.5 ± 0.1 1.3 ± 0.1

Appendix 2. The values of nutrient release (DOC and DTN) from biochars.
Sample DOC (mg/kg) DTN (mg/kg)
BC1 2209.4 ± 4.3 6.9 ± 0.5
BC2 180.2 ± 5.7 5.95 ± 0.08
BC3 3070.0 ± 200.5 41.3 ± 2.2
BC4 517.5 ± 1.5 13.1 ± 0.8
BC5 30.8 ± 0.3 2.3 ± 0.1
BC6 337.0 ± 4.4 3.1 ± 0.3
BC7 8.9 ± 2.9 0.83 ± 0.02
BC8 6397.3 ± 46.3 2705.3 ± 26.1
Appendix 3. The values and composition of 15 PAHs in biochars.
PAH-compound PAH-amount (mg/kg)
BC1 BC2 BC3 BC4 BC5 BC6 BC7 BC8
Naphthalene 66,09 13,70 2,97 25,11 7,71 0,58 10,16 0,13
2-Methylnaphthalene 49,23 3,26 3,35 10,75 1,19 0,10 0,72 0,11
1-Methylnaphthalene 24,05 1,77 2,34 5,56 0,44 0,10 0,50 0,30
Acenaphthalne 2,63 0,00 0,00 1,22 0,03 0,00 0,67 0,00
Acenaphthene 2,54 1,29 1,32 1,30 0,17 0,09 0,09 0,31
Fluorene 11,23 1,80 2,14 2,02 0,20 0,44 0,00 0,36
Phenathrene 9,94 3,00 2,00 3,23 0,74 0,13 3,72 1,42
Anthracene 4,16 3,51 2,02 2,27 0,12 0,05 0,94 0,00
Fluoranthene 2,38 1,83 1,86 1,98 0,13 0,03 0,90 0,64
Pyrene 2,63 1,90 1,96 2,07 0,15 0,02 0,84 0,57
Benz[a]anthracene 4,04 4,79 4,79 4,78 0,04 0,01 0,39 0,11
Chrysene 3,17 3,72 3,74 3,77 0,06 0,01 0,46 0,13
Benz[b]fluoranthene 4,63 0,00 0,00 5,78 0,04 0,01 0,16 0,13
Benz[k]fluoranthene 3,56 4,41 4,44 0,00 0,01 0,01 0,12 0,00
Benz[a]pyrene 0,00 0,00 0,00 4,91 0,02 0,00 0,08 0,07
SUM 190,28 44,99 32,93 74,74 11,05 1,58 19,75 4,29