Embed Size (px)
Citation preview
Schola Europaea / Office of the Secretary-General
Pedagogical Development Unit
Ref.: 2021-01-D-52-en-2 Orig.: EN
Mathematics Syllabus 3 Periods – S6-S7
Approved by the Joint Teaching Committee at its online meeting on 11
and 12 February 2021
Entry into force: on 1 September 2021 for S6
on 1 September 2022 for S7
1st Baccalaureate session in June 2023
2021-01-D-52-en-2 2/58
Europeans Schools Mathematics Syllabus Year S6&7 3 Periods
Table of contents
1. General Objectives .................................................................................................................. 3
2. Didactical Principles ................................................................................................................. 4
3. Learning Objectives ................................................................................................................. 6
3.1. Competences ................................................................................................................... 6
3.2. Cross-cutting concepts ..................................................................................................... 7
4. Content ............................................................................................................................ 8
4.1. Topics ............................................................................................................................... 8
4.2. Tables ............................................................................................................................... 8
5. Assessment .......................................................................................................................... 29
5.1. Attainment Descriptors .................................................................................................... 31
Annex 1: Suggested time frame .................................................................................................... 33
Annex 2: Example for a NHST test ............................................................................................... 34
Annex 3: Sample BAC papers, solutions and matrix ..................................................................... 35

2021-01-D-52-en-2 3/58
1. General Objectives
The European Schools have the two objectives of providing formal education and of encouraging pupils’ personal development in a wider social and cultural context. Formal education involves the acquisition of competences (knowledge, skills and attitudes) across a range of domains. Personal development takes place in a variety of spiritual, moral, social and cultural contexts. It involves an awareness of appropriate behaviour, an understanding of the environment in which pupils live, and a development of their individual identity.
These two objectives are nurtured in the context of an enhanced awareness of the richness of European culture. Awareness and experience of a shared European life should lead pupils towards a greater respect for the traditions of each individual country and region in Europe, while developing and preserving their own national identities.
The pupils of the European Schools are future citizens of Europe and the world. As such, they need a range of competences if they are to meet the challenges of a rapidly changing world. In 2006 the European Council and European Parliament adopted a European Framework for Key Competences for Lifelong Learning. It identifies eight key competences which all individuals need for personal fulfilment and development, for active citizenship, for social inclusion and for employment:
1. Literacy competence 2. Multilingual competence 3. Mathematical competence and competence in science, technology and engineering 4. Digital competence 5. Personal, social and learning to learn competence 6. Civic competence 7. Entrepreneurship competence 8. Cultural awareness and expression competence
The European Schools’ syllabuses seek to develop all of these key competences in the pupils.
Key competences are that general, that we do not mention them all the time in the Science and Mathematics syllabuses.
2021-01-D-52-en-2 4/58
2. Didactical Principles
General
In the description of the learning objectives, competences, connected to content, play an important role. This position in the learning objectives reflects the importance of competences acquisition in actual education. Exploratory activities by pupils support this acquisition of competences, such as in experimenting, designing, searching for explanations and discussing with peers and teachers. In science education, a teaching approach is recommended that helps pupils to get acquainted with concepts by having them observe, investigate and explain phenomena, followed by the step to have them make abstractions and models. In mathematics education, investigations, making abstractions and modelling are equally important. In these approaches, it is essential that a maximum of activity by pupils themselves is stimulated – not to be confused with an absent teacher: teacher guidance is an essential contribution to targeted stimulation of pupils' activities.
The concept of inquiry-based learning (IBL) refers to these approaches. An overview of useful literature on this can be found in the PRIMAS guide for professional development providers.
http://primas-project.eu/wp-content/uploads/sites/323/2017/10/PRIMAS_Guide-for-Professional-Development-Providers-IBL_110510.pdf
Mathematics
Careful thought has been given to the content and the structure to where topics are first met in a pupil’s time learning mathematics in secondary education. It is believed that this is a journey and if too much content is met at one point, there is a risk that it will not be adequately understood and thus a general mathematical concept will not be fully appreciated. By limiting the content of this syllabus (found in section 4.2.) each year more time can be used to develop core mathematical concepts that may have been met before or new mathematical concepts introduced are given ample time for extension. It must be noted that extension activities are conducted at the discretion of the teacher, however, it is suggested that rather than look at a vertical approach to extension a horizontal approach is used, thus giving the pupil a deeper understanding of the mathematical concept (in section 4 the word ‘limitation’ is used to ensure the extension does not go too far).
Furthermore, to this point it is believed that with a focus on competences this syllabus can encourage pupils to have a greater enjoyment of mathematics, as they not only understand the content better but understand the historical context (where it is expected a history of mathematics can be told over the cycles) and how the mathematics can be applied in other subjects, cross cutting (these can be seen in the fourth column in section 4.2.). As such the syllabuses have specifically been designed with reflection to the key competences (section 1) and the subject specific competences (section 3.1). In some cases, the key competences are
clear for example the numerous history suggested activities (shown by the icon ) that maps to key competency 8 (Cultural awareness and expression). In other areas the link may not be so apparent.
One of the tasks in the pupil’s learning process is developing inference skills, analytical skills and strategic thinking, which are linked to both the key and subject specific competences. This is the ability to plan further steps in order to succeed solving a problem as well as dividing the process of solving more complex problems into smaller steps. A goal of teaching mathematics is to develop pupil’s intuitions in mathematics appropriate for their age. The ability to understand and use mathematical concepts (e.g., angle, length, area, formulae and equations) is much more important than memorising formal definitions.

2021-01-D-52-en-2 5/58
This syllabus has also been written so that it can be accessible by teachers, parents and pupils. This is one reason why icons have been used (listed in section 4.2.). These icons represent different areas of mathematics and are not necessarily connected to just one competency but can cover a number of competences.
To ensure pupils have a good understanding of the mathematics the courses from S1 to S7 have been developed linearly with each year the work from the previous year is used as a foundation to build onto. Thus, it is essential before commencing a year the preceding course must have been covered or a course that is similar. The teacher is in the best position to understand the specific needs of the class and before beginning a particular topic it is expected that pupils have the pre-required knowledge. A refresh is always a good idea when meeting a concept for the first time in a while. It should be noted that revision is not included in the syllabus, however, as mentioned earlier about limiting new content, there is time to do this when needed.
The use of technology and digital tools plays an important role in both theoretical and applied mathematics, which is reflected in this syllabus. The pupils should get the opportunity to work and solve problems with different tools such as spreadsheets, computer algebra system (CAS) software, dynamic geometric software (DGS), programming software or other software that are available in the respective schools. Technology and digital tools should be used to support and promote pupils’ understanding, for example by visualising difficult concepts and providing interactive and personalised learning opportunities, rather than as a substitute for understanding. Their use will also lead to improved digital competence.
Teachers have full discretion with how to teach this course, materials to use and even the sequence the content is taught in. The content and the competencies (indicated in the tables in section 4.2., columns 2 and 3) to be covered is, however, mandatory.
The S6 3 Period Course
This course has been specifically written for those that are not choosing mathematics at a higher level. The aim of the course is less interested in why the mathematics works but finding models that can be applied to satisfy given criteria. It is hoped that by following this applied approach pupils that have historically had difficulties with theoretical mathematics should have a better understanding of the application of the topics met. Hence this course focuses on modelling, and in section 7 of this document the rationale and an example of how to use modelling is explained. This has applications in science, economics, geography and beyond, with an aim of promoting life-long learning. The use of mathematics in a cross curricula setting has been prioritised in developing this syllabus.
Pupils must note that the 4 Period and 6 Period courses in S5 are different. Thus, pupils that have not studied the 4 Period course in S5 may find themselves at a small disadvantage, as this 3 Period course is a natural continuation to the work done in the 4 Period course of S5. It is certainly recommended that pupils have a good understanding of the topics covered in the 4 Period course of S4 and S5.
The S7 3 Period Course
This course is a continuation from the S6 3 Period course, and it is strongly advised that anyone wishing to start this course has a good understanding of the topics and competences covered in the S6 3 Period course. It should be noted that the S6 5 Period course has a different approach to mathematics.
2021-01-D-52-en-2 6/58
3. Learning Objectives
3.1. Competences
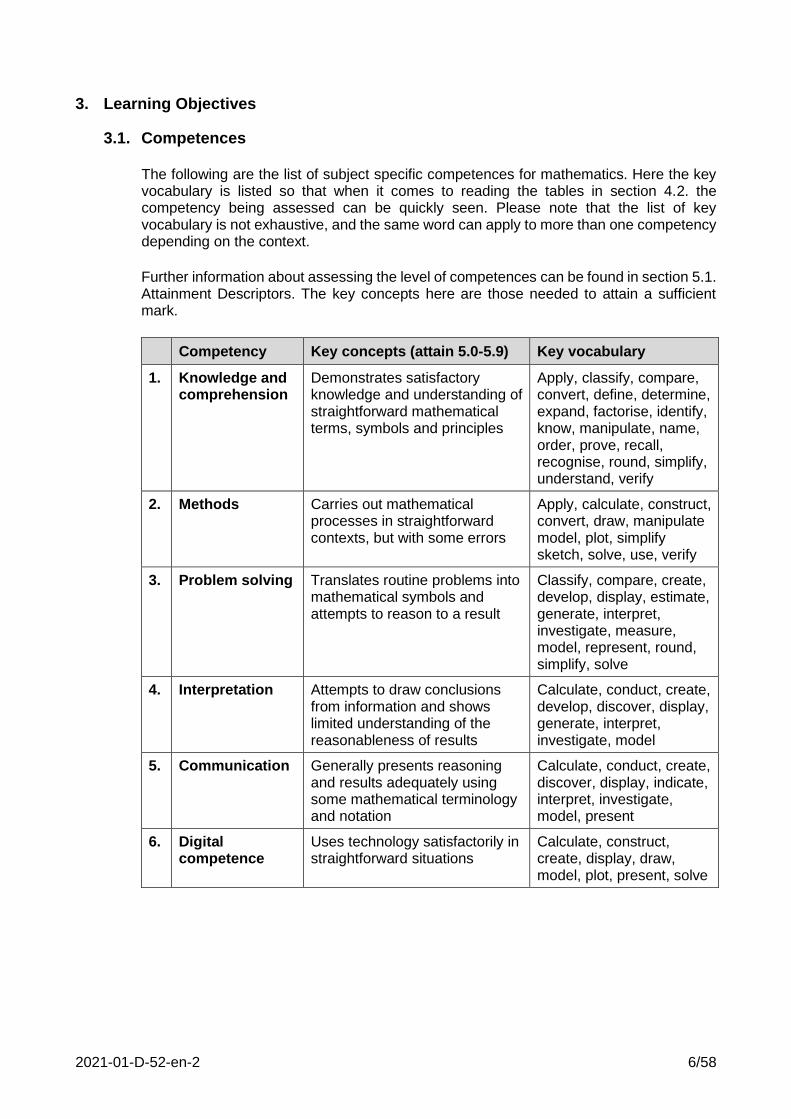
The following are the list of subject specific competences for mathematics. Here the key vocabulary is listed so that when it comes to reading the tables in section 4.2. the competency being assessed can be quickly seen. Please note that the list of key vocabulary is not exhaustive, and the same word can apply to more than one competency depending on the context.
Further information about assessing the level of competences can be found in section 5.1. Attainment Descriptors. The key concepts here are those needed to attain a sufficient mark.
Competency Key concepts (attain 5.0-5.9) Key vocabulary
1. Knowledge and comprehension
Demonstrates satisfactory knowledge and understanding of straightforward mathematical terms, symbols and principles
Apply, classify, compare, convert, define, determine, expand, factorise, identify, know, manipulate, name, order, prove, recall, recognise, round, simplify, understand, verify
2. Methods Carries out mathematical processes in straightforward contexts, but with some errors
Apply, calculate, construct, convert, draw, manipulate model, plot, simplify sketch, solve, use, verify
3. Problem solving Translates routine problems into mathematical symbols and attempts to reason to a result
Classify, compare, create, develop, display, estimate, generate, interpret, investigate, measure, model, represent, round, simplify, solve
4. Interpretation Attempts to draw conclusions from information and shows limited understanding of the reasonableness of results
Calculate, conduct, create, develop, discover, display, generate, interpret, investigate, model
5. Communication Generally presents reasoning and results adequately using some mathematical terminology and notation
Calculate, conduct, create, discover, display, indicate, interpret, investigate, model, present
6. Digital competence
Uses technology satisfactorily in straightforward situations
Calculate, construct, create, display, draw, model, plot, present, solve

2021-01-D-52-en-2 7/58
3.2. Cross-cutting concepts
Cross cutting concepts will be carried by the joint competences. The list of cross cutting concepts that will be composed will be shared by all science and mathematics syllabuses. The tentative list to be taught is based on the next generation science standards in the United states (National Research Council, 2013):
Concept Description
1. Patterns Observed patterns of forms and events guide organisation and classification, and they prompt questions about relationships and the factors that influence them.
2. Cause and effect Mechanism and explanation. Events have causes, sometimes simple, sometimes multifaceted. A major activity of science is investigating and explaining causal relationships and the mechanisms by which they are mediated. Such mechanisms can then be tested across given contexts and used to predict and explain events in new contexts.
3. Scale, proportion and quantity
In considering phenomena, it is critical to recognise what is relevant at different measures of size, time, and energy and to recognise how changes in scale, proportion, or quantity affect a system’s structure or performance.
4. Systems and system models
Defining the system under study—specifying its boundaries and making explicit a model of that system—provides tools for understanding the world. Often, systems can be divided into subsystems and systems can be combined into larger systems depending on the question of interest
5. Flows, cycles and conservation
Tracking fluxes of energy and matter into, out of, and within systems helps one understand the systems’ possibilities and limitations.
6. Structure and function
The way in which an object or living thing is shaped and its substructure determine many of its properties and functions and vice versa.
7. Stability and change
For natural and built systems alike, conditions of stability and determinants of rates of change or evolution of a system are critical for its behaviour and therefore worth studying.
8. Nature of Science
All science relies on a number of basic concepts, like the necessity of empirical proof and the process of peer review.
9. Value thinking Values thinking involves concepts of justice, equity, social–ecological integrity and ethics within the application of scientific knowledge.
In the mathematics syllabuses, the concepts 5 and 8 will be addressed only to a limited extent.
The lists of competences and cross cutting concepts will serve as a main cross-curricular binding mechanism. The subtopics within the individual syllabuses will refer to these two aspects by linking to them in the learning goals.
http://ngss.nsta.org/Professional-Learning.aspx
2021-01-D-52-en-2 8/58
4. Content
4.1. Topics
This section contains the tables with the learning objectives and the mandatory content for the strand Mathematics in S6 and S7 (3 periods per week).
4.2. Tables
How to read the tables on the following pages
The learning objectives are the curriculum goals. They are described in the third column. These include the key vocabulary, highlighted in bold, that are linked to the specific mathematics competences found in section 3.1. of this document. These goals are related to content and to competences. The mandatory content is described in the second column. The final column is used for suggested activities, key contexts and phenomena. The teacher is free to use these suggestions or use their own providing that the learning objective and competencies have been met. Please note that the word ‘limitation’ is used to ensure that when extension is planned it is planned with the idea of horizontal extension rather than vertical extension as mentioned in section 2. of this document.
Use of icons
Furthermore, there are six different icons which indicate the areas met in the final column:
Activity
Cross-cutting concepts
Digital competence
Extension
History
Phenomenon
Each of these icons highlight a different area and are used to make the syllabus easier to
read. These areas are based on the key competences mentioned in section 1 of this
document.
2021-01-D-52-en-2 9/58
S6 3 Period (3P)
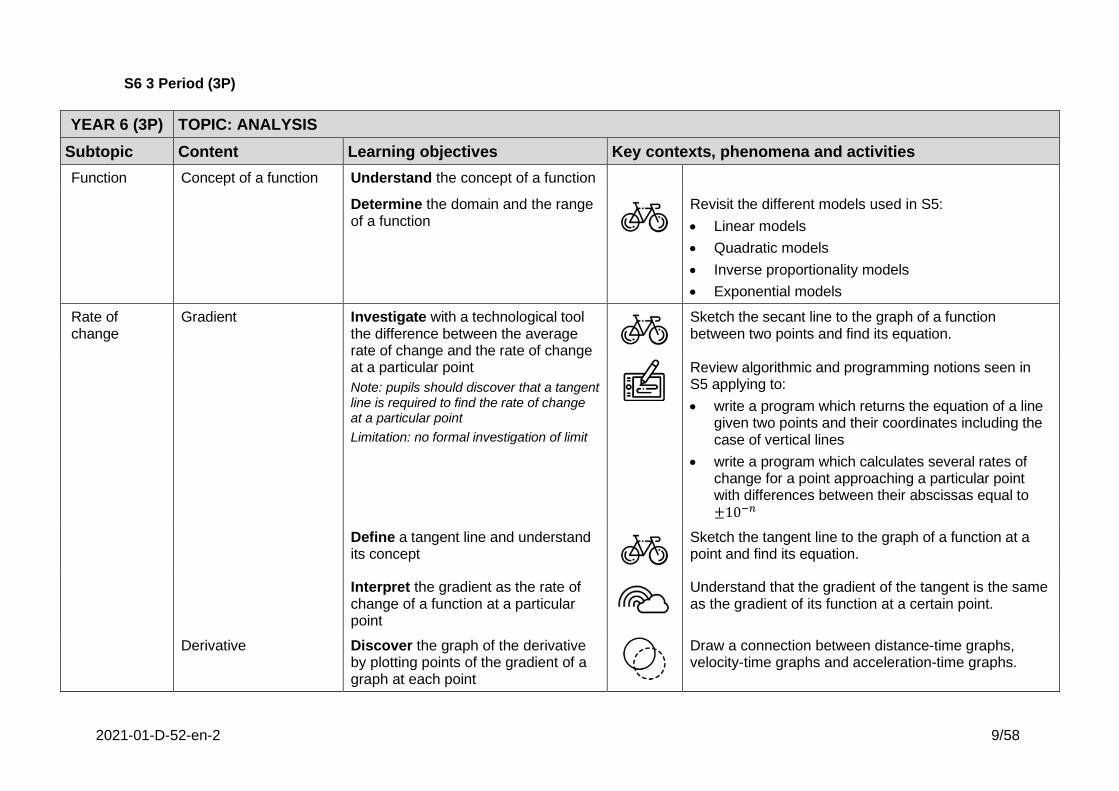
YEAR 6 (3P) TOPIC: ANALYSIS
Subtopic Content Learning objectives Key contexts, phenomena and activities
Function Concept of a function Understand the concept of a function
Determine the domain and the range of a function
Revisit the different models used in S5:
• Linear models
• Quadratic models
• Inverse proportionality models
• Exponential models
Rate of change
Gradient Investigate with a technological tool the difference between the average rate of change and the rate of change at a particular point
Note: pupils should discover that a tangent line is required to find the rate of change at a particular point
Limitation: no formal investigation of limit
Sketch the secant line to the graph of a function between two points and find its equation.
Review algorithmic and programming notions seen in S5 applying to:
• write a program which returns the equation of a line given two points and their coordinates including the case of vertical lines
• write a program which calculates several rates of change for a point approaching a particular point with differences between their abscissas equal to ±10−𝑛
Define a tangent line and understand its concept
Sketch the tangent line to the graph of a function at a point and find its equation.
Interpret the gradient as the rate of change of a function at a particular point
Understand that the gradient of the tangent is the same as the gradient of its function at a certain point.
Derivative Discover the graph of the derivative by plotting points of the gradient of a graph at each point
Draw a connection between distance-time graphs, velocity-time graphs and acceleration-time graphs.
2021-01-D-52-en-2 10/58
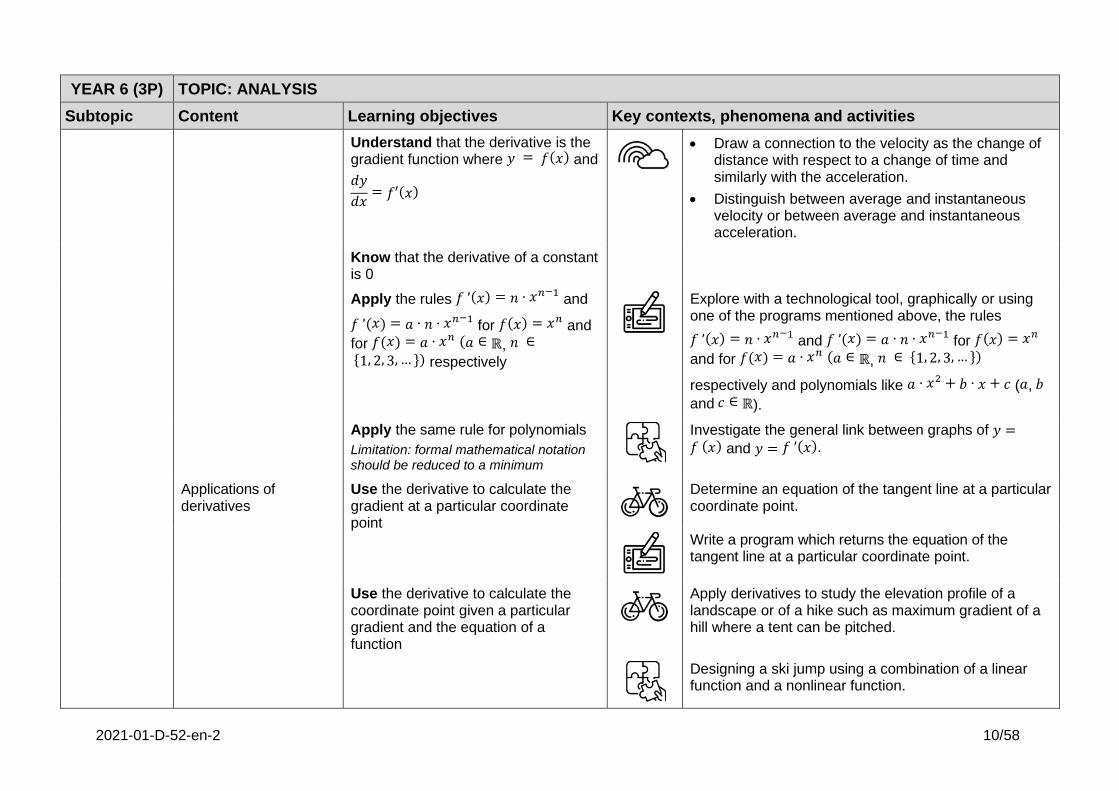
YEAR 6 (3P) TOPIC: ANALYSIS
Subtopic Content Learning objectives Key contexts, phenomena and activities
Understand that the derivative is the gradient function where 𝑦 = 𝑓(𝑥) and
𝑑𝑦
𝑑𝑥= 𝑓′(𝑥)
• Draw a connection to the velocity as the change of distance with respect to a change of time and similarly with the acceleration.
• Distinguish between average and instantaneous velocity or between average and instantaneous acceleration.
Know that the derivative of a constant is 0
Apply the rules 𝑓 ’(𝑥) = 𝑛 · 𝑥𝑛−1 and
𝑓 ’(𝑥) = 𝑎 · 𝑛 · 𝑥𝑛−1 for 𝑓(𝑥) = 𝑥𝑛
and
for 𝑓(𝑥) = 𝑎 · 𝑥𝑛 (𝑎 ∈ ℝ, 𝑛 ∈
{1, 2, 3, … }) respectively
Explore with a technological tool, graphically or using one of the programs mentioned above, the rules
𝑓 ’(𝑥) = 𝑛 · 𝑥𝑛−1 and 𝑓 ’(𝑥) = 𝑎 · 𝑛 · 𝑥𝑛−1
for 𝑓(𝑥) = 𝑥𝑛
and for 𝑓(𝑥) = 𝑎 · 𝑥𝑛 (𝑎 ∈ ℝ, 𝑛 ∈ {1, 2, 3, … })
respectively and polynomials like 𝑎 · 𝑥2 + 𝑏 · 𝑥 + 𝑐 (𝑎, 𝑏
and 𝑐 ∈ ℝ).
Apply the same rule for polynomials
Limitation: formal mathematical notation should be reduced to a minimum
Investigate the general link between graphs of 𝑦 =𝑓 (𝑥) and 𝑦 = 𝑓 ’(𝑥).
Applications of derivatives
Use the derivative to calculate the gradient at a particular coordinate point
Determine an equation of the tangent line at a particular coordinate point.
Write a program which returns the equation of the tangent line at a particular coordinate point.
Use the derivative to calculate the coordinate point given a particular gradient and the equation of a function
Apply derivatives to study the elevation profile of a landscape or of a hike such as maximum gradient of a hill where a tent can be pitched.
Designing a ski jump using a combination of a linear function and a nonlinear function.
2021-01-D-52-en-2 11/58
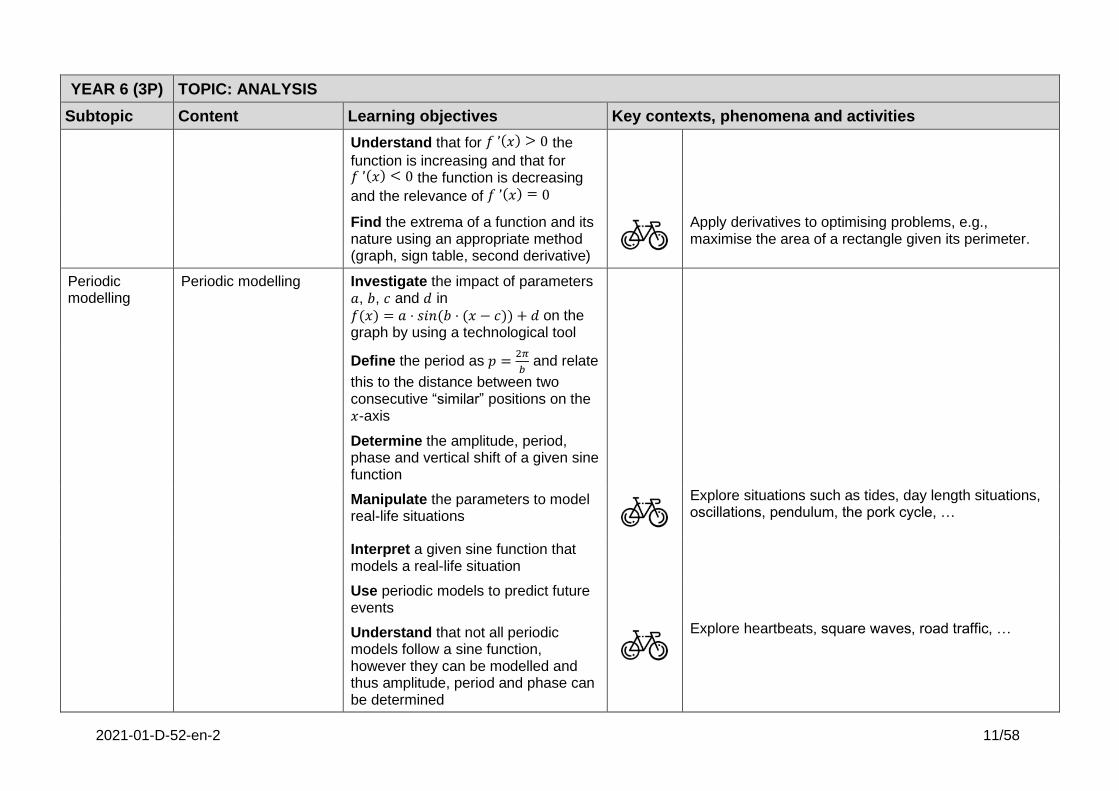
YEAR 6 (3P) TOPIC: ANALYSIS
Subtopic Content Learning objectives Key contexts, phenomena and activities
Understand that for 𝑓 ’(𝑥) > 0 the
function is increasing and that for 𝑓 ’(𝑥) < 0 the function is decreasing
and the relevance of 𝑓 ’(𝑥) = 0
Find the extrema of a function and its nature using an appropriate method (graph, sign table, second derivative)
Apply derivatives to optimising problems, e.g., maximise the area of a rectangle given its perimeter.
Periodic modelling
Periodic modelling Investigate the impact of parameters 𝑎, 𝑏, 𝑐 and 𝑑 in
𝑓(𝑥) = 𝑎 ⋅ 𝑠𝑖𝑛(𝑏 ⋅ (𝑥 − 𝑐)) + 𝑑 on the graph by using a technological tool
Define the period as 𝑝 =2𝜋
𝑏 and relate
this to the distance between two consecutive “similar” positions on the 𝑥-axis
Determine the amplitude, period, phase and vertical shift of a given sine function
Manipulate the parameters to model real-life situations
Explore situations such as tides, day length situations, oscillations, pendulum, the pork cycle, …
Interpret a given sine function that models a real-life situation
Use periodic models to predict future events
Understand that not all periodic models follow a sine function, however they can be modelled and thus amplitude, period and phase can be determined
Explore heartbeats, square waves, road traffic, …

2021-01-D-52-en-2 12/58
YEAR 6 (3P) TOPIC: ANALYSIS
Subtopic Content Learning objectives Key contexts, phenomena and activities
Interpret the rate of change of a
model, e.g., the rate of change of the velocity is the acceleration
• The warming and cooling of an object.
• The recovery time following a physical activity (heart rate).
2021-01-D-52-en-2 13/58
YEAR 6 (3P) TOPIC: STATISTICS AND PROBABILITY
Subtopic Content Learning objectives Key contexts, phenomena and activities
Combinatorics Arrangements of permutations and combinations
Recognise and model situations in combinatorics leading to counting the number of:
• ordered arrangements of length 𝑘 of 𝑛 distinct objects where
repetition is allowed: 𝑛𝑘
e.g., A passcode has 6 digits (0 to 9) which can be repeated. How many different passcodes are there?
• permutations of 𝑛 distinct objects (without repetition): 𝑛!
e.g., How many different ways can the letters in the word MATHS be arranged?
e.g., How many different ways can the letters in the word ADDING be arranged?
• permutations of 𝑘 objects from a set of 𝑛 distinct objects without
repetition: 𝑛!
(𝑛−𝑘)!
e.g., 10 runners are in a race. How many possible 1st, 2nd and 3rd places are there?
• combinations of 𝑘 objects from a set of 𝑛 distinct objects without
repetition: (𝑛𝑘
) =𝑛!
𝑘!(𝑛−𝑘)!
Note: the use of a tree diagram (at least for the two or three first levels of the diagram) is suggested/recommended
e.g., For an upcoming Mathematics competition, a team of 5 members must be chosen from a class of 20. How many different teams could be chosen?
Note: compare this answer with an answer where order of selection mattered, i.e. first chosen is team captain.
2021-01-D-52-en-2 14/58
YEAR 6 (3P) TOPIC: STATISTICS AND PROBABILITY
Subtopic Content Learning objectives Key contexts, phenomena and activities
Calculate the previous numbers of arrangements, permutations and combinations using powers, factorial numbers and the aforementioned formulae
Note: calculations must be done by hand, e.g., using Pascal’s triangle, for the lowest values, or with a technological tool otherwise
Investigate the numbers of possible:
• passwords given a maximal length and a set of allowed characters
• one-dimensional barcode (EAN protocol), ISBN and ISSN
• phone and bank account numbers in different countries
• number plates in different countries
• books layout on a shelf without or with constraint
• ranking or podium at a competition
• results at lotteries in different countries (number of balls and rules are different depending on the population of the country), including the second and higher rank results
• hands in card games
Solve problems including calculations of probabilities using the classical
definition 𝑃(𝐴) =favourable outcomes
total outcomes
regarding numbers of possible arrangements, permutations and combinations and their calculations using a technological tool
Explore and or investigate:
• the size of a group to consider so that two people of
this group have the same birthday is more than 1
2 or
99%
• problems regarding numbers of possible permutations with repetition
• the winnings at a lottery depending on the rank (is there inverse proportionality?)
• poker hand rankings
• the numbers of two-dimensional barcode (QR code/flash code protocol)
• the control codes in simple situations (IBAN, EAN, ISBN, …)
2021-01-D-52-en-2 15/58
YEAR 6 (3P) TOPIC: STATISTICS AND PROBABILITY
Subtopic Content Learning objectives Key contexts, phenomena and activities
Probability Elementary probability Derive the following formulae from a contingency table, tree diagram and Venn diagram
• 𝑃(�̅�) = 1 − 𝑃(𝐴)
• 𝑃(𝐴 ∪ 𝐵) = 𝑃(𝐴) + 𝑃(𝐵) for
𝐴 ∩ 𝐵 = ∅
• 𝑃(𝐴 ∪ 𝐵) = 𝑃(𝐴) + 𝑃(𝐵) − 𝑃(𝐴 ∩ 𝐵)
for 𝐴 ∩ 𝐵 ≠ ∅
• 𝑃𝐵(𝐴) = 𝑃(𝐴|𝐵) =𝑃(𝐴⋂𝐵)
𝑃(𝐵)
Note: the pupil is free to choose the way he/she answers a question using formulae or a diagram
Use data collected from the class, e.g., late or at time at school and transportation mode used to go to school (car, bus, bicycle, ...).
Independent events Identify independent events by using the following:
• 𝑃(𝐴 ∩ 𝐵) = 𝑃(𝐴) ∙ 𝑃(𝐵)
• 𝑃𝐵(𝐴) = 𝑃(𝐴|𝐵) = 𝑃(𝐴)
Bayes’ theorem and total probability law
Understand and apply Bayes’
theorem: 𝑃𝐵(𝐴) = 𝑃(𝐴|𝐵) =𝑃(𝐵|𝐴)∙𝑃(𝐴)
𝑃(𝐵)
for two events 𝐴 and 𝐵 with 𝑃(𝐵) ≠ 0
Limitation: the formula
𝑃(𝐴|𝐵) =𝑃(𝐵|𝐴)∙𝑃(𝐴)
𝑃(𝐵|𝐴)∙𝑃(𝐴)+𝑃(𝐵|�̅�)∙𝑃(�̅�) must not
expressly be known but, with appropriate indications, situations referring to it can be studied
Investigate about disease testing, breath or blood alcohol testing or other type of tests:
• their sensitivities (the ability of these tests to correctly identify the true positive)
• their specificities (the ability of these tests to correctly identify the true negative)
• their accuracies:
(𝑃(true positive) + 𝑃(true negative))
Random variables
Discrete random variables
Understand the concept of a finite discrete random variable and its probabilities
2021-01-D-52-en-2 16/58
YEAR 6 (3P) TOPIC: STATISTICS AND PROBABILITY
Subtopic Content Learning objectives Key contexts, phenomena and activities
Understand, interpret and calculate by hand and with a technological tool, including the use of a spreadsheet, the expected value and the standard deviation of a given discrete random variable, including those following a discrete uniform distribution
Limitation: for calculations by hand, a data set of up to six values
Investigate the winnings expectation value for gambling games.
Compare different games/insurances using expected value and determine if they are fair.
• Review algorithmic and programming notions seen in S5 to calculate the expected value and the standard deviation of a given discrete random variable.
• Write a program which calculates the mean gain when playing several times a certain gambling game.
Bernoulli process Recognise a Bernoulli process, a sequence of Bernoulli trials in which:
• the trials are independent of each other
• there are only two possible outcomes for each trial (success or failure)
• the probability of success is the same for each trial
Calculate the probability of an event, succession of successes and failures, corresponding to a Bernoulli process, using a tree diagram or not
2021-01-D-52-en-2 17/58
YEAR 6 (3P) TOPIC: STATISTICS AND PROBABILITY
Subtopic Content Learning objectives Key contexts, phenomena and activities
Binomial distribution Know that the binomial distribution with parameters 𝑛 and 𝑝 (𝐵(𝑛, 𝑝)) is the discrete probability distribution of a random variable 𝑋 equal to the numbers of successes in a Bernoulli process
Understand the formula
𝑃(𝑋 = 𝑘) = (𝑛𝑘
) · 𝑝𝑘 · (1 − 𝑝)𝑛−𝑘 for a
random variable 𝑋 binomially
distributed with distribution 𝐵(𝑛, 𝑝)
Investigate with a technological tool how varying the parameters effect the symmetricity of the graph of the binomial distribution.
Calculate a probability with the formula
𝑃(𝑋 = 𝑘) = (𝑛𝑘
) · 𝑝𝑘 · (1 − 𝑝)𝑛−𝑘 for a
random variable 𝑋 binomially
distributed with distribution 𝐵(𝑛, 𝑝)
Calculate the probabilities 𝑃(𝑋 ≤ 𝑘), 𝑃(𝑋 ≥ 𝑘) and 𝑃(𝑘 ≤ 𝑋 ≤ 𝑘′) for a random variable 𝑋 binomially
distributed with distribution 𝐵(𝑛, 𝑝) using a technological tool
Investigate numbers of paths in grid problems.
Calculate the expected value and the standard deviation of a given random variable 𝑋 binomially distributed with
distribution 𝐵(𝑛, 𝑝) using the formulae 𝐸(𝑋) = 𝑛 ∙ 𝑝 and
σ(𝑋) = √𝑛 ∙ 𝑝 ∙ (1 − 𝑝)
Investigate under which conditions different distributions give the same expected value.
Modelling with the binomial distribution
Recognise and model situations where binomial distribution can be used
2021-01-D-52-en-2 18/58
YEAR 6 (3P) TOPIC: STATISTICS AND PROBABILITY
Subtopic Content Learning objectives Key contexts, phenomena and activities
Recognise and model situations where binomial distribution can be used as an approximation, i.e. when a small sample is taken by making successive draws from a large population
Explore, using a technological tool, possibly writing a program to simulate such sampling, different situations and quantify the relative error when doing such an approximation.
Calculate corresponding probabilities, the expected value and standard deviation
Overview of models
Linear, quadratic, periodic, exponential and statistical models
Analyse unknown and complex problems and find appropriate models to solve them
Create a categorisation scheme for mathematical models.
Use different types of models to verify or improve the fit to the data
The spread of a virus can be represented by a variety of models. Depending on the basic reproduction number 𝑅, an exponential (𝑅 ≠ 1) or a linear model (𝑅 = 1) will be appropriate. If a second wave occurs, there could be a periodic model. These models could also include dependent and independent events.
Other examples are the stock market or simple weather and climate models.
2021-01-D-52-en-2 19/58
S7 3 Period (3P)
YEAR 7 (3P) TOPIC: ANALYSIS
Subtopic Content Learning objectives Key contexts, phenomena and activities
Exponential and logarithmical functions
The exponential function: 𝑦 = 𝑒𝑥
Know the properties (domain, self-differential function, increasing, limits for 𝑥 → ±∞ and growing phenomena) of the exponential function 𝑦 = 𝑒𝑥, 𝑥 ∈ℝ
Explore the exponential function with the derivative of 𝑎𝑥.
Compare the merits of using the following forms of exponential functions and know how to convert
𝑦 = 𝐾 ∙ 𝑒𝑎·𝑥+𝑏 in 𝑦 = 𝐾 ∙ 𝐴𝑥
The natural logarithm: 𝑦 = ln 𝑥
Know the properties (domain, derivative, increasing and limits for 𝑥 → +∞ and for 𝑥 → 0) of the natural logarithmic function 𝑦 = ln 𝑥, 𝑥 ∈ ℝ>0
Know that the exponential function 𝑦 = 𝑒𝑥
and the natural logarithmic
function 𝑦 = ln 𝑥 are inverse
functions, i.e. 𝑦 = 𝑒𝑥 ⇔ 𝑥 = ln 𝑦
Know how to convert 𝑦 = 𝐾 ∙ 𝐴𝑥 in
𝑦 = 𝐾 ∙ 𝑒𝑎·𝑥
Exponential and logarithmical models
Investigate transformations on the graphs by manipulating the parameters on a technological tool in following formulae:
• 𝑦 = 𝑘 ∙ 𝑒𝑎(𝑥+𝑏)
• 𝑦 = 𝑘 ∙ ln (𝑎(𝑥 + 𝑏))
Investigate how the parameters can transform the exponential growth and is it possible to “flatten the curve”?
2021-01-D-52-en-2 20/58
YEAR 7 (3P) TOPIC: ANALYSIS
Subtopic Content Learning objectives Key contexts, phenomena and activities
Calculate from the parameters of an exponential model the rate of growth/decay using a technological tool
Discover that something cannot grow or decay infinitely
Discuss why on an island it can only support a certain amount of life.
Create an exponential model that has realistic limits.
Solve exponential or logarithmical equations using a technological tool (graphing software or CAS)
Calculating the population growth rates, compound interest, depreciation of assets.
Identify increasing or decreasing phenomena of evolution according to an exponential or logarithmic model and apply to practical problems
Investigate why, when using growth models, one can use a logarithmic scale to easily plot data, e.g., for the infection rates in a pandemic.
Area under a graph
Area through approximation
Define
𝑓(𝑥) ∙ 1 + 𝑓(𝑥 + 1) ∙ 1 + 𝑓(𝑥 + 2) ∙ 1 as
an approximation by left sided rectangles of the area bounded by a non-negative function 𝑓 and the 𝑥-axis
from 𝑥 to 𝑥 + 3 with each rectangle
having a width of 1
Investigate why would it be useful to find the area under a graph. One example could be to look at velocity-time graphs, find the area and discuss what this relates to.
Investigate with a technological tool the effect ℎ has on approximating the
area bounded by a non-negative function 𝑓 and the 𝑥-axis from 𝑥 to
𝑥 + 𝑛 · ℎ, 𝑛 ∈ ℕ, ℎ ∈ ℝ>0, given by
Investigate the approximate area depending on whether the function is increasing or decreasing.
2021-01-D-52-en-2 21/58
YEAR 7 (3P) TOPIC: ANALYSIS
Subtopic Content Learning objectives Key contexts, phenomena and activities
𝑓(𝑥) ∙ ℎ + 𝑓(𝑥 + ℎ) ∙ ℎ + ⋯
+𝑓(𝑥 + (𝑛 − 1) · ℎ) ∙ ℎ
each rectangle having a width of ℎ
Note: to keep integer values of 𝑛 and ℎ,
one can focus on values so that 𝑛 · ℎ = 6
Investigate if other shapes and methods, e.g., triangles or right sided or centred rectangles or trapeziums, could give an even better approximation of the area.
Note: the use of triangles could be used to derive equations found when calculating a primitive function and thus give pupils a better understanding.
• Compare the approximate value with the exact area given by a CAS calculation.
• Write a program, using a technological tool, that gives approximate area values for one or several methods (for example comparing rectangles or trapeziums and varying the number 𝑛 of shapes), thus revisiting the S5 algorithm and programming notions.
Define the area bounded by a non-negative function 𝑓 and the 𝑥-axis
from 𝑥 = 𝑎 to 𝑥 = 𝑏 as ∫ 𝑓(𝑥)𝑑𝑥𝑏
𝑎
Integral calculus
Primitive function and indefinite integral
Investigate the relationship between derivative and primitive functions
Understand the primitive function is the antiderivative and how this function relates to the area function with regards to the indefinite integral.
Determine, with a technological tool, a primitive function for the following types of functions:
Use a digital tool to explore the primitive functions of other types of function.
2021-01-D-52-en-2 22/58
YEAR 7 (3P) TOPIC: ANALYSIS
Subtopic Content Learning objectives Key contexts, phenomena and activities
• 𝑦 = 𝑃(𝑥) with 𝑃 polynom
• 𝑦 = 𝑘 ∙ 𝑒𝑎·𝑥+𝑏
• 𝑦 =𝑘
𝑎·𝑥+𝑏
where 𝑎, 𝑏 and 𝑘 ∈ ℝ, 𝑎 ≠ 0 and
𝑘 ≠ 0
Definite integral Know that the definite integral gives the area bounded by the graph of a non-negative function 𝑓 and the 𝑥-axis
from 𝑥 = 𝑎 to 𝑥 = 𝑏 through
𝐹(𝑏) − 𝐹(𝑎),
thus ∫ 𝑓(𝑥)𝑑𝑥𝑏
𝑎= 𝐹(𝑏) − 𝐹(𝑎)
Interpret the following integrals geometrically for a non-negative function 𝑓 and 𝑎 < 𝑏 < 𝑐:
• ∫ 𝑓(𝑥)𝑑𝑥𝑎
𝑎= 0
• ∫ 𝑓(𝑥)𝑑𝑥 + ∫ 𝑓(𝑥)𝑑𝑥 = ∫ 𝑓(𝑥)𝑑𝑥𝑐
𝑎
𝑐
𝑏
𝑏
𝑎
• ∫ 𝑘 ∙ 𝑓(𝑥)𝑑𝑥 = 𝑘 ∙ ∫ 𝑓(𝑥)𝑑𝑥𝑏
𝑎
𝑏
𝑎 ,
𝑘 ∈ ℝ>0
2021-01-D-52-en-2 23/58
YEAR 7 (3P) TOPIC: ANALYSIS
Subtopic Content Learning objectives Key contexts, phenomena and activities
Know how to determine an area bounded by:
• the graph of a function which takes positive and negative values by dividing the interval into several intervals where the function has a constant sign
• the graphs of two functions by dividing the interval into several intervals where the difference between the functions has a constant sign
from 𝑥 = 𝑎 to 𝑥 = 𝑏
Investigate the effect that an area below the 𝑥-axis has on the total area. Ask pupils: “Which context(s) does it make sense to make this area positive?”
Calculate areas with a technological tool for one or a combination of the following types of functions:
• 𝑦 = 𝑃(𝑥) with 𝑃 polynom
• 𝑦 = 𝑘 ∙ 𝑒𝑎·𝑥+𝑏
• 𝑦 =𝑘
𝑎·𝑥+𝑏
where 𝑎, 𝑏 and 𝑘 ∈ ℝ, 𝑎 ≠ 0 and 𝑘 ≠ 0
Calculate areas with a technological tool using one of the following formulae:
• ∫ |𝑓(𝑥)|𝑑𝑥𝑏
𝑎
• ∫ |𝑓(𝑥) − 𝑔(𝑥)|𝑑𝑥𝑏
𝑎
depending on the case
2021-01-D-52-en-2 24/58
YEAR 7 (3P) TOPIC: ANALYSIS
Subtopic Content Learning objectives Key contexts, phenomena and activities
Integral calculus as a tool
Use integral calculus as a tool for solving practical problems and/or verifying results such as:
• those relating to displacement, velocity and acceleration (from displacement to velocity and acceleration and vice versa)
• those relating to finding out the total amount of a quantity given its rate of change
• calculating arc lengths and volume of solids of revolutions
Note: relevant formulae must be provided
• Model a journey with variable velocity to:
o create a function of velocity with respect to time
o find the acceleration and the displacement
o plot all the functions on the same axis using a technological tool
o make comparisons
• Explore the quantity of water given the flow rate.
Investigate the volume of revolution of an object using appropriate CAD software design and 3D printing; the calculations can be verified using integral calculus.
2021-01-D-52-en-2 25/58
YEAR 7 (3P) TOPIC: STATISTICS AND PROBABILITY
Subtopic Content Learning objectives Key contexts, phenomena and activities
Bivariate statistics
Visualization Draw a scatter diagram as a visualization of a bivariate data set
Add the mean point to a scatter diagram
Correlation Interpret a scatter diagram in terms of a possible relationship between the variables
Know the difference between correlation and causality
Investigate examples in which correlation and causality are misused.
Regression Understand the idea of fitting a model to a bivariate data set
Note: different types of regressions can be mentioned here
Modelling with a linear function
Investigate with a technological tool the relevance of a linear 𝑦 = 𝑚 · 𝑥 + 𝑝
fitting depending on the values of 𝑚 and 𝑝
Understand the meaning of the Pearson correlation coefficient 𝑟, calculate it with a technological tool and interpret the result in terms of a strong or weak, positive or negative relationship
Use a spreadsheet to:
• enter bivariate data
• draw a scatter diagram
• plot the mean point
• draw least square regression line
• calculate 𝑟
2021-01-D-52-en-2 26/58
YEAR 7 (3P) TOPIC: STATISTICS AND PROBABILITY
Subtopic Content Learning objectives Key contexts, phenomena and activities
Apply linear regression to real-life problems
One could explore the scatter diagram of (𝑋, ln 𝑌) or (ln 𝑋 , 𝑌) to find a linear regression.
Investigate the relevance of a linear regression by using 𝑟
Use a linear regression, if relevant, to make interpolations, extrapolations and forecasts
Investigate the limits of extrapolation linked to the fact that a model often only applies on a certain time frame.
Random variables
Continuous random variables
Understand the concept of a continuous random variable and its probabilities calculated using integrals
• Investigate the probability to get randomly:
o a precise value between 0 and 1
o a value between two other fixed values between 0 and 1
if all numbers have same probability to be chosen.
• Investigate the probability to get randomly:
o a pupil of the school having a precise age, down to the second
o a pupil of the school having an age between two other fixed values
if all pupils have same probability to be chosen.
Modelling with the normal distribution
Recognise that many data sets can be modelled by a normal distribution characterised by its expected value and standard deviation
Limitation: neither development about this result nor explanations about the central limit theorem must be done
• Use data collected from the class or the school (marks at a test or an exam, difference between the marks of the two correctors at the ES baccalaureate, …).
• Represent data as a dot plot and, by manipulating a graph of a normal distribution curve, find an appropriate fit.
2021-01-D-52-en-2 27/58
YEAR 7 (3P) TOPIC: STATISTICS AND PROBABILITY
Subtopic Content Learning objectives Key contexts, phenomena and activities
Know that for a random variable 𝑋 following a normal distribution with expected value 𝜇 and standard deviation 𝜎 (empirical rule):
• 𝑃(𝜇 − 𝜎 ≤ 𝑋 ≤ 𝜇 + 𝜎) ≈ 0.68
• 𝑃(𝜇 − 2𝜎 ≤ 𝑋 ≤ 𝜇 + 2𝜎) ≈ 0.95
• 𝑃(𝜇 − 3𝜎 ≤ 𝑋 ≤ 𝜇 + 3𝜎) ≈ 0.997
Calculate, using a technological tool, for a random variable 𝑋 following a normal distribution with given expected value 𝜇 and standard
deviation 𝜎:
• 𝑃(𝑋 ≤ 𝑏)
• 𝑃(𝑎 ≤ 𝑋)
• 𝑃(𝑎 ≤ 𝑋 ≤ 𝑏)
• 𝑎 if 𝑃(𝑋 ≤ 𝑎) = 𝑘 is given
• Investigate for which values of 𝑛 and 𝑝 the scatter plot of the points corresponding to a binomial distribution 𝐵(𝑛, 𝑝) fits to the density function
corresponding to the normal distribution 𝑁(𝜇, 𝜎2)
with 𝜇 = 𝑛 · 𝑝 and 𝜎 = √𝑛 · 𝑝 · (1 − 𝑝).
Note: the choice of the conditions for a good
approximation regarding 𝑛 and 𝑝 is arbitrary; one will find different criteria in the literature.
• Model various continuous random variables (including the normal distribution) using integral calculus to determine the probability.
Null hypothesis significance testing (NHST) procedure
Understand and use the NHST procedure, including:
• creating a null hypothesis H0 for a proportion 𝑝 (𝑝 = 𝑎) and an (one-tailed, left and right sided) alternative hypothesis 𝐻1 (or 𝐻𝑎) (𝑝 = 𝑏)
• defining the test statistic
• determining the critical value and region
• Investigate two-tailed alternative hypothesis, including for a mean value 𝜇.
• Determine the critical value and region for a given significance level (5% or 1%).
2021-01-D-52-en-2 28/58
YEAR 7 (3P) TOPIC: STATISTICS AND PROBABILITY
Subtopic Content Learning objectives Key contexts, phenomena and activities
• accepting or rejecting the null hypothesis H0 based on the test statistic’s critical value
• calculating the type 1 (significance level) and type 2 errors
• understanding the impact of the critical value on the outcome of the test
Conduct, using a technological tool, a test according to the NHST procedure applied to a real-life problem situation
Limitation: binomial and normal distributions are the only ones to be considered
Interpret and analyse the outcomes from the above test

2021-01-D-52-en-2 29/58
5. Assessment
For each level there are attainment descriptors written by the competences, which give an idea of the level that pupils have to reach. They also give an idea of the kind of assessments that can be done.
With the competences are verbs that give an idea of what kind of assessment can be used to assess that goal. In the table with learning objectives these verbs are used and put bold, so there is a direct link between the competences and the learning objectives.
Assessing content knowledge can be done by written questions where the pupil has to respond on. Partly that can be done by multiple choice but competences as constructing explanations and engaging in argument as well as the key competences as communication and mathematical competence need open questions or other ways of assessing.
An assignment where pupils have to use their factual knowledge to make an article or poster about a (broader) subject can be used to also judge the ability to critically analyse data and use concepts in unfamiliar situations and communicate logically and concisely about the subject.
In Europe (and America) pupils must have some competence in designing and/or engineering (STEM education). So there has to be an assessment that shows the ability in designing and communicating. A design assessment can also show the ability in teamwork.
Pupils have to be able to do an (experimental) inquiry. An (open) inquiry should be part of the assessments. Assessing designing and inquiry can be combined with other subjects or done by one subject, so pupils are not obliged to do too many designing or open inquiry just for assessment at the end of a year.
Digital competence can be assessed by working with spreadsheets, gathering information from internet, measuring data with measuring programs and hardware, modelling theory on the computer and comparing the outcomes of a model with measured data. Do combine this with other assessments where this competence is needed.
Assessment is formative when either formal or informal procedures are used to gather evidence of learning during the learning process and are used to adapt teaching to meet pupil needs. The process permits teachers and pupils to collect information about pupil progress and to suggest adjustments to the teacher’s approach to instruction and the pupil’s approach to learning.
Assessment is summative when it is used to evaluate pupil learning at the end of the instructional process or of a period of learning. The purpose is to summarise the pupils’ achievements and to determine whether, and to what degree, the pupils have demonstrated understanding of that learning.
S7 final baccalaureate mark in mathematics
The S7 3 Period course is to not only to be assessed using the written baccalaureate exam (BAC) and pre-baccalaureate exam (preBAC) but also continuous teacher assessment using the various competences. These continuous, formative assessments do not need to follow the format of the Baccalaureate exam but can vary in type and structure.
The preBAC and BAC exams on the other hand will be very similar in structure, although only the BAC will be written centrally, while the preBACs will be harmonised within each school. This means that all topics from S6 up to the time of the preBAC could potentially be included and the

2021-01-D-52-en-2 30/58
guidelines for the number and style of questions in the BAC should apply to the preBAC. In requiring the preBAC to mirror the structure of the BAC, as described below, pupils are assured that the preBACs are comparable between European schools, as well as within each school.
To achieve the highest marks, higher order thinking skills will be required to fully answer the papers. Pupils should be prepared to meet a small number of questions that have an unfamiliar format and require more abstract problem solving and interpretation skills. It is also possible that a single question might require skills and knowledge from several topics. Although all topics in the syllabus will be covered, the proportion of each topic is not fixed. Questions may contain sub-questions. Pupils are encouraged to attempt to solve all questions, so that they can demonstrate a wide variety of skills throughout the exam. Partial solution can be allowed some marks.
Whilst the exact weighting of the competencies is not stipulated, they should follow a similar weighting to those provided in the sample papers found in Annex 4, of this document, and certainly each competency should be examined in the written BAC.
Information pertinent to the 3 Period written BAC
The written BAC will be of two parts, part with and part without a technological tool. They are both 120 minutes in length and both carry the same weighting.
For both parts of the written BAC, questions are written with the key verbs highlighted. This helps pupils structure their solutions based on the particular competency.
The part without the technological tool will consist of 10 questions each worth 5 marks for a total of 50 marks. One of the questions in this part could be a multiple choice or similar where pupils are asked to identify an answer. Each of these questions is on a particular topic and is more concerned with the processes taught in the syllabus. All topics of the S6 and S7 syllabus should be covered within this part.
All questions must be independent, and it must be clear for each mark, where it refers to. Thus, it must be possible for the pupil to achieve every single mark and it must be avoided for example, to give more than one mark for a single result.
The part with the technological tool will consist of two long questions each worth 25 marks for a total of 50 marks. These long, structured questions allow pupils to explore a given context in more depth using a variety and quite possibly all the different topics covered in the S6 and S7 syllabus within a single long question. The technological tool will need to be used to fully answer this paper, though this does not exclude the possibility that some questions could be fully answered without the use of the tool.
With a competency-based curriculum the hope is that pupils over a period of the course have generated a way of answering questions in different ways depending on how the pupil has interpreted the question. Thus, solutions provided are only suggested solutions and it is up to the marker’s discretion to take into account a variety of appropriate solutions.
For all assessment, the marking scale of the European schools shall be used, as described in “Marking system of the European schools: Guidelines for use” (Ref.: 2017-05-D-29-en-7).
2021-01-D-52-en-2 31/58
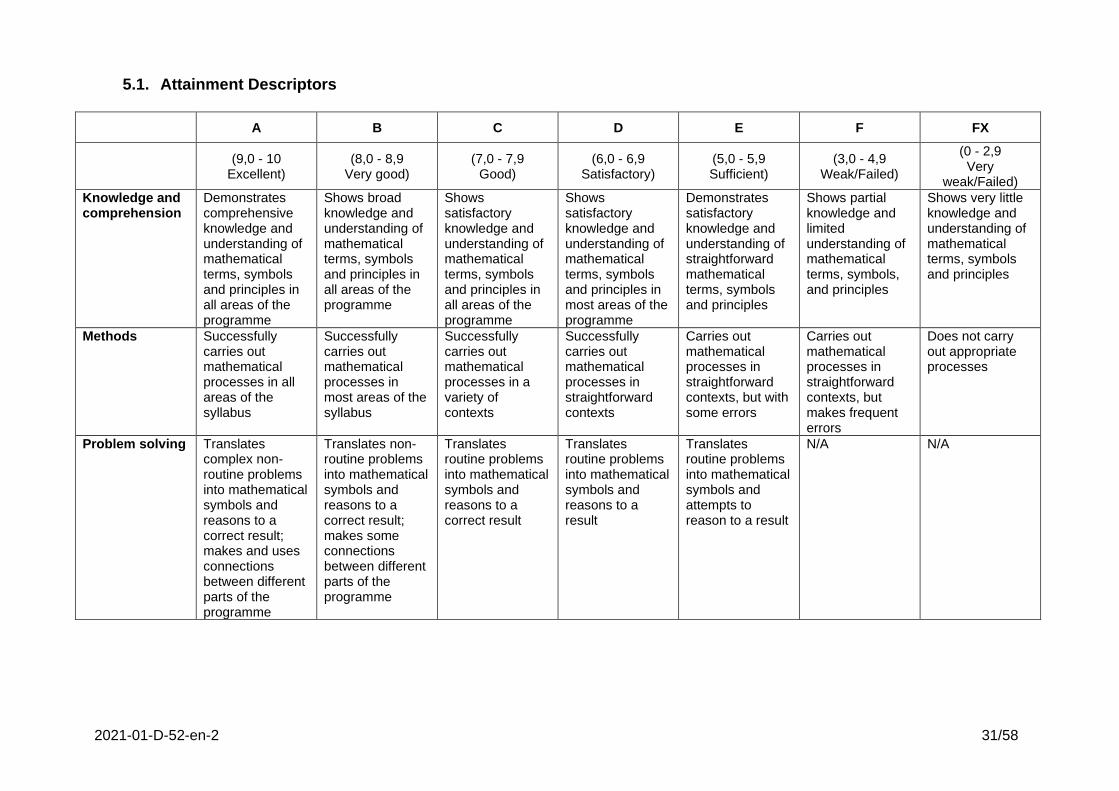
5.1. Attainment Descriptors
A B C D E F FX
(9,0 - 10
Excellent) (8,0 - 8,9
Very good) (7,0 - 7,9
Good) (6,0 - 6,9
Satisfactory) (5,0 - 5,9 Sufficient)
(3,0 - 4,9 Weak/Failed)
(0 - 2,9 Very
weak/Failed)
Knowledge and comprehension
Demonstrates comprehensive knowledge and understanding of mathematical terms, symbols and principles in all areas of the programme
Shows broad knowledge and understanding of mathematical terms, symbols and principles in all areas of the programme
Shows satisfactory knowledge and understanding of mathematical terms, symbols and principles in all areas of the programme
Shows satisfactory knowledge and understanding of mathematical terms, symbols and principles in most areas of the programme
Demonstrates satisfactory knowledge and understanding of straightforward mathematical terms, symbols and principles
Shows partial knowledge and limited understanding of mathematical terms, symbols, and principles
Shows very little knowledge and understanding of mathematical terms, symbols and principles
Methods Successfully carries out mathematical processes in all areas of the syllabus
Successfully carries out mathematical processes in most areas of the syllabus
Successfully carries out mathematical processes in a variety of contexts
Successfully carries out mathematical processes in straightforward contexts
Carries out mathematical processes in straightforward contexts, but with some errors
Carries out mathematical processes in straightforward contexts, but makes frequent errors
Does not carry out appropriate processes
Problem solving Translates complex non-routine problems into mathematical symbols and reasons to a correct result; makes and uses connections between different parts of the programme
Translates non-routine problems into mathematical symbols and reasons to a correct result; makes some connections between different parts of the programme
Translates routine problems into mathematical symbols and reasons to a correct result
Translates routine problems into mathematical symbols and reasons to a result
Translates routine problems into mathematical symbols and attempts to reason to a result
N/A N/A
2021-01-D-52-en-2 32/58
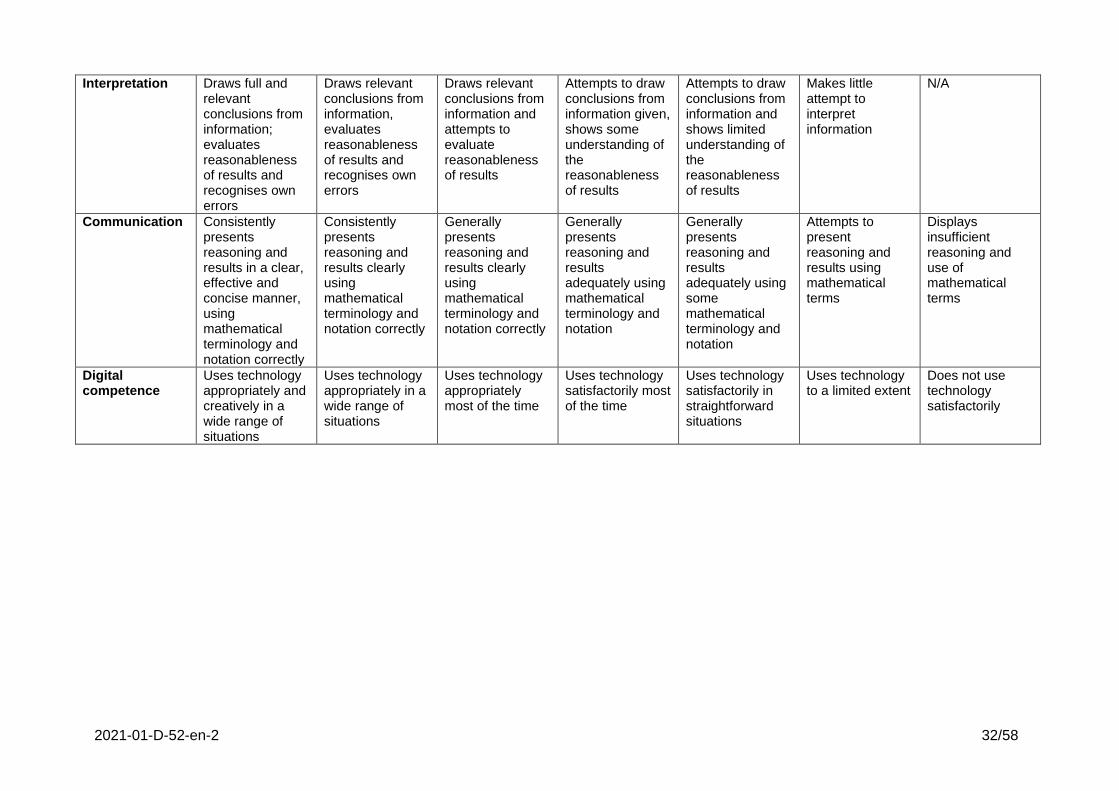
Interpretation Draws full and relevant conclusions from information; evaluates reasonableness of results and recognises own errors
Draws relevant conclusions from information, evaluates reasonableness of results and recognises own errors
Draws relevant conclusions from information and attempts to evaluate reasonableness of results
Attempts to draw conclusions from information given, shows some understanding of the reasonableness of results
Attempts to draw conclusions from information and shows limited understanding of the reasonableness of results
Makes little attempt to interpret information
N/A
Communication Consistently presents reasoning and results in a clear, effective and concise manner, using mathematical terminology and notation correctly
Consistently presents reasoning and results clearly using mathematical terminology and notation correctly
Generally presents reasoning and results clearly using mathematical terminology and notation correctly
Generally presents reasoning and results adequately using mathematical terminology and notation
Generally presents reasoning and results adequately using some mathematical terminology and notation
Attempts to present reasoning and results using mathematical terms
Displays insufficient reasoning and use of mathematical terms
Digital competence
Uses technology appropriately and creatively in a wide range of situations
Uses technology appropriately in a wide range of situations
Uses technology appropriately most of the time
Uses technology satisfactorily most of the time
Uses technology satisfactorily in straightforward situations
Uses technology to a limited extent
Does not use technology satisfactorily
2021-01-D-52-en-2 33/58
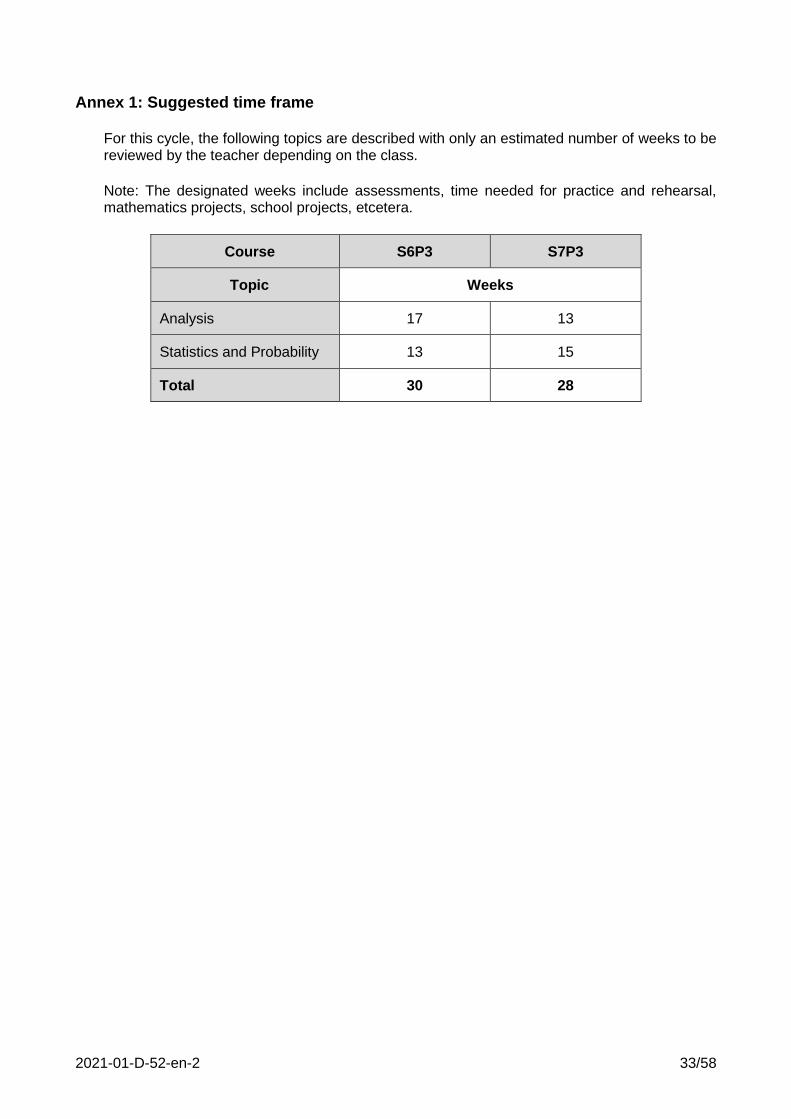
Annex 1: Suggested time frame
For this cycle, the following topics are described with only an estimated number of weeks to be reviewed by the teacher depending on the class.
Note: The designated weeks include assessments, time needed for practice and rehearsal, mathematics projects, school projects, etcetera.
Course S6P3 S7P3
Topic Weeks
Analysis 17 13
Statistics and Probability 13 15
Total 30 28
2021-01-D-52-en-2 34/58
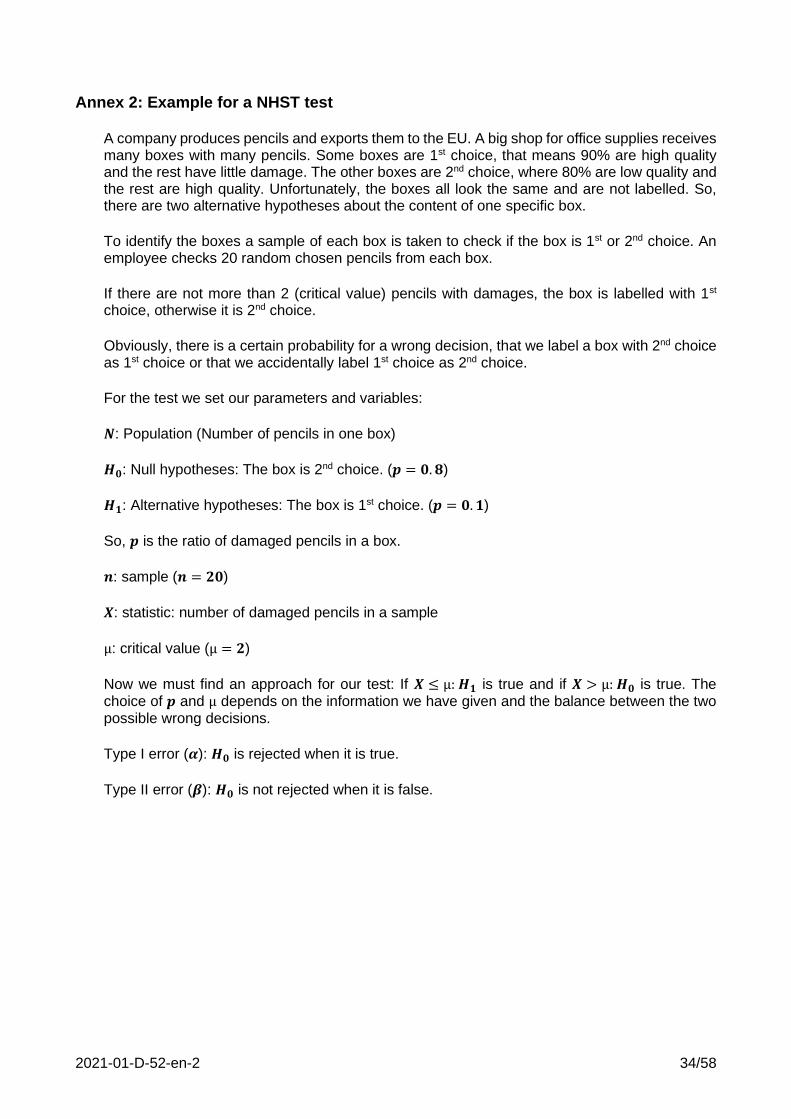
Annex 2: Example for a NHST test
A company produces pencils and exports them to the EU. A big shop for office supplies receives many boxes with many pencils. Some boxes are 1st choice, that means 90% are high quality and the rest have little damage. The other boxes are 2nd choice, where 80% are low quality and the rest are high quality. Unfortunately, the boxes all look the same and are not labelled. So, there are two alternative hypotheses about the content of one specific box.
To identify the boxes a sample of each box is taken to check if the box is 1st or 2nd choice. An employee checks 20 random chosen pencils from each box.
If there are not more than 2 (critical value) pencils with damages, the box is labelled with 1st choice, otherwise it is 2nd choice.
Obviously, there is a certain probability for a wrong decision, that we label a box with 2nd choice as 1st choice or that we accidentally label 1st choice as 2nd choice.
For the test we set our parameters and variables:
𝑵: Population (Number of pencils in one box)
𝑯𝟎: Null hypotheses: The box is 2nd choice. (𝒑 = 𝟎. 𝟖)
𝑯𝟏: Alternative hypotheses: The box is 1st choice. (𝒑 = 𝟎. 𝟏)
So, 𝒑 is the ratio of damaged pencils in a box.
𝒏: sample (𝒏 = 𝟐𝟎)
𝑿: statistic: number of damaged pencils in a sample
µ: critical value (µ = 𝟐)
Now we must find an approach for our test: If 𝑿 ≤ µ: 𝑯𝟏 is true and if 𝑿 > µ: 𝑯𝟎 is true. The choice of 𝒑 and µ depends on the information we have given and the balance between the two possible wrong decisions.
Type I error (𝜶): 𝑯𝟎 is rejected when it is true.
Type II error (𝜷): 𝑯𝟎 is not rejected when it is false.

2021-01-D-52-en-2 35/58
Annex 3: Sample BAC papers, solutions and matrix
The following pages include:
• Sample BAC without Tool
• Sample BAC without Tool solutions
• Sample BAC with Tool
• Sample BAC with Tool solutions
• Sample BAC Competency Matrix
o Without Tool
o With Tool
2021-01-D-52-en-2 36/58
DATE: DD/MM/YYYY
DURATION OF THE EXAMINATION: 120 minutes
EXAMINATION WITHOUT TECHNOLOGICAL TOOL
AUTHORISED MATERIAL:
Formula Booklet
Notes:
• As this is a sample paper the cover page is likely to change.
• This sample paper should only be used to see how questions can be created from the syllabus
focusing on competences rather than strictly on content.
• The keywords found in the syllabus are highlighted in bold to help the candidate see which
competency the question is focusing on and thus helping in answering the question.
MATHEMATICS 3 PERIODS
PART A
2021-01-D-52-en-2 37/58
PART A
Page 1/4 Marks
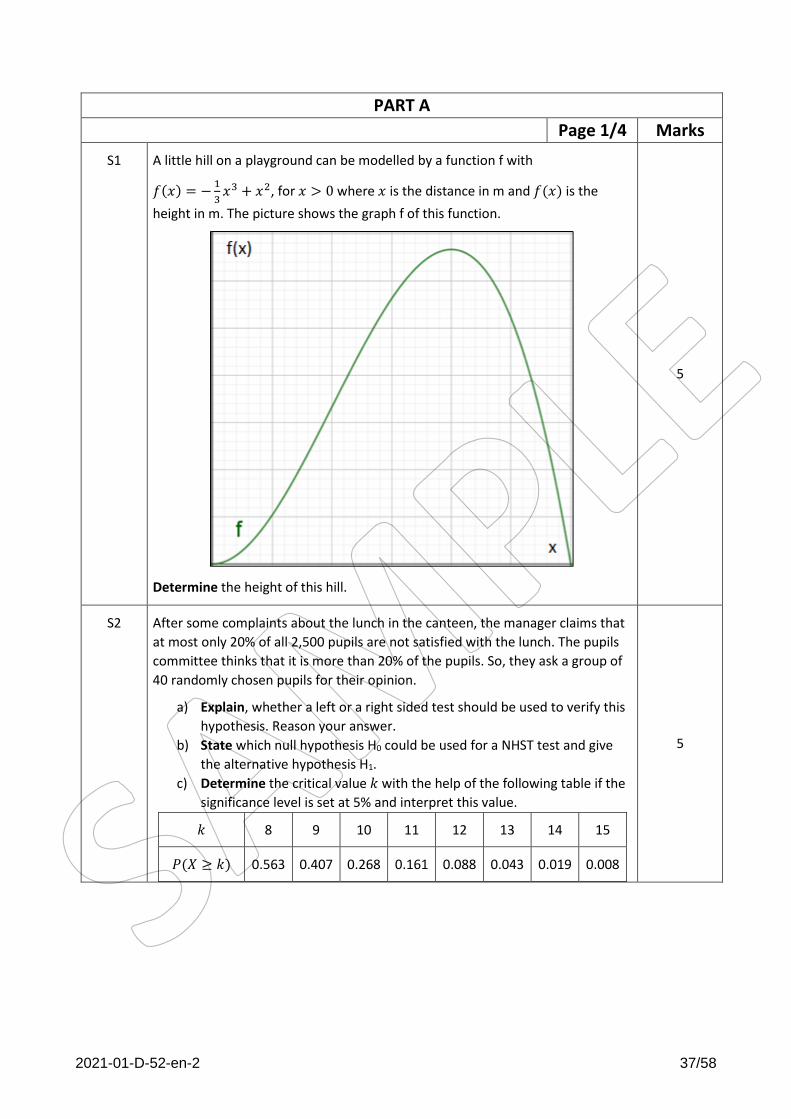
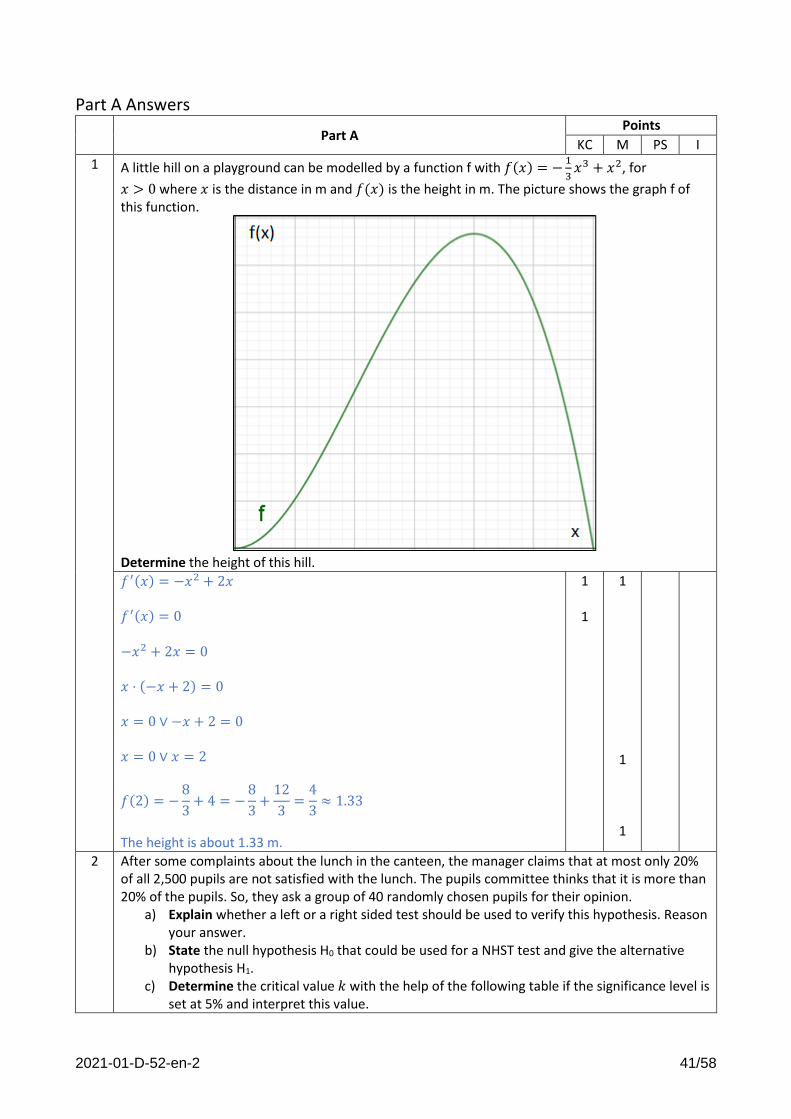
S1 A little hill on a playground can be modelled by a function f with
𝑓(𝑥) = −1
3𝑥3 + 𝑥2, for 𝑥 > 0 where 𝑥 is the distance in m and 𝑓(𝑥) is the
height in m. The picture shows the graph f of this function.
Determine the height of this hill.
5
S2 After some complaints about the lunch in the canteen, the manager claims that
at most only 20% of all 2,500 pupils are not satisfied with the lunch. The pupils
committee thinks that it is more than 20% of the pupils. So, they ask a group of
40 randomly chosen pupils for their opinion.
a) Explain, whether a left or a right sided test should be used to verify this
hypothesis. Reason your answer.
b) State which null hypothesis H0 could be used for a NHST test and give
the alternative hypothesis H1.
c) Determine the critical value 𝑘 with the help of the following table if the
significance level is set at 5% and interpret this value.
𝑘 8 9 10 11 12 13 14 15
𝑃(𝑋 ≥ 𝑘) 0.563 0.407 0.268 0.161 0.088 0.043 0.019 0.008
5
2021-01-D-52-en-2 38/58
PART A
Page 2/4 Marks
S3 A small supermarket chain employs 900 people, 10 of them work in the
management, but only one of the managers is female. The other 809 women
work in the shops.
Show, that it depends on the sex, if you get a position in the management of
this company.
5
S4 A couple needs a negative Covid test to visit friends abroad. It is known that 20
% of the tests show a negative result, although the person could be infected
(false negative result). The probability of a false positive result is close to zero. It
can be assumed that if one of them is infected, that the other one is also
infected.
Explain, why this situation is a Bernoulli process and show, that the probability
of a false negative result drops down to 4 % when both get tested.
5
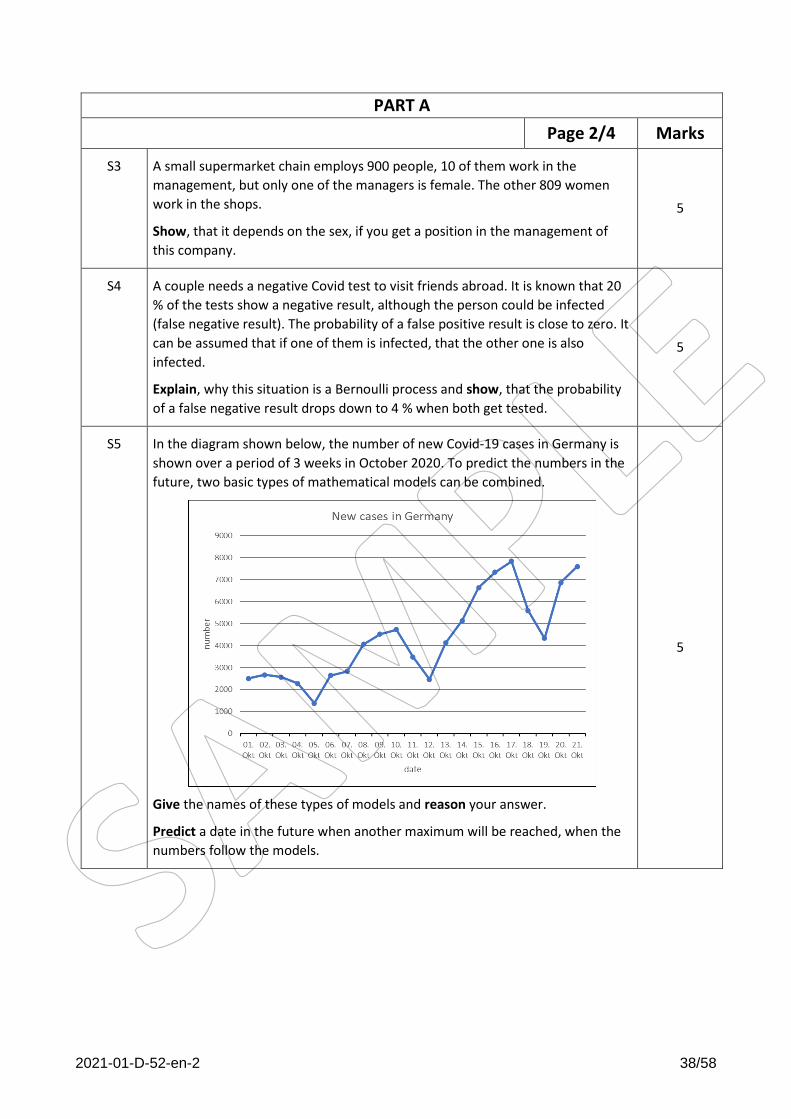
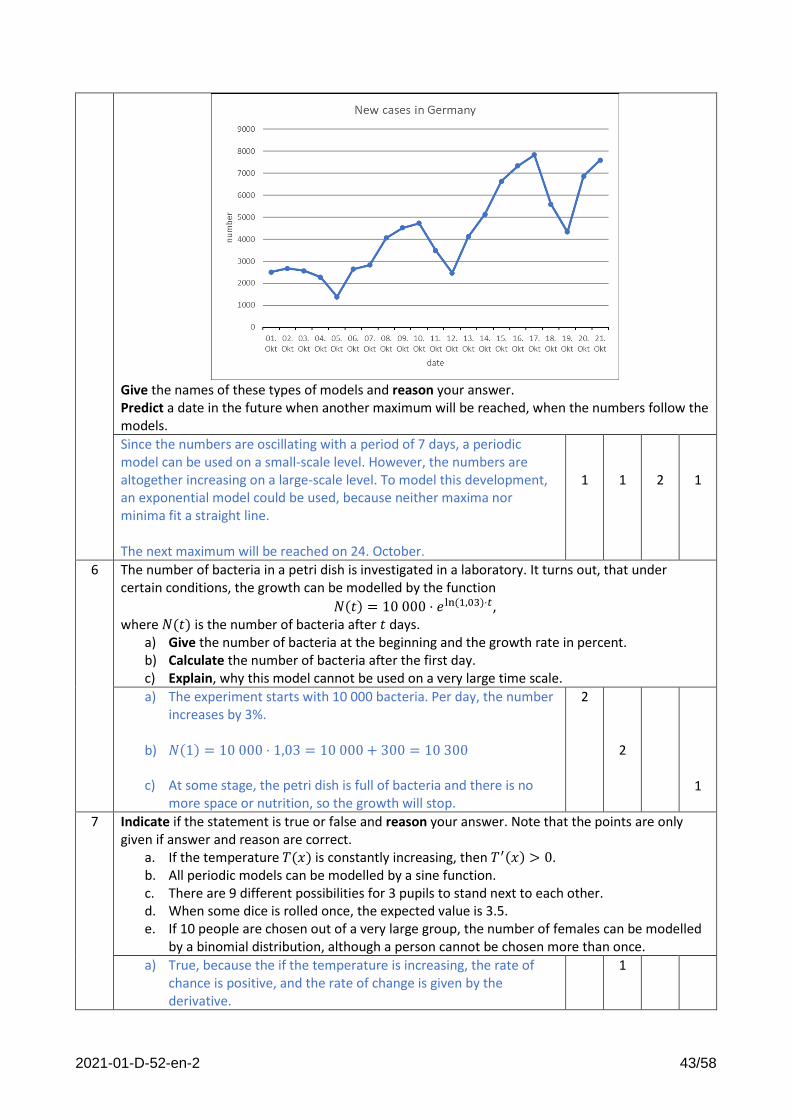
S5 In the diagram shown below, the number of new Covid-19 cases in Germany is
shown over a period of 3 weeks in October 2020. To predict the numbers in the
future, two basic types of mathematical models can be combined.
Give the names of these types of models and reason your answer.
Predict a date in the future when another maximum will be reached, when the
numbers follow the models.
5
2021-01-D-52-en-2 39/58
PART A
Page 3/4 Marks
S6 The number of bacteria in a petri dish is investigated in a laboratory. It turns
out, that under certain conditions, the growth can be modelled by the function
𝑁(𝑡) = 10 000 ⋅ 𝑒ln(1,03)⋅𝑡,
where 𝑁(𝑡) is the number of bacteria after 𝑡 days.
a) Give the number of bacteria at the beginning and the growth rate in
percent.
b) Calculate the number of bacteria after the first day.
c) Explain, why this model cannot be used on a very large time scale.
5
S7 Indicate if the statement is true or false and reason your answer. Note that the
points are only given if answer and reason are correct.
a) If the temperature 𝑇(𝑥) is constantly increasing, then 𝑇′(𝑥) > 0.
b) All periodic models can be modelled by a sine function.
c) There are 9 different possibilities for 3 pupils to stand next to each
other.
d) When some dice is rolled once, the expected value is 3.5.
e) If 10 people are chosen out of a very large group, the number of females
can be modelled by a binomial distribution, although a person cannot be
chosen more than once.
5
S8 The daylength 𝐿(𝑡) in hours on a certain location was recorded over one year. It
can be modelled by the function
𝐿(𝑡) = 4 ⋅ sin (2𝜋
365𝑥) + 12,
where 𝑡 is the time in days.
Interpret the outcome of ∫ 𝐿(𝑡)𝑑𝑡 365
0and explain, why the result is equal to
12 ⋅ 365 = 4380.
5
S9 a) Interpret what is meant by expected value of a random variable.
b) 𝑋 is a random variable following a normal distribution with expected
value μ and standard deviation σ.
Give a probability taking into account these two characteristic values μ
and σ.
c) A continuous random variable 𝑌 defined over ℝ is such that
𝑃(𝑎 ≤ 𝑦 ≤ 𝑏) = ∫ 𝑓(𝑧)𝑑𝑧𝑏
𝑎.
Explain why ∫ 𝑓(𝑧)𝑑𝑧 = 1+∞
−∞.
5

2021-01-D-52-en-2 40/58
PART A
Page 4/4 Marks
S10 A new machine recognises doping in blood. Let there be the following two
events:
• P: The test is positive
• D: The sportsman was doped
After some test runs it was found out, that out of 100 blood samples with
doping, the machine recognises it in 90 cases. However, it also gives a false
alarm in 5% of the cases, when the sample was clean. It can be assumed, that
every 10th sportsman at a certain event is doped.
We want to find out the probability that a sportsman was indeed doped when
the test is positive.
a) Present all necessary information in the correct mathematical notation.
b) Use an appropriate method to determine the probability for a banknote
to be false when the machine gives an alarm.
5
2021-01-D-52-en-2 41/58
Part A Answers
Part A Points
KC M PS I
1 A little hill on a playground can be modelled by a function f with 𝑓(𝑥) = −1
3𝑥3 + 𝑥2, for
𝑥 > 0 where 𝑥 is the distance in m and 𝑓(𝑥) is the height in m. The picture shows the graph f of this function.
Determine the height of this hill.
𝑓′(𝑥) = −𝑥2 + 2𝑥 𝑓′(𝑥) = 0 −𝑥2 + 2𝑥 = 0 𝑥 ⋅ (−𝑥 + 2) = 0 𝑥 = 0 ∨ −𝑥 + 2 = 0 𝑥 = 0 ∨ 𝑥 = 2
𝑓(2) = −8
3+ 4 = −
8
3+
12
3=
4
3≈ 1.33
The height is about 1.33 m.
1
1
1
1
1
2 After some complaints about the lunch in the canteen, the manager claims that at most only 20% of all 2,500 pupils are not satisfied with the lunch. The pupils committee thinks that it is more than 20% of the pupils. So, they ask a group of 40 randomly chosen pupils for their opinion.
a) Explain whether a left or a right sided test should be used to verify this hypothesis. Reason your answer.
b) State the null hypothesis H0 that could be used for a NHST test and give the alternative hypothesis H1.
c) Determine the critical value 𝑘 with the help of the following table if the significance level is set at 5% and interpret this value.
2021-01-D-52-en-2 42/58
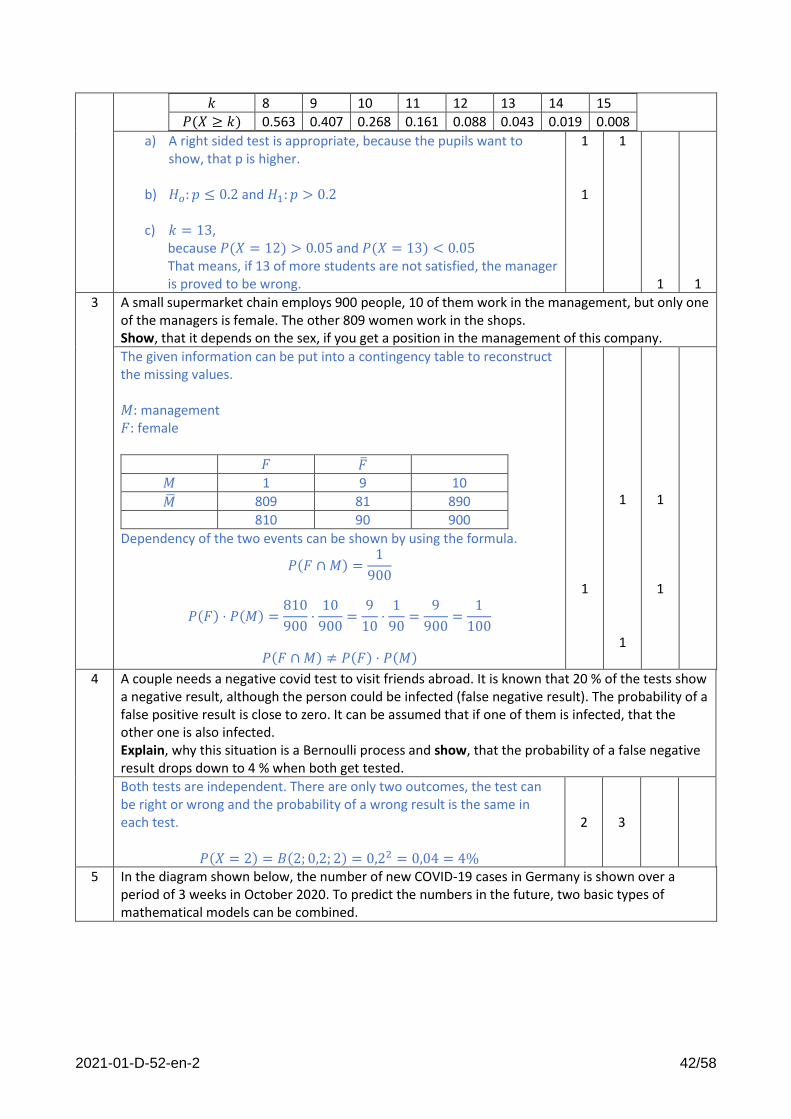
𝑘 8 9 10 11 12 13 14 15
𝑃(𝑋 ≥ 𝑘) 0.563 0.407 0.268 0.161 0.088 0.043 0.019 0.008
a) A right sided test is appropriate, because the pupils want to show, that p is higher.
b) 𝐻𝑜: 𝑝 ≤ 0.2 and 𝐻1: 𝑝 > 0.2
c) 𝑘 = 13,
because 𝑃(𝑋 = 12) > 0.05 and 𝑃(𝑋 = 13) < 0.05 That means, if 13 of more students are not satisfied, the manager is proved to be wrong.
1
1
1
1
1
3 A small supermarket chain employs 900 people, 10 of them work in the management, but only one of the managers is female. The other 809 women work in the shops. Show, that it depends on the sex, if you get a position in the management of this company.
The given information can be put into a contingency table to reconstruct the missing values. 𝑀: management 𝐹: female
𝐹 �̅�
𝑀 1 9 10
�̅� 809 81 890
810 90 900
Dependency of the two events can be shown by using the formula.
𝑃(𝐹 ∩ 𝑀) =1
900
𝑃(𝐹) ⋅ 𝑃(𝑀) =810
900⋅
10
900=
9
10⋅
1
90=
9
900=
1
100
𝑃(𝐹 ∩ 𝑀) ≠ 𝑃(𝐹) ⋅ 𝑃(𝑀)
1
1
1
1
1
4 A couple needs a negative covid test to visit friends abroad. It is known that 20 % of the tests show a negative result, although the person could be infected (false negative result). The probability of a false positive result is close to zero. It can be assumed that if one of them is infected, that the other one is also infected. Explain, why this situation is a Bernoulli process and show, that the probability of a false negative result drops down to 4 % when both get tested.
Both tests are independent. There are only two outcomes, the test can be right or wrong and the probability of a wrong result is the same in each test.
𝑃(𝑋 = 2) = 𝐵(2; 0,2; 2) = 0,22 = 0,04 = 4%
2
3
5 In the diagram shown below, the number of new COVID-19 cases in Germany is shown over a period of 3 weeks in October 2020. To predict the numbers in the future, two basic types of mathematical models can be combined.
2021-01-D-52-en-2 43/58
Give the names of these types of models and reason your answer. Predict a date in the future when another maximum will be reached, when the numbers follow the models.
Since the numbers are oscillating with a period of 7 days, a periodic model can be used on a small-scale level. However, the numbers are altogether increasing on a large-scale level. To model this development, an exponential model could be used, because neither maxima nor minima fit a straight line. The next maximum will be reached on 24. October.
1
1
2
1
6 The number of bacteria in a petri dish is investigated in a laboratory. It turns out, that under certain conditions, the growth can be modelled by the function
𝑁(𝑡) = 10 000 ⋅ 𝑒ln(1,03)⋅𝑡, where 𝑁(𝑡) is the number of bacteria after 𝑡 days.
a) Give the number of bacteria at the beginning and the growth rate in percent. b) Calculate the number of bacteria after the first day. c) Explain, why this model cannot be used on a very large time scale.
a) The experiment starts with 10 000 bacteria. Per day, the number increases by 3%.
b) 𝑁(1) = 10 000 ⋅ 1,03 = 10 000 + 300 = 10 300
c) At some stage, the petri dish is full of bacteria and there is no
more space or nutrition, so the growth will stop.
2
2
1
7 Indicate if the statement is true or false and reason your answer. Note that the points are only given if answer and reason are correct.
a. If the temperature 𝑇(𝑥) is constantly increasing, then 𝑇′(𝑥) > 0. b. All periodic models can be modelled by a sine function. c. There are 9 different possibilities for 3 pupils to stand next to each other. d. When some dice is rolled once, the expected value is 3.5. e. If 10 people are chosen out of a very large group, the number of females can be modelled
by a binomial distribution, although a person cannot be chosen more than once.
a) True, because the if the temperature is increasing, the rate of chance is positive, and the rate of change is given by the derivative.
1
2021-01-D-52-en-2 44/58
b) False, because the red light of a traffic light be a periodic model. But the light is either on or off with no stages in between, so it cannot be modelled by a sine function.
c) False, because this example is without repetition. So, in fact
there are 6 possibilities.
d) True, because 𝐸(𝑋) = (1 + 2 + 3 + 4 + 5 + 6): 6 = 3.5
e) True, because the change in the probability is rather small, when we have a large group. Beside a constant probability, there can only be two options to choose from (male and female) and it must be a random choice.
1
1
1
1
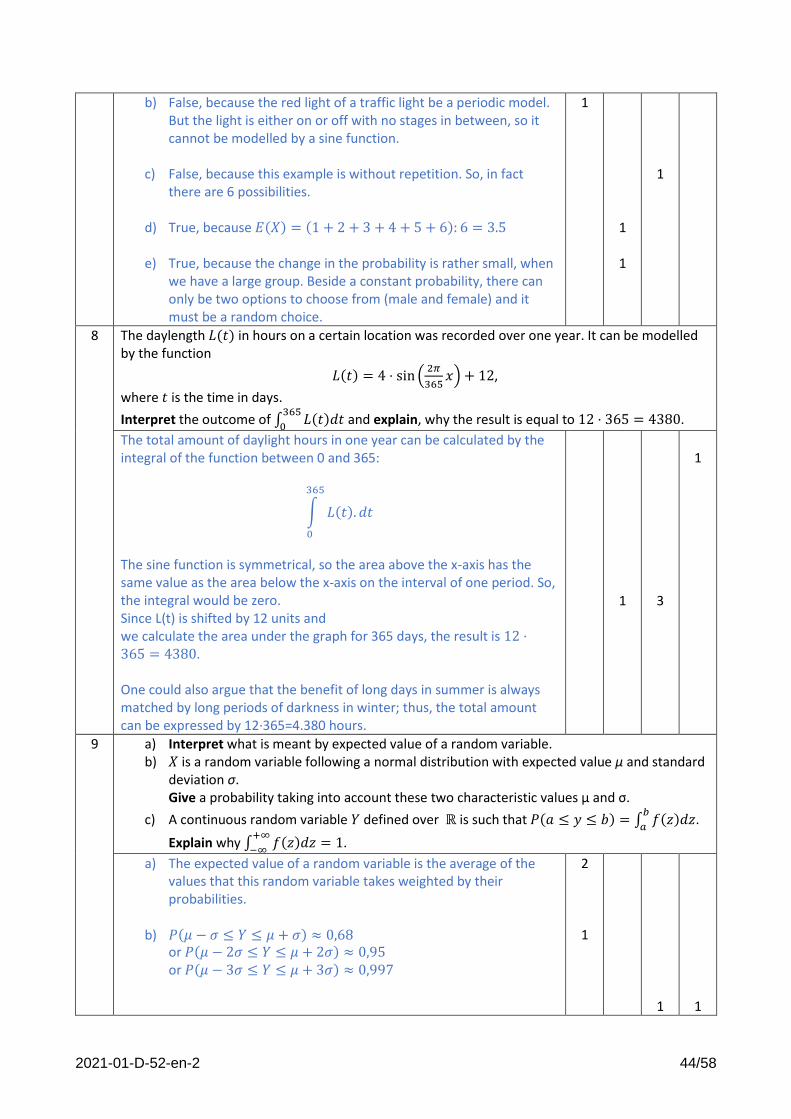
8 The daylength 𝐿(𝑡) in hours on a certain location was recorded over one year. It can be modelled by the function
𝐿(𝑡) = 4 ⋅ sin (2𝜋
365𝑥) + 12,
where 𝑡 is the time in days.
Interpret the outcome of ∫ 𝐿(𝑡)𝑑𝑡 365
0and explain, why the result is equal to 12 ⋅ 365 = 4380.
The total amount of daylight hours in one year can be calculated by the integral of the function between 0 and 365:
∫ 𝐿(𝑡). 𝑑𝑡
365
0
The sine function is symmetrical, so the area above the x-axis has the same value as the area below the x-axis on the interval of one period. So, the integral would be zero. Since L(t) is shifted by 12 units and we calculate the area under the graph for 365 days, the result is 12 ⋅365 = 4380. One could also argue that the benefit of long days in summer is always matched by long periods of darkness in winter; thus, the total amount can be expressed by 12∙365=4.380 hours.
1
3
1
9 a) Interpret what is meant by expected value of a random variable. b) 𝑋 is a random variable following a normal distribution with expected value μ and standard
deviation σ. Give a probability taking into account these two characteristic values μ and σ.
c) A continuous random variable 𝑌 defined over ℝ is such that 𝑃(𝑎 ≤ 𝑦 ≤ 𝑏) = ∫ 𝑓(𝑧)𝑑𝑧𝑏
𝑎.
Explain why ∫ 𝑓(𝑧)𝑑𝑧 = 1+∞
−∞.
a) The expected value of a random variable is the average of the values that this random variable takes weighted by their probabilities.
b) 𝑃(𝜇 − 𝜎 ≤ 𝑌 ≤ 𝜇 + 𝜎) ≈ 0,68
or 𝑃(𝜇 − 2𝜎 ≤ 𝑌 ≤ 𝜇 + 2𝜎) ≈ 0,95 or 𝑃(𝜇 − 3𝜎 ≤ 𝑌 ≤ 𝜇 + 3𝜎) ≈ 0,997
2
1
1
1
2021-01-D-52-en-2 45/58
c) The integral ∫ 𝑓(𝑧)𝑑𝑧+∞
−∞ corresponds to 𝑃(−∞ < 𝑍 < +∞), the
probability for 𝑌 to take all possible real values. Since 𝑌 denotes a random variable defined on ℝ, this probability is therefore that of all possible events, hence the value is 1.
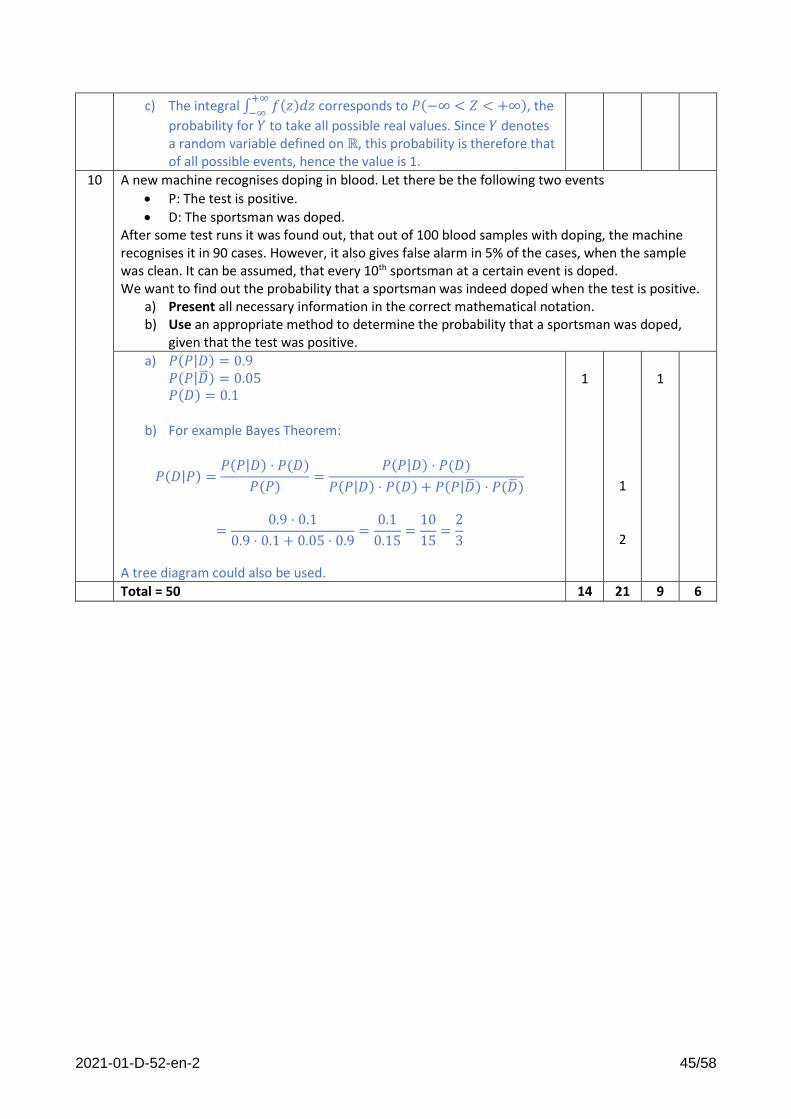
10 A new machine recognises doping in blood. Let there be the following two events
• P: The test is positive.
• D: The sportsman was doped. After some test runs it was found out, that out of 100 blood samples with doping, the machine recognises it in 90 cases. However, it also gives false alarm in 5% of the cases, when the sample was clean. It can be assumed, that every 10th sportsman at a certain event is doped. We want to find out the probability that a sportsman was indeed doped when the test is positive.
a) Present all necessary information in the correct mathematical notation. b) Use an appropriate method to determine the probability that a sportsman was doped,
given that the test was positive.
a) 𝑃(𝑃|𝐷) = 0.9 𝑃(𝑃|�̅�) = 0.05 𝑃(𝐷) = 0.1
b) For example Bayes Theorem:
𝑃(𝐷|𝑃) =𝑃(𝑃|𝐷) ⋅ 𝑃(𝐷)
𝑃(𝑃)=
𝑃(𝑃|𝐷) ⋅ 𝑃(𝐷)
𝑃(𝑃|𝐷) ⋅ 𝑃(𝐷) + 𝑃(𝑃|�̅�) ⋅ 𝑃(�̅�)
=0.9 ⋅ 0.1
0.9 ⋅ 0.1 + 0.05 ⋅ 0.9=
0.1
0.15=
10
15=
2
3
A tree diagram could also be used.
1
1
2
1
Total = 50 14 21 9 6

2021-01-D-52-en-2 46/58
DATE: DD/MM/YYYY
DURATION OF THE EXAMINATION: 120 minutes
EXAMINATION WITH TECHNOLOGICAL TOOL
AUTHORISED MATERIAL:
Technological tool
Formula Booklet
Notes:
• As this is a sample paper the cover page is likely to change.
• This sample paper should only be used to see how questions can be created from the syllabus
focusing on competences rather than strictly on content.
• The keywords found in the syllabus are highlighted in bold to help the candidate see which
competency the question is focusing on and thus helping in answering the question.
MATHEMATICS 3 PERIODS
PART B
2021-01-D-52-en-2 47/58
PART B
Question 1/2 Marks
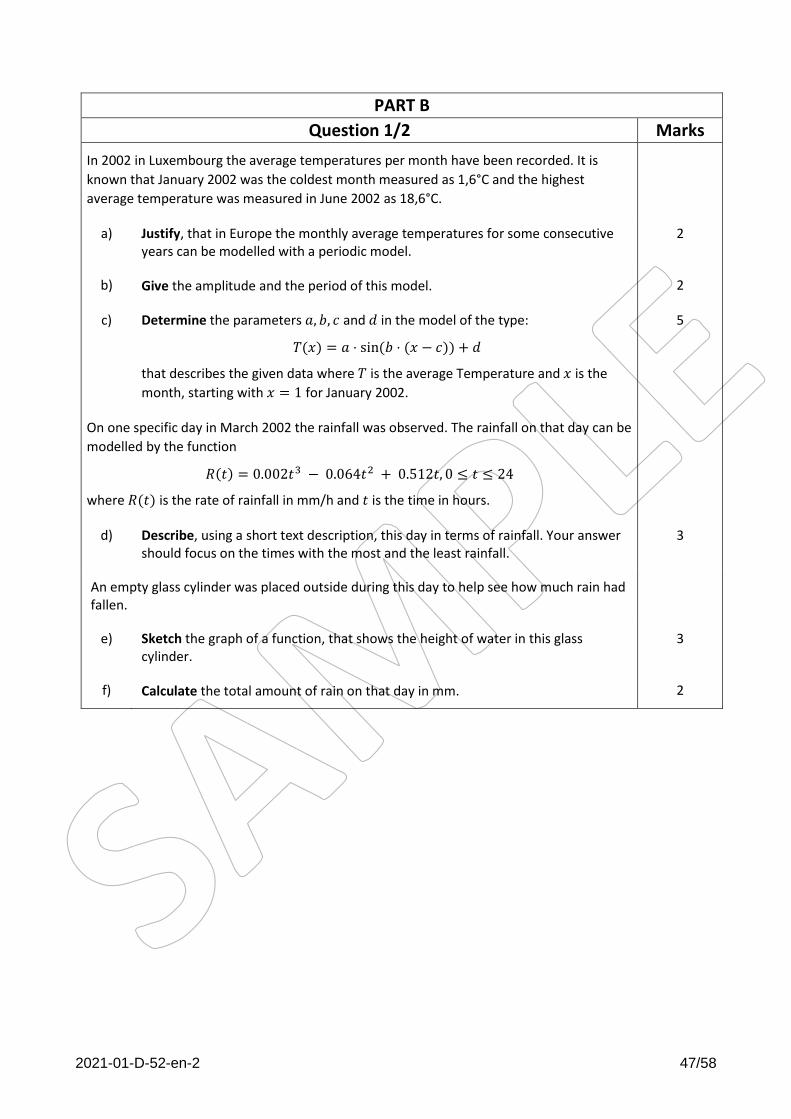
In 2002 in Luxembourg the average temperatures per month have been recorded. It is
known that January 2002 was the coldest month measured as 1,6°C and the highest
average temperature was measured in June 2002 as 18,6°C.
a) Justify, that in Europe the monthly average temperatures for some consecutive years can be modelled with a periodic model.
2
b) Give the amplitude and the period of this model. 2
c) Determine the parameters 𝑎, 𝑏, 𝑐 and 𝑑 in the model of the type:
𝑇(𝑥) = 𝑎 ⋅ sin(𝑏 ⋅ (𝑥 − 𝑐)) + 𝑑
that describes the given data where 𝑇 is the average Temperature and 𝑥 is the
month, starting with 𝑥 = 1 for January 2002.
5
On one specific day in March 2002 the rainfall was observed. The rainfall on that day can be
modelled by the function
𝑅(𝑡) = 0.002𝑡3 − 0.064𝑡2 + 0.512𝑡, 0 ≤ 𝑡 ≤ 24
where 𝑅(𝑡) is the rate of rainfall in mm/h and 𝑡 is the time in hours.
d) Describe, using a short text description, this day in terms of rainfall. Your answer should focus on the times with the most and the least rainfall.
3
An empty glass cylinder was placed outside during this day to help see how much rain had fallen.
e) Sketch the graph of a function, that shows the height of water in this glass cylinder.
3
f) Calculate the total amount of rain on that day in mm. 2
2021-01-D-52-en-2 48/58
Question 1/2 continued Marks
The year 2002 in Luxembourg turned out to have 195 rainy days and 170 days without rain.
It can be assumed, that all days have the same chance of being a rainy day. One year later,
meteorologists want to investigate, if there was more rain in 2003. Unfortunately, some
data were lost, so they took only a small sample of 30 consecutive days.
g) Calculate the probability that it rains on a random day, if we assume, that the total
number of rainy days in both years remains constant and the rainy days are equally
distributed over the whole year.
1
h) Use a NHST procedure to find out how many days it must rain so the
meteorologists can say that there was more rain in 2003 compared to 2002 when
the significance level is at 5%.
5
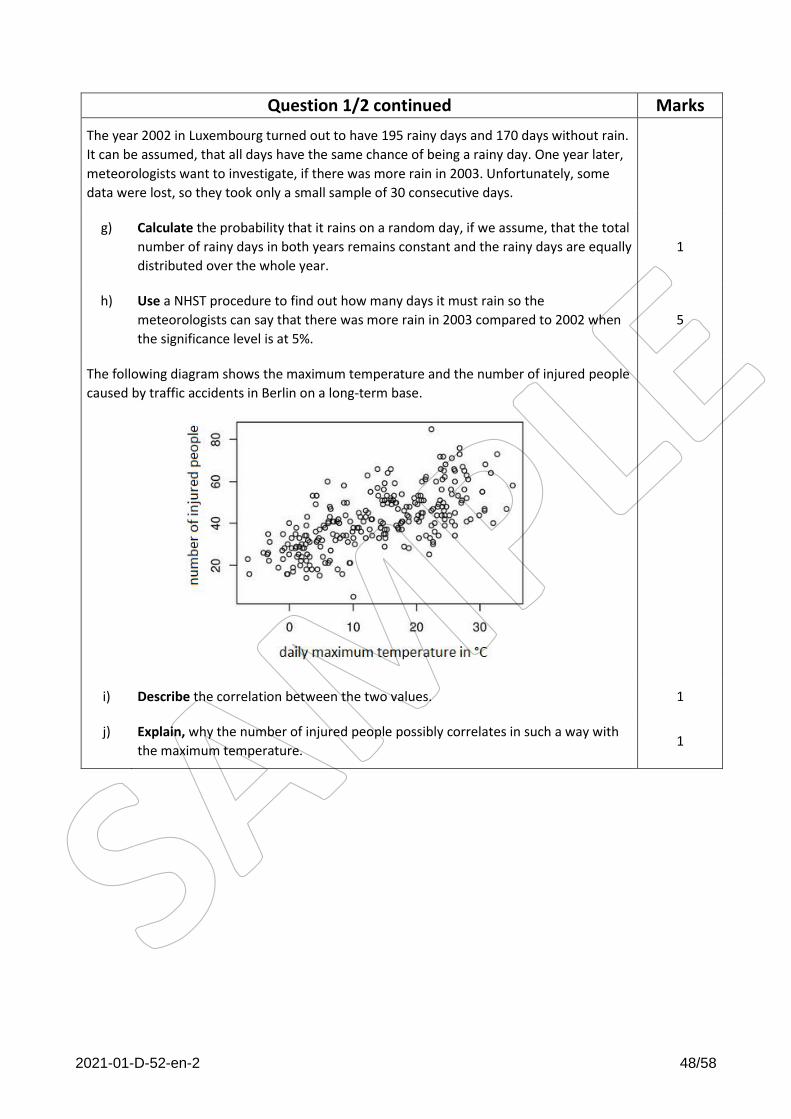
The following diagram shows the maximum temperature and the number of injured people
caused by traffic accidents in Berlin on a long-term base.
i) Describe the correlation between the two values. 1
j) Explain, why the number of injured people possibly correlates in such a way with
the maximum temperature. 1
2021-01-D-52-en-2 49/58
PART B
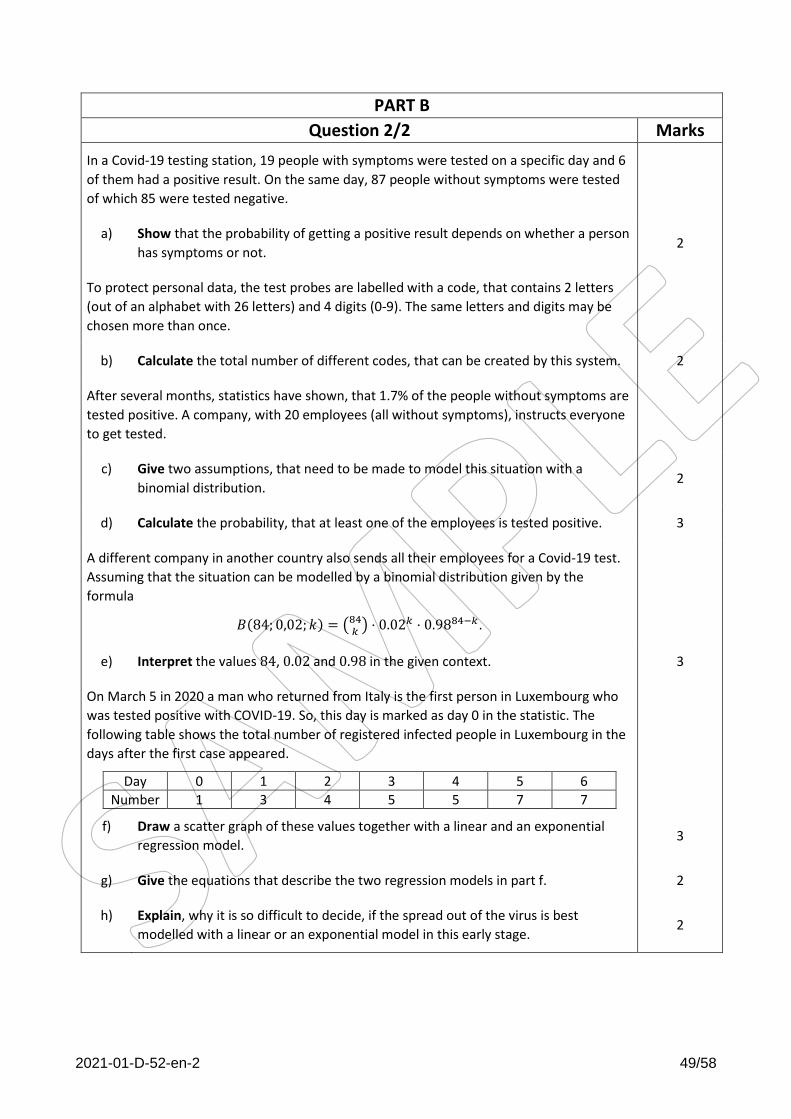
Question 2/2 Marks
In a Covid-19 testing station, 19 people with symptoms were tested on a specific day and 6
of them had a positive result. On the same day, 87 people without symptoms were tested
of which 85 were tested negative.
a) Show that the probability of getting a positive result depends on whether a person
has symptoms or not. 2
To protect personal data, the test probes are labelled with a code, that contains 2 letters
(out of an alphabet with 26 letters) and 4 digits (0-9). The same letters and digits may be
chosen more than once.
b) Calculate the total number of different codes, that can be created by this system. 2
After several months, statistics have shown, that 1.7% of the people without symptoms are
tested positive. A company, with 20 employees (all without symptoms), instructs everyone
to get tested.
c) Give two assumptions, that need to be made to model this situation with a
binomial distribution. 2
d) Calculate the probability, that at least one of the employees is tested positive. 3
A different company in another country also sends all their employees for a Covid-19 test.
Assuming that the situation can be modelled by a binomial distribution given by the
formula
𝐵(84; 0,02; 𝑘) = (84𝑘
) ⋅ 0.02𝑘 ⋅ 0.9884−𝑘.
e) Interpret the values 84, 0.02 and 0.98 in the given context. 3
On March 5 in 2020 a man who returned from Italy is the first person in Luxembourg who
was tested positive with COVID-19. So, this day is marked as day 0 in the statistic. The
following table shows the total number of registered infected people in Luxembourg in the
days after the first case appeared.
Day 0 1 2 3 4 5 6
Number 1 3 4 5 5 7 7
f) Draw a scatter graph of these values together with a linear and an exponential
regression model. 3
g) Give the equations that describe the two regression models in part f. 2
h) Explain, why it is so difficult to decide, if the spread out of the virus is best
modelled with a linear or an exponential model in this early stage. 2
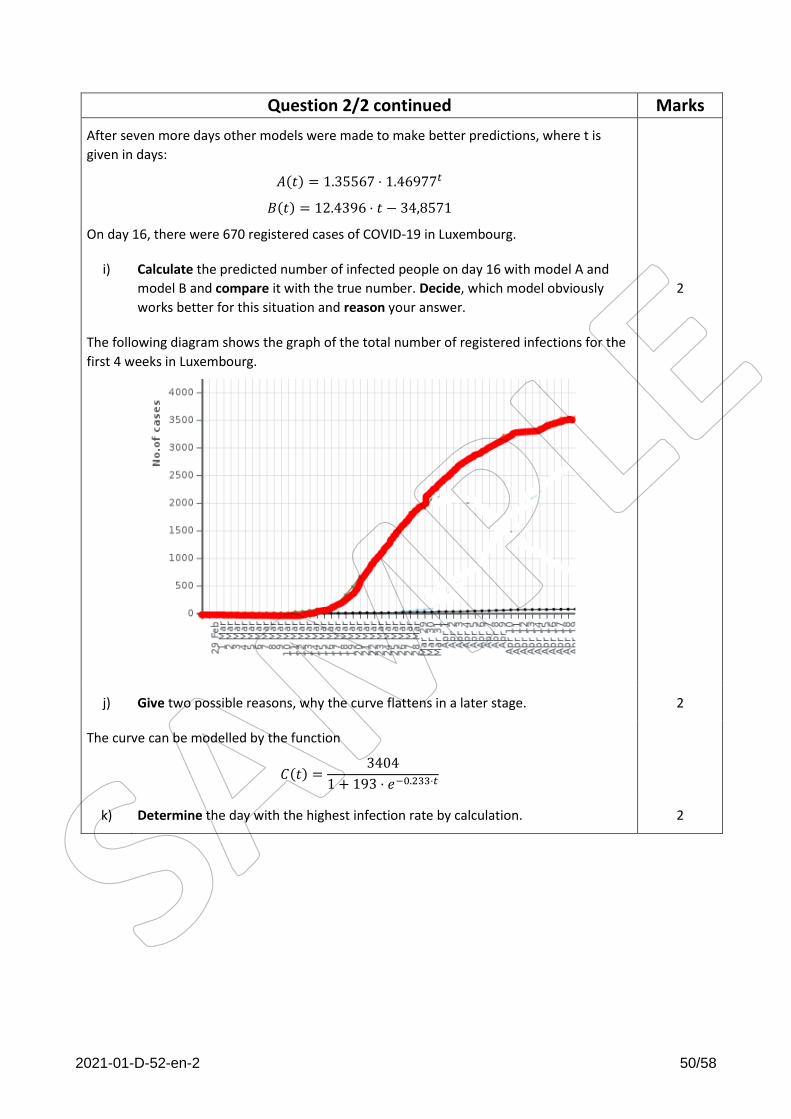
2021-01-D-52-en-2 50/58
Question 2/2 continued Marks
After seven more days other models were made to make better predictions, where t is
given in days:
𝐴(𝑡) = 1.35567 ⋅ 1.46977𝑡
𝐵(𝑡) = 12.4396 ⋅ 𝑡 − 34,8571
On day 16, there were 670 registered cases of COVID-19 in Luxembourg.
i) Calculate the predicted number of infected people on day 16 with model A and
model B and compare it with the true number. Decide, which model obviously
works better for this situation and reason your answer.
2
The following diagram shows the graph of the total number of registered infections for the
first 4 weeks in Luxembourg.
j) Give two possible reasons, why the curve flattens in a later stage. 2
The curve can be modelled by the function
𝐶(𝑡) =3404
1 + 193 ⋅ 𝑒−0.233⋅𝑡
k) Determine the day with the highest infection rate by calculation. 2
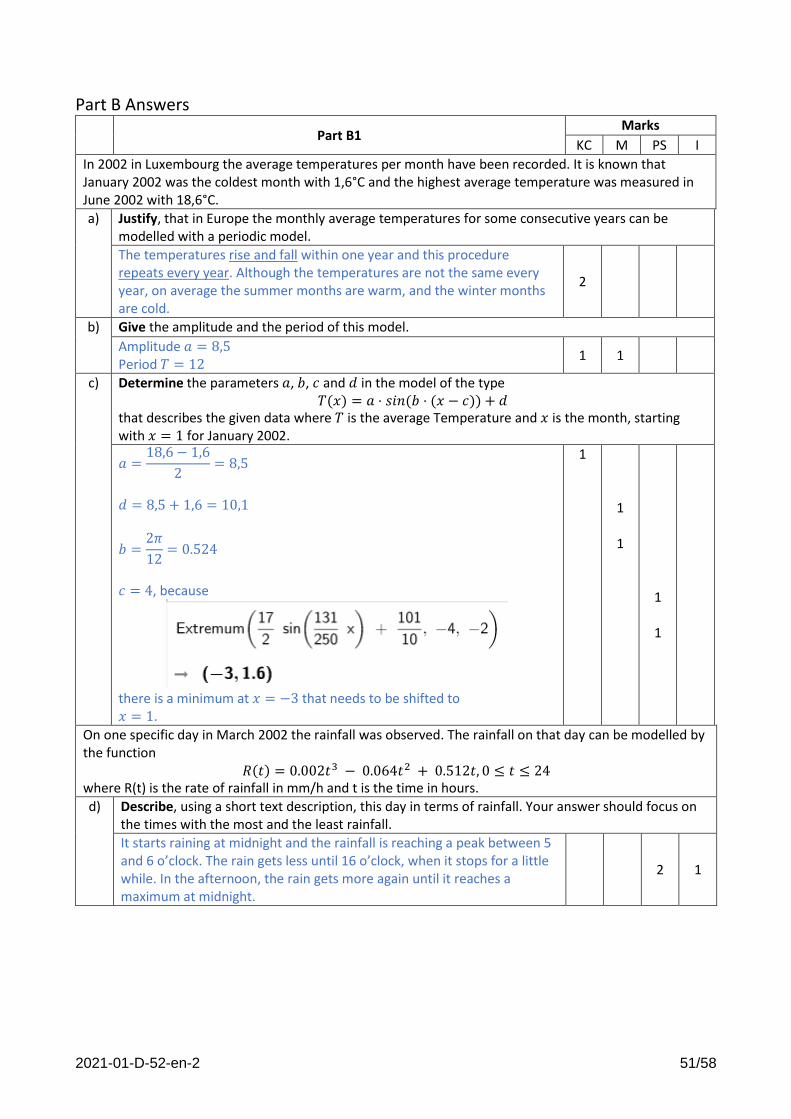
2021-01-D-52-en-2 51/58
Part B Answers
Part B1 Marks
KC M PS I
In 2002 in Luxembourg the average temperatures per month have been recorded. It is known that January 2002 was the coldest month with 1,6°C and the highest average temperature was measured in June 2002 with 18,6°C.
a) Justify, that in Europe the monthly average temperatures for some consecutive years can be modelled with a periodic model.
The temperatures rise and fall within one year and this procedure repeats every year. Although the temperatures are not the same every year, on average the summer months are warm, and the winter months are cold.
2
b) Give the amplitude and the period of this model.
Amplitude 𝑎 = 8,5 Period 𝑇 = 12
1 1
c) Determine the parameters 𝑎, 𝑏, 𝑐 and 𝑑 in the model of the type 𝑇(𝑥) = 𝑎 ⋅ 𝑠𝑖𝑛(𝑏 ⋅ (𝑥 − 𝑐)) + 𝑑
that describes the given data where 𝑇 is the average Temperature and 𝑥 is the month, starting with 𝑥 = 1 for January 2002.
𝑎 =18,6 − 1,6
2= 8,5
𝑑 = 8,5 + 1,6 = 10,1
𝑏 =2𝜋
12= 0.524
𝑐 = 4, because
there is a minimum at 𝑥 = −3 that needs to be shifted to 𝑥 = 1.
1
1
1
1
1
On one specific day in March 2002 the rainfall was observed. The rainfall on that day can be modelled by the function
𝑅(𝑡) = 0.002𝑡3 − 0.064𝑡2 + 0.512𝑡, 0 ≤ 𝑡 ≤ 24 where R(t) is the rate of rainfall in mm/h and t is the time in hours.
d) Describe, using a short text description, this day in terms of rainfall. Your answer should focus on the times with the most and the least rainfall.
It starts raining at midnight and the rainfall is reaching a peak between 5 and 6 o’clock. The rain gets less until 16 o’clock, when it stops for a little while. In the afternoon, the rain gets more again until it reaches a maximum at midnight.
2 1
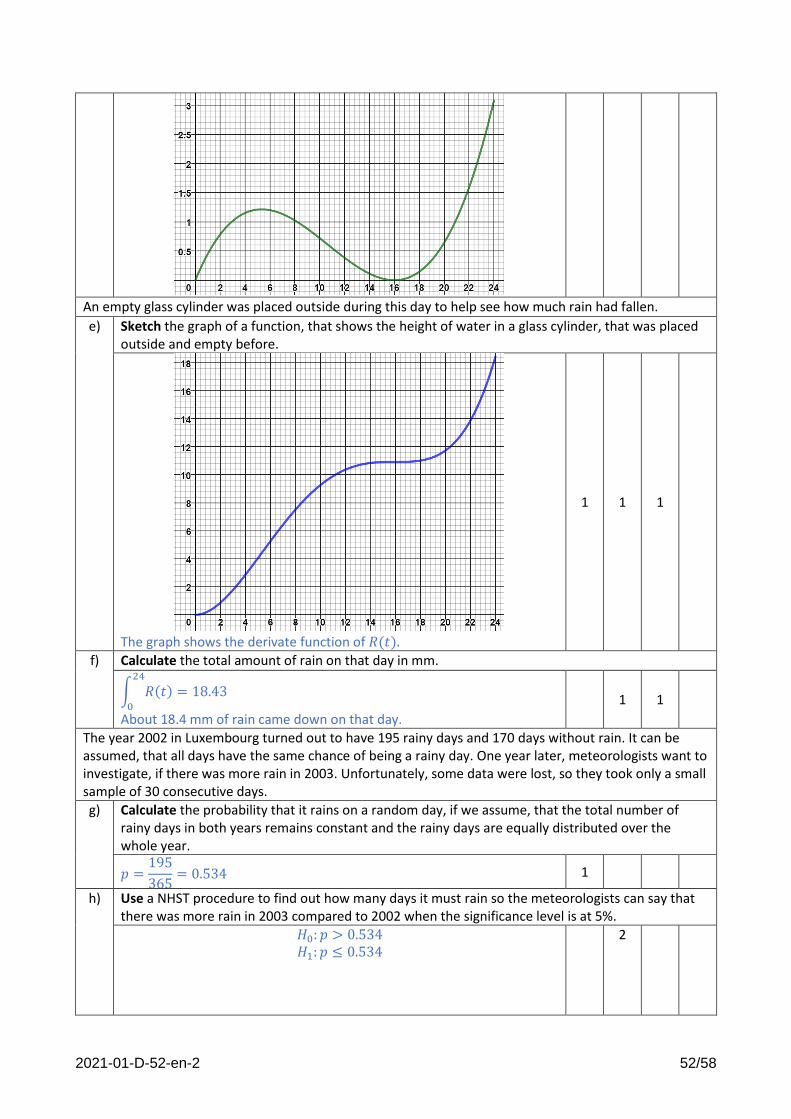
2021-01-D-52-en-2 52/58
An empty glass cylinder was placed outside during this day to help see how much rain had fallen.
e) Sketch the graph of a function, that shows the height of water in a glass cylinder, that was placed outside and empty before.
The graph shows the derivate function of 𝑅(𝑡).
1 1 1
f) Calculate the total amount of rain on that day in mm.
∫ 𝑅(𝑡) = 18.4324
0
About 18.4 mm of rain came down on that day.
1 1
The year 2002 in Luxembourg turned out to have 195 rainy days and 170 days without rain. It can be assumed, that all days have the same chance of being a rainy day. One year later, meteorologists want to investigate, if there was more rain in 2003. Unfortunately, some data were lost, so they took only a small sample of 30 consecutive days.
g) Calculate the probability that it rains on a random day, if we assume, that the total number of rainy days in both years remains constant and the rainy days are equally distributed over the whole year.
𝑝 =195
365= 0.534 1
h) Use a NHST procedure to find out how many days it must rain so the meteorologists can say that there was more rain in 2003 compared to 2002 when the significance level is at 5%.
𝐻0: 𝑝 > 0.534 𝐻1: 𝑝 ≤ 0.534
2
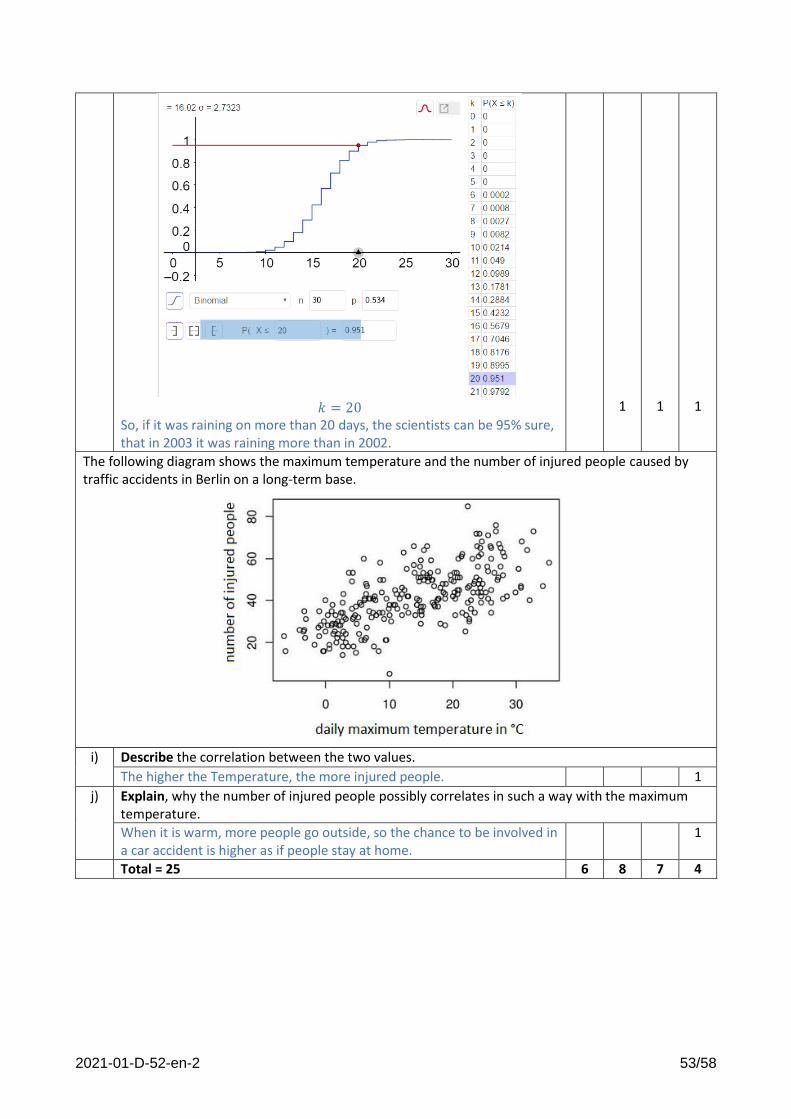
2021-01-D-52-en-2 53/58
𝑘 = 20
So, if it was raining on more than 20 days, the scientists can be 95% sure, that in 2003 it was raining more than in 2002.
1
1
1
The following diagram shows the maximum temperature and the number of injured people caused by traffic accidents in Berlin on a long-term base.
i) Describe the correlation between the two values.
The higher the Temperature, the more injured people. 1
j) Explain, why the number of injured people possibly correlates in such a way with the maximum temperature.
When it is warm, more people go outside, so the chance to be involved in a car accident is higher as if people stay at home.
1
Total = 25 6 8 7 4
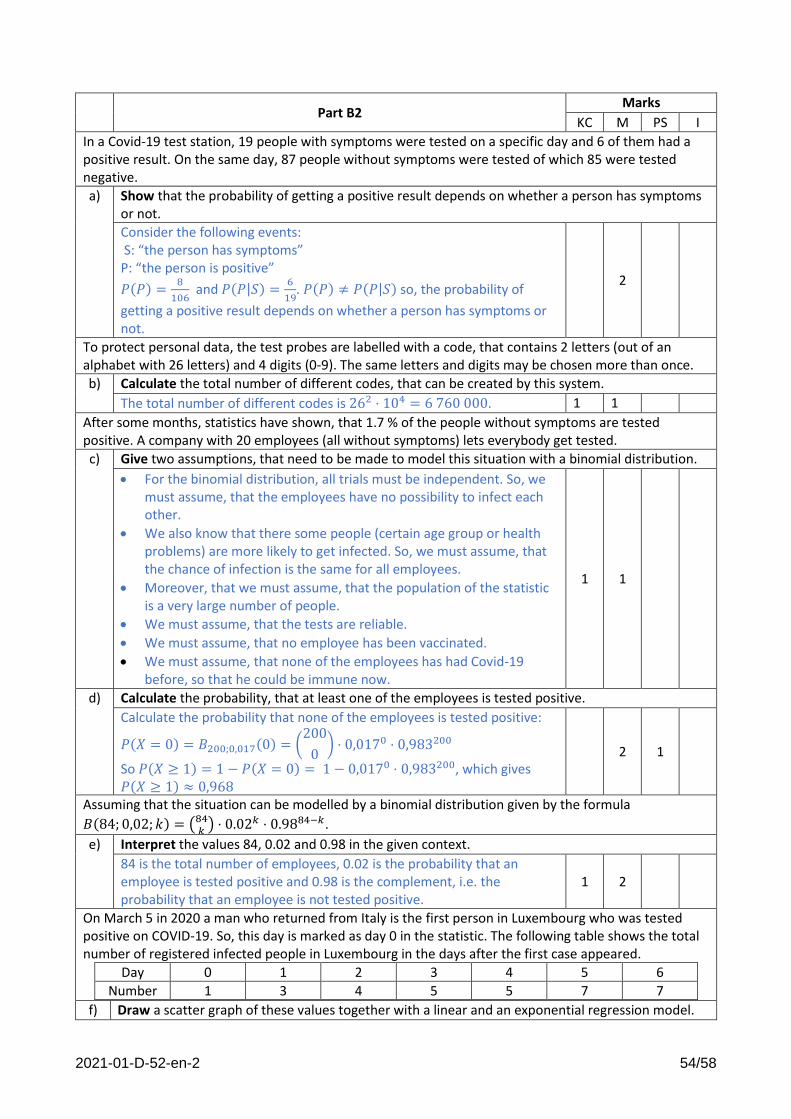
2021-01-D-52-en-2 54/58
Part B2 Marks
KC M PS I
In a Covid-19 test station, 19 people with symptoms were tested on a specific day and 6 of them had a positive result. On the same day, 87 people without symptoms were tested of which 85 were tested negative.
a) Show that the probability of getting a positive result depends on whether a person has symptoms or not.
Consider the following events: S: “the person has symptoms” P: “the person is positive”
𝑃(𝑃) =8
106 and 𝑃(𝑃|𝑆) =
6
19. 𝑃(𝑃) ≠ 𝑃(𝑃|𝑆) so, the probability of
getting a positive result depends on whether a person has symptoms or not.
2
To protect personal data, the test probes are labelled with a code, that contains 2 letters (out of an alphabet with 26 letters) and 4 digits (0-9). The same letters and digits may be chosen more than once.
b) Calculate the total number of different codes, that can be created by this system.
The total number of different codes is 262 ⋅ 104 = 6 760 000. 1 1
After some months, statistics have shown, that 1.7 % of the people without symptoms are tested positive. A company with 20 employees (all without symptoms) lets everybody get tested.
c) Give two assumptions, that need to be made to model this situation with a binomial distribution.
• For the binomial distribution, all trials must be independent. So, we must assume, that the employees have no possibility to infect each other.
• We also know that there some people (certain age group or health problems) are more likely to get infected. So, we must assume, that the chance of infection is the same for all employees.
• Moreover, that we must assume, that the population of the statistic is a very large number of people.
• We must assume, that the tests are reliable.
• We must assume, that no employee has been vaccinated.
• We must assume, that none of the employees has had Covid-19 before, so that he could be immune now.
1 1
d) Calculate the probability, that at least one of the employees is tested positive.
Calculate the probability that none of the employees is tested positive:
𝑃(𝑋 = 0) = 𝐵200;0,017(0) = (200
0) ⋅ 0,0170 ⋅ 0,983200
So 𝑃(𝑋 ≥ 1) = 1 − 𝑃(𝑋 = 0) = 1 − 0,0170 ⋅ 0,983200, which gives 𝑃(𝑋 ≥ 1) ≈ 0,968
2 1
Assuming that the situation can be modelled by a binomial distribution given by the formula
𝐵(84; 0,02; 𝑘) = (84𝑘
) ⋅ 0.02𝑘 ⋅ 0.9884−𝑘.
e) Interpret the values 84, 0.02 and 0.98 in the given context.
84 is the total number of employees, 0.02 is the probability that an employee is tested positive and 0.98 is the complement, i.e. the probability that an employee is not tested positive.
1 2
On March 5 in 2020 a man who returned from Italy is the first person in Luxembourg who was tested positive on COVID-19. So, this day is marked as day 0 in the statistic. The following table shows the total number of registered infected people in Luxembourg in the days after the first case appeared.
Day 0 1 2 3 4 5 6
Number 1 3 4 5 5 7 7
f) Draw a scatter graph of these values together with a linear and an exponential regression model.
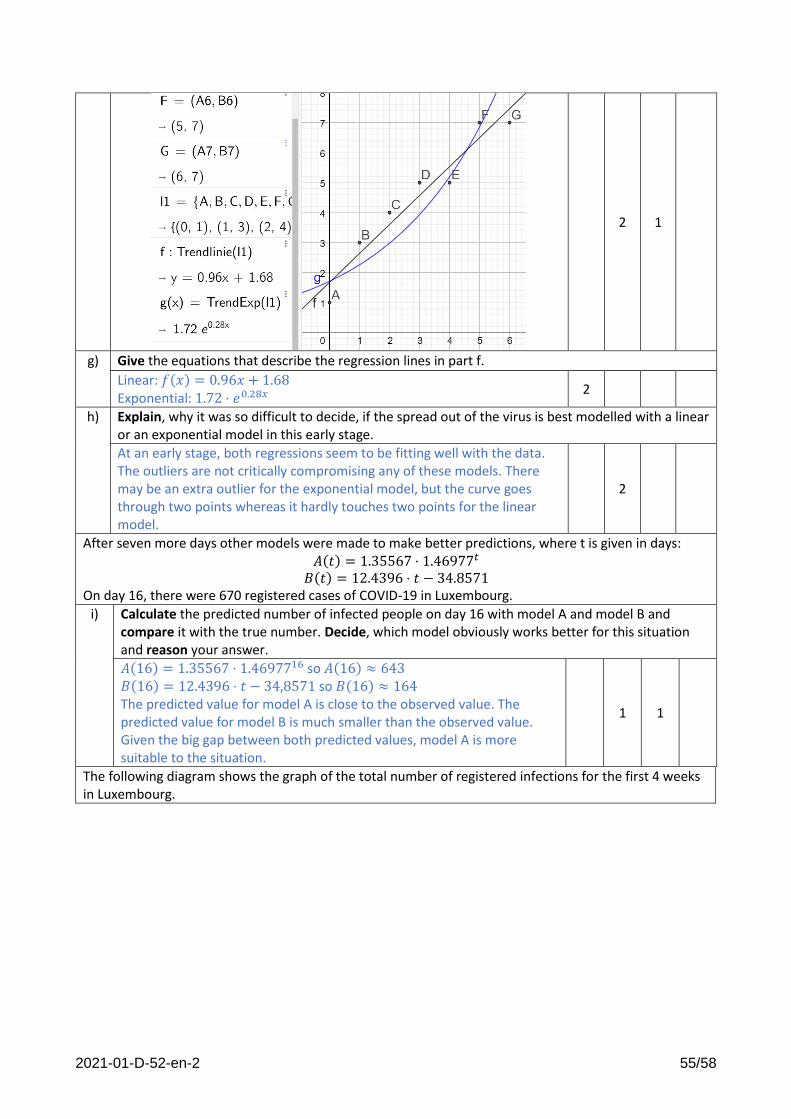
2021-01-D-52-en-2 55/58
2 1
g) Give the equations that describe the regression lines in part f.
Linear: 𝑓(𝑥) = 0.96𝑥 + 1.68 Exponential: 1.72 ⋅ 𝑒0.28𝑥
2
h) Explain, why it was so difficult to decide, if the spread out of the virus is best modelled with a linear or an exponential model in this early stage.
At an early stage, both regressions seem to be fitting well with the data. The outliers are not critically compromising any of these models. There may be an extra outlier for the exponential model, but the curve goes through two points whereas it hardly touches two points for the linear model.
2
After seven more days other models were made to make better predictions, where t is given in days: 𝐴(𝑡) = 1.35567 ⋅ 1.46977𝑡
𝐵(𝑡) = 12.4396 ⋅ 𝑡 − 34.8571 On day 16, there were 670 registered cases of COVID-19 in Luxembourg.
i) Calculate the predicted number of infected people on day 16 with model A and model B and compare it with the true number. Decide, which model obviously works better for this situation and reason your answer.
𝐴(16) = 1.35567 ⋅ 1.4697716 so 𝐴(16) ≈ 643 𝐵(16) = 12.4396 ⋅ 𝑡 − 34,8571 so 𝐵(16) ≈ 164 The predicted value for model A is close to the observed value. The predicted value for model B is much smaller than the observed value. Given the big gap between both predicted values, model A is more suitable to the situation.
1 1
The following diagram shows the graph of the total number of registered infections for the first 4 weeks in Luxembourg.
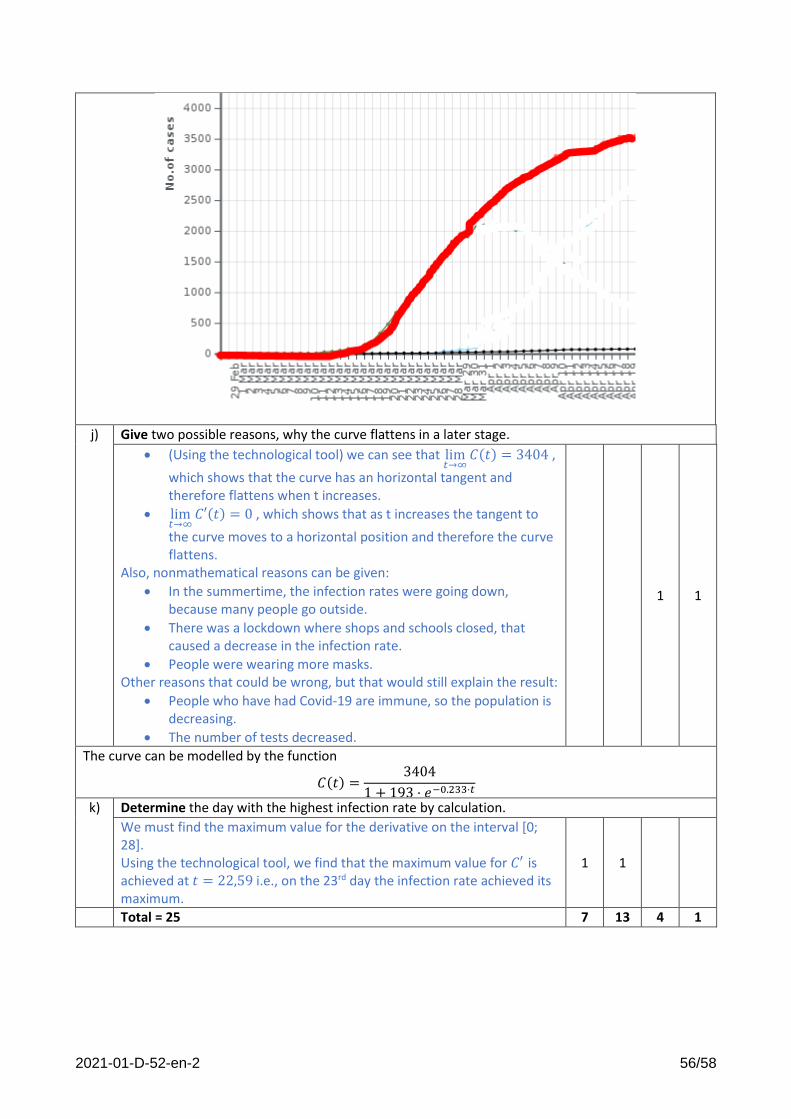
2021-01-D-52-en-2 56/58
j) Give two possible reasons, why the curve flattens in a later stage.
• (Using the technological tool) we can see that lim𝑡→∞
𝐶(𝑡) = 3404 ,
which shows that the curve has an horizontal tangent and therefore flattens when t increases.
• lim𝑡→∞
𝐶′(𝑡) = 0 , which shows that as t increases the tangent to
the curve moves to a horizontal position and therefore the curve flattens.
Also, nonmathematical reasons can be given:
• In the summertime, the infection rates were going down, because many people go outside.
• There was a lockdown where shops and schools closed, that caused a decrease in the infection rate.
• People were wearing more masks. Other reasons that could be wrong, but that would still explain the result:
• People who have had Covid-19 are immune, so the population is decreasing.
• The number of tests decreased.
1 1
The curve can be modelled by the function
𝐶(𝑡) =3404
1 + 193 ⋅ 𝑒−0.233⋅𝑡
k) Determine the day with the highest infection rate by calculation.
We must find the maximum value for the derivative on the interval [0; 28]. Using the technological tool, we find that the maximum value for 𝐶′ is achieved at 𝑡 = 22,59 i.e., on the 23rd day the infection rate achieved its maximum.
1 1
Total = 25 7 13 4 1
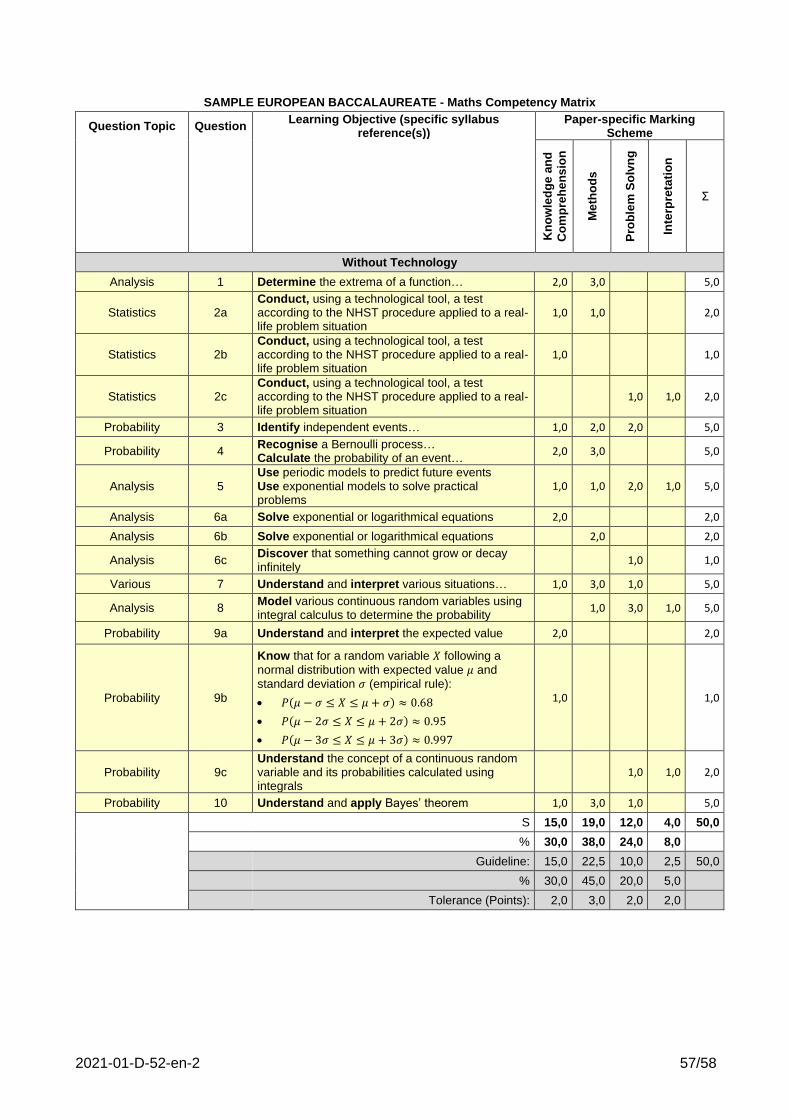
2021-01-D-52-en-2 57/58
SAMPLE EUROPEAN BACCALAUREATE - Maths Competency Matrix
Question Topic Question Learning Objective (specific syllabus
reference(s)) Paper-specific Marking
Scheme
Kn
ow
led
ge
an
d
Co
mp
reh
en
sio
n
Me
tho
ds
Pro
ble
m S
olv
ng
Inte
rpre
tati
on
Σ
Without Technology
Analysis 1 Determine the extrema of a function… 2,0 3,0 5,0
Statistics 2a Conduct, using a technological tool, a test according to the NHST procedure applied to a real-life problem situation
1,0 1,0 2,0
Statistics 2b Conduct, using a technological tool, a test according to the NHST procedure applied to a real-life problem situation
1,0 1,0
Statistics 2c Conduct, using a technological tool, a test according to the NHST procedure applied to a real-life problem situation
1,0 1,0 2,0
Probability 3 Identify independent events… 1,0 2,0 2,0 5,0
Probability 4 Recognise a Bernoulli process… Calculate the probability of an event…
2,0 3,0 5,0
Analysis 5 Use periodic models to predict future events Use exponential models to solve practical problems
1,0 1,0 2,0 1,0 5,0
Analysis 6a Solve exponential or logarithmical equations 2,0 2,0
Analysis 6b Solve exponential or logarithmical equations 2,0 2,0
Analysis 6c Discover that something cannot grow or decay infinitely
1,0 1,0
Various 7 Understand and interpret various situations… 1,0 3,0 1,0 5,0
Analysis 8 Model various continuous random variables using integral calculus to determine the probability
1,0 3,0 1,0 5,0
Probability 9a Understand and interpret the expected value 2,0 2,0
Probability 9b
Know that for a random variable 𝑋 following a
normal distribution with expected value 𝜇 and
standard deviation 𝜎 (empirical rule):
• 𝑃(𝜇 − 𝜎 ≤ 𝑋 ≤ 𝜇 + 𝜎) ≈ 0.68
• 𝑃(𝜇 − 2𝜎 ≤ 𝑋 ≤ 𝜇 + 2𝜎) ≈ 0.95
• 𝑃(𝜇 − 3𝜎 ≤ 𝑋 ≤ 𝜇 + 3𝜎) ≈ 0.997
1,0 1,0
Probability 9c Understand the concept of a continuous random variable and its probabilities calculated using integrals
1,0 1,0 2,0
Probability 10 Understand and apply Bayes’ theorem 1,0 3,0 1,0 5,0
S 15,0 19,0 12,0 4,0 50,0
% 30,0 38,0 24,0 8,0
Guideline: 15,0 22,5 10,0 2,5 50,0
% 30,0 45,0 20,0 5,0
Tolerance (Points): 2,0 3,0 2,0 2,0
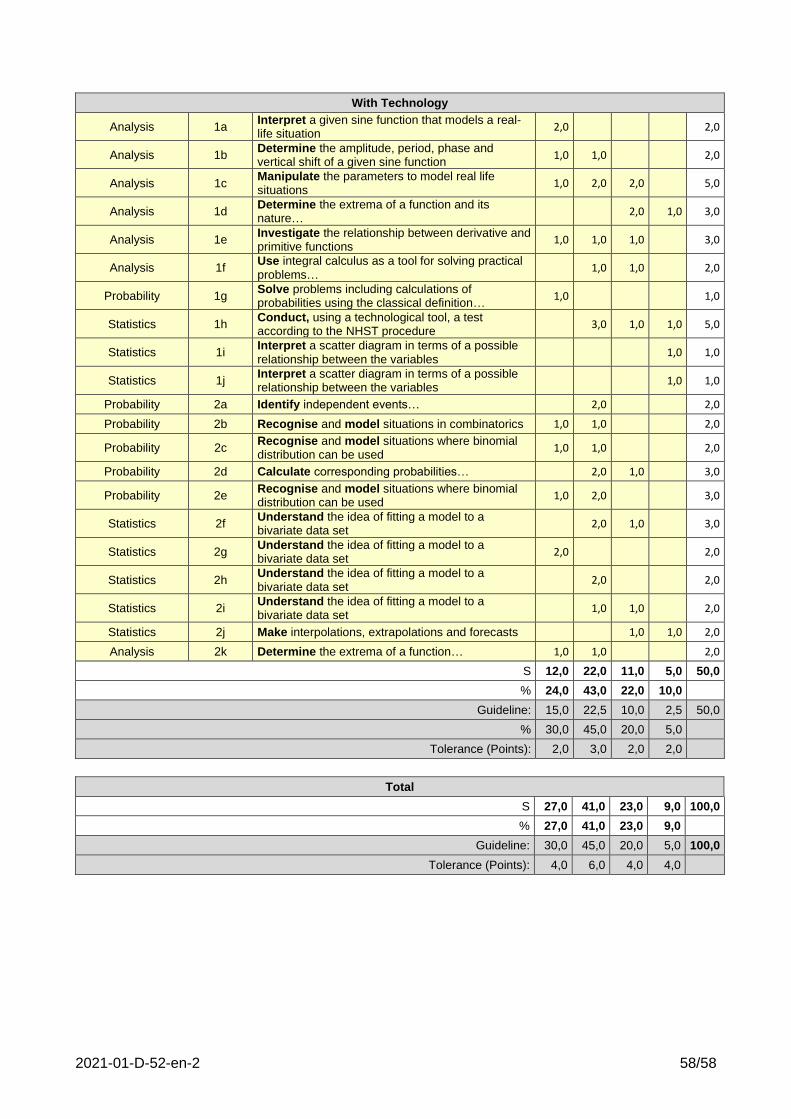
2021-01-D-52-en-2 58/58
With Technology
Analysis 1a Interpret a given sine function that models a real-life situation
2,0 2,0
Analysis 1b Determine the amplitude, period, phase and vertical shift of a given sine function
1,0 1,0 2,0
Analysis 1c Manipulate the parameters to model real life situations
1,0 2,0 2,0 5,0
Analysis 1d Determine the extrema of a function and its nature…
2,0 1,0 3,0
Analysis 1e Investigate the relationship between derivative and primitive functions
1,0 1,0 1,0 3,0
Analysis 1f Use integral calculus as a tool for solving practical problems…
1,0 1,0 2,0
Probability 1g Solve problems including calculations of probabilities using the classical definition…
1,0 1,0
Statistics 1h Conduct, using a technological tool, a test according to the NHST procedure
3,0 1,0 1,0 5,0
Statistics 1i Interpret a scatter diagram in terms of a possible relationship between the variables
1,0 1,0
Statistics 1j Interpret a scatter diagram in terms of a possible relationship between the variables
1,0 1,0
Probability 2a Identify independent events… 2,0 2,0
Probability 2b Recognise and model situations in combinatorics 1,0 1,0 2,0
Probability 2c Recognise and model situations where binomial distribution can be used
1,0 1,0 2,0
Probability 2d Calculate corresponding probabilities… 2,0 1,0 3,0
Probability 2e Recognise and model situations where binomial distribution can be used
1,0 2,0 3,0
Statistics 2f Understand the idea of fitting a model to a bivariate data set
2,0 1,0 3,0
Statistics 2g Understand the idea of fitting a model to a bivariate data set
2,0 2,0
Statistics 2h Understand the idea of fitting a model to a bivariate data set
2,0 2,0
Statistics 2i Understand the idea of fitting a model to a bivariate data set
1,0 1,0 2,0
Statistics 2j Make interpolations, extrapolations and forecasts 1,0 1,0 2,0
Analysis 2k Determine the extrema of a function… 1,0 1,0 2,0
S 12,0 22,0 11,0 5,0 50,0
% 24,0 43,0 22,0 10,0
Guideline: 15,0 22,5 10,0 2,5 50,0
% 30,0 45,0 20,0 5,0
Tolerance (Points): 2,0 3,0 2,0 2,0
Total
S 27,0 41,0 23,0 9,0 100,0
% 27,0 41,0 23,0 9,0
Guideline: 30,0 45,0 20,0 5,0 100,0
Tolerance (Points): 4,0 6,0 4,0 4,0


![S7-1200 Easy Book en [11 2009]](https://img.pdfslide.net/doc/110x75/634fe85a483af7f78c01e9ef/s7-1200-easy-book-en-11-2009.jpg)


