Embed Size (px)
Citation preview
2013
http://informahealthcare.com/pdrISSN: 1751-8423 (print), 1751-8431 (electronic)
Dev Neurorehabil, Early Online: 1–13! 2013 Informa UK Ltd. DOI: 10.3109/17518423.2013.806963
ORIGINAL ARTICLE
Matrix for assessment of activities and participation: Measuringfunctioning beyond diagnosis in young children with disabilities
Susana Castro & Ana Pinto
Faculty of Psychology and Educational Sciences, Porto University, Porto, Portugal
Abstract
Objective: (i) To study the functioning patterns of young children with disabilities comparedwith typically developing children, using a new ICF-CY based tool – the Matrix for Assessmentof Activities and Participation; (ii) study the factors that predict these functioning patterns.Methods: The MAAP tool was administered to three groups of children: (i) with autism, (ii) withother types of disabilities and (iii) typically developing.Results: Cluster analysis showed that children group according to the severity of theirfunctioning profile and not according to the diagnostic category in which they were classified.Multiple regression analysis showed that a model comprising the environmental factors andthe level of engagement in different routines of the child is a good predictor of these children’sfunctioning patterns.Conclusion: These results support a functional approach to disability instead of the traditionalmedical model approach, underlining the role of engagement and environment in determiningfunctioning.
Keywords
Engagement, environment, functioningpatterns, ICF-CY, measure
History
Received 8 March 2013Revised 13 May 2013Accepted 16 May 2013Published online 18 July 2013
Introduction
A growing body of literature has been focusing on the
usefulness of a functional approach to disability, particularly
in what concerns educational interventions in preschool
settings (e.g. [1, 2]), which may operationalized by the
International Classification of Functioning Disability and
Health for Children and Youth [3]. Based on this theoretical
framework and classification system, the aim of this article is
to describe the development of a new assessment measure, to
be used by preschool teachers in order to support an authentic
assessment [4] procedure of young children with disabilities,
to describe the study of reliability properties of this new tool
and to describe a first pilot study conducted with it.
The International Classification of FunctioningDisability and Health for Children and Youth as aframework for describing disability in young children
The International Classification of Functioning, Disability
and Health for Children and Youth [3] is part of the ‘‘Family
of Classifications’’ of the World Health Organization (WHO),
and it was preceded by an adult version, the ICF [5]. The
ICF model uses a multidimensional approach to disability
[6, 7]. Previously, the most widely used classifications,
the Diagnostic and Statistical Manual of Mental Disorders
(DSM-IV) [8] and the International Classification of Diseases
and Related Health Problems (ICD) [9] were based on a
medical approach to disability. While the ICD-10 provides
etiological information on specific diseases, the ICF describes
dimensions of functioning within a health condition, regard-
less of specific diagnosis.
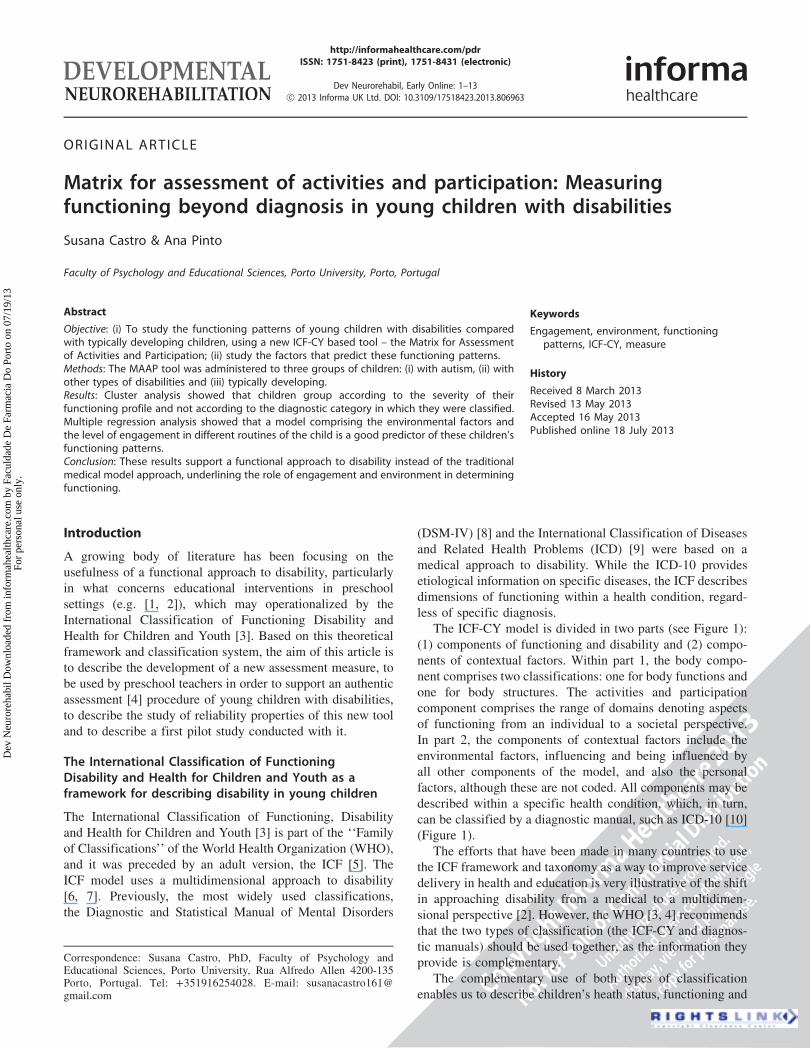
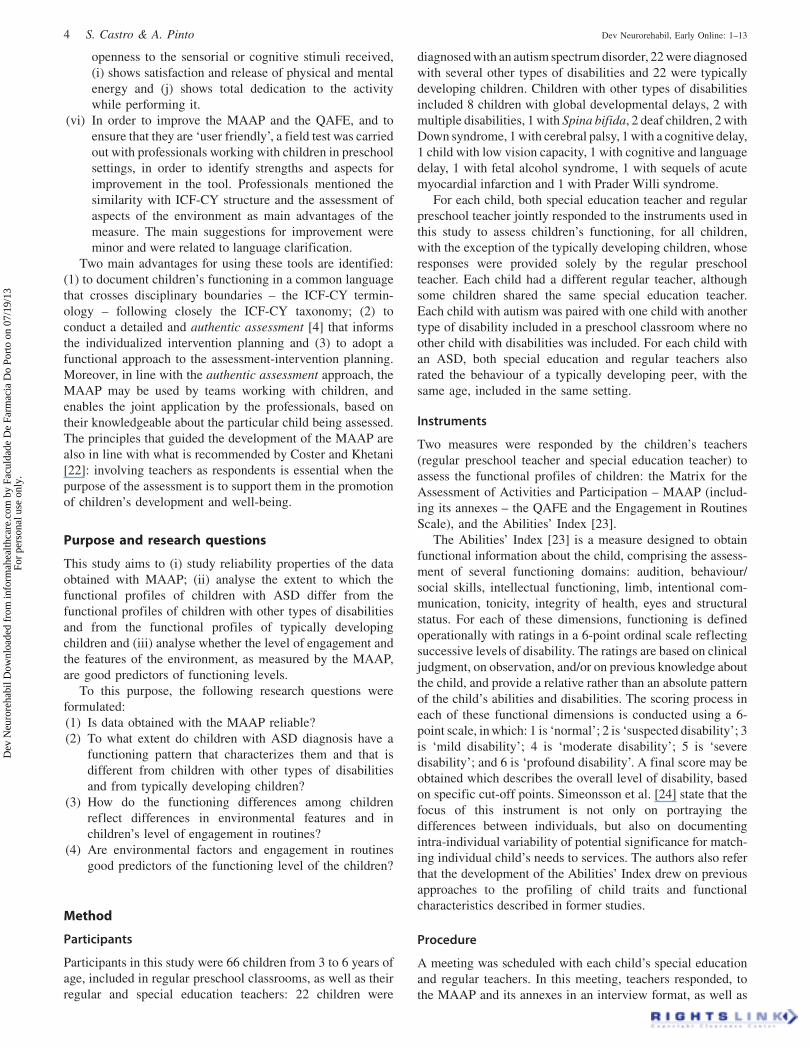
The ICF-CY model is divided in two parts (see Figure 1):
(1) components of functioning and disability and (2) compo-
nents of contextual factors. Within part 1, the body compo-
nent comprises two classifications: one for body functions and
one for body structures. The activities and participation
component comprises the range of domains denoting aspects
of functioning from an individual to a societal perspective.
In part 2, the components of contextual factors include the
environmental factors, influencing and being influenced by
all other components of the model, and also the personal
factors, although these are not coded. All components may be
described within a specific health condition, which, in turn,
can be classified by a diagnostic manual, such as ICD-10 [10]
(Figure 1).
The efforts that have been made in many countries to use
the ICF framework and taxonomy as a way to improve service
delivery in health and education is very illustrative of the shift
in approaching disability from a medical to a multidimen-
sional perspective [2]. However, the WHO [3, 4] recommends
that the two types of classification (the ICF-CY and diagnos-
tic manuals) should be used together, as the information they
provide is complementary.
The complementary use of both types of classification
enables us to describe children’s heath status, functioning and
Correspondence: Susana Castro, PhD, Faculty of Psychology andEducational Sciences, Porto University, Rua Alfredo Allen 4200-135Porto, Portugal. Tel: +351916254028. E-mail: [email protected]
Dev
Neu
rore
habi
l Dow
nloa
ded
from
info
rmah
ealth
care
.com
by
Facu
ldad
e D
e Fa
rmac
ia D
o Po
rto
on 0
7/19
/13
For
pers
onal
use
onl
y.
participation, in line with contextualistic approaches to
human development. In fact, the transactional nature of
development implies that children’s particular forms of
activities, ways of participating and environmental constraints
to optimal functioning are addressed, especially when their
development is not following a typical trajectory. The ICF-CY
version was designed to record these multilevel aspects of
children’s lives, using a common language and taxonomy to
address developmental changes and idiosyncrasies [3, 10].
In spite of the usefulness of such a broad classification
system, specific classes of ICF-CY codes may be defined in
order to characterize a specific functioning problem or health
condition, thus clarifying diagnostic information and provid-
ing a basis to plan interventions (core-sets). Castro and Pinto
[11] developed a core-set for young children with autism
spectrum disorders, however, other types of sets of ICF-CY
codes may be developed: for instance, Elligsen [12] devel-
oped a code set aimed to describe essential ICF-CY codes for
specific age groups in childhood. While the core-sets describe
functioning within a specific health condition, the code-sets
describe functioning for specific circumstances or life-
situations. Even when core-sets are developed for a specific
health condition, the ICF-CY provides a functioning profile,
rather than diagnostic information, with the purpose of
describing the nature and the severity of the limitations of
functioning and the environmental factors influencing them
[3, 5, 7].
The need for a new measure of functioning inpreschool contexts
According to Simeonsson et al. [3] (p. 603) ‘a key function of
a classification system is its ability to serve as a framework
for the development of assessment measures reflecting the
specified dimensions of that classification’. The authors also
recognize the limited availability of measurements to assess
functional limitations in children that are brief and effective,
based on an international taxonomy, and that are of use in
disability screening. Moreover, an essential requirement for
implementing effective intervention programs for children
with disabilities is the use of a common language to document
components of functioning and development. Adopting the
ICF-CY taxonomy in the development of new measures may
enable the use of such common language by providing a
match between the classification functioning dimensions for
assessment, and specific variables that will constitute items in
questionnaires and scales.
The Matrix for Assessment of Activities and Participation
(MAAP) was developed based on the activities and partici-
pation as well as on the environmental factors components of
the ICF-CY [3]. The aim was to provide an authentic
assessment procedure to professionals working with young
children with ASD in light of a functional approach to the
assessment-intervention process [4]. The measure is intended
to be used by early childhood special education professionals
to guide the assessment of children’s performance (ages 2 to
6) and surrounding environmental factors, based on their
functioning in daily natural settings, namely the preschool
classrooms. As the MAAP was designed taking the ICF-CY
taxonomy as a reference framework for content and structure
of the measurement, it provides a profile of child functioning
on the classification’s dimensions. It is also meant to be a
useful tool to support an authentic assessment. According to
Bagnato [13] (p. 27) authentic assessment is ‘the systematic
recording of developmental observations over time by famil-
iar and knowledgeable caregivers about the naturally
occurring competencies of young children in daily routines’.
Unlike the traditional testing, authentic assessment proced-
ures rely solely on information obtained in children’s natural
environments. Items of authentic assessment instruments are
not based on standardized content but on children’s real
behaviours, which are observed and considered as significant
for functioning in their daily routines. Also, these instruments
elicit teaching strategies because the items may be (and often
are) included as part of the curriculum [4]. As guidelines for
an authentic assessment procedure, Bagnato [13] suggests the
following: (a) sharing the assessment responsibilities with a
team; (b) conducting the assessment over time; (c) having a
team leader that becomes the ‘‘orchestrator’’ of the assess-
ment across professionals and contexts; (d) adopting a flexible
style to adjust the assessment process to the particular
Figure 1. The ICF/ICF-CY model.
2 S. Castro & A. Pinto Dev Neurorehabil, Early Online: 1–13
Dev
Neu
rore
habi
l Dow
nloa
ded
from
info
rmah
ealth
care
.com
by
Facu
ldad
e D
e Fa
rmac
ia D
o Po
rto
on 0
7/19
/13
For
pers
onal
use
onl
y.
characteristics of each child; (e) relying on parents’ judgments
and observations; (f) selecting ‘a common instrument to unify
interdisciplinary and interagency teamwork’; (g) employing
‘jargon-free materials’; (h) using instruments that are sensible
to child progress; (i) using technology to facilitate assessment
[3] (p. 35). According to this author, when an assessment is
authentic it yields information on children’s natural and
typical environments, on the characteristics of their own
ecology, documenting the functionality of such environments.
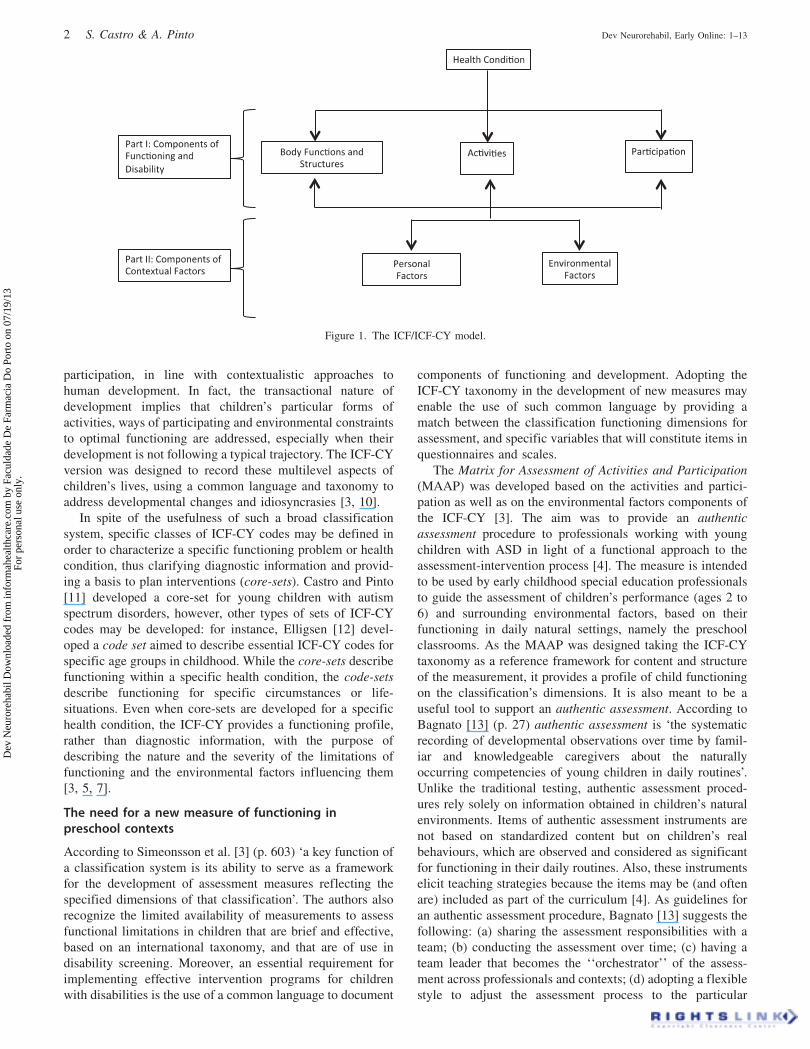
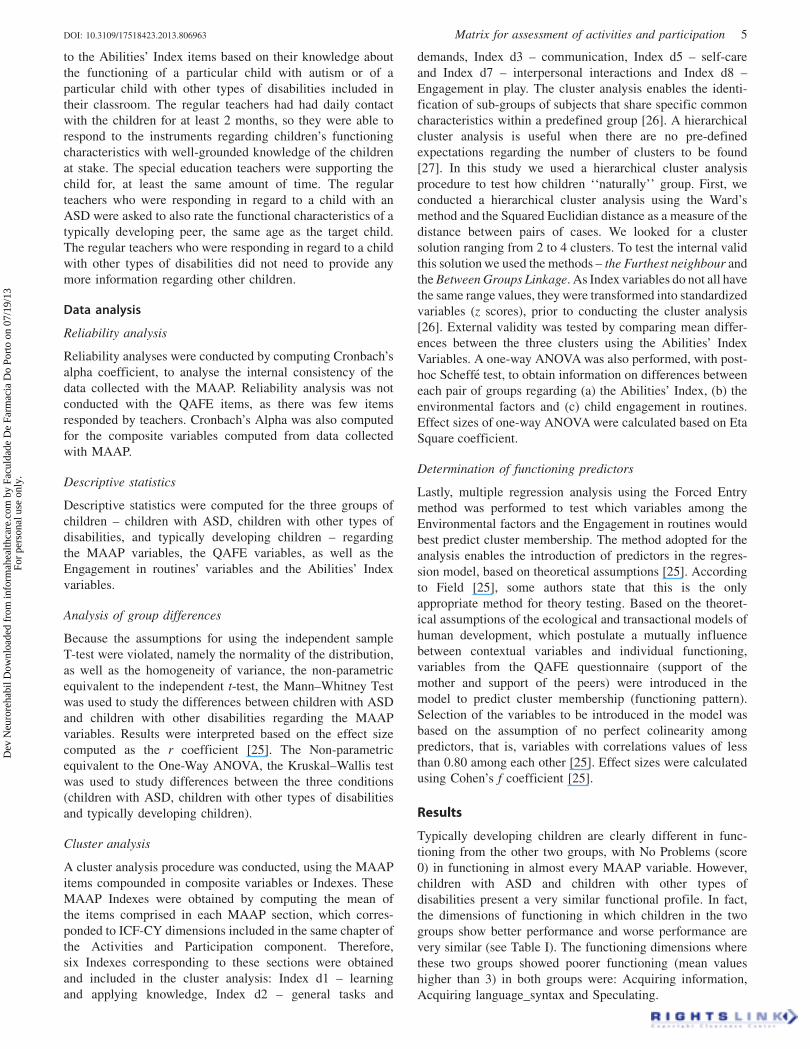
The MAAP comprises 45 items. An example of one item is
presented in Figure 2. Each item corresponds to an ICF-CY
functioning dimension that was regarded, by experts in the
field of early childhood special education, childhood disabil-
ity, child development and ASD, as Essential for the
assessment-intervention process of children diagnosed or
presenting signs of an ASD, from birth to 6 years of age (core-
set for ASD). In spite of the fact that the MAAP is to be used
for the assessment of children from 2 to 6 years of age,
functioning dimensions considered essential from birth to
2 years of age were included, as some children aged 2 and
above may present difficulties in functioning features
regarded as essential in lower ages.
The following procedure was adopted for the development
of the MAAP:
(i) Each ICF-CY functioning dimension included in the
core-set for ASD [11] was reformulated into an easy
understandable item, which was clear enough to guide
the observation of children’s performance, based on the
ICF-CY descriptor for each functioning dimension, as
well as on the content of items of assessment instru-
ments that were previously linked to the ICF-CY (e.g.,
ADOS, ADI-R, Carolina Curriculum) [14, 15].
(ii) Each item was complemented with a rating scale ranging
from 0 to 4. This scale corresponds to the ICF-CY
Universal Qualifier scale, enabling the identification of
the magnitude of the problem observed in that item.
A descriptor for each value of the scale was added, based
on two main criteria: frequency in time (according to the
ICF-CY suggestions on the percentage of time that the
problems in functioning affect the child’s daily life) and
the level of difficulty faced by the child.
(iii) Each item (see Figure 2) also includes a scale for rating
the developmental level of the child’s performance,
according to the age norms of the assessment measures
that were previously linked to the ICF-CY.
(iv) Besides the assessment of the Activities and
Participation functioning dimensions, the MAAP
includes a Questionnaire for the Assessment of Factors
of the Environment – QAFE. Environmental Factors
may be seen as scene-setters for the occurrence of
activities and forms of Participation [16], influencing
these dimensions of child functioning and being influen-
ced by them, in line with transactional and systemic
approaches to development [17, 18]. This questionnaire
contains all the dimensions of the environmental factors
component of the ICF-CY that were regarded as
Essential by experts to the assessment-intervention
process of young children with an ASD in the study
conducted by Castro and Pinto [11]. The universal
qualifier scale was adapted to include facilitators (0 to
þ4) and barriers (�4 to 0). Similarly to the previous
MAAP items, each value of the scale is further detailed
with a simple descriptor.
(v) Lastly, it was important to provide a way of assessing the
broad level of children’s engagement in their daily
routine. To complement the information on functioning
in light of the ICF-CY, an Engagement in routines scale
was included in the MAAP, in which professionals
interacting in a daily basis with the child being assessed,
are asked to identify the routines/life situations of the
child’s typical day and to rate the level of engagement
normally presented by the child in each of the identified
routines, in a scale ranging from 1 (not engaged) to 5
(totally engaged). In order to ensure that all professionals
have the same understanding of what ‘being engaged’
means, a summary of engagement characteristics
defined in scientific literature is provided [19–21]. The
engagement characteristics highlighted were the follow-
ing: a child who is engaged in a specific routine is a
child who: (a) spends most of the time in interaction
with the environment, (b) focuses on the target tasks,
(c) is interacting in an active, persistent/or and attentive
way, (d) presents a behaviour that is adequate to the
contextual demands and to his/her developmental level,
(f) exhibits different levels of competence, (g) shows
interest, motivation and/or fascination, (h) shows
2. Explores properties of objects in the surrounding environment through actions with more than one object, such as, completing puzzles, taking blocks out of a box and putting them inside again (d1311).
0 1 2 3 4
Always explores spontaneously
several objects simultaneously,
demonstrating interest and
manipulating them whenever they
are present in the surrounding
environment, without any dif�iculty.
Often explores several objects of the environment spontaneously, manipulating them independently. Sometimes you may need to direct his/her attention to the objects.
Has some dif�iculty in
simultaneously exploring various
objects from the surrounding
environment, spontaneously. Often
you have to direct his/her attention to the objects and
encourage exploration. However,
with this support can make an
exploration of objects with some frequency.
Demonstrates having a hard time
to spontaneously explore various
objects from the surrounding
environment. Almost always is necessary to direct his/her attention to the objects and
encourage their exploitation. Needs a lot of adult support to explore
multiple objects simultaneously.
Does not spontaneously explores several objects simultaneously. Even when calling his/her attention to the objects and encouraging exploration, he/she is not interested in handling, or explores only one object.
MARK THE BEHAVIOR WITH HIGHER DEVELOPMENTAL LEVEL THAT THE CHILD IS ABLE TO DEMONSTRATE, USING ANNEX I
NA A B C D
Figure 2. Example of one item of the MAAP.
DOI: 10.3109/17518423.2013.806963 Matrix for assessment of activities and participation 3
Dev
Neu
rore
habi
l Dow
nloa
ded
from
info
rmah
ealth
care
.com
by
Facu
ldad
e D
e Fa
rmac
ia D
o Po
rto
on 0
7/19
/13
For
pers
onal
use
onl
y.
openness to the sensorial or cognitive stimuli received,
(i) shows satisfaction and release of physical and mental
energy and (j) shows total dedication to the activity
while performing it.
(vi) In order to improve the MAAP and the QAFE, and to
ensure that they are ‘user friendly’, a field test was carried
out with professionals working with children in preschool
settings, in order to identify strengths and aspects for
improvement in the tool. Professionals mentioned the
similarity with ICF-CY structure and the assessment of
aspects of the environment as main advantages of the
measure. The main suggestions for improvement were
minor and were related to language clarification.
Two main advantages for using these tools are identified:
(1) to document children’s functioning in a common language
that crosses disciplinary boundaries – the ICF-CY termin-
ology – following closely the ICF-CY taxonomy; (2) to
conduct a detailed and authentic assessment [4] that informs
the individualized intervention planning and (3) to adopt a
functional approach to the assessment-intervention planning.
Moreover, in line with the authentic assessment approach, the
MAAP may be used by teams working with children, and
enables the joint application by the professionals, based on
their knowledgeable about the particular child being assessed.
The principles that guided the development of the MAAP are
also in line with what is recommended by Coster and Khetani
[22]: involving teachers as respondents is essential when the
purpose of the assessment is to support them in the promotion
of children’s development and well-being.
Purpose and research questions
This study aims to (i) study reliability properties of the data
obtained with MAAP; (ii) analyse the extent to which the
functional profiles of children with ASD differ from the
functional profiles of children with other types of disabilities
and from the functional profiles of typically developing
children and (iii) analyse whether the level of engagement and
the features of the environment, as measured by the MAAP,
are good predictors of functioning levels.
To this purpose, the following research questions were
formulated:
(1) Is data obtained with the MAAP reliable?
(2) To what extent do children with ASD diagnosis have a
functioning pattern that characterizes them and that is
different from children with other types of disabilities
and from typically developing children?
(3) How do the functioning differences among children
reflect differences in environmental features and in
children’s level of engagement in routines?
(4) Are environmental factors and engagement in routines
good predictors of the functioning level of the children?
Method
Participants
Participants in this study were 66 children from 3 to 6 years of
age, included in regular preschool classrooms, as well as their
regular and special education teachers: 22 children were
diagnosed with an autism spectrum disorder, 22 were diagnosed
with several other types of disabilities and 22 were typically
developing children. Children with other types of disabilities
included 8 children with global developmental delays, 2 with
multiple disabilities, 1 with Spina bifida, 2 deaf children, 2 with
Down syndrome, 1 with cerebral palsy, 1 with a cognitive delay,
1 child with low vision capacity, 1 with cognitive and language
delay, 1 with fetal alcohol syndrome, 1 with sequels of acute
myocardial infarction and 1 with Prader Willi syndrome.
For each child, both special education teacher and regular
preschool teacher jointly responded to the instruments used in
this study to assess children’s functioning, for all children,
with the exception of the typically developing children, whose
responses were provided solely by the regular preschool
teacher. Each child had a different regular teacher, although
some children shared the same special education teacher.
Each child with autism was paired with one child with another
type of disability included in a preschool classroom where no
other child with disabilities was included. For each child with
an ASD, both special education and regular teachers also
rated the behaviour of a typically developing peer, with the
same age, included in the same setting.
Instruments
Two measures were responded by the children’s teachers
(regular preschool teacher and special education teacher) to
assess the functional profiles of children: the Matrix for the
Assessment of Activities and Participation – MAAP (includ-
ing its annexes – the QAFE and the Engagement in Routines
Scale), and the Abilities’ Index [23].
The Abilities’ Index [23] is a measure designed to obtain
functional information about the child, comprising the assess-
ment of several functioning domains: audition, behaviour/
social skills, intellectual functioning, limb, intentional com-
munication, tonicity, integrity of health, eyes and structural
status. For each of these dimensions, functioning is defined
operationally with ratings in a 6-point ordinal scale reflecting
successive levels of disability. The ratings are based on clinical
judgment, on observation, and/or on previous knowledge about
the child, and provide a relative rather than an absolute pattern
of the child’s abilities and disabilities. The scoring process in
each of these functional dimensions is conducted using a 6-
point scale, in which: 1 is ‘normal’; 2 is ‘suspected disability’; 3
is ‘mild disability’; 4 is ‘moderate disability’; 5 is ‘severe
disability’; and 6 is ‘profound disability’. A final score may be
obtained which describes the overall level of disability, based
on specific cut-off points. Simeonsson et al. [24] state that the
focus of this instrument is not only on portraying the
differences between individuals, but also on documenting
intra-individual variability of potential significance for match-
ing individual child’s needs to services. The authors also refer
that the development of the Abilities’ Index drew on previous
approaches to the profiling of child traits and functional
characteristics described in former studies.
Procedure
A meeting was scheduled with each child’s special education
and regular teachers. In this meeting, teachers responded, to
the MAAP and its annexes in an interview format, as well as
4 S. Castro & A. Pinto Dev Neurorehabil, Early Online: 1–13
Dev
Neu
rore
habi
l Dow
nloa
ded
from
info
rmah
ealth
care
.com
by
Facu
ldad
e D
e Fa
rmac
ia D
o Po
rto
on 0
7/19
/13
For
pers
onal
use
onl
y.
to the Abilities’ Index items based on their knowledge about
the functioning of a particular child with autism or of a
particular child with other types of disabilities included in
their classroom. The regular teachers had had daily contact
with the children for at least 2 months, so they were able to
respond to the instruments regarding children’s functioning
characteristics with well-grounded knowledge of the children
at stake. The special education teachers were supporting the
child for, at least the same amount of time. The regular
teachers who were responding in regard to a child with an
ASD were asked to also rate the functional characteristics of a
typically developing peer, the same age as the target child.
The regular teachers who were responding in regard to a child
with other types of disabilities did not need to provide any
more information regarding other children.
Data analysis
Reliability analysis
Reliability analyses were conducted by computing Cronbach’s
alpha coefficient, to analyse the internal consistency of the
data collected with the MAAP. Reliability analysis was not
conducted with the QAFE items, as there was few items
responded by teachers. Cronbach’s Alpha was also computed
for the composite variables computed from data collected
with MAAP.
Descriptive statistics
Descriptive statistics were computed for the three groups of
children – children with ASD, children with other types of
disabilities, and typically developing children – regarding
the MAAP variables, the QAFE variables, as well as the
Engagement in routines’ variables and the Abilities’ Index
variables.
Analysis of group differences
Because the assumptions for using the independent sample
T-test were violated, namely the normality of the distribution,
as well as the homogeneity of variance, the non-parametric
equivalent to the independent t-test, the Mann–Whitney Test
was used to study the differences between children with ASD
and children with other disabilities regarding the MAAP
variables. Results were interpreted based on the effect size
computed as the r coefficient [25]. The Non-parametric
equivalent to the One-Way ANOVA, the Kruskal–Wallis test
was used to study differences between the three conditions
(children with ASD, children with other types of disabilities
and typically developing children).
Cluster analysis
A cluster analysis procedure was conducted, using the MAAP
items compounded in composite variables or Indexes. These
MAAP Indexes were obtained by computing the mean of
the items comprised in each MAAP section, which corres-
ponded to ICF-CY dimensions included in the same chapter of
the Activities and Participation component. Therefore,
six Indexes corresponding to these sections were obtained
and included in the cluster analysis: Index d1 – learning
and applying knowledge, Index d2 – general tasks and
demands, Index d3 – communication, Index d5 – self-care
and Index d7 – interpersonal interactions and Index d8 –
Engagement in play. The cluster analysis enables the identi-
fication of sub-groups of subjects that share specific common
characteristics within a predefined group [26]. A hierarchical
cluster analysis is useful when there are no pre-defined
expectations regarding the number of clusters to be found
[27]. In this study we used a hierarchical cluster analysis
procedure to test how children ‘‘naturally’’ group. First, we
conducted a hierarchical cluster analysis using the Ward’s
method and the Squared Euclidian distance as a measure of the
distance between pairs of cases. We looked for a cluster
solution ranging from 2 to 4 clusters. To test the internal valid
this solution we used the methods – the Furthest neighbour and
the Between Groups Linkage. As Index variables do not all have
the same range values, they were transformed into standardized
variables (z scores), prior to conducting the cluster analysis
[26]. External validity was tested by comparing mean differ-
ences between the three clusters using the Abilities’ Index
Variables. A one-way ANOVA was also performed, with post-
hoc Scheffe test, to obtain information on differences between
each pair of groups regarding (a) the Abilities’ Index, (b) the
environmental factors and (c) child engagement in routines.
Effect sizes of one-way ANOVA were calculated based on Eta
Square coefficient.
Determination of functioning predictors
Lastly, multiple regression analysis using the Forced Entry
method was performed to test which variables among the
Environmental factors and the Engagement in routines would
best predict cluster membership. The method adopted for the
analysis enables the introduction of predictors in the regres-
sion model, based on theoretical assumptions [25]. According
to Field [25], some authors state that this is the only
appropriate method for theory testing. Based on the theoret-
ical assumptions of the ecological and transactional models of
human development, which postulate a mutually influence
between contextual variables and individual functioning,
variables from the QAFE questionnaire (support of the
mother and support of the peers) were introduced in the
model to predict cluster membership (functioning pattern).
Selection of the variables to be introduced in the model was
based on the assumption of no perfect colinearity among
predictors, that is, variables with correlations values of less
than 0.80 among each other [25]. Effect sizes were calculated
using Cohen’s f coefficient [25].
Results
Typically developing children are clearly different in func-
tioning from the other two groups, with No Problems (score
0) in functioning in almost every MAAP variable. However,
children with ASD and children with other types of
disabilities present a very similar functional profile. In fact,
the dimensions of functioning in which children in the two
groups show better performance and worse performance are
very similar (see Table I). The functioning dimensions where
these two groups showed poorer functioning (mean values
higher than 3) in both groups were: Acquiring information,
Acquiring language_syntax and Speculating.
DOI: 10.3109/17518423.2013.806963 Matrix for assessment of activities and participation 5
Dev
Neu
rore
habi
l Dow
nloa
ded
from
info
rmah
ealth
care
.com
by
Facu
ldad
e D
e Fa
rmac
ia D
o Po
rto
on 0
7/19
/13
For
pers
onal
use
onl
y.
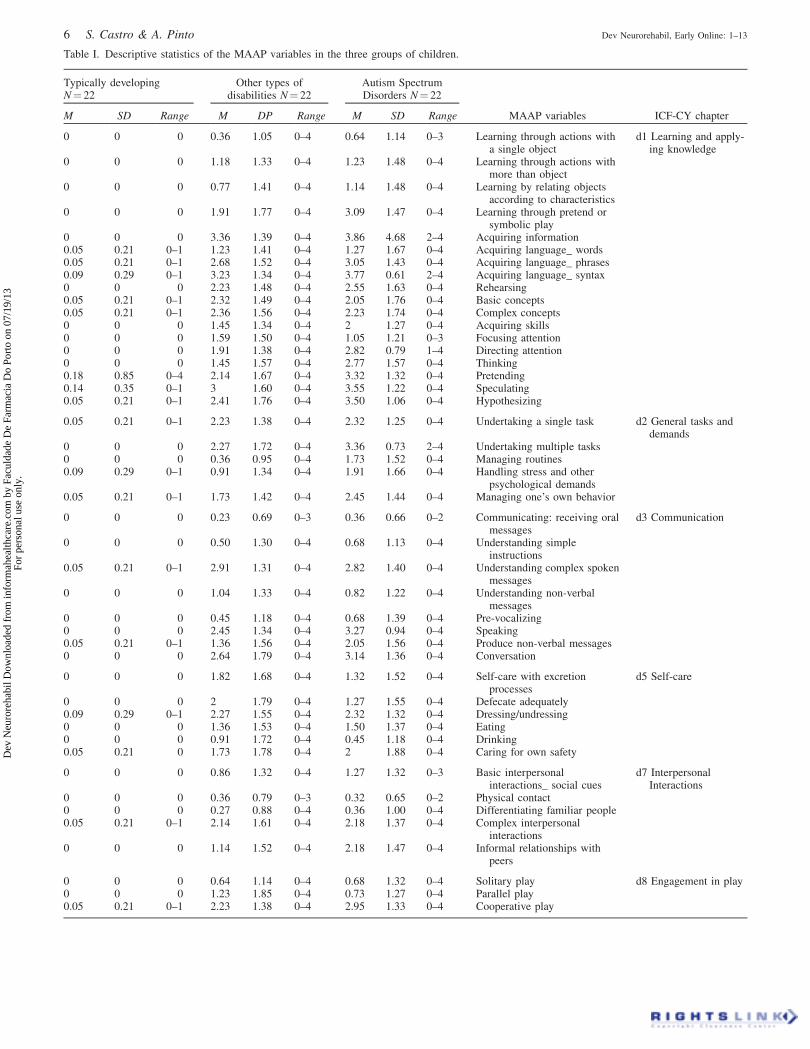
Table I. Descriptive statistics of the MAAP variables in the three groups of children.
Typically developingN¼ 22
Other types ofdisabilities N¼ 22
Autism SpectrumDisorders N¼ 22
M SD Range M DP Range M SD Range MAAP variables ICF-CY chapter
0 0 0 0.36 1.05 0–4 0.64 1.14 0–3 Learning through actions witha single object
d1 Learning and apply-ing knowledge
0 0 0 1.18 1.33 0–4 1.23 1.48 0–4 Learning through actions withmore than object
0 0 0 0.77 1.41 0–4 1.14 1.48 0–4 Learning by relating objectsaccording to characteristics
0 0 0 1.91 1.77 0–4 3.09 1.47 0–4 Learning through pretend orsymbolic play
0 0 0 3.36 1.39 0–4 3.86 4.68 2–4 Acquiring information0.05 0.21 0–1 1.23 1.41 0–4 1.27 1.67 0–4 Acquiring language_ words0.05 0.21 0–1 2.68 1.52 0–4 3.05 1.43 0–4 Acquiring language_ phrases0.09 0.29 0–1 3.23 1.34 0–4 3.77 0.61 2–4 Acquiring language_ syntax0 0 0 2.23 1.48 0–4 2.55 1.63 0–4 Rehearsing0.05 0.21 0–1 2.32 1.49 0–4 2.05 1.76 0–4 Basic concepts0.05 0.21 0–1 2.36 1.56 0–4 2.23 1.74 0–4 Complex concepts0 0 0 1.45 1.34 0–4 2 1.27 0–4 Acquiring skills0 0 0 1.59 1.50 0–4 1.05 1.21 0–3 Focusing attention0 0 0 1.91 1.38 0–4 2.82 0.79 1–4 Directing attention0 0 0 1.45 1.57 0–4 2.77 1.57 0–4 Thinking0.18 0.85 0–4 2.14 1.67 0–4 3.32 1.32 0–4 Pretending0.14 0.35 0–1 3 1.60 0–4 3.55 1.22 0–4 Speculating0.05 0.21 0–1 2.41 1.76 0–4 3.50 1.06 0–4 Hypothesizing
0.05 0.21 0–1 2.23 1.38 0–4 2.32 1.25 0–4 Undertaking a single task d2 General tasks anddemands
0 0 0 2.27 1.72 0–4 3.36 0.73 2–4 Undertaking multiple tasks0 0 0 0.36 0.95 0–4 1.73 1.52 0–4 Managing routines0.09 0.29 0–1 0.91 1.34 0–4 1.91 1.66 0–4 Handling stress and other
psychological demands0.05 0.21 0–1 1.73 1.42 0–4 2.45 1.44 0–4 Managing one’s own behavior
0 0 0 0.23 0.69 0–3 0.36 0.66 0–2 Communicating: receiving oralmessages
d3 Communication
0 0 0 0.50 1.30 0–4 0.68 1.13 0–4 Understanding simpleinstructions
0.05 0.21 0–1 2.91 1.31 0–4 2.82 1.40 0–4 Understanding complex spokenmessages
0 0 0 1.04 1.33 0–4 0.82 1.22 0–4 Understanding non-verbalmessages
0 0 0 0.45 1.18 0–4 0.68 1.39 0–4 Pre-vocalizing0 0 0 2.45 1.34 0–4 3.27 0.94 0–4 Speaking0.05 0.21 0–1 1.36 1.56 0–4 2.05 1.56 0–4 Produce non-verbal messages0 0 0 2.64 1.79 0–4 3.14 1.36 0–4 Conversation
0 0 0 1.82 1.68 0–4 1.32 1.52 0–4 Self-care with excretionprocesses
d5 Self-care
0 0 0 2 1.79 0–4 1.27 1.55 0–4 Defecate adequately0.09 0.29 0–1 2.27 1.55 0–4 2.32 1.32 0–4 Dressing/undressing0 0 0 1.36 1.53 0–4 1.50 1.37 0–4 Eating0 0 0 0.91 1.72 0–4 0.45 1.18 0–4 Drinking0.05 0.21 0 1.73 1.78 0–4 2 1.88 0–4 Caring for own safety
0 0 0 0.86 1.32 0–4 1.27 1.32 0–3 Basic interpersonalinteractions_ social cues
d7 InterpersonalInteractions
0 0 0 0.36 0.79 0–3 0.32 0.65 0–2 Physical contact0 0 0 0.27 0.88 0–4 0.36 1.00 0–4 Differentiating familiar people0.05 0.21 0–1 2.14 1.61 0–4 2.18 1.37 0–4 Complex interpersonal
interactions0 0 0 1.14 1.52 0–4 2.18 1.47 0–4 Informal relationships with
peers
0 0 0 0.64 1.14 0–4 0.68 1.32 0–4 Solitary play d8 Engagement in play0 0 0 1.23 1.85 0–4 0.73 1.27 0–4 Parallel play0.05 0.21 0–1 2.23 1.38 0–4 2.95 1.33 0–4 Cooperative play
6 S. Castro & A. Pinto Dev Neurorehabil, Early Online: 1–13
Dev
Neu
rore
habi
l Dow
nloa
ded
from
info
rmah
ealth
care
.com
by
Facu
ldad
e D
e Fa
rmac
ia D
o Po
rto
on 0
7/19
/13
For
pers
onal
use
onl
y.
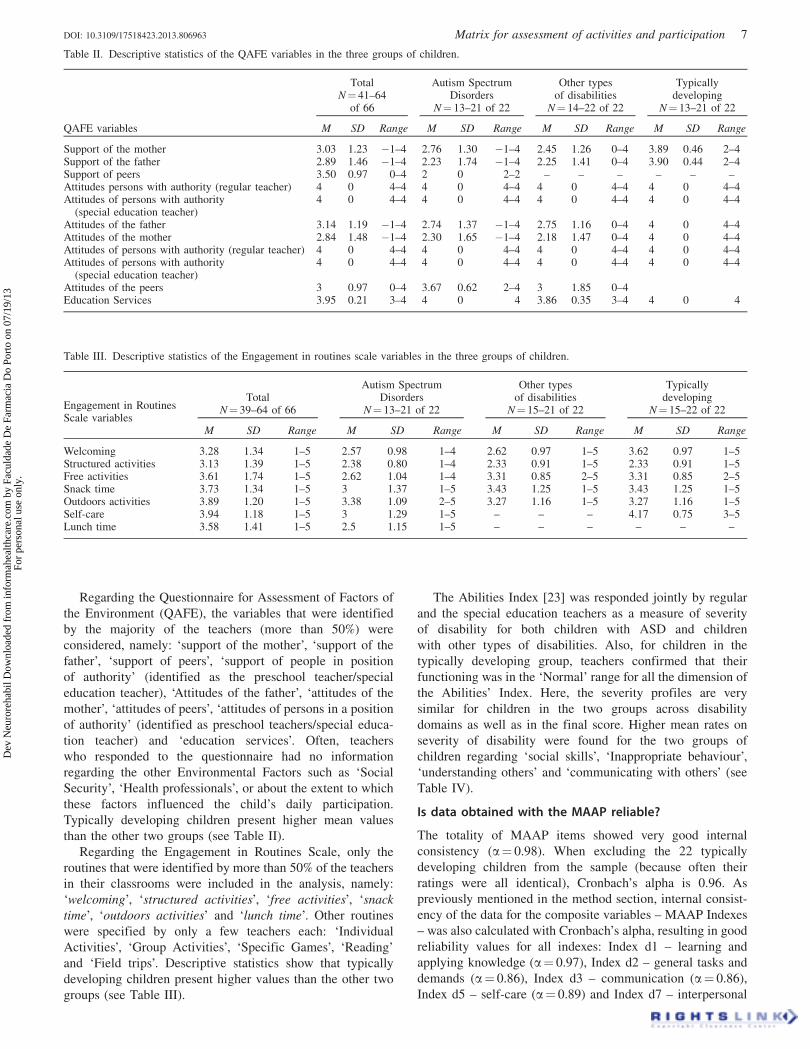
Regarding the Questionnaire for Assessment of Factors of
the Environment (QAFE), the variables that were identified
by the majority of the teachers (more than 50%) were
considered, namely: ‘support of the mother’, ‘support of the
father’, ‘support of peers’, ‘support of people in position
of authority’ (identified as the preschool teacher/special
education teacher), ‘Attitudes of the father’, ‘attitudes of the
mother’, ‘attitudes of peers’, ‘attitudes of persons in a position
of authority’ (identified as preschool teachers/special educa-
tion teacher) and ‘education services’. Often, teachers
who responded to the questionnaire had no information
regarding the other Environmental Factors such as ‘Social
Security’, ‘Health professionals’, or about the extent to which
these factors influenced the child’s daily participation.
Typically developing children present higher mean values
than the other two groups (see Table II).
Regarding the Engagement in Routines Scale, only the
routines that were identified by more than 50% of the teachers
in their classrooms were included in the analysis, namely:
‘welcoming’, ‘structured activities’, ‘free activities’, ‘snack
time’, ‘outdoors activities’ and ‘lunch time’. Other routines
were specified by only a few teachers each: ‘Individual
Activities’, ‘Group Activities’, ‘Specific Games’, ‘Reading’
and ‘Field trips’. Descriptive statistics show that typically
developing children present higher values than the other two
groups (see Table III).
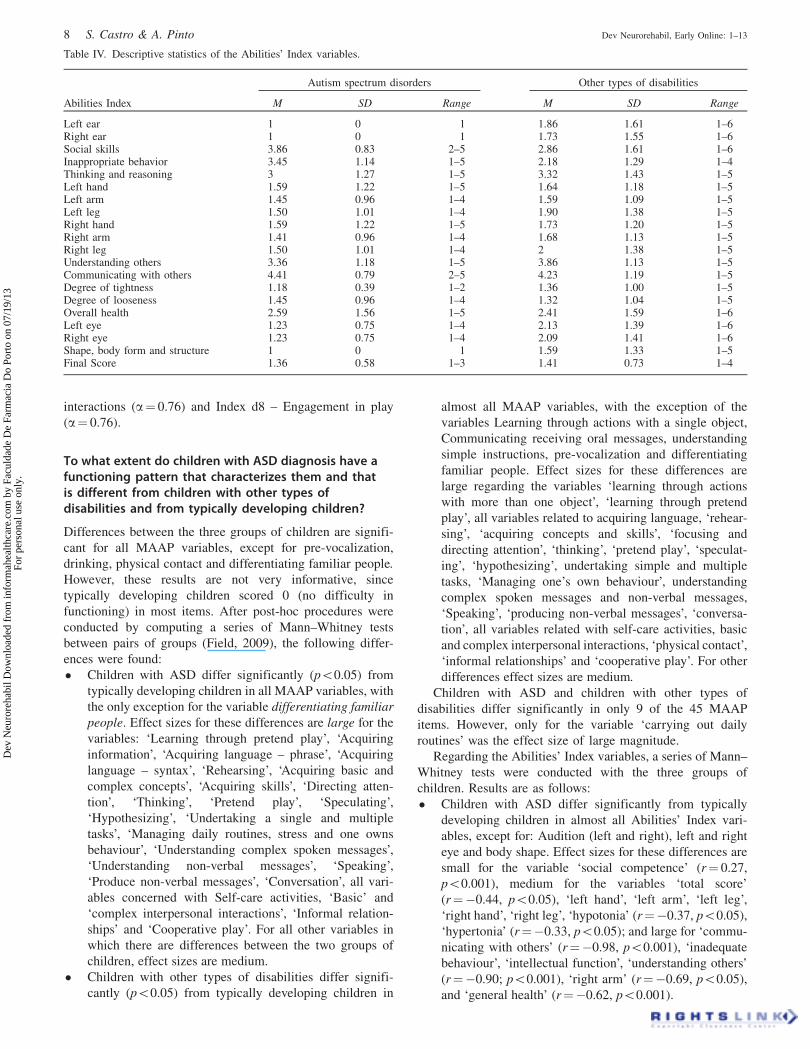
The Abilities Index [23] was responded jointly by regular
and the special education teachers as a measure of severity
of disability for both children with ASD and children
with other types of disabilities. Also, for children in the
typically developing group, teachers confirmed that their
functioning was in the ‘Normal’ range for all the dimension of
the Abilities’ Index. Here, the severity profiles are very
similar for children in the two groups across disability
domains as well as in the final score. Higher mean rates on
severity of disability were found for the two groups of
children regarding ‘social skills’, ‘Inappropriate behaviour’,
‘understanding others’ and ‘communicating with others’ (see
Table IV).
Is data obtained with the MAAP reliable?
The totality of MAAP items showed very good internal
consistency (a¼ 0.98). When excluding the 22 typically
developing children from the sample (because often their
ratings were all identical), Cronbach’s alpha is 0.96. As
previously mentioned in the method section, internal consist-
ency of the data for the composite variables – MAAP Indexes
– was also calculated with Cronbach’s alpha, resulting in good
reliability values for all indexes: Index d1 – learning and
applying knowledge (a¼ 0.97), Index d2 – general tasks and
demands (a¼ 0.86), Index d3 – communication (a¼ 0.86),
Index d5 – self-care (a¼ 0.89) and Index d7 – interpersonal
Table II. Descriptive statistics of the QAFE variables in the three groups of children.
TotalN¼ 41–64
of 66
Autism SpectrumDisorders
N¼ 13–21 of 22
Other typesof disabilities
N¼ 14–22 of 22
Typicallydeveloping
N¼ 13–21 of 22
QAFE variables M SD Range M SD Range M SD Range M SD Range
Support of the mother 3.03 1.23 �1–4 2.76 1.30 �1–4 2.45 1.26 0–4 3.89 0.46 2–4Support of the father 2.89 1.46 �1–4 2.23 1.74 �1–4 2.25 1.41 0–4 3.90 0.44 2–4Support of peers 3.50 0.97 0–4 2 0 2–2 – – – – – –Attitudes persons with authority (regular teacher) 4 0 4–4 4 0 4–4 4 0 4–4 4 0 4–4Attitudes of persons with authority
(special education teacher)4 0 4–4 4 0 4–4 4 0 4–4 4 0 4–4
Attitudes of the father 3.14 1.19 �1–4 2.74 1.37 �1–4 2.75 1.16 0–4 4 0 4–4Attitudes of the mother 2.84 1.48 �1–4 2.30 1.65 �1–4 2.18 1.47 0–4 4 0 4–4Attitudes of persons with authority (regular teacher) 4 0 4–4 4 0 4–4 4 0 4–4 4 0 4–4Attitudes of persons with authority
(special education teacher)4 0 4–4 4 0 4–4 4 0 4–4 4 0 4–4
Attitudes of the peers 3 0.97 0–4 3.67 0.62 2–4 3 1.85 0–4Education Services 3.95 0.21 3–4 4 0 4 3.86 0.35 3–4 4 0 4
Table III. Descriptive statistics of the Engagement in routines scale variables in the three groups of children.
Engagement in RoutinesScale variables
TotalN¼ 39–64 of 66
Autism SpectrumDisorders
N¼ 13–21 of 22
Other typesof disabilities
N¼ 15–21 of 22
Typicallydeveloping
N¼ 15–22 of 22
M SD Range M SD Range M SD Range M SD Range
Welcoming 3.28 1.34 1–5 2.57 0.98 1–4 2.62 0.97 1–5 3.62 0.97 1–5Structured activities 3.13 1.39 1–5 2.38 0.80 1–4 2.33 0.91 1–5 2.33 0.91 1–5Free activities 3.61 1.74 1–5 2.62 1.04 1–4 3.31 0.85 2–5 3.31 0.85 2–5Snack time 3.73 1.34 1–5 3 1.37 1–5 3.43 1.25 1–5 3.43 1.25 1–5Outdoors activities 3.89 1.20 1–5 3.38 1.09 2–5 3.27 1.16 1–5 3.27 1.16 1–5Self-care 3.94 1.18 1–5 3 1.29 1–5 – – – 4.17 0.75 3–5Lunch time 3.58 1.41 1–5 2.5 1.15 1–5 – – – – – –
DOI: 10.3109/17518423.2013.806963 Matrix for assessment of activities and participation 7
Dev
Neu
rore
habi
l Dow
nloa
ded
from
info
rmah
ealth
care
.com
by
Facu
ldad
e D
e Fa
rmac
ia D
o Po
rto
on 0
7/19
/13
For
pers
onal
use
onl
y.
interactions (a¼ 0.76) and Index d8 – Engagement in play
(a¼ 0.76).
To what extent do children with ASD diagnosis have afunctioning pattern that characterizes them and thatis different from children with other types ofdisabilities and from typically developing children?
Differences between the three groups of children are signifi-
cant for all MAAP variables, except for pre-vocalization,
drinking, physical contact and differentiating familiar people.
However, these results are not very informative, since
typically developing children scored 0 (no difficulty in
functioning) in most items. After post-hoc procedures were
conducted by computing a series of Mann–Whitney tests
between pairs of groups (Field, 2009), the following differ-
ences were found:
� Children with ASD differ significantly (p50.05) from
typically developing children in all MAAP variables, with
the only exception for the variable differentiating familiar
people. Effect sizes for these differences are large for the
variables: ‘Learning through pretend play’, ‘Acquiring
information’, ‘Acquiring language – phrase’, ‘Acquiring
language – syntax’, ‘Rehearsing’, ‘Acquiring basic and
complex concepts’, ‘Acquiring skills’, ‘Directing atten-
tion’, ‘Thinking’, ‘Pretend play’, ‘Speculating’,
‘Hypothesizing’, ‘Undertaking a single and multiple
tasks’, ‘Managing daily routines, stress and one owns
behaviour’, ‘Understanding complex spoken messages’,
‘Understanding non-verbal messages’, ‘Speaking’,
‘Produce non-verbal messages’, ‘Conversation’, all vari-
ables concerned with Self-care activities, ‘Basic’ and
‘complex interpersonal interactions’, ‘Informal relation-
ships’ and ‘Cooperative play’. For all other variables in
which there are differences between the two groups of
children, effect sizes are medium.
� Children with other types of disabilities differ signifi-
cantly (p50.05) from typically developing children in
almost all MAAP variables, with the exception of the
variables Learning through actions with a single object,
Communicating receiving oral messages, understanding
simple instructions, pre-vocalization and differentiating
familiar people. Effect sizes for these differences are
large regarding the variables ‘learning through actions
with more than one object’, ‘learning through pretend
play’, all variables related to acquiring language, ‘rehear-
sing’, ‘acquiring concepts and skills’, ‘focusing and
directing attention’, ‘thinking’, ‘pretend play’, ‘speculat-
ing’, ‘hypothesizing’, undertaking simple and multiple
tasks, ‘Managing one’s own behaviour’, understanding
complex spoken messages and non-verbal messages,
‘Speaking’, ‘producing non-verbal messages’, ‘conversa-
tion’, all variables related with self-care activities, basic
and complex interpersonal interactions, ‘physical contact’,
‘informal relationships’ and ‘cooperative play’. For other
differences effect sizes are medium.
Children with ASD and children with other types of
disabilities differ significantly in only 9 of the 45 MAAP
items. However, only for the variable ‘carrying out daily
routines’ was the effect size of large magnitude.
Regarding the Abilities’ Index variables, a series of Mann–
Whitney tests were conducted with the three groups of
children. Results are as follows:
� Children with ASD differ significantly from typically
developing children in almost all Abilities’ Index vari-
ables, except for: Audition (left and right), left and right
eye and body shape. Effect sizes for these differences are
small for the variable ‘social competence’ (r¼ 0.27,
p50.001), medium for the variables ‘total score’
(r¼�0.44, p50.05), ‘left hand’, ‘left arm’, ‘left leg’,
‘right hand’, ‘right leg’, ‘hypotonia’ (r¼�0.37, p50.05),
‘hypertonia’ (r¼�0.33, p50.05); and large for ‘commu-
nicating with others’ (r¼�0.98, p50.001), ‘inadequate
behaviour’, ‘intellectual function’, ‘understanding others’
(r¼�0.90; p50.001), ‘right arm’ (r¼�0.69, p50.05),
and ‘general health’ (r¼�0.62, p50.001).
Table IV. Descriptive statistics of the Abilities’ Index variables.
Autism spectrum disorders Other types of disabilities
Abilities Index M SD Range M SD Range
Left ear 1 0 1 1.86 1.61 1–6Right ear 1 0 1 1.73 1.55 1–6Social skills 3.86 0.83 2–5 2.86 1.61 1–6Inappropriate behavior 3.45 1.14 1–5 2.18 1.29 1–4Thinking and reasoning 3 1.27 1–5 3.32 1.43 1–5Left hand 1.59 1.22 1–5 1.64 1.18 1–5Left arm 1.45 0.96 1–4 1.59 1.09 1–5Left leg 1.50 1.01 1–4 1.90 1.38 1–5Right hand 1.59 1.22 1–5 1.73 1.20 1–5Right arm 1.41 0.96 1–4 1.68 1.13 1–5Right leg 1.50 1.01 1–4 2 1.38 1–5Understanding others 3.36 1.18 1–5 3.86 1.13 1–5Communicating with others 4.41 0.79 2–5 4.23 1.19 1–5Degree of tightness 1.18 0.39 1–2 1.36 1.00 1–5Degree of looseness 1.45 0.96 1–4 1.32 1.04 1–5Overall health 2.59 1.56 1–5 2.41 1.59 1–6Left eye 1.23 0.75 1–4 2.13 1.39 1–6Right eye 1.23 0.75 1–4 2.09 1.41 1–6Shape, body form and structure 1 0 1 1.59 1.33 1–5Final Score 1.36 0.58 1–3 1.41 0.73 1–4
8 S. Castro & A. Pinto Dev Neurorehabil, Early Online: 1–13
Dev
Neu
rore
habi
l Dow
nloa
ded
from
info
rmah
ealth
care
.com
by
Facu
ldad
e D
e Fa
rmac
ia D
o Po
rto
on 0
7/19
/13
For
pers
onal
use
onl
y.
� Children with other types of disabilities also differ
significantly from typically developing children in almost
all variables, excepting: audition (right), left hand, left
arm, Hypertonia, Hypotonia and body shape. Effect sizes
of the differences are medium for the variables ‘left eye’
(r¼�0.51, p� 0.001), ‘inadequate behaviour’ and ‘right
leg’ (r¼�0.49, p50.05), ‘general health’ (r¼�0.41,
p� 0.001), ‘right eye’ (r¼�0.41, p� 0.05), ‘left leg’
(r¼�0.37, p50.05), ‘right hand’, ‘right arm’ and
‘audition-left’ and ‘total score’ (r¼�0.32, p50.05);
and large for the variables ‘social competence’
(r¼�0.94, p50.001), ‘understanding others’ and com-
municate with others (r¼�0.81, p50.001), and ‘intel-
lectual function’ (r¼�0.75, p50.001).
� Children with ASD and children with other types of
disabilities only differ in regard to seven variables of the
Abilities’ Index. However, effect sizes for these differ-
ences are all medium.
In what concerns the Engagement in routines scale, similar
results have been observed:
� Children with ASD and typically developing children
differ significantly from each other in terms of engage-
ments level in preschool routines (p50.001). Children
with ASD present lower levels of engagement when
compared to typically developing children in all analysed
routines: ‘welcoming’ (r¼ 0.76), structured activities
(r¼ 0.79), ‘free activities’ (r¼ 0.64), ‘snack time’
(r¼ 0.65), ‘outdoors/recess activities’ (r¼ 0.67) and
‘lunch time’ (r¼ 0.71).
� Children with other types of disabilities also present
significantly lower levels of engagement in preschool
routines when compared to typically developing children
(p� 0.001): ‘welcoming’ (r¼ 0.73), ‘structured activities’
(r¼ 0.76), ‘free activities’ (r¼ 0.59), ‘snack time’
(r¼ 0.58), ‘outdoors activities’ (r¼ 0.69) and ‘lunch
time’ (r¼ 0.52).
� Children with ASD and children with other types of
disabilities do not differ in the level of engagement they
present in all of the analysed preschool routines.
In relation to the Environmental factors that were rated as
facilitators or barriers by more than 50% of the inquired
professionals, results are as follows:
� Children with ASD differ significantly from typically
developing children regarding the variables: ‘support of
the mother’ (r¼ 0.57, p50.001), ‘support of people in
position of authority’ (r¼ 0.38, p50.001) and ‘attitudes
of the father’ (r¼ 0.49, p50.001).
� Children with other types of disabilities differ signifi-
cantly from typically developing children regarding the
variables: ‘support of the mother’ (r¼ 0.73, p50.001),
‘support of the father’ (r¼ 0.59, p50.001), ‘support of
people in position of authority’ (r¼ 0.38, p50.05),
‘attitudes of the father’ (r¼ 0.60, p50.001), ‘attitudes of
the mother’ (r¼ 0.43, p50.05), and ‘attitudes of persons
in a position of authority’ (r¼ 0.33, p50.05).
� Children with ASD and children with other types of
disabilities do not differ in any of the analysed variables
related with environmental factors.
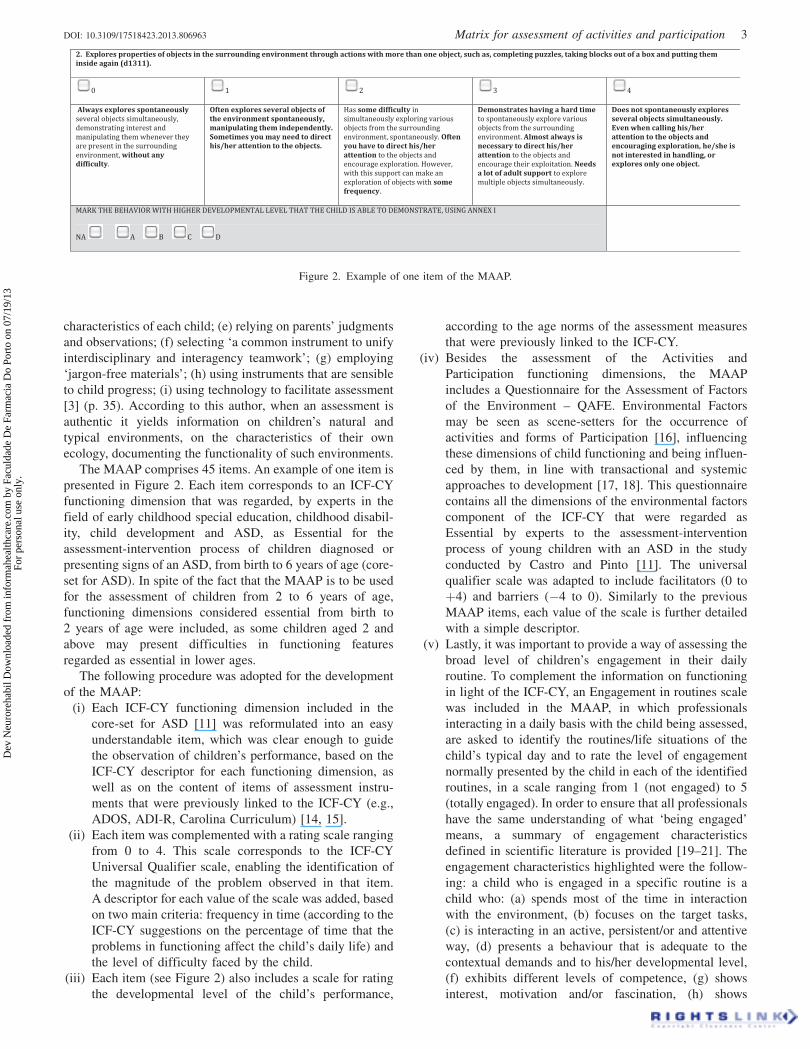
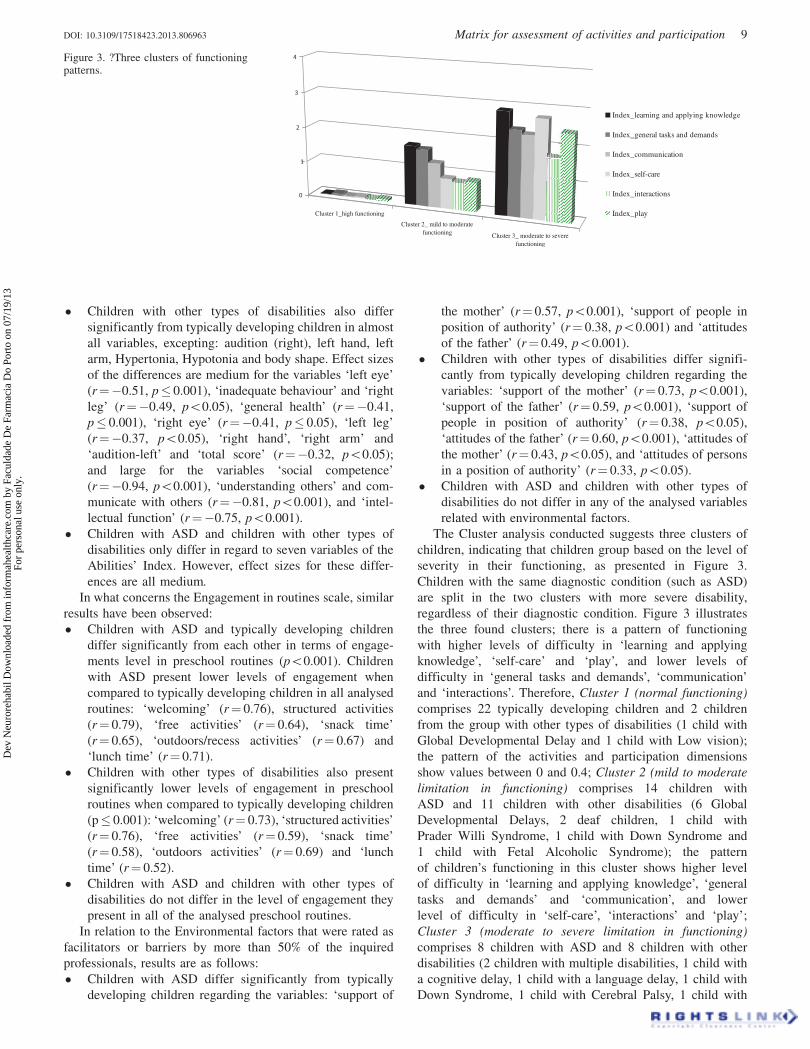
The Cluster analysis conducted suggests three clusters of
children, indicating that children group based on the level of
severity in their functioning, as presented in Figure 3.
Children with the same diagnostic condition (such as ASD)
are split in the two clusters with more severe disability,
regardless of their diagnostic condition. Figure 3 illustrates
the three found clusters; there is a pattern of functioning
with higher levels of difficulty in ‘learning and applying
knowledge’, ‘self-care’ and ‘play’, and lower levels of
difficulty in ‘general tasks and demands’, ‘communication’
and ‘interactions’. Therefore, Cluster 1 (normal functioning)
comprises 22 typically developing children and 2 children
from the group with other types of disabilities (1 child with
Global Developmental Delay and 1 child with Low vision);
the pattern of the activities and participation dimensions
show values between 0 and 0.4; Cluster 2 (mild to moderate
limitation in functioning) comprises 14 children with
ASD and 11 children with other disabilities (6 Global
Developmental Delays, 2 deaf children, 1 child with
Prader Willi Syndrome, 1 child with Down Syndrome and
1 child with Fetal Alcoholic Syndrome); the pattern
of children’s functioning in this cluster shows higher level
of difficulty in ‘learning and applying knowledge’, ‘general
tasks and demands’ and ‘communication’, and lower
level of difficulty in ‘self-care’, ‘interactions’ and ‘play’;
Cluster 3 (moderate to severe limitation in functioning)
comprises 8 children with ASD and 8 children with other
disabilities (2 children with multiple disabilities, 1 child with
a cognitive delay, 1 child with a language delay, 1 child with
Down Syndrome, 1 child with Cerebral Palsy, 1 child with
Figure 3. ?Three clusters of functioningpatterns.
Cluster 1_high functioning
Cluster 2_ mild to moderatefunctioning Cluster 3_ moderate to severe
functioning
0
1
2
3
4
Index_learning and applying knowledge
Index_general tasks and demands
Index_communication
Index_self-care
Index_interactions
Index_play
DOI: 10.3109/17518423.2013.806963 Matrix for assessment of activities and participation 9
Dev
Neu
rore
habi
l Dow
nloa
ded
from
info
rmah
ealth
care
.com
by
Facu
ldad
e D
e Fa
rmac
ia D
o Po
rto
on 0
7/19
/13
For
pers
onal
use
onl
y.
squeals of myocardial infarction and 1 child with Spina
Bifida).
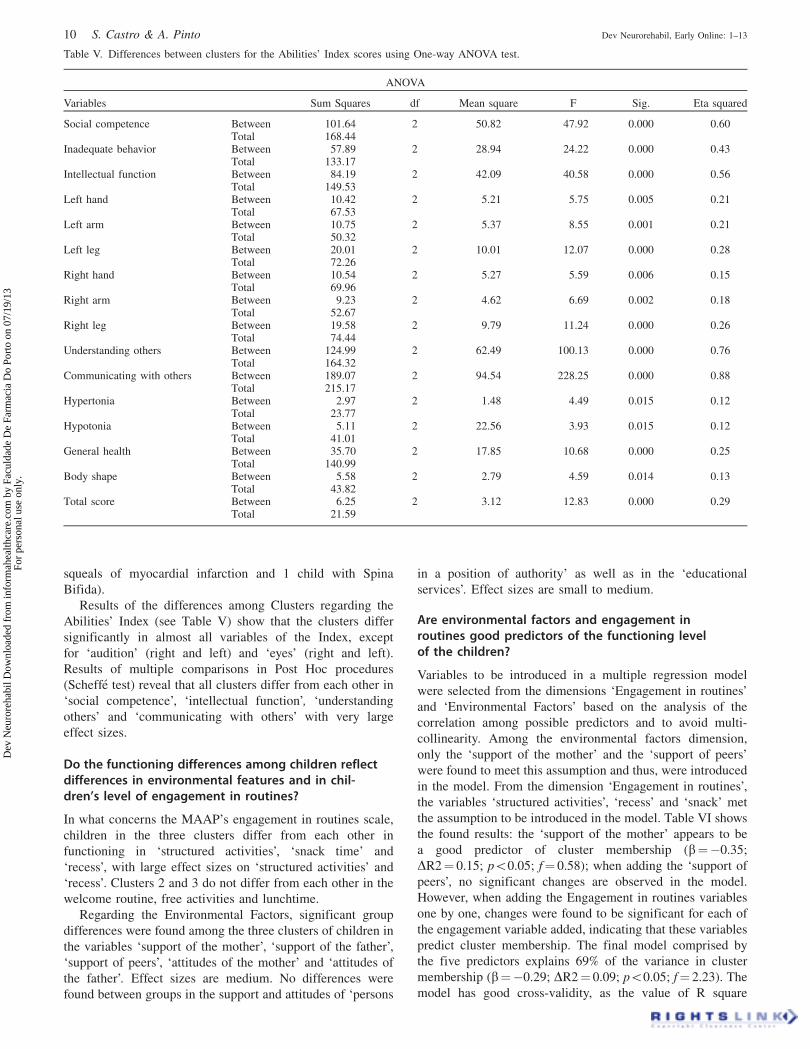
Results of the differences among Clusters regarding the
Abilities’ Index (see Table V) show that the clusters differ
significantly in almost all variables of the Index, except
for ‘audition’ (right and left) and ‘eyes’ (right and left).
Results of multiple comparisons in Post Hoc procedures
(Scheffe test) reveal that all clusters differ from each other in
‘social competence’, ‘intellectual function’, ‘understanding
others’ and ‘communicating with others’ with very large
effect sizes.
Do the functioning differences among children reflectdifferences in environmental features and in chil-dren’s level of engagement in routines?
In what concerns the MAAP’s engagement in routines scale,
children in the three clusters differ from each other in
functioning in ‘structured activities’, ‘snack time’ and
‘recess’, with large effect sizes on ‘structured activities’ and
‘recess’. Clusters 2 and 3 do not differ from each other in the
welcome routine, free activities and lunchtime.
Regarding the Environmental Factors, significant group
differences were found among the three clusters of children in
the variables ‘support of the mother’, ‘support of the father’,
‘support of peers’, ‘attitudes of the mother’ and ‘attitudes of
the father’. Effect sizes are medium. No differences were
found between groups in the support and attitudes of ‘persons
in a position of authority’ as well as in the ‘educational
services’. Effect sizes are small to medium.
Are environmental factors and engagement inroutines good predictors of the functioning levelof the children?
Variables to be introduced in a multiple regression model
were selected from the dimensions ‘Engagement in routines’
and ‘Environmental Factors’ based on the analysis of the
correlation among possible predictors and to avoid multi-
collinearity. Among the environmental factors dimension,
only the ‘support of the mother’ and the ‘support of peers’
were found to meet this assumption and thus, were introduced
in the model. From the dimension ‘Engagement in routines’,
the variables ‘structured activities’, ‘recess’ and ‘snack’ met
the assumption to be introduced in the model. Table VI shows
the found results: the ‘support of the mother’ appears to be
a good predictor of cluster membership (b¼�0.35;
DR2¼ 0.15; p50.05; f¼ 0.58); when adding the ‘support of
peers’, no significant changes are observed in the model.
However, when adding the Engagement in routines variables
one by one, changes were found to be significant for each of
the engagement variable added, indicating that these variables
predict cluster membership. The final model comprised by
the five predictors explains 69% of the variance in cluster
membership (b¼�0.29; DR2¼ 0.09; p50.05; f¼ 2.23). The
model has good cross-validity, as the value of R square
Table V. Differences between clusters for the Abilities’ Index scores using One-way ANOVA test.
ANOVA
Variables Sum Squares df Mean square F Sig. Eta squared
Social competence Between 101.64 2 50.82 47.92 0.000 0.60Total 168.44
Inadequate behavior Between 57.89 2 28.94 24.22 0.000 0.43Total 133.17
Intellectual function Between 84.19 2 42.09 40.58 0.000 0.56Total 149.53
Left hand Between 10.42 2 5.21 5.75 0.005 0.21Total 67.53
Left arm Between 10.75 2 5.37 8.55 0.001 0.21Total 50.32
Left leg Between 20.01 2 10.01 12.07 0.000 0.28Total 72.26
Right hand Between 10.54 2 5.27 5.59 0.006 0.15Total 69.96
Right arm Between 9.23 2 4.62 6.69 0.002 0.18Total 52.67
Right leg Between 19.58 2 9.79 11.24 0.000 0.26Total 74.44
Understanding others Between 124.99 2 62.49 100.13 0.000 0.76Total 164.32
Communicating with others Between 189.07 2 94.54 228.25 0.000 0.88Total 215.17
Hypertonia Between 2.97 2 1.48 4.49 0.015 0.12Total 23.77
Hypotonia Between 5.11 2 22.56 3.93 0.015 0.12Total 41.01
General health Between 35.70 2 17.85 10.68 0.000 0.25Total 140.99
Body shape Between 5.58 2 2.79 4.59 0.014 0.13Total 43.82
Total score Between 6.25 2 3.12 12.83 0.000 0.29Total 21.59
10 S. Castro & A. Pinto Dev Neurorehabil, Early Online: 1–13
Dev
Neu
rore
habi
l Dow
nloa
ded
from
info
rmah
ealth
care
.com
by
Facu
ldad
e D
e Fa
rmac
ia D
o Po
rto
on 0
7/19
/13
For
pers
onal
use
onl
y.
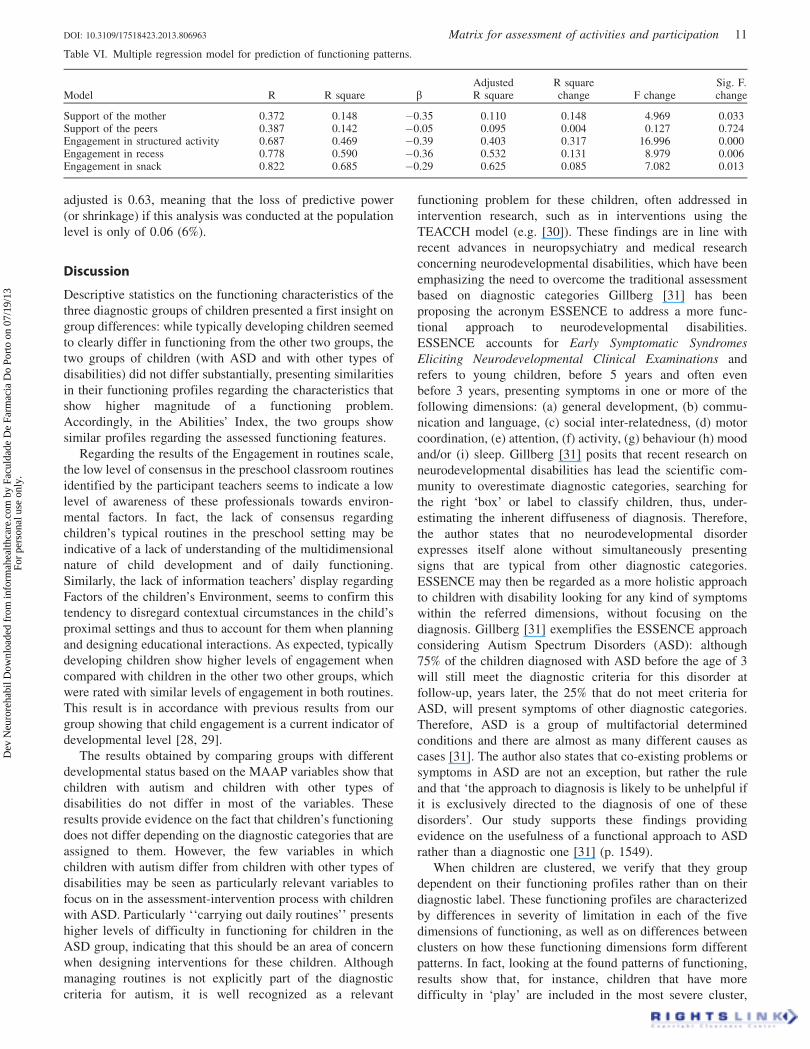
adjusted is 0.63, meaning that the loss of predictive power
(or shrinkage) if this analysis was conducted at the population
level is only of 0.06 (6%).
Discussion
Descriptive statistics on the functioning characteristics of the
three diagnostic groups of children presented a first insight on
group differences: while typically developing children seemed
to clearly differ in functioning from the other two groups, the
two groups of children (with ASD and with other types of
disabilities) did not differ substantially, presenting similarities
in their functioning profiles regarding the characteristics that
show higher magnitude of a functioning problem.
Accordingly, in the Abilities’ Index, the two groups show
similar profiles regarding the assessed functioning features.
Regarding the results of the Engagement in routines scale,
the low level of consensus in the preschool classroom routines
identified by the participant teachers seems to indicate a low
level of awareness of these professionals towards environ-
mental factors. In fact, the lack of consensus regarding
children’s typical routines in the preschool setting may be
indicative of a lack of understanding of the multidimensional
nature of child development and of daily functioning.
Similarly, the lack of information teachers’ display regarding
Factors of the children’s Environment, seems to confirm this
tendency to disregard contextual circumstances in the child’s
proximal settings and thus to account for them when planning
and designing educational interactions. As expected, typically
developing children show higher levels of engagement when
compared with children in the other two other groups, which
were rated with similar levels of engagement in both routines.
This result is in accordance with previous results from our
group showing that child engagement is a current indicator of
developmental level [28, 29].
The results obtained by comparing groups with different
developmental status based on the MAAP variables show that
children with autism and children with other types of
disabilities do not differ in most of the variables. These
results provide evidence on the fact that children’s functioning
does not differ depending on the diagnostic categories that are
assigned to them. However, the few variables in which
children with autism differ from children with other types of
disabilities may be seen as particularly relevant variables to
focus on in the assessment-intervention process with children
with ASD. Particularly ‘‘carrying out daily routines’’ presents
higher levels of difficulty in functioning for children in the
ASD group, indicating that this should be an area of concern
when designing interventions for these children. Although
managing routines is not explicitly part of the diagnostic
criteria for autism, it is well recognized as a relevant
functioning problem for these children, often addressed in
intervention research, such as in interventions using the
TEACCH model (e.g. [30]). These findings are in line with
recent advances in neuropsychiatry and medical research
concerning neurodevelopmental disabilities, which have been
emphasizing the need to overcome the traditional assessment
based on diagnostic categories Gillberg [31] has been
proposing the acronym ESSENCE to address a more func-
tional approach to neurodevelopmental disabilities.
ESSENCE accounts for Early Symptomatic Syndromes
Eliciting Neurodevelopmental Clinical Examinations and
refers to young children, before 5 years and often even
before 3 years, presenting symptoms in one or more of the
following dimensions: (a) general development, (b) commu-
nication and language, (c) social inter-relatedness, (d) motor
coordination, (e) attention, (f) activity, (g) behaviour (h) mood
and/or (i) sleep. Gillberg [31] posits that recent research on
neurodevelopmental disabilities has lead the scientific com-
munity to overestimate diagnostic categories, searching for
the right ‘box’ or label to classify children, thus, under-
estimating the inherent diffuseness of diagnosis. Therefore,
the author states that no neurodevelopmental disorder
expresses itself alone without simultaneously presenting
signs that are typical from other diagnostic categories.
ESSENCE may then be regarded as a more holistic approach
to children with disability looking for any kind of symptoms
within the referred dimensions, without focusing on the
diagnosis. Gillberg [31] exemplifies the ESSENCE approach
considering Autism Spectrum Disorders (ASD): although
75% of the children diagnosed with ASD before the age of 3
will still meet the diagnostic criteria for this disorder at
follow-up, years later, the 25% that do not meet criteria for
ASD, will present symptoms of other diagnostic categories.
Therefore, ASD is a group of multifactorial determined
conditions and there are almost as many different causes as
cases [31]. The author also states that co-existing problems or
symptoms in ASD are not an exception, but rather the rule
and that ‘the approach to diagnosis is likely to be unhelpful if
it is exclusively directed to the diagnosis of one of these
disorders’. Our study supports these findings providing
evidence on the usefulness of a functional approach to ASD
rather than a diagnostic one [31] (p. 1549).
When children are clustered, we verify that they group
dependent on their functioning profiles rather than on their
diagnostic label. These functioning profiles are characterized
by differences in severity of limitation in each of the five
dimensions of functioning, as well as on differences between
clusters on how these functioning dimensions form different
patterns. In fact, looking at the found patterns of functioning,
results show that, for instance, children that have more
difficulty in ‘play’ are included in the most severe cluster,
Table VI. Multiple regression model for prediction of functioning patterns.
Model R R square bAdjustedR square
R squarechange F change
Sig. F.change
Support of the mother 0.372 0.148 �0.35 0.110 0.148 4.969 0.033Support of the peers 0.387 0.142 �0.05 0.095 0.004 0.127 0.724Engagement in structured activity 0.687 0.469 �0.39 0.403 0.317 16.996 0.000Engagement in recess 0.778 0.590 �0.36 0.532 0.131 8.979 0.006Engagement in snack 0.822 0.685 �0.29 0.625 0.085 7.082 0.013
DOI: 10.3109/17518423.2013.806963 Matrix for assessment of activities and participation 11
Dev
Neu
rore
habi
l Dow
nloa
ded
from
info
rmah
ealth
care
.com
by
Facu
ldad
e D
e Fa
rmac
ia D
o Po
rto
on 0
7/19
/13
For
pers
onal
use
onl
y.
thus indicating the importance of engagement in play in
defining functioning profiles.
In what concerns group differences in environmental
characteristics, and although we do not have much informa-
tion regarding these features, results show that typically
developing children present higher levels of support than
children with disabilities. This result seems to be indicative
of the Transactional influences in development advocated
by Sameroff, by which the child is influenced by the
environmental features, but also has an influence on the
environment [17, 32].
These findings are in line with recent advances in
neuropsychiatry and medical research concerning neurodeve-
lopmental disabilities, which have been emphasizing the need
to overcome the traditional assessment based on diagnostic
categories. Christopher Gillberg [31] has been proposing
the acronym ESSENCE to address a more functional
approach to neurodevelopmental disabilities. ESSENCE
accounts for ‘Early Symptomatic Syndromes Eliciting
Neurodevelopmental Clinical Examinations’ and refers to
young children, before 5 years and often even before 3 years,
presenting symptoms in one or more of the following
dimensions: (a) general development, (b) communication
and language, (c) social inter-relatedness, (d) motor coordin-
ation, (e) attention, (f) activity, (g) behaviour (h) mood and/or
(i) sleep. Gillberg [31] posits that recent research on
neurodevelopmental disabilities has lead the scientific com-
munity to overestimate diagnostic categories, searching for
the right ‘‘box’’ or label to classify children, thus, under-
estimating the inherent diffuseness of diagnosis. Therefore,
the author states that no neurodevelopmental disorder
expresses itself alone without simultaneously presenting
signs that are typical from other diagnostic categories.
ESSENCE may then be regarded as a more holistic approach
to children with disability looking for any kind of symptoms
within the referred dimensions, without focusing on the
diagnosis. Gillberg [31] exemplifies the ESSENCE approach
considering Autism Spectrum Disorders (ASD): although
75% of the children diagnosed with ASD before the age of
3 will still meet the diagnostic criteria for this disorder at
follow-up, years later, the 25% that do not meet criteria for
ASD, will present symptoms of other diagnostic categories.
Therefore, ASD is a group of multifactorial determined
conditions and there are almost as many different causes as
cases [31]. The author also states that co-existing problems or
symptoms in ASD are not an exception, but rather the rule
and that ‘the approach to diagnosis is likely to be unhelpful if
it is exclusively directed to the diagnosis of one of these
disorders’ [31] (p. 1549). Our study supports these findings
providing evidence on the usefulness of a functional approach
to ASD rather than a diagnostic one.
Results from the multiple regression analysis indicate that
children’s levels of engagement in daily routines as well as the
support they receive in the immediate environment predict
children’s functioning patterns. In accordance with previous
results, the quality and quantity of engagement that the child
shows in daily routines of the preschool, as well as the
influence of aspects of the environment are relevant factors to
be taken into account when promoting positive functioning in
young children with disabilities [28].
Results are in line with the bioecological and the
transactional models of development and disability, which
state the importance of taking into account the dimensions of
the different levels of contextual variables in children’s
contexts, from the closer to the most distal, as well as the
transactions that constantly and mutually occur between the
child and the environment.
Conclusion
The main conclusion that we may draw from this study is that a
functional approach to intervention in young children with
disabilities may be more beneficial than a diagnostic approach,
since children differ from each other in terms of patterns of
functioning, rather than in terms of their health conditions or
in function of the diagnostic label they were assigned. Such
conclusion provides evidence indicating that interventions
should be more oriented toward the promotion of positive
functioning and participation based on the individual charac-
teristics of the child, than on promoting capacities that are
typically disadvantaged in a specific diagnostic group.
In summary, this study provides evidence and assessment
resources (the new developed ICF-CY based tool – the
MAAP), to support the adoption of a functional approach
when conducting an assessment-intervention process with
young children with disabilities. Teachers may now start
assessing their children from the time they enter the preschool
programme, following the detailed functional approach pre-
sented by the MAAP, as they observe their behaviour on an
everyday basis and in a natural context. Moreover, repeated
assessment over time enables monitoring of functioning
progress, independently of diagnostic categories.
Limitations of the study
In future research, using the MAAP in a larger sample of
young children with disabilities would be desirable in order to
analyse the psychometric properties of data collected with the
MAAP. It is important to underline that, since this study
provided us with information on the fact that children do not
differ in regards to their diagnostic category, but rather in
regards to the severity of the limitation in functioning
observed, it would be interesting that the larger sample
could include children with various types of disabilities.
Factor analysis are needed to verify whether the MAAP
structure actually overlaps with the structure of the ICF-CY,
as this was the authors’ goal.
Another limitation of this study was that the instrument
was responded by professionals following an interview
format. This format may be useful, as it ensures that all
teachers have the same understanding of the items, however,
teachers should all have known the children for the same
amount of time, which was not possible to control. Ideally,
teachers should have a similar first contact with the tool (such
as a small training workshop) and then respond to the items,
as they observe their children, over a certain period of time.
Declaration of interest
The authors report no conflicts of interest. The authors alone
are responsible for the content and writing of this paper. The
12 S. Castro & A. Pinto Dev Neurorehabil, Early Online: 1–13
Dev
Neu
rore
habi
l Dow
nloa
ded
from
info
rmah
ealth
care
.com
by
Facu
ldad
e D
e Fa
rmac
ia D
o Po
rto
on 0
7/19
/13
For
pers
onal
use
onl
y.
authors wish to thank Fundacao para a a Ciencia e Tecnologia
(FCT) for funding this study.
References
1. Simeonsson RJ, Bailey DB, Smith T, Buysse V. Young childrenwith disabilities: Functional assessment by teachers. JournalDevelopmental and Physical Disabilities 1995;7:267–284. doi:10.1007/BF02578431(1995).
2. Simeonsson RJ. Defining and classifying childhood disability.Institute of Medicine. Disability in America. Washington, DC:National Academy Press; 2005.
3. World Health Organization. International Classification ofFunctioning, Disability and Health for Children and Youth(ICF-CY). Geneva: World Health Organization; 2007.
4. Bagnato SJ, Neisworth JT, Pretti-Frontczak K. Linking authenticassessment & early childhood intervention. Best measures for bestpractices. 2nd ed. Baltimore, MD: Paul Brookes; 2010.
5. World Health Organization. International Classification ofFunctioning, Disability and Health. Geneva: World HealthOrganization; 2001.
6. Florian L, Hollenweger J, Simeonsson RJ, Wedell K, Riddell S, TerziL, Holland, A. Cross-Cultural Perspectives on the Classification ofChildren With Disabilities: Part I. Issues in the Classificationof Children With Disabilities. The Journal of Special Education2006;40(1):36–45. doi:10.1177/00224669060400010401.
7. Simeonsson RJ, Leonardi M, Lollar D, Bjorck-Akesson E,Hollenweger J, Martinuzzi A. Applying the InternationalClassification of Functioning, Disability and Health (ICF) tomeasure childhood disability. Disability and rehabilitation 2003;25(11–12):602–610. doi:10.1080/0963828031000137117(2003).
8. American Psychiatric Association. Diagnostic and StatisticalManual of Mental Disorders. 4th ed.; 2000.
9. World Health Organization. International Classification of Diseasesand health related problems, 10th revision. Geneva: World HealthOrganization; 2010.
10. Lollar DJ, Simeonsson RJ. Diagnosis to function: Classification forchildren and youths. Journal of Developmental and Behavioralpediatrics: JDBP 2005;26(4):323–330.
11. Castro S, Pinto A. Identification of core functioning features forassessment and intervention in Autism Spectrum Disorders.Disability and Rehabilitation 2013;35:125–133.
12. Ellingsen KM. Deriving developmental code sets from theInternational Classification of Functioning, Disability and Health– for Children and Youth (ICF-CY) [unpublished dissertation].University of North Carolina at Chapel Hill; 2011.
13. Bagnato, SJ. Authentic assessment for early childhood intervention:Best practices. New York: Guilford Press; 2008.
14. Castro S, Ferreira T, Dababnah S, Pinto AI. Linking AutismMeasures with the ICF-CY: Functionality beyond the borders ofDiagnosis and Interrater agreement Issues. DevelopmentalNeurorehabilitation. DOI:10.3109/17518423.2012.733438.
15. Castro S, Pinto AI, Maia M. Linking the Carolina curriculum forpreschoolers with special needs to the ICF-CY. British Journal ofDevelopmental Disabilities 2011;52 Part 2(113):131–144.DOI:10.1179/096979511798967043.
16. Badley EM. Enhancing the conceptual clarity of the activity andparticipation components of the International Classification of
Functioning, Disability, and Health. Social science & medicine1982;66(11):2335–2345. doi:10.1016/j.socscimed.2008.01.026.
17. Sameroff AJ, Fiese BH. Transactional regulations: The develop-mental ecology of early intervention. In: Shonkoff JP, Meisels SJ,editors. Handbook of early childhood intervention. 2nd ed.Cambridge: Press Syndicate of the University of Cambridge;2000. pp 135–159.
18. Skyttner L. General systems theory, 2nd ed. Singapore: WorldScientific Publishing Co. Pte. Lda; 2005.
19. Almqvist L, Uys CJE, Sandberg, A. The concepts of participation,engagement and flow: A matter of creating optimal play experi-ences. South African Journal of Occupational Therapy 2007;37(3):8–13.
20. Laevers F. Assessing the quality of childcare provision:‘‘Involvement’’ as criterion. Researching Early Childhood 1997;3:151–165.
21. McWilliam RA, Bailey DB. Promoting engagement and mastery.In: Bailey DB, Wolery M, editors. Teaching infants and pre-schoolers with disabilities, 2nd ed. New York: MacMillanPublishing Company; 1992. pp 230–255.
22. Coster W, Khetani MA. Measuring participation of children withdisabilities: Issues and challenges. Disability and Rehabilitation2008;30(8):639–648. doi:10.1080/09638280701400375.
23. Simeonsson RJ, Bailey DB. ABILITIES Index. Chapel Hill, NC:Frank Porter Graham Development Center, University of NorthCarolina; 1991.
24. Simeonsson RJ, Chen J, Hu Y. Functional assessment of Chinesechildren with the ABILITIES index. Disability and Rehabilitation1995;17(7):400–410. doi: 10.3109/09638289509166728.
25. Field A. Discovering statistics using the SPSS. London: SAGEPublications Inc; 2009.
26. Maroco J. Analise Estatıtica com o SPSS Statistics. Lisboa: EdicoesSılabo; 2003.
27. Bergman LR, Magnusson D, El Khouri BM. Studying individualdevelopment in an interindividual context: A person-orientedapproach (paths through life). London: Lawrence EarlbaumAssociates, Publishers; 2003.
28. Grande C. Estudo do Impacto das Interaccoes Educadora-criancano desenvolvimento das criancas com necessidades educativasespeciais em context de creche e jardim de infancia. [Unpublisheddissertation]. Faculty of Psychology and Educational Sciences,Porto University; 2010.
29. Pinto AI, Barros S, Aguiar C, Pessanha M, Bairrao J. Relacoesentre idade desenvolvimental, dimensoes do comportamentoadaptativo e envolvimento observado [Relationships betweendevelopmental age, dimensions of adaptive behavior and observedengagement]. Analise Psicologica 2006;serie XXIV(4):447–466.
30. McConachie H, Randle V, Hammal D, Le Couteur A. A controlledtrial of a training course for parents of children with suspectedautism spectrum disorder. The Journal of Pediatrics 2005;147(3):335–340. doi:10.1016/j.jpeds.2005.03.056.
31. Gillberg C. The ESSENCE in child psychiatry: Early SymptomaticSyndromes eliciting neurodevelopmental clinical examinations.Research on Developmental Disabilities 2010;31(6):1543–1551.doi:10.1016/j.ridd.2010.06.002.
32. Sameroff AJ, Chandler MJ. Reproductive risk and the continuum ofcaretaking casualty. In: Horowitz FD, Hetherington M, Scarr-Salapatek S, Siegel G, editors. Review of child developmentresearch. Chicago: University of Chicago Press; 1975. pp 187–244.
DOI: 10.3109/17518423.2013.806963 Matrix for assessment of activities and participation 13
Dev
Neu
rore
habi
l Dow
nloa
ded
from
info
rmah
ealth
care
.com
by
Facu
ldad
e D
e Fa
rmac
ia D
o Po
rto
on 0
7/19
/13
For
pers
onal
use
onl
y.