Embed Size (px)
Citation preview
Darji et al. World Journal of Pharmaceutical and Medical Research
www.wjpmr.com
92
MATRIX RELEASE FOR CHRONIC INFLAMMATORY DISEASE
*1Darji Yogeshkumar Govindbhai and
2Dr. Satyajit Sahoo
1Research Scholar, Research Development and Innovation Centre C. U. Shah University Wadhwancity – 363030.
2Profesor, Research Development and Innovation Centre C. U. Shah University Wadhwancity – 363 030.
Article Received on 29/08/2019 Article Revised on 19/09/2019 Article Accepted on 09/10/2019
1. INTRODUCTION
1.1 Asthma
1.1.1 Definition[1,2]
Asthma is a common chronic inflammatory disease of
the airways characterized by variable and recurring
symptoms, reversible airflow obstruction and
bronchospasm.[1]
Asthma is the result of chronic
inflammation of the airways which subsequently results
in increased contractability of the surrounding smooth
muscles. This among other factors leads to bouts of
narrowing of the airway. The narrowing is typically
reversible with or without treatment. Occasionally the
airways themselves change. Common symptoms include
wheezing, coughing, chest tightness, and shortness of
breath.[2]
II. Optimization by using 32 full factorial
Experimental Design: III. Stability study of matrix
tablet
5.3.1 Analysis of drug candidate
1. Melting point It was one of the parameters to judge the purity of crude
drugs. In case of pure chemicals or photochemical,
melting points are very sharp and constant. Since the
crude drugs contain the mixed chemicals, they are
described with certain range of melting point.
Procedure A small quantity of powder was placed into a Capillary.
That was placed in the melting point determining
apparatus containing castor oil. The temperature of the
castor oil was gradual increased automatically and read
the temperature at which powder started to melt and the
temperature when all the powder gets melted.
2. Drug Identification Drug Identification can be found by UV spectroscopy, IR
Spectroscopy.
UV Spectroscopy A stock solution of Doxofylline 5 μg/ml was prepared
separately in Water. The UV spectrum of Doxofylline
was recorded using double beam UV-Visible
Spectrophotometer (Shimadzu, UV-2450) at 1.0 cm slit
width using 0.1 N HCl pH 1.2 as solvent in the range of
200-400nm. The wavelength of maximum absorption at
274 nm was found to be sharp and satisfactory.
FTIR of pure drug Identification of Doxofylline was carried out using FTIR
study. For this the FTIR spectra of plain drug was
recorded in FTIR 8400 S Shimadzu spectrophotometer.
The pure Doxofylline drug was mixed thoroughly with
potassium bromide. For the scans were obtained at a
resolution of 4000-400cm-1
.
3. Calibration curve of Doxofylline in 0.1 N HCI[23]
Solvent:- 0.1 N HCl pH 1.2
Concentration:- 5 µg/ml(λmax=274.20 nm)
Stock solution was prepared by dissolving 50 mg drug
in 100 ml simulated 0.1N HCL pH 1.2(500µg/ml).
From this solution withdraw 4 ml and make up
simulated 0.1 N HCl buffer pH 1.2 up to 100 ml
wjpmr, 2019,5(11), 92-104
SJIF Impact Factor: 5.922
Research Article
ISSN 2455-3301
WJPMR
WORLD JOURNAL OF PHARMACEUTICAL
AND MEDICAL RESEARCH www.wjpmr.com
*Corresponding Author: Darji Yogeshkumar Govindbhai
Research Scholar, Research Development and Innovation Centre C. U. Shah University Wadhwancity – 363030.
ABSTRACT
Asthma is a common chronic inflammatory disease of the airways characterized by variable and recurring
symptoms, reversible airflow obstruction and bronchospasm.[1]
Asthma is the result of chronic inflammation of the
airways which subsequently results in increased contractability of the surrounding smooth muscles. This among
other factors leads to bouts of narrowing of the airway. The narrowing is typically reversible with or without
treatment. Occasionally the airways themselves change. Common symptoms include wheezing, coughing, chest
tightness.
KEYWORDS: Asthma, chronic inflammatory disease.
Darji et al. World Journal of Pharmaceutical and Medical Research
www.wjpmr.com
93
(20µg/ml).
Withdraw 2.5,5,7.5,10,12.5 ml from stock solution
and make upto 10 ml with simulated 0.1 N HCl pH
1.2 to produce solution of concentration 5,10,15,20 and
25µg/ml respectively.
4. Calibration curve of Doxofylline in Phosphate
buffer pH 6.8[32]
Solvent:- Phosphate buffer pH 6.8
Concentration:- 5 µg/ml (λmax=273.20 nm)
Stock solution was prepared by dissolving 50 mg drug in
100 ml simulated Phoshate Buffer pH 6.8(500µg/ml).
From this solution withdraw 4 ml and make up
simulated Phosphate buffer pH 6.8 up to 100 ml
(20µg/ml).
Withdraw 2.5,5,7.5,10,12.5 ml from stock solution
and make upto 10 ml with simulated Phosphate
Buffer pH 6.8 to produce solution of concentration
5,10,15,20 and 25 µg/ml respectively.
5. Drug excipients compatibility study
By FTIR Compatibility of Doxofylline with the respective
Polymers that is Hydroxypropyl Methyl Cellulose,
Xanthan Gum, Guar Gum. Individual excipients was
established by Infrared Absorption Spectral Analysis
(FTIR). Any changes in the chemical composition after
combining with the excipients were investigated with IR
spectral analysis.
DSC (Differential scanning calorimetry) The DSC spectrum of the Doxofylline and selected
formulation (F7) were recorded using DSC with TDA
trend line software. The thermal traces were obtained by
heating from 20 ºC to 900 ºC at heating rate of 20 ºC
under atmospheric condition in open crucibles.
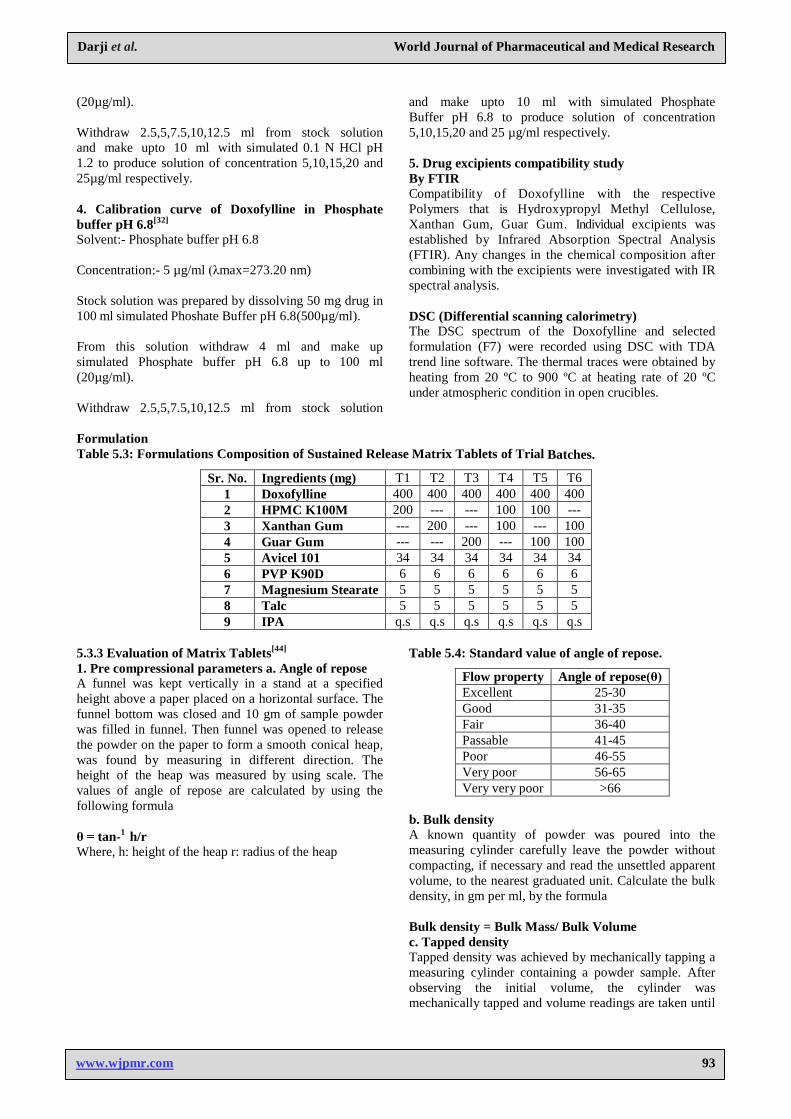
Formulation
Table 5.3: Formulations Composition of Sustained Release Matrix Tablets of Trial Batches.
Sr. No. Ingredients (mg) T1 T2 T3 T4 T5 T6
1 Doxofylline 400 400 400 400 400 400
2 HPMC K100M 200 --- --- 100 100 ---
3 Xanthan Gum --- 200 --- 100 --- 100
4 Guar Gum --- --- 200 --- 100 100
5 Avicel 101 34 34 34 34 34 34
6 PVP K90D 6 6 6 6 6 6
7 Magnesium Stearate 5 5 5 5 5 5
8 Talc 5 5 5 5 5 5
9 IPA q.s q.s q.s q.s q.s q.s
5.3.3 Evaluation of Matrix Tablets[44]
1. Pre compressional parameters a. Angle of repose A funnel was kept vertically in a stand at a specified
height above a paper placed on a horizontal surface. The
funnel bottom was closed and 10 gm of sample powder
was filled in funnel. Then funnel was opened to release
the powder on the paper to form a smooth conical heap,
was found by measuring in different direction. The
height of the heap was measured by using scale. The
values of angle of repose are calculated by using the
following formula
θ = tan-1 h/r
Where, h: height of the heap r: radius of the heap
Table 5.4: Standard value of angle of repose.
Flow property Angle of repose(θ)
Excellent 25-30
Good 31-35
Fair 36-40
Passable 41-45
Poor 46-55
Very poor 56-65
Very very poor >66
b. Bulk density A known quantity of powder was poured into the
measuring cylinder carefully leave the powder without
compacting, if necessary and read the unsettled apparent
volume, to the nearest graduated unit. Calculate the bulk
density, in gm per ml, by the formula
Bulk density = Bulk Mass/ Bulk Volume
c. Tapped density Tapped density was achieved by mechanically tapping a
measuring cylinder containing a powder sample. After
observing the initial volume, the cylinder was
mechanically tapped and volume readings are taken until
Darji et al. World Journal of Pharmaceutical and Medical Research
www.wjpmr.com
94
little further volume changes were observed.
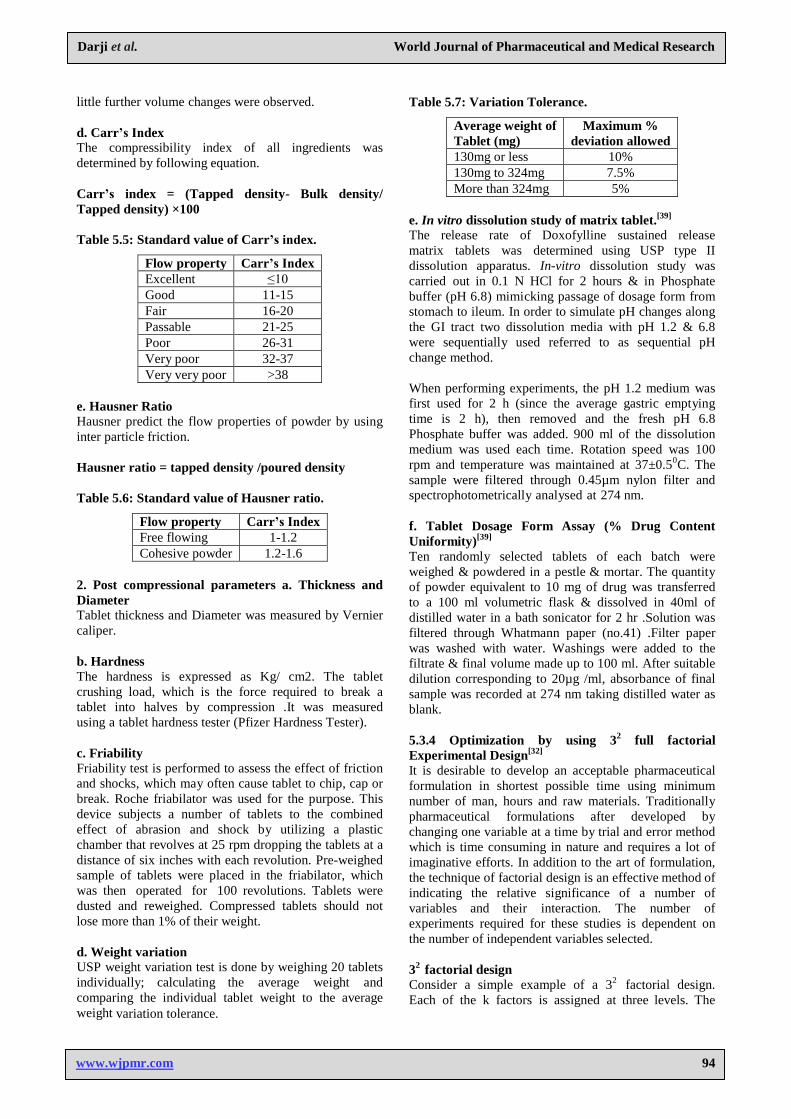
d. Carr’s Index The compressibility index of all ingredients was
determined by following equation.
Carr’s index = (Tapped density- Bulk density/
Tapped density) ×100
Table 5.5: Standard value of Carr’s index.
Flow property Carr’s Index
Excellent ≤10
Good 11-15
Fair 16-20
Passable 21-25
Poor 26-31
Very poor 32-37
Very very poor >38
e. Hausner Ratio Hausner predict the flow properties of powder by using
inter particle friction.
Hausner ratio = tapped density /poured density
Table 5.6: Standard value of Hausner ratio.
Flow property Carr’s Index
Free flowing 1-1.2
Cohesive powder 1.2-1.6
2. Post compressional parameters a. Thickness and
Diameter Tablet thickness and Diameter was measured by Vernier
caliper.
b. Hardness The hardness is expressed as Kg/ cm2. The tablet
crushing load, which is the force required to break a
tablet into halves by compression .It was measured
using a tablet hardness tester (Pfizer Hardness Tester).
c. Friability Friability test is performed to assess the effect of friction
and shocks, which may often cause tablet to chip, cap or
break. Roche friabilator was used for the purpose. This
device subjects a number of tablets to the combined
effect of abrasion and shock by utilizing a plastic
chamber that revolves at 25 rpm dropping the tablets at a
distance of six inches with each revolution. Pre-weighed
sample of tablets were placed in the friabilator, which
was then operated for 100 revolutions. Tablets were
dusted and reweighed. Compressed tablets should not
lose more than 1% of their weight.
d. Weight variation USP weight variation test is done by weighing 20 tablets
individually; calculating the average weight and
comparing the individual tablet weight to the average
weight variation tolerance.
Table 5.7: Variation Tolerance.
Average weight of
Tablet (mg)
Maximum %
deviation allowed
130mg or less 10%
130mg to 324mg 7.5%
More than 324mg 5%
e. In vitro dissolution study of matrix tablet.[39]
The release rate of Doxofylline sustained release
matrix tablets was determined using USP type II
dissolution apparatus. In-vitro dissolution study was
carried out in 0.1 N HCl for 2 hours & in Phosphate
buffer (pH 6.8) mimicking passage of dosage form from
stomach to ileum. In order to simulate pH changes along
the GI tract two dissolution media with pH 1.2 & 6.8
were sequentially used referred to as sequential pH
change method.
When performing experiments, the pH 1.2 medium was
first used for 2 h (since the average gastric emptying
time is 2 h), then removed and the fresh pH 6.8
Phosphate buffer was added. 900 ml of the dissolution
medium was used each time. Rotation speed was 100
rpm and temperature was maintained at 37±0.50C. The
sample were filtered through 0.45µm nylon filter and
spectrophotometrically analysed at 274 nm.
f. Tablet Dosage Form Assay (% Drug Content
Uniformity)[39]
Ten randomly selected tablets of each batch were
weighed & powdered in a pestle & mortar. The quantity
of powder equivalent to 10 mg of drug was transferred
to a 100 ml volumetric flask & dissolved in 40ml of
distilled water in a bath sonicator for 2 hr .Solution was
filtered through Whatmann paper (no.41) .Filter paper
was washed with water. Washings were added to the
filtrate & final volume made up to 100 ml. After suitable
dilution corresponding to 20µg /ml, absorbance of final
sample was recorded at 274 nm taking distilled water as
blank.
5.3.4 Optimization by using 32 full factorial
Experimental Design[32]
It is desirable to develop an acceptable pharmaceutical
formulation in shortest possible time using minimum
number of man, hours and raw materials. Traditionally
pharmaceutical formulations after developed by
changing one variable at a time by trial and error method
which is time consuming in nature and requires a lot of
imaginative efforts. In addition to the art of formulation,
the technique of factorial design is an effective method of
indicating the relative significance of a number of
variables and their interaction. The number of
experiments required for these studies is dependent on
the number of independent variables selected.
32 factorial design
Consider a simple example of a 32
factorial design.
Each of the k factors is assigned at three levels. The
Darji et al. World Journal of Pharmaceutical and Medical Research
www.wjpmr.com
95
levels are usually High = 1, Medium = 0 and Low = -1.
Such a scheme is useful as a preliminary experimental
program before a more ambitious study is undertaken.
The outcome of the 32
factorial experiment will help
identify the relative importance of factors and also will
offer some knowledge about the interaction effects. Let
us take a simple case where the number of factors is 2.
Let these factors be X1 and X2. The number of
experiments that may be performed is 9
corresponding to the following combinations:
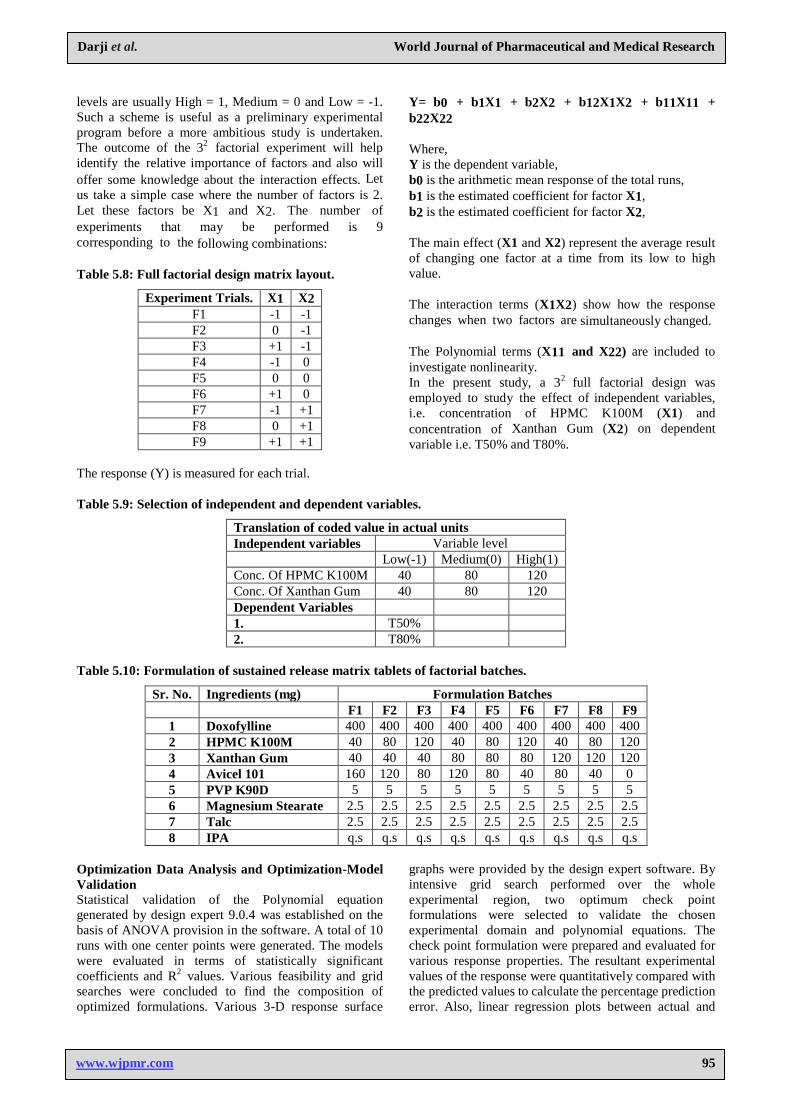
Table 5.8: Full factorial design matrix layout.
Experiment Trials. X1 X2
F1 -1 -1
F2 0 -1
F3 +1 -1
F4 -1 0
F5 0 0
F6 +1 0
F7 -1 +1
F8 0 +1
F9 +1 +1
The response (Y) is measured for each trial.
Y= b0 + b1X1 + b2X2 + b12X1X2 + b11X11 +
b22X22
Where,
Y is the dependent variable,
b0 is the arithmetic mean response of the total runs,
b1 is the estimated coefficient for factor X1,
b2 is the estimated coefficient for factor X2,
The main effect (X1 and X2) represent the average result
of changing one factor at a time from its low to high
value.
The interaction terms (X1X2) show how the response
changes when two factors are simultaneously changed.
The Polynomial terms (X11 and X22) are included to
investigate nonlinearity. In the present study, a 3
2 full factorial design was
employed to study the effect of independent variables,
i.e. concentration of HPMC K100M (X1) and
concentration of Xanthan Gum (X2) on dependent
variable i.e. T50% and T80%.
Table 5.9: Selection of independent and dependent variables.
Translation of coded value in actual units
Independent variables Variable level
Low(-1) Medium(0) High(1)
Conc. Of HPMC K100M 40 80 120
Conc. Of Xanthan Gum 40 80 120
Dependent Variables
1. T50%
2. T80%
Table 5.10: Formulation of sustained release matrix tablets of factorial batches.
Sr. No. Ingredients (mg) Formulation Batches
F1 F2 F3 F4 F5 F6 F7 F8 F9
1 Doxofylline 400 400 400 400 400 400 400 400 400
2 HPMC K100M 40 80 120 40 80 120 40 80 120
3 Xanthan Gum 40 40 40 80 80 80 120 120 120
4 Avicel 101 160 120 80 120 80 40 80 40 0
5 PVP K90D 5 5 5 5 5 5 5 5 5
6 Magnesium Stearate 2.5 2.5 2.5 2.5 2.5 2.5 2.5 2.5 2.5
7 Talc 2.5 2.5 2.5 2.5 2.5 2.5 2.5 2.5 2.5
8 IPA q.s q.s q.s q.s q.s q.s q.s q.s q.s
Optimization Data Analysis and Optimization-Model
Validation Statistical validation of the Polynomial equation
generated by design expert 9.0.4 was established on the
basis of ANOVA provision in the software. A total of 10
runs with one center points were generated. The models
were evaluated in terms of statistically significant
coefficients and R2
values. Various feasibility and grid
searches were concluded to find the composition of
optimized formulations. Various 3-D response surface
graphs were provided by the design expert software. By
intensive grid search performed over the whole
experimental region, two optimum check point
formulations were selected to validate the chosen
experimental domain and polynomial equations. The
check point formulation were prepared and evaluated for
various response properties. The resultant experimental
values of the response were quantitatively compared with
the predicted values to calculate the percentage prediction
error. Also, linear regression plots between actual and
Darji et al. World Journal of Pharmaceutical and Medical Research
www.wjpmr.com
96
predicted values of the response were produced using
MS-excel.
Contour plot and surface plot of design The optimization of formulation was carried out by
plotting contour plots (3-D) and surface plot (2-D) for all
observed dependent variable. Here, contour plot and
surface plots were drawn using the design expert 9.0.4
software. These types of plots are useful in study of the
effect of 2 factors on the response at one time. Various
contour plots and response surface plots are depicted in
figures respectively.
5.3.5 Stability Study of Optimized Formulation Optimized batch was placed for stability study at
40±0.5˚C/75±5 % RH for 1 month. Sample was
collected after that and evaluated for physical parameters
and in vitro dissolution study.
6. RESULTS AND DISCUSSION
6.1 Analysis of drug candidate
6.1.1 Melting Point
Table 6.1: Melting Point of Doxofylline.
Test Specification Observation
Melting Point 144-145.50C 144
0C
Thus, it has been identified that Observed Melting
Point of Doxofylline is within the Specific Range so it
conform that Doxofylline drug is pure.
6.1.2 Drug identification
1. UV spectroscopy
Determination of maximum wave length in 0.1 N HCl
buffer pH 1.2[23]
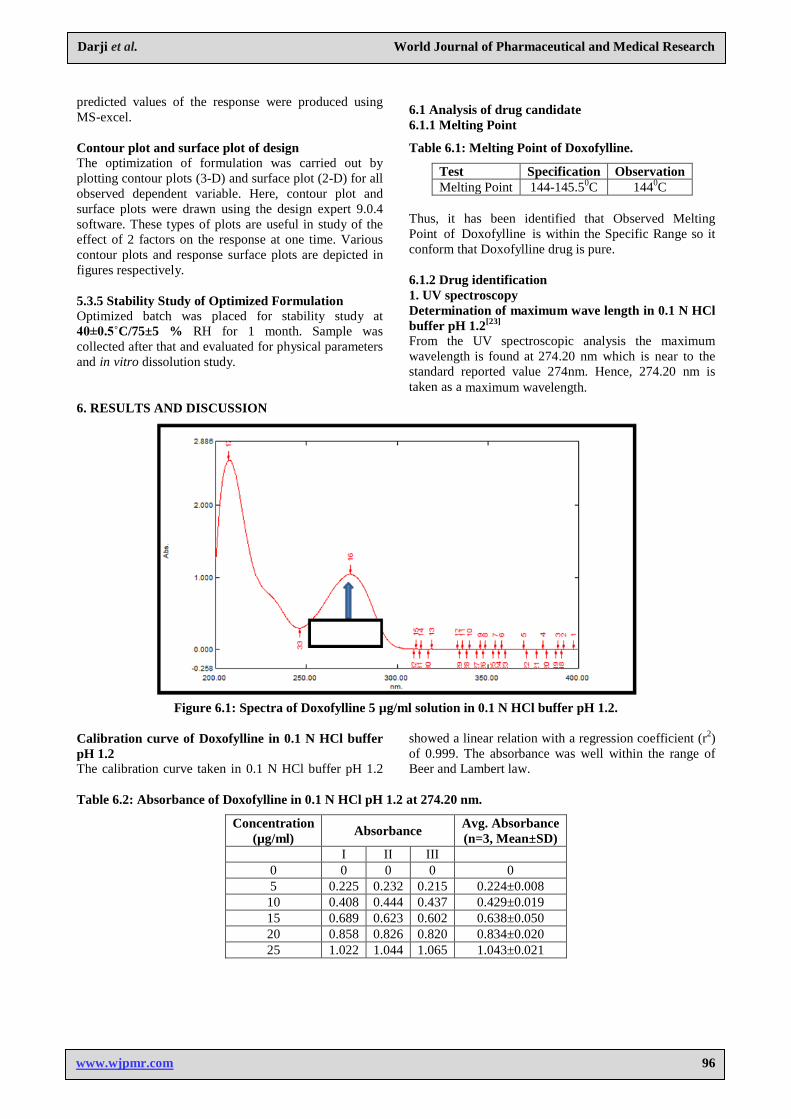
From the UV spectroscopic analysis the maximum
wavelength is found at 274.20 nm which is near to the
standard reported value 274nm. Hence, 274.20 nm is
taken as a maximum wavelength.
Figure 6.1: Spectra of Doxofylline 5 µg/ml solution in 0.1 N HCl buffer pH 1.2.
Calibration curve of Doxofylline in 0.1 N HCl buffer
pH 1.2 The calibration curve taken in 0.1 N HCl buffer pH 1.2
showed a linear relation with a regression coefficient (r2)
of 0.999. The absorbance was well within the range of
Beer and Lambert law.
Table 6.2: Absorbance of Doxofylline in 0.1 N HCl pH 1.2 at 274.20 nm.
Concentration
(µg/ml) Absorbance
Avg. Absorbance
(n=3, Mean±SD) I II III
0 0 0 0 0
5 0.225 0.232 0.215 0.224±0.008
10 0.408 0.444 0.437 0.429±0.019
15 0.689 0.623 0.602 0.638±0.050
20 0.858 0.826 0.820 0.834±0.020
25 1.022 1.044 1.065 1.043±0.021
Darji et al. World Journal of Pharmaceutical and Medical Research
www.wjpmr.com
97
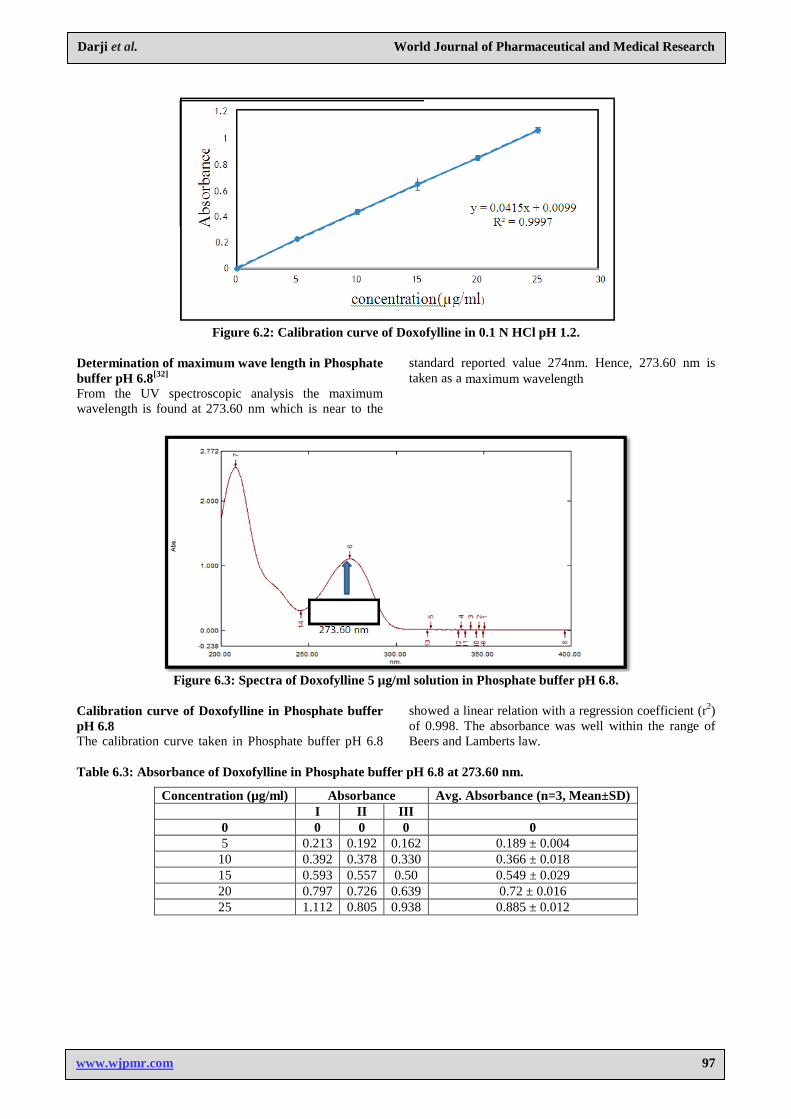
Figure 6.2: Calibration curve of Doxofylline in 0.1 N HCl pH 1.2.
Determination of maximum wave length in Phosphate
buffer pH 6.8[32]
From the UV spectroscopic analysis the maximum
wavelength is found at 273.60 nm which is near to the
standard reported value 274nm. Hence, 273.60 nm is
taken as a maximum wavelength
Figure 6.3: Spectra of Doxofylline 5 µg/ml solution in Phosphate buffer pH 6.8.
Calibration curve of Doxofylline in Phosphate buffer
pH 6.8 The calibration curve taken in Phosphate buffer pH 6.8
showed a linear relation with a regression coefficient (r2)
of 0.998. The absorbance was well within the range of
Beers and Lamberts law.
Table 6.3: Absorbance of Doxofylline in Phosphate buffer pH 6.8 at 273.60 nm.
Concentration (µg/ml) Absorbance Avg. Absorbance (n=3, Mean±SD)
I II III
0 0 0 0 0
5 0.213 0.192 0.162 0.189 ± 0.004
10 0.392 0.378 0.330 0.366 ± 0.018
15 0.593 0.557 0.50 0.549 ± 0.029
20 0.797 0.726 0.639 0.72 ± 0.016
25 1.112 0.805 0.938 0.885 ± 0.012
Darji et al. World Journal of Pharmaceutical and Medical Research
www.wjpmr.com
98
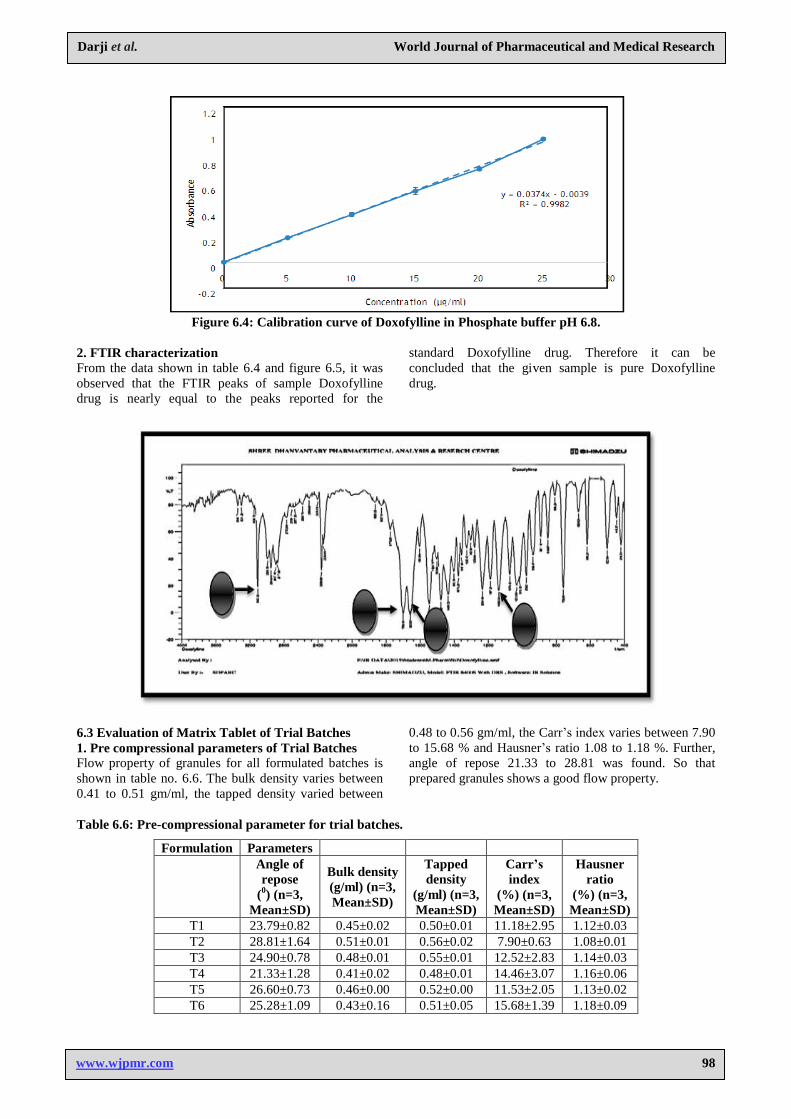
Figure 6.4: Calibration curve of Doxofylline in Phosphate buffer pH 6.8.
2. FTIR characterization From the data shown in table 6.4 and figure 6.5, it was
observed that the FTIR peaks of sample Doxofylline
drug is nearly equal to the peaks reported for the
standard Doxofylline drug. Therefore it can be
concluded that the given sample is pure Doxofylline
drug.
6.3 Evaluation of Matrix Tablet of Trial Batches
1. Pre compressional parameters of Trial Batches Flow property of granules for all formulated batches is
shown in table no. 6.6. The bulk density varies between
0.41 to 0.51 gm/ml, the tapped density varied between
0.48 to 0.56 gm/ml, the Carr’s index varies between 7.90
to 15.68 % and Hausner’s ratio 1.08 to 1.18 %. Further,
angle of repose 21.33 to 28.81 was found. So that
prepared granules shows a good flow property.
Table 6.6: Pre-compressional parameter for trial batches.
Formulation Parameters
Angle of
repose
(0) (n=3,
Mean±SD)
Bulk density
(g/ml) (n=3,
Mean±SD)
Tapped
density
(g/ml) (n=3,
Mean±SD)
Carr’s
index
(%) (n=3,
Mean±SD)
Hausner
ratio
(%) (n=3,
Mean±SD)
T1 23.79±0.82 0.45±0.02 0.50±0.01 11.18±2.95 1.12±0.03
T2 28.81±1.64 0.51±0.01 0.56±0.02 7.90±0.63 1.08±0.01
T3 24.90±0.78 0.48±0.01 0.55±0.01 12.52±2.83 1.14±0.03
T4 21.33±1.28 0.41±0.02 0.48±0.01 14.46±3.07 1.16±0.06
T5 26.60±0.73 0.46±0.00 0.52±0.00 11.53±2.05 1.13±0.02
T6 25.28±1.09 0.43±0.16 0.51±0.05 15.68±1.39 1.18±0.09
Darji et al. World Journal of Pharmaceutical and Medical Research
www.wjpmr.com
99
2. Post compressional parameters of Trial Batches From table no. 6.7 it was seen that all tablets passes the
weight variation test as per IP. Further the parameters
like hardness and thickness meet the criteria. The low
value of % friability indicated the mechanical stability
of the formulation. Drug content in the different
formulations of trial batches were found to be 96.57 to
100.4
Table 6.7: Post-compressional parameter for trial batches.
Formulation Parameters
Thickness
(mm) (n=3,
Mean±SD)
Diameter
(mm) (n=3,
Mean±SD)
Hardness
(kg/cm3) (n=3,
Mean±SD)
Weight Variation
(NMT 5%) (n=3,
Mean±SD)
Friability
(%) (n=3,
Mean±SD)
%Drug
content (n=3,
Mean±SD)
T1 4.28±0.001 12.56±0.09 6.56±0.15 Pass 0.24%±1.56 97.96
T2 4.75±0.004 12.94±0.11 6.33±0.15 Pass 0.37%±0.43 99.70
T3 3.96±0.006 12.73±0.49 6.1±0.1 Pass 0.19%±2.48 100.4
T4 4.91±0.003 12.85±0.56 7.03±0.25 Pass 0.33%±0.91 98.36
T5 4.88±0.008 12.42±0.20 6.7±0.17 Pass 0.41%±0.20 97.14
T6 4.59±0.005 12.63±0.94 6.89±0.36 pass 0.35%±1.08 96.57
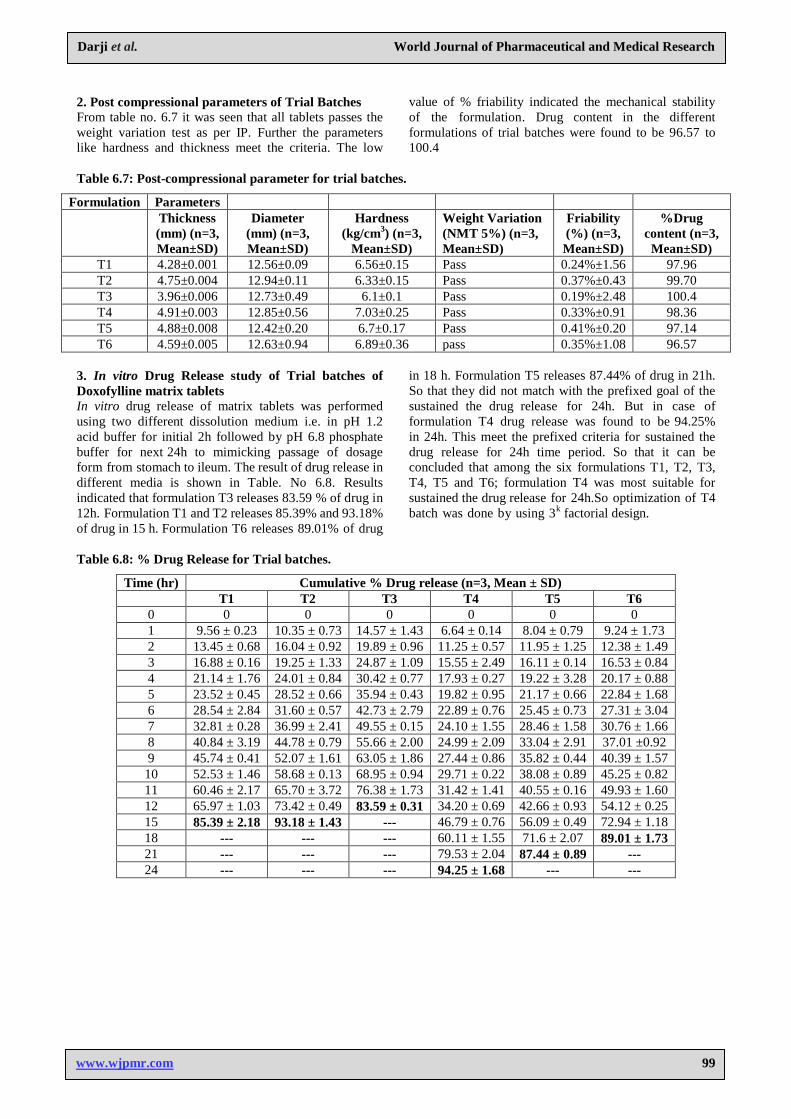
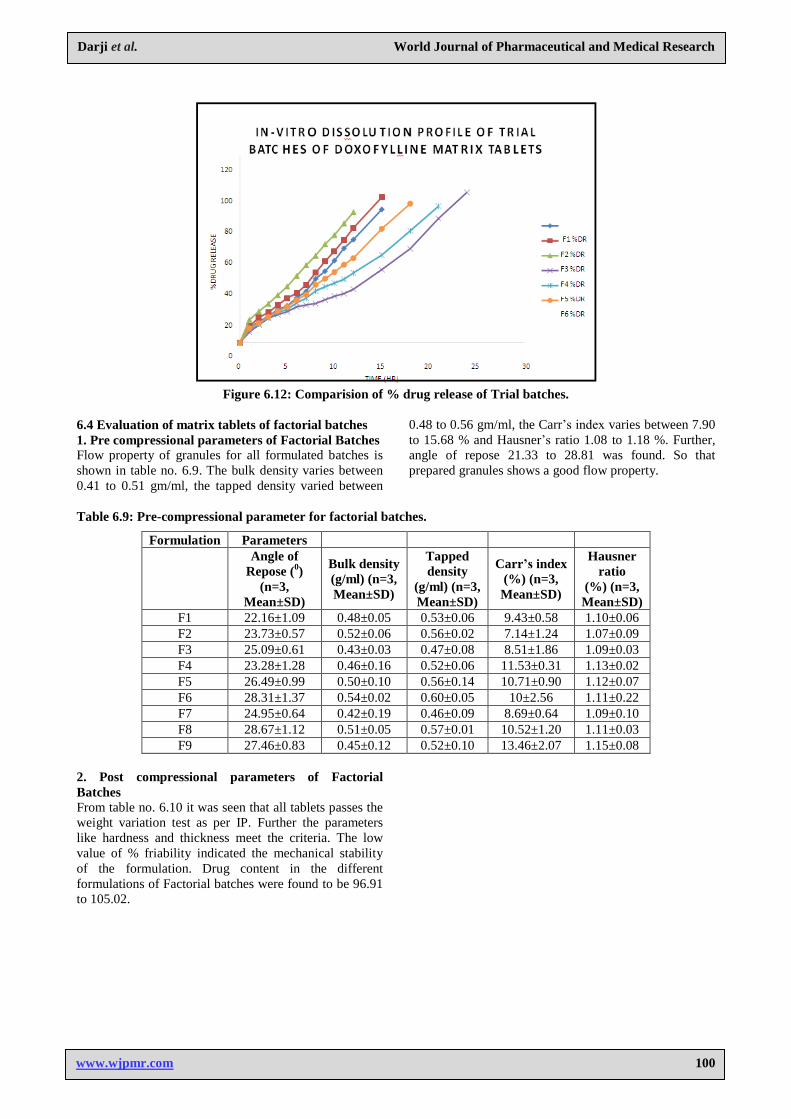
3. In vitro Drug Release study of Trial batches of
Doxofylline matrix tablets In vitro drug release of matrix tablets was performed
using two different dissolution medium i.e. in pH 1.2
acid buffer for initial 2h followed by pH 6.8 phosphate
buffer for next 24h to mimicking passage of dosage
form from stomach to ileum. The result of drug release in
different media is shown in Table. No 6.8. Results
indicated that formulation T3 releases 83.59 % of drug in
12h. Formulation T1 and T2 releases 85.39% and 93.18%
of drug in 15 h. Formulation T6 releases 89.01% of drug
in 18 h. Formulation T5 releases 87.44% of drug in 21h.
So that they did not match with the prefixed goal of the
sustained the drug release for 24h. But in case of
formulation T4 drug release was found to be 94.25%
in 24h. This meet the prefixed criteria for sustained the
drug release for 24h time period. So that it can be
concluded that among the six formulations T1, T2, T3,
T4, T5 and T6; formulation T4 was most suitable for
sustained the drug release for 24h.So optimization of T4
batch was done by using 3k
factorial design.
Table 6.8: % Drug Release for Trial batches.
Time (hr) Cumulative % Drug release (n=3, Mean ± SD)
T1 T2 T3 T4 T5 T6
0 0 0 0 0 0 0
1 9.56 ± 0.23 10.35 ± 0.73 14.57 ± 1.43 6.64 ± 0.14 8.04 ± 0.79 9.24 ± 1.73
2 13.45 ± 0.68 16.04 ± 0.92 19.89 ± 0.96 11.25 ± 0.57 11.95 ± 1.25 12.38 ± 1.49
3 16.88 ± 0.16 19.25 ± 1.33 24.87 ± 1.09 15.55 ± 2.49 16.11 ± 0.14 16.53 ± 0.84
4 21.14 ± 1.76 24.01 ± 0.84 30.42 ± 0.77 17.93 ± 0.27 19.22 ± 3.28 20.17 ± 0.88
5 23.52 ± 0.45 28.52 ± 0.66 35.94 ± 0.43 19.82 ± 0.95 21.17 ± 0.66 22.84 ± 1.68
6 28.54 ± 2.84 31.60 ± 0.57 42.73 ± 2.79 22.89 ± 0.76 25.45 ± 0.73 27.31 ± 3.04
7 32.81 ± 0.28 36.99 ± 2.41 49.55 ± 0.15 24.10 ± 1.55 28.46 ± 1.58 30.76 ± 1.66
8 40.84 ± 3.19 44.78 ± 0.79 55.66 ± 2.00 24.99 ± 2.09 33.04 ± 2.91 37.01 ±0.92
9 45.74 ± 0.41 52.07 ± 1.61 63.05 ± 1.86 27.44 ± 0.86 35.82 ± 0.44 40.39 ± 1.57
10 52.53 ± 1.46 58.68 ± 0.13 68.95 ± 0.94 29.71 ± 0.22 38.08 ± 0.89 45.25 ± 0.82
11 60.46 ± 2.17 65.70 ± 3.72 76.38 ± 1.73 31.42 ± 1.41 40.55 ± 0.16 49.93 ± 1.60
12 65.97 ± 1.03 73.42 ± 0.49 83.59 ± 0.31 34.20 ± 0.69 42.66 ± 0.93 54.12 ± 0.25
15 85.39 ± 2.18 93.18 ± 1.43 --- 46.79 ± 0.76 56.09 ± 0.49 72.94 ± 1.18
18 --- --- --- 60.11 ± 1.55 71.6 ± 2.07 89.01 ± 1.73
21 --- --- --- 79.53 ± 2.04 87.44 ± 0.89 ---
24 --- --- --- 94.25 ± 1.68 --- ---
Darji et al. World Journal of Pharmaceutical and Medical Research
www.wjpmr.com
100
Figure 6.12: Comparision of % drug release of Trial batches.
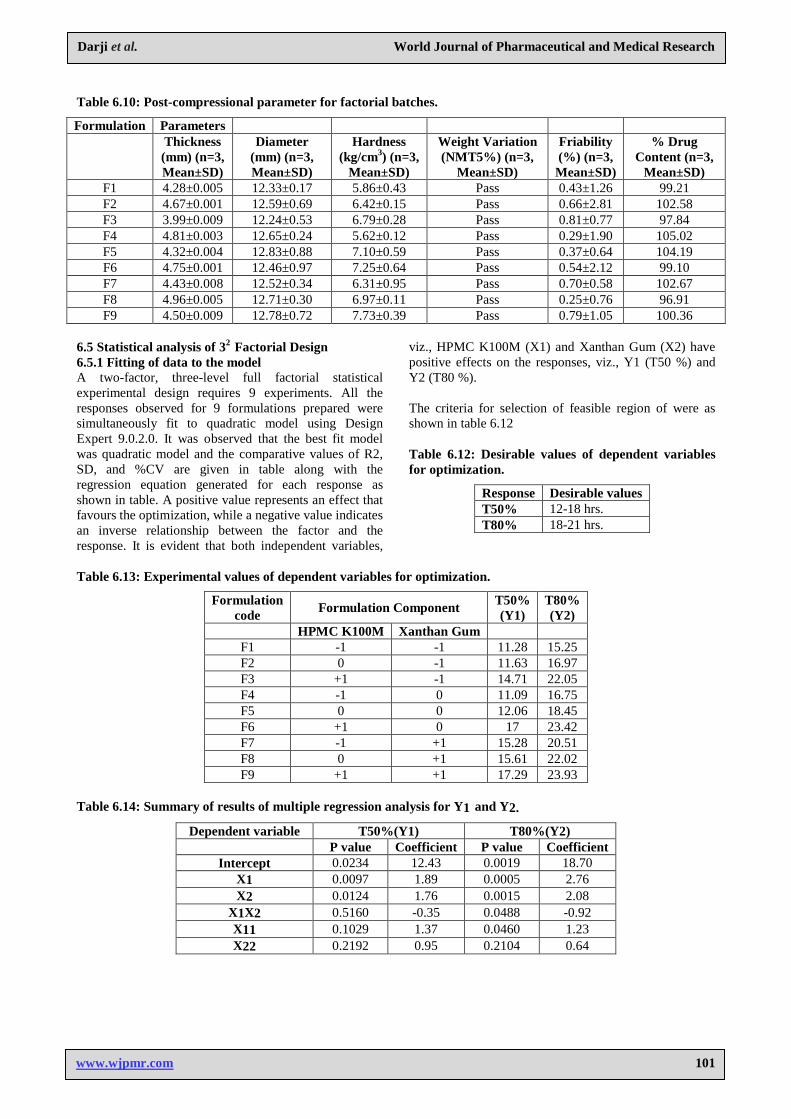
6.4 Evaluation of matrix tablets of factorial batches
1. Pre compressional parameters of Factorial Batches Flow property of granules for all formulated batches is
shown in table no. 6.9. The bulk density varies between
0.41 to 0.51 gm/ml, the tapped density varied between
0.48 to 0.56 gm/ml, the Carr’s index varies between 7.90
to 15.68 % and Hausner’s ratio 1.08 to 1.18 %. Further,
angle of repose 21.33 to 28.81 was found. So that
prepared granules shows a good flow property.
Table 6.9: Pre-compressional parameter for factorial batches.
Formulation Parameters
Angle of
Repose (0)
(n=3,
Mean±SD)
Bulk density
(g/ml) (n=3,
Mean±SD)
Tapped
density
(g/ml) (n=3,
Mean±SD)
Carr’s index
(%) (n=3,
Mean±SD)
Hausner
ratio
(%) (n=3,
Mean±SD)
F1 22.16±1.09 0.48±0.05 0.53±0.06 9.43±0.58 1.10±0.06
F2 23.73±0.57 0.52±0.06 0.56±0.02 7.14±1.24 1.07±0.09
F3 25.09±0.61 0.43±0.03 0.47±0.08 8.51±1.86 1.09±0.03
F4 23.28±1.28 0.46±0.16 0.52±0.06 11.53±0.31 1.13±0.02
F5 26.49±0.99 0.50±0.10 0.56±0.14 10.71±0.90 1.12±0.07
F6 28.31±1.37 0.54±0.02 0.60±0.05 10±2.56 1.11±0.22
F7 24.95±0.64 0.42±0.19 0.46±0.09 8.69±0.64 1.09±0.10
F8 28.67±1.12 0.51±0.05 0.57±0.01 10.52±1.20 1.11±0.03
F9 27.46±0.83 0.45±0.12 0.52±0.10 13.46±2.07 1.15±0.08
2. Post compressional parameters of Factorial
Batches From table no. 6.10 it was seen that all tablets passes the
weight variation test as per IP. Further the parameters
like hardness and thickness meet the criteria. The low
value of % friability indicated the mechanical stability
of the formulation. Drug content in the different
formulations of Factorial batches were found to be 96.91
to 105.02.
Darji et al. World Journal of Pharmaceutical and Medical Research
www.wjpmr.com
101
Table 6.10: Post-compressional parameter for factorial batches.
Formulation Parameters
Thickness
(mm) (n=3,
Mean±SD)
Diameter
(mm) (n=3,
Mean±SD)
Hardness
(kg/cm3) (n=3,
Mean±SD)
Weight Variation
(NMT5%) (n=3,
Mean±SD)
Friability
(%) (n=3,
Mean±SD)
% Drug
Content (n=3,
Mean±SD)
F1 4.28±0.005 12.33±0.17 5.86±0.43 Pass 0.43±1.26 99.21
F2 4.67±0.001 12.59±0.69 6.42±0.15 Pass 0.66±2.81 102.58
F3 3.99±0.009 12.24±0.53 6.79±0.28 Pass 0.81±0.77 97.84
F4 4.81±0.003 12.65±0.24 5.62±0.12 Pass 0.29±1.90 105.02
F5 4.32±0.004 12.83±0.88 7.10±0.59 Pass 0.37±0.64 104.19
F6 4.75±0.001 12.46±0.97 7.25±0.64 Pass 0.54±2.12 99.10
F7 4.43±0.008 12.52±0.34 6.31±0.95 Pass 0.70±0.58 102.67
F8 4.96±0.005 12.71±0.30 6.97±0.11 Pass 0.25±0.76 96.91
F9 4.50±0.009 12.78±0.72 7.73±0.39 Pass 0.79±1.05 100.36
6.5 Statistical analysis of 32 Factorial Design
6.5.1 Fitting of data to the model A two-factor, three-level full factorial statistical
experimental design requires 9 experiments. All the
responses observed for 9 formulations prepared were
simultaneously fit to quadratic model using Design
Expert 9.0.2.0. It was observed that the best fit model
was quadratic model and the comparative values of R2,
SD, and %CV are given in table along with the
regression equation generated for each response as
shown in table. A positive value represents an effect that
favours the optimization, while a negative value indicates
an inverse relationship between the factor and the
response. It is evident that both independent variables,
viz., HPMC K100M (X1) and Xanthan Gum (X2) have
positive effects on the responses, viz., Y1 (T50 %) and
Y2 (T80 %).
The criteria for selection of feasible region of were as
shown in table 6.12
Table 6.12: Desirable values of dependent variables
for optimization.
Response Desirable values
T50% 12-18 hrs.
T80% 18-21 hrs.
Table 6.13: Experimental values of dependent variables for optimization.
Formulation
code Formulation Component
T50%
(Y1)
T80%
(Y2)
HPMC K100M Xanthan Gum
F1 -1 -1 11.28 15.25
F2 0 -1 11.63 16.97
F3 +1 -1 14.71 22.05
F4 -1 0 11.09 16.75
F5 0 0 12.06 18.45
F6 +1 0 17 23.42
F7 -1 +1 15.28 20.51
F8 0 +1 15.61 22.02
F9 +1 +1 17.29 23.93
Table 6.14: Summary of results of multiple regression analysis for Y1 and Y2.
Dependent variable T50%(Y1) T80%(Y2)
P value Coefficient P value Coefficient
Intercept 0.0234 12.43 0.0019 18.70
X1 0.0097 1.89 0.0005 2.76
X2 0.0124 1.76 0.0015 2.08
X1X2 0.5160 -0.35 0.0488 -0.92
X11 0.1029 1.37 0.0460 1.23
X22 0.2192 0.95 0.2104 0.64
Darji et al. World Journal of Pharmaceutical and Medical Research
www.wjpmr.com
102
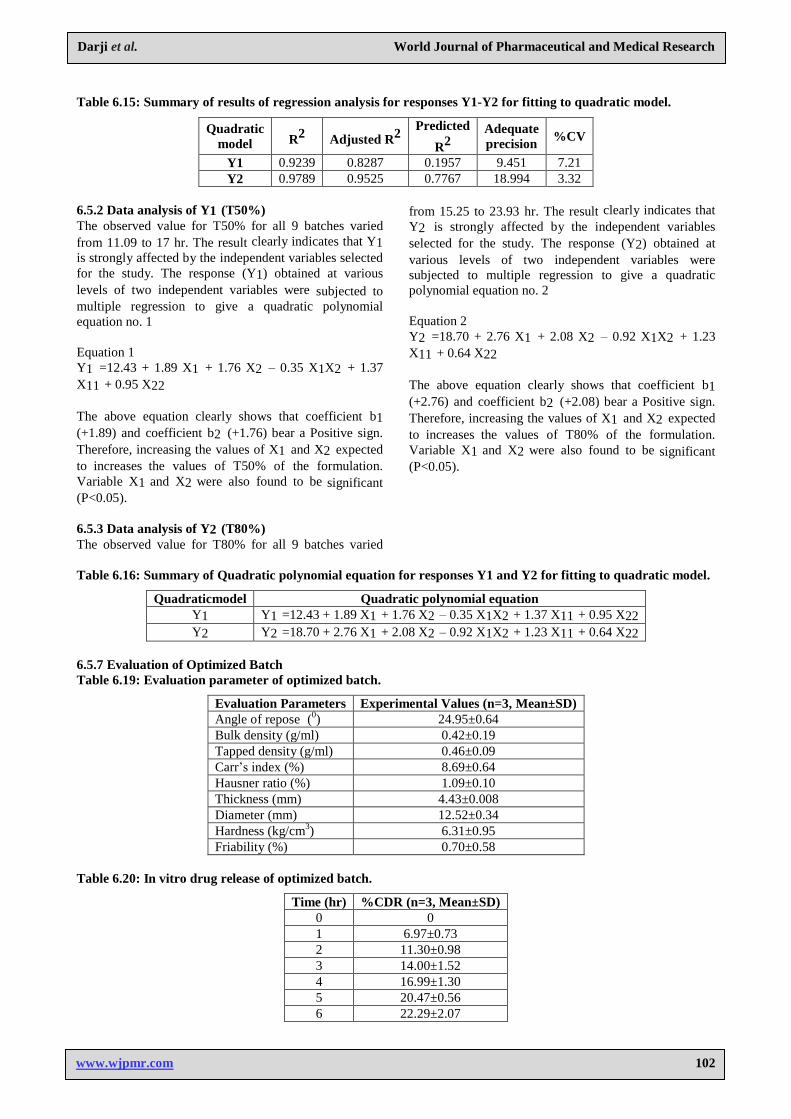
Table 6.15: Summary of results of regression analysis for responses Y1-Y2 for fitting to quadratic model.
Quadratic
model R2
Adjusted R2
Predicted
R2
Adequate
precision %CV
Y1 0.9239 0.8287 0.1957 9.451 7.21
Y2 0.9789 0.9525 0.7767 18.994 3.32
6.5.2 Data analysis of Y1 (T50%) The observed value for T50% for all 9 batches varied
from 11.09 to 17 hr. The result clearly indicates that Y1
is strongly affected by the independent variables selected
for the study. The response (Y1) obtained at various
levels of two independent variables were subjected to
multiple regression to give a quadratic polynomial
equation no. 1
Equation 1
Y1 =12.43 + 1.89 X1 + 1.76 X2 – 0.35 X1X2 + 1.37
X11 + 0.95 X22
The above equation clearly shows that coefficient b1
(+1.89) and coefficient b2 (+1.76) bear a Positive sign.
Therefore, increasing the values of X1 and X2 expected
to increases the values of T50% of the formulation.
Variable X1 and X2 were also found to be significant
(P<0.05).
6.5.3 Data analysis of Y2 (T80%) The observed value for T80% for all 9 batches varied
from 15.25 to 23.93 hr. The result clearly indicates that
Y2 is strongly affected by the independent variables
selected for the study. The response (Y2) obtained at
various levels of two independent variables were
subjected to multiple regression to give a quadratic
polynomial equation no. 2
Equation 2
Y2 =18.70 + 2.76 X1 + 2.08 X2 – 0.92 X1X2 + 1.23
X11 + 0.64 X22
The above equation clearly shows that coefficient b1
(+2.76) and coefficient b2 (+2.08) bear a Positive sign.
Therefore, increasing the values of X1 and X2 expected
to increases the values of T80% of the formulation.
Variable X1 and X2 were also found to be significant
(P<0.05).
Table 6.16: Summary of Quadratic polynomial equation for responses Y1 and Y2 for fitting to quadratic model.
Quadraticmodel Quadratic polynomial equation
Y1 Y1 =12.43 + 1.89 X1 + 1.76 X2 – 0.35 X1X2 + 1.37 X11 + 0.95 X22
Y2 Y2 =18.70 + 2.76 X1 + 2.08 X2 – 0.92 X1X2 + 1.23 X11 + 0.64 X22
6.5.7 Evaluation of Optimized Batch
Table 6.19: Evaluation parameter of optimized batch.
Evaluation Parameters Experimental Values (n=3, Mean±SD)
Angle of repose (0) 24.95±0.64
Bulk density (g/ml) 0.42±0.19
Tapped density (g/ml) 0.46±0.09
Carr’s index (%) 8.69±0.64
Hausner ratio (%) 1.09±0.10
Thickness (mm) 4.43±0.008
Diameter (mm) 12.52±0.34
Hardness (kg/cm3) 6.31±0.95
Friability (%) 0.70±0.58
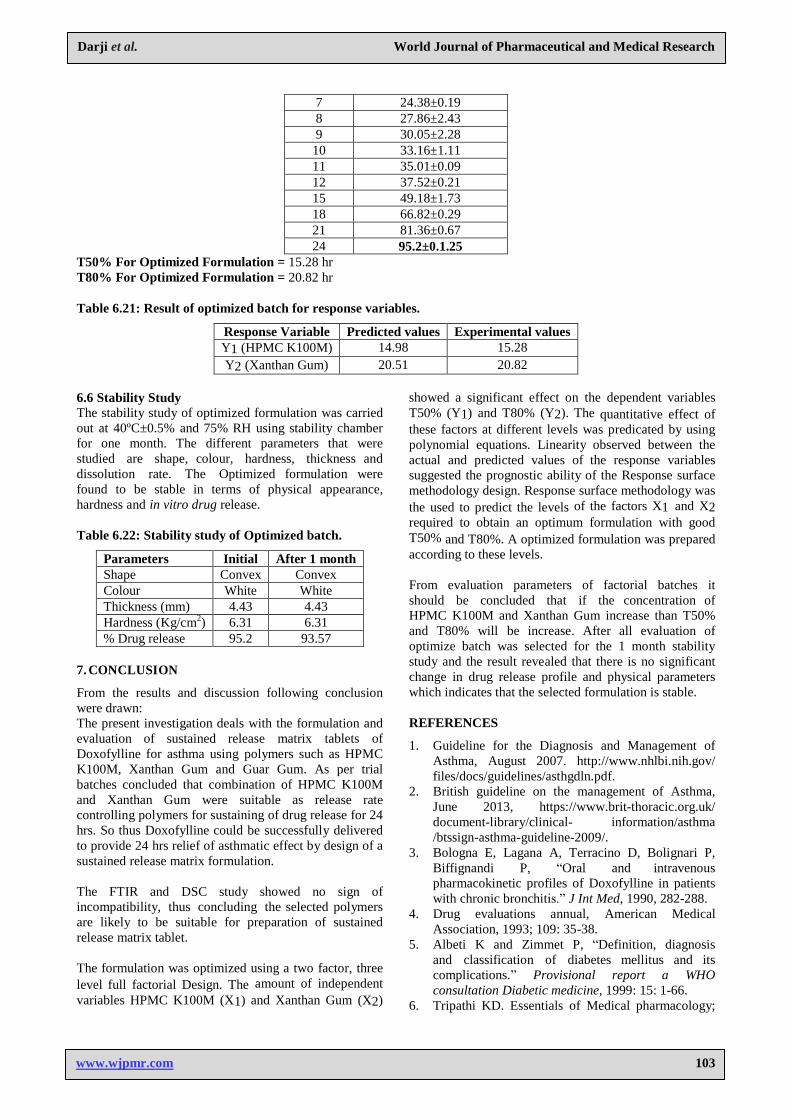
Table 6.20: In vitro drug release of optimized batch.
Time (hr) %CDR (n=3, Mean±SD)
0 0
1 6.97±0.73
2 11.30±0.98
3 14.00±1.52
4 16.99±1.30
5 20.47±0.56
6 22.29±2.07
Darji et al. World Journal of Pharmaceutical and Medical Research
www.wjpmr.com
103
7 24.38±0.19
8 27.86±2.43
9 30.05±2.28
10 33.16±1.11
11 35.01±0.09
12 37.52±0.21
15 49.18±1.73
18 66.82±0.29
21 81.36±0.67
24 95.2±0.1.25
T50% For Optimized Formulation = 15.28 hr
T80% For Optimized Formulation = 20.82 hr
Table 6.21: Result of optimized batch for response variables.
Response Variable Predicted values Experimental values
Y1 (HPMC K100M) 14.98 15.28
Y2 (Xanthan Gum) 20.51 20.82
6.6 Stability Study The stability study of optimized formulation was carried
out at 40ºC±0.5% and 75% RH using stability chamber
for one month. The different parameters that were
studied are shape, colour, hardness, thickness and
dissolution rate. The Optimized formulation were
found to be stable in terms of physical appearance,
hardness and in vitro drug release.
Table 6.22: Stability study of Optimized batch.
Parameters Initial After 1 month
Shape Convex Convex
Colour White White
Thickness (mm) 4.43 4.43
Hardness (Kg/cm2) 6.31 6.31
% Drug release 95.2 93.57
7. CONCLUSION
From the results and discussion following conclusion
were drawn:
The present investigation deals with the formulation and
evaluation of sustained release matrix tablets of
Doxofylline for asthma using polymers such as HPMC
K100M, Xanthan Gum and Guar Gum. As per trial
batches concluded that combination of HPMC K100M
and Xanthan Gum were suitable as release rate
controlling polymers for sustaining of drug release for 24
hrs. So thus Doxofylline could be successfully delivered
to provide 24 hrs relief of asthmatic effect by design of a
sustained release matrix formulation.
The FTIR and DSC study showed no sign of
incompatibility, thus concluding the selected polymers
are likely to be suitable for preparation of sustained
release matrix tablet.
The formulation was optimized using a two factor, three
level full factorial Design. The amount of independent
variables HPMC K100M (X1) and Xanthan Gum (X2)
showed a significant effect on the dependent variables
T50% (Y1) and T80% (Y2). The quantitative effect of
these factors at different levels was predicated by using
polynomial equations. Linearity observed between the
actual and predicted values of the response variables
suggested the prognostic ability of the Response surface
methodology design. Response surface methodology was
the used to predict the levels of the factors X1 and X2
required to obtain an optimum formulation with good
T50% and T80%. A optimized formulation was prepared
according to these levels.
From evaluation parameters of factorial batches it
should be concluded that if the concentration of
HPMC K100M and Xanthan Gum increase than T50%
and T80% will be increase. After all evaluation of
optimize batch was selected for the 1 month stability
study and the result revealed that there is no significant
change in drug release profile and physical parameters
which indicates that the selected formulation is stable.
REFERENCES
1. Guideline for the Diagnosis and Management of
Asthma, August 2007. http://www.nhlbi.nih.gov/
files/docs/guidelines/asthgdln.pdf.
2. British guideline on the management of Asthma,
June 2013, https://www.brit-thoracic.org.uk/
document-library/clinical- information/asthma
/btssign-asthma-guideline-2009/.
3. Bologna E, Lagana A, Terracino D, Bolignari P,
Biffignandi P, “Oral and intravenous
pharmacokinetic profiles of Doxofylline in patients
with chronic bronchitis.” J Int Med, 1990, 282-288.
4. Drug evaluations annual, American Medical
Association, 1993; 109: 35-38.
5. Albeti K and Zimmet P, “Definition, diagnosis
and classification of diabetes mellitus and its
complications.” Provisional report a WHO
consultation Diabetic medicine, 1999: 15: 1-66.
6. Tripathi KD. Essentials of Medical pharmacology;
Darji et al. World Journal of Pharmaceutical and Medical Research
www.wjpmr.com
104
6th
Edn; Jaypee Brothers Publishers (p) Ltd, 2008;
280-287.
7. Jantzen GM., Robinson JR., Lee VH. Design and
fabrication of oral controlled release drug delivery
systems, Modern Pharmaceutics; 3rd Edn; Marcel
Dekker, New York, 1996; 168-196.
8. Tiwari S, Siahboomi R, “Extended release oral drug
delivery technology: Monolithic matrix systems”,
Drug Delivery Systems, Totowa, Humana NJ Press,
1998.
9. Banker G., Christopher R. Sustained and controlled
drug delivery systems, In Modern Pharmaceutics;
3rdedition; Marcel Dekker, New York, 1996; 576-
593.
10. Chien YW, Lin S. Encyclopedia of Pharmaceutical
Technology;2nd Edn; Marcel Dekker, New York,
1997; 304-305.
11. Venkatraman S, Davar A, Chester A, Kleiner L.
An overview of controlled release systems,
Handbook of Pharmaceutical Controlled Release
Technology; Marcel Dekker, New York, 2000; 431-
465.
12. Brahmankar DM., Jaiswal SB. Bio pharmaceutics
and Pharmacokinetics, A Treaties; 1st Edn; Vallabh
Prakashan, New Delhi, 1995; 335-357.
13. Jantzen GM and Robinson JR, “Sustained and
controlled drug delivery systems.” Modern
pharmaceutics, 1996; 4: 501-515.
14. Cirrilo R, Borone D, Franzone JS, “Doxofylline
an asthmatic drug lacking affinity for adenosine
receptors.” Arch Int Pharmacodyn Ther., 1988;
295: 221-237.
15. Bologna E, Lagana A, Terracino D, Bolignari P,
Biffignandi P, “Oral and intravenous
pharmacokinetic profiles of Doxofylline in patients
with chronic bronchitis.” J Int Med., 1990; 282-288.
16. Villain F, Maria DP, Ronchi E and Galimberti
M, “Oral doxofylline with chronic obstructive
pulmonary disease.” Int J Clin Pharmacol Ther.,
1997; 35(3): 107-111.
17. Ganesh GN, “Preparation and Evaluation of
Sustained Release Matrix Tablet of Diclofenac
Sodium using Natural Polymer.” J. Pharm. Sci. &
Res., 2010; 2(6): 360-368.
18. Krishnaiah YS, Karthikeyan RS, Gouri SV,
Satyanarayana V, “Three-layer guar gum matrix
tablet formulations for oral controlled delivery of
highly soluble trimetazidine dihydrochloride.” J
Control Release., 2002; 14-25.
19. Patel H, Panchal D, Patel U, Brahmbhatt T,
Suthar M, “Matrix type drug delivery system: a
review.” J. pharm. Sci. Bio. Sci., 2011; 143-151.
20. Shruthi R, M,pharm thesis, “A Prospective
Comparative study of efficacy and tolerability of
Doxofylline over other Methylxanthines in mild to
moderate persistent bronchial Asthma in a tertiary
care hospital.” Rajiv Gandhi University of Health
science, 2013.
21. Muhammad AM, Zafar I, Steven HN, “Gaur Gum,
Xanthan Gum, and HPMC Can Defined Release
Mechanisms and sustaine release of propranolol
Hydrochloride.” AAPS Pharm Sci Tech., 2011; 12:
77-87.
22. Baisya O, Deb J, Bhowmik M, “Formulation and
evaluation of sustained release matrix tablet of
atenolol based on natural polymer.” Reseach journal
of pharmaceutical, biological and chemical
sciences, 2012; 3: 878-86.
23. Praveen P, Gnanaprakash K, Gobinath M,
“Formulation and Evaluation of Sustained release
Tablets of Doxofylline.” Int J of Current
Pharmaceutical & Clinical Research., 2014; 4: 13-
20.
24. Shajan A and Narayanan N, “Formulation and
Evaluation of Bilayer Tablets of Doxofylline Hcl
and Montelukast Sodium.” Int J of Advanced
Pharmaceutics, 2012; 2: 119-124.


