Embed Size (px)
Citation preview
ZJS - 262 1962
M. Holaaa
MEASURED SPECTRA OF HEUTROIS BSCAPUG PROM IROÍ SPHERES
Reg. 5. ÚYTSI 73307
SKODA WORKS
luoleex Power Construction Dirieion, Information Centre
FLZSff, CZECHOSLOVAKIA
- 2 -1. DTTRODUCTIOH
Comparison of measured and calculated results of neutron penetration through a given medium is тегу often difficult on aooount of incorrectly defined source of radiation used in the experiment, ami sometimes also due to geometry, which may he rather complicated from the viewpoint of calculation» It is the reason why In the recent years the basio testing of the calculations! methods has been carried out experimentally using Of 252 as a well-defined source of neutrons and spherical geometry of the medium involved.
It may be said that iron is one of the fundamental materials used in reactor technology* But its properties, namely its high scattering cross section as well as the striking resonance character of its total effective cross section. Involve problems in calculating the penetration of neutrons. The authors of /1/ and /2/ have measured the penetration of neutrons emitted by Cf 252 through Iron in a spherical geometry, and compared the results with calculation. Because their results exhibit a rather high scattering, we have performed another measurement by means of iron spheres with diameters 20, 30, and 50 em.
The measurement of neutron spectra in such verifying experiments is carried out using differential spectrometrle methods which offer to obtain sufficiently fine neutron spectra.These methods are usually based on the scatter of neutrons on hydrogen nuclei and detection of recoil protons. Our measurement has been performed using a etilbene crystal sointlllation spectrometer, and the SP-2 proportional counter filled with hydrogen (392*4 kPa). The energy range of measured spectra has been from 10 ktY up to 10 MeV.
- 4 -3. ТНВ МВТНПТ) от msASURING AND THE EVALUATION OP NBUTROH SPECTRA
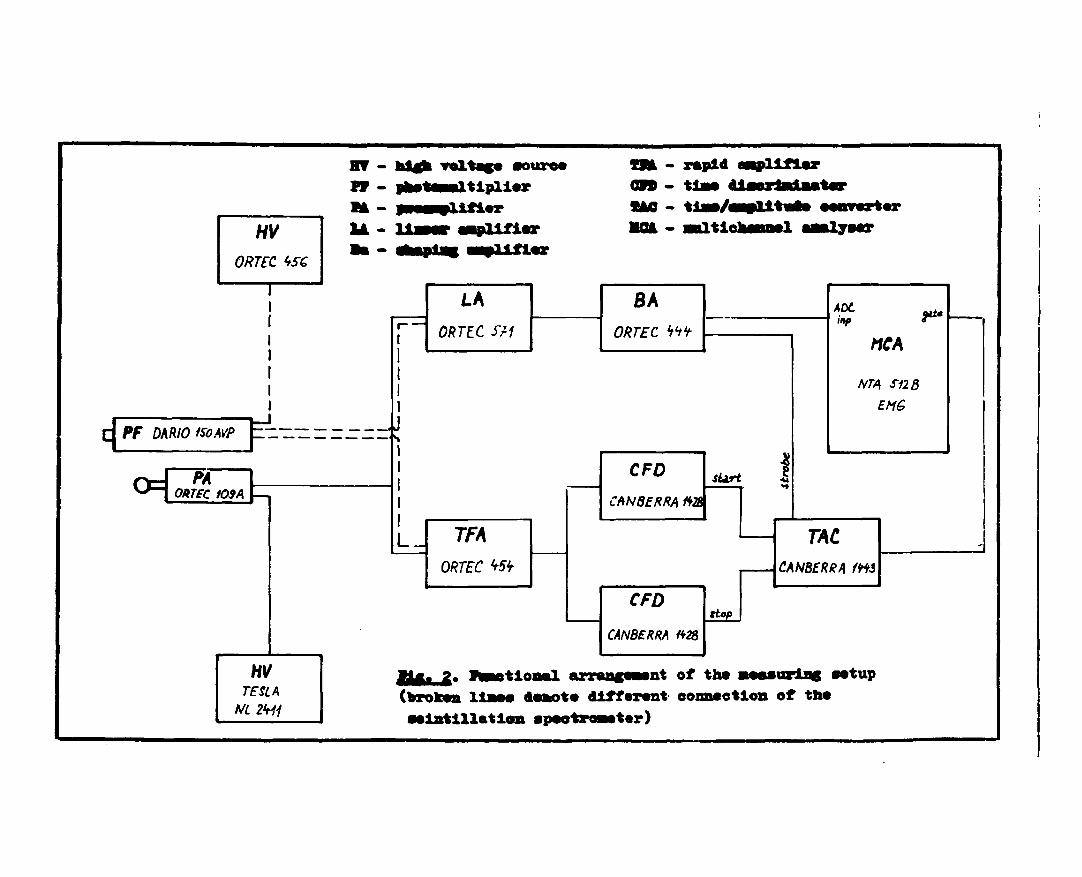
Tht neutron spectra have been measured using a differential apectrometrlc method based on the registration of recoil protons, the gama background being discriminated eleotronicall/. Spectra of neutrons with energy ranging from 0,5 to 10 MeV пате bean measured using a stilbene crystal scintillation spectrometer* Spectra of neutrons with energy in the region from 10 keY to 800 ke? hare been measured by means of hydrogen-filled SP-2 spherical oliamber with a diameter of 40 am, the hydrogen Doing under 392*4 кРа of pressure. Functional arrangement of the measuring setup is shown in fig. 2* The separation of pulses from neutrons and photons is based on different front edge of pulses from protons (neutrons) and electrons (photons)* The separation signal is processed in the case of the scintillation spectrometer in dependence on pulse rise time, and in the case of the hydrogen chamber in dependence on pulse rise speed* The dependence of pulse rise time on energy necessitates to divide the spectrum obtained by the scintillation spectrometer into two components (a soft component and a hard one). Due to an escape of electrons from the hydrogen chamber there occurs a so-called physical threshold of photon discrimination. It is the highest energy which electrons can impart to the detector. For the SP-2 chamber filled with hydrogen (392.4 kPa) this energy equals to some 120 keV. For this reason we divide the measurement of spectra of neutrons by means of hydrogen chamber into two components* The hard component (100 keV up to 800 keV) is measured without discrimination of photons, while the soft one (10 keV up to 150 keT) is measured with discrimination. Furthermore, insufficient difference of rise times from proton and electron pulses from the hydrogen chamber makes it necessary to adopt an additional discrimination of photons connected with measuring a purs source of photons (Ra 226). This procedure has been described at a greater length in /4/.
- 6 -
speotra, the neutron spectra are evaluated on the basis of
their smoothed derivative, cubical parabola with 7 points of
fitting being used for the smoothing. The division of spectrum
energy soale is logarithmic with 40 points in one decade.
4l \"\TY*1S OF MEASURED RESULTS
Measured spectra of neutrons emitted by the source Cf 252
and neutrons escaping from the surfaces of iron spheres dia 20,
30, and 50 mm, are presented in fig» 3 and in table 1. The
values are normalised to one neutron emitted by the source,
the normalising constant being Se/4/r2 • 7.8 z ioV cm •
The statistical error of the measured results has been mar
kedly influenced by the separation of measured spectral data
from the background of scattered neutrons. The small separa
tion of the effect from the background has made It practically
impossible to evaluate the spectrum of neutrons from Cf 252
with energies under 100 keV. Furthermore, statistical scatter
in the energy region between 100 and 300 keV has been increa
sed for the same reason. In measuring on iron spheres, this
small separation has resulted again in a marked statistical
scatter of measured values in energy regions 10 - 20 keV and
30 - 50 keV. Achieving a better accuracy would necessitate to
decrease the distance between the detector and the neutron
source, in which ease the influence of the background caused by
scattered neutrons would be reduced.
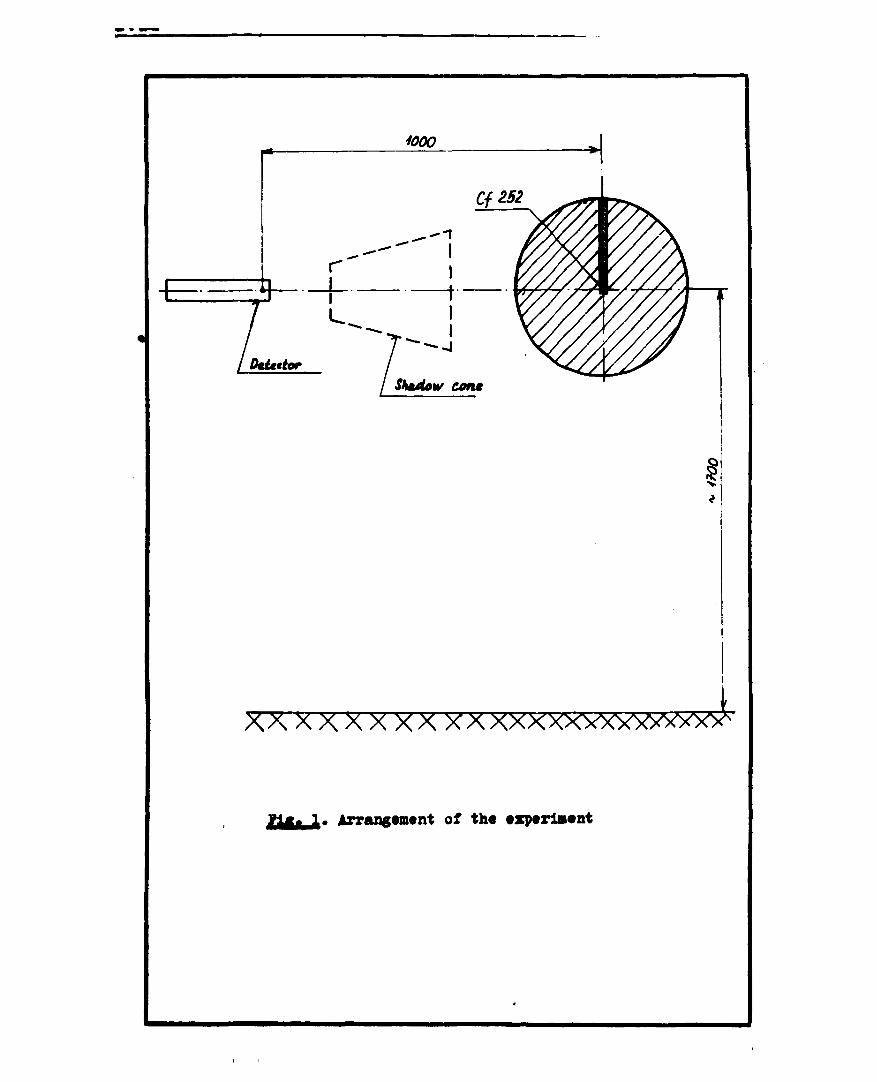
Comparison of measured neutron spectra (fig. 3) suggests
a rapid decrease of neutron flux density for E>1*5 MeV with
increasing iron thickness. The energy region between 0.8 and
1.5 MeV is transitory| after an initial increase of spectrum
values they start to decrease as early as from small iron
thicknesses. The third Important region is for neutron energy
below 0*8 MeV. Here the neutron flux densities grow in the
whole range of measured iron thicknesses. Because the ret* of
growth Is highest in the regions of least effective cross
seotlon, the resonance character of the spectrum Is more and
more expressive. For energy over 3 MeV the measured spectrum
of Cf 252 exhibits a very good concordance with theory /8/.
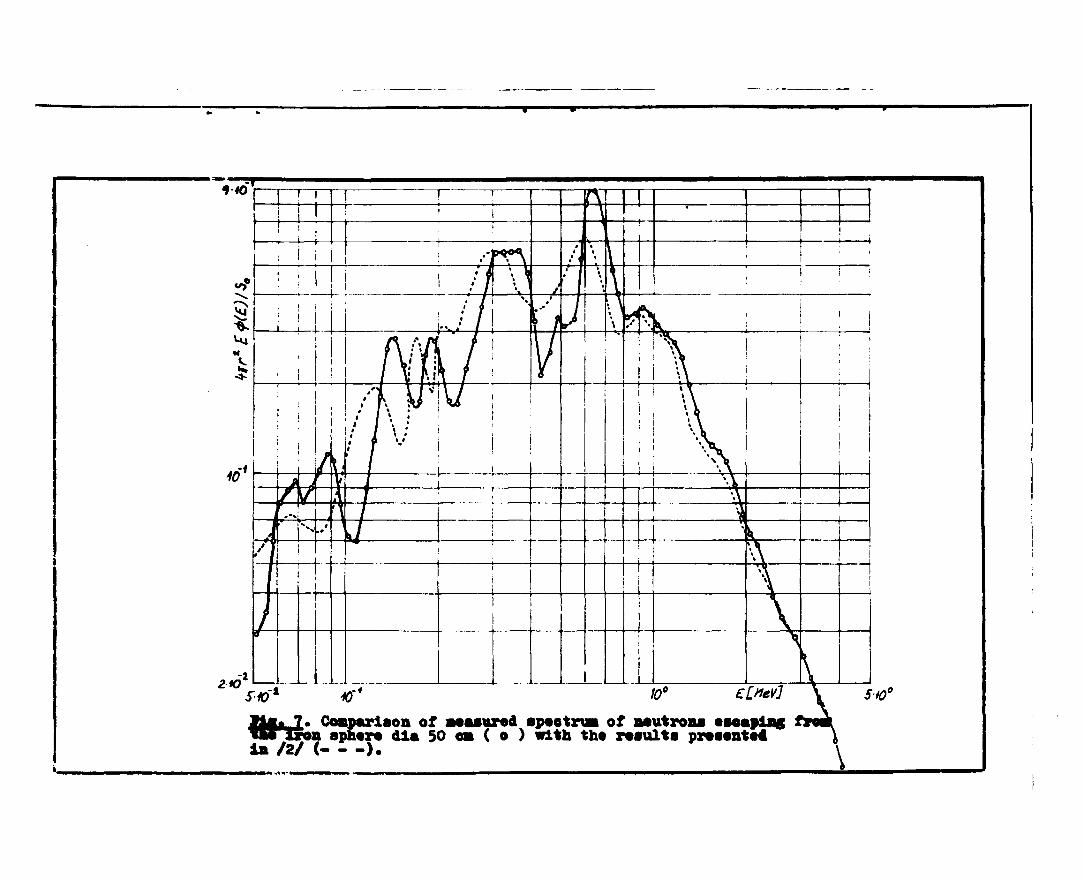
- 8 -the differences are in the limits which axe adequate to different philosophy of measurement and data processing (e.g. division of the neutron spectrum from the viewpoint of energy). The deviations for energy below 800 keV result pertly from different energy resolution of the detectors, partly from data processing. In addition, the shift of resonances towards lower energies /2/, which is especially marked in fig. 7 (sphere, dia 50 cm), may serve as an evidence of different calibration (from the viewpoint of energy) of the detectors.
5. CONCLUSIONS In comparing our results with /1/ and /2/, we have
found satisfactory concordance of the spectra of neutrons escaping from the surfaces of iron spheres only in the region of В - 100 - 650 keY (in case /1/) and for E> 800 keV in case /2/. The differences in the findings of individual authors cannot be attributed only to different energy resolution of the detectors or to different dlvisiom of the neutron spectrum. Of great Impact are also systematic errors occurring both in measurement and in data processing. The main sources of the errors consist in inaccurate energy calibration and in the bond between individual components of tie spectrum. Because results of these measurements are used for testing the calcu-lational methods, while the results in themselves are not considered as reliable, it seemsjustified to start in the verification of the calculation from experimental results of as many authors as possible. Beyond this, comparing experiments should be done which could help in eliminating the systematic errors of measurements of all experimental teams involved.
1000
Cf252
Г
U.
Dtitttor Shadow cone
XX X X X X XX ХХХХХХХ\УхУЛУУ>^
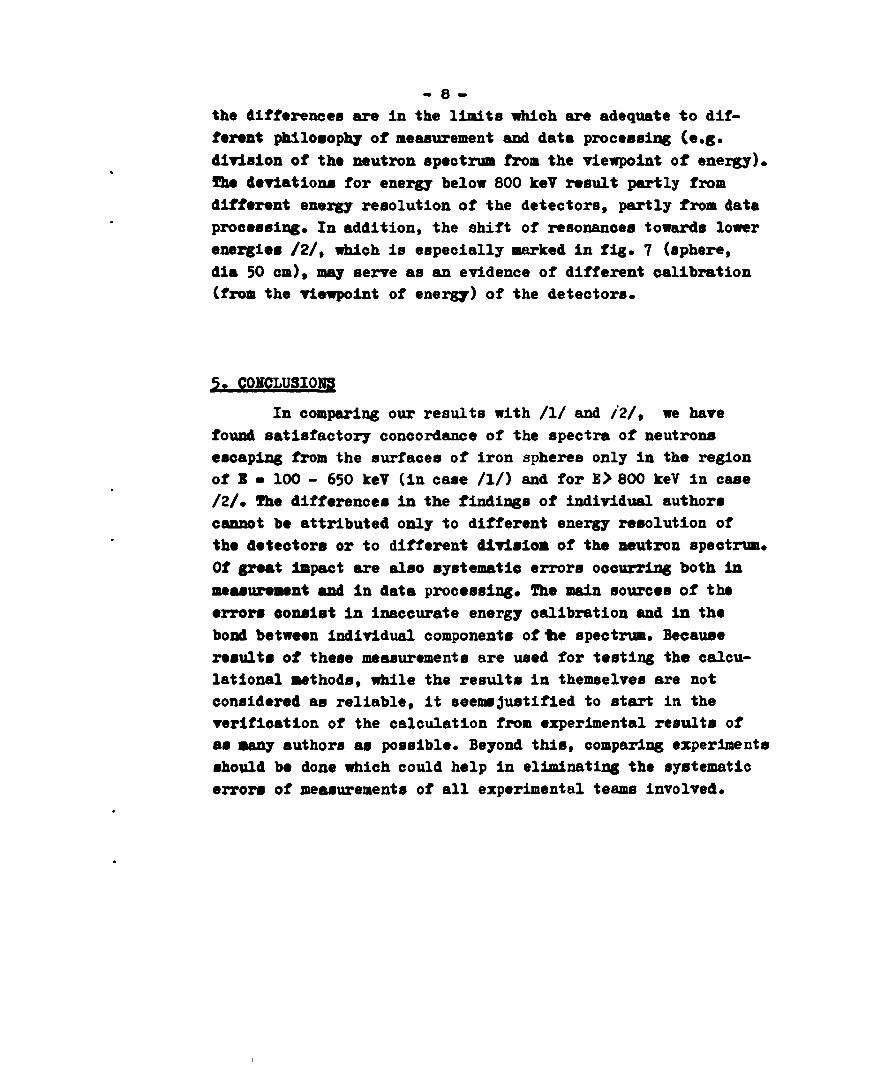
У1ж. 1, Arrangement of the experiment
U l i j » lao apootr« of aratreaa omitted bj fluion of Of 292 ( * ) . tad taa «Metro of Matron* eooapiag from Iron aphereo •la 20 ( • ) , 41a 30 ( + ) , oat 41» 50 ( a ) . Breton 11a* «aaotoa taawrotlool apootama of Of 252 /B/. Taleea aoraallae* to oat
oalttrt ay the oemroe.
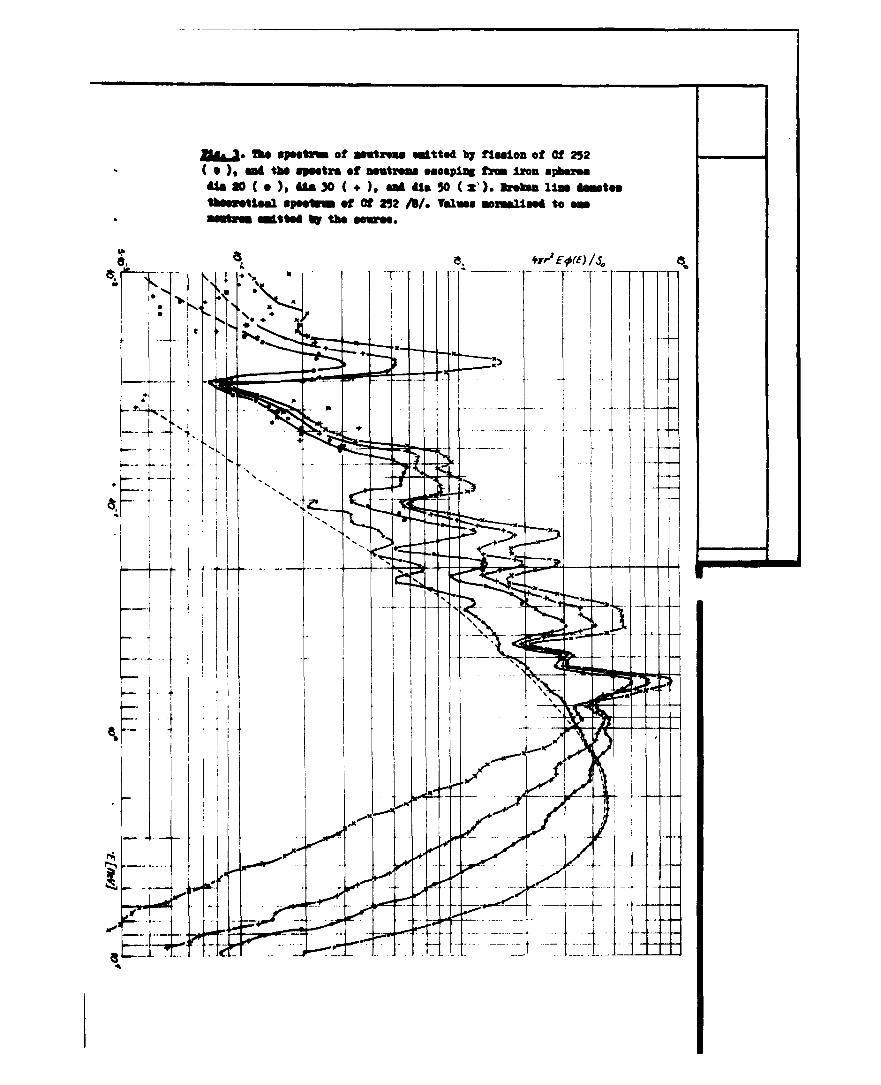
1QV ELMeV] Ид?» 5. Оомраг1аоп of moaaarod apaotnm of aautroaa ••««plac from taa lroa apaara die 20 « ( • ) «1th the raaalta presented la A / ( ), and /2/ ( ).
140
гю EÍMeV]
Iff- 7* Comparison of аошгагоД apootnm of neutrone oaeamlng ta* iron aphoro dla 50 ев ( o ) with tha reaulta preaantat ia /2/ (- - - ) .
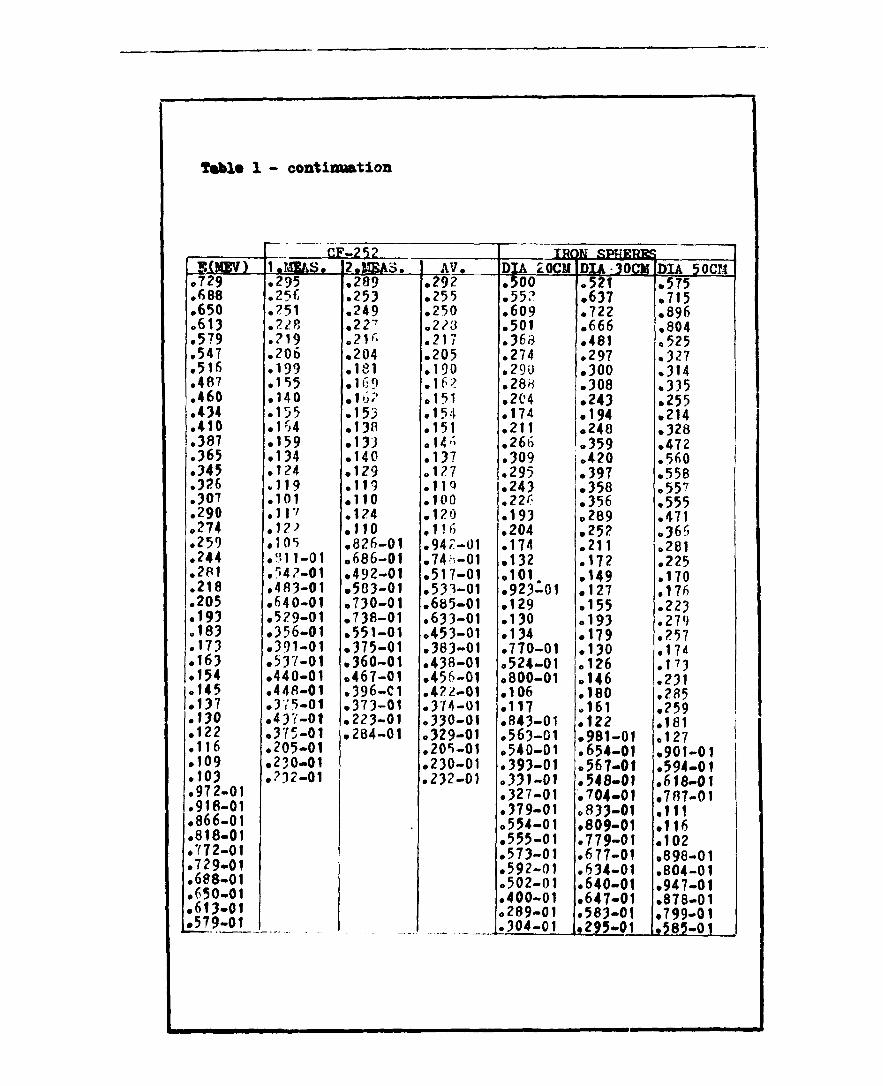
Tábl* 1 - continuation
S(MEV) .729 • 688 .650 .613 .579 .547 .516 .487 .460 .434 .410 .387 .365 .345 .326 .307 .290 .274 .259 .244 .281 .218 .205 .193 .183 .173 .163 .154 .145 .137 .130 .122 .116 .109 .103 .972-01 .918-01
Л f f Jb л .866-01 .818-01 .772-01 .729-01 .688-01 .650-01 •613-01 •579-01
CF-2«>? 1 .MEAS. .295 .256 .251 .22Я .219 .206 .199 • 1*>5 .140 .155 .164 .159 .134 .124 .119 .101 .117 . 1 ? ' .105 ."•11-01 .r. 4 2-01 .483-01 .640-01 .529-01 .356-01 .391-01 .537-01 •440-01 .448-01 •375-01 .437-01 •375-01 .205-01 •230-01 ,?32-01
I
2.MEA3. .289 .253 .249 . 22^ .21 <"• .204 .181 .169 .16; ' .153 • 138 .133 .140 . 129 .119 • 110 .124 • 110 •826-01 •686-01 .492-01 .583-01 .730-01 .738-01 .551-01 •375-01 .360-01 •467-01 .396-01 .373-01 .223-01 •284-01
_ . .
AV. .292 .255 .250 .223 .217 .205 .190 .162 .151 .154 .151 .14-"' .137 .127 .11 o .100 .120 .116 .942-01 .74h-01 .517-01 .533-01 •685-01 .633-01 .453-01 .383-01 .438-01 .456-01 .422-01 .374-01 .330-01 .329-01 .205-01 .230-01 .232-01
_
TRON RPHRPRf DIA 20CM .500 .552 .609 .501 .363 .274 .290 .288 .204 .174 .211 .266 .309 .295 .243 .22^ .193 .204 .174 .132 .101 •923-01 .129 .130 • 134 .770-01 .524-01 .800-01 • 106 .117 .843-01 .563-01 .540-01 .393-01 .331-01 .327-01 .379-01 .554-01 .555-01 .573-01 .592-01 .502-01 •400-01 .289-01 .304-01
DIA 30CM .521 .637 .722 .666 .481 .297 .300 .308 .243 • 194 .248 • 359 .420 .397 .358 .356 .289 .252 .211 .172 .149 .127 .155 .193 .179 .130 .126 .146 .180 .161 • 122 •981-01 .654-01 .567-01 .548-01 .704-01 o833-01 .809-01 .779-01 .677-01 .634-01 .640-01 .647-01 .583-01 .295-01
DIA 50CM .575 .715 .896 .804 .525 .327 .314 .335 .255 .214 .328 .472 .560 .558 .557 .555 .471 .366 .281 .225 .170 .176 .223 .270 .257 .174 .173 .231 .285 .259 .181 .127 .901-01 .594-01 .618-01 .787-01 .111 .116 • 102 .898-01 .804-01 .947-01 .878-01 •799-01 .585-01
C$£" */•?<?£"
ZJE - 262 1982
M. Holman
MEASURED SPECTRA OF NEUTRONS ESCAPING
FROM IRON SPHERES
Ф ŠKODA WORKS
Nuclear Power Construction Division, Information Centre PLZEŇ, CZECHOSLOVAKIA
AB3TBÁ0T
lb* report deaoribea aeaeurlng the apeotra of neutrone eaoaplng froa tht aurfaee of iron apherea in energy iaterral from 10 ко? up to 10 MeV. tht aeaaureaent haa Ъоож perforata uaiag a aelntlllation epeetroaeter having a atllbeaa oryatal, and a proportional counter SF-2 filled with hydrogen under 392*4 kPa of proaaure. Uaed apherea had dlaaetera of 20, 30, and 50 ca, Jf 252 being used an a eouree of neutrone.
- 3 -2. PB3CHIPTI0N OP THE EXPERIMENT
Tas arrangement of the experiment is shown in fig* 1. The Iron spheres have been suspended some 1.7 m аЪоте the floor of the laboratory, and the source inserted into the sphere through a cylindrical channel dia 20 on. The channel has been then closed by am iron plug. The effective thickness of the Iron for the penetration of neutrons has been therefore less than the actual radii of the spheres by half the size of the central hollow cavity dia 20 z 20 mm. Shielding cone filled with water containing 40 g/1 of boric acid has served for the measurement and elimination of neutrons scattered from the construction and walls* The distance of 1 m between the source and the detectors gua-ranted practically point geometry of both the source and detector. Angular orientation of the detectors in relation to the source has been chosen in such a way as to place both the stil-bene crystal axis and SP-2 hydrogen chamber anode on the line connecting the source with the detector* In order to suppress the soft gamma radiation, both types of used detectors have been provided with a 4 mm thick envelope of lead* This wrapping of detectors into lead we commonly use in fields with a high predominance of photons, and it is the reason why we have used it also here, even if it has not been absolutely necessary*
The spectrum of the Cf 252 neutron source has been measured twice, i.e. prior to and after the measurement with the iron spheres. The measurement has been repeated in order to verify the long-term stability of the measuring set. The measurement of one arrangement took approximately 10 hours so that the overall time of the experiment amounted to some 250 hours*
The background of the scattered neutrons measured with the shielding cone has been read off directly in the pulse height spectra* All results have been normalized to one neutron emitted by the source, the normalizing constant being determined from the preset neutron emission of 2.35 x 10°s from Ingram of Cf 252 /3/. The density of the neutron flux (the normalizing constant) corresponding to 420/<g of Cf 252 in 1 m from the source will be then 7.8 x lO3*"1©*"2.
5 -
Energy resolution of the hydrogen chamber SP-2 is 5*1 % (I - 770 k«V) while that of the stilbene crystal scintillation •peotrometer amounts to some 10 % (Б « 1 Me?). Tne energy scale of the scintillation spectrometer has been carried out by measuring the Compton edges (Ra 226). The energy calibration of the hydrogen chamber has been performed directly with respect to striking resonances in the spectrum of neutrons behind iron*
The neutron spectra as obtained from pulse height spectra hays been evaluated by means of programs "EIKA" and "SPB" or "SPEC", language FORTRAN ADT. The program "BHKA" eerree for evaluating the energy calibration of detectors while the other two programs are used to the evaluation of neutron spectra* As distinct from "SFE", the program "SPEC" takes into ac-oount corrections of proton spectra as obtained by scintillation speotrometer for the escape of protons and for doubled scattering of neutrons in the crystal of etilbene /5/* Concerning crystal dia 10 x 10 mm, the influence of the above-mentioned corrections is negligible* Proton spectra as measured by the hydrogen chamber are in both programs corrected for proton escape from the detector* In doing it. an analytical technique mentioned in /5/ and /6/ is used* According to /7/. correctionsobtained calcula»ionally differ significantly from those obtained by experimental means* This is attributable mainly to differences in the amount of gas amplification of the spherical detector along its anode because this results in the creatien of practically unknown spaces of limited gas multiplication* Assuming the effective radius of the detector less by 10 % in comparison with actual value, the comparison of neutron spectra performed with due account to both experimental /7/ sad calculated corrections gave a good agreement in the shape of the spectrum* In addition* if the comparison is based on using the effective radius* the absolute values of neutron spectra approach much closer the actual ones* Because the spherical hydrogen chambers cannot be regarded as detectors of absolute values of neutron flux densities* the spectra obtained by their means are normalised to values measured by the scintillation spectrometer in the region of their overlapping* After corrections of measured proton
- 7 -
An Insignificant softening of the measured spectrum between
1 and 3 MeY may be attributable to neutron interactions in
the suspension, source casing and mainly in the lead envelo
pe of the detectors. In energy region below 1 MeV, the softe
ning of the spectrum is more striking and it exhibits even a
resonance nature. This fact has been found practically analogi
cal in both measurements of the spectrum. It is assumed that
also this effect is caused by parasitic scattering of the
neutrons*
One of our goals consisted in comparing the results
with those presented in /1/ and /2/. In /1/» the authors hare
measured iron spheres up to a diameter of 45 cm, while in /2/
no results of measuring Cf 252 souxce have been available. In
/1/, the neutron spectra have been measured by means of cylin
drical chambers filled with pressurized hydrogen (293*4 kPa and
147 kPa), orypton (147 kPa), and methane (293.4 kPa). In /2/,
a combination method has been adopted, i.e. a stilbene crystal
scintillation spectrometer and a cylindrical chamber. The
chamber, denoted SHK 38, has been filled with 294*3 kfa of
hydrogen* The lower limit of measured neutron spectra has been
60 kef in case /1/ and 50 keV in the latter*
Comparison of Cf 252 measured neutron spectra suggests
(fig. 4) that spectrum according to /1/ deviates more from the
theoretioal one /8/ below 800 keV. On the other hand, our results
performed on iron spheres dia 20, 30 em (fig. 5 and 6} are in
good concordance with /1/ both from the viewpoint of shape, and
absolute values in the region between 100 and 650 keV. For the
energy of some 650 keV the spectra exhibit a stepwise increase
of deviation. For energies exceeding 650 keV the spectra
have a similar shape, but their values are shifted by some
30 %, It is probable that the difference in the results occurred during "putting together" of individual components of
the spectrum as obtained by various detectors.
Our results are in much better concordance with /2/ if
considered from the viewpoint of absolute values of neutron
spectrum (fig. 5» 6, and 7)* For energies exceeding 800 keV
- 9 -
LIST Oř REFERENCES
1. H. Werle et el.» KFK 2219, 1975 2. E.A. Тгукот et al.: FBI 943, 1979 3» B. J, Hall, H.H. Rossis Californium-252 in Teaching and Rese
arch, IAEA - Technical Report Series Ho. 159, 1974. 4. M. Holaan et al.: ZJE - 236, 1979 5« N. L* Snldor, H.D. Warren: Nuclear Instrumenta and Methods
51(1967), p. 109-116 6. M. Holaam ZJE - 220, 1979 7. С 0. Kefflshallt AWRE 031/73 8» J. Grundl, 0. Eisenhauer: Report EUR - 5667 e/f, part I, 1977*
voltage eouree t l p l i e r f i e r
CM, - rapid amplifier
uo -MOL -
1
1 1 1 1 1 ,1 s 1 1 1 1 1 L_
LA
ORTíC J7/
BA
ORTEC hHt
TFA
ORTEC V5V
CFD
CANBERRA Ш
CFD CANBERRA Ю8
sUrt
Stop
!
ADC <KÍ«
MCA
NT A S12Ď EMG
TAC CANBERRA /ИЗ
.
9±f. f. Ivjastioaal arrangement of the aeeeuring eetup (broken Mwmw denote different connection of the a e i n t i l l a t i o n apeetroaeter)
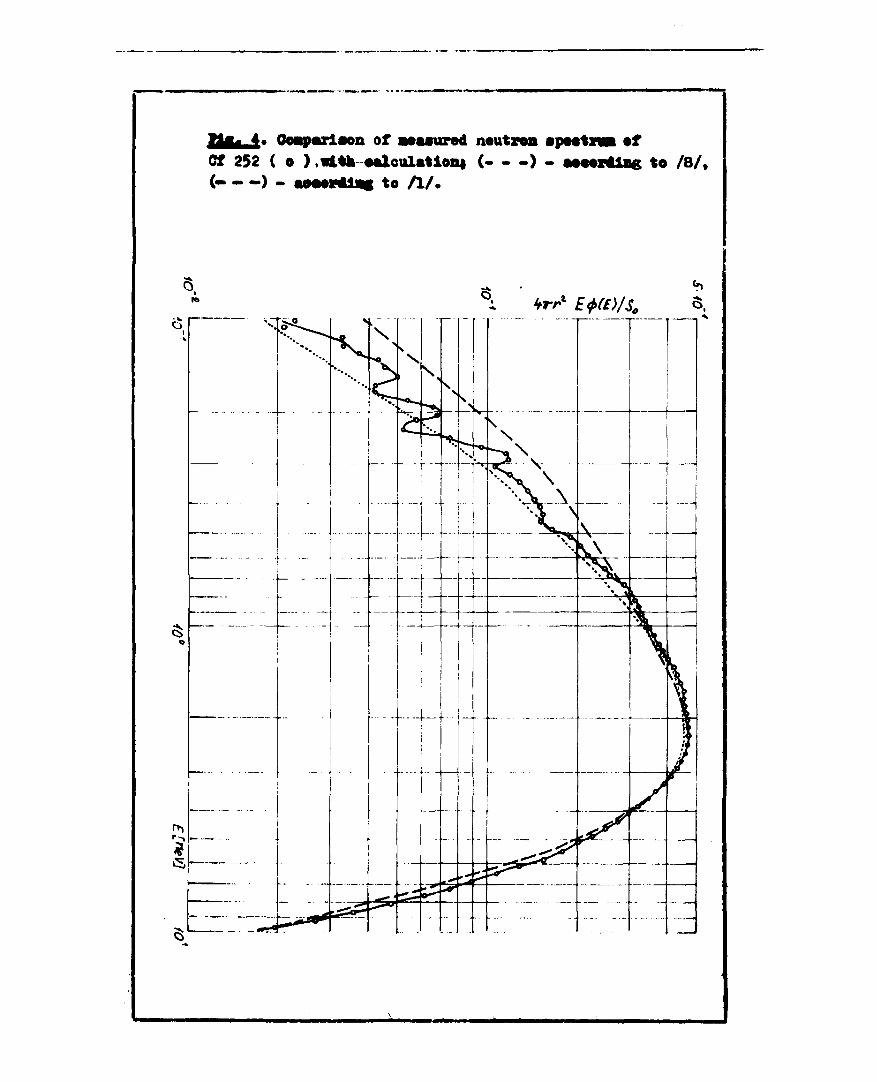
2tfcul* Comparison of noMurod neutron opootmm •* Cf 252 ( о ) ,il*k Mloulatloni ( - - - ) - Moortlng to / 8 / , ( - - - ) - «MOVd!*** to Л / .
6 *r/>* £ ^ Д ,
<5 1
l>1
<5
>.
— . .
* ' •
—
- — -
4
*_
_ .
-
4
"^
4 >
• • . 4
-
* ̂
ъ • 4
4 >
i -
^ ^
- - - •
v\~ ^
<
p^lL....
1*1
"4»
--
.
л íó
—
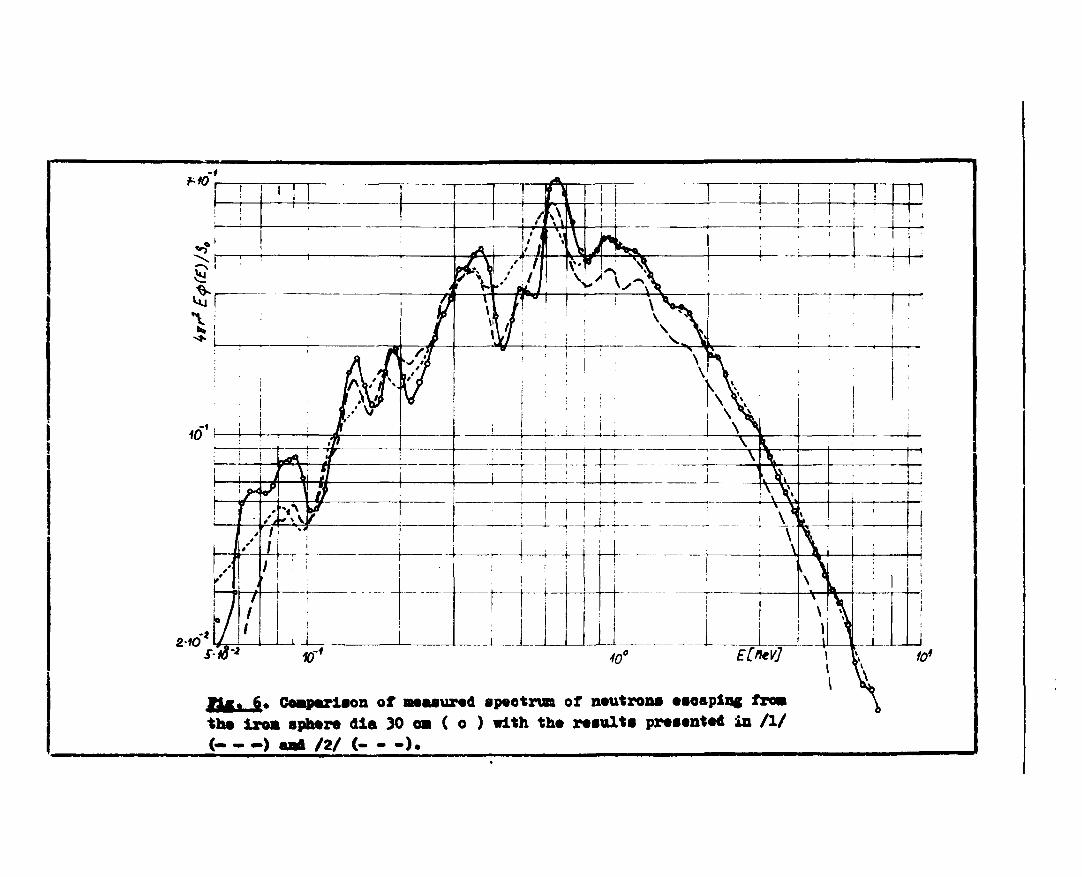
lig. 6. Coepexiaon of measured spectrum of neutrone eeoaping froa the iro» sphere die 30 о» ( о ) with the reeulte presented in /1/ ( ) aad /2/ ( ).
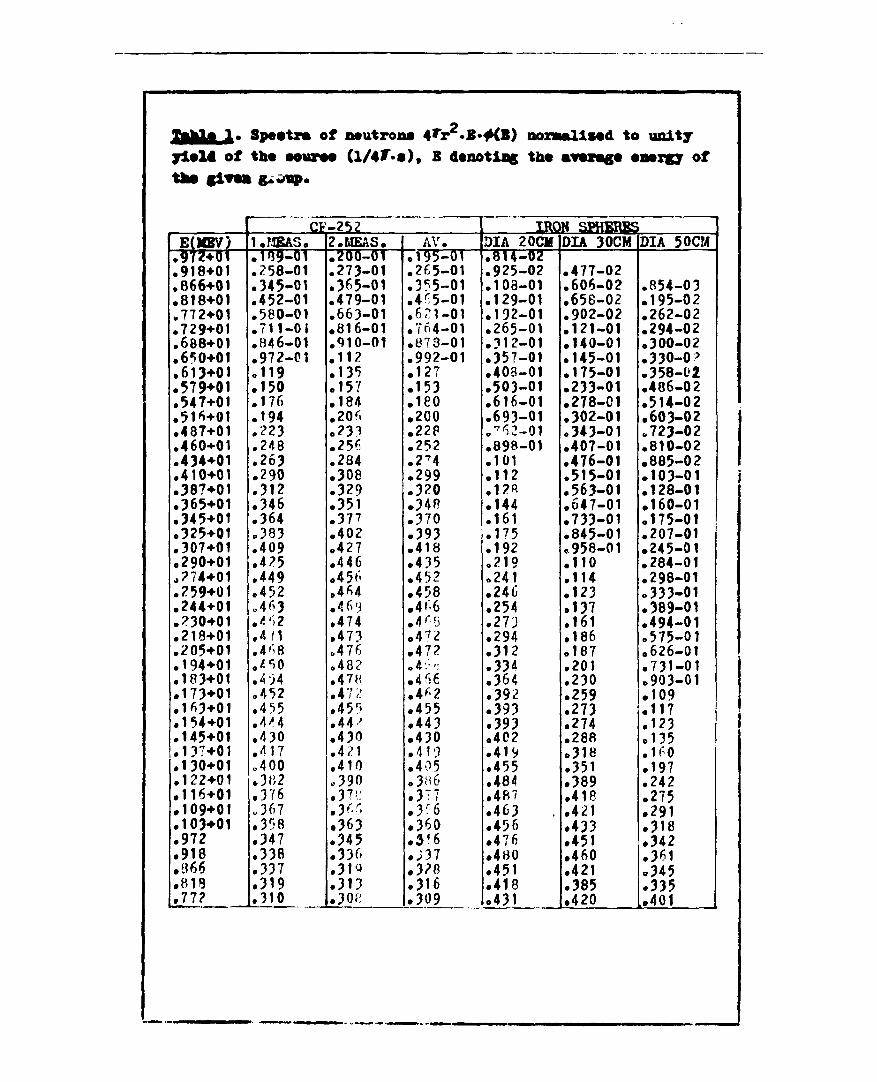
2ttti_A* Spootr» of neutrone 4*г »В»^(В) normalised to unity 7lol4 of tho souroo (l/4f.a), В denoting the avenge energy of the give» g*dup.
E(MEV) .9724-01 .918+01 .866+01 .818+01 .772+01 .729+01 .688+01 .650+01 .613+01 .579*01 .547+01 .515+01 .487+01 .460+01 .434+01 .410+01 .387+01 .365+01 .345+01 .325+01 .307+01 .290+01 .274+01 .259+01 .244+01 .230+01 .218+01 .205+01 .194+01 .183+01 .173+01 .1*3+01 .154+01 .145+01 .137+01 .130+01 .122+01 .116+01 .109+01 .103+01 .972 .918 .366 .818 .77?
CF 1.MEAS. .149-01 .258-01 .345-01 .452-01 .580-01 .711-01 .846-01 .972-01 .119 .150 .176 .194 .223 .248 .263 .290 .312 .346 .364 .383 .409 .425 .449 .452 .463 .4 62 .4/1 .4*8 .450 .4^4 .452 .455 .4-4 .430 .417 „400 .382 .376 .367 .358 .347 .338 .337 .319 .310
-252 2.MEAS. .200-01 .273-01 .365-01 .479-01 .663-01 .816-01 .410-01 .112 .135 .157 .184 .206 .233 .256 .284 .308 .329 .351 .377 .402 .427 .446 .45»' .464 .4 6-j .474 .473 .476 .48? .478 .47,' .45r» .44' .430 .421 .410 .390 .37'..: .36Г, .363 .345 .336 .310 .313 .308
AV. .195-01 .265-01 .355-01 .465-01 .621-01 •764-01 .873-01 .992-01 .127 .153 .180 .200 .22P .252 .274 .299 .320 .348 .370 .393 .418 .435 .452 .458 •4»'-6 .4<"5 .472 .472 .4;''i .466 .462 .455 .443 .430 .419 .405 • 3«6 .377 .3r6 .360 .3^6 .J37 .328 .316 .309
IRO DIA 20CM •814-02 .925-02 .103-01 .129-01 .192-01 .265-01 .312-01 .357-01 .403-01 .503-01 .616-01 .693-01 •?52-01 .898-01 .101 .112 .128 .144 .161 .175 .192 .219 .241 .246 .254 • 273 .294 .312 .33* .364 .392 .393 .393 .402 .419 .455 .484 • 487 .463 .456 .476 .480 .451 • 418 .431
N SPHERES DIA 30CM
.477-02
.606-02
.658-02
.902-02
.121-01
.140-01
.145-01
.175-01
.233-01
.278-01
.302-01
.343-01
.407-01
.476-01
.515-01
.563-01
.647-01
.733-01
.845-01 *958-01 .110 .114 .123 .137 .161 • 186 .187 .201 • 230 .259 .273 .274 .288 .318 .351 .389 .418 .421 .433 .451 .460 .421 .385 .420
DIA 50CM
.854-03
.195-02
.262-02
.294-02
.300-02
.330-0'
.358-02
.486-02
.514-02
.603-02
.723-02
.810-02
.885-02
.103-01
.128-01 •160-01 .175-01 .207-01 .245-01 .284-01 .298-01 .333-01 .389-01 .494-01 .575-01 .626-01 .731-01 .903-01 .109 .117 .123 .135 .160 .197 .242 .275 .291 .318 .342 .361 .345 .335 ,.401
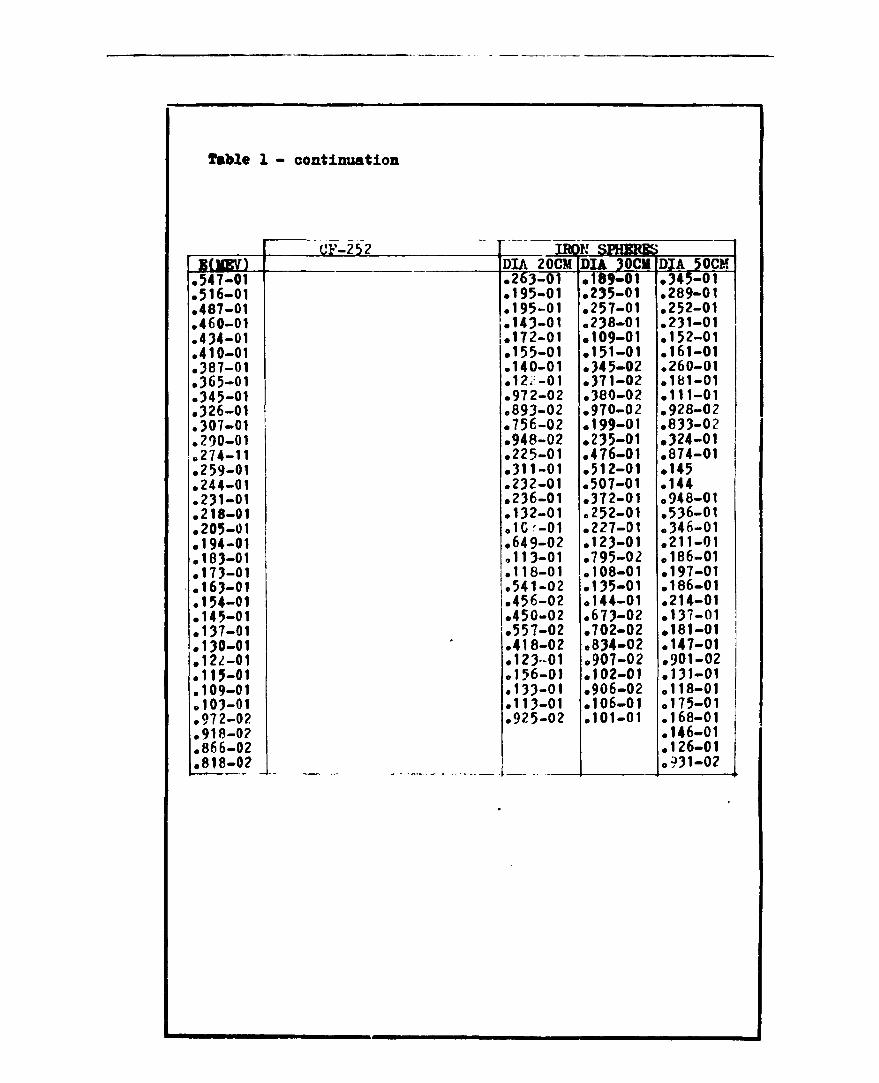
Table 1 - continuation
E(lfBV) .547-01 .516-01 .487-01 .460-01 .434-01 .410-01 .387-01 .365-01 .345-01 .326-01 .307-01 .290-01 .274-11 .259-01 .244-01 .231-01 .218-01 .205-01 .194-01 .183-01 .173-01 .163-01 .154-01 .145-01 .137-01 •130-01 .12,2-01 .115-01 .109-01 .103-01 .972-02 .918-0? .866-02 .818-0?
CF-252
•
IRON SPHERES DIA 20CM .263-01 .195-01 .195-01 .143-01 .172-01 .155-01 .140-01 .12/-01 .972-02 .893-02 .756-02 .948-02 .225-01 .311-01 .232-01 .236-01 .132-01 .1С'-01 .649-02 ,113-01 .118-01 .541-02 .456-02 .450-02 .557-02 .418-02 .12301 .156-01 .133-01 .113-01 .925-02
DIA 30CH •189-01 .235-01 .257-01 .238-01 .109-01 .151-01 .345-02 .371-02 .380-02 .970-02 .199-01 .235-01 •476-01 .512-01 .507-01 .372-01 ,252-01 .227-01 .123-01 .795-02 .108-01 .135-01 .144-01 .673-02 .702-02 .834-02 .907-02 •102-01 .906-02 .106-01 .101-01
DIA 50CM .345-01 .289-01 .252-01 .231-01 .152-01 .161-01 .260-01 .1Ы-01 .111-01 .928-02 .833-0? •324-01 •874-01 .145 .144 .948-01 .536-01 .346-01 .211-01 .186-01 .197-01 .186-01 .214-01 .137-01 •181-01 •147-01 •901-02 .131-01 .118-01 .175-01 .168-01 .146-01 .126-01 .931-02