Embed Size (px)
Citation preview

Measurement and modelling of quality changes in stored untreatedgrey water
A. Dixon a, D. Butler a,*, A. Fewkes b, M. Robinson a
a Department of Civil and Environmental Engineering, Imperial College of Science, Technology and Medicine, London SW7 2BU, UKb Department of Building and Environmental Health, Nottingham Trent University, Nottingham, UK
Received 24 November 1999; received in revised form and accepted 2 August 2000
Abstract
This paper describes an investigation into stored untreated grey water quality processes and the development of a computer
simulation for those processes. A laboratory study was carried out to investigate the changes in water quality with increasing
residence time, and the results were used to calibrate and verify the model. Model results gave a good ®t for dissolved oxygen (DO)
concentrations, but only a reasonable ®t for chemical oxygen demand (COD). Still, the main trends of model and laboratory COD
data were broadly represented. Measurement and model results tend to con®rm the initial hypothesis of four major processes in
operation: settlement of suspended solids, aerobic microbial growth, anaerobic release of soluble COD from settled organic matter
and atmospheric reaeration. Storing grey water for 24 h may signi®cantly improve water quality through rapid settlement of organic
particles, however, storage beyond 48 h leads to depleted DO levels and potential aesthetic problems. A more detailed model of
COD fractions within grey water (with the relevant measured data) in conjunction with a characterisation of particulate settling
velocities should lead to improvements in model predictions. Ó 2000 Elsevier Science Ltd. All rights reserved.
Keywords: Grey water; Residence time; Simulation; Storage; Water quality
1. Introduction
Storage is an important element in all grey water re-cycling systems. Clearly, water needs to be stored at somepoint, whether before treatment or after treatment. Ifstored before treatment, there is the advantage that someprimary settling will go on before it reaches the treatmentstage, thereby reducing the burden on the secondarytreatment stage. However this runs the risk of odour andpossible health considerations, due to the growth of mi-cro-organisms. Storage after treatment may seem like abetter alternative, but this may not be the case. Withrelatively simple treatment systems likely to be used indomestic water recycling, organic content, though re-duced, is unlikely to be eliminated entirely. This will meanthat the treated grey water may need to be frequentlyrecycled through the disinfection stage to maintain ap-propriate bacterial levels. Also the ®lter or membraneused for treating the water is likely to become fouled morequickly and need cleaning or replacing more frequently,
again adding to the running costs. Even if most of thewater is stored after treatment, there must be some stor-age before to act as a bu�er and prevent the treatmentsystem being overloaded by an in¯ux of grey water.
Whilst there has been considerable research into thequality of fresh grey water (Butler, Friedler, & Gatt,1995; Hrudey & Raniga, 1980; Rose, Gwo-shing Sun,Gerba, & Sinclair, 1991; Siegrist, Witt, & Boyle, 1976;Surendran & Wheatley, 1998) the water quality pro-cesses that occur in grey water stored prior to treatmentare not yet fully described. This paper details the labo-ratory analysis of stored untreated grey water and thedevelopment of a computer model to simulate the mainwater quality processes. The model forms a componentof a fuller model for the entire domestic water recyclingsystem (Dixon, 2000).
2. Storage
In the domestic environment, interactions betweenresidents and their water using appliances give rise to apattern of discharges characterised by peaks in themorning and evening (Butler, 1991). The diurnal pattern
Urban Water 1 (1999) 293±306
www.elsevier.com/locate/urbwat
* Corresponding author. Tel.: +44-20-7594-6099; fax: +44-20-7594
6124.
E-mail address: [email protected] (D. Butler).
1462-0758/00/$ - see front matter Ó 2000 Elsevier Science Ltd. All rights reserved.
PII: S 1 4 6 2 - 0 7 5 8 ( 0 0 ) 0 0 0 3 1 - 5

is still apparent at the scale of multi-residential buildings(Webster, 1972) though transitions tend to be smoother.Balancing the supply and demands of service water is akey factor in re-use system success. The storage capacityhas a direct impact on water saving e�ciency and,generally, the higher the storage volume (and henceresidence time) the greater the e�ciency (Dixon, Butler,& Fewkes, 1999). Thus storage forms a vital componentin the hydraulic design of the system.
On the other hand, it has been reported that extendedretention of grey water before use (or treatment) cancompromise overall system performance. For example,the cause of treatment failure at one grey water re-usetest site was cited as the solubilisation of chemical ox-ygen demand (COD) due to anaerobic processes in thepre-treatment collection system (Ward, 1996). Water re-use practitioners report that grey water should not bestored for more than 24 h (Kourik, 1991; van der Ryn,1995), and proposed UK guidelines, resulting from acomprehensive review of grey water use, recommendthat grey water should not be stored beyond 48 h beforere-use (Mustow, Grey, Smerdon, Pinney, & Wagget,1997). However de®nitive evidence is rarely given tosupport such assertions. Even if correct, what happensto water quality beyond this ÔsafeÕ period? Is any resi-dence time at all bene®cial? If so, when do the by-products of biodegradation outweigh the bene®ts ofsettlement (for example)?
3. Laboratory experiments
3.1. Materials and equipment
A grey water tank in operation would probablycontain a mixture of grey water types, including the
normal chemicals used in every household. In these ex-periments, however, types were kept separate to estab-lish baseline data and reduce variability as far aspossible. Laboratory tests were thus performed onsamples from the bath, and washing machine (WM).The bath samples represent water derived from personalwashing, and the WM samples represent laundry-washing discharges. The WM programme used had awash cycle followed by an initial discharge ¯ush [1] anda rinse cycle with three separate ¯ushes [2±4]. Initial testsshowed a distinct step in total coliform (TC) count andturbidity between ¯ushes 2 and 3. Hence the WM outputwas divided into two samples composed of ¯ushes 1 and2, and another containing ¯ushes 3 and 4. The donors ofclothes and bath water samples were all adults. All WMsamples were obtained from a Hoover 1200 WM on a40°C wash programme using Persil Automatic washingpowder. Weights of clothes and powder used were re-corded, together with ¯ush volumes and temperatures(see Table 1).
The samples were stored under quiescent conditionsin 10 l bottles in 2 batches of 8 samples. Each samplecontainer was wrapped in black plastic and stored atroom temperature. These were covered, but not airtight.In between batches, the vessels were washed with de-tergent and rinsed with nitric acid. The sample types aregiven in Table 1 and consist of two bath, two WM¯ushes 1 and 2 and two WM ¯ushes 3 and 4 in eachbatch. In the ®rst batch, control samples of both tapwater and reagent grade distilled water were also pre-pared and stored alongside the other samples. In thesecond batch, a tap water control was again used. Inaddition, the second WM sample (¯ushes 3 and 4) wasaerated using a 3 W aerator giving 40 l/h air ¯ow under1 m head of water.
Nomenclature
/1 process rate for aerobic growth of heterotrophs
/2 process rate for decay of heterotrophs
/3 process rate for settlement of suspended solids
/4 process rate for hydrolysis of particulate matter
by aerobic micro-organisms
/5 process rate for anaerobic chemical oxygen
demand (COD) from release
/6 process rate for reaeration at the water surface
lH heterotrophic growth rate coe�cient
bh heterotrophic decay rate coe�cient
Cn temperature coe�cient
fp coe�cient for particulate products of biomass
decay
kACR rate of anaerobic COD release
kH rate of hydrolysis in liquor
kL rate of reaeration
KOH half saturation coe�cient for DO utilisation
KS half saturation coe�cient for substrate utilisation
kSET coe�cient of settling
KX half saturation coe�cient for aerobic hydrolysis
XSLI inert sludge
Si inert soluble COD
SO dissolved oxygen (DO) concentration
SO SAT DO saturation level
SS readily degradable substrate (soluble)
T temperature
XBH heterotrophic biomass
XI inert particulate COD
XP particulate products of biomass decay
XS slowly degradable particulate substrate
XSL slowly degradable sludge
YH yield coe�cient for heterotrophic biomass
production
294 A. Dixon et al. / Urban Water 1 (1999) 293±306

The storage period chosen was 20±25 days, withsamples taken daily. The analysis period was chosen toestablish:· when or if equilibrium conditions occurred;· whether long-term storage could be used for treat-
ment purposes;· details of water quality status in failed grey water
systems.
3.2. Chemical analysis
Measurements were made in all samples of key waterquality parameters including COD, dissolved oxygen(DO), temperature, pH, turbidity, total suspended solids(TSS), and TC and faecal coliforms (FC). Measure-ments were taken daily for the ®rst 4 days of testing andthen less frequently as they approached equilibrium (seeTable 2). Single sub-samples of 100 ml volume weretaken from the top 50 mm of the water column fortesting.
Tests were carried out in accordance with StandardMethods wherever appropriate (APHA/AWWA, 1989).COD was measured using the closed re¯ux titrimetricmethod. Samples were collected, diluted 1:10 (except fortap water and distilled water which were undiluted) andacidi®ed with concentrated H2SO4 to preserve themuntil the tests could be performed. Stronger sampleswere further diluted. DO was measured using a cali-brated, and temperature compensated, digital meterconnected to a membrane covered polyphosphate elec-trode. The pH was read using an electrometric method.This determines the H� ions by measuring the potentialdi�erence between a standard hydrogen electrode and a
reference electrode. The temperature was measured us-ing a digital thermometer.
The turbidity of the samples was measured by thenephelometric method, with results expressed in nephe-lometric turbidity units (NTUs). To maintain sampleswithin the range of the turbidimeter used, 1:10 dilutionswere necessary. The full solids suite was determined,following Standard Methods, though only TSS ®guresare reported here. The TC and FC were determinedusing the IVEXX Coliert system. This was used in con-junction with special trays known as Qunatitrays to fa-cilitate using the multiple test tube method de®ned in theStandard Methods. A range of dilutions up to 1:500 wasfound to be necessary. Results are expressed statisticallyas most probable numbers of organisms per 100 ml(MPN/100ml). Fuller details of the test methods usedare given in Robinson (1996).
4. Results
The results of the grey water storage experiments aredescribed in the following and the behaviour of eachwater quality determinant is reported in turn. Data fromall batch 1 experiments plus the FB4+ test in batch 2 aregiven in detail in Table 2(a)±(i). Figs. 2±7 show a se-lection of batches 1 and 2 COD and DO data from theseexperiments in conjunction with output from the com-puter model (described later in this paper).
4.1. COD
COD values varied signi®cantly and did not appearto correlate with any other single factor. This may be
Table 1
Sample run identi®cation
Sample
code
Calibration/
veri®cation runs
Type Mass of clothes
(g)
Mass of detergent
(g)
Volume of ¯ushes
(l)
Temperature
(°C)
(a) First batch
DB1 4 (verif) Bath ± ± ± ±
DB2 1 (calibration) Bath ± ± ± ±
FA1 WM ¯ushes 1 and 2 4002 150.1 30 32
FB1 3 (calibration) WM ¯ushes 3 and 4 4002 ± 45 23
FA2 WM ¯ushes 1 and 2 4067 143.5 30 32
FB2 6 (veri®cation) WM ¯ushes 3 and 4 4067 ± 42.5 24
T1 Tap water ± ± ± ±
RO Distilled water ± ± ± ±
(b) Second batch
DB3 2 (calibration) Bath ± ± ± ±
DB4 5 (veri®cation) Bath ± ± ± ±
FA3 WM ¯ushes 1 and 2 4199 155.7 30 32
FB3 WM ¯ushes 3 and 4 4199 ± 42 24
FA4 WM ¯ushes 1 and 2 3964 158.3 30 31
FB4 WM ¯ushes 3 and 4 3964 ± 40 24
FB4+ FB4+ aeration 3964 ± 40 24
T3 Tap water ± ± ± ±
A. Dixon et al. / Urban Water 1 (1999) 293±306 295

Table 2
Water quality data
Determinand 3/6/1996 4/6/1996 5/6/1996 6/6/1996 10/6/1996 13/6/1996 17/6/1996 20/6/1996 24/6/1996 27/6/1996
(a) DB1
COD (mg/l) 770 320 260 374 270 360 530 410 320 580
pH 7.6 7.2 7.0 7.4 7.2 7.1 7.1 7.0 6.7 6.7
DO (mg/l) 7.4 0.8 0.3 2.6 1.2 1.8 1.4 1.8 1.3 1.1
Temperature (°C) 22.4 21.9 23.5 26.1 25.0 22.3 25.9 20.3 21.2 23.1
Turbidity (NTU) 51.3 49.1 54.3 55.0 54.8 55.6 51.9 51.3 47.4 46.2
TC (MPN/100 ml) 50 >104 >105 >2� 105 >105 >105 >105 >105 >105 >2� 105
FC (MPN/100 ml) 0 0 0 0 0 0 0 0 0 ±
TSS (mg/l) 34 35 37 34 58 53 56 ± 36 43
(b) DB2
COD (mg/l) 600 320 580 370 300 160 400 400 130
pH 7.4 7.1 6.9 7.1 7.1 7.1 7.1 7.0 6.7 6.6
DO (mg/l) 7.9 4.0 1.5 3.0 1.5 1.9 1.0 2.2 1.4 1.1
Temperature (°C) 20.9 21.6 23.4 26.2 25.0 21.9 25.7 19.9 21.0 23.1
Turbidity (NTU) 40.9 35.7 35.3 34.7 35.7 35.7 35.3 33.1 34.4 34.4
TC (MPN/100 ml) 690 >104 >105 >2� 105 >105 >105 >105 >105 >105 >105
FC (MPN/100 ml) 0 0 1600 3100 >105 105 >6� 104 >6� 104 >6� 104 ±
TSS (mg/l) 60 54 52 41 47 35 51 39 57 50
Determinand 10/6/1996 11/6/1996 12/6/1996 13/6/1996 17/6/1996 20/6/1996 24/6/1996 27/6/1996 3/7/1996
(c) FA1
COD (mg/l) 3700 3200 2900 2900 3800 3700 2100 2400 ±
pH 9.5 9.4 9.4 9.2 9.1 9.0 8.8 8.6 8.5
DO (mg/l) 9.5 0.4 0.4 0.4 1.1 0.7 0.3 0.2 1.8
Temperature (°C) 26.1 24.1 23.0 22.3 26.0 19.8 21.1 23.1 18.7
Turbidity (NTU) 270 250 240 230 140 120 110 100 96
TC (MPN/100 ml) >104 105 105 >105 >105 >105 >105 >105 >105
FC (MPN/100 ml) 0 0 0 0 0 0 0 ± 0
TSS (mg/l) 550 530 580 610 220 180 280 140 140
(d) FB1
COD (mg/l) 750 300 690 ± 470 660 65 0 ±
pH 8.7 8.5 8.5 8.2 7.8 7.5 7.2 7.1 7.0
DO (mg/l) 8.1 0.7 0.6 0.5 1.0 0.6 0.3 0.3 1.9
Temperature (°C) 24.4 23.9 22.9 22.3 26.5 19.8 21.1 23.1 18.7
Turbidity (NTU) 67.5 25.0 23.1 23.4 22.3 20.8 20.6 18.3 17.2
TC (MPN/100 ml) 8300 >4� 104 105 >8� 104 >105 >105 >105 >105 >105
FC (MPN/100 ml) 0 2100 0 500 0 0 0 ± 0
TSS (mg/l) 120 43 43 33 53 38 27 24 18
Determinand 11/6/1996 12/6/1996 13/6/1996 17/6/1996 20/6/1996 24/6/1996 27/6/1996 3/7/1996
(e) FA2
COD (mg/l) 2200 2700 3400 2400 6800 2600 5800 ±
pH 9.4 9.3 9.1 9.0 9.0 8.8 8.7 8.5
DO (mg/l) 6.3 0.3 0.3 0.6 0.9 0.5 0.3 1.6
Temperature (°C) 24.7 23.1 22.2 26.3 19.9 21.2 23.0 18.8
Turbidity (NTU) 240 250 210 130 97 97 89 91
TC (MPN/100 ml) 104 >105 >105 >105 >105 >105 >105 >105
FC (MPN/100 ml) 100 0 1000 0 0 0 ± 0
TSS (mg/l) 380 520 7 5 4 6 6 6
(f) FB2
COD (mg/l) 490 99 33 530 590 0 1100 ±
pH 8.6 8.3 8.2 7.7 7.5 7.2 7.1 7.0
DO (mg/l) 6.5 0.6 0.6 0.4 0.6 0.4 0.5 2.3
Temperature (°C) 24.5 22.7 22.2 26.2 19.8 21.2 23.1 18.8
Turbidity (NTU) 46 23 23 20 21 19 17 16
TC (MPN/100 ml) >104 >105 105 >105 >105 >105 >105 >105
296 A. Dixon et al. / Urban Water 1 (1999) 293±306

due to actual variation, but will certainly include ex-perimental error associated with trying to capture totalCOD values of a liquid containing substantial solidscontent. Bath samples exhibited a slight downwardtrend in COD with varying degree of ¯uctuation fromsample to sample. WM samples typically exhibited asharp decrease in COD values in the ®rst day of storagefollowed by an increase in values after 8±10 days in mostsamples. The initial COD values were in the range 290±1200 mg/l for bath samples, 2200±4100 mg/l for WM¯ushes 1 and 2 samples and 170±750 mg/l for WM and 3and 4 samples.
4.2. DO
In all except the aerated sample (FB4+), DO con-centrations fell to between a quarter and a third of theirinitial values during the ®rst 3 days of the storage ex-
periments. After the initial drop, DO values ¯uctuatedin the range 0.2±3.0 mg/l. These ¯uctuations tended torespond to variation in ambient temperature. The aer-ated sample exhibited an initial drop in DO from 8.2 to4.8 mg/l followed by a rise to between 6.3 and 7.6 mg/lfor the remainder of the experiment.
4.3. pH
The WM samples demonstrated the most alkalineconditions in the region of pH 9.3±9.5, gradually fallinginto a lower range of pH 8.3±8.8 over the test duration.The bath samples were less alkaline and showed less¯uctuation, starting in the range of pH 7.4±7.6 andfalling to a range of pH 6.6±6.8. The initial pH value ofthe aerated sample was comparable to the other WM¯ushes 3 and 4 samples, yet its ®nal value was approx-imately 1 pH point higher than the rest.
Table 2 (Continued)
Determinand 11/6/1996 12/6/1996 13/6/1996 17/6/1996 20/6/1996 24/6/1996 27/6/1996 3/7/1996
FC (MPN/100 ml) 0 0 500 0 0 0 ± 0
TSS (mg/l) 67 43 35 48 37 31 26 18
Determinand 3/6/1996 4/6/1996 5/6/1996 6/6/1996 10/6/1996 13/6/1996 17/6/1996 20/6/1996 24/6/1996 27/61996
(g) T1
COD (mg/l) 6 ± 0 ± 0 3 41 28 0 0
pH 7.5 7.5 7.5 7.6 7.7 7.8 7.9 7.8 7.5 7.5
DO (mg/l) 8.1 8.1 7.3 7.2 6.8 6.4 7.8 7.0 7.6 7.6
Temperature (°C) 19.6 20.9 23.5 25.8 25.4 21.2 25.6 19.9 21.1 23.1
Turbidity (NTU) 0.3 0.4 0.1 0.3 0.2 0.1 0 0.3 0.1 0.2
TC (MPN/100 ml) 150 0 50 >104 0 0 20 0 30 ±
FC (MPN/100 ml) 0 0 0 0 0 0 0 0 0 ±
TSS (mg/l) 150 0 11 1 0 0 6 0 4 0
(h) RO
COD (mg/l) 6 ± 6 ± 20 10 22 28 0 0
pH 6.0 6.0 6.0 6.1 6.4 6.7 6.8 6.5 6.4 7.0
DO (mg/l) 7.6 7.9 7.9 7.3 7.3 6.1 8.0 6.8 6.9 6.7
Temperature (°C) 21.9 213 23.4 25.6 25.1 22.4 25.8 19.8 21.2 23.2
Turbidity (NTU) 0 0.2 0.1 0 0.2 0 0 0.2 0.2 0.1
TC (MPN/100 ml) >200 50 >104 >105 0 0 0 10 0 ±
FC (MPN/100 ml) 0 0 0 0 0 0 0 0 0 ±
TSS (mg/l) 0 2 6 0 0 0 4 0 4 0
Determinand 16/7/1996 17/7/1996 18/7/1996 22/7/1996 25/7/1996 31/7/1996 7/8/1996
(i) FB4+
COD (mg/l) 410 ± 210 380 42 62 62
pH 8.7 8.5 8.0 7.9 8.3 8.4 8.3
DO (mg/l) 8.2 8.9 5.5 4.8 7.6 7.2 6.3
Temperature (°C) 22.0 20.7 22.8 27.2 22.1 23.1 22.4
Turbidity (NTU) 52 52 44 5.0 1.0 2.1 2
TC (MPN/100 ml) >104 1:8� 104 105 >105 >105 >105 >105
FC (MPN/100 ml) 0 0 ± ± ± 0 0
TSS (mg/l) 110 87 ± 93 13 7 5
A. Dixon et al. / Urban Water 1 (1999) 293±306 297

4.4. Turbidity
Turbidity values declined in all samples over the du-ration of the test. This phenomenon was most pro-nounced in the samples with higher initial turbidityvalues. The ¯ushes 1 and 2 WM samples had the highestinitial values in the range 240±430 NTU, much greaterthan the 40±94 NTU in the bath samples. The sampleswith higher values showed the greatest decrease in tur-bidity over the tests. WM ¯ushes 3 and 4 samples de-creased to a range 74±190 NTU over the test duration.Bath samples typically exhibited only minor decreases inturbidity.
4.5. Suspended solids
A downward trend is observed in the suspended sol-ids concentrations for the WM samples. The TSS con-centration of all but one WM ¯ushes 1 and 2 samplestarted between 0.4 and 0.6 g/l, and fell to between 0.02and 0.1 g/l. Flushes 3 and 4 samples behaved in a similarfashion, starting between 0.07 and 0.19 g/l and ®nishingbetween 0.18 and 0.03 g/l. In contrast, the TSS values ofthe bath samples did not appear to follow any simpletrend, and all values are considerably lower than for theWM samples. The TSS concentration of all bath sam-ples fell from 0.04±0.06 to 0.02±0.05 g/l, though thetransition is not smooth. The TSS concentration of onebath sample closed on a value slightly higher than itsinitial concentration. Given the anaerobic conditionsdeveloped within the vessel, the resuspension of solidsby gas bubbles may explain this.
4.6. Total and faecal coliforms
If the initial values of the TC counts were within theanalytical range of the method (>105 MPN/100 ml) theytended to rise to exceed it within a few days of storageand then remain outside this range for the duration ofthe experiment. Just one of the bath samples (DB2) wascontaminated with FC, whereas several of the WMsamples showed evidence of some faecal contamination.
4.7. Subjective results
Particular note was made of visual and olfactoryaesthetic characteristics in the stored samples. After aperiod of 4 days, visible ¯ocs had formed in two of thebath samples though not in the others. Only one bathsample developed an odour, ®rst becoming apparentafter day 4 and then steadily getting stronger for theremainder of the experiment. The highly polluted WM¯ushes 1 and 2 samples gave o� an unpleasant odourafter two weeks of storage, whilst ¯ushes 3 and 4 sam-ples developed unpleasant odour at around 1 weekwhich became progressively stronger. In all stored WM
samples the odour improved in the last few days of thetests. All WM samples left a visible sediment deposit bythe end of the experiment, whilst the bath samplesproduced a little visible sediment. On day 4, foam beganto over¯ow from the aerated sample and ceased after 7days. The odour from this sample was milder than allother WM samples and did not have such an unpleasantcharacteristic. The aerated sample became much clearerthan the other WM ¯ushes 3 and 4 samples.
4.8. Control samples
There was no signi®cant change in the water qualityof the control samples over the duration of the experi-ments. Small ¯uctuations in DO corresponded tochanges in water temperature.
5. Discussion of storage test results
The main factors in¯uencing grey water qualitycharacteristics, and observed in this study are related to:· settlement of suspended solids;· aerobic degradation of organic matter;· anaerobic degradation of organic matter.
The transfer of oxygen through the water surfaceaccording to changes in temperature is also a factor inwater quality changes. These processes were more ob-vious in the results of the more polluted samples.
5.1. Settlement of suspended material
Settlement was clearly occurring in the most pollutedsamples, evident in falling TSS values and the built-upof sediment. However it was not so obvious in theweakly polluted samples. Suspended matter in greywater exhibits a range of particle sizes (Lovell, 1983)which must have a range of settling characteristics. Theheavier particles fall rapidly to the base of the storagetank and appear as sediment. Other suspended particlessettle at a rate dependent on their shape and densitycharacteristics. Conditions in all samples were quiescentfor the test duration and care was taken to minimisedisturbance of samples during daily sampling proce-dures.
5.2. Growth of aerobic micro-organisms
The published results of water quality analyses haveshown that grey water from the bath and WM cancontain signi®cant populations of organisms, repre-sented by relatively high TC counts (Hrudey & Raniga,1980; Nolde, Christen, & Dott, 1993; Siegrist et al.,1976). In this study, initial TC numbers were in the
298 A. Dixon et al. / Urban Water 1 (1999) 293±306

range 50 to >105/100 ml, rising to exceed at least 105/100ml in all samples after 1±4 days. DO levels droppedrapidly in the ®rst few days of storage as a result ofmicrobial activity. It is assumed that the dynamics of themicrobial population follow typical patterns of growthand decay, though numbers never fell below 105/100 mlin the entire test, indicating that conditions of substrate,nutrients and environment were su�cient to supportsigni®cant microbial populations over that period.
5.3. Release of COD from anaerobically degraded settledorganic matter
The evidence for soluble COD release due to anaer-obic activity is based upon the following observations:· an increase in some samples of measured COD after
several days of storage;· production of noisome odours suggesting anaerobic
activity;· decreases in DO to below 1 mg/l in non-aerated sam-
ples.Additionally, anaerobic COD release of deposited
solids has been isolated and measured in the laboratoryin the context of storage of road run-o� in roadsidegullies (Memon & Butler, submitted).
It is postulated that, initially, the organic particulatematerial is well mixed within the water column and thuscontributes to the overall COD measurement. Theseparticulates then settle according to their settling char-acteristics, and a proportion of solids descends out of thetop 50 mm of the water column. Since, sub-samples forCOD tests are taken from this upper 50 mm, settledparticulates no longer contribute to the measured CODvalues, thus the measured COD values drop. The largerorganic matter, now lower in the water column or settledto the invert forms substrate for anaerobic microbialpopulations to degrade, resulting in the release of solubleCOD products such as fatty acids. These soluble CODproducts are assumed to mix in the water column andthus contribute to the measured COD. Fig. 1 illustratesthe main processes assumed to occur. The veracity ofthese assumptions will be determined later in the paper.
5.4. E�ects of temperature
The e�ects of temperature were most obvious in the¯uctuation of DO. When the DO concentration of thesample is less than the saturation concentration, there isa net transfer of oxygen from the atmosphere throughthe water surface. The net transfer is in the other di-rection if the saturation concentration should decrease.An increase in temperature lowers the saturation con-centration and vice versa.
6. Water re-use simulation model
A comprehensive simulation model has been devel-oped to investigate the performance of water re-usesystems. It comprises of two modules, an input modulethat generates and/or processes time-series of water useevents, and a system module that simulates the key water¯ow and quality processes within a re-use system (Dixon,2000). The stored grey water sub-model, described in thispaper, forms the larger part of water quality processcomponent of the system module. Other water qualityprocesses not described here but included in the fullmodel related to the treatment processes including ®l-tration and disinfection (Dixon, Butler, & Fewkes, 2000).The model can be run under a wide range of water re-usescenarios incorporating changes in scale, technology andmaintenance strategy. System performance is assessedthrough evaluation of indicators that are described in thefollowing.
7. Performance indicators
The concept of assessing re-use system performanceaccording to water conservation, aesthetics, health,functionality and cost was introduced earlier. The waterquality data generated by this model is particularlyuseful in evaluating a systemÕs aesthetic performanceand aspects of functionality.
Fig. 1. Grey water ÔcolumnÕ, showing main water quality processes.
A. Dixon et al. / Urban Water 1 (1999) 293±306 299

7.1. Aesthetic performance
Reports have shown (Ward, 1996; Schneider, 1996;Surendan & Wheatley, 1999) that aesthetic consider-ations are important in de®ning the success or failure ofa re-use system. The primary indicator of aestheticperformance has been taken as the concentration of DOin the system water since results show decreased DO isassociated with release of noisome gases. The full sim-ulation model provides information about the propor-tion of time that a particular re-use system containssystem water of low DO. The concentration of sus-pended solids is also used as an indicator of aestheticperformance. The model provides frequency data forincidences of high suspended solids concentration in thesystem water.
7.2. Functionality
Functionality is related to the operation of systemcomponents and in particular the treatment compo-nents. For example, certain treatment technologies tendto focus on removal of solid material and the reductionin system water COD. Therefore, it is important toknow the behaviour of COD fractions that occur nat-urally in storage.
7.3. Hygiene
Grey water re-use has potentially serious implicationsfor public health and fresh samples have been shown tocontain TC levels of P105/100 ml (Rose et al., 1991;Hrudey & Raniga, 1980; Dixon, 2000). FC levels of 104
MPN/100 ml are considered to be acceptable for ÔservicewaterÕ in Germany (Nolde, 1995), whilst Mustow et al.,(1997) proposed no detectable FC/100 ml for most ap-plications of grey water re-use.
However this paper is concerned with water qualitychanges in stored, untreated grey water, and the ma-jority of human pathogens do not grow outside of thehuman host. There is not much evidence concerning thepersistence and growth of pathogens in untreated greywater, though Rose et al. (1991) did ®nd evidence ofsome persistence. Diaper et al. (2000) concluded thatmicrobiologically induced health risks are signi®cant insystems producing untreated grey water (i.e., malfunc-tioning systems).
8. Computer simulation of water quality processes
The stored grey water sub-model simulates the mainwater quality processes postulated from the results oflaboratory analysis, namely:· settlement of suspended solids;· aerobic microbial growth;
· release of soluble COD due to anaerobic degradationof settled organic matter;
· transfer of oxygen between water surface and atmo-sphere.The representation of aerobic growth, decay and
hydrolysis was based upon components of the ActivatedSludge Model (ASM) No. 1 (Henze, Grady, Gujer,Marais, & Matsuo, 1987). This model represents oxygendemand processes in terms of COD, making a particulardistinction between soluble, particulate and inert frac-tions. Anaerobic COD release was additionally includedwithin the ASM framework. However no attempt hasbeen made to model the microbial population respon-sible for the anaerobic degradation. The settlementprocess is simulated by a ®rst-order model. Surface rea-eration is based upon the de®cit between actual DO levelsand the temperature dependent DO saturation level.
9. Process rates
The e�ect of each process on model variables isconsidered in turn. The model calculates the net e�ectupon each water quality determinant as a result of allprocesses acting together.
9.1. Aerobic growth of heterotrophs
The aerobic growth of heterotrophs, /1, is de®ned bythe growth rate coe�cient, lH, and the active biomass,XBH. Monod functions are used for substrate SS andoxygen availability SO, so that growth is retarded at lowlevels of substrate and/or oxygen. A half saturationconstant is de®ned for substrate, KS, and oxygen utili-sation, KOH. The process rate is temperature dependentaccording to ambient temperature, T, and the temper-ature coe�cient, C1:
/1�XBH � �lH � �SS=�SS�KS�� � �SO=�SO�KOH��� �C�Tÿ20�1
:
�1�The fraction of energy that goes towards new cellgrowth is governed by the inverse of the yield variableYH. The smaller the yield value, the less e�cient thebiomass is at turning energy into new cells, i.e., moreoxygen and substrate are used up to achieve the sameincrease in cell COD:
dXBH=dt � /1 � 1; �2�dSO=dt � /1 � ÿ1 � �1ÿ YH�=YH; �3�dSS=dt � /1 � ÿ1 � �1=YH�: �4�
9.2. Decay of heterotrophic biomass
The rate, /2, at which a fraction of the active het-erotrophic biomass decays over time is determined by
300 A. Dixon et al. / Urban Water 1 (1999) 293±306
the rate of decay, bh, of the COD of the active biomass,XBH, and a temperature function governed by coe�-cient, C2:
/2 � bh � XBH � C�Tÿ20�2 ; �5�
dXBH=dt � /2 � ÿ1: �6�A fraction of the decay products is available for furtherutilisation whilst the remainder is assumed to be inert.These fractions are determined by the variable fp:
dXS=dt � /2 � �1ÿ fp�; �7�dXP=dt � /2 � fp: �8�
9.3. Settlement of suspended solids
All suspended solids with the exception of the activebiomass are assumed to be settleable and have the samesettling characteristics. Settlement, /3, is represented inthe model as a ®rst-order process, characterised by thesettlement rate, kSET:
/3 � kSET; �9�dXS=dt � /3 � ÿ1; �10�dXP=dt � /3 � ÿ1; �11�dXI=dt � /3 � ÿ1; �12�where XS is the slowly degradable particulate COD, XP
represents the particulate products of biomass decay(assumed to be unavailable for microbial degradation)and XI represents the fraction of inert particulate ma-terial. Laboratory analysis showed that sediment for-mation occurred in some of the stored grey watersamples, but not all. Therefore the variables that de-scribe slowly degradable and inert sludge, XSL, and XSLI,respectively, do not refer explicitly to a visible built-upof solid material on the base of the storage tank, ratherto a general increase in particulate COD in the lowerregion of the water column due to the descent of largersuspended particles from upper regions:
dXSL=dt � /3 � XS; �13�dXSLI=dt � /3 � �XI � XP�: �14�
9.4. Hydrolysis of particulate matter by aerobic micro-organisms
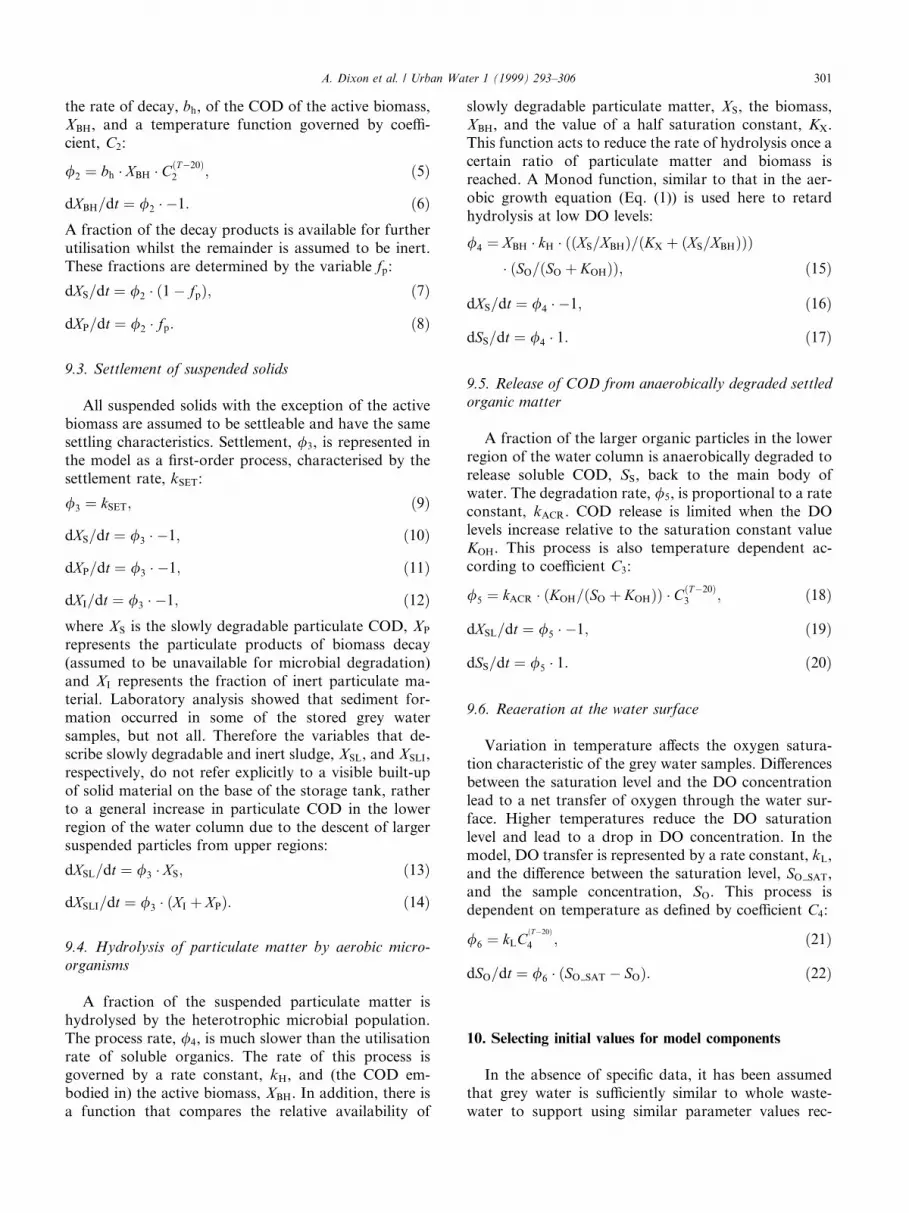
A fraction of the suspended particulate matter ishydrolysed by the heterotrophic microbial population.The process rate, /4, is much slower than the utilisationrate of soluble organics. The rate of this process isgoverned by a rate constant, kH, and (the COD em-bodied in) the active biomass, XBH. In addition, there isa function that compares the relative availability of
slowly degradable particulate matter, XS, the biomass,XBH, and the value of a half saturation constant, KX.This function acts to reduce the rate of hydrolysis once acertain ratio of particulate matter and biomass isreached. A Monod function, similar to that in the aer-obic growth equation (Eq. (1)) is used here to retardhydrolysis at low DO levels:
/4 � XBH � kH � ��XS=XBH�=�KX � �XS=XBH���� �SO=�SO � KOH��; �15�
dXS=dt � /4 � ÿ1; �16�
dSS=dt � /4 � 1: �17�
9.5. Release of COD from anaerobically degraded settledorganic matter
A fraction of the larger organic particles in the lowerregion of the water column is anaerobically degraded torelease soluble COD, SS, back to the main body ofwater. The degradation rate, /5, is proportional to a rateconstant, kACR. COD release is limited when the DOlevels increase relative to the saturation constant valueKOH. This process is also temperature dependent ac-cording to coe�cient C3:
/5 � kACR � �KOH=�SO � KOH�� � C�Tÿ20�3 ; �18�
dXSL=dt � /5 � ÿ1; �19�
dSS=dt � /5 � 1: �20�
9.6. Reaeration at the water surface
Variation in temperature a�ects the oxygen satura-tion characteristic of the grey water samples. Di�erencesbetween the saturation level and the DO concentrationlead to a net transfer of oxygen through the water sur-face. Higher temperatures reduce the DO saturationlevel and lead to a drop in DO concentration. In themodel, DO transfer is represented by a rate constant, kL,and the di�erence between the saturation level, SO SAT,and the sample concentration, SO. This process isdependent on temperature as de®ned by coe�cient C4:
/6 � kLC�Tÿ20�4 ; �21�
dSO=dt � /6 � �SO SAT ÿ SO�: �22�
10. Selecting initial values for model components
In the absence of speci®c data, it has been assumedthat grey water is su�ciently similar to whole waste-water to support using similar parameter values rec-
A. Dixon et al. / Urban Water 1 (1999) 293±306 301

ommended by Henze et al. (1987). Wherever possible,initial values for model parameters and variables havebeen based on those suggested in ASM No. 1 manualand values adopted by other research using the ASM.The ®rst column in Table 3 contains a review of typicalvalues used in ASM research.
10.1. COD fractions
In the absence of speci®c COD fraction data for greywater, estimates were based on BOD and TOC data inconjunction with TS, TVS, TSS and TVSS data for greywater (Siegrist et al., 1976). A summary of these esti-mated fractions and typical COD fractions for domesticwastewater is provided in Table 4.
10.2. Temperature e�ects
Biochemical water quality processes tend to be af-fected by changes in temperature and each of the bio-
chemical process rates has a temperature function basedon the Arrhenius equation. Table 5 contains a summaryof typical temperature coe�cients used in ASM appli-cations, as well as the estimated values adopted in thisstudy. Sample water temperature data was interpolatedto give the time-series used in the model. Each samplehad its own temperature pro®le that was used whencomparing model and laboratory data.
11. Calibration and veri®cation
11.1. Selection of data
We recall that laboratory tests have been performedon samples from the bath and WM. Presently, data fromthe WM ¯ushes 1 and 2 sample analysis is not used inthe calibration exercise, because the high pollutantloading in these discharges render them unsuitable forre-use without signi®cant further treatment. Howeverthe data will be reviewed once the model has been de-veloped for the relevant treatment processes. The re-maining data comprises of 4 bath and 4 ¯ushes 3 and 4WM discharge samples. The data was arranged in twosets, one for calibration and the second for veri®cation.Calibration was carried out with two of the bath sam-ples (one from each batch) and one from ¯ushes 3 and 4WM sample. Veri®cation was carried out with two otherbath samples (one from each batch) and another from¯ushes 3 and 4 sample (see Table 1).
11.2. Calibration
Calibration was based on measured values for DO,SO and COD (MC). Measured COD is the sum of thenon-inert fractions of COD in the main body of greywater (excluding settled particulate matter):
MC � SS � XS � XBH: �23�The calibration was carried out by varying model pa-rameter values to achieve the best ®t between model
Table 3
Model parameter values
Model component Literature values This study (from
calibration)
lH (dayÿ1) 1±8 2.7
bh (dayÿ1) 0.2±1 1
fp (g COD/g COD) 0.08±0.2 0.2
kACR (day ÿ1) ± 0.2
kL (dayÿ1) ± 0.1
kH (dayÿ1) 1±25 1
KOH (g O2/m3) 0.05±0.5 1.8
KS (g COD/m3) 1±20 20
kSET (g/l/day)a 0.3±30 1.5
KX (g COD/g COD) 0.01±0.5 0.5
YH (g COD/g COD) 0.55±0.67 0.55
a From secondary treated wastewater (Tchobanoglous & Burton, 1991;
Henze et al., 1987; Kappeler & Gujer, 1992; Sollfrank & Gujer, 1991;
Henze, Gujer, Mino, Matsuo, Wentzel, & Marais, 1995; Bjerre, 1997;
Hvitved-Jacobsen, Vollertson, & Nielsen, 1998; Vollertsen, Almeida, &
Hvitved-Jacobsen, 1999) as cited in Almeida (1999).
Table 4
Initial conditions for model run
Model component ASM 1
(mg COD/l)a
ASM 2
(mg COD/l)b
Estimated fractions in
grey water (mg COD/l)
Estimated fractions in
grey water (%)
Si 25±40 20±100 105 15
SOc ± ± 6.6 ±
SS 70±125 30±310 315 45
XBH 2 ± 2 0.2
XI 25±100 30±150 63 9
XS 100±250 80±600 217 31
a See Henze et al. (1987), as cited in Almeida (1999).b See Henze et al. (1995), as cited in Almeida (1999).c Values are in mg/l DO.
302 A. Dixon et al. / Urban Water 1 (1999) 293±306

data and laboratory data for SO and MC in the threeselected samples. Preliminary test runs revealed that SO
and MC behaviour was particularly sensitive to thegrowth rate, lH, the rate of settlement, KSET, the halfsaturation constant for oxygen utilisation, KOH, and theanaerobic COD release rate, kACR. The value of thesefour parameters was varied to achieve a best visible ®twith the laboratory data. Preliminary runs also revealedthat the estimate of COD fractions described earliercould be modi®ed to improve the model ®t for MC (seeTable 6). The proportion of particulate COD was in-creased from 31% to 61%. Calibration was carried out inan iterative manner. Sample was compared with modeldata and adjustments were made to model parametersfor each of the three samples in turn. This cycle wasrepeated, making smaller and smaller parameter ad-justments until there was a satisfactory ®t for all of thelaboratory data. Formal parameter optimisation will beattempted once further water quality data becomesavailable.
Figs. 2±4 show measured and modelled COD and DOvalues for each of the calibration data sets.
11.3. Veri®cation
To verify the model, initial MC and SO values, to-gether with the temperature pro®le for each set of veri-®cation data, were input to the model. Modelparameters were not altered from their calibration val-ues. The model was run and the resulting series of DOand COD (SO and MC) values were compared againstthe laboratory data, as shown in Figs. 5±7.
12. Discussion of calibration and veri®cation
The water quality model is based on the hypothesisthat aerobic heterotrophic growth, settlement of sus-pended solids, anaerobic degradation and reaerationthrough the water surface are the dominant processes indetermining water quality behaviour in stored grey wa-ter. The ®t of model data to laboratory results wassatisfactory in all cases in terms of DO, represented inthe model by SO. The behaviour of DO is characterisedby an initial rapid decline followed by temperature-re-
Table 6
Modi®ed estimates for COD fractions in grey water
Model component Mod®ed
fractions (%)
Modi®ed fractions
(mg COD/l)
Si 15 34
SOa ± 6.9
SS 15 107
XBH 0.2 2
XI 8.8 125
XS 61 426
a Values are in mg/l DO.
Fig. 2. Calibration plot for COD and DO (run 1: bath water, batch 1).
Fig. 3. Calibration plot for COD and DO (run 2: bath water, batch 2).
Table 5
Temperature coe�cientsa
Coe�cient Process Literature values This study
C1 Growth of heterotrophic biomass 1.07±1.18 1.1
C2 Decay of heterotrophic biomass 1.07 1.024
C3 Anaerobic COD release ± 1.024
C4 Aeration 1.008±1.047 1.024
a See Bowie et al. (1985), Henze et al. (1995), Cao (1994) and Vollertsen et al. (1999), as cited in Almeida (1999).
A. Dixon et al. / Urban Water 1 (1999) 293±306 303

lated ¯uctuations in concentration in the range 0.2±2.7mg/l. The selected parameter values for lH and KOH gavea good ®t between model and calibration data for SO.Moreover, the good ®t of SO to veri®cation data justi®esthe adoption of an increased value of KOH compared tovalues adopted in other applications of the ASM model(see Table 3).
The model output for measured COD, MC, did not ®tas well as the SO data, and the deviation varied fromsample to sample. The prevailing trend, characterised bya rapid decline and then slow recovery of MC values isstrongly evident in run 2 (Fig. 3) which demonstrates areasonable match of model and laboratory data. Allruns, except 2 and 5 (Figs. 3 and 6), show a good ®t forthe initial decline in COD, though these would show animproved ®t if a greater proportion of particulate mattersettled out, suggesting a review of the COD fractionestimates. Runs 1, 4 and 5 (Figs. 2, 5 and 6) indicate thata reduction in the anaerobic COD release rate, kACR,would improve the ®t, whilst the model ®t for run 6would bene®t from an increased rate of anaerobic COD
release. In run 5, the intial COD value of 1200 mg/llooks to be high for a bath water, and if a lower initialvalue were used a much better model ®t could beachieved. The 1100 mg/l COD value in run 6 appears tobe erroneous, given the trend in the other data.
The results relate to speci®c grey water types and inpractice the characteristics of the water will vary fromhousehold to household. Di�erent household chemicals,for example, will have di�erent degrees of biodegrada-bility, and this in turn will a�ect the ability of any modelto accurately predict changes in water quality determi-nants.
13. Conclusions
Stored, untreated grey water undergoes signi®cantwater quality changes and it is hypothesised that fourmain processes govern these changes. The dominantprocesses in the ®rst few hours of storage are settlement
Fig. 4. Calibration plot for COD and DO (run 3: WM ¯ushes 3 and 4,
batch 1).
Fig. 5. Veri®cation plot for COD and DO (run 4: bath water, batch 1).
Fig. 6. Veri®cation plot for COD and DO (run 5: bath water, batch 2).
Fig. 7. Veri®cation plot for COD and DO (run 6: WM ¯ushes 3 and 4,
batch 1).
304 A. Dixon et al. / Urban Water 1 (1999) 293±306

of suspended particulate matter and depletion of DO.Measurements indicate rapid growth of coliforms in allsamples, indicating depletion of DO is probably causedby growth of aerobic biomass. The two other key pro-cesses are thought to be reaeration of DO through thewater surface, and the release of soluble COD due toanaerobic degradation of settled slowly degradableparticulate matter, though these were not directly ob-served.
The simulation model developed in the study usesMonod-type equations similar to those found in theIWA ASM1 model. The model was calibrated to the dataof three samples and then veri®ed against another threeindependent sets. Model to laboratory data ®t was foundto be good in all cases for the DO concentration, givingweight to the assumptions of depletion due to aerobicdegradation and reaeration through the water surface.
Model ®t was not as impressive, however, for COD.Nevertheless, the model did represent the characteristicdecline and subsequent increase evident in several sam-ples. Adjustment of the model parameters representinganaerobic COD release improves the model ®t later inthe run (in speci®c cases), lending support to the initialhypothesis of delayed benthic release.
The results con®rm practical observations that greywater should not be stored longer than approximately48 h. However, more than this, they indicate that greywater can bene®t from at least 24 h storage in terms ofsubstantial reductions in COD (and TSS) associatedwith the settlement phase (remembering that COD is afunctionality performance indicator). Storage for thatperiod will minimise the load on subsequent treatmentstages. Measurements and model both indicate, how-ever, that DO levels drop substantially and unacceptably(given their role as an aesthetic performance indicator)within 24 h. However this deleterious e�ect can beminimised by including a small amount of aeration ca-pacity as indicated in the FB4+ test results. As coliformcounts tend to be high initially, these should not beadversely a�ected by 24 h of storage. Thus storage ofthis duration is neutral as regards hygiene standards.Very careful design of the storage tank will be required ifsettlement is to be encouraged, to avoid long-term de-position of solids in the tank invert and its associatedodour problems.
The water quality model satisfactorily simulates thebehaviour of DO, but the simulation for measured CODis not yet su�ciently good for the model to be used as anoperational tool. However the complexity of the modelis justi®ed in terms of capturing the detail of trends inthe data, not predicted by simpler approaches. Moredetailed laboratory characterisation of grey water interms of:· COD analysis (role of homogenisation and ®ltration
of samples, di�erentiating di�erent fractions, verticalpro®ling);
· determination of settling characteristics of suspendedand deposited particles should lead to better under-standing of the processes and improvements in themodel.
Acknowledgements
This work was carried out under the EPSRC ÔSus-tainable CitiesÕ initiative grant numbers GR/K63450 andGR/K61616. The constructive comments of the anony-mous reviewers are acknowledged.
References
Almeida, M. C. (1999). Pollutant transformation processes in sewers
under aerobic dry weather ¯ow conditions. Ph.D. thesis, Imperial
College, University of London.
Bjerre, H. L. (1997). Transformation of wastewater in an open sewer:
The Emscher river, Germany. Ph.D. thesis, Aalborg University,
Denmark.
Bowie, G. L., Mills, W. B., Porcella, D. B., Cambell, C. L., Pagenkopf,
J. R., Rupp, G. L., Johnson, K. M., Chan, P. W. H., Gherini, S. A.,
& Chamberlain, C. E. (1985). Rates, constants, and kinetics
formulations on surface water quality modeling (2nd ed.). EPA/
600/3-85/040.
Butler, D. (1991). A small-scale study of wastewater discharges from
domestic appliances. Journal of IWEM, 5, 178±185.
Butler, D., Friedler, E., & Gatt, K. (1995). Characterising the quantity
and quality of domestic wastewater in¯ows. Water Science Tech-
nology, 31(7), 13±24.
Cao, Y. (1994). Aerobic heterotrophic biodegradation in polluted drains
and sewers ± the drain and sewer as dual-phase biological reactors.
Doctoral thesis, TUD/IHE, Delft, Netherlands.
Diaper, C., Dixon, A., Butler, D., Fewkes, A., Parsons, S.A.,
Strathern, M., Stephenson, T., & Strutt, J. (2000). Small scale
water recycling systems ± risk assessment and modelling. In
Proceedings of the ®rst world congress of the international water
association (pp. 3±7). Paris.
Dixon, A. (2000). Computer simulation of domestic water re-use
systems: greywater and rainwater in combination, Ph.D. thesis,
Imperial College, University of London.
Dixon, A., Butler, D., & Fewkes, A. (1999). Water saving potential of
domestic water re-use systems using greywater and rainwater in
combination. Water Science Technology, 39(5), 25±32.
Dixon A., Butler, D., & Fewkes A. (2000). Report on systems model
WateRAT. WROCS project, Imperial College, London.
Henze, M., Grady, C. P. L., Jr., Gujer, W., Marais, G. v. R., &
Matsuo, T. (1987). Activated sludge model No. 1. Scienti®c and
technical report No. 1, IAWPRC, London.
Henze, M., Gujer, W., Mino, T., Matsuo, T., Wentzel, M. C., &
Marais, G. v. R. (1995). Activated sludge model No. 2. Scienti®c and
technical report No. 3, IAWQ, London.
Hrudey, S. E., & Raniga, S. (1980). Greywater Characteristics health
concerns and treatment technology, design of water and waste-
water service for cold climate communities. In Proceedings of post
conference seminar in conjunction with IAWPR conference. Toron-
to.
Hvitved-Jacobsen, T., Vollertson, J., & Nielsen, P. H. (1998). A
process and model concept for microbial wastewater transforma-
tions on gravity sewers. Water Science Technology, 37(1), 233±241.
Kappeler, J., & Gujer, W. (1992). Estimation of kinetic parame-
ters of heterotrophic biomass under aerobic conditions and
A. Dixon et al. / Urban Water 1 (1999) 293±306 305

characterisation of wastewater for activated sludge modelling.
Water Science Technology, 25(6), 125±139.
Kourik, R. (1991). Gray water use in the landscape: How to help your
landscape prosper with recycled water. Santa Rosa, CA, USA:
Metamorphic Press.
Lovell, J. A. (1983). The degradation of stored domestic wastewater for
reuse in WC ¯ushing. M.Phil. dissertation, Trent Polytechnic,
Nottingham.
Memon, F. A., & Butler, D. (submitted). Identi®cation and modelling
of dry weather processes in gully pots. Water Research.
Mustow, S., Grey, R., Smerdon, T., Pinney, C., & Wagget, R. (1997).
Water conservation ± implications of using recycled greywater and
stored rainwater in the UK. Final report 13034/1, prepared by
BSRIA for DWI.
Nolde, E. (1995). Greywater reuse in households ± experience from
Germany. In J. Staudenmann et al., (Eds.), Research forum on
Recycing the resource (Vols. 5&6). Zurich, Switzerland: Transtec
Publ.
Nolde, E., Christen, S., & Dott, W. (1993). Experiences with using
stormwater and treated greywater in Berlin households ± aspects of
hygiene and greywater puri®cation. In Proceedings of the sixth
junior scientist course. Kastanienbaum, Switzerland.
Robinson, M. D. (1996). The storage and recycling of domestic
grey water. M.Sc. dissertation, Imperial College, University of
London.
Rose, J. B., Gwo-shing, S., Gerba, C. P., & Sinclair, N. A.
(1991). Microbial quality and persistence of enteric pathogens in
graywater from various household sources. Water Resources, 25(1),
37±42.
van der Ryn, S. (1995). The toilet papers (pp. 81±98). CA, USA:
Ecological Design Press.
Schneider, M. P. (1996). The social acceptibility of rainwater conser-
vation and re-use in domestic properties. In Proceedings of the
standing conference on Stormwater source control: Quantity and
quality (16th December, Vol. XIV, pp. 1±32). Coventry University.
Siegrist, R., Witt, M. B., & Boyle, (1976). Characteristics of rural
household wastewater. ASCE Journal of Environmental Engineering
Division, 533±548.
Solfrank, U., & Gujer, W. (1991). Characterisation of domestic
wastewater for mathematical modelling of activated sludge process.
Water Science Technology, 23, 1057±1066.
Surendran, S., & Wheatley, A. (1998). Grey-water reclamation for
non-potable re-use. Journal of CIWEM, 12, 406±413.
Surendran, S., & Wheatley, A., (1999). Greywater and roof water
reclamation at large institutions ± Loughborough experiences. In
Proceedings of the CIWEM national conference on Making better
use of water resources (19th May). London.
Tchobanoglous, G., & Burton, F. L. (Metcalf and Eddy) (1991).
Wastewater engineering, treatment and disposal (3rd ed.). New
York: McGraw-Hill.
Vollertsen, J., Almeida, M. C., & Hvitved-Jacobsen, T. (1999). E�ects
of temperature and dissolved oxygen on hydrolysis of sewer solids.
Water Research, 33, 3119±3126.
Ward, M., (1996). Experiences from research at linacre college, Oxford.
Architectural Digest for the 21st Century (21 AD): Water. School
of Architecture, Oxford Brookes University.
Webster, C. J. D. (1972). An investigation of the use of water outlets in
multi-storey ¯ats. Building Service Engineering, 39.
306 A. Dixon et al. / Urban Water 1 (1999) 293±306


