Embed Size (px)
Citation preview
Presented at the First International Workshop between the Center for the Seawater Desalination Plant and the EuropeanDesalination Society, November 15–16, 2007, GIST, Gwangju, Korea.
0011-9164/09/$– See front matter © 2009 Elsevier B.V. All rights reserved
Desalination 238 (2009) 78–89
Measurement of size and number of suspended and dissolvednanoparticles in water for evaluation of colloidal fouling
in RO membranes
Kihong Park*, Ji Yeon Park, Sungyun Lee, Jaeweon ChoDepartment of Environmental Science and Engineering, Gwangju Institute of Science and Technology (GIST),
1-Oryong-Dong, Buk-Gu, Gwangju 500-712, KoreaTel. +82 (62) 970-2463; Fax. +82 (62) 970-2434; email: [email protected]
Received 15 November 2007; Accepted 31 January 2008
Abstract
We developed a real-time aerosolization method combined with membrane filtration technique to determine sizeand number of dissolved and suspended colloid nanoparticles in water. Feed water before and after being treated byMF, UF or NF membranes was in-situ aerosolized and dried, and size and number of particles were determined inreal time. Humic acid, CaCO3, and NaCl nanoparticles with varying solute concentrations, and standard nanoparticleswith known size and number, were used to evaluate performance of the current method. We also measured size andnumber of colloidal nanoparticles in wastewater effluent, river water, and seawater. We found that there exists asignificant amount of nanoparticles remaining even after UF and NF filtration, suggesting that dissolved nano-particles that survived by UF and NF filtration may affect the fouling in RO membranes in the desalination process.The dissolved nanoparticles are defined here as those that are originally not in particle phase in feed water but thatare able to precipitate near the membranes by crystallization or concentration polarization in the form of particlephase. Separating of dissolved and suspended nanoparticles in water was achieved with the current method, leadingto determine their relative contribution in the feed water. The fraction of dissolved nanoparticles in seawater thatsurvived through NF filtration in total particle count is 66% while that in river water is 44%. TEM/EDS analysisverified that a significant amount of dissolved nanoparticles survived through UF and NF filtration, and that distincttypes of dissolved nanoparticles exist in river water and seawater. Dissolved nanoparticles in seawater were classifiedinto four types: carbon-rich spherical particles, carbon-mineral rich (Ca-O-C-Mg-S-Cl-Si) irregular particles, carbon-mineral rich spherical particles (C-Cu-Ca-O-Si-Mg), and Na-containing cubic particles.
Keywords: Colloid nanoparticles; Aerosolization; Particle size; RO Membrane; Desalination
*Corresponding author.
K. Park et al. / Desalination 238 (2009) 78–89 79
1. Introduction
There has been a significant amount ofresearch on colloidal fouling which limits the lifeand performance of membranes. Recently, mucheffort has been made to predict membrane foulingby colloidal particles in feed water. Foulingindices such as SDI (Silt Density Index) [1,2] andMFI (Modified Fouling Index) [3] have beenwidely used to estimate colloidal fouling. Thesemethods are based on filtration of feed watersthrough a 0.45 µm Millipore microfilter [4].However, they inadequately dealt with particlessmaller than ~0.45 µm and dissolved particles. Inthe desalination process, despite the use of micro-filtration (MF) or ultrafiltration (UF) as pretreat-ment to reverse osmosis, colloidal fouling stilloccurred in stages of RO membranes [1,5,6]. Ithas been reported that severe colloidal foulingproblems occurred although the above standardindices were met [7–9]. This might occur becausethe SDI or MFI test is not able to account fornanoparticles smaller than the pore size and dis-solved in water, probably having significanteffects on membrane fouling. Schippers et al. [10]also reported that particles smaller than 50 nmwere responsible for flux decline in RO mem-branes. Nanoparticles passing through a pretreat-ment system (MF or UF) can exist in the form ofdissolved particles and suspended particlessmaller than the pore size. Here we define thedissolved nanoparticles as those that are origi-nally not in the particle phase in feed water (i.e.,they are dissolved in water) but that are able toprecipitate near the membranes by crystallizationor concentration polarization in the form ofparticle phase. Suspended nanoparticles maycoagulate and adhere to RO membranes due toconcentration polarization, compaction, surfaceinteraction, and other factors near the surface ofmembranes [11]. Thus, quantification of bothdissolved and suspended nanoparticles is essentialto understaning membrane fouling by nanopar-ticles and to establish control methods for reduc-ing nanocolloidal fouling.
A light scattering technique was used to countparticle numbers in the water in real time. How-ever, this method was limited for nanoparticlesdue to low scattering intensity of small particlesand bubble artifacts, and it was also difficult tocount dissolved particles. With the field flowfractionation method [12,13], separation of nano-particles in a laminar carrier flow under a fieldcross flow can be accomplished using theirdiffusion coefficient that can be used to determineparticle size. This method has an advantage toaccount for interaction between particles andmembranes, but it requires extensive calibrationprocedures to determine the absolute particle size.Off-line methods such as transmission electronmicroscopy [14,15], scanning electron micro-scopy (SEM) [16], and atomic force microscopy(AFM) [17–19] can be used to determine particlesize and morphology, but it is limited to obtainquantitative size and counting data.
In this study, we propose a new aerosolizationmethod combined with a membrane filtrationtechnique to determine size and number of nano-particles dissolved and suspended in water in realtime. Humic acid, calcium carbonate, and sodiumchloride particles were artificially generated withknown concentrations in DI water to evaluate thecurrent method for quantifying their particleconcentration. Standard particles with a knownsize and number in water are also used to evaluatethe new method for sizing accuracy. Furthermore,we applied it for several types of feed waters suchas wastewater, river water, and seawater todetermine size and number of nanoparticles (20–600 nm) in these waters. Off-line transmissionelectron microscopy and energy dispersive spec-troscopy (EDS) analysis were performed toexamine particle morphology and elementalcomposition.
2. Experimental methods
We applied an aerosolization method com-bined with membrane filtration technique to
K. Park et al. / Desalination 238 (2009) 78–8980
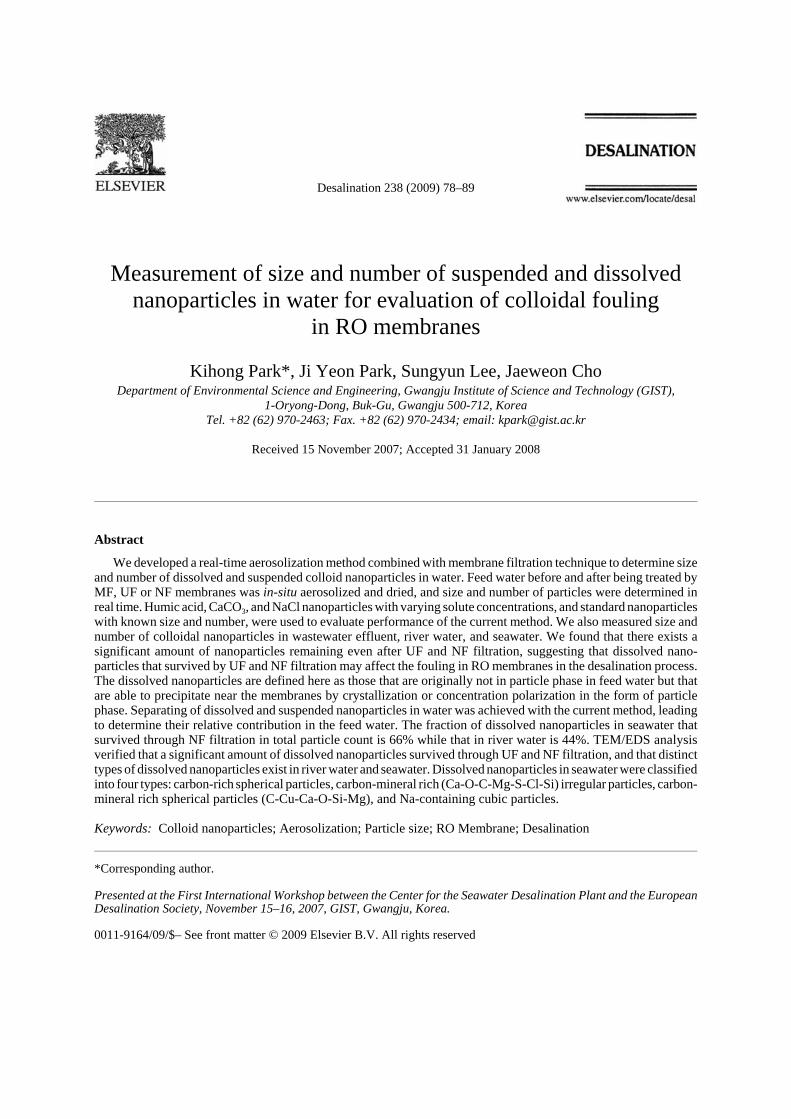
Fig. 1. Experimental set-up for measuring nanoparticles in feed water using the aerosolization method combined with amembrane filtration technique.
determine size and number of dissolved and sus-pended nanoparticles in water. Our experimentalset-up is shown in Fig. 1. Feed water solution isaerosolized into micrometer droplets by a con-stant output atomizer (TSI 3076) equipped with asyringe pump. The syringe pump supplies a freshsolution with a constant flow rate of 2 ml/min tothe atomizing jet. These droplets containingsuspended and dissolved particles are dried outby using two diffusion driers in series, and thenremaining particles are introduced to the particlecounting system. Particles in the air are countedwith a respect to particle size using a combinationof a differential mobility analyzer (DMA) (TSI3081 DMA) and a condensation particle counter(CPC) (TSI 3022A CPC) [20]. The DMA sepa-rates particles according to their electrical mobi-lity which is related to particle size, and then thenumber of particles of the given size is countedwith the CPC in a continuous manner. This pro-vides number size distribution of particles in thesize range of 20-600 nm with 64 or 128 bins in~2 min. By integrating the number size distri-bution, the total number of concentration particlesin 20–600 nm can be calculated.
Since the current aerosolization methoddetermines size and number of both dissolved andsuspended particles, comparison of particle sizeand number before and after NF filtration enablesus to estimate number fraction of dissolved andsuspended nanoparticles in water. The NF mem-brane may remove most of suspended nano-particles (note that the pore size of the NF mem-brane is approximately 0.9 nm) and some of thedissolved nanoparticles. Thus, the current methodmay provide the lower limit of concentration ofthe dissolved nanoparticles. To determine particlesize and number after UF and NF filtration, thesolution was first pretreated by UF membrane(5 kDa, PBCC, Millipore, France, or 100 kDa,PBHK, Millipore, France) or NF membrane (NF70, Saehan, Korea). For UF or NF filtration, aflat-sheet type of membrane was placed in therectangular plate-and-frame membrane cell hav-ing dimensions of 7.7 cm length, 2.6 cm width,and 0.3 cm height for the cross-flow bench-scaleexperiments, which provide an active membranearea of 56.8 cm2. The permeate flux was moni-tored by a digital flow meter. Before feed waterwas filtered by the membrane, de-ionized water
K. Park et al. / Desalination 238 (2009) 78–89 81
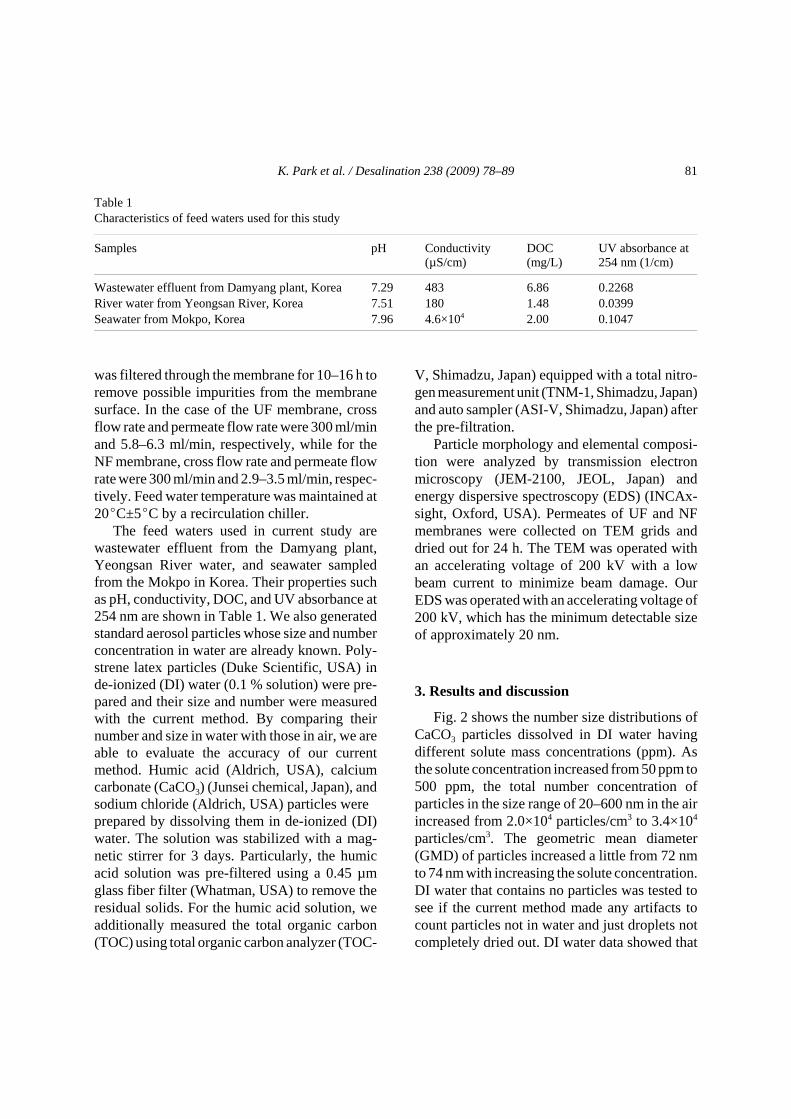
Table 1Characteristics of feed waters used for this study
Samples pH Conductivity(µS/cm)
DOC(mg/L)
UV absorbance at254 nm (1/cm)
Wastewater effluent from Damyang plant, Korea 7.29 483 6.86 0.2268River water from Yeongsan River, Korea 7.51 180 1.48 0.0399Seawater from Mokpo, Korea 7.96 4.6×10⁴ 2.00 0.1047
was filtered through the membrane for 10–16 h toremove possible impurities from the membranesurface. In the case of the UF membrane, crossflow rate and permeate flow rate were 300 ml/minand 5.8–6.3 ml/min, respectively, while for theNF membrane, cross flow rate and permeate flowrate were 300 ml/min and 2.9–3.5 ml/min, respec-tively. Feed water temperature was maintained at20EC±5EC by a recirculation chiller.
The feed waters used in current study arewastewater effluent from the Damyang plant,Yeongsan River water, and seawater sampledfrom the Mokpo in Korea. Their properties suchas pH, conductivity, DOC, and UV absorbance at254 nm are shown in Table 1. We also generatedstandard aerosol particles whose size and numberconcentration in water are already known. Poly-strene latex particles (Duke Scientific, USA) inde-ionized (DI) water (0.1 % solution) were pre-pared and their size and number were measuredwith the current method. By comparing theirnumber and size in water with those in air, we areable to evaluate the accuracy of our currentmethod. Humic acid (Aldrich, USA), calciumcarbonate (CaCO3) (Junsei chemical, Japan), andsodium chloride (Aldrich, USA) particles wereprepared by dissolving them in de-ionized (DI)water. The solution was stabilized with a mag-netic stirrer for 3 days. Particularly, the humicacid solution was pre-filtered using a 0.45 µmglass fiber filter (Whatman, USA) to remove theresidual solids. For the humic acid solution, weadditionally measured the total organic carbon(TOC) using total organic carbon analyzer (TOC-
V, Shimadzu, Japan) equipped with a total nitro-gen measurement unit (TNM-1, Shimadzu, Japan)and auto sampler (ASI-V, Shimadzu, Japan) afterthe pre-filtration.
Particle morphology and elemental composi-tion were analyzed by transmission electronmicroscopy (JEM-2100, JEOL, Japan) andenergy dispersive spectroscopy (EDS) (INCAx-sight, Oxford, USA). Permeates of UF and NFmembranes were collected on TEM grids anddried out for 24 h. The TEM was operated withan accelerating voltage of 200 kV with a lowbeam current to minimize beam damage. OurEDS was operated with an accelerating voltage of200 kV, which has the minimum detectable sizeof approximately 20 nm.
3. Results and discussion
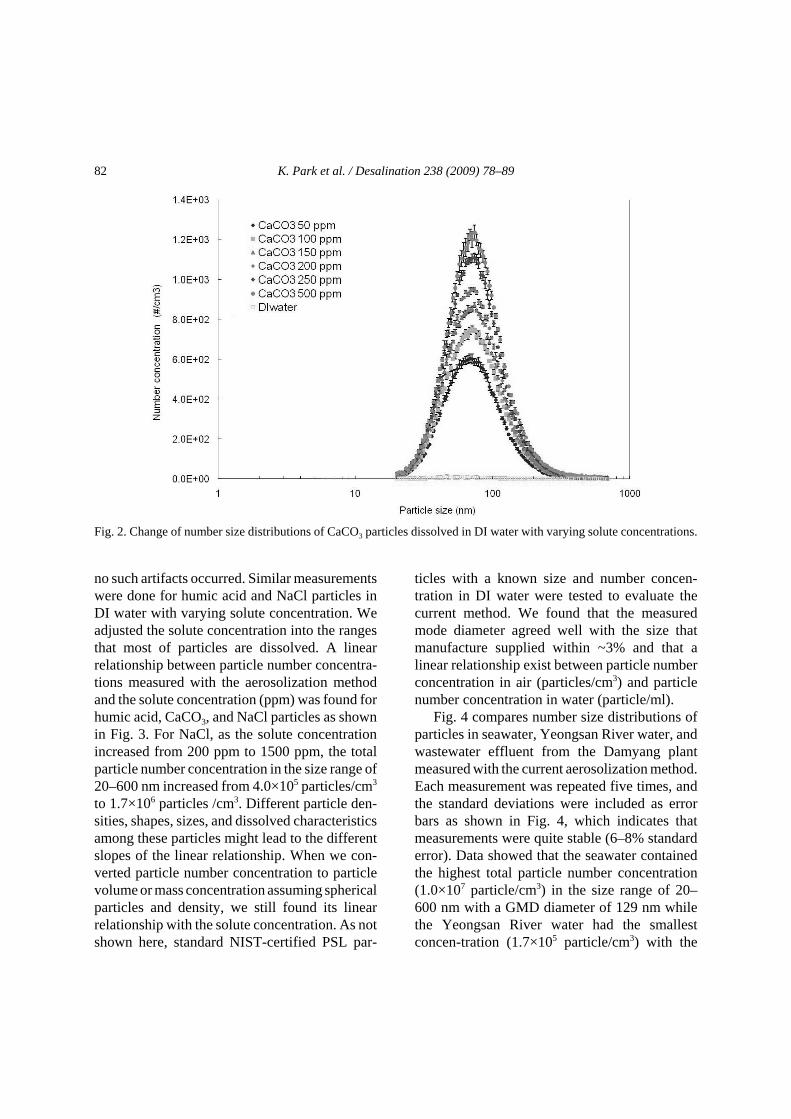
Fig. 2 shows the number size distributions ofCaCO3 particles dissolved in DI water havingdifferent solute mass concentrations (ppm). Asthe solute concentration increased from 50 ppm to500 ppm, the total number concentration ofparticles in the size range of 20–600 nm in the airincreased from 2.0×10⁴ particles/cm3 to 3.4×10⁴
particles/cm3. The geometric mean diameter(GMD) of particles increased a little from 72 nmto 74 nm with increasing the solute concentration.DI water that contains no particles was tested tosee if the current method made any artifacts tocount particles not in water and just droplets notcompletely dried out. DI water data showed that
K. Park et al. / Desalination 238 (2009) 78–8982
Fig. 2. Change of number size distributions of CaCO3 particles dissolved in DI water with varying solute concentrations.
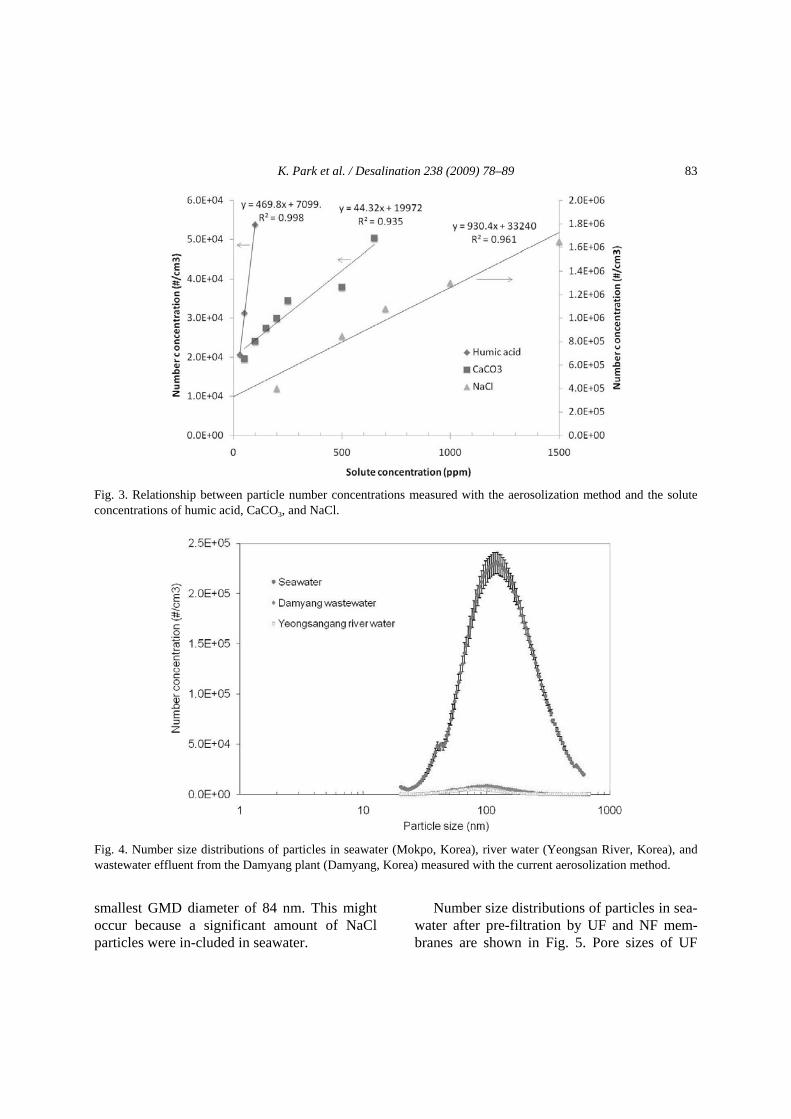
no such artifacts occurred. Similar measurementswere done for humic acid and NaCl particles inDI water with varying solute concentration. Weadjusted the solute concentration into the rangesthat most of particles are dissolved. A linearrelationship between particle number concentra-tions measured with the aerosolization methodand the solute concentration (ppm) was found forhumic acid, CaCO3, and NaCl particles as shownin Fig. 3. For NaCl, as the solute concentrationincreased from 200 ppm to 1500 ppm, the totalparticle number concentration in the size range of20–600 nm increased from 4.0×10⁵ particles/cm3
to 1.7×10⁶ particles /cm3. Different particle den-sities, shapes, sizes, and dissolved characteristicsamong these particles might lead to the differentslopes of the linear relationship. When we con-verted particle number concentration to particlevolume or mass concentration assuming sphericalparticles and density, we still found its linearrelationship with the solute concentration. As notshown here, standard NIST-certified PSL par-
ticles with a known size and number concen-tration in DI water were tested to evaluate thecurrent method. We found that the measuredmode diameter agreed well with the size thatmanufacture supplied within ~3% and that alinear relationship exist between particle numberconcentration in air (particles/cm3) and particlenumber concentration in water (particle/ml).
Fig. 4 compares number size distributions ofparticles in seawater, Yeongsan River water, andwastewater effluent from the Damyang plantmeasured with the current aerosolization method.Each measurement was repeated five times, andthe standard deviations were included as errorbars as shown in Fig. 4, which indicates thatmeasurements were quite stable (6–8% standarderror). Data showed that the seawater containedthe highest total particle number concentration(1.0×10⁷ particle/cm3) in the size range of 20–600 nm with a GMD diameter of 129 nm whilethe Yeongsan River water had the smallestconcen-tration (1.7×10⁵ particle/cm3) with the
K. Park et al. / Desalination 238 (2009) 78–89 83
Fig. 3. Relationship between particle number concentrations measured with the aerosolization method and the soluteconcentrations of humic acid, CaCO3, and NaCl.
Fig. 4. Number size distributions of particles in seawater (Mokpo, Korea), river water (Yeongsan River, Korea), andwastewater effluent from the Damyang plant (Damyang, Korea) measured with the current aerosolization method.
smallest GMD diameter of 84 nm. This mightoccur because a significant amount of NaClparticles were in-cluded in seawater.
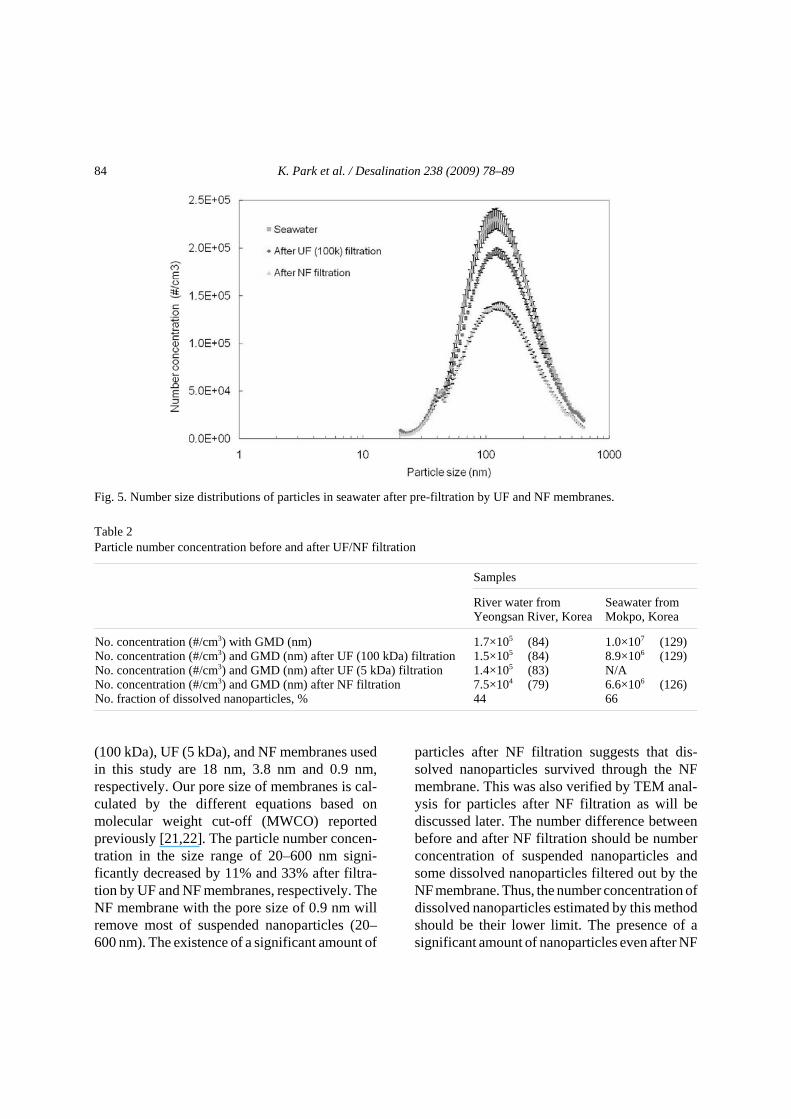
Number size distributions of particles in sea-water after pre-filtration by UF and NF mem-branes are shown in Fig. 5. Pore sizes of UF
K. Park et al. / Desalination 238 (2009) 78–8984
Fig. 5. Number size distributions of particles in seawater after pre-filtration by UF and NF membranes.
Table 2Particle number concentration before and after UF/NF filtration
Samples
River water fromYeongsan River, Korea
Seawater fromMokpo, Korea
No. concentration (#/cm3) with GMD (nm)No. concentration (#/cm3) and GMD (nm) after UF (100 kDa) filtrationNo. concentration (#/cm3) and GMD (nm) after UF (5 kDa) filtrationNo. concentration (#/cm3) and GMD (nm) after NF filtrationNo. fraction of dissolved nanoparticles, %
1.7×10⁵ (84)1.5×10⁵ (84)1.4×10⁵ (83)7.5×10⁴ (79)44
1.0×10⁷ (129)8.9×10⁶ (129)N/A6.6×106 (126)66
(100 kDa), UF (5 kDa), and NF membranes usedin this study are 18 nm, 3.8 nm and 0.9 nm,respectively. Our pore size of membranes is cal-culated by the different equations based onmolecular weight cut-off (MWCO) reportedpreviously [21,22]. The particle number concen-tration in the size range of 20–600 nm signi-ficantly decreased by 11% and 33% after filtra-tion by UF and NF membranes, respectively. TheNF membrane with the pore size of 0.9 nm willremove most of suspended nanoparticles (20–600 nm). The existence of a significant amount of
particles after NF filtration suggests that dis-solved nanoparticles survived through the NFmembrane. This was also verified by TEM anal-ysis for particles after NF filtration as will bediscussed later. The number difference betweenbefore and after NF filtration should be numberconcentration of suspended nanoparticles andsome dissolved nanoparticles filtered out by theNF membrane. Thus, the number concentration ofdissolved nanoparticles estimated by this methodshould be their lower limit. The presence of asignificant amount of nanoparticles even after NF
K. Park et al. / Desalination 238 (2009) 78–89 85
(a)
(b)
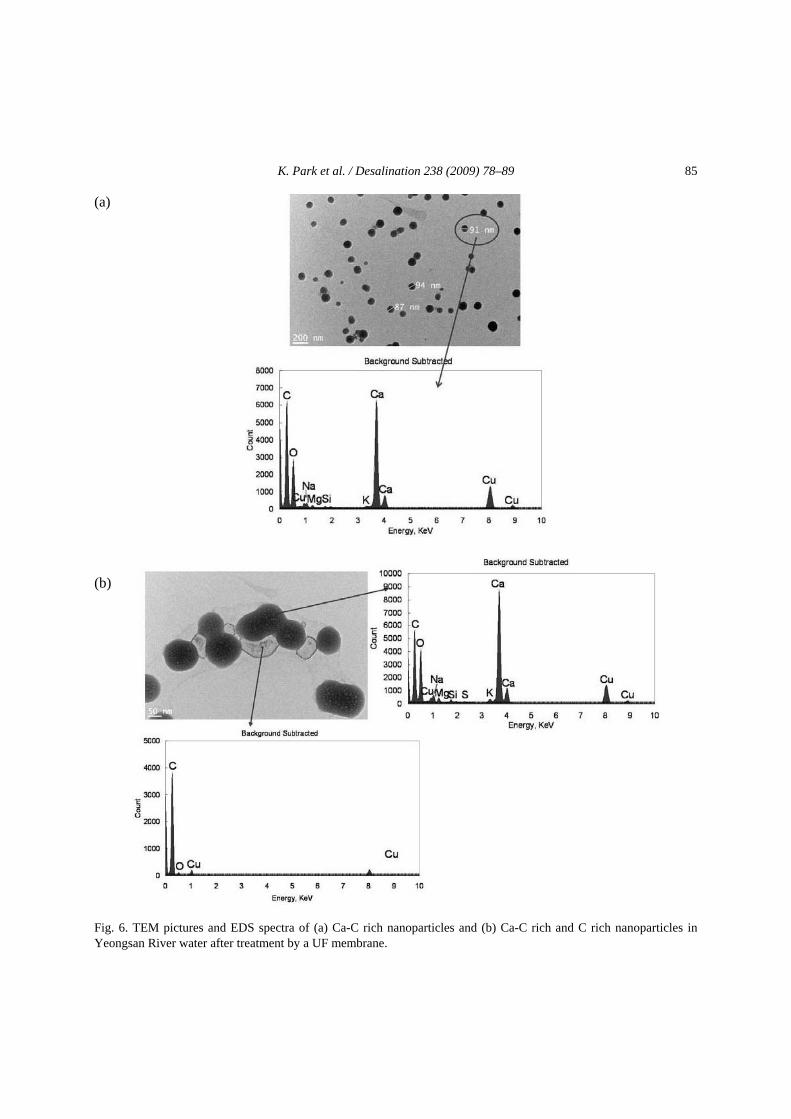
Fig. 6. TEM pictures and EDS spectra of (a) Ca-C rich nanoparticles and (b) Ca-C rich and C rich nanoparticles inYeongsan River water after treatment by a UF membrane.
K. Park et al. / Desalination 238 (2009) 78–8986
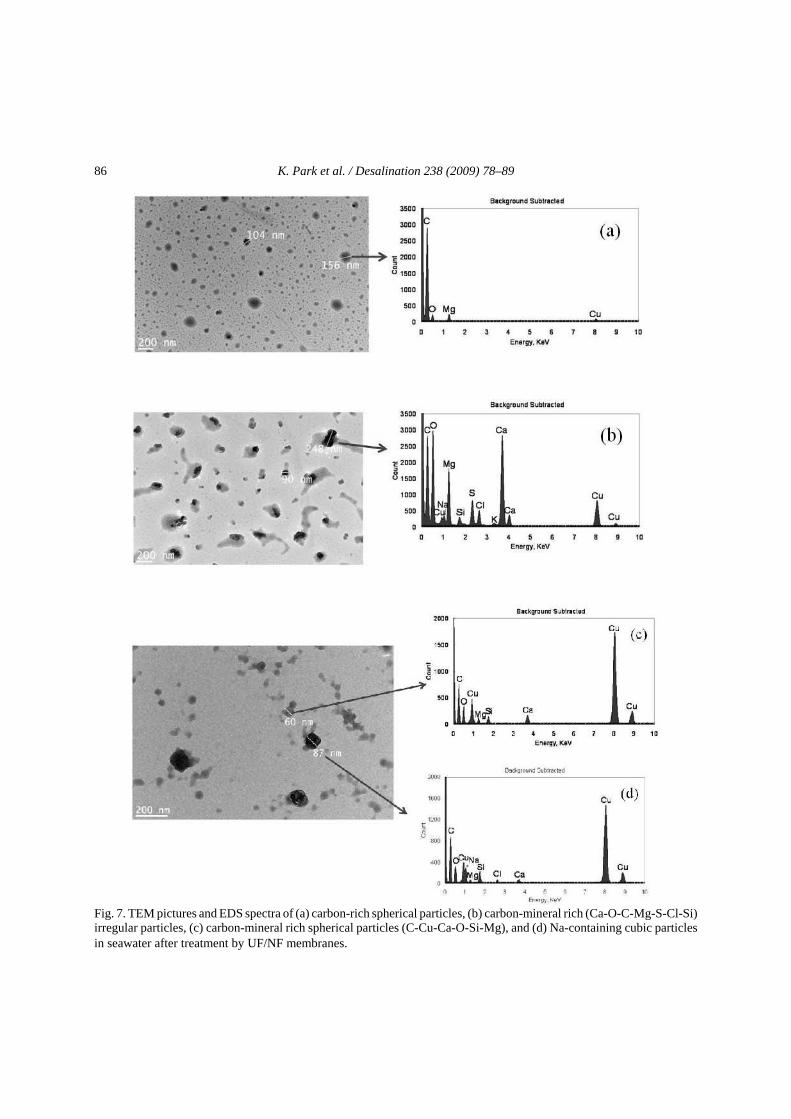
Fig. 7. TEM pictures and EDS spectra of (a) carbon-rich spherical particles, (b) carbon-mineral rich (Ca-O-C-Mg-S-Cl-Si)irregular particles, (c) carbon-mineral rich spherical particles (C-Cu-Ca-O-Si-Mg), and (d) Na-containing cubic particlesin seawater after treatment by UF/NF membranes.
K. Park et al. / Desalination 238 (2009) 78–89 87
filtration suggests that dissolved nanoparticlesthat survived through pre-filtration processes inthe desalination may contribute to the fouling inRO membrane. Particle number concentration andthe GMD with UF and NF filtration processes forseawater and river water were summarized inTable 2. The estimated fraction of dissolvednanoparticles in seawater that survived throughNF pre-filtration is 66% while that in river wateris 44%. Higher conductivity of seawater (~4.6×10⁴ µs/cm) (see Table 1) indicated the presence ofmore inorganic dissolved solids such as chloride,sulfate, and sodium, leading to higher fraction ofdissolved nanoparticles in seawater than riverwater.
Fig. 6(a) shows the TEM picture and EDSspectra of Ca-C rich nanoparticles included inYeongsan River water after treatment by the UFmembrane. We made TEM/EDS analysis forparticles completely dried out. These particles aremostly enriched by Ca and C as shown in theEDS spectra. We also observed particles that con-tain mostly carbon as shown in Fig. 6(b). Most ofthe particles in river water were classified intothese two types. The Ca-C rich particles would beCaCO3 mixtures while the carbon rich particlesmight be organic particles. We did not observe asignificant difference in particle morphologybetween the UF and NF treated river water. Fig. 7shows TEM images and EDS spectra of nano-particles observed in seawater after UF/NFfiltration. We classified them into four types ofnanoparticles based on particle morphology andelemental composition: carbon-rich sphericalparticles as shown in Fig. 7(a), carbon-mineralrich (Ca-O-C-Mg-S-Cl-Si) irregular particles asshown in Fig. 7(b), carbon-mineral rich sphericalparticles (C-Cu-Ca-O-Si-Mg) as shown inFig. 7(c), and Na-containing cubic particles asshown in Fig. 7(d). The presence of C, O, Na, Cu,Mg, Si, Ca, S, K, and Cl elements in seawaternanoparticles is similar to those of major seawaterparticles previously reported [24]. We also foundthat seawater filtered by UF membrane included
relatively more carbon-mineral rich irregularparticles [Fig. 7(b)] than that filtered by the NFmembrane. This suggests that this type of nano-particle was preferentially filtered out by the NFmembrane. Our TEM/EDS data suggest that asignificant amount of dissolved nanoparticlessurvived through UF and NF filtration, which isconsistent with our previous results for particlenumber size distribution, and that several types ofdissolved nanoparticles exist in the seawater.
4. Conclusions
We developed the new aerosolization methodcombined with the membrane filtration techniqueto determine size and number of suspended anddissolved nanoparticles of 20–600 nm in feedwater. Data for humic acid, CaCO3, and NaClnanoparticles with varying solute concentrations,and standard nanoparticles with a known size andnumber showed that the method can be used toquantify size and number of nanoparticles inwater. Measurements of size and number of par-ticles in several types of natural waters (seawater,waste water, and river water) were performed.Data showed that seawater had the highest par-ticle number concentration (~1.0×10⁷ particle/cm3) with the highest GMD of 129 nm while theYeongsan River water had the smallest concen-tration (1.7×10⁵ particle/cm3) with the smallestGMD of 84 nm in the particle size range of20–600 nm. The estimated fraction of dissolvednanoparticles in seawater that survived throughNF filtration is 66% while that in river water is44%. We found that a significant amount ofnanoparticles remained even after NF filtration,suggesting that dissolved nanoparticles thatsurvived through pre-filtration processes shouldaffect the fouling in RO membrane in thedesalination process. TEM/EDS analysis alsoshowed that a significant amount of dissolvednanoparticles survived through UF and NF filtra-tion and that distinct types of dissolved nano-particles exist in river water and seawater.
K. Park et al. / Desalination 238 (2009) 78–8988
Acknowledgements
The research described in this article wassupported by the Center for Seawater Desali-nation plant (B01-05-03) and partially supportedby the Korea Research Foundation Grant (KRF-2007-331-D00222) and the Korea Science andEngineering Foundation (KOSEF) (R01-2007-000-10391-0).
References
[1] S.G. Yiantsios, D. Sioutopoulos and A.J. Karabelas,Colloidal fouling of RO membranes: an overview ofkey issues and efforts to develop improved predictiontechniques, Desalination, 183 (2005) 257–272.
[2] C. Park, H. Kim, S. Hong and S.I. Choi, Variationand prediction of membrane fouling index undervarious feed water characteristics, J. Membr. Sci.,284 (2006) 248–254.
[3] J.C. Schippers and J. Verdouw, Modified FoulingIndex, a method of determining the fouling charac-teristics of water, Desalination, 32 (1980) 137–148.
[4] R.Y. Ning and T.L. Troyer, Colloidal fouling of ROmembranes following MF/UF in the reclamation ofmunicipal wastewater, Desalination, 208 (2007) 232–237.
[5] S. Sjogren, Hygroscopic growth and water uptakekinetics of two-phase aerosol particles consisting ofammonium sulfate, adipic and humic acid mixtures,J. Aerosol Sci., 38 (2007) 157–171.
[6] P.J. Ziemann, Evidence for low-volatility diacylperoxides as a nucleating agent and major componentof aerosol formed from reactions of O-3 withcyclohexene and homologous compounds, J. Phys.Chem. A, 106 (2002) 4390–4402.
[7] J.W. Kaakinen and C.D. Moody, Characteristics ofreverse osmosis membrane fouling at the YumaDesalting test facility, in: ACS Symp. Ser. No. 181,S. Sourirajan and T. Matsuura, eds., ReverseOsmosis and Desalination, Washington, DC, 1985,pp. 359–382.
[8] F.H. Butt, F. Rahman and U. Baduruthamal, Charac-terization of foulants by autopsy of RO desalinationmembranes, Desalination, 114 (1997) 51–64.
[9] J.A.M. van Paasen, J.C. Kruithof, S.M. Bakker and
F. Schoonenberg Kegel, Integrated multi-objectivemembrane systems for surface water treatment: pre-treatment of nanofiltration by riverbank filtration andconventional ground water treatment, Desalination,118 (1998) 239–248.
[10] J.C. Schippers, J.H. Hannemaayer, C.A. Smoldersand A. Kostense, Predicting flux decline in reverseosmosis membrane, Desalination, 38 (1981) 339–348.
[11] E. Alayemieka, S.H. Lee and J.G. Oh, Estimation ofcake formation on microfiltration membrane surfaceusing zeta potential, Kor. Soc. Environ. Eng., 11(2006) 201–207.
[12] J. Cho, Y.J. Park, H. Sun, S. Kim and Y. Yoon,Measurements of effective sizes and diffusivities ofnano-colloids and micro-particles, Coll. Surf. A–Physicochem. Eng. Aspects, 274 (2006) 43–47.
[13] T. Rameshwar, Determination of the size of water-soluble nanoparticles and quantum dots by field-flowfractionation, J. Nanosci. Nanotechnol., 6 (2006)2461–2467.
[14] B. Oktem, M.P. Tolocka and M.V. Johnston, On-lineanalysis of organic components in fine and ultrafineparticles by photoionization aerosol mass spectro-metry, Anal. Chem., 76 (2004) 253–261.
[15] R.A. Sperling, Size determination of (Bio)conjugatedwater-soluble colloidal nanoparticles: A comparisonof different techniques, J. Phys. Chem. C, 111 (2007)11552–11559.
[16] K. Suzuki, Characterisation of airborne particulatesand associated trace metals deposited on tree bark byICP-OES, ICP-MS, SEM-EDX and laser ablationICP-MS, Atmospheric Environment, 40 (2006)2626–2634.
[17] J.R. Lead, D. Muirhead and C.T. Gibson, Characteri-zation of freshwater natural aquatic colloids byatomic force microscopy (AFM), Eviron. Sci.Technol., 39 (2005) 6930–6936.
[18] D. Muirhead and J.R. Lead, Measurement of the sizeand structure of natural aquatic colloids in an urban-ised watershed by atomic force microscopy, Hydro-biologia, 494 (2003) 65–69.
[19] K.A. Ramirez-Aguilar, D.W. Lehmpuhl, A.E.Michel, J.W. Birks and K.L. Rowlen, Atomic forcemicroscopy for the analysis of environmental par-ticles, Ultramicroscopy, 77 (1999) 187–194.
[20] E.O. Knutson and K.T. Whitby, Aerosol classi-
K. Park et al. / Desalination 238 (2009) 78–89 89
fication by electric mobility: apparatus, theory, andapplications, J. Aerosol Sci., 6 (1975) 443–451.
[21] W.R. Bowen and T.A. Doneva, Atomic forcemicroscopy characterization of ultrafiltration mem-branes: Correspondence between surface pore dimen-sions and molecular weight cut-off, Surface InterfaceAnal., 29 (2000) 544–547.
[22] S. Singh, K.C. Khulbe, T. Matsuura and P.Ramamurthy, Membrane characterization by solutetransport and atomic force microscopy, J. Membr.Sci., 142 (1998) 111–127.
[23] N. Posfai, J.R. Anderson, P.R. Buseck and H.Sievering, Compositional variations of sea-salt-modeaerosol particles from the North Atlantic, J. Geophys.Res., 100 (1995) 23,063–23,074.
[24] J. Li, J.R. Anderson and P.R. Buseck, TEM study ofaerosol particles from clean and polluted marineboundary layers over the North Atlantic, J. Geophys.Res.–Atmospheres, 108 (2003) 4189–4202.


