Embed Size (px)
Citation preview
Fermi National Accelerator Laboratory
Measurement of the B+ and B” Meson Lifetimes
F. Abe et al The CDF Collaboration
Fermi National hcelerator Laboratory P.O. Box 500, Batavia, Illinois 60510
January 1994
Submitted to Physical Review Letters
0 Operated by UnivetsiCes Research Association Inc. under Contract No. DE-AC@76CH03000 with the United States Department of Energy
. Dmclaimer
This report was prepared as an account of work sponsored by an agency of the United States Government, Neither the United States Government nor any agency thereof, nor any of their employees, makes any warranty, express OF implied, OF assumes any legal liability or responsibility for the accuracy, completeness, OF usefulness of any information, apparatus, product, OF process disclosed, or represents that its use would not infringe privately owned Fights. Reference herein to any specifi! commercial product, process, or service by trade name, trademark, manufacturer, OF otherwise, does not necessarily constitute or imply its endorsement, recommendation, OF favoring by the United States Government or any agency thereof The views and opinions of authors expressed herein do not necessarily state or reflect those of the United States Government or any agency thereof.
CDF/PUB/BOTTOM/PUBLIC/2381 FERMILAB-PUB-94/034-E
Measurement of the B+ and B” Meson Lifetimes
F. Abe,13 M. Albrow, ’ D. Amidei,16 C. Anway-Wiese ,4 G. Apollinari,26 H. Areti, ’ P. Auchincloss,2s F. Asfar,
P. Asei,20 N. Bacchetta, I8 W. Badgett, I6 M. W. Bailey,24 J. Bao,33 P. de Barbaro,25 A. Barbaro-Galtieri,‘4
V. E. Barnes,24 B. A. Barnett, I2 P. Bartalini,23 G. Bauer, I5 T. Baumanqg F. Bedeschi,2” S. Behrendq2 S. Belforte,23
G. Bellettini,23 J. Bellinger,32 D. Beqjamin,“’ J. Benlloch,15 D. Bentoq21 A. Beretvaq7 J. P. Berge,’ A. Bhatti,2”
K. Biery, ” M. Binkley,7 F. Bird,28 D. BiseIlo,20 R. E. Blair, ’ C. Blocker ,28 A. Bodek,25 V. Bolognesi,23 D. Bortoletto,24
C. Boswell,‘2 T. Boulos, I4 G. Brandenburg, g E. Buckley-Geer,7 H. S. Budd,25 K. Burkett,” G. Busetto,20
A. Byon-Wagner,’ K. L. Byrum,’ C. Campagnari,7 M. Campbell,” A. Caner,7 W. Carithers,14 D. Carlsmith,
A. Castro,20 Y. Ceq2’ F. Cervel.li,23 J. Chapman, I6 G. Ch.iarelli,8 T. Chikamatsu,30 S. Cihangir,’ A. G. Clark,23
M. Cobal, M. Contreras,’ J. Cooper,’ M. Cordelli,s D. P. CoupaL2’ D. Crane,’ J. D. Cunningham,2 T. Daniels,”
F. DeJongh,’ S. Del.l’Agnello,23 M. Dell’Orso,23 L. Demortier,26 B. Denby, M. Deninno,3 P. F. Derwent,” T. Devlin,27
M. Dickson,25 S. Donati, 23 J. P. DOIIC,~~ R. B. Drucker,14 A. Dunn, l6 K. Einsweiler,14 J. E. Elias,7 R. Ely,14 E. En-
gels, Jr., 22 S. Eno,5 D. Errede,‘O S. Errede,‘O A. Etchegoyeq7“ Q. Fan,25 B. Farhat,15 I. Fiori,3 B. Flaugher,7
G. W. Foster,7 M. Franklin9 M. Frautschi,” J. Freeman,’ J. Friedman,” H. Frisch,5 A. Fry,28 T. A. Fuess,28
Y. Fukui,13 S. Funaki,30 G. Gagliardi,23 M. Gallinaro,20 A. F. Garfinkel,24 S. Geer,’ D. W. Gerdes,16 P. Giannetti,2”
N. Giokariq2” P. Girom.ini,s L. Gladney,21 D. Glensi.nski,12 M. Gold,r8 J. Gonsaleq2’ A. Gordon9 A. T. Goshaw,’
K. Goulianos, 26 H. Grassmann, 2E A. GrewaL2’ G. Grieco, 23 L. Groer,27 C. Grosso-Pilcher,’ C. Haber,14 S. R. Hahn7
R. Hamilton,g R. Handler,32 R. M. Hans,33 K. Hara,30 B. Harral,ll R. M. Harris,7 S. A. Hauger,(j J. Hauser,
C. Hawk,27 J. Heinrich,2’ D. Hennessy,’ R. Hollebeek,21 L. Holloway,” A. H&cher,” S. Hong,16 G. Houk,21 P. HU,~~
B. T. Huffman, R. Hugheq2’ P. Hurst,g J. Huston,17 J. Huth,7 J. Hylen,7 M. Incagli,23 J. Incandela, H. 1~0,~’
H. Jensen7 C. P. Jessop, ’ U. Joshi,’ R. W. Kadel,14 E. Kajfass,’ T. Kamon,2g T. Kaneko,30 D. A. Kardelis,”
H. Kasha, 33 Y. Kato,lg L. Keeble,2g R. D. Kennedy,17 R. Kephart,’ P. Kesten,14 D. Kestenbaum,g R. M. Keup,”
H. Keuteliaq7 F. Keyvan, 4 D. 8. Kim,’ H. S. Kim,*l S. B. Kim,16 S. H. Kim,3o Y. K. Kim,14 L. Kirsch,2
P. Koehn,25 K. Kondo,30 J. Konigsberg,g S. Kop~,~ K. Kordas,l ’ W. Ko~ka,~ E. KOVBCS,~~ M. Krasberg, l6 J. Kroll,‘l
M. Kruse,24 S. E. Kuhlmann,’ E. Kuns,27 A. T. Laasanen,24 S. Lammel, J. I. Lamoureux,32 T. LeCompte,”
S. Leone,23 J. D. Lewiq7 P. Limon ,’ M. Lindgreq4 T. M. Liss,lO N. Lockyer,21 0. Long,21 M. Loreti,20 E. H. Low,”
D. Lucchesi,23 C. B. Lu~hini,‘~ P. Lukens,’ P. Maas, K. Maeshima,7 A. Maghakian,26 M. Mangano,23 J. Mansour,“l
Submitted to Physical Review Letters January 25, 1994.
1
M. Mariotti,‘” J. P. Marriner,7 A. MartinlO J. A. J. Matthews,‘s R. Mattingly,’ P. McIntyre,” P. Melese,26
A. Mensione,23 E. Meschi, 23 G. MichaiLs S. Mikamo,13 M. Miller,’ T. Mimashi,30 S. Miscetti,s M. Mishina,13
H. Mitsushio,“’ S. Miyashits,30 Y. Morita,13 S. Moulding,26 J. Muell~r,~~ A. Mukherjee,’ T. Mull~r,~ P. Musgrave,”
L. F. Nakae,” I. Nakano, ” C. Nelsoq7 D. Neuberger, 4 C. Newman-Holmes,’ L. Nodulman,’ S. Ogawa13’ K. E. Ohl,‘3s3
R. Oishi,“” T. Okusawa, Is C. Pagliarone, 23 R. Paoletti,23 V. Papadimitriou, ‘I S. Park,’ J. Patrick,7 G. Pauletta,23
L. Pescara,” M. D. Peters, ‘4 T. J. Phillips,’ G. Piacentino,3 M. Pillai,25 R. Plunkett,’ L. Pondrom,32 N. Produit,‘4
J. Proudfoot,’ F. Ptohos,’ G. Punsi,‘” K. Ragan,” F. Rimondi,3 L. Ristori,23 M. Roach-Bellino,31 W. J. Robertson,’
T. Rodrigo,’ J. Romano,5 L. Rosenson, W. K. Sakumoto,25 D. Saltsberg,’ A. Sansoni,* V. Scarpine,” A. Schindler,14
P. Schlabach,’ E. E. Schmidt,7 M. P. Schmidt,“” 0. Schneider,” G. F. Sciacca,23 A. Scribano,23 S. Segler,7 S. Seidel,”
Y. Seiya, 3o G. Sganos, l1 M. Shapiro,14 N. M. Shaw,24 Q. Shen,24 P. F. Shepard,” M. Shiiojima,30 M. Shochet,’
J. Siegrist,28 A. Sill,‘” P. Sinervo,” P. Singh,22 J. Skarha, I2 K. Sliwa,3’ D. A. Smith,23 F. D. Snider,i2 L. Song,7
T. Song,16 J. Spalding,7 P. Sphi~as,‘~ A. Spies,” L. Stanco,20 J. Steele,32 A. Stefanini,23 K. Strahl,” J. Strait,’
G. Sullivan,5 K. Sumorok,‘5 R. L. Swarts, Jr.,l’ T. Takahashi,ls K. Takikawa,30 F. Tartarelhz3 Y. Teramoto,”
S. Tether,‘” D. Theriot, J. Thomaq2s R. Thun,” M. Timko,31 P. Tipton, A. Titov,26 S. Tk.acsyk,7 A. Tollestrup,7
J. Tom&on,” J. F. de Troc~nis,~ J. Tseng,‘l M. Turcotte,28 N. Tnrini,3 N. Uemura,30 F. Ukegawa,” G. Unal,”
S. Vejcik, III, l6 R. VidaL7 M. Vondracek,‘O R. G. Wagner,’ R. L. Wagner,’ N. Waiuer,7 R. C. Walker,25 J. Wang,5
Q. F. Wang,26 A. Warburton,” G. Watts,25 T. Watts,27 R. Webb,2s C. Wendt,32 H. Wensel,14 W. C. Wester, 111,14
T. Westhusing,” A. B. Wicklund,’ E. Wicklund, R. Wilkinsoqzl H. H. Williams,2* P. Wilson,’ B. L. Winer,*’
J. Wolinski,2g D. Y. WU,‘~ X. Wqz3 J. W~SS,~~ A. Yagil,’ W. Yao,14 K. Yasu~ka,~~ Y. Ye,l’ G. P. Yeh,’ M. Yin,’
J . Yoh,’ T. Yoshida,‘g D. Yovanovitch,7 I. Yu,~~ J. C. Yuq7 A. Zanetti,23 F. Zetti,23 S. Zhang,” W. Zhang,2 ’ and
S. Zucchelli”
(CDF Collaboration)
’ Argonne National Laboratory, Aqonnc, Illinoir SO@9
’ Bmndeir Ilnirerriiy, Waliham, hfa#rachweiie 02254
3 Istihto Nazionale di Firica Nuclean, Unirerrity of Bologna, I-40126 Bologna, Italy
4 Univerrily of Co&main al ,508 Angelcr, Lor Angeles, California 90024
’ University of Chicago, Chicago, Illinois 60657
’ Duke Unirerrily, Durham, North Carolina 27708
2
’ Fermi National Accelemtor Laboratory, Batavia, Illinois 60510
’ Labomtori Nazionali di Fmrcati, lrtituto Nazionale di Fisica Nuclear, 1-000~~ Fmscaii, Italy
’ Howard University, Cambridge, Marsachuselts 02138
lo University of Illinois, Urbana, Illinois 61801
” Instituie of Particle Phyricr, McGill Unioctsity, Montreal HSA 2T8, and University of Toronto,
Toronto MsS lA7, Canada
” The Johns Hopkins Uniwcrrity, Baltimon, Mawland 21218
” National Labomiorg for High Energy Phyoicr (KEK), Tsukuba, Ibamki SO5, Japan
l4 Lawrence Berkeley Labomloty, Berkeley, California 94720
l5 Maasachusctis Inrtiiuie of Technology, Cambridge, Marrachuretts 02139
I6 Univemity of Michigan, Ann Arbor, Michigan 46109
I7 Michigan State Univezrity, Earl Loanring, Michigan 48824
” Unioesaity of New Medico, Albuqueque, New Men’co 87131
ls Osaka City Uniwerrity, Osaka 588, Japan
” Univeraito di Padova, lnrtituto Nazionale di Fi&za Nucleaan, S&one di Padova, I-55131 Padooa, Italy
*’ Universiiy of Pennsylvania, Philadelphia, Pennrylrania 19104
22 Unirerrity of Pittaburglr, Pittabu+8h, Pennrylvania 15260
23 Isfituto Nazionalc di Fisica Nuclcan, University and Scuola Normale Superion of Pisa, l-56100 Piea, Italy
24 Purdue Unioersity, West Lofoyette, Indiana 47907
” Univemity of Rochester, Rochcrte+, New Yott 14627
26 Rockejelles Unicremity, New York, New York 10021
27 Rutgers University, Pircataway, New Jerrcy OS854
” Superconduciing Super Collider Labomtory, Dallas, Texas 75237
2s Ttzar AbM Unirereiiy, College Station, Tezas 7784s
3o Uniwerrity of Taukuba, T~ukrba, Ibamki 305, Japan
31 Tuftr Uniretrity, Medfoni, Marrachuaettr 02155
32 Univerrily of Wisconrin, Madiron, Wirconrin 55706
33 Yale University, New Haven, Connecticut 06511
(Received DATE)
3
The lifetimes of the B+ and B” mesons have been measured using fully reconstructed decays. In a
sample of - 49600 J/$ + pfp- decays recorded with the Collider Detector at Fermilab, 146 f 16
B+ and 121 f 16 B” mesons have been reconstructed using the silicon vertex detector. Unbinned
likelihood fits to the proper lifetime distributions of these B mesons give T+ = 1.61 f 0.16 (stat) 3~
0.05 (sys) ps, To = 1.57 ZJI 0.16 (stat) f 0.06 (sys) ps, and r+/r” = 1.02 zt 0.16 (stat) f 0.05 (sys).
PACS numbers: 13.25.+m, 14.40.J~
Recently, precision measurements of the average bhadron lifetime have been made [1,2]. When combined with a
partial decay width and a theoretical model of B decay, such measurements can be used to calculate the Cabibbo-
Kobayashi-Maskawa matrix element lVcbl [3]. The simplest B decay model is the spectator model, which predicts
equal charged and neutral J3 meson lifetimes. Although deviations from the spectator model are large in the charm
sector, calculations of the B+/B’ lifetime ratio that include non-spectator diagrams predict T+/T” to be equal to 1.0
within lo-20% [4].
Measurements of r+ and r” have been made at PEP and LEP using partially reconstructed decays containing a
lepton and a @ or D*- [5]. Indirect measurements have also been made by CLEO and ARGUS, using the ratio
of the B+ and B” semileptonic branching ratios [6]. We present here a measurement of the T+ and TO using fully
reconstructed decays of the form B + 9K, where \E represents a J/$J or +(2S) and K represents a K+, X*(892)+, Ki,
or K”(892)’ . This is the first high statistics measurement of B meson lifetimes performed using fully reconstructed
decays. Throughout this paper, references to a specific charge state imply the charge-conjugate state as well.
The data used in this analysis were collected by the Collider Detector at Fermilab*(CDF) during 1992-1993. The
data sample corresponds to an integrated luminosity of - 22.4 pb-’ of pis collisions at a center-of-mass energy of 1.8
TeV. The CDF detector has been described in detail elsewhere [7]. The main detector systems used for this analysis
are the silicon vertex detector (SVX), the central tracking chamber (CTC) and the muon system. The SVX and
CTC are located in a 1.4 T solenoidal magnetic field. The SVX consists of 4 layers of silicon strip detectors with r-4
readout, including pulse height information [8]. The pitch between readout strips is 60 pm (55 pm) on the 3 inner
(1 outer) layers. A spatial resolution of 13 pm has been obtained. The first measurement plane is located 3 cm from
the interaction point, leading to an impact parameter resolution of (13 + 40/m) pm, where pr is the momentum
transverse to the beam direction (measured in GeV/c). The transverse profile of the beam is circular and has an rms
4
of - 40 pm, while the longitudinal beam sise is - 30 cm. The CTC is a cylindrical drift chamber containing 64 layers,
which are grouped into alternating axial and stereo superlayers containing 12 and 6 layers respectively. The combined
CTC/SVX pr resolution is dpr/b = [(0.0009py)2 + (0.0066)*]*. Th e central muon system consists of three detector
elements. The Central Muon Chambers (CMU), located behind - 5 interaction lengths (A,) of material, provide
muon identification over 65% of 4 for the pseudorapidity range ]q] 5 0.6, where 51 = - In[tan(6/2)]. This q region
is further instrumented by the Central Muon Upgrade (CMP), located after - 8 AI. The central muon extension
(CMX), which covers the pseudorapidity range 0.6 < IT]/ < 1.0, provides muon identification over 67% of the asimuth
and is located behind - 6 A,. The dimuon trigger used for this analysis is described in Reference [2].
Muons for reconstruction of J/$ candidates are selected using the following criteria: 1) The difference in the distance
in the transverse plane between the track in the muon chamber and the extrapolated CTC track is required to be less
than 3a, where Q is calculated using the quadratic sum of the multiple scattering and measurement uncertainties. For
muons in the CMU, where the z position is measured, the 3a matching requirement is also made in the longitudinal
view. 2) The energy deposited in the hadronic calorimeter by each muon is required to be greater than 0.1 GeV,
indicating the presence of a track. 3) The reconstructed pr of at least one of the muon tracks is required to be > 2.5
GeV/c.
To insure that the decay point of the B meson is well measured, the following quality cuts are applied: 1) each track
must contain at least 2 CTC axial superlayers each of which must have at least 5 hit layers; 2) each track must contain
at least 2 CTC stereo superlayers each of which must have at least 2 hit layers; 3) both muons must be reconstructed
in the SVX.
The invariant mass for oppositely charged dirnuon candidates obtained with these cuts has been calculated after
constraining the two tracks to come from a common point in space (“vertex constraint”). The total number of events
in the signal region (defined as 1t80 MeV/cZ from the world average value of the .7/$ mass [9]) is 58338. The number
of J/1/ candidates after background subtraction is 49630 f 260.
Using this J/lr, sample, we ba:e searched for the decay $(ZS) -+ J/+z+z-. To improve the mass resolution, the
four tracks are vertex constrained and the dimuon mass is simultaneously constrained to the world average J/lc, mass.
Combinations where the fit x2 corresponds to a confidence level of less than 1% are rejected. Within a mass window
of A120 MeV/c2 of the world average $(2S) mass [911 we obtain a total of 764f53 events after background subtraction.
Kz candidates are selected by requiring two oppositely charged tracks with impact parameters with respect to the
primary vertex of at least 2a, where u is the quadratic sum of the measurement error on the impact parameter and
5
the sise of the beam spot. The Kz candidate is required to have a positive decay length with respect to the J/lr,
vertex, and its impact parameter (computed as the minimum distance in the transverse plane between the K$ tlight
path and the .I/$ vertex) is required to be less than 2 mm. Combinations with a mass more than 20 MeV/c2 from
the world average Kz mass [S] are rejected.
B candidates are reconstructed by combining a q candidate either with a track (assumed to be a K+), or with a
K$ candidate plus a track (assumed to be a s+) forming a K’(892)+ candidate, or with a K$ candidate, or with
two oppositely charged tracks (assumed to be a K+ and a X-) forming a K’(892)’ candidate. The J/$ and $(2S)
candidates are mass constrained and all tracks (except Kz decay products) are constrained to come from a single
vertex. Kz decay products are mass and vertex constrained and the KS is constrained to point to the B decay vertex.
Combinations where the K‘(892) mass is more than 80 MeV/c’ from the world average mass [9] are rejected. In all
cases, the fit is required to have a x2 which corresponds to a confidence level of better than 1%.
Cuts on the B meson and K pi are optimised to give the smallest statistical uncertainty on the number of B mesons
after background subtraction. A Monte Carlo simulation is used to model the signal coming from B meson decays,
while data in the sidebands of the invariant mass distributions are used to determine the number of background
events. The pr cuts obtained by this proceedure are not strongly decay-mode dependent. We therefore use the same
selection criteria for all channels: pr(B) > 6.0 GeV/c and m(K) > 1.25 GeV/c.
The reconstruction is applied to all possible track combinations, allowing the same J/$ to be used for more than
one B candidate. Since such duplicate events could bias the lifetime measurement, we choose only one candidate per
event in a f120 MeV/c’ window around the world average B mass [9]. First, for duplicate candidates arising from the
ambiguity of the mass assigned to the two tracks forming the K*(892)O, only the candidate with .the Kx or IRK mass
assignment closest to the world average K’(892)O mass is kept; this choice decreases the number of B” candidates by
- 30%. Then, among the remaining candidates in the mass window, we choose the one with the highest confidence
level returned by the fit described above.
The upper plots in Figure 1 show the invariant mass distributions of all Bt and B” candidates. Background in
these distributions comes from combinations of J/$‘s with tracks produced during the bquark fragmentation or with
other remnants of the ~$5 collision. These tracks should reconstruct to the primary vertex. Thus the background is
largest for events where the decay distance is small. This fact is demonstrated in the lower plots of Figure 1.
We define the B signal region of the invariant mass distribution to be the region within f30 MeV/c* of the world
average B mass. Sideband regions, used to determine the shape of the background under the mass peak, are defined
6
to have invariant mass between 60 and I20 MeV/c’ from the world average B mass. These sidebands have been
chosen to exclude the regions where B 4 \kKz events are kinematically allowed.
The technique used to measure the B+ and B” lifetimes is similar to the one used by CDF to measure the average
B lifetime [2]. For each B candidate, the two dimensional decay distance L,, is calculated as the projection of the
vector 3 pointing from the primary to the secondary vertex onto the transverse momentum of the B candidate. Since
the momentum of the B meson is known, the proper decay length CT can be determined:
CT +!$“.g$$..
The primary vertex position is approximated by the mean beam position, determined run-by-run using SVX infor-
mation and averaging over many events. We choose not to measure the primary vertex event-by-event because the
presence of a second b quark coupled with the low multiplicity in the J/4 events can lead to a systematic bias in the
lifetime. This technique would not improve the statistical uncertainty of the measurement significantly.
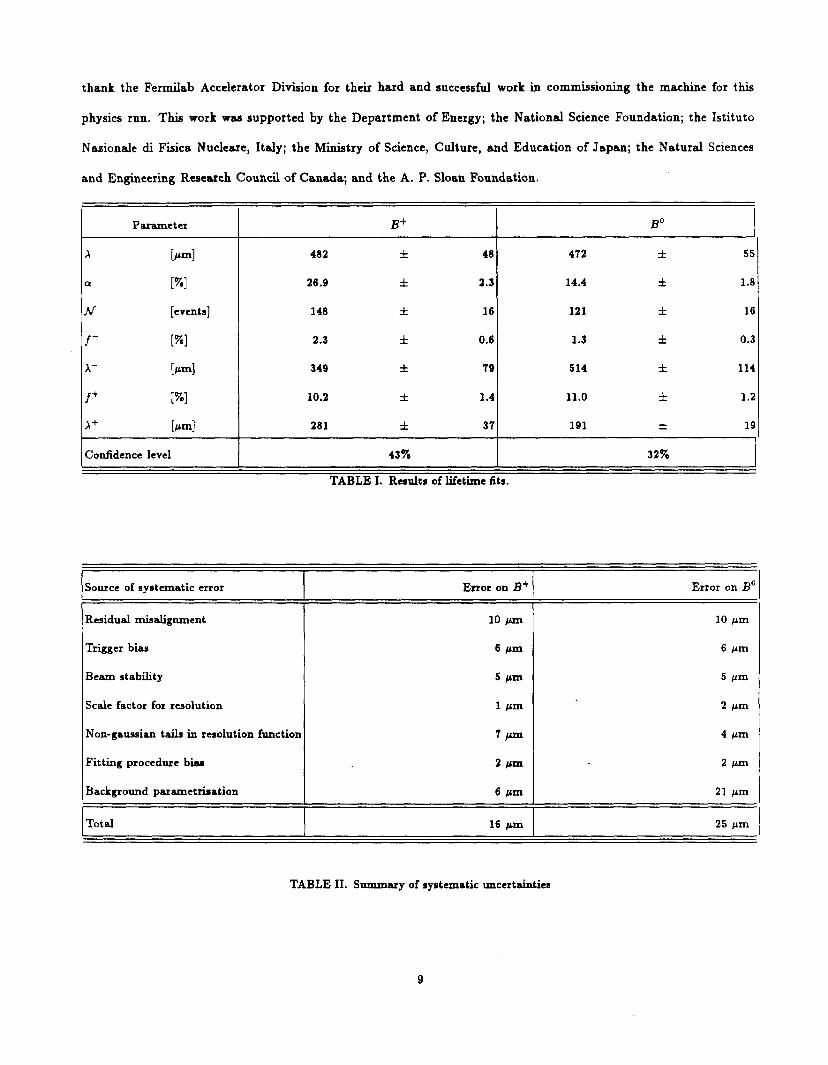
The lifetimes of the B+ and B” are obtained by performing separate unbinned maximum likelihood fits to the CT
distributions of the charged and neutral event samples. For each sample, the fit is made simultaneously to the signal
and sideband distributions. The number of background events in the peak region is constrained to be equal, within
Poisson fluctuations, to the number of events in the normalined sideband distribution. The fits, which are shown in
Figure 2 and summarised in Table I, are performed under the following assumptions:
l The signal region contains both signal and background events. The proper decay lengths of the signal events
are distributed according to an exponential function convoluted with a Gaussian resolution function. The slope
of the exponential (A) is the proper decay length to be measured. The Gaussian resolution for each event is the
measurement error on CT. The fit parameter o gives the fraction of signal events in the peak region while N
gives the number of signal events.
l Background events in the signal region are assumed to have the same cr distribution as the events in the
sideband region. The proper decay lengths of the background events are distributed according to the sum of a
Gaussian resolution function and two exponential tails, where the exponentials are used to model the positive
and negative lifetime tails [2]. The fit parameters ft and f- are the fraction of background events in the
positive-side and negative-side exponentials, while A+ and A- are the exponential slopes.
Estimates of the systematic uncertainties on the lifetime measurements are listed in Table II. The uncertainties
7
due to residual misalignment, trigger bias, and movement of the beam-spot within a single run are determined in the
same manner as Reference [2] and are completely correlated in the Bt and B” lifetime measurements. The result
of the m&mum likelihood fit depends on the decay-length error calculated for each event. We have varied these
errors by a common scale factor which is allowed to float in the fit; this variation changes the proper decay length by
< 2 pm. The effect of non-gaussian tails in the resolution function has been studied by including exponential tails in
the fit and allowing both the slope and normalisation of these tails to vary freely. This study yields a 7 pm (4 pm)
uncertainty in the proper decay length of the Bt (BO). FI om studies using event samples generated with a Monte
Carlo technique, we determine that the fitting procedure biases the lifetime measurements by 5 2 km.
An additional source of uncertainty on this measurement comes from the modeling of the background CT distribution.
Although the confidence levels of the fits are adequate (Table I), we estimate the systematic uncertainty associated
with the choice of parameterisation by comparing the fitted lifetime to that obtained if an extreme model of the
background shape is used. We add to the background ,parameterisation a flat component in the range 0 < CT < 0.2
cm. The normalisation of this flat component is allowed to vary in the fit. Based on this study, we assign a systematic
uncertainty of 6 pm (21 pm) to the B+ (B”) proper decay length due to uncertainties in the shape of the background
distribution.
Combining the above sources of uncertainty in quadrature, we estimate a systematic uncertainty of 16 pm (25 pm)
on the Bt (B’) mean decay length. When calculating the uncertainty on the lifetime ratio, we remove the correlated
systematic uncertainties indicated above. The final results are:
r+ = 1.6i f 0.16 (stat) rf: 0.05 (sys) ps
TO = 1.57 f 0.18 (stat) f 0.08 (sys) ps
rt/7’ = 1.02 f 0.16 (stat) k 0.05 (sys)
These measurements are consistent with those presented in References [5] and [6], but have a smaller uncertainty.
They are also consistent with recent measurements of the average bhadron lifetime (1.49 f 0.038 ps) [ll].
The measurement of 7’ can be combined with CLEO measurements of the q2 dependence of the partial width for
B” - D*--!+v~ to extract a value of lVcal [lo]. Using the method and results of Reference [12] and the value of 7’
quoted here, we find l&al = (36 f 5 & 4) x 10e3. Using our measurement of TO, there is no increase in the overall
error on lVct,l and any systematic uncertainty associated with using the inclusive lifetime is eliminated.
We thank the CDF technical support staff at all CDF institutions for their hard work and dedication. We also
8
thank the Fermilab Accelerator Division for their hard and successful work in commissioning the machine for this
physics run. This work was supported by the Department of Energy; the National Science Foundation; the Istituto
Nasionale di Fisica Nucleare, Italy; the Ministry of Science, Culture, and Education of Japan; the Natural Sciences
and Engineering Research Council of Canada; and the A. P. Sloan Foundation.
Parameter
A bml P PI
M [events]
f- PI
A- bd
f+ PI
x+ bl
Confidence level
B+
482 f 48
26.9 f 2.3
148 f 16
2.3 l 0.6
349 f 79 10.2 i 1.4
281 l 37
43%
TABLE I. Results of lifetime fits.
B0
472 * 55
14.4 f 1.8
121 f 16
1.3 f 0.3
514 f 114
11.0 It 1.2
191 * 19
32%
Source of systematic error
Residual misalignment
Bigger bias
Beam stability
Scale factor for resolution
Non-gaussian taih in resolution fimctior
Fitting procedure bias
Background parametrisation
Error on B+ Error on Ba
10 pm
6 pm
5 pm
1 ccm
7 ,p
2Icm
6 wn
10 pm
6 fim
5 pm
2 pm
4 pm
2 Pm
21 pm
25 pm Total 16 Nrn
TABLE II. Summary of systematic uncertainties
9
(b) Visitor.
[l] P. Abreu et al. Z. Phys. C 68 567 (1992); B. Ad eve et al. Phys. Lett B 270 111 (1992); 0. Adriani et al. Phys. L&t.
B 817 (1993) 474; P.D. Acton et al. Phys. Lett. B 274 513 (1992); D. Buskuli c et al. Phys. Lett. B 295 (1992) 174; D.
Buskulic et al. Phya. Lett. B 314 (1993) 459; P.D. Acton et al. CERN-PPE/93-92, submitted to Z. Phys. C.
[2] F. Abe et al. Phys. Rev. Lett. 71 3421 (1993).
[3] D. Besson, Recent Bottom Phydicd Rerub from Thredhold Machined, to be published in the Proceedings of the 1993
Lepton-Photon Conference, August 1993, Ithaca, New York.
[4] M.B. Voloshin and M.A. Sh&uan, Sov. Phys. JETP 64 698 (1986); G. Altarelli and S. Petrarca, Phys. Lett. B 261 303
(1991); I. Bigi and N. Uraltsev, Phys. Lett. B 280 271 (1992).
[S] S. Wagner et al. Phys. Rev. Lett. 64 1095 (1990); P. Abreu et al. Z. Phys. C 67 161 (1993); D. Buskuhc et al. Phys. Lett.
B 297 449 (1992); D. Bu&uIi~ et al. Phys. Lett. B SO7 194 (1993); D. BuskuIic et al. Phys. Lett. B 314 459 (1993); P.D.
Acton et al. Phys. Lett. B $07 247 (1993).
[6] H. Albrecht et al. Phys. Lett. B 275 195 (1992); R. F&on et al. Phys. Rev. D 43 236 (1991); M. Artuso et al. A Mea-
surement of the Charged and Neutral B Meron Lifetime Ratio, contributed paper to the 1993 Lepton-Photon Conference,
August 1993, Ithaca, New York.
[7] F. Abe et al. Nucl. Inst. and Meth. A271 387 (1988) and references therein.
[8] D. Amidei et al. FERMILAB PUB-94/024/E, to be published in Nud. Itut. and Meth.; B. Barnett et al. Nucl. Inst. and
Meth. A Sl5 125 (1992); 0. Schneider et al. Proceedings of the 7’h Meeting of the American Physical Society, Division of *. .a
Particles and Fields, Fermilab, Nov 1992, World Scientific Press, 1743.
[9] Particle Data Group, K. Hikasa et al. Phys. Rev D45 (1992).
[lo] M. Neubert, Phys. Lett. B 264 455 (1991).
[ll] W. Venus, Recent Redultd on Bottom Phydicd aboae Threrhold, to be published in the proceedings of the 1993 Lepton-Photon
10
Conference, August, 1993, Ithaca, New York.
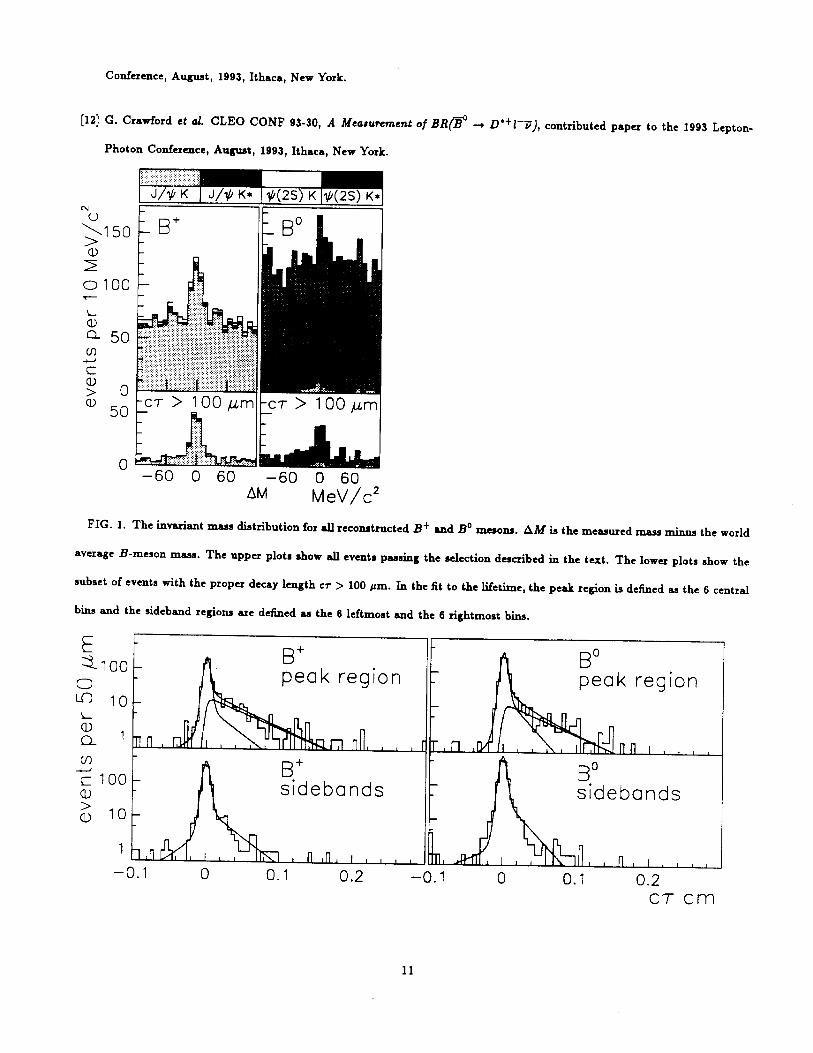
G. Crawford et al. CLEO CONF 93-30, A Measurement of BR@ -+ D’+l-D), contributed paper to the 1993 Lepton-
Photon Conference, August, 1993, Ithaca, New York.
FIG. 1. The invariant maas distribution for all reconstructed Bt and B” mesons. AM is the measured mass minm the world
average B-meson mass. The upper plots show all events passing the selection described in the text. The lower plots show the
subset of events with the proper decay length CT > 100 pm. Jn the fit to the lifetime, the peak region is defined as the 6 central
bins and the sideband regions are defined as the 6 leftmost and the 6 rightmost bins.
c7- cm
11

FIG. 2. The CT distributions of all reconstructed Bt and Ba mesons. The upper (lower) hintograms show the peak (sideband)
region distributions. The fist (last) b’ m of each histogram shows the number of underflow (overflow) events. The superimposed
curves are the contribution fkom the signal, the background and their sum, as determined from the likelihood fit described in
the text.
12


