Embed Size (px)
Citation preview
Measurement of Water Transport from Saturated PumiceAggregates to Hardening Cement Paste
by
Pietro Lura 1 , Dale P. Bentz 2, David A. Lange 3, Konstantin Kovler 4, Arnon Bentur 4, andKlaas van Breugel 5
Department of Civil Engineering 1Technical University of DenmarkBrovej - Building 118, 2800 Kgs.
Lyngby, Denmark
Building and Fire Research Laboratory 2National Institute of Standards and Technology
Gaithersburg, MD 20899 USA
University of Illinois at Urbana-Champaign 3Urbana, IL
Technion - Israel Institute of Technology 4Haifa, Israel
Delft University of Technology 5Delft, The Netherlands
Reprinted from the Advances in Cement and Concrete. Proceedings. EngineeringConferences International. Copper Mountain, CO, August 10-14, 2003, 89-99 pp., 2003.
NOTE: This paper is a contribution of the National Institute of Standards andTechnology and is not subject to copyright.
~.dvances in Cement andConcTEtf
MEASUREMENT OF WATER TRANSPORT FROM SATURATEDFUMICE AGGREGATES TO HARDENING CEMENT PASTE
Pietro Lura " Dale P. Bentz", David A. LangeO,
Konstantin Kovler-, Arnon BentuT' and Klaas van Breugel'1) Department of Civil Engineering, Technical University of Denmark, Brovej -Building 118, 2800
Kgs. Lyngby, Denmark2) Nationallnstifute of Standards and Technology, G8ithersburg (MD), USA
3) University of Illinois at Urban8-Champaign, USA') Technion -Israel Institute of Technology, Haifa, Israel') Delft University of Technology, Delft, The Netherlands
ABsmACT
In this study about internal curing of High Performance Concrete, X-ray absorption showed thatconsiderable transport of water from saturated lightweight aggregates (pumice) to hydratingcement paste [water/cement (w/c) ratio 0.3] took place in the first days after casting and covereda distance of at least 4 mm. As a consequence, the amount of water released by the lightweightaggregates, rather than the spatial distribution of the aggregates, is in this case the crucial factor
to avoid early-age self-desiccation shrinkage.
INTRODUCTlON
High strength cementitious materials are characterized by superior propenies in the hardenedstate. Yet, their application encounters some difficulties, in panicular due to sensitivity to early-age cracking, which is associated with sell-desiccation and autogenous shrinkagle (1).Conventional curing techniques are not always effective in eliminating cracking, since the water
migration into the concrete is limited by the tightness of the cement paste (2).
An effective strategy to overcome this problem is the use of pre-soaked lightweight aggr'"gates(LWA) as internal water reservoirs. Several investigators have explored this concept in the Ilast 10years (~). These studies inve~tigated the effects on the reduction of autogenous shrinkage ofthe replacement level of normal weight coarse aggregates by saturated LWA and of the de!~ree of
water saturation of the LWA.
Other studies focused on the mechanisms of internal curing, pointing out that, in order to avoidself-desiccation, the amount of entrained water srould equal the volume of chemical shrink.age ofthe cement paste (.2). Moreover, the spatial distribution of the 'water reservoirs' in the mi~'Iure isconsidered of primary importance in the internal curing process. The distance of the sa1turatedLWA from the point in the cement paste where the relative humidity drop takes place determinesthe efficiency of the internal curing. The maximum transport distance of water. as a conse<juenceof the depercolalion of Ihe pores in a low w/c ratio paste, was eslimated as few hundreds ofmicromelers at laler ages (2). With water-reservoirs well distributed within the matrix, shorterdistances have 10 be covered and the efficiency of the irnernal-curing process is increased.According to these considerations, a novel concept in internal curing is based on dispersing,cvery5mall, saturated LWA throughout the concrete, which will serve as tiny reservoirs with sLlfficient
Advances in Cement and ConcretE
water in them to compensate for se"-desiccation. The spacing between the particles will besufficiently small so that the water they supply will not have to diffuse/percolate over a largedistance to counteract se"-desiccation. The reservoir of water in the LWA could therefore be'kept10 a Illinimum, thus economizing on the content and porosity of the LWA (~). In theseconditions, determination of the distance the water in the LWA can cover in the hydrating cementpaste LJecollles a factor of paramount importance to improve the effectiveness of internal curing.
In this study. the X-ray prolile 01 a sandwich specimen composed 01 saturated pumice and freshcernent paste vo/as measured as a function 01 hydration time with the GNI X-ray System') (1.0.).Changes in the X-ray counts measured by a detector are related to changes in density of themedium through which the X-rays are traveling (11), higher counts being m~asured for lowerdensilies. In Ihis case, Ihe moislure Iranspon from the pumice to the hardening cement pasteshould result in an increase of counts in the pumice, which is losing moisture, and a decrease 01counls in the cement paste. In past research, the X-ray system had been used to measure dryingprofiles of cemenl pasle al early ages (~. Also transport 01 waler Irom high to low w/c: ratiopastes was delected (1.4). In these studies, water was observed to easily migrate over distancesof 5 mm and more during the drying 01 tresh cemenl paste (12:1-4). Moreover, transpon of walerfrom super-absorbent polymers to cement paste was measured (15).
MATERIALS
Pumice
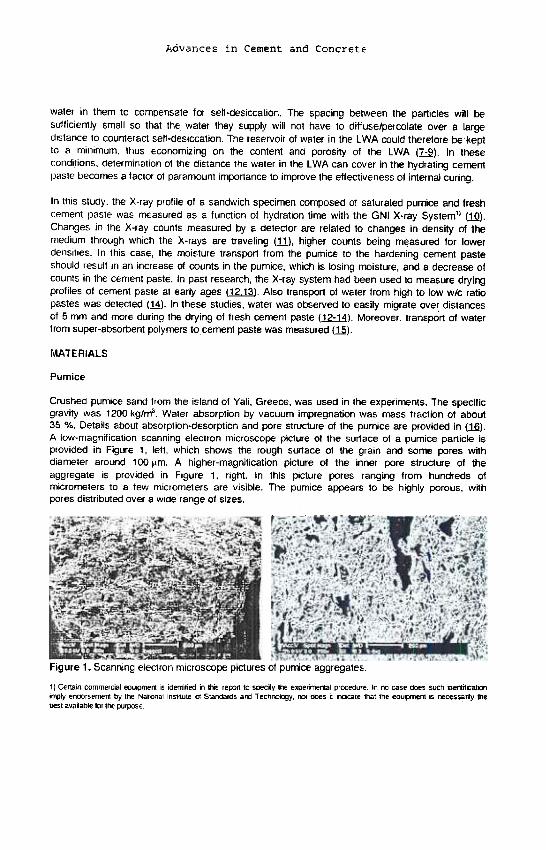
Crushed pumice sand from the island of Yali, Greece, was used in the experimerlts. The specificgravity was 1200 kg/mo. Water absorption by vacuum impregnation was mass fraction of about35 %. Details aboU1 absorpfion-desorpfion and pore sfructure of the pumice are provided in (1.6.).A low-magnification scanning electron microscope picture of the sur1ace of a pumice particle isprovided in Figure 1, left, which shows the rough sur1ace of the grain and some pore~; withdiameter around 1 00 ~m. A higher-magnification picture of the inner pore structure Clf theaggregate is provided in Figure 1, right. In this picture pores ranging from hundrecis ofmicrometers to a few micrometers are visible. The pumice appears to be highly porous, withpores distribU1ed over a wide range of sizes.
",,",::~:;';.--"'-".;""". ~
Figure 1. Scanning eleclron microscope pictures of pumice aggregale5.
') Genain commercial ecu~me" i, identified OJ this re~n 10 specly the experimental procedure In no case Ooes such denlili:atiooin1)ly enQorsemenl by the Nafional Institute 01 Standards and TechrolC'JY. ~ does I Old,cate that the equ~nlenl is necessari~ thebest available lor the purposE
Advances in Cement and Concret
Cement paste
The cement paste used was made with Portland cement, CCRL Cement 135 (17.). and had a wlcratio of 0.3. The Blaine fineness of the cement was 394 m2/kg. For Cement 135, a large amountof experimental and numerical simulation data about hydration was available (1L1.6).
METHODS
X-ray absorption measurements
Large flat pumice grains were selected from the largesl fraction of the aggregate (> 4,75 mm). Toobtain a flat and smooth interface with the paste, the aggregates were polished with sandpaper toobtain prisms, 10 mm x 4 mm x 2 mm. The L WA were cleaned by uhrasound in ultra-pure waterfor 1 min to remove any dust produced by the polishing. Aggregates were then vacuum driecl andweighed. Subsequenfly, they were evacuated under high vacuum and impregnated with di!;tilledwater for about 3 h. The aggregates were left in the water overnight. The surface 01 theaggregates was then dried with an air stream and the saturated-surface-dry mass was 'measured.The L WA contained about 35 % water by mass fraction.
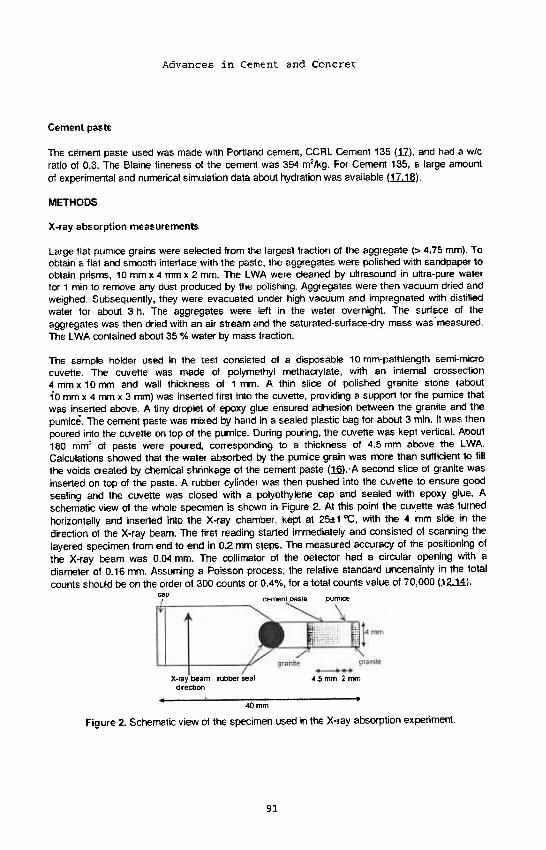
The sample holder used in the test consisted of a disposable 10 mm-pathlength semi-microcuvette. The cuvette was made 01 polymethyl methacrylate, with an internal crossection4 mm x 10 mm and wall thickness of 1 mm. A thin slice of polished granite stone (aboutfo mm x 4 mm x 3 mm) was insened first into the cuvette, providing a support for the pumice thatwas insened above. A tiny droplet of epoxy glue ensured adhesion between the granite and thepumice. The cement paste was mixed by hand in a sealed plastic bag for about 3 min. It wa~ thenpoured into the cuvette on top of the pumice. During pouring, the cuvette was kept vertical. About180 mms of paste were poured, corresponding to a thickness of 4.5 mm aloove the LWA.Calculations showed that the water absorbed by the pumice grain was rrure than sufficient to fillthe voids created by chemical shrinkage of the cement paste (1§).'A second sliD" 01 granite wasinsened on top of the paste. A rubber cylinder was then pushed into the cuvette to ensure goodsealing and the cuvette was closed with a polyethylene cap and sealed with epoxy glue. Aschematic view of the whole specimen is shown in Figure 2. At this point the clJ\'ette was turnedhorizontally and inserted into the X-ray chamber, kept at 25:t1 "C, with the 4 mm side in thedirection 01 the X-ray beam. The first reading staned immediately and consisted 01 scanning thelayered specimen from end to end in 0.2 mm steps. The measured accuracy 01 the positioning ofthe X-ray beam was 0.04 mm. The collimator of the detector had a circular opening with adiameter of 0.16 mm. Assuming a Poisson process, the relative standard uncertainty in the totalcounts should be on the order of 300 counts or 0.4%, lor a total counts value 01 70,000 (12.14).
cap, cement paste pum"",'- \
granite QraniteI I
X-ray beam rubber sealdiredion
---4.5mm 2mm
40mm
Figure 2. Schematic view of the specimen used in the X-ray absorption experiment.
91
Advances in Cement and Concre
Chemical shrinkage measurements
About 5 g of freshly mixed cement paste were cast in the bottom of a small glass jar, withdiameter 25 mm and height 60 mm. The thickness of the cement paste sample was abou:t 5 mm.After the cement paste was covered with 1 mL of water, the jar was filled with hydraulic oil. Thejar was sealed with a rubber stopper encasing a pipette graduated in 10 fllL increments andplaced in a constant-lemperature water bath at 25 °C. The oil level within the pipel~e wasmeasured to the nearest 2.5 flL over time. The chemical shrinkage per gram of initial cem~nt wasdetermined by normalizing the change in volume to the mass of solids in the sample. For eachmeasurement, two specimens were tested. The maximum expanded uncentainty (1,6.) in thecalculated chemica! shrinkage has been previously estimated (19) to be 0.001 g water/(gcement), assuming a coverage factor of 2 (A).
Non-evaporable water measurements
The non-evaporable water content, Wn. is defined as the mass loss per gram of original c:ement.measured between the temperatures of 105 .C and 1000 .C. From the non-evaporable watercontent, the degree of hydration can be estimated assuming a value for th,e non-evaporablewater of a fully hydrated sample. This value can be calculated from tlhe Bogue phasecomposition of the cement (C3S 56.5 %. CzS 14.3 %. C3A 5.9 %, and C.J\F 6.6 %); in thepresent case a value of 0.235 g H2O/g cement was used (1§.). The specimens were storedinside the X-ray chamber (25:1:1 .C) to realize the same conditions as in the moisture transportsamples. Both saturated and sealed samples were tested. After 8 h, 1 d, 3 d. ~r d, and 28 d. onesample of each curing condition was crushed with a pestle in a mortar. The powder was flushedwith methanol twice to stop hydration. Two crucibles were partially filled with the content of eachsample and dried overnight in the oven at 105 .C. The crucibles were subsequently vveighedand fired in the furnace at 1000 'c for about 3 h. The difference between the two rnasses,compensated for the loss on ignition of the dry cement powder, represented tt1le non-evaporablewater content of the sample.
Numerical simulation of cement hydration
Hydration of the cement paste was simulated with the program CEMHYD3D. For details of themodeling, see (W). Chemical shrinkage and degree of hydration in saturatl~ and in sealedcuring conditions at 25.C were calculated as a function 01 curing age. Curing in saturatedconditions in CEMHYD3D is realized by guaranteeing free availability to wiater lor h),drationthroughout the simulation. In the experiments, however, depercolation of the capillary pores in theiow wlc paste alter a few days hydration will limit access of the water: some s1~".(jesiccation willtake place and further hydration will be hampered. After depercolation 01 the capillary porosity,the measured non-evaporable water content in the "saturated" samples will tlnerefore be lower1han in the ideal case of perfect saturation, but higher than in the case 01 sealed hydration.
RESULTS
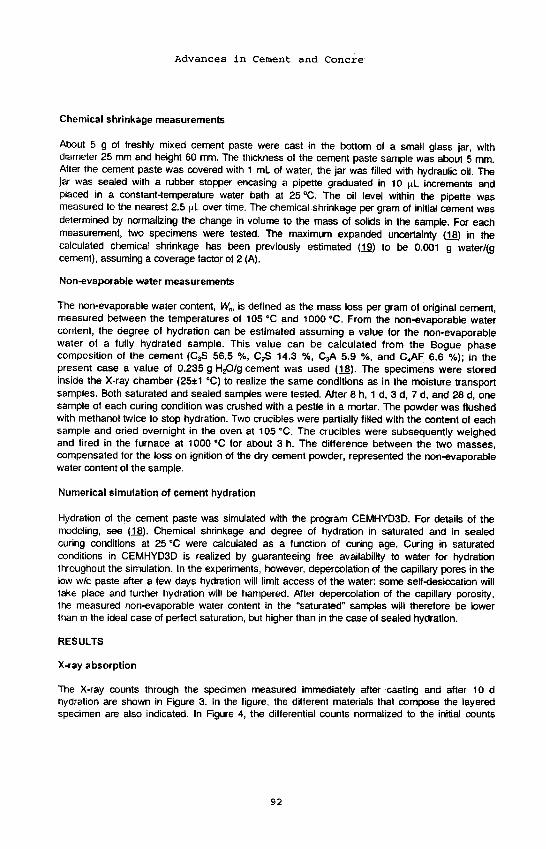
X-ray absorption
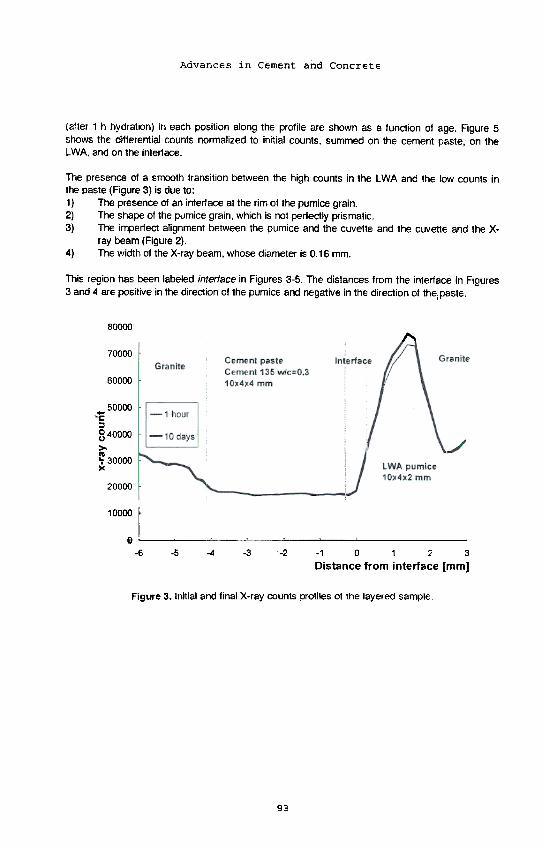
The X-ray counts through the specimen measured immediately after castin!g and after 10 dhydration are shown in Figure 3. In the figure, the different materials that con1pose the layeredspecimen are also indicated. In Figure 4, the differential counts normalized to the initial counts
92
Advances in Cement and Concrete
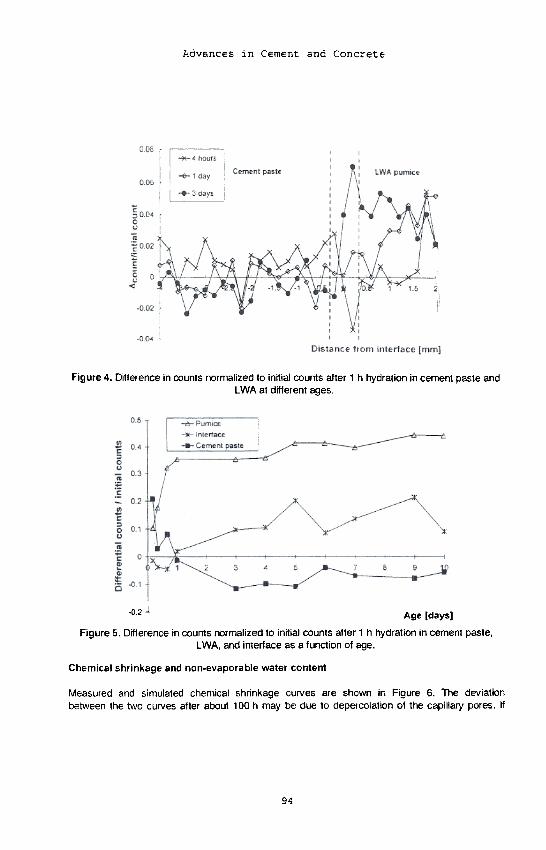
(after 1 h hydration) in each position along the profile are shown as a function of age. Figure 5shows the differential counts nonnalized to initial counts, summed on the cement paste; on theLWA, and on the interface.
The presence of a smooth transition between the high counts in the LWA and the low counts inthe paste (Figure 3) is due to:1) The presence of an interlace at the rim of the pumice grain.2) The shape of the pumice grain, which is not perfectly prismatic.3) The imperlect alignment between the pumice and the cuvette and the cuvene and the X-
ray beam (Figure 2).4) The width of the X-ray beam, whose diameter is 0.16 mm.
This region has been labeled interlace in Figures 3-5. The distances from the inter1~ce in Figures3 and 4 are positive in the direction of the pumice and negative in the direction of the; paste.
80000
/',70000
60000
50000.."C~8 40000>-~'; 30000>c
20000
10000 I
0-5 -3 -2-6 -4 -1 0 1 2 3
Distance from intelrface [mnrl]
Figure 3. Initial and final X-ray counts profiles of the layered san1ple.
g~
F.dvances in Cement and Concrete
Figure 4. Ditlerence in CXJunts normalized to initial CXJunts after 1 h hydration in cement paste and
LWA at different ages.
-0.2 1 Age [days]
Figure 5. Difterence in counts normalized to initial counts after 1 h hydratior! in cemenll paste,LWA, and interface as a function of age.
Chemical shrinkage and non-evaporable water content
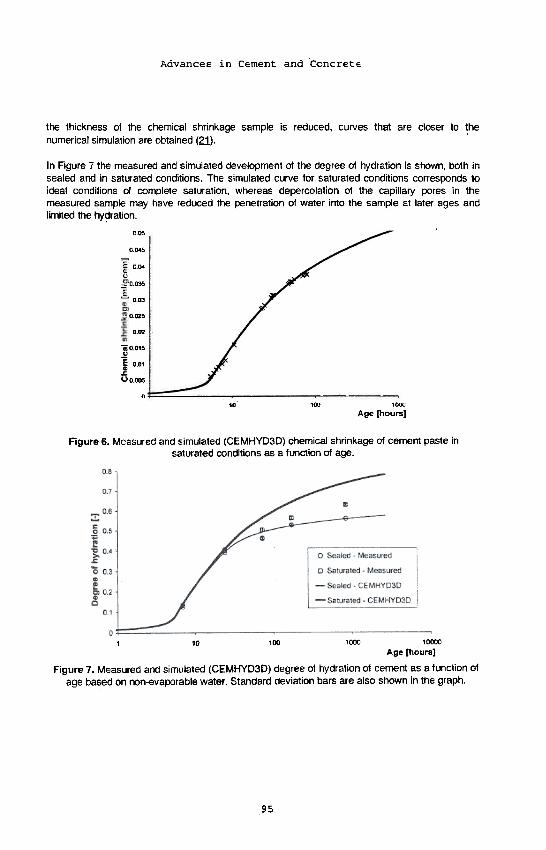
Measured and simulated chemical shrinkage curves are shown in Figure 6. The deviationbetween the two curves after about 100 h may be due to depercolation of the capillarjl pores. 11
94
Advances in Cement and ConcretE
the thickness of the chemical shrinkage sample is reduced, curves that are closer to thenumerical simulation are obtained (2:1).
In Figure 7 the measured and simulated development of the degree of hydration is shown, bo'lh insealed and in saturated conditions. The simulated curve for saturated conditions corresponds toideal conditions 01 complete saturation, whereas depercolation of the capillary pores in themeasured sample may have reduced the penetration of water into the sample at later ages andlimited the hyc:Jration.
005,
0045-
00.-
0.035 -
003-
0._'
0.02 -
-0.015 .
001 -
"'0005-
0
-#-
I x Measured I
I-CEMHYD3D I
10 100 1000
Age (hours]
Figure 6. Measured and simulated (CEMHYD3D) chemical shrinkage of cement paste insaturated conditions as a function of age.
1 10 100 1000 10000
Age [hours]
Figure 7. Measured and simulated (CEMHYD3D) degree of hydration ot cement as a functic'n ofage based on non-evaporable water. Standard deviation bars are also shown in the graph.
95
~.dvances in Cement and co~crete
DISCUSSION
The X-ray counts in the paste increase at 4 h almost at any point, decrease in the followingreadings and stabilize afier 7 d (Figure 5). The first rise may be due to settlement of the pastebetween casting and the 4 h reading, as has been observed previously (12,.H). The subsequentdecrease of counts, corresponding to an increase in density, is probably due to absorption ofwater from the LWA.
The counts in the lWA in the first hours increase at the right end and decrease~~ the left end(Figure 4), possibly indicating a moisture transport within the thickness 01 the ipumice.Afterwards, the counts on the whole l WA increase and then become almost stable after 3 dhydration. The interlace region sees a decrease in counts in the first hours (Figu/es <I and 5)and then a sudden increase. The oscillations in counts in the following daysmig~t bE! due tomeasurement error. In fact, the sharp gradient in counts in this region (Figure 3), ~mplifies theeffect of the uncer1ainty in the positioning of the x-ray beam, which is about 0.04 mn;,.'
In synthesis, the behavior observed in the X-ray absorption test corresponds to senlemelrJt in thepaste in the first 4 h, which is the dormant period of the hydration of the paste (W). OncE~ seningtakes place, pores are emptied in the cement paste and water is pulled out of the LWA, passingthrough the interface first. Water is detected while it is passing from the right edge of the pumiceto the left, through the interface and then into the paste. From 1 d, the counts in the interlace aredecreasing, and then by 3 d the whole transport process is almost over.
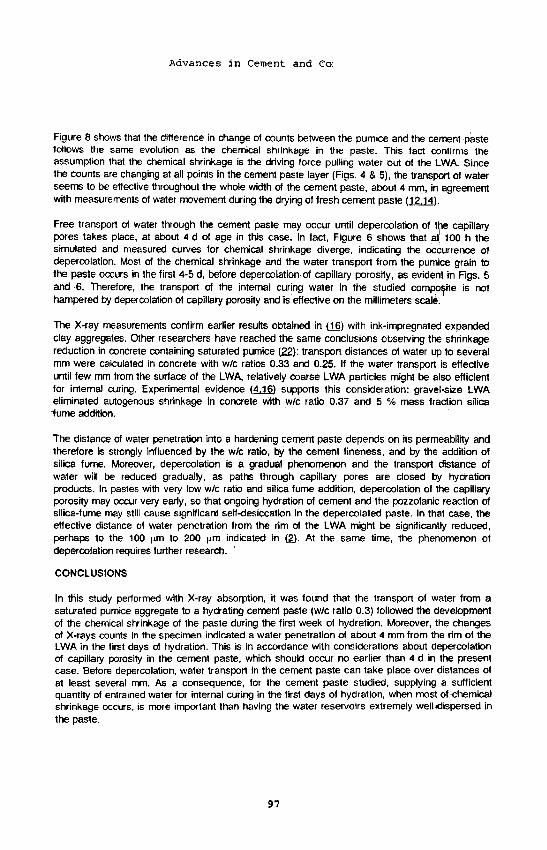
The chemical shrinkage in the paste is the driving force for the moisture transport. Asprogressively smaller pores are emptied in the cemem paste (1), a gradiem of relative Ihumidityforms between the saturated pumice grain and the hardening paste, which pulls water out of theLWA. On the other hand, the evolution in time of the coums difference between the LWA and thecemem paste represems a measure of the water transported. These two quantities are plottedtogether in Figure 8, where the chemical shrinkage was zeroed at 1 h to correspond to tihe initialX-rays measurement.
10 100 1000
Age [hours]
Figure 8. Counts difference as a function of age
96
Advances in Cement and COI
Figure 8 shows that the difference in change 01 counts between the pumice and the cement pastefollows the same evolution as the chemical shrinkage in the paste. This fact contirms theassumption that the chemical shrinkage is the driving lorce pulling water out of the LWA. Sincethe counts are changing at all points in the cement paste layer (Figs. 4 & 5), the transport of waterseems to be effective throughout the whole width of the cement paste, about 4 mm, in agreementwith measurements of water movement during the drying of fresh cement paste (12.14).
Free transpor1 of water through the cement paste may occur until depercolation of the capillarypores takes place, at about 4 d of age in this case. In fact, Figure 6 shows that a\ 100 h thesimulated and measured curves for chemical shrinkage diverge, indicating the occurrence ofdepercolation. Mos! of the chemical shrinkage and the water transpor1 from the pumice g'rain tothe paste occurs in the first 4-5 d, before depercolation.of capillary porosity, as evident in l=igs. 5and 6. Therefore, the lranspor1 of 1he internal curing water in the studied compo~ite is nothampered by depercolation of capillary porosity and is effective on the millimeters scale:.
The X-ray measurements confirm earlier results obtained in (12) with ink-impregnated expandedclay aggregates. Other researchers have reached the same conclusions observing the shrinkagereduction in concrete containing saturated pumice (2.2): transport distances of water up to severalmm were calculated in concrete with w/c ratios 0.33 and 0.25. .If the water transport is effectiveuntil few mm from the surface of the LWA, relatively coarse LWA particles might be also efficientfor internal curing. Experimental evidence (.4.12) supports this consideration: gravel-size, LWAeliminated autogenous shrinkage in concrete with w/c ratio 0.37 and 5 % mass fractiorl silica-fume addition.
The distance of water penetration into a hardening cement paste depends on its permeability andtherefore is strongly influenced by the w/c ratio, by the cement fineness, and by the addition ofsilica fume. Moreover, depercolation is a gradual pheoornenon and the transport distalrlce ofwater will be reduced gradually, as paths through capillary pores are closed by hyljrationproducts. In pastes with very low w/c ratio and silica fume addition, de percolation of the c;ipillaryporosity may occur very early, so that ongoing hydration of cement and the pozzolanic reac~ion ofsilica-fume may still cause significant self-desiccation in the depercolated paste. In that ca!;e, theeffective distance of water penetration from the rim of the LWA might be significantly reduced,perhaps to the 100 flm to 200 I'm indicated in (2). At the same time, the phenomelnon ofdepercolation requires further research. '
CONCLUSIONS
In this study periormed with X-ray absorption, it was found that the transport of water from asaturated pumice aggregate to a hydrating cement paste (w/c ratio 0.3) followed the developmentof the chemical shrinkage of the paste during the first week of hydration. Moreover, the changesof X-rays counts in the specimen indicated a water penetration of about 4 mm from the rim, of thelWA in the first days 01 hydration. This is in accordance with considerations about depercolatooof capillary porosity in the cement paste, which shoukj occur no earlier than 4d in the ~)fesentcase. Before depercolation, water transport in the cement paste can take place over distarlces ofat least several nYn. As a consequence, for the cement paste studied, supplying a sLrfficientquantity of entrained water for internal curing in the first days of hydration, when most ofctlemicalshrinkage occurs, is more important than having the water reservoirs extremely wellidispersed inthe paste.
97
Advances in Cement and Concrete
ACKNOWLEDGEMENTS
This research is the result 01 a summer stay 01 the first author at the Building and Fire ResearchLaboratory of the National Institute 01 Standards and Technologies (NIST), Gaithersburg (MO),USA. The funding 01 the United States-Israel Bi-National Science Foundation (BSF), project'Autogenous Curing 01 High Strength Cementitious Materials by Means 01 Lightweight Micro-Aggregates Acting as Internal Water Reservoirs' is gratefully acknowledged.
REFERENCES
(1) C.M.Jensen & P.F .Hansen, Atnogenous deformation and RH-change in perspective, Cementand Concrete Research 31(12) (2001) 1859-1865
(2) D.P.Bentz & K.A.Snyder, Protected paste volume in concrete -Extension to intern~~ curingusing saturated lightweight fine aggregate, Cement and Concrete Research 29 (11) (1999) 1863-1867
(~) T .A.Hammer, High strength L WA concrete with silica fume. Effect of water content 'in theL WA on mechanical properTies, Supplememary Papers in the 4th CANMET/ACI 1m. Coni. On FlyAsh, Silica Fume, Slag and natural Pozzolans in Concrete, Turkey, (1992), pp. 314-330
(.4) K.Takada, K.van Breugel, E.A.B.Koenders & N.Kaptijn, Experimental Evaluation otAutogenous Shrinkage of Lightweight Aggregate Concrete, Proc. Int. Workshop AU1oshrink'98.ed. E.-I. Tazawa, Hiroshima, Japan, E & FN SPaN, London, (1999), pp. 221-230
(2) A.Bentur, S.lgarashi, & K.Kovler, Prevention of autogenous shrinkage in high strenflthconcrete by internal curing using wet lightweight aggregates, Cement & Concrete Research 31
(11)(2001)1587-1591
(.6) C.M.Jensen & P.F .Hansen, Water-entrained cement-based materials -I. Principle a'1dtheoretical background, Cement and Concrete Research 31 (4) (2001) 647-654
(Z) S.Zhutovsky, K.Kovler & A.Bentur, Efficiency of lightweight aggregates for internal curing ofhigh strength concrete to eliminate autogenous shrinkage, Materials & Structures 35 (246) (2002)97-101
(.§.) S. Zhutovsky, K. Kovler & A. Bentur, Influence of Wet Lightweight Aggregate on AutogenousShrinkage of Concrete at Early Ages, Proc. 6th Int. Conf. Creep, Shrinkage and DurabilityMechanics of Concrete and Other Quasi-Brittle materials, eds. F.-J. Ulm, Z.P. Bazant & F.li.Wittmann, Cambridge, MA, August 20-22 2001, Elsevier Science Ltd, pp. 697-702.
(~) S. Zhutovsky, K. Kovler & A. Bentur, Autogenous curing of High-Strength Concrete using pre-soaked pumice and perlite sand, Proc. 3rd Int. Res. Sem. Self-desiccation and its imponance in
concrete technology, 15 June 2002, Lund, Sweden, pp. 161-173.
(lQ) GNI X-ray System, h1\Q:II\Nv.'W.gni.dkl, May 2003
(11) K.K.Hansen, S.K.Jensen, LGerward & K.Singh, Dual-energy X-ray absorptiometrv lor the
Advances in Cement and Concrete
simultaneous determination of density and moisture content in porous structural materials, Pr()c.5th Symp. Build. Phys. Nordic Countries, Gothenburg, Sweden (1999)
(12) D.P .Bentz & K.K.Hansen. Preliminary observations of water movement in cement pastesduring curing using X-my absolption, Cement and Concrete Research 30 (7) (2000) 1157-116Ei
In) D.P.Bentz, M.R.Geiker & K.K.Hansen, Shrinkage-reducing admixtures and early,.agedesiccation in cement pastes and mortars, Cement and Concrete Research 31 (7) (2001) 1075-1085
(M) D.P.Bentz, K.K.Hansen, H.D.Madsen, F.VaJlee & E.J.Griesel, Dryinglhydration in cerrentpastes during curing, Materials and Structures 34 (243) (2001) 557-565
(~) T. 0slergaard. Measurements on water entrained cement paste at NIS7; GNI n~wsletler.
htlc:/Iwww.gni.dk/, Augus12001
(1§) P .Lura, Autogenous deformation and internal curing of concrete, Ph.D. tnesis. DelftUniversity of Technok)gy. Delft (2003)
(11) Cement arK! Concrete Reference Laboratory Proficiency Sample Program, Final Repolt onPortland Cement Proficiency Samples Number 135 and 136, Cement arK! Concrete Reference
"Laboratory, Gaithersburg, MO, March 2000
(.1§) D.P .Bentz, X.Feng, C.J.Haecker & P .Stutzman, Analysis of CCRL Proficiency Cements 135and 136 Using CEMHYD3D, NIST Internal Report 6545 (2000)
~) B.N. Taylor & C.E.Kuyatl, C.E., Guidelines for Evaluating and Expressing the Uncel1ainry ofNIST Measurement Results, NIST Technical Note No. 1297, U.S. Department of CommE!rce,Washington, D.C., Sept. 1994
(2Q) D.P .Bentz, Three-Dimensional Computer Simulation of. Ponland Cement Hydration andMicrostructure Development, Journal of the American Ceramic Society 80 (1) (1997) 3-21
(2.1) M.R.Geiker, Studies of Polt/and Cement Hydration, PhD thesis, Institute ot Mineral Industry,Technical University 01 Denmark, Lyngby (1983)
(22) S. Zhut.°vsky, K Kovler & A. Bentur, Assessment of Distance of Water Migration in /nt.9ma/Curing of High-Strength Concrete, Paper presented at the session "Autogenous deformatic'n 01concrete" at American Concrete Institute Fall Convention, Phoenix, Arizona, October 2002, alsosubmitted lor an ACI Special Publication on Autogenous deformation (2003)
99