Embed Size (px)
Citation preview
Measuring Adolescent Women’s Sexual and Reproductive Health Within A Rights-Based Framework: Developing and Applying an Index
Ragnar Anderson, Christine Panchaud, Lisa Remez and Susheela Singh
December 2014
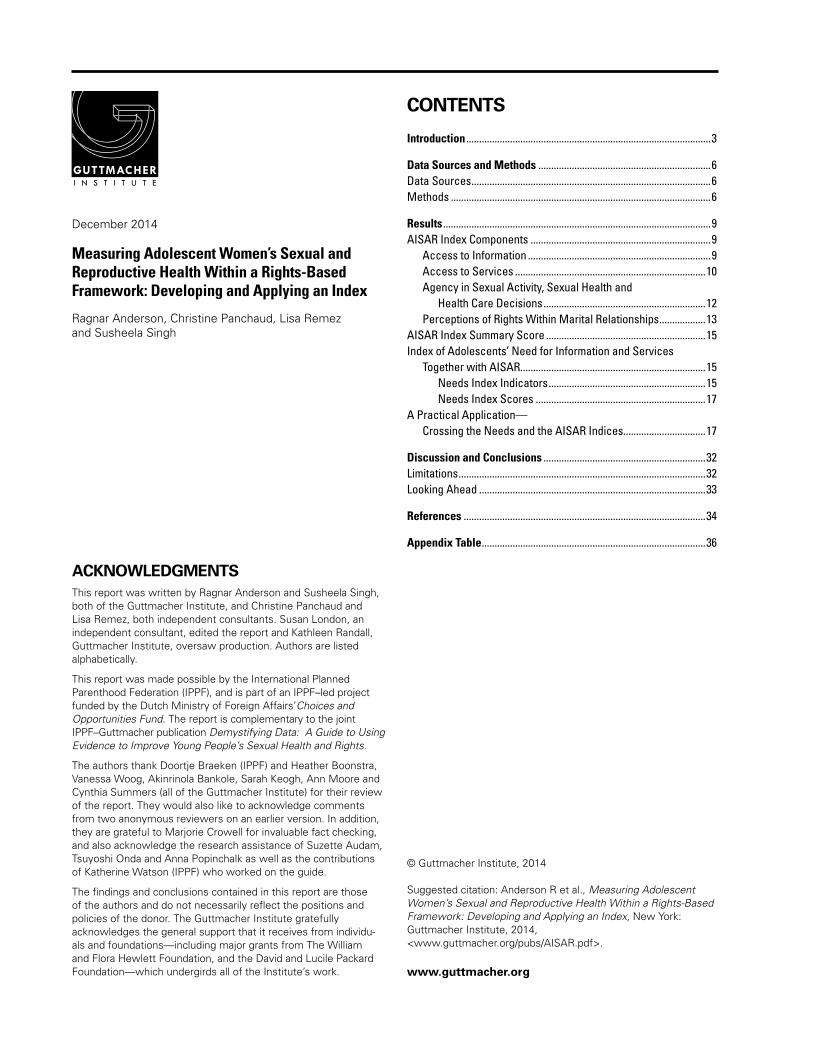
HIGHLIGHTSn To explore the feasibility of creating an easy-to-use summary data tool from survey data, we
combined 16 indicators into an index measuring four dimensions of adolescent women’s sexual and reproductive health and rights. The index was tested using data from 30 countries that had relatively recent nationally representative surveys and were distributed across four regions.
n The resulting index, denoted by the summary acronym AISAR, examines adolescents’ access to information and services, agency in sexual activity and health, and perceptions of rights within marriage. To explore how the tool can be used, we also created an index of adoles-cents’ needs for sexual and reproductive health information and services.
n Although the results are tentative and exploratory, some general patterns emerged. Condi-tions of adolescent women’s sexual and reproductive health and rights are poorest in the 13 Sub-Saharan African countries, where needs are also among the highest. Latin American countries have above-average conditions, but also have very high needs. The South and Southeast Asian countries tend to have relatively poor sexual and reproductive health condi-tions for adolescent women, but also have below-average needs. The three Eastern European countries have above-average health and rights conditions with relatively low needs.
n Our exploratory exercise showed large gaps in the availability of survey data that accurately measure adolescents’ receipt of sexual and reproductive health information and their access to services, and even larger gaps in data to document their sense of agency in sexual and reproductive matters and understanding of their sexual rights.
n Despite the difficulties of drawing conclusions from an index with many missing data points, these findings suggest that developing such indices is a useful endeavor that can provide helpful, at-a-glance summary information to policymakers and program planners. The analysis also makes clear the great need to improve on this pilot effort.
n The existing data gaps point to the need for national surveys to develop and include new questions to more accurately measure adolescents’ understanding of sexual health issues, their access to needed services, and their ability to exercise their rights and exert agency over their sexual and reproductive lives.
CONTENTS
© Guttmacher Institute, 2014
Suggested citation: Anderson R et al., Measuring Adolescent Women’s Sexual and Reproductive Health Within a Rights-Based Framework: Developing and Applying an Index, New York: Guttmacher Institute, 2014, <www.guttmacher.org/pubs/AISAR.pdf>.
www.guttmacher.org
December 2014
Measuring Adolescent Women’s Sexual and Reproductive Health Within a Rights-Based Framework: Developing and Applying an Index
Ragnar Anderson, Christine Panchaud, Lisa Remez and Susheela Singh
Introduction ...............................................................................................3
Data Sources and Methods ...................................................................6Data Sources .............................................................................................6Methods .....................................................................................................6
Results ........................................................................................................9AISAR Index Components ......................................................................9 Access to Information .......................................................................9 Access to Services ..........................................................................10 Agency in Sexual Activity, Sexual Health and Health Care Decisions ...............................................................12 Perceptions of Rights Within Marital Relationships ..................13AISAR Index Summary Score ..............................................................15Index of Adolescents’ Need for Information and Services Together with AISAR ........................................................................15 Needs Index Indicators .............................................................15 Needs Index Scores ..................................................................17A Practical Application— Crossing the Needs and the AISAR Indices................................17
Discussion and Conclusions ...............................................................32Limitations ................................................................................................32Looking Ahead ........................................................................................33
References ..............................................................................................34
Appendix Table .......................................................................................36
ACKNOWLEDGMENTSThis report was written by Ragnar Anderson and Susheela Singh, both of the Guttmacher Institute, and Christine Panchaud and Lisa Remez, both independent consultants. Susan London, an independent consultant, edited the report and Kathleen Randall, Guttmacher Institute, oversaw production. Authors are listed alphabetically.
This report was made possible by the International Planned Parenthood Federation (IPPF), and is part of an IPPF–led project funded by the Dutch Ministry of Foreign Affairs’Choices and Opportunities Fund. The report is complementary to the joint IPPF–Guttmacher publication Demystifying Data: A Guide to Using Evidence to Improve Young People’s Sexual Health and Rights.
The authors thank Doortje Braeken (IPPF) and Heather Boonstra, Vanessa Woog, Akinrinola Bankole, Sarah Keogh, Ann Moore and Cynthia Summers (all of the Guttmacher Institute) for their review of the report. They would also like to acknowledge comments from two anonymous reviewers on an earlier version. In addition, they are grateful to Marjorie Crowell for invaluable fact checking, and also acknowledge the research assistance of Suzette Audam, Tsuyoshi Onda and Anna Popinchalk as well as the contributions of Katherine Watson (IPPF) who worked on the guide.
The findings and conclusions contained in this report are those of the authors and do not necessarily reflect the positions and policies of the donor. The Guttmacher Institute gratefully acknowledges the general support that it receives from individu-als and foundations—including major grants from The William and Flora Hewlett Foundation, and the David and Lucile Packard Foundation—which undergirds all of the Institute’s work.
3Guttmacher Institute
The inability of many adolescent women to protect their
sexual and reproductive health is a pressing concern. The
inalienable right of all women to do so has been estab-
lished through multiple mechanisms, including human
rights treaties and international conventions.1–4 The right
to reproductive health is commonly defined as “a human
right that protect[s] against the causes of ill health and
promote[s] sexual and reproductive well-being.”5 Although
it applies to all people, men and women of all ages, certain
groups in particular face barriers to exercising this right.
Notably, adolescent women’s age and biology place them
at higher than average risk for unintended pregnancy and
STIs, including HIV. (In this report the term "adolescents"
refers to 15–19-year-olds.) They also often have the high-
est unmet need for services that prevent such outcomes.
Strong youth policies are in place in many countries,
and adolescent fertility is a progress indicator for one of
the global targets specified in Millennium Development
Goal (MDG) 5, reduce maternal mortality by 75% between
2000 and 2015. Yet even though improving adolescent
sexual and reproductive health is high on the global
agenda,6,7 comparatively little attention is paid to monitor-
ing how that agenda is implemented and its impact on
real-life outcomes. In fact, evidence clearly shows large
gaps in adolescents’ ability to obtain the information and
services that they need to protect and preserve their
sexual and reproductive health and rights.8–11 Those gaps
are widest in the developing world and can have a marked
negative impact on adolescent health and on public health
in general.
For example, when adolescents are unable to prevent
unintended pregnancies by practicing contraception, un-
planned births or induced, often unsafe, abortions can re-
sult. In 2014, an estimated 12 million adolescents living in
developing regions gave birth.12 Although unplanned births
among all women of reproductive age are falling globally,
large proportions of births to adolescents in the develop-
ing world continue to be unplanned,13 which can have life-
long consequences for both mother and infant. Moreover,
this outcome reflects only those pregnancies that ended
in births; as of 2008, an estimated 3.2 million adolescent
women in the developing world (excluding China) resorted
to induced abortion that year.14 Laws that highly restrict
Introduction
legal abortion in the majority of these countries mean that
most abortions of adolescents there are clandestine and
unsafe, and adolescents are thought to “suffer the most
from the negative consequences of unsafe abortion.”
Cultural attitudes that restrict adolescents’ access to
sexual health information, practices that encourage unions
between adolescent women and much older men, and
adolescents’ limited agency to negotiate condom use all
put them at high risk for contracting STIs, including HIV.
Reports of the Joint United Nations Programme on HIV/
AIDS (UNAIDS) do not present separate estimates of
HIV prevalence for 15–19-year-olds,15 but some recent
national-level surveys show very high rates among this
age-group in countries with generalized epidemics (those
in which at least 1% of the population is infected). For
example, HIV prevalence among 15–19-year-old women
in six Sub-Saharan African countries ranges from 2.7%
to 7.1%.*16 UNAIDS reports that Sub-Saharan African
15–24-year-old women account for one in four new infec-
tions and are twice as likely as their male counterparts
to be living with HIV.15 Moreover, the coverage of HIV
testing is extremely low among adolescent women in
Sub-Saharan Africa, and as a result most—more than four
in five—do not know their HIV status.17
In general, adolescents worldwide still have inad-
equate access to sexuality education and to sexual and
reproductive health services.10 Rigorous research has
shown that providing them with comprehensive sexuality
education and sufficient access to needed reproductive
and sexual health care does not lead to early sexual initia-
tion but does improve their sexual health outcomes.18–21 A
growing body of evidence clearly shows the benefits of in-
vesting in the sexual and reproductive health of all people,
including adolescents, and the economic and public-health
costs for failing to do so.22,23
Much of the existing work on indicators of adolescent
sexual and reproductive health focuses on knowledge,
*These six countries (with survey year and prevalence rates) are Kenya (2008–2009, 2.7%), Malawi (2010, 4.2%), Mozambique (2009 AIDS Indicator Survey, 7.1%), Uganda (2011, 3.0%), Zambia (2007, 5.7%) and Zimbabwe (2010–2011, 4.2%). (Source: refer-ence 16.)
4 Guttmacher Institute
developed originally by Karen Hardee and colleagues that
identified four key components of good-quality family
planning services: availability, accessibility, acceptability
and quality (AAAQ).30 The authors subsequently expanded
these components to encompass four more, namely, ac-
countability, community participation, supportive commu-
nity norms and increased individual agency.30,31 Although
Hardee’s framework is focused on family planning and is
oriented toward all women and couples regardless of age,
it is a useful starting point for conceptualizing the needs
of adolescent women in the broader sense of their overall
sexual and reproductive health care and rights.
To develop our index, we drew on data generated for
a guide (a collaborative project with International Planned
Parenthood Federation [IPPF]) on how to effectively use
data to improve the sexual and reproductive health and
rights of young people.13 A total of 70 indicators for 30
countries already processed for that project served as the
foundation for our development of this new adolescent
index. These indicators are primarily drawn from national
demographic and health surveys and therefore fall short
of measuring certain aspects of the AAAQ framework
and its related components. Nevertheless, given time and
financial constraints, and reasonable approximation, we
aligned these indicators to match what we could of that
framework, while also adding and revising indicators to
specifically address the situation of adolescent women.
In all, we used 16 of the indicators falling into four do-
mains or components to develop our index. Because ado-
lescent women are just beginning their sexual and repro-
ductive lives and need information first and foremost, the
attitudes, behaviors and outcomes, whereas coverage of
rights is far more limited.8,24–26 It is essential to take into
account adolescent women’s rights to the full range of
information, services and skills-training that would enable
a healthy and satisfying sexual life and ensure protection
from violence and abuse. Measuring the fulfillment of
rights is intrinsically hard, but not impossible given the
availability of useful proxies.
Many studies and two global goals (MDGs 5 and 6)
have highlighted the need for quantitative measurements
of adolescent sexual and reproductive health and rights.
A comprehensive index that combines a broad range of
related measures would mark significant progress toward
satisfying this longstanding need to capture the situation
of adolescent women at the country level. An index is
an attractive data-analysis and presentation tool because
it provides policymakers and program planners with a
simple way of sizing up the current situation to see where
needs are most pressing. For example, Population Action
International (PAI) produced a Reproductive Risk Index in
200727 and a Sexual and Reproductive Health and Rights
Index in 2014.28
In line with recent efforts to use quantitative indicators
to monitor contraceptive programs’ fulfillment of human
rights,29 we sought to explore whether an index could
assess the state of adolescent women’s reproductive
health and rights, paralleling the above efforts. Our index
was conceived within the broad concept of other ongoing
rights-based initiatives that are developing indicators to as-
sess whether women are able to get care and its quality.
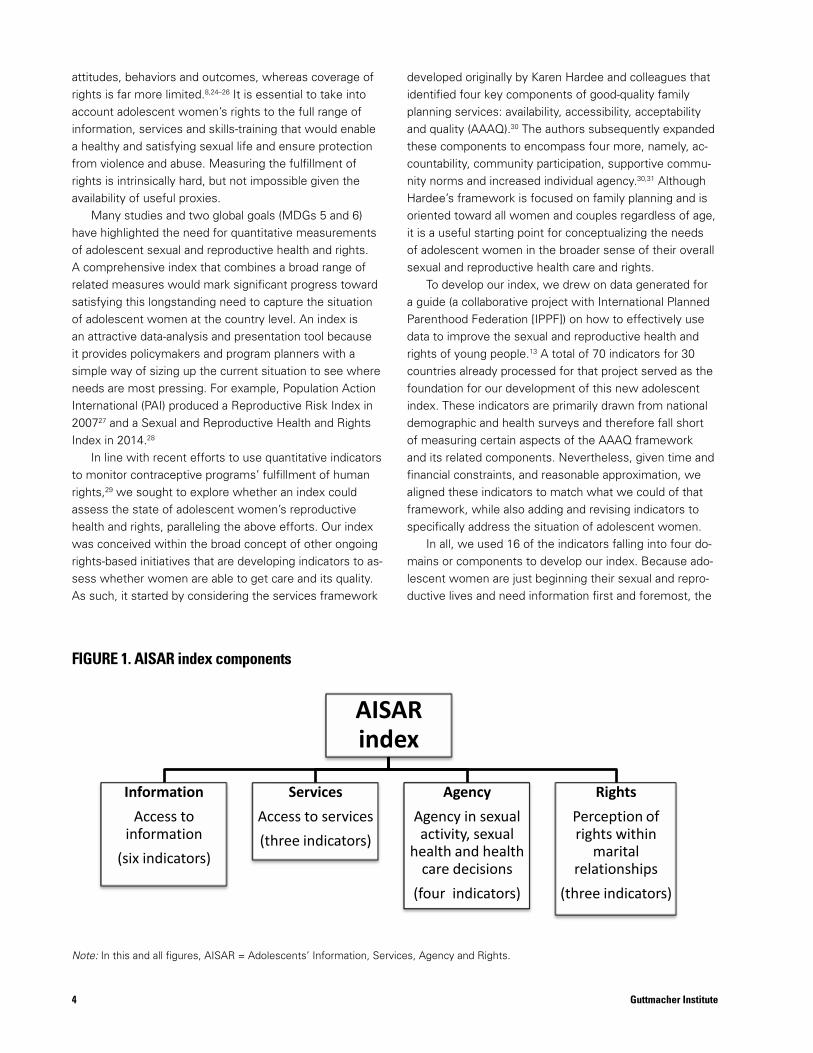
As such, it started by considering the services framework FIGURE 1. AISAR index components
Note: In this and all figures, AISAR = Adolescents’ Information, Services, Agency and Rights.
AISAR index
Information Access to
information (six indicators)
Services Access to services (three indicators)
Agency Agency in sexual activity, sexual
health and health care decisions
(four indicators)
Rights Perception of rights within
marital relationships
(three indicators)
FIGURE 1. AISAR index components
Note: In this and all figures, AISAR = Adolescents’ Information, Services, Agency and Rights.
5Guttmacher Institute
first component of our index includes a range of variables
that together give an idea of adolescent women’s access
to sexual and reproductive health information. The second
component reflects the AAAQ element of accessibility, as
measured from adolescent women’s actual use of mater-
nal and reproductive health services. In line with Hardee’s
individual agency, the third component of our index draws
on indicators of adolescent women’s ability to protect
their sexual health and prevent negative outcomes. Finally,
for the fourth component, we sought as close a proxy as
possible to assessing adolescent women’s perceptions of
a wife’s sexual rights within marriage, specifically con-
cerning sexual activity and domestic violence. These four
components—Adolescents’ Information, Services, Agency
and Rights—are combined into a single index having the
acronym AISAR (Figure 1).
Any attempt to create an index of hard-to-measure
attitudes and behaviors is greatly constrained by data
availability and suitability, especially when circumstances
dictate the use of preexisting indicators. Nonetheless,
given the pressing need for better data tools, testing
and applying the AISAR index is a worthwhile research
endeavor. In this report, we describe how the index is
constructed and provide results for 30 countries, based on
their most recent survey that was available at the time of
analysis. The countries lie in four major geographic regions
(Africa, Eastern Europe, South and Southeast Asia, and
Latin American and the Caribbean), offering a good test
of whether the index will work well in a wide range of
social, economic and cultural contexts, and also providing
a means of assessing similarities and differences within
regions. Separately, we also constructed an index of need
for information and services among adolescent women to
examine the relationship between the AISAR index and
related needs, providing insight into the AISAR index’s
utility for informing policies and programs. Finally, we
discuss implications of our findings, as well as gaps in the
data and the need for collecting information that better
captures the situations and needs of adolescent women.
Data Sources and Methods
6 Guttmacher Institute
Data SourcesAs mentioned previously, our exploratory AISAR index
took advantage of survey data that had already been as-
sembled for a joint Guttmacher and IPPF project. Approxi-
mately half of the 30 countries included were selected by
IPPF as part of their larger programming efforts (Albania,
Dominican Republic, Egypt, Ethiopia, Guatemala, Hondu-
ras, Kenya, India, Indonesia, Pakistan, Philippines, Sen-
egal, Vietnam and Zambia). Guttmacher added 16 more
countries to achieve some degree of regional representa-
tion and variation in the sample. At the time of our original
analysis, all countries had had surveys that were fielded in
the past 10 years.
The source of survey data for 29 of the 30 countries is
the Demographic and Health Survey (DHS) program con-
ducted by Macro International, an organization that imple-
ments national sample surveys on sexual and reproductive
health in a wide range of countries, working in collabora-
tion with local institutions. The sole country with data
from a different survey program is Guatemala, for which
we relied on a comparable data set, collected with techni-
cal assistance from the U.S. Centers for Disease Control
and Prevention (CDC). A strong advantage of these types
of surveys is that the data are highly comparable across
countries, with standardized questions on most topics,
and standardized approaches to study design, training of
field staff, data collection and data processing. All data
presented are weighted results, therefore providing rep-
resentative information for the population of adolescent
women in each country.
The surveys from which data were drawn for the
jointly produced guide were fielded between 2002 and
early 2011.13 Because these surveys are meant to be
routinely updated and several newer ones had recently be-
come available, we use more recent survey data for seven
countries in our index. These countries (and their most
recent survey year) are Bangladesh (2011), Honduras
(2011–2012), Indonesia (2012), Mozambique (2011),
Pakistan (2012–2013), Peru (2012) and Uganda (2011).
Given the cyclical nature of constantly replenishing data,
several included countries will likely have more recent
data available by the time this report is published.
All 30 surveys are nationally representative and have
large samples; interviews are conducted face to face
with women aged 15–49 (and in many countries, also
with men of reproductive age). With one exception, all of
the indicators in our index use adolescent women aged
15–19 as their denominator. The exception is the propor-
tion of adult women aged 18–49 agreeing that young
adolescents should be taught about the condom, and this
indicator is included here to get a sense of the broader
societal context in which adolescents live. In doing so,
we borrow from Hardee’s extended AAAQ program
framework, which recommends incorporating a mea-
sure of supportive community norms.30 The unweighted
samples of women aged 15–19 are sizable, ranging from
567 in Pakistan to 23,955 in India, with the exception
of Vietnam (see Appendix Table 1). In that country, only
67 adolescent women were interviewed in a survey of
ever-married women only. In addition to Vietnam, three
other countries included in this index had surveys that
were limited to ever-married women: Bangladesh, Egypt
and Pakistan.
MethodsIndicators Used in the AISAR IndexFrom the 70 indicators that were compiled for the guide
project, we selected 16 to go into the AISAR index.
These describe the situation of adolescents’ sexual and
reproductive health and rights and capture four dimen-
sions of adolescent women’s lives: accessibility to
information, accessibility to services, agency in matters
of sexual activity and health, and perceptions of rights
within marital relationships. The rationale behind the
choice of each of these indicators is discussed in the
Results section.
The availability of data for each of the 16 indicators
varied across the 30 countries. Unsurprisingly, the indica-
tors measuring opinions and attitudes, especially on the
agency and rights components, were most affected
by missing data. At the country level, those that lack
data on more than one of the 16 indicators are Egypt,
Guatemala and Pakistan (data missing on five indica-
tors) and Bangladesh and Vietnam (four indicators). At
7Guttmacher Institute
the component level, unavailable data affect the reliabil-
ity of scores for several countries. The reliability of the
information component, which includes six indicators, is
relatively good, with six countries (Bangladesh, Colombia,
Dominican Republic, Egypt, Guatemala and Pakistan)
missing data on one of the six indicators. The services
component, made up of three indicators, is not missing
data for any country. For the individual agency compo-
nent, which includes four indicators, six countries (Bolivia,
Indonesia, Moldova, Nepal, Peru and Philippines) lack data
for one indicator. However, five countries (Bangladesh,
Egypt, Guatemala, Pakistan and Vietnam) lack data for
two (i.e., 50%) of the four indicators, compromising the
reliability of their scores on this component. The situa-
tion is similar for the three-indicator rights component:
Bangladesh is missing data for one indicator; however,
four countries (Egypt, Guatemala, Pakistan and Vietnam)
are missing data for two indicators (i.e., 66% of data for
this component), which negatively affects the reliability of
these countries’ scores on this component.
The comparability of the rights component across
countries is further affected by the fact that some coun-
tries lack parts of multipart contributing indicators. For
example, the indicator gauging women’s sense of sexual
autonomy within marriage includes an item from an
empowerment of women question that asks about three
situations in which a woman is justified in refusing sex
with her husband (i.e., she knows he has sex with other
women, knows he has an STI, or is tired or not in the
mood). However, wide variability in survey questionnaires
meant that some countries did not collect these exact
data. Thus, in three countries (Honduras, Mozambique and
Uganda) this indicator is based on data for only one of the
three situations. Moreover, for our rights index indicator
that uses responses to an item on negotiating safer sex,
many countries that did not have this item did have similar
content covered in the above empowerment of women
question. Thus, we were able to use data on whether a
wife can refuse intercourse if her husband has an STI as
a proxy for the missing survey item on whether she can
ask her husband to use condom use in that situation in six
countries (Bangladesh, Bolivia, India, Indonesia, Peru and
the Philippines).
When data on an indicator were missing from the
most recent survey (at the time of analysis), we used
data from the preceding survey, when available. Because
most of the missing indicators assess attitudes, which
are relatively slow to change, we assumed that using the
second-most recent survey would not unduly compromise
comparability.
Calculation of Component and Summary ScoresEach AISAR indicator is expressed so that higher-value
responses (percentages or averages) denote a more favor-
able situation for adolescent women. We used a two-step
process to calculate component scores. First, all indicators
were scaled to the range of 0 to 100. (For each indicator,
the lowest value is converted to a minimum value of 0
and the highest value is converted to a maximum value of
100. This means that all indicators are treated as equal in
importance, so they contribute equally to the component
scores and are not differentially weighted.) Second, the
indicator scores for a given component were summed and
divided by the number of indicators in the component to
derive the component score. In all instances in which data
were missing, we calculated each country’s component
score on the basis of the number of component indicators
for which countries supplied data. Finally, we averaged
the four component scores to obtain our summary AISAR
index score. As with the 16 constituent indicators, higher
component scores and higher summary index scores indi-
cate a more positive environment for adolescent women.
Tabulations were done using SPSS version 18.
Index of Adolescents’ Needs for Information and Services To make the AISAR index more useful for policy mak-
ing and program planning, we also developed an index
measuring adolescents’ need for sexual and reproduc-
tive health information and services, abbreviated as the
needs index. Crossing these two indices can indicate,
in the aggregate, how adolescents are situated in re-
gard to getting information and services, compared with
their level of need for them. The needs index comprises
seven indicators. As with the AISAR indicators, all seven
are coded in the same direction, but in this case, higher
values indicate a greater need for sexual and reproductive
health information and services. Six of these indicators
come from the same sources as the AISAR indicators;
the seventh, HIV prevalence, comes from UNAIDS. The
UNAIDS indicator that we use is the midrange estimate
of the percentage of 15–24-year-old women infected with
HIV, because this measure is not available for 15–19-year-
olds; the indicator is for 2012,15 the most recent year
for which these data were available at the time of our
analysis. Although some DHS and CDC surveys provide
this indicator for 15–19-years-olds, the measure is avail-
able for only a minority of the 30 countries. Moreover,
the values for 15–24-year-olds should not vary much from
those for 15–19-year-olds. Indeed, DHS survey–based
HIV prevalence rates among 15–19-year-old women in
six Sub-Saharan African countries (see above; 2.7–7.1%
in 2007–201116) are similar to the UNAIDS values among
8 Guttmacher Institute
15–24-year-old women in these countries (3.6–6.6% in
201215).
Because of widespread cultural taboos against sex and
especially premarital sex, asking adolescent women to
report on these intimate topics is always problematic and
especially so in very socially conservative countries. As
mentioned above, four of the 30 countries (Bangladesh,
Egypt, Pakistan and Vietnam) surveyed ever-married
women only. As a result, unlike the surveys fielded in the
26 other countries, these four did not have information
on the timing of first sex, which is one of the needs index
indicators; another indicator that also depends on this
measure is the difference between median age at first
sex and first marriage. We assumed that in these four
countries, the timing of first sex coincides with the timing
of first marriage and used the median age at first marriage
as a proxy for median age at first sex. We considered this
plausible, given the minimal level of premarital sexual
activity in these countries,8 and given findings from an
experimental question posed to ever-married Bangladeshi
women showing that virtually none reported having had
sex before marrying.32 Finally, the needs index score was
calculated in the same way as the AISAR index score.
Every country supplied data for all seven indicators in the
needs index with the exception of Albania, which is miss-
ing data on a single indicator.
Results
AISAR Index ComponentsBelow we discuss each of the four components that we
used to build the AISAR index, commenting on each of
the 16 indicators. We then present the summary scores
for the four dimensions of adolescent women’s sexual
and reproductive health and rights. These are, broadly
speaking, adolescent women’s exposure to and familiar-
ity with related information; their use of related services;
their agency in sexual decision-making and ability to
protect their sexual and reproductive health; and their per-
ceptions of women’s sexual and bodily autonomy within
marriage and right to be free from domestic violence.
Access to InformationComponent indicators. For the access to information
component, we used indicators that we hoped would
provide a good sense of adolescent women’s access to
and receipt of information: knowledge about contraception
and HIV, access to channels of communication through
which they may receive such information, and attendance
at secondary school for the potential receipt of sexuality
education (Table 1).
• Average number of modern contraceptive methods* known among adolescent women measures familiar-
ity with effective methods and thus, indirectly, having
received information on this crucial reproductive health
topic. Although knowing that a method exists does not
denote knowing how to use it correctly, it is certainly a
prerequisite; knowledge also does not necessarily cor-
relate with availability and access. The median number
of modern methods known among adolescents in these
30 countries is roughly 4.3, found in both Moldova and
Pakistan. The three countries in which adolescents know
the fewest modern contraceptive methods, fewer than
two, are Democratic Republic of Congo (DRC), Nigeria
and Vietnam (1.6–1.9), whereas adolescents in Colombia,
Dominican Republic and Nepal know at least six (6.1–6.5).
• Percentage of 15–19-year-old women with comprehen-sive knowledge of HIV/AIDS measures the proportions
who have more than superficial knowledge. This indicator
is a composite measure of familiarity with the two most
common ways of preventing HIV (using condoms and
being monogamous with an uninfected partner), under-
standing that a healthy-looking person can have HIV, and
rejecting the two most common local misperceptions
about HIV transmission. The median for this measure is
between Senegal and Mozambique, where 26–27% of
adolescent women have such comprehensive knowledge,
which is essential to prevention. It is lowest, at fewer than
12%, in the four overwhelmingly Muslim countries, which
also have minimal HIV prevalence (Bangladesh, Egypt,
Indonesia and Pakistan). The three countries with the
highest levels of comprehensive knowledge, at 46–49%,
are all in Sub-Saharan Africa (Rwanda, Tanzania and Zimba-
bwe), where the epidemic is most concentrated. Unfor-
tunately, the country with the highest HIV prevalence
among 15–24-year-old women as of 2012, Mozambique,35
has only a moderate level of comprehensive knowledge
among 15–19-year-old women, at 27%, a value that is
lower than that in 14 other countries.
• Percentage of 15–19-year-old women who know a source for condoms measures the extent to which ado-
lescent women have information about where to obtain a
method that protects both their sexual and reproductive
health. It is only the first step toward using the method.
Of the 26 countries that supplied data on this indicator,
the median percentage of 15–19-year-old women knowing
where to get a male condom falls between Zambia (67%)
and Ghana and Uganda (69% each). The range across
countries is broad, going from 30–33% in Nigeria and DRC
to 94–95% in Colombia, Peru and Ukraine, with the bulk
of remaining countries (eight) having values in the 70s and
80s.
• Percentage of 15–19-year-old women who have recently been exposed to family planning messages in the media (radio, television or newspaper) measures whether these
countries have recently had campaigns publicizing family
Guttmacher Institute 9
*Sterilization (male and female), pills, IUDs, injectables, implants, patches, male and female condoms, diaphragms, spermicides (foam or jelly) and emergency contraception.
10 Guttmacher Institute
countries (Pakistan, Rwanda and Bangladesh) have neg-
ligible values on this indicator, with 0–1% of adolescents
having weekly exposure to all three media. A relatively
large number of countries fall into a narrow range of
values: In 12 of the 29 with data (Colombia did not collect
these data), fewer than 10% of adolescent women have
such weekly exposure, and in another seven, fewer than
20% do. The four outliers, at 49–52%, are two Eastern
European countries (Moldova and Ukraine) and two Latin
American countries (Dominican Republic and Guatemala).
Component score. Overall scores for the access to
information component ranged from 10 to 84; the median
score, at 51.5, is found between Vietnam and Uganda
(Figure 2). Unsurprisingly, two countries in Latin America
(Colombia and Dominican Republic) and two in Eastern
Europe (Ukraine and Moldova) have the highest access
to information scores (79–84). Three of the four countries
with the lowest scores are in Sub-Saharan Africa, with
DRC having by far the lowest score of all 30 countries,
just 10 out of a possible 84. The scores for one-third of
countries are values in the 50s—with representation from
all four subregions. Aside from this clustering around the
midpoint, no clear pattern emerges. Although our predeter-
mined choice of countries severely hampers our ability to
accurately detect patterns by region, the regional averages
are similarly low in Africa and South and Southeast Asia
(40 and 43, respectively) and similarly high in Latin America
and Eastern Europe (69 and 73, respectively).
Access to Services Component indicators. The three indicators in the ac-
cess to services component provide an overall measure of
adolescent women’s access to maternal and contraceptive
care, as shown by their actual use of these services (Table
2). The ability to get quality contraceptive care is critical
to allow adolescents to decide the timing and number of
births. At this age, postponing motherhood to achieve
more education can drastically alter the future. And when
these women do decide to start their families, getting
adequate prenatal and delivery care is essential to ensur-
ing both their own and their infants’ health. Combined, the
three indicators on use of these services provide a good
sense of how accessible they are to adolescent women.
• Percentage of women younger than 20 whose most recent birth was delivered at a health facility measures
receipt of basic maternal health care. This indicator, which
is limited to women who gave birth as adolescents in the
five years preceding the survey,† also gives a sense of ad-
olescents’ access to health care more generally, as many
planning through three media channels and whether these
messages have reached adolescents. It is a good measure
of a country’s commitment to increasing awareness of
family planning. The median value is in Indonesia, where
53% of adolescent women had recent exposure to mes-
sages about family planning. The lowest proportions are in
DRC and Pakistan (at 17–19%), countries that have histori-
cally had very weak family planning programs.33 Vietnam,
Colombia and the Philippines occupy the opposite end of
the spectrum, with at least 70% of adolescent women
saying they had had such recent exposure. Vietnam and
Colombia have had very strong national programs for
decades, and the timing of the Philippines’ survey in 2008
marked the start of a historic campaign to pass a repro-
ductive health law.34
• Percentage of secondary school–aged adolescent women attending secondary school is an indicator of their
potential exposure to life skills or sexuality education. It is
also an indicator of the minimum level of schooling wom-
en need to be educated enough to exert some control
over their reproductive lives. The median level of female
secondary school attendance at the time of the survey
lies between Ghana (42%) and Nigeria and India (46%
each). The range is wide—starting at 13% in Ethiopia and
Malawi, and reaching 85% in Ukraine. The strong educa-
tional disadvantage of Sub-Saharan African adolescents
is clear in the fact that, with the exception of Zimbabwe,
the remaining 11 countries in that subregion fall below the
median, with fewer than one-fifth of secondary school–
aged women attending school in five countries (Ethiopia,
Kenya, Malawi, Rwanda and Uganda). Unsurprisingly, in
the upper–middle income countries35 of Colombia and
Moldova* net attendance reaches 70–79%.
• Percentage of 15–19-year-old women exposed weekly to radio, television and newspapers denotes good, regular
access to all three of these mass media. Although adoles-
cents’ exposure has nothing to do with content, it does
provide a sense of the potential reach of these media for
programming that conveys messages about preserving
and protecting sexual and reproductive health and rights.
The indicator requires exposure to all three media every
week, so it is measuring a high level of exposure. Three
*Data on school attendance were unavailable from the surveys conducted in Ukraine and Guatemala. Thus, the data shown were drawn from the World Bank Development indicators and represent the percentage enrolled in (as opposed to attending) secondary school in the same years as the surveys. †There are two exceptions: Bangladesh and Vietnam, whose time frame for births is three years preceding the survey.
11Guttmacher Institute
which countries have made modern methods available
and accessible, it is useful in assessing how well mar-
ried adolescents are protected from the negative effects
of unintended pregnancy (including unsafe abortion) and
unplanned births (i.e., those that come too soon and those
that are not wanted at all).
The median is seen in Tanzania and Vietnam, each
with 39% of demand for contraception being met by mod-
ern methods. The values are evenly spread out—at least
through percentages in the 60s. The very high outliers,
at 76% and 87% in Rwanda and Indonesia, respectively,
reflect their very low levels of unmet need (6.4–6.7%)16
together with high levels of modern method use (29–48%
of married 15–19-year-olds use such methods). The same
cannot be said for Nigeria, DRC and Ghana, however; be-
cause these Sub-Saharan African countries have both low
modern method use and high unmet need, only 9–11%
of demand is met by modern methods. (To cite just one
of these three countries as an example, in Nigeria, 19%
of married adolescent women have an unmet need for
contraception, but only 2% use a modern method.13)
Component score. The median score on the access to
services component, 44.5, falls between Uganda and
Zambia. Values range from 11 to 87 (Figure 3). Compared
with scores for the first component (access to informa-
tion), the scores on access to services show more unifor-
mity, at least below the median until reaching the score
of 31; nine countries have scores within a narrow range
of 36 to 41. The four countries with the highest scores,
at 81–87, are all in Latin America—Colombia, Dominican
Republic, Honduras and Peru. These four also have rela-
tively high-performing national family planning programs
and have recently invested in promoting prenatal and
maternal care.33 Two countries stand out for having the
lowest scores by far—Ethiopia and Nigeria at 13 and 11,
respectively. In Ethiopia, because modern method use
satisfies a fairly high proportion of demand for contracep-
tion (above the median on this indicator), its overall low
score on the access to services component is driven by
its very low prevalence of facility-based births and prenatal
care coverage. Nigeria, on the other hand, has among the
lowest of all scores on all three service indicators, with
minimal adolescent use of modern contraceptives and of
maternal and prenatal care. Regional averages are 76 and
71 for Latin America and Eastern Europe, respectively.
The average is considerably lower in Africa and South and
Southeast Asia, at 43 and 39, respectively.
women will receive a package of services at the health
facility where they deliver. Mozambique and Zimbabwe,
with 63–65% of adolescent deliveries occurring at health
facilities, occupy the midpoint. Ethiopia is a notable outlier,
at just 12%, suggesting that adolescents there run the
highest risk of going without timely treatment should they
develop complications giving birth. At the other extreme,
facility-based births are basically universal, at 95–100%, in
five countries—the three in Eastern Europe and the two
Latin American nations of Colombia and the Dominican
Republic.
• Percentage who made four or more prenatal care visits among women younger than 20 at the time of birth for
their most recent pregnancy illustrates the extent to
which pregnant adolescents get consistent, preventive
care during pregnancy, which is critical for both mother
and child. Nepal and Zambia occupy the median value,
at 54–55%. Not only is the spread of values wide across
the 30 countries, but it is also more evenly distributed
than many other indicators, with at least a few countries
falling in nearly every 10–percentage point spread (starting
with values in 30s, 40s, 50s, etc.). There is some ex-
pected overlap with the related delivery care indicator just
mentioned, with Ethiopia again being an important outlier:
Just 15% of pregnant Ethiopian adolescents make the
recommended number of prenatal care visits. Moldova
and Dominican Republic again show the highest rates of
coverage, along with another upper–middle income coun-
try,35 Peru (at 90–94% for these three countries).
• Percentage of demand for contraception satisfied by use of modern methods among married 15–19-year-old women assesses the extent to which married adolescents
who want to avoid pregnancy are using effective, modern
methods as opposed to using less effective, traditional
ones or not using any method at all. (It is calculated by
dividing the percentage using a modern method by the
sum of the percentage having unmet need for contracep-
tion,* the percentage using a modern method and the
percentage using a traditional method.) As this indicator
incorporates elements of unmet need and the extent to
*In brief, unmet need among married adolescent women is the proportion who are able to become pregnant, want to postpone pregnancy for at least two years, but are nonetheless not using any method of contraception. In 2012, the DHS program revised how it calculates unmet need. The values presented here use the revised definition, so will not match those published in nearly all reports of surveys used in our index (source: Bradley SEK et al., Revising unmet need for family planning, DHS Analytical Studies, Calverton, MD, USA: ICF International, 2012, No. 25).
12 Guttmacher Institute
Agency in Sexual Activity, Sexual Health and Health Care Decisions Component indicators. The indicators in the agency
component speak to the extent to which adolescent wom-
en marry at age 20 or older (which enhances the possibil-
ity for independence and continued schooling); their ability
to protect themselves from pregnancy and STIs with
condoms; and to have a say in their own health care deci-
sions if married. It also includes a measure that shows the
extent to which adult women in society support providing
information to young adolescents on condoms (a proxy
for community approval of adolescents being allowed
to protect their sexual health; Table 3). Together, these
indicators provide a sense of adolescent women’s per-
sonal agency and the cultural environment in which they
navigate their sexual and reproductive lives. The quality of
this environment heavily influences whether adolescents
can make their own sexual and reproductive choices, or
whether those choices are made by others.
• Percentage of 15–19-year-old women who have never been married is our measure of adolescent marriage,
since all AISAR index items are scored in the same
direction, with higher scores denoting better outcomes
(i.e., higher proportions never marrying means a lower
prevalence of adolescent marriage). Delaying marriage
until after adolescence can mean more time to complete
schooling, which greatly increases opportunities for work
and economic independence. Postponing early marriage
can also delay the onset of early motherhood, which can
severely limit a young woman’s educational and profes-
sional prospects. Moreover, as the age gap between ado-
lescents and their husbands is often very wide, especially
in Sub-Saharan Africa,36,37 adolescents who have much
older husbands often have little say in when they have
sex, so simply delaying marriage in and of itself can mean
more sexual autonomy.
Tanzania and Zambia fall at the midpoint for this indica-
tor, with 80–81% of adolescent women never having
married at the time of their interview (when they were
aged 15–19). The range across countries is fairly small,
with values clustering in the 70s and 80s for 23 countries.
Bangladesh and Mozambique are clear outliers, as only
54–59% of adolescents in those countries have never
married. At the other extreme, most adolescent women,
91–96%, have never married in five countries: Albania,
Ghana, Rwanda, Ukraine and Vietnam.
• Percentage of 15–19-year-old women reporting they can get condoms on their own is a useful indicator of their
self-efficacy, specifically, their belief that they can access
services and overcome taboos that stigmatize women
for getting a condom on their own. Unfortunately, this
indicator reports responses to a hypothetical question,
“If you wanted to, could you yourself get a condom?”
and as such does not measure actual behavior. However,
for adolescent women, just feeling empowered to get a
condom without outside help is important, as it is the first
step toward self-protection from both unintended preg-
nancy and STIs.
Of the 24 countries with data on this indicator, the
midpoint falls between Ethiopia, and Albania and Nepal,
with 30–31% of adolescent women reporting that they
could get a condom if they wanted to. There is relatively
little variation from this median, with half of the coun-
tries having values within 10 percentage points of it. The
outliers by far are India and Nigeria, with fewer than 10%
of adolescents in those countries answering yes to this
question (8–9%). On the other end of the spectrum, three-
quarters of adolescent women in Colombia responded
they could get a condom on their own.
• Percentage of married 15–19-year-old women who have sole or joint (with husband) say in their own health care*
is a proxy for how much control a married adolescent has
over her life in general, and thus provides a glimpse of
the relationship dynamics of her marriage. Although the
question asks about health care overall, this can certainly
include contraceptive care as well as pregnancy-related
and HIV/STI care. Of the 28 countries supplying data, the
midpoint falls between Zambia and Ethiopia, where 59%
and 69%, respectively, of married adolescents say they
make health care decisions on their own or together with
their partner. The Sub-Saharan African, predominantly
Muslim country of Senegal is worthy of mention, as its
level is so much lower than any other country’s, at 19%.
(This means that 81% of Senegalese adolescent wives do
not participate at all in their health care decisions, which
are made for them by others, who are overwhelmingly
their husbands.) Two other countries have values below
30%—Nigeria and Pakistan. On the other hand, participa-
tion by young wives in decisions about their health care
is the norm in two of the three Eastern European coun-
tries, with 92–93% of Ukrainian and Moldovan adolescent
wives saying they decide on their own or jointly with their
*This indicator is the sum of two proportions in a percentage dis-tribution of women by their responses to the question asking who usually makes decisions about their health care (mainly wife, wife and husband jointly, mainly husband, other). Thus, this indicator measures the proportion reporting that they mainly control their health care decisions plus the proportion reporting that they have joint say with their husband.
13Guttmacher Institute
components’ scores, at 13–82; Eastern Europe has a
high average of 77 (but has only three countries) with a
small range of 62–85. South and Southeast Asia has an
average score of 41, with a range of 18–68. The region of
Latin America and the Caribbean has a narrower range of
64–86, with an average of 73.
Perception of Rights Within Marital RelationshipsComponent indicators. This component seeks to capture
adolescent women’s understanding of a wife’s rights to
autonomy in a marriage (Table 4). Similar to the indicators
in the previous component on agency, the indicators for
this component also provide a glimpse into a complex so-
cial topic: gender equality, specifically the roles and rights
of each sex in a marital relationship. The culturally defined
attitudes around what happens in the private sphere of
marriage can reveal a great deal about normative expecta-
tions and attitudes—that is, although these data refer to
the perceptions of many still unmarried adolescents, they
reflect societal norms. Except for the four countries that
interviewed ever-married women only (Bangladesh, Egypt,
Pakistan and Vietnam), the responses are from all adoles-
cents regardless of marital status, and we know that only
a minority—from 4% in Rwanda to 41% in Mozambique—
of 15–19-year-olds in these countries had ever married
by the time of the survey. Thus, these attitudes, and
their attendant expectations for behaviors, reflect what
adolescent women have witnessed in their own family
and what their culture dictates to be appropriate behavior
for a wife. Although the indicator wording refers to rights
within marital relationships only, adolescent women’s
responses are surely also influenced by what they have
lived or witnessed in sexual relationships outside of mar-
riage. Together, these indicators describe the perceptions
of what adolescent women assume will be their sexual
rights within marriage, including rights to exercise control
over sexual activity, to be free from infection and to be
free from domestic violence.
• Percentage of 15–19-year-old women who agree with three reasons why a wife would be justified in refus-ing sex (i.e., she knows her husband has sex with other women, she knows that he has an STI, or she is tired or not in the mood) measures the extent to which adoles-
cent women feel a wife must have sex with her husband
irrespective of his infidelity, her risk of infection and her
desire to not have sex. This indicator does not reflect
actual personal behavior, but instead gives a sense of ado-
lescent women’s expectations of a wife’s role and status
in marital relationships. Of the 25 countries with data on
husband. Unlike many other indicators whose values are
more evenly spread across each 10–percentage point
value range, eight of the 28 countries with data, repre-
senting all four subregions, have percentages in the 70s
denoting moderately high levels of participation.
• Percentage of 18–49-year-old women who agree that 12–14-year-olds should be taught about condoms shows
the level of community support broadly for young adoles-
cents being informed about ways to protect their sexual
health and, more specifically, support for providing sexual
health education when it is needed most—before the age
by which most adolescents become sexually active. Al-
though the indicator measures support for information on
one subject only, condom use is so essential to both preg-
nancy and HIV prevention that it is a good proxy for adult
support of young adolescents’ right to receive sexuality
education in general and to be informed about their sexual
health. We present data on adult women’s attitudes only,
and their responses refer to educating 12–14-year-olds of
both sexes about condom use in 21 of the 22 countries
with data. (The sole exception is India, whose question-
naire differed on every part of this indicator; see Table 3.)
Of the 22 countries, the midpoint lies between Malawi
and Mozambique, at 58% each, and Albania and Kenya, at
61% each. The highest proportions of adult women sup-
porting education on condom use (91–93%) are in Latin
American or Eastern European countries, which have low
levels of HIV prevalence (Dominican Republic, Honduras,
Colombia and Ukraine). India and Vietnam show the low-
est values for this indicator, at 28–29%.
Component score. Kenya’s agency component score,
at 53, falls at the midpoint for all countries, which have a
range from 13 to 86 (Figure 4). Variation from the median
on this score is fairly evenly spread out, with at least a
few countries falling within every 10–percentage point
grouping (e.g., 60s, 70s, 80s) except for the one true
outlier, Nigeria, at 13; this country was among the three
with the lowest values for every indicator making up this
component. That a Sub-Saharan African country, Rwanda,
has the fourth-highest score on this component (right
behind Moldova, Ukraine and Colombia) is encouraging
and unexpected. It speaks to that country’s nation-building
with a focus on gender equality after its institutions and
infrastructure were all but destroyed in the mid-1990s;
Rwanda’s very high ranking on the gender equity index
demonstrates that relatively poor countries can suc-
cessfully implement policies that improve the status
of women.38 Regionally, Africa has an average agency
component score of 46, with a wider range than the other
14 Guttmacher Institute
• Percentage of 15–19-year-old women who disagree with all five reasons that would justify a husband hitting his wife addresses the following reasons: the wife burns the
food, she argues with her husband, she goes out without
telling him, she neglects the children and she refuses
sexual intercourse with him. This indicator measures
adolescent women’s attitudes on the unacceptability of
domestic violence—the higher the proportion, the more
unacceptable. Given the exact reasons posed in the ques-
tion, the indicator reflects attitudes toward the rights to
sexual autonomy, to freedom of movement and to free-
dom of expression. Nigeria occupies the midpoint, at 60%
disagreeing with all five reasons, a positive for this country
that so often is at the lowest point on other indicators.
The values on this indicator are relatively evenly spread
out across countries, with two notable exceptions. Rejec-
tion of justifications for domestic violence is universal in
the South Asian country of Nepal (at 99%). At the other
extreme, only one-quarter (26%) of adolescents in the
Sub-Saharan African country of DRC agreed that domestic
violence would be not be justified in all five circumstances
presented in the question; in other words, three-quarters
agree that it would be justified in at least one of these
circumstances.
Component score. The results for the perceptions of
rights component show a wide range of scores—from
zero (in DRC) to 96 (in both the Dominican Republic and
Peru; Figure 5). The actual values on all three of DRC’s
indicators in this component are above zero, but the
component score is zero, because of how we set up the
conversions for minimums in component scores among
the 30 countries; that is, the zero is a relative score, mean-
ing DRC has the lowest score by comparison with all
other countries. The median score of 56.5 falls between
the Sub-Saharan African nations of Rwanda and Ghana.
With the important exception of DRC just mentioned,
scores for this component are among the most evenly
spread out of the four (i.e., no real clustering), with at
least three countries falling into five 10–percentage point
spreads (i.e., the 30s, 40s, 50s, 70s and 90s). Exclud-
ing DRC, the three countries with the lowest scores are
Senegal, Zambia and Mozambique (25–31). Nepal, Peru
and the Dominican Republic occupy the opposite end of
the score spectrum (94–96). The appearance of the South
Asian nation of Nepal in this list of highest-scoring coun-
tries is encouraging. The regional average for this index
varies widely. It is 39 in Africa, 58 in South and Southeast
Asia, 75 in Eastern Europe, and 88 in Latin America and
the Caribbean.
this indicator,* the median falls at Ghana, with 61% agree-
ing a wife has the right to refuse intercourse in all three
specified circumstances. The lowest proportions endors-
ing wives’ sexual autonomy are found in the Sub-Saharan
African nations of DRC and Senegal (26% and 31%,
respectively). On the other hand, in two countries, both in
Latin America (Dominican Republic and Peru), 87–88% of
adolescent women believe a wife has the right to refuse
sex with her husband in all three circumstances.
• Percentage of 15–19-year-old women who believe that if a wife knows that her husband has an STI, she is justified in asking him to use a condom gauges women’s ability
to negotiate condom use within marriage. This question
cannot get at what happens should a husband refuse that
request. As with many of the attitude questions, nationally
representative surveys that are primarily concerned with
behaviors can get at only the essential first step toward
women’s empowerment and autonomy. In many coun-
tries, taboos against using condoms in marriage mean that
married women are at especially high risk for STIs, includ-
ing HIV. These risks are heightened when adolescent
women marry much older men who are likely to have (or
have had) extramarital sexual partners; such pronounced
age disparity is especially common in many countries in
Sub-Saharan Africa with high HIV prevalence.36,37
Among the 27 countries with data for this indicator,†
Albania occupies the midpoint, at 80% of adolescent
women saying they believe a wife is justified in asking
that her husband use a condom if he has an STI. This
high-value median, and the lack of real variation from it (17
of the 27 countries with data fall at the median or within
12 percentage points of it) shows a lot of support in these
countries of a wife’s right to ask her husband to use a con-
dom (or to refuse sex with him, the proxy for this indicator
used in six of the 27 countries). The outliers include the
Dominican Republic, where support for a wife’s request
for condom use is nearly universal (97%) and DRC, where
fewer than half (47%) of 15–19-year-old women agree that
a wife should be able to ask a husband to use a condom if
he has an STI.
*Because the surveys in Honduras, Mozambique and Uganda did not ask about three situations in which a wife would be justified in refusing sex, we provide available data for just one of the three reasons—namely, knowing that her husband “is having sex with other women.”
†Questionnaires for six of these included countries—Bangladesh, Bolivia, India, Indonesia, Peru and the Philippines—did not ask this specific question. Therefore, for these countries, this indica-tor uses a related measure, namely, the “percentage of women aged 15–19 who believe that if a husband has an STI, his wife is justified in refusing to have intercourse with him.”
15Guttmacher Institute
The remaining four countries—Bangladesh, India, Pakistan
and Vietnam—fall substantially below the median. In the
case of the Sub-Saharan African countries, their sheer
number (13) means that they are likely to have a notable
range: This group’s summary scores range from a low of
17 in DRC to a high of 65 in Rwanda. With the important
exception of Rwanda, the other countries in this subre-
gion fall at or below the median of the summary index.
The situation for adolescents in these 12 countries leaves
much room for improvement.
Index of Adolescents’ Needs for Information and Services Together with AISARAs mentioned earlier, we wanted to provide policymakers
and program planners with a way to use the AISAR index
and came up with a potential index of need for informa-
tion and services (needs index) to pair it with. This second
index quantifies the extent to which adolescents’ sexual
and reproductive behaviors or related outcomes create
potential need for information and services.
Needs Index IndicatorsWe selected seven indicators for inclusion, all of which
can represent different aspects of need among adoles-
cent women for sexual and reproductive information and
services (Table 6).
• Percentage of 15–19-year-old women who have ever had sexual intercourse, regardless of marital status, is a useful
indicator of the minimum level of need for sexual health
information and services. Ideally, all adolescent women
(not only those who have ever had sex) should receive
such information and services. In four countries—Egypt,
Bangladesh, Pakistan and Vietnam—where only ever-
married women were interviewed, we use the available
data on the percentage ever having married as a proxy for
the percentage ever having had sex. This assumption is
plausible because sexual activity before marriage is very
low in these four countries, based on data available from
studies other than the national DHS surveys.8
In most countries, 25–45% of 15–19-year-old women
report that they have had sexual intercourse. Bolivia and
Senegal are at the midpoint (30%). Seven countries—
most of which have a relatively high age at first marriage
and some of which are also known for having especially
conservative sexual and gender values—have values at
14% and below. In only three countries have at least 50%
of adolescent women ever had sex: Colombia in Latin
America and two of the least developed Sub-Saharan
African countries, DRC and Mozambique. The latter coun-
try has a very high proportion of adolescents who have
AISAR Index Summary Score We combined each country’s individual component scores
(Tables 1–4) to yield a country-level summary AISAR index
score (Table 5). The higher the score, the more likely
that adolescent women live in an environment that is
conducive to enhancing and protecting their sexual and
reproductive health and rights. Lower scores, on the other
hand, suggest that adolescent women are having a hard
time getting the information and services they need to
achieve a good overall state of sexual and reproductive
health.
The AISAR index summary scores range from 17 to
86 across countries (Figure 6). There are two 10-point
“modes”—that is, scores in the 40s and in the 50s (with
six countries each). The rest of the countries fall within
the following 10-point spreads—80s (three countries), 70s
(four), 60s (four), 30s (three) and 20s (three), and DRC’s
score is the lowest, at 17. The midpoint, at 51.5, falls
between two Sub-Saharan African countries, Ghana and
Malawi. As expected, given that Colombia, Dominican
Republic and Ukraine show high scores on individual com-
ponents (always in the top five), these three countries also
have the highest summary scores. From the lowest-score
standpoint, the placement of DRC, Nigeria and Senegal
reflects the fact that they fall within the eight lowest
scores on the information, agency and rights components.
Interestingly, Senegal did relatively well on one compo-
nent—it is close to the median on the access to services
component score—suggesting that despite good access
to services, adolescent women in Senegal are hampered
from attaining overall good sexual and reproductive health
because they lack information, agency and rights.
It is encouraging to see that the Sub-Saharan African,
low-income country of Rwanda35 has a summary index
score that places it within the eight highest-scoring coun-
tries. Rwanda’s divergence from the 12 other Sub-Saharan
African countries’ summary scores likely stems from its
very high performance on the access to services and
agency components. Unsurprisingly, given their individual
component scores, all six Latin American countries fall
within the top nine highest scores on the summary index.
Another clear pattern emerges with the three Eastern
European countries: Ukraine is the highest scoring on
three of the four components (exception is services),
followed closely by Moldova (with services exception just
mentioned, where it is highest), and Albania brings up the
rear. It is worth noting, however, that Albania’s score is
above the median on all four components.
Of the seven very different South and Southeast
Asian countries represented, the Philippines, Nepal and
Indonesia fall above the median on the summary index.
16 Guttmacher Institute
sesses how well married adolescents’ desire to postpone
pregnancy matches their contraceptive practice. We lack
data on the subset of women who usually present the
highest unmet need for contraception—single adolescents
who are currently sexually active—because of the very
small sample sizes of such women in some countries and
the lack of data for this subgroup in a few countries. High
levels of unmet need for contraception show that many of
the women who potentially need contraceptive methods
do not have access to them (i.e., mismatch between low
levels of contraceptive use and strong desires to avoid
pregnancy). Low levels of unmet need can mean either that strong desires to postpone pregnancy are being met
with high levels of contraceptive use or that few women
want to postpone pregnancy and so very few are practic-
ing contraception; in both cases, however, the absolute
level of unmet need for contraception is low.
Two Sub-Saharan African countries, Mozambique and
Zambia, fall at the midpoint for this indicator, at 22%. It
shows relatively little variation, with 18 of the 30 countries
having percentages of unmet need in the teens and 20s.
Three countries have extremely low levels of unmet need
at less than 10% (Egypt, Indonesia and Rwanda). The
country with the highest unmet need by far is Ghana, at
62%. The distance of this value from the next highest one
represents the single most important outlier in our study,
showing a true departure from the norm and suggests
that Ghanaian married adolescents are at highest risk for
unplanned childbearing and unsafe abortion.
• Percentage of recent births to mothers younger than 20 that were unplanned conveys the extent to which
adolescents may need contraceptive services. It should
be mentioned that this indicator refers to only those
unintended pregnancies (i.e., those wanted later or not
at all) that were brought to term; given the lack of data
on abortion incidence among adolescents by country, it
does not include the many additional unintended pregnan-
cies that ended not in births but in induced abortions. The
median falls between Ethiopia and the Philippines, at 28%
and 30%, respectively, of recent births being unplanned.
In four countries, fewer than 10% of births to adolescents
are unplanned (Egypt, Pakistan, Indonesia and Albania).
Unsurprisingly, the three countries with the highest levels
of unplanned childbearing are in Latin America, a region
that tends to have far lower fertility—and more important
for this measure, lower wanted fertility—than the other
regions included in our indices. Specifically, in Bolivia,
Colombia and Peru, nearly two-thirds of all births to
women who were adolescents when they delivered were
unplanned. That at least one-quarter of recent births were
ever married (not shown), which contributes to its high
level on this ever sex indicator.
• Percentage of 18–24-year-old women who married before age 18 shows the extent to which women have
married before reaching adulthood. Early marriage often
means a high likelihood of childbearing during adoles-
cence, which increases need for pregnancy and deliv-
ery care; it is also directly related to increased need for
contraceptive care. And in countries where young women
have far older spouses and condom use is taboo within
marriage, adolescent wives are at very high risk for STI in-
fection, including HIV.36 Women who marry very young are
often less able than older women to access the informa-
tion and services they need.
One Sub-Saharan African country and one South Asian
country, Zimbabwe and Pakistan, respectively, occupy
the midpoint at 30% of 18–24-year-olds marrying before
adulthood. More than half of the 30 countries cluster
around the midpoint within a 10–percentage point spread
(with values in the 20s, 30s and 40s). The outliers with the
lowest prevalence of such early marriages, at 7–9%, are
two of the three Eastern European countries (Albania and
Ukraine) and Rwanda and Vietnam. On the other end of
the spectrum, marrying while still a minor is by far most
frequent in Bangladesh, as 69% of 18–24-year-olds in that
country have married before age 18.
• Average gap in years between median ages at first intercourse and first marriage measures the average
duration of the period during which adolescents engage in
premarital sexual activity, which heightens their need for
information and services to prevent unintended pregnancy
and STIs. These all-important services need to be spe-
cially tailored so adolescents can overcome the obstacles
created by stigma condemning sexual activity outside of
marriage. The midpoint value for this gap is one year, as
shown in Rwanda and Guatemala. For eight countries, the
gap is zero, indicating that first sex effectively coincides
with first marriage; for four of these countries, the value
is assumption-based, in the absence of the necessary
data from surveys in these countries (Egypt, Bangladesh,
Pakistan and Vietnam). In six countries, the gap in the tim-
ing of first sex relative to first marriage is more than two
years. Adolescent women are at risk for possible negative
outcomes from premarital sexual activity for the longest
durations in the Latin American countries of Peru and
Colombia (3.1 years and 3.8 years, respectively).
• Percentage of married 15–19-year-olds who have an un-met need for contraception is a standard measure that as-
17Guttmacher Institute
zambique, having the highest level of need, with an outlier
value of 80. The countries with the next highest scores,
in the 60s, include four Sub-Saharan African countries
(Ghana, Malawi, Uganda and Zambia) and one Latin Ameri-
can country (Colombia). The three countries that score
lowest on this index are Egypt, Indonesia and Vietnam.
These three countries likely have the lowest level of need
for information and services because they each have low
levels of early marriage (and sex), little premarital sexual
activity, few unplanned births (albeit for different reasons)
and low adolescent fertility rates.
A Practical Application—Crossing the Needs and the AISAR IndicesPlotting the needs index score (on the vertical axis, scaled
from 6 to 80) against the AISAR index (on the horizontal
axis, from 17 to 86; Figure 7) clarifies the connection
between a given country’s needs with respect to adoles-
cents’ sexual and reproductive health and rights and the
current conditions that inform and influence those needs.
Countries’ scores on these two indices place them into
four quadrants.
In interpreting the scatter plot figure, it is important to
bear in mind that both indices are relative measures and
show the position of each country relative to all others in
the analysis. In other words, the indices are not measur-
ing the absolute level of need or the precise conditions
conducive to adolescent women’s sexual and reproductive
health. Because this group of 30 countries is very diverse,
the indices span a very wide range of needs and condi-
tions. Another basic point affecting interpretation and use
of this figure is the notable absence of a sexuality educa-
tion indicator from both indices. Although we lack data,
all adolescents need comprehensive sexuality informa-
tion that is appropriate to their development and that is
provided early enough in adolescence to enable them to
make informed decisions about having sex and protect-
ing their sexual health when they become sexually active.
While the indicators and components that comprise the in-
dices point to lower or higher levels of need, and to poorer
or better conditions conducive to adolescent women’s
protecting their sexual health, some fundamental and
universal needs are not captured by the indices.
Placement in the upper left quadrant of the scatter plot
indicates the greatest mismatch between adolescents’
sexual and reproductive needs and their actual situation
(i.e., highest need and poorest state of current sexual and
reproductive health). The countries in the lower left quad-rant have a poorer adolescent sexual and reproductive
health situation, but their lower level of need means that
fewer resources are likely called for. Being situated in the
unplanned in 17 countries shows a high level of need
for contraceptive information and services among
adolescents.
• Age-specific fertility rate among 15–19-year-olds, or the
annual rate at which adolescents give birth, shows the
extent of early childbearing. Having a baby during adoles-
cence is a good marker of potential needs for maternal
and child health services. High adolescent fertility might
also signal high need for contraceptive care. The spread
between countries with the highest and lowest rates is
very large, that is, rates from 17 to 167 births per 1,000
women aged 15–19. The midpoint falls roughly between
India and Bolivia, where the annual rate is 88–90 births
per 1,000 women aged 15–19. All three Eastern European
countries fall among the four with rates below 35; the
fourth is the Southeast Asian country of Vietnam (at 25).
These rates sharply contrast with the highest rate of 167
births per 1,000 adolescents in Mozambique. The next
five highest values, from 121 to 152, are all in other Sub-
Saharan African countries (DRC, Malawi, Nigeria, Uganda
and Zambia).
• Percentage of 15–24-year-old women infected with HIV
is the closest measure to prevalence among adolescents,
and it is available for 29 of 30 countries (Albania is the
exception). This proportion gives a sense of how far the
epidemic has reached into the general youth population as
of 2012. If high, it signals an elevated need for treatment
and counseling; in particular, HIV-positive women need
tailored counseling in fulfilling culturally prescribed roles
as wives and mothers. Among the 29 countries with data,
Senegal occupies the midpoint with a prevalence of 0.3%.
As expected, prevalence rates are very low in the majority
of countries. The exceptions are nine Sub-Saharan African
countries that have generalized epidemics (a country is
considered to have a generalized epidemic if the HIV prev-
alence is 1% or more in the overall population); within this
group, 4–7% of 15–24-year-old women are HIV positive in
Malawi, Mozambique, Uganda, Zambia and Zimbabwe.
Needs Index Scores The overall scores on the needs index show the extent to
which the situation of adolescent women creates need
but no more. That is, the scores say nothing about the ex-
tent to which this need is met. The higher the score, the
greater the need for information and services. This index’s
median score falls between Honduras, at 45, and Bangla-
desh and Nigeria, at 46 each. The needs scores are very
evenly spread out, with values in every 10–percentage
point spread up to the score of 68, with one country, Mo-
18 Guttmacher Institute
at just a single AISAR index component instead of the
summary index that incorporates all four. Figure 8 graphs
the only component for which we have complete indica-
tor data from all 30 countries, access to services, against
the needs index. The result is some shifting in and out of
quadrants (four countries), but for the most part, countries
stayed within their original quadrant, with some changing
position within it. For example, because Nepal’s and the
Philippines’ services scores mostly fall below the median,
these two countries moved toward poorer health condi-
tions—that is, from the lower right quadrant in Figure 7 to
the lower left quadrant in Figure 8.
In addition, the relatively high scores on the services
index in two Sub-Saharan African countries, Zambia and
Zimbabwe, moved them toward better conditions, out of
the upper left quadrant and into the upper right quadrant.
Nigeria’s very low modern contraceptive use, together
with its low maternal and prenatal coverage, moved that
country even further to the extreme on the AISAR index
within the quadrant characterized by high needs and poor
sexual and reproductive health. Mozambique moved a
bit to the right within the high-needs and poor-conditions
quadrant, toward a slightly better health situation.
The above confirms that the pattern of overall need
for improvement in conditions that are conducive to
adolescent women’s sexual and reproductive health is
very similar whether we consider the full AISAR index
or only its component that measures access to services.
In addition, the key result shown in both figures is that
the most pressing issues of high levels of need and very
poor adolescent health—that is, countries in the upper left
quadrant—demand immediate programmatic attention.
lower right quadrant signals the best situation—relatively
low need and better sexual and reproductive health condi-
tions for adolescent women. Finally, being situated in the upper right quadrant indicates a good overall situation—al-
though the level of need is high, the sexual and reproduc-
tive health situation is also relatively better. Thus, the “fit”
of a country’s needs to the actual sexual and reproductive
health environment for adolescents is poorest in the upper
left quadrant and best in the lower right quadrant.
The distribution of the 30 countries across the four
quadrants shows that where a country falls on the AISAR
index can have very different programmatic implications
depending on where it lies on the needs index. Figure 7
shows a generalized distribution of the four major regions
into the four major quadrants. That is, 10 Sub-Saharan
African countries cluster in (or right up against) the up-
per left quadrant. Placement within the quadrant is also
revealing: In this quadrant, Mozambique has both the
highest overall level of need and the third poorest adoles-
cent sexual and reproductive health conditions, meaning
it requires a very large investment in programming. The
position within this quadrant of DRC and Nigeria, below
Mozambique on the needs index but furthest to the left
on the health conditions index, suggests that these two
countries also require substantial investment to improve
standards of adolescent sexual and reproductive health.
Two Sub-Saharan African countries (Senegal and
Ethiopia) and the enormous South Asian nation of India
cluster in the upper part of the lower left quadrant, indicat-
ing relatively poor conditions of adolescent health and
medium levels of need. Pakistan and Vietnam fall low
on the needs index, toward the bottom of this quadrant,
but they also are below the median on conditions condu-
cive to good adolescent sexual and reproductive health.
All three Eastern European countries, one Sub-Saharan
African country (Rwanda) and one Southeast Asian coun-
try (Philippines) all fall toward the center of the lower right
quadrant, indicating higher than median levels of adoles-
cent sexual and reproductive health and lower than me-
dian levels of need. In this quadrant, the Southeast Asian
nation of Indonesia and the North African country of Egypt
lie at the lower end of the needs index range. Collectively,
these findings indicate that within the limitations of what
we can measure, the countries falling in the lower right
quadrant are in a relatively good situation. Finally, five of
the six Latin America countries cluster in (or on the bound-
ary of) the upper right quadrant, with medium to high lev-
els of need and medium to good conditions of adolescent
sexual and reproductive health.
Because this exercise is exploratory, we decided
to see how the scatter plot would change if we looked
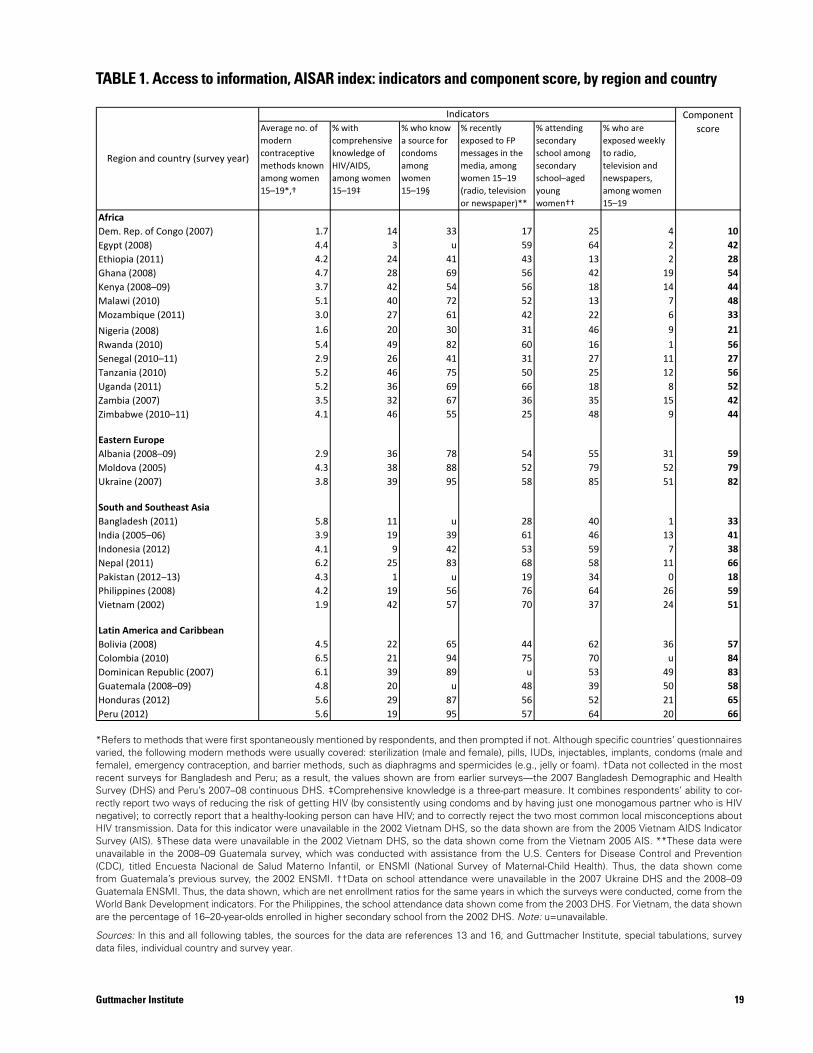
19Guttmacher Institute
Average no. of modern contraceptive methods known among women 15–19*,†
% with comprehensive knowledge of HIV/AIDS, among women 15–19‡
% who know a source for condoms among women 15–19§
% recently exposed to FP messages in the media, among women 15–19 (radio, television or newspaper)**
% attending secondary school among secondary school–aged young women††
% who are exposed weekly to radio, television and newspapers, among women 15–19
AfricaDem. Rep. of Congo (2007) 1.7 14 33 17 25 4 10Egypt (2008) 4.4 3 u 59 64 2 42Ethiopia (2011) 4.2 24 41 43 13 2 28Ghana (2008) 4.7 28 69 56 42 19 54Kenya (2008–09) 3.7 42 54 56 18 14 44Malawi (2010) 5.1 40 72 52 13 7 48Mozambique (2011) 3.0 27 61 42 22 6 33Nigeria (2008) 1.6 20 30 31 46 9 21Rwanda (2010) 5.4 49 82 60 16 1 56Senegal (2010–11) 2.9 26 41 31 27 11 27Tanzania (2010) 5.2 46 75 50 25 12 56Uganda (2011) 5.2 36 69 66 18 8 52Zambia (2007) 3.5 32 67 36 35 15 42Zimbabwe (2010–11) 4.1 46 55 25 48 9 44
Eastern EuropeAlbania (2008–09) 2.9 36 78 54 55 31 59Moldova (2005) 4.3 38 88 52 79 52 79Ukraine (2007) 3.8 39 95 58 85 51 82
South and Southeast AsiaBangladesh (2011) 5.8 11 u 28 40 1 33India (2005–06) 3.9 19 39 61 46 13 41Indonesia (2012) 4.1 9 42 53 59 7 38Nepal (2011) 6.2 25 83 68 58 11 66Pakistan (2012–13) 4.3 1 u 19 34 0 18Philippines (2008) 4.2 19 56 76 64 26 59Vietnam (2002) 1.9 42 57 70 37 24 51
Latin America and CaribbeanBolivia (2008) 4.5 22 65 44 62 36 57Colombia (2010) 6.5 21 94 75 70 u 84Dominican Republic (2007) 6.1 39 89 u 53 49 83Guatemala (2008–09) 4.8 20 u 48 39 50 58Honduras (2012) 5.6 29 87 56 52 21 65Peru (2012) 5.6 19 95 57 64 20 66
TABLE 1. Access to information, AISAR index: indicators and component score, by region and country
Indicators
Region and country (survey year)
Component score
TABLE 1. Access to information, AISAR index: indicators and component score, by region and country
*Refers to methods that were first spontaneously mentioned by respondents, and then prompted if not. Although specific countries’ questionnaires varied, the following modern methods were usually covered: sterilization (male and female), pills, IUDs, injectables, implants, condoms (male and female), emergency contraception, and barrier methods, such as diaphragms and spermicides (e.g., jelly or foam). †Data not collected in the most recent surveys for Bangladesh and Peru; as a result, the values shown are from earlier surveys—the 2007 Bangladesh Demographic and Health Survey (DHS) and Peru’s 2007–08 continuous DHS. ‡Comprehensive knowledge is a three-part measure. It combines respondents’ ability to cor-rectly report two ways of reducing the risk of getting HIV (by consistently using condoms and by having just one monogamous partner who is HIV negative); to correctly report that a healthy-looking person can have HIV; and to correctly reject the two most common local misconceptions about HIV transmission. Data for this indicator were unavailable in the 2002 Vietnam DHS, so the data shown are from the 2005 Vietnam AIDS Indicator Survey (AIS). §These data were unavailable in the 2002 Vietnam DHS, so the data shown come from the Vietnam 2005 AIS. **These data were unavailable in the 2008–09 Guatemala survey, which was conducted with assistance from the U.S. Centers for Disease Control and Prevention (CDC), titled Encuesta Nacional de Salud Materno Infantil, or ENSMI (National Survey of Maternal-Child Health). Thus, the data shown come from Guatemala’s previous survey, the 2002 ENSMI. ††Data on school attendance were unavailable in the 2007 Ukraine DHS and the 2008–09 Guatemala ENSMI. Thus, the data shown, which are net enrollment ratios for the same years in which the surveys were conducted, come from the World Bank Development indicators. For the Philippines, the school attendance data shown come from the 2003 DHS. For Vietnam, the data shown are the percentage of 16–20-year-olds enrolled in higher secondary school from the 2002 DHS. Note: u=unavailable.
Sources: In this and all following tables, the sources for the data are references 13 and 16, and Guttmacher Institute, special tabulations, survey data files, individual country and survey year.
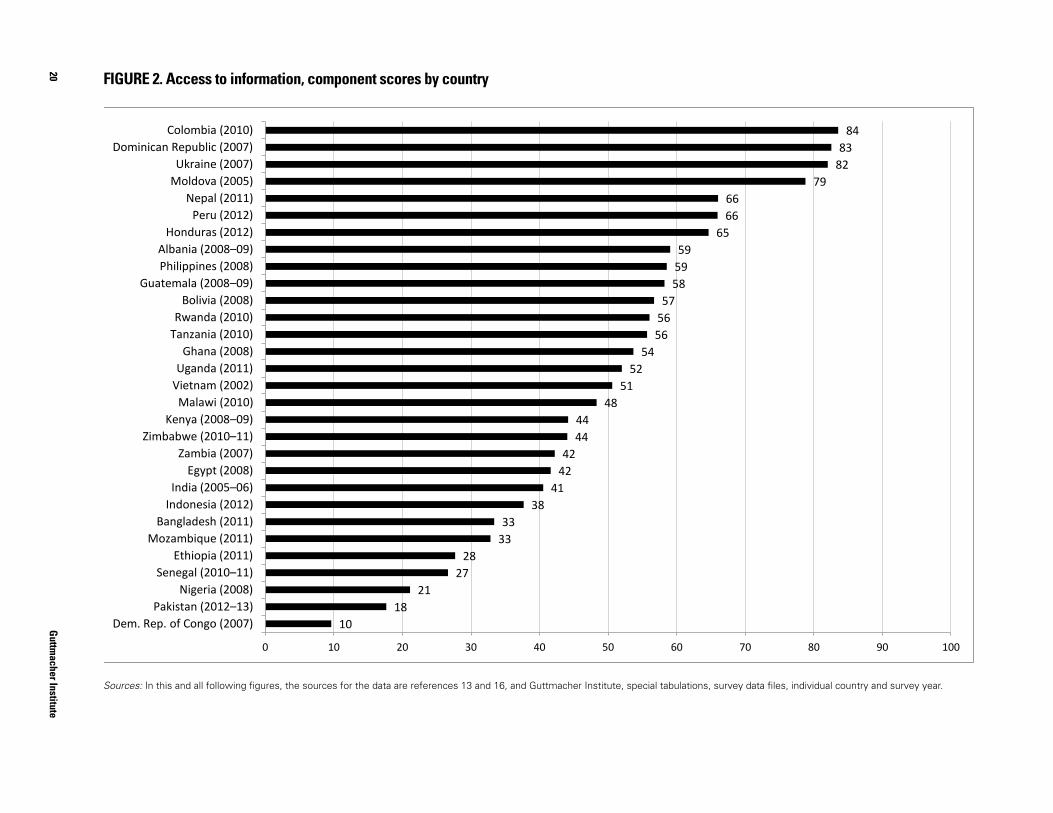
20G
uttmacher Institute
FIGURE 2. Access to information, component scores by country
Sources: In this and all following figures, the sources for the data are references 13 and 16, and Guttmacher Institute, special tabulations, data files, individual country and survey year.
10 18
21 27
28 33 33
38 41
42 42
44 44
48 51
52 54
56 56 57
58 59 59
65 66 66
79 82 83
84
0 10 20 30 40 50 60 70 80 90 100
Dem. Rep. of Congo (2007) Pakistan (2012–13)
Nigeria (2008) Senegal (2010–11)
Ethiopia (2011) Mozambique (2011)
Bangladesh (2011) Indonesia (2012) India (2005–06)
Egypt (2008) Zambia (2007)
Zimbabwe (2010–11) Kenya (2008–09)
Malawi (2010) Vietnam (2002) Uganda (2011)
Ghana (2008) Tanzania (2010) Rwanda (2010)
Bolivia (2008) Guatemala (2008–09)
Philippines (2008) Albania (2008–09)
Honduras (2012) Peru (2012)
Nepal (2011) Moldova (2005) Ukraine (2007)
Dominican Republic (2007) Colombia (2010)
FIGURE 2. Access to information, component scores by country
Sources: In this and all following figures, the sources for the data are references 13 and 16, and Guttmacher Institute, special tabulations, survey data files, individual country and survey year.
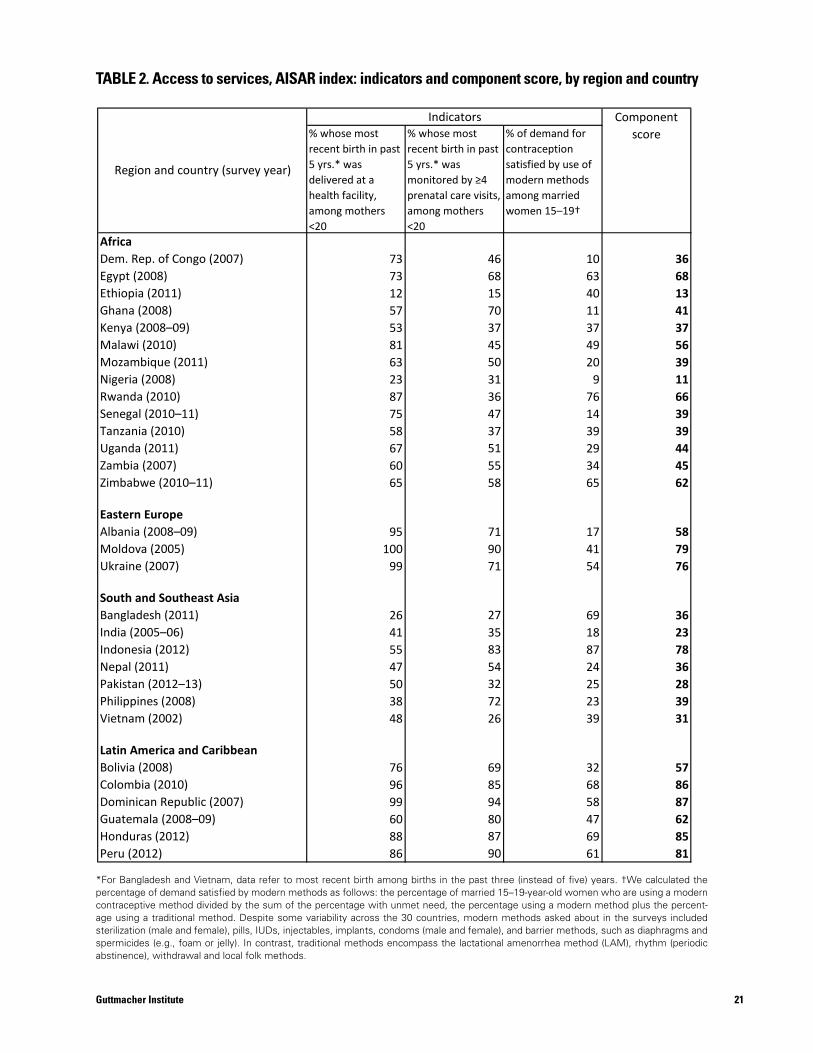
% whose most recent birth in past 5 yrs.* was delivered at a health facility, among mothers <20
% whose most recent birth in past 5 yrs.* was monitored by ≥4 prenatal care visits, among mothers <20
% of demand for contraception satisfied by use of modern methods among married women 15–19†
AfricaDem. Rep. of Congo (2007) 73 46 10 36Egypt (2008) 73 68 63 68Ethiopia (2011) 12 15 40 13Ghana (2008) 57 70 11 41Kenya (2008–09) 53 37 37 37Malawi (2010) 81 45 49 56Mozambique (2011) 63 50 20 39Nigeria (2008) 23 31 9 11Rwanda (2010) 87 36 76 66Senegal (2010–11) 75 47 14 39Tanzania (2010) 58 37 39 39Uganda (2011) 67 51 29 44Zambia (2007) 60 55 34 45Zimbabwe (2010–11) 65 58 65 62
Eastern EuropeAlbania (2008–09) 95 71 17 58Moldova (2005) 100 90 41 79Ukraine (2007) 99 71 54 76
South and Southeast AsiaBangladesh (2011) 26 27 69 36India (2005–06) 41 35 18 23Indonesia (2012) 55 83 87 78Nepal (2011) 47 54 24 36Pakistan (2012–13) 50 32 25 28Philippines (2008) 38 72 23 39Vietnam (2002) 48 26 39 31
Latin America and CaribbeanBolivia (2008) 76 69 32 57Colombia (2010) 96 85 68 86Dominican Republic (2007) 99 94 58 87Guatemala (2008–09) 60 80 47 62Honduras (2012) 88 87 69 85Peru (2012) 86 90 61 81
TABLE 2. Access to services, AISAR index: indicators and component score, by region and country
Indicators Component score
Region and country (survey year)
TABLE 2. Access to services, AISAR index: indicators and component score, by region and country
*For Bangladesh and Vietnam, data refer to most recent birth among births in the past three (instead of five) years. †We calculated the percentage of demand satisfied by modern methods as follows: the percentage of married 15–19-year-old women who are using a modern contraceptive method divided by the sum of the percentage with unmet need, the percentage using a modern method plus the percent-age using a traditional method. Despite some variability across the 30 countries, modern methods asked about in the surveys included sterilization (male and female), pills, IUDs, injectables, implants, condoms (male and female), and barrier methods, such as diaphragms and spermicides (e.g., foam or jelly). In contrast, traditional methods encompass the lactational amenorrhea method (LAM), rhythm (periodic abstinence), withdrawal and local folk methods.
21Guttmacher Institute
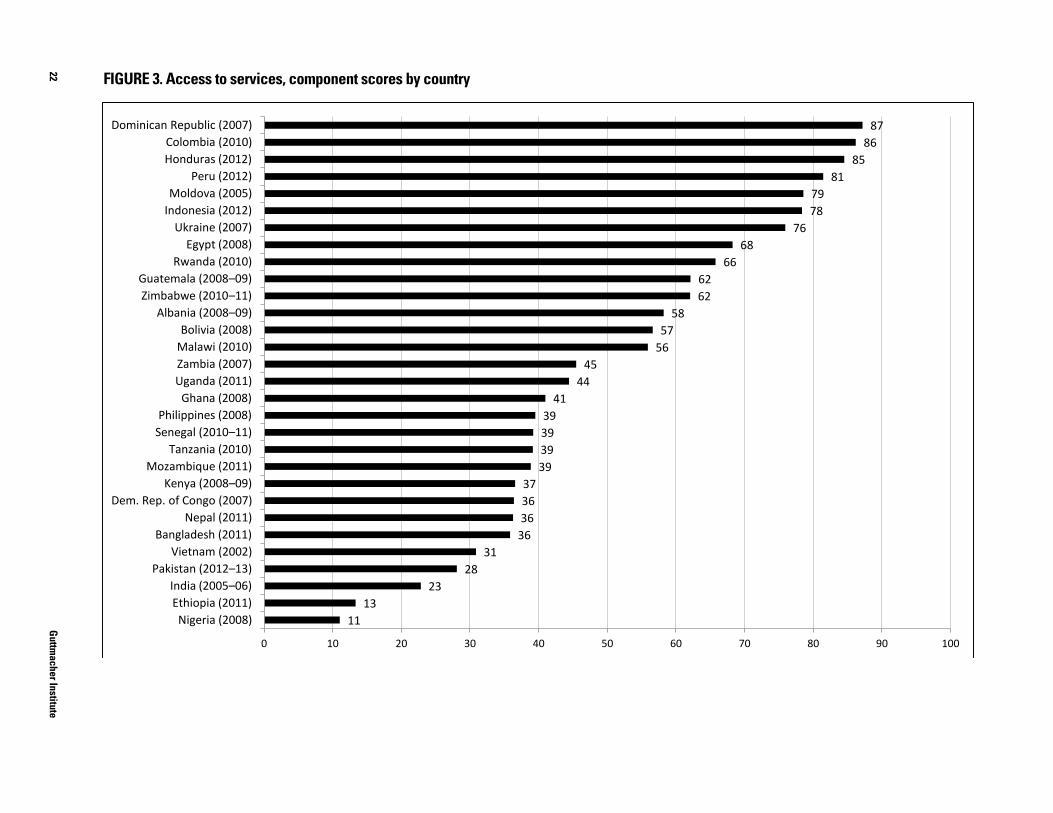
22G
uttmacher Institute
FIGURE 3. Access to services, component scores by country
11 13
23 28
31 36 36 36 37
39 39 39 39
41 44
45 56 57
58 62 62
66 68
76 78 79
81 85
86 87
0 10 20 30 40 50 60 70 80 90 100
Nigeria (2008) Ethiopia (2011) India (2005–06)
Pakistan (2012–13) Vietnam (2002)
Bangladesh (2011) Nepal (2011)
Dem. Rep. of Congo (2007) Kenya (2008–09)
Mozambique (2011) Tanzania (2010)
Senegal (2010–11) Philippines (2008)
Ghana (2008) Uganda (2011) Zambia (2007) Malawi (2010) Bolivia (2008)
Albania (2008–09) Zimbabwe (2010–11) Guatemala (2008–09)
Rwanda (2010) Egypt (2008)
Ukraine (2007) Indonesia (2012) Moldova (2005)
Peru (2012) Honduras (2012) Colombia (2010)
Dominican Republic (2007)
FIGURE 3. Access to services, component scores by country
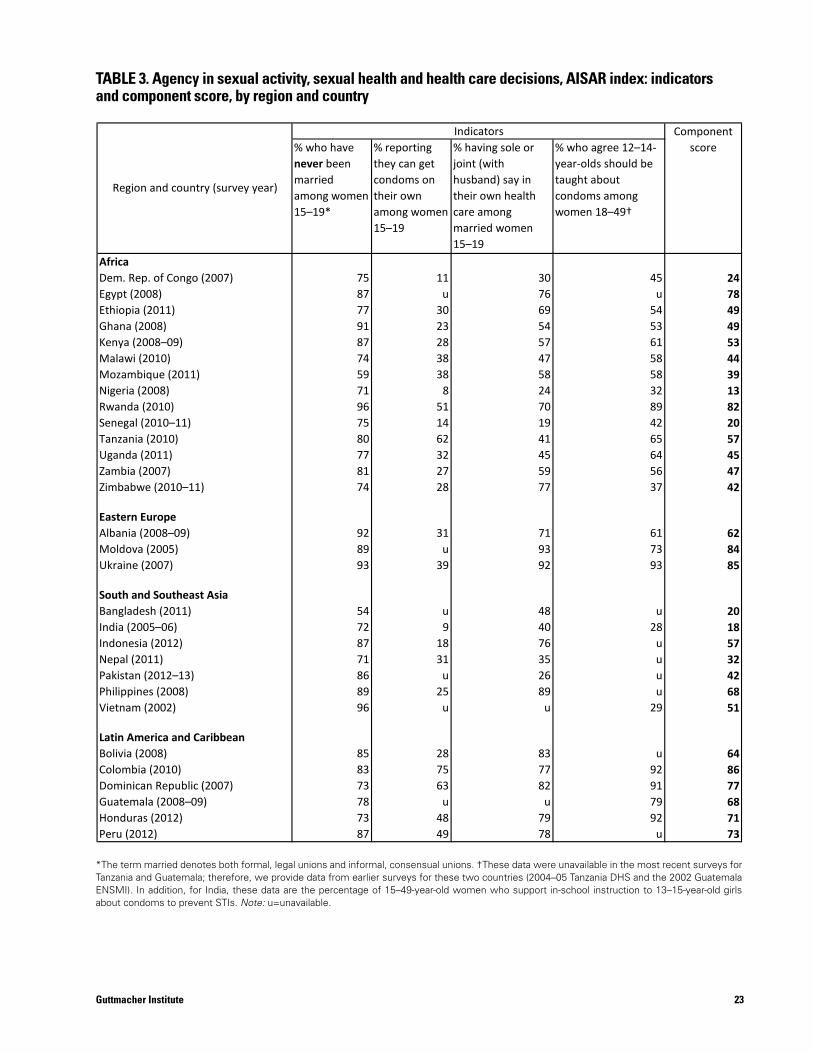
23Guttmacher Institute
% who have never been married among women 15–19*
% reporting they can get condoms on their own among women 15–19
% having sole or joint (with husband) say in their own health care among married women 15–19
% who agree 12–14-year-olds should be taught about condoms among women 18–49†
AfricaDem. Rep. of Congo (2007) 75 11 30 45 24Egypt (2008) 87 u 76 u 78Ethiopia (2011) 77 30 69 54 49Ghana (2008) 91 23 54 53 49Kenya (2008–09) 87 28 57 61 53Malawi (2010) 74 38 47 58 44Mozambique (2011) 59 38 58 58 39Nigeria (2008) 71 8 24 32 13Rwanda (2010) 96 51 70 89 82Senegal (2010–11) 75 14 19 42 20Tanzania (2010) 80 62 41 65 57Uganda (2011) 77 32 45 64 45Zambia (2007) 81 27 59 56 47Zimbabwe (2010–11) 74 28 77 37 42
Eastern EuropeAlbania (2008–09) 92 31 71 61 62Moldova (2005) 89 u 93 73 84Ukraine (2007) 93 39 92 93 85
South and Southeast AsiaBangladesh (2011) 54 u 48 u 20India (2005–06) 72 9 40 28 18Indonesia (2012) 87 18 76 u 57Nepal (2011) 71 31 35 u 32Pakistan (2012–13) 86 u 26 u 42Philippines (2008) 89 25 89 u 68Vietnam (2002) 96 u u 29 51
Latin America and CaribbeanBolivia (2008) 85 28 83 u 64Colombia (2010) 83 75 77 92 86Dominican Republic (2007) 73 63 82 91 77Guatemala (2008–09) 78 u u 79 68Honduras (2012) 73 48 79 92 71Peru (2012) 87 49 78 u 73
TABLE 3. Agency in sexual activity, sexual health and health care decisions, AISAR index: indicators and component score, by region and country
Indicators Component score
Region and country (survey year)
TABLE 3. Agency in sexual activity, sexual health and health care decisions, AISAR index: indicators and component score, by region and country
*The term married denotes both formal, legal unions and informal, consensual unions. †These data were unavailable in the most recent surveys for Tanzania and Guatemala; therefore, we provide data from earlier surveys for these two countries (2004–05 Tanzania DHS and the 2002 Guatemala ENSMI). In addition, for India, these data are the percentage of 15–49-year-old women who support in-school instruction to 13–15-year-old girls about condoms to prevent STIs. Note: u=unavailable.
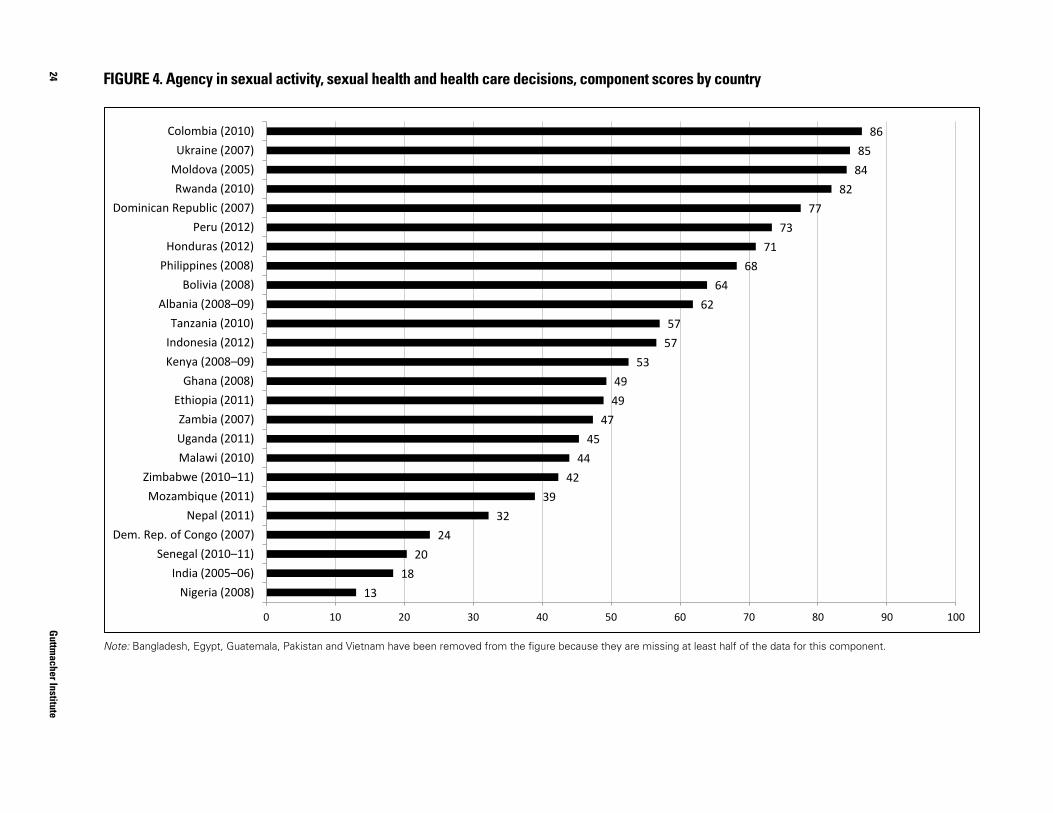
24G
uttmacher Institute
FIGURE 4. Agency in sexual activity, sexual health and health care decisions, component scores by country
13 18
20 24
32 39
42 44
45 47
49 49
53 57 57
62 64
68 71
73 77
82 84 85
86
0 10 20 30 40 50 60 70 80 90 100
Nigeria (2008) India (2005–06)
Senegal (2010–11) Dem. Rep. of Congo (2007)
Nepal (2011) Mozambique (2011)
Zimbabwe (2010–11) Malawi (2010) Uganda (2011) Zambia (2007)
Ethiopia (2011) Ghana (2008)
Kenya (2008–09) Indonesia (2012) Tanzania (2010)
Albania (2008–09) Bolivia (2008)
Philippines (2008) Honduras (2012)
Peru (2012) Dominican Republic (2007)
Rwanda (2010) Moldova (2005) Ukraine (2007)
Colombia (2010)
FIGURE 4. Agency in sexual activity, sexual health and health care decisions, component scores by country
Note: Bangladesh, Egypt, Guatemala, Pakistan and Vietnam have been removed from the figure because they are missing at least half of the data for this component.
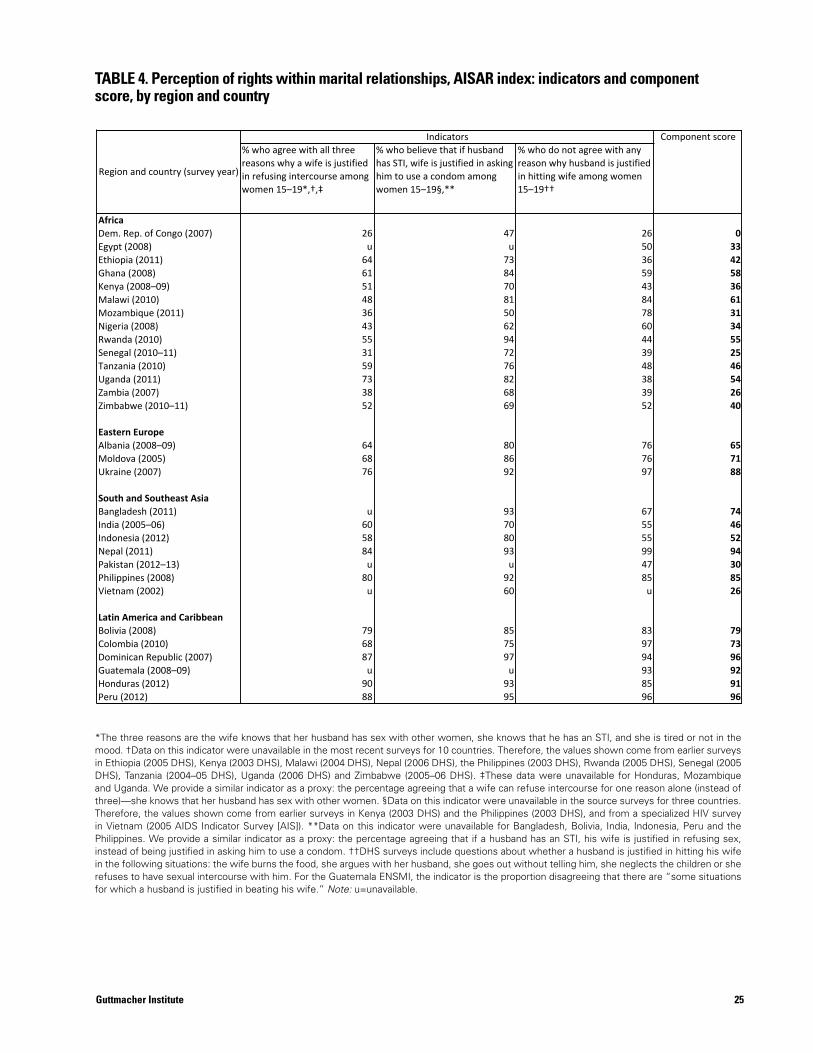
25Guttmacher Institute
% who agree with all three reasons why a wife is justified in refusing intercourse among women 15–19*,†,‡
% who believe that if husband has STI, wife is justified in asking him to use a condom among women 15–19§,**
% who do not agree with any reason why husband is justified in hitting wife among women 15–19††
AfricaDem. Rep. of Congo (2007) 26 47 26 0Egypt (2008) u u 50 33Ethiopia (2011) 64 73 36 42Ghana (2008) 61 84 59 58Kenya (2008–09) 51 70 43 36Malawi (2010) 48 81 84 61Mozambique (2011) 36 50 78 31Nigeria (2008) 43 62 60 34Rwanda (2010) 55 94 44 55Senegal (2010–11) 31 72 39 25Tanzania (2010) 59 76 48 46Uganda (2011) 73 82 38 54Zambia (2007) 38 68 39 26Zimbabwe (2010–11) 52 69 52 40
Eastern EuropeAlbania (2008–09) 64 80 76 65Moldova (2005) 68 86 76 71Ukraine (2007) 76 92 97 88
South and Southeast AsiaBangladesh (2011) u 93 67 74India (2005–06) 60 70 55 46Indonesia (2012) 58 80 55 52Nepal (2011) 84 93 99 94Pakistan (2012–13) u u 47 30Philippines (2008) 80 92 85 85Vietnam (2002) u 60 u 26
Latin America and CaribbeanBolivia (2008) 79 85 83 79Colombia (2010) 68 75 97 73Dominican Republic (2007) 87 97 94 96Guatemala (2008–09) u u 93 92Honduras (2012) 90 93 85 91Peru (2012) 88 95 96 96
TABLE 4. Perception of rights within marital relationships, AISAR index: indicators and component score, by region and country
*The three reasons are the wife knows that her husband has sex with other women, she knows that he has an STI, and she is tired or not in the mood.†Data on this indicator were unavailable in the most recent surveys for 10 countries. Therefore, the values shown come from earlier surveys in Ethiopia (2005 DHS), Kenya (2003 DHS), Malawi (2004 DHS), Nepal (2006 DHS), Philippines (2003 DHS), Rwanda (2005 DHS), Senegal (2005 DHS), Tanzania (2004–05 DHS), Uganda (2006 DHS) and Zimbabwe (2005–06 DHS).
Note: u = unavailable.
Indicators Component score
Region and country (survey year)
TABLE 4. Perception of rights within marital relationships, AISAR index: indicators and component score, by region and country
*The three reasons are the wife knows that her husband has sex with other women, she knows that he has an STI, and she is tired or not in the mood. †Data on this indicator were unavailable in the most recent surveys for 10 countries. Therefore, the values shown come from earlier surveys in Ethiopia (2005 DHS), Kenya (2003 DHS), Malawi (2004 DHS), Nepal (2006 DHS), the Philippines (2003 DHS), Rwanda (2005 DHS), Senegal (2005 DHS), Tanzania (2004–05 DHS), Uganda (2006 DHS) and Zimbabwe (2005–06 DHS). ‡These data were unavailable for Honduras, Mozambique and Uganda. We provide a similar indicator as a proxy: the percentage agreeing that a wife can refuse intercourse for one reason alone (instead of three)—she knows that her husband has sex with other women. §Data on this indicator were unavailable in the source surveys for three countries. Therefore, the values shown come from earlier surveys in Kenya (2003 DHS) and the Philippines (2003 DHS), and from a specialized HIV survey in Vietnam (2005 AIDS Indicator Survey [AIS]). **Data on this indicator were unavailable for Bangladesh, Bolivia, India, Indonesia, Peru and the Philippines. We provide a similar indicator as a proxy: the percentage agreeing that if a husband has an STI, his wife is justified in refusing sex, instead of being justified in asking him to use a condom. ††DHS surveys include questions about whether a husband is justified in hitting his wife in the following situations: the wife burns the food, she argues with her husband, she goes out without telling him, she neglects the children or she refuses to have sexual intercourse with him. For the Guatemala ENSMI, the indicator is the proportion disagreeing that there are “some situations for which a husband is justified in beating his wife.” Note: u=unavailable.
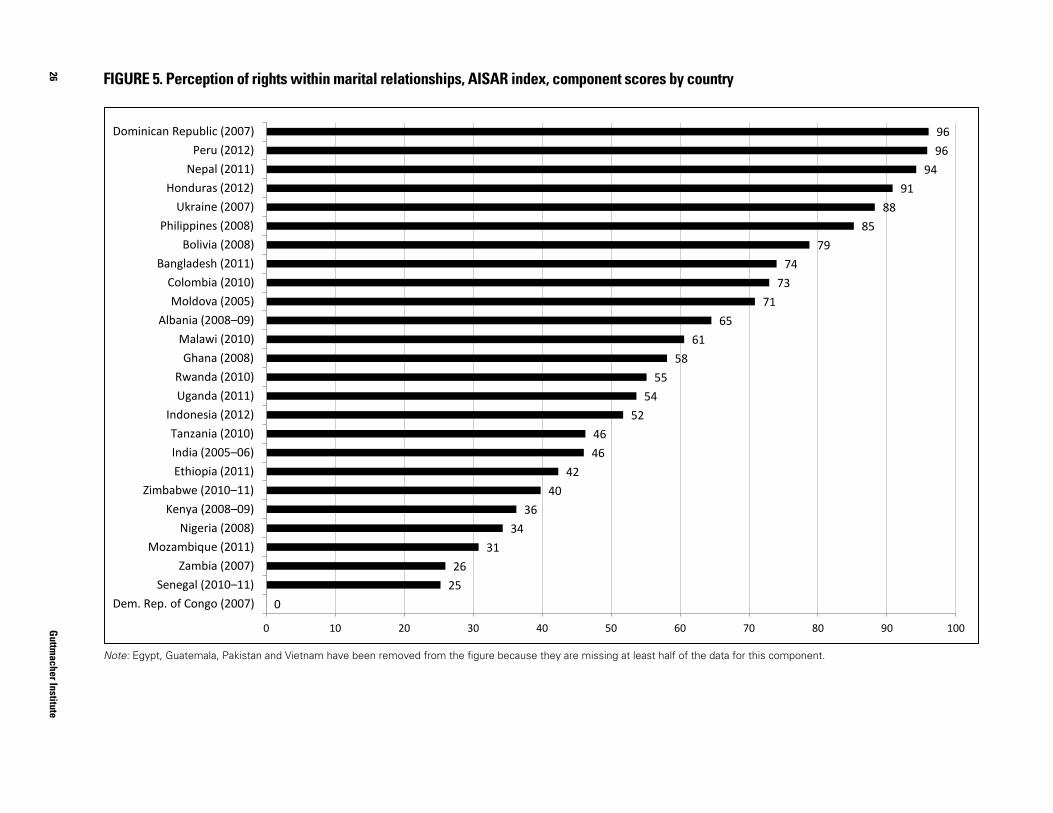
26G
uttmacher Institute
FIGURE 5. Perception of rights within marital relationships, AISAR index, component scores by country
0 25 26
31 34
36 40
42 46 46
52 54
55 58
61 65
71 73
74 79
85 88
91 94
96 96
0 10 20 30 40 50 60 70 80 90 100
Dem. Rep. of Congo (2007) Senegal (2010–11)
Zambia (2007) Mozambique (2011)
Nigeria (2008) Kenya (2008–09)
Zimbabwe (2010–11) Ethiopia (2011) India (2005–06) Tanzania (2010)
Indonesia (2012) Uganda (2011) Rwanda (2010)
Ghana (2008) Malawi (2010)
Albania (2008–09) Moldova (2005)
Colombia (2010) Bangladesh (2011)
Bolivia (2008) Philippines (2008)
Ukraine (2007) Honduras (2012)
Nepal (2011) Peru (2012)
Dominican Republic (2007)
FIGURE 5. Perception of rights within marital relationships, AISAR index, component scores by country
Note: Egypt, Guatemala, Pakistan and Vietnam have been removed from the figure because they are missing at least half of the data for this component.
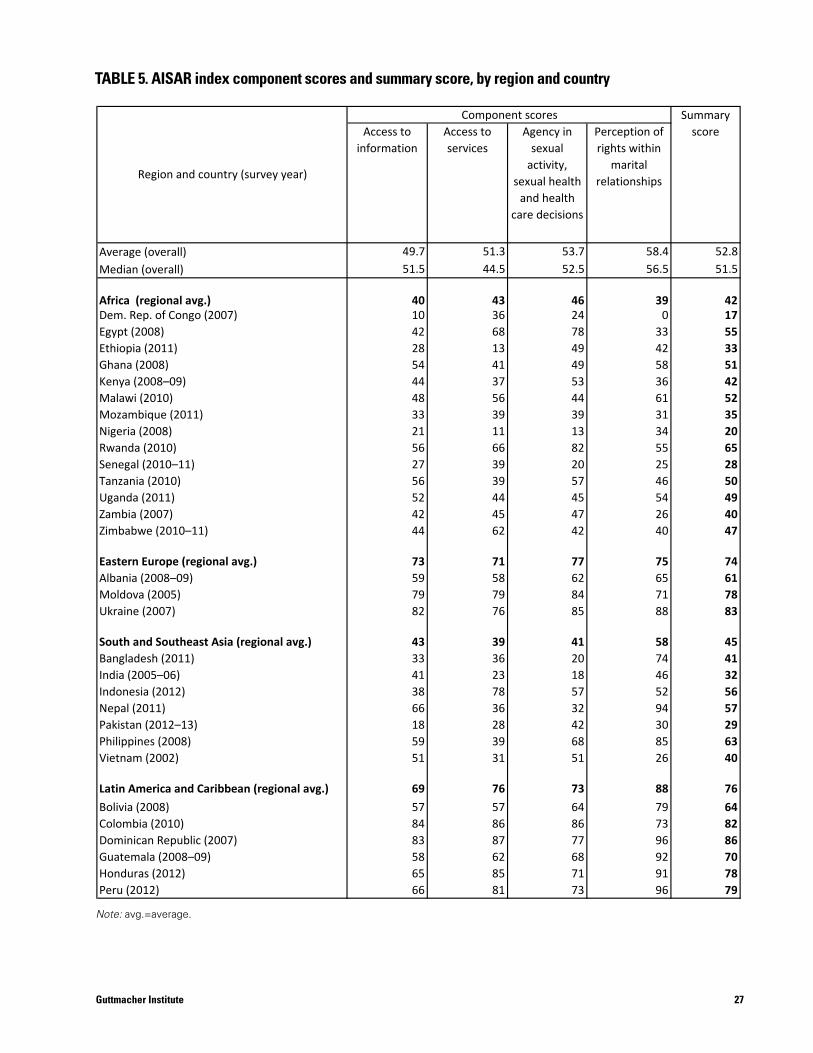
27Guttmacher Institute
Access to information
Access to services
Agency in sexual
activity, sexual health
and health care decisions
Perception of rights within
marital relationships
Average (overall) 49.7 51.3 53.7 58.4 52.8Median (overall) 51.5 44.5 52.5 56.5 51.5
Africa (regional avg.) 40 43 46 39 42Dem. Rep. of Congo (2007) 10 36 24 0 17Egypt (2008) 42 68 78 33 55Ethiopia (2011) 28 13 49 42 33Ghana (2008) 54 41 49 58 51Kenya (2008–09) 44 37 53 36 42Malawi (2010) 48 56 44 61 52Mozambique (2011) 33 39 39 31 35Nigeria (2008) 21 11 13 34 20Rwanda (2010) 56 66 82 55 65Senegal (2010–11) 27 39 20 25 28Tanzania (2010) 56 39 57 46 50Uganda (2011) 52 44 45 54 49Zambia (2007) 42 45 47 26 40Zimbabwe (2010–11) 44 62 42 40 47
Eastern Europe (regional avg.) 73 71 77 75 74Albania (2008–09) 59 58 62 65 61Moldova (2005) 79 79 84 71 78Ukraine (2007) 82 76 85 88 83
South and Southeast Asia (regional avg.) 43 39 41 58 45Bangladesh (2011) 33 36 20 74 41India (2005–06) 41 23 18 46 32Indonesia (2012) 38 78 57 52 56Nepal (2011) 66 36 32 94 57Pakistan (2012–13) 18 28 42 30 29Philippines (2008) 59 39 68 85 63Vietnam (2002) 51 31 51 26 40
Latin America and Caribbean (regional avg.) 69 76 73 88 76Bolivia (2008) 57 57 64 79 64Colombia (2010) 84 86 86 73 82Dominican Republic (2007) 83 87 77 96 86Guatemala (2008–09) 58 62 68 92 70Honduras (2012) 65 85 71 91 78Peru (2012) 66 81 73 96 79
Summary score
Region and country (survey year)
Component scoresTABLE 5. AISAR index component scores and summary score, by region and country
TABLE 5. AISAR index component scores and summary score, by region and country
Note: avg.=average.
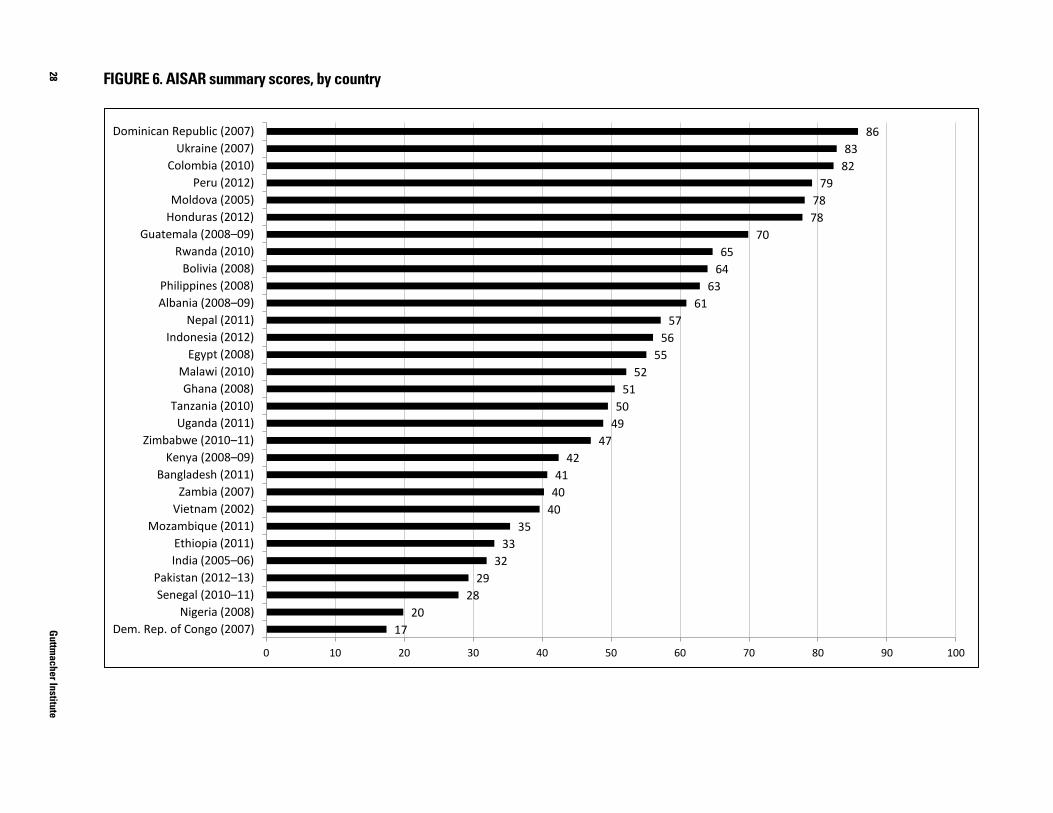
28G
uttmacher Institute
FIGURE 6. AISAR summary scores, by country
17 20
28 29
32 33
35 40 40 41
42 47
49 50
51 52
55 56
57 61
63 64 65
70 78 78
79 82 83
86
0 10 20 30 40 50 60 70 80 90 100
Dem. Rep. of Congo (2007) Nigeria (2008)
Senegal (2010–11) Pakistan (2012–13)
India (2005–06) Ethiopia (2011)
Mozambique (2011) Vietnam (2002)
Zambia (2007) Bangladesh (2011)
Kenya (2008–09) Zimbabwe (2010–11)
Uganda (2011) Tanzania (2010)
Ghana (2008) Malawi (2010)
Egypt (2008) Indonesia (2012)
Nepal (2011) Albania (2008–09) Philippines (2008)
Bolivia (2008) Rwanda (2010)
Guatemala (2008–09) Honduras (2012) Moldova (2005)
Peru (2012) Colombia (2010)
Ukraine (2007) Dominican Republic (2007)
FIGURE 6. AISAR summary scores, by country
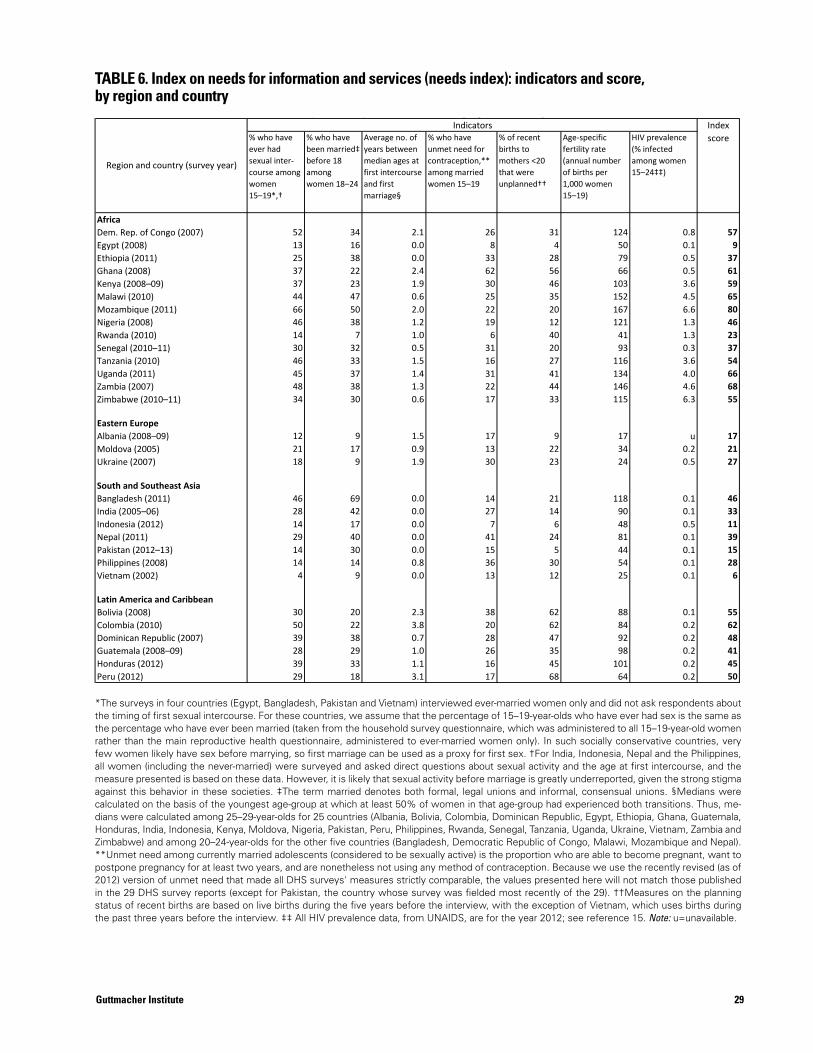
29Guttmacher Institute
% who have ever had sexual inter-course among women 15–19*,†
% who have been married‡ before 18 among women 18–24
Average no. of years between median ages at first intercourse and first marriage§
% who have unmet need for contraception,** among married women 15–19
% of recent births to mothers <20 that were unplanned††
Age-specific fertility rate (annual number of births per 1,000 women 15–19)
HIV prevalence (% infected among women 15–24‡‡)
AfricaDem. Rep. of Congo (2007) 52 34 2.1 26 31 124 0.8 57Egypt (2008) 13 16 0.0 8 4 50 0.1 9Ethiopia (2011) 25 38 0.0 33 28 79 0.5 37Ghana (2008) 37 22 2.4 62 56 66 0.5 61Kenya (2008–09) 37 23 1.9 30 46 103 3.6 59Malawi (2010) 44 47 0.6 25 35 152 4.5 65Mozambique (2011) 66 50 2.0 22 20 167 6.6 80Nigeria (2008) 46 38 1.2 19 12 121 1.3 46Rwanda (2010) 14 7 1.0 6 40 41 1.3 23Senegal (2010–11) 30 32 0.5 31 20 93 0.3 37Tanzania (2010) 46 33 1.5 16 27 116 3.6 54Uganda (2011) 45 37 1.4 31 41 134 4.0 66Zambia (2007) 48 38 1.3 22 44 146 4.6 68Zimbabwe (2010–11) 34 30 0.6 17 33 115 6.3 55
Eastern EuropeAlbania (2008–09) 12 9 1.5 17 9 17 u 17Moldova (2005) 21 17 0.9 13 22 34 0.2 21Ukraine (2007) 18 9 1.9 30 23 24 0.5 27
South and Southeast AsiaBangladesh (2011) 46 69 0.0 14 21 118 0.1 46India (2005–06) 28 42 0.0 27 14 90 0.1 33Indonesia (2012) 14 17 0.0 7 6 48 0.5 11Nepal (2011) 29 40 0.0 41 24 81 0.1 39Pakistan (2012–13) 14 30 0.0 15 5 44 0.1 15Philippines (2008) 14 14 0.8 36 30 54 0.1 28Vietnam (2002) 4 9 0.0 13 12 25 0.1 6
Latin America and CaribbeanBolivia (2008) 30 20 2.3 38 62 88 0.1 55Colombia (2010) 50 22 3.8 20 62 84 0.2 62Dominican Republic (2007) 39 38 0.7 28 47 92 0.2 48Guatemala (2008–09) 28 29 1.0 26 35 98 0.2 41Honduras (2012) 39 33 1.1 16 45 101 0.2 45Peru (2012) 29 18 3.1 17 68 64 0.2 50
TABLE 6. Index on need for information and services (Needs index): indicators and score, by region and countryIndicators
Region and country (survey year)
Index score
TABLE 6. Index on needs for information and services (needs index): indicators and score, by region and country
*The surveys in four countries (Egypt, Bangladesh, Pakistan and Vietnam) interviewed ever-married women only and did not ask respondents about the timing of first sexual intercourse. For these countries, we assume that the percentage of 15–19-year-olds who have ever had sex is the same as the percentage who have ever been married (taken from the household survey questionnaire, which was administered to all 15–19-year-old women rather than the main reproductive health questionnaire, administered to ever-married women only). In such socially conservative countries, very few women likely have sex before marrying, so first marriage can be used as a proxy for first sex. †For India, Indonesia, Nepal and the Philippines, all women (including the never-married) were surveyed and asked direct questions about sexual activity and the age at first intercourse, and the measure presented is based on these data. However, it is likely that sexual activity before marriage is greatly underreported, given the strong stigma against this behavior in these societies. ‡The term married denotes both formal, legal unions and informal, consensual unions. §Medians were calculated on the basis of the youngest age-group at which at least 50% of women in that age-group had experienced both transitions. Thus, me-dians were calculated among 25–29-year-olds for 25 countries (Albania, Bolivia, Colombia, Dominican Republic, Egypt, Ethiopia, Ghana, Guatemala, Honduras, India, Indonesia, Kenya, Moldova, Nigeria, Pakistan, Peru, Philippines, Rwanda, Senegal, Tanzania, Uganda, Ukraine, Vietnam, Zambia and Zimbabwe) and among 20–24-year-olds for the other five countries (Bangladesh, Democratic Republic of Congo, Malawi, Mozambique and Nepal). **Unmet need among currently married adolescents (considered to be sexually active) is the proportion who are able to become pregnant, want to postpone pregnancy for at least two years, and are nonetheless not using any method of contraception. Because we use the recently revised (as of 2012) version of unmet need that made all DHS surveys' measures strictly comparable, the values presented here will not match those published in the 29 DHS survey reports (except for Pakistan, the country whose survey was fielded most recently of the 29). ††Measures on the planning status of recent births are based on live births during the five years before the interview, with the exception of Vietnam, which uses births during the past three years before the interview. ‡‡ All HIV prevalence data, from UNAIDS, are for the year 2012; see reference 15. Note: u=unavailable.
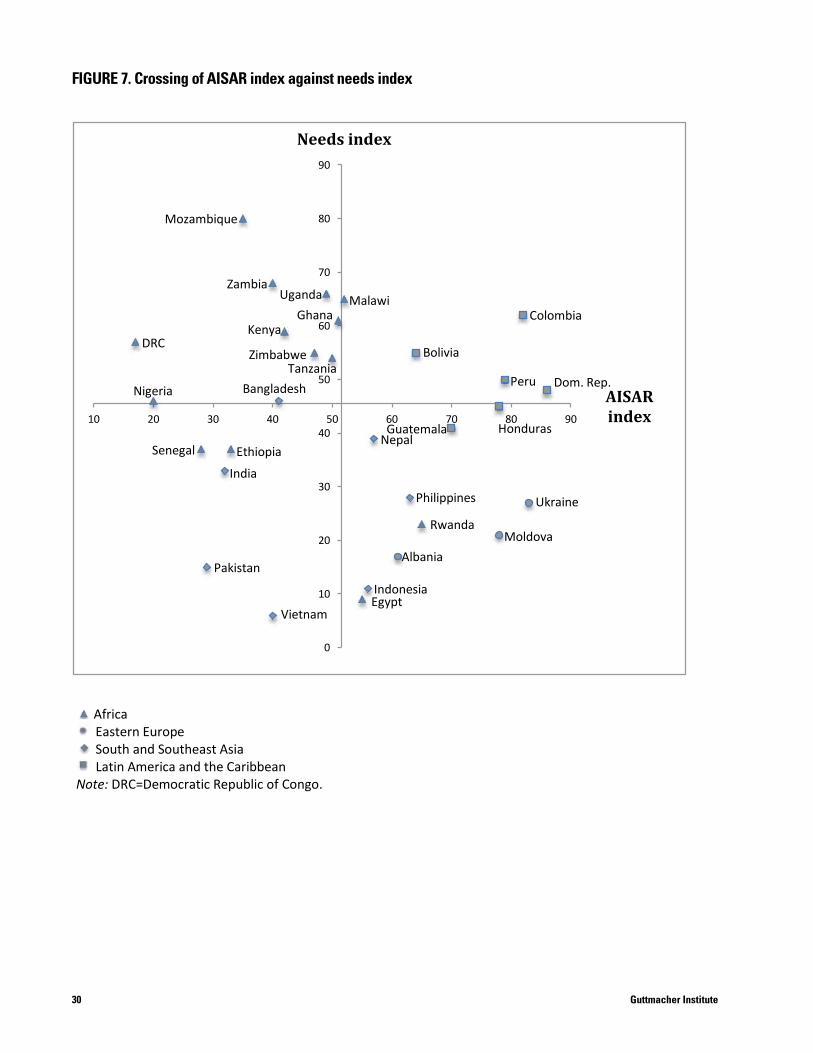
30 Guttmacher Institute
FIGURE 7. Crossing of AISAR index against Needs index
Africa Eastern Europe South and Southeast Asia Latin America and the Caribbean
Note: DRC=Democratic Republic of Congo.
0
10
20
30
40
50
60
70
80
90
10 20 30 40 50 60 70 80 90
AISAR index
Needs index
Vietnam Egypt
Albania
Indonesia Pakistan
Moldova Rwanda
Ukraine Philippines
Guatemala Nepal
India Ethiopia Senegal
Nigeria Bangladesh
DRC
Mozambique
Zambia Malawi
Ghana
Bolivia
Uganda
Kenya
Tanzania Zimbabwe
Colombia
Dom. Rep. Peru
Honduras
FIGURE 7. Crossing of AISAR index against needs index
FIGURE 7. Crossing of AISAR index against Needs index
Africa Eastern Europe South and Southeast Asia Latin America and the Caribbean
Note: DRC=Democratic Republic of Congo.
0
10
20
30
40
50
60
70
80
90
10 20 30 40 50 60 70 80 90
AISAR index
Needs index
Vietnam Egypt
Albania
Indonesia Pakistan
Moldova Rwanda
Ukraine Philippines
Guatemala Nepal
India Ethiopia Senegal
Nigeria Bangladesh
DRC
Mozambique
Zambia Malawi
Ghana
Bolivia
Uganda
Kenya
Tanzania Zimbabwe
Colombia
Dom. Rep. Peru
Honduras
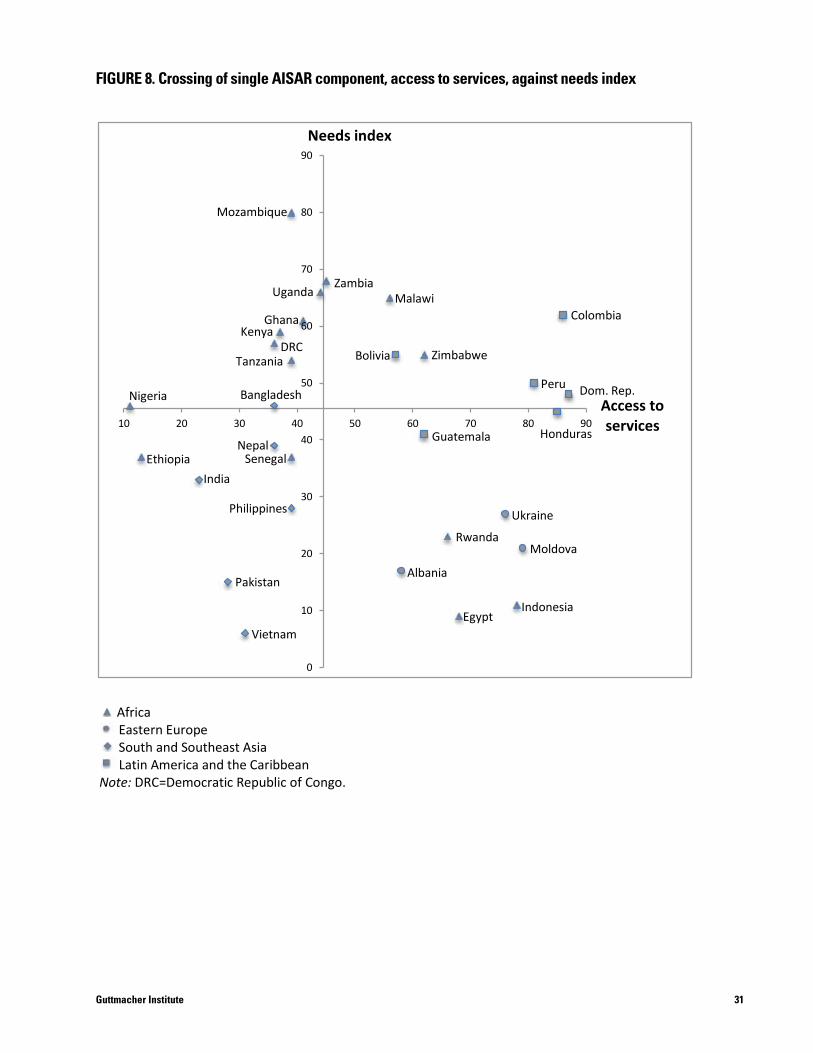
31Guttmacher Institute
FIGURE 8. Crossing of single AISAR component, Access to services, against Needs index
Africa Eastern Europe South and Southeast Asia Latin America and the Caribbean
Note: DRC=Democratic Republic of Congo.
0
10
20
30
40
50
60
70
80
90
10 20 30 40 50 60 70 80 90 Access to services
Needs index
Vietnam
Pakistan
Nigeria
Ethiopia India
Philippines
Senegal Nepal
Bangladesh
Guatemala
Ukraine
Moldova Rwanda
Albania
Indonesia Egypt
Mozambique
Zambia Uganda
Ghana Kenya
DRC Tanzania
Malawi Colombia
Zimbabwe Bolivia
Honduras
Peru Dom. Rep.
FIGURE 8. Crossing of single AISAR component, access to services, against needs index
FIGURE 7. Crossing of AISAR index against Needs index
Africa Eastern Europe South and Southeast Asia Latin America and the Caribbean
Note: DRC=Democratic Republic of Congo.
0
10
20
30
40
50
60
70
80
90
10 20 30 40 50 60 70 80 90
AISAR index
Needs index
Vietnam Egypt
Albania
Indonesia Pakistan
Moldova Rwanda
Ukraine Philippines
Guatemala Nepal
India Ethiopia Senegal
Nigeria Bangladesh
DRC
Mozambique
Zambia Malawi
Ghana
Bolivia
Uganda
Kenya
Tanzania Zimbabwe
Colombia
Dom. Rep. Peru
Honduras
32 Guttmacher Institute
Discussion and Conclusions
a number of indicators for five countries* rendered these
countries’ scores on the affected components unreliable,
so their values (shown in the tables but not in the figures
or text) should be interpreted with caution. Overall, of the
four components, the agency component is missing the
most data (13% of data points are missing), followed by
the rights component (9%) and the information compo-
nent (3%). (As expected when using data from surveys
designed primarily to collect data on behaviors such as
contraceptive and maternal care use, no data are missing
in the services component.) This variability across compo-
nent data should be kept in mind when comparing overall
summary scores and averages, since we did not remove
those countries that were missing data on at least half of
the indicators from country or regional averages.
It is important to clarify that several of these indicators
do not measure actual behaviors, but instead opinions or
attitudes. The use of such proxies highlights the need to
develop better measures and to gather more specific in-
formation, especially in the area of agency and rights, and
to do so through nationally representative surveys. Rights
questions were sometimes unavailable in a given survey
year, so we had to go further back in time. The result was
that for some countries, data from different years were
used in constructing their measures. And even when
responses to questions on rights were available, surveys
varied in how these questions were asked. Therefore, we
sometimes had to rely on proxies, or when not all parts of
a composite indicator were available, we had to use just
one part of such measures. We also lacked several data
points from the single country that participated in a survey
program different from the DHS, Guatemala, whose ques-
tionnaires were not always strictly comparable. Another
issue of comparability was the year of data collection: For
23 of the 30 countries, the main survey year was relatively
recent (2008–2012), but for four countries, the year of
survey was 2007, for two countries it was 2005–2006,
and for one, 2002.
We created the AISAR index to see if readily available
survey data could be assembled into a meaningful tool for
policymakers and program planners. Its summary score
would ideally capture the current reproductive and sexual
health situation of adolescents at a given time in a given
country. These results could be of use for national govern-
ments and for specific ministries within countries (Minis-
try of Health, Ministry of Education, Ministry of Women’s
Affairs, etc.), depending on the component selected.
Additionally, international agencies and donor organiza-
tions could benefit from cross-country assessments of
adolescents’ current situation to better understand which
countries and regions need the most attention.
The results from this exploratory analysis of 30 coun-
tries show that most countries in Sub-Saharan Africa and
South and Southeast Asia tend to cluster at the lower end
of the range of the AISAR index, while Eastern Europe and
Latin America had higher average scores on this index.
Overall, these results indicate that adolescents in the three
Eastern European countries and those in the included Latin
American countries live in an environment that is relatively
more favorable to their sexual and reproductive health,
compared with counterparts in most of the Sub-Saharan
African and South and Southeast countries we examined.
LimitationsThis exercise served to highlight the many and serious
gaps in the availability—and usability—of data on a wide
range of indicators from a wide range of countries. Our
desire for broad regional representation meant having to
forgo many of the potential agency and rights indicators
that were simply unavailable in a few very conservative
societies (mostly in North Africa and in South and South-
east Asia) and in the one country that participated in a dif-
ferent survey program, Guatemala. Furthermore, the lack
of data from never-married adolescents in many of these
same countries means that results are just not as repre-
sentative as those in the countries in which all adoles-
cents, both married and single, participated in the survey.
The regions were less representative than we would
have liked, for example, with just three countries making
up the single region of Eastern Europe. The lack of data on
*A total of five countries were missing data for at least half of the indicators for the agency component (Bangladesh, Egypt, Guatemala, Pakistan and Vietnam) and four of those five—Bangladesh was the exception—were missing data for at least half of the indicators for the rights component.
33Guttmacher Institute
differences between countries, rather than their situa-
tion against an absolute standard of the highest quality of
health and rights. Even though, to our knowledge, no such
standard exists, it remains an important area for future
investigation, one that would provide useful goals and
targets for researchers to work toward.
Looking AheadThe indicators included in the AISAR index were selected
as the best among available measures on which to base
a comprehensive tool to quantify several dimensions of
the broad concept of adolescent sexual and reproductive
health and rights. Development of better measures and
coverage in national surveys of the very important dimen-
sions of agency and rights, which proved the most prob-
lematic, is essential. Also essential is collection of data on
receipt of comprehensive sexuality education—a prerequi-
site for adolescent women’s ability to protect their health
and exercise their rights—which is almost completely
lacking in the large-scale surveys that were the source of
our data. As mentioned before, we used variables that
measure use of services to capture access, given that in-
dicators that assess the actual degree of access—relative
proximity, affordability, on-hand supply, friendly provider
attitudes, etc.—are still rarely collected on nationally repre-
sentative surveys. Developing all-encompassing dimen-
sions of adolescents’ sexual and reproductive lives, such
as self-efficacy and gender equality, for inclusion in future
surveys should be a top priority.
Within the limitations of what we could measure, the
AISAR component and summary indices, paired with the
needs index, proved to be valuable tools. They provide
users with a quick understanding of multiple dimensions
affecting the sexual and reproductive health and rights of
adolescent women. At the country level, health planners
and policymakers can use these indices to rapidly assess
how their country is faring in specific aspects and how it
compares with other countries.
Regional and global agencies may also find this sum-
mary index and its components useful in their planning.
The resulting data could be very helpful in developing
arguments for funding interventions in specific areas of
adolescents’ sexual health and rights that require immedi-
ate attention. The index can be expanded to incorporate
many additional countries. In addition, the indicators (and
thus their components and the resulting indices) can be
periodically updated to allow analyses of trends over time.
Including data for subgroups—such as urban and rural
women, and poor and nonpoor women—would vastly
enhance the index’s utility in defining priorities and desig-
nating target groups. Knowing where needs are greatest
and adolescents’ situation is poorest would help direct
resources to where they would make the most difference.
Of course, many political, social and cultural factors
that influence the sexual and reproductive experiences
of adolescent women have not been captured in the
available data. In addition, our indices measure relative
34 Guttmacher Institute
1. African Union Commission, Protocol to the African Charter on Human and Peoples’ Rights on the Rights of Women in Africa (Maputo Protocol), Maputo, Mozambique, 2003.
2. United Nations (UN) General Assembly, Convention on the Elimination of All Forms of Discrimination Against Women (CEDAW), New York, 1979.
3. UN, Beijing Declaration: Fourth World Conference on Women, Beijing, 1995.
4. UN, Cairo Programme of Action, International Conference on Population and Development, Cairo, September 5–13, 1994, New York, 1995.
5. Erdman J and Cook R, Reproductive rights, in: Heggenhou-gen K, ed., Encyclopedia of Public Health, Oxford: Academic Press, 2008, pp. 532–538.
6. Jejeebhoy S, Zavier A and Santhya K, Meeting the com-mitments of the ICPD Programme of Action to young people, Reproductive Health Matters, 2013, 21(41):18–30.
7. Chandra-Mouli V, Bloem P and Ferguson J, The World Health Organization’s work on adolescent sexual and reproductive health, Bundesgesundheitblatt, Gesundheitforschung, Gesund-heitsschutz, 2013, 56(2):256–261.
8. Lloyd C, ed., National Research Council and Institute of Medi-cine, Growing Up Global: The Changing Transitions to Adulthood in Developing Countries, Washington, DC: National Academies Press, 2005.
9. World Health Organization (WHO), The Sexual and Reproduc-tive Health of Young Adolescents in Developing Countries: Re-viewing the Evidence, Identifying Research Gaps, and Moving the Agenda, Report of a WHO technical consultation, Geneva, 4–5 November, 2010, Geneva: WHO, 2011.
10. Bankole A and Malarcher S, Removing barriers to adoles-cents’ access to contraceptive information and services, Stud-ies in Family Planning, 2010, 41(2):117–124.
11. Chandra-Mouli V et al., Contraception for adolescents in low and middle income countries: needs, barriers and access, Reproductive Health, 2014, 11(1).
12. UN Department of Economic and Social Affairs, Population Division, World Population Prospects: The 2012 Revision, DVD, New York: UN, 2013.
13. Anderson R et al., Demystifying Data: A Guide to Using Evidence to Improve Young People’s Sexual Health and Rights, New York: Guttmacher Institute, 2014.
14. Shah I and Ahman E, Unsafe abortion differentials in 2008 by age and developing country region: high burden among young women, Reproductive Health Matters, 2012, 20(39):169–173.
15. Joint United Nations Programme on HIV/AIDS (UNAIDS), Global Report: UNAIDS Report on the Global AIDS Epidemic 2013, Geneva: UNAIDS, 2013.
16. DHS Program in StatCompiler, 2014, <http://www.statcom-piler.com/>, accessed Sept. 13, 2014.
17. UNICEF, HIV/AIDS and Children, Thematic Report 2013, New York: UNICEF, 2014.
18. Kirby D, Laris B and Rolleri L, Sex and HIV Education Programs for Youth: Their Impact and Important Characteristics, Research Triangle Park, NC, USA: Family Health International, 2006.
19. Kirby D, The Impact of Sex Education on the Sexual Behav-iour of Young People, New York: UN Population Division, 2011.
20. Ross D, Dick B and Ferguson J, Preventing HIV/AIDS in Young People: A Systematic Review of the Evidence from Developing Countries, Geneva: WHO, 2006.
21. Speizer I, Magnani R and Colvin C, The effectiveness of adolescent reproductive health interventions in developing countries: a review of the evidence, Journal of Adolescent Health, 2003, 33(5):324–348.
22. Singh S, Darroch J and Ashford L, Adding It Up: The Costs and Benefits of Investing in Sexual and Reproductive Health 2014, New York: Guttmacher Institute, 2014.
23. Chandra-Mouli V et al., Invest in adolescents and young people: it pays, Reproductive Health, 2013, 10(51).
24. Guttmacher Institute, Into a New World: Young Women’s Sexual and Reproductive Lives, New York: Guttmacher Insti-tute, 1998.
25. Mensch B, Bruce J and Greene M, The Uncharted Passage: Girls’ Adolescence in the Developing World, New York: Popula-tion Council, 1998.
26. Stewart L and Eckert E, Indicators for Reproductive Health Program Evaluation: Final Report of the Subcommittee on Ado-lescent Reproductive Health Services, Chapel Hill, NC, USA: Carolina Population Center, 1995.
27. Population Action International (PAI), A Measure of Survival: Calculating Women’s Sexual and Reproductive Risk, Washing-ton, DC: PAI, 2007.
References
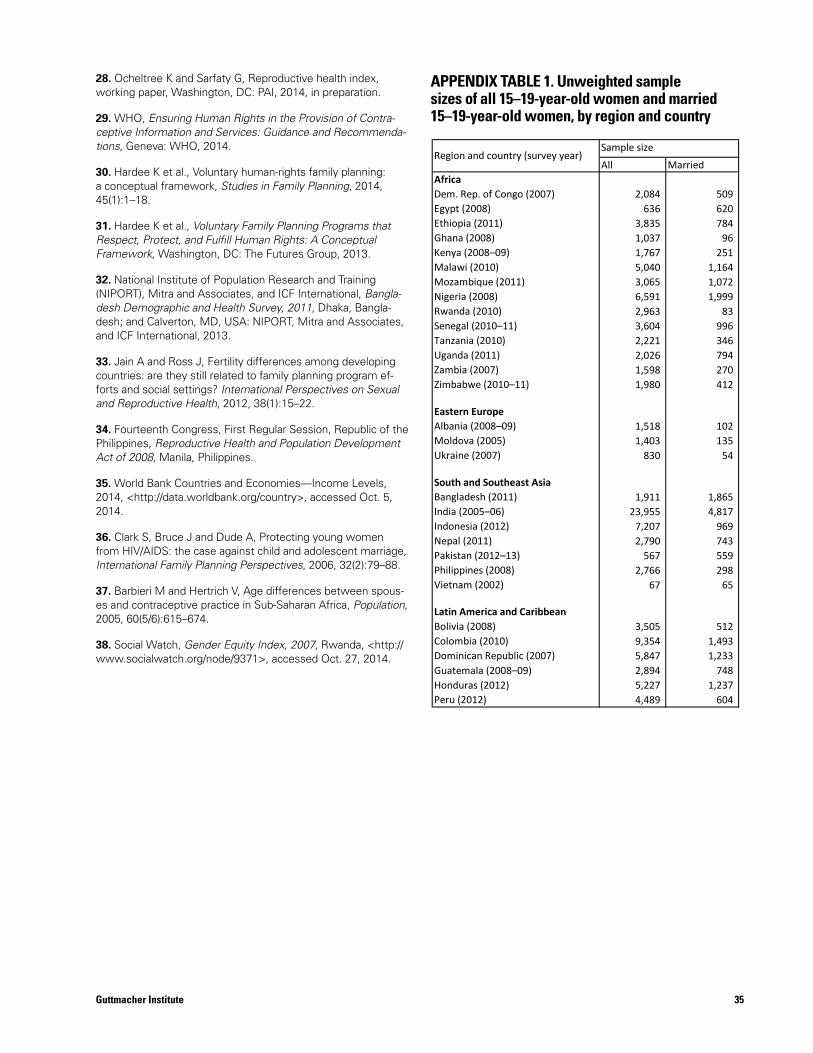
35Guttmacher Institute
28. Ocheltree K and Sarfaty G, Reproductive health index, working paper, Washington, DC: PAI, 2014, in preparation.
29. WHO, Ensuring Human Rights in the Provision of Contra-ceptive Information and Services: Guidance and Recommenda-tions, Geneva: WHO, 2014.
30. Hardee K et al., Voluntary human-rights family planning: a conceptual framework, Studies in Family Planning, 2014, 45(1):1–18.
31. Hardee K et al., Voluntary Family Planning Programs that Respect, Protect, and Fulfill Human Rights: A Conceptual Framework, Washington, DC: The Futures Group, 2013.
32. National Institute of Population Research and Training (NIPORT), Mitra and Associates, and ICF International, Bangla-desh Demographic and Health Survey, 2011, Dhaka, Bangla-desh; and Calverton, MD, USA: NIPORT, Mitra and Associates, and ICF International, 2013.
33. Jain A and Ross J, Fertility differences among developing countries: are they still related to family planning program ef-forts and social settings? International Perspectives on Sexual and Reproductive Health, 2012, 38(1):15–22.
34. Fourteenth Congress, First Regular Session, Republic of the Philippines, Reproductive Health and Population Development Act of 2008, Manila, Philippines.
35. World Bank Countries and Economies—Income Levels, 2014, <http://data.worldbank.org/country>, accessed Oct. 5, 2014.
36. Clark S, Bruce J and Dude A, Protecting young women from HIV/AIDS: the case against child and adolescent marriage, International Family Planning Perspectives, 2006, 32(2):79–88.
37. Barbieri M and Hertrich V, Age differences between spous-es and contraceptive practice in Sub-Saharan Africa, Population, 2005, 60(5/6):615–674.
38. Social Watch, Gender Equity Index, 2007, Rwanda, <http://www.socialwatch.org/node/9371>, accessed Oct. 27, 2014.
All MarriedAfricaDem. Rep. of Congo (2007) 2,084 509 Egypt (2008) 636 620 Ethiopia (2011) 3,835 784 Ghana (2008) 1,037 96 Kenya (2008–09) 1,767 251 Malawi (2010) 5,040 1,164 Mozambique (2011) 3,065 1,072 Nigeria (2008) 6,591 1,999 Rwanda (2010) 2,963 83 Senegal (2010–11) 3,604 996 Tanzania (2010) 2,221 346 Uganda (2011) 2,026 794 Zambia (2007) 1,598 270 Zimbabwe (2010–11) 1,980 412
Eastern EuropeAlbania (2008–09) 1,518 102 Moldova (2005) 1,403 135 Ukraine (2007) 830 54
South and Southeast AsiaBangladesh (2011) 1,911 1,865 India (2005–06) 23,955 4,817 Indonesia (2012) 7,207 969 Nepal (2011) 2,790 743 Pakistan (2012–13) 567 559 Philippines (2008) 2,766 298 Vietnam (2002) 67 65
Latin America and CaribbeanBolivia (2008) 3,505 512 Colombia (2010) 9,354 1,493 Dominican Republic (2007) 5,847 1,233 Guatemala (2008–09) 2,894 748 Honduras (2012) 5,227 1,237 Peru (2012) 4,489 604
Region and country (survey year)
APPENDIX TABLE 1. Unweighted sample sizes of all 15–19-year-old women and married 15–19-year-old women, by region and country
Sample size
APPENDIX TABLE 1. Unweighted sample sizes of all 15–19-year-old women and married 15–19-year-old women, by region and country
36
Advancing sexual and reproductive health worldwide through research, policy analysis and public education
125 Maiden Lane New York, NY 10038
(212) 248-1111; fax (212) [email protected]
www.guttmacher.org
4 Newhams RowLondon, United Kingdom SE1 3UZ
+44 (0)20 7939 8200fax: +44 (0)20 7939 8300
www.ippf.org