Embed Size (px)
Citation preview
Review of Industrial Organization 11: 493-509,1996. @ 1996 Kluwer Academic Publishers. Printed in the Netherlands.
493
Measuring Changes in Multiproduct Market Structure: An Application to U.S. Airlines
KATHY J. HAYES* Department of Economics, Southern Methodist University, Dallas, TX 75275-0496, U.S.A. and Federal Reserve Bank of Dallas, Research Department Dallas, TX 7.5265-5906, U.S.A.
LEOLA B. ROSS* Department of Economics, Brewster Building, East Carolina University, Greenville, NC 278584353, U.S.A.
Abstract. The Entropy Index decomposition property is utilized to construct an aggregate index of route concentration that accounts for the multiple products, customer preferences and industry concentration. The Directed Divergence Statistic, an aggregate index which measures changes in market structure at the airline specific level, is similarly decomposed. We find that route concentration more closely resembles a duopoly than an industry with 16 major carriers. Further, the Directed Divergence Statistic decomposition reveals that while the industry seems to have absorbed the loss of national three carriers, those remaining engineered substantial changes in their product offerings to accommodate passengers.
Key words: Market structure, subgroup decomposable, airline markets.
I. Introduction
A measure of the level of concentration in an industry can provide important information about the competitiveness of markets and the market power possessed by the firms which belong to a particular industry. Further, the trend of industry concentration within the US during this century has received considerable attention in the economic literature (Deutsch and Silber (1995), Attaran and Saghafi (1988, 1990), Shepherd(l964,1982)andWhite(l98la, 1981b)).Earlier studies(Shepherd and White) rely on concentration ratios and their respective time trends to map the relative rise or decline of concentration in various industries. More recently, work by Attaran and Saghafi utilizes the well documented decomposition properties of the Entropy Index measure (Theil 1967,1972) to obtain more detailed information about the nature of diversity among the top 500 US fhms. Attaran and Saghti decompose the top 500 firms into five groups of 100 firms separated by original f?irm
* The authors acknowledgehelpful suggestions from SabyasachiBasu, John Bishop, Noel Cressie, Michael Ferrantino, Joseph Hirschberg, Esfandiar Maasoumi, John Scott, Daniel Slottje and two anonymous referees. Ross is grateful to the Transportation Research Board’s Grad VII Award Program for financial support. The views expressed in this article are solely those of the authors and should not be attributed to the Federal Reserve Bank of Dallas or to the Federal Reserve System.
494 KATHY J. HAYES AND LEOLA B. ROSS
size to conclude that the big are getting bigger while the small are getting smaller. Deutsch and Silber (1995) do a similar decomposition, on the Gini Coefficient, of national concentration and develop a measure of dynamic change for that index.
While the level of national concentration (or its inverse, diversity) can pro- vide some point of comparison for individual industries, the more important issue regarding industry structure is how to measure concentration within a particular industry. Further, with the growing importance of diversified, multiproduct indus- tries, meeting in numerous markets (Scott 1982, 199 1,1993), the question of how to measure and interpret concentration becomes even more complex. When a group of firms overlap in the range of products they offer, it is likely that monopoly power exists for some products, whereas other products are a source of competition among firms. Given the possibility of varied mixes of products, traditional measures of concentration can provide only limited information about market competitiveness.
The number of industries which fit this description are vast and varied. For example, automobiles, department and discount stores, airlines, home improvement centers and even hospitals and HMO’s must be able to offer not only a competitive product, but, also a particular basket of products to remain competitive in our one-stop shopping economy. In an endless quest for market power, many firms in today’s market must both provide a wide spectrum of products to compete with other firm’s and in addition offer products different from its competitors’ to carve out a profitable niche. Given the growing diversity of the US marketplace, a measure of industry concentration which incorporates and describes the role of multiple products offered by multiple firms is a natural progression in this literature.
The entropy (or Theil) decomposition properties are taken one step further than in previous studies. It is decomposed twice into two equal sum measures with different addends, then it is “recomposed,” or equated, to form a measure of multiproduct industry concentration which is comprised of various product concentrations, demand concentration and thm specific product mixes. This three- part concentration measure has been developed with the goal of assessing the relationship between route and industry concentration in the domestic US airline industry during the early 1990’s. We chose this industry because the airlines are clearly multiproduct competitors which have undergone dramatic changes over the past twenty years. The most radical changes occurred during the late 1970’s and early 1980’s from the Airline Deregulation Act of 1978 and the most recent changes are due to the onset of frequent price wars in the early 1990’s. The latter time period was chosen so that the rapid changes caused by deregulation in 1978 could be avoided and, thus, concentration and market structure in a more stable and mature industry could be mapped.
It is found that while the routes may be sufficiently concentrated to provoke the Department of Justice to begin anti-trust legal action, concentration at the industry level would not and this may actually explain some of the highly competitive behavior exhibited by such a concentrated industry recently. We also find that the high level route concentration is counterbalanced by a highly diversified demand
MEASURING CHANGES IN MULTIPRODUCT MARKET STRUCTURE 495
structure. Airlines attempt to accommodate this demand structure by offering a wide variety of routes. The combination of these two factors yields a measure of route concentration that suggests monopoly power, with an effective level of competition which is close to a duopoly, while the industry concentration suggests a more intensely competitive environment with at least 16 major carriers.
Why then, would it be interesting to measure industry concentration at all? Certain stylized facts about the airlines make industry concentration a relevant measure. First, it is important to offer a wide variety of routes to increase customer loyalty through frequent flier programs. If a carrier offers flights across an extensive network, the frequent flier miles they award will be more valuable than on a carrier that does not and a traveler might be inclined to travel to an alternative airport to take advantage of those miles. Second, flights to different vacation spots might directly compete with each other if the traveler is searching for a bargain. For example, a skier might compare prices to Vermont vs. Colorado or Utah to plan a trip or a “spring breaker” might compare the prices to Miami vs. Tampa. In this sense, airlines may be forced to compete not only for passengers who know they want to go to San Diego, but also for those who are considering flights to Los Angeles or Hawaii. On the flip side, a firm in a nationally competitive multiproduct industry may have the potential to exploit market power at the product specific level. For example, a carrier with a large network will likely charge higher prices to customers at monopoly endpoints than those nearby a large metropolitan area.
The trend for the airlines seems to be one of gradual increase in market con- centration at the industry level, although, a clear trend at the route level is not immediately perceptible. While understanding the nature of these tends can pro- vide some insight, a measure of concentration at any level is aggregate and static. A previously unexplored and firm specific method for measuring changes in mar- ket structure falls out of the decomposition procedure for the entropy index while preserving the aggregate nature of an index. This technique is derived from the directed divergence statistic which is known in the statistics literature for measuring similarities among distributions. In the past, studies by White and Shepherd map changes in concentration ratios by estimating their time trends. While the trend of concentration provides useful and important information, it is possible for market shares to change drastically among firms within an industry without exhibiting large changes in concentration. (The clearest example of this situation occurs when two firms trade market shares. While this can represent a dramatic shift in market structure, concentration by any measure will not change.) Conversely, the directed divergence statistic is a weighted sum of changes in individual market shares and may be decomposed like the entropy index. This decomposition analysis reveals that trends in concentration may not tell the whole story since shifting market shares reflect turmoil in a “mature” market even when the aggregate concentration measure does not change. For example, the departures of Eastern Airlines and Midway has a noticeable impact on the mix of routes offered by the remaining carriers but did not result in drastic changes in national market shares. Conversely,
496 KATHY J. HAYES AND LEOLA B. ROSS
the departure of Pan American Airlines in the first quarter of 1992 went virtually unnoticed in the domestic market.
The next section of this paper contains a detailed description of the multiproduct entropy concentration index, along with its description of the airline industry. In the third section, the directed divergence statistic is introduced and applied to airline data. The final section concludes this paper with various findings and gained insights into the airline industry.
II. The Dual Decomposition of the Entropy Index
Airline passengers may be divided by routes traveled or airline traveled and these breakdowns may be represented by vectors such that each Xi = (~1~. . .zA~)’ represents a vector of passengers traveling on a particular route separated by airlines or, similarly, each X, = (z,t . ..z,~) represents a vector of passengers traveling on a particular airline separated by routes. These vectors could be stacked such that the route vectors make a (AR x 1) column vector or the airlines are extended making a (1 x AR) row vector. Each of these vectors then represents the entire sample of travelers in a given period traveling on all routes and all airlines. More formally,
is the total number of passengers traveling a particular route and,
is the total number of passengers traveling a particular airline, and thus
is the total number of passengers traveling, or, equivalently
From this it follows that the vector over (u) ( 9. ..PA) will represent the distribution of passengers over airlines and the vector over (T) ( 9. . .PR) will represent the distribution of passengers over routes. Therefore, the concentration of market shares measured by passenger volume (market share can alternatively be measured by sales volume, capacity, employment, value-added or physical output)‘) using the entropy index is
’ Scherer and Ross, p. 71.
MEASURINGCHANGESINMULTIPRODUCTMARKETSTRUCTURF! 497
The Entropy Index (EI) differs from the Concentration Ratio (CR) and the Herflndahl-Hirshman Index (HH) in two respects. First, it measures the diversity in market shares over a range of minus infinity (which represents a continuum of competitive firms) and zero (which represents a monopoly).* For example, the airline industry at the beginning of the sample period (first quarter 1990) had nineteen major carriers (major is defined in the appendix) and at the end of the sample period (fourth quarter 1992) had sixteen major carriers. Given nineteen equal market shares the EI for the airlines would be -2.94 and given sixteen the EI would be -2.77. An industry with two equally sized firms would exhibit a EI of -0.69, three equal players would exhibit - 1 .lO, fifty equal players, -3.9, and 325 players, -5.78. It is clear that with only a few players, adding one more has the potential of dramatically decreasing concentration whereas the numbers change less dramatically as they get larger. When the HH and the E1 are compared for various products or industries, it is found that the rankings they provide are quite consistent with each other. Therefore, the use of the E1 does not undermine the long history of incorporating the HH into both economic and legal analysis, it merely provides an additional tool for the study of multiple product industries given the decomposition property described below.
The second, more significant difference between the E1 and other concentration measures lies in the decomposability property it possesses.3 For example, these decomposition properties have been used extensively in the income inequality lit- erature and have been shown to be a very useful tool for comparing the income inequality between various groups4 of people versus the inequality within those groups. For the purposes of measuring concentration, we exploit this decompos- ability to highlight is relevance to multiproduct industries. This method is to date undocumented. While the HH also has some mathematical properties that are quite useful for the analysis of market structure, is cannot be similarly decomposed by product line.5
We do not suggest that this is better or worse than a [O,l] measure, only that it is a distinction. 3 The Gini Coefficient has a similar decomposition. However, that index is not popular because of
the difficulty of calculation and its inability to distinguish a monopoly from an industry with four or one hundred equally sized firms. Further, while Deutch and Silber (1995) develop a dynamic change index for the Gini, it is also quite cumbersome to calculate and does not lend itself easily to other indices as does the directed divergence statistic developed in the next section.
4 Examples of groups are race, region, gender, tax bracket and education level. This type of decomposition may be found in Theil(l972,1989).
’ A well known breakdown of the H H index is equality to Csz + 1 /N, where the first term is the vatiunce equivalent (or the variance of firm shares) and the second term is the numbers equivalent. From this equality the H H can be used to calculate the number of equally sized firms that would yield an equal concentration measure (Scherer and Ross, p. 73). However, a simple numerical example can demonstrate that the H H does not decompose in the same way as the EI nor in the sense of Foster, Greer and Thorbecke (1984).
498 KATHY J. HAYES AND LEOLA B. ROSS
Remark 1: The Entropy Index concentration measure may be decomposed as follows:
where
(6b)
(64
letting EI(X) = C;ti,, C~zcl=I(zar/P) ln(z,,/P). The well knowndecomposability property of this measure (Theil 1967) implies the following equalities:
U(X) = H(A) + C&=,+(X,) (7)
and
EI(X) = H(R) t c:=, $EI(XT) (8)
Setting (7) equal to (8) and rearranging terms gives the equality stated in (6).
On the left hand side of (6) is the Effective Route Concentration, Cp==, (P,/P)EI( X,), which is a weighted average of concentration at the route level, and measures overall route competitiveness. Individual route concentration is measured by EI(X,) which is based on the market shares of each airline on route T. On the right hand side of (6) is the Industry Concentration, EI(A). This is a measure of national airline concentration based on the aggregate market shares of each airline and represents the level of concentration in market supply. In a sense the Effective Route Concentration is a detailed version of H(A) and allows comparisons to be drawn regarding airline competitiveness at the route level (which may represent the market power faced by consumers of airline travel) and airline competitiveness at the national level.
The second right side term is the product or Demand Concentration measure, EI(R). This is based on the share of travelers each route claims and characterizes the mix of services required by passengers in aggregate. A highly concentrated
MEASURING CHANGES IN MULTIPRODUCT MARKET STRUCTURE 499
demand structure will not leave much room for firms to carve niches into various markets, whereas, a less concentrated demand will. Further, the changes that occur in this index over time (which is the subject of the next section) could be quite informative for assessing the evolution of demand. Clearly the degree of certainty regarding future demand is deeply rooted in the stability exhibited in the past.
Similarly, EI( X,) describes the distribution of passengers on an airline a and demonstrates the product diversity of that airline. Thus, balancing term is the Airline Product Mix, C&l(Pa/P)EI(X,), or a weighted average of the route mixes airlines offer to accommodate demand and remain competitive across routes. The Airline Product Mix is a detailed version of EI( R) and permits the comparison of aggregate travel demand and the distribution of services offered by individual carriers as they compete for customer loyalty. From this measure we can assess the importance of economies of scope in networking and even advertising. When there is little difference between this term and demand EI(R), one can infer that offering a full range of products is wise in the given industry. While this might be the case for HMOs, grocery stores or gas stations, it is more likely that some degree of product diversity will be found in most industries.
Thus, effective route concentration can be thought of as reflecting the conflict between the level of industry concentration and demand diversity which is balanced by individual airlines’ product lines. No other measure of concentration has been shown to decompose so as to accommodate the diversity of a multiproduct industry and for this reason this index is both more informative and more descriptive than its predecessors.
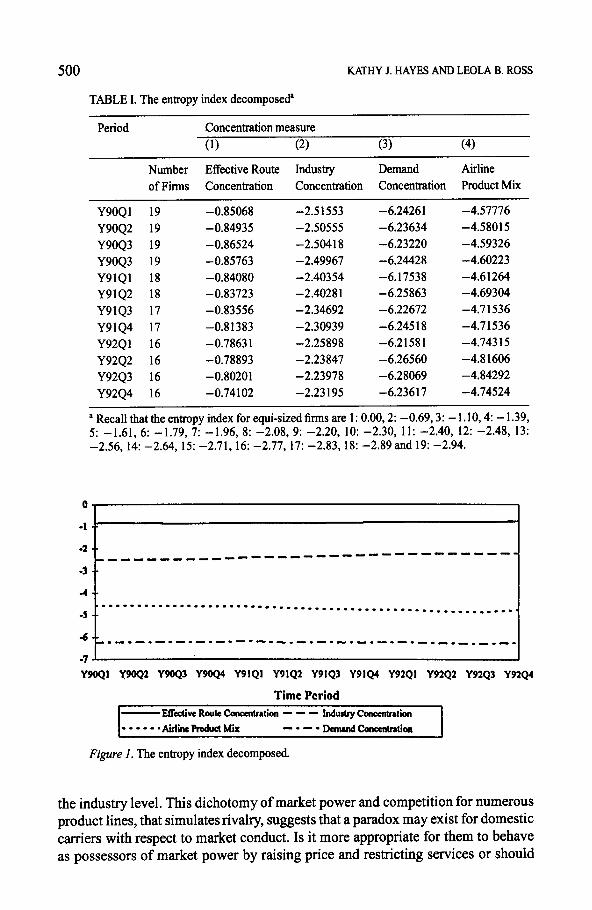
Table I shows the EI decomposed in this way for the airline industry from the first quarter of 1990 to the last quarter of 1992. These numbers are also rep- resented graphically in Figure 1. These market shares were obtained from the Origin and Destination Survey (DB 1A) which is maintained by the Department of Transportation and described more fully in the Appendix.
The Effective Route Concentration, represented by Column (l), shows little competitiveness, with a weighted average within the two-three equally sized fhms range. Conversely, it may be inferred from Column (2), Industry Concentration, that the airline industry in aggregate is not far from the 19 and 16 equally sized firms range of -2.94 in Y90Ql to -2.77 in Y92Q4, respectively, Further, the Demand Concentration, Column (4), indicates that demand is highly diversified as is the weighted average of Airline Product Mix, represented by Column (3). In order to keep a strong market share an airline must cover all its bases by flying numerous routes.
This analysis demonstrates the importance of deciphering the role of multiple products in the competitiveness of the airline industry. Measuring concentration at both the national and route level reveals that the effective level of competition on routes averages to an industry with two or three players while there is national competition with nineteen. While each airline has the ability to wield market power on any number of routes, it is also true that each airline is forced to compete at
500 KATHY J. HAYES AND LEOLA B. ROSS
TABLE I. The entropy index decomposeda
Period .Concentration measure (1) (2) (3) (4)
Number Effective Route Industry Demand Airline of Firms Concentration Concentration Concentration Product Mix
Y9OQl 19 -0.85068 -2.51553 -6.24261 -4.57776 Y9OQ2 19 -0.84935 -2.50555 -6.23634 -4.58015 Y9OQ3 19 -0.86524 -2.50418 -6.23220 -4.59326 Y9OQ3 19 -0.85763 -2.49967 -6.24428 -4.60223 Y91Ql 18 -0.84080 -2.40354 -6.17538 -4.61264 Y91Q2 18 -0.83723 -2.40281 -6.25863 -4.69304 Y91Q3 17 -0.83556 -2.34692 -6.22672 -4.71536 Y91Q4 17 -0.81383 -2.30939 -6.24518 -4.71536 Y92Ql 16 -0.7863 1 -2.25898 -6.21581 -4.743 15 Y92Q2 16 -0.78893 -2.23847 -6.26560 -4.8 1606 Y92Q3 16 -0.80201 -2.23978 -6.28069 -4.84292 Y92Q4 16 -0.74102 -2.23195 -6.23617 -4.74524
a Recall that the entropy index for equi-sized firms are 1: 0.00,2: -0.69,3: - 1.10,4: - 1.39, 5: -1.61, 6: -1.79, 7: -1.96, 8: -2.08, 9: -2.20, 10: -2.30, 11: -2.40, 12: -2.48, 13: -2.56, 14: -2.64, 15: -2.71, 16: -2.77, 17: -2.83,18: -2.89and 19: -2.94.
-1 -:
-2 -- ________-a--------- __-------w-B--
3 --
d-2.-.-.-.-.-.- ------.-.---.-.--------------
-7 - Y9oQl y9OQ2 Y!MQ3 Y9OQ4 Y91QI Y91Q2 Y9lQS Y9lQ4 Y92Q1 Y92Q2 Y92Q3 Y92Q4
Time Period I-Efkdivc Route ConscntraIion - - - Indusby Cation I
-----~AidiiProduclMix -.--DcmdConcmtnlion
Figure I. The entropy index decomposed.
the industry level. This dichotomy of market power and competition for numerous product lines, that simulates rivalry, suggests that a paradox may exist for domestic carriers with respect to market conduct. Is it more appropriate for them to behave as possessors of market power by raising price and restricting services or should
MEASURING CHANGES IN MULTIPRODUCT MARKET STRUCTURE 501
they offer their service at the competitive price? Perhaps the price wars of recent years are evidence that this paradox has not been resolved. The connection between price wars and market power is investigated in Ross (1994).
III. The Directed Divergence Statistic
A quick glance at Table I would suggest that industry structure is not dramatically changing over the time period in question. However, whether or not there is any change in structure via market share is a question that requires a scientific approach. Fortunately, the E1 is particularly useful for addressing analyses of this nature. The EI lends itself easily to a goodness-c$jt statistic which can be utilized to describe how closely one distribution resembles another.6 In the case of ,331, the point of comparison would be a uniform distribution.
A more interesting application of this measure is when the distribution, in this case the distribution of firm sizes, is compared to the distribution of lirm sizes in another period. In this sense we are able to identify changes at a firm-specific level even though the observation points of this data set are aggregated to the route. The generalized form of the goodness-of-Jit measure is
P(p: q) = 2 x X(X + $f=lPi K) 1 I.2 -1 &
where
(9)
(10)
6 This type of statistic is a member of the power-divergence family as defined by
2nP(X/n : A) = 2
pZfz~Xi[(~)AmI]; --oO<X<oO
X(X + 1)
where X is the family parameter, X/n = (XI /, . . ., Xk /n) is the actual distribution to be compared, n is the total number of observations and (“1, . . ., xk) is the distribution to which X is hypothesized equal. (The notation and discussion to follow is borrowed from Read and Cressie (1988) Section 2.4.) Pearson (1900) showed that this statistic will converge to a Xi-,-1 asymptotically (s + 1 is the number of efficiently estimated parameters) if the two distributions are independent. When X -+ 0 the above statistic may be expressed as
lim 2nIx(X/n : i’) = Ci;=tXi In Xi
x-o ( ,> Z’
’ See Read and Cressie 1988.
502 KATHY J. HAYES AND LEOLA B. ROSS
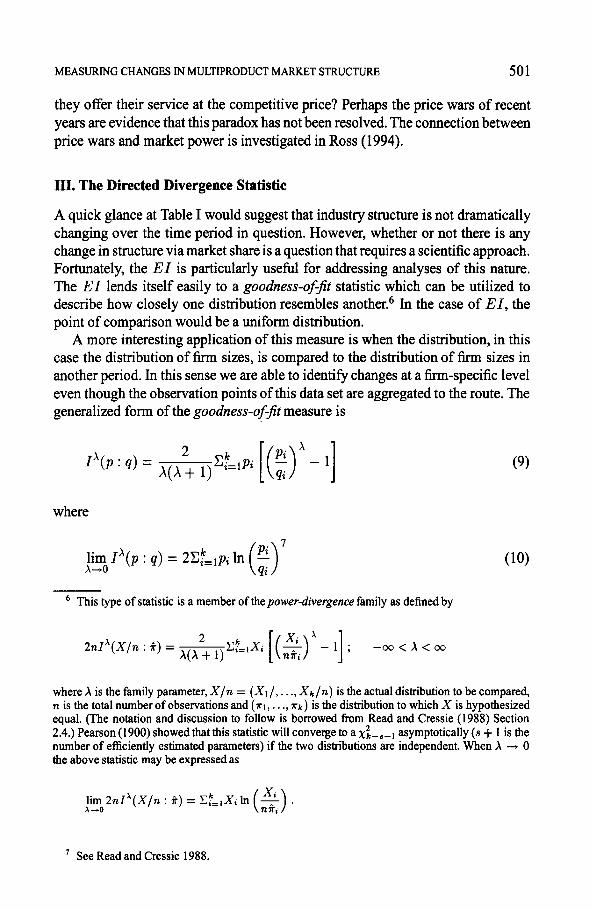
TABLE II. The divergence of industry concentration from peri- od Y9OQl
(1) (2) (3) (4) (5) A= -.85 -.25 -.I0 SO .80
Y9OQ2 0.0033 0.0034 0.0034 0.0034 0.0034 Y9OQ3 0.0081 0.0082 0.0082 0.0082 0.0083 Y90Q4 0.0081 0.0083 0.0084 0.0087 0.0089 Y9lQl 0.0741 0.1975 0.3335 19.939 322.87 Y91Q2 0.0707 0.1947 0.3220 20.936 349.07 Y9lQ3 0.0966 0.2534 0.4236 23.913 382.10 Y9lQ4 0.1198 0.2880 0.4619 23.527 370.74 Y92Ql 0.1526 0.4076 0.6816 37.369 574.58 Y92Q2 0.1553 0.4125 0.6940 40.211 645.63 Y92Q3 0.1586 0.4157 0.6978 40.759 659.62 Y92Q4 0.1622 0.4170 0.6962 38.952 613.64
which closely resembles an EI. Equation (9) may be translated into the airline concentration notation as follows:
2 X(A + l)xt=l pt
“[(3g*5Jl] (11)
This is actually a Directed Divergence Statistic (DDV) since we are measuring the divergence of concentration in time period s from the concentration in time period t.* If we interchange the t’s and s’s, the numbers will not be the same since this index is path dependent and, therefore, an average of these two may also be used as the statistic.
In order to get a flavor of the statistics these numbers would generate, Table II shows the directed divergence of airline concentration EI( A) of all subsequent time periods from time period Y9OQl as represented by Equation (11). This analysis is conducted for various X’s to demonstrate the role it plays in this statistic. Some very small carriers (primarily charter airlines) have been excluded from this exercise since they do not compete with the commercial airline industry.
Clearly, the choice of X is not arbitrary with regard to measuring the degree of change. A choice of -.85 quite obviously makes any difference look quite obscure whereas a choice of .80 seems to successfully magnify any divergence whatsoever. Nevertheless, uniformly the statistics show larger changes from Y9OQ 1 to Y91Q1, a noticeable change in Y91Q3, then another leap in Y92Ql. The three leaps coincide with the departures of Eastern Airlines, Midway and Pan American Airlines, respectively.
One can easily see that this index is also readily applicable to the H H concentration index by setting X equal to 2. However, since the subject of this study is the multiproduct applications of this index, we will contain our analysis to its EI application.
MEASURING CHANGES IN MULTIPRODUCT MARKET STRUCTURE 503
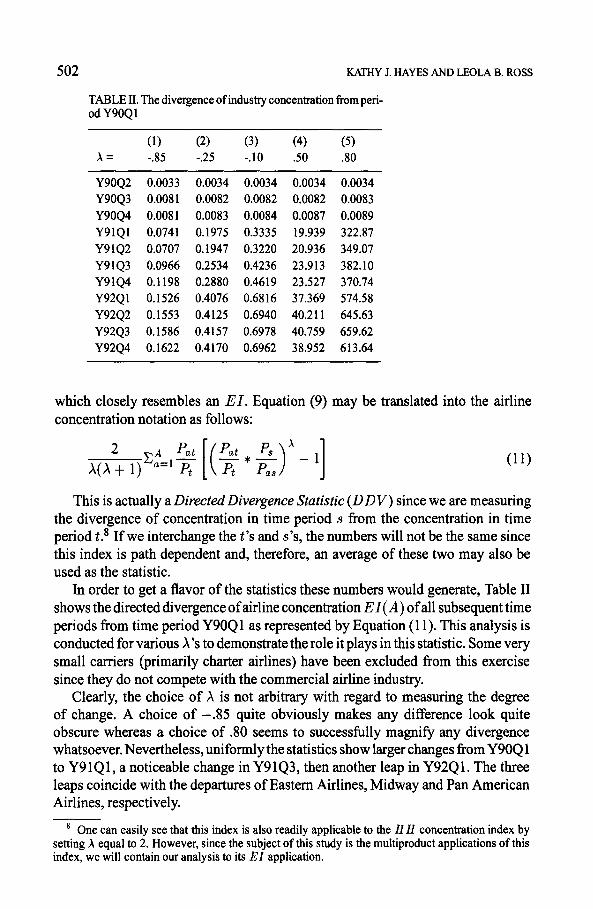
TABLE III. The divergence of demand concentration from period Y9OQl
(1) (2) (3) (4) (5) A= -.85 -.25 -.lO SO .80
Y9OQ2 0.0613 0.0538 0.0515 0.0480 0.047 1 Y9OQ3 0.0929 0.0848 0.0836 0.0812 0.0812 Y9OQ4 0.070 1 0.0587 0.057 1 0.053 1 0.0520 Y91Ql 0.1097 0.0853 0.082 1 0.0742 0.0720 Y91Q2 0.1138 0.098 1 0.0962 0.0925 0.0922 Y91Q3 0.1772 0.1641 0.1654 0.2027 0.275 1 Y91Q4 0.1475 0.1278 0.1264 0.1329 0.1499 Y92Ql 0.1617 0.1299 0.1256 0.1157 0.1141 Y92Q2 0.1874 0.1601 0.1566 0.1509 0.1534 Y92Q3 0.2240 0.1949 0.1913 0.1862 0.1894 Y92Q4 0.202 1 0.1675 0.1628 0.1531 0.1534
The last quarter shows a decline in the divergence from the first quarter when X is greater than -.25; this is the quarter that follows the first highly publicized summer price war in 1992. The trend reversal reflects regained market shares by the bankrupt Continental which had been steadily losing market share since 1990, and a loss of market share by American Airlines, America West, Delta Airlines, Northwest Airlines, United Airlines and TWA which had been steadily gaining market share since 1990. This suggests that a severe market wide price war might significantly influence market structure. An unanticipated drop in prices could disrupt the patterns of consumer loyalty and create an opportunity for permanent changes in the evolution of the marketplace. Further, it is possible that the desperate firms which started these price wars (i.e. Northwest Airlines and others) may have lost the market share they hoped to gain with their actions. Incidentally, Continental, the winner of the summer 1992 price war (with regard to market share), was able to emerge from bankruptcy in 1993 (NY Times July, 21 1993).
Table III reveals that changes in the distribution of consumer demand (as demon- strated by using Equation (11)) are more obscure than industry concentration. Peri- ods Y9OQ2 through Y9OQ4 are not much different from Y9OQ1, whereas Y91Ql through Y92Q4 exhibit similar divergences but are still small in comparison to the divergences in the concentration measures. This degree of stability in the pattern of demand indicates that (at least at the industry level) airlines should be able to predict demand with a high degree of accuracy.
As with many other indices of economic measurement,’ the chosen value of the parameter, X, can reveal some the preferences of the measurer with regard to
9 Atkinson (1970) originally suggestedthat the parameter for his index was a measure of inequality aversion. More recent analysis of the biases imposed by various measures is detailed in Baseman, Hayes and Slottje (1994).
504 KATHY J. HAYES AND LEOLA B. ROSS
appropriate magnification of changes in market structure. Therefore, rather than to pass judgment on the changes in concentration by deciding the significance of their relative magnitudes, we present this analysis for illustrative purposes only. The optimal choice of X is, thus, a function of desired variability rather than interpretation. As in the case of the EI, when the DDV is measured in its log form (as depicted in Equation (10)) it is decomposable into three parts. The decomposition procedure is similar to that of the EI and may be derived in an identical fashion.
Remark 2: The directed divergence of industry concentration in time period s from time period t may be decomposed as follows:
where
W)
WC)
The three components of industry concentration divergence directly match the three components of the EI. DDV(X,), Effective Route Divergence, measures the divergence of market shares on route r and is derived from EI(X,). Similarly, DDV(A) is a measure of the divergence of market shares at the national level and is derived from EI(A). The divergence of aggregated consumer demand for air travel is represented by DDV(R), or Demand Divergence, and the divergence of carrier a’s mix is represented by DDV(X,). DDV(A) and DDV(X,), Industry Divergence and Demand Divergence, combine with Airline Mix Divergence to define the divergence of route market shares.
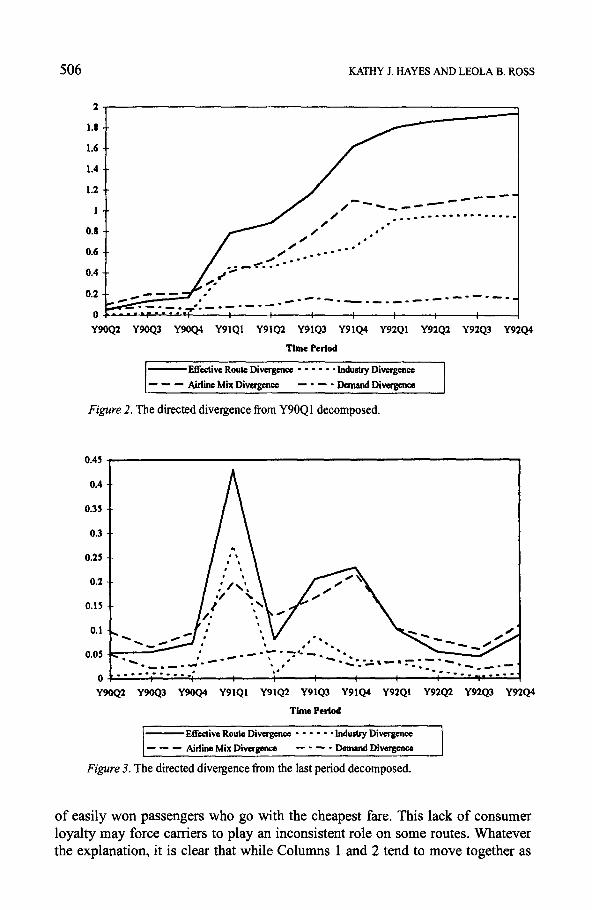
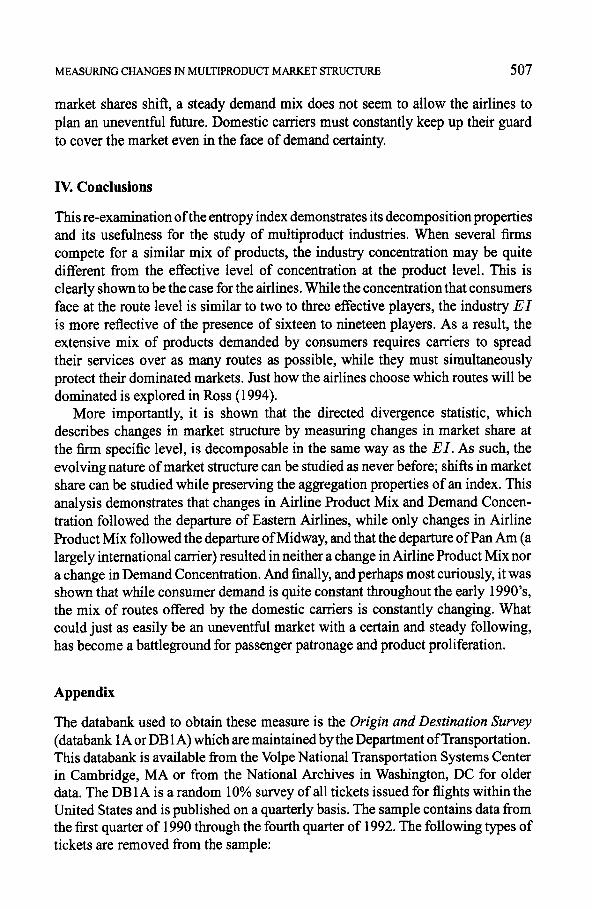
The application of this decomposition property reveals that changes in route structure are dominated by changes in airline mix and has little to do with changes in demand structure. Table IV shows the breakdown of the DDV by its various components. This breakdown is also demonstrated graphically in Figures 2 and 3.
MEASURING CHANGES IN MULTIPRODUCT MARKET STRUCTURE
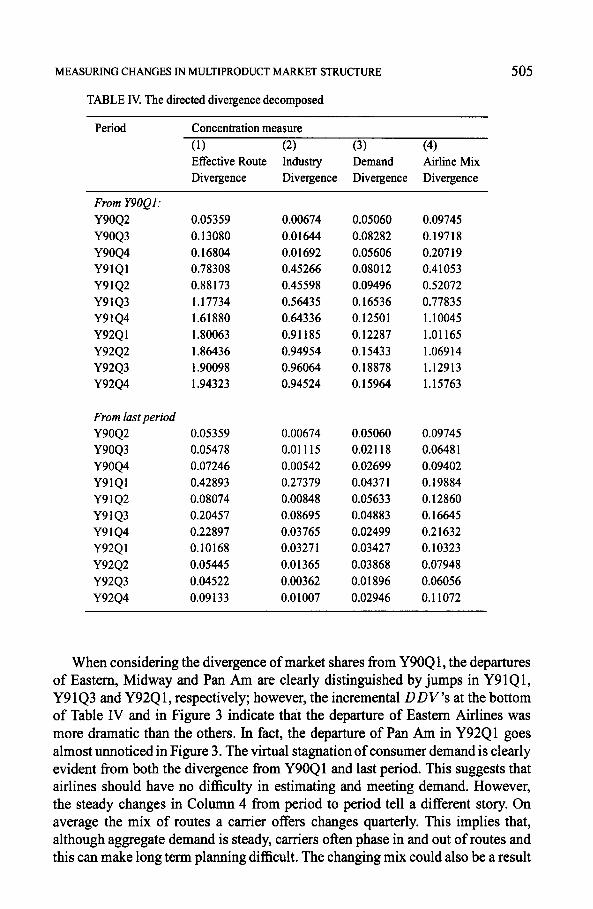
TABLE IV. The directed divergence decomposed
Period Concentration measure (1) (2) (3) (4) Effective Route Industry Demand Airline Mix Divergence Divergence Divergence Divergence
From Y9OQl: Y9OQ2 Y9OQ3 Y9OQ4 Y91Ql Y91Q2 Y91Q3 Y91Q4 Y92Ql Y92Q2 Y92Q3 Y92Q4
From last period Y9OQ2 Y9OQ3 Y9OQ4 Y91Ql Y91Q2 Y91Q3 Y91Q4 Y92Ql Y92Q2 Y92Q3 Y92Q4
0.05359 0.00674 0.05060 0.09745 0.13080 0.01644 0.08282 0.19718 0.16804 0.01692 0.05606 0.20719 0.78308 0.45266 0.08012 0.41053 0.88173 0.45598 0.09496 0.52072 1.17734 0.56435 0.16536 0.77835 1.61880 0.64336 0.12501 1.10045 1.80063 0.91185 0.12287 1.01165 1.86436 0.94954 0.15433 1.06914 1.90098 0.96064 0.18878 1.12913 1.94323 0.94524 0.15964 1.15763
0.05359 0.00674 0.05060 0.09745 0.05478 0.01115 0.02118 0.0648 1 0.07246 0.00542 0.02699 0.09402 0.42893 0.27379 0.0437 1 0.19884 0.08074 0.00848 0.05633 0.12860 0.20457 0.08695 0.04883 0.16645 0.22897 0.03765 0.02499 0.21632 0.10168 0.0327 1 0.03427 0.10323 0.05445 0.01365 0.03868 0.07948 0.04522 0.00362 0.01896 0.06056 0.09133 0.01007 0.02946 0.11072
505
When considering the divergence of market shares from Y9OQ 1, the departures of Eastern, Midway and Pan Am are clearly distinguished by jumps in Y91Q 1, Y91Q3 and Y92Q1, respectively; however, the incremental DDV’s at the bottom of Table IV and in Figure 3 indicate that the departure of Eastern Airlines was more dramatic than the others. In fact, the departure of Pan Am in Y92Ql goes almost unnoticed in Figure 3. The virtual stagnation of consumer demand is clearly evident from both the divergence from Y9OQl and last period. This suggests that airlines should have no difficulty in estimating and meeting demand. However, the steady changes in Column 4 from period to period tell a different story. On average the mix of routes a carrier offers changes quarterly. This implies that, although aggregate demand is steady, carriers often phase in and out of routes and this can make long term planning difficult. The changing mix could also be a result
506 KATHY J. HAYES AND LEOLA B. ROSS
2
1.8
1.6
1.4
1.2
1
0.8
0.6
0.4
0.2
0
-- -----
1--- _____-.-1.1.....--
-----A._____-- m-----_
Y9OQ2 Y9OQ3 Y9OQ4 Y9lQ1 Y91Q2 Y91Q3 Y91Q4 Y92Ql Y92Q2 Y92Q3 Y92Q4
The Pcrlod
-Elk&e Route Divergence - - - - - - lndusby Divergence
- - - AirliieMixDivergcnce ------DemandDivergence
Figure 2. The directed divergence from Y9OQ1 decomposed.
0.45 .
0.4 ._
0.35 -.
0.3 -_
0.25 -.
0.2 --
0.15 ..
Y9OQ2 Y9OQ3 Y9OQ4 Y91Ql Y91Q2 Y91Q3 Y91Q4 Y92Ql Y92Q2 Y92Q3 Y92Q4
Time Peiiod
- Effwtive Route Divergence * - - - - * lndurtry Divcrgmct
- - - Airbe Mix Divergence ------DmnandDivcrgcnce
Figure 3. The directed divergence from the last period decomposed.
of easily won passengers who go with the cheapest fare. This lack of consumer loyalty may force carriers to play an inconsistent role on some routes. Whatever the explanation, it is clear that while Columns 1 and 2 tend to move together as
MEASURING CHANGES IN MULTIPRODUCT MARKET STRUCTURE 507
market shares shift, a steady demand mix does not seem to allow the airlines to plan an uneventful future. Domestic carriers must constantly keep up their guard to cover the market even in the face of demand certainty.
IV. Conclusions
This re-examination of the entropy index demonstrates its decomposition properties and its usefulness for the study of multiproduct industries. When several fhms compete for a similar mix of products, the industry concentration may be quite different from the effective level of concentration at the product level. This is clearly shown to be the case for the airlines. While the concentration that consumers face at the route level is similar to two to three effective players, the industry EI is more reflective of the presence of sixteen to nineteen players. As a result, the extensive mix of products demanded by consumers requires carriers to spread their services over as many routes as possible, while they must simultaneously protect their dominated markets. Just how the airlines choose which routes will be dominated is explored in Ross (1994).
More importantly, it is shown that the directed divergence statistic, which describes changes in market structure by measuring changes in market share at the firm specific level, is decomposable in the same way as the EI. As such, the evolving nature of market structure can be studied as never before; shifts in market share can be studied while preserving the aggregation properties of an index. This analysis demonstrates that changes in Airline Product Mix and Demand Concen- tration followed the departure of Eastern Airlines, while only changes in Airline Product Mix followed the departure of Midway, and that the departure of Pan Am (a largely international carrier) resulted in neither a change in Airline Product Mix nor a change in Demand Concentration. And finally, and perhaps most curiously, it was shown that while consumer demand is quite constant throughout the early 1990’s, the mix of routes offered by the domestic carriers is constantly changing. What could just as easily be an uneventful market with a certain and steady following, has become a battleground for passenger patronage and product proliferation.
Appendix
The databank used to obtain these measure is the Origin and Destination Survey (databank 1A or DB IA) which are maintained by the Department ofTransportation. This databank is available from the Volpe National Transportation Systems Center in Cambridge, MA or from the National Archives in Washington, DC for older data. The DB 1A is a random 10% survey of all tickets issued for flights within the United States and is published on a quarterly basis. The sample contains data from the hrst quarter of 1990 through the fourth quarter of 1992. The following types of tickets are removed from the sample:
508 KATHY J. HAYES AND LEOLA B. ROSS
(1) Any ticket with one or more segments of first class travel (with the exception of Southwest Airlines which records all tickets as first class).
(2) Any tickets that are not either one-way or round-trip. (3) Any tickets with more than one change of plane per direction of travel. (4) Any tickets with an origin or destination outside the United States. (5) Interline tickets (those tickets where services are provided by more than one
carrier). (6) Any tickets that were less than $10 or greater than $750 each way (or $20
and $1500 round-trip, respectively) as these are assumed to be frequent flier tickets, chartered flights or input errors.
(7) Any tickets from carriers that had less than 20 tickets in Y9OQl (these are assumed to be minor carriers that do not compete with the 19 major carriers).
There are 1,049 routes selected from this data set. This is the same sample used for Hayes and Ross (1995) and Ross (1994) so that any conclusions arising from this line of research are not sample specific. The DB 1A has observations on almost any combination of segments imaginable between two endpoints.
References Atkinson, A. B. (1970) ‘On the Measurement of Inequality ‘,JournalofEconomic Theory, 2,244-236. Attaran, M. and Saghafi, M. M. (1988) ‘Concentration Tends and Profitability in the US Manufacturing
Sector: 1970-l 984’, Applied Economics, 20,1497-l 5 10. Basmann, R. L., Hayes, K. J., and Slottje, D. J. (1994) Some New Methods for Measuring and
Describing Economic Inequality, JAI Press, Greenwich, CT. Deutsch, J. and Silber, J. (1995) ‘Static Versus Dynamic Measures of Aggregate Concentration: The
Case of Fortune’s 500’, Southern Economics Journal, 62,192-209. Foster, J. E., Greer, J., and Thorbecke, E. (1984) ‘A Class of Decomposable Poverty Measures’,
Econometrica, 52,761-766. Hannah, L. and Kay, J. A. (1977) Concentration in Modern Industry: Theory, Measurement and the
U.K. Experience, The Macmillan Press Ltd., London. Hayes, K. and Ross, L. (1995) ‘Discounted Fares and Route Rivalries’, Mimeo, Southern Methodist
University. Hirsch, J. S. (1993) ‘Big Airlines Scale Back Hub-Airport System to Curb Rising Costs: Traffic
Gains Trail Forecasts; Passengers, Shippers Find Service has Deteriorated: A Struggle for Market Share’, The Wall Street Journal, Al and A4.
Passel, P. (1993) ‘Airline Panel Wants to Tinker but Only a Little’, The New York Times, July 2 1, C 1 and C2.
Pearson, K. (1900) ‘On the Criterion that a Given System of Deviations from the Probable in the Case of a Correlated System of Variables is such that It Can Be Reasonably Supposed to have Risen from Random Sampling’, Philosophy Magazine, 50, 157-I 72.
Read, T. R. C. and Cressie, N. A. (1988) Goodness-ofFit Statistics for Discrete Muftivariate Data, Springer-Verlag Publishers, New York.
Ross, L. B. (1994) An Analysis of Price Wars in the U. S. Airline Industry: Theory and Evidence, Ph.D. Dissertation, Southern Methodist University.
Saghafi, M. M. and Attaran, M. (1990) ‘Is This the Beginning of the End in the Competitive Trend’, Eastern Economic Journal, XVI, 125-132.
Scott, J. T. (1982) ‘Multimarket Contact and Economic Performance’, Review of Economics and Statistics, 64,368-375.
Scott, J. T. (1991) ‘Multimarket Contact and Diversified Oligopolists’, International Journal of Industrial Organization, 9,225-238.
MEASURING CHANGES lN MULTIPRODUCT MARKET STRUCTURE 509
Scott, J. T. (1993) Purposive Diversification and Economic Perfbrmance, Cambridge University Press, Cambridge.
Shepherd, W. G. (1964) ‘Trends of Concentration in American Manufacturing Industries, 1947-1958’, The Review of Economics and Statistics, 54,200-2 12.
Shepherd, W. G. (1982) ‘Causes of Increased Competition in the U.S. Economy, 1939-1980’, The Review of Economics and Statistics, 64,613-626.
Scherer, F. M. and Ross, D. (1990) IndustrialMarket Structure andEconomic Performance, Houghton Mifflin Co., Boston.
Slottje, D. J. (1989) The StructureofEarnings and theMeasurementofIncome Inequality in the U.S., Elsevier Science Publishers, Amsterdam.
Theil, H. (1989) ‘The Development of International Inequality’, Journal of Econometrics, 42, 145- 155.
Theil, H. (1972) Statistical Decomposition Analysis, Elsevier Publishing Company, New York. Theil, H. (1967) Economics and Information Theory, Rand McNally Co. Chicago. White, L. J. (1981) ‘What Has Been Happening to Aggregate Concentration in the United States?’
The Journal of Industrial Economics, 29,223-230. White, L. J. (198 1) ‘On Measuring Aggregate Concentration: A Reply’, Journal of Industrial Eco-
nomics, 30,223224.