Embed Size (px)
Citation preview

Journal of Operations Management 22 (2004) 171–196
Measuring dimensions of manufacturing flexibility
Lori L. Kostea,1, Manoj K. Malhotrab,∗, Subhash Sharmac,2
a Management Department, Seidman School of Business, Grand Valley State University, Allendale, MI 49401, USAb Management Science Department, Moore School of Business, University of South Carolina, Columbia, SC 29208, USA
c Marketing Department, Moore School of Business, University of South Carolina, Columbia, SC 29208, USA
Accepted 12 January 2004
Abstract
Even though many managers and academics have cited flexibility as a key competitive capability, efforts to measure andunderstand this complex construct continue. Consequently in this paper, we address the issue of manufacturing flexibilitymeasurement, and then use these measures to better understand flexibility. Churchill’s [J. Market. Res. 16 (1979) 64] paradigmis used to develop psychometrically sound measures for six oft-used dimensions of manufacturing flexibility: machine, labor,material handling, mix, new product, and modification. Previous research shows that each of these dimensions, in turn, iscomprised of four elements. The resulting 24 scales (6 dimensions× 4 elements) demonstrate the desired properties of unidi-mensionality, reliability, and validity. We show further that the four elements of any given manufacturing flexibility dimensioncan be grouped into two conceptually separate factors representing “Scope” and “Achievability” of flexible responses. Scopeand achievability factor scores can be used to compare a subset of firms with respect to their flexibility choices, and observethe trade-offs firms make both within and across flexibility dimensions. Along with scale development, establishing scopeversus achievability relationships between flexibility elements provides a better basis for measuring and creating a holisticunderstanding of this complex concept.© 2004 Elsevier B.V. All rights reserved.
Keywords:Manufacturing flexibility; Measurement; Empirical research
1. Introduction
The potential competitive impact of flexibility iswell recognized (Cox, 1989; De Meyer et al., 1989).However, both managers and academics have notedthe lack of appropriate measures for it (e.g.,De Toniand Tonchia, 1998; Parker and Wirth, 1999; Koste
∗ Corresponding author. Tel.:+1-803-777-2712;fax: +1-803-777-6876.E-mail addresses:[email protected] (L.L. Koste),[email protected] (M.K. Malhotra),[email protected] (S. Sharma).
1 Tel.: +1-616-331-7454; fax:+1-616-331-7445.2 Tel.: +1-803-777-4912; fax:+1-803-777-6876.
and Malhotra, 1999; Beach et al., 2000) as well asthe need to better understand the relationships amongdifferent types of flexibility (e.g.,Parker and Wirth,1999; Beach et al., 2000). While efforts have beenmade to address the measurement gap, good, general-izable measures that span multiple industries are stilllacking (Gerwin, 1993), which in turn hinders the ef-fective management of this key capability. This studyseeks to address this need by creating generalizablemeasures for six different dimensions of manufactur-ing flexibility and then using these measures to furtherour understanding of manufacturing flexibility.
A number of recent studies have measured flexi-bility objectively, using industry specific measures
0272-6963/$ – see front matter © 2004 Elsevier B.V. All rights reserved.doi:10.1016/j.jom.2004.01.001

172 L.L. Koste et al. / Journal of Operations Management 22 (2004) 171–196
(e.g., Dixon, 1992; MacDuffie et al., 1996; Suarezet al., 1995, 1996; Upton, 1995, 1997). Unfortunately,these measures are not broad-based and are applicableonly to the industries within which they were created.Consequently, three other studies have attempted todevelop flexibility measures that span multiple in-dustries. Two of these were empirical, but they wereexploratory in nature.Gupta and Somers (1992)pro-vided the first effort at scale development. They culledeleven flexibility dimensions and 34 items from theexisting literature. Exploratory factor analysis (EFA)resulted in the retention of nine factors, some of whichwere composites of the original flexibility dimen-sions. Several of the measures thus developed weresingle-item measures and the flexibility dimensionslacked a well-defined theoretical domain.
A more recent effort byD’Souza and Williams(2000) partially addresses this concern. The authorswere consistent in specifying the domain for the vol-ume, variety, process and material handling flexibilitydimensions included in their study. However, whileprior research indicates that the domain of flexibilityconsists of more than two elements (e.g.,Gupta andBuzacott, 1989; Slack, 1983, 1987; Upton, 1994),the authors used only two to assess each flexibilitydimension. Single or dual items from the literaturewere chosen to capture the range and mobility ele-ments of each of them. EFA demonstrated that theitems loaded on the two factors as anticipated. Whilethis study advanced the empirical efforts toward scaledevelopment, a concern exists with respect to the factthat D’Souza and Williams (2000)operationalizedonly two elements. This concern is significant, andmandates additional efforts in measuring flexibility.
A study byParker and Wirth (1999)took a differentapproach. The authors examined the intended purposeof a given flexibility measure and used evaluative cri-teria to identify “best” measures for several differenttypes of flexibility. They found two types of flexibilitylacked good measures and subsequently created mod-els to assess them. While insightful, the underlyingassumptions behind the models were fairly restrictive,potentially limiting their use in industry.
The above studies focused solely on flexibility,although this concept has been operationalized in abroader context in other empirical research.Pagell andKrause (1999)examined the relationships between op-erational flexibility, uncertainty, and firm performance.
Narasimhan and Das (1999)examined the effect ofstrategic sourcing on advanced manufacturing tech-nologies (AMT) and on three specific types of flexi-bility, as well as the relationships among the flexibilitydimensions.Brandyberry et al. (1999)also examinedthe relationship between AMT and market-orientedflexibility. However, since flexibility was not the pri-mary focus of these studies, the operationalization ofthis construct was fairly limited. Two of the studiescombined multiple dimensions of flexibility into onemeasure (e.g.,Pagell and Krause, 1999; Brandyberryet al., 1999) or focused on limited aspects of the di-mensions (e.g.,Narasimhan and Das, 1999measuredflexibility for all dimensions with respect to the mo-bility element only). While these studies providedinsight and advanced their respective research fields,they would have been strengthened considerably by afuller, multi-faceted approach to measuring flexibility,an objective we intend to pursue in this study.
2. The flexibility construct
While many different types of flexibility have beenidentified in the literature, prior research indicates thatthe domain of any flexibility dimension is comprisedof four elements: range-number, range-heterogeneity,mobility, and uniformity (Slack, 1983, 1987; Upton,1994; Koste and Malhotra, 1999). The range-number(R-N) element of flexibility is a strict numerical countof the number of possible options that a system orresource can achieve. The range-heterogeneity (R-H)element addresses the degree of difference betweendifferent options. The mobility (M) element repre-sents the ease with which the organization movesfrom one state to another. For each change of statewithin the range, mobility is assessed via transitionpenalties. The uniformity (U) element of flexibilitycaptures any alteration or deterioration of the sys-tem associated with invoking a flexible response. Assuch, a large number of performance measures canbe used to assess the similarity of performance out-comes within the spanned range. For both transitionpenalties and changes in performance, the net sum ofchanges must be considered.
In this study, we focus on six flexibility di-mensions: machine, labor, material handling, mix,new product and modification. Machine, labor, and

L.L. Koste et al. / Journal of Operations Management 22 (2004) 171–196 173
material handling flexibility were included becausethey are frequently studied in the literature (e.g.,Gupta and Somers, 1992; Nandkeolyar and Christy,1992; Malhotra and Ritzman, 1990) and also providea base for the development of higher-level flexibil-ity dimensions. Mix, new product, and modificationflexibility were included because of their competitiveimportance in the market place, as evidenced by theirfrequent inclusion in the empirical flexibility research(e.g.,Dixon, 1992; Suarez et al., 1995, 1996; Upton,1995, 1997). While additional flexibility dimensionshave been discussed in the literature, they have beenaddressed far less frequently in the empirical re-search. For example, even though it is beginning toreceive more attention lately (e.g.,Jack and Raturi,2002), volume flexibility was addressed on a limitedbasis (e.g.,Fiegenbaum and Karnani, 1991; Suarezet al., 1995, 1996) at the time this research was con-ducted. In contrast, numerous studies have includedor focused on mix and/or new product flexibilityover the course of time (e.g.,Dixon, 1992; Kekreand Srinivasan, 1990; MacDuffie et al., 1996; Suarezet al., 1995, 1996; Swamidass and Newell, 1987;Upton, 1995, 1997among others). Consequently, wetoo focused on those dimensions that were perceivedby prior researchers as the most relevant ones. Inaddition, pilot studies and pre-tests revealed that theinclusion of scales for additional flexibility dimen-sions would have made the survey prohibitively long,potentially compromising data collection efforts andthe attendant response rates. We describe next thecompletion of the scale development paradigm forthese six flexibility dimensions.
3. Scale development
3.1. Content validity
For generating the scale items and establishing theircontent validity, we carefully followed the recommen-dations offered byHinkin (1995). In order to par-simoniously capture the specific domain of interestand to provide content validity, literature from di-verse research areas was reviewed for potential scaleitems. The literature base included, but was not limitedto, conceptual and empirical flexibility research, shopfloor scheduling and dual resource constraint research,
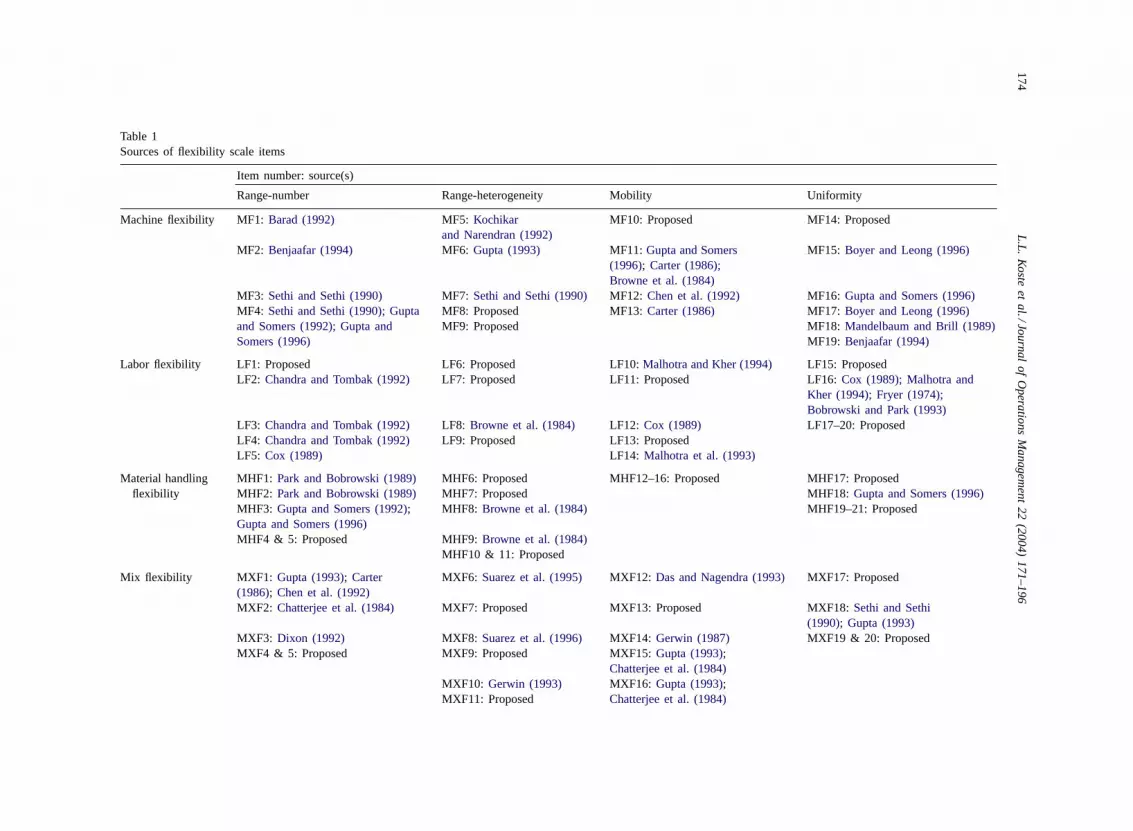
and flexible manufacturing systems research. The lit-erature review resulted in a number of items that couldeither be included verbatim or adapted. These itemswere then classified based on the flexibility dimensionand the element they addressed (seeTable 1). Eachcell in the table identifies the acronyms for individ-ual items associated with each of the six flexibility di-mensions and their elements, along with the originalsource(s) of the item.
A number of newly proposed items were alsocreated. This was necessary; in particular, for thoseflexibility dimensions which were addressed lessfrequently in the literature (e.g., material handlingflexibility) or which were treated jointly with anotherdimension (e.g., modification flexibility). In addition,some elements, such as range-heterogeneity, havebeen less developed than others and thus needed newconstructs.
A thorough literature review, along with expertopinions, was used to ensure the content validity ofthe scales. In addition, the Q-sort technique was usedto identify those items that should be grouped together(Moore and Benbasat, 1991). The proposed itemswere randomly arranged to prevent any unintendedimplication of the construct associated with an item.Detailed descriptions of the flexibility dimensionsand elements were also provided to the respondents.The goal of the Q-sort was to match the proposeditems with the appropriate flexibility dimension andelement. The responses were then analyzed for thefrequencies with which each item was correctly asso-ciated and matched with its intended construct.
Seven academics and two practitioners who werewell versed in the concept of different dimensions ofmanufacturing flexibility completed the Q-sort. Whilethe overall performance of the items was acceptable,a handful of them were often categorized improperly.The responses to these items were individually exam-ined and, where appropriate, the item was modifiedto more clearly reflect its intended flexibility dimen-sion and element. Those items that had performed verypoorly in the Q-sort were deleted. Finally, some newitems were developed based on the existing literatureand an examination of those items that had performedwell.
One additional issue with respect to the content va-lidity of the scales should also be addressed. A cursoryexamination of the scale items may lead the reader to
174L
.L.
Ko
stee
ta
l./Jou
rna
lo
fO
pe
ratio
ns
Ma
nage
me
nt
22
(20
04
)1
71
–1
96
Table 1Sources of flexibility scale items
Item number: source(s)
Range-number Range-heterogeneity Mobility Uniformity
Machine flexibility MF1: Barad (1992) MF5: Kochikarand Narendran (1992)
MF10: Proposed MF14: Proposed
MF2: Benjaafar (1994) MF6: Gupta (1993) MF11: Gupta and Somers(1996); Carter (1986);Browne et al. (1984)
MF15: Boyer and Leong (1996)
MF3: Sethi and Sethi (1990) MF7: Sethi and Sethi (1990) MF12: Chen et al. (1992) MF16: Gupta and Somers (1996)MF4: Sethi and Sethi (1990); Guptaand Somers (1992); Gupta andSomers (1996)
MF8: Proposed MF13:Carter (1986) MF17: Boyer and Leong (1996)MF9: Proposed MF18:Mandelbaum and Brill (1989)
MF19: Benjaafar (1994)
Labor flexibility LF1: Proposed LF6: Proposed LF10:Malhotra and Kher (1994) LF15: ProposedLF2: Chandra and Tombak (1992) LF7: Proposed LF11: Proposed LF16:Cox (1989); Malhotra and
Kher (1994); Fryer (1974);Bobrowski and Park (1993)
LF3: Chandra and Tombak (1992) LF8: Browne et al. (1984) LF12: Cox (1989) LF17–20: ProposedLF4: Chandra and Tombak (1992) LF9: Proposed LF13: ProposedLF5: Cox (1989) LF14: Malhotra et al. (1993)
Material handlingflexibility
MHF1: Park and Bobrowski (1989) MHF6: Proposed MHF12–16: Proposed MHF17: ProposedMHF2: Park and Bobrowski (1989) MHF7: Proposed MHF18:Gupta and Somers (1996)MHF3: Gupta and Somers (1992);Gupta and Somers (1996)
MHF8: Browne et al. (1984) MHF19–21: Proposed
MHF4 & 5: Proposed MHF9:Browne et al. (1984)MHF10 & 11: Proposed
Mix flexibility MXF1: Gupta (1993); Carter(1986); Chen et al. (1992)
MXF6: Suarez et al. (1995) MXF12: Das and Nagendra (1993) MXF17: Proposed
MXF2: Chatterjee et al. (1984) MXF7: Proposed MXF13: Proposed MXF18:Sethi and Sethi(1990); Gupta (1993)
MXF3: Dixon (1992) MXF8: Suarez et al. (1996) MXF14: Gerwin (1987) MXF19 & 20: ProposedMXF4 & 5: Proposed MXF9: Proposed MXF15:Gupta (1993);
Chatterjee et al. (1984)MXF10: Gerwin (1993) MXF16: Gupta (1993);
Chatterjee et al. (1984)MXF11: Proposed

L.L
.K
oste
et
al./Jo
urn
al
of
Op
era
tion
sM
an
agem
en
t2
2(2
00
4)
17
1–
19
6175
New productflexibility
NPF1 & 2: Proposed NPF6–10: Proposed NPF14: Proposed NPF19–22: ProposedNPF3: Chatterjee et al. (1984) NPF11:Ramasesh and
Jayakumar (1991)NPF15:Gupta and Somers (1992)
NPF4: Booz-Allen & Hamilton(1982)
NPF12 & 13: Proposed NPF16:Chatterjee et al. (1984)
NPF5: Sethi and Sethi (1990);Gupta and Somers (1992);Chatterjee et al. (1984)
NPF17:Dixon (1992)
NPF18:Gupta and Somers (1992)
Modificationflexibility
MDF1–4: Proposed MDF7:Ramasesh andJayakumar (1991)
MDF12–16: Proposed MDF17–20: Proposed
MDF5: Chatterjee et al. (1984) MDF8–11: ProposedMDF6: Booz-Allen & Hamilton(1982)

176 L.L. Koste et al. / Journal of Operations Management 22 (2004) 171–196
incorrectly conclude that some of the items are sim-ply restatements of each other and thus redundant. Butsuch an approach was deliberately adopted, and essen-tially introduced what in scale development literatureis called “useful redundancy”. It served the objectiveof better tapping the domain of the construct. The re-sulting final scale items and their detailed results areprovided inAppendix A.
3.2. Sampling issues
The revised items were then evaluated via a pretestof the instrument. As perHinkin (1995), we paid par-ticular attention to the sampling and data collectionprocess and therefore describe it in detail here. Themanufacturing plant was chosen as the unit of analysisfor this study for several reasons. First, a manufac-turing plant is likely to reflect to some degree all sixof the flexibility dimensions included in the study.Second, the use of plant level analysis is consistentwith the focus of recent empirical flexibility research(e.g.,Dixon, 1992; Suarez et al., 1995, 1996; Upton,1995, 1997). Finally, it has been shown that differentplants within the same division or strategic businessunit may achieve different levels of flexibility (Dixon,1992; Upton, 1995, 1997). Thus, plant level analysisshould provide enough variance to create and test theproposed measures.
The targeted survey respondent should possess ad-equate knowledge to accurately complete the instru-ment. The flexibility dimensions included in our studywere within the responsibility of top management.Consequently, Plant Managers or Vice Presidents ofManufacturing were the targeted respondents. Due tothe workload of these individuals, several incentiveswere included in an effort to increase the response rate(Yu and Cooper, 1983).
Since the possibility of bias or incomplete knowl-edge exists with the use of a single respondent(Huber and Power, 1985), efforts were made to ad-dress this concern. A smaller sample of respondingplants were contacted and a second survey participantwas requested. This approach allowed the degree ofagreement, i.e. inter-rater agreement, between the tworespondents to be assessed (James et al., 1984, 1993).
Three criteria were used to define the sample frame:process type, SIC code, and firm size. Manufacturingoperations and process types that were likely to be
associated with all six of the flexibility dimensionswere desirable. Job shop and batch manufacturingorganizations produce multiple products in relativelysmall volumes, thereby requiring flexible resources(Hayes and Wheelwright, 1984). Organizations withan assembly/production line process also require adegree of flexibility, such as the flexibility to changeproduct mix or introduce new products. Continuousflow organizations, in contrast, produce a single ora limited number of products, and require less flex-ibility ( Hayes and Wheelwright, 1984). Given thisdistinction, organizations that were likely to possessjob shop, batch or production line processes werethe predominant targets, and were more frequentlyrepresented in the sample frame.
The sample should also provide a variety of flex-ibility values over the measures being developed(Gerwin, 1987). In this study, Gerwin noted that thesampled population should include diversity “so thatthe scales to be developed will have some generality.”He also cautioned, however, that the population mustnot be so diverse that a scale is not applicable to theentire population. To meet these conflicting needs, weselected organizations in a limited number of indus-tries. Those manufacturers within industries such aselectronics (SIC 36), machinery (SIC 35), and metalproducts (SIC 34) have been deemed likely candi-dates for flexibility research (Gerwin, 1987; Guptaand Somers, 1992, 1996; MacDuffie et al., 1996),thereby prompting their inclusion in our research aswell.
The third selection criterion was firm size. Man-ufacturing firms of a reasonable size (medium tolarge) were chosen for the sample frame. This focusis consistent with prior empirical flexibility research.Gupta and Somers (1992, 1996), in a cross-sectionalstudy, surveyed similarly sized organizations, withthe majority having sales between US$ 25 millionand US$ 1 billion. Other studies have used large,capital-intensive organizations, such as textile andfine paper manufacturers, to examine flexibility (e.g.,Dixon, 1992; Upton, 1997). In addition, larger firmswould be more likely to emphasize the developmentof the higher-level flexibility dimensions (i.e., mix,new product and modification). The building of thesecapabilities also requires skills and resources thatmay be more prevalent in larger firms. Consequently,we sought to include firms that had reported annual

L.L. Koste et al. / Journal of Operations Management 22 (2004) 171–196 177
sales of US$ 25 million or higher in our sampleframe, omitting firms with smaller reported sales fromconsideration.
After defining the sample frame for this study, itwas possible to proceed with pre-testing the instru-ment. Seven point Likert-type scales were used forthe flexibility items. The scales ranged from “stronglydisagree” to “strongly agree”, with a middle anchorpoint of “neither agree nor disagree”. Due to the rela-tive nature of flexibility (Tidd, 1991), instructions in-dicated that items should be answered “relative to yourmajor competitors”. Further, a number of the itemswere reverse-worded to prevent response bias. Finally,the preliminary survey contained additional questionsthat were used to gather necessary descriptive infor-mation regarding annual sales, number of employees,SIC code, etc.
A convenience sample of firms, with the desiredcharacteristics, was selected for the pretest from the1998 National Edition of the Harris ManufacturersDirectory. Potential respondents were contacted, toldthe subject of the study, and requested to participate.The instrument was completed by a total of 15 orga-nizations. In addition to completing the survey, the re-spondents provided written qualitative feedback on theclarity of both the instructions and the survey items.The respondents provided notes and comments on anywords or items that were ambiguous or imprecise.Prior to finalizing the instrument, a thorough reviewof all the survey items was undertaken and changeswere made.
4. Data collection
The 1998 National Edition of the HarrisManufacturers Directoryagain provided a list of ap-propriate firms for the large-scale data collection ef-fort. These firms were located all over the USA. Thoseorganizations that participated in pre-testing the in-strument were necessarily excluded from the sampleframe. The sample was then randomly selected fromthe three SIC groups. The representation of each SICgroup in the sample was proportionate to its represen-tation in the sample frame. For example, if 35% ofthe organizations in the sample frame were electron-ics manufacturers, then 35% of the surveys were sentto randomly chosen organizations in this industry.
The survey instrument was mailed to 1000 orga-nizations in the sample frame. Of the initial mailing,twenty instruments were returned due to incorrectaddresses. A total of 117 surveys were received in thefirst 6 weeks. Follow-up phone calls were made tomany of the non-responding firms, resulting in 41 ad-ditional responses. Moreover, of the non-respondingfirms contacted, 218 were found to have incorrectcontact information and were subsequently removedfrom the sample. In all, 158 completed questionnaireswere returned, resulting in a 20.9% (158/762) re-sponse rate. This response rate is consistent with otherempirical research (e.g.,Hyer and Wemmerlov, 1989;Sethi and King, 1994) and considered acceptable inOperations Management survey research (Malhotraand Grover, 1998).
Non-response bias is always a concern in surveyresearch. We assessed non-response bias in two ways.First, we compared early and late responders. Thoseresponses that were received in the first 6 weeks afterthe initial mailing were labeled “early” responses,and the remaining ones were deemed as “late”. Theresponses for both groups were compared for all 122flexibility scale items. Of these, only seven itemsdiffered significantly at aP-value of 0.05. As an ad-ditional check,�2 tests were conducted to compareresponders and non-responders on two organizationalcharacteristics. No difference was found betweenresponders and non-responders with respect to Es-timated Sales (P = 0.134) or SIC group (i.e., 34,35, 36) (P = 0.142). These findings collectively in-dicated that non-response bias was not a significantconcern.
A profile of the responding firms is provided inTable 2. As can be seen from the table, one third of thesample comes from SIC 34, 26.52% from SIC 35, and40.15% from SIC 36. Sales of the responding organi-zations ranged from less than 50 million to 3 billion,with the majority having sales of less than 250 million(87.2%). The number of employees ranged from lessthan 50 to greater than 1000, with the majority havingbetween 100 and 1000 employees (89.1%). The rangeof annual sales and number of employees demonstratesthat the sample does consist of the desired mix ofmedium and large firms (e.g.,Hyer and Wemmerlov,1989; Swamidass, 1994). Thus, the objective of creat-ing a sample of medium and large firms within threeSIC groups (34, 35, 36) was accomplished.

178 L.L. Koste et al. / Journal of Operations Management 22 (2004) 171–196
Table 2Profile of responding organizations and respondents
Metric Frequency Percentage Cumulativepercentage
SIC codeSIC 34 49 33.33 33.33SIC 35 39 26.52 59.85SIC 36 59 40.15 100.00
SalesLess than 50 milliona 31 19.9 19.950–100 million 56 35.9 55.8101–250 million 49 31.4 87.2251–500 million 15 9.6 96.8501 million–1 billion 4 2.6 99.41–3 billion 1 0.6 100.00
Number of employeesLess than 50 1 0.6 0.651–100 2 1.3 1.9101–250 16 10.2 12.1251–500 68 43.6 55.7501–1000 55 35.3 91.0Over 1000 14 9.0 100.00
Top management:President 5 3.2 3.2Chief Executive
Officer (CEO)1 0.6 3.8
Executive Vice President 4 2.6 6.4Vice President/General
Manager5 3.2 9.6
Vice President 8 5.2 14.8General Manager 12 7.7 22.5Division Manager 1 0.6 23.1Vice President of
Manufacturing19 12.3 35.4
Vice President ofOperations
18 11.6 47.0
Vice President ofProduction
2 1.3 48.3
Middle managementPlant Manager 37 23.9 72.2Operations Manager 7 4.5 76.7Manufacturing Manager 12 7.8 84.5Production Manager 3 2.0 86.5
Lower managementPlant Supervisor 2 1.3 87.8Plant Foreman 1 0.6 88.4Other 18 11.6 100.0
Knowledge levelExtensive knowledge 9 5.8 5.8Considerable knowledge 57 36.5 42.3Moderate knowledge 65 41.7 84.0Some knowledge 22 14.1 98.1No knowledge 3 1.9 100.0
a Estimated sales from the 1998 National Edition of the HarrisManufacturing Directory were greater than 25 million.
As discussed previously, the targeted respon-dent for this study was “someone who was veryknowledgeable” about operations at the plant. AsTable 2shows, the majority of respondents (86.5%)were high-ranking manufacturing executives at orabove the level of production manager. Thus, webelieve that the respondent did possess accurate infor-mation concerning flexibility in the plant. In addition,these high-level respondents are likely to be involvedwith the topic, thereby increasing accuracy (Huberand Power, 1985). Finally, respondents were gen-erally knowledgeable about competitors’ operationssince 98.1% of them possessed between “some” and“extensive” knowledge of competitors’ operations(seeTable 2). This knowledge should enhance the ac-curacy of their response for those items that requireda response “relative to major competitors”.
5. Measurement properties of the scales
5.1. Content validity
Prior to discussing the measurement properties ofthe scales, we briefly revisit the issue of content va-lidity. Analysis of the inter-item correlations amongscale items supported the content validity of the scales.Typically, these correlations should be moderate andnot very high. High loadings (i.e., items whose load-ings are greater than 0.9), which result in inter-itemcorrelations of greater than 0.8, should be avoided.For instance, the R-H element of labor flexibility hadan average inter-item correlation before scale purifi-cation of 0.353 and only 0.572 after scale purifica-tion. Of the 24 constructs included in this study, onlyone had an average inter-item correlation greater than0.80 (mobility element of material handling flexibil-ity). The high inter-item correlation for this particularscale is a limitation of this study, but could certainlybe addressed in future scale refinement efforts.
We turn now to an examination of the measure-ment properties for each of the elements within our sixflexibility dimensions. Since there were a large num-ber of indicators (122) and a limited sample size, wefollowed the one-step approach as advocated byBurt(1976). Reliability, convergent validity, and inter-rateragreement were examined for each element (construct)of a flexibility dimension. Discriminant validity was

L.L. Koste et al. / Journal of Operations Management 22 (2004) 171–196 179
then examined with respect to the four elements asso-ciated with a given flexibility dimension.
The measurement scales were purified using all 158of the completed instruments with a list wise optionfor missing data. This is a more conservative treat-ment of missing data (Wothke, 1993), as those ques-tionnaires for which data was incomplete for a givenscale were omitted from the relevant analysis. This ap-proach resulted in slight variations in sample size foreach scale, as can be seen from the sample sizes in-dicated inAppendix A. Overall, however, the samplesizes were adequate.
5.2. Convergent validity
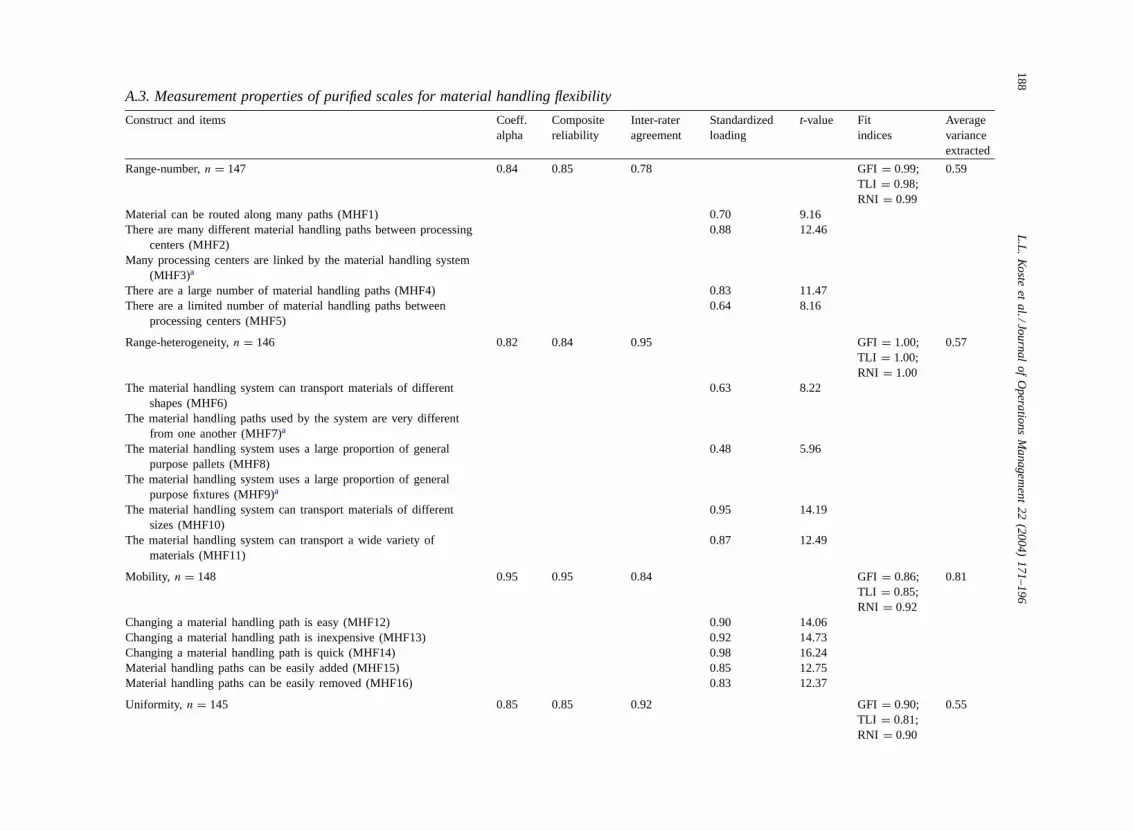
Convergent validity of the indicators exists if agroup of indicators are measuring one common factor.Convergent validity is demonstrated by the statisticalsignificance of the loadings at a given alpha (i.e.,P = 0.05). Alternatively, reliability (squared stan-dardized loadings) or the average variance extracted(AVE) can be examined. All three techniques wereused simultaneously to purify the scales. Items orindicators that did not meet these criteria were consid-ered for deletion. This rigorous approach was takento increase confidence in the measures. After purifi-cation, all the goodness-of-fit indices (i.e., GFI, TLIand RNI) suggested good model fit (seeAppendix A).In addition, the AVE for the purified scales was inexcess of the recommended 0.50 (Segars, 1997), forall but one flexibility construct (R-H for new productflexibility was 0.46). Thus, overall, the purified scalesdemonstrated convergent validity.
The internal consistency of the scales was assessedwith coefficientα and composite reliability. The re-tained scale items demonstrated acceptable internalconsistency, with a range of 0.79–0.95 for coefficient�, and a range of 0.79–0.94 for composite reliabil-ity. Both measures were above the recommended level(0.60) for newly developed scales (Nunnaly, 1978;Hatcher, 1994).
5.3. Inter-rater agreement
Having verified the reliability and convergent va-lidity of the purified scales, we turn to a discussionof inter-rater agreement. As previously discussed, anumber of second responses (n = 28) were obtained.
James et al. (1984, 1993)provide an appropriate mea-sure for assessing the level of inter-rater agreement,within-group inter-rater agreement index (rwg). Theindex can range between 0 and 1, with 1 representingperfect agreement. The index was calculated for thegroup of items (after purification) that capture eachconstruct. AlthoughJames et al. (1984, 1993)do notprovide a definitive cutoff point, values of 0.71 orhigher have been deemed acceptable (e.g.,Dean andSharfman, 1993). The indices for the 24 purified scalesranged from 0.79 to 0.97, which are above the rec-ommended minimum (seeAppendix A). Thus, singlerespondent bias does not appear to exist in the sample.
5.4. Discriminant validity
After examining the unidimensionality, reliability,convergent validity, and inter-rater agreement, weexamined the discriminant validity of the scales. Dis-criminant validity is demonstrated if the average vari-ance extracted for each construct (within-constructvariance) is greater than the squared correlationsbetween constructs (between-construct variance)(Hatcher, 1994; Segars, 1997). Bagozzi’s (1980)criterion can also be used throughχ2 differencetests.
We examined discriminant validity among the fourelements of any given dimension of flexibility, usingFornell and Larcker’s (1981)technique. A four fac-tor correlated model representing each of the four ele-ments was used to examine discriminant validity, andis schematically shown inFig. 1. The within-groupand between-group variances for all the constructs arecontained inAppendix B. The four elements are listedin the header row and column. The diagonal cells con-tain the within-group variances, the off-diagonal cellsin the lower triangle contain the between-group vari-ances, and the off-diagonal cells in the upper trianglerepresent correlations among the constructs.
As can be seen in the tables, the within-groupvariances of any two constructs exceed the variancebetween those two constructs, thereby supportingdiscriminant validity. As an additional verification,Bagozzi’s (1980)technique was used to examine theχ2 differences between two models for each pairof constructs: a two-factor correlated model and atwo-factor correlated model in which the correlationsamong the constructs are constrained to be equal

180 L.L. Koste et al. / Journal of Operations Management 22 (2004) 171–196
Fig. 1. Four factor correlated model of flexibility.
to one. Theχ2 differences were all significant atP = 0.001, further supporting discriminant validityof the scales.
5.5. Predictive validity
A final consideration with the development of newscales is the existence of predictive or criterion-relatedvalidity, which assesses the ability of the scale to re-late theoretically to variables outside the scale. Weexplored this validity by comparing the multi-itemmeasures with an external variable called “Overallflexibility”, which was assessed in the survey instru-ment with a single item that requested the respon-dents to “rate the overall flexibility of manufacturingin your plant”. Responses ranged from highly inflexi-ble (coded 1) to highly flexible (coded 5).Saraph et al.(1989)and later onFlynn et al. (1994)followed a sim-ilar approach to establish criterion related validity oftheir scales, whereby quality scales were correlated toself-reported quality performance.
As previously discussed, all four elements con-tribute to a given dimension of flexibility. Further, it isreasonable to assume that all six dimensions includedin this study contribute to the manufacturing flexibil-ity of the plant. Thus, a comparison can be conductedbetween “overall flexibility” and a composite valuefor the six flexibility dimensions across each of itsfour elements. To obtain this aggregate value, weadded the sum scores of the 24 elements for eachorganization in the sample. The resulting compos-ite value was positively and significantly correlated
with the overall flexibility rating of the organization(r = 0.350, P = 0.000), thereby providing a degreeof nomological validity. It appears that the newly de-veloped scales accurately and effectively differentiateamong organizations. Firms that were highly flexiblebased on our measured flexibility scores were alsoperceived to have greater overall flexibility.
We should note that we created the aggregate flex-ibility score specifically for comparison purposes.Given the relative infancy of flexibility measure-ment research, we advocate treating the flexibilitydimensions individually until a greater level of under-standing is reached. This approach provides a moredetailed and accurate picture of flexibility, and hasbeen advocated by several other researchers as well. Inparticular,Narasimhan and Das (1999, pp. 694–695)state in this context that “A unidimensional treatmentof manufacturing flexibility is inadvisable because(1) the contribution of individual flexibilities will beaggregated with the resulting loss of information, (2)the interactions among the various flexibility dimen-sions cannot be examined, and (3) such compositeconceptualizations of manufacturing flexibility wouldbe less useful to the practitioner. Interactions andrelationships among different flexibility types meritinvestigation (Gil, 1994).”
Having established the measurement properties ofthese 24 flexibility constructs (four elements each forsix flexibility dimensions), we now utilize these mea-sures in an effort to further our understanding of flex-ibility. We first analyze the relationship between theelements of any given flexibility dimension, and then
L.L. Koste et al. / Journal of Operations Management 22 (2004) 171–196 181
discuss how these separate measures of flexibility canbe interpreted and used in future empirical studies.
6. Interpretation of flexibility constructs
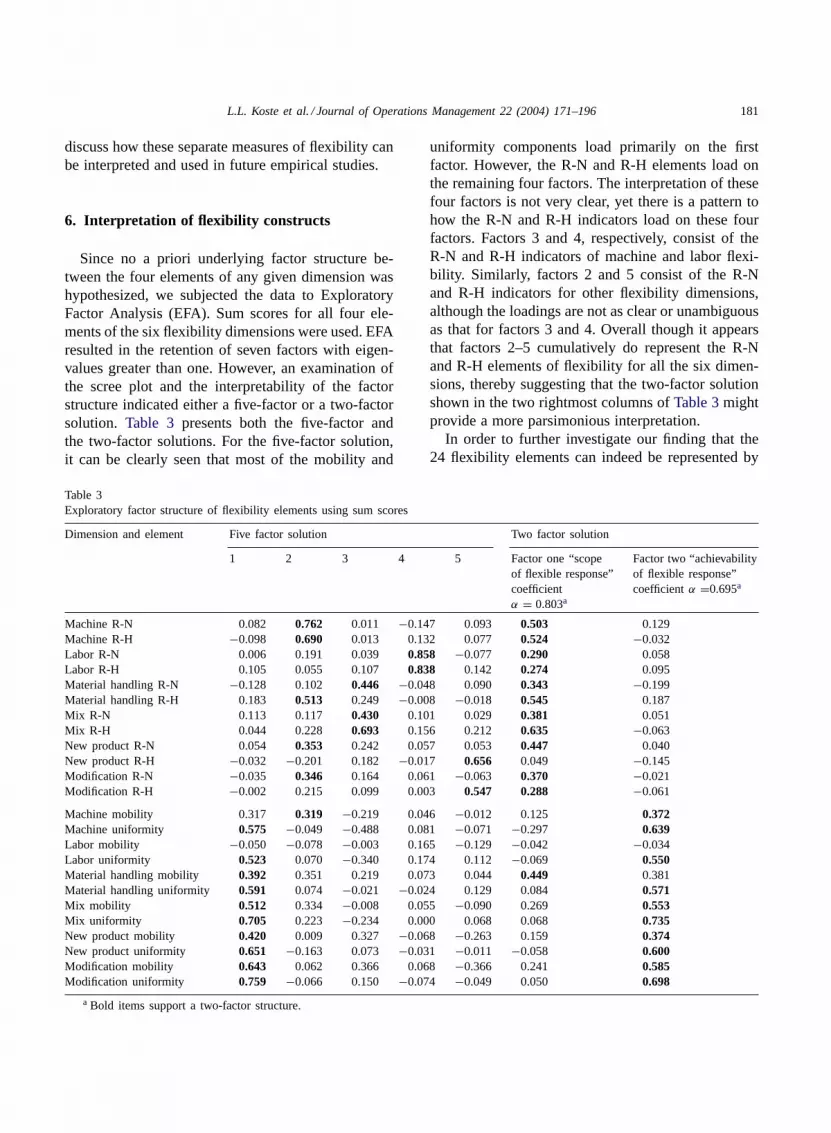
Since no a priori underlying factor structure be-tween the four elements of any given dimension washypothesized, we subjected the data to ExploratoryFactor Analysis (EFA). Sum scores for all four ele-ments of the six flexibility dimensions were used. EFAresulted in the retention of seven factors with eigen-values greater than one. However, an examination ofthe scree plot and the interpretability of the factorstructure indicated either a five-factor or a two-factorsolution. Table 3 presents both the five-factor andthe two-factor solutions. For the five-factor solution,it can be clearly seen that most of the mobility and
Table 3Exploratory factor structure of flexibility elements using sum scores
Dimension and element Five factor solution Two factor solution
1 2 3 4 5 Factor one “scopeof flexible response”coefficientα = 0.803a
Factor two “achievabilityof flexible response”coefficientα =0.695a
Machine R-N 0.082 0.762 0.011 −0.147 0.093 0.503 0.129Machine R-H −0.098 0.690 0.013 0.132 0.077 0.524 −0.032Labor R-N 0.006 0.191 0.039 0.858 −0.077 0.290 0.058Labor R-H 0.105 0.055 0.107 0.838 0.142 0.274 0.095Material handling R-N −0.128 0.102 0.446 −0.048 0.090 0.343 −0.199Material handling R-H 0.183 0.513 0.249 −0.008 −0.018 0.545 0.187Mix R-N 0.113 0.117 0.430 0.101 0.029 0.381 0.051Mix R-H 0.044 0.228 0.693 0.156 0.212 0.635 −0.063New product R-N 0.054 0.353 0.242 0.057 0.053 0.447 0.040New product R-H −0.032 −0.201 0.182 −0.017 0.656 0.049 −0.145Modification R-N −0.035 0.346 0.164 0.061 −0.063 0.370 −0.021Modification R-H −0.002 0.215 0.099 0.003 0.547 0.288 −0.061
Machine mobility 0.317 0.319 −0.219 0.046 −0.012 0.125 0.372Machine uniformity 0.575 −0.049 −0.488 0.081 −0.071 −0.297 0.639Labor mobility −0.050 −0.078 −0.003 0.165 −0.129 −0.042 −0.034Labor uniformity 0.523 0.070 −0.340 0.174 0.112 −0.069 0.550Material handling mobility 0.392 0.351 0.219 0.073 0.044 0.449 0.381Material handling uniformity 0.591 0.074 −0.021 −0.024 0.129 0.084 0.571Mix mobility 0.512 0.334 −0.008 0.055 −0.090 0.269 0.553Mix uniformity 0.705 0.223 −0.234 0.000 0.068 0.068 0.735New product mobility 0.420 0.009 0.327 −0.068 −0.263 0.159 0.374New product uniformity 0.651 −0.163 0.073 −0.031 −0.011 −0.058 0.600Modification mobility 0.643 0.062 0.366 0.068 −0.366 0.241 0.585Modification uniformity 0.759 −0.066 0.150 −0.074 −0.049 0.050 0.698
a Bold items support a two-factor structure.
uniformity components load primarily on the firstfactor. However, the R-N and R-H elements load onthe remaining four factors. The interpretation of thesefour factors is not very clear, yet there is a pattern tohow the R-N and R-H indicators load on these fourfactors. Factors 3 and 4, respectively, consist of theR-N and R-H indicators of machine and labor flexi-bility. Similarly, factors 2 and 5 consist of the R-Nand R-H indicators for other flexibility dimensions,although the loadings are not as clear or unambiguousas that for factors 3 and 4. Overall though it appearsthat factors 2–5 cumulatively do represent the R-Nand R-H elements of flexibility for all the six dimen-sions, thereby suggesting that the two-factor solutionshown in the two rightmost columns ofTable 3mightprovide a more parsimonious interpretation.
In order to further investigate our finding that the24 flexibility elements can indeed be represented by

182 L.L. Koste et al. / Journal of Operations Management 22 (2004) 171–196
Table 4Exploratory factor analysis results for composite scores of scopeand achievability
Elements Scope Achievability
Range-number 0.907 0.007Range-heterogeneity 0.886 0.044Mobility 0.302 0.844Uniformity −0.131 0.907
two factors only, we summed all the R-N indicators,all the R-H indicators, all the M indicators, and all theU indicators for the six dimensions. This resulted infour composite variables representing four elementsof flexibility aggregated across the six dimensions.These variables were then subjected to EFA. Theeigenvalue-greater-than-one rule and the scree plotsuggested a two-factor solution.Table 4 gives theloadings. It is clear fromTable 4that the compositeR-N and R-H indicators load on the first factor, andthe composite M and U indictors load on the secondfactor, thus lending further support to the notion thatthe four elements can be represented by two under-lying factors even when aggregated across all sixflexibility dimensions.
The two factors discussed above illustrate the con-tribution of all four elements to flexibility. The firstfactor, comprised of the R-N and R-H elements, cap-tures the scope of flexible response in terms of the fullrange and diversity of options (i.e., operations, prod-ucts, etc.) that the organization can attain, and henceis termed as “Scope”. The second factor, comprisedof M and U elements, represents the achievabil-ity associated with flexible responses, and hence istermed as “Achievability”. It captures the short-term(transient) and long-term (duration) penalties that theorganization incurs in invoking the flexible response.Organizations must be aware of both scope andachievability aspects of flexibility—increasing theoptions (number and heterogeneity) and decreasingthe penalties associated with exercising these flexibleoptions. Unfortunately, achieving high levels for bothfactors (i.e., all four elements) simultaneously maybe beyond the expertise or resource capabilities ofsome organizations. Firms may have the necessaryresources to improve one element or factor, but notall. Thus, tradeoffs may occur between scope andachievability (Skinner, 1969, 1996) Upton (1995)
hinted at these trade-offs in the fine paper industry.He found that aspects of mix flexibility (M and R-H)were “not obviously related to one another” (p. 222).The two factors also capture, albeit more succinctly,the interrelated concepts of “flexibility”, “efficiency”,and “adaptability” proposed byBordoloi et al. (1999).
The scope and achievability factors identified in thisstudy create a more explicit level of detail that providesgreater insight into flexibility. To illustrate this further,we examined whether these two factors could effec-tively differentiate among different flexibility choicesmade by different firms. Five firms in each of the threeSIC groups present in our sample were selected forcomparison purposes. Firms that were both above andbelow the average scope and achievability for their re-spective SIC groups were chosen. The level of scopeand achievability of each firm for all six flexibility di-mensions is provided inTable 5. The scope of eachflexibility dimension was calculated by averaging theR-N and R-H elements, while the average of the Mand U elements provided the achievability measure.For comparison purposes, we again utilized the “over-all flexibility” rating provided by each firm.
An examination of the 15 firms inTable 5 pro-vides interesting insight into flexibility. The measuresclearly differentiate between organizations with re-spect to scope and achievability. For example, firm Cexceeds the SIC group average for most of the flexi-bility factors. Yet the survey respondent rated overallflexibility of firm C as a 3.00 (neither inflexible norflexible). Now contrast this with the performance offirm E, which has lower than average performance oneight of the 12 flexibility factors, yet rates itself higheroverall (4.00). If flexibility in these organizations hadbeen assessed with just a single item, we would incor-rectly rank firm E as more flexible than firm C. Instead,the flexibility when broken down across different di-mensions and factors provides a substantially moreaccurate picture of the organization’s true capabilities.
The measures also create a framework withinwhich trade-offs, both between and across flexibilitydimensions, can be examined. Consider the flexibil-ity levels achieved by firm A. For machine, laborand material handling flexibility, the scope factor ex-ceeds the achievability factor. Thus, for these flexi-bility dimensions, firm A has emphasized providinga greater scope of flexible options. The opposite sit-uation exists for the dimensions of mix, new product,

L.L
.K
oste
et
al./Jo
urn
al
of
Op
era
tion
sM
an
agem
en
t2
2(2
00
4)
17
1–
19
6183
Table 5Firm performance on scope and achievability factors
Flexibility dimension Machine Labor Material handling Mix New product Modification Overall flexibility
SIC group Firm Scope Achievability Scope Achievability Scope Achievability Scope Achievability Scope Achievability Scope Achievability
Fabricated metal A 5.42 2.93 5.50 3.58 3.88 3.70 2.95 3.67 2.00 3.08 2.25 3.50 3.00B 3.33 4.00 6.00 5.17 1.88 3.50 1.75 4.50 2.60 3.03 2.08 3.83 4.00C 5.75 5.87 5.58 4.00 4.38 6.00 5.32 6.50 3.80 6.15 4.50 6.25 3.00D 4.00 4.17 6.83 4.17 4.88 3.30 4.60 4.13 2.60 3.53 3.29 5.03 5.00E 2.88 1.93 5.21 3.92 6.00 2.30 4.98 2.25 1.20 2.18 1.46 1.53 4.00
SIC group average 4.23 3.74 5.17 3.86 4.46 3.79 4.48 3.73 3.24 3.50 3.77 3.92 3.93
Industrial electricalequipment
J 5.67 2.10 5.83 2.00 5.63 6.90 5.00 5.63 1.80 4.30 2.83 3.80 5.00
K 4.33 3.60 5.71 3.83 3.25 4.80 5.08 4.83 4.90 2.50 3.33 3.00 3.00L 4.54 4.60 6.00 3.83 4.25 2.60 2.50 1.92 1.80 2.58 5.25 2.50 4.00M 3.21 5.00 2.88 4.17 4.50 5.60 4.07 4.67 4.40 3.48 3.58 3.65 4.00N 1.00 1.90 5.04 3.08 3.63 4.40 4.83 4.71 2.40 4.20 4.83 4.20 4.00
SIC group average 4.13 3.58 5.15 3.81 4.58 4.57 4.51 3.85 3.18 3.12 4.31 3.60 3.94
Electroniccomponents
V 1.00 3.40 6.75 4.83 3.50 2.60 4.47 3.13 3.31 2.00 2.96 3.03 4.00
W 6.67 2.10 7.00 2.08 6.75 5.80 7.00 2.96 4.30 3.30 5.29 4.00 4.00X 3.25 3.27 5.96 4.50 4.63 2.90 6.62 2.92 2.40 5.38 3.67 5.13 4.00Y 4.83 3.70 4.17 3.42 3.88 3.80 4.77 4.00 3.40 4.58 3.46 5.28 3.00Z 6.67 1.83 6.54 2.58 6.88 4.60 6.13 3.42 4.10 5.40 4.08 5.43 3.00
SIC group average 3.78 3.30 5.94 3.90 4.27 3.78 5.15 3.69 3.58 3.39 4.25 3.98 3.72

184 L.L. Koste et al. / Journal of Operations Management 22 (2004) 171–196
and modification flexibility. For these dimensions,the achievability factor for firm A has superiorperformance. Firm W, in a different industry, takesyet another approach in managing its flexibility. Thisorganization possesses higher levels of the scope fac-tor for all six flexibility dimensions, yet this comes atthe expense of lower achievability across the board. Infact, for some dimensions such as machine and laborflexibility, firm W has substantial differences betweenscope and achievability performance. Clearly, whenevaluating choices made by firms A and W, there isno one approach that is discernible. Rather, managersapparently recognize the needs and limitations of theirown organization and respond accordingly to developnecessary flexibility capabilities.
While this illustration used only a small subset oforganizations in our sample (approximately 10%), itserved several useful purposes. First, it aptly demon-strates that our flexibility measures capture differencesbetween plants and confirms that the scales developedhere have the ability to more accurately representand discriminate between the flexibility capabilitiesof an organization. The scales also provide future re-searchers with the ability to choose those specific as-pects of flexibility that are most relevant for their study.For example, the research focus could be at the ele-mental level or at the factor level, whereby trade-offswithin a given flexibility dimension, or even acrosscompetitive priorities, are explored. Alternatively,the four elements of a flexibility dimension could besummed to provide a single number or compositescore for comparison across organizations. Only bycapturing detailed differences do we begin to under-stand the many requirements, choices, and trade-offsorganizations make in creating their flexibility capa-bilities and consequently their competitiveness.
7. Conclusion
The primary goal of this study was to addressthe lack of non-industry specific measures for man-ufacturing flexibility. Given the multi-dimensionalcomplexity associated with this concept,Churchill(1979) paradigm was an appropriate framework forthis study. An extensive literature search generatedpotential scale items that were supplemented bynewly proposed ones. The paradigm was subsequently
completed for six flexibility dimensions, each ofwhich is comprised of four elements. Factor analysisrevealed that each flexibility dimension response con-sists of scope and achievability components that areconceptually different, though not completely unre-lated to one another. These two factors highlight theneed to consider both the benefits and penalties asso-ciated with flexibility, so that the potential trade-offbetween these factors can be evaluated. The two fac-tors, scope and achievability, were subsequently usedto illustrate that organizational differences do existwith respect to flexibility. These differences can befound within and across flexibility dimensions as wellas industries, thereby providing a richer understandingof the flexibility capability of an organization.
Rigorous scale development is a time-consumingendeavor, which is also evidenced by the fact that be-tween 1989 and 1996,Hensley (1999)could find onlysix studies in the operations management literature thatutilized and described a formalized, complete scale de-velopment process using questionnaire data. Yet, the-ory development and testing cannot progress withoutvalid theoretically derived constructs. It is within thiscontext that the contribution of this paper to the knowl-edge base in flexibility must be assessed. Specifically,
1. It provides psychometrically sound measures atthe elemental level for six dimensions of flexibil-ity. While Koste and Malhotra (1999)provided theframework within which manufacturing flexibilitycould be interpreted and undertook the first step inthe paradigm of identifying the domain of the con-structs, this study actually created the unique setof generalizable measures and scales that severalresearchers in the field have called for in publishedstudies. In that regard, the current work is bothtimely and useful. The measures created possessunidimensionality, reliability, convergent validity,discriminant validity, and predictive validity. Thedemonstration of these properties has been notedas largely lacking in other flexibility measures(O’Leary-Kelly and Vokurka, 1998), potentiallycreating a situation where erroneous conclusionsare reached. Consequently, the availability of thesemeasures will allow the advancement of this fieldof research.
2. It empirically tests and validates the frameworkprovided inKoste and Malhotra (1999). That study

L.L. Koste et al. / Journal of Operations Management 22 (2004) 171–196 185
was conceptual in nature, and the empirical test-ing of the four elements validates this approach tomeasuring and understanding flexibility. Furtheranalysis can also yield insights into relationshipsbetween flexibility dimensions and the testing offlexibility hierarchy as proposed by these and someother authors.
3. The study identifies two underlying factors offlexibility—Scope and Achievability. While notspecifically labeled so in prior literature, these twofactors highlight the need to consider both the ben-efits and penalties associated with flexibility, sothat the potential trade-off between these factorscan be evaluated. As our literature review reveals,prior measures have generally tended to eitherblend limited aspects of both benefits and penal-ties into a single scale, or focus on only isolatednarrow versions of benefits and penalties. Ourconstructs along four elements for each dimensioncapture much greater depth and richness than thesingle item measures used in other studies such asD’Souza and Williams (2000). Moreover, the scaleswe report and the two factors of scope and achiev-ability contained within them are also relevant forpractitioners, who may need to decide which aspectof a given flexibility dimension is most pertinentto their organization and thus demand appropriateinvestment of organizational resources.
As with any scale development effort of this mag-nitude and complexity, we recognize the limitationsassociated with this research. Presence of additionalcontextual information for each sample firm wouldhave provided greater insight, but was not feasiblewith such a large-scale data collection effort thatspanned multiple industry groups. Consequently, aswith any newly developed scales, this research shouldbe replicated and also expanded for other dimensionsof interest such as volume flexibility. The measure-ment properties of the scales developed here shouldalso be validated for a range of other SIC groups andprocess choices. Such future studies would provideadditional insight into and confidence regarding thegeneralizability of the manufacturing flexibility scalesdeveloped here.
We are hopeful that future scholars would find thesevalid, reliable, non-industry specific measures usefulin advancing several other avenues of research. For ex-ample, the flexibility capability of organizations couldbe assessed within and across industry groups. Todate, these comparisons have been restricted to firmswithin a single industry (e.g.,Dixon, 1992; Upton,1995, 1997). Alternately, researchers could also usethese scales to explore the evolution and managementof this key capability, and attain a better understand-ing of how firms make tradeoffs between scope andachievability of each type of flexible response.

186L
.L.
Ko
stee
ta
l./Jou
rna
lo
fO
pe
ratio
ns
Ma
nage
me
nt
22
(20
04
)1
71
–1
96
Appendix A
A.1. Measurement properties of purified scales for machine flexibility
Construct and items Coeff.alpha
Compositereliability
Inter-rateragreement
Standardizedloading
t-value Fit indices Averagevarianceextracted
Range-number,n = 152 0.80 0.79 0.85 0.58A typical machine can perform a large percentage of the total
number of operations performed in the plant (MF1)a
A large number of operations can be performed by more than onemachine (MF2)
0.61 7.57
A typical machine can use many different tools (MF3) 0.88 11.02The number of different operations that a typical machine can
perform is high (MF4)0.78 9.77
Range-heterogeneity,n = 150 0.87 0.87 0.79 GFI= 0.95;TLI = 0.84;RNI = 0.94
0.63
Machines can perform operations which are not very similar toone another (MF5)
0.79 10.92
Machines can perform various types of operations (MF6) 0.88 12.75Existing machines cannot be used to perform new operations
(MF7)a
Machines can perform a variety of operations (MF8) 0.75 10.28Machines can perform operations which differ greatly from one
another (MF9)0.74 10.09
Mobility, n = 151 0.84 0.83 0.93 0.65Machine changeovers between operations are easy (MF10) 0.85 11.47Machine set-ups between operations are quick (MF11) 0.89 12.19A lot of available capacity is used in changing between machine
operations (MF12)a
Machine tools can be changed quickly (MF13) 0.65 8.47
Uniformity, n = 152 0.94 0.93 0.83 GFI= 0.82;TLI = 0.77;RNI = 0.88
0.74
All machines achieve similar performance across all operations(MF14)
0.85 12.79
Machines are equally effective, in terms of productivity, for alloperations (MF15)
0.92 14.64
Machines are equally efficient for all processing operations (MF16) 0.94 15.20Machines are equally effective, in terms of quality, for all
operations (MF17)0.79 11.56
Machines are equally reliable for all operations (MF18) 0.81 11.86The processing cost (in dollars) of an operation is not affected by
machine choice (MF19)a
a Item deleted during scale purification.

L.L
.K
oste
et
al./Jo
urn
al
of
Op
era
tion
sM
an
agem
en
t2
2(2
00
4)
17
1–
19
6187
A.2. Measurement properties of purified scales for labor flexibility
Construct and items Coeff.alpha
Compositereliability
Inter-rateragreement
Standardizedloading
t-value Fitindices
Averagevarianceextracted
Range-number,n = 155 0.89 0.89 0.96 GFI= 0.97;TLI = 0.94;RNI = 0.97
0.67
Workers can perform a large number of tasks (LF1) 0.87 13.09Workers are responsible for more than one task (LF2) 0.93 14.70A large number of job classifications exist in the workforce (LF3)a
Workers are cross-trained to perform many different tasks (LF4) 0.79 11.35Workers possess many different skills (LF5) 0.66 8.89
Range-heterogeneity,n = 156 0.80 0.82 0.94 0.61The tasks which workers perform are very similar to one another
(LF6)a
Workers perform a diverse set of tasks (LF7) 0.80 10.22Workers can perform various types of tasks (LF8) 0.94 12.22Workers can perform tasks which differ greatly from one another
(LF9)0.55 6.99
Mobility, n = 155 0.83 0.84 0.86 0.65A short time delay occurs when workers are moved between
different tasks (LF10)0.57 7.38
It is easy to move workers between different tasks (LF11)a
A small cost is incurred (in dollars) when workers are movedbetween different tasks (LF12)
0.85 11.66
A small cost is incurred (in terms of lost productivity) whenworkers are moved between different tasks (LF13)
0.95 13.37
Workers can move easily between different tasks (LF14)a
Uniformity, n = 152 0.94 0.94 0.95 GFI= 0.86;TLI = 0.90;RNI = 0.93
0.73
Workers are equally effective, in terms of quality, for all tasks (LF15) 0.82 12.13Workers are equally efficient at all tasks (LF16) 0.88 13.67Workers achieve similar performance levels for all tasks (LF17) 0.87 13.35Worker choice does not affect the processing cost (in dollars) of a
task (LF18)0.71 9.92
Workers are equally reliable for all tasks (LF19) 0.90 14.09Workers are equally effective, in terms of productivity, for all tasks
(LF20)0.92 14.79
a Item deleted during scale purification.
188L
.L.
Ko
stee
ta
l./Jou
rna
lo
fO
pe
ratio
ns
Ma
nage
me
nt
22
(20
04
)1
71
–1
96
A.3. Measurement properties of purified scales for material handling flexibility
Construct and items Coeff.alpha
Compositereliability
Inter-rateragreement
Standardizedloading
t-value Fitindices
Averagevarianceextracted
Range-number,n = 147 0.84 0.85 0.78 GFI= 0.99;TLI = 0.98;RNI = 0.99
0.59
Material can be routed along many paths (MHF1) 0.70 9.16There are many different material handling paths between processing
centers (MHF2)0.88 12.46
Many processing centers are linked by the material handling system(MHF3)a
There are a large number of material handling paths (MHF4) 0.83 11.47There are a limited number of material handling paths between
processing centers (MHF5)0.64 8.16
Range-heterogeneity,n = 146 0.82 0.84 0.95 GFI= 1.00;TLI = 1.00;RNI = 1.00
0.57
The material handling system can transport materials of differentshapes (MHF6)
0.63 8.22
The material handling paths used by the system are very differentfrom one another (MHF7)a
The material handling system uses a large proportion of generalpurpose pallets (MHF8)
0.48 5.96
The material handling system uses a large proportion of generalpurpose fixtures (MHF9)a
The material handling system can transport materials of differentsizes (MHF10)
0.95 14.19
The material handling system can transport a wide variety ofmaterials (MHF11)
0.87 12.49
Mobility, n = 148 0.95 0.95 0.84 GFI= 0.86;TLI = 0.85;RNI = 0.92
0.81
Changing a material handling path is easy (MHF12) 0.90 14.06Changing a material handling path is inexpensive (MHF13) 0.92 14.73Changing a material handling path is quick (MHF14) 0.98 16.24Material handling paths can be easily added (MHF15) 0.85 12.75Material handling paths can be easily removed (MHF16) 0.83 12.37
Uniformity, n = 145 0.85 0.85 0.92 GFI= 0.90;TLI = 0.81;RNI = 0.90
0.55

L.L
.K
oste
et
al./Jo
urn
al
of
Op
era
tion
sM
an
agem
en
t2
2(2
00
4)
17
1–
19
6189
The choice of material handling path does not effect the materialtransfer time (MHF17)
0.86 12.30
The choice of material handling path does not affect the efficiencyof material transfer (MHF18)
0.89 13.11
The quality of materials is not affected by the material handlingpath used (MHF19)
0.49 6.03
The choice of material handling path does not affect the materialtransfer cost (in dollars) (MHF20)
0.78 10.76
All material handling paths exhibit similar performance (MHF21) 0.60 7.52
a Item deleted during scale purification.

190L
.L.
Ko
stee
ta
l./Jou
rna
lo
fO
pe
ratio
ns
Ma
nage
me
nt
22
(20
04
)1
71
–1
96
A.4. Measurement properties of purified scales for mix flexibility
Construct and items Coeff.alpha
Compositereliability
Inter-rateragreement
Standardizedloading
t-value Fitindices
Average varianceextracted
Range-number,n = 151 0.85 0.86 0.85 GFI= 0.97;TLI = 0.95;RNI = 0.96
0.56
A large number of products are produced in the plant (MXF1) 0.86 12.43The average number of products produced in the plant is large
(MXF2)0.69 9.09
A large number of product lines are produced in the plant (MXF3) 0.85 12.34A limited number of products are produced in the plant (MXF4) 0.71 9.50Existing product lines are very broad (MXF5) 0.58 7.40
Range-heterogeneity,n = 150 0.85 0.85 0.90 GFI= 0.92;TLI = 0.86;RNI = 0.90
0.50
The variety of products produced in the plant is extensive (MXF6) 0.63 8.14The processing requirements for the products produced in the plant
vary greatly from one product to another (MXF7)0.82 11.65
The products produced in the plant are very different from oneanother (MXF8)
0.83 11.75
Products are only slightly different from one another (MXF9) 0.59 7.42A diverse set of products is produced in the plant (MXF10) 0.75 10.20The material requirements for the products produced in the plant
vary greatly from one product to another (MXF11)0.56 6.96
Mobility, n = 151 0.84 0.86 0.85 GFI= 0.96;TLI = 0.90;RNI = 0.96
0.62
The cost (in dollars) of including a product in the product mix issmall (MXF12)a
The product mix produced by the plant can be changed easily(MXF13)
0.72 9.67
The time required to change to a different product mix is short(MXF14)
0.69 9.23
The manufacturing system can quickly changeover to a differentproduct mix (MXF15)
0.89 13.01
The cost of changing to a different product mix is small (MXF16) 0.83 11.87
Uniformity, n = 150 0.85 0.86 0.90 0.68Productivity levels are not affected by changes in product mix
(MXF17)0.84 11.68
The efficiency of the production process is not affected by changesin product mix (MXF18)
0.96 13.92
Product quality is not affected by changes in product mix (MXF19)a
The performance of the system is not affected by changes in productmix (MXF20)
0.65 8.47
a Item deleted during scale purification.

L.L
.K
oste
et
al./Jo
urn
al
of
Op
era
tion
sM
an
agem
en
t2
2(2
00
4)
17
1–
19
6191
A.5. Measurement properties of purified scales for new product flexibility
Construct and items Coeff.alpha
Compositereliability
Inter-rateragreement
Standardizedloading
t-value Fitindices
Average varianceextracted
Range-number,n = 152 0.90 0.90 0.92 GFI= 0.96;TLI = 0.96;RNI = 0.97
0.66
The number of new products introduced into production each year ishigh (NPF1)
0.89 13.81
A limited number of new products are introduced each year (NPF2) 0.70 9.72A large number of new product prototypes are produced in the
system each year (NPF3)0.75 10.68
A large proportion of our products have been introduced within thepast year (NPF4)
0.72 10.08
A large number of new products are introduced each year (NPF5) 0.95 15.34
Range-heterogeneity,n = 148 0.79 0.80 0.97 GFI= 0.89;TLI = 0.65;RNI = 0.81
0.46
New products are very similar to existing products (NPF6) 0.45 5.21New products are incremental improvements of existing products
(NPF7)0.77 10.00
New product variety is extensive (NPF8)a
New products are often extensions of existing product lines (NPF9) 0.74 9.51New products are often improvements of existing products (NPF10) 0.74 9.57New products are very innovative (NPF11)a
New products are very different from existing products (NPF12)a
New products are refinements of existing products (NPF13) 0.63 7.74
Mobility, n = 149 0.84 0.84 0.94 GFI= 0.96;TLI = 0.92;RNI = 0.94
0.52
The managerial effort required to introduce a new product into fullscale production is low (NPF14)
0.66 8.34
The cost (in dollars) required to design and develop new products isextremely high (NPF15)
0.63 7.93
The start-up cost (in dollars) of introducing new products intofull-scale production is low (NPF16)
0.75 10.03
The number of months from the earliest stage of design toproduction of a saleable product is low (NPF17)
0.77 10.39
The time required to develop and introduce new products isextremely low (NPF18)
0.77 10.35
Uniformity, n = 152 0.80 0.81 0.90 GFI= 0.96;TLI = 0.84;RNI = 0.94
0.52

192L
.L.
Ko
stee
ta
l./Jou
rna
lo
fO
pe
ratio
ns
Ma
nage
me
nt
22
(20
04
)1
71
–1
96
Appendix A.5 (Continued)
Construct and items Coeff.alpha
Compositereliability
Inter-rateragreement
Standardizedloading
t-value Fitindices
Average varianceextracted
Manufacturing system performance is not affected when a newproduct is introduced into the production system (NPF19)
0.56 6.85
The quality of existing products is not affected when a new productis introduced into the production system (NPF20)
0.65 8.30
The average cost/unit of products is not affected when a newproduct is introduced into the production system (NPF21)
0.81 10.74
Productivity levels are not affected when a new product isintroduced into the production system (NPF22)
0.83 11.12
a Item deleted during scale purification.

L.L
.K
oste
et
al./Jo
urn
al
of
Op
era
tion
sM
an
agem
en
t2
2(2
00
4)
17
1–
19
6193
A.6. Measurement properties of purified scales for modification flexibility
Construct and items Coeff.alpha
Compositereliability
Inter-rateragreement
Standardizedloading
t-value Fitindices
Average varianceextracted
Range-number,n = 153 0.88 0.89 0.93 GFI= 0.89;TLI = 0.87;RNI = 0.91
0.57
A large number of products are modified to the customer’sspecifications (MDF1)
0.81 11.87
There are a limited number of modified products produced each year(MDF2)
0.61 8.07
The features of existing products are often modified (MDF3) 0.85 12.64Engineering change orders are often used to modify products (MDF4) 0.55 7.10There are a large number of modified products produced each year
(MDF5)0.90 13.99
Existing product lines are frequently modified (MDF6) 0.75 10.48
Range-heterogeneity,n = 152 0.81 0.80 0.93 GFI= 0.91;TLI = 0.62;RNI = 0.87
0.52
The product modifications made are fairly similar to one another(MDF7)
0.51 6.29
The variety of product modifications made is extensive (MDF8)a
Modified products are very similar to existing products (MDF9) 0.62 7.83Modified products are very different from each other (MDF10) 0.89 12.16Modified products are very different from existing products (MDF11) 0.79 10.59
Mobility, n = 150 0.89 0.89 0.96 GFI= 0.99;TLI = 1.00;RNI = 1.00
0.63
Modified products can be made quickly (MDF12) 0.77 10.84The average cost of introducing modified products into full-scale
production is low (MDF13)0.72 9.72
Product modifications are performed quickly (MDF14) 0.85 12.49The time to produce modified products is small (MDF15) 0.84 12.34Product modifications are easy to make (MDF16) 0.77 10.80
Uniformity, n = 152 0.89 0.90 0.91 GFI= 0.97;TLI = 0.94;RNI = 0.97
0.69
Productivity levels are not affected when a modified product isintroduced into the manufacturing system (MDF17)
0.86 12.92
Manufacturing system performance is not affected by the productionof modified products (MDF18)
0.93 14.69
The average cost/unit of products is not affected when a modifiedproduct is introduced into the production system (MDF19)
0.90 13.95
The quality of existing products is not affected when a modifiedproduct is introduced into the manufacturing system (MDF20)
0.61 8.07
a Item deleted during scale purification.

194 L.L. Koste et al. / Journal of Operations Management 22 (2004) 171–196
Appendix B
Element R-N R-H M U
Discriminant validity of machine flexibilityelements
R-N 0.58 0.582 0.243 0.010R-H 0.34 0.63 0.241 −0.142M 0.06 0.06 0.65 0.297U 0.0001 0.02 0.09 0.74
Discriminant validity of labor flexibility elementsR-N 0.67 0.703 0.073 0.292R-H 0.49 0.61 0.127 0.186M 0.005 0.02 0.65 −0.079U 0.09 0.03 0.006 0.73
Discriminant validity of material handlingflexibility elements
R-N 0.59 0.150 0.146 −0.116R-H 0.02 0.57 0.373 0.108M 0.02 0.14 0.81 0.386U 0.01 0.01 0.15 0.55
Discriminant validity of mix flexibility elementsR-N 0.56 0.565 0.160 0.080R-H 0.32 0.50 0.156 −0.040M 0.03 0.02 0.62 0.565U 0.01 0.002 0.32 0.68
Discriminant validity of new product flexibilityelements
R-N 0.66 0.085 0.177 0.004R-H 0.007 0.46 −0.094 0.024M 0.03 0.009 0.52 0.280U 0.0001 0.0006 0.08 0.52
Discriminant validity of modification flexibilityelements
R-N 0.57 0.207 0.143 0.033R-H 0.04 0.52 −0.180 −0.031M 0.02 0.03 0.63 0.570U 0.001 0.001 0.32 0.69
References
Beach, R., Muhlemann, A.P., Price, D.H.R., Paterson, A., Sharp,J.A., 2000. A review of manufacturing flexibility. EuropeanJournal of Operational Research 122 (1), 41–57.
Bagozzi, R.P., 1980. Causal Models in Marketing, John Wiley &Sons.
Barad, M., 1992. Impact of some flexibility factors in FMSs—aperformance evaluation approach. International Journal ofProduction Research 30 (11), 2587–2602.
Benjaafar, S., 1994. Models for performance evaluation offlexibility in manufacturing systems. International Journal ofProduction Research 32 (6), 1383–1402.
Bobrowski, P.M., Park, P.S., 1993. An evaluation of laborassignment rules when workers are not perfectly interchange-able. Journal of Operations Management 11, 257–268.
Booz-Allen & Hamilton, 1982. New Product Management for the1980s. Booz-Allen & Hamilton Inc., New York.
Bordoloi, S.K., Cooper, W.W., Matsuo, H., 1999. Flexibility,adaptability, and efficiency in manufacturing systems. Produc-tion and Operations Management 8 (2), 133–150.
Boyer, K.K., Leong, G.K., 1996. Manufacturing flexibility atthe plant level. Omega International Journal of ManagementScience 24 (5), 495–510.
Brandyberry, A., Rai, A., White, G.P., 1999. Intermediateperformance impacts of advanced manufacturing technologysystems: an empirical investigation. Decision Sciences 30 (4),993–1020.
Browne, J., Dubois, D., Rathmill, K., Sethi, S.P., Stecke, K.E.,1984. Classification of flexible manufacturing systems. TheFMS Magazine, April, pp. 114–117.
Burt, R.S., 1976. Interpretational confounding of unobservablevariables in structural equation models, sociological methods.Sociological Methods & Research 5, 3–52.
Carter, M.F., 1986. Designing flexibility into automatedmanufacturing systems. In; Second ORSA/TIMS Conference onFlexible Manufacturing Systems: Operations Research Modelsand Applications, Amsterdam, pp. 107–118.
Chandra, P., Tombak, M.M., 1992. Models for the evaluation ofrouting and machine flexibility. European Journal of OperationalResearch 60, 156–165.
Chatterjee, A., Cohen, M.A., Maxwell, W.L., Miller, L.W., 1984.Manufacturing flexibility: models and measurements. In: FirstORSA/TIMS Conference on Flexible Manufacturing Systems:Operations Research Models and Applications, Ann Arbor, MI,pp. 49–64.
Chen, I.J., Calantone, R.J., Chung, C.-H., 1992. The marketing-manufacturing interface and manufacturing flexibility. OmegaInternational Journal of Management Science 20 (4), 431–443.
Churchill Jr, G.A., 1979. A paradigm for developing better mea-sures of marketing constructs. Journal of Marketing Research16, 64–73.
Cox, T., Jr., 1989. Toward the measurement of manufacturingflexibility. Production and Inventory Management Journal, FirstQuarter, 68–72.
Das, S.K., Nagendra, P., 1993. Investigations into the impact offlexibility on manufacturing performance. International Journalof Production Research 31 (10), 2337–2354.
Dean, J.W., Sharfman, M.P., 1993. The relationship betweenprocedural rationality and political behavior in strategicdecision-making. Decision Sciences 24 (6), 1069–1084.
De Meyer, A., Nakane, J., Miller, J.G., Ferdows, K., 1989.Flexibility: the next competitive battle. Strategic ManagementJournal 10, 135–144.
L.L. Koste et al. / Journal of Operations Management 22 (2004) 171–196 195
De Toni, A., Tonchia, S., 1998. Manufacturing flexibility: aliterature review. International Journal of Production Research36 (6), 1587–1617.
Dixon, J.R., 1992. Measuring manufacturing flexibility: anempirical investigation. European Journal of OperationalResearch 60, 131–143.
D’Souza, D.E., Williams, F.P., 2000. Toward a taxonomy ofmanufacturing flexibility dimensions. Journal of OperationsManagement 18, 577–593.
Fiegenbaum, A., Karnani, A., 1991. Output flexibility—acompetitive advantage for small firms. Strategic ManagementJournal 12, 101–114.
Flynn, B.B., Schroeder, R.G., Sakakibara, S., 1994. AFramework for quality management research and an associatedmeasurement instrument. Journal of Operations Management11, 339–366.
Fornell, C., Larcker, D.F., 1981. Evaluating structural equationmodels with unobservable variables and measurement error.Journal of Marketing Research 18, 39–50.
Fryer, J.S., 1974. Labor flexibility in multiechelon dual-constrainedjob shops. Management Science 20 (7), 1073–1080.
Gerwin, D., 1987. An agenda for research on the flexibility ofmanufacturing processes. International Journal of Operationsand Production Management 7 (1), 38–49.
Gerwin, D., 1993. Manufacturing flexibility: a strategic perspective.Management Science 39 (4), 395–410.
Gil, M.J.A., 1994. Capital budgeting and flexible manufacturing.International Journal of Production Economics 36, 109–128.
Gupta, D., 1993. On measurement and valuation of manufacturingflexibility. International Journal of Production Research 31 (12),2947–2958.
Gupta, D., Buzacott, J.A., 1989. A framework for understandingflexibility of manufacturing systems. Journal of ManufacturingSystems 8 (2), 89–97.
Gupta, Y.P., Somers, T.M., 1992. The measurement ofmanufacturing flexibility. European Journal of OperationalResearch 60, 166–182.
Gupta, Y.P., Somers, T.M., 1996. Business strategy, manufacturingflexibility, and organizational performance relationships: a pathanalysis approach. Production and Operations Management5 (3), 204–233.
Harris Manufacturers Directory 1998 National Edition, 1998.Harris InfoSource, Ohio.
Hatcher, L., 1994. A Step-by-Step Approah to Using the SAS®
System for Factor Analysis and Structural Equation Modeling.SAS Institute Inc., Cary, NC.
Hayes, R.H., Wheelwright, S.C., 1984. Restoring Our CompetitiveEdge: Competing Through Manufacturing. John Wiley andSons, New York.
Hensley, R.L., 1999. A review of operations management studiesusing scale development techniques. Journal of OperationsManagement 17, 343–358.
Hinkin, T.R., 1995. A review of scale development practices in thestudy of organizations. Journal of Management 21 (5), 967–988.
Hyer, N.L., Wemmerlov, U., 1989. Group technology in theUS manufacturing industry: a survey of current practices.International Journal of Production Research 27 (8), 1287–1304.
Huber, G.P., Power, D.J., 1985. Retrospective reports ofstrategic-level managers: guidelines for increasing theiraccuracy. Strategic Management Journal 6, 171–180.
Jack, E.P., Raturi, A., 2002. Sources of volume flexibility and theirimpact on performance. Journal of Operations Management20 (5), 519–548.
James, L.R., Demaree, R.G., Wolf, G., 1984. Estimatingwithin-group reliability with and without response bias. Journalof Applied Psychology 69 (1), 85–98.
James, L.R., Demaree, R.G., Wolf, G., 1993. Estimatingwithin-group inter-rater reliability with and without responsebias. Journal of Applied Psychology 78 (2), 306–309.
Kekre, S., Srinivasan, K., 1990. Broader product line: a necessityto achieve success? Management Science 36 (10), 1216–1231.
Kochikar, V.P., Narendran, T.T., 1992. A framework for assessingthe flexibility of manufacturing systems. International Journalof Production Research 30 (12), 2873–2895.
Koste, L.L., Malhotra, M., 1999. A theoretical framework foranalyzing the dimensions of manufacturing flexibility. Journalof Operations Management 18, 75–93.
MacDuffie, J.P., Sethuraman, K., Fisher, M.L., 1996. Productvariety and manufacturing performance: evidence from theinternational automotive assembly plant study. ManagementScience 42 (3), 350–369.
Malhotra, M.K., Ritzman, L.P., 1990. Resource flexibility issuesin multistage manufacturing. Decision Sciences 21, 673–690.
Malhotra, M.K., Kher, H.V., 1994. An evaluation of workerassignment policies in dual resource-constrained job shopswith heterogeneous resources and worker transfer delays.International Journal of Production Research 32 (5), 1087–1103.
Malhotra, M.K., Grover, V., 1998. An assessment of surveyresearch in POM: from constructs to theory. Journal ofOperations Management 16, 407–425.
Malhotra, M.K., Fry, T.D., Kher, H.V., Donohue, J.M., 1993. Theimpact of learning and labor attrition on worker flexibility indual resource constrained job shops. Decision Sciences 24 (3),641–663.
Mandelbaum, M., Brill, P.H., 1989. Examples of measurement offlexibility and adaptivity in manufacturing systems. Journal ofOperations Research Society 40 (6), 603–609.
Moore, G.C., Benbasat, I., 1991. Development of an instrument tomeasure the perceptions of adopting an information technologyinnovation. Information Systems Research 2 (3), 192–222.
Nandkeolyar, U., Christy, D.P., 1992. An investigation of theeffect of machine flexibility and number of part familieson system performance. International Journal of ProductionResearch 30 (3), 513–526.
Narasimhan, R., Das, A., 1999. An empirical investigation of thecontribution of strategic sourcing to manufacturing flexibilitiesand performance. Decision Sciences 30 (3), 683–718.
Nunnaly, J.C., 1978. Psychometric Theory. McGraw-Hill, NewYork.
O’Leary-Kelly, S.W., Vokurka, R.J., 1998. The empiricalassessment of construct validity. Journal of OperationsManagement 16, 387–405.
Pagell, M., Krause, D.R., 1999. A multiple-method study ofenvironmental uncertainty and manufacturing flexibility. Journalof Operations Management 17 (3), 307–325.

196 L.L. Koste et al. / Journal of Operations Management 22 (2004) 171–196
Park, P.S., Bobrowski, P.M., 1989. Job release and labor flexibilityin a dual resource constrained job shop. Journal of OperationsManagement 8 (3), 230–249.
Parker, R.P., Wirth, A., 1999. Manufacturing flexibility: measuresand relationships. European Journal of Operational Research118 (3), 429–449.
Ramasesh, R.V., Jayakumar, M.D., 1991. Measurement ofmanufacturing flexibility: a value based approach. Journal ofOperations Management 10 (4), 446–468.
Saraph, J.V., Benson, P.G., Schroeder, R.G., 1989. An instrumentfor measuring the critical factors of quality management.Decision Sciences 20, 810–829.
Segars, A.H., 1997. Assessing the unidimensionality of measure-ment: a paradigm and illustration within the context ofinformation systems research. Omega 25 (1), 107–121.
Sethi, A.K., Sethi, S.P., 1990. Flexibility in manufacturing: asurvey. The International Journal of Flexible ManufacturingSystems 2, 289–328.
Sethi, V., King, W.R., 1994. Development of measures to assess theextent to which an information technology application providescompetitive advantage. Management Science 40 (12), 1601–1627.
Skinner, W., 1969. Manufacturing—missing link in corporatestrategy. Harvard Business Review 3, 136–144.
Skinner, W., 1996. Manufacturing strategy on the “S” curve.Production and Operations Management 5 (1), 3–14.
Slack, N., 1983. Flexibility as a manufacturing objective. Inter-national Journal of Operations and Production Management3 (3), 4–13.
Slack, N., 1987. The flexibility of manufacturing systems.International Journal of Operations and Production Management7 (4), 35–45.
Suarez, F.F., Cusumano, M.A., Fine, C.H., 1995. An empiricalstudy of flexibility in manufacturing. Sloan ManagementReview Fall, 25–32.
Suarez, F.F., Cusumano, M.A., Fine, C.H., 1996. An empiricalstudy of manufacturing flexibility in printed circuit boardassembly. Operations Research 44 (1), 223–240.
Swamidass, P.M., 1994. Technology on the Factory Floor II. TheManufacturing Institute, Washington, DC, p. xi.
Swamidass, P.M., Newell, W.T., 1987. Manufacturing strategy,environmental uncertainty and performance: a path analyticmodel. Management Science 33 (4), 509–524.
Tidd, J., 1991. Flexible Manufacturing Technologies andInternational Competiveness. Pinter Publishers, London.
Upton, D.M., 1994. The Management of Manufacturing Flexibility.California Management Review Winter, 72–89.
Upton, D.M., 1995. Flexibility as process mobility: the mana-gement of plant capabilities for quick response manufacturing.Journal of Operations Management 12, 205–224.
Upton, D.M., 1997. Process range in manufacturing: an empiricalstudy of flexibility. Management Science 43 (8), 1079–1092.
Wothke, W., 1993. Nonpositive definite matrices in structuralmodeling. In: Bollen, K.A., Long, J.S. (Eds), Testing StructuralEquation Models, pp. 256–293.
Yu, J., Cooper, H., 1983. A Quantitative review of research designeffects on response rates to questionnaires. Journal of MarketingResearch 20, 36–44.


