Embed Size (px)
Citation preview

Page 1 of 14© The Author 2014. Published by Oxford University Press on behalf of The Gerontological Society of America. All rights reserved. For permissions, please e-mail: [email protected].
Measuring Future Time Perspective Across Adulthood: Development and Evaluation of a Brief Multidimensional QuestionnaireAllyson Brothers, MA,*,1 Helena Chui, PhD,2 and Manfred Diehl, PhD1
1Department of Human Development and Family Studies, Colorado State University, Fort Collins. 2Division of Psychology, School of Social and International Studies, University of Bradford, UK.
*Address correspondence to Allyson Brothers, MA, Department of Human Development and Family Studies, Colorado State University, Fort Collins, CO 80523. E-mail: [email protected]
Received February 16 2014; Accepted June 5 2014.
Decision Editor: Rachel Pruchno, PhD
Purpose of the Study: Despite calls for the consideration of future time perspective (FTP) as a multidimensional construct, mostly unidimensional measurement instru-ments have been used. This study had two objectives: (a) to develop a brief multidi-mensional questionnaire for assessing FTP in adulthood and evaluate its psychometric properties; and (b) to examine age associations and age-group differences of the dimen-sions of FTP.Design and Methods: Data were collected from 625 community-residing adults between the ages of 18 and 93, representing young, middle-aged, and older adults. The psychometric evaluation involved exploratory factor analyses (EFA) and confirmatory FA (CFA), reliability and validity analyses, and measurement invariance testing. Zero-order and partial correlations were used to examine the association of the dimensions of FTP with age, and multivariate analysis of variance was used to examine age-group differences.Results: EFA and CFA supported a three-factor solution: Future as Open, Future as Limited, and Future as Ambiguous. Metric measurement invariance for this factor struc-ture was confirmed across the three age groups. Reliability and validity analyses pro-vided evidence of sound psychometric properties of the brief questionnaire. Age was negatively associated with Future as Open and positively associated with Future as Limited. Young adults exhibited significantly greater ambiguity toward the future than middle-aged or older adults.Implications: This study provides evidence in support of the psychometric properties of a new brief multidimensional FTP scale. It also provides evidence for a pattern of age associations and age-group differences consistent with life-span developmental theory.
Key words: Future orientation, Multidimensional assessment, Life-span development
The Gerontologist, 2014, Vol. 00, No. 00, 1–14doi:10.1093/geront/gnu076
Research Article
The Gerontologist Advance Access published July 25, 2014 by guest on July 26, 2014
http://gerontologist.oxfordjournals.org/D
ownloaded from

“At any given point in an individual’s life, the antici-pated amount of time left to live may shape behavior and affect in important ways.” - Schulz and Heckhausen (1996, p. 703)
The way in which individuals perceive their personal life-time has been of interest to researchers for many decades (Carstensen, 2006; Neugarten, 1968). Future time perspec-tive (FTP) is one component of personal lifetime and is con-cerned with how individuals look at their future, as opposed to their present or past. FTP can be defined as the percep-tions and expectations a person has with regard to his or her future, specifically the extent to which he or she perceives the future as open-ended and holding opportunities, or as being limited and closed in nature (Carstensen, Isaacowitz, & Charles, 1999). In recent years, interest in individuals’ FTP has been evident in a variety of disciplines and con-texts. For example, FTP has been shown to be associated with risk-taking behavior in young adults (Duangpatra, Bradley, & Glendon, 2009), engagement in health behav-iors (Gellert, Ziegelmann, Lippke, & Schwarzer, 2012), decision making (Löckenhoff & Carstensen, 2007), and workplace success in middle-aged and older adults (Zacher & Frese, 2009). FTP is also strongly related to the selection and pursuit of social goals, in particular, the preference for social partners (Lang, 2000). Thus, FTP is relevant across the adult life span, from adolescence to late adulthood, and longitudinal research suggests that there are age-related differences and age-related changes in FTP (Cate & John, 2007).
Given the importance of FTP for a number of behaviors, it is essential that the construct is assessed in a comprehen-sive manner. Existing self-report questionnaires, however, do not reflect the multiple dimensions of FTP that are sug-gested by theoretical and empirical evidence, but instead rely on a unidimensional approach, assessing a continuum that ranges from an open future on one end to a limited future on the other end. Furthermore, research on FTP has mainly used samples of a limited age range (see Cate & John, 2007 for an exception), and often includes items that are inherently age-biased; that is, a person of a particular age may only be able to answer an item in one direction because the way it is worded. Using a sample that covered the entire adult life span, this study developed and evalu-ated a brief FTP questionnaire that applied a multidimen-sional perspective and also minimized age bias.
The Study of FTP
Systematic research on FTP started more than four decades ago when Neugarten (1968) argued that midlife brings a qualitative shift in the way individuals perceive time. Specifically, Neugarten (1968) described that in middle age
many adults begin to focus on the time left to live, rather than the time they have already lived. This shift may be accompanied by increased motivation to achieve certain goals, or it may usher in a time of heightened anxiety. Early theorists also argued that studying various dimensions of FTP would be informative for understanding adults’ attitudes and behaviors. Rakowski (1979), for example, proposed the dimensions of future extension, degree of planning, and anticipated affect as integral parts of FTP, and also argued that older adults may be portrayed as holding primarily a negative FTP. This presumption of a primarily limited sense of the future in old age continues to be a topic of current research (e.g., Carstensen, 2006). Therefore, understanding the multidimensionality of FTP is essential for accurately determining the psychological and behavioral relevance of this construct.
A large body of research shows the utility of FTP across the life span and in various life contexts. In adolescence a stronger future orientation is associated with positive developmental outcomes, such as academic achievement (Schechter & Francis, 2010), and protects against engage-ment in maladaptive behaviors (Chen & Vazsonyi, 2011). During adulthood, a more expansive FTP has been shown to be related to a larger social network (Lang, 2000), whereas a more limited FTP is associated with better emo-tion regulation (Kellough & Knight, 2012). FTP also has associations with certain personality traits. For instance, individuals holding a more expansive FTP tend to score higher on the trait conscientiousness. Furthermore, younger adults who reported a limited future were more likely to score higher on neuroticism (Cate & John, 2007). Studies in adulthood also show that FTP plays an important role in future-oriented behaviors, such as financial saving habits (Rabinovich, Morton, & Postmes, 2010), physical activ-ity (Stahl & Patrick, 2012), and healthy nutrition (Gellert et al., 2012). Additionally, FTP has relevance for promot-ing the job success of older workers, due to its relation-ship with generativity motives (Kooij & Van De Voorde, 2011) and with job complexity and control (Zacher & Frese, 2009). In later life, shifts in FTP are thought to be adaptive, such that as individuals perceive a more limited future, behavior becomes less concerned with individual needs (Brandtstädter, Rothermund, Kranz, & Kuhn, 2010) and more directed toward generativity (Kooij & Van De Voorde, 2011). Despite the wide-reaching relevance of FTP, many studies have relied on a unidimensional assessment of the construct, which constrains the developmental rel-evance of the construct.
FTP is measured in various ways, depending on the dis-cipline and age group of interest. The most common meas-ure is the 10-item scale by Carstensen and Lang (1996), which assesses FTP as a developmental construct in adults.
The Gerontologist, 2014, Vol. 00, No. 00 Page 2 of 14
by guest on July 26, 2014http://gerontologist.oxfordjournals.org/
Dow
nloaded from

Predictive validity of the scale has been described (Lang & Carstensen, 2002), but its psychometric properties have otherwise not been widely documented. Little to no psy-chometric information is available for early FTP measures (e.g., Gould, 1972; Lessing, 1972). On the other hand, Zimbardo’s Time Perspective Inventory (ZPTI; Zimbardo & Boyd, 1999) has been widely validated, but primar-ily with adolescent and emerging adult populations. The ZPTI applies a somewhat conceptually different approach and assumes that individuals have a tendency to orient to one of three time perspectives (i.e., past, present, or future; Zimbardo & Boyd, 1999), in contrast to conceptualizing the future as open versus limited. In summary, a psycho-metrically sound multidimensional measure of FTP for use with adults will be an important contribution to the field.
A Multidimensional Approach to FTP
From an empirical perspective, it is becoming clear that openness and limitations represent two related but distinct dimensions of FTP, and this evidence comes from several different methodological approaches. First, factor analytic studies consistently find that openness and limitations emerge as two separate factors that represent unique infor-mation (Cate & John, 2007; Kooij, de Lange, Jansen, & Dikkers, 2013; Zacher & Frese, 2009), with 52% (Zacher & Frese, 2009) to 90% (Cate & John, 2007) nonshared variance. Second, evidence suggests that an increase in one factor is not necessarily concordant with a decrease in the other. In one study, middle-aged women reported a rela-tively high focus on opportunities, while simultaneously experiencing an increasing sense of the future as limited, suggesting that the two dimensions may function indepen-dently of one another (Cate & John, 2007). Third, there is preliminary evidence that opportunities and limitations correlate differently with many constructs, rather than being mirror images of one another. For instance, a greater sense of future as limited among young people is associ-ated with higher neuroticism, but there is no relationship between opportunities and neuroticism in this age group. Similarly, openness (but not limitations) is correlated with conscientiousness among younger adults (Cate & John, 2007). These preliminary findings are supported by recent work (Kooij et al., 2013), which found that open-ended and limited FTP correlated differentially with work moti-vation variables and work engagement.
Aside from the empirical evidence, there are also good theoretical reasons for conceptualizing FTP as a multidi-mensional construct. First, life-span developmental theory (Baltes, Lindenberger, & Staudinger, 2006) considers most developmental constructs, such as FTP, to be both multi-directional and multidimensional. Within this framework,
the different dimensions of FTP would be expected to potentially show different patterns of age differences and different trajectories of age-related change across adult-hood, both in positive and negative directions.
Second, the unidimensional view of FTP also neglects the possibility that individuals may view their future as uncertain, which we theorize to represent a potential third dimension of FTP. In particular, individuals may perceive the future as ambiguous when they are not certain if their goals and plans can be realized or if opportunities exist to put their life plans into action (Hendricks, 2001; Zaleski, 2001). Viewing the future as uncertain is a plausible frame of mind for individuals of any age. Young persons might experience uncertainty toward the future due to unde-cided career paths and unfavorable economic conditions (Morselli, 2013), whereas middle-aged or older individuals might develop a sense of uncertainty toward the future as a result of critical life events, such as impending retirement, failing health, or the loss of a loved one (Rakowski, 1986). Thus, experiencing the future as uncertain may not simply be the midpoint on the continuum between an open and limited time perspective but rather a qualitatively different third dimension of FTP.
In summary, a multidimensional measure of FTP has potentially great value for research on adult development and aging, as it will allow for the study of age differences and age trajectories of these different dimensions, as well as the study of how the different dimensions covary with other developmentally relevant variables. Thus, the theoret-ical relevance of the FTP construct suggests that a reliable and valid multidimensional assessment tool would fill an existing void and would potentially find wide application in research and applied settings.
Given this general background, the present study had two primary objectives. The first objective was to develop and evaluate the psychometric properties of a brief meas-ure to assess three theoretically meaningful dimensions of FTP: Future as Open, Future as Limited, and Future as Ambiguous. A brief measure was the desired outcome in order to increase its practical applications and allow for more widespread incorporation into research and practice. Psychometric evaluation included exploratory and con-firmatory analyses of the factorial structure; examination of item-total correlations and scale reliabilities, as well as convergent and divergent validity; and testing for measure-ment invariance across age groups. The second objective was to examine the associations between the three FTP dimensions and age. In accordance with life-span develop-mental theory, we expected that age would be negatively associated with Future as Open, and positively with Future as Limited. Furthermore, in terms of age differences we expected that young adults would score highest on Future
The Gerontologist, 2014, Vol. 00, No. 00 Page 3 of 14
by guest on July 26, 2014http://gerontologist.oxfordjournals.org/
Dow
nloaded from
as Open, and older adults would score highest on Future as Limited. Because Future as Ambiguous has not yet been assessed in FTP research, and because ambiguity toward the future is plausible at any point during the life span, no specific hypotheses were postulated for this dimension.
Methods
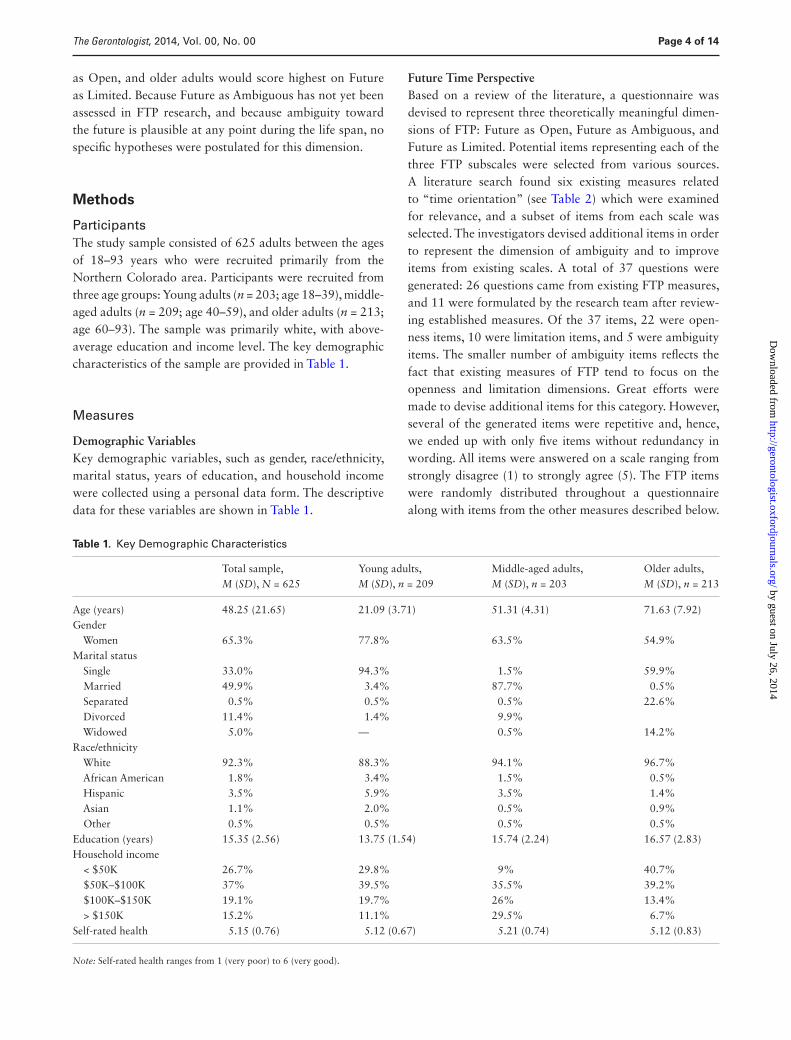
ParticipantsThe study sample consisted of 625 adults between the ages of 18–93 years who were recruited primarily from the Northern Colorado area. Participants were recruited from three age groups: Young adults (n = 203; age 18–39), middle-aged adults (n = 209; age 40–59), and older adults (n = 213; age 60–93). The sample was primarily white, with above-average education and income level. The key demographic characteristics of the sample are provided in Table 1.
Measures
Demographic VariablesKey demographic variables, such as gender, race/ethnicity, marital status, years of education, and household income were collected using a personal data form. The descriptive data for these variables are shown in Table 1.
Future Time PerspectiveBased on a review of the literature, a questionnaire was devised to represent three theoretically meaningful dimen-sions of FTP: Future as Open, Future as Ambiguous, and Future as Limited. Potential items representing each of the three FTP subscales were selected from various sources. A literature search found six existing measures related to “time orientation” (see Table 2) which were examined for relevance, and a subset of items from each scale was selected. The investigators devised additional items in order to represent the dimension of ambiguity and to improve items from existing scales. A total of 37 questions were generated: 26 questions came from existing FTP measures, and 11 were formulated by the research team after review-ing established measures. Of the 37 items, 22 were open-ness items, 10 were limitation items, and 5 were ambiguity items. The smaller number of ambiguity items reflects the fact that existing measures of FTP tend to focus on the openness and limitation dimensions. Great efforts were made to devise additional items for this category. However, several of the generated items were repetitive and, hence, we ended up with only five items without redundancy in wording. All items were answered on a scale ranging from strongly disagree (1) to strongly agree (5). The FTP items were randomly distributed throughout a questionnaire along with items from the other measures described below.
Table 1. Key Demographic Characteristics
Total sample, M (SD), N = 625
Young adults, M (SD), n = 209
Middle-aged adults, M (SD), n = 203
Older adults, M (SD), n = 213
Age (years) 48.25 (21.65) 21.09 (3.71) 51.31 (4.31) 71.63 (7.92)Gender Women 65.3% 77.8% 63.5% 54.9%Marital status Single 33.0% 94.3% 1.5% 59.9% Married 49.9% 3.4% 87.7% 0.5% Separated 0.5% 0.5% 0.5% 22.6% Divorced 11.4% 1.4% 9.9% Widowed 5.0% — 0.5% 14.2%Race/ethnicity White 92.3% 88.3% 94.1% 96.7% African American 1.8% 3.4% 1.5% 0.5% Hispanic 3.5% 5.9% 3.5% 1.4% Asian 1.1% 2.0% 0.5% 0.9% Other 0.5% 0.5% 0.5% 0.5%Education (years) 15.35 (2.56) 13.75 (1.54) 15.74 (2.24) 16.57 (2.83)Household income < $50K 26.7% 29.8% 9% 40.7% $50K–$100K 37% 39.5% 35.5% 39.2% $100K–$150K 19.1% 19.7% 26% 13.4% > $150K 15.2% 11.1% 29.5% 6.7%Self-rated health 5.15 (0.76) 5.12 (0.67) 5.21 (0.74) 5.12 (0.83)
Note: Self-rated health ranges from 1 (very poor) to 6 (very good).
The Gerontologist, 2014, Vol. 00, No. 00 Page 4 of 14
by guest on July 26, 2014http://gerontologist.oxfordjournals.org/
Dow
nloaded from

Psychological ConstructsIn order to assess the convergent and divergent validity of the new FTP questionnaire, we administered well-vali-dated measures of satisfaction with life, neuroticism, and extraversion.
Satisfaction with life. The satisfaction with life scale (SWLS; Diener, Emmons, Larsen, & Griffin, 1985) was used to assess the cognitive–evaluative (rather than affective) component of subjective well-being. Five items (e.g., “In most ways, my life is close to ideal”) were answered on a 7-point rating scale (1 = strongly disagree, 7 = strongly agree). Cronbach’s α in the present study was 0.85, which was almost identical to the internal reliability reported by Diener and colleagues (1985). In addition to internal reliability, Diener and colleagues reported a 2-month test–retest stability of 0.82 (Study 1). The convergent validity of the SWLS has been demon-strated by positive correlations with positive affect and other measures of subjective well-being (Pavot & Diener, 1993). Conversely, the divergent validity has been demonstrated by negative correlations with measures of depression and nega-tive affect (Pavot & Diener, 1993).
Personality traits. We included the Neuroticism and Extraversion scales from the NEO Five Factor Inventory (NEO-FFI; Costa & McCrae, 1992) as measures of two primary personality traits. Each scale has 12 items to which participants respond on a 5-point rating scale
(1 = strongly disagree, 5 = strongly agree). Cronbach’s α values were 0.89 and 0.83 for Neuroticism and Extraversion, respectively. The psychometric properties of the NEO-FFI are well documented (Costa & McCrae, 2008).
Control VariablesWe included measures of dispositional optimism, depres-sion, self-rated health (SRH), and social desirability to con-trol for their potentially confounding effects on FTP. These control variables were selected based on their conceptual potential to influence the way in which individuals perceive their future. Specifically, we wanted to ensure that any statistically significant relationships between FTP and age could not instead be explained by the extent to which indi-viduals viewed the future as optimistic, or their tendency to respond to the questionnaires in a socially desirable way. It was also important to ensure that symptoms of depression or poor physical health did not explain the relationship between FTP and age.
Optimism. The Life Orientation Test-Revised (LOT-R; Scheier, Carver, & Bridges, 1994) measures dispositional optimism, and includes 10 items such as “In uncertain times, I usually expect the best” (1 = strongly disagree, 5 = strongly agree). Cronbach’s α in the present study was 0.81. The predictive and discriminant validity of the LOT-R are satisfactory (Scheier et al., 1994). Additional evidence
Table 2. Findings From Exploratory Factor Analysis and Scale Reliabilities for the Future Time Perspective Scale—Short Form
(Calibration Sample: n = 312)
Item text Item source Pattern coefficients (PROMAX rotation)
Communalities
I II III
O12—I look forward to the future with hope and enthusiasm d 0.84 0.71O10—When I think about the future, I expect good things to happen a 0.74 0.53L3—I have little hope for the future (R) b 0.64 0.38O2—Each new day and season presents me with interesting opportunities a 0.58 0.32L9—I have the sense that time is running out f 0.85 0.74L10—I am beginning to experience that time is limited f 0.70 0.46L6—Increasingly I feel like time is against me a 0.58 0.48L2—I know that I do not have all the time in the world a 0.34 0.09A4—My future is uncertain a 0.74 0.54A2—You cannot really plan for the future because things change so much e 0.62 0.34A8—My future seems very vague and uncertain to me d 0.44 0.40A1—I do not focus on the future because it is so uncertain to me anyway c 0.44 0.39Eigenvalues 3.99 1.60 1.33% Variance 29.15% 8.92% 6.63%Cronbach’s alpha 0.77 0.71 0.70
Notes: R = Item is reverse scored. a = Investigator generated; b = Sense of time (Gould, 1972); c = Scales of psychological well-being, purpose in life (Ryff & Keyes, 1995); d = FTP Inventory (Heimberg, 1963 unpublished, as cited in Lessing, 1972); e = Zimbardo Time Perspective Inventory (Zimbardo & Boyd, 1999); f = Future Time Perspective scale (Carstensen & Lang, 1996). FTP = future time perspective.
The Gerontologist, 2014, Vol. 00, No. 00 Page 5 of 14
by guest on July 26, 2014http://gerontologist.oxfordjournals.org/
Dow
nloaded from

for the construct validity of the LOT-R has been reported by Glaesmer and colleagues (2012) based on a representa-tive population survey in Germany. Specifically, these authors reported findings indicative of the measure’s con-vergent (i.e., positive correlations with satisfaction with life and subjective health ratings) and divergent validity (i.e., negative correlations with measures of depressive symp-toms and with health care utilization).
Depressive symptoms. The Center for Epidemiological Studies Depression scale (CES-D; Radloff, 1977) scale was used to assess depressive symptoms. The CES-D has 20 items that are answered on a 4-point scale (1 = Rarely or none of the time [less than 1 day], 4 = Most or all of the time [5–7 days]). The psychometric properties of the CES-D are established in terms of internal consistency (Cronbach α’s usually greater than 0.85) and test–retest reliability (Hertzog, Van Alstine, Usala, Hultsch, & Dixon, 1990; Radloff, 1977). Cronbach’s α in this study was 0.89. Evidence for the measure’s convergent and divergent validity has been provided in terms of correlations with other measures of depression (e.g., the Beck Depression Inventory) and by its ability to discriminate between psy-chiatric inpatients and members of the general population (see Shaver & Brennan, 1991).
Self-rated health. SRH was assessed with the question “Overall, I believe my health to be…,” (1 = very good, 6 = very poor). Responses were reverse scored so that a higher number indicated better perceived health. Despite its simplicity as a single-item measure, SRH has consist-ently shown predictive validity with regard to a number of outcomes, including objective health and mortality (Idler & Benyamini, 1997).
Social desirability. The self-deception scale from the Balanced Inventory of Desirable Responding (BIDR; Paulhus, 1991) measures overconfidence in a person’s judgment and consists of 20 items such as “I never regret my decisions” (1 = not true, 7 = very true). Cronbach’s α was 0.70. The psychometric characteristics of the BIDR, including construct validity, have been established (Paulhus, 2002). In terms, of internal consistency, Paulhus (1991) reported alpha coefficients for the self-deception scale ranging from .68 to .80. The test–retest reliability over a 5-week period was 0.69 (Paulhus, 1991). The con-vergent validity of the scale has been demonstrated via positive correlations with measures of repressive style and measures of coping and defense (Paulhus, 1991). Discriminant validity has been supported by positive correlations with measures of impression management (Paulhus, 1991).
Procedures
Data were collected via mail survey, following established procedures of survey research (Dillmann, 2000). Research personnel were trained on the procedures using a structured training protocol and were supervised closely for adherence to the study protocol. Middle-aged and older adults filled out the questionnaires at home and returned the completed forms by mail. Students completed their questionnaires in group sessions on campus. A standard set of instructions was explained to all participants prior to questionnaire completion. Participants provided written informed con-sent prior to completing the study materials, in accordance with institutional policies. Student participants received course credit for their participation, and for referring indi-viduals in older age groups. A debriefing letter was pro-vided to all participants upon questionnaire completion.
Statistical Analyses
Exploratory factor analyses (EFA) and confirmatory FA (CFA) were performed on two separate random halves of the study sample for the purposes of establishing and confirming the factor structure of the short-form FTP scale (Anderson & Gerbing, 1988). EFA was performed on what we refer to as the calibration sample (n = 312), using SPSS, Version 21.0. In addition to traditional methods (e.g., eigenvalue > 1.0, scree plot) for determining the number of factors to extract, we also applied parallel analysis. Parallel analysis (Russell, 2002) is a more rigorous statisti-cal approach in which a series of random data matrices are generated and serve as a baseline against which the actual data are compared. Parallel analysis was conducted using SPSS syntax written by O’Connor (2000), and the factors with eigenvalues that exceeded the 95th percentile of the randomly generated eigenvalues were retained.
CFAs were performed on the cross-validation sample (n = 313) using Mplus 3.12 (Muthén & Muthén, 2007). Measurement invariance analyses were performed on the total sample. We used the Satorra–Bentler robust maxi-mum likelihood (MLM) estimation in order to account for the issue of non-normality inherent with 5-point rat-ing scale data (Finney & DiStefano, 2006). The MLM estimation method adjusts the standard errors and the chi-square statistic in order to account for non-normality (Russell, 2002), thereby reducing the risk of a Type I error. Following established practice, multiple indices were used to evaluate the goodness of fit. The comparative fit index and Tucker–Lewis index are both indicators used to com-pare nested models; values > 0.95 indicate acceptable fit. The root mean square error of approximation (RMSEA) and square root mean residual (SRMR) are both indicators
The Gerontologist, 2014, Vol. 00, No. 00 Page 6 of 14
by guest on July 26, 2014http://gerontologist.oxfordjournals.org/
Dow
nloaded from

of misfit; therefore, satisfactory fit is indicated by RMSEA < 0.06 and SRMR < 0.05 (Byrne, 2012). The change in goodness of fit between nested models was evaluated based on the change in the chi-square statistic using an adjusted equation suitable for comparison of MLM chi-square val-ues (Satorra & Bentler, 1999).
Before conducting correlational and age-comparative analyses, we performed a check for potential outliers and influential cases. Knowing that answers to questions regard-ing the future could be influenced by extreme responses on a number of psychological variables, we screened for potential outliers with regard to depressive symptoms, optimism, neuroticism, and social desirability. Using a cut-off score of z ≥ 3.0 (Tabachnick & Fidell, 2007) on any of these variables, 14 unique cases were considered outli-ers on one or more variables and were therefore removed. Eight cases were removed for high scores on the CES-D (seven young adults and one middle-aged adult); four cases were removed for low scores on dispositional optimism (one young adult, two middle-aged adults, and one older adult); two cases were removed for high scores on neuroti-cism (both young adults); and two cases were removed for high scores on social desirability (both middle-aged adults). Therefore, correlational and age-comparative analyses include the remaining 611 participants (i.e., 200 young adults, 199 middle-aged adults, and 212 older adults).
Results
Psychometric Findings
Content ValidityThe pool of 37 FTP items was rated for content validity by four raters trained in psychology. Specifically, based on the item content, raters indicated for each item to which scale it should belong: Future as Open, Limited, or Ambiguous, or “none of the above.” Interrater reliability was assessed using Cohen’s kappa coefficient which corrects for agree-ment by chance. The kappa coefficients ranged from 0.86 to 1.0, with a mean kappa of 0.93. Thus, the agreement among the raters was high, suggesting good content valid-ity of the selected items. The wording and source of each item retained for the short-form questionnaire are listed in Table 2.
EFA and Scale ReliabilitiesTo investigate the factor structure of the newly created FTP questionnaire, a principal axis factor (PAF) analysis with PROMAX rotation was performed with the entire set of 37 items first, and then a short form was devised as a next step. This analysis yielded four factors, accounting for 44.93% of the variance. The four-factor solution was obtained because items representing the dimension Future
as Open loaded on two separate factors (i.e., Factors 1 and 2). However, inspection of Factor 2 revealed that it accounted for only 6.07% of the variance and did not rep-resent substantively distinct content compared with Factor 1. Specifically, there was no clear distinction with regard to the type of items loading onto Factor 1 versus Factor 2; both sets of items represented various ideas of seeing the future as being expansive, having opportunities, and as a time for hope. Therefore, it was determined that Factor 2 was a redundant factor that could be dropped without sac-rificing any important information. As a result, three fac-tors were extracted from this PAF: Future as Open, Future as Limited, and Future as Ambiguous.
To develop a short form of the FTP questionnaire, we applied two main criteria. Criterion 1 was to select items with the highest pattern coefficients from the EFA. Criterion 2 included an evaluation of item content, determined by the investigators. Specifically, we excluded items that were very similar in content, thus avoiding redundancy in mean-ing. In addition to avoiding redundancy, we also excluded items that were age-biased. That is, we excluded items that could only be answered in a certain direction by a certain age group. An example is the item, “I cannot even imagine what my life will be like in twenty years,” which is biased in favor of young and middle-aged adults. In the process of applying these two criteria, we selected at least four top-performing items in each domain in order to ensure that a sufficient number of items would be available to conduct the CFAs. In consideration of model identification for CFA, three indicators per latent variable are preferred (Kenny, 1979). Therefore, we started with at least four items per domain in case any items would need to be dropped due to poor model fit.
This process resulted in a reduced set of 12 items, with four items per subscale. These 12 items were subjected to a follow-up PAF with rotation to simple structure. Table 2 shows the pattern coefficients and communalities of the short form, as well as the eigenvalues and the amount of variance accounted for by the factors. The PAF with PROMAX rotation yielded three factors that accounted for 44.70% of the variance. All of the items had pattern coefficients larger than 0.34 on their respective factor, with the majority being larger than 0.60. Based on the content of the marker items, the factors were interpreted as Future as Open (Factor 1), Future as Limited (Factor 2), and Future as Ambiguous (Factor 3). Consistent with expecta-tions, the factor Future as Open was inversely related to Future as Limited (r
12 = −.47) and Future as Ambiguous (r13 = −.46), whereas Future as Limited and Future as Ambiguous were positively correlated (r23 = .44). Based on this factor solution, coefficients of internal consistency (Cronbach’s α) were calculated for the scales of the short
The Gerontologist, 2014, Vol. 00, No. 00 Page 7 of 14
by guest on July 26, 2014http://gerontologist.oxfordjournals.org/
Dow
nloaded from

form. The resulting Cronbach’s α ranged from 0.70 to 0.77 (see Table 2). Corrected item-total correlations ranged from .48 to .65 for the items of the scale Future as Open, from .24 to .63 for the items of Future as Limited, and from .47 to .57 for the items of Future as Ambiguous. The mean item-total correlations were .58, .49, and .53 for the three scales, respectively.
Convergent and Divergent ValidityConvergent validity was examined by calculating zero-order correlations between each of the short-form FTP scales with related psychological constructs (see Table 3). As would be expected, Future as Open was moderately to strongly correlated with optimism, satisfaction with life, and extraversion. Future as Limited was significantly correlated with depressive symptoms and neuroticism, but Future as Ambiguous showed a somewhat stronger correlation with both of these constructs. Overall, the correlations were in the expected direction, with primarily medium effect sizes according to Cohen (1988). Evidence of divergent validity is apparent in the varied pattern of correlations among the three FTP subscales: Compared with Future as Ambiguous, Future as Limited showed an overall weaker pattern of association with constructs such as neuroticism and depres-sive symptoms. Such a pattern provides support for the dif-ferential utility of these subscales.
Confirmatory Factor Analyses
A set of nested measurement models was examined in order to determine whether the three-factor model suggested by the EFA provided a significantly better fit to the data com-pared with the prevailing conceptualization of FTP as a two-dimensional (Cate & John, 2007) or one-dimensional
construct (Carstensen, 2006). The two-factor model we tested assumed Future as Open and Future as Limited/Ambiguous to represent two separate factors, whereas the one-factor model views FTP as one global factor. The hypothesized three-factor model is shown in Figure 1.
The three-factor model provided a good fit to the observed data. Furthermore, the three-factor model fit the data significantly better than the two- or one-factor models (Table 4). The parameter estimates based on the completely standardized model are shown in Figure 1. All factor load-ings in the three-factor model were significantly different from zero (t > 1.96) and similar to the estimated pattern coefficients obtained in the exploratory analyses. Also, the factor intercorrelations were in the expected direction and their magnitude suggested that the three factors were suffi-ciently distinct from each other. Given this confirmation of the factor structure, factor scores for each FTP dimension were calculated by summing participants’ individual scores on all items that comprised a factor (i.e., unit weighting). These factor scores were used in the subsequent analyses.
Measurement Invariance
Measurement invariance analyses were performed in order to examine whether the factor structure of the short-form FTP scale was equivalent across age groups. Developmental constructs are often assumed to have an invariant fac-tor structure across different ages; however, in order to make valid mean level comparisons across groups, this assumption must first be established empirically (Horn & McArdle, 1992). Procedures for testing increasingly strin-gent degrees of invariance were followed (Byrne, 2012; Horn & McArdle, 1992). First, using a multigroup anal-ysis, a baseline model (see Table 4, M1) established that
Table 3. Correlations of FTP Questionnaire Dimensions and Select Psychological Constructs (N = 611)
1. 2. 3. 4. 5. 6. 7. 8. 9. 10. 11.
1. Future as Open —2. Future as Limited −.31* —3. Future as Ambiguous −.42* .39* —4. Optimism .59* −.27* −.44* —5. Satisfaction with Life .28* −.21* −.30* .37* —6. Neuroticism −.32* .27* .40* −.64* −.35* —7. Extraversion .57* −.18* −.30* .46* .31* −.23* —8. Depressive symptoms −.25* .22* .36* −.50* −.43* .68* −.17* —9. Self-rated health .28* −.10* −.18* .35* .22* −.25* .29* −.24* —10. Social desirability .26* −.17* −.30* .32* .23* −.44* .29* −.31* .25* —11. Age—zero order −.14* .13* −.10* .19* −.01 −.43* −.22* −.38* −.03 .08 —Age—partiala −.31* .24* .05
Notes: FTP = future time perspective.aControlling for the effects of optimism, depressive symptoms, self-rated health, and social desirability.*p < .05.
The Gerontologist, 2014, Vol. 00, No. 00 Page 8 of 14
by guest on July 26, 2014http://gerontologist.oxfordjournals.org/
Dow
nloaded from

the same factor loading pattern was supported across the three age groups (i.e., configural invariance). Second, the assumption of invariant factor loadings across age groups (M2) was supported (i.e., metric invariance). The assump-tion of invariant factor loadings represents the minimum requirement for valid group comparisons of factor scores (Byrne, 2012). The subsequent steps of constraining the
item intercepts (i.e., scalar invariance; M3), factor vari-ances (i.e., strict invariance with latent variances; M4), and factor covariances (i.e., strict invariance with latent covari-ances; M5), did not provide an improved fit to the data, suggesting that stricter forms of measurement invariance were not supported by the data. Table 4 shows the good-ness of fit indices for each step of the invariance analyses.
Figure 1. CFA results of the three-factor model of the Future Time Perspective scale–Short Form. The factor loadings and the factor intercorrelations from the completely standardized solution are shown. CFA = confirmatory factor analyses.
Table 4. Confirmatory Factor Analyses and Measurement Invariance Models With Resulting Goodness of Fit Indices
Model MLM χ2 df Δ MLM χ2 Δdf CFI TLI RMSEA SRMR
Confirmatory factor analysis models (cross-validation sample: n = 313)1-Factor model of FTP 716.04 55 — — 0.316 0.180 0.196 0.7222-Factor model of FTP 183.16 53 8,497.54a 2 0.865 0.832 0.089 0.0683-Factor model of FTP 85.57 51 78.28a 2 0.961 0.950 0.049 0.053Measurement invariance models (total sample: N = 625)M1: Configural 251.53 153 — — 0.949 0.934 0.056 0.059M2: Metric 270.91 171 19.38 18 0.949 0.941 0.053 0.062M3: Scalar 456.10 195 200.94b 24 0.866 0.864 0.080 0.085M4: Strict–factor variances 467.51 201 11.33 6 0.863 0.865 0.080 0.094M5: Strict–factor covariances 475.47 207 7.96 6 0.862 0.868 0.079 0.095
Notes: CFI = comparative fit index; FTP = future time perspective; RMSEA = root mean square error of approximation; SRMR = square root mean residual. Estimation method: robust maximum likelihood (MLM); TLI = Tucker–Lewis index.aIndicates significantly better fit compared with the previous model, based on the chi-square critical value for the specified change in degrees of freedom, α-level 0.05.bIndicates significantly worse fit compared with the previous model, based on the chi-square critical value for the specified change in degrees of freedom, α-level 0.05.
The Gerontologist, 2014, Vol. 00, No. 00 Page 9 of 14
by guest on July 26, 2014http://gerontologist.oxfordjournals.org/
Dow
nloaded from

Associations of Age and the Three Dimensions of FTP
Zero-order correlations showed significant yet small asso-ciations between age and the three FTP dimensions (see Table 3). Age was negatively correlated with Future as Open and with Future as Ambiguous. Age was positively cor-related with Future as Limited. We then examined partial correlations with age, controlling for the effect of optimism, depressive symptoms, self-rated health, and social desir-ability. All of these variables were significantly associated with the three dimensions of FTP and we wanted to rule out that the associations between the FTP scales and age were not due to the shared variance with these variables. After controlling for the effects of these variables, the par-tial correlations became stronger for age and Future as Open (rpartial = −.31, p < .001), as well as for age and Future as Limited (rpartial = .24, p < .001). Therefore, a higher age tended to be associated with perceiving the future as less open and also more limited, regardless of optimism, depression, health, or social desirability. No significant association was found between age and Future as Ambiguous once the effect of the potentially confounding variables was taken into account.
The hypotheses of age-group differences regarding the three dimensions of FTP were tested using multivari-ate analysis of variance (MANOVA). To examine whether or not there were any sex differences with regard to the dimensions of FTP, we also included sex in this analysis. Neither the main effect of sex nor the interaction term reached the .05 level of statistical significance; thus, we repeated the analysis as a one-way MANOVA with age
group as the between-subjects factor. This analysis yielded a small but significant multivariate effect for age group, Wilks’ Λ = 0.927, F(6, 1212) = 7.76, p < .001, η2
p = 0.037. Examination of the univariate effects showed a significant effect of age group on all three dimensions of FTP: Future as Open, F(2,608) = 4.31, p = .01, η2
p = 0.014; Future as Limited, F(2,608) = 3.30, p = .037, η2
p = 0.011; and Future as Ambiguous, F(2,608) = 5.94, p = .003, η2
p = 0.019. Post-hoc tests using Tukey’s honestly significant difference method indicated that young adults perceived their future as significantly more open (M = 16.85, SD = 1.84) than older adults (M = 16.26, SD = 2.23; see Figure 2). In addition, young adults also perceived their future as more ambigu-ous (M = 10.44, SD = 2.91) than middle-aged (M = 9.55, SD = 2.75) or older adults (M = 9.66, SD = 2.77). As expected, older adults (M = 12.66, SD = 2.67) perceived their future as significantly more limited than younger adults (M = 12.00, SD = 2.45). Figure 2 displays the age group means using standardized scores (z-scores) for ease of interpretation.
Discussion
The primary goal of this study was to design and evaluate a brief questionnaire to assess multiple dimensions of FTP in adulthood. The psychometric properties of this instrument were supported by the data, including the hypothesized three-factor structure as well as internal consistency reli-ability and several types of validity. We also found support for metric measurement invariance across three age groups,
Figure 2. Pattern of age-group differences on the three FTP subscales. Different letters denote a significant difference, p < .05. Error bars represent standard errors. FTP = future time perspective.
The Gerontologist, 2014, Vol. 00, No. 00 Page 10 of 14
by guest on July 26, 2014http://gerontologist.oxfordjournals.org/
Dow
nloaded from

indicating that the instrument assesses the three dimensions of FTP in identical ways in young, middle-aged, and older adults.
The second goal of the study was to examine the asso-ciation between age and the three FTP dimensions. Our hypotheses, which were based on life-span developmental theory, were supported by the data. Specifically, our data showed that Future as Open was negatively associated with age, whereas Future as Limited was positively associated with age. These associations held even after controlling for optimism, depression, self-rated health, and social desir-ability. In summary, these findings suggest that an older age tended to be associated with seeing the future as less open and also more limited, regardless of how optimistic, depressed or healthy a person was, or the extent to which a person responded in a socially desirable manner. Although we found a statistically significant yet small negative asso-ciation between age and Future as Ambiguous, this corre-lation became nonsignificant when we controlled for the potential confounding variables.
In addition to the correlational analyses, we also found support for the hypothesized age-group differences in FTP. Consistent with previous research and with life-span devel-opmental theories, such as socioemotional selectivity theory (Carstensen et al., 1999), younger adults tended to perceive the future as being more open, whereas older adults tended to perceive the future as more limited. This study extends existing research by examining age-group differences in a new dimension of FTP, Future as Ambiguous. That younger adults perceived their future as significantly more ambigu-ous than middle-aged adults and older adults was an inter-esting finding which was somewhat unexpected yet also informative. Many of the young adults in our sample were university students who were getting ready to embark on a professional career and might have been concerned about the larger economical and societal context in which their future is embedded and depends on. Thus, it is understand-able that they may look at their personal future not only in terms of openness and opportunities, but also with feel-ings and thoughts of ambiguity. Indeed, as can be seen in Figure 2, in young adults the average level of perceiving one’s future as ambiguous was about the same as the aver-age level of perceiving the future as open. This aspect of young adults’ FTP would not have been captured with the existing questionnaires of FTP and, therefore, we believe that our brief multidimensional questionnaire permits a more differentiated assessment of adults’ personal FTP.
This study contributes to the existing literature in sev-eral ways. First, other studies have considered FTP as a unidimensional (Lang & Carstensen, 2002) or two-dimen-sional construct (Cate & John, 2007; Kooij & Van De Voorde, 2011). However, the conceptualization considering
ambiguity toward the future as a third dimension had not yet been examined prior to this study. The findings from this study suggest that we developed reliable marker items for this dimension which measured it in comparable ways in young, middle-aged, and older adults. Second, the pre-sent study also contributes to the existing knowledge base in that it examined the multidimensional structure of FTP in adults spanning a wide range of ages, namely from 18 to 93 years. Thus, the wide age range covered is a unique facet of this study. Previous studies have relied on samples that represented only part of the adult life span, either focus-ing on middle and early old age, excluding adults in the very old age range. In combination with the examination of the measurement invariance of the newly developed instru-ment, the sample size and sample composition, therefore, permitted the robust examination of age differences in FTP. Third, this study controlled for the effects of poten-tially confounding constructs, such as optimism, depressive symptoms, self-rated health, and social desirability, and showed that two dimensions of FTP were associated with age even after taking these variables into account. Previous research controlled for confounds such as social desir-ability (specifically acquiescence; Cate & John, 2007) and health status (Lang & Carstensen, 2002). However, to our knowledge, our study is the first to control for the tendency to have an optimistic disposition, a consideration that we deem to be extremely important when asking individuals how they perceive the future. Thus, we interpret the results from these analyses as providing evidence for the discrimi-nant validity of Future as Open and Future as Limited.
Overall, the strength of the correlations between age and the three dimensions of FTP were lower in magnitude than expected. Other studies have reported stronger zero-order correlations between age and Future as Open (Gellert et al., 2012; Zacher & Frese, 2009). Specifically, Gellert and col-leagues found correlations of FTP and age to be r = −.48 among a sample of individuals age 16–78 (Study 1), and r = −.31 in a sample age 60–95 (Study 2). In contrast, we found correlations between age and all three domains to be low but statistically significant among older adults (Open: r = −.17; Limited: r = .11; Ambiguous: r = .24); the cor-relations between age and the three FTP domains in young or middle-aged adults in our sample was nonsignificant. One potential reason that the correlations between age and the three FTP dimensions were not as strong as expected is that we excluded items that were inherently age-biased. For instance, an adult in his or her 80s is, by definition, limited in responding to an item such as “Most of my life still lies ahead of me” (Carstensen & Lang, 1996). Hence, the content of this item does not apply in the same way to this individual compared with a person in his or her 30s or 40s. Such items, then, may distort the relationship between
The Gerontologist, 2014, Vol. 00, No. 00 Page 11 of 14
by guest on July 26, 2014http://gerontologist.oxfordjournals.org/
Dow
nloaded from

FTP and age and potentially result in biased correlations. Therefore, the revised short form of our FTP measure mini-mizes the risk that adults’ FTP scores are influenced by an inherent age bias. Furthermore, it is likely that subjective age ratings, rather than simply chronological age, may con-tribute more strongly to individuals’ ratings of FTP scales. For instance, Weiss and Lang (2012) showed the impor-tance of age-group identification for individuals’ ratings of FTP, such that older adults who identified less strongly with their actual age group scored higher on Future as Open. This finding suggests that other psychological constructs, including subjective evaluations of age, contribute to rat-ings of FTP over and above chronological age.
Limitations and Future Directions
An important limitation of the present study was the homo-geneity of the sample. Most individuals were Caucasian, well educated, and generally healthy, and there were more women than men. Therefore, the generalizability of find-ings is limited and may not reflect the experiences of non-white adults, particularly men, those with fewer years of formal education, and those in poorer health. This measure of FTP will need to be evaluated with a more representative sample in order to better understand how the three dimen-sions function in a broader range of demographic variables. A second limitation is that the study does not allow any statements about change in the dimensions of FTP over time, as the data are cross-sectional.
Future research should include the longitudinal evalua-tion of the brief FTP questionnaire in order to understand how the dimensions of FTP change across adulthood. Further refinement of the questionnaire may also be war-ranted, such as replacing a poorly performing item (L2), and performing Rasch analyses to further improve the psy-chometric soundness of the instrument. In addition, only about 45% of the variance was explained by our short-form questionnaire. Although this small amount of vari-ance is comparable with previous research (e.g., Cate & John, 2007 explained 51%), it would be important to study a more heterogeneous sample to determine whether the items account for a larger amount of the variance in FTP. Finally, follow-up studies should examine how the brief FTP scale performs compared with potentially overlapping constructs. For example, we measured its association with dispositional optimism, but its relation to a hope scale (e.g., Snyder et al., 1996) would also be important to examine.
In summary, this study provides evidence in support of the utility of a new multidimensional questionnaire to assess FTP. The new short-form FTP measure was shown to be reliable and valid and can be incorporated in studies of individuals across the entire adult life span.
FundingThis research was supported by grant R21 AG041379 from the National Institute of Aging, National Institutes of Health.
ReferencesAnderson, J. C., & Gerbing, D. W. (1988). Structural equation mode-
ling in practice: A review and recommended two-step approach. Psychological Bulletin, 103, 411–423.
Baltes, P., Lindenberger, U., & Staudinger, U. M. (2006). Lifespan theory in developmental psychology. In W. Damon (Series Ed.) & R. M. Lerner (Vol. Ed.), Handbook of child psychology: Vol. 1. Theoretical models of human development (6th ed., pp. 569–644). Hoboken, NJ: Wiley.
Brandtstädter, J., Rothermund, K., Kranz, D., & Kuhn, W. (2010). Final decentrations personal goals, rationality perspectives, and the awareness of life’s finitude. European Psychologist, 15, 152–163. doi:10.1027/1016–9040/a000019
Byrne, B. M. (2012). Structural equation modeling with Mplus. New York, NY: Routledge.
Carstensen, L. L. (2006). The influence of a sense of time on human development. Science (New York, N.Y.), 312, 1913–1915. doi:10.1126/science.1127488
Carstensen, L. L., Isaacowitz, D. M., & Charles, S. T. (1999). Taking time seriously. A theory of socioemotional selectivity. The American Psychologist, 54, 165–181. doi:10.1037//0003-066X.54.3.165
Carstensen, L. L., & Lang, F. R. (1996). Future time perspective scale. Unpublished Manuscript, Stanford University.
Cate, R. A., & John, O. P. (2007). Testing models of the structure and development of future time perspective: Maintaining a focus on opportunities in middle age. Psychology and Aging, 22, 186–201. doi:10.1037/0882-7974.22.1.186
Chen, P., & Vazsonyi, A. T. (2011). Future orientation, impulsiv-ity, and problem behaviors: A longitudinal moderation model. Developmental Psychology, 47, 1633–1645. doi:10.1037/a0025327
Cohen, J. (1988). Statistical power analysis for the behavioral sci-ences (2nd ed.). Hillsdale, NJ: Erlbaum.
Costa, P. T., Jr., & McCrae, R. R. (2008). The NEO Inventories. In R. P. Archer & S. R. Smith (Eds.), Personality assessment (pp. 213–245). New York, NY: Routledge.
Costa, P. T., Jr., & McCrae, R. R. (1992). Revised NEO Personality Inventory (NEO-PI-R) and NEO Five-Factor Inventory (NEO-FFI): Professional manual. Odessa, FL: Psychological Assessment Resources, Inc.
Diener, E., Emmons, R. A., Larsen, R. J., & Griffin, S. (1985). The Satisfaction With Life Scale. Journal of Personality Assessment, 49, 71–75. doi:10.1207/s15327752jpa4901_13
Dillmann, R. A. (2000). Mail and internet surveys: The tailored design method. New York, NY: Wiley.
Duangpatra, K. N. K., Bradley, G. L., & Glendon, A. I. (2009). Variables affecting emerging adults’ self-reported risk and reck-less behaviors. Journal of Applied Developmental Psychology, 30, 298–309. doi:10.1016/j.appdev.2008.12.011
Finney, S. J., & DiStefano, C. (2006). Non-normal and categorical data in structural equation modeling. In G. R. Hancock & R. O. Mueller (Eds.), Structural equation modeling: A second course. Greenwich, CT: Information Age Publishing.
The Gerontologist, 2014, Vol. 00, No. 00 Page 12 of 14
by guest on July 26, 2014http://gerontologist.oxfordjournals.org/
Dow
nloaded from

Gellert, P., Ziegelmann, J. P., Lippke, S., & Schwarzer, R. (2012). Future time perspective and health behaviors: Temporal fram-ing of self-regulatory processes in physical exercise and dietary behaviors. Annals of Behavioral Medicine: A Publication of the Society of Behavioral Medicine, 43, 208–218. doi:10.1007/s12160-011-9312-y
Glaesmer, H., Rief, W., Martin, A., Mewes, R., Brähler, E., Zenger, M., & Hinz, A. (2012). Psychometric properties and pop-ulation-based norms of the Life Orientation Test Revised (LOT-R). British Journal of Health Psychology, 17, 432–445. doi:10.1111/j.2044-8287.2011.02046.x
Gould, R. L. (1972). The phases of adult life: a study in developmental psychology. The American Journal of Psychiatry, 129, 521–531.
Hendricks, J. (2001). It’s about time. In S. H. McFadden & R. C. Atchley (Eds.), Aging and the meaning of time (pp. 21–50). New York, NY: Springer Publishing.
Hertzog, C., Van Alstine, J., Usala, P. D., Hultsch, D. F., & Dixon, R. (1990). Measurement properties of the Center for Epidemiological Studies Depression (CES-D) scale in older pop-ulations. Psychological Assessment, 2, 64–72.
Horn, J. L., & McArdle, J. J. (1992). A practical and theoretical guide to measurement invariance in aging research. Experimental Aging Research, 18, 117–144.
Idler, E. L., & Benyamini, Y. (1997). Self-rated health and mortality: A review of twenty-seven community studies. Journal of Health and Social Behavior, 38, 21–37.
Kellough, J. L., & Knight, B. G. (2012). Positivity effects in older adults’ perception of facial emotion: The role of future time perspective. The Journals of Gerontology. Series B, Psychological Sciences and Social Sciences, 67, 150–158. doi:10.1093/geronb/gbr079
Kenny, D. A. (1979). Correlation and causality. New York, NY: Wiley.
Kooij, D., & Van De Voorde, K. (2011). How changes in subjec-tive general health predict future time perspective, and devel-opment and generativity motives over the lifespan. Journal of Occupational and Organizational Psychology, 84, 228–247. doi:10.1111/j.2044-8325.2010.02012.x
Kooij, D. T. A. M., de Lange, A. H., Jansen, P. G. W., & Dikkers, J. S. E. (2013). Beyond chronological age. Examining perceived future time and subjective health as age-related mediators in relation to work-related motivations and well-being. Work & Stress, 27, 88–105. doi:10.1080/02678373.2013.769328
Lang, F. R. (2000). Endings and continuity of social relation-ships: Maximizing intrinsic benefits within personal networks when feeling near to death. Journal of Social and Personal Relationships, 17, 155–182. doi:10.1177/0265407500172001
Lang, F. R., & Carstensen, L. L. (2002). Time counts: Future time perspective, goals, and social relationships. Psychology and Aging, 17, 125–139. doi:10.1037//0882-7974.17.1.125
Lessing, E. E. (1972). Extension of personal future time perspec-tive, age, and life satisfaction of children and adolescents. Developmental Psychology, 6, 457–468. doi:10.1037/H0032576
Löckenhoff, C. E., & Carstensen, L. L. (2007). Aging, emotion, and health-related decision strategies: Motivational manipulations can reduce age differences. Psychology and Aging, 22, 134–146. doi:10.1037/0882-7974.22.1.134
Morselli, D. (2013). The olive tree effect: Future time perspective when the future is uncertain. Culture & Psychology, 19, 305–322. doi:10.1177/1354067X13489319
Muthén, K. K., & Muthén, B. O. (2007). MPLUS user’s guide (4th ed.). Los Angeles, CA: Muthén & Muthén.
Neugarten, B. L. (1968). The awareness of middle age. In B. L. Neugarten (Ed.), Middle age and aging (pp. 93–98). Chicago, IL: University of Chicago Press.
O’Connor, B. P. (2000). SPSS and SAS programs for determining the number of components using parallel analysis and velicer’s MAP test. Behavior Research Methods, Instruments, & Computers: A Journal of the Psychonomic Society, Inc, 32, 396–402.
Paulhus, D. L. (1991). Measurement and control of response bias. In J. P. Robinson, P. R. Shaver, & L. S. Wrightsman (Eds.), Measures of personality and social psychological attitudes (Vol. 1, pp. 37–41). New York, NY: Academic Press.
Paulhus, D. L. (2002). Socially desirable responding: The evolution of a construct. In H. Braun, D. N. Jackson, & D. E. Wiley (Eds.), The role of constructs in psychological and educational meas-urement (pp. 67–88). Hillsdale, NJ: Erlbaum.
Pavot, W., & Diener, E. (1993). Review of the satisfaction with life scale. Psychological Assessment, 5, 164–172. doi:10.1037/1040-3590.5.2.164
Rabinovich, A., Morton, T., & Postmes, T. (2010). Time perspective and attitude-behaviour consistency in future-oriented behav-iours. The British Journal of Social Psychology/The British Psychological Society, 49(Pt 1), 69–89. doi:10.1348/014466608x401875
Radloff, L. S. (1977). The CES-D scale: A self-report depression scale for research in the general population. Applied Psychological Measurement, 1, 385–401. doi:10.1177/014662167700100306
Rakowski, W. (1979). Future time perspective in later adulthood: review and research directions. Experimental Aging Research, 5, 43–88. doi:10.1080/03610737908257187
Rakowski, W. (1986). Future time perspective: Applications to the health context of later adulthood. American Behavioral Scientist, 29, 730–745.
Russell, D. (2002). In search of underlying dimensions: The use (and abuse) of factor analysis in Personality and Social Psychology Bulletin. Personality and Social Psychology Bulletin, 28, 1629–1646. doi:10.1177/014616702237645
Ryff, C. D., & Keyes, C. L. (1995). The structure of psychologi-cal well-being revisited. Journal of Personality and Social Psychology, 69, 719–727. doi:10.1037/0022-3514.69.4.719
Satorra, A., & Bentler, P. (1999). A scaled difference chi-square test statistic for moment structure analysis. UCLA Statistic Preprint. Retrieved from http://statistics.ucla.edu/preprints/uclastat-preprint-1999:19.
Schechter, D. E., & Francis, C. M. (2010). A life history approach to understanding youth time preference: Mechanisms of environ-mental risk and uncertainty and attitudes toward risk behav-ior and education. Human Nature, 21, 140–164. doi:10.1007/s12110-010-9084-2
Scheier, M. F., Carver, C. S., & Bridges, M. W. (1994). Distinguishing optimism from neuroticism (and trait anxiety, self-mastery, and self-esteem): A reevaluation of the Life Orientation Test. Journal of Personality and Social Psychology, 67, 1063–1078. doi:10.1037/0022-3514.67.6.1063
Schulz, R., & Heckhausen, J. (1996). A life span model of successful aging. The American Psychologist, 51, 702–714.
Shaver, P. R., & Brennan, K. A. (1991). Measures of depression and loneliness. In J. P. Robinson, P. R. Shaver, & L. S. Wrightsman
The Gerontologist, 2014, Vol. 00, No. 00 Page 13 of 14
by guest on July 26, 2014http://gerontologist.oxfordjournals.org/
Dow
nloaded from

(Eds.), Measures of personality and social psychological atti-tudes (pp. 195–289). San Diego, CA: Academic Press.
Stahl, S. T., & Patrick, J. H. (2012). Adults’ future time perspec-tive predicts engagement in physical activity. The Journals of Gerontology. Series B, Psychological Sciences and Social Sciences, 67, 413–416. doi:10.1093/geronb/gbr118
Snyder, C. R., Sympson, S. C., Ybasco, F. C., Borders, T. F., Babyak, M. A., & Higgins, R. L. (1996). Development and validation of the State Hope Scale. Journal of Personality and Social Psychology, 70, 321–335.
Tabachnick, B. G., & Fidell, L. S. (2007). Using multivariate statis-tics (5th ed.). Boston, MA: Pearson Education, Inc.
Weiss, D., & Lang, F. R. (2012). “They” are old but “I” feel younger: age-group dissociation as a self-protective strategy
in old age. Psychology and Aging, 27, 153–163. doi:10.1037/a0024887
Zacher, H., & Frese, M. (2009). Remaining time and opportunities at work: Relationships between age, work characteristics, and occupational future time perspective. Psychology and Aging, 24, 487–493. doi:10.1037/a0015425
Zaleski, Z. (2001). Future time perspective and subjective well-being in adolescent samples. In P. Schmuck & K. M. Sheldon (Eds.), Life goals and well-being: Towards a positive pychology of human striving (pp. 58–67). Seattle, WA: Hogrefe & Huber.
Zimbardo, P. G., & Boyd, J. N. (1999). Putting time in perspec-tive: A valid, reliable individual-differences metric. Journal of Personality and Social Psychology, 77, 1271–1288. doi:10.1037/0022-3514.77.6.1271
The Gerontologist, 2014, Vol. 00, No. 00 Page 14 of 14
by guest on July 26, 2014http://gerontologist.oxfordjournals.org/
Dow
nloaded from


