Embed Size (px)
Citation preview

क दरीय भमि जल बोरड
जल ससाधन, नदी विकास और गगा सरकषण
विभाग, जल शकति मतरालय
भारत सरकार
Central Ground Water Board Department of Water Resources, River Development and Ganga Rejuvenation,
Ministry of Jal Shakti Government of India
AQUIFER MAPPING AND MANAGEMENT
OF GROUND WATER RESOURCES
MEDAK DISTRICT, TELANGANA
दवकषणी कषतर, हदराबाद
Southern Region, Hyderabad

REPORT ON
AQUIFER MAPPING FOR SUSTAINABLE MANAGEMENT OF GROUND WATER RESOURCES IN HARD ROCK AREAS OF
MEDAK DISTRICT (ERSTWHILE), TELANGANA STATE
CONTRIBUTORS’ PAGE
Name Designation
Principal Author
Dr. G. Praveen Kumar : Scientist-C
Supervision & Guidance
Shri G.R.C Reddy &
Dr. P.N. Rao
: Supdtg. Hydrogeologist & Nodal officer and Supdtg. Hydrogeologist
Shri D. Subba Rao : Regional Director

REPORT ON AQUIFER MAPPING FOR SUSTAINABLE MANAGEMENT OF
GROUND WATER RESOURCES IN MEDAK DISTRICT (ERSTWHILE), TELANGANA STATE
Executive summary
Content Chapter No. Content Page No.
1 INTRODUCTION 1
1.1 Objectives 1 1.2 Scope of study 2 1.3 Area details 2 1.4 Climate and Rainfall 3 1.5 Geomorphological set up 4 1.6 Drainage and Structures 5 1.7 Land use and cropping pattern (2019-20) 5
1.8 Cropping Pattern trend 7 1.9 Soils 9 1.10 Irrigation 10
1.11 Prevailing water conservation/recharge practices 11
1.12 Geology 11 2 DATA COLLECTION AND GENERATION 11
2.1 Hydrogeological Studies 12 2.1.1 Ground water Occurrences and Movement 13 2.1.2 Exploratory Drilling 14 2.1.3 Ground water yield 14
2.2 Water Levels 15 2.2.1 Water Table Elevations (m amsl) 15 2.2.2 Depth to Water Levels (DTW) 15 2.2.3 Water level fluctuations (November vs. May) 16
2.2.4 Long term water level trends (10 yrs) 16 2.3 Geophysical studies 16 2.4 Hydro-chemical studies 19 2.4.1 Pre-monsoon 19 2.4.2 Post-monsoon 19 3 DATA INTERPRETATION, INTEGRATION AND
AQUIFER MAPPING 23
3.1 Conceptualization of aquifer system in 3D 23
3.2 Hydro-geological sections 24
3.2.1 North-West and South-East Section 25

3.2.2 South-West and North-East Section 25
3.2.3 West-East Section 25
3.3 Aquifer characterization 26
3.3.1 Weathered zone 26
3.3.2 Fractured zone 28
4 GROUNDWATER RESOURCES (2017) 30 5 GROUND WATER RELATED ISSUES and
REASONS FOR ISSUES 32
5.1 Issues 32
5.2 Reasons for Issues 33
6 MANAGEMENT STRATEGIES 34 6.1 Management plan 34 6.1.1 Supply side measures 34 6.1.1.1 Mission Kakatiya 34 6.1.1.2 Mission Bhagiratha 35 6.1.1.3 Artificial Recharge Structure 35 6.1.1.4 Other supply side measures 39 6.1.1.5 Water Conservation Measures 39 6.1.2 Demand Side Measures 39 6.1.2.1 Ongoing Micro-irrigation 39
6.1.2.2 Proposed Micro-irrigation 39
6.1.3 Impact of Kaleshwaram project 40
6.1.4 Other Recommendations 41
6.2 Expected Results and out come 42 Acknowledgment 42
Figures
Figure-1.1 Location map, Medak district. 2
Figure-1.2 Isohyetal map , Medak district. 3 Figure-1.3 Geomorphology map. 4
Figure-1.4 Drainage and water bodies map. Medak district. 5
Figure-1.5 Land use and land cover of Medak district 6
Figure-1.6a & 1.6b
Cropping pattern in Khariff and Rabi 7
Figure-1.7 Cropping area trend plots 8
Figure-1.8 Soil map, Medak district. 9
Figure-1.9 Irrigation projects with command areas in Medak district 10
Figure-1.10 Geology map, Medak district. 11
Figure-2.1 Hydrogeological data availability map 13

Table
Annexure-1: Proposed Supply side interventions in Priority-1 area.
Annexure-2: Proposed Supply side interventions in Priority-2 area.
Figure-2.2 Hydrogeology map, Medak district 14
Figure-2.3 Water Table Elevations (m amsl) 15
Figure-2.4 Depth to water levels Pre-monsoon 17
Figure-2.5 Depth to water levels Post –monsoon 17
Figure-2.6 Water Level Fluctuation (m) (Nov vs.May) 18
Figure-2.7 Graphical representation of water level trends (10 yrs) 18
Figure-2.8 Long-term water level trends (Pre and Post-monsoon-10yrs) 19
Figure-2.9 Distribution of Electrical conductivity (Pre-monsoon) 20
Figure-2.10 Distribution of Nitrate (Pre-monsoon) 21
Figure-2.11 Distribution of Fluoride (Pre-monsoon) 21
Figure-2.12 Distribution of Electrical conductivity (Post-monsoon) 22
Figure-2.13 Distribution of Nitrate (Post-monsoon) 22
Figure-2.14 Distribution of Fluoride (Post-monsoon) 23
Figure-3.1 3-D Model for study area 24
Figure-3.2 Layout of hydro geological Sections 25
Figure-3.3a-c Hydro geological sections in different directions, Medak district 26
Figure-3.4 Thickness of Weathered zone, , Medak district 27
Figure-3.5 Depth wise weathered zone distribution 28
Figure-3.6 Depth of Fractured zone, Medak district 29
Figure-3.7 Depth wise distribution of fractures, Medak district 29
Figure-4.1 Utilizable ground water resources, Medak district (2017) 31
Figure-6.1 Priority-1 area, for sustainable management of ground water Resources, Medak district
37
Figure-6.2 Priority-2 area, for sustainable management of ground water Resources, Hard rock areas, Medak district
38
Table-1.1 Cropping area trend 7
Table-2.1 Brief activities showing data compilation and generations. 11
Table-4.1 Computed Dynamic, In-storage ground water resources, Medak district. 31
Table-6.1 Hydrogeological characteristics of area 36

REPORT ON AQUIFER MAPPING FOR SUSTAINABLE MANAGEMENT OF
GROUND WATER RESOURCES IN MEDAK (ERSTWHILE) DISTRICT, TELANGANA STATE
AT A GLANCE
S.No. Item Particulars
1 Districts : Medak (New districts: Medak, Sangareddy, Siddipet (part)
2 Revenue Mandals : 46 (New mandals:61)
3 Villages : 1267 Nos
4 Geographical area : 9699 km2
5 Mappable area : 9699 km2
5 Population (2011 Census) : 30.31 lakh
6 Density of population (2011 Census) : 313 persons/km2.
7 Location : North latitude 17°25´-18°16 East longitude 77°26-79°16"
8 Rainfall (Normal) : ~635-1035 mm (avg: 868 mm) (SW: 78 % & NE: 21 %)
9 Geomorphology : Pediplain (57 %), pediment (20 %), Dissected plateau (16%), Denudation hills (3 %).
10 Major Rivers : Manjeera
11 Watersheds : 53 nos
12 Land Utilization (Ha) (2017-18) : Forest occupies ~10 % of the total geographical area, barren and uncultivable land is 5.4%, land put to non-agricultural use is 7.3%, cultivable waste is 2%, current fallow lands are 17.8%. 23.4% area out of the cultivated area is under double cropping.
13 Soils : Sandy loams soils (55 %) and Clayey soils (44%)
14 Cropping Pattern (2017-18)
(Gross Area:416705 Ha)
: Crops grown are Cotton (45%) followed by Paddy (19%)
during khariff and (62%) during rabi season. Pulses are grown in (10%) during khariff and Sugarcane is grown in (3%) during khariff and (6%) during rabi. The other crops are Millets and oil seeds.
15 Irrigation : Major project: Singur project on Manjira (Registered ayacut:40000 ha, Mostly used for drinking water supply to Hyd.)
Medium Projects: Nallavagu project (ayacut: 6030 ha), Ghanpur Anicut (ayacut: 21625 ha),
MI Tanks: 582 (>100 Acres ayacut) and 5174 (<100 Acres ayacut) minor irrigation tanks
16 Prevailing Water : PT: 1202 and 964 check dams and 994 farm ponds

Conservation/Recharge Practices Under Mission Kakatiya (Phase 1 to4) total ~12.08 MCM of silt is removed.
17 Geology : Granites: 64 %, BGC: 13%, Basalts : 19%, Laterite :3%.
18 Hydrogeological data points : 329 hydrogeological data points (Exploration: 245(CGWB: 206 and SGWD: 39), VES: 84 (CGWB).
19 Number of ground water structures : As on 31/03/2017, CGWB drilled 206 bore wells
Irrigation Wells: 1.52 lakhs (DW:0.15 lakhs and BW: 1.36 lakhs Domestic Wells: 4401 wells
20 Ground water yield (lps) : 0.1 to 6 lps (Avg:1.2 lps)
<0.1 to 6 lps (avg: 1.2 lps) in Granites and <0.1 to 4 lps (avg: 1.0 lps) in Basalts.
Deepest Fracture : 198 m at Chinnakondur in Chinnakondur mandal
21 Water Levels
Depth to water levels (m bgl)
:
:
123 wells (CGWB:44, SGWD:79)
Water table elevations during pre-monsoon season vary from 326.5 - 628 m amsl and during post-monsoon season vary from 342.6 – 637 m amsl.
Pre-monsoon season: 4.3 to 69.3 m bgl (average: 24.26 m bgl) and majority are in the range of 20- 40 m bgl (70 % area) followed by 10-20 mbgl (24% area). Deep water levels (> 40 mbgl) occupy 4% of area.
Post-monsoon: 0.1 to 34.91 m bgl (average: 11.16) and majority are in the range of 10-20 m bgl (42% area) followed by 5-10 mbgl (35 % area) , shallow water levels < 5 mbgl (10 % area) and Deep water levels ( > 20 m.bgl) occupy 12% of area.
22 Water Level Fluctuations (May vs. November )
: -0.15 to 41.97 m.bgl. Only one well at Mulug village registered fall in water level
23 Long term water level trends (10yrs)
(84 wells)
: Pre-monsoon: Falling trends: 58 wells ( -0.02 m/yr to -3.9 m/yr) Rising trends: 17 wells shows 0.01 to 1.22 m/yr.
Post-monsoon: Falling trends: 60 wells (-0.005 m/yr to -4.9 m/yr) Rising trends: 23 wells shows 0.05 to 4.12 m/yr.
24 Geophysical data (down to 200 m) : 84 VES
Weathered granite/Gneiss <100Ω m , Semi-weathered granite/Gneiss 60-350 Ω m, Fractured granite/Gneiss >350 Ω m. and < 250 ohm (Ω) m for the weathered Basalt, 300-1100 Ω m for underlying fractured Basalt and > 1200 Ω m for massive Basalt.
25 Hydrochemistry : Total 507 data
Pre-monsoon (CGWB:55 nos, SGWD:168 and RWS:103)
Post-monsoon (SGWD:129 and RWS:149) 25.1 Electrical Conductivity (µ Siemens/cm) : Pre-monsoon: 156-6629 µ Siemens/cm (avg:1168) in 83 %
of the area area EC is within 1500 µ Siemens/cm.

Post-monsoon: 150 - 6091 µ Siemens/cm (avg:1229) in 83 % of the area EC is within 1500 µ Siemens/cm.
25.2 Fluoride mg/l : Pre-monsoon: 0.02- 4.75 mg/L, 7% of area are unfit for human consumptions.
Post-monsoon: 0.06- 3.06 mg/L, 8 % of area are unfit for human consumptions.
25.3 Nitrate mg/l : Pre-monsoon: BDL to 230 mg/l and found 15 % of samples are unfit for human consumption
Post-monsoon: BDL to 496 and 24% of samples are unfit for human consumption.
26 Conceptualization Weathered zone (~20 m). Fractured zone( 20-198m.)
27 Aquifer Characterization : Saprolite (~13 m) and lower sap rock (13-20)
10-20 m weathering occurs in 75% followed by < 10 m in 15% of area and deep weathering occurs in 10 % of area.
Majority of fractures ~77% occurs within 100 m depth in Granites and ~70% within 100 m depth in Basalts .
Deepest fracture at 198 m at Chinnakondur in Chinnakondur mandal.
27.1 Aquifer wise Ground water yield : <0.1 to 3 lps. Lower yields (< 1 lps) occur in most of the area and moderate yields (1-3 lps) occur in central and eastern part and higher yields (> 3 lps) occur in southern and southwestern parts.
Yield varies from 0.01 to 6.7 lps.(avg: 1.2 lps)
27.2 Transmissivity (m2/day) : 1- 66 m2/day and in majority of wells it is <20 m2/day,
1- 122 m2/day and in majority of wells it is <30 m2/day,
27.3 Specific Yield : < 1 to 2 % -
27.4 Storativity : - 0.00001 to 0.0001
28 Ground water Resources (2017) MCM (As per New Districts and New mandals)
: Command Non-Command
Total
28.1 Net Dynamic groundwater availability : 67.26 1019 1086 28.2 Gross GW Draft : 16.95 792 809 28.3 Provision for Domestic &Industrial
(2025) : 9.01 112.6 121.6
28.4 Average Stage of Ground water development (%)
25 77 74
28.5 Net GW Availability for future irrigation
: 48.8 171 220
28.6 In storage GW Resources : 292.9 MCM (May)
Net recharge during monsoon season is 817.7 MCM 28.7 Categorization of mandals Mandal wise it varies from 29 % to 127%
(OE:11, C:7, SC: 24 and Safe:19)

29 Major Ground Water Issues Identified : Over-exploitation: ~2278 Km2 (8% of area) covering 376 villages.
Ground water Pollution: Geogenic:- Fluoride (10 % samples are unfit for human consumptions. Anthropogenic:- Nitrate 20 % samples are unfit for human consumptions).
Deep water levels (> 20 m bgl) are observed during pre -monsoon season in 74 % of area and 12% in post-monsoon.
Declining water levels: Out of 84 wells analyzed, 58wells shown falling trend in pre-monsoon and 60 during post-monsoon season.
Low Sustainability: Low yield (<1 lps) occurs in ~54 % of area and reduction in yield over a period of time.
Water marketing is present in almost all over the area.
Change in land use from agricultural land to residential purposes and cropping pattern from traditional crops to Paddy and cash crops (cotton and spices) is observed.
30 Management Strategies : Supply side measures
Ongoing Projects
Mission Kakatiya: (Phase-1 to 4): ~12 MCM of silt is removed from 85% of tanks contributing to ~ 4 MCM to groundwater and with this additional ~500 ha land can be brought under irrigated dry (ID) crops under tank ayacut.
To be taken up ~ remaining 826 tanks in next phases for de-silting. Mission Bhagiratha:~110 MCM of water will be imported from surface sources this will save ~66 MCM of ground water and from this ~11000 ha of additional land can be brought under ID crops.
To be taken up (Artificial Recharge Structure)
Priority-1:Over-exploited villages: 457(~2278 km2)
673 ARS (CD with recharge shafts: 220 and PT:453)
Cost Rs ~123 Crores
Priority-2:Other remaining villages:808 (~6531 km2)
2254 ARS (CD with recharge shafts:1006 and PT:1248)
Cost Rs ~400 Crores.
Water Conservation measures (WCM) Farm Ponds
The size of form ponds can be 10 x 10 x 3 m. Total 24306 farm ponds are recommended (20 in each village in 1257 villages) with total cost of 60.76 crores. this can create an

additional storage of 7.2 MCM
Demand side measure
Ongoing work: In the area till date a total ~40954 ha area is brought under micro-irrigation saving ~122 MCM of groundwater.
Proposed micro Irrigation: ~62,850 ha of additional land that can be brought under micro-irrigation Cost: 377 crores. With this ~188 MCM of ground water can be conserved over the traditional irrigation practices.
Other Recommendations
Declaration of Minimum Support Price in advance (before start of season) and improved facilities at procurement centres.
As a mandatory measure, every groundwater user should recharge rainwater through artificial recharge structures in proportionate to the extraction on OE blocks.
Capacity building in power supply regulation (4 hour each in morning and evening) will increase the sustainability of wells
A participatory groundwater management (PGWM) approach in sharing of groundwater and monitoring resources on a constant basis along with effective implementation of the existing ‘Water, Land and Trees Act’ of 2002 (WALTA-2002).
Laser levelling of irrigated land.
Subsidy/incentives on cost involved in sharing of groundwater may be given to the concerned farmers.
In urban and rural areas the sewerage line should be constructed to arrest leaching of nitrate
31 Expected Results and Out come : With the above interventions costing Rs 961 crores (excluding the cost involved in Mission Kakatiya and Mission Bhagiratha), the likely benefit would be net saving of 257 MCM of ground water or net reduction of 17% in stage of ground water, i.e., from 74 % to 57 % One time cost will be ~3 paisa/litre (Rs 27 /m3 of
ground water).
ABBREVATIONS
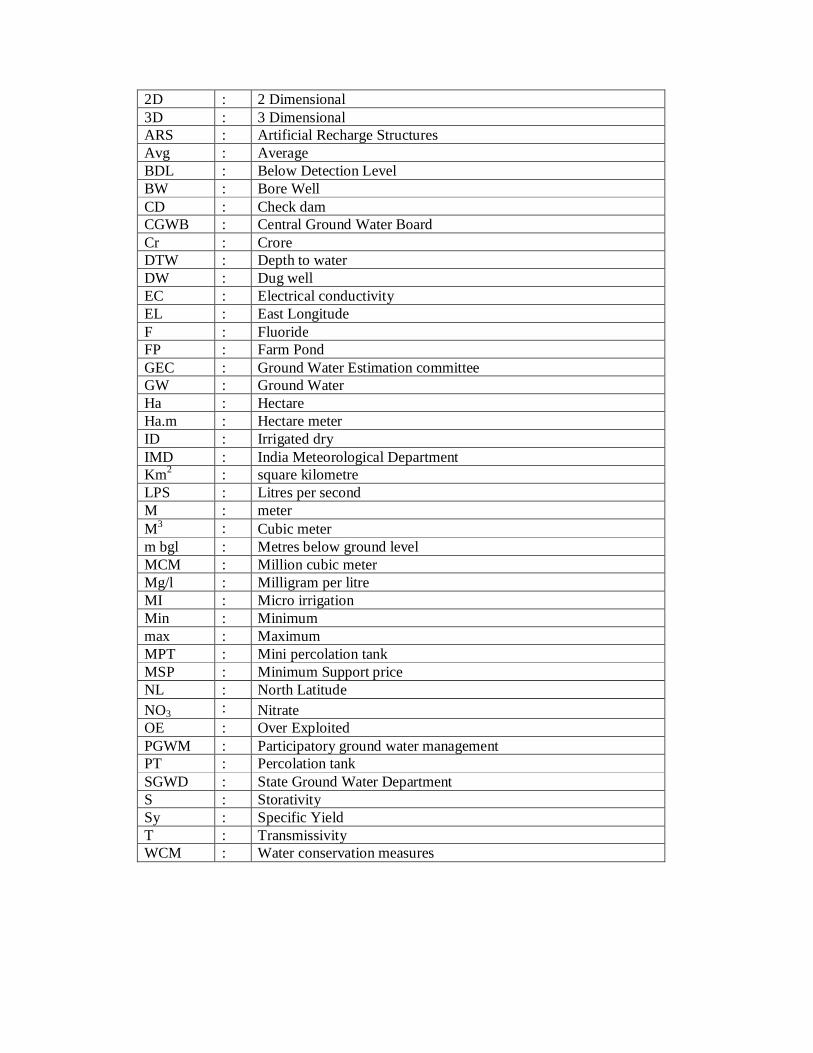
2D : 2 Dimensional 3D : 3 Dimensional ARS : Artificial Recharge Structures Avg : Average BDL : Below Detection Level BW : Bore Well CD : Check dam CGWB : Central Ground Water Board Cr : Crore DTW : Depth to water DW : Dug well EC : Electrical conductivity EL : East Longitude F : Fluoride FP : Farm Pond GEC : Ground Water Estimation committee GW : Ground Water Ha : Hectare Ha.m : Hectare meter ID : Irrigated dry IMD : India Meteorological Department Km2 : square kilometre LPS : Litres per second M : meter M3 : Cubic meter m bgl : Metres below ground level MCM : Million cubic meter Mg/l : Milligram per litre MI : Micro irrigation Min : Minimum max : Maximum MPT : Mini percolation tank MSP : Minimum Support price NL : North Latitude NO3 : Nitrate OE : Over Exploited PGWM : Participatory ground water management PT : Percolation tank SGWD : State Ground Water Department S : Storativity Sy : Specific Yield T : Transmissivity WCM : Water conservation measures

EXECUTIVE SUMMARY
Medak (erstwhile) district covering an area of 9699 km2, receives an average annual normal
rainfall of 868 mm of which SW monsoon 78 % and north-east monsoon contributes 21.5 %.
During the year 2017-18, the district received 832 mm (4% less) rainfall than normal annual
rainfall. Administratively, the area is governed by 46 revenue mandals with 1267 villages.
The population of the district is ~ 30.31 lakhs (2011 census) with average density of 313
persons/km2.
The area is underlain by Granites (64 %), Banded Gneissic Complex (13%), Basalt (19%).
Pediplains are major geomorphic feature (57% of area), followed by pediment (20%),
Dissected plateau (16%), Denudation hills (3 %). Most of the area is drained by rivers
Manjeera, Maneru, Musi and their tributaries and are divided into 53 watersheds. The soils
are sandy loamy (55%) and clayey soils (45%). The gross cropped area (2019-20) during
khariff season is 505888 ha and during rabi season is 127035 ha (Total 632923 ha). The net
cropped area is 541854 ha. Crops grown are Cotton (45%) followed by Paddy (19%) during
khariff and (62%) during rabi season. Pulses are grown in (10%) during khariff and
Sugarcane is grown in(3%) during khariff and (6%) during rabi. The other crops are Millets
and oil seeds. Long term cropping pattern shows rising trend in Paddy and Cotton cropping
areas and fall in Millets, Sugarcane and Pulses cropping areas Over all the cropping area of
the district is increasing at a rate of 5374 Ha/Yr.
There is no major irrigation project in the district. Two medium projects namely Nallavagu
project and Ghanpur Anicut, with irrigation potential of 6030 and 21625 acres are there in the
district. The other minor projects in the district include Rachakattu reservoir, Pallavaram
project, Gunduvagu anicut, SMC works and P.R tanks (>100 Acres ayacut) with 582 tanks
and P.R tanks (<100 Acres ayacut) with 5174 tanks with combined irrigation potential of
237516 acres. During the year 2017-18, 91675 ha area was irrigated from surface water.
Ground water contributes 78 % of irrigation and surface water 22 %. In the area there are
~1202 PT and 964 CD and ~40954 ha of land is brought under MI and ~12 MCM of silt is
removed under Mission Kakatiya.
Exploratory results of CGWB (206 no.) wells are analysed of which 53 wells are drilled in
Basaltic area and 153 wells in Granitic area. These comprise 01 well of shallow depth (30 m),
44 nos (30-60 m), 33 nos (60-100 m), 25 nos (100-150 m), 103 nos (150-200 m) depth. There

are ~1.65 lakh agricultural wells (Irrigation BW: 1.36 lakhs, Irrigation DW: 0.24 lakh and
Domestic wells 4401). Ground water yield varies from <0.1 to 6 lps in Granite/Gneisses and
<0.1 to 4 lps in Basalts. Majority of fractures occur within 100 m depth and deepest fracture
is encountered at 198 m.bgl at Chinnakondur in Chinnakondur mandal.
Water levels are monitored through 123 Piezometer wells during pre and post-monsoon
season. The DTW varies from 4.3 to 69.3 m bgl (average: 24.26) and 0.1 to 35.91 m bgl
(average: 11.16) during pre and post-monsoon season respectively. During pre-monsoon
season 20-40 m water level range is more predominant (70% of area) followed by 10-20 m
(24 % of area), and > 40 m.bgl (4 % of area). During post-monsoon season 10-20 m water
level is more predominant (42 % of area), followed by 5-10 m (35 % of area) and < 5 m (10
% of area). Water level fluctuation (Nov Vs. May) data indicates that out of 194 wells, only
one well at Mulug village registered fall in water level. Water level fluctuations vary from -
0.15 to 41.97 m with average rise of 13.19 m. Long-term water level trends from 84wells
during pre-monsoon shows falling trends in 58 wells -0.02 m/yr to -3.5 m/yr (0 to 1 m: 35
wells, 1-2 m: 15 wells and > 2: 8 wells) and 17 wells shows a rising trend in the range of 0.01
to 4.12 m/yr. During post-monsoon season, 60 wells show falling trends in the range of -
0.005 m/yr to -4.9 m/yr and 23 wells show rising trends in the range of 0.05 to 4.12 m/yr.
Geophysical data from 84 VES data (CGWB) reveals resistivity < 100 Ohm (Ω) m for the
weathered granite, 60-350 Ω m for underlying semi weathered granite, between 180-350 Ω m
for fractured granite and > 350 Ω m for massive granite. < 250 ohm (Ω) m for the weathered
Basalt (1-20 m), 300-1100 Ω m for underlying fractured Basalt (70-100m) and > 1200 Ω m
for massive Basalt.
Total 504 ground water samples (Pre-monsoon:326 and Post-monsoon:278) were analysed
for knowing the suitability of ground water for drinking purposes. In 83% of area EC is in
the range of < 1500 µ Siemens/cm during pre and post-monsoon seasons. During pre-
monsoon season, concentration of NO3 ranges from BDL to 230 mg/l and found that in 15 %
samples beyond permissible limit of BIS (45 mg/l) and F concentration varies from 0.02 to
4.57 mg/l and found 90% of the samples with in permissible limits of BIS (< 1.5 mg/l).
During post-monsoon season, concentration of NO3 ranges from BDL to 496 mg/l and in 20
% of samples it is beyond maximum permissible limit of BIS (45 mg/l). The F concentration
varies from 0.03 to 3.06 mg/l and in 22 samples (8%) it is beyond maximum permissible limit
of BIS.

Based on 329 hydrogeological data points, aquifers from the area can be conceptualized in to
2 no.s namely 1) weathered zone (~20 m) and 2) fractured zone (20- 198 m). Weathered zone
has gone dry in most of the area due to over-exploitation during pre-monsoon season.
Weathered zone in the range of < 10 m occurs in 15 % of area, 10-20 m in 75 % of area, and
deep weathering (> 20 m) in 10 % of area. Ground water yield of this zone varies from 0.1-3
lps, Transmissivity varies from 1 to 66 m2/day in Granites and upto 14 m2/day in Basalts.
Fracturing zone varies from 20 to 198 m (deepest fracture at Chinnakondur mandal). In
majority of area (65%) fractures occur within < 60 m depth in Granites and 48% in Basalts.
It is observed that 60-100 m. fractures constitute 12 % in Granites and 22% in Basalts, while
> 100 m. fractures comprise 23 % in Granites and 31% in Basalts. Ground water yield varies
from 0.01 to 6 lps. Transmissivity (T) varies from 1 to 122 m2/day in Granites and 0.1 to 90
m2/day in Basalts.
Net dynamic replenishable ground water availability as on 2017 is 1086 MCM, gross ground
water draft is 809 MCM, provision for drinking and industrial use for the year 2025 is 121
MCM and net available balance for future irrigation use is 220 MCM. The stage of ground
water development varies from 29% to 127%. The in-storage ground water resources down to
the maximum fractured depth (198 m) is 292.9 MCM.
Major issues identified are over-exploitation (2278 km2 area covering 376 villages, geo-genic
(F), deep water levels (> 20 m bgl) in 73 % of the area during pre-monsoon season and
declining water levels in majority of hydrograph stations and sustainability in 54 % of the
area. Other issues identified are water marketing, change in cropping pattern etc.
The management strategies mainly include both supply side and demand side. The supply
side measure includes ongoing work under Mission Kakatiya where ~12 MCM of silt has
been removed from existing 85 % tanks. This will contribute ~3MCM of ground water by
recharge, with this additional ~500 ha land can be brought under irrigated dry (ID) crops in
tank ayacut. Under Mission Bhagiratha, there is plan to import ~110 MCM of water for
drinking purposes which will save the present ~66 MCM of water for drinking and domestic
purposes and with this additional ~11000 ha of land can be brought under ID crops.
Construction of 673 ARS with ~123 crores in priority-1 area (over-exploited 457 villages)
and constructions of 2254 ARS with ~400 crores in priority-2 area (other area) are
recommended as supply side measures. Under Water conservation measures, construction of
24306 nos of farm ponds are proposed with a cost of 60.76 crores in all villages.

Demand side measure includes bringing ~62840 ha of land (from 1257 villages @50
ha/village)) under micro-irrigation with total cost of 377 crores. With this 188 MCM of
ground water will be saved in both seasons by utilizing same units.
The ongoing Kaleshwaram project is proposed to create ~275784 Ha ayacut, which can
irrigate ~55% of gross cropped area in the district.
Other measure includes providing good quality seeds, improved procurement facilities,
providing Minimum Support Price, mandatory artificial recharge at every Govt and industrial
units. Application of laser levelling technology in irrigated land, Subsidy on cost involved in
sharing of ground water, providing proper sewerage system and participatory groundwater
management (PGWM) are the other measures recommended.
With the above interventions costing Rs 961 crores (excluding the cost involved in Mission
Kakatiya and Mission Bhagiratha), the likely benefit would be the net saving of 257 MCM of
ground water. This will bring down the stage of ground water development by 17 % ( from
74 % to 57%).

NUMBER OF DATA POINTS USED FOR PREPARATION OF VARIOUS MAPS/FIGS- MEDAK DISTRICT, TELANGANA STATE
S. No.
Data Aquifer Total Data Points
Source CGWB SGWD Well
Inventory
1 Panel Diagram (3-D)
Combine 329 Expl:206 VES:84
39 -
2 Hydrogeological Sections
4 no 329 Expl:206 VES:84
39 -
3 Fence/panel Diagrams
1 no 329 Expl:206 VES:84
39 -
4 Depth of weathering
1 no 329 Expl:206 VES:84
39 -
5 Depth of fracturing
1 no 329 Expl:206 VES:84
39 -
6 Groundwater Yield
Weathered zone 329 84 23 102 Fractured zone 245 125 21 56
7 Transmissivity (m2/day)
Weathered zone 10 10 0 0 Fractured zone 52 52 0 0
8 Depth to Water Level Maps
Combine 123 84 108 -
9 Water Level Fluctuation
Combine 123 84 108 -
10 Long term water level trends
Combine 84 52 32 0
11 Water quality Pre Post
Combine 504 Pre:326 Post:278
55 0
SGWD:168 and RWS : 103) SGWD:129 and RWS : 149)
0 0

1
1. INTRODUCTION
Aquifer mapping is a multidisciplinary and a holistic scientific approach wherein a
combination of geologic, geophysical, hydrologic and chemical analysis is applied to
characterize the quantity, quality and sustainability of ground water in aquifers. In recent
past, there has been a paradigm shift from “groundwater development” to “groundwater
management”. As large parts of India particularly hard rocks have become water stressed
due to rapid growth in demand for water due to population growth, irrigation, urbanization
and changing life style. Therefore, in order to have an accurate and comprehensive micro-
level picture of groundwater in India, aquifer mapping in different hydrogeological settings at
the appropriate scale is devised and implemented, to enable robust groundwater management
plans. This will help in achieving drinking water security, improved irrigation facility and
sustainability in water resources development in large parts of rural and many parts of urban
India. The aquifer mapping program is important for planning suitable adaptation strategies
to meet climate change also. Thus the crux of National Aquifer Mapping (NAQUIM) is not
merely mapping, but reaching the goal-that of ground water management through community
participation.
Hard rocks (Granites/Gneisses) lack primary porosity, and groundwater occurrence is limited
to secondary porosity developed by weathering and fracturing. Weathered zone is the
potential recharge zone for deeper fractures and excessive withdrawal from this zone leads to
drying up in places and reducing the sustainability of structures. Besides these quantitative
aspects, groundwater quality also represents a major challenge which is threatened by both
geogenic and anthropogenic pollution. In some places, the aquifers have high level of
geogenic contaminants, such as fluoride, rendering them unsuitable for drinking purposes.
High utilization of fertilizers for agricultural productions and improper development of
sewage system in rural/urban areas lead to point source pollution viz., nitrate and chloride.
1.1 Objectives: In view of the above challenges, an integrated hydrogeological study was
taken up to develop a reliable and comprehensive aquifer map and to suggest suitable
groundwater management plan on 1: 50,000 scale.

2
1.2 Scope of study: The main scope of study is summerised below.
1. Compilation of existing data (exploration, geophysical, groundwater level and
groundwater quality with geo-referencing information and identification of principal
aquifer units.
2. Periodic long term monitoring of ground water regime (for water levels and water
quality) for creation of time series data base and ground water resource estimation.
3. Quantification of groundwater availability and assessing its quality.
4. To delineate aquifer in 3-D along with their characterization on 1:50,000 scale.
5. To formulate groundwater management plans.
1.3 Area Details: The Medak district (Erstwhile) having geographical area of 9699 km2,
lies between north latitude 17°25´26"-18°16´46" and east longitude 77°26´49"-79°16´59". It
is part of the river Godavari basin (Fig.1.1). Out of total area, the non-command area is 83 %
and command area (17%) and hilly area is 9%. Administratively the district is governed by
46 revenue mandals (61 new mandals) with 1011 Panchayats and 1267 villages with a
population of ~30.31 lakhs (2011 census), Population wise Regode Mandal has lowest
population (33,056) and Siddipet mandal has highest population (152365).
Fig.1.1: Location map of Medak district (Erstwhile).

3
1.4 Climate and Rainfall: The climate of the district is characterised by hot summer and
generally dry weather except during S-W monsoon season.The normal mean daily minimum
and maximum temperatures are 26 °C and 40 °C during May and 13°C and 28.2 °C during
December. Normal annual rainfall varies between 635 mm (Kondapak) and 1035 mm
(Medak) with average of 868 mm (Fig. 1.2). ~ SW monsoon contributes 78%, NE monsoon
contributes 21.5% while the rest by winter and summer rainfall. Rainfall increses from west
to central part and from east to central part and then decreases further south-east. As per the
IMD rainfall data, during the year 2019, it received 832 mm of rainfall (-4% less than
normal rainfall).
Fig.1.2: Isohyetal map of Medak district.
Analysis of long term rainfall data of 20 years shows very little change in annual rainfall,
with rise of 3.8 mm/yr. The monthly rainfall trend shows major change in rainfall
distribution, decline in rainfall trend is observed in monsoon months of July and August, upto

4
4 mm/year and rise in rainfall is observed in June, September, October and November
months (Fig-1.3a & 1.3b).
Fig-1.3a: Annual Rainfall trend Fig-1.3b: Monthly Rainfall trend
1.5 Geomorphological Set up: Pediplain is the major landform covering about 5540 km2
(57%) area. The other landforms observed are Pediment (20%), Dissected Plateau (16%),
Denudation hills (03%), Flood plain, Residual hill, Channel fill, etc. (Fig.1.3).
Fig.1.3: Geomorphology of Medak district.

5
1.6 Drainage and Structures: Major part of the district falls under Godavari basin. The
District is divided into two major drainage basins namely Godavari & Krishna and sub basins
of major rivers with their tributaries, Majeera, Maneru and Musi. These sub basins are further
sub divided into 53 groundwater watersheds. No major rivers are flowing across the district.
But, the “Manjeera”, tributary of Godavari river, originates in Bidar district and enters Medak
district in the southeastern direction. It flows for about 96 Km. in the western and northwestern
mandals of Narayankhed, Zaheerabad, Sangareddy, Narsapur and Medak. Other small rivers like
Haldi Vagu, Nalla Vagu, Naranja Vagu and Kudleru Vagu flows through the district.
Lineaments trend along E-W, NE-SW, N-S and NW-SE directions. Map depicting drainage,
water bodies, lineaments and watershed boundaries is presented in Fig.1.4.
Fig.1.4: Drainage, lineaments and watershed boundaries.
1.7 Land use and cropping pattern (2019-20): In the area, the land use can be grouped into
11 classes (Fig.1.5). Forest occupies ~10 % of the total geographical area, barren and
uncultivable land is 5.4%, land put to non-agricultural use is 7.3%, cultivable waste is 2%,

6
current fallow lands are 17.8%. Nearly 4.23 lakh hectare is under cultivation, while 23.4%
(1.00 lakh hectares) area out of the cultivated area is under double cropping.
The gross cropped area (2019-20) during khariff season is 505888 ha and during rabi season
is 127035 ha (Total 632923 ha). The net cropped area is 541854 ha. Main crops grown are
Cotton 227801 ha (45%) followed by Paddy 97778 ha (19%) during khariff and 78442 ha (62%)
during rabi season. Pulses are grown in 52212 ha (10%) during khariff and Sugarcane is
grown in 14355 (3%) during khariff and 7404 ha (6%) during rabi. The other crops are Millets
and oil seeds. Season wise cropping pattern is given in Fig.1.6a and Fig.1.6b.
Fig.1.5: Land use and land cover of Medak district.

7
1.8 Cropping Pattern trend:
To understand the long term cropping pattern changes, 20 years data of cropping pattern is
analysed. It is observed from the cropping area trend (Table- 1.1) that the cropping areas of
Paddy and Cotton are rising and the cropping areas of Millets, Sugarcane and Pulses are
falling. Over all the cropping area of the district is increasing at a rate of 5374 Ha/Yr.The
plots for cropping area trends is given in Fig-1.7.
Table-1.1 : Cropping area trend
Crop Trend Ha/Yr
Paddy 3331
Cotton 11175
Millets -4062
Sugarcane -358
Pulses -5241
Total 5374
Fig.1.6a: Cropping pattern in Khariff Fig.1.6b: Cropping pattern in Rabi

8
Fig-1.7: Cropping area trend plots
The observations made from the analysis are given below.
There is a gradual change in cropping pattern in the past 20 years.
The extent of Paddy and Cotton in gross cropped area is increasing for past 20 years
where as the extent of Millets and Pulses is decreasing during the same period.
The cropping trend data for paddy indicate irrigation requirement of 36.64 MCM/Yr (~3% of
Dynamic ground water resources available in the district), which is mostly met by the ground

9
water in the district. The ID crops such as Millets and Pulses are showing falling trend. If the
Paddy growth rate is reduced to zero, 36.64 MCM/Yr water can be saved.
1.9 Soils: The area is mainly occupied by Sandy loams (55%), (red and sandy soils, which are
shallow with low water holding capacity), Clayey soils (44 %) (deep, gravelly clay with low
avaialable water content (AWC)) and laterite (1%). Red laterite soil is predominant in
Zahirabad and Kohir mandals. Black cotton soils, comprising of clay loams, clay and silt clay,
are found in Sangareddy, Sadasivapet, Kondapoor, Munipally, Pulkal, Shankarampet (A),
Alladurg, Jogipet, Regode, Narayankhed, Manoor, Kangti , Kalher , Narsapur, Kowdipally,
Shivampet , Hathnoora and Jinnaram mandals. (Fig.1.8).
Fig.1.8: Soil map of Medak district.

10
1.10 Irrigation:
River Manjeera a tributary to the River Godavari, originates in Bidar district and enters
Medak district in the southeastern direction, It flows for about 96 Km. in the western and north-
western mandals. Other small Rivers like Haldi Vagu, Nalla Vagu, Naranja Vagu and Kudleru
Vagu passes through the district. There is no major irrigation project in the district. One
major project, Singur project on Manjira River at Singur village is dedicated to drinking
water supply to Hyderabad city. Two medium projects namely Nallavagu project and
Ghanpur Anicut, with irrigation potential of 6030 and 21625 acres respectively in the district.
The other minor projects in the district include Rachakattu reservoir, Pallavaram project,
Gunduvagu anicut, SMC works and 582 P.R tanks (>100 Acres ayacut) and 5174 P.R tanks
(<100 Acres ayacut) with combined irrigation potential of 237516 acres. Irrigation projects
location with command area is given in Fig.1.9. There are 138943 bore wells and 9416
dugwells with an average command area of only 0.4 ha for each borewell and dugwell.
During the year 2017-18, 91675 Ha area was irrigated from surface water (22%) while
ground water contributes 78% of irrigation.
Fig.1.9 : Irrigation projects with command areas in Medak district
(Source: Major & Medium Irrigation projects, I&CAD)
11
1.11 Prevailing Water Conservation/Recharge Practices: In the district there are ~1202
percolation tanks, 964 Check dams and 994 farm ponds with gross storage of 99 MCM.
Under Mission Kakatiya (Phase 1 to 4) 4930 tanks have been undertaken under RRR
(Repairs, restoration and Rejuvenation) schemes.
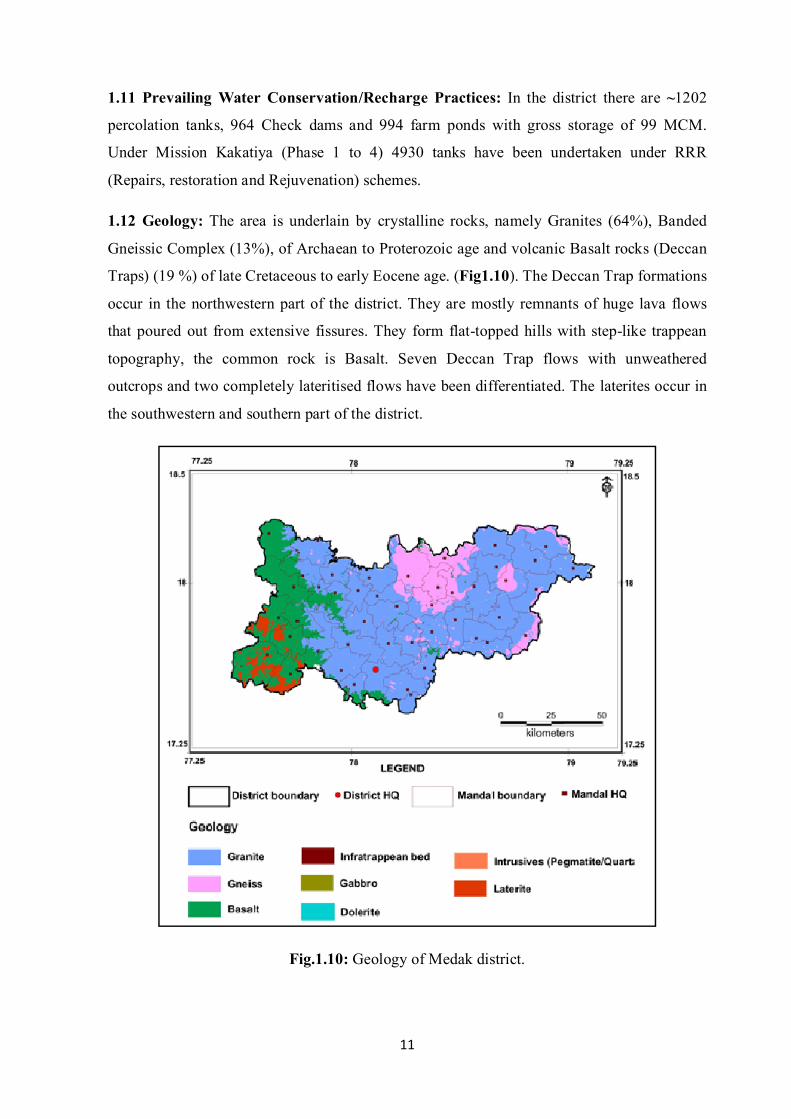
1.12 Geology: The area is underlain by crystalline rocks, namely Granites (64%), Banded
Gneissic Complex (13%), of Archaean to Proterozoic age and volcanic Basalt rocks (Deccan
Traps) (19 %) of late Cretaceous to early Eocene age. (Fig1.10). The Deccan Trap formations
occur in the northwestern part of the district. They are mostly remnants of huge lava flows
that poured out from extensive fissures. They form flat-topped hills with step-like trappean
topography, the common rock is Basalt. Seven Deccan Trap flows with unweathered
outcrops and two completely lateritised flows have been differentiated. The laterites occur in
the southwestern and southern part of the district.
Fig.1.10: Geology of Medak district.
12
2. DATA COLLECTION AND GENERATION
Collection and compilation of data for aquifer mapping studies is carried out in conformity
with Expenditure Finance Committee (EFC) document of XII plan of CGWB encompassing
various data generation activities (Table-2.1).
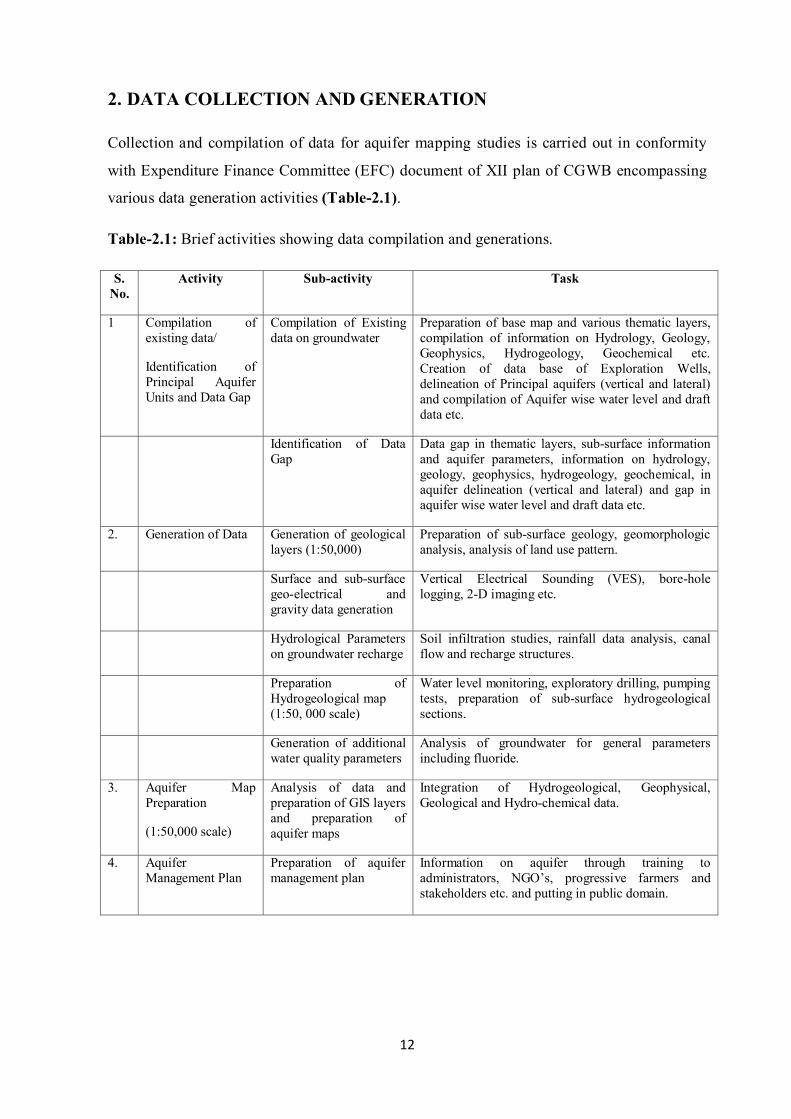
Table-2.1: Brief activities showing data compilation and generations.
S. No.
Activity Sub-activity Task
1 Compilation of existing data/
Identification of Principal Aquifer Units and Data Gap
Compilation of Existing data on groundwater
Preparation of base map and various thematic layers, compilation of information on Hydrology, Geology, Geophysics, Hydrogeology, Geochemical etc. Creation of data base of Exploration Wells, delineation of Principal aquifers (vertical and lateral) and compilation of Aquifer wise water level and draft data etc.
Identification of Data Gap
Data gap in thematic layers, sub-surface information and aquifer parameters, information on hydrology, geology, geophysics, hydrogeology, geochemical, in aquifer delineation (vertical and lateral) and gap in aquifer wise water level and draft data etc.
2. Generation of Data Generation of geological layers (1:50,000)
Preparation of sub-surface geology, geomorphologic analysis, analysis of land use pattern.
Surface and sub-surface geo-electrical and gravity data generation
Vertical Electrical Sounding (VES), bore-hole logging, 2-D imaging etc.
Hydrological Parameters on groundwater recharge
Soil infiltration studies, rainfall data analysis, canal flow and recharge structures.
Preparation of Hydrogeological map (1:50, 000 scale)
Water level monitoring, exploratory drilling, pumping tests, preparation of sub-surface hydrogeological sections.
Generation of additional water quality parameters
Analysis of groundwater for general parameters including fluoride.
3. Aquifer Map Preparation
(1:50,000 scale)
Analysis of data and preparation of GIS layers and preparation of aquifer maps
Integration of Hydrogeological, Geophysical, Geological and Hydro-chemical data.
4. Aquifer Management Plan
Preparation of aquifer management plan
Information on aquifer through training to administrators, NGO’s, progressive farmers and stakeholders etc. and putting in public domain.

13
2.1 Hydrogeological Studies
Hydrogeology is concerned primarily with mode of occurrence, distribution, movement and
chemistry of ground water occurring in the subsurface in relation to the geological
environment. The occurrence and movement of water in the subsurface is broadly governed
by geological frameworks i.e., nature of rock formations including their porosity (primary
and secondary) and permeability. The principal aquifers in the area are granites, gneisses and
basalts and the occurrence and movement of ground water in these rocks is controlled by the
degree of interconnection of secondary pores/voids developed by fracturing and weathering.
Based on 329 hydrogeological data points (Fig.2.1) hydrogeological map is prepared. The
depth of contact between Basalts and Granites varies from 42 m.bgl (Nagwar) to 146 m.bgl
(Buchanhally). The Infra-trappeans are noticed upto a maximum depth of 164 m.bgl at
Govindpur. Laterites are mostly found in Zaheerabad mandal and its surroundings.
Fig. 2.1: Hydrogeological data availability.
2.1.1 Ground water occurrences and movement: Ground water occurs under unconfined
and semi-confined/confined conditions and flows downward from the weathered zone into
the fracture zone. The main aquifers constitute the weathered zone at the top, followed by a
discrete anisotropic fractured/fissured zone at the bottom, generally extending down to 200 m

14
depth. The storage in Granitic rocks is primarily confined to the weathered zone and its
overexploitation, mainly for irrigation purpose, has resulted in desaturation of weathered
zone at many places. In Basaltic terrain, vesicular basalt is the main aquifer, in all 53
borewells were drilled in the area with maximum drilled depth of 193.5 m.bgl. At present,
extraction is mainly through boreholes of 60-100 m depth, with yield between <0.2 and 7
litres/second (lps). ~ 96 % of fractures occur within 100 m depth and the deepest fracture is
encountered in Granites at a depth of 198 m.bgl (Chinnakondur) and in basalts at a depth of
164 m depth (Govindapur). The hydrogeological map of the area is presented in Fig. 2.2.
Fig.2.2: Hydrogeological map of Medak district.
2.1.2 Exploratory Drilling: As on 31/03/2018, CGWB drilled 206 bore wells (exploratory,
observation and piezometers), 53 wells in basaltic area and 153 wells in granitic area and
SGWD drilled 39 wells in the district. Data analysed from CGWB wells indicates, 01 well of
shallow depth (30 m), 44 wells of 30-60 m depth, 33 wells of 60-100 m depth, 25 wells of
100-150 m depth and 103 wells of 150-200m depth. Deepest fracture encountered at
198 m.bgl at Chinnakondur in Chinnakondur mandal.In the district, there are 1,65,384

15
existing wells (Irrigation: 1,60,983 wells (DW: 24,420 and BW:1,36,563) and domestic: 4401
wells (HP: 2792 and BW with PP: 1609).
2.1.3 Ground water Yield: Ground water yield of Granitic aquifers varies from <0.1 to 6
lps (avg: 1.2 lps) and Basaltic aquifers varies from <0.1 to 4 lps (avg: 1.0 lps). Wells located
in the command area have higher yield (1-3 lps) and sustain for more hours of pumping as
compared to non-command area where yields are relatively low with sustainability for 2-3
hrs (Fig.2.2).
2.2 Water Levels: Ground water levels from 123 piezometers (CGWB:44 and SGWD: 79
were analyzed for pre-monsoon and 113 piezometers (CGWB:44 and SGWD: 69) for post-
monsoon seasons respectively.
2.2.1 Water Table Elevations: During pre-monsoon and post-monsoon season (May and
November), the water-table elevation ranges from 326.5 - 628 and 342.6-637 meter above
mean sea level (m amsl) respectively and general ground flow is towards river Manjira
andtowards river Godavari from southwest to north-east part of district (Fig.2.3).
Fig.2.3: Water table elevations (m amsl) during pre and post-monsoon season
2.2.2 Depth to Water Levels (DTW): The DTW varies from 4.3 to 69.3 meter below ground
level (m bgl) (average: 24.26 m bgl) and 0.1 - 35.91 m bgl (average: 11.16) during pre-
monsoon and post-monsoon season respectively.

16
Pre-monsoon season: Majority of the water levels during this season are in the range of
20-40 m covering 70 % of the area, followed by 10-20 m bgl (24%). Deep water levels in the
range of > 40 m bgl occupy about 4% of the area falling in parts of Danur, Doultabad,
Kulcharam, Medak, Narayankhed and Raikod mandals (Fig.2.4). Shallow water levels (< 10
mbgl) occupy about 2% of the area in Alladurg, Shankarampet and Zahirabad mandals.
Post-monsoon season: Majority of the water levels during this season are in the range of
10-20 m bgl, covering 42 % of the area, followed by 5 to 10 m.bgl water levels with 35% of
the area. Shallow water levels < 5m.bgl cover 10% of the area and Deep water levels
(> 20 m) cover 12% of the area spreading in parts of Doultabad, Gajwel, Kowdipalli,
Kulcharam, Medak, Narsapur, Sangareddy, Wargal and Zahirabad mandals (Fig.2.5).
2.2.3 Water Level Fluctuations (May vs. November): The water level fluctuations vary
from -0.15 to 41.97 m with average rise of 13.19 m (Fig.2.6). Only one well at Mulug village
registered fall in water level and remaining all wells show rise in water levels. Rise in water
levels in the range of 10 to 20 m. cover 56% of area followed by 5 to 10 m, covering 26% of
area. Water level rise of < 5 m. is observed in Jinnaram, Mulug, Pulkal and Regode mandals.
2.2.4 Long term water level trends: Trend analysis for the last 10 years is studied from 84
hydrograph stations of CGWB and SGWD. It is observed that during pre-monsoon season,
58 wells show falling trend (0-1:35, 1-2: 15 and >2 m: 8 wells) (max fall: 3.95 m/yr) and 17
wells shows rising trend (0-1.22 m/yr). During post-monsoon season 60 wells show falling
trend (0-1m.:46, 1-2 m: 9 and >2 m: 5 wells) (maximum fall: 4.99 m/Yr) and 23 wells shows
rising trends (0-4.12 m/yr). The graphical representation of fall and rise is shown in Fig 2.7
and spatial distribution of long term water level trend shown in Fig 2.8.
2.3 Geophysical Studies:A total of 84 VES data is interpreted, which reveals resistivity <
100 ohm (Ω) m for the weathered granite (1-30 m), 60-350 Ω m for underlying fractured
granite with maximum thickness of 84 m and > 350 Ω m for massive granite.It also reveals
resistivity < 250 ohm (Ω) m for the weathered Basalt (1-20 m), 300-1100 Ω m for underlying
fractured Basalt (70-100m) and > 1200 Ω m for massive Basalt.

17
Fig.2.4: Depth to water levels Pre-monsoon
Fig.2.5: Depth to water levels Post-monsoon.

18
Fig.2.6: Water Level Fluctuations (m) (Nov with respect to May).
Fig. 2.7: Graphical representation of water level trends

19
Fig. 2.8: Long-term water level trends
2.4 Hydro chemical Studies
To understand chemical nature of groundwater, total 504 data is utilized from ground water
monitoring wells of CGWB, SGWD and RWS wells (Pre-monsoon:326 and post-
monsoon:278) (mostly tapping combined aquifers Aq-1 and aq-2) during the pre-monsoon
and post-monsoon season. Parameters namely pH, EC (in µS/cm at 25° C), TH, Ca, Mg,
Na, K, CO3, HCO3, Cl, SO4, NO3 and F were analyzed.
2.4.1 Pre-monsoon (May)
Groundwater is mildly alkaline to alkaline in nature with pH in the range of 6.48-8.94 (Avg:
7.65). Electrical conductivity varies from 156-6629 (avg: 1168) µ Siemens/cm. In 83% of
area EC is within 1500 µ Siemens/cm, in 13% area, it is 1500-3000 µ Siemens/cm and in
04% area, it is > 3000 µ Siemens/cm (Fig.2.9). Average concentration of TDS is 728 mg/L
and NO3 ranges from 1-230 mg/L. Nitate concentration in 15% of samples is beyond
permissible limits of 45 mg/L (Fig.2.10). Fluoride concentration varies from 0.02-4.57 mg/L
(Fig 2.11) and 90% of samples it is within permissible limits of BIS and rest is beyond
permissible limit of 1.5 mg/L. High fluoride concentration is observed mostly in Mulug,
Sadasivpet mandal and in most of the eastern part and scattered parts in central and northern
aprts of the district.
2.4.2 Post-monsoon (November)
Groundwater from the area is mildly alkaline to alkaline in nature with pH in the range of
6.6-9.19 (Avg: 7.54). Electrical conductivity varies from 150-6091 (avg: 1229) µ

20
Siemens/cm. In 83% of area EC is within 1500 µ Siemens/cm, in 16% of area EC is
1500 to 3000 µ Siemens/cm and in 1% area it is > 3000 µ Siemens/cm falling in command
area mostly in Wargal and Sadasivpet mandals(Fig.2.12). Average concentration of TDS is
787 mg/L. NO3 ranges from <1-496 mg/L. and in 24% of samples it is beyond permissible
limit of 45 mg/L (Fig.2.13). Fluoride concentration varies from 0.06-3.06 mg/L (Fig 2.14)
and 92% of area is within permissible limit of BIS and rest is beyond permissible limit of 1.5
mg/L. High fluoride concentration is observed in 8 % of samples. Over all 66% of samples
are unfit for human consumption from the district.
Fig.2.9: Distribution of Electrical conductivity (Pre-monsoon).

21
Fig.2.10: Distribution of Nitrate (Pre-monsoon).
Fig.2.11: Distribution of Fluoride (Pre-monsoon).

22
Fig.2.12: Distribution of Electrical conductivity (Post-monsoon).
Fig.2.13: Distribution of Nitrate (Post-monsoon).

23
Fig.2.14: Distribution of Fluoride (Post-monsoon).
3. DATA INTERPRETATION, INTEGRATION AND AQUIFER MAPPING
Conceptualization of 3-D hydrogeological model was carried out by interpreting and
integrating representative 329 data points (both hydrogeological and geophysical down to
200 m) for preparation of 3-D map, panel diagram and hydrogeological sections. The data
(Fig.2.1) is calibrated for elevations with Shuttle Radar Topography Mission (SRTM) data.
The lithological information was generated by using the RockWorks-16 software and
generated 3-D map for Medak district (Fig.3.1) and hydrogeological sections.

24
Fig.-3.1: 3-D Model for study area.
3.1 Conceptualization of aquifer system in 3D
Aquifers were characterized in terms of potential and quality based on integrated
hydrogeological data and various thematic maps. Weathered zone is considered up to the
maximum depth of weathering and first fracture encountered (below weathered depth)
generally down to ~20 m depth and the fractured zone (fractured granite) is considered up to
the depth of deepest fracture below weathered zone (~20-198 m).
3.2 Hydrogeological Sections
Hydrogeological sections are prepared in NW-SE, SW-NE and W-E directions (Fig. 3.2).

25
Fig.-3.2: Map showing orientation of hydrogeological Sections
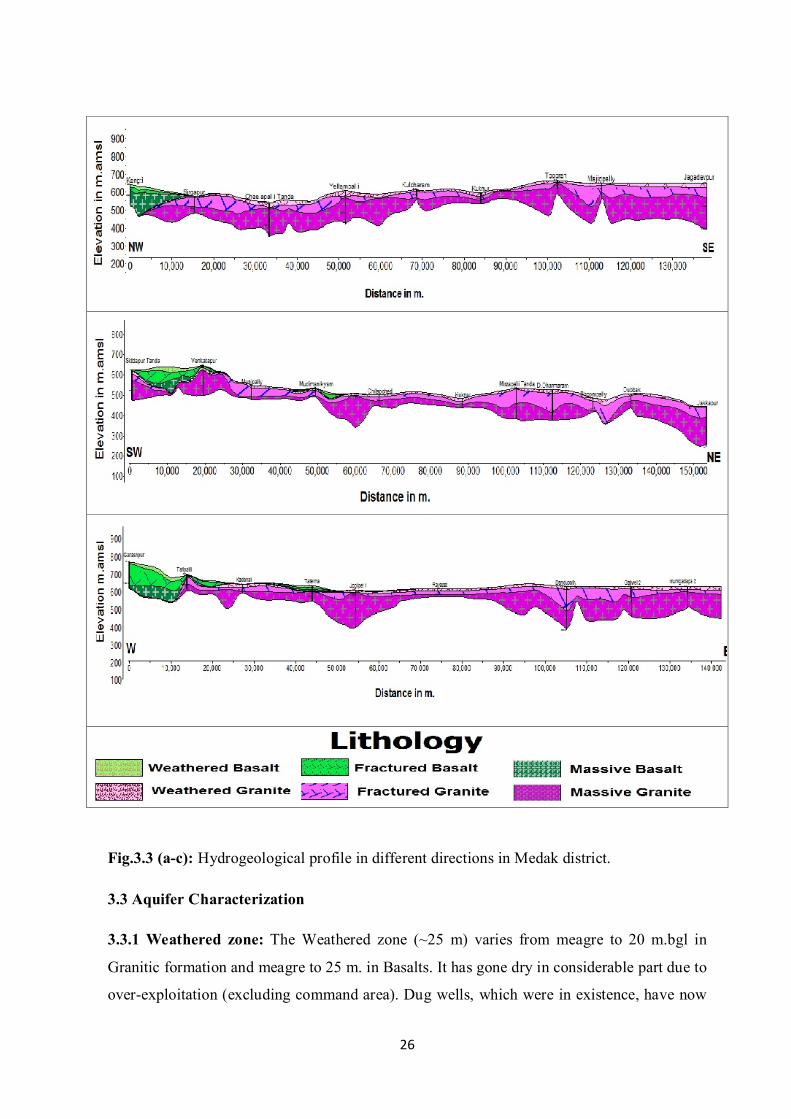
3.2.1 North-West and South-East Section: The section is drawn along the NW-SE
direction covering distance of ~140 kms (Fig.3.3a). It depicts thick weathered zone and
fractured zone in south-eastern part and thick fractured zone in north-western part adjacent to
Basalt. Basalts extend upto ~15 km into the district from NW boundary and the depth of
Basalt occurence gradually decreases from NW –SE direction.
3.2.2 South-West and North-East Section: The section is drawn along the SW-NE parts
covering distance of ~155 kms (Fig.3.3b). It depicts thick weathered zone in the central part
and thin fracture zones in the central part with thick fractured zone on both sides. Basalts
extend upto ~25 km into the district from SW boundary and thin isolated Basalt layers are
observed in central part.
3.2.3 West-East Section: The section drawn horizontally along the West-East direction
covering distance of ~145 kms (Fig.3.3c), depicts thick weathered zone in eastern and
western part and thin fracture zones in the central part with thick fractured zone on both
sides. Basalts extend upto ~22 km into the district from SW boundary and thin isolated basalt
layers are observed in central part.Thick fractured basalt zone is observed in the western part.
26
Fig.3.3 (a-c): Hydrogeological profile in different directions in Medak district.
3.3 Aquifer Characterization
3.3.1 Weathered zone: The Weathered zone (~25 m) varies from meagre to 20 m.bgl in
Granitic formation and meagre to 25 m. in Basalts. It has gone dry in considerable part due to
over-exploitation (excluding command area). Dug wells, which were in existence, have now

27
become defunct and presently located only in command area with water column. Spatial
distribution of weathering depth zone map is given in Fig.3.4. Thickness of weathered zone
is in the range of 10-20 m in most part of area covering 49% of area. Shallow weathering
(< 10 m) occurs in 37% of the area and deep weathering (> 20 m) occurs in rest of the area
(Fig.3.5).
Ground water yield from weathered granite/gneiss aquifer varies from <0.1 to 3 lps (avg: 0.6
lps) in granites and from 0.01 to 2 lps (avg: 0.4 lps) in basalt aquifer. The transmissivity
varies from 1 to 14 m2/day in basalts and upto 66 m2/day in weathered granite/gneiss aquifer.
Fig.3.4: Thickness of Weathered zone - Medak district.

28
Fig.3.5: Depth wise weathered zone distribution
3.3.2 Fractured zone: Ground water is extracted mainly through bore wells of 20 to 100 m
depth from fractured zone (~20 to 198 m). Based on CGWB data, it is inferred that fractures
in the range of < 60 m depth are more predominant (76 % of the area), 60-100 and 100-150
fractures occur in 18 % and 6% of area respectively and deep fractures in the range of 150-
198 m occur in Narayankhed, Nayalkal and Kondapaka mandals (Fig.3.6). Analysis of
occurence of fractures (446 nos from 320 wells) reveal that majority of fractures (~75 %)
occur within 100 m depth (Fig. 3.7).
In fractured granite/gneiss yield varies from 0.01 to 6.7 lps (avg: 1.2 lps). Wells located in the
command area have higher yield (1-3 lps) and sustains for more hours of pumping as
compared to non-command area where yields are relatively low and sustains for 2-3 hrs. The
deepest fracture encountered is at 198 m.bgl. The transmissivity varies from 1-122 m2/day.
Stotativity of the fracture zone varies from 0.0001 to 0.00001. In Basaltic terrain, yield varies
from 0.01 to 4.4 lps (avg: 1 lps). The deepest fracture encountered is at 164 m.bgl.
Transmissivity varies from 0.1 to 90 m2/day.

29
Fig.-3.6: Depth of Fractured zone (Maximum depth) (m bgl).
Fig.-3.7: Depth wise distribution of fractures.
No. of Wells analysed : 320 No. of Fractures analysed :446

30
4. GROUND WATER RESOURCES (2017)
In hard rocks, for practical purpose it is very difficult to compute zone wise (aquifer wise)
ground water resources, because the weathered zone (WZ) and fractured zone (FZ) are inter-
connected with fractures/joints and fractured zone gets recharged through weathered zone.
Therefore it is very difficult to demarcate the boundary between two aquifers; hence the
resources are estimated considering entire area as a single aquifer system. Village wise
dynamic and in-storage ground water resources are computed as per the guidelines laid down
in GEC methodology.
While computing the in-storage resources, the general depth of deepest fractures in the area,
pre-monsoon water levels and 2 % of granular zone (depth below pre-monsoon water level
and down to deepest fracture depth in the village) is considered. Summarized command/ non-
command area and mandal wise resources are given in Table-4.1.
As per 2017 GEC report, the net dynamic replenishable groundwater availability is 1086
MCM, gross ground water draft for all uses 809 MCM, provision for drinking and industrial
use for the year 2025 is 121 MCM and net annual ground water potential available for future
irrigation needs is 220 MCM. 11 mandals (Ameenpur, Jarasangam, Nyalkal, Patancheru,
Zaheerabad, Kondapak, Markook, Mirdoddi,Mulugu, Nanganur, Wargal) falls in over-
exploited category, 7 (Nizampet, Kelher, Doulthabad, Dubbak, Jagdevpur, Raipole, Siddipet
Urban) in critical category, 24 mandals fall in semi critical category and remaining 19
mandals fall in safe category. Mandal wise stage of ground water development varies from
29% (Singapoor mandal) to 127% (Nyalkal mandal) with average of 74%. Based on 2017
resources, village wise utilizable ground water resource map is prepared and presented in
Fig. 4.1.
The instorage was calculated for saturated weathered zone and the saturated fractured zone to
the depth of deepest fracture encountered. The total instorage groundwater resources
estimated for Medak district is 292.9 MCM, 31.85 MCM is from command area and 261
MCM from non-command area.

31
Table-4.1: Computed Dynamic, In-storage ground water resources, Medak district.
Parameters Command Non-command
Total
As per GEC 2017 MCM MCM MCM
Dynamic (Net GWR Availability) 67.26 1019 1086
Monsoon recharge from rainfall 13.11 685.7 688.8
Monsoon recharge from other sources 17.91 111 128.9
Non-Monsoon recharge from rainfall 0.8 140 141
Non-monsoon recharge from other sources 42.9 194.4 237.3
Gross GW Draft 16.95 792 809
Irrigation 16.64 720 737
Domestic and Industrial use 0.3 71.5 71.8
Provision for Drinking and Industrial use for the year 2025
9.01 112.6 121.6
Net GW availability for future irrigation 48.8 171 220
Stage of GW development (%) 25% 77% 74%
Mandal wise it varies from 29 % (Singapoor) to 127 % (Nyalkal)
In-storage GW Resources (down to the maximum depth of fractures)
31.85 261.1 292.9
Fig.4.1: Utilizable ground water resources (2017).

32
5. GROUND WATER RELATED ISSUES AND REASONS FOR ISSUES
5.1 Issues
Over-exploitation
~2278 Km2 area covering 376 villages are categorized as over-exploited where
ground water balance for future irrigation is zero or negative.
Deep water levels
Deep water levels (> 20 m bgl) are observed during pre and post-monsoon season in
73 % and 12 % of the area respectively.
Out of 84 wells analysed, 58 wells during pre-monsoon 60 wells during post-
monsoon shown falling trend in the last 10 years (@-0.02 to -2.98 m/yr and -0.04 to
-2.05 m/yr) respectively.
Low Sustainability
Low yield (<1 lps) occurs in ~54% of area covering entire district. The yield from
bore wells have reduced over a period of time and some bore wells which used to
yield sufficient quantity of water have gone dry due to low rainfall.
Pollution (Geogenic and Anthropogenic)
Few mandals are fluorosis endemic where fluoride (geogenic) as high as 4.57 mg/L
during pre-monsoon and 3.06 mg/L during post-monsoon season is found in
groundwater. The high fluoride concentration (>1.5 mg/L) occur in 7% and 6% of
the area during pre-monsoon and post-monsoon season respectively.
High nitrate (> 45 mg/L) due to anthropogenic activities is observed in 43 samples
(15%) and 65 samples (24%) during pre-monsoon and post-monsoon season covering
command and urban areas.

33
Water Marketing and other Issues
Water marketing is present in almost all over the area and people are buying bottled
water from the market for drinking purposes as there is no sufficient supply of surface
water.
Change in land use from agricultural land to residential purposes and cropping pattern
from traditional crops to cash crops (spices, cotton) is observed.
Based on ground water paddy is grown during rabi season in non-command area
leading to heavy withdrawal of ground water during non-monsoon period.
5.2 Reasons for Issues
Over-exploitation and Deep water levels
Over-extraction, paddy cultivation during rabi season (62% to total crops) ground
water mining, limited artificial recharge measures etc.
Low Sustainability
Absence of primary porosity, negligible development of secondary porosity, low
rainfall, desaturation of weathered zone and urbanization.
Geo-genic pollution (Fluoride)
Higher concentration of fluoride in ground water is attributed due to source rock, rock
water interaction where acid-soluble fluoride bearing minerals (fluorite, fluoro-
apatite) gets dissolved under alkaline conditions.
Higher residence time of ground water in deeper aquifer.
Anthropogenic pollution (Nitrate)
Higher concentration is due to unscientific sewage disposal of treated and untreated
effluents in urban and rural areas.Use of NPK fertilizers and nitrogen fixation by
leguminous crops.

34
6. MANAGEMENT STRATEGIES
High dependence on groundwater coupled with absence of augmentation measures has led to
a steady fall in water levels and desaturation of weathered zone in some parts, raising
questions on sustainability of existing groundwater structures, food and drinking water
security. The occurrence of fractures is very limited in extent, as the compression in the rock
reduces the opening of fractures at depth and the majority of fractures occur within 100 m
depth (75%) (Fig.3.7). Higher NO3- concentrations (> 45 mg/L) in weathered zone is due to
sewage contamination and higher concentration of F- (>1.5 mg/L) in weathered zone and
fractured zone is due to local geology (granite/gneiss rock), high weathering, longer
residence time and alkaline nature of groundwater.
6.1 Management plan
The uneven distribution of groundwater availability and its utilization indicates that a single
management strategy cannot be adopted and requires integrated hydrogeological aspects
along with socio-economic conditions to develop appropriate management strategy.
In the district 72789 MCM of unstaturated volume (below the depth of 5 m) is avaialable
during post-monsoon season having 1455 MCM of recharge potential (2%). This can be
utilized for implementing management strategy.
The study suggests notable measures for sustainable groundwater management, which
involves a combination of various measures given below. State Governments initiatives in
groundwater recharge were also considered.
1. Supply side measures
2. Demand side measures
3. Regulatory measures
4. Institutional measures
6.1.1 Supply side measures:
Ongoing Projects
6.1.1.1 Repair Renovation and Restoration of existing tanks (Mission Kakatiya):
De-silting of existing minor tanks (4930 no) was taken under state Govt. sponsored
Mission Kaktiya-Phase-1, Phase-2, Phase-3 and Phase-4 to remove 12.08 MCM of
silt and this has created additional surface storage. This will contribute ~ 4 MCM to

35
groundwater and with this additional ~500 ha land can be brought under irrigated dry
(ID) crops in tank ayacut.
There is need to take remaining tanks (~826 MI tanks) in next phases for de-silting,
this will greatly help in stabilisation of tank ayacut and ground water augmentation.
6.1.1.2 Mission Bhagiratha:
Under Telangana Drinking Water Supply Project (TDWSP) also known as Mission
Bhagiratha, all the villages and towns are proposed to be covered from the water grid
with intake from Manjira river at Singur (Segment-8, 9 and 10A) covering entire
district to provide protected water from surface reservoirs. The scheme is to enhance
the existing drinking water scheme and to provide 100, 135 and 150 lpd/person of
water in rural, municipal and municipal corporation respectively.
The total water requirement as per 2011 census is 110 MCM and this imported water
from surface sources will reduce the present utilized ~66 MCM of ground water
(considering 60 lpcd). This can be effectively utilized to irrigate ~11000 ha of
additional land under ID crops.
6.1.1.3 Artificial Recharge structures:
Construction of 2927 artificial recharge structures (ARS) 673 in priority-1 (over-exploited)
and 2254 in priority-2 (other areas) are suggested by following standard methodology.
While formulating the village wise groundwater management plan, the unsaturated volume of
aquifer is estimated by multiplying the area with specific yield and unsaturated thickness
(post-monsoon water levels below 5 m). Initially village wise dynamic groundwater
resources of 2017 are considered (Fig.4.1). Potential surface run off is estimated by following
standard procedures. On conservative side 20% run off yield is considered as non-committed
yield for recommending artificial recharge structures in intermittent areas 50% of yield is
considered and remaining 50% is recommended for implementing water conservation
measures in recharge areas through MGNREGS.
The pre-monsoon groundwater quality is considered for categorising contaminated area (F
>1.5 mg/l & EC >3000 µ S/cm). Nitrate is not considered here because it is point source
pollution and localized. Based on above criteria, the area is prioritized into Priority-1
(over-exploited) which needs immediate intervention and Priority-2. Based on

36
hydrogeological characteristics, the area is further sub-divided into following 8 categories
(Table-6.1).
Table-6.1: Hydrogeological characteristics of area.
Category Hydrogeologic characterizations
1 High EC with additional scope for artificial recharge.
2 High EC with no additional scope for artificial recharge.
3 High F with additional scope for artificial recharge.
4 High F with no additional scope for artificial recharge.
5 High EC and F with additional scope for artificial recharge.
6 High EC and F with no additional scope for artificial recharge.
7 Groundwater quality within permissible limits for drinking and irrigation with scope for artificial recharge.
8 Groundwater quality within permissible limits for drinking and irrigation with no
scope for artificial recharge.
Priority-1 (Area where groundwater development > 100 %)
Area consisting of 457 villages covering ~2580 Km2 (Fig.6.1) is considered as Priority-1
where 373 MCM recharge potential and 95 MCM utilizable yield is avaialable. This requires
immediate intervention as the stage of groundwater development is > 100%. For sustainable
development and management of the groundwater resources the following recommendations
are made and summarised in Annexure-1.
1076 artificial recharge structures (557 CD’s and 519 mini PT’s) exist in the area.
In addition to the existing structures, 673 artificial recharge structures (220 CD’s with
shafts and 453 mini PT’s with shafts) with a total cost of 123 crores (@ 15 Lakh/CD
and 20 Lakh/PT) can be taken up.
After effective utilization of this yield, there will be 14 MCM of ground water
recharge with new structures.
All existing artificial recharge structures are to be desilted and maintained properly.

37
Roof top rainwater harvesting structures should be made mandatory to all
Government buildings (new and existing).
Fig.6.1: Priority-1 area (Over-exploited)
Priority-2 (Area where groundwater development <100 %)
Area consisting of 808 villages with ~6531 Km2 rechargable area (Fig.6.2) is considered as
Priority-2, where 1083 MCM recharge potential and 289 MCM utilizable yield is avaialable.
For sustainable development and management of groundwater resources, the
recommendations are made and summarised in Annexure-II.

38
Fig.6.2: Priority-2 area.
1098 artificial recharge structures (670 CD’s and 428 mini PT’s) exist in the area.
In addition to the existing structures, 2254 artificial recharge structures (ARS) (1006
CD’s with shafts and 1248 mini PT’s with shafts) can be taken up with a cost estimate
of 400 crores.
After effective utilization of this yield, there will be 55 MCM of ground water
recharge with new structures.
All existing artificial recharge structures are to be desilted and maintained properly.
Roof top rainwater harvesting structures should be made mandatory to all
Government buildings.

39
6.1.1.4 Other supply side measures:
Existing ARS like percolation tanks and check dams and dried dug wells can be de-
silted involving people’s participation through the Mahatma Gandhi National Rural
Employment Guarantee Scheme (MGNREGS) (NREGA 2005). This will also help in
sustainable management of groundwater resources.
Some of de-silted tanks along river Manjira and river Godavari may be filled up with
river water during lean monsoon period.
6.1.1.5 Water Conservation Measures (WCM) (Farm Ponds):
The farm ponds are the ideal water conservation structures, which are constructed in
the low lying areas of the farm. The size of form ponds can be 10 x 10 x 3 m. In the
district total 994 farm ponds exist in 197 villages and additional 24306 farm ponds are
recommended (20 in each village in 1257 villages) with total cost of 60.76 crores.
6.1.2 Demand side measures: In order to manage the available resources more effectively
the following measures are recommended.
6.1.2.1 Ongoing Work
In the area till date drip and sprinklers are sanctioned for ~40954 ha under ID crops
saving ~122 MCM of groundwater from the basin.
6.1.2.2 Proposed Work
~62,850 ha of additional land that can be brought under micro-irrigation (@50
ha/village in 1257 villages) costing about 377 crores (considering 1 unit/ha @0.6
lakh/ha). With this 188 MCM of ground water can be conserved over the traditional
irrigation practices (considering 0.003 MCM/ha for ID crops against 0.006 MCM/ha).
Change in cropping pattern from water intensive paddy/spices (turmeric) to irrigated
dry crops like pulses and oil seeds are recommended, particularly in water
stress/Over-exploited/Critical areas. If necessary some regulatory rules may be
framed and implemented.
Paddy cropping area is to be reduced as it is increasing by 3331 Ha/Yr, creating
additional stress of 36.6 MCM/Yr on ground water.

40
To avoid the interference of cone of depression between the productive wells,
intermittent pumping of bore wells is recommended through regulatory mechanism.
Power supply should be regulated by giving power in 4 hour spells two times a day in
the morning and evening by the concerned department so that pumping of the bore
well is carried out in phased manner to allow recuperations of the aquifer and increase
sustainability of the bore wells.
As a mandatory measure, every groundwater user should recharge rainwater through
artificial recharge structures in proportionate to the extraction.
6.1.3 Impact of Kaleshwaram Project: The Kaleshwaram project command area covers 7
districts with 95 mandals covering 1581 villages, to create an additional ayacut of 18.25 lakh
acres of land in Telangana state. Medak district will be highly benifited as most of the area in
the district fall under command area.
The ongoing Kaleshwaram project is proposed to create ~275784 Ha ayacut, which can
irrigate ~55% of cropped area in the district.
With the implementation of proposed project, additional ground water recharge will
take place due to infiltration form tank storage, canal seepage and return irrigation.
The proposed project will also help in reducing stress on ground water and increasing
the water table wherever they are deep.
The Kaleshwaram project, apart from directly irrigating 2.75 lakh Ha, aims to
recharge groundwater by filling tanks, and other water bodies.
Continuous supply of water to willage tanks and other water bodies will replenish the
ground water significantly.
Strict implementation of Conjunctive use of surface and ground water is needed to
reduce the stress on ground water.

41
Fig- 6.3: Kaleshwaram Project proposed command area
If 55% of the paddy cropped area of the district is irrigated by Kaleshwaram project water, it can substitute ~557 MCM of irrigation requirements and similarly reduce stress on groundwater.The impact of Kaleshwaram project will be more than the proposed interventions for ground water management.
6.1.4 Other measures
Declaration of Minimum Support Price in advance (before start of season) and improved facilities at procurement centres.
Subsidy/incentives on cost involved in sharing of groundwater may be given to the concerned farmers.
A participatory groundwater management (PGWM) approach in sharing of
groundwater resources and monitoring on a constant basis along with effective
implementation of the existing ‘Water, Land and Trees Act’ of 2002 (WALTA-2002)
are the other measures suggested. Subsidy/incentives on cost involved in sharing of
groundwater may be given to the farmers involved.
In urban and rural areas the sewerage line should be constructed to arrest leaching of
nitrate.

42
6.2 Expected Results and Out come
With the above interventions costing Rs 961 crores (excluding the cost involved in Mission
Kakatiya and Mission Bhagiratha), the likely benefit would be the net saving of 327 MCM of
ground water. This will bring down the stage of ground water development by 17% (from
74% to 57%). The other benefits will be more distribution of income among farmers. The
onetime cost will be ~3paisa/litre (Rs 27 /m3 of ground water).
Acknowledgment
The author thanks Sri K.C.Naik, Chairman, Dr.E.Sampath Kumar, Member (South), of the
Central Ground Water Board, Govt. of India, Sri D.Subba Rao, Regional Director, Dr. P. N.
Rao and GRC Reddy of CGWB, for their encouragement and guidance. The author
acknowledges State Ground Water Department and Rural Water Supply department, Govt of
Telangana for making available of field data. Author also thanks the Executive Engineer and
his drilling crew of CGWB, for carrying out the exploration activity.

Proposed supply side interventions in Priority–I area Annexure-I
S.No Mandal Village Area [Sq.Km]
EC Microsiemens/ cm
F mg/L
Volume of Runoff considered for Recharge MCM
Proposed CDs
Proposed PTs
Total Cost (Lakh Rs)
1 Andole Brahampally 2.08 1050 0.8 0.030 0 3 60
2 Andole Kansanpally 4.46 1075 1 0.065 1 2 55
3 Andole Rollapahad 3.14 675 1.6 0.046 1 0 15
4 Andole S.R.M.Pally 2.58 1075 1 0.038 0 3 60
5 Chegunta Ananthsagar 4.84 800 1.5 0.066 0 2 40
6 Chegunta Ibrahimpur 20.70 1000 1 0.281 3 0 45
7 Chegunta Kasanpally 3.65 675 1.2 0.050 0 1 20
8 Chegunta Polampally 3.74 875 1.4 0.051 1 1 35
9 Chegunta Pothampally 5.27 625 1.3 0.072 0 3 60
10 Chegunta Rampur 9.02 750 1.3 0.122 1 4 95
11 Chegunta Reddipally 4.43 850 1.5 0.060 0 2 40
12 Chegunta Rukmapur 3.92 850 1.4 0.053 0 1 20
13 Chegunta UlliThimmaipally 2.54 825 1.5 0.034 0 3 60
14 Chegunta Valbbhapur 4.69 900 1.2 0.064 1 2 55
15 Chinnakodur Gangapur 7.05 875 0.8 0.038 0 1 20
16 Chinnakodur Jakkapur 22.69 700 1.1 0.122 1 2 55
17 Doulthabad Arepally (S.J) 3.38 775 0.8 0.031 0 1 20
18 Doulthabad ChinnaMasanpally 2.19 600 0.8 0.020 0 2 40
19 Dubbak Cheekode 23.29 1450 0.6 0.211 2 2 70
20 Dubbak Habisipur 9.97 800 1 0.090 1 0 15
21 Dubbak Hasan Mirapur 3.21 1350 1 0.029 0 1 20
22 Dubbak Pothareddypet 18.65 1125 1 0.169 2 0 30
23 Dubbak Rajakkapet 4.25 1175 1.5 0.038 0 1 20
24 Hathnura Chanadapur 4.11 550 1.2 0.052 1 0 15
25 Hathnura Cheekmaddur 4.48 1000 0.9 0.057 1 2 55
26 Hathnura Devulapalli 3.37 825 1.5 0.042 1 0 15
27 Hathnura Gundlamachanur 8.49 1325 1.1 0.107 0 3 60
28 Hathnura Kodapak 5.07 950 1.4 0.064 0 2 40
29 Hathnura Konyal 8.29 1050 1.1 0.104 2 2 70
30 Hathnura Lingapur 4.57 925 0.9 0.058 1 2 55
31 Hathnura Madhura 3.61 950 1.4 0.046 1 0 15
32 Hathnura Malkapur 1.87 525 1.3 0.024 0 2 40
33 Hathnura Nasthipur 3.33 750 1.4 0.042 1 0 15
34 Hathnura Reddykhanapur 7.13 525 1.3 0.090 2 1 50
35 Hathnura Royyapalli 1.74 675 1.4 0.022 0 2 40
36 Hathnura Taherkhanpet 0.91 700 1.2 0.011 0 1 20
37 Jagdevpur AngadiKistapur 4.61 975 1.2 0.028 0 1 20
38 Jagdevpur Kondapur 2.70 1875 1.2 0.016 0 1 20
39 Jagdevpur Rayavaram 4.96 750 1.1 0.030 0 1 20
40 Jagdevpur Vardarajpur 5.44 2250 1.2 0.033 0 1 20

41 Jagdevpur Wattipally 5.83 1475 1.4 0.035 0 3 60
42 Jharasangam Bardipur 4.11 950 0.3 0.041 1 0 15
43 Jharasangam Bopanpalle 4.31 975 0.4 0.043 1 0 15
44 Jharasangam Boregaon 5.94 950 0.4 0.059 1 2 55
45 Jharasangam Islampur 2.88 875 0.5 0.028 0 3 60
46 Jharasangam Jharsangam 6.02 1000 0.3 0.059 1 2 55
47 Jharasangam Krishnapur 3.19 950 1.1 0.032 0 3 60
48 Jharasangam Kuppanagar 10.64 1050 0.3 0.105 2 2 70
49 Jharasangam Medpalle 5.95 1125 0.3 0.059 1 2 55
50 Jharasangam Pyarawaram 2.62 1025 0.4 0.026 0 2 40
51 Jinnaram Amdoor 7.84 1375 0.6 0.099 1 2 55
52 Jinnaram Anantharam 4.26 950 0.5 0.054 1 1 35
53 Jinnaram Madhavaram 4.36 1225 1.1 0.055 1 1 35
54 Jinnaram Palem 1.24 1025 1.2 0.016 0 1 20
55 Jinnaram Puttuguda 2.79 1325 1 0.035 0 3 60
56 Kalher Bachepally 15.77 1375 1.3 0.169 4 1 80
57 Kalher Gosaipally 0.88 875 0.7 0.009 0 1 20
58 Kalher Kalher 12.70 850 1.5 0.136 3 1 65
59 Kalher Malharpur 0.90 1875 0.5 0.010 0 1 20
60 Kalher Mardi 11.73 900 1.2 0.126 2 4 110
61 Kalher Masanpally 4.48 825 1.5 0.048 1 1 35
62 Kalher Meerkhanpet 4.80 1050 0.9 0.051 1 1 35
63 Kalher Nagdhar 23.03 1575 0.8 0.247 5 4 155
64 Kalher Raparthy 12.23 1050 0.9 0.131 3 1 65
65 Kangti Banswada 6.06 1150 0.5 0.060 1 0 15
66 Kangti Jumgi.B. 7.09 1175 0.4 0.070 1 0 15
67 Kangti Jumgi.K 4.37 1175 0.4 0.043 1 0 15
68 Kangti Tadkal, 10.94 1200 0.4 0.108 2 3 90
69 Kangti Valmoor 3.71 1175 0.4 0.037 0 3 60
70 Kondapak Mangole 8.26 1075 1.4 0.035 0 1 20
71 Kondapak Marpadga 29.89 1550 1.1 0.126 0 2 40
72 Kondapak Mathpalle 4.70 1100 1.4 0.020 0 1 20
73 Kondapak Singaram 4.65 925 1.1 0.020 0 1 20
74 Kondapur Garakurthy 5.01 1775 0.7 0.037 0 3 60
75 Kondapur Girmapur 1.83 1400 0.7 0.014 0 1 20
76 Kondapur Gopularam 1.87 1350 0.6 0.014 0 1 20
77 Kondapur Haridaspur 3.27 800 0.7 0.024 0 2 40
78 Kondapur Mallepally 5.37 1075 0.8 0.040 1 0 15
79 Kowdipally Antharam 3.36 1075 0.6 0.052 1 1 35
80 Kowdipally Chandur 7.61 1075 1 0.119 2 3 90
81 Kowdipally Gangavaram 3.74 925 0.7 0.058 1 2 55
82 Kowdipally Jaggampet 4.13 975 0.7 0.064 1 2 55
83 Kowdipally Kanchanpalli 10.62 700 1 0.166 0 4 80
84 Kowdipally Kannaram 5.73 1125 0.5 0.089 2 1 50
85 Kowdipally Kowdipally 2.01 1125 0.5 0.031 0 3 60

86 Kowdipally Md. Nagar 8.53 1150 0.5 0.133 3 1 65
87 Kowdipally Mutturajpally 5.80 850 0.7 0.090 2 1 50
88 Kowdipally Seri Faizabad 1.04 1000 0.6 0.016 0 1 20
89 Kowdipally Tunki 10.96 1125 0.8 0.171 0 1 20
90 Kulcharam Appajipally 0.84 1400 0.9 0.009 0 1 20
91 Kulcharam Ch.Ghanapur 14.29 1125 1 0.153 3 3 105
92 Kulcharam Paithra 7.88 1075 0.8 0.085 2 0 30
93 Kulcharam Rangampet 8.19 725 0.8 0.088 2 1 50
94 Kulcharam Thukkapur 2.17 1175 0.8 0.023 0 2 40
95 Kulcharam Tummaipally 1.76 625 1.2 0.019 0 2 40
96 Manoor Dawoor 6.39 400 0.5 0.063 1 2 55
97 Manoor Dosapally 4.40 400 0.5 0.043 1 0 15
98 Manoor Keshwar 4.82 550 0.5 0.048 1 1 35
99 Manoor Maqudumpur 5.10 525 1.3 0.050 1 1 35
100 Manoor Pusalpad 5.97 525 0.5 0.059 1 2 55
101 Manoor Thumnoor 3.48 500 1.3 0.034 0 3 60
102 Medak Aurangabad 4.03 900 0.9 0.063 1 2 55
103 Medak Byathole 4.75 1275 0.9 0.074 0 3 60
104 Medak Fareedpur 4.69 675 1 0.073 0 3 60
105 Medak Komtoor 2.52 1375 1.2 0.039 1 0 15
106 Medak Lingasanpally 4.23 1175 0.9 0.066 0 2 40
107 Medak Maddulwai 1.99 875 0.9 0.031 0 3 60
108 Medak Maqdumpur 4.05 2150 0.7 0.063 0 2 40
109 Medak Pashapur 1.75 1750 1.4 0.027 0 2 40
110 Medak Shalipet 2.70 925 0.9 0.042 1 0 15
111 Mirdoddi Chepial 12.89 1200 0.8 0.127 0 2 40
112 Mulugu Achaipally 2.44 575 2.3 0.018 0 2 40
113 Mulugu Bahilampur 4.71 575 3.3 0.035 0 1 20
114 Mulugu Bandamailaram 5.44 450 0.8 0.041 1 0 15
115 Mulugu Cheelasagar 15.75 475 2.9 0.118 0 3 60
116 Mulugu ChinnaThimmapur 2.84 575 2.5 0.021 0 2 40
117 Mulugu Kothur 4.74 500 1.3 0.035 0 3 60
118 Mulugu Laxmakkapally 2.89 700 2.2 0.022 0 2 40
119 Mulugu Narsapur 1.94 600 2.2 0.015 0 1 20
120 Mulugu Singannaguda 2.65 550 2 0.020 0 2 40
121 Mulugu Srirampur 1.74 575 2.2 0.013 0 1 20
122 Munipally Magdempally 1.40 1450 0.5 0.014 0 1 20
123 Munipally Takkadpally 2.47 750 1.1 0.024 0 2 40
124 Nanganur Palamukula 11.99 1425 1.7 0.081 1 0 15
125 Narayankhed Allapur 2.58 650 0.6 0.028 0 2 40
126 Narayankhed Anthwar 2.26 1500 0.5 0.024 0 2 40
127 Narayankhed Bhanapur 0.89 1625 0.4 0.010 0 1 20
128 Narayankhed Gangapur 10.60 1025 0.6 0.114 2 3 90
129 Narayankhed Jagannathpur 1.85 1250 0.4 0.020 0 2 40
130 Narayankhed Jujalpur 1.42 1300 0.4 0.015 0 1 20

131 Narayankhed Kondapur 4.62 1600 0.5 0.050 1 1 35
132 Narayankhed Mansurpur 2.61 1500 0.5 0.028 0 2 40
133 Narayankhed Narsapur 3.67 2175 0.5 0.039 1 0 15
134 Narayankhed Paidipally 3.59 1150 0.8 0.039 0 3 60
135 Narayankhed Ryakal 1.51 1125 0.6 0.016 0 1 20
136 Narayankhed Sanjeevanraopet 12.57 1600 0.6 0.135 3 1 65
137 Narayankhed Venkatapur 2.27 1800 0.5 0.024 0 2 40
138 Narsapur Admapur 6.58 1200 1 0.089 2 1 50
139 Narsapur Awancha 3.27 1050 0.8 0.044 1 0 15
140 Narsapur CC.Kunta 5.87 975 0.7 0.080 2 0 30
141 Narsapur Chippalthurthi 6.08 1300 1 0.082 2 0 30
142 Narsapur Gollapally 1.76 925 0.7 0.024 0 2 40
143 Narsapur Ibrahimabad 7.98 1025 1 0.108 2 3 90
144 Narsapur Jakkapally 3.34 1300 1 0.045 1 0 15
145 Narsapur K.Maddur 4.78 1000 1.4 0.065 0 2 40
146 Narsapur Kondapur 2.00 975 0.9 0.027 0 2 40
147 Narsapur Mohammadabad 4.09 1300 1 0.056 1 1 35
148 Narsapur Moosapet 6.31 1200 0.9 0.086 2 0 30
149 Narsapur Nagulapally 4.67 1225 0.9 0.063 0 1 20
150 Narsapur R.C.Pur 2.48 1075 0.8 0.034 0 1 20
151 Narsapur Reddypally 4.00 1475 0.7 0.054 1 1 35
152 Narsapur Rustumpet 6.34 1375 0.9 0.086 1 0 15
153 Narsapur Tujalpur 6.70 750 0.8 0.091 2 1 50
154 Narsapur Tuljarampet 1.03 1100 0.8 0.014 0 1 20
155 Narsapur Yellapur 3.39 1150 0.9 0.046 0 1 20
156 Nyalkal Ameerabad 4.13 575 0.4 0.041 1 0 15
157 Nyalkal Atnur 4.80 925 0.8 0.047 1 1 35
158 Nyalkal Basanthpur 2.90 350 0.3 0.029 0 3 60
159 Nyalkal Chalki 8.23 500 0.4 0.081 2 0 30
160 Nyalkal Cheekurthi 8.31 675 0.5 0.082 2 0 30
161 Nyalkal Chingepally 6.75 900 0.7 0.067 1 2 55
162 Nyalkal Dappur 11.04 750 0.6 0.109 2 3 90
163 Nyalkal Gangwar 3.92 325 0.3 0.039 0 3 60
164 Nyalkal Ganjoti 6.53 575 0.7 0.065 1 2 55
165 Nyalkal Humnapur 2.97 500 0.4 0.029 0 3 60
166 Nyalkal Hussain nagar 8.39 700 0.5 0.083 2 0 30
167 Nyalkal Kakaijanwada 5.02 475 0.4 0.050 1 1 35
168 Nyalkal Khaleelpur.M 3.84 425 0.3 0.038 0 3 60
169 Nyalkal Malgi 7.20 675 0.5 0.071 1 3 75
170 Nyalkal Malkanpahad. 1.42 350 0.4 0.014 0 1 20
171 Nyalkal Mamidgi 10.04 350 0.4 0.099 2 2 70
172 Nyalkal Mariampur 7.19 750 0.5 0.071 1 3 75
173 Nyalkal Metalkunta 6.92 325 0.3 0.068 1 3 75
174 Nyalkal Mirzapur.B. 3.51 400 0.3 0.035 0 3 60
175 Nyalkal Mirzapur-N 3.65 1075 0.4 0.036 0 3 60

176 Nyalkal Mungi 8.47 700 0.4 0.084 2 0 30
177 Nyalkal Murthuzapur 4.14 475 0.4 0.041 1 0 15
178 Nyalkal Naimatabad 6.71 325 0.4 0.066 1 2 55
179 Nyalkal Nyalkal 14.15 1025 0.8 0.140 3 2 85
180 Nyalkal Raghapur 4.92 575 0.4 0.049 1 1 35
181 Nyalkal Rajola 4.05 375 0.4 0.040 1 0 15
182 Nyalkal Ramtirth 5.03 650 0.8 0.050 1 1 35
183 Nyalkal Ratnapur 8.92 725 0.5 0.088 2 1 50
184 Nyalkal Rukmapur 3.69 425 0.4 0.036 0 3 60
185 Nyalkal Shamshallapur 4.74 525 0.5 0.047 1 1 35
186 Papannapet Ablapur 2.72 1450 1.3 0.032 0 3 60
187 Papannapet Annaram 5.93 1425 0.9 0.069 1 3 75
188 Papannapet Doulapur 5.19 1725 1.2 0.060 1 2 55
189 Papannapet Ellapur 4.34 2625 0.6 0.050 1 1 35
190 Papannapet Enkepally 2.58 1325 0.8 0.030 0 3 60
191 Papannapet Kothapally 3.61 1925 1.2 0.042 1 0 15
192 Papannapet Lingaipally 9.53 1900 1.2 0.111 2 3 90
193 Papannapet Minpur 4.26 1925 1.4 0.050 1 1 35
194 Papannapet Muddapur 1.63 1400 1.1 0.019 0 2 40
195 Papannapet Nagsanpally 13.25 1275 1 0.154 3 3 105
196 Patancheru Bachaguda 2.31 2200 0.9 0.021 0 2 40
197 Patancheru Chitkul 8.48 2225 1 0.077 2 0 30
198 Patancheru Chitkul 8.48 2225 1 0.077 2 0 30
199 Patancheru Ilapur 5.11 1125 1.1 0.046 1 1 35
200 Patancheru Kardanur 3.93 800 1.1 0.036 0 3 60
201 Patancheru Pocharam 5.12 1900 1 0.046 1 1 35
202 Pulkal Gangojipet 3.01 650 0.7 0.030 0 3 60
203 Pulkal Kudur 5.88 525 0.9 0.058 1 2 55
204 Pulkal Pulkal 10.34 450 0.9 0.102 2 2 70
205 Raikode Chimnapur 3.25 1075 0.3 0.035 0 3 60
206 Raikode Dharmapur 6.01 925 0.3 0.065 1 2 55
207 Raikode Hasnabad 9.93 925 0.8 0.107 2 3 90
208 Raikode Itkepally 7.36 625 0.9 0.079 2 0 30
209 Raikode Jamalpur 2.35 750 0.8 0.025 0 2 40
210 Raikode Khudavandapur 5.86 925 0.9 0.063 1 2 55
211 Raikode Kodoor 9.81 975 0.9 0.105 2 2 70
212 Raikode Madhapur 1.42 850 0.6 0.015 0 1 20
213 Raikode Mahabhatpur 2.80 800 0.7 0.030 0 3 60
214 Raikode Mamidipally 4.98 1125 0.4 0.053 1 1 35
215 Raikode Moratga 2.75 1125 0.4 0.029 0 3 60
216 Raikode Musthafapur 2.36 1050 0.5 0.025 0 2 40
217 Raikode Naganpally 6.54 975 0.5 0.070 1 3 75
218 Raikode Nagwar 5.31 800 0.5 0.057 1 2 55
219 Raikode Pampad 8.15 675 1.4 0.088 2 0 30
220 Raikode Shapur 2.69 725 1.1 0.029 0 3 60

221 Raikode Singitham 16.49 825 0.4 0.177 4 1 80
222 Raikode Yenkepally 2.95 875 0.5 0.032 0 3 60
223 Raikode Yousufpur 5.62 875 0.3 0.060 1 2 55
224 Ramayampet Laxmapur 4.51 1725 0.8 0.030 0 3 60
225 Ramayampet Nandigaon 5.51 1400 0.9 0.037 0 1 20
226 RC Puram Bandalguda 1.37 1225 1.1 0.011 0 1 20
227 RC Puram E.N.pally 5.32 575 0.7 0.044 1 0 15
228 RC Puram Osman Nagar 2.97 825 1.2 0.024 0 2 40
229 RC Puram Tellapur 12.84 875 1.2 0.106 2 3 90
230 Regode M.Venkatapur 2.26 750 0.9 0.022 0 2 40
231 Regode Sinddole 0.97 625 2.4 0.010 0 1 20
232 Sadasivpet Enkepally 3.49 1325 1.1 0.029 0 3 60
233 Sadasivpet Istritabad 1.95 1625 0.9 0.016 0 1 20
234 Sadasivpet Kambalpally 3.31 1100 0.7 0.027 0 1 20
235 Sadasivpet Rejintal 4.12 1325 0.7 0.034 0 3 60
236 Sadasivpet Siddapur 5.30 1800 0.8 0.044 1 0 15
237 Sangareddy Chiduruppa 6.03 1775 0.6 0.045 1 0 15
238 Sangareddy Irrigipally 2.48 750 0.9 0.019 0 2 40
239 Sangareddy Kashipur 2.54 500 1.1 0.019 0 1 20
240 Sangareddy Mamidipally 6.63 1600 1.4 0.050 1 1 35
241 Shankarampet-A Moosapeta 1.79 1400 1.3 0.021 0 2 40
242 Shankarampet-R Kaslapur 2.03 950 0.9 0.028 0 2 40
243 Shankarampet-R Siripally 2.58 1075 1 0.035 0 3 60
244 Shivampet Bijilipur 4.77 800 0.8 0.051 1 1 35
245 Shivampet Chennapur 2.18 1650 0.8 0.023 0 2 40
246 Shivampet Gangaipally 3.53 750 0.7 0.038 0 3 60
247 Shivampet Gomaram 7.60 925 1.1 0.082 1 0 15
248 Shivampet Gundlapalli 4.79 900 0.5 0.051 1 1 35
249 Shivampet Lingojigudam 1.54 975 0.8 0.017 0 1 20
250 Shivampet PeddaGotimukla 7.60 1350 0.9 0.082 2 0 30
251 Shivampet Shivampet 8.11 1975 0.5 0.087 2 0 30
252 Shivampet Usrikapally 5.65 1825 0.8 0.061 0 2 40
253 Siddipet Narayanraopet 24.66 725 2.2 0.150 1 1 35
254 Tekmal Achannapally 3.46 1450 0.9 0.031 0 3 60
255 Tekmal Malkapur 1.76 625 1.5 0.016 0 1 20
256 Thoguta Lingapur 8.52 725 0.8 0.064 1 0 15
257 Thoguta Zapthilingareddipally 4.62 975 1 0.035 0 1 20
258 Toopran Dharmarajpally 1.48 825 0.4 0.011 0 1 20
259 Toopran Gundareddypalli 8.39 1375 1.1 0.063 1 2 55
260 Toopran Hussainpur 1.27 2475 0.4 0.010 0 1 20
261 Toopran Imanpur 2.39 1575 0.8 0.018 0 2 40
262 Toopran Konaipally (PT) 1.92 850 0.4 0.014 0 1 20
263 Toopran Kondapur 2.97 475 0.9 0.022 0 2 40

264 Toopran Muppireddipally 3.65 525 0.4 0.027 0 2 40
265 Toopran Nagulapally 3.25 1625 0.6 0.024 0 2 40
266 Toopran Padalpally 2.20 2350 0.7 0.016 0 1 20
267 Toopran Ramaipally 2.03 1600 0.7 0.015 0 1 20
268 Toopran Ravelly 4.78 1775 1.4 0.036 0 3 60
269 Toopran Venkatapally 3.09 1975 0.9 0.023 0 2 40
270 Toopran Venkatapur 8.70 600 0.5 0.065 1 2 55
271 Wargal Amberpet 1.80 3925 0.7 0.012 0 1 20
272 Wargal Ananthagiripalle 6.22 2300 0.6 0.042 1 0 15
273 Wargal Chandapur 3.40 3825 0.6 0.023 0 2 40
274 Wargal Girmapur 2.38 5175 0.7 0.016 0 1 20
275 Wargal Gouraram 7.33 5300 1.1 0.050 1 1 35
276 Wargal Jabbapur 3.04 4800 0.8 0.021 0 2 40
277 Wargal Majidpally 6.32 4225 0.7 0.043 1 0 15
278 Wargal Nemtoor 13.18 4875 0.7 0.089 2 1 50
279 Wargal Pamulaparthi 21.41 1175 2.4 0.145 1 0 15
280 Wargal Ramachandrapur 1.31 2125 0.5 0.009 0 1 20
281 Wargal Shakaram 3.16 5250 0.7 0.021 0 2 40
282 Wargal Singaipalli 1.68 5225 0.9 0.011 0 1 20
283 Wargal Sitarampalle 1.31 3225 0.6 0.009 0 1 20
284 Wargal Veluru 11.94 2675 0.5 0.081 2 0 30
285 Wargal Wargal 26.65 6375 0.8 0.180 4 1 80
286 Yeldurthy Domararncha 2.53 575 0.7 0.029 0 2 40
287 Yeldurthy Peddapur 1.07 1650 0.8 0.012 0 1 20
288 Zaheerabad Auranganagar 3.58 375 0.3 0.045 1 0 15
289 Zaheerabad Gousabad 4.91 350 0.3 0.062 1 1 35
290 Zaheerabad Hothi - K 13.37 400 1.1 0.168 3 4 125
291 Zaheerabad Huggelli 13.84 975 1.7 0.174 4 1 80
292 Zaheerabad Hyderabad 4.45 300 0.6 0.056 1 1 35
293 Zaheerabad Raipalle (PD) 3.38 3675 0.8 0.043 1 0 15
294 Zaheerabad Tamadpalle 2.55 600 1.1 0.032 0 3 60
220 453 1236
0

Proposed supply side interventions in Priority–II area Annexure-II
S.No Mandal Village Area [Sq.Km]
EC Microsiemens/cm
F mg/L
Volume of Runoff considered for Recharge MCM
Proposed CDs
Proposed PTs
Total Cost (Lakh Rs)
1 Alladurg Alladurg 9.51 775 0.9 0.11 2 3 90
2 Alladurg Appajipally 5.63 825 1 0.07 1 2 55
3 Alladurg Bairandibba 4.99 725 0.9 0.06 0 2 40
4 Alladurg Bijilipur 4.42 1175 0.6 0.05 0 1 20
5 Alladurg Buddaipally 1.92 1075 0.8 0.02 0 1 20
6 Alladurg Chevella 5.48 725 0.8 0.06 0 2 40
7 Alladurg Chilver 8.41 700 1 0.10 2 2 70
8 Alladurg G.Peddapur 20.90 875 1 0.24 0 3 60
9 Alladurg Gowthapur 3.70 1325 0.6 0.04 1 0 15
10 Alladurg Keroor 4.69 1200 0.7 0.05 0 1 20
11 Alladurg Mahamamdapur 5.75 700 1 0.07 1 3 75
12 Alladurg Marvelli 7.12 1300 0.5 0.08 2 0 30
13 Alladurg Mupparam 6.12 750 0.9 0.07 0 2 40
14 Alladurg Muslapur 11.34 725 1 0.13 0 1 20
15 Alladurg Palwatla 4.84 1350 0.3 0.06 1 1 35
16 Andole Aksanpally 8.16 1075 1 0.12 2 3 90
17 Andole Almaipet 10.38 1100 0.7 0.15 3 3 105
18 Andole Ananthasagar 5.73 475 0.7 0.08 2 0 30
19 Andole Andole 14.18 1250 1 0.21 4 4 140
20 Andole Chinthakunta 7.89 525 1.5 0.11 2 3 90
21 Andole Dakoor 19.89 875 0.9 0.29 6 4 170
22 Andole Danampally 2.20 525 1.2 0.03 0 3 60
23 Andole Jogipet 7.19 1100 1 0.10 2 2 70
24 Andole Kichannapally 1.77 600 1.6 0.03 0 2 40
25 Andole Kodikal 6.18 650 0.8 0.09 2 1 50
26 Andole Mansanpally 4.37 575 1.8 0.06 1 2 55
27 Andole Mansanpally 6.24 1175 1.1 0.09 2 1 50
28 Andole Nadlapur 3.11 825 0.8 0.05 1 0 15
29 Andole Neradigunta 6.68 1075 0.9 0.10 2 2 70
30 Andole Pasanipet 6.01 875 0.9 0.09 2 0 30
31 Andole Ramsanipally 6.32 750 1.4 0.09 0 1 20
32 Andole Saibanpet 5.19 1075 0.8 0.08 1 3 75
33 Andole Sangupet 5.71 1025 0.8 0.08 2 0 30
34 Andole Talelama 9.61 1200 0.8 0.14 3 2 85
35 Andole Thadmanoor 8.66 975 1.1 0.13 2 4 110
36 Andole Yerraram 9.49 925 1 0.14 3 2 85
37 Chegunta Bheemraopally 7.88 850 1.4 0.11 2 3 90
38 Chegunta Bonala 10.13 1075 0.8 0.14 3 2 85
39 Chegunta Chandaipet 8.28 625 1.3 0.11 0 3 60

40 Chegunta Chegunta 4.28 850 1.5 0.06 0 2 40
41 Chegunta Chetlathimmaipally 9.27 525 1.3 0.13 0 4 80
42 Chegunta Chinnashivanoor 7.73 650 1.2 0.10 0 2 40
43 Chegunta Gollapally 5.19 675 1.3 0.07 0 3 60
44 Chegunta Makkarajpet 11.84 625 1.3 0.16 2 3 90
45 Chegunta Narsampally 7.60 900 1 0.10 2 2 70
46 Chegunta Narsingi 10.89 975 1 0.15 3 2 85
47 Chegunta Peddashivanoor 10.93 625 1.3 0.15 1 2 55
48 Chegunta Vallur 5.11 850 1.5 0.07 1 3 75
49 Chegunta Wadiaram 10.13 800 1.4 0.14 1 2 55
50 Doulthabad Appajipally 20.59 2475 0.8 0.19 4 2 100
51 Doulthabad Begumpet 6.10 2750 0.8 0.06 1 1 35
52 Doulthabad Godugupally 7.69 600 1.2 0.07 0 3 60
53 Doulthabad Indupriyal 11.74 625 1 0.11 0 1 20
54 Doulthabad Konapur 3.16 550 0.9 0.03 0 1 20
55 Doulthabad Lingaaarajupally 3.65 675 0.7 0.03 0 1 20
56 Doulthabad Lingareddypally 3.42 675 0.8 0.03 0 1 20
57 Doulthabad Mubaraspur 11.88 525 0.7 0.11 0 1 20
58 Doulthabad Narsampally(P.D) 3.55 625 1.2 0.03 0 3 60
59 Doulthabad Rangumpet 3.64 1450 0.8 0.03 0 3 60
60 Doulthabad Waddepally 14.00 1550 0.9 0.13 2 4 110
61 Doulthabad Yelkal 3.15 2950 0.8 0.03 0 3 60
62 Dubbak Dubbak 24.97 750 1.4 0.23 1 0 15
63 Gajwel Bangal Venkatapur 8.85 3050 0.8 0.07 1 2 55
64 Gajwel Dharamareddypally 9.55 1925 0.8 0.07 0 1 20
65 Gajwel Kyasaram 4.09 650 0.9 0.03 0 1 20
66 Gajwel M.Masanpally 3.49 3900 0.8 0.03 0 2 40
67 Gajwel Sangapur 5.13 3050 0.8 0.04 0 2 40
68 Gajwel Seripally 4.14 750 0.9 0.03 0 1 20
69 Hathnura Borpatla 10.81 575 1.3 0.14 3 1 65
70 Hathnura Chintalcheru 16.35 1450 0.4 0.21 3 4 125
71 Hathnura Govindarajpalli 5.32 950 1.1 0.07 1 3 75
72 Hathnura Hathnoora 17.14 875 1.5 0.22 3 0 45
73 Hathnura Kasala 14.82 675 1.4 0.19 4 2 100
74 Hathnura Mangapur 10.13 875 1.3 0.13 2 4 110
75 Hathnura Naguladevpalli 8.76 1050 1.1 0.11 2 3 90
76 Hathnura Palpanoor 4.15 1000 1.2 0.05 1 1 35
77 Hathnura Panyal 10.75 1200 1.1 0.14 3 1 65
78 Hathnura Sikindarpur 10.81 1150 1.1 0.14 3 1 65
79 Hathnura Sirpuram 19.94 925 0.7 0.25 5 4 155
80 Hathnura Turkalakhanapur 7.18 625 1.2 0.09 1 1 35
81 Hathnura Yellammaguda 8.03 1150 0.9 0.10 2 0 30
82 Jagdevpur Erravalli 11.11 2025 1.4 0.07 0 2 40
83 Jagdevpur Gollapally 7.01 1725 1.3 0.04 1 0 15
84 Jagdevpur Munigadapa 16.21 1525 1.4 0.10 2 2 70

85 Jagdevpur Theegul 35.59 500 0.7 0.22 2 0 30
86 Jharasangam Ananthasagar 2.10 1325 0.5 0.02 0 2 40
87 Jharasangam Bidekanna 12.54 2275 0.9 0.12 2 4 110
88 Jharasangam Chilemamidi 7.03 1125 0.4 0.07 1 3 75
89 Jharasangam Chilkepalle 6.81 3725 0.5 0.07 1 3 75
90 Jharasangam Chillepalle 7.55 900 0.3 0.07 1 3 75
91 Jharasangam Devarampalle 3.35 1050 0.4 0.03 0 3 60
92 Jharasangam Edakulapalle 17.77 900 0.4 0.18 4 1 80
93 Jharasangam Edulapalle 9.87 1775 0.4 0.10 2 2 70
94 Jharasangam Gangapur 2.65 1100 0.3 0.03 0 2 40
95 Jharasangam Giniarpally 4.64 1650 0.4 0.05 1 0 15
96 Jharasangam Guntamarpalle 5.61 850 0.4 0.06 1 1 35
97 Jharasangam Jeerlapalle 6.79 900 0.4 0.07 1 3 75
98 Jharasangam junegaon 3.66 850 0.5 0.04 0 3 60
99 Jharasangam Kakkerwada 6.53 1000 0.3 0.06 1 2 55
100 Jharasangam Kamalpalle 3.31 875 0.4 0.03 0 3 60
101 Jharasangam Kappad 4.13 850 0.4 0.04 1 0 15
102 Jharasangam Kollur 6.30 975 0.3 0.06 1 2 55
103 Jharasangam Machnoor 12.27 925 0.7 0.12 2 4 110
104 Jharasangam Narsapur 2.74 950 0.4 0.03 0 2 40
105 Jharasangam Sangam-K 2.48 975 0.4 0.02 0 2 40
106 Jharasangam Siddapur 4.13 775 0.3 0.04 1 0 15
107 Jharasangam Tummanpalle 3.97 900 0.4 0.04 1 0 15
108 Jharasangam Vanampalle 5.66 925 0.3 0.06 1 1 35
109 Jharasangam Yelgoi 14.35 600 0.3 0.14 3 2 85
110 Jinnaram Annaram 7.82 875 0.8 0.10 2 2 70
111 Jinnaram Bollaram 9.37 925 1.2 0.12 0 3 60
112 Jinnaram Bonthapally 9.30 1000 0.5 0.12 2 3 90
113 Jinnaram Ch.Potharam 2.55 900 1 0.03 0 3 60
114 Jinnaram Dacharam 2.76 775 0.6 0.03 0 3 60
115 Jinnaram Domadugu 5.20 950 0.6 0.07 1 2 55
116 Jinnaram Gaddapotharam 2.44 900 1 0.03 0 3 60
117 Jinnaram Gummadidala 13.12 875 0.4 0.17 3 4 125
118 Jinnaram Jinnaram 14.18 1050 1.1 0.18 4 1 80
119 Jinnaram Kanukunta 21.93 875 0.9 0.28 6 2 130
120 Jinnaram Khajipally 4.95 950 1.1 0.06 1 2 55
121 Jinnaram Kistaipally 3.68 950 1.1 0.05 1 1 35
122 Jinnaram Kodakanchi 8.11 1350 1 0.10 2 2 70
123 Jinnaram Kothapally 5.06 1050 0.8 0.06 0 2 40
124 Jinnaram Laxmapur 4.29 875 0.7 0.05 1 1 35
125 Jinnaram Mambapur 11.05 450 0.8 0.14 3 2 85
126 Jinnaram Mangampet 3.75 925 1.3 0.05 1 1 35
127 Jinnaram Nallapally 8.51 700 0.9 0.11 2 3 90
128 Jinnaram Nalthur 8.43 1125 1.1 0.11 2 3 90
129 Jinnaram Ootla 9.30 925 1.3 0.12 1 3 75
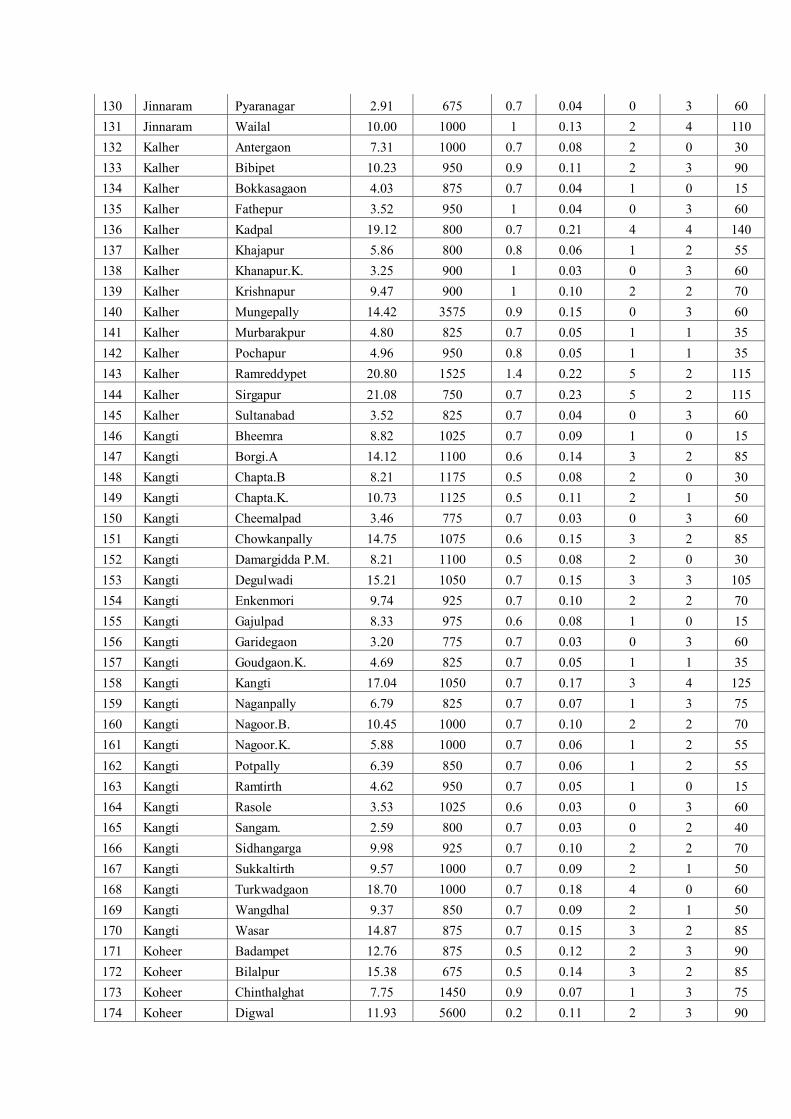
130 Jinnaram Pyaranagar 2.91 675 0.7 0.04 0 3 60
131 Jinnaram Wailal 10.00 1000 1 0.13 2 4 110
132 Kalher Antergaon 7.31 1000 0.7 0.08 2 0 30
133 Kalher Bibipet 10.23 950 0.9 0.11 2 3 90
134 Kalher Bokkasagaon 4.03 875 0.7 0.04 1 0 15
135 Kalher Fathepur 3.52 950 1 0.04 0 3 60
136 Kalher Kadpal 19.12 800 0.7 0.21 4 4 140
137 Kalher Khajapur 5.86 800 0.8 0.06 1 2 55
138 Kalher Khanapur.K. 3.25 900 1 0.03 0 3 60
139 Kalher Krishnapur 9.47 900 1 0.10 2 2 70
140 Kalher Mungepally 14.42 3575 0.9 0.15 0 3 60
141 Kalher Murbarakpur 4.80 825 0.7 0.05 1 1 35
142 Kalher Pochapur 4.96 950 0.8 0.05 1 1 35
143 Kalher Ramreddypet 20.80 1525 1.4 0.22 5 2 115
144 Kalher Sirgapur 21.08 750 0.7 0.23 5 2 115
145 Kalher Sultanabad 3.52 825 0.7 0.04 0 3 60
146 Kangti Bheemra 8.82 1025 0.7 0.09 1 0 15
147 Kangti Borgi.A 14.12 1100 0.6 0.14 3 2 85
148 Kangti Chapta.B 8.21 1175 0.5 0.08 2 0 30
149 Kangti Chapta.K. 10.73 1125 0.5 0.11 2 1 50
150 Kangti Cheemalpad 3.46 775 0.7 0.03 0 3 60
151 Kangti Chowkanpally 14.75 1075 0.6 0.15 3 2 85
152 Kangti Damargidda P.M. 8.21 1100 0.5 0.08 2 0 30
153 Kangti Degulwadi 15.21 1050 0.7 0.15 3 3 105
154 Kangti Enkenmori 9.74 925 0.7 0.10 2 2 70
155 Kangti Gajulpad 8.33 975 0.6 0.08 1 0 15
156 Kangti Garidegaon 3.20 775 0.7 0.03 0 3 60
157 Kangti Goudgaon.K. 4.69 825 0.7 0.05 1 1 35
158 Kangti Kangti 17.04 1050 0.7 0.17 3 4 125
159 Kangti Naganpally 6.79 825 0.7 0.07 1 3 75
160 Kangti Nagoor.B. 10.45 1000 0.7 0.10 2 2 70
161 Kangti Nagoor.K. 5.88 1000 0.7 0.06 1 2 55
162 Kangti Potpally 6.39 850 0.7 0.06 1 2 55
163 Kangti Ramtirth 4.62 950 0.7 0.05 1 0 15
164 Kangti Rasole 3.53 1025 0.6 0.03 0 3 60
165 Kangti Sangam. 2.59 800 0.7 0.03 0 2 40
166 Kangti Sidhangarga 9.98 925 0.7 0.10 2 2 70
167 Kangti Sukkaltirth 9.57 1000 0.7 0.09 2 1 50
168 Kangti Turkwadgaon 18.70 1000 0.7 0.18 4 0 60
169 Kangti Wangdhal 9.37 850 0.7 0.09 2 1 50
170 Kangti Wasar 14.87 875 0.7 0.15 3 2 85
171 Koheer Badampet 12.76 875 0.5 0.12 2 3 90
172 Koheer Bilalpur 15.38 675 0.5 0.14 3 2 85
173 Koheer Chinthalghat 7.75 1450 0.9 0.07 1 3 75
174 Koheer Digwal 11.93 5600 0.2 0.11 2 3 90

175 Koheer Godgarpally Pattiiko 4.95 775 0.5 0.04 1 0 15
176 Koheer Gurujwada 7.46 1025 0.4 0.07 1 3 75
177 Koheer Kaveli 12.74 2450 0.7 0.12 2 3 90
178 Koheer Khanapur 4.73 750 0.4 0.04 1 0 15
179 Koheer Kohir 26.86 1875 0.2 0.24 5 3 135
180 Koheer Kothur D 4.72 900 1.4 0.04 1 0 15
181 Koheer Kothur K. 4.68 750 0.4 0.04 1 0 15
182 Koheer Machireddypally 6.26 850 0.4 0.06 1 2 55
183 Koheer Madri 8.24 2200 0.5 0.07 1 3 75
184 Koheer Maniyarpally 12.17 800 0.5 0.11 2 3 90
185 Koheer Nagireddypally 6.39 500 0.5 0.06 1 2 55
186 Koheer Paidigammail 17.39 500 0.5 0.16 3 3 105
187 Koheer Parsapally 9.06 650 0.4 0.08 2 0 30
188 Koheer Pitcharagadi 13.17 800 0.6 0.12 2 3 90
189 Koheer Rajnelli 3.56 875 0.4 0.03 0 3 60
190 Koheer Sajjapur 5.46 825 0.4 0.05 1 1 35
191 Koheer Venkatapur 8.88 1600 1 0.08 2 0 30
192 Kondapak Kondapak 28.90 1425 1.1 0.12 0 1 20
193 Kondapak Tipparam 8.13 925 1.1 0.03 0 2 40
194 Kondapur Aliabad 4.26 1675 0.6 0.03 0 3 60
195 Kondapur Anathasagar 11.36 1125 0.7 0.08 2 0 30
196 Kondapur Ch. Konapur 5.94 1325 0.6 0.04 1 0 15
197 Kondapur Gadi Malkapur 3.27 1325 0.6 0.02 0 2 40
198 Kondapur Gangaram 8.27 625 0.7 0.06 1 2 55
199 Kondapur Gollapally 8.22 1025 0.8 0.06 1 2 55
200 Kondapur Gunthapally 5.83 975 0.9 0.04 1 0 15
201 Kondapur Kondapur 9.37 1275 0.7 0.07 1 3 75
202 Kondapur Malkapur 12.14 1025 1.2 0.09 2 1 50
203 Kondapur Mansanpally 5.98 1400 0.6 0.04 1 0 15
204 Kondapur Marepally 11.10 1225 0.7 0.08 2 0 30
205 Kondapur Mohamdpur 6.30 850 0.7 0.05 1 1 35
206 Kondapur Munidevunipally 9.21 1425 0.6 0.07 1 3 75
207 Kondapur Qutubshapet 1.83 1100 0.6 0.01 0 1 20
208 Kondapur Terpole 10.93 1950 0.5 0.08 2 0 30
209 Kondapur Togarpally 9.30 1550 0.5 0.07 1 3 75
210 Kowdipally Ajamari 6.52 1025 0.8 0.10 2 2 70
211 Kowdipally Banda Pothigal 4.32 1025 0.8 0.07 0 3 60
212 Kowdipally Bujrampet 13.82 800 0.8 0.22 5 1 95
213 Kowdipally Chilipched 8.14 1225 0.8 0.13 2 4 110
214 Kowdipally Chitkul 8.35 1025 0.9 0.13 3 1 65
215 Kowdipally Devulapalli 5.77 1025 0.6 0.09 2 1 50
216 Kowdipally Dharmasagar 5.18 1075 0.6 0.08 2 0 30
217 Kowdipally Faizabad 9.01 1050 0.7 0.14 3 2 85
218 Kowdipally Gowthapur 9.89 1025 1.2 0.15 3 3 105
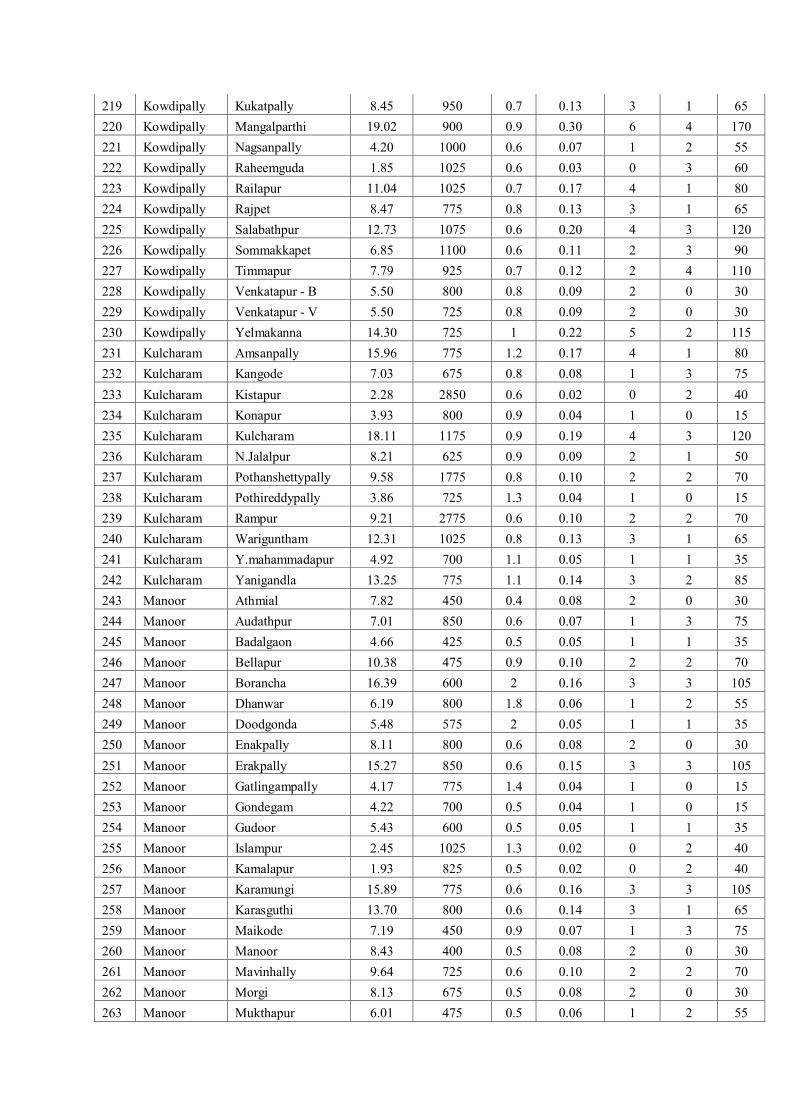
219 Kowdipally Kukatpally 8.45 950 0.7 0.13 3 1 65
220 Kowdipally Mangalparthi 19.02 900 0.9 0.30 6 4 170
221 Kowdipally Nagsanpally 4.20 1000 0.6 0.07 1 2 55
222 Kowdipally Raheemguda 1.85 1025 0.6 0.03 0 3 60
223 Kowdipally Railapur 11.04 1025 0.7 0.17 4 1 80
224 Kowdipally Rajpet 8.47 775 0.8 0.13 3 1 65
225 Kowdipally Salabathpur 12.73 1075 0.6 0.20 4 3 120
226 Kowdipally Sommakkapet 6.85 1100 0.6 0.11 2 3 90
227 Kowdipally Timmapur 7.79 925 0.7 0.12 2 4 110
228 Kowdipally Venkatapur - B 5.50 800 0.8 0.09 2 0 30
229 Kowdipally Venkatapur - V 5.50 725 0.8 0.09 2 0 30
230 Kowdipally Yelmakanna 14.30 725 1 0.22 5 2 115
231 Kulcharam Amsanpally 15.96 775 1.2 0.17 4 1 80
232 Kulcharam Kangode 7.03 675 0.8 0.08 1 3 75
233 Kulcharam Kistapur 2.28 2850 0.6 0.02 0 2 40
234 Kulcharam Konapur 3.93 800 0.9 0.04 1 0 15
235 Kulcharam Kulcharam 18.11 1175 0.9 0.19 4 3 120
236 Kulcharam N.Jalalpur 8.21 625 0.9 0.09 2 1 50
237 Kulcharam Pothanshettypally 9.58 1775 0.8 0.10 2 2 70
238 Kulcharam Pothireddypally 3.86 725 1.3 0.04 1 0 15
239 Kulcharam Rampur 9.21 2775 0.6 0.10 2 2 70
240 Kulcharam Wariguntham 12.31 1025 0.8 0.13 3 1 65
241 Kulcharam Y.mahammadapur 4.92 700 1.1 0.05 1 1 35
242 Kulcharam Yanigandla 13.25 775 1.1 0.14 3 2 85
243 Manoor Athmial 7.82 450 0.4 0.08 2 0 30
244 Manoor Audathpur 7.01 850 0.6 0.07 1 3 75
245 Manoor Badalgaon 4.66 425 0.5 0.05 1 1 35
246 Manoor Bellapur 10.38 475 0.9 0.10 2 2 70
247 Manoor Borancha 16.39 600 2 0.16 3 3 105
248 Manoor Dhanwar 6.19 800 1.8 0.06 1 2 55
249 Manoor Doodgonda 5.48 575 2 0.05 1 1 35
250 Manoor Enakpally 8.11 800 0.6 0.08 2 0 30
251 Manoor Erakpally 15.27 850 0.6 0.15 3 3 105
252 Manoor Gatlingampally 4.17 775 1.4 0.04 1 0 15
253 Manoor Gondegam 4.22 700 0.5 0.04 1 0 15
254 Manoor Gudoor 5.43 600 0.5 0.05 1 1 35
255 Manoor Islampur 2.45 1025 1.3 0.02 0 2 40
256 Manoor Kamalapur 1.93 825 0.5 0.02 0 2 40
257 Manoor Karamungi 15.89 775 0.6 0.16 3 3 105
258 Manoor Karasguthi 13.70 800 0.6 0.14 3 1 65
259 Manoor Maikode 7.19 450 0.9 0.07 1 3 75
260 Manoor Manoor 8.43 400 0.5 0.08 2 0 30
261 Manoor Mavinhally 9.64 725 0.6 0.10 2 2 70
262 Manoor Morgi 8.13 675 0.5 0.08 2 0 30
263 Manoor Mukthapur 6.01 475 0.5 0.06 1 2 55

264 Manoor Nadigadda Hurkrana 5.70 625 0.5 0.06 1 1 35
265 Manoor Nagalgidda 7.42 575 0.5 0.07 1 3 75
266 Manoor Ootpally 6.58 775 0.6 0.07 1 2 55
267 Manoor Pulkurthy 8.89 450 0.4 0.09 2 0 30
268 Manoor Raipally 4.85 1225 0.6 0.05 1 1 35
269 Manoor Ranapur 5.56 475 1.2 0.05 1 1 35
270 Manoor Shaligira 6.33 575 0.5 0.06 1 2 55
271 Manoor Sharidamargidda 9.65 675 0.5 0.10 2 2 70
272 Manoor Shikarkhana 5.97 825 0.6 0.06 1 2 55
273 Manoor Thimmapur 3.01 650 0.5 0.03 0 3 60
274 Manoor Thornal 7.19 550 0.5 0.07 1 3 75
275 Manoor Usrikpally 5.77 1350 0.5 0.06 1 2 55
276 Manoor Vallor 5.56 500 0.5 0.05 1 1 35
277 Manoor Yelgoi 21.91 450 0.4 0.22 5 1 95
278 Manoor Yerraboguda 3.84 625 0.5 0.04 0 3 60
279 Manoor Yesgi 6.29 850 0.6 0.06 1 2 55
280 Medak Ananthasagar 7.29 1325 0.9 0.11 0 3 60
281 Medak Ausulapally 6.09 925 0.8 0.10 2 2 70
282 Medak B.Bhoopathpur 7.24 925 0.9 0.11 0 3 60
283 Medak Balanagar 5.21 700 0.8 0.08 2 0 30
284 Medak Burugpally 30.13 975 0.9 0.47 10 5 250
285 Medak Chityal 13.86 700 0.6 0.22 4 1 80
286 Medak Gangapur 9.83 1525 0.8 0.15 3 3 105
287 Medak Haveli Ghanapur 9.85 975 0.9 0.15 0 3 60
288 Medak Khajipally 10.47 1525 1.3 0.16 3 3 105
289 Medak Kuchenpally 5.26 1200 0.9 0.08 2 0 30
290 Medak M.Bhoopathpur 5.35 1200 1 0.08 2 0 30
291 Medak Medak 30.09 1000 1 0.47 10 5 250
292 Medak Mirugudpally 2.47 925 0.9 0.04 0 3 60
293 Medak Muthaipally 3.99 925 0.9 0.06 0 2 40
294 Medak Nagapur 6.88 1050 0.9 0.11 0 2 40
295 Medak Pathur 12.11 1400 0.8 0.19 4 2 100
296 Medak Peroor 3.21 3275 0.5 0.05 0 1 20
297 Medak Rajpally 7.11 925 0.9 0.11 2 3 90
298 Medak Rajpet 25.84 975 0.9 0.40 5 5 175
299 Medak Rayalamadugu 10.40 2725 0.6 0.16 3 3 105
300 Medak Rayanpally 15.01 1525 0.9 0.23 5 2 115
301 Medak Sardhana 15.93 800 1 0.25 4 4 140
302 Medak Shamnapur 7.50 1475 0.8 0.12 2 3 90
303 Medak Thimmaipally 5.60 1175 0.9 0.09 2 0 30
304 Medak Thogita 11.54 875 0.9 0.18 1 1 35
305 Medak Venkatapur 12.12 1400 1.2 0.19 4 2 100
306 Mirdoddi Mirdoddi 30.41 1100 1 0.30 4 1 80
307 Mirdoddi Mothey 11.42 1075 0.9 0.11 0 1 20

308 Mirdoddi Rudraram 12.72 1300 0.7 0.13 0 2 40
309 Mulugu Banda Thimmapur 3.05 500 1.3 0.02 0 2 40
310 Mulugu Baswapur 3.20 525 1.7 0.02 0 2 40
311 Mulugu Damarakunta 17.31 1575 2 0.13 0 2 40
312 Mulugu Karkapartla 10.83 700 3 0.08 1 0 15
313 Mulugu Kokkkonda 10.83 550 1.8 0.08 2 0 30
314 Mulugu Mulugu 19.24 3200 1.5 0.14 3 2 85
315 Mulugu Narsampally 8.96 375 3.3 0.07 0 3 60
316 Mulugu Tanedarpally 4.13 1225 2.9 0.03 0 1 20
317 Mulugu Tunki Bollaram 11.75 1025 2.1 0.09 2 0 30
318 Mulugu Zapthi singaipally 4.57 525 2.6 0.03 0 3 60
319 Munipally Allapur 2.67 750 1.2 0.03 0 2 40
320 Munipally Antharam 3.89 825 0.5 0.04 0 3 60
321 Munipally Beloor 6.56 900 1.6 0.06 1 2 55
322 Munipally Bodepally 4.47 775 0.9 0.04 1 0 15
323 Munipally Bodishettipally 3.91 900 0.4 0.04 0 3 60
324 Munipally Busareddypally 12.17 750 2.2 0.12 2 4 110
325 Munipally Chellapally 7.17 850 1.6 0.07 1 3 75
326 Munipally Chelmedakurd 8.80 825 0.5 0.09 2 0 30
327 Munipally Chinnachelmada 11.29 775 0.8 0.11 2 3 90
328 Munipally Garilapally 8.06 775 1.3 0.08 2 0 30
329 Munipally Hydlapur 2.33 750 1 0.02 0 2 40
330 Munipally Kallepally 6.58 875 1.6 0.06 1 2 55
331 Munipally Kamkole 10.89 2150 0.8 0.11 2 3 90
332 Munipally Khamampally 9.86 775 0.7 0.10 2 2 70
333 Munipally Lingampally 8.95 900 0.3 0.09 2 0 30
334 Munipally Lonikalan 7.09 800 0.8 0.07 1 3 75
335 Munipally Lonikud 8.44 775 0.9 0.08 2 0 30
336 Munipally Maktyakysaram 7.76 775 1.8 0.08 1 3 75
337 Munipally Mallikarjunpally 7.71 750 1.4 0.08 1 3 75
338 Munipally Mansanpally 4.66 800 0.6 0.05 1 1 35
339 Munipally Melasangam 5.92 900 0.4 0.06 1 2 55
340 Munipally Munipally 16.62 750 0.8 0.16 3 3 105
341 Munipally Polkampally 3.84 800 0.7 0.04 0 3 60
342 Munipally Ramchandrapur(UT) 4.34 750 2.7 0.04 1 0 15
343 Munipally Rekulpahad UT 2.24 800 1.8 0.02 0 2 40
344 Munipally Thatpally 6.60 825 0.6 0.07 1 2 55
345 Narayankhed Abbenda 15.05 625 0.6 0.16 3 3 105
346 Narayankhed Ananthasagar 12.89 1100 0.7 0.14 3 2 85
347 Narayankhed Chand Kanpally 2.61 1675 0.4 0.03 0 2 40
348 Narayankhed Chandapur 2.11 1450 0.6 0.02 0 2 40
349 Narayankhed Chaptka-K 7.10 700 0.7 0.08 1 3 75
350 Narayankhed G.Hukarana 3.71 925 0.5 0.04 1 0 15
351 Narayankhed Hangarga-B 4.78 675 0.6 0.05 1 1 35

352 Narayankhed Hangarga-K 9.01 700 0.6 0.10 2 2 70
353 Narayankhed Hanmathraopet 1.47 1875 0.6 0.02 0 1 20
354 Narayankhed Jukal 9.55 1675 0.5 0.10 0 2 40
355 Narayankhed Kamjipur 6.58 1900 0.5 0.07 1 3 75
356 Narayankhed Lingapur 2.10 1725 0.5 0.02 0 2 40
357 Narayankhed Madhwar 12.78 1750 0.6 0.14 3 1 65
358 Narayankhed Nagapur 3.72 675 0.6 0.04 1 0 15
359 Narayankhed Namalimet 5.34 2500 0.6 0.06 1 0 15
360 Narayankhed Narayankhed 7.51 1700 0.4 0.08 2 0 30
361 Narayankhed Nizamapet 20.98 4075 0.9 0.23 4 2 100
362 Narayankhed Panchagoan 3.95 1200 0.6 0.04 1 0 15
363 Narayankhed Pipri 3.65 950 0.5 0.04 1 0 15
364 Narayankhed Rudrar 5.15 750 1.4 0.06 0 1 20
365 Narayankhed Sathagoan 5.69 1225 0.7 0.06 1 0 15
366 Narayankhed Ujalampad 6.07 750 0.7 0.07 1 2 55
367 Narsapur Achampet 2.81 1100 0.6 0.04 0 3 60
368 Narsapur Ahmed Nagar 9.36 1125 0.7 0.13 2 4 110
369 Narsapur Brahmanpally 5.00 1025 0.7 0.07 1 3 75
370 Narsapur Hanumanthapur 3.44 850 0.6 0.05 1 1 35
371 Narsapur Khazipet 12.82 775 0.8 0.17 4 1 80
372 Narsapur Lingapur 6.00 975 0.7 0.08 2 0 30
373 Narsapur Madapur 4.20 1250 1.2 0.06 1 2 55
374 Narsapur Malparthi 2.26 850 0.6 0.03 0 3 60
375 Narsapur Manthoor 4.50 900 0.7 0.06 1 2 55
376 Narsapur Narayanpur 3.50 875 0.6 0.05 1 1 35
377 Narsapur Narsapur 22.64 1525 0.8 0.31 7 1 125
378 Narsapur Nathnaipally 4.82 775 1.4 0.07 1 2 55
379 Narsapur P.C.Kunta 5.50 1350 1.1 0.07 1 3 75
380 Narsapur Tirumalapur 2.31 800 0.8 0.03 0 3 60
381 Nyalkal Ganeshpur 4.94 400 0.4 0.05 1 1 35
382 Nyalkal Handnoor 14.45 325 0.5 0.14 3 2 85
383 Nyalkal Husselli 5.70 450 0.5 0.06 1 1 35
384 Nyalkal Ibrahimpur 7.18 800 0.5 0.07 1 3 75
385 Nyalkal Kalbemula 9.48 350 0.4 0.09 2 1 50
386 Nyalkal Rejintal 15.81 575 0.3 0.16 3 3 105
387 Nyalkal Tatpally 2.85 1175 0.3 0.03 0 3 60
388 Nyalkal Tekur 4.32 1050 0.3 0.04 1 0 15
389 Nyalkal Waddi 7.64 575 0.5 0.08 1 3 75
390 Papannapet Arkela 8.71 1700 1.2 0.10 2 2 70
391 Papannapet Bacharam 6.35 1600 1.1 0.07 1 3 75
392 Papannapet Cheekode 5.94 2000 1.4 0.07 1 3 75
393 Papannapet Chitriyal 7.64 1475 0.8 0.09 2 1 50
394 Papannapet Ellapur 4.34 2625 0.6 0.05 1 1 35
395 Papannapet Gandarpally 9.83 875 1 0.11 2 3 90
396 Papannapet Kodapak 14.62 1100 1 0.17 4 1 80

397 Papannapet Kompally 4.56 1950 0.5 0.05 1 1 35
398 Papannapet Kurtiwada 19.36 1700 1.3 0.23 5 2 115
399 Papannapet Mallampet 12.36 2800 0.8 0.14 3 2 85
400 Papannapet Namapur 6.07 1550 0.9 0.07 1 3 75
401 Papannapet Narsingi 6.30 1650 1.2 0.07 1 3 75
402 Papannapet Papannapet 10.66 1700 1.3 0.12 2 4 110
403 Papannapet Podchanpally 13.50 1350 0.9 0.16 3 3 105
404 Papannapet Ramthirtham 5.29 1300 1.1 0.06 1 2 55
405 Papannapet Tammaipally 4.31 1800 1.2 0.05 1 1 35
406 Papannapet Yousufpeta 8.59 1925 1.2 0.10 2 2 70
407 Patancheru Ameenpur 18.05 925 1.2 0.16 3 3 105
408 Patancheru Bhanoor 14.12 450 0.5 0.13 2 4 110
409 Patancheru Chinnakanjarla 10.85 1725 0.7 0.10 0 2 40
410 Patancheru Indresham 7.90 2075 0.6 0.07 0 3 60
411 Patancheru Inole 5.51 2050 0.7 0.05 1 1 35
412 Patancheru Isnapur 9.02 1900 0.9 0.08 2 0 30
413 Patancheru Kistareddypet 2.60 1475 0.9 0.02 0 2 40
414 Patancheru Kyasaram 7.88 425 0.4 0.07 1 3 75
415 Patancheru Lakdaram 17.10 2125 1 0.15 0 3 60
416 Patancheru Muthangi 8.06 1800 1.1 0.07 1 3 75
417 Patancheru Nandigoun 13.27 500 0.6 0.12 2 4 110
418 Patancheru Part Ghanpur 12.37 600 0.8 0.11 2 3 90
419 Patancheru Pashamailaram 8.45 500 0.5 0.08 1 3 75
420 Patancheru Patancheru 15.42 1000 1.2 0.14 3 2 85
421 Patancheru Patelguda 1.97 1775 0.7 0.02 0 2 40
422 Patancheru PeddaKanjarla 11.63 1925 0.7 0.11 1 2 55
423 Patancheru Rameshwaranmbanda 6.34 2025 0.5 0.06 1 2 55
424 Patancheru Rudraram 16.85 650 0.6 0.15 3 3 105
425 Patancheru Sultanpur 11.21 1150 1.1 0.10 2 2 70
426 Patancheru Wadakpally 3.38 1600 0.8 0.03 0 3 60
427 Pulkal Baswapur 11.41 325 1.2 0.11 2 3 90
428 Pulkal Chekriyal 6.78 675 0.6 0.07 1 3 75
429 Pulkal Chowtkur 25.08 1375 0.7 0.25 5 4 155
430 Pulkal Gongloor 18.63 625 0.7 0.18 4 2 100
431 Pulkal Hunnapur 5.41 775 2.8 0.05 1 1 35
432 Pulkal Isojipet 7.08 600 0.8 0.07 1 3 75
433 Pulkal Korpole 18.31 800 0.9 0.18 4 2 100
434 Pulkal Lingampally 3.38 650 1.1 0.03 0 3 60
435 Pulkal Manthoor 9.61 850 2.5 0.09 2 2 70
436 Pulkal Minpoor 15.56 475 0.9 0.15 3 3 105
437 Pulkal Muddaipet 5.18 500 1.3 0.05 1 1 35
438 Pulkal Mudimanik 13.98 175 0.8 0.14 3 2 85
439 Pulkal Pocharam 7.52 675 2.2 0.07 1 3 75
440 Pulkal Raipahad 3.20 850 1.9 0.03 0 3 60
441 Pulkal S.Itikyal 6.60 350 0.9 0.07 1 2 55

442 Pulkal S.R.Guda 1.44 650 0.6 0.01 0 1 20
443 Pulkal Sarefpally 2.44 575 0.7 0.02 0 2 40
444 Pulkal Shivampet 10.68 750 0.6 0.11 2 3 90
445 Pulkal Sulthanpur 5.29 600 0.7 0.05 1 1 35
446 Pulkal Taddanpally 3.60 600 0.6 0.04 0 3 60
447 Pulkal Vendikole 8.45 950 0.8 0.08 2 0 30
448 Pulkal Venkata kistapur 3.37 650 0.7 0.03 0 3 60
449 Raikode Allapur 3.79 1075 0.3 0.04 1 0 15
450 Raikode Auranganagar 6.71 875 0.6 0.07 1 3 75
451 Raikode Doultabad 3.53 1100 0.5 0.04 0 3 60
452 Raikode Hulgera 6.49 1150 0.4 0.07 1 3 75
453 Raikode Indoor 12.37 1100 0.5 0.13 3 1 65
454 Raikode Jamge (K) 6.08 825 0.4 0.07 1 2 55
455 Raikode Karchal 5.41 1100 0.4 0.06 1 2 55
456 Raikode Khanjamalpur 5.17 625 0.6 0.06 1 1 35
457 Raikode Kushnoor 5.71 900 0.3 0.06 1 2 55
458 Raikode Matoor 5.80 575 0.4 0.06 1 2 55
459 Raikode Mohammadapur 3.60 825 0.3 0.04 0 3 60
460 Raikode Nallampally 5.98 825 0.3 0.06 1 2 55
461 Raikode Peapalpally 11.02 950 0.4 0.12 2 3 90
462 Raikode Raikode 11.46 800 0.3 0.12 2 4 110
463 Raikode Raipally 6.95 875 0.4 0.07 1 3 75
464 Raikode Sangapur 6.50 825 0.5 0.07 1 3 75
465 Raikode Shamshuddinpdur 4.35 1225 0.3 0.05 1 1 35
466 Raikode Sirur 4.65 850 0.8 0.05 1 1 35
467 Ramayampet Akkannapet 10.68 1875 0.8 0.07 1 3 75
468 Ramayampet Chelmeda 17.71 1300 0.8 0.12 0 1 20
469 Ramayampet Danthepally 6.05 1450 0.8 0.04 1 0 15
470 Ramayampet J.Lingapur 9.05 1700 0.8 0.06 1 2 55
471 Ramayampet Katriyal 8.27 1600 0.8 0.06 1 1 35
472 Ramayampet Parvathapur 10.66 1425 0.9 0.07 1 3 75
473 Ramayampet Sadashivnagar 2.34 1800 0.8 0.02 0 1 20
474 Ramayampet Tonigandla 10.33 1825 0.8 0.07 1 3 75
475 RC Puram Kachireddypally. 3.39 850 1.2 0.03 0 2 40
476 RC Puram Kolluru 12.47 675 1 0.10 2 2 70
477 RC Puram Manmole 13.90 850 1.2 0.11 2 3 90
478 RC Puram R.C.puram 6.93 875 1.3 0.06 1 2 55
479 RC Puram Velmela 11.77 650 0.9 0.10 2 2 70
480 Regode Buranwadi 1.44 575 0.9 0.01 0 1 20
481 Regode Chowdarpally 4.78 625 0.9 0.05 1 1 35
482 Regode Jangiryal 3.68 650 0.8 0.04 0 3 60
483 Regode Khadirabad 25.26 1150 1.3 0.25 5 4 155
484 Regode Kondapur 3.74 600 0.9 0.04 0 3 60
485 Regode Kothwalpally 4.84 825 0.8 0.05 1 1 35
486 Regode Marpally 4.96 550 0.9 0.05 0 1 20
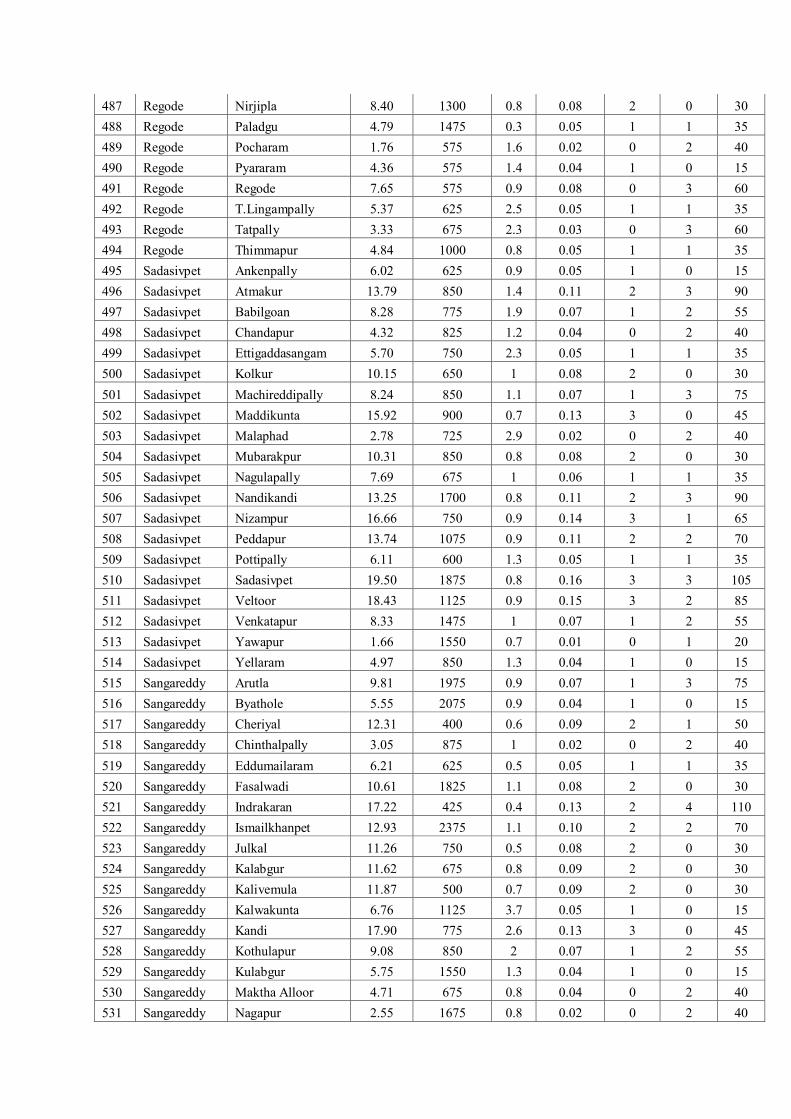
487 Regode Nirjipla 8.40 1300 0.8 0.08 2 0 30
488 Regode Paladgu 4.79 1475 0.3 0.05 1 1 35
489 Regode Pocharam 1.76 575 1.6 0.02 0 2 40
490 Regode Pyararam 4.36 575 1.4 0.04 1 0 15
491 Regode Regode 7.65 575 0.9 0.08 0 3 60
492 Regode T.Lingampally 5.37 625 2.5 0.05 1 1 35
493 Regode Tatpally 3.33 675 2.3 0.03 0 3 60
494 Regode Thimmapur 4.84 1000 0.8 0.05 1 1 35
495 Sadasivpet Ankenpally 6.02 625 0.9 0.05 1 0 15
496 Sadasivpet Atmakur 13.79 850 1.4 0.11 2 3 90
497 Sadasivpet Babilgoan 8.28 775 1.9 0.07 1 2 55
498 Sadasivpet Chandapur 4.32 825 1.2 0.04 0 2 40
499 Sadasivpet Ettigaddasangam 5.70 750 2.3 0.05 1 1 35
500 Sadasivpet Kolkur 10.15 650 1 0.08 2 0 30
501 Sadasivpet Machireddipally 8.24 850 1.1 0.07 1 3 75
502 Sadasivpet Maddikunta 15.92 900 0.7 0.13 3 0 45
503 Sadasivpet Malaphad 2.78 725 2.9 0.02 0 2 40
504 Sadasivpet Mubarakpur 10.31 850 0.8 0.08 2 0 30
505 Sadasivpet Nagulapally 7.69 675 1 0.06 1 1 35
506 Sadasivpet Nandikandi 13.25 1700 0.8 0.11 2 3 90
507 Sadasivpet Nizampur 16.66 750 0.9 0.14 3 1 65
508 Sadasivpet Peddapur 13.74 1075 0.9 0.11 2 2 70
509 Sadasivpet Pottipally 6.11 600 1.3 0.05 1 1 35
510 Sadasivpet Sadasivpet 19.50 1875 0.8 0.16 3 3 105
511 Sadasivpet Veltoor 18.43 1125 0.9 0.15 3 2 85
512 Sadasivpet Venkatapur 8.33 1475 1 0.07 1 2 55
513 Sadasivpet Yawapur 1.66 1550 0.7 0.01 0 1 20
514 Sadasivpet Yellaram 4.97 850 1.3 0.04 1 0 15
515 Sangareddy Arutla 9.81 1975 0.9 0.07 1 3 75
516 Sangareddy Byathole 5.55 2075 0.9 0.04 1 0 15
517 Sangareddy Cheriyal 12.31 400 0.6 0.09 2 1 50
518 Sangareddy Chinthalpally 3.05 875 1 0.02 0 2 40
519 Sangareddy Eddumailaram 6.21 625 0.5 0.05 1 1 35
520 Sangareddy Fasalwadi 10.61 1825 1.1 0.08 2 0 30
521 Sangareddy Indrakaran 17.22 425 0.4 0.13 2 4 110
522 Sangareddy Ismailkhanpet 12.93 2375 1.1 0.10 2 2 70
523 Sangareddy Julkal 11.26 750 0.5 0.08 2 0 30
524 Sangareddy Kalabgur 11.62 675 0.8 0.09 2 0 30
525 Sangareddy Kalivemula 11.87 500 0.7 0.09 2 0 30
526 Sangareddy Kalwakunta 6.76 1125 3.7 0.05 1 0 15
527 Sangareddy Kandi 17.90 775 2.6 0.13 3 0 45
528 Sangareddy Kothulapur 9.08 850 2 0.07 1 2 55
529 Sangareddy Kulabgur 5.75 1550 1.3 0.04 1 0 15
530 Sangareddy Maktha Alloor 4.71 675 0.8 0.04 0 2 40
531 Sangareddy Nagapur 2.55 1675 0.8 0.02 0 2 40

532 Sangareddy Pothireddypally 6.52 925 4.4 0.05 1 0 15
533 Sangareddy Sangareddy 7.55 900 2.4 0.06 1 1 35
534 Sangareddy Tadlapally 4.90 800 1.2 0.04 0 2 40
535 Sangareddy Uttarpally 13.07 925 0.8 0.10 2 1 50
536 Shankarampet-A Baddaram 3.61 1750 0.7 0.04 1 0 15
537 Shankarampet-A Burugupally 8.34 1000 1.3 0.10 2 2 70
538 Shankarampet-A Ch. Laxmapur 6.06 3325 0.7 0.07 1 3 75
539 Shankarampet-A Cheelapally 7.37 3225 0.8 0.09 2 0 30
540 Shankarampet-A Danampally 2.20 1450 1.3 0.03 0 2 40
541 Shankarampet-A Gottimukula 8.37 1300 0.7 0.10 2 2 70
542 Shankarampet-A Jambikunta 12.04 3625 0.8 0.14 3 2 85
543 Shankarampet-A Jukal 13.97 1925 1.2 0.16 3 3 105
544 Shankarampet-A K.Venkatapur 6.74 1800 0.6 0.08 2 0 30
545 Shankarampet-A Kamalapur 2.38 2875 0.7 0.03 0 2 40
546 Shankarampet-A Kollapally 3.63 1775 0.7 0.04 1 0 15
547 Shankarampet-A Kothapet 2.98 2050 1.1 0.03 0 3 60
548 Shankarampet-A M. Laxmapur 12.95 1500 0.9 0.15 3 3 105
549 Shankarampet-A Malkapur 3.55 1725 0.7 0.04 1 0 15
550 Shankarampet-A Ramajpally 3.57 1825 1.1 0.04 1 0 15
551 Shankarampet-A Shankarampet-A 4.39 2175 0.6 0.05 1 1 35
552 Shankarampet-A Sivaipally 1.77 1525 1.3 0.02 0 2 40
553 Shankarampet-A Tenkati 12.04 3525 0.8 0.14 3 2 85
554 Shankarampet-A Tirmalapoor 4.51 2275 0.6 0.05 1 1 35
555 Shankarampet-A Uthloor 6.44 1975 1 0.07 1 3 75
556 Shankarampet-A Virojipally 7.33 1900 0.9 0.09 2 0 30
557 Shankarampet-R Ambojipet 2.57 925 1.2 0.03 0 3 60
558 Shankarampet-R Chandampet 7.97 1000 0.9 0.11 2 3 90
559 Shankarampet-R Chandapur 4.66 1225 0.6 0.06 1 2 55
560 Shankarampet-R Dharipally 7.33 1900 0.8 0.10 2 2 70
561 Shankarampet-R Gajagatlapally 6.58 1500 0.8 0.09 2 1 50
562 Shankarampet-R Gavvallapally 8.26 1150 1.1 0.11 2 3 90

563 Shankarampet-R Jangarai 6.84 1300 0.7 0.09 2 1 50
564 Shankarampet-R Jangarai 13.54 1300 0.7 0.18 4 2 100
565 Shankarampet-R Kamaram 6.35 1025 1.1 0.09 2 0 30
566 Shankarampet-R Khajapur 11.15 1550 0.8 0.15 3 3 105
567 Shankarampet-R Korvipally 4.99 1900 0.5 0.07 1 3 75
568 Shankarampet-R Madur 18.39 1300 0.9 0.25 5 4 155
569 Shankarampet-R Mirjapally 6.89 1100 1 0.09 2 1 50
570 Shankarampet-R S.Kondapoor 9.85 1675 1.1 0.13 3 1 65
571 Shankarampet-R Shankapur 8.53 1225 0.8 0.12 2 3 90
572 Shankarampet-R Shankarampet-R 9.00 975 1.1 0.12 2 4 110
573 Shankarampet-R Suraram 16.49 1450 0.7 0.22 5 2 115
574 Shankarampet-R T.Mandapoor 8.58 1875 1.5 0.12 2 3 90
575 Shankarampet-R Zaptishivnoor 7.04 950 0.8 0.10 2 2 70
576 Shivampet Allipur 7.26 950 0.9 0.08 2 0 30
577 Shivampet Chandi 8.50 900 0.9 0.09 1 1 35
578 Shivampet Chinnagotimukla 5.06 1750 0.7 0.05 1 1 35
579 Shivampet Donthi 7.86 1200 0.6 0.08 1 0 15
580 Shivampet Edulapalli 4.55 1850 0.7 0.05 0 1 20
581 Shivampet Kothapet 11.36 1200 0.8 0.12 2 4 110
582 Shivampet Nawabpet 14.14 925 1.2 0.15 2 3 90
583 Shivampet Pambanda 12.15 1825 0.8 0.13 3 1 65
584 Shivampet Parkibanda 11.76 775 0.6 0.13 2 4 110
585 Shivampet Pillutla 8.37 1225 0.8 0.09 2 1 50
586 Shivampet Potharam 3.61 600 0.3 0.04 0 3 60
587 Shivampet Pothulabguda 4.48 1700 0.8 0.05 1 1 35
588 Shivampet Ratnapur 11.46 1450 0.8 0.12 2 4 110
589 Shivampet Shabashpally 6.08 775 0.5 0.07 0 2 40
590 Shivampet Sikindlapur 9.30 850 1 0.10 1 2 55
591 Shivampet Timmapur 3.37 1900 0.7 0.04 0 3 60
592 Siddipet Pullur 19.76 650 1 0.12 0 1 20
593 Siddipet Raghavapur 18.15 1400 0.9 0.11 0 1 20
594 Tekmal Bardipur 7.84 650 1.1 0.07 1 3 75
595 Tekmal Bodmatpally 4.62 675 1 0.04 1 0 15
596 Tekmal Dadaipally 3.14 675 1.5 0.03 0 3 60
597 Tekmal Eklaspur 2.91 700 0.8 0.03 0 2 40
598 Tekmal Elkurthi 9.08 1050 0.7 0.08 2 0 30
599 Tekmal H.M. Pally 5.04 1000 0.7 0.05 1 0 15
600 Tekmal Kadloor 8.84 700 0.8 0.08 2 0 30
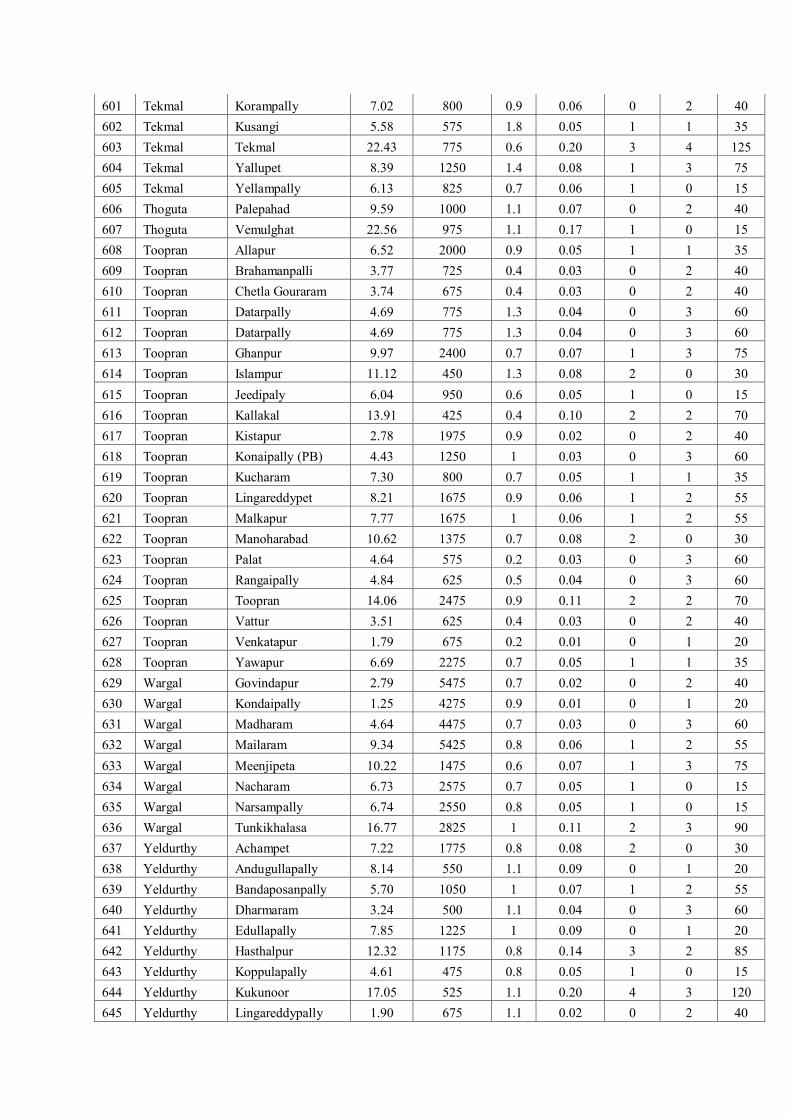
601 Tekmal Korampally 7.02 800 0.9 0.06 0 2 40
602 Tekmal Kusangi 5.58 575 1.8 0.05 1 1 35
603 Tekmal Tekmal 22.43 775 0.6 0.20 3 4 125
604 Tekmal Yallupet 8.39 1250 1.4 0.08 1 3 75
605 Tekmal Yellampally 6.13 825 0.7 0.06 1 0 15
606 Thoguta Palepahad 9.59 1000 1.1 0.07 0 2 40
607 Thoguta Vemulghat 22.56 975 1.1 0.17 1 0 15
608 Toopran Allapur 6.52 2000 0.9 0.05 1 1 35
609 Toopran Brahamanpalli 3.77 725 0.4 0.03 0 2 40
610 Toopran Chetla Gouraram 3.74 675 0.4 0.03 0 2 40
611 Toopran Datarpally 4.69 775 1.3 0.04 0 3 60
612 Toopran Datarpally 4.69 775 1.3 0.04 0 3 60
613 Toopran Ghanpur 9.97 2400 0.7 0.07 1 3 75
614 Toopran Islampur 11.12 450 1.3 0.08 2 0 30
615 Toopran Jeedipaly 6.04 950 0.6 0.05 1 0 15
616 Toopran Kallakal 13.91 425 0.4 0.10 2 2 70
617 Toopran Kistapur 2.78 1975 0.9 0.02 0 2 40
618 Toopran Konaipally (PB) 4.43 1250 1 0.03 0 3 60
619 Toopran Kucharam 7.30 800 0.7 0.05 1 1 35
620 Toopran Lingareddypet 8.21 1675 0.9 0.06 1 2 55
621 Toopran Malkapur 7.77 1675 1 0.06 1 2 55
622 Toopran Manoharabad 10.62 1375 0.7 0.08 2 0 30
623 Toopran Palat 4.64 575 0.2 0.03 0 3 60
624 Toopran Rangaipally 4.84 625 0.5 0.04 0 3 60
625 Toopran Toopran 14.06 2475 0.9 0.11 2 2 70
626 Toopran Vattur 3.51 625 0.4 0.03 0 2 40
627 Toopran Venkatapur 1.79 675 0.2 0.01 0 1 20
628 Toopran Yawapur 6.69 2275 0.7 0.05 1 1 35
629 Wargal Govindapur 2.79 5475 0.7 0.02 0 2 40
630 Wargal Kondaipally 1.25 4275 0.9 0.01 0 1 20
631 Wargal Madharam 4.64 4475 0.7 0.03 0 3 60
632 Wargal Mailaram 9.34 5425 0.8 0.06 1 2 55
633 Wargal Meenjipeta 10.22 1475 0.6 0.07 1 3 75
634 Wargal Nacharam 6.73 2575 0.7 0.05 1 0 15
635 Wargal Narsampally 6.74 2550 0.8 0.05 1 0 15
636 Wargal Tunkikhalasa 16.77 2825 1 0.11 2 3 90
637 Yeldurthy Achampet 7.22 1775 0.8 0.08 2 0 30
638 Yeldurthy Andugullapally 8.14 550 1.1 0.09 0 1 20
639 Yeldurthy Bandaposanpally 5.70 1050 1 0.07 1 2 55
640 Yeldurthy Dharmaram 3.24 500 1.1 0.04 0 3 60
641 Yeldurthy Edullapally 7.85 1225 1 0.09 0 1 20
642 Yeldurthy Hasthalpur 12.32 1175 0.8 0.14 3 2 85
643 Yeldurthy Koppulapally 4.61 475 0.8 0.05 1 0 15
644 Yeldurthy Kukunoor 17.05 525 1.1 0.20 4 3 120
645 Yeldurthy Lingareddypally 1.90 675 1.1 0.02 0 2 40

646 Yeldurthy M. Jalalpur 7.89 500 1.1 0.09 0 1 20
647 Yeldurthy Manepally 13.01 575 1 0.15 2 3 90
648 Yeldurthy Mangalparthy 13.74 600 1 0.16 3 1 65
649 Yeldurthy Masaipet 17.30 800 0.7 0.20 2 3 90
650 Yeldurthy Settipally(K) 18.71 725 0.8 0.22 5 1 95
651 Yeldurthy Uppulingapur 9.45 1525 0.9 0.11 2 3 90
652 Yeldurthy Yeldurthy 29.27 1625 0.8 0.34 4 4 140
653 Yeldurthy Yeshwantharaopet 8.70 650 1.1 0.10 2 1 50
654 Zaheerabad Allipur 3.79 475 1.6 0.05 1 1 35
655 Zaheerabad Anegunta 9.86 475 0.5 0.12 2 4 110
656 Zaheerabad Gudpalle 29.63 375 0.3 0.37 8 2 160
657 Zaheerabad Hothi - B 26.47 300 0.3 0.33 7 3 165
658 Zaheerabad Malchelma 12.26 500 0.5 0.15 3 3 105
659 Zaheerabad Malkapur (JADI) 8.77 500 0.5 0.11 2 3 90
660 Zaheerabad Mogdampalle 42.42 325 0.2 0.53 11 9 345
661 Zaheerabad Parvathapur 6.08 400 0.4 0.08 1 3 75
662 Zaheerabad Pastapur 5.29 625 1.5 0.07 1 2 55
663 Zaheerabad Ranjole 15.49 525 1.8 0.20 4 3 120
664 Zaheerabad Sarjaraopet 8.12 425 0.4 0.10 2 2 70
665 Zaheerabad Shaikapur 18.75 375 0.5 0.24 5 3 135
666 Zaheerabad Zahirabad - R 21.27 400 1 0.27 6 1 110
1006 1248 40050


