Embed Size (px)
Citation preview
SuStainableMega-eventsin developing countrieS
Experiences and insights from Host Cities in South Africa, India and Brazil
SuStainableMega-eventsin developing countrieS
Experiences and insights from Host Cities in South Africa, India and Brazil
2 • SuStainable Mega-eventS in Developing CountrieS 3 Oksana Perkins/Shutterstock.comBruce Sutherland, City of Cape Town
4 • SuStainable Mega-eventS in Developing CountrieS 5
Organisations interested in further information, or seeking to enter into discussions about this report are invited to contact:
PARTNERS
KOnrad-adenauer-Stiftung 60 Hume Road, Dunkeld, Johannesburg 2196, South Africa
Tel: +27 11 214 2900Fax: +27 11 214 2913/4E-mail: [email protected]: www.kas.org.za/www.kas.de
SuStainable energy africa The Green Building, Westlake Business Park, Cape Town 7945, South Africa Tel: +27 21 702 3622Fax: +27 21 702 3625E-mail: [email protected]: www.sustainable.org.za
the energy and reSOurceS inStituteDarbari Seth Block, India Habitat Centre Complex, Lodhi Road, New Delhi – 110 003, India
Tel: +91 11 2468 2100Fax: +91 11 2468 2144 E-mail: [email protected]: www.teriin.org
gitec cOnSult gmbhBongardstrasse 3, 40479 Duesseldorf, Germany
Tel: +49 211 440 80Fax: +49 211 440 8204E-mail: [email protected]: www.gitec-consult.de
coNTRibuToRS
The Report is printed on Sappi Triple Green paper, an environmentally friendly paper stock made from chlorine-free sugar cane fibre and fibres sourced from sustainable afforestation in South Africa.
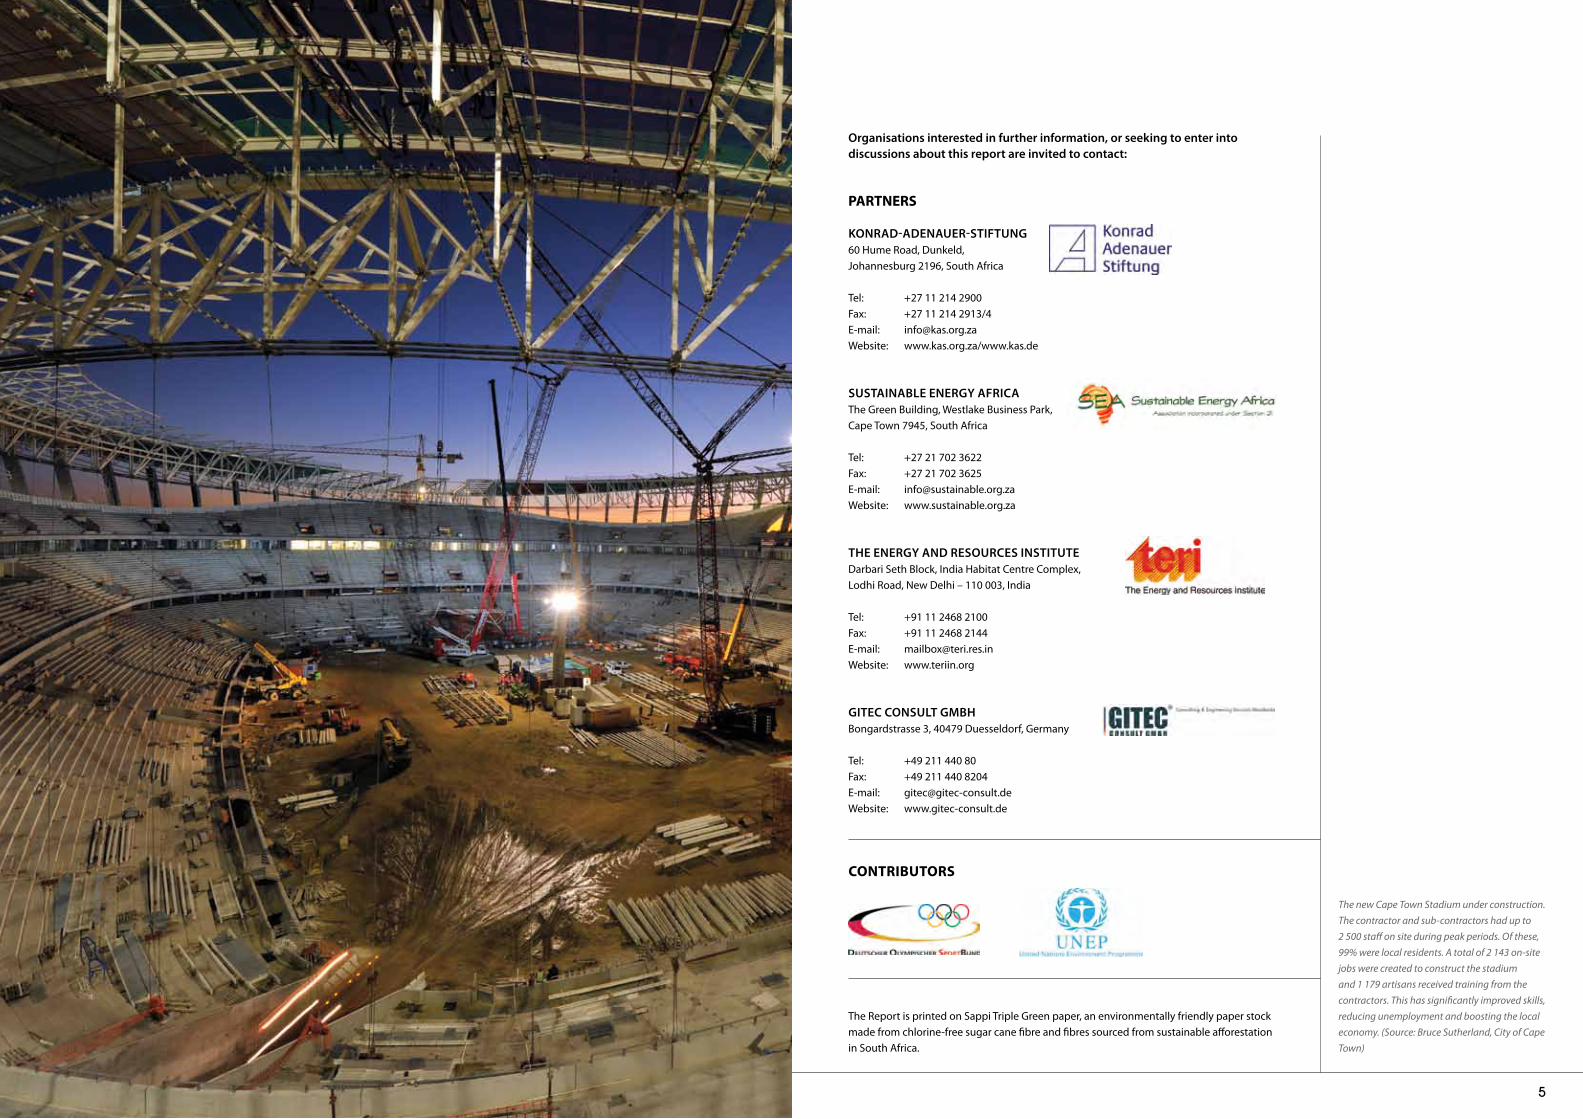
The new Cape Town Stadium under construction. The contractor and sub-contractors had up to 2 500 staff on site during peak periods. Of these, 99% were local residents. A total of 2 143 on-site jobs were created to construct the stadium and 1 179 artisans received training from the contractors. This has significantly improved skills, reducing unemployment and boosting the local economy. (Source: Bruce Sutherland, City of Cape Town)
6 • SuStainable Mega-eventS in Developing CountrieS 7
The development of this report was made possible by the support, guidance and cooperation of a number of key stakeholders.
The South African Country Study was prepared by Mark Borchers and Sivuyile Maboda of Sustainable Energy Africa (SEA).
The India Country Study was written by Shailly Kedia, Aastha Mehta, Prasun Gangopadhyay, Arpita Khanna and Shilpi Kapur of The Energy and Resources Institute (TERI) with advisors Dr Ligia Noronha and Dr Prodipto Ghosh. The support of two enthusiastic interns, Aparna Vashista and Kartikeya Babhada, is acknowl-edged.
The Brazil Country Study as well as the Summary Report were authored by Dr Christoph Trusen of GITEC Consult GmbH with the support of Clarissa Dudenhoeffer.
The authors wish to thank the Konrad-Adenauer-Stiftung (KAS), in particular the respective KAS-offices in South Africa, India and Brazil for their generosity and guidance in making this report possible.
A special word of thanks goes to the following individuals for their valued sup-port and technical assistance: Dr Werner Boehler, Christian Huebner and Christina Teichmann from KAS, Kurt Ackermann (Edit), Bryony van Wyk (Design) and Sheryl Ozinsky (Project Co-ordination).
The authors hope that the commitment shown by the Deutsche Olympische Sportbund (DOSB) and the UN Environment Programme (UNEP) to promote the hosting of sustainable mega-events will be an inspiration for other stakeholders involved in such events.
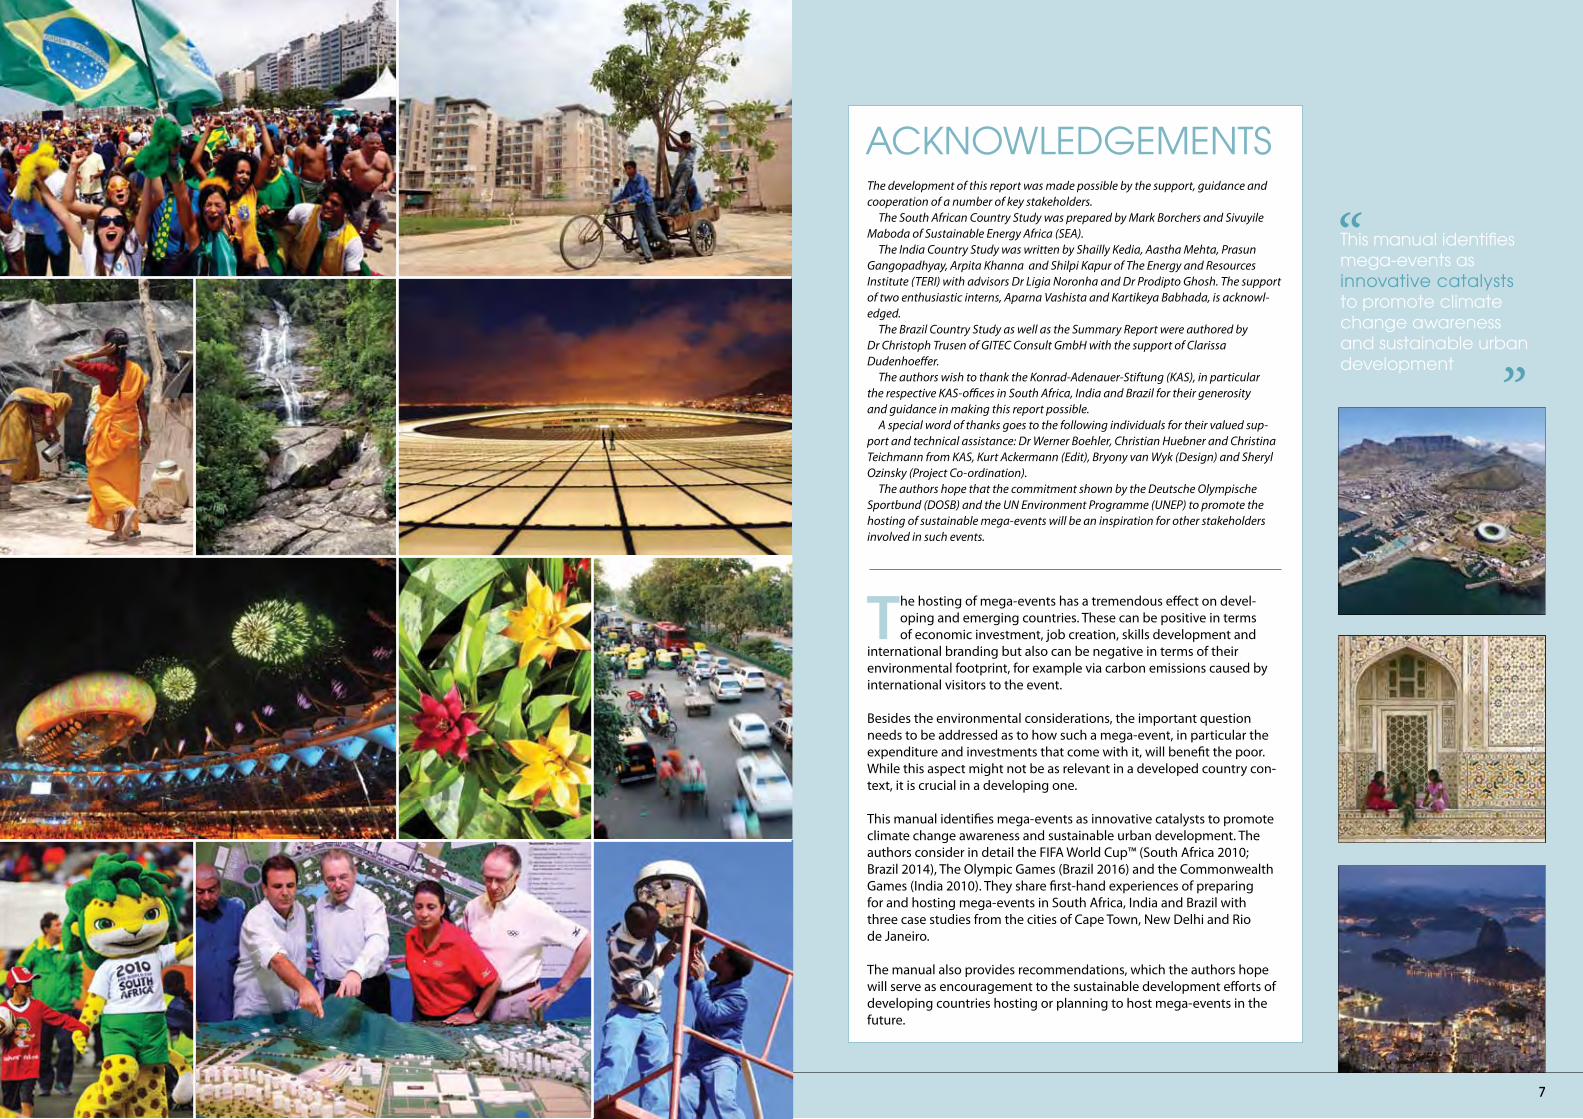
the hosting of mega-events has a tremendous effect on devel-oping and emerging countries. These can be positive in terms of economic investment, job creation, skills development and
international branding but also can be negative in terms of their environmental footprint, for example via carbon emissions caused by international visitors to the event.
Besides the environmental considerations, the important question needs to be addressed as to how such a mega-event, in particular the expenditure and investments that come with it, will benefit the poor. While this aspect might not be as relevant in a developed country con-text, it is crucial in a developing one.
This manual identifies mega-events as innovative catalysts to promote climate change awareness and sustainable urban development. The authors consider in detail the FIFA World Cup™ (South Africa 2010; Brazil 2014), The Olympic Games (Brazil 2016) and the Commonwealth Games (India 2010). They share first-hand experiences of preparing for and hosting mega-events in South Africa, India and Brazil with three case studies from the cities of Cape Town, New Delhi and Rio de Janeiro.
The manual also provides recommendations, which the authors hope will serve as encouragement to the sustainable development efforts of developing countries hosting or planning to host mega-events in the future.
aCknowleDgeMentS
this manual identifies mega-events as innovative catalysts to promote climate change awareness and sustainable urban development
”
“
8 • SuStainable Mega-eventS in Developing CountrieS 9
table of ContentSTable of Contents 8Glossary 10Forewords 12
SummARy REPORT 14
1.1 Sustainable development and mega-events in cities: a conceptual framework 16
1.1.1 urban Development Challenges 16 1.1.2 Cities and Sustainable Development 20 1.1.3 mega-Events as Catalysts for Sustainable Development: The Role of Event Greening in Cities 24
1.2 hosting mega-events in developing countries: cost-benefit concerns 27
1.3 mega-events and Sustainable development: lessons learned from india, South africa and brazil 29
1.3.1 Event Governance and Business models 29 1.3.2 Resource Allocations and Planning 31 1.3.3 Greening of the mega-Events 33 1.3.4 Event Impacts and urban Development Challenges 38
1.4 conclusion 41
SOuTH AFRICA: The 2010 FIFA World Cup™ 42
2.1 background 44 2.1.1 South Africa Profile 45 2.1.2 Cape Town Profile 46 2.1.3 Developmental Objectives for the 2010 FIFA World Cup™ 47
2.2 the 2010 fifa World cup™ mega-event 48 2.2.1 Overview of the Event 48 2.2.2 Event Business model 48 2.2.3 Governance of the Event 52
2.3 impacts of the 2010 fifa World cup™ 52 2.3.1 Environmental Impacts 52 2.3.2 Economic Impacts 57
1
2.3.3 Social Impacts 58 2.3.4 Summary of Impacts 60
2.4 conclusion 61
2.5 recommendations 61 2.5.1 Recommendations for Host Countries and FIFA 61 2.5.2 Recommendations and Lessons for Host Cities 63 2.5.3 Aligning Towards a Common Goal 63
INDIA: The 2010 Commonwealth Games 64
3.1 background 66 3.1.1 India Profile 68 3.1.2 Delhi Profile 69
3.2 the 2010 commonwealth games mega-event 70 3.2.1 Overview of the Event 70 3.2.2 Event Business model 71 3.2.3 Governance of the Event 71
3.3 impacts of the 2010 commonwealth games 72 3.3.1 Economic Impacts 72 3.3.2 Environmental Impacts 76 3.3.3 Social Impacts 79 3.3.4 Summary of Impacts 80
3.4 recommendations 80
3.4 annexures 84 Annexure 1: Agencies involved in the conduct of the
2010 CWG 84 Annexure 2: Agency-wise allocations at the centre and
state levels 85 Annexure 3: Ecological Code for the 2010 CWG 86 Annexure 4: Overview of key displacements reported
during the course of the 2010 CWG 86
BRAzIL: The 2016 Olympic Games 88
4.1 background 90 4.1.1 Development Challenges for Brazil and Rio de Janeiro 90 4.1.2 Development Objectives of Rio de Janeiro 93
4.2 the 2016 Olympic games mega-event 96 4.2.1 Overview of the Event 96 4.2.2 Event Business model 97 4.2.3 Governance of the Event 100 4.2.4 The Sustainability and Environmental Agenda of the
Olympic Games 101
4.3 Potential impacts of the 2016 Olympic games 104 4.3.1 Economic and Social Impacts 104 4.3.2 Environmental Impacts 106
References 108List of Tables 111List of Figures 111
a key strategic question for developing countries concerns the poten-tial employment and income-generating effects of mega-events, and particularly the social distribution of these effects ”
“
10 • SuStainable Mega-eventS in Developing CountrieS 11
acSa Airports Company of South AfricaasgiSa Accelerated and Shared Growth Initiative of South Africaana Agência Nacional de AguasaPO Autoridade Pública Olímpicabid Banco Interamericano de Desenvolvimentobmu German Federal ministry for the Environment, Nature Conservation and Reactor Safetybrt Bus Rapid Transport cgf Commonwealth Games FederationcO2 Carbon dioxidecO2e Carbon dioxide equivalentcoct City of Cape TowncOP Conference of PartiescWg Commonwealth Gamesdanida Danish International Development Agencydeat Department of Environmental Affairs and Tourism dOSb Deutscher Olympischer SportbunddWa Department of Water Affairsfbe Free Basic Electricityfbae Free Basic Alternative Energyfcc FIFA Confederations Cupfifa Fédération Internationale de Football AssociationsgdP Gross Domestic Productgge Greenhouse Gas Emissionsghg Greenhouse Gas hca Host City AgreementhctOP Host City Transport Operations Planibc International Broadcasting Centreinr Indian RupeeiOc International Olympic Committeeirt Integrated Rapid Transit iWmP Integrated Waste management PolicyKaS Konrad-Adenauer-StiftungkWh Kilowatt-hourKl KilolitreKg Kilogram lOc FIFA World Cup™ Local Organising CommitteemPc main Press CentremtSf medium Term Strategic FrameworkmW megawattnema National Environmental management ActngO Non-Governmental OrganizationnWa National Water ActnO3 NitrateOc Organizing CommitteeOcOg Organizing Committee for the Olympic GamesOda Olympic Delivery AuthorityPraSa Passenger Rail Agency of South AfricaPVa Public viewing areaSafa South African Football AssociationSmP Sustainability management PlanSO2 Sulphur Dioxide teri The Energy and Resources Institute uneP united Nations Environment Programmeun-habitat united Nations Human Settlement ProgrammeuSd uS DollarWc World CupWhO World Health Organization Sea Sustainable Energy AfricaSmme Small, medium and micro-sized enterprisetcO2e Tonnes of carbon-dioxide equivalentZar South African Rand
gloSSary
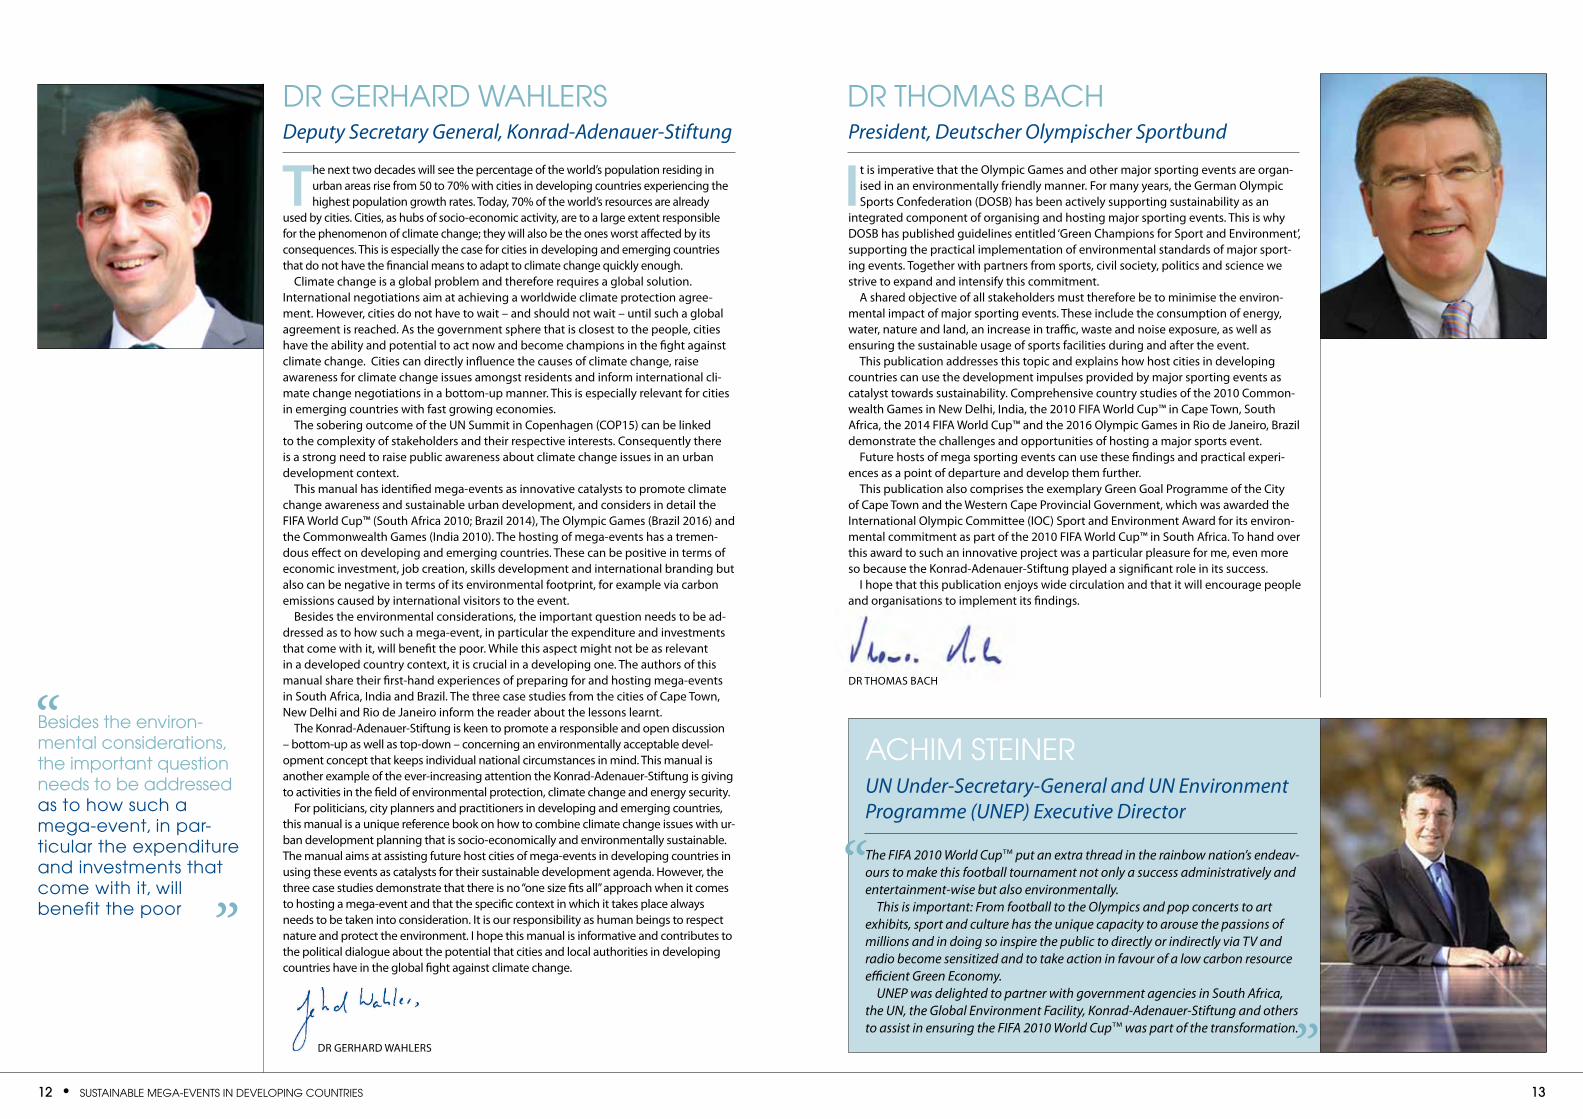
Opposite Rio celebrates after being awarded the 2016 Olympic Games. (Source: Vanderlei Almeida/AFP/Getty Images)
12 • SuStainable Mega-eventS in Developing CountrieS 13
Deputy Secretary General, Konrad-Adenauer-Stiftung
the next two decades will see the percentage of the world’s population residing in urban areas rise from 50 to 70% with cities in developing countries experiencing the highest population growth rates. Today, 70% of the world’s resources are already
used by cities. Cities, as hubs of socio-economic activity, are to a large extent responsible for the phenomenon of climate change; they will also be the ones worst affected by its consequences. This is especially the case for cities in developing and emerging countries that do not have the financial means to adapt to climate change quickly enough.
Climate change is a global problem and therefore requires a global solution. International negotiations aim at achieving a worldwide climate protection agree-ment. However, cities do not have to wait – and should not wait – until such a global agreement is reached. As the government sphere that is closest to the people, cities have the ability and potential to act now and become champions in the fight against climate change. Cities can directly influence the causes of climate change, raise awareness for climate change issues amongst residents and inform international cli-mate change negotiations in a bottom-up manner. This is especially relevant for cities in emerging countries with fast growing economies.
The sobering outcome of the uN Summit in Copenhagen (COP15) can be linked to the complexity of stakeholders and their respective interests. Consequently there is a strong need to raise public awareness about climate change issues in an urban development context.
This manual has identified mega-events as innovative catalysts to promote climate change awareness and sustainable urban development, and considers in detail the FIFA World Cup™ (South Africa 2010; Brazil 2014), The Olympic Games (Brazil 2016) and the Commonwealth Games (India 2010). The hosting of mega-events has a tremen-dous effect on developing and emerging countries. These can be positive in terms of economic investment, job creation, skills development and international branding but also can be negative in terms of its environmental footprint, for example via carbon emissions caused by international visitors to the event.
Besides the environmental considerations, the important question needs to be ad-dressed as to how such a mega-event, in particular the expenditure and investments that come with it, will benefit the poor. While this aspect might not be as relevant in a developed country context, it is crucial in a developing one. The authors of this manual share their first-hand experiences of preparing for and hosting mega-events in South Africa, India and Brazil. The three case studies from the cities of Cape Town, New Delhi and Rio de Janeiro inform the reader about the lessons learnt.
The Konrad-Adenauer-Stiftung is keen to promote a responsible and open discussion – bottom-up as well as top-down – concerning an environmentally acceptable devel-opment concept that keeps individual national circumstances in mind. This manual is another example of the ever-increasing attention the Konrad-Adenauer-Stiftung is giving to activities in the field of environmental protection, climate change and energy security.
For politicians, city planners and practitioners in developing and emerging countries, this manual is a unique reference book on how to combine climate change issues with ur-ban development planning that is socio-economically and environmentally sustainable. The manual aims at assisting future host cities of mega-events in developing countries in using these events as catalysts for their sustainable development agenda. However, the three case studies demonstrate that there is no “one size fits all” approach when it comes to hosting a mega-event and that the specific context in which it takes place always needs to be taken into consideration. It is our responsibility as human beings to respect nature and protect the environment. I hope this manual is informative and contributes to the political dialogue about the potential that cities and local authorities in developing countries have in the global fight against climate change.
DR GERHARD WAHLERS
Dr gerharD wahlerSPresident, Deutscher Olympischer Sportbund
it is imperative that the Olympic Games and other major sporting events are organ-ised in an environmentally friendly manner. For many years, the German Olympic Sports Confederation (DOSB) has been actively supporting sustainability as an
integrated component of organising and hosting major sporting events. This is why DOSB has published guidelines entitled ‘Green Champions for Sport and Environment’, supporting the practical implementation of environmental standards of major sport-ing events. Together with partners from sports, civil society, politics and science we strive to expand and intensify this commitment.
A shared objective of all stakeholders must therefore be to minimise the environ-mental impact of major sporting events. These include the consumption of energy, water, nature and land, an increase in traffic, waste and noise exposure, as well as ensuring the sustainable usage of sports facilities during and after the event.
This publication addresses this topic and explains how host cities in developing countries can use the development impulses provided by major sporting events as catalyst towards sustainability. Comprehensive country studies of the 2010 Common-wealth Games in New Delhi, India, the 2010 FIFA World Cup™ in Cape Town, South Africa, the 2014 FIFA World Cup™ and the 2016 Olympic Games in Rio de Janeiro, Brazil demonstrate the challenges and opportunities of hosting a major sports event.
Future hosts of mega sporting events can use these findings and practical experi-ences as a point of departure and develop them further.
This publication also comprises the exemplary Green Goal Programme of the City of Cape Town and the Western Cape Provincial Government, which was awarded the International Olympic Committee (IOC) Sport and Environment Award for its environ-mental commitment as part of the 2010 FIFA World Cup™ in South Africa. To hand over this award to such an innovative project was a particular pleasure for me, even more so because the Konrad-Adenauer-Stiftung played a significant role in its success.
I hope that this publication enjoys wide circulation and that it will encourage people and organisations to implement its findings.
DR THOmAS BACH
Dr thoMaS baCh
besides the environ-mental considerations, the important question needs to be addressed as to how such a mega-event, in par-ticular the expenditure and investments that come with it, will benefit the poor ”
“UN Under-Secretary-General and UN Environment Programme (UNEP) Executive Director
The FIFA 2010 World Cup™ put an extra thread in the rainbow nation’s endeav-ours to make this football tournament not only a success administratively and entertainment-wise but also environmentally.
This is important: From football to the Olympics and pop concerts to art exhibits, sport and culture has the unique capacity to arouse the passions of millions and in doing so inspire the public to directly or indirectly via TV and radio become sensitized and to take action in favour of a low carbon resource efficient Green Economy.
UNEP was delighted to partner with government agencies in South Africa, the UN, the Global Environment Facility, Konrad-Adenauer-Stiftung and others to assist in ensuring the FIFA 2010 World Cup™ was part of the transformation.
aChiM Steiner
“
”
14 • SuStainable Mega-eventS in Developing CountrieS Summary report • 15
summary report
sustainable urban development and mega-events in developing countries
summary report
overview
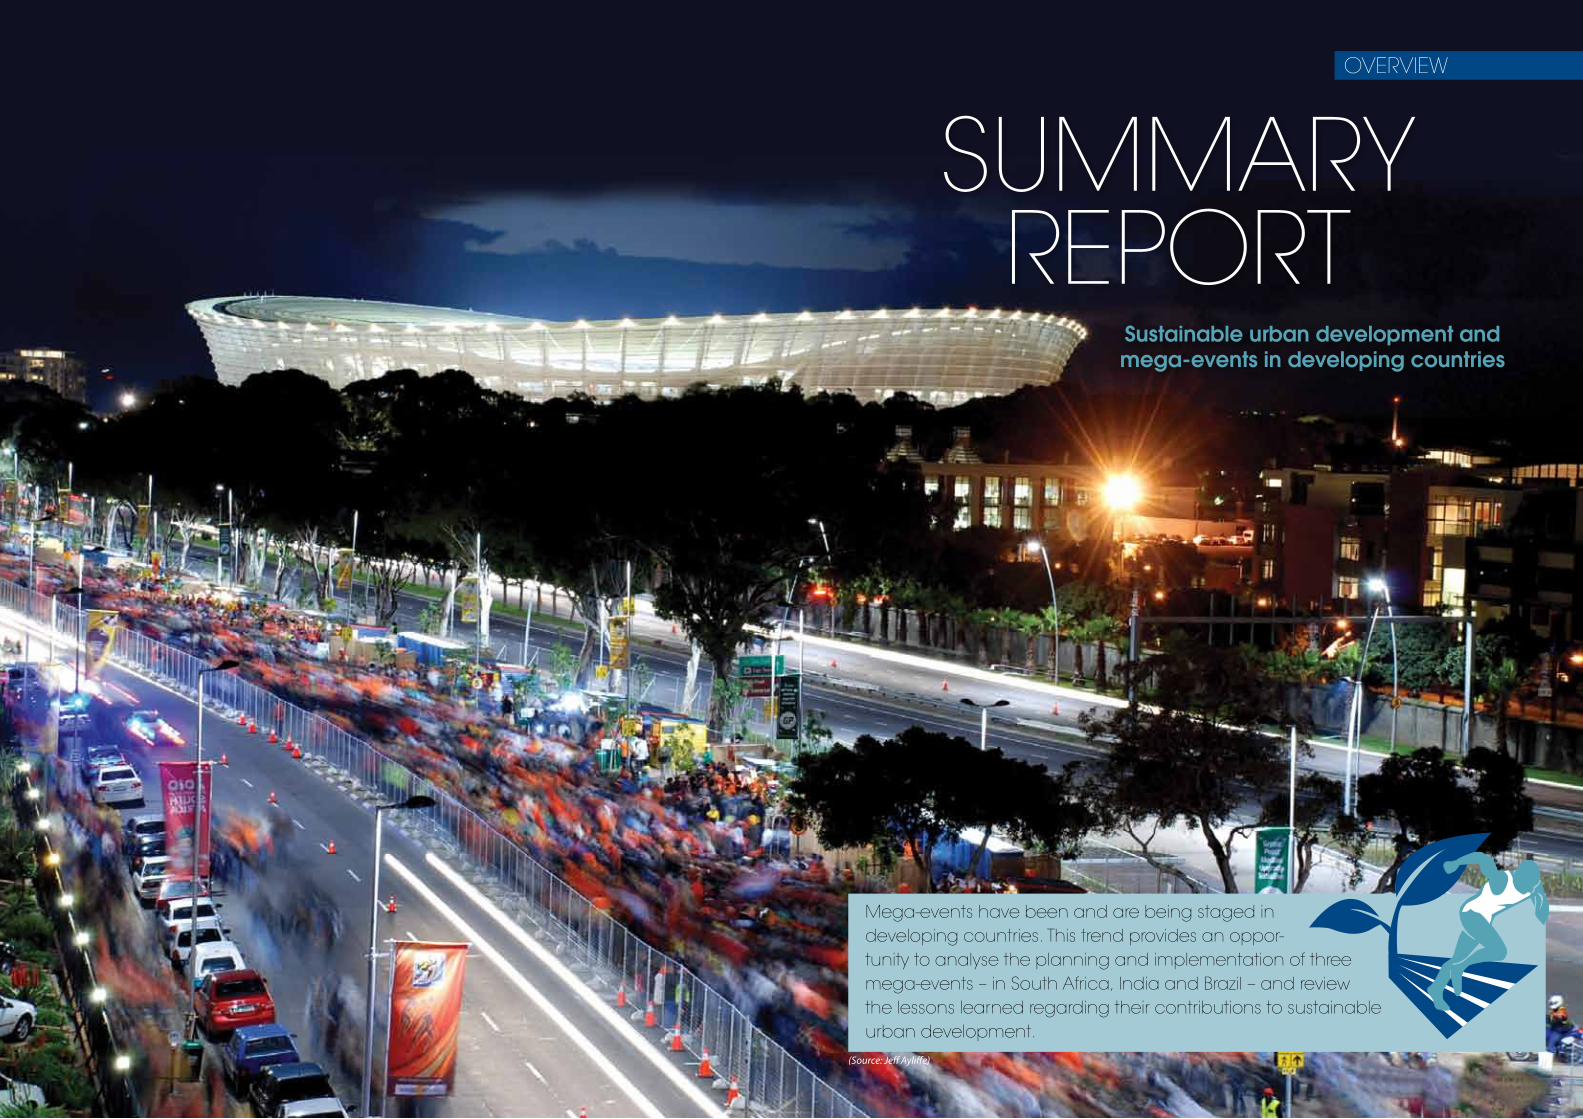
mega-events have been and are being staged in developing countries. this trend provides an oppor - tunity to analyse the planning and implementation of three mega-events – in south africa, india and Brazil – and review the lessons learned regarding their contributions to sustainable urban development.
(Source: Jeff Ayliffe)
16 • SuStainable Mega-eventS in Developing CountrieS Summary report • 17
summary report
1.1 SuStainable DevelopMent anD Mega-eventS in CitieS: a ConCeptual fraMework
1.1.1 Urban Development ChallengesOne of the most powerful global mega-trends is increased urbanisation, marking the 21st century as the “Century of the City” (UN-HABITAT 2008:X). The United Nations Human Settlement Programme (UN-HABITAT)1 estimates that by 2050 some 70% of the world population will live in cities. Agenda 21, which is a blueprint for sustainable development, explicitly recognises that while the consumption patterns of cities in industrialised countries were severely stressing the global ecosystem, their counter-parts in the developing world were unable even to meet their demands for energy, infrastructure, water and sanitation to overcome basic economic and social problems. Urban growth rates are highest in the developing world, which absorbs an average of 5 million new urban residents every month and is responsible for 95% of the world’s urban population growth. By 2050, the total urban population of the developing world will more than double, increasing from 2.3 billion in 2005 to 5.3 billion (UN-HABITAT 2010a). Asia will host 63% of the global urban population, Africa almost a quarter. Latin America is currently the most urbanised region in the developing world with 77% already living in urban areas. India’s urban population has grown from 290 million in 2001 to 340 million in 2008 and is projected to reach 590 million by 2030 (UNEP 2011a:20).
Urban growth is particularly strong in many of the megacities2. In 2007 UN-HABITAT listed a total of 19 megacities, while 26 are expected for 2025 with nearly half a billion inhabitants.
UN-HABITAT analysed the causes of population growth in 245 of the fastest growing cities in the developing world between 1990 and 2000. The predominant drivers are shown in the following table:
The most important drivers are economic and industrial policies, and their associ-ated strategic investments, in two key areas: transport and communication infrastruc-ture and the trade service sectors.
Rapid urban growth directly increases the complexity of the development chal-lenges that cities will face in future. Given this reality, the concept of a ‘sustainable city’ becomes relevant. The Sustainable Cities Programme (SCP)3 defines a ‘sustainable city’ as one in which achievements in economic, social and physical development are made to last (UN-HABITAT 1998). Thus a sustainable city considers the three dimen-sions – economic, social and environmental – of sustainability.
Economic The expected increase of the urban population in developing countries of 3 billion
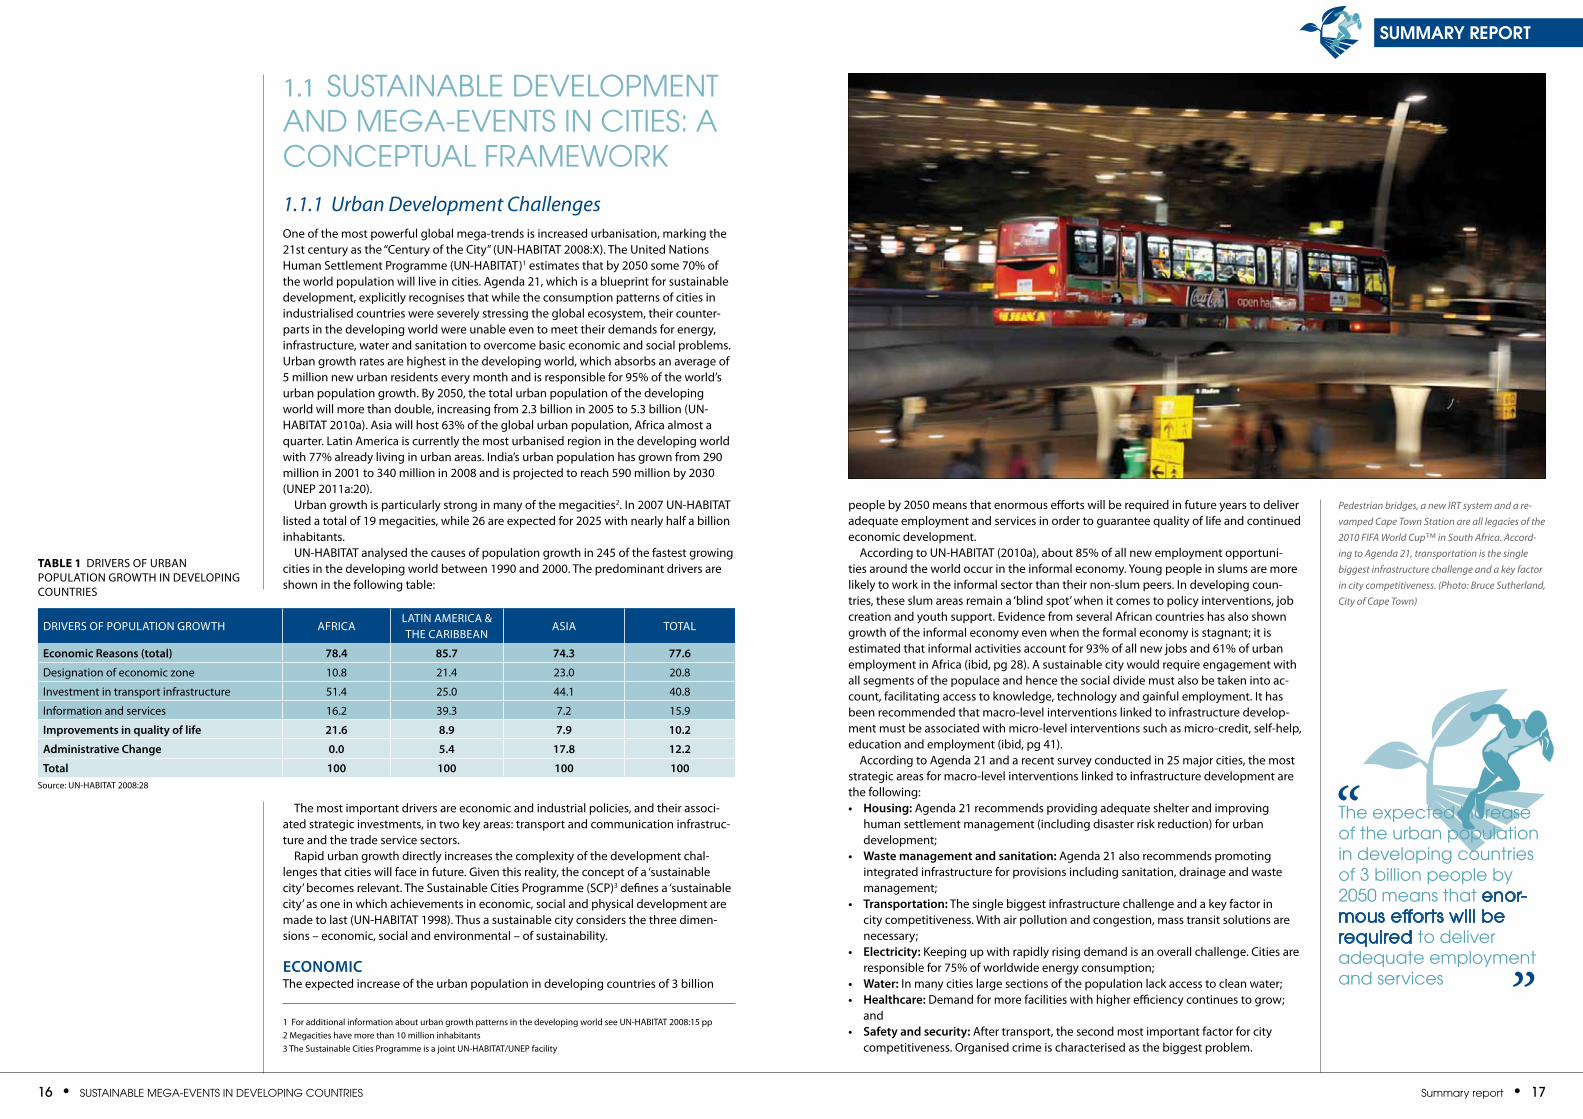
Pedestrian bridges, a new IRT system and a re-vamped Cape Town Station are all legacies of the 2010 FIFA World Cup™ in South Africa. Accord-ing to Agenda 21, transportation is the single biggest infrastructure challenge and a key factor in city competitiveness. (Photo: Bruce Sutherland, City of Cape Town)
people by 2050 means that enormous efforts will be required in future years to deliver adequate employment and services in order to guarantee quality of life and continued economic development.
According to UN-HABITAT (2010a), about 85% of all new employment opportuni-ties around the world occur in the informal economy. Young people in slums are more likely to work in the informal sector than their non-slum peers. In developing coun-tries, these slum areas remain a ‘blind spot’ when it comes to policy interventions, job creation and youth support. Evidence from several African countries has also shown growth of the informal economy even when the formal economy is stagnant; it is estimated that informal activities account for 93% of all new jobs and 61% of urban employment in Africa (ibid, pg 28). A sustainable city would require engagement with all segments of the populace and hence the social divide must also be taken into ac-count, facilitating access to knowledge, technology and gainful employment. It has been recommended that macro-level interventions linked to infrastructure develop-ment must be associated with micro-level interventions such as micro-credit, self-help, education and employment (ibid, pg 41).
According to Agenda 21 and a recent survey conducted in 25 major cities, the most strategic areas for macro-level interventions linked to infrastructure development are the following: • Housing: Agenda 21 recommends providing adequate shelter and improving
human settlement management (including disaster risk reduction) for urban development;
• Waste management and sanitation: Agenda 21 also recommends promoting integrated infrastructure for provisions including sanitation, drainage and waste management;
• Transportation: The single biggest infrastructure challenge and a key factor in city competitiveness. With air pollution and congestion, mass transit solutions are necessary;
• Electricity: Keeping up with rapidly rising demand is an overall challenge. Cities are responsible for 75% of worldwide energy consumption;
• Water: In many cities large sections of the population lack access to clean water;• Healthcare: Demand for more facilities with higher efficiency continues to grow;
and• Safety and security: After transport, the second most important factor for city
competitiveness. Organised crime is characterised as the biggest problem.
DRIvERS Of POPULATION GROWTH AfRICALATIN AmERICA & THE CARIBBEAN
ASIA TOTAL
Economic Reasons (total) 78.4 85.7 74.3 77.6
Designation of economic zone 10.8 21.4 23.0 20.8
Investment in transport infrastructure 51.4 25.0 44.1 40.8
Information and services 16.2 39.3 7.2 15.9
improvements in quality of life 21.6 8.9 7.9 10.2
Administrative change 0.0 5.4 17.8 12.2
Total 100 100 100 100Source: UN-HABITAT 2008:28
table 1 DRIvERS Of URBAN POPULATION GROWTH IN DEvELOPING COUNTRIES
1 for additional information about urban growth patterns in the developing world see UN-HABITAT 2008:15 pp2 megacities have more than 10 million inhabitants3 The Sustainable Cities Programme is a joint UN-HABITAT/UNEP facility
”
“the expected increase of the urban population in developing countries of 3 billion people by 2050 means that enor-mous efforts will be required to deliver adequate employment and services
18 • SuStainable Mega-eventS in Developing CountrieS Summary report • 19
summary report
SociAl In spite of the fact that many cities are so called ‘engines of development’, the inequal-ity4 within cities is growing and urban areas are becoming the predominant locations for poverty (Globalscan 2010:16). The rates of unemployment and underemployment remain very high in many regions and people have to survive through informal eco-nomic activities. Youth in particular suffer from the lack of employment opportunities. Today, huge numbers of young people remain unemployed in the developing world: out of the 1.1 billion young people world wide between the ages of 15 and 24, only about 548 million, are employed (UN-HABITAT 2008:86).
Latin America and Africa in particular exhibit extremely high levels of urban inequality. On the top of the lists in Latin America and Africa are Brazilian and South African cities with Gini coefficients above 0.65. In Asia, India will experience rising lev-els of urban inequality in the future (UN Habitat 2008:XII). In some regions with very high levels of inequality, the benefits of economic growth did not have a beneficial effect on the poor. The consequences of such social and economic disparities are, as the recent riots in England demonstrate, profoundly worrying: “Inequalities create social and political fractures within society that can develop into social unrest. This is par-ticularly true in places experiencing both high levels of inequality and endemic poverty, which increase the risk of political tension and social divisions that can threaten national security and economic development. Social unrest and insecurity, in turn, reduce incen-tives for investment and force governments to increase the amount of public resources devoted to internal security – resources that might have otherwise been spent on more productive sectors of the economy or on social services and infrastructure” (UN-HABITAT 2008:xiii).
Inequality and poverty in cities are most apparent in existing slums. Their inhabit-ants normally experience very limited access to basic services such as education, health, basic sanitation, etc. In the developing world, one third of the urban popu-lation lives in slums. The highest percentages can be found in Sub-Saharan Africa (62.2%) and in South Asia (42.9%)6.
EnviRonmEnTAl Cities today face serious environmental crises. Although specific scenarios differ, each has significant negative effects on the well being of the urban population. The pat-tern of development and economic growth, which characterised recent decades, has resulted in the degradation and destruction of a significant part of the world’s major ecosystem goods and services, with direct negative consequences for urban areas.
One of the most serious problems for many urban areas is freshwater scarcity. Stud-ies estimate (mcKinsey 2009:5pp) that by 2030, the world will face a 40% gap between water demand and supply as the following figure illustrates:
One-third of the population in developing countries will live in basins where this deficit is larger than 50% (mcKinsey 2009:5). Severe quality issues caused by low coverage of sanitation and water treatment systems exacerbate the challenge. UNEP (2011a:10) points out that more than 884 million people lack access to clean drinking water, while 2.6 billion lack access to adequate sanitation services, with serious nega-tive health consequences as a result.
Other environmental burdens at the local level include air pollution and inadequate waste management. Air pollution has caused health problems in several developing countries and especially in newly industrialising countries. The World Health Organiza-tion (WHO) estimates that more than 1 billion people in Asia alone are exposed to air pollution that exceeds WHO guidelines (UN-HABITAT 2008:123).
Inadequate waste management also increases health risks. In general, waste gener-ated in cities in the developing world consists mostly of organic material. Although recycling and reuse of solid waste are common practices, they are often carried out by the informal sector under hazardous conditions. In many countries recycling and reuse has not been adopted as a national policy.
Urban areas are also the principal drivers of climate change. Cities account for 60-80% of worldwide energy consumption (UNEP 2011a:20) and 80% of carbon emis-sions (Clinton foundation 2010:21). In fact, cities are considered the key players in the carbon emissions and climate change arenas because most human and economic activities are concentrated in urban areas. Industrial activities and built-up areas in cities consume a large amount of the world’s energy (UN-HABITAT 2008:133). The single largest contributor to global greenhouse gas emissions is the building sec-tor, mainly because one-third of global energy end-use takes place within buildings (UNEP 2011a:20). The other most relevant sector is urban transport. Current transport systems are primarily built around private vehicles and are responsible for the highest contribution to climate change and related health risks. Nearly a quarter of the global energy-related CO2-emissions come from transportation. furthermore, the environ-mental and social costs such as air pollution, accidents and congestion can total 10% of a regional or national GDP (UNEP 2011a:22p.).
4 UN-HABITAT (2008:50) uses the term “inequality” in the sense of “unequal distribution of opportunities“. 5 A Gini coefficient of over 0,6 means in concrete terms (UN-HABITAT 2008:51): Extremely high levels of inequality,
not only among individuals, but also among social groups (known as “horizontal inequality”), i.e., wealth concen-trated among certain groups at the exclusion of the majority.
6 for further information about urban slums see UN-HABITAT 2008:90pp
Figure 1 THE DEmAND AND SUPPLY SCENARIO Of WATERSource: mcKinsey and Company 2009:6
Municiple & Domestic
Industry
Agriculture
Existingwithdrawls
2030withdrawls
Basins with deficits
Basins with surplus
Existingaccessible, reliable, sustrainable supply
Surface water
Ground water
4,500600800
3,100
6,900900
1,500
4,500
4,200700
3,500
-40%2%
CAGR
Relevant supply quanitity is much lower than the
absolute renewable water available in nature
2,800
100
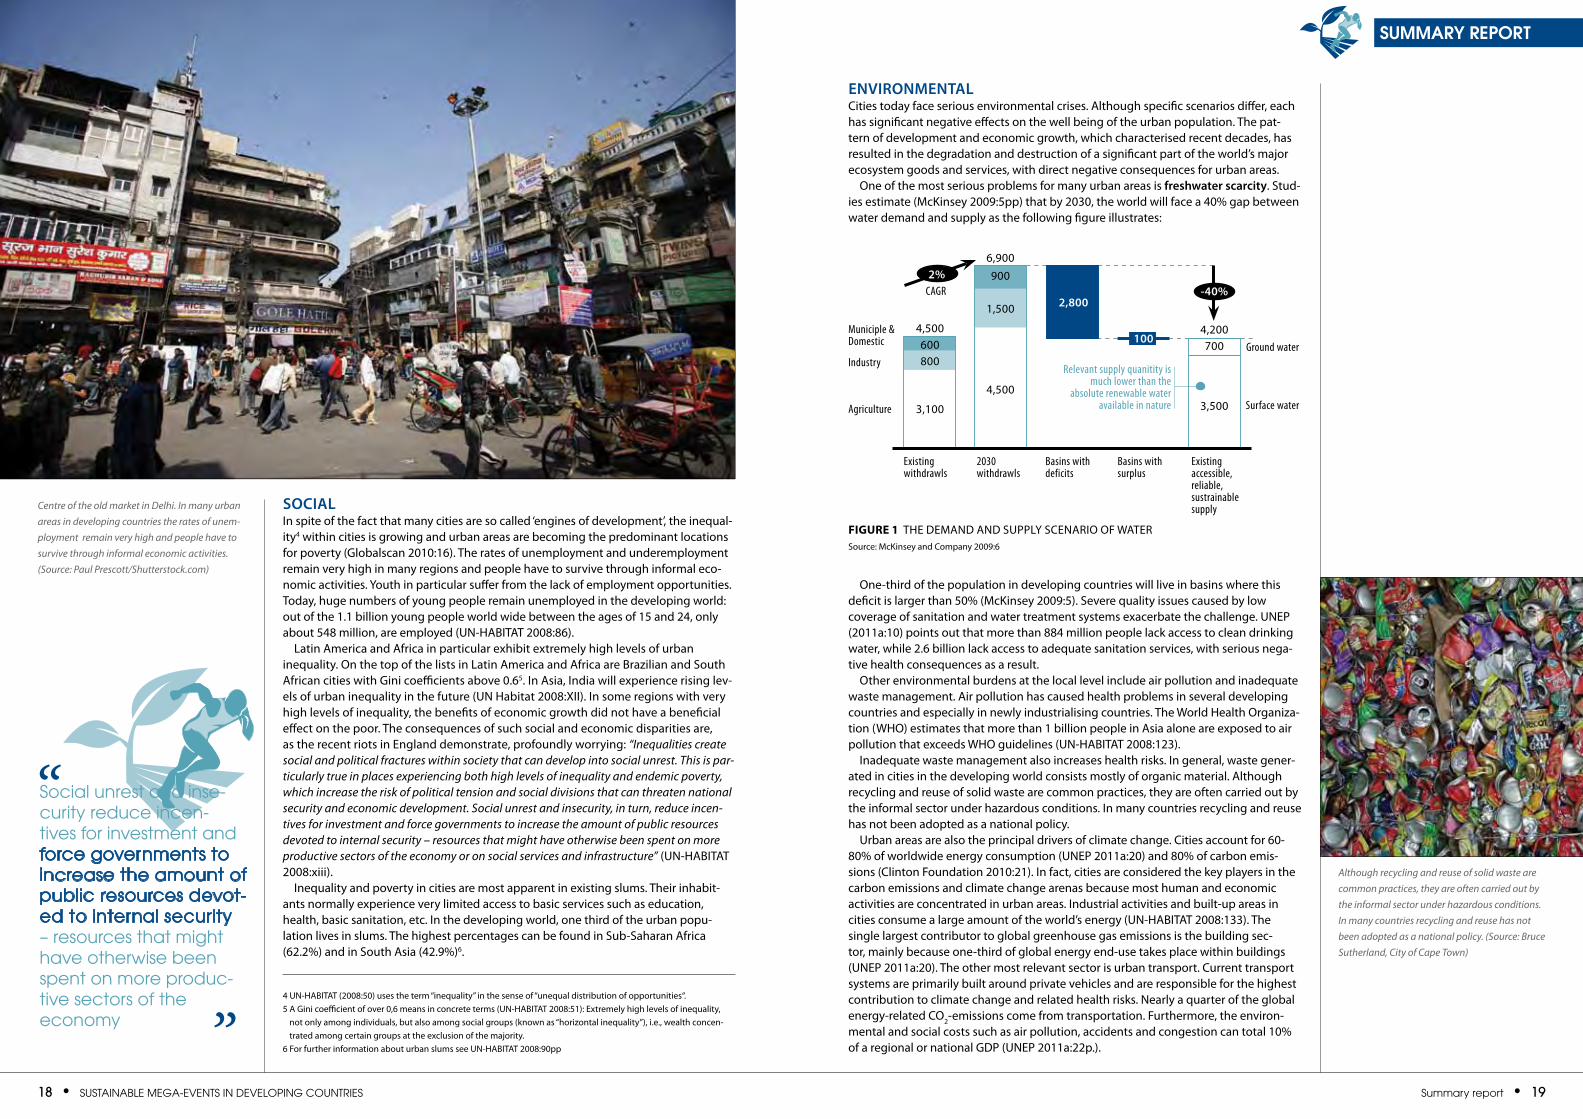
Centre of the old market in Delhi. In many urban areas in developing countries the rates of unem-ployment remain very high and people have to survive through informal economic activities. (Source: Paul Prescott/Shutterstock.com)
Social unrest and inse-curity reduce incen-tives for investment and force governments to increase the amount of public resources devot-ed to internal security – resources that might have otherwise been spent on more produc-tive sectors of the economy ”
“Although recycling and reuse of solid waste are common practices, they are often carried out by the informal sector under hazardous conditions. In many countries recycling and reuse has not been adopted as a national policy. (Source: Bruce Sutherland, City of Cape Town)
20 • SuStainable Mega-eventS in Developing CountrieS Summary report • 21
summary report
Hence, “the emerging picture of the 21st century city fits many descriptions. Some are centres of rapid industrial growth and wealth creation, often accompanied by harm-ful waste and pollution. Others are characterised by stagnation, urban decay and rising social exclusion and intolerance. Both scenarios point to the urgent need for new, more sustainable approaches to urban development. Both argue for greener, more resilient and inclusive towns and cities that can help combat climate change and resolve age-old urban inequalities”(UN Secretary General Ban Ki-moon quoted in UN-HABITAT 2010a).
Key challenges for sustainable development as outlined above are relevant for the host country cities that are the subject of this study (see Table 2). As developing coun-tries, they still face poverty and high social inequality, despite high rates of economic growth. India, Brazil and South Africa are further distinguished by strong urbanisation trends; Rio de Janeiro and New Delhi are megacities. All three countries have large deficits in urban infrastructure, which include the transport sector and main environ-mental management systems. Public security problems (crime rate, etc.) are serious. All three countries face serious environmental problems, with a high degree of pollu-tion and significant GHG emissions.
1.1.2 Cities and Sustainable Development The development community is currently preparing for the United Nations Confer-ence on Sustainable Development (UNCSD) to be held at Rio de Janeiro in June 2012, at what is more commonly known as Rio+20. The year 2012 will mark twenty years since the United Nations Conference on Environment and Development (UNCED) or ‘Earth Summit’ was held at Rio de Janeiro in 1992 when 108 Heads of State and Government and representatives from international agencies and non-governmental organizations from across the globe met to discuss issues around sustainable develop-
ment. The two themes of the 2012 Conference are (i) Green Economy in the context of sustainable development and poverty eradication (GESDPE) and (ii) Institutional framework for Sustainable Development (IfSD).
The World Commission on Sustainable Development defined sustainable develop-ment as “development that meets the needs of the present without compromising the ability of future generations to meet their own needs”. Important components linked to sustainable development are depicted in the following venn diagram (figure 2) – these include social, economic, environmental, social equity (social and economic), green economy (economic and environmental), ecological society (environmental and social), and sustainable development (social, economic and environmental).
The concept of ‘Green Economy’ has moved into the mainstream of policy discourse as a consequence of the widespread disillusionment with the prevailing economic development paradigm and the mentioned environmental, social and economic crises scenarios. UNEP (2011b:16) defines ‘Green Economy’ as one that results in “improved human well-being and social equity, while significantly reducing environmental risks and ecological scarcities. Green economy is low carbon, resource efficient, and socially inclu-sive.” ‘Green Economy’ will be one of the central topics discussed by the Rio 2012 Earth Summit.
In order to realise the potential of mega-events in developing country cities, govern-ments and institutions at the national and international levels have important roles to play. Collaboration between national and international institutions with major groups (including local authorities) is relevant in this context. This subject is also of relevance to the Institutional framework for Sustainable Development (IfSD) theme of the forth-coming UN Summit at Rio.
The concept of a ‘Green Economy’ does not replace sustainable development, but there is a growing understanding that achieving sustainability rests almost entirely on getting the economy right (UNEP 2011a:1). On the other hand such an assumption does not consider the complexity of economy and society in developing countries where sustainability cannot be linked to the economy alone. In developing countries a large proportion of the population is still not integrated with economic development, for example small and marginal farmers in India7. With exclusive reference to economic policy, UNEP states that: “In sum, moving towards a green economy must become a stra-tegic economic policy agenda for achieving sustainable development. A green economy recognises that the goal of sustainable development is improving the quality of human life within the constraints of the environment, which include combating global climate change, energy insecurity, and ecological scarcity. However, a green economy cannot be focused exclusively on eliminating environmental problems and scarcity. It must also ad-dress the concerns of sustainable development with intergenerational equity and eradicat-ing poverty” (UNEP 2011b:19).
HOST COUNTRY AND CITY ECONOmIC SOCIAL ENvIRONmENTAL
Brazil Rio de Janeiro
• High levels of urbanisation, urban growth, megacities;
• High slum prevalence as share of total housing;
• Inadequate and insufficient urban social infrastructure (water-waste-management systems, transport etc.).
• Poverty and very high levels of social inequality;
• Under- and unemployment especially among young people;
• Deficits in human resource development and capacity capacity building;
• massive security problems.
• Insufficient availability of clean water;
• Inadequate waste and sewage treatment;
• Air pollution;• Deforestation and biodiversity
loss;• GHG-Emissions from the trans-
port sector
indianew Delhi
• Increasing population;• Expanding urban agglomera-
tion;• Low sex ratio;• Severe lack of employment
opportunities;• Inadequate social infrastructure
for provisioning of services such as water and health.
• High slum prevalence as share of total housing;
• Consistently high absolute numbers of people/large popu-lation living in poverty;
• Limited access to basic services like water, education, health;
• Security concerns.
• Air pollution;• Water quality and quantity –
both surface water and ground-water;
• Inadequate waste management;• Prone to natural hazards such
as earthquakes; vulnerable to climate change impacts includ-ing climate extremes;
• Biodiversity loss and land degradation.
South Africacape Town
• High growth rates of urban population and high urbanisa-tion rate;
• Lack of adequate housing, strong growth of the informal housing sector:
• Difficulties in providing of infra-structure and basic services.
• High proportion of the popula-tion living in poverty;
• High level of social inequality;• Lack of adequate employment
and income opportunities;• very limited access to roads,
running water, sewage and refuse removal;
• massive public security prob-lems (crime rate, etc.).
• South Africa is the highest emitter of GHG in Africa;
• High dependence on coal-fired stations as main energy source;
• High residential and commer-cial GHG-emissions in Cape Town through the use of coal-based energy;
• Environmental pollution.
table 2 KEY CHALLENGES IN THE HOST CITIES DELHI, CAPE TOWN AND RIO DE JANEIRO
Figure 2 COmPONENTS LINKED TO SUSTAINABLE DEvELOPmENTSource: GoI 2010: 31p
7 In Brazil the expression ‘Green and Inclusive Economy’ is frequently used; In India the terms ‘Inclusive’ and ‘Sustain-able development’ are used.
1
2 3
4 5
6
7
1 Social2 Economic3 Environmental4 Social equality/distributive justice5 Ecological society6 Green economy7 Sustainable development
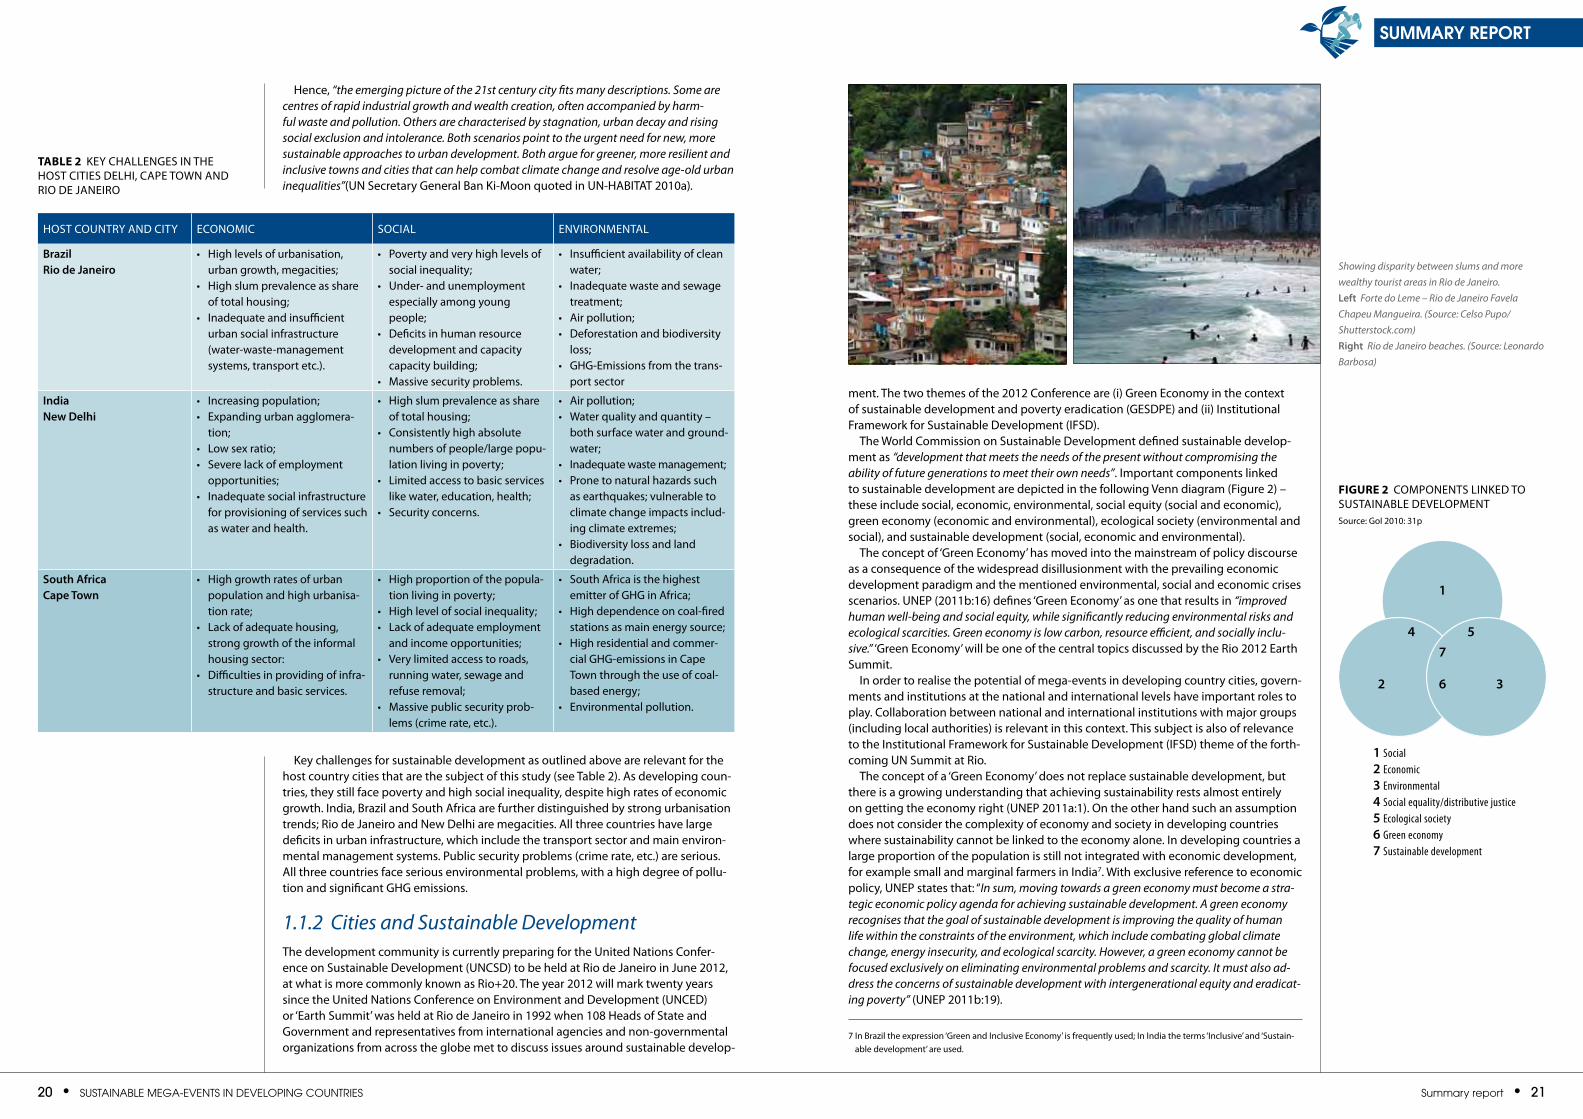
Showing disparity between slums and more wealthy tourist areas in Rio de Janeiro.left Forte do Leme – Rio de Janeiro Favela Chapeu Mangueira. (Source: Celso Pupo/ Shutterstock.com)Right Rio de Janeiro beaches. (Source: Leonardo Barbosa)
22 • SuStainable Mega-eventS in Developing CountrieS Summary report • 23
summary report
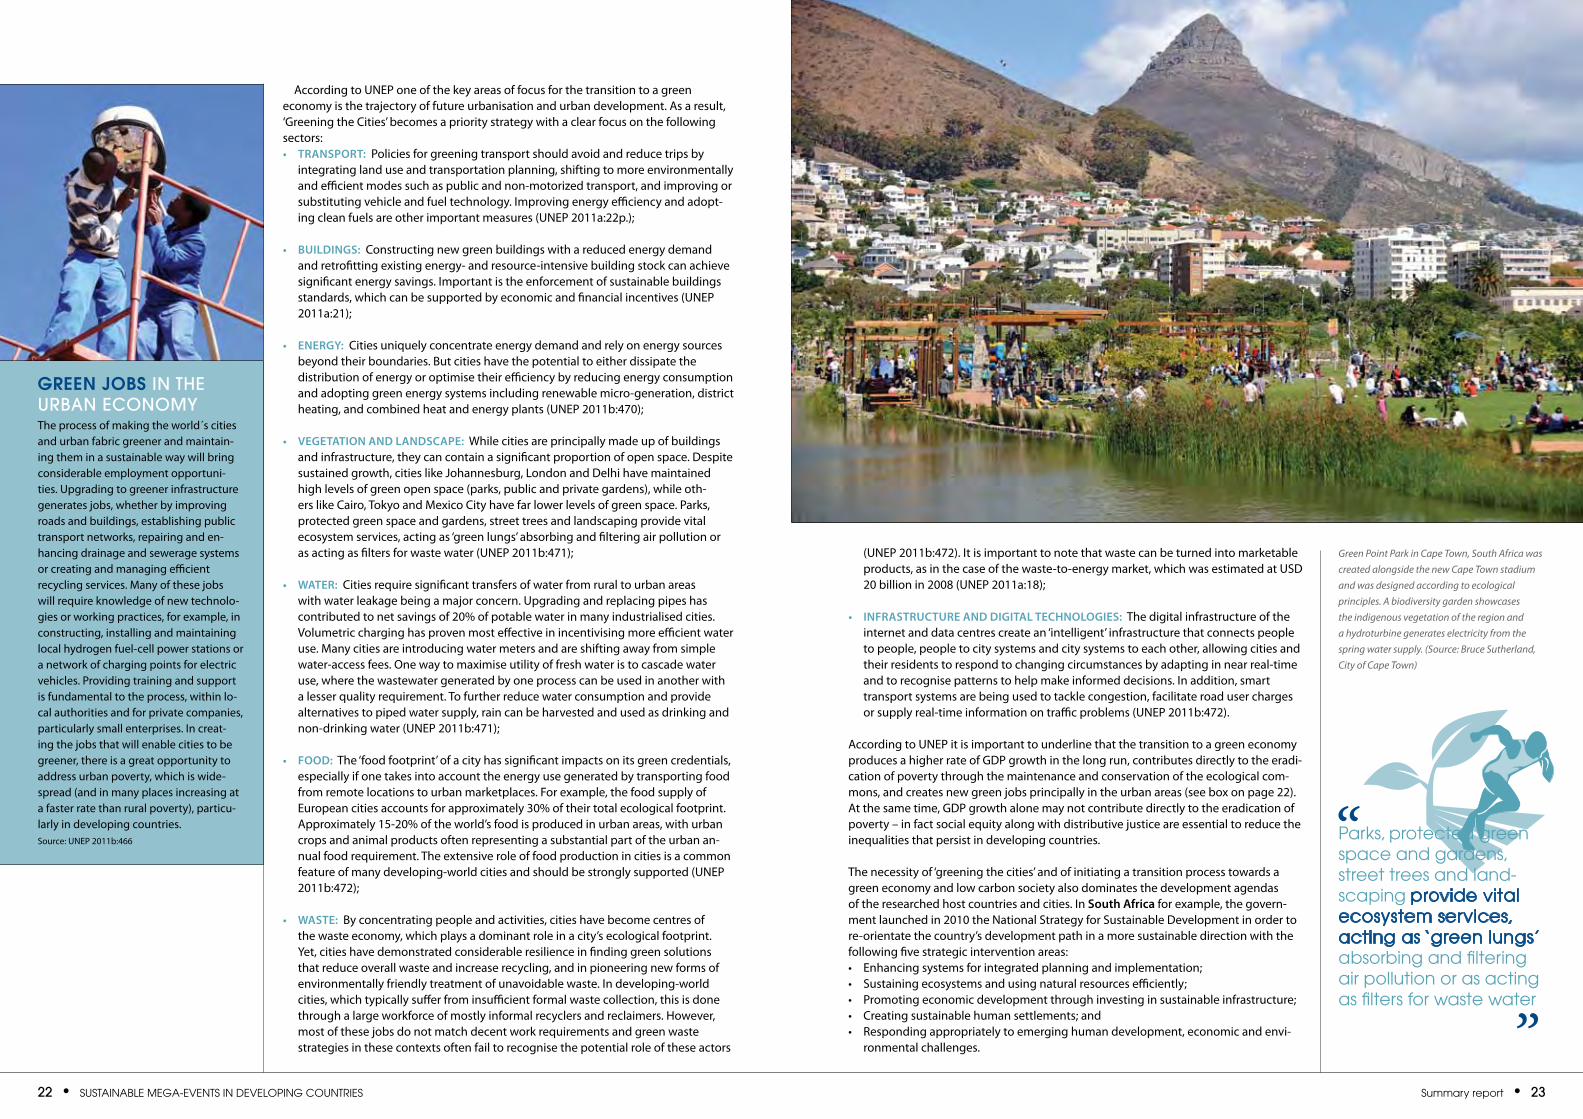
According to UNEP one of the key areas of focus for the transition to a green economy is the trajectory of future urbanisation and urban development. As a result, ‘Greening the Cities’ becomes a priority strategy with a clear focus on the following sectors:• TRAnSpoRT: Policies for greening transport should avoid and reduce trips by
integrating land use and transportation planning, shifting to more environmentally and efficient modes such as public and non-motorized transport, and improving or substituting vehicle and fuel technology. Improving energy efficiency and adopt-ing clean fuels are other important measures (UNEP 2011a:22p.);
• BuilDingS: Constructing new green buildings with a reduced energy demand and retrofitting existing energy- and resource-intensive building stock can achieve significant energy savings. Important is the enforcement of sustainable buildings standards, which can be supported by economic and financial incentives (UNEP 2011a:21);
• EnERgy: Cities uniquely concentrate energy demand and rely on energy sources beyond their boundaries. But cities have the potential to either dissipate the distribution of energy or optimise their efficiency by reducing energy consumption and adopting green energy systems including renewable micro-generation, district heating, and combined heat and energy plants (UNEP 2011b:470);
• vEgETATion AnD lAnDScApE: While cities are principally made up of buildings and infrastructure, they can contain a significant proportion of open space. Despite sustained growth, cities like Johannesburg, London and Delhi have maintained high levels of green open space (parks, public and private gardens), while oth-ers like Cairo, Tokyo and mexico City have far lower levels of green space. Parks, protected green space and gardens, street trees and landscaping provide vital ecosystem services, acting as ‘green lungs’ absorbing and filtering air pollution or as acting as filters for waste water (UNEP 2011b:471);
• WATER: Cities require significant transfers of water from rural to urban areas with water leakage being a major concern. Upgrading and replacing pipes has contributed to net savings of 20% of potable water in many industrialised cities. volumetric charging has proven most effective in incentivising more efficient water use. many cities are introducing water meters and are shifting away from simple water-access fees. One way to maximise utility of fresh water is to cascade water use, where the wastewater generated by one process can be used in another with a lesser quality requirement. To further reduce water consumption and provide alternatives to piped water supply, rain can be harvested and used as drinking and non-drinking water (UNEP 2011b:471);
• FooD: The ‘food footprint’ of a city has significant impacts on its green credentials, especially if one takes into account the energy use generated by transporting food from remote locations to urban marketplaces. for example, the food supply of European cities accounts for approximately 30% of their total ecological footprint. Approximately 15-20% of the world’s food is produced in urban areas, with urban crops and animal products often representing a substantial part of the urban an-nual food requirement. The extensive role of food production in cities is a common feature of many developing-world cities and should be strongly supported (UNEP 2011b:472);
• WASTE: By concentrating people and activities, cities have become centres of the waste economy, which plays a dominant role in a city’s ecological footprint. Yet, cities have demonstrated considerable resilience in finding green solutions that reduce overall waste and increase recycling, and in pioneering new forms of environmentally friendly treatment of unavoidable waste. In developing-world cities, which typically suffer from insufficient formal waste collection, this is done through a large workforce of mostly informal recyclers and reclaimers. However, most of these jobs do not match decent work requirements and green waste strategies in these contexts often fail to recognise the potential role of these actors
(UNEP 2011b:472). It is important to note that waste can be turned into marketable products, as in the case of the waste-to-energy market, which was estimated at USD 20 billion in 2008 (UNEP 2011a:18);
• inFRASTRucTuRE AnD DigiTAl TEcHnologiES: The digital infrastructure of the internet and data centres create an ‘intelligent’ infrastructure that connects people to people, people to city systems and city systems to each other, allowing cities and their residents to respond to changing circumstances by adapting in near real-time and to recognise patterns to help make informed decisions. In addition, smart transport systems are being used to tackle congestion, facilitate road user charges or supply real-time information on traffic problems (UNEP 2011b:472).
According to UNEP it is important to underline that the transition to a green economy produces a higher rate of GDP growth in the long run, contributes directly to the eradi-cation of poverty through the maintenance and conservation of the ecological com-mons, and creates new green jobs principally in the urban areas (see box on page 22). At the same time, GDP growth alone may not contribute directly to the eradication of poverty – in fact social equity along with distributive justice are essential to reduce the inequalities that persist in developing countries.
The necessity of ‘greening the cities’ and of initiating a transition process towards a green economy and low carbon society also dominates the development agendas of the researched host countries and cities. In South Africa for example, the govern-ment launched in 2010 the National Strategy for Sustainable Development in order to re-orientate the country’s development path in a more sustainable direction with the following five strategic intervention areas:• Enhancing systems for integrated planning and implementation;• Sustaining ecosystems and using natural resources efficiently;• Promoting economic development through investing in sustainable infrastructure;• Creating sustainable human settlements; and• Responding appropriately to emerging human development, economic and envi-
ronmental challenges.
Green Jobs in the Urban economyThe process of making the world´s cities and urban fabric greener and maintain-ing them in a sustainable way will bring considerable employment opportuni-ties. Upgrading to greener infrastructure generates jobs, whether by improving roads and buildings, establishing public transport networks, repairing and en-hancing drainage and sewerage systems or creating and managing efficient recycling services. many of these jobs will require knowledge of new technolo-gies or working practices, for example, in constructing, installing and maintaining local hydrogen fuel-cell power stations or a network of charging points for electric vehicles. Providing training and support is fundamental to the process, within lo-cal authorities and for private companies, particularly small enterprises. In creat-ing the jobs that will enable cities to be greener, there is a great opportunity to address urban poverty, which is wide-spread (and in many places increasing at a faster rate than rural poverty), particu-larly in developing countries.Source: UNEP 2011b:466
Green Point Park in Cape Town, South Africa was created alongside the new Cape Town stadium and was designed according to ecological principles. A biodiversity garden showcases the indigenous vegetation of the region and a hydroturbine generates electricity from the spring water supply. (Source: Bruce Sutherland, City of Cape Town)
parks, protected green space and gardens, street trees and land-scaping provide vital ecosystem services, acting as ‘green lungs’ absorbing and filtering air pollution or as acting as filters for waste water
”
“
24 • SuStainable Mega-eventS in Developing CountrieS Summary report • 25
summary report
But South African cities like Cape Town are also implementing their own sustainability initiatives with a special focus on environmental policies in areas such as integrated waste management, energy security and efficiency, renewable energy use and climate change.
The sustainability agenda of Rio de Janeiro includes the following areas: • Employment and income;• Urban infrastructure;• Environment;• Public Transport; and• Social services programmes.
The environmental development priorities include:• Upgrading of the water and sewage system, as well as the building of streets,
particularly in those regions of the city that are responsible for the pollution of Guanabara Bay;
• Construction of drainage systems in Jacarepaguá; • Construction of a new, environmentally compatible landfill site; • Implementation of a climate protection policy in the city with clearly defined emis-
sion reduction objectives and the relevant implementation measures; • Upgrading of the bicycle lanes in Rio; and• Reforestation and restoration of degraded surfaces, and protection of biodiversity.
The sustainability agenda as reflected in annual plans of Delhi and Delhi masterplan 2021 includes the following areas:• Improving air quality, water quality, biodiversity, waste management, transport
networks, energy security, and disaster risk reduction; • Enhancing awareness with the help of Resident Welfare Associations and 1900 Eco
Clubs in schools and colleges of the city;• Realising the goals of the Delhi Climate Change Agenda 2009-2012. Delhi is the
only city in the country to have an action plan related to climate change, which is formulated on the lines of the National Action Plan on Climate Change;
• Controlling retail prices of essential commodities in Delhi through market interven-tions;
• Promoting special economic zones, high-tech, environment-friendly, and knowl-edge-based industries;
• Increasing hospital bed density per thousand population from 2.2 to 5;• Housing for urban populace especially economically weaker sections; and• Increasing efforts towards implementing the ‘Right to Education Act’.
1.1.3 Mega-Events as Catalysts for Sustainable Development: The Role of Event Greening in CitiesToday, there is very stiff competition between countries and cities to host so called ‘mega-events’. Sports mega-events such as the Olympic Games, fIfA World Cup™, and the CGf Commonwealth Games are especially contested because they attract millions of spectators to the country and city and have intense media coverage with global reach. On the other hand they require enormous investments.
The motivation to host mega-events is based on at least two factors (Kenney and varrel 2011:1):• “A successful hosting offers global exposure, prestige and legitimacy to the host city
and the entire country, which is especially desired by emerging economies eager to prove that they have become major players on the global stage and
• Secondly, hosting a mega-event rests on the promise of an economic windfall coupled with a substantial urban makeover”.
furthermore, staging a mega-event offers a unique opportunity for the host cities not only to present themselves to the world and achieve economic benefits, but there is also the possibility of creating a ‘green legacy’ in some sectors, which would help the cities to face their future development challenges. The precondition for the creation of a green legacy is the ‘greening of the event’, the process of incorporating socially
and environmentally responsible decision-making into the planning, organisation and implementation of, and participation in, an event (see box alongside). Event-Greening has two key dimensions (Borchers et al. 2010:16):• The mitigation of the direct environmental impact, or ‘footprint’, of the event
(including the carbon dioxide emissions, as well as waste created, water and energy used, biodiversity threatened, etc.) and
• The potential of the event to catalyse a broader societal, political and economic shift towards more sustainable lifestyles and production patterns, and to leave a positive legacy.
The hosting of a mega-event puts severe pressure on the urban infrastructure and ser-vices related to transportation, water consumption or waste treatment and can have significant consequences. Infrastructure projects and the presence of high number of tourists and spectators will cause a significant increase in greenhouse gas emissions during the event. Overall, mitigation actions for these possible negative consequences have to be planned and implemented in order to guarantee the sustainability of the event.
On the other hand, the event can offer a unique opportunity to catalyse a broader change towards a green economy and sustainable lifestyles. Actions that have a direct effect on key sectors that drive this transformation process (transport, waste, built environment or energy) are, for example:• Promotion of a low carbon and energy efficient public transport system and urban
mobility;• Use of renewable fuels in public and private event transport;• Implementation of a waste management system that prioritise the reduction, reuse,
recycling and treatment of waste; or• following guidelines for low carbon and energy efficient construction and building
management.
HiSToRy oF gREEning mEgA-EvEnTSThe history of greening mega-events is a fairly recent process, where undoubtedly the International Olympic Committee (IOC) took the lead. In 1994, the IOC recognised the importance of the environment and sustainable development, and in 1996 added a paragraph on environmental protection to the Olympic Charter (IOC 2009:1). The IOC´s role in this context is “to encourage and support a responsible concern for environmen-tal issues, to promote sustainable development in sport and to require that the Olympic Games are held accordingly”8. As part of its implementation of this amendment, the IOC included an environmental dimension as one of the mandatory elements of bids to
what is event GreeninG? Event-greening is the process of incor-porating socially and environmentally responsible decision-making into the planning, organisation and implementa-tion of, and participation in, an event. It involves including sustainable develop-ment principles and practices in all levels of event organisation, and aims to ensure that an event is hosted responsibly. It represents the total package of interven-tions at an event, and needs to be done in an integrated manner. Event-greening should start at the inception of the project, and should involve all the key role players, such as clients, organisers, venues, subcontractors and suppliers. It aims to achieve the following:
• To improve the resource efficiency of the entire event and supply chain management;
• To reduce negative environmental impacts, such as carbon emissions, waste ending up on landfill sites, and the effect on biodiversity;
• To increase economic, social and envi-ronmental benefits (triple-bottom line);
• To enhance the economic impact, such as local investment and long-term viability;
• To strengthen the social impact, such as community involvement and fair employment;
• To improve sustainable performance within an available budget;
• To present opportunities for more ef-ficient planning and use of equipment and infrastructure;
• To reduce the negative impact on local inhabitants;
• To protect the local biodiversity, water and soilresources;
• To apply the principles of eco-procure-ment of goods and services;
• To raise awareness of sustainability issues8 from Chapter 1 of the Olympic Charter
Bicycles along Copacabana beach. In Rio de Janeiro, one of the development priorities is the upgrading of the bicycle lanes in the city. (Source: Luiz Rocha/Shutterstock.com)
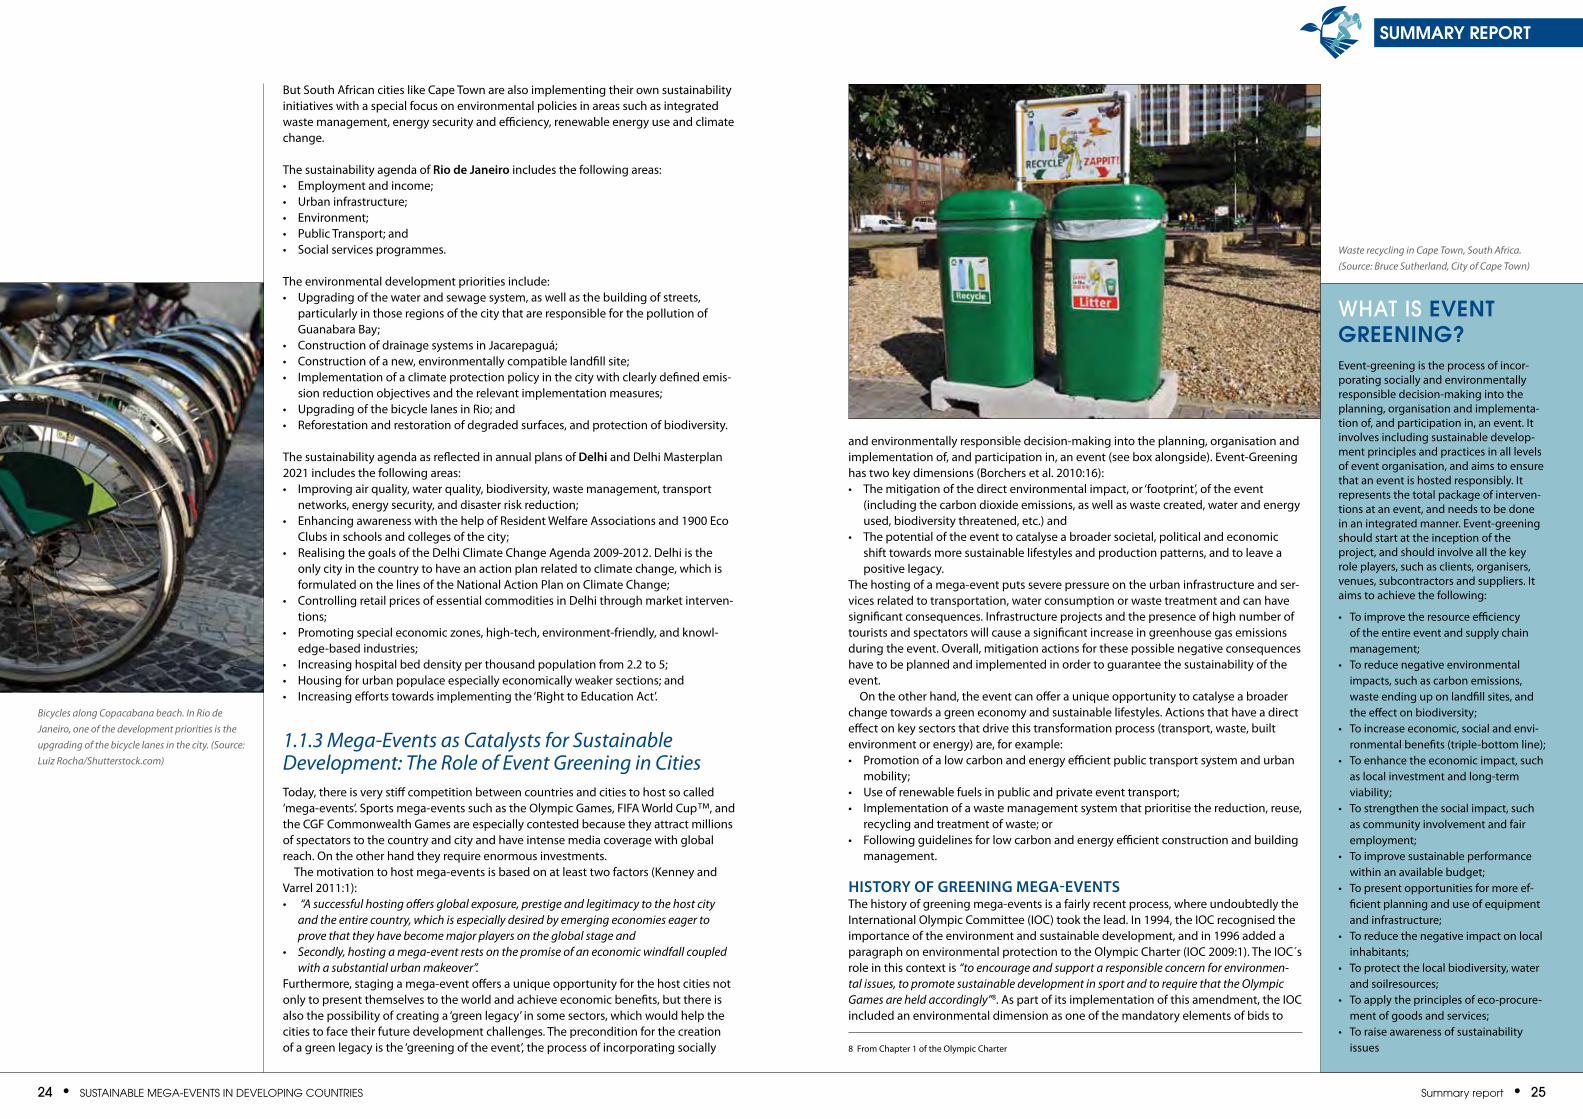
Waste recycling in Cape Town, South Africa. (Source: Bruce Sutherland, City of Cape Town)
26 • SuStainable Mega-eventS in Developing CountrieS Summary report • 27
summary report
host the Games. Another major milestone was the introduction of the Olympic Games Impact Study in 2003. In order to measure the impact of the Games, more than 100 indicators were created and grouped into three spheres of sustainable development, economic, socio-cultural and environmental (IOC 2009:3).
One of the first Olympic Games with a clear environmental agenda was Sydney 2000, where the key environmental achievements included access to public transport, solar power applications, building material selection, recycling of construction waste, energy and water conservation, and wetland restoration (IOC 2009:3). The London 2012 Organizing Committee has produced a London 2012 Sustainability Plan, which is structured according to five priority themes: Climate Change, waste, biodiversity, inclusion and healthy living. Sochi 2014 works with the ideas of carbon neutrality and zero waste (IOC 2009:4).
The first fIfA World Cup™ with a greening agenda was Germany 2006, where the Green Goal Programme was carried out in order to reduce to the greatest possible extent the adverse effects on the environment associated with organising the World Cup. ‘Green Goal’ was an integrated part of the planning and organising of the tourna-ment and a contribution towards the ‘sustainable legacy’ of the World Cup (OC 2006 fIfA World Cup™:9).
The evaluation of the Green Goal Programme showed that it achieved almost all objectives to a large extent (see box alongside). On the other hand, the Legacy Report of the Programme concluded: “Experiences with Green Goal have not only indicated existing opportunities, they have also shown where and why an environmental concept for World Cup tournaments has its limitations. It is unfortunate that under the prevailing circumstances the objectives of an increase in energy efficiency, greater use of rainwater and the environmentally beneficial tending of football pitches were not achieved. With Green Goal, however, important organisational tasks and opportunities were identified for all those who will be involved in future in the organization of World Cup tournaments“ (OC 2006 fIfA World Cup™:15).
The vision of the green games strategy of the 2010 Delhi Commonwealth Games stated: “To Strive towards reducing carbon footprints and become the benchmark for the multi-disciplinary games in the future” (CWG organizing committee website). Greening of the Games were divided into eight modules, that included: Green Games vision, mission and Goals; Green Infrastructure; Green Ceremonies; Green Hospitality; Eco Procurement; Green Sensitisation; Greening and Offset; and Sustainability Reporting and Sustainability Indicators. To help realise this vision, activities included city forest plantations; designing Thyagaraj Stadium as a model green sporting venue and estab-lishing a Commonwealth Garden.
1.2 HoSting Mega-eventS in Developing CountrieS: CoSt-benefit ConCernSIn considering the legacy of mega-events, their potential for contributing to sustain-able development and their negative social and ecological effects become additional burdens as these events are more frequently being hosted by developing cities and countries. As mentioned, cities in the developing world are facing enormous social, economic and environmental challenges, which are not comparable with those of Sydney, vancouver or London. In particular, the cities of the emerging developing countries show deep social and economic disparities, significant infrastructural deficits and environmental problems. Usually the public budgets are insufficient to meet the development demands and priorities for public investments have to be defined care-fully. It is important, therefore, to discuss the cost-benefit ratio of mega-events, which is being influenced by various factors such as the following:• The model of financing;• The quality of the planning and implementation process of the investments;• The economic, social and environmental effects;• The possible contributions of the legacy to the development goals of the hosting
city or country; and • The successful mitigation of possible negative environmental effects.
In general, different models of financing mega-events are possible. As figure 3 shows, the different models can range from 100% public share to 100% private share. most common are mixed models. The public share can be distributed among federal and provincial governments and the host cities. IOC or fIfA are completely exempted from any financial obligations. They do participate, however, in the generated profit9. “Thus, the organiser of the Olympic Games is like a franchise: the IOC awards the rights, pays attention to the corporate design and participates in the revenues to a certain extent whereas the organiser bears the risk alone” (Preuss 2004:14).
Regardless of the chosen model, fIfA and IOC will demand a guarantee in order to avoid a financial failure of the Games. The guarantee normally can be given directly by the host city or the regional and national government.
Green Goal results –germany 2006
WATER: The outstanding project in the area of water consumption, due solely to the savings it produced, is the rainwa-ter cistern. A particular highlight is the cistern in the Olympia Stadium in Berlin, which is said to be larger than that in any other European stadium.
WASTE: Clean stadiums provided an obvious indication of successful waste avoidance during the World Cup. One example of successful waste avoid-ance was the use of returnable plastic beakers for the first time at a World Cup. An important lesson learned was that ef-fective waste avoidance makes separate collection of waste in the spectator areas of stadiums superfluous.
EnERgy: The installation of several thousand square metres of solar cells and the supply of certificated green electric-ity for the World Cup are examples of the promotion of environmentally beneficial renewable energy through Green Goal.
TRAnSpoRT: Substantially more visitors travelled to host cities and World Cup stadiums with environmentally favour-able public means of transport – such as by bus or train – than had originally been expected. In all, 75% of visitors travelled to stadiums by bus, rail and bicycle or on foot, and 25% travelled by car.
climATE: The adverse effects of trans-port on the climate resulting from large sporting events will also not be completely avoidable in the foreseeable future. In this respect, the concept of cli-mate compensation represents a path for the future, which should become a stand-ard for large sporting events. Up to now, no large sporting event has compensated a quantity of greenhouse gases that is comparable to that achieved by Green Goal with its ‘Gold Standard’ projects.Source: OC 2006 fIfA World Cup™:94pp
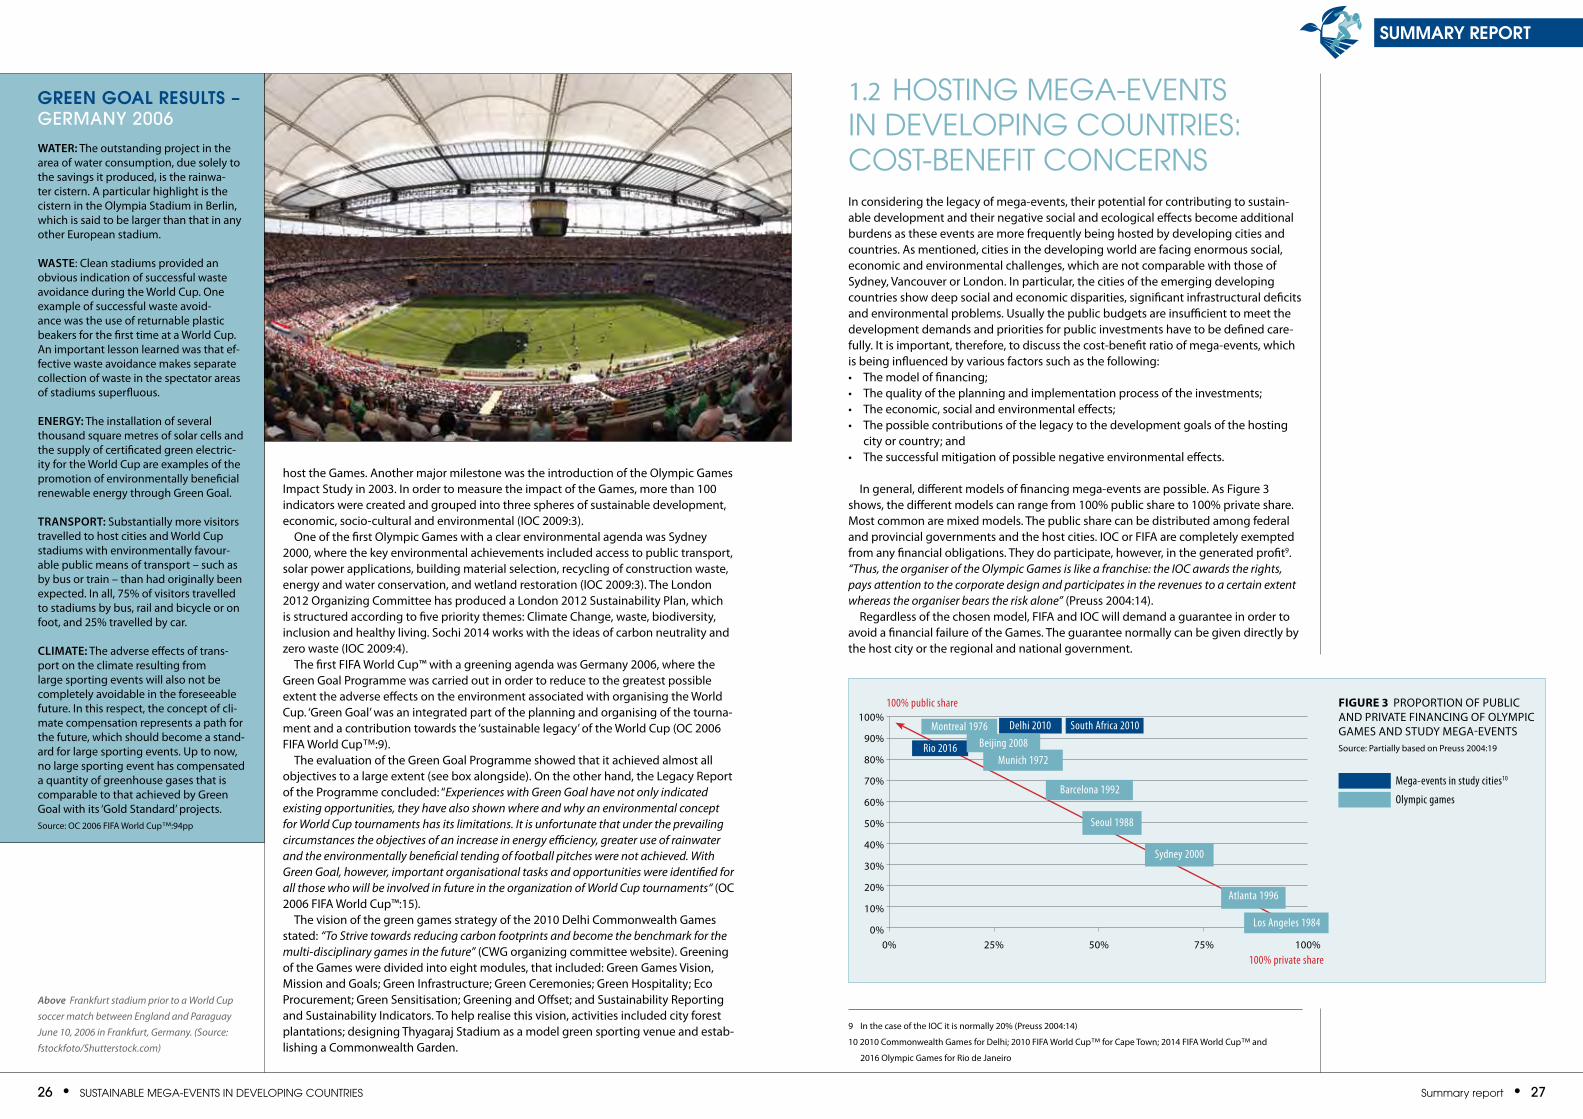
Above Frankfurt stadium prior to a World Cup soccer match between England and Paraguay June 10, 2006 in Frankfurt, Germany. (Source: fstockfoto/Shutterstock.com)
Mega-events in study cities10
Olympic games
Figure 3 PROPORTION Of PUBLIC AND PRIvATE fINANCING Of OLYmPIC GAmES AND STUDY mEGA-EvENTSSource: Partially based on Preuss 2004:19
9 In the case of the IOC it is normally 20% (Preuss 2004:14)
10 2010 Commonwealth Games for Delhi; 2010 fIfA World Cup™ for Cape Town; 2014 fIfA World Cup™ and
2016 Olympic Games for Rio de Janeiro
100%
90%
80%
70%
60%
50%
40%
30%
20%
10%
0%0% 25% 50% 75% 100%
South Africa 2010Delhi 2010
Rio 2016
Montreal 1976Beijing 2008
Munich 1972
Barcelona 1992
Seoul 1988
Sydney 2000
Atlanta 1996
Los Angeles 1984
100% public share
100% private share
28 • SuStainable Mega-eventS in Developing CountrieS Summary report • 29
summary report
In the few cases where developing countries hosted or will host sports mega-events, it was or will be the government that takes the driver’s seat in financing the infrastructure needed for these events. With public funds being the primary source of financing, the question of the opportunity costs has to be raised. from a develop-ment point of view, it is important to take into account what kind of results alternative investments in social infrastructure would produce. With scarce public funds mainly being used, the quality of the planning and implementation process becomes a crucial factor in the cost-benefit ratio. In many cases, however the real costs turned out to be much higher than the originally planned ones, indicating planning deficits and mismanagement. South Africa, for example, underestimated the World Cup costs by a factor of 20 in their bid11. The same occurred with the Commonwealth Games in Delhi and will occur in Brazil, where the costs for staging the fIfA World Cup™ 2014 and the Olympic Games 2016 are exploding compared to the numbers offered in the bid books.
The high costs of staging sports mega-events in developing countries are generally justified by the expected economic, social and environmental benefits of the events for the staging country and city. The Presidents of Brazil, India and South Africa recog-nized in a joint declaration “that hosting these events reflects the positive momentum of developing countries, and of the three countries in particular, and that they are potentially a tool for their social and economic development.“ (IBSA 2010). But possible develop-mental effects of mega-events are highly controversial:
“Mega-events generally fail to deliver the massive economic windfalls predicted by pre-event assessments. The projected costs and benefits, often crafted by lobbyists, generally turn out to be off the mark, as most independent research shows. Although the immediate impact of mega-events can be spectacular, involving huge audiences, the net impact on real economic variables, e.g., taxable sales, employment, personal income, has been sys-tematically overestimated. Certain economic sectors, especially tourism, do benefit but the “multiplier” effects intended to boost the entire economy have rarely materialized.” (varrel and Kennedy 2011:2).
A key strategic question for developing countries concerns the potential employ-ment and income-generating effects of mega-events, and particularly the social distribution of these effects. most of the existing research indicates that mega-events can lead to considerable employment growth12. The jobs required to host a mega-event are, however, mostly of a temporary nature and dependent on the different event phases. The jobs created in the first phases are directly linked to organising the event and may be lost afterwards. Lasting jobs are created in the phase after the event through the induced economic effects, mainly in the building sector and the tour-ism and leisure industry. These jobs are a direct result of the changed city image and improved tourism infrastructure (Preuss 2004:252pp).
An important related question concerns the social distribution of the projected positive employment and income-generating effects. In general it must be pointed out that positive employment and income-generating effects are likely to arise for the poor population too, but do not necessarily occur to the expected extent. In emerging and developing countries in particular, the social inclusion of the poor population has to be promoted actively through specific programmes.
On the other hand, it is absolutely possible that hosting mega-events can contribute to deepening social inequalities in a city. for example, investments by government in the infrastructure of sport centres could be made at the expense of investments in social infrastructure (hospitals, schools, etc.). Other negative effects on the poor popu-lation could be the following: • Relocations to make way for new infrastructure measures, displacement through
property speculation on the basis of city suburbs that have increased in value, etc.; • A loss of image, for example, through problems during the staging of the Games
could lead to a subsequent reduction of economic activity that would then impact negatively on the poor population;
• mega-events are often used by local administrations to remove informal economic activities (e.g. street sales) from the city.
In order to guarantee a positive cost-benefit ratio of staging a mega-event it is impor-tant that potential economic, social and environmental legacies correspond to the development objectives of the country and of the host city. Additionally, the infra-structure investments should also be part of the long-term infrastructure planning.
finally, especially in developing countries, it is extremely important that possible nega-tive environmental impacts of mega-events (water use, waste, carbon footprint, pollution, etc.) will be mitigated adequately by the implementation of a sustainability agenda.
1.3 Mega-eventS anD SuStainable DevelopMent: leSSonS learneD froM inDia, SoutH afriCa anD brazilAs mentioned, many recent and near future mega-events have been and are being staged in developing countries: South Africa (2010 fIfA World Cup™), India (2010 Com-monwealth Games) and Brazil (2014 fIfA World Cup™ and 2016 Olympics), as well as the COP 17 (17th United Nations Conference of Parties under the framework Conven-tion on Climate Change) taking place in South Africa in 2011.
This trend has provided an opportunity to analyse the planning and implementation of three mega-events in India (Commonwealth Games), South Africa (2010 fIfA World Cup™) and Brazil (2016 Olympic Games) and review the lessons learned regarding their potential contributions to sustainable development. The lessons learned are sum-marised according to the following four major topics: Event Governance and Business models; Resource Allocation and Planning; Greening of the Events; and Impacts and Urban Development Challenges.
1.3.1 Event Governance and Business ModelsEvery mega-event has its own governance scheme, which defines the design, plan-ning, hosting and the delivery of the event. It also incorporates the relevant decision-making process regarding allocation of resources and includes the requirements and standards developed by the ‘owner-organisations’ such as fIfA or the IOC.
As mentioned earlier, organising and implementing mega-sport events follows a type of franchising model, which defines the event’s structure and content in great de-tail, and which imposes certain mandatory requirements for host countries and cities in the bid process. This model is based primarily on the interests and business models of the ‘franchise owner’ (fIfA or the IOC) and was established based on their experi-ences of events hosted primarily in the developed world.
11 See the South Africa Country Study in this publication 12 See Preuss 2004:247pp. for the employment impacts of Olympic Games
Construction of the Indira GandhiIndoor Stadium, Delhi for the Commonwealth Games 2010. (Source: Daniel Berehulak/Getty Images)
a key strategic question for developing countries concerns the poten-tial employment and income-generating effects of mega-events, and particularly the social distribution of these effects ”
“
A football game held during the construction of Cape Town Stadium, South Africa. The construc-tion was monitored by an environmental control officer. (Source: Bruce Sutherland, City of Cape Town)
30 • SuStainable Mega-eventS in Developing CountrieS Summary report • 31
summary report
The question therefore arises whether this model is appropriate for mega-events being hosted in developing countries. The lessons learned from the 2010 fIfA World Cup™ can provide some clear answers13.
As the South Africa Country Report points out, the specific objectives of the host country and fIfA are not necessarily congruent. While South Africa’s legacy objectives include economic benefits, the strengthening of South Africa’s image, social develop-ment and football development, fIfA expects to realise a ‘world class event’14 with all necessary infrastructure in place and financial profit as the result.
In fact, the Olympic Games and the World Cup are the heart of the business models of the ICO and fIfA, and the generated profits must cover the costs and expenses that are incurred by the organisation between the events: “FIFA’s major source of income is the World Cup, and in this regard the TV broadcasting and general marketing rights for the event bring in 83% of their total income... FIFA’s business model will be a strong factor in preserving a particular approach to the event, and for example will tend to preserve a strong focus on the construction and use of ‘TV-genic’ large stadia and the prioritization of large multinational corporate sponsors with likely concomitant reduced focus on the participation of local businesses.” 15
The ‘franchise-owners’ have strong governance and the ‘last word’ over their events. Their main purpose is to guarantee the adequate quality of the event, also required by the broadcasting corporations and the main sponsors. Consequently, the host cities and countries have to submit themselves to a great number of conditions and obliga-tions. The host countries have to offer special guarantees, which include a supportive financial environment including tax exemptions, certain legal immunities and the guarantee to ensure the intellectual property rights. These guarantees require special laws, which the country has to pass before the event. The host cities have to sign a non-negotiable City Host Contract, which defines all the responsibilities and obliga-tions the host cities have to assume16.
The ‘franchising-models’ of mega-events leave little room for the hosting countries and cities in the relevant decision-making processes. They therefore offer little flexibil-ity to adapt themselves to the specific conditions and needs of developing countries. It seems very important that host countries and cities should lobby for more decision-making powers in order to organize mega-events that correspond to their national and local objectives, since they carry most of the risk and financial burden. The case of the 2010 fIfA World Cup™ in South Africa provides two examples, where this was by no means the case: • The stadia constructed were inappropriate in number and size for South Africa
and left the country and the host cities with underused stadia incurring significant maintenance costs;
• fIfA’s business model involves large multinational partners and sponsors. While local businesses are involved as second-tier sponsors, in a developing country the support of local businesses needs more emphasis. fIfA’s agreements with sponsors and interactions with host countries should therefore leave more scope for involve-ment of local businesses, large as well as small, including potentially allowing small traders in and around fIfA exclusion zones17.
1.3.2 Resource Allocations and PlanningThe mega-events in South Africa and India as well as the events, which will soon take place in Brazil, are mainly funded by public investments. As the actual operational cost of the events were easily covered by the revenues generated from ticket sales, spon-sorship, licensing or broadcasting18, the main financial burden was due to infrastruc-ture investments, which were assumed by the national, regional or local governments. In India, for example, the infrastructure expenditures (mainly sport and transport infrastructure) for the Commonwealth Games had a 73% share of the total costs of the mega-event. In Brazil, the estimated costs of the infrastructure for the Olympic Games represent 77% of all costs, while in South Africa it represented more than 80% of the national expenditure.
According to the South African Report the country’s total expenditures on the 2010 fIfA World Cup™ amounted to around 7 billion USD, while the direct revenues for the Governments from ticket sales and tourism were insignificant. As a result, there was a net loss of 6.6 billion USD to South Africa, which represents almost 5% of the annual national budget. In Cape Town itself the World Cup expenditures totalled 1.5 billion USD, about 13% of which were covered by the city, which represented 13% of its an-nual budget.
13 See also the South Africa Country Study in this publication14 ‘World class event’ obviously by Western standards15 See the South Africa Country Study16 The Host City Contract for the 2012 London Olympic Games is documented under
http://www.gamesmonitor.org.uk/files/Host%20City%20Contract.pdf
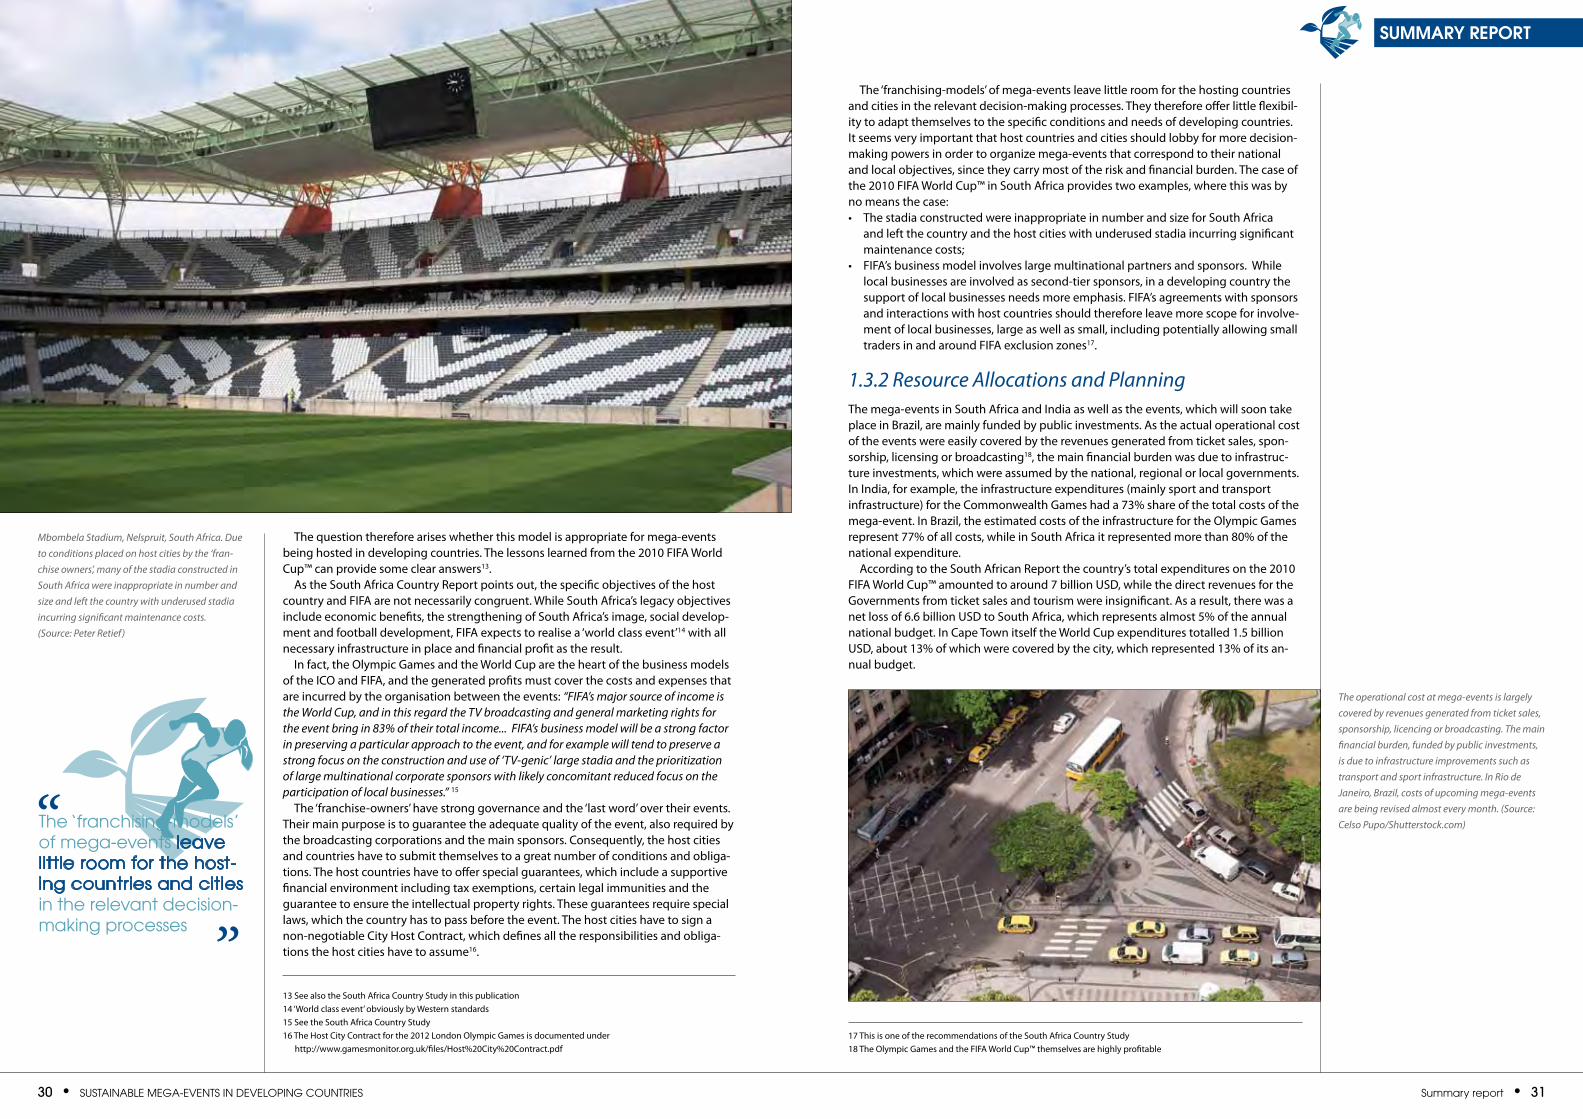
Mbombela Stadium, Nelspruit, South Africa. Due to conditions placed on host cities by the ‘fran-chise owners’, many of the stadia constructed in South Africa were inappropriate in number and size and left the country with underused stadia incurring significant maintenance costs. (Source: Peter Retief)
the ‘franchising-models’ of mega-events leave little room for the host-ing countries and cities in the relevant decision-making processes ”
“
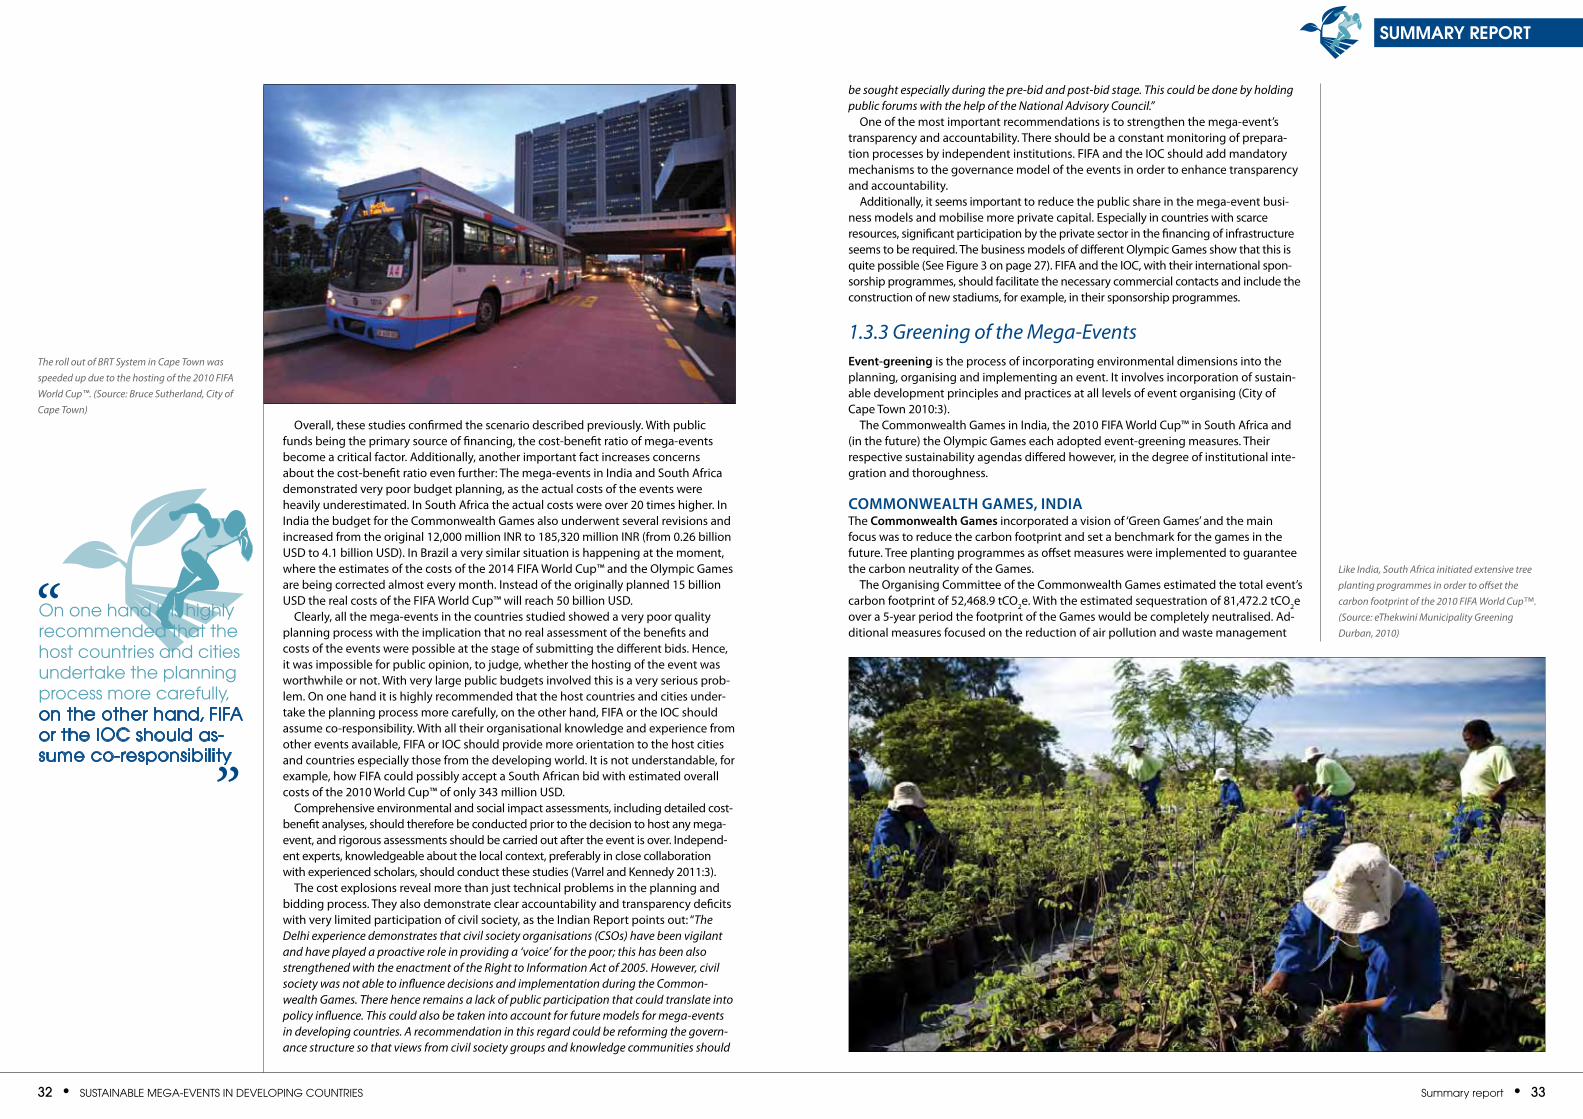
The operational cost at mega-events is largely covered by revenues generated from ticket sales, sponsorship, licencing or broadcasting. The main financial burden, funded by public investments, is due to infrastructure improvements such as transport and sport infrastructure. In Rio de Janeiro, Brazil, costs of upcoming mega-events are being revised almost every month. (Source: Celso Pupo/Shutterstock.com)
17 This is one of the recommendations of the South Africa Country Study18 The Olympic Games and the fIfA World Cup™ themselves are highly profitable
32 • SuStainable Mega-eventS in Developing CountrieS Summary report • 33
summary report
Overall, these studies confirmed the scenario described previously. With public funds being the primary source of financing, the cost-benefit ratio of mega-events become a critical factor. Additionally, another important fact increases concerns about the cost-benefit ratio even further: The mega-events in India and South Africa demonstrated very poor budget planning, as the actual costs of the events were heavily underestimated. In South Africa the actual costs were over 20 times higher. In India the budget for the Commonwealth Games also underwent several revisions and increased from the original 12,000 million INR to 185,320 million INR (from 0.26 billion USD to 4.1 billion USD). In Brazil a very similar situation is happening at the moment, where the estimates of the costs of the 2014 fIfA World Cup™ and the Olympic Games are being corrected almost every month. Instead of the originally planned 15 billion USD the real costs of the fIfA World Cup™ will reach 50 billion USD.
Clearly, all the mega-events in the countries studied showed a very poor quality planning process with the implication that no real assessment of the benefits and costs of the events were possible at the stage of submitting the different bids. Hence, it was impossible for public opinion, to judge, whether the hosting of the event was worthwhile or not. With very large public budgets involved this is a very serious prob-lem. On one hand it is highly recommended that the host countries and cities under-take the planning process more carefully, on the other hand, fIfA or the IOC should assume co-responsibility. With all their organisational knowledge and experience from other events available, fIfA or IOC should provide more orientation to the host cities and countries especially those from the developing world. It is not understandable, for example, how fIfA could possibly accept a South African bid with estimated overall costs of the 2010 World Cup™ of only 343 million USD.
Comprehensive environmental and social impact assessments, including detailed cost-benefit analyses, should therefore be conducted prior to the decision to host any mega-event, and rigorous assessments should be carried out after the event is over. Independ-ent experts, knowledgeable about the local context, preferably in close collaboration with experienced scholars, should conduct these studies (varrel and Kennedy 2011:3).
The cost explosions reveal more than just technical problems in the planning and bidding process. They also demonstrate clear accountability and transparency deficits with very limited participation of civil society, as the Indian Report points out: “The Delhi experience demonstrates that civil society organisations (CSOs) have been vigilant and have played a proactive role in providing a ‘voice’ for the poor; this has been also strengthened with the enactment of the Right to Information Act of 2005. However, civil society was not able to influence decisions and implementation during the Common-wealth Games. There hence remains a lack of public participation that could translate into policy influence. This could also be taken into account for future models for mega-events in developing countries. A recommendation in this regard could be reforming the govern-ance structure so that views from civil society groups and knowledge communities should
be sought especially during the pre-bid and post-bid stage. This could be done by holding public forums with the help of the National Advisory Council.”
One of the most important recommendations is to strengthen the mega-event’s transparency and accountability. There should be a constant monitoring of prepara-tion processes by independent institutions. fIfA and the IOC should add mandatory mechanisms to the governance model of the events in order to enhance transparency and accountability.
Additionally, it seems important to reduce the public share in the mega-event busi-ness models and mobilise more private capital. Especially in countries with scarce resources, significant participation by the private sector in the financing of infrastructure seems to be required. The business models of different Olympic Games show that this is quite possible (See figure 3 on page 27). fIfA and the IOC, with their international spon-sorship programmes, should facilitate the necessary commercial contacts and include the construction of new stadiums, for example, in their sponsorship programmes.
1.3.3 Greening of the Mega-EventsEvent-greening is the process of incorporating environmental dimensions into the planning, organising and implementing an event. It involves incorporation of sustain-able development principles and practices at all levels of event organising (City of Cape Town 2010:3).
The Commonwealth Games in India, the 2010 fIfA World Cup™ in South Africa and (in the future) the Olympic Games each adopted event-greening measures. Their respective sustainability agendas differed however, in the degree of institutional inte-gration and thoroughness.
commonWEAlTH gAmES, inDiAThe commonwealth games incorporated a vision of ‘Green Games’ and the main focus was to reduce the carbon footprint and set a benchmark for the games in the future. Tree planting programmes as offset measures were implemented to guarantee the carbon neutrality of the Games.
The Organising Committee of the Commonwealth Games estimated the total event’s carbon footprint of 52,468.9 tCO2e. With the estimated sequestration of 81,472.2 tCO2e over a 5-year period the footprint of the Games would be completely neutralised. Ad-ditional measures focused on the reduction of air pollution and waste management
Like India, South Africa initiated extensive tree planting programmes in order to offset the carbon footprint of the 2010 FIFA World Cup™. (Source: eThekwini Municipality Greening Durban, 2010)
on one hand it is highly recommended that the host countries and cities undertake the planning process more carefully, on the other hand, fifa or the ioC should as-sume co-responsibility
”
“
The roll out of BRT System in Cape Town was speeded up due to the hosting of the 2010 FIFA World Cup™. (Source: Bruce Sutherland, City of Cape Town)
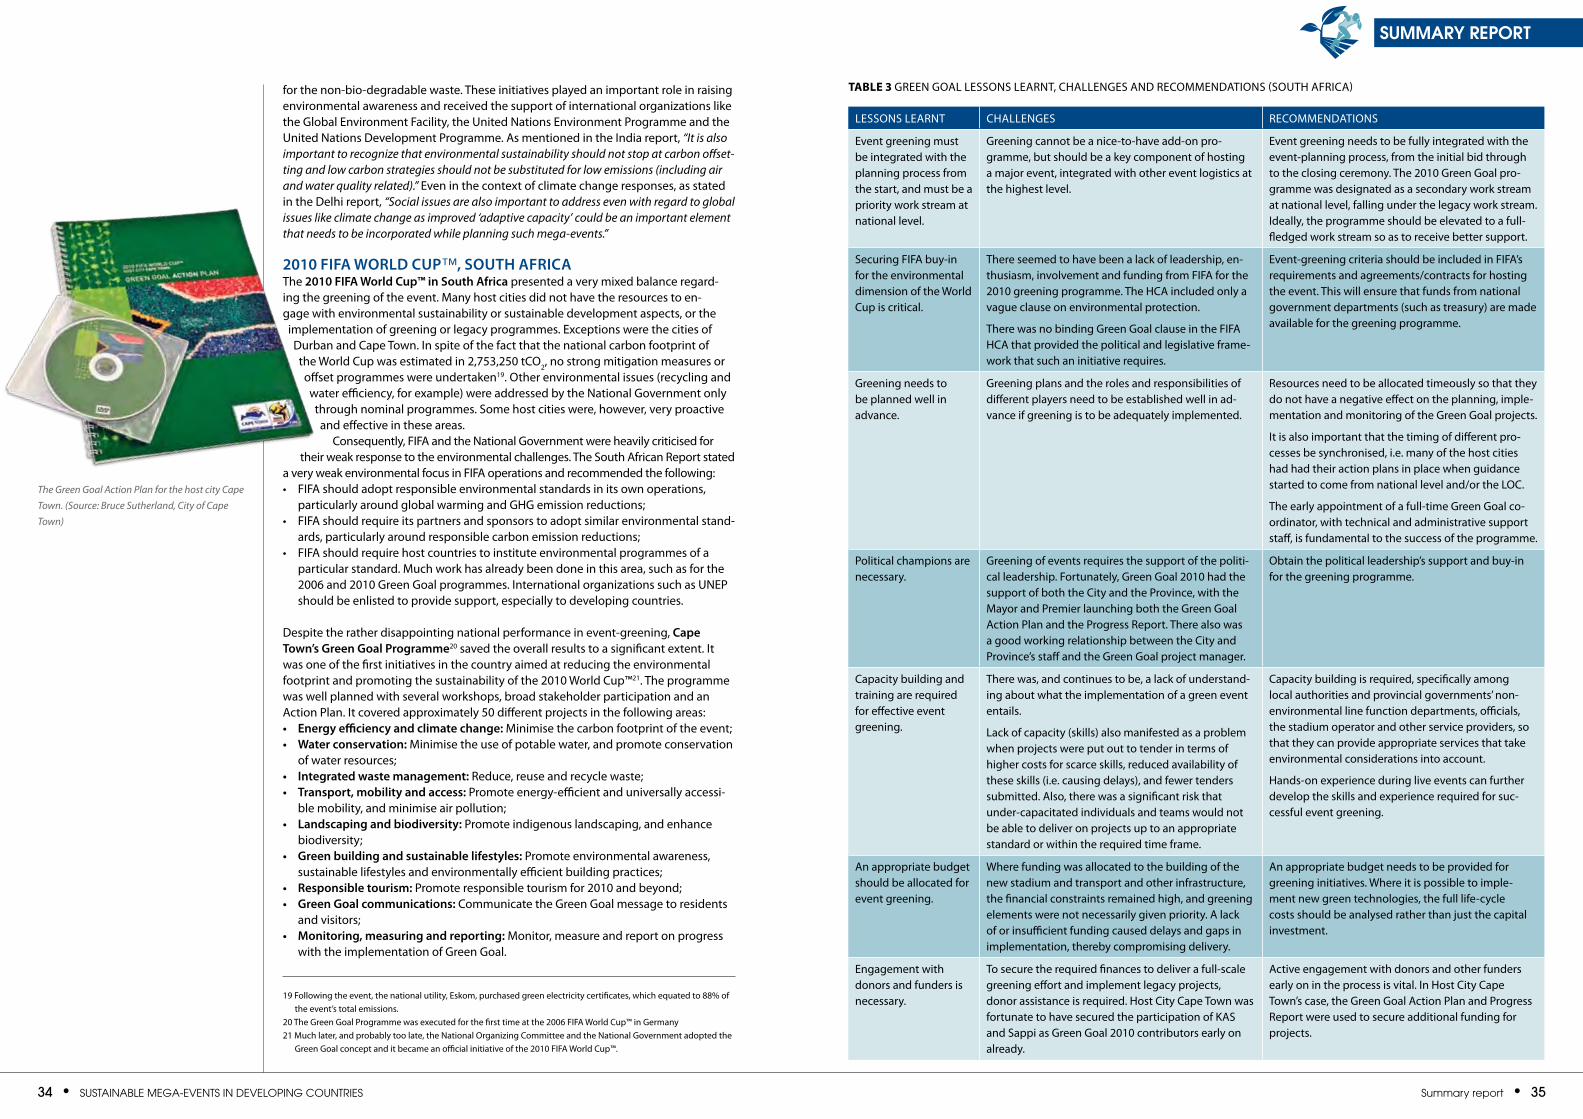
34 • SuStainable Mega-eventS in Developing CountrieS Summary report • 35
summary report
for the non-bio-degradable waste. These initiatives played an important role in raising environmental awareness and received the support of international organizations like the Global Environment facility, the United Nations Environment Programme and the United Nations Development Programme. As mentioned in the India report, “It is also important to recognize that environmental sustainability should not stop at carbon offset-ting and low carbon strategies should not be substituted for low emissions (including air and water quality related).” Even in the context of climate change responses, as stated in the Delhi report, “Social issues are also important to address even with regard to global issues like climate change as improved ‘adaptive capacity’ could be an important element that needs to be incorporated while planning such mega-events.”
2010 FiFA WoRlD cup™, SouTH AFRicAThe 2010 FiFA World cup™ in South Africa presented a very mixed balance regard-ing the greening of the event. many host cities did not have the resources to en-gage with environmental sustainability or sustainable development aspects, or the implementation of greening or legacy programmes. Exceptions were the cities of Durban and Cape Town. In spite of the fact that the national carbon footprint of the World Cup was estimated in 2,753,250 tCO2, no strong mitigation measures or offset programmes were undertaken19. Other environmental issues (recycling and water efficiency, for example) were addressed by the National Government only through nominal programmes. Some host cities were, however, very proactive and effective in these areas.
Consequently, fIfA and the National Government were heavily criticised for their weak response to the environmental challenges. The South African Report stated
a very weak environmental focus in fIfA operations and recommended the following: • fIfA should adopt responsible environmental standards in its own operations,
particularly around global warming and GHG emission reductions;• fIfA should require its partners and sponsors to adopt similar environmental stand-
ards, particularly around responsible carbon emission reductions;• fIfA should require host countries to institute environmental programmes of a
particular standard. much work has already been done in this area, such as for the 2006 and 2010 Green Goal programmes. International organizations such as UNEP should be enlisted to provide support, especially to developing countries.
Despite the rather disappointing national performance in event-greening, cape Town’s green goal programme20 saved the overall results to a significant extent. It was one of the first initiatives in the country aimed at reducing the environmental footprint and promoting the sustainability of the 2010 World Cup™21. The programme was well planned with several workshops, broad stakeholder participation and an Action Plan. It covered approximately 50 different projects in the following areas: • Energy efficiency and climate change: minimise the carbon footprint of the event;• Water conservation: minimise the use of potable water, and promote conservation
of water resources;• integrated waste management: Reduce, reuse and recycle waste;• Transport, mobility and access: Promote energy-efficient and universally accessi-
ble mobility, and minimise air pollution;• landscaping and biodiversity: Promote indigenous landscaping, and enhance
biodiversity;• green building and sustainable lifestyles: Promote environmental awareness,
sustainable lifestyles and environmentally efficient building practices;• Responsible tourism: Promote responsible tourism for 2010 and beyond;• green goal communications: Communicate the Green Goal message to residents
and visitors; • monitoring, measuring and reporting: monitor, measure and report on progress
with the implementation of Green Goal.
19 following the event, the national utility, Eskom, purchased green electricity certificates, which equated to 88% of the event’s total emissions.
20 The Green Goal Programme was executed for the first time at the 2006 fIfA World Cup™ in Germany21 much later, and probably too late, the National Organizing Committee and the National Government adopted the
Green Goal concept and it became an official initiative of the 2010 fIfA World Cup™.
LESSONS LEARNT CHALLENGES RECOmmENDATIONS
Event greening must be integrated with the planning process from the start, and must be a priority work stream at national level.
Greening cannot be a nice-to-have add-on pro-gramme, but should be a key component of hosting a major event, integrated with other event logistics at the highest level.
Event greening needs to be fully integrated with the event-planning process, from the initial bid through to the closing ceremony. The 2010 Green Goal pro-gramme was designated as a secondary work stream at national level, falling under the legacy work stream. Ideally, the programme should be elevated to a full-fledged work stream so as to receive better support.
Securing fIfA buy-in for the environmental dimension of the World Cup is critical.
There seemed to have been a lack of leadership, en-thusiasm, involvement and funding from fIfA for the 2010 greening programme. The HCA included only a vague clause on environmental protection.
There was no binding Green Goal clause in the fIfA HCA that provided the political and legislative frame-work that such an initiative requires.
Event-greening criteria should be included in fIfA’s requirements and agreements/contracts for hosting the event. This will ensure that funds from national government departments (such as treasury) are made available for the greening programme.
Greening needs to be planned well in advance.
Greening plans and the roles and responsibilities of different players need to be established well in ad-vance if greening is to be adequately implemented.
Resources need to be allocated timeously so that they do not have a negative effect on the planning, imple-mentation and monitoring of the Green Goal projects.
It is also important that the timing of different pro-cesses be synchronised, i.e. many of the host cities had had their action plans in place when guidance started to come from national level and/or the LOC.
The early appointment of a full-time Green Goal co-ordinator, with technical and administrative support staff, is fundamental to the success of the programme.
Political champions are necessary.
Greening of events requires the support of the politi-cal leadership. fortunately, Green Goal 2010 had the support of both the City and the Province, with the mayor and Premier launching both the Green Goal Action Plan and the Progress Report. There also was a good working relationship between the City and Province’s staff and the Green Goal project manager.
Obtain the political leadership’s support and buy-in for the greening programme.
Capacity building and training are required for effective event greening.
There was, and continues to be, a lack of understand-ing about what the implementation of a green event entails.
Lack of capacity (skills) also manifested as a problem when projects were put out to tender in terms of higher costs for scarce skills, reduced availability of these skills (i.e. causing delays), and fewer tenders submitted. Also, there was a significant risk that under-capacitated individuals and teams would not be able to deliver on projects up to an appropriate standard or within the required time frame.
Capacity building is required, specifically among local authorities and provincial governments’ non-environmental line function departments, officials, the stadium operator and other service providers, so that they can provide appropriate services that take environmental considerations into account.
Hands-on experience during live events can further develop the skills and experience required for suc-cessful event greening.
An appropriate budget should be allocated for event greening.
Where funding was allocated to the building of the new stadium and transport and other infrastructure, the financial constraints remained high, and greening elements were not necessarily given priority. A lack of or insufficient funding caused delays and gaps in implementation, thereby compromising delivery.
An appropriate budget needs to be provided for greening initiatives. Where it is possible to imple-ment new green technologies, the full life-cycle costs should be analysed rather than just the capital investment.
Engagement with donors and funders is necessary.
To secure the required finances to deliver a full-scale greening effort and implement legacy projects, donor assistance is required. Host City Cape Town was fortunate to have secured the participation of KAS and Sappi as Green Goal 2010 contributors early on already.
Active engagement with donors and other funders early on in the process is vital. In Host City Cape Town’s case, the Green Goal Action Plan and Progress Report were used to secure additional funding for projects.
table 3 GREEN GOAL LESSONS LEARNT, CHALLENGES AND RECOmmENDATIONS (SOUTH AfRICA)
The Green Goal Action Plan for the host city Cape Town. (Source: Bruce Sutherland, City of Cape Town)
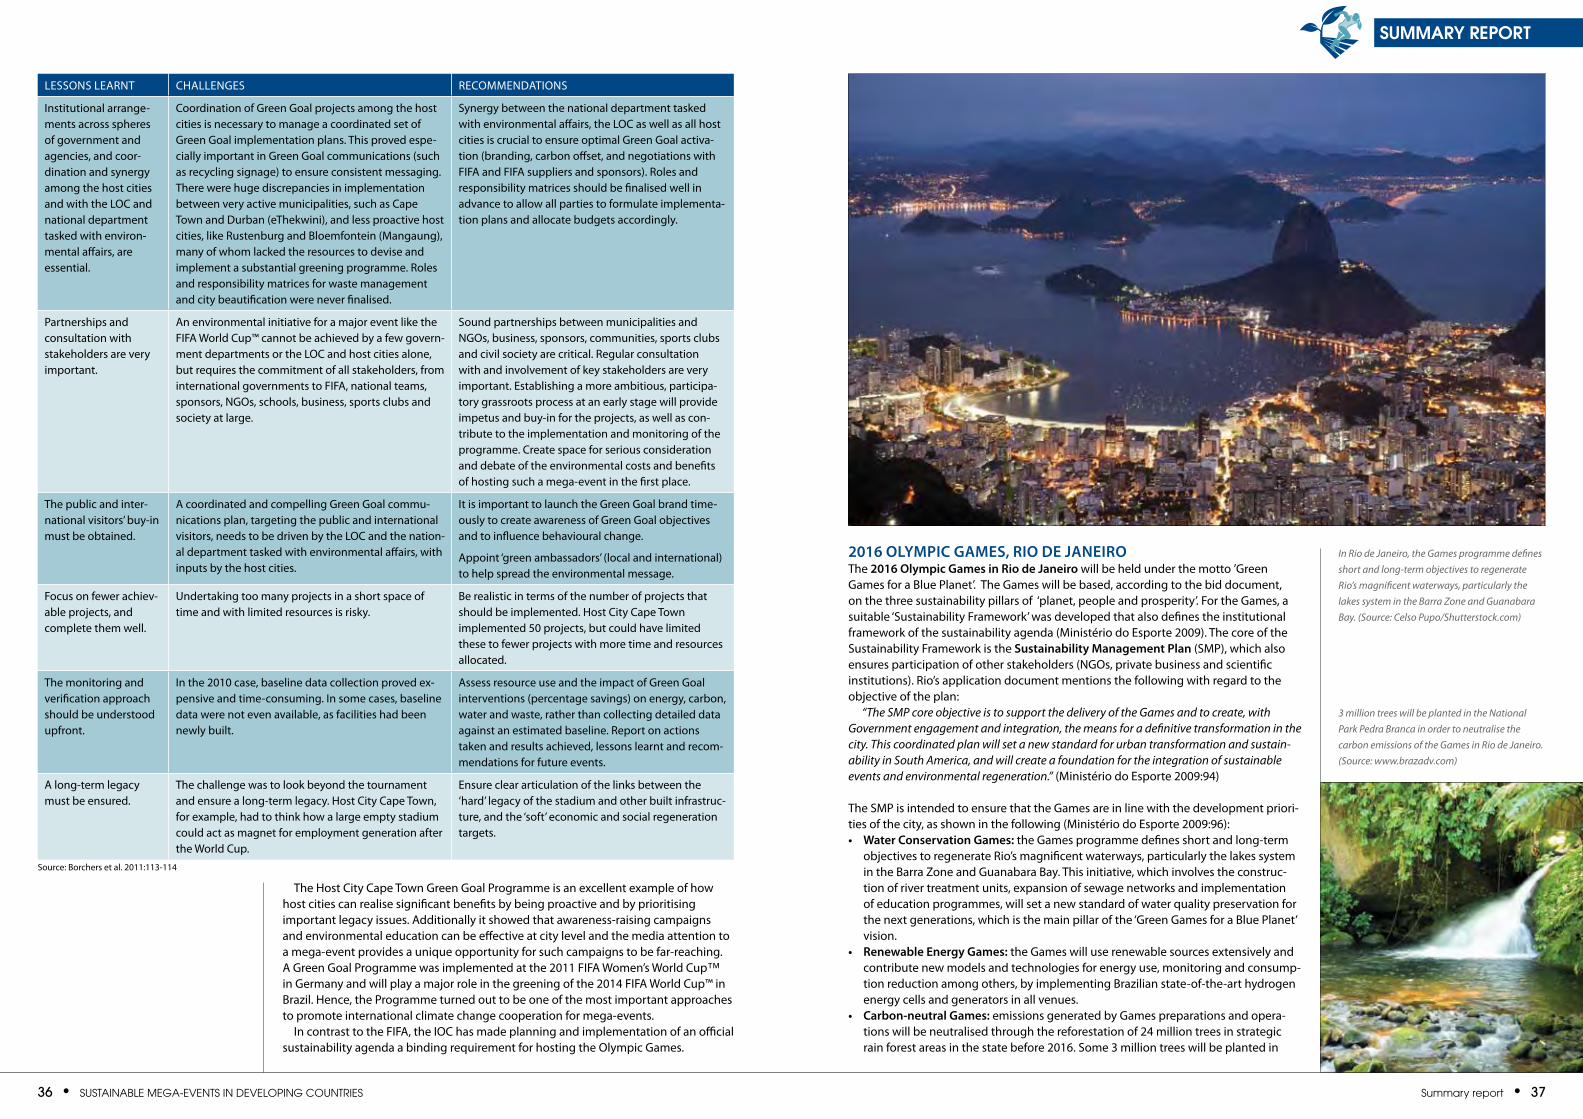
36 • SuStainable Mega-eventS in Developing CountrieS Summary report • 37
summary report
LESSONS LEARNT CHALLENGES RECOmmENDATIONS
Institutional arrange-ments across spheres of government and agencies, and coor-dination and synergy among the host cities and with the LOC and national department tasked with environ-mental affairs, are essential.
Coordination of Green Goal projects among the host cities is necessary to manage a coordinated set of Green Goal implementation plans. This proved espe-cially important in Green Goal communications (such as recycling signage) to ensure consistent messaging. There were huge discrepancies in implementation between very active municipalities, such as Cape Town and Durban (eThekwini), and less proactive host cities, like Rustenburg and Bloemfontein (mangaung), many of whom lacked the resources to devise and implement a substantial greening programme. Roles and responsibility matrices for waste management and city beautification were never finalised.
Synergy between the national department tasked with environmental affairs, the LOC as well as all host cities is crucial to ensure optimal Green Goal activa-tion (branding, carbon offset, and negotiations with fIfA and fIfA suppliers and sponsors). Roles and responsibility matrices should be finalised well in advance to allow all parties to formulate implementa-tion plans and allocate budgets accordingly.
Partnerships and consultation with stakeholders are very important.
An environmental initiative for a major event like the fIfA World Cup™ cannot be achieved by a few govern-ment departments or the LOC and host cities alone, but requires the commitment of all stakeholders, from international governments to fIfA, national teams, sponsors, NGOs, schools, business, sports clubs and society at large.
Sound partnerships between municipalities and NGOs, business, sponsors, communities, sports clubs and civil society are critical. Regular consultation with and involvement of key stakeholders are very important. Establishing a more ambitious, participa-tory grassroots process at an early stage will provide impetus and buy-in for the projects, as well as con-tribute to the implementation and monitoring of the programme. Create space for serious consideration and debate of the environmental costs and benefits of hosting such a mega-event in the first place.
The public and inter-national visitors’ buy-in must be obtained.
A coordinated and compelling Green Goal commu-nications plan, targeting the public and international visitors, needs to be driven by the LOC and the nation-al department tasked with environmental affairs, with inputs by the host cities.
It is important to launch the Green Goal brand time-ously to create awareness of Green Goal objectives and to influence behavioural change.
Appoint ‘green ambassadors’ (local and international) to help spread the environmental message.
focus on fewer achiev-able projects, and complete them well.
Undertaking too many projects in a short space of time and with limited resources is risky.
Be realistic in terms of the number of projects that should be implemented. Host City Cape Town implemented 50 projects, but could have limited these to fewer projects with more time and resources allocated.
The monitoring and verification approach should be understood upfront.
In the 2010 case, baseline data collection proved ex-pensive and time-consuming. In some cases, baseline data were not even available, as facilities had been newly built.
Assess resource use and the impact of Green Goal interventions (percentage savings) on energy, carbon, water and waste, rather than collecting detailed data against an estimated baseline. Report on actions taken and results achieved, lessons learnt and recom-mendations for future events.
A long-term legacy must be ensured.
The challenge was to look beyond the tournament and ensure a long-term legacy. Host City Cape Town, for example, had to think how a large empty stadium could act as magnet for employment generation after the World Cup.
Ensure clear articulation of the links between the ‘hard’ legacy of the stadium and other built infrastruc-ture, and the ‘soft’ economic and social regeneration targets.
Source: Borchers et al. 2011:113-114
The Host City Cape Town Green Goal Programme is an excellent example of how host cities can realise significant benefits by being proactive and by prioritising important legacy issues. Additionally it showed that awareness-raising campaigns and environmental education can be effective at city level and the media attention to a mega-event provides a unique opportunity for such campaigns to be far-reaching. A Green Goal Programme was implemented at the 2011 fIfA Women’s World Cup™ in Germany and will play a major role in the greening of the 2014 fIfA World Cup™ in Brazil. Hence, the Programme turned out to be one of the most important approaches to promote international climate change cooperation for mega-events.
In contrast to the fIfA, the IOC has made planning and implementation of an official sustainability agenda a binding requirement for hosting the Olympic Games.
2016 olympic gAmES, Rio DE JAnEiRoThe 2016 olympic games in Rio de Janeiro will be held under the motto ’Green Games for a Blue Planet’. The Games will be based, according to the bid document, on the three sustainability pillars of ‘planet, people and prosperity’. for the Games, a suitable ‘Sustainability framework’ was developed that also defines the institutional framework of the sustainability agenda (ministério do Esporte 2009). The core of the Sustainability framework is the Sustainability management plan (SmP), which also ensures participation of other stakeholders (NGOs, private business and scientific institutions). Rio’s application document mentions the following with regard to the objective of the plan:
“The SMP core objective is to support the delivery of the Games and to create, with Government engagement and integration, the means for a definitive transformation in the city. This coordinated plan will set a new standard for urban transformation and sustain-ability in South America, and will create a foundation for the integration of sustainable events and environmental regeneration.” (ministério do Esporte 2009:94)
The SmP is intended to ensure that the Games are in line with the development priori-ties of the city, as shown in the following (ministério do Esporte 2009:96): • Water conservation games: the Games programme defines short and long-term
objectives to regenerate Rio’s magnificent waterways, particularly the lakes system in the Barra Zone and Guanabara Bay. This initiative, which involves the construc-tion of river treatment units, expansion of sewage networks and implementation of education programmes, will set a new standard of water quality preservation for the next generations, which is the main pillar of the ‘Green Games for a Blue Planet’ vision.
• Renewable Energy games: the Games will use renewable sources extensively and contribute new models and technologies for energy use, monitoring and consump-tion reduction among others, by implementing Brazilian state-of-the-art hydrogen energy cells and generators in all venues.
• carbon-neutral games: emissions generated by Games preparations and opera-tions will be neutralised through the reforestation of 24 million trees in strategic rain forest areas in the state before 2016. Some 3 million trees will be planted in
In Rio de Janeiro, the Games programme defines short and long-term objectives to regenerate Rio’s magnificent waterways, particularly the lakes system in the Barra Zone and Guanabara Bay. (Source: Celso Pupo/Shutterstock.com)
3 million trees will be planted in the National Park Pedra Branca in order to neutralise the carbon emissions of the Games in Rio de Janeiro. (Source: www.brazadv.com)
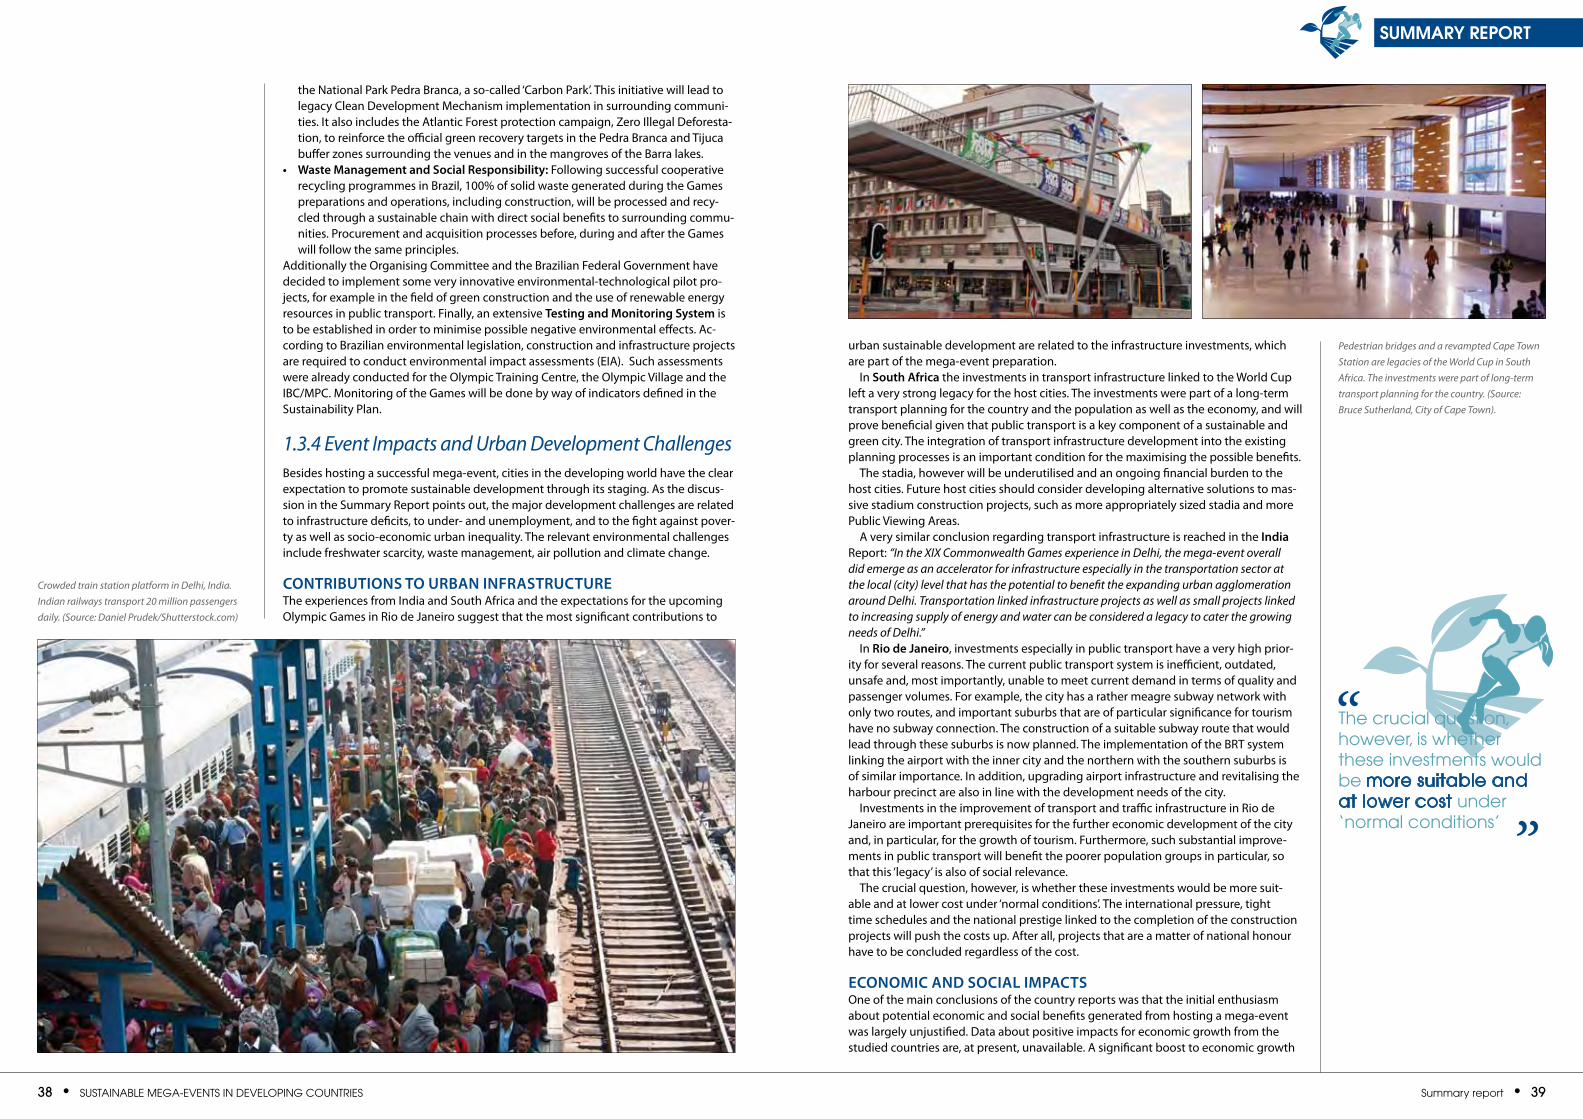
38 • SuStainable Mega-eventS in Developing CountrieS Summary report • 39
summary report
the National Park Pedra Branca, a so-called ‘Carbon Park’. This initiative will lead to legacy Clean Development mechanism implementation in surrounding communi-ties. It also includes the Atlantic forest protection campaign, Zero Illegal Deforesta-tion, to reinforce the official green recovery targets in the Pedra Branca and Tijuca buffer zones surrounding the venues and in the mangroves of the Barra lakes.
• Waste management and Social Responsibility: following successful cooperative recycling programmes in Brazil, 100% of solid waste generated during the Games preparations and operations, including construction, will be processed and recy-cled through a sustainable chain with direct social benefits to surrounding commu-nities. Procurement and acquisition processes before, during and after the Games will follow the same principles.
Additionally the Organising Committee and the Brazilian federal Government have decided to implement some very innovative environmental-technological pilot pro-jects, for example in the field of green construction and the use of renewable energy resources in public transport. finally, an extensive Testing and monitoring System is to be established in order to minimise possible negative environmental effects. Ac-cording to Brazilian environmental legislation, construction and infrastructure projects are required to conduct environmental impact assessments (EIA). Such assessments were already conducted for the Olympic Training Centre, the Olympic village and the IBC/mPC. monitoring of the Games will be done by way of indicators defined in the Sustainability Plan.
1.3.4 Event Impacts and Urban Development Challenges Besides hosting a successful mega-event, cities in the developing world have the clear expectation to promote sustainable development through its staging. As the discus-sion in the Summary Report points out, the major development challenges are related to infrastructure deficits, to under- and unemployment, and to the fight against pover-ty as well as socio-economic urban inequality. The relevant environmental challenges include freshwater scarcity, waste management, air pollution and climate change.
conTRiBuTionS To uRBAn inFRASTRucTuREThe experiences from India and South Africa and the expectations for the upcoming Olympic Games in Rio de Janeiro suggest that the most significant contributions to
urban sustainable development are related to the infrastructure investments, which are part of the mega-event preparation.
In South Africa the investments in transport infrastructure linked to the World Cup left a very strong legacy for the host cities. The investments were part of a long-term transport planning for the country and the population as well as the economy, and will prove beneficial given that public transport is a key component of a sustainable and green city. The integration of transport infrastructure development into the existing planning processes is an important condition for the maximising the possible benefits.
The stadia, however will be underutilised and an ongoing financial burden to the host cities. future host cities should consider developing alternative solutions to mas-sive stadium construction projects, such as more appropriately sized stadia and more Public viewing Areas.
A very similar conclusion regarding transport infrastructure is reached in the india Report: “In the XIX Commonwealth Games experience in Delhi, the mega-event overall did emerge as an accelerator for infrastructure especially in the transportation sector at the local (city) level that has the potential to benefit the expanding urban agglomeration around Delhi. Transportation linked infrastructure projects as well as small projects linked to increasing supply of energy and water can be considered a legacy to cater the growing needs of Delhi.”
In Rio de Janeiro, investments especially in public transport have a very high prior-ity for several reasons. The current public transport system is inefficient, outdated, unsafe and, most importantly, unable to meet current demand in terms of quality and passenger volumes. for example, the city has a rather meagre subway network with only two routes, and important suburbs that are of particular significance for tourism have no subway connection. The construction of a suitable subway route that would lead through these suburbs is now planned. The implementation of the BRT system linking the airport with the inner city and the northern with the southern suburbs is of similar importance. In addition, upgrading airport infrastructure and revitalising the harbour precinct are also in line with the development needs of the city.
Investments in the improvement of transport and traffic infrastructure in Rio de Janeiro are important prerequisites for the further economic development of the city and, in particular, for the growth of tourism. furthermore, such substantial improve-ments in public transport will benefit the poorer population groups in particular, so that this ‘legacy’ is also of social relevance.
The crucial question, however, is whether these investments would be more suit-able and at lower cost under ‘normal conditions’. The international pressure, tight time schedules and the national prestige linked to the completion of the construction projects will push the costs up. After all, projects that are a matter of national honour have to be concluded regardless of the cost.
Economic AnD SociAl impAcTSOne of the main conclusions of the country reports was that the initial enthusiasm about potential economic and social benefits generated from hosting a mega-event was largely unjustified. Data about positive impacts for economic growth from the studied countries are, at present, unavailable. A significant boost to economic growth
Crowded train station platform in Delhi, India. Indian railways transport 20 million passengers daily. (Source: Daniel Prudek/Shutterstock.com)
Pedestrian bridges and a revampted Cape Town Station are legacies of the World Cup in South Africa. The investments were part of long-term transport planning for the country. (Source: Bruce Sutherland, City of Cape Town).
the crucial question, however, is whether these investments would be more suitable and at lower cost under ‘normal conditions’ ”
“
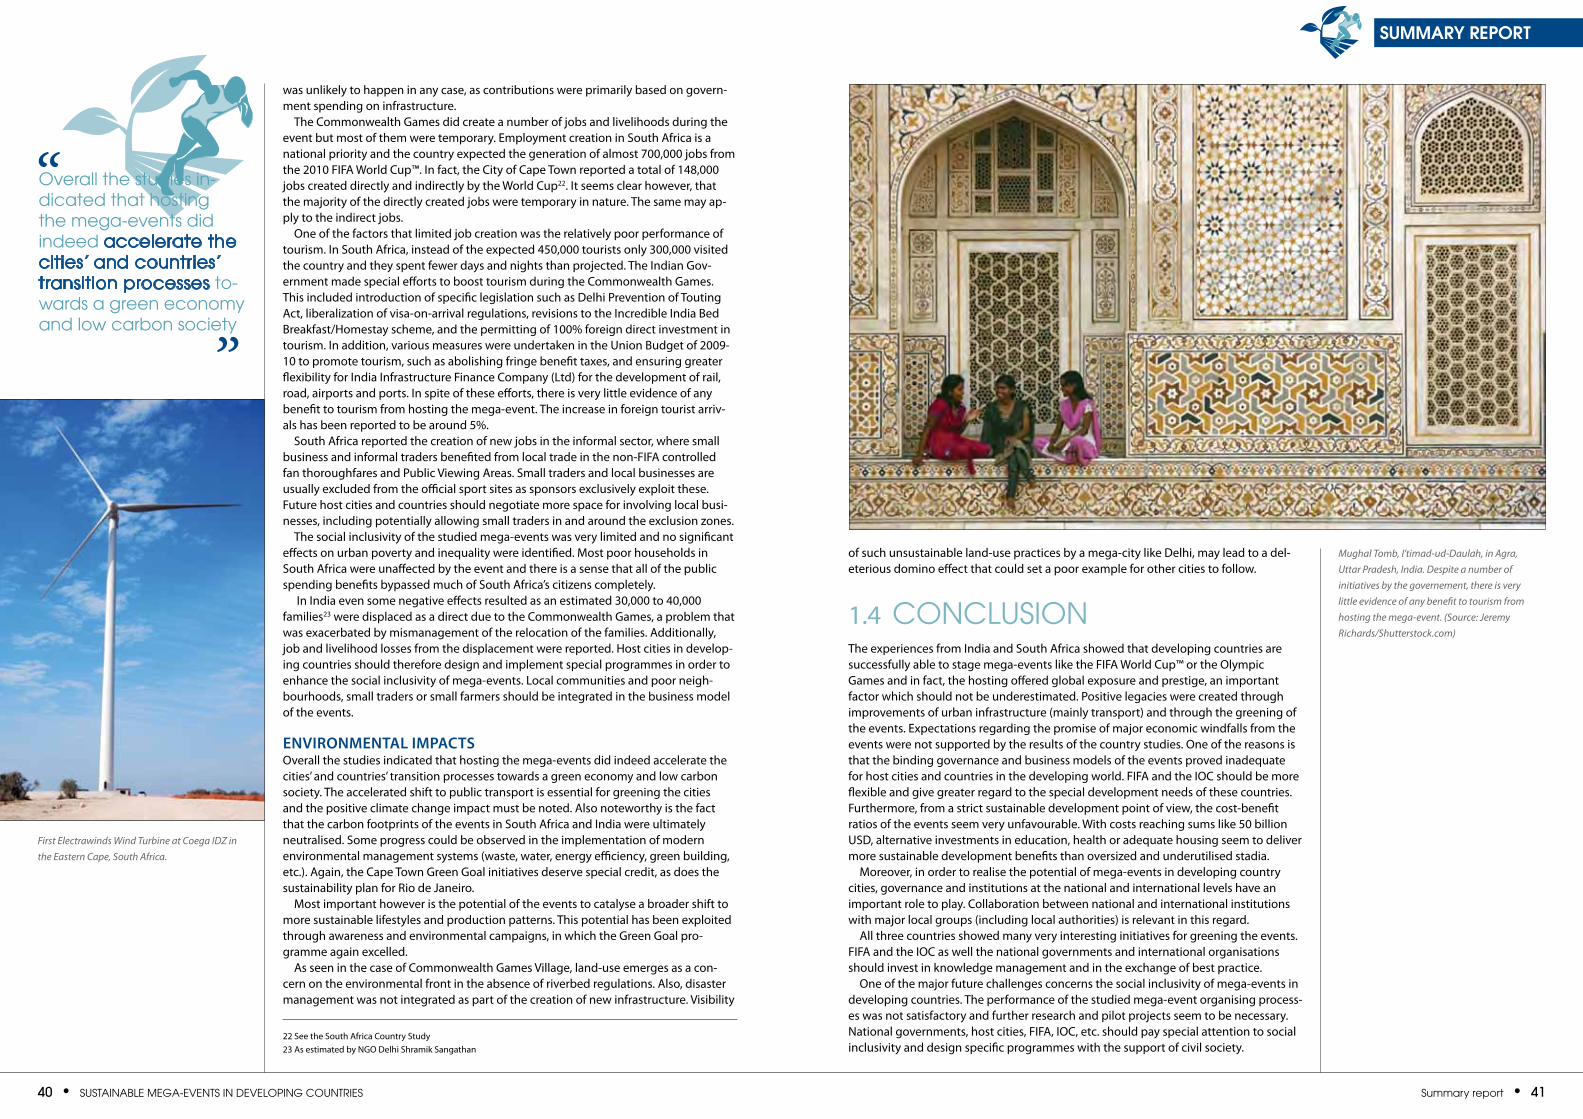
40 • SuStainable Mega-eventS in Developing CountrieS Summary report • 41
summary report
was unlikely to happen in any case, as contributions were primarily based on govern-ment spending on infrastructure.
The Commonwealth Games did create a number of jobs and livelihoods during the event but most of them were temporary. Employment creation in South Africa is a national priority and the country expected the generation of almost 700,000 jobs from the 2010 fIfA World Cup™. In fact, the City of Cape Town reported a total of 148,000 jobs created directly and indirectly by the World Cup22. It seems clear however, that the majority of the directly created jobs were temporary in nature. The same may ap-ply to the indirect jobs.
One of the factors that limited job creation was the relatively poor performance of tourism. In South Africa, instead of the expected 450,000 tourists only 300,000 visited the country and they spent fewer days and nights than projected. The Indian Gov-ernment made special efforts to boost tourism during the Commonwealth Games. This included introduction of specific legislation such as Delhi Prevention of Touting Act, liberalization of visa-on-arrival regulations, revisions to the Incredible India Bed Breakfast/Homestay scheme, and the permitting of 100% foreign direct investment in tourism. In addition, various measures were undertaken in the Union Budget of 2009-10 to promote tourism, such as abolishing fringe benefit taxes, and ensuring greater flexibility for India Infrastructure finance Company (Ltd) for the development of rail, road, airports and ports. In spite of these efforts, there is very little evidence of any benefit to tourism from hosting the mega-event. The increase in foreign tourist arriv-als has been reported to be around 5%.
South Africa reported the creation of new jobs in the informal sector, where small business and informal traders benefited from local trade in the non-fIfA controlled fan thoroughfares and Public viewing Areas. Small traders and local businesses are usually excluded from the official sport sites as sponsors exclusively exploit these. future host cities and countries should negotiate more space for involving local busi-nesses, including potentially allowing small traders in and around the exclusion zones.
The social inclusivity of the studied mega-events was very limited and no significant effects on urban poverty and inequality were identified. most poor households in South Africa were unaffected by the event and there is a sense that all of the public spending benefits bypassed much of South Africa’s citizens completely.
In India even some negative effects resulted as an estimated 30,000 to 40,000 families23 were displaced as a direct due to the Commonwealth Games, a problem that was exacerbated by mismanagement of the relocation of the families. Additionally, job and livelihood losses from the displacement were reported. Host cities in develop-ing countries should therefore design and implement special programmes in order to enhance the social inclusivity of mega-events. Local communities and poor neigh-bourhoods, small traders or small farmers should be integrated in the business model of the events.
EnviRonmEnTAl impAcTSOverall the studies indicated that hosting the mega-events did indeed accelerate the cities’ and countries’ transition processes towards a green economy and low carbon society. The accelerated shift to public transport is essential for greening the cities and the positive climate change impact must be noted. Also noteworthy is the fact that the carbon footprints of the events in South Africa and India were ultimately neutralised. Some progress could be observed in the implementation of modern environmental management systems (waste, water, energy efficiency, green building, etc.). Again, the Cape Town Green Goal initiatives deserve special credit, as does the sustainability plan for Rio de Janeiro.
most important however is the potential of the events to catalyse a broader shift to more sustainable lifestyles and production patterns. This potential has been exploited through awareness and environmental campaigns, in which the Green Goal pro-gramme again excelled.
As seen in the case of Commonwealth Games village, land-use emerges as a con-cern on the environmental front in the absence of riverbed regulations. Also, disaster management was not integrated as part of the creation of new infrastructure. visibility
of such unsustainable land-use practices by a mega-city like Delhi, may lead to a del-eterious domino effect that could set a poor example for other cities to follow.
1.4 ConCluSionThe experiences from India and South Africa showed that developing countries are successfully able to stage mega-events like the fIfA World Cup™ or the Olympic Games and in fact, the hosting offered global exposure and prestige, an important factor which should not be underestimated. Positive legacies were created through improvements of urban infrastructure (mainly transport) and through the greening of the events. Expectations regarding the promise of major economic windfalls from the events were not supported by the results of the country studies. One of the reasons is that the binding governance and business models of the events proved inadequate for host cities and countries in the developing world. fIfA and the IOC should be more flexible and give greater regard to the special development needs of these countries. furthermore, from a strict sustainable development point of view, the cost-benefit ratios of the events seem very unfavourable. With costs reaching sums like 50 billion USD, alternative investments in education, health or adequate housing seem to deliver more sustainable development benefits than oversized and underutilised stadia.
moreover, in order to realise the potential of mega-events in developing country cities, governance and institutions at the national and international levels have an important role to play. Collaboration between national and international institutions with major local groups (including local authorities) is relevant in this regard.
All three countries showed many very interesting initiatives for greening the events. fIfA and the IOC as well the national governments and international organisations should invest in knowledge management and in the exchange of best practice.
One of the major future challenges concerns the social inclusivity of mega-events in developing countries. The performance of the studied mega-event organising process-es was not satisfactory and further research and pilot projects seem to be necessary. National governments, host cities, fIfA, IOC, etc. should pay special attention to social inclusivity and design specific programmes with the support of civil society.
Mughal Tomb, I’timad-ud-Daulah, in Agra, Uttar Pradesh, India. Despite a number of initiatives by the governement, there is very little evidence of any benefit to tourism from hosting the mega-event. (Source: Jeremy Richards/Shutterstock.com)
22 See the South Africa Country Study 23 As estimated by NGO Delhi Shramik Sangathan
First Electrawinds Wind Turbine at Coega IDZ in the Eastern Cape, South Africa.
overall the studies in-dicated that hosting the mega-events did indeed accelerate the cities’ and countries’ transition processes to-wards a green economy and low carbon society
”
“
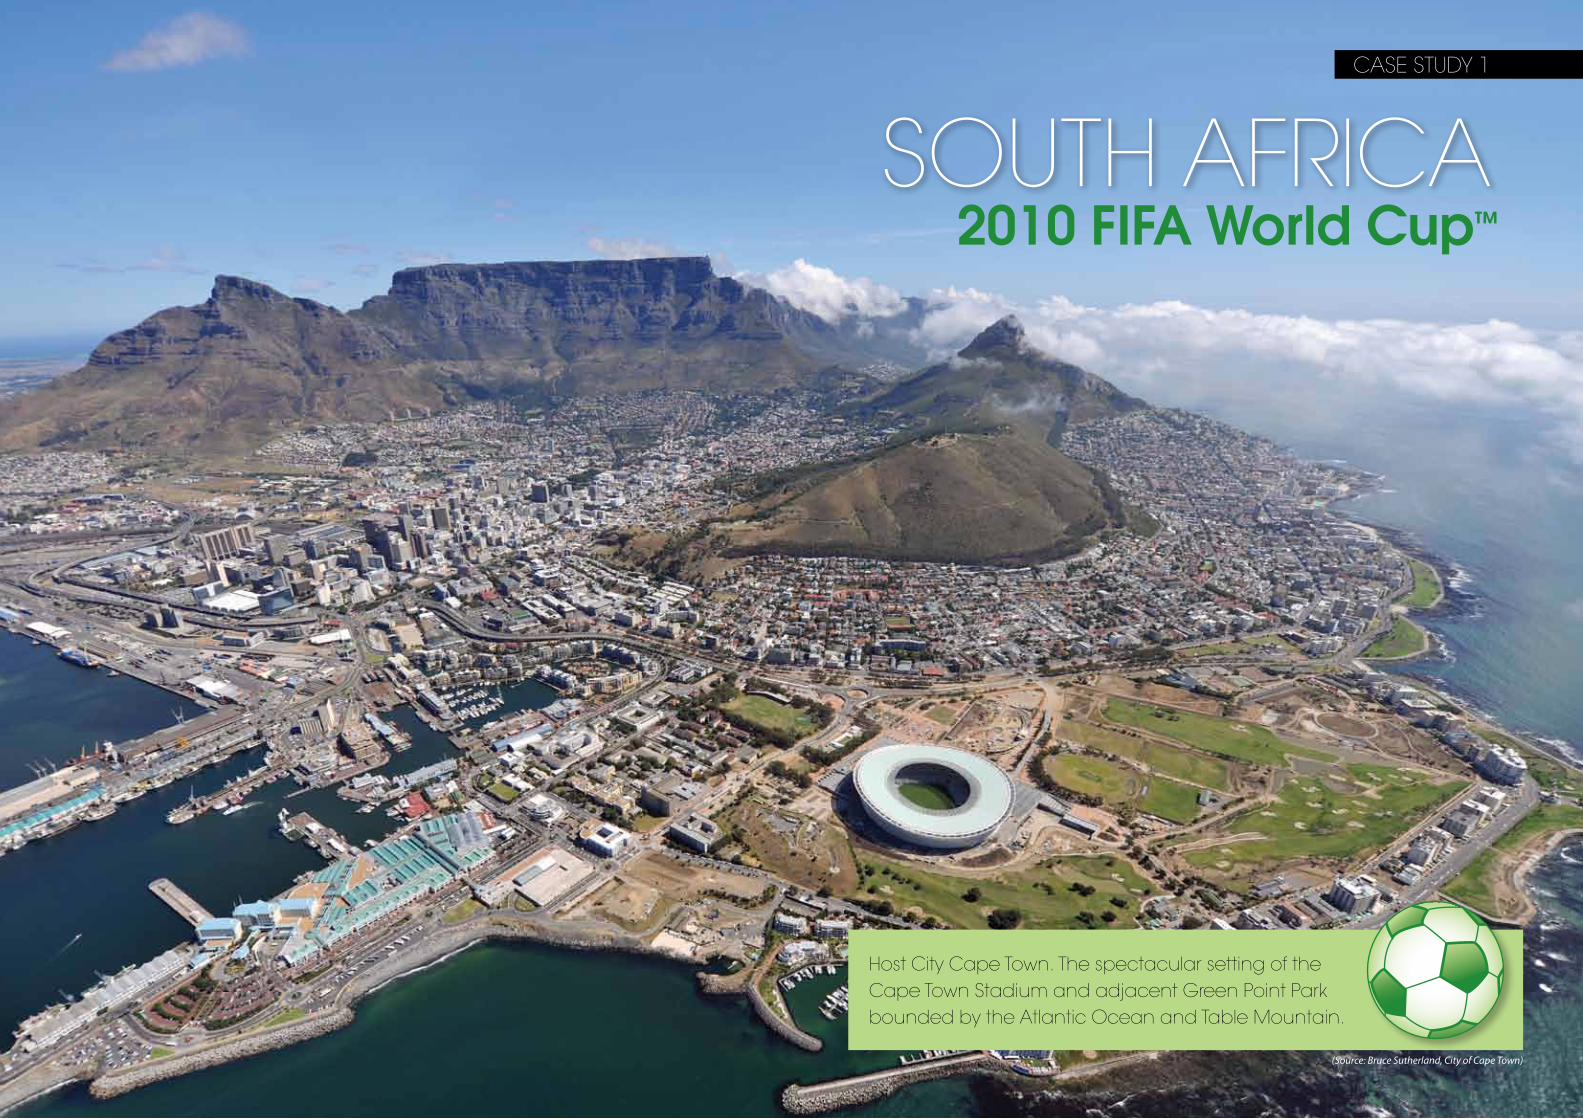
42 • SuStainable Mega-eventS in Developing CountrieS South africa • 43
south africa
2010 fifa World cup™
SOUTH AFRICACASe STUdy 1
Host City Cape Town. The spectacular setting of the Cape Town Stadium and adjacent Green Point Park bounded by the Atlantic Ocean and Table Mountain.
(Source: Bruce Sutherland, City of Cape Town)
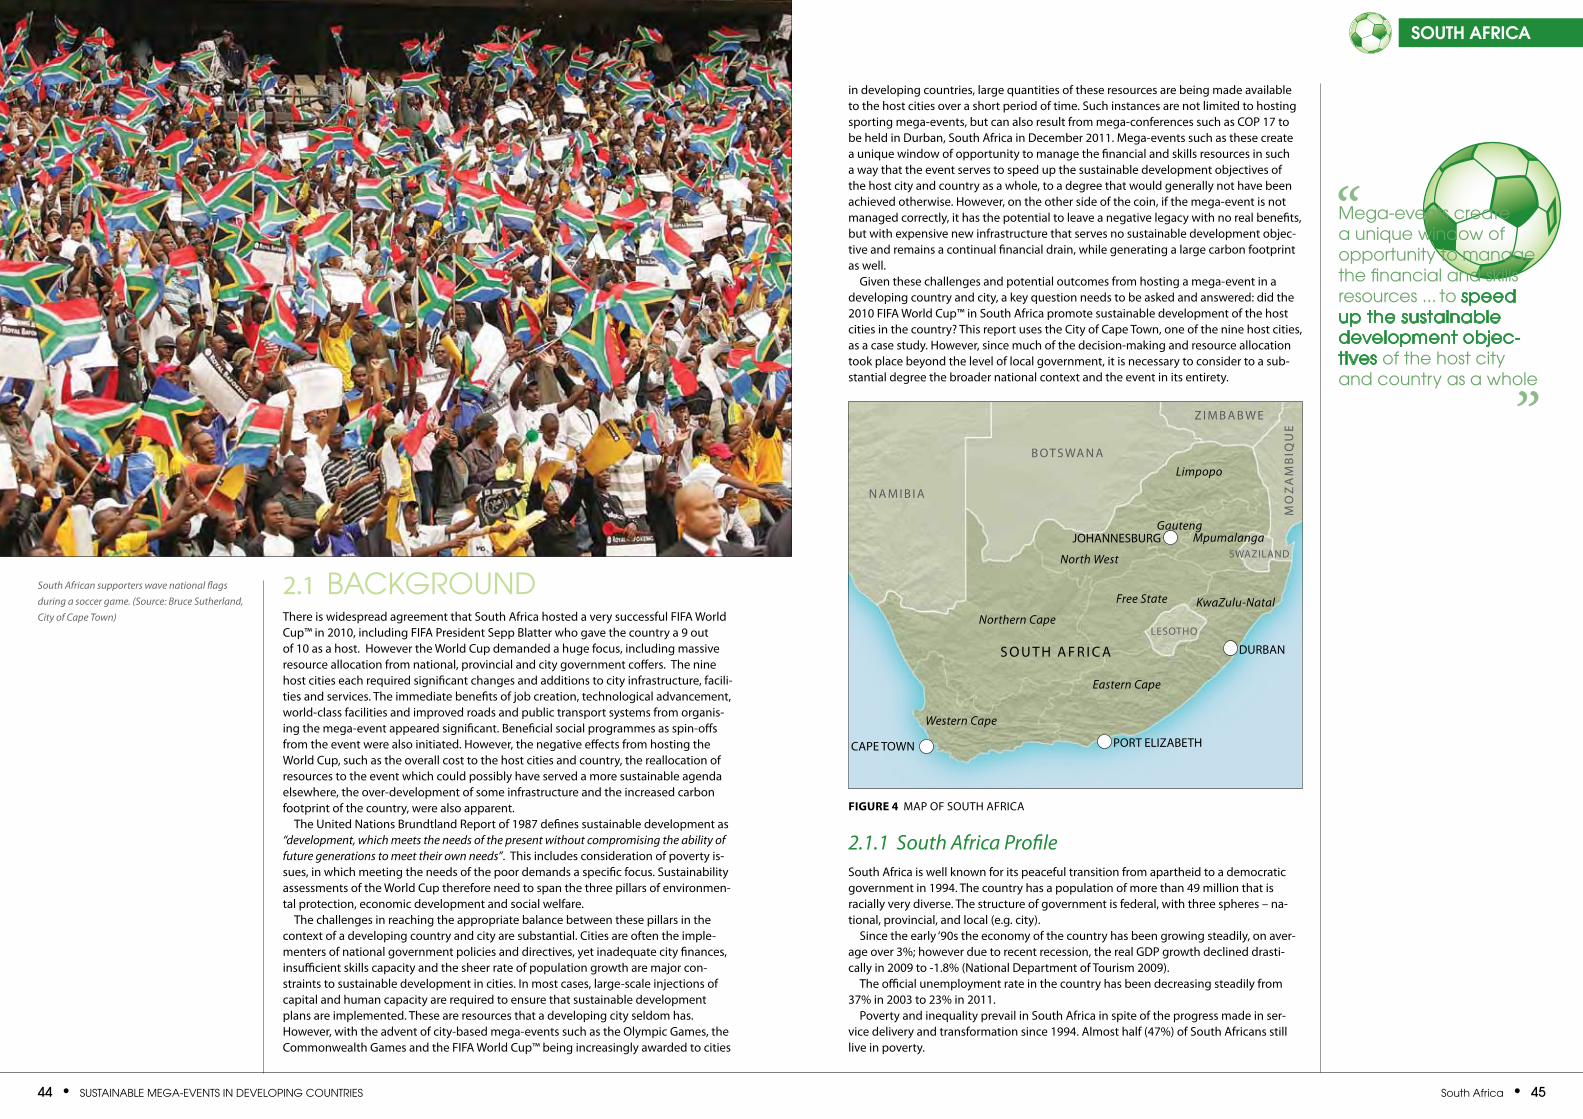
44 • SuStainable Mega-eventS in Developing CountrieS South africa • 45
south africa
2.1 baCkgrounDThere is widespread agreement that South Africa hosted a very successful FIFA World Cup™ in 2010, including FIFA President Sepp Blatter who gave the country a 9 out of 10 as a host. However the World Cup demanded a huge focus, including massive resource allocation from national, provincial and city government coffers. The nine host cities each required significant changes and additions to city infrastructure, facili-ties and services. The immediate benefits of job creation, technological advancement, world-class facilities and improved roads and public transport systems from organis-ing the mega-event appeared significant. Beneficial social programmes as spin-offs from the event were also initiated. However, the negative effects from hosting the World Cup, such as the overall cost to the host cities and country, the reallocation of resources to the event which could possibly have served a more sustainable agenda elsewhere, the over-development of some infrastructure and the increased carbon footprint of the country, were also apparent.
The United Nations Brundtland Report of 1987 defines sustainable development as “development, which meets the needs of the present without compromising the ability of future generations to meet their own needs”. This includes consideration of poverty is-sues, in which meeting the needs of the poor demands a specific focus. Sustainability assessments of the World Cup therefore need to span the three pillars of environmen-tal protection, economic development and social welfare.
The challenges in reaching the appropriate balance between these pillars in the context of a developing country and city are substantial. Cities are often the imple-menters of national government policies and directives, yet inadequate city finances, insufficient skills capacity and the sheer rate of population growth are major con-straints to sustainable development in cities. In most cases, large-scale injections of capital and human capacity are required to ensure that sustainable development plans are implemented. These are resources that a developing city seldom has. However, with the advent of city-based mega-events such as the Olympic Games, the Commonwealth Games and the FIFA World Cup™ being increasingly awarded to cities
South African supporters wave national flags during a soccer game. (Source: Bruce Sutherland, City of Cape Town)
Mega-events create a unique window of opportunity to manage the financial and skills resources ... to speed up the sustainable development objec-tives of the host city and country as a whole
in developing countries, large quantities of these resources are being made available to the host cities over a short period of time. Such instances are not limited to hosting sporting mega-events, but can also result from mega-conferences such as COP 17 to be held in Durban, South Africa in December 2011. Mega-events such as these create a unique window of opportunity to manage the financial and skills resources in such a way that the event serves to speed up the sustainable development objectives of the host city and country as a whole, to a degree that would generally not have been achieved otherwise. However, on the other side of the coin, if the mega-event is not managed correctly, it has the potential to leave a negative legacy with no real benefits, but with expensive new infrastructure that serves no sustainable development objec-tive and remains a continual financial drain, while generating a large carbon footprint as well.
Given these challenges and potential outcomes from hosting a mega-event in a developing country and city, a key question needs to be asked and answered: did the 2010 FIFA World Cup™ in South Africa promote sustainable development of the host cities in the country? This report uses the City of Cape Town, one of the nine host cities, as a case study. However, since much of the decision-making and resource allocation took place beyond the level of local government, it is necessary to consider to a sub-stantial degree the broader national context and the event in its entirety.
2.1.1 South Africa ProfileSouth Africa is well known for its peaceful transition from apartheid to a democratic government in 1994. The country has a population of more than 49 million that is racially very diverse. The structure of government is federal, with three spheres – na-tional, provincial, and local (e.g. city).
Since the early ‘90s the economy of the country has been growing steadily, on aver-age over 3%; however due to recent recession, the real GDP growth declined drasti-cally in 2009 to -1.8% (National Department of Tourism 2009).
The official unemployment rate in the country has been decreasing steadily from 37% in 2003 to 23% in 2011.
Poverty and inequality prevail in South Africa in spite of the progress made in ser-vice delivery and transformation since 1994. Almost half (47%) of South Africans still live in poverty.
”
“
Figure 4 MAP OF SOUTH AFRICA
CAPe TOWN PORT elIzABeTH
DURBAN
jOHANNeSBURG
Eastern Cape
Limpopo
KwaZulu-NatalNorthern Cape
GautengMpumalanga
North West
Free State
Western Cape
S O U T H A F R I C A
B OT S WA N A
N A M I B I A
z I M B A B W e
leSOTHO
SWAzIlAND
MO
zA
MB
IQU
e
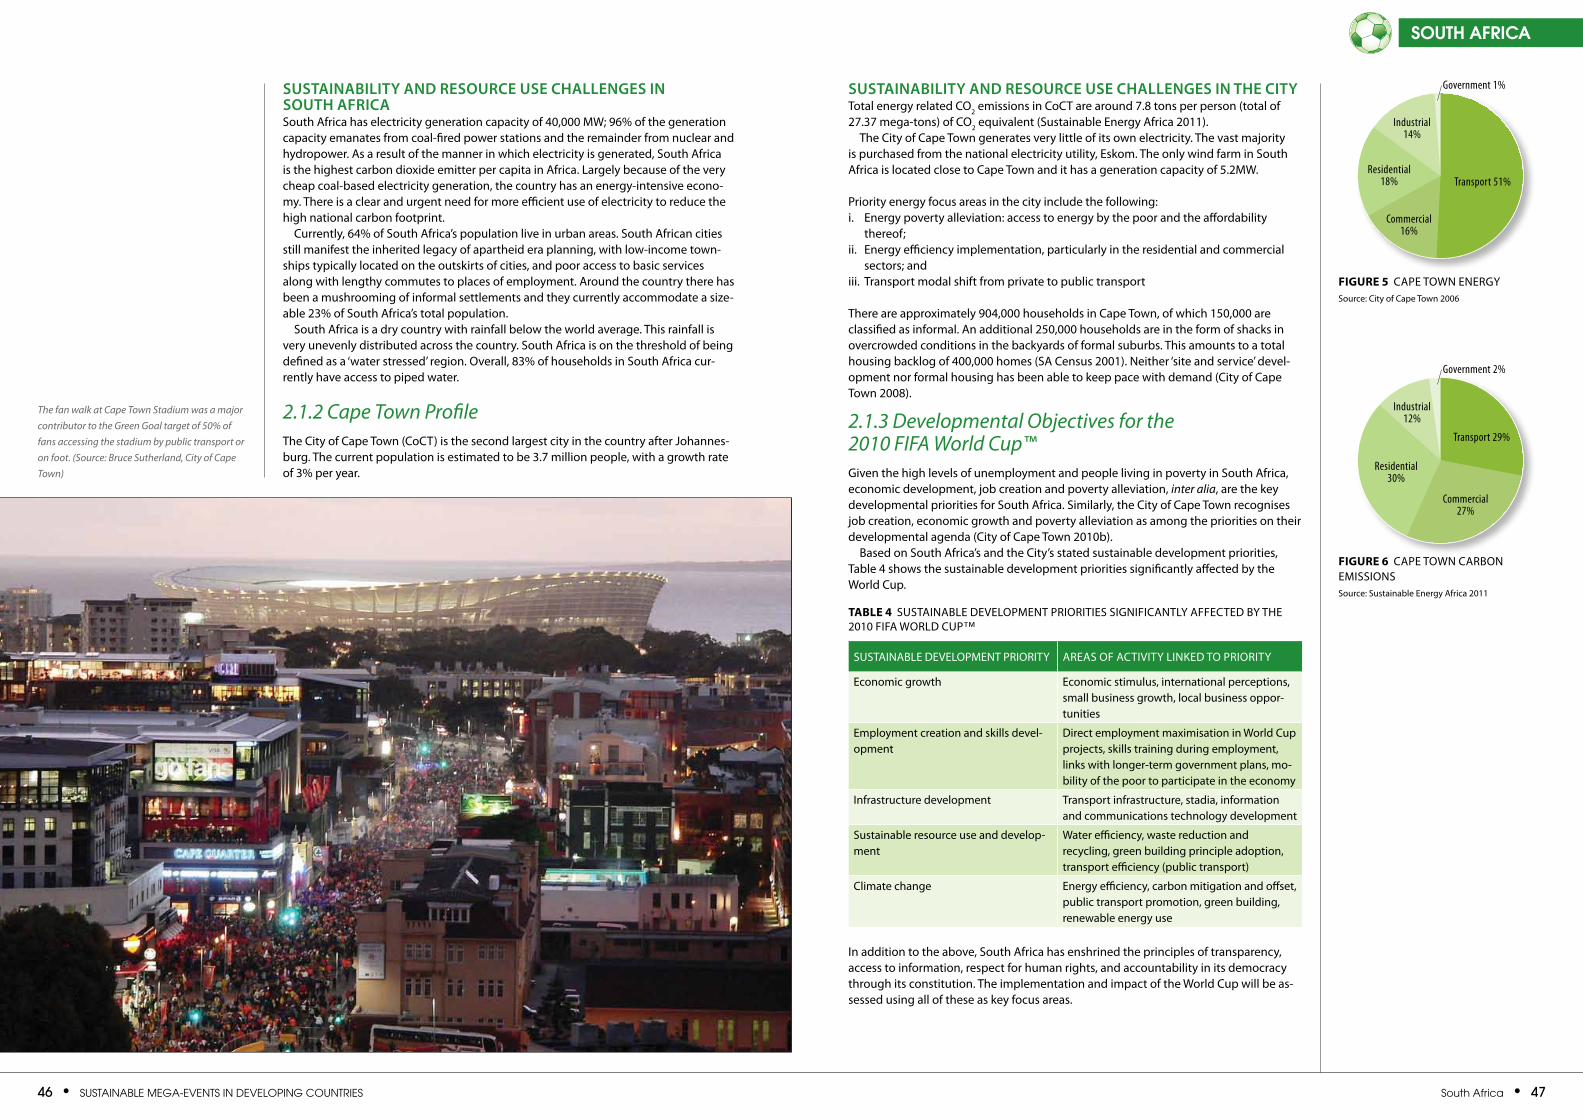
46 • SuStainable Mega-eventS in Developing CountrieS South africa • 47
south africa
SuStainability and ReSouRce uSe challengeS in South afRicaSouth Africa has electricity generation capacity of 40,000 MW; 96% of the generation capacity emanates from coal-fired power stations and the remainder from nuclear and hydropower. As a result of the manner in which electricity is generated, South Africa is the highest carbon dioxide emitter per capita in Africa. largely because of the very cheap coal-based electricity generation, the country has an energy-intensive econo-my. There is a clear and urgent need for more efficient use of electricity to reduce the high national carbon footprint.
Currently, 64% of South Africa’s population live in urban areas. South African cities still manifest the inherited legacy of apartheid era planning, with low-income town-ships typically located on the outskirts of cities, and poor access to basic services along with lengthy commutes to places of employment. Around the country there has been a mushrooming of informal settlements and they currently accommodate a size-able 23% of South Africa’s total population.
South Africa is a dry country with rainfall below the world average. This rainfall is very unevenly distributed across the country. South Africa is on the threshold of being defined as a ‘water stressed’ region. Overall, 83% of households in South Africa cur-rently have access to piped water.
2.1.2 Cape Town ProfileThe City of Cape Town (CoCT) is the second largest city in the country after johannes-burg. The current population is estimated to be 3.7 million people, with a growth rate of 3% per year.
SuStainability and ReSouRce uSe challengeS in the cityTotal energy related CO2 emissions in CoCT are around 7.8 tons per person (total of 27.37 mega-tons) of CO2 equivalent (Sustainable energy Africa 2011).
The City of Cape Town generates very little of its own electricity. The vast majority is purchased from the national electricity utility, eskom. The only wind farm in South Africa is located close to Cape Town and it has a generation capacity of 5.2MW.
Priority energy focus areas in the city include the following:i. energy poverty alleviation: access to energy by the poor and the affordability
thereof;ii. energy efficiency implementation, particularly in the residential and commercial
sectors; andiii. Transport modal shift from private to public transport
There are approximately 904,000 households in Cape Town, of which 150,000 are classified as informal. An additional 250,000 households are in the form of shacks in overcrowded conditions in the backyards of formal suburbs. This amounts to a total housing backlog of 400,000 homes (SA Census 2001). Neither ‘site and service’ devel-opment nor formal housing has been able to keep pace with demand (City of Cape Town 2008).
2.1.3 Developmental Objectives for the 2010 FIFA World Cup™Given the high levels of unemployment and people living in poverty in South Africa, economic development, job creation and poverty alleviation, inter alia, are the key developmental priorities for South Africa. Similarly, the City of Cape Town recognises job creation, economic growth and poverty alleviation as among the priorities on their developmental agenda (City of Cape Town 2010b).
Based on South Africa’s and the City’s stated sustainable development priorities, Table 4 shows the sustainable development priorities significantly affected by the World Cup.
In addition to the above, South Africa has enshrined the principles of transparency, access to information, respect for human rights, and accountability in its democracy through its constitution. The implementation and impact of the World Cup will be as-sessed using all of these as key focus areas.
The fan walk at Cape Town Stadium was a major contributor to the Green Goal target of 50% of fans accessing the stadium by public transport or on foot. (Source: Bruce Sutherland, City of Cape Town)
Figure 5 CAPe TOWN eNeRGySource: City of Cape Town 2006
Figure 6 CAPe TOWN CARBON eMISSIONSSource: Sustainable energy Africa 2011
SUSTAINABle DevelOPMeNT PRIORITy AReAS OF ACTIvITy lINkeD TO PRIORITy
economic growth economic stimulus, international perceptions, small business growth, local business oppor-tunities
employment creation and skills devel-opment
Direct employment maximisation in World Cup projects, skills training during employment, links with longer-term government plans, mo-bility of the poor to participate in the economy
Infrastructure development Transport infrastructure, stadia, information and communications technology development
Sustainable resource use and develop-ment
Water efficiency, waste reduction and recycling, green building principle adoption, transport efficiency (public transport)
Climate change energy efficiency, carbon mitigation and offset, public transport promotion, green building, renewable energy use
Table 4 SUSTAINABle DevelOPMeNT PRIORITIeS SIGNIFICANTly AFFeCTeD By THe 2010 FIFA WORlD CUP™
Transport 51%
Commercial 16%
Residential 18%
Industrial 14%
Government 1%
Transport 29%
Commercial 27%
Residential 30%
Industrial 12%
Government 2%
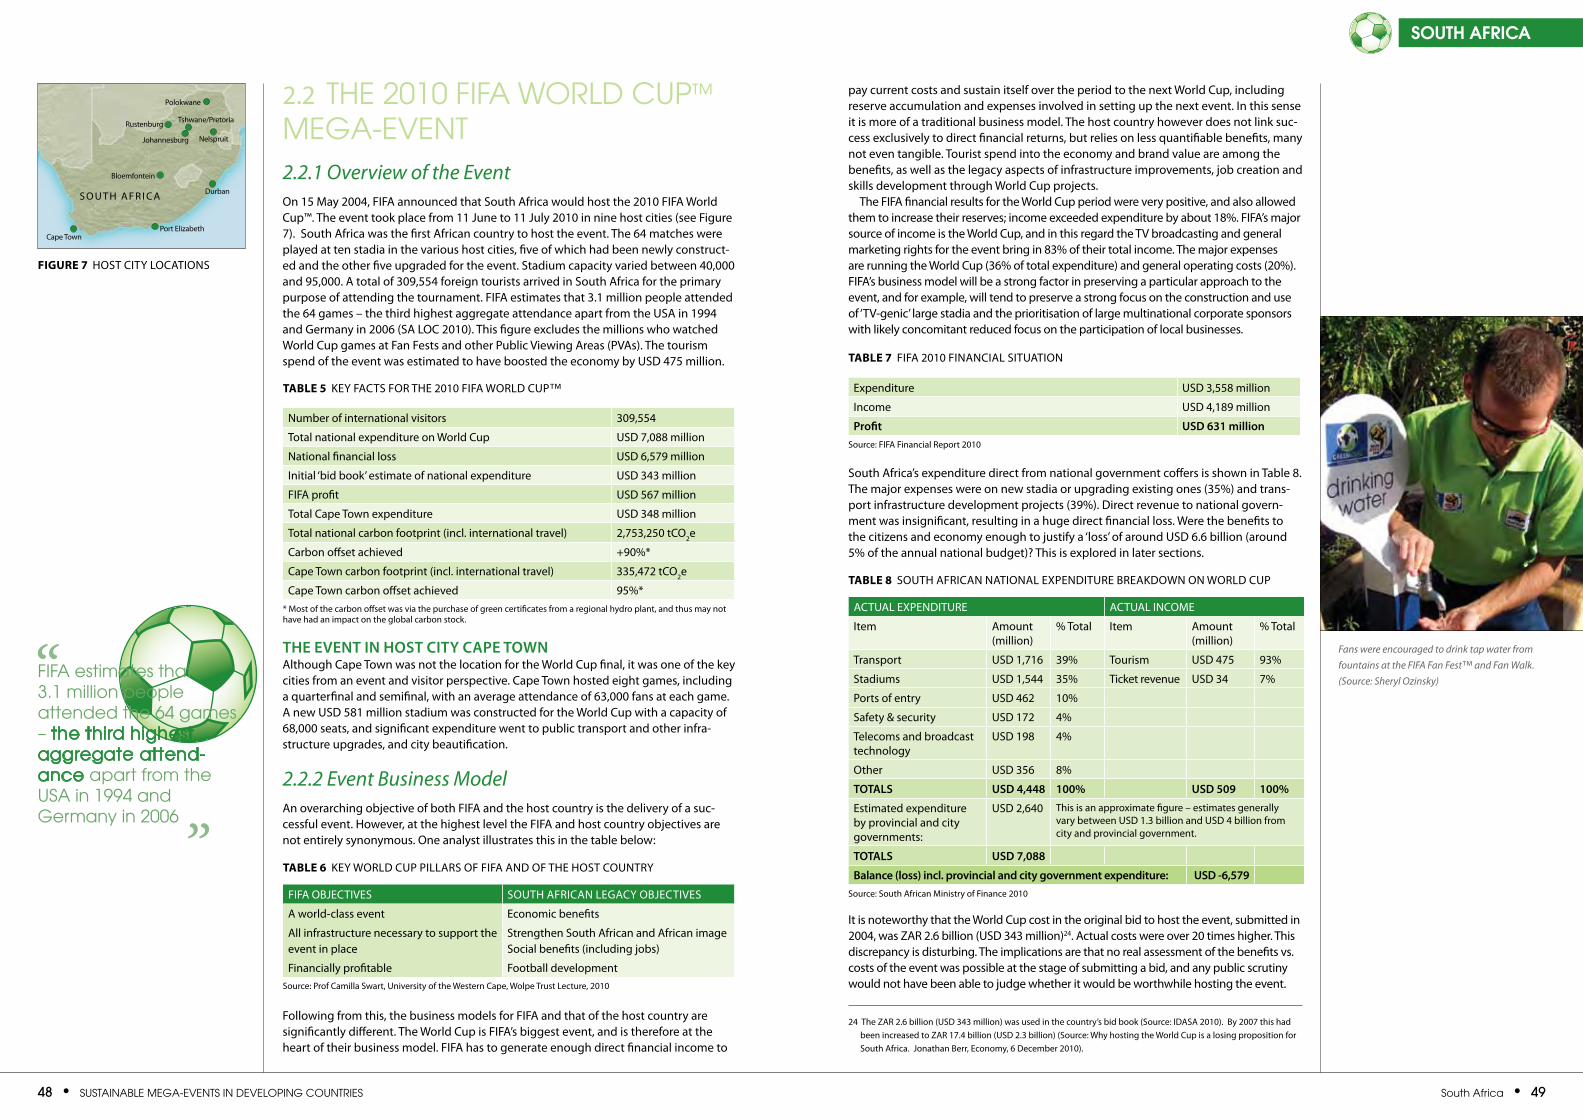
48 • SuStainable Mega-eventS in Developing CountrieS South africa • 49
south africa
2.2 the 2010 FiFa WorlD Cup™ Mega-event2.2.1 Overview of the EventOn 15 May 2004, FIFA announced that South Africa would host the 2010 FIFA World Cup™. The event took place from 11 june to 11 july 2010 in nine host cities (see Figure 7). South Africa was the first African country to host the event. The 64 matches were played at ten stadia in the various host cities, five of which had been newly construct-ed and the other five upgraded for the event. Stadium capacity varied between 40,000 and 95,000. A total of 309,554 foreign tourists arrived in South Africa for the primary purpose of attending the tournament. FIFA estimates that 3.1 million people attended the 64 games – the third highest aggregate attendance apart from the USA in 1994 and Germany in 2006 (SA lOC 2010). This figure excludes the millions who watched World Cup games at Fan Fests and other Public viewing Areas (PvAs). The tourism spend of the event was estimated to have boosted the economy by USD 475 million.
the event in hoSt city cape townAlthough Cape Town was not the location for the World Cup final, it was one of the key cities from an event and visitor perspective. Cape Town hosted eight games, including a quarterfinal and semifinal, with an average attendance of 63,000 fans at each game. A new USD 581 million stadium was constructed for the World Cup with a capacity of 68,000 seats, and significant expenditure went to public transport and other infra-structure upgrades, and city beautification.
2.2.2 Event Business ModelAn overarching objective of both FIFA and the host country is the delivery of a suc-cessful event. However, at the highest level the FIFA and host country objectives are not entirely synonymous. One analyst illustrates this in the table below:
Following from this, the business models for FIFA and that of the host country are significantly different. The World Cup is FIFA’s biggest event, and is therefore at the heart of their business model. FIFA has to generate enough direct financial income to
pay current costs and sustain itself over the period to the next World Cup, including reserve accumulation and expenses involved in setting up the next event. In this sense it is more of a traditional business model. The host country however does not link suc-cess exclusively to direct financial returns, but relies on less quantifiable benefits, many not even tangible. Tourist spend into the economy and brand value are among the benefits, as well as the legacy aspects of infrastructure improvements, job creation and skills development through World Cup projects.
The FIFA financial results for the World Cup period were very positive, and also allowed them to increase their reserves; income exceeded expenditure by about 18%. FIFA’s major source of income is the World Cup, and in this regard the Tv broadcasting and general marketing rights for the event bring in 83% of their total income. The major expenses are running the World Cup (36% of total expenditure) and general operating costs (20%). FIFA’s business model will be a strong factor in preserving a particular approach to the event, and for example, will tend to preserve a strong focus on the construction and use of ‘Tv-genic’ large stadia and the prioritisation of large multinational corporate sponsors with likely concomitant reduced focus on the participation of local businesses.
South Africa’s expenditure direct from national government coffers is shown in Table 8. The major expenses were on new stadia or upgrading existing ones (35%) and trans-port infrastructure development projects (39%). Direct revenue to national govern-ment was insignificant, resulting in a huge direct financial loss. Were the benefits to the citizens and economy enough to justify a ‘loss’ of around USD 6.6 billion (around 5% of the annual national budget)? This is explored in later sections.
It is noteworthy that the World Cup cost in the original bid to host the event, submitted in 2004, was zAR 2.6 billion (USD 343 million)24. Actual costs were over 20 times higher. This discrepancy is disturbing. The implications are that no real assessment of the benefits vs. costs of the event was possible at the stage of submitting a bid, and any public scrutiny would not have been able to judge whether it would be worthwhile hosting the event.
johannesburg
S O U T H A F R I C A
Cape TownPort elizabeth
Durban
Tshwane/PretoriaRustenburg
Nelspruit
Polokwane
Bloemfontein
Figure 7 HOST CITy lOCATIONS
Number of international visitors 309,554
Total national expenditure on World Cup USD 7,088 million
National financial loss USD 6,579 million
Initial ‘bid book’ estimate of national expenditure USD 343 million
FIFA profit USD 567 million
Total Cape Town expenditure USD 348 million
Total national carbon footprint (incl. international travel) 2,753,250 tCO2e
Carbon offset achieved +90%*
Cape Town carbon footprint (incl. international travel) 335,472 tCO2e
Cape Town carbon offset achieved 95%** Most of the carbon offset was via the purchase of green certificates from a regional hydro plant, and thus may not have had an impact on the global carbon stock.
Table 5 key FACTS FOR THe 2010 FIFA WORlD CUP™
FIFA OBjeCTIveS SOUTH AFRICAN leGACy OBjeCTIveS
A world-class event economic benefits
All infrastructure necessary to support the event in place
Strengthen South African and African image Social benefits (including jobs)
Financially profitable Football developmentSource: Prof Camilla Swart, University of the Western Cape, Wolpe Trust lecture, 2010
Table 6 key WORlD CUP PIllARS OF FIFA AND OF THe HOST COUNTRy
expenditure USD 3,558 million
Income USD 4,189 million
profit uSd 631 millionSource: FIFA Financial Report 2010
Table 7 FIFA 2010 FINANCIAl SITUATION
Fans were encouraged to drink tap water from fountains at the FIFA Fan Fest™ and Fan Walk. (Source: Sheryl Ozinsky)
FiFa estimates that 3.1 million people attended the 64 games – the third highest aggregate attend-ance apart from the uSa in 1994 and germany in 2006
”
“ACTUAl exPeNDITURe ACTUAl INCOMe
Item Amount (million)
% Total Item Amount (million)
% Total
Transport USD 1,716 39% Tourism USD 475 93%
Stadiums USD 1,544 35% Ticket revenue USD 34 7%
Ports of entry USD 462 10%
Safety & security USD 172 4%
Telecoms and broadcast technology
USD 198 4%
Other USD 356 8%
totalS uSd 4,448 100% uSd 509 100%
estimated expenditure by provincial and city governments:
USD 2,640 This is an approximate figure – estimates generally vary between USD 1.3 billion and USD 4 billion from city and provincial government.
totalS uSd 7,088
balance (loss) incl. provincial and city government expenditure: uSd -6,579Source: South African Ministry of Finance 2010
Table 8 SOUTH AFRICAN NATIONAl exPeNDITURe BReAkDOWN ON WORlD CUP
24 The zAR 2.6 billion (USD 343 million) was used in the country’s bid book (Source: IDASA 2010). By 2007 this had been increased to zAR 17.4 billion (USD 2.3 billion) (Source: Why hosting the World Cup is a losing proposition for South Africa. jonathan Berr, economy, 6 December 2010).
50 • SuStainable Mega-eventS in Developing CountrieS South africa • 51
south africa
cape town ReSouRce allocationAs with the host country at national government level, the host cities received almost no direct income from the event other than receiving a small proportion of local ticket revenue (approximately 10%). They were supported financially by national government grants but their overall expenses remained a drain on city coffers. They thus made a significant loss, although there are indirect economic and social benefits, which may compensate at least a portion of this, and are discussed later in the report. The financial situation typical of host cities is illustrated for Cape Town in Table 9. Out of the total ex-penditure of USD 1.6 billion the City contributed USD 348 million directly from its coffers, or about 13% of the total annual city budget of around USD 2.64 billion. However this World Cup expenditure was incurred over three or four financial years, thus costing the City about 4% extra for this period on average.
StadiaWhile the stadia represent a significant upgrade on previous facilities, and are world-class and multi-purpose sport and event venues, in many host cities they are expected to be substantially under-utilised and thus be a financial burden on the cities, which have to take ongoing responsibility for their operation and maintenance costs. This should not have been unexpected, as previous mega-events indicate that stadia seldom provide returns on investment. estimates of the financial burden of the Cape Town stadium are between USD 0.7 to USD 1.5 million per year25.
tRanSpoRt infRaStRuctuReTransport infrastructure was the other major expense for the country. Total expendi-ture in this category was USD 1.7 billion, mostly from national coffers. This included the purchase of 1,400 luxury buses, construction of bus rapid transit projects in major cities, highway and road upgrading, and airport upgrading. For the latter, the Airports Company of South Africa has embarked on an additional USD 2.6 billion upgrade26, which will be an ongoing asset to a country where tourism is an important economic sector. The public transport upgrading that took place was generally part of government’s longer-term infrastructure plan, and therefore the World Cup mainly accelerated the delivery of these
services rather than redirected national resources. This was the case for host city Cape Town too, where plans submitted to national government for funding support all were already in the longer-term transport plans of the metro.
However it remains unclear who benefits from these investments. While it is expected that mid- to high-income households will be among the beneficiaries in our increasingly congested cities, and the improved roads will facilitate economic efficiency, there is a question as to how much the poor will benefit. Nevertheless it is widely held that, as a developing country, improvements in infrastructure are important for growth, and the World Cup has clearly provided this sector with a boost.
infoRmation and communicationS technologieS (ict)It was hoped that the sophisticated ICT requirements of the World Cup would accelerate internet access to South Africans partly via the introduction of digital Tv infrastructure. One analyst considers that the upgrades made during the event will continue to be use-ful. For example the upgrade of the emergency services disaster centres in the host cities will help cope with disasters better in future (Mathen 2010). Overall however, it is pres-ently unclear how much of this benefit has been, or will be, realised.
the official legacy pRogRammeSFIFA developed a set of legacy projects together with the South African government and other African countries (South African lOC 2010). FIFA contributed USD 20 million to SAFA and USD 80 million to the ‘2010 FIFA World Cup legacy Trust’ (FIFA 2010). The Trust comprised FIFA’s major legacy promotion vehicle for South Africa, and was established as a part of FIFA’s promise that South Africans would “benefit from the World Cup long after the final whistle had blown” (FIFA 2010).
In addition to the above national initiatives, various cities developed their own legacy programmes or projects. Cape Town was among those that emphasised this aspect in implementing World Cup projects, and most of their legacy projects were located within the Green Goal programme. This programme was initiated in Cape Town (based on the German 2006 Green Goal model) and later adopted by the lOC and national government. The Cape Town Green Goal programme is discussed later.
exPeNDITURe (millions) INCOMe (millions)
Item Amount % Total Item Amount
Stadium USD 580 35% Ticket Sales USD 4.9
Access to stadium USD 39 2%
Green point common USD 76 5%
Inner city transport USD 5.5 0%
CBD infrastructure USD 78 5%
Roads, sport facilities USD 68 4%
Major roads USD 239 15%
Public transport USD 549 34%
totalS uSd 1,634.5 100% uSd 4.9
balance: uSd -1,629.6Source: City of Cape Town 2011
Table 9 exPeNDITURe ON INFRASTRUCTURe IN CAPe TOWN
Total cost of government expenditure on stadiums USD 2.17 billion
World Cup Bid Book stadium cost estimate USD 0.108 billion
difference (actual vs. estimated) uSd 2.062 billionSource: IDASA 2010
Table 10 SOUTH AFRICAN STADIUM exPeNDITURe – ACTUAl vS. eSTIMATeD
Moses Mabhida Stadium in Durban. Previous mega-events indicate that stadia seldom provide returns on investment. (Source: Jbor/Shutter-stock.com )
25 IDASA 2010 and personal communications with City officials. Note that this cost reflects the anticipated annual loss for running the stadium. The total operating budget (not loss) has been estimated at USD 8.7 million for 2011 (Cape Times, “City to run stadium as talks continue” 5 April 2011)
26 www.sa2010.gov.za – note that this figure is accounted for separately and not in World Cup expenditure totals
it is widely held that, as a developing country, improvements in infra-structure are important for growth, and the World Cup has clearly provided this sector with a boost ”
“
The Gautrain – Africa’s first high-speed rail line – is one of the legacy projects of the 2010 FIFA World Cup™ in Johannesburg. (Source: Stephane de Sakutin/AFP/Getty Images)
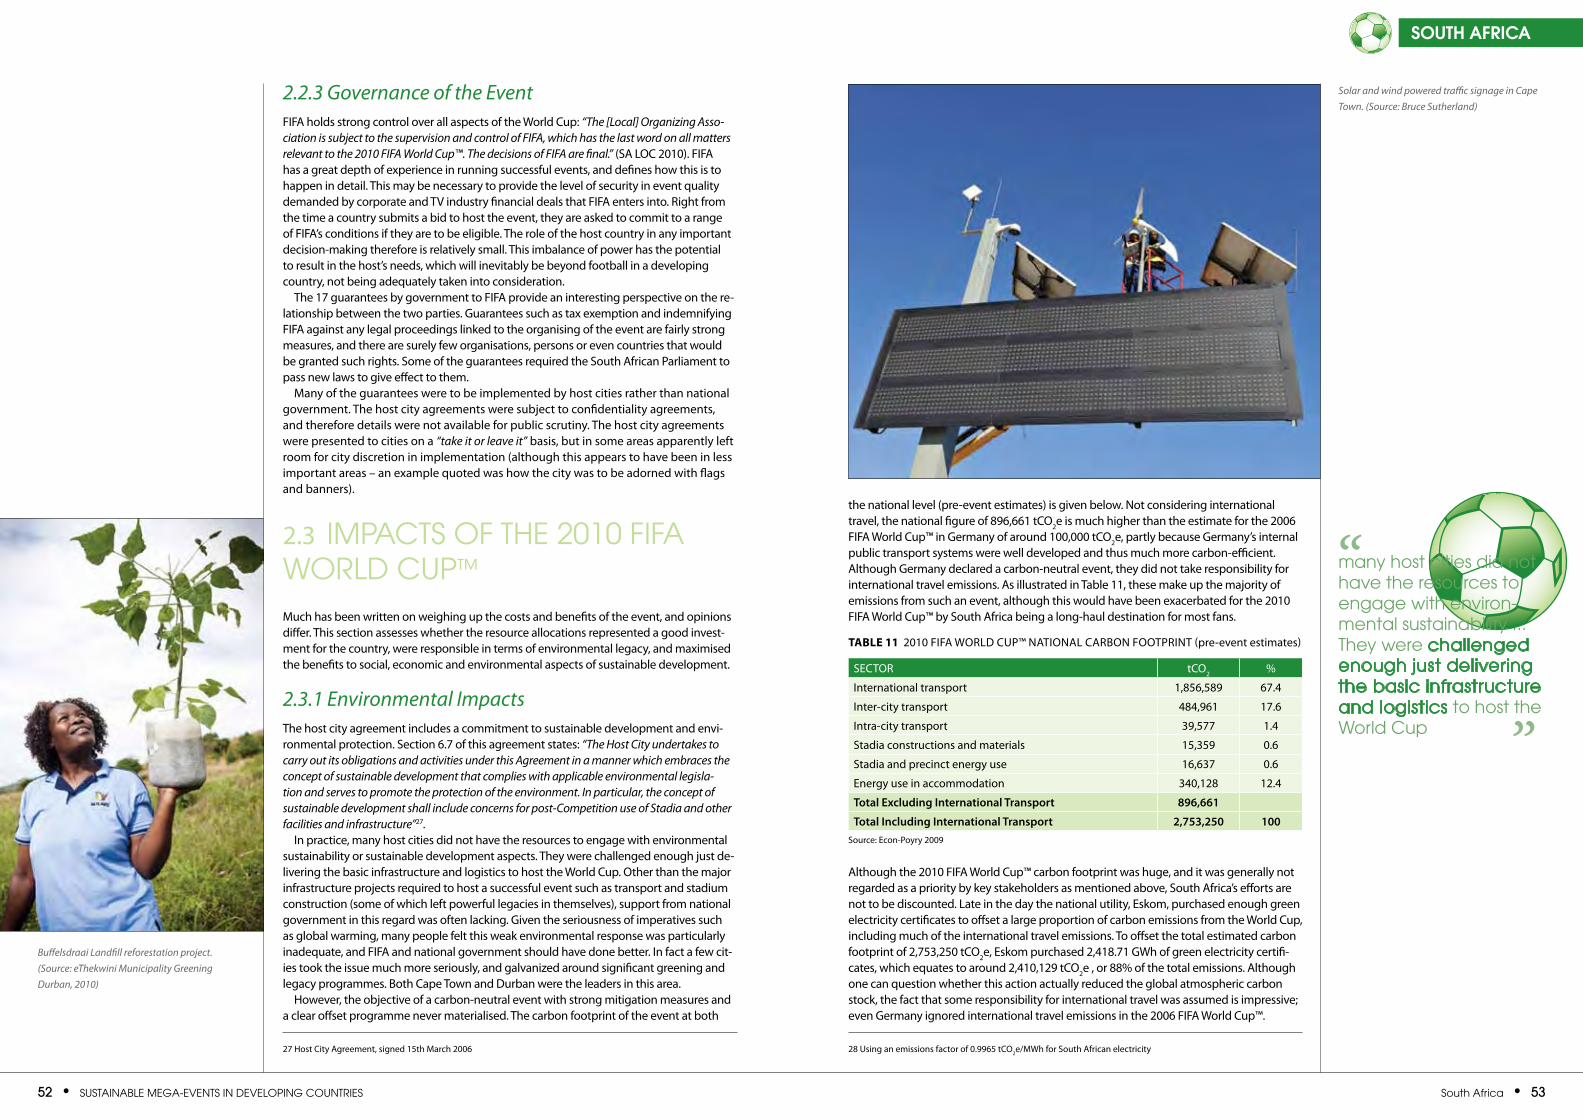
52 • SuStainable Mega-eventS in Developing CountrieS South africa • 53
south africa
2.2.3 Governance of the EventFIFA holds strong control over all aspects of the World Cup: “The [Local] Organizing Asso-ciation is subject to the supervision and control of FIFA, which has the last word on all matters relevant to the 2010 FIFA World Cup™. The decisions of FIFA are final.” (SA lOC 2010). FIFA has a great depth of experience in running successful events, and defines how this is to happen in detail. This may be necessary to provide the level of security in event quality demanded by corporate and Tv industry financial deals that FIFA enters into. Right from the time a country submits a bid to host the event, they are asked to commit to a range of FIFA’s conditions if they are to be eligible. The role of the host country in any important decision-making therefore is relatively small. This imbalance of power has the potential to result in the host’s needs, which will inevitably be beyond football in a developing country, not being adequately taken into consideration.
The 17 guarantees by government to FIFA provide an interesting perspective on the re-lationship between the two parties. Guarantees such as tax exemption and indemnifying FIFA against any legal proceedings linked to the organising of the event are fairly strong measures, and there are surely few organisations, persons or even countries that would be granted such rights. Some of the guarantees required the South African Parliament to pass new laws to give effect to them.
Many of the guarantees were to be implemented by host cities rather than national government. The host city agreements were subject to confidentiality agreements, and therefore details were not available for public scrutiny. The host city agreements were presented to cities on a “take it or leave it” basis, but in some areas apparently left room for city discretion in implementation (although this appears to have been in less important areas – an example quoted was how the city was to be adorned with flags and banners).
2.3 iMpaCtS oF the 2010 FiFa WorlD Cup™
Much has been written on weighing up the costs and benefits of the event, and opinions differ. This section assesses whether the resource allocations represented a good invest-ment for the country, were responsible in terms of environmental legacy, and maximised the benefits to social, economic and environmental aspects of sustainable development.
2.3.1 Environmental ImpactsThe host city agreement includes a commitment to sustainable development and envi-ronmental protection. Section 6.7 of this agreement states: “The Host City undertakes to carry out its obligations and activities under this Agreement in a manner which embraces the concept of sustainable development that complies with applicable environmental legisla-tion and serves to promote the protection of the environment. In particular, the concept of sustainable development shall include concerns for post-Competition use of Stadia and other facilities and infrastructure”27.
In practice, many host cities did not have the resources to engage with environmental sustainability or sustainable development aspects. They were challenged enough just de-livering the basic infrastructure and logistics to host the World Cup. Other than the major infrastructure projects required to host a successful event such as transport and stadium construction (some of which left powerful legacies in themselves), support from national government in this regard was often lacking. Given the seriousness of imperatives such as global warming, many people felt this weak environmental response was particularly inadequate, and FIFA and national government should have done better. In fact a few cit-ies took the issue much more seriously, and galvanized around significant greening and legacy programmes. Both Cape Town and Durban were the leaders in this area.
However, the objective of a carbon-neutral event with strong mitigation measures and a clear offset programme never materialised. The carbon footprint of the event at both
the national level (pre-event estimates) is given below. Not considering international travel, the national figure of 896,661 tCO2e is much higher than the estimate for the 2006 FIFA World Cup™ in Germany of around 100,000 tCO2e, partly because Germany’s internal public transport systems were well developed and thus much more carbon-efficient. Although Germany declared a carbon-neutral event, they did not take responsibility for international travel emissions. As illustrated in Table 11, these make up the majority of emissions from such an event, although this would have been exacerbated for the 2010 FIFA World Cup™ by South Africa being a long-haul destination for most fans.
Although the 2010 FIFA World Cup™ carbon footprint was huge, and it was generally not regarded as a priority by key stakeholders as mentioned above, South Africa’s efforts are not to be discounted. late in the day the national utility, eskom, purchased enough green electricity certificates to offset a large proportion of carbon emissions from the World Cup, including much of the international travel emissions. To offset the total estimated carbon footprint of 2,753,250 tCO2e, eskom purchased 2,418.71 GWh of green electricity certifi-cates, which equates to around 2,410,129 tCO2e , or 88% of the total emissions. Although one can question whether this action actually reduced the global atmospheric carbon stock, the fact that some responsibility for international travel was assumed is impressive; even Germany ignored international travel emissions in the 2006 FIFA World Cup™.
28 Using an emissions factor of 0.9965 tCO2e/MWh for South African electricity
Solar and wind powered traffic signage in Cape Town. (Source: Bruce Sutherland)
Buffelsdraai Landfill reforestation project. (Source: eThekwini Municipality Greening Durban, 2010)
SeCTOR tCO2 %
International transport 1,856,589 67.4
Inter-city transport 484,961 17.6
Intra-city transport 39,577 1.4
Stadia constructions and materials 15,359 0.6
Stadia and precinct energy use 16,637 0.6
energy use in accommodation 340,128 12.4
total excluding international transport 896,661
total including international transport 2,753,250 100Source: econ-Poyry 2009
Table 11 2010 FIFA WORlD CUP™ NATIONAl CARBON FOOTPRINT (pre-event estimates)
27 Host City Agreement, signed 15th March 2006
many host cities did not have the resources to engage with environ-mental sustainability ... they were challenged enough just delivering the basic infrastructure and logistics to host the World Cup ”
“
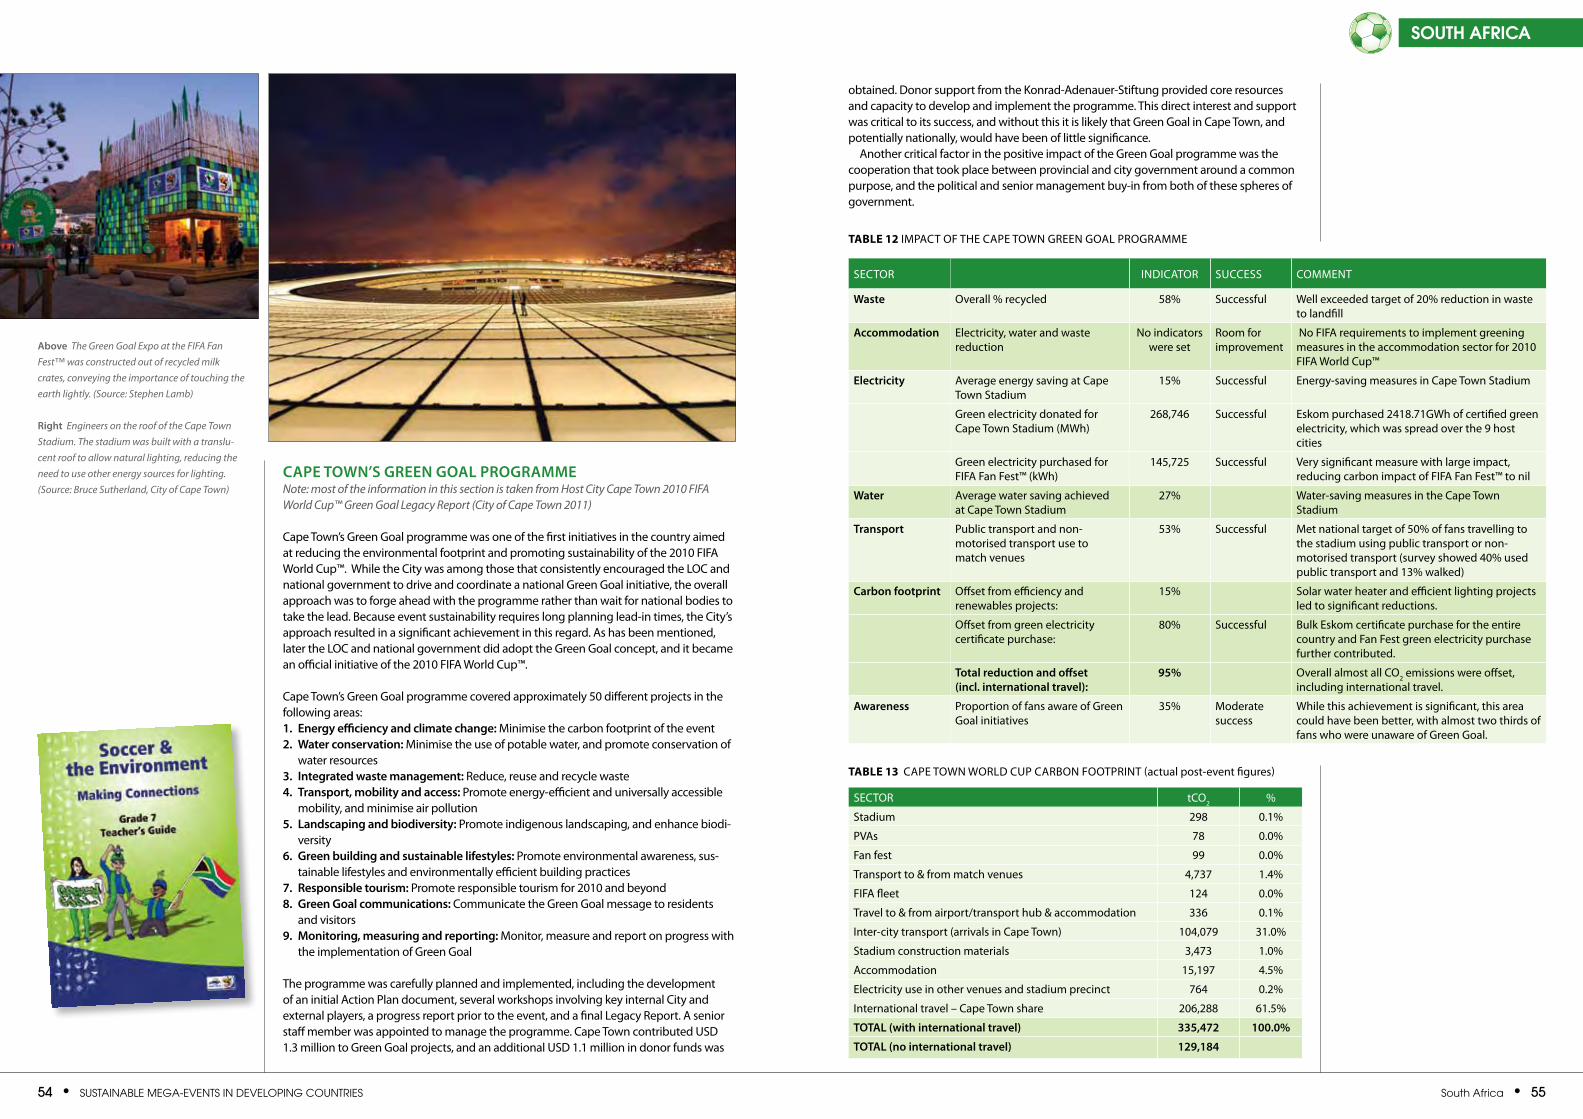
54 • SuStainable Mega-eventS in Developing CountrieS South africa • 55
south africa
cape town’S gReen goal pRogRammeNote: most of the information in this section is taken from Host City Cape Town 2010 FIFA World Cup™ Green Goal Legacy Report (City of Cape Town 2011)
Cape Town’s Green Goal programme was one of the first initiatives in the country aimed at reducing the environmental footprint and promoting sustainability of the 2010 FIFA World Cup™. While the City was among those that consistently encouraged the lOC and national government to drive and coordinate a national Green Goal initiative, the overall approach was to forge ahead with the programme rather than wait for national bodies to take the lead. Because event sustainability requires long planning lead-in times, the City’s approach resulted in a significant achievement in this regard. As has been mentioned, later the lOC and national government did adopt the Green Goal concept, and it became an official initiative of the 2010 FIFA World Cup™.
Cape Town’s Green Goal programme covered approximately 50 different projects in the following areas: 1. energy efficiency and climate change: Minimise the carbon footprint of the event2. water conservation: Minimise the use of potable water, and promote conservation of
water resources3. integrated waste management: Reduce, reuse and recycle waste4. transport, mobility and access: Promote energy-efficient and universally accessible
mobility, and minimise air pollution5. landscaping and biodiversity: Promote indigenous landscaping, and enhance biodi-
versity6. green building and sustainable lifestyles: Promote environmental awareness, sus-
tainable lifestyles and environmentally efficient building practices7. Responsible tourism: Promote responsible tourism for 2010 and beyond8. green goal communications: Communicate the Green Goal message to residents
and visitors9. monitoring, measuring and reporting: Monitor, measure and report on progress with
the implementation of Green Goal
The programme was carefully planned and implemented, including the development of an initial Action Plan document, several workshops involving key internal City and external players, a progress report prior to the event, and a final legacy Report. A senior staff member was appointed to manage the programme. Cape Town contributed USD 1.3 million to Green Goal projects, and an additional USD 1.1 million in donor funds was
above The Green Goal Expo at the FIFA Fan Fest™ was constructed out of recycled milk crates, conveying the importance of touching the earth lightly. (Source: Stephen Lamb)
Right Engineers on the roof of the Cape Town Stadium. The stadium was built with a translu-cent roof to allow natural lighting, reducing the need to use other energy sources for lighting. (Source: Bruce Sutherland, City of Cape Town)
SeCTOR INDICATOR SUCCeSS COMMeNT
waste Overall % recycled 58% Successful Well exceeded target of 20% reduction in waste to landfill
accommodation electricity, water and waste reduction
No indicators were set
Room for improvement
No FIFA requirements to implement greening measures in the accommodation sector for 2010 FIFA World Cup™
electricity Average energy saving at Cape Town Stadium
15% Successful energy-saving measures in Cape Town Stadium
Green electricity donated for Cape Town Stadium (MWh)
268,746 Successful eskom purchased 2418.71GWh of certified green electricity, which was spread over the 9 host cities
Green electricity purchased for FIFA Fan Fest™ (kWh)
145,725 Successful very significant measure with large impact, reducing carbon impact of FIFA Fan Fest™ to nil
water Average water saving achieved at Cape Town Stadium
27% Water-saving measures in the Cape Town Stadium
transport Public transport and non- motorised transport use to match venues
53% Successful Met national target of 50% of fans travelling to the stadium using public transport or non-motorised transport (survey showed 40% used public transport and 13% walked)
carbon footprint Offset from efficiency and renewables projects:
15% Solar water heater and efficient lighting projects led to significant reductions.
Offset from green electricity certificate purchase:
80% Successful Bulk eskom certificate purchase for the entire country and Fan Fest green electricity purchase further contributed.
total reduction and offset (incl. international travel):
95% Overall almost all CO2 emissions were offset, including international travel.
awareness Proportion of fans aware of Green Goal initiatives
35% Moderate success
While this achievement is significant, this area could have been better, with almost two thirds of fans who were unaware of Green Goal.
Table 12 IMPACT OF THe CAPe TOWN GReeN GOAl PROGRAMMe
SeCTOR tCO2 %
Stadium 298 0.1%
PvAs 78 0.0%
Fan fest 99 0.0%
Transport to & from match venues 4,737 1.4%
FIFA fleet 124 0.0%
Travel to & from airport/transport hub & accommodation 336 0.1%
Inter-city transport (arrivals in Cape Town) 104,079 31.0%
Stadium construction materials 3,473 1.0%
Accommodation 15,197 4.5%
electricity use in other venues and stadium precinct 764 0.2%
International travel – Cape Town share 206,288 61.5%
total (with international travel) 335,472 100.0%
total (no international travel) 129,184
Table 13 CAPe TOWN WORlD CUP CARBON FOOTPRINT (actual post-event figures)
obtained. Donor support from the konrad-Adenauer-Stiftung provided core resources and capacity to develop and implement the programme. This direct interest and support was critical to its success, and without this it is likely that Green Goal in Cape Town, and potentially nationally, would have been of little significance.
Another critical factor in the positive impact of the Green Goal programme was the cooperation that took place between provincial and city government around a common purpose, and the political and senior management buy-in from both of these spheres of government.
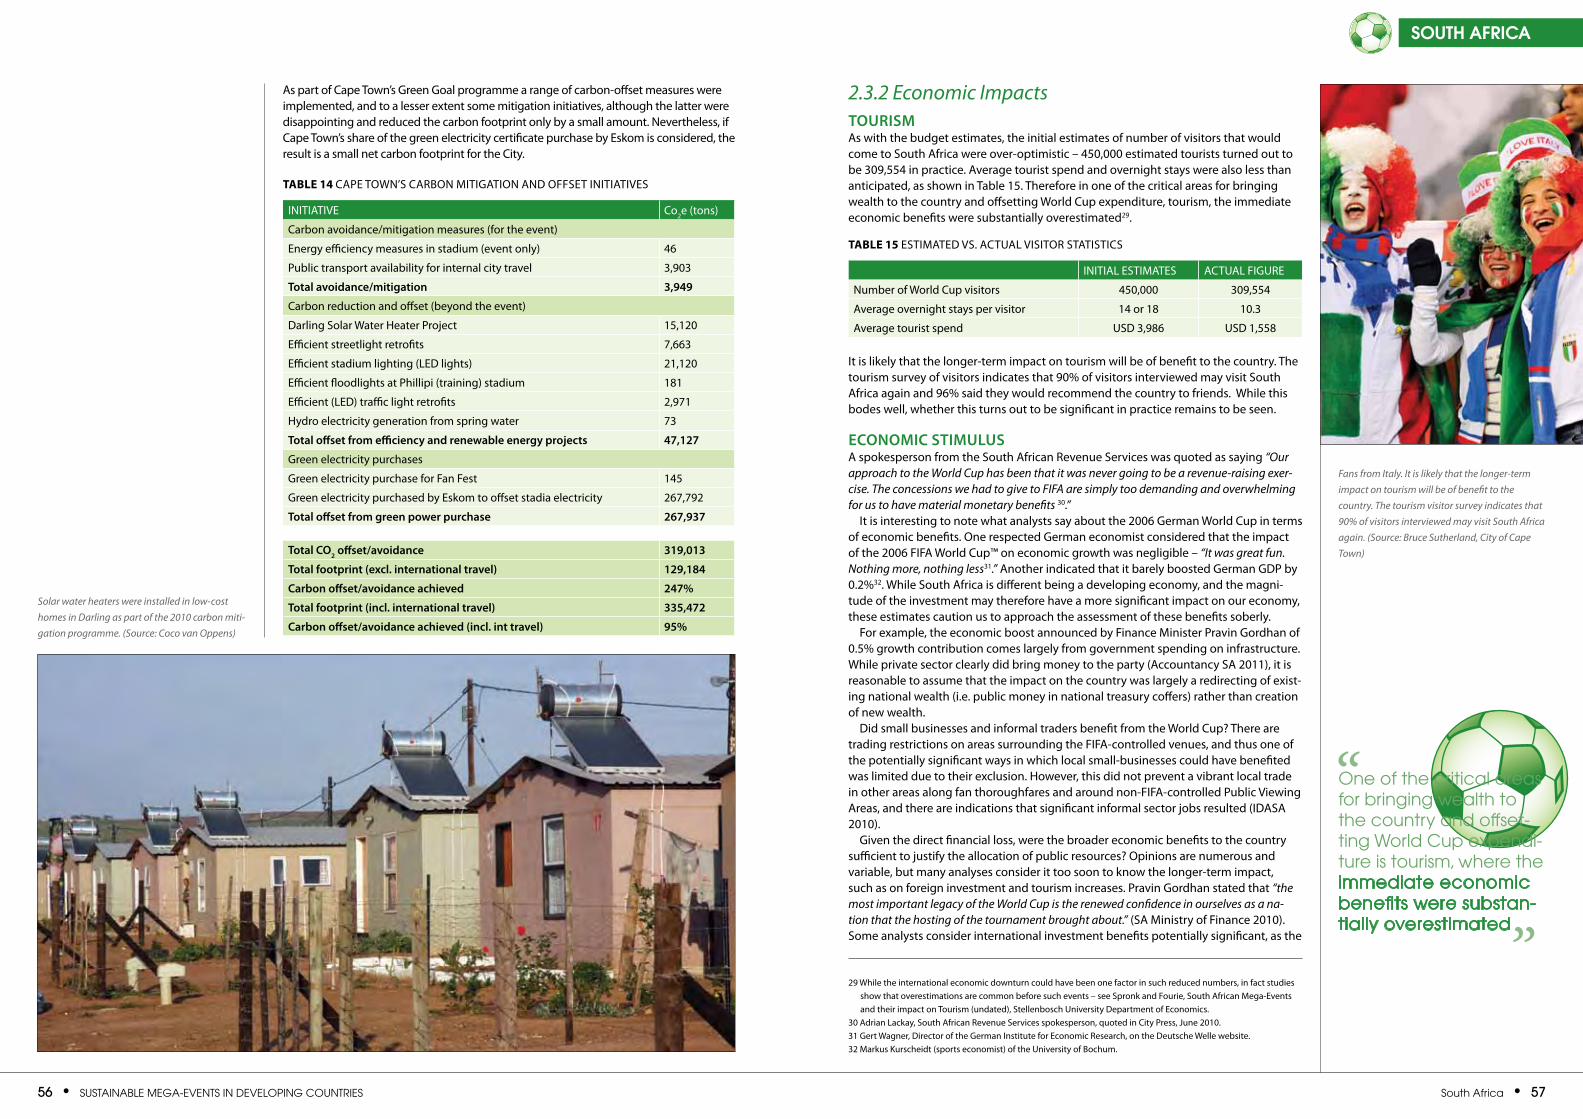
56 • SuStainable Mega-eventS in Developing CountrieS South africa • 57
south africa
As part of Cape Town’s Green Goal programme a range of carbon-offset measures were implemented, and to a lesser extent some mitigation initiatives, although the latter were disappointing and reduced the carbon footprint only by a small amount. Nevertheless, if Cape Town’s share of the green electricity certificate purchase by eskom is considered, the result is a small net carbon footprint for the City.
2.3.2 Economic Impacts
touRiSmAs with the budget estimates, the initial estimates of number of visitors that would come to South Africa were over-optimistic – 450,000 estimated tourists turned out to be 309,554 in practice. Average tourist spend and overnight stays were also less than anticipated, as shown in Table 15. Therefore in one of the critical areas for bringing wealth to the country and offsetting World Cup expenditure, tourism, the immediate economic benefits were substantially overestimated29.
It is likely that the longer-term impact on tourism will be of benefit to the country. The tourism survey of visitors indicates that 90% of visitors interviewed may visit South Africa again and 96% said they would recommend the country to friends. While this bodes well, whether this turns out to be significant in practice remains to be seen.
economic StimuluSA spokesperson from the South African Revenue Services was quoted as saying “Our approach to the World Cup has been that it was never going to be a revenue-raising exer-cise. The concessions we had to give to FIFA are simply too demanding and overwhelming for us to have material monetary benefits 30.”
It is interesting to note what analysts say about the 2006 German World Cup in terms of economic benefits. One respected German economist considered that the impact of the 2006 FIFA World Cup™ on economic growth was negligible – “It was great fun. Nothing more, nothing less31.” Another indicated that it barely boosted German GDP by 0.2%32. While South Africa is different being a developing economy, and the magni-tude of the investment may therefore have a more significant impact on our economy, these estimates caution us to approach the assessment of these benefits soberly.
For example, the economic boost announced by Finance Minister Pravin Gordhan of 0.5% growth contribution comes largely from government spending on infrastructure. While private sector clearly did bring money to the party (Accountancy SA 2011), it is reasonable to assume that the impact on the country was largely a redirecting of exist-ing national wealth (i.e. public money in national treasury coffers) rather than creation of new wealth.
Did small businesses and informal traders benefit from the World Cup? There are trading restrictions on areas surrounding the FIFA-controlled venues, and thus one of the potentially significant ways in which local small-businesses could have benefited was limited due to their exclusion. However, this did not prevent a vibrant local trade in other areas along fan thoroughfares and around non-FIFA-controlled Public viewing Areas, and there are indications that significant informal sector jobs resulted (IDASA 2010).
Given the direct financial loss, were the broader economic benefits to the country sufficient to justify the allocation of public resources? Opinions are numerous and variable, but many analyses consider it too soon to know the longer-term impact, such as on foreign investment and tourism increases. Pravin Gordhan stated that “the most important legacy of the World Cup is the renewed confidence in ourselves as a na-tion that the hosting of the tournament brought about.” (SA Ministry of Finance 2010). Some analysts consider international investment benefits potentially significant, as the
Solar water heaters were installed in low-cost homes in Darling as part of the 2010 carbon miti-gation programme. (Source: Coco van Oppens)
Fans from Italy. It is likely that the longer-term impact on tourism will be of benefit to the country. The tourism visitor survey indicates that 90% of visitors interviewed may visit South Africa again. (Source: Bruce Sutherland, City of Cape Town)
INITIATIve Co2e (tons)
Carbon avoidance/mitigation measures (for the event)
energy efficiency measures in stadium (event only) 46
Public transport availability for internal city travel 3,903
total avoidance/mitigation 3,949
Carbon reduction and offset (beyond the event)
Darling Solar Water Heater Project 15,120
efficient streetlight retrofits 7,663
efficient stadium lighting (leD lights) 21,120
efficient floodlights at Phillipi (training) stadium 181
efficient (leD) traffic light retrofits 2,971
Hydro electricity generation from spring water 73
total offset from efficiency and renewable energy projects 47,127
Green electricity purchases
Green electricity purchase for Fan Fest 145
Green electricity purchased by eskom to offset stadia electricity 267,792
total offset from green power purchase 267,937
total co2 offset/avoidance 319,013
total footprint (excl. international travel) 129,184
carbon offset/avoidance achieved 247%
total footprint (incl. international travel) 335,472
carbon offset/avoidance achieved (incl. int travel) 95%
Table 14 CAPe TOWN’S CARBON MITIGATION AND OFFSeT INITIATIveS
INITIAl eSTIMATeS ACTUAl FIGURe
Number of World Cup visitors 450,000 309,554
Average overnight stays per visitor 14 or 18 10.3
Average tourist spend USD 3,986 USD 1,558
Table 15 eSTIMATeD vS. ACTUAl vISITOR STATISTICS
29 While the international economic downturn could have been one factor in such reduced numbers, in fact studies show that overestimations are common before such events – see Spronk and Fourie, South African Mega-events and their impact on Tourism (undated), Stellenbosch University Department of economics.
30 Adrian lackay, South African Revenue Services spokesperson, quoted in City Press, june 2010.31 Gert Wagner, Director of the German Institute for economic Research, on the Deutsche Welle website.32 Markus kurscheidt (sports economist) of the University of Bochum.
one of the critical areas for bringing wealth to the country and offset-ting World Cup expendi-ture is tourism, where the immediate economic benefits were substan-tially overestimated
”
“
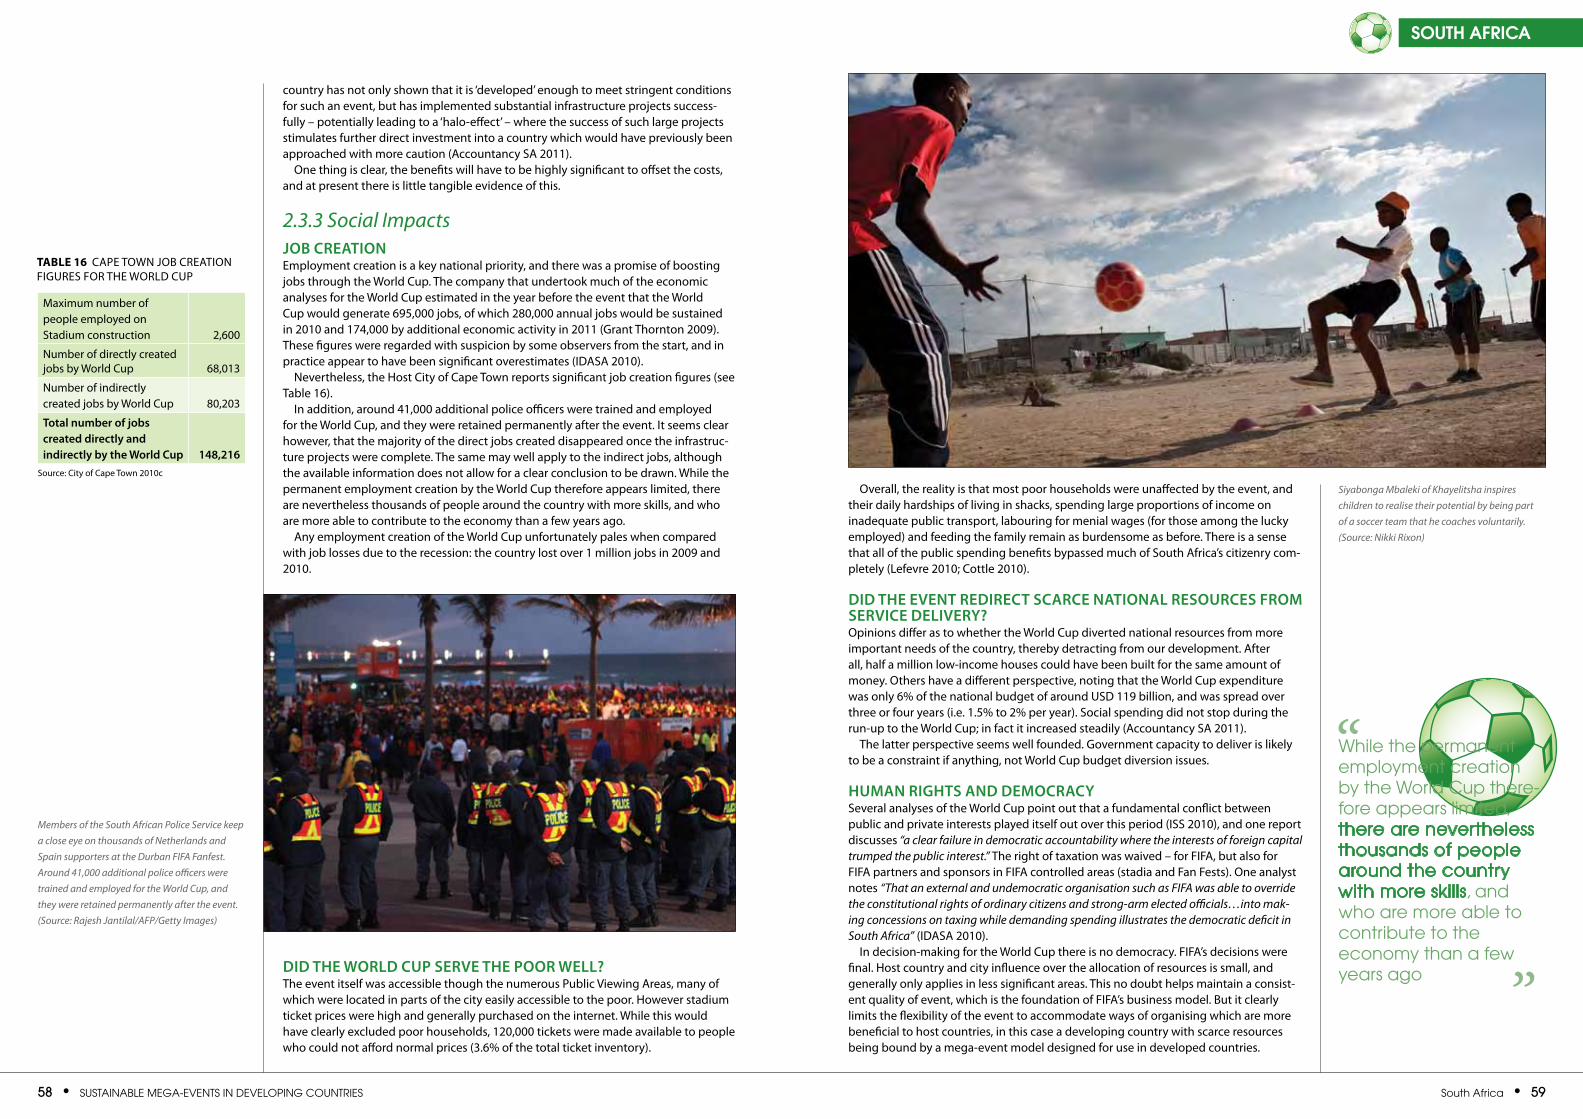
58 • SuStainable Mega-eventS in Developing CountrieS South africa • 59
south africa
country has not only shown that it is ‘developed’ enough to meet stringent conditions for such an event, but has implemented substantial infrastructure projects success-fully – potentially leading to a ‘halo-effect’ – where the success of such large projects stimulates further direct investment into a country which would have previously been approached with more caution (Accountancy SA 2011).
One thing is clear, the benefits will have to be highly significant to offset the costs, and at present there is little tangible evidence of this.
2.3.3 Social ImpactsJob cReationemployment creation is a key national priority, and there was a promise of boosting jobs through the World Cup. The company that undertook much of the economic analyses for the World Cup estimated in the year before the event that the World Cup would generate 695,000 jobs, of which 280,000 annual jobs would be sustained in 2010 and 174,000 by additional economic activity in 2011 (Grant Thornton 2009). These figures were regarded with suspicion by some observers from the start, and in practice appear to have been significant overestimates (IDASA 2010).
Nevertheless, the Host City of Cape Town reports significant job creation figures (see Table 16).
In addition, around 41,000 additional police officers were trained and employed for the World Cup, and they were retained permanently after the event. It seems clear however, that the majority of the direct jobs created disappeared once the infrastruc-ture projects were complete. The same may well apply to the indirect jobs, although the available information does not allow for a clear conclusion to be drawn. While the permanent employment creation by the World Cup therefore appears limited, there are nevertheless thousands of people around the country with more skills, and who are more able to contribute to the economy than a few years ago.
Any employment creation of the World Cup unfortunately pales when compared with job losses due to the recession: the country lost over 1 million jobs in 2009 and 2010.
did the woRld cup SeRve the pooR well?The event itself was accessible though the numerous Public viewing Areas, many of which were located in parts of the city easily accessible to the poor. However stadium ticket prices were high and generally purchased on the internet. While this would have clearly excluded poor households, 120,000 tickets were made available to people who could not afford normal prices (3.6% of the total ticket inventory).
Overall, the reality is that most poor households were unaffected by the event, and their daily hardships of living in shacks, spending large proportions of income on inadequate public transport, labouring for menial wages (for those among the lucky employed) and feeding the family remain as burdensome as before. There is a sense that all of the public spending benefits bypassed much of South Africa’s citizenry com-pletely (lefevre 2010; Cottle 2010).
did the event RediRect ScaRce national ReSouRceS fRom SeRvice deliveRy?Opinions differ as to whether the World Cup diverted national resources from more important needs of the country, thereby detracting from our development. After all, half a million low-income houses could have been built for the same amount of money. Others have a different perspective, noting that the World Cup expenditure was only 6% of the national budget of around USD 119 billion, and was spread over three or four years (i.e. 1.5% to 2% per year). Social spending did not stop during the run-up to the World Cup; in fact it increased steadily (Accountancy SA 2011).
The latter perspective seems well founded. Government capacity to deliver is likely to be a constraint if anything, not World Cup budget diversion issues.
human RightS and democRacySeveral analyses of the World Cup point out that a fundamental conflict between public and private interests played itself out over this period (ISS 2010), and one report discusses “a clear failure in democratic accountability where the interests of foreign capital trumped the public interest.” The right of taxation was waived – for FIFA, but also for FIFA partners and sponsors in FIFA controlled areas (stadia and Fan Fests). One analyst notes “That an external and undemocratic organisation such as FIFA was able to override the constitutional rights of ordinary citizens and strong-arm elected officials…into mak-ing concessions on taxing while demanding spending illustrates the democratic deficit in South Africa” (IDASA 2010).
In decision-making for the World Cup there is no democracy. FIFA’s decisions were final. Host country and city influence over the allocation of resources is small, and generally only applies in less significant areas. This no doubt helps maintain a consist-ent quality of event, which is the foundation of FIFA’s business model. But it clearly limits the flexibility of the event to accommodate ways of organising which are more beneficial to host countries, in this case a developing country with scarce resources being bound by a mega-event model designed for use in developed countries.
Siyabonga Mbaleki of Khayelitsha inspires children to realise their potential by being part of a soccer team that he coaches voluntarily. (Source: Nikki Rixon)
Maximum number of people employed on Stadium construction 2,600
Number of directly created jobs by World Cup 68,013
Number of indirectly created jobs by World Cup 80,203
total number of jobs created directly and indirectly by the world cup 148,216
Source: City of Cape Town 2010c
Table 16 CAPe TOWN jOB CReATION FIGUReS FOR THe WORlD CUP
Members of the South African Police Service keep a close eye on thousands of Netherlands and Spain supporters at the Durban FIFA Fanfest. Around 41,000 additional police officers were trained and employed for the World Cup, and they were retained permanently after the event. (Source: Rajesh Jantilal/AFP/Getty Images)
While the permanent employment creation by the World Cup there-fore appears limited, there are nevertheless thousands of people around the country with more skills, and who are more able to contribute to the economy than a few years ago ”
“
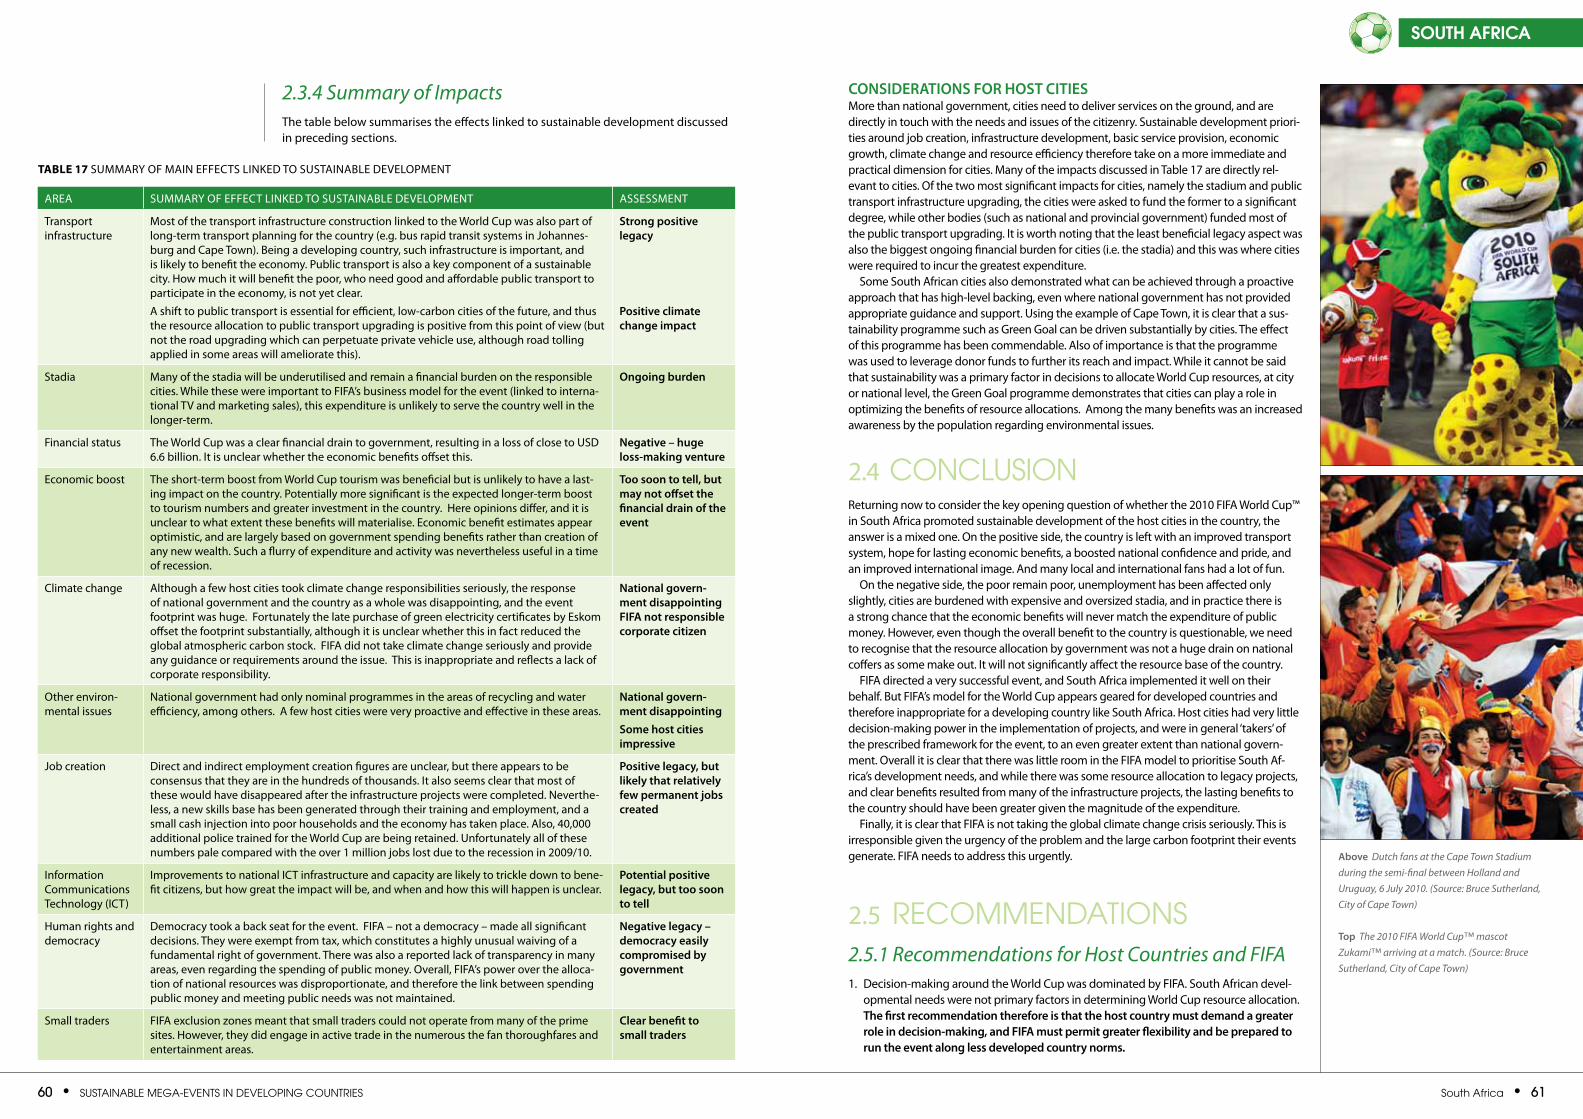
60 • SuStainable Mega-eventS in Developing CountrieS South africa • 61
south africa
conSideRationS foR hoSt citieSMore than national government, cities need to deliver services on the ground, and are directly in touch with the needs and issues of the citizenry. Sustainable development priori-ties around job creation, infrastructure development, basic service provision, economic growth, climate change and resource efficiency therefore take on a more immediate and practical dimension for cities. Many of the impacts discussed in Table 17 are directly rel-evant to cities. Of the two most significant impacts for cities, namely the stadium and public transport infrastructure upgrading, the cities were asked to fund the former to a significant degree, while other bodies (such as national and provincial government) funded most of the public transport upgrading. It is worth noting that the least beneficial legacy aspect was also the biggest ongoing financial burden for cities (i.e. the stadia) and this was where cities were required to incur the greatest expenditure.
Some South African cities also demonstrated what can be achieved through a proactive approach that has high-level backing, even where national government has not provided appropriate guidance and support. Using the example of Cape Town, it is clear that a sus-tainability programme such as Green Goal can be driven substantially by cities. The effect of this programme has been commendable. Also of importance is that the programme was used to leverage donor funds to further its reach and impact. While it cannot be said that sustainability was a primary factor in decisions to allocate World Cup resources, at city or national level, the Green Goal programme demonstrates that cities can play a role in optimizing the benefits of resource allocations. Among the many benefits was an increased awareness by the population regarding environmental issues.
2.4 ConCluSionReturning now to consider the key opening question of whether the 2010 FIFA World Cup™ in South Africa promoted sustainable development of the host cities in the country, the answer is a mixed one. On the positive side, the country is left with an improved transport system, hope for lasting economic benefits, a boosted national confidence and pride, and an improved international image. And many local and international fans had a lot of fun.
On the negative side, the poor remain poor, unemployment has been affected only slightly, cities are burdened with expensive and oversized stadia, and in practice there is a strong chance that the economic benefits will never match the expenditure of public money. However, even though the overall benefit to the country is questionable, we need to recognise that the resource allocation by government was not a huge drain on national coffers as some make out. It will not significantly affect the resource base of the country.
FIFA directed a very successful event, and South Africa implemented it well on their behalf. But FIFA’s model for the World Cup appears geared for developed countries and therefore inappropriate for a developing country like South Africa. Host cities had very little decision-making power in the implementation of projects, and were in general ‘takers’ of the prescribed framework for the event, to an even greater extent than national govern-ment. Overall it is clear that there was little room in the FIFA model to prioritise South Af-rica’s development needs, and while there was some resource allocation to legacy projects, and clear benefits resulted from many of the infrastructure projects, the lasting benefits to the country should have been greater given the magnitude of the expenditure.
Finally, it is clear that FIFA is not taking the global climate change crisis seriously. This is irresponsible given the urgency of the problem and the large carbon footprint their events generate. FIFA needs to address this urgently.
2.5 reCoMMenDationS 2.5.1 Recommendations for Host Countries and FIFA 1. Decision-making around the World Cup was dominated by FIFA. South African devel-
opmental needs were not primary factors in determining World Cup resource allocation. the first recommendation therefore is that the host country must demand a greater role in decision-making, and fifa must permit greater flexibility and be prepared to run the event along less developed country norms.
above Dutch fans at the Cape Town Stadium during the semi-final between Holland and Uruguay, 6 July 2010. (Source: Bruce Sutherland, City of Cape Town)
top The 2010 FIFA World Cup™ mascot Zukami™ arriving at a match. (Source: Bruce Sutherland, City of Cape Town)
AReA SUMMARy OF eFFeCT lINkeD TO SUSTAINABle DevelOPMeNT ASSeSSMeNT
Transport infrastructure
Most of the transport infrastructure construction linked to the World Cup was also part of long-term transport planning for the country (e.g. bus rapid transit systems in johannes-burg and Cape Town). Being a developing country, such infrastructure is important, and is likely to benefit the economy. Public transport is also a key component of a sustainable city. How much it will benefit the poor, who need good and affordable public transport to participate in the economy, is not yet clear.
A shift to public transport is essential for efficient, low-carbon cities of the future, and thus the resource allocation to public transport upgrading is positive from this point of view (but not the road upgrading which can perpetuate private vehicle use, although road tolling applied in some areas will ameliorate this).
Strong positive legacy
positive climate change impact
Stadia Many of the stadia will be underutilised and remain a financial burden on the responsible cities. While these were important to FIFA’s business model for the event (linked to interna-tional Tv and marketing sales), this expenditure is unlikely to serve the country well in the longer-term.
ongoing burden
Financial status The World Cup was a clear financial drain to government, resulting in a loss of close to USD 6.6 billion. It is unclear whether the economic benefits offset this.
negative – huge loss-making venture
economic boost The short-term boost from World Cup tourism was beneficial but is unlikely to have a last-ing impact on the country. Potentially more significant is the expected longer-term boost to tourism numbers and greater investment in the country. Here opinions differ, and it is unclear to what extent these benefits will materialise. economic benefit estimates appear optimistic, and are largely based on government spending benefits rather than creation of any new wealth. Such a flurry of expenditure and activity was nevertheless useful in a time of recession.
too soon to tell, but may not offset the financial drain of the event
Climate change Although a few host cities took climate change responsibilities seriously, the response of national government and the country as a whole was disappointing, and the event footprint was huge. Fortunately the late purchase of green electricity certificates by eskom offset the footprint substantially, although it is unclear whether this in fact reduced the global atmospheric carbon stock. FIFA did not take climate change seriously and provide any guidance or requirements around the issue. This is inappropriate and reflects a lack of corporate responsibility.
national govern-ment disappointing fifa not responsible corporate citizen
Other environ-mental issues
National government had only nominal programmes in the areas of recycling and water efficiency, among others. A few host cities were very proactive and effective in these areas.
national govern-ment disappointingSome host cities impressive
job creation Direct and indirect employment creation figures are unclear, but there appears to be consensus that they are in the hundreds of thousands. It also seems clear that most of these would have disappeared after the infrastructure projects were completed. Neverthe-less, a new skills base has been generated through their training and employment, and a small cash injection into poor households and the economy has taken place. Also, 40,000 additional police trained for the World Cup are being retained. Unfortunately all of these numbers pale compared with the over 1 million jobs lost due to the recession in 2009/10.
positive legacy, but likely that relatively few permanent jobs created
Information Communications Technology (ICT)
Improvements to national ICT infrastructure and capacity are likely to trickle down to bene-fit citizens, but how great the impact will be, and when and how this will happen is unclear.
potential positive legacy, but too soon to tell
Human rights and democracy
Democracy took a back seat for the event. FIFA – not a democracy – made all significant decisions. They were exempt from tax, which constitutes a highly unusual waiving of a fundamental right of government. There was also a reported lack of transparency in many areas, even regarding the spending of public money. Overall, FIFA’s power over the alloca-tion of national resources was disproportionate, and therefore the link between spending public money and meeting public needs was not maintained.
negative legacy – democracy easily compromised by government
Small traders FIFA exclusion zones meant that small traders could not operate from many of the prime sites. However, they did engage in active trade in the numerous the fan thoroughfares and entertainment areas.
clear benefit to small traders
Table 17 SUMMARy OF MAIN eFFeCTS lINkeD TO SUSTAINABle DevelOPMeNT
2.3.4 Summary of ImpactsThe table below summarises the effects linked to sustainable development discussed in preceding sections.
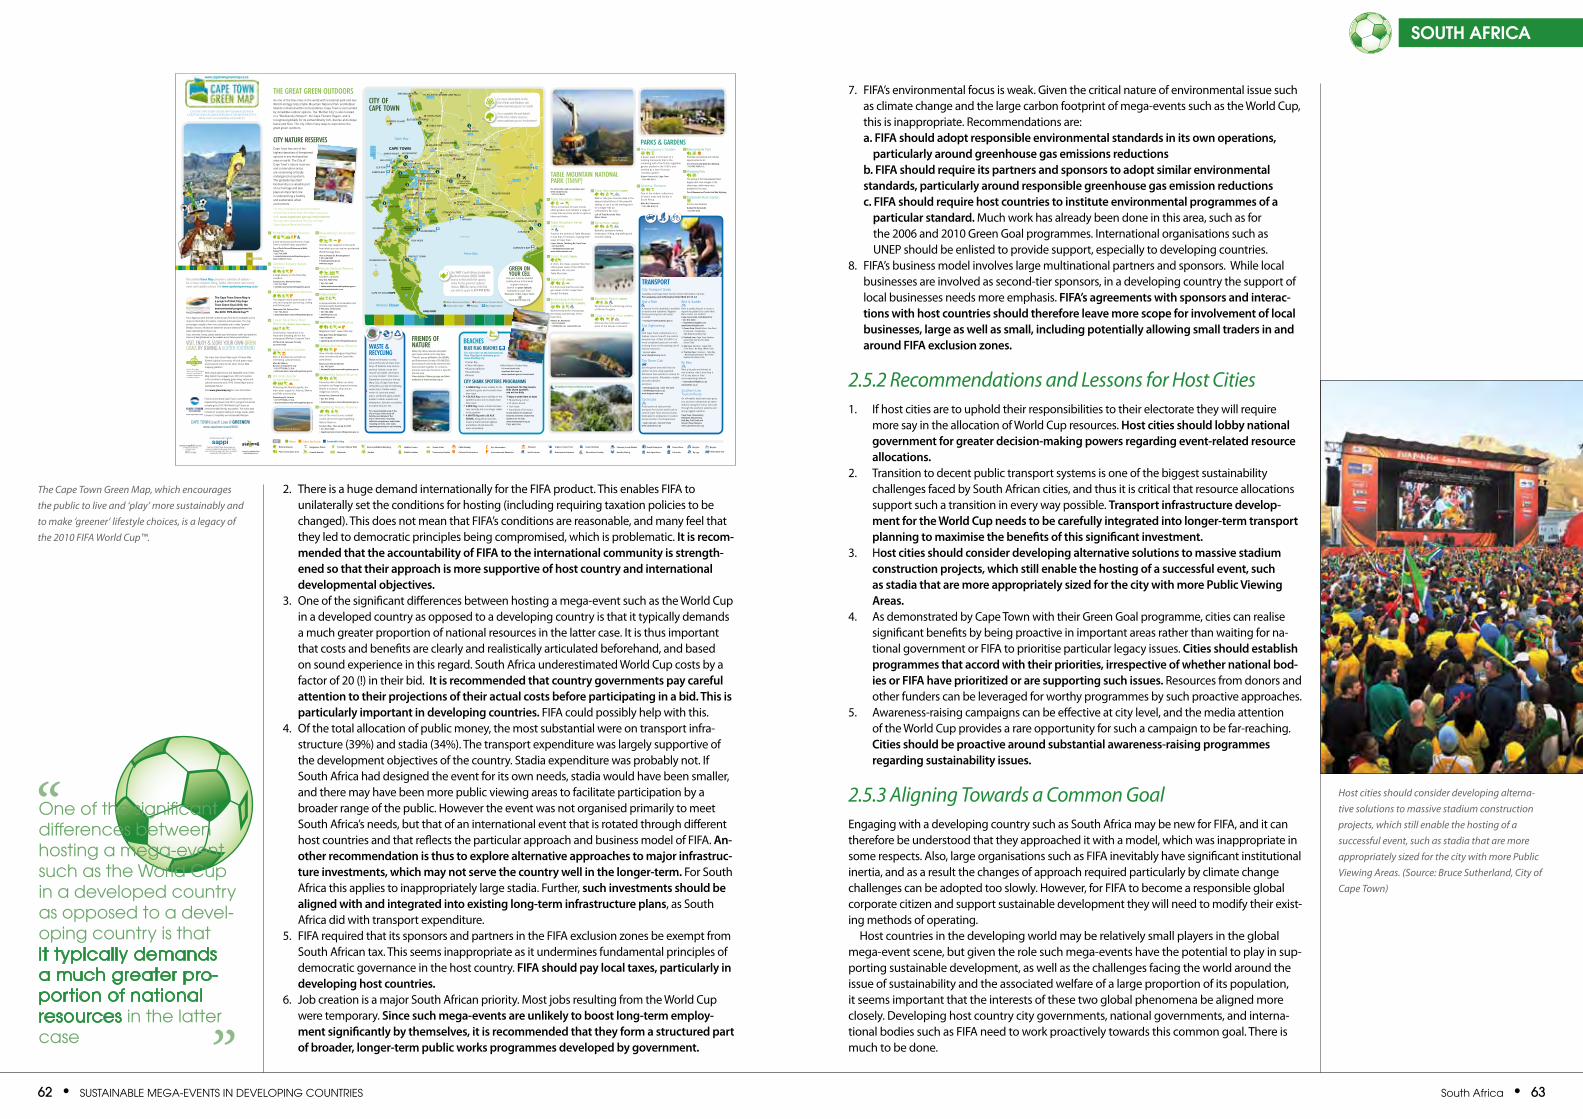
62 • SuStainable Mega-eventS in Developing CountrieS South africa • 63
south africa
2. There is a huge demand internationally for the FIFA product. This enables FIFA to unilaterally set the conditions for hosting (including requiring taxation policies to be changed). This does not mean that FIFA’s conditions are reasonable, and many feel that they led to democratic principles being compromised, which is problematic. it is recom-mended that the accountability of fifa to the international community is strength-ened so that their approach is more supportive of host country and international developmental objectives.
3. One of the significant differences between hosting a mega-event such as the World Cup in a developed country as opposed to a developing country is that it typically demands a much greater proportion of national resources in the latter case. It is thus important that costs and benefits are clearly and realistically articulated beforehand, and based on sound experience in this regard. South Africa underestimated World Cup costs by a factor of 20 (!) in their bid. it is recommended that country governments pay careful attention to their projections of their actual costs before participating in a bid. this is particularly important in developing countries. FIFA could possibly help with this.
4. Of the total allocation of public money, the most substantial were on transport infra-structure (39%) and stadia (34%). The transport expenditure was largely supportive of the development objectives of the country. Stadia expenditure was probably not. If South Africa had designed the event for its own needs, stadia would have been smaller, and there may have been more public viewing areas to facilitate participation by a broader range of the public. However the event was not organised primarily to meet South Africa’s needs, but that of an international event that is rotated through different host countries and that reflects the particular approach and business model of FIFA. an-other recommendation is thus to explore alternative approaches to major infrastruc-ture investments, which may not serve the country well in the longer-term. For South Africa this applies to inappropriately large stadia. Further, such investments should be aligned with and integrated into existing long-term infrastructure plans, as South Africa did with transport expenditure.
5. FIFA required that its sponsors and partners in the FIFA exclusion zones be exempt from South African tax. This seems inappropriate as it undermines fundamental principles of democratic governance in the host country. fifa should pay local taxes, particularly in developing host countries.
6. job creation is a major South African priority. Most jobs resulting from the World Cup were temporary. Since such mega-events are unlikely to boost long-term employ-ment significantly by themselves, it is recommended that they form a structured part of broader, longer-term public works programmes developed by government.
7. FIFA’s environmental focus is weak. Given the critical nature of environmental issue such as climate change and the large carbon footprint of mega-events such as the World Cup, this is inappropriate. Recommendations are: a. fifa should adopt responsible environmental standards in its own operations, particularly around greenhouse gas emissions reductions b. fifa should require its partners and sponsors to adopt similar environmental standards, particularly around responsible greenhouse gas emission reductions c. fifa should require host countries to institute environmental programmes of a particular standard. Much work has already been done in this area, such as for the 2006 and 2010 Green Goal programmes. International organisations such as UNeP should be enlisted to provide support, especially to developing countries.
8. FIFA’s business model involves large multinational partners and sponsors. While local businesses are involved as second-tier sponsors, in a developing country the support of local businesses needs more emphasis. fifa’s agreements with sponsors and interac-tions with host countries should therefore leave more scope for involvement of local businesses, large as well as small, including potentially allowing small traders in and around fifa exclusion zones.
2.5.2 Recommendations and Lessons for Host Cities1. If host cities are to uphold their responsibilities to their electorate they will require
more say in the allocation of World Cup resources. host cities should lobby national government for greater decision-making powers regarding event-related resource allocations.
2. Transition to decent public transport systems is one of the biggest sustainability challenges faced by South African cities, and thus it is critical that resource allocations support such a transition in every way possible. transport infrastructure develop-ment for the world cup needs to be carefully integrated into longer-term transport planning to maximise the benefits of this significant investment.
3. Host cities should consider developing alternative solutions to massive stadium construction projects, which still enable the hosting of a successful event, such as stadia that are more appropriately sized for the city with more public viewing areas.
4. As demonstrated by Cape Town with their Green Goal programme, cities can realise significant benefits by being proactive in important areas rather than waiting for na-tional government or FIFA to prioritise particular legacy issues. cities should establish programmes that accord with their priorities, irrespective of whether national bod-ies or fifa have prioritized or are supporting such issues. Resources from donors and other funders can be leveraged for worthy programmes by such proactive approaches.
5. Awareness-raising campaigns can be effective at city level, and the media attention of the World Cup provides a rare opportunity for such a campaign to be far-reaching. cities should be proactive around substantial awareness-raising programmes regarding sustainability issues.
2.5.3 Aligning Towards a Common Goalengaging with a developing country such as South Africa may be new for FIFA, and it can therefore be understood that they approached it with a model, which was inappropriate in some respects. Also, large organisations such as FIFA inevitably have significant institutional inertia, and as a result the changes of approach required particularly by climate change challenges can be adopted too slowly. However, for FIFA to become a responsible global corporate citizen and support sustainable development they will need to modify their exist-ing methods of operating.
Host countries in the developing world may be relatively small players in the global mega-event scene, but given the role such mega-events have the potential to play in sup-porting sustainable development, as well as the challenges facing the world around the issue of sustainability and the associated welfare of a large proportion of its population, it seems important that the interests of these two global phenomena be aligned more closely. Developing host country city governments, national governments, and interna-tional bodies such as FIFA need to work proactively towards this common goal. There is much to be done.
The Cape Town Green Map, which encourages the public to live and ‘play’ more sustainably and to make ‘greener’ lifestyle choices, is a legacy of the 2010 FIFA World Cup™.
Host cities should consider developing alterna-tive solutions to massive stadium construction projects, which still enable the hosting of a successful event, such as stadia that are more appropriately sized for the city with more Public Viewing Areas. (Source: Bruce Sutherland, City of Cape Town)
one of the significant differences between hosting a mega-event such as the World Cup in a developed country as opposed to a devel-oping country is that it typically demands a much greater pro-portion of national resources in the latter case ”
“
R310
M42
M42
M4
M6
M6
M65
M65
M65
M65 M65
M64
M4
M4
M4
M66
M63
M63
M63
M41
M38
M6
M6
M6
M17
M52
M57
M24M10
M9 M9
M22
M18
M18
M16M16
M7
M7
M16
M10
R102
R102
R310
M10
M32
M45
M49
M49
M49
M45
M54
M9
M9
M7
M7
R310
R310
R102
R102
R102
M5
M5
M8
R27
M14
M14
M14
M14
M14
M13
M19
R27
R27
R27
R304
R304
M58
R304
R302
R302
R304
R304
R304
R302
M48
M58
R302
R302
R304
R304
R312
M16
M25
M25
M11
M25
M23
M23
M15
M15
M23
R102
R101
R101
R304
M12
M12M12
M12
R102
R310
R44
R44
R44
R44
R44
R44
R44
R44
R310
R304
R310
R310R44
R45
NOORDHOEK
PAROW
TYGERVALLEY
STRAND
GORDON’S BAY
MACASSAR
DURBANVILLE
BRACKENFELL
GOODWOOD
EDGEMEAD
EERSTERIVIER
KUILSRIVIER
KHAYELITSHA
PHILIPPI
MITCHELLSPLAIN
MILNERTON
BLOUBERGSTRAND
MELKBOSSTRAND
TABLE VIEW
PARKLANDS
ROBBEN ISLAND
PINELANDS
SALT RIVER
GUGULETU
NYANGAKENILWORTH
CONSTANTIA
STRANDFONTEIN
PLUMSTEAD
WYNBERGLLANDUDNO
CLIFTON
SEA POINT
GREEN POINT
CAMPS BAY
TOKAI
FISH HOEK
SCARBOROUGH
CAPE TOWN INTERNATIONAL
AIRPORT
KOMMETJIE
CAPE POINT
ATLANTIS
MAMRE
SIMON’S TOWN
HOUT BAY
MUIZENBERG
WATERFRONT BELLVILLE
SOMERSET WEST
CLAREMONT
STELLENBOSCH
NEWLANDSM4
TO ATLANTIS, MAMRE AND PELLA
MNANDI
ZEEKOEIVLEI
ZANDVLEI
RONDEVLEI
CHAPMAN’S PEAK FALSE BAY ECOLOGY PARK
Table Bay
CAPE OF GOOD HOPE
CAPE TOWN
TABLE MOUNTAINNATIONAL PARK
(SILVERMINE)
TABLE MOUNTAINNATIONAL PARK
N2
N1
N7
N1 N1
N1
N1
N7
N7
N7
M3
M5RONDEBOSCH
M3WOODSTOCK
M3
M5
M5
N2
N2
N2
N2
N2
M3
False Bay
Atlantic Ocean
Seal Island
N
TABLE MOUNTAINNATIONAL PARK
WOLFGAT
OBSERVATORY
MACASSAR DUNES
DRIFTSANDS
BRACKEN
51 59 94
79 4724
32
18 80
05 06105
07
08 11 27
10
09 102
103
104
107
69
55
30 64
17
16
76
14 15
50 49
6091 77 61 62 92
3193
95
2625
63 5234
96 9719 99
10153 58
0103
0265 35 81
6685
36 10004
98
395440
106
38 83
37 8482
86
41
21
67
22
33
78
87 42 68
12
88
13
43-49
71-7589
2923
5756
CITY CENTRE
90
20
THE GREAT GREEN OUTDOORSAs one of the few cities in the world with a national park and two World Heritage Sites (Table Mountain National Park and Robben Island) contained within its boundaries, Cape Town is surrounded by incredible outdoor options. The ‘Mother City’ is also located in a “Biodiversity Hotspot”, the Cape Floristic Region, and is recognised globally for its extraordinarily rich, diverse and unique fauna and flora. The city offers many ways to experience the great green outdoors.
This printed Green Map presents a selection of options – for a more complete listing, further information and current news and updates please visit www.capetowngreenmap.co.za
Cape Town Live it! Love it! GREENER!www.capetown.travel/2010
Find out more about Cape Town’s commitment to implementing Green Goal 2010, a programme aimed at making the 2010 FIFA World Cup™ event as environmentally friendly as possible. The action plan includes 41 projects relating to energy, waste, water, transport, hospitality and sustainable lifestyles. www.capetown.travel
publishers of special interest maps
It is a legacy project that will continue post 2010 as an invaluable source of green information for visitors, residents and businesses. The map encourages people to live more sustainably and to make “greener” lifestyle choices. All sites are listed free and are selected from www.capetowngreenmap.co.za. If you meet the criteria, please submit your information online and stand the chance of being featured on the website and in future print editions.
Visit, enjoy & score your own Green Goals by leaVinG a liGhter footprint
The Cape Town Green Map is a project of Host City Cape Town Green Goal 2010, the environmental programme for the 2010 FIFA World Cup™.
The Cape Town Green Map is part of Green Map System’s global community of local green maps and powered online by the Open Green Map mapping platform.
With unique global icons and adaptable tools, Green Map System has engaged over 600 communities in 55 countries in mapping green living, nature and cultural resources since 1995. Green Maps chart a sustainable future!
Visit www.greenmap.org for more information.
Icons © Green Map System, Inc. 2009. All rights reserved. Green Map® is a registered trademark and used with permission.
Sponsor of SAPPI Triple Green paper, an environmentally-friendly paper stock made
from chlorine-free sugar cane fibre, to support sustainable afforestation in SA.
Host City Green Goal Contributor
www.capetowngreenmap.co.za
Use the Cape town Green Map to Make Greener lifestyle ChoiCes anD experienCe the Mother City’s
wealth of sUstainable resoUrCes
2ND EDiTiON
CiTy Of CApE TOwN
For more information on the City’s Parks and Gardens visit www.capetown.gov.za/en/parks
For a complete list and details of the City’s nature reserves: www.capetown.gov.za/environment
CiTy NATURE RESERVES pARKS & GARDENS
Rondevlei Nature Reserve
A bird sanctuary and home to Cape Town’s resident hippo population. Cnr of Perth Rd and Fisherman’s Walk, Grassy ParkT 021 706 2404 E [email protected]
Zandvlei Estuary Nature Reserve
A large estuary on the False Bay coastline.Coniston Ave, Marina Da GamaT 021 701 7542 E [email protected]
Zeekoevlei Nature Reserve
The largest inland water body in the city and a popular picnicking, sailing and fishing spot.
Zeekoevlei Rd, Pelican ParkT 021 706 2404E [email protected]
Lower Silvermine River Wetlands (Public Open Space)
Small fynbos marshland is an important breeding site for the endangered Western Leopard Toad.Off Main Rd, between Clovelly and Fish Hoek
Mamre Nature Garden
Rich in biodiversity and with an interesting cultural history. Main Rd, Mamre. By prior arrangement onlyT 021 577 5000/2/3/4E [email protected]
Witzands Aquifer Conservation Area
Protecting the Atlantis aquifer, the main water supply for Atlantis, Mamre and Pella communities.Dassenberg Dr, AtlantisT 021 577 5000/2/3/4 E [email protected]
Blaauwberg Conservation Area
Visit the only viewpoint in the world from which you can see two proclaimed World Heritage Sites.Otto du Plessis Dr, BloubergstrandT 021 554 0957E [email protected] www.bca.org.za
Rietvlei Wetland Reserve
A birders’ paradise!Grey Ave, Table View
T 021 557 5509 E rietvlei.wetlandreserve@capetown.gov.zawww.friendsofrietvlei.co.za
Intaka Island
A unique example of conservation and private property development. 6 Park Lane, Century City
T 021 552 6889E [email protected]
Tygerberg Nature Reserve
Magnificent 360° views of the City.Main gate: Totius St, Welgemoed.T 021 913 5695 E [email protected]
Durbanville Nature Reserve
View critically endangered Swartland shale renosterveld and Cape Flats sand fynbos.
Racecourse Rd, DurbanvilleT 021 970 3097 E [email protected]
Helderberg Nature Reserve
Favourites with children are tame bontebok and large leopard tortoises. Boasts a museum, shop and an indigenous nursery.Verster Ave, Somerset West
T 021 851 6982
Kogelberg Nature Reserve
One of the most scenic coastal routes skirts the large Kogelberg Nature Reserve.Gordon’s Bay - 8km along the R44T 021 856 5605E [email protected]
Cape Town has one of the highest densities of threatened species in any metropolitan area on earth. The City of Cape Town’s nature reserves and conservation areas are conserving critically endangered ecosystems. This globally important biodiversity is a valuable part of our heritage and also plays an important role in underpinning a healthy and sustainable urban environment.
For the complete list and information on the City’s more than 30 nature reserves visit: www.capetown.gov.za/environmentYou can also download the City of Cape Town Nature Reserves booklet.
Table Mountain Aerial Cableway
For information and access times visit:www.sanparks.org T 021 701 8692
Table Mountain (TMNP)
This is a mountain of many moods offering hikers and climbers a range of routes that vary from strolls to rigorous hikes and climbs.
Table Mountain Aerial Cableway
Travel to the summit of Table Mountain in less than 10 minutes, enjoying 360° views of Cape Town.Lower Station, Tafelberg Rd, Cape TownT 021 424 8181E [email protected]
Lions Head (TMNP)
A short, but steep, popular hike that offers great views of the Atlantic seaboard, the city and Table Mountain.
Signal Hill (TMNP)
It is from here that the noon day gun marks 12:00 in Cape Town (except Sundays).
Kirstenbosch National Botanical Garden (SANBI)
World-renowned for showcasing the beauty and diversity of the Cape flora. Rhodes Dr, Newlands T 021 799 8783 E [email protected] www.sanbi.org
Tokai Arboretum (TMNP)
Walk or ride your mountain bike in the adjacent plantations of this peaceful setting, or use it as the starting point for a longer hike up to Elephant’s Eye cave.Left off Tokai Rd at the Tokai Manor House
Silvermine (TMNP)
Beautiful, sandstone fynbos landscapes. Hiking, dog walking and mountain biking.
Boulders Beach (TMNP)
World famous for its thriving colony of African Penguins.
Cape of Good Hope (TMNP)
Discover the most south-western point of the African continent!
CiTy SHARK SpOTTERS pROGRAMME
wASTE & RECyCLiNG
Kirstenbosch National Botanical Garden A GREEN flag means visibility for the spotters is good, and no sharks have been seen. A BLACK flag means visibility for the spotters is poor, but no sharks have been seen. A RED flag means a shark has been seen recently, but is no longer visible to the spotters. A WHITE flag with a BLACK SHARK, along with a loud siren, means a shark has been sighted, and bathers should leave the water immediately.
Important: No flag means that shark spotters are not on duty
7 days a week 8am to 6pmMuizenberg corner• St James beach• Fish Hoek• Noordhoek (The Hoek)•
Check website for additional beaches and times of year that spotters are on duty.www.sharkspotters.org.zaT 021 480 7700
fRiENDS Of NATUREMany City nature reserves and public open spaces listed on the map have “Friends” groups affiliated to the Wildlife and Environment Society of SA (WESSA) and consist of community members who have banded together to conserve, promote and raise funds for a specific natural area. View details of these groups and their websites at www.wessa.org.za
Maynardville Park
Provides recreational and cultural opportunities to all. Cnr of Church and Wolfe Sts, WynbergT 021 762 9180/1/2
Wynberg Park
The spring of the Krakeelwater River begins here. See vestiges of the silver trees, which were once prevalent in the area. Cnr of Klaasens and Trovato Link Rds, Wynberg
Durbanville Rose Garden
For the rose fanatics! Durban Rd, DurbanvilleT 021 970 3129
The Company’s Garden
A green jewel in the heart of a bustling metropolis that is the remaining half of the Dutch vegetable garden planted in the 1650’s and overlaid by a later Victorian ‘romantic garden’.Queen Victoria St, Cape Town T 021 400 2521
Arderne Gardens
One of the richest collections of exotic trees and shrubs in South Africa. Main Rd, ClaremontT 021 689 8102/3
23
24
25
26
27
Camps Bay Beach
BLUE fLAG BEACHES
•Camps Bay •Clifton 4th Beach•Muizenberg Beach•Strandfontein•Mnandi
• Bikini Beach (Gordan Bay) For more beach info, download this book at www.capetown.gov.za/environment
For more info on the International Blue Flag Beach Initiative go to www.blueflag.org
Company Gardens
Cape Point
Boulders Beach
TABLE MOUNTAiN NATiONAL pARK (TMNP)
14
GREEN ON yOUR CELL
Use your Internet-enabled mobile phone to find what
is green near you: Search on your suburb, followed by Cape Town.
Example: Tokai, Cape Town
@ www.greenmap.org
journey to sustainable livingwww.urbansprout.co.za
Bird and Wildlife Watching
Wildlife HabitatGarden
Indigenous Plants
FairtradeEco Agriculture
Social Enterprise
Re use
Museum
KEY
Park/ Recreation Area
Nature Reserve
WetlandsCoastal Habitat Ecotourism Resource
Organic/Local Food Green BuildingEco-tour/Nature Walk Wildlife Centre
Cultural Performance
Child-friendlyScenic Vista
Healthy DiningEco-Products
Eco Information
Environmental Education
Farmers/Local Market Recycle
Wheelchair Friendly
Green Store
Community Garden
Sustainable LivingNature Culture And Society
Alternative fuel
Bicycle
Nature Reserves & Parks Southern Line Tourism Route
Visitor info centre Railway Blue flag beaches
Use WWF's South African Sustainable Seafood Initiative (SASSI) FishMS service to find which fish species make for the greenest seafood choices. SMS the name of the fish you wish to query to 079 499 8795
BEACHES
www.mapsinfo.co.za
Waste minimisation is a key focus of the City of Cape Town. Drop-off facilities help citizens practice ‘reduce, reuse and recycle’ principles. All it takes is a new mindset - think twice. Separation at source is the key. Many City of Cape Town drop-off facilities accept the following waste items: Garden waste, motor oil, cans and metal, paper, cardboard, glass, plastic, builder’s rubble, e-waste and polystyrene. Specific recyclables accepted vary per site.
For a downloadable map of the City of Cape Town’s drop-off facilities and details of the City’s ‘Think Twice’ recycling collection programme, and private recycling services, visit: www.capetowngreenmap.co.za/recycling
TRANSpORTCity Transport GuideAvailable at all Cape Town Tourism Visitor Information Centres.For enquiries and information Dial 0800 65 64 63
Dial-a-Ride
A service for the disabled is available to visitors and residents. Register first by phoning the call center or emailE [email protected]
City Sightseeing
Visit Cape Town’s attractions on a topless, hop-on hop-off, low carbon emission bus. A fleet of EURO 2 or more-compliant buses are run with a strong focus on the sparing use of natural resources. T 021 511 6000 www.citysightseeing.co.za
The Green Cab
Join the green drive with this low carbon service using Liquefied Petroleum Gas vehicles to reduce its carbon footprint. Affordable, reliable and safe transfers and tours.T 0861thegreencab / 086 184 3473 E [email protected] www.thegreencab.co.za
Cyclecabs
Pedal-powered cabs provide transport for tourists and locals in central Cape Town and surrounds. Dedicated to employment creation and promotion of entrepreneurs.
T 0861 745 547 / 072 907 7333 www.cyclecabs.co.za
Bike & Saddle
Rent a quality bicycle or book a signature guided city cycle rides. Burn carbs, not carbon! Cape Grace Hotel, V&A Waterfront T 021 813 6433 E [email protected] www.bikeandsaddle.com 1. Ocean View: Mouille Point - Sea Point
Promenade - Camps Bay - V&A Waterfront (Blue Trai)
2. Football view: Cape Town Stadium, Urban Park and The Fan Walk. (Green Trail)
3. Sky View: Kloofnek - Signal Hill - Lions Head - Bo-Kaap. (White Trail)
4. The Bay View: Foreshore - Table Bay - Bloubergstrand Beach -Blue Peter Restaurant (Yellow Trail)
By Bike
Rent a bicycle and helmet at one location, ride it and drop it off at any base in their ever-expanding network.E [email protected]
www.bybike.co.za
Southern Line Tourism Route An affordable daily train pass gives you access to attractions at seven stations along the scenic rail route through the southern suburbs and along rugged coastline.
Cape Town, Observatory, Newlands, Muizenberg, Kalk Bay, Fish Hoek and Simon’s Town Stations www.capemetrorail.co.za
R310
M42
M42
M4
M6
M6
M65
M65
M65
M65 M65
M64
M4
M4
M4
M66
M63
M63
M63
M41
M38
M6
M6
M6
M17
M52
M57
M24M10
M9 M9
M22
M18
M18
M16M16
M7
M7
M16
M10
R102
R102
R310
M10
M32
M45
M49
M49
M49
M45
M54
M9
M9
M7
M7
R310
R310
R102
R102
R102
M5
M5
M8
R27
M14
M14
M14
M14
M14
M13
M19
R27
R27
R27
R304
R304
M58
R304
R302
R302
R304
R304
R304
R302
M48
M58
R302
R302
R304
R304
R312
M16
M25
M25
M11
M25
M23
M23
M15
M15
M23
R102
R101
R101
R304
M12
M12M12
M12
R102
R310
R44
R44
R44
R44
R44
R44
R44
R44
R310
R304
R310
R310R44
R45
NOORDHOEK
PAROW
TYGERVALLEY
STRAND
GORDON’S BAY
MACASSAR
DURBANVILLE
BRACKENFELL
GOODWOOD
EDGEMEAD
EERSTERIVIER
KUILSRIVIER
KHAYELITSHA
PHILIPPI
MITCHELLSPLAIN
MILNERTON
BLOUBERGSTRAND
MELKBOSSTRAND
TABLE VIEW
PARKLANDS
ROBBEN ISLAND
PINELANDS
SALT RIVER
GUGULETU
NYANGAKENILWORTH
CONSTANTIA
STRANDFONTEIN
PLUMSTEAD
WYNBERGLLANDUDNO
CLIFTON
SEA POINT
GREEN POINT
CAMPS BAY
TOKAI
FISH HOEK
SCARBOROUGH
CAPE TOWN INTERNATIONAL
AIRPORT
KOMMETJIE
CAPE POINT
ATLANTIS
MAMRE
SIMON’S TOWN
HOUT BAY
MUIZENBERG
WATERFRONT BELLVILLE
SOMERSET WEST
CLAREMONT
STELLENBOSCH
NEWLANDSM4
TO ATLANTIS, MAMRE AND PELLA
MNANDI
ZEEKOEIVLEI
ZANDVLEI
RONDEVLEI
CHAPMAN’S PEAK FALSE BAY ECOLOGY PARK
Table Bay
CAPE OF GOOD HOPE
CAPE TOWN
TABLE MOUNTAINNATIONAL PARK
(SILVERMINE)
TABLE MOUNTAINNATIONAL PARK
N2
N1
N7
N1 N1
N1
N1
N7
N7
N7
M3
M5RONDEBOSCH
M3WOODSTOCK
M3
M5
M5
N2
N2
N2
N2
N2
M3
False Bay
Atlantic Ocean
Seal Island
N
TABLE MOUNTAINNATIONAL PARK
WOLFGAT
OBSERVATORY
MACASSAR DUNES
DRIFTSANDS
BRACKEN
51 59 94
79 4724
32
18 80
05 06105
07
08 11 27
10
09 102
103
104
107
69
55
30 64
17
16
76
14 15
50 49
6091 77 61 62 92
3193
95
2625
63 5234
96 9719 99
10153 58
0103
0265 35 81
6685
36 10004
98
395440
106
38 83
37 8482
86
41
21
67
22
33
78
87 42 68
12
88
13
43-49
71-7589
2923
5756
CITY CENTRE
90
20
Bike & Saddle
02
03
04
05
06
07
08
09
10
11
01
15
19
16
17
18
20
21
22
12
Rietvlei Wetland Reserve
13
64 • SuStainable Mega-eventS in Developing CountrieS india • 65
india1
2010 Commonwealth GamesINDIA
cAse stuDy 2
the XiX Commonwealth games 2010 in Delhi represented the largest sporting event held in india after the 1982 asian games. Delhi’s experience may assist future host cities in developing countries to direct resources for mega-events to support sustainable development initiatives.
11(Source: Manpreet Romana/AFP/Getty Images))
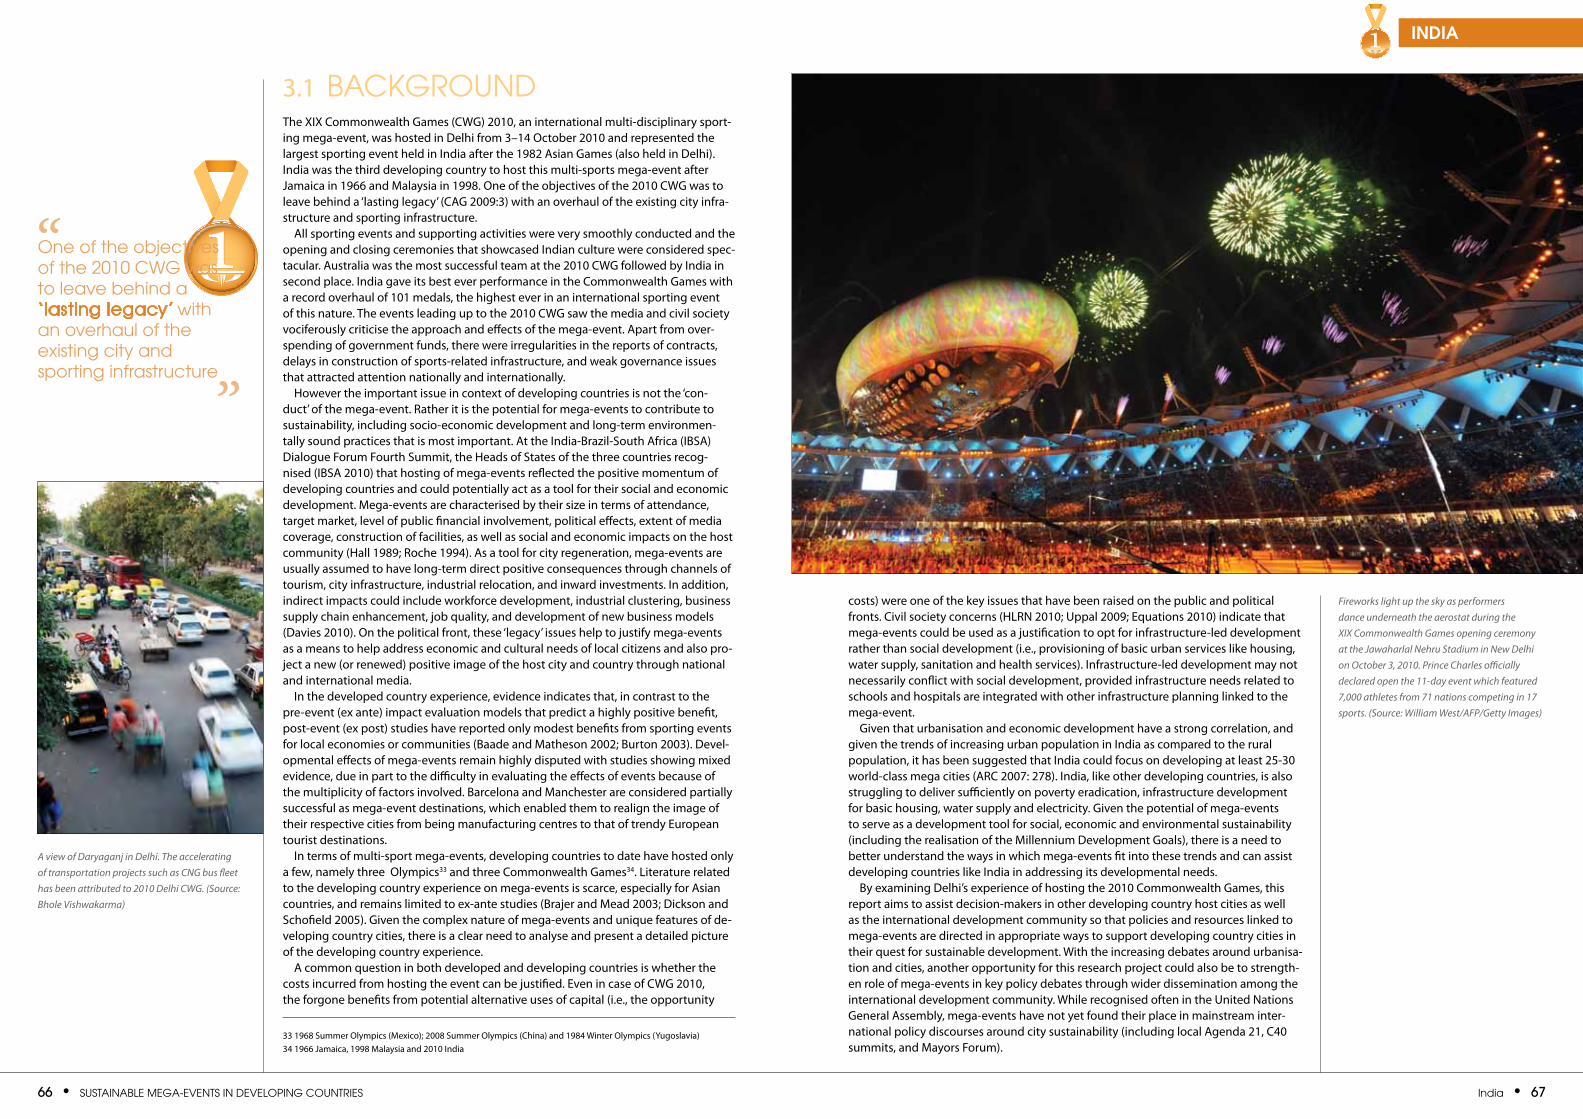
66 • SuStainable Mega-eventS in Developing CountrieS india • 67
india1
11
3.1 baCkgrounDThe XIX Commonwealth Games (CWG) 2010, an international multi-disciplinary sport-ing mega-event, was hosted in Delhi from 3–14 October 2010 and represented the largest sporting event held in India after the 1982 Asian Games (also held in Delhi). India was the third developing country to host this multi-sports mega-event after Jamaica in 1966 and Malaysia in 1998. One of the objectives of the 2010 CWG was to leave behind a ‘lasting legacy’ (CAG 2009:3) with an overhaul of the existing city infra-structure and sporting infrastructure.
All sporting events and supporting activities were very smoothly conducted and the opening and closing ceremonies that showcased Indian culture were considered spec-tacular. Australia was the most successful team at the 2010 CWG followed by India in second place. India gave its best ever performance in the Commonwealth Games with a record overhaul of 101 medals, the highest ever in an international sporting event of this nature. The events leading up to the 2010 CWG saw the media and civil society vociferously criticise the approach and effects of the mega-event. Apart from over-spending of government funds, there were irregularities in the reports of contracts, delays in construction of sports-related infrastructure, and weak governance issues that attracted attention nationally and internationally.
However the important issue in context of developing countries is not the ‘con-duct’ of the mega-event. Rather it is the potential for mega-events to contribute to sustainability, including socio-economic development and long-term environmen-tally sound practices that is most important. At the India-Brazil-South Africa (IBSA) Dialogue Forum Fourth Summit, the Heads of States of the three countries recog-nised (IBSA 2010) that hosting of mega-events reflected the positive momentum of developing countries and could potentially act as a tool for their social and economic development. Mega-events are characterised by their size in terms of attendance, target market, level of public financial involvement, political effects, extent of media coverage, construction of facilities, as well as social and economic impacts on the host community (Hall 1989; Roche 1994). As a tool for city regeneration, mega-events are usually assumed to have long-term direct positive consequences through channels of tourism, city infrastructure, industrial relocation, and inward investments. In addition, indirect impacts could include workforce development, industrial clustering, business supply chain enhancement, job quality, and development of new business models (Davies 2010). On the political front, these ‘legacy’ issues help to justify mega-events as a means to help address economic and cultural needs of local citizens and also pro-ject a new (or renewed) positive image of the host city and country through national and international media.
In the developed country experience, evidence indicates that, in contrast to the pre-event (ex ante) impact evaluation models that predict a highly positive benefit, post-event (ex post) studies have reported only modest benefits from sporting events for local economies or communities (Baade and Matheson 2002; Burton 2003). Devel-opmental effects of mega-events remain highly disputed with studies showing mixed evidence, due in part to the difficulty in evaluating the effects of events because of the multiplicity of factors involved. Barcelona and Manchester are considered partially successful as mega-event destinations, which enabled them to realign the image of their respective cities from being manufacturing centres to that of trendy European tourist destinations.
In terms of multi-sport mega-events, developing countries to date have hosted only a few, namely three Olympics33 and three Commonwealth Games34. Literature related to the developing country experience on mega-events is scarce, especially for Asian countries, and remains limited to ex-ante studies (Brajer and Mead 2003; Dickson and Schofield 2005). Given the complex nature of mega-events and unique features of de-veloping country cities, there is a clear need to analyse and present a detailed picture of the developing country experience.
A common question in both developed and developing countries is whether the costs incurred from hosting the event can be justified. Even in case of CWG 2010, the forgone benefits from potential alternative uses of capital (i.e., the opportunity
costs) were one of the key issues that have been raised on the public and political fronts. Civil society concerns (HLRN 2010; Uppal 2009; Equations 2010) indicate that mega-events could be used as a justification to opt for infrastructure-led development rather than social development (i.e., provisioning of basic urban services like housing, water supply, sanitation and health services). Infrastructure-led development may not necessarily conflict with social development, provided infrastructure needs related to schools and hospitals are integrated with other infrastructure planning linked to the mega-event.
Given that urbanisation and economic development have a strong correlation, and given the trends of increasing urban population in India as compared to the rural population, it has been suggested that India could focus on developing at least 25-30 world-class mega cities (ARC 2007: 278). India, like other developing countries, is also struggling to deliver sufficiently on poverty eradication, infrastructure development for basic housing, water supply and electricity. Given the potential of mega-events to serve as a development tool for social, economic and environmental sustainability (including the realisation of the Millennium Development Goals), there is a need to better understand the ways in which mega-events fit into these trends and can assist developing countries like India in addressing its developmental needs.
By examining Delhi’s experience of hosting the 2010 Commonwealth Games, this report aims to assist decision-makers in other developing country host cities as well as the international development community so that policies and resources linked to mega-events are directed in appropriate ways to support developing country cities in their quest for sustainable development. With the increasing debates around urbanisa-tion and cities, another opportunity for this research project could also be to strength-en role of mega-events in key policy debates through wider dissemination among the international development community. While recognised often in the United Nations General Assembly, mega-events have not yet found their place in mainstream inter-national policy discourses around city sustainability (including local Agenda 21, C40 summits, and Mayors Forum).
33 1968 Summer Olympics (Mexico); 2008 Summer Olympics (China) and 1984 Winter Olympics (Yugoslavia)34 1966 Jamaica, 1998 Malaysia and 2010 India
Fireworks light up the sky as performers dance underneath the aerostat during the XIX Commonwealth Games opening ceremony at the Jawaharlal Nehru Stadium in New Delhi on October 3, 2010. Prince Charles officially declared open the 11-day event which featured 7,000 athletes from 71 nations competing in 17 sports. (Source: William West/AFP/Getty Images)
A view of Daryaganj in Delhi. The accelerating of transportation projects such as CNG bus fleet has been attributed to 2010 Delhi CWG. (Source: Bhole Vishwakarma)
one of the objectives of the 2010 CWg was to leave behind a ‘lasting legacy’ with an overhaul of the existing city and sporting infrastructure
”
“
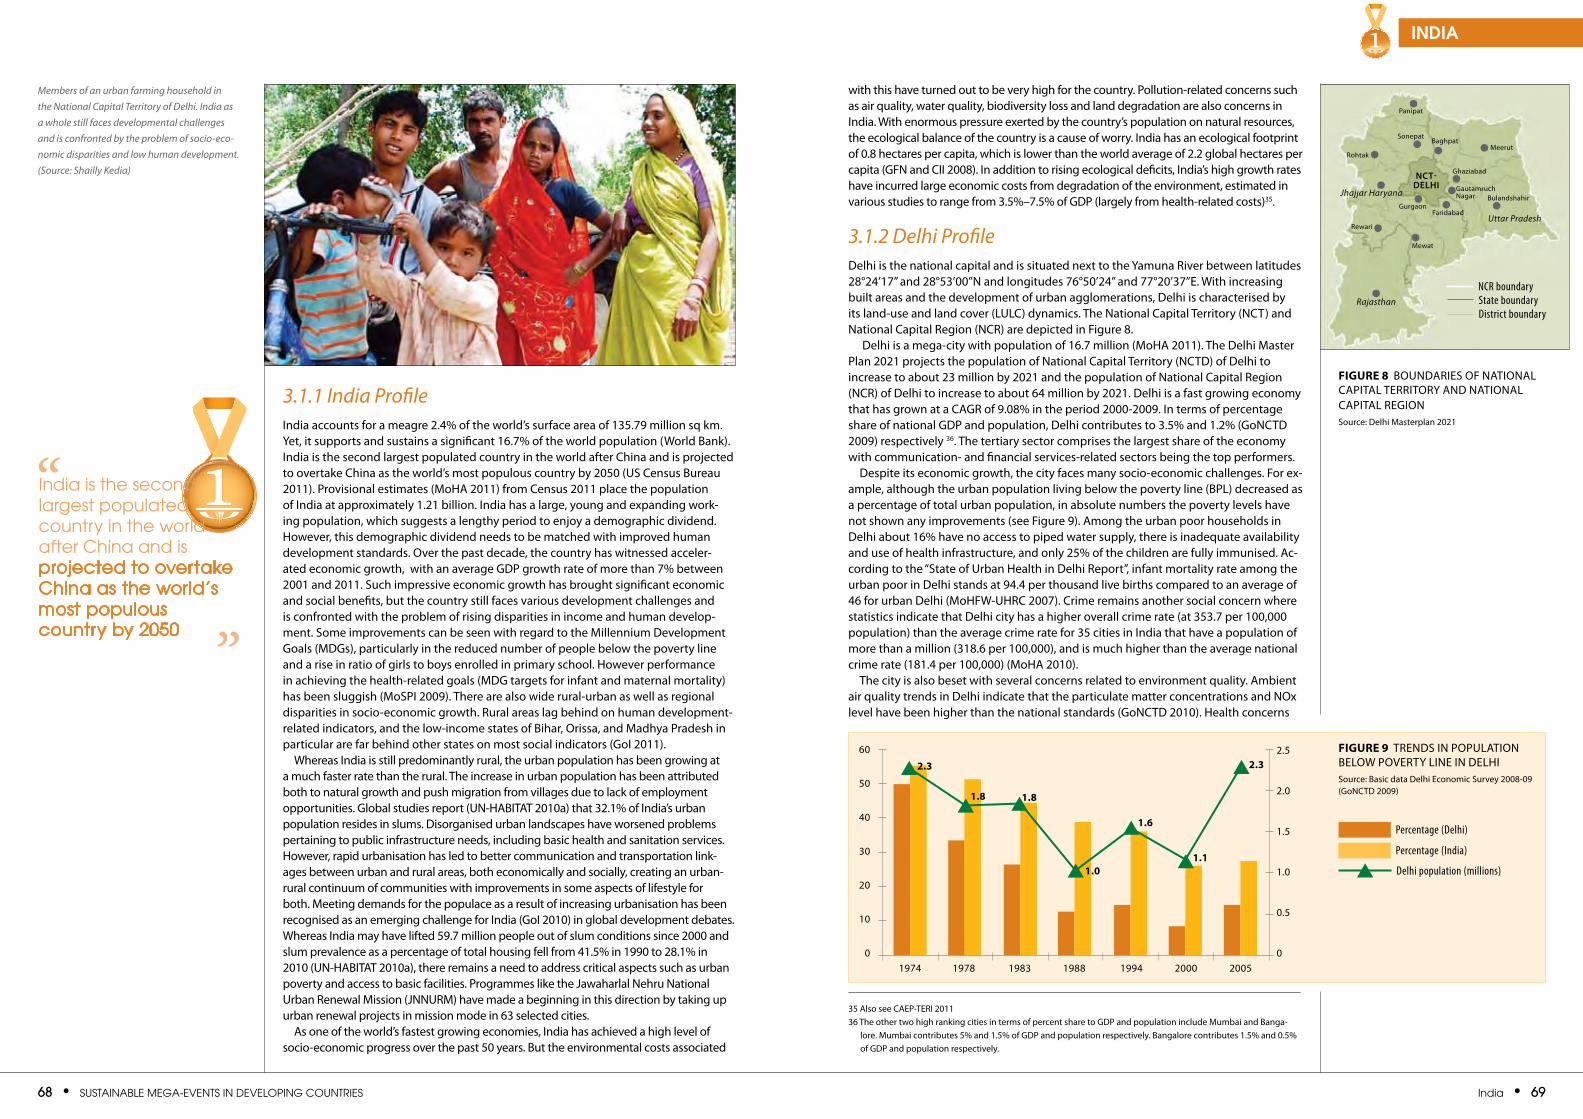
68 • SuStainable Mega-eventS in Developing CountrieS india • 69
india1
113.1.1 India Profile India accounts for a meagre 2.4% of the world’s surface area of 135.79 million sq km. Yet, it supports and sustains a significant 16.7% of the world population (World Bank). India is the second largest populated country in the world after China and is projected to overtake China as the world’s most populous country by 2050 (US Census Bureau 2011). Provisional estimates (MoHA 2011) from Census 2011 place the population of India at approximately 1.21 billion. India has a large, young and expanding work-ing population, which suggests a lengthy period to enjoy a demographic dividend. However, this demographic dividend needs to be matched with improved human development standards. Over the past decade, the country has witnessed acceler-ated economic growth, with an average GDP growth rate of more than 7% between 2001 and 2011. Such impressive economic growth has brought significant economic and social benefits, but the country still faces various development challenges and is confronted with the problem of rising disparities in income and human develop-ment. Some improvements can be seen with regard to the Millennium Development Goals (MDGs), particularly in the reduced number of people below the poverty line and a rise in ratio of girls to boys enrolled in primary school. However performance in achieving the health-related goals (MDG targets for infant and maternal mortality) has been sluggish (MoSPI 2009). There are also wide rural-urban as well as regional disparities in socio-economic growth. Rural areas lag behind on human development-related indicators, and the low-income states of Bihar, Orissa, and Madhya Pradesh in particular are far behind other states on most social indicators (GoI 2011).
Whereas India is still predominantly rural, the urban population has been growing at a much faster rate than the rural. The increase in urban population has been attributed both to natural growth and push migration from villages due to lack of employment opportunities. Global studies report (UN-HABITAT 2010a) that 32.1% of India’s urban population resides in slums. Disorganised urban landscapes have worsened problems pertaining to public infrastructure needs, including basic health and sanitation services. However, rapid urbanisation has led to better communication and transportation link-ages between urban and rural areas, both economically and socially, creating an urban-rural continuum of communities with improvements in some aspects of lifestyle for both. Meeting demands for the populace as a result of increasing urbanisation has been recognised as an emerging challenge for India (GoI 2010) in global development debates. Whereas India may have lifted 59.7 million people out of slum conditions since 2000 and slum prevalence as a percentage of total housing fell from 41.5% in 1990 to 28.1% in 2010 (UN-HABITAT 2010a), there remains a need to address critical aspects such as urban poverty and access to basic facilities. Programmes like the Jawaharlal Nehru National Urban Renewal Mission (JNNURM) have made a beginning in this direction by taking up urban renewal projects in mission mode in 63 selected cities.
As one of the world’s fastest growing economies, India has achieved a high level of socio-economic progress over the past 50 years. But the environmental costs associated
with this have turned out to be very high for the country. Pollution-related concerns such as air quality, water quality, biodiversity loss and land degradation are also concerns in India. With enormous pressure exerted by the country’s population on natural resources, the ecological balance of the country is a cause of worry. India has an ecological footprint of 0.8 hectares per capita, which is lower than the world average of 2.2 global hectares per capita (GFN and CII 2008). In addition to rising ecological deficits, India’s high growth rates have incurred large economic costs from degradation of the environment, estimated in various studies to range from 3.5%–7.5% of GDP (largely from health-related costs)35.
3.1.2 Delhi ProfileDelhi is the national capital and is situated next to the Yamuna River between latitudes 28°24’17’’ and 28°53’00’’N and longitudes 76°50’24’’ and 77°20’37’’E. With increasing built areas and the development of urban agglomerations, Delhi is characterised by its land-use and land cover (LULC) dynamics. The National Capital Territory (NCT) and National Capital Region (NCR) are depicted in Figure 8.
Delhi is a mega-city with population of 16.7 million (MoHA 2011). The Delhi Master Plan 2021 projects the population of National Capital Territory (NCTD) of Delhi to increase to about 23 million by 2021 and the population of National Capital Region (NCR) of Delhi to increase to about 64 million by 2021. Delhi is a fast growing economy that has grown at a CAGR of 9.08% in the period 2000-2009. In terms of percentage share of national GDP and population, Delhi contributes to 3.5% and 1.2% (GoNCTD 2009) respectively 36. The tertiary sector comprises the largest share of the economy with communication- and financial services-related sectors being the top performers.
Despite its economic growth, the city faces many socio-economic challenges. For ex-ample, although the urban population living below the poverty line (BPL) decreased as a percentage of total urban population, in absolute numbers the poverty levels have not shown any improvements (see Figure 9). Among the urban poor households in Delhi about 16% have no access to piped water supply, there is inadequate availability and use of health infrastructure, and only 25% of the children are fully immunised. Ac-cording to the “State of Urban Health in Delhi Report”, infant mortality rate among the urban poor in Delhi stands at 94.4 per thousand live births compared to an average of 46 for urban Delhi (MoHFW-UHRC 2007). Crime remains another social concern where statistics indicate that Delhi city has a higher overall crime rate (at 353.7 per 100,000 population) than the average crime rate for 35 cities in India that have a population of more than a million (318.6 per 100,000), and is much higher than the average national crime rate (181.4 per 100,000) (MoHA 2010).
The city is also beset with several concerns related to environment quality. Ambient air quality trends in Delhi indicate that the particulate matter concentrations and NOx level have been higher than the national standards (GoNCTD 2010). Health concerns
Members of an urban farming household in the National Capital Territory of Delhi. India as a whole still faces developmental challenges and is confronted by the problem of socio-eco-nomic disparities and low human development. (Source: Shailly Kedia)
Figure 8 BOUNDARIES OF NATIONAL CAPITAL TERRITORY AND NATIONAL CAPITAL REGIONSource: Delhi Masterplan 2021
india is the second largest populated country in the world after China and is projected to overtake China as the world’s most populous country by 2050 ”
“
35 Also see CAEP-TERI 201136 The other two high ranking cities in terms of percent share to GDP and population include Mumbai and Banga-
lore. Mumbai contributes 5% and 1.5% of GDP and population respectively. Bangalore contributes 1.5% and 0.5% of GDP and population respectively.
60
50
40
30
20
10
0
2.5
2.0
1.5
1.0
0.5
01974 1978 1983 1988 1994 2000 2005
2.3
1.8 1.8
1.0
1.6
1.1
2.3Figure 9 TRENDS IN POPULATION BELOW POvERTY LINE IN DELHISource: Basic data Delhi Economic Survey 2008-09 (GoNCTD 2009)
Percentage (Delhi)
Percentage (India)
Delhi population (millions)
Rajasthan
Uttar Pradesh
Jhajjar Haryana
nct- delhi
NCR boundaryState boundaryDistrict boundary
Rewari
Mewat
Meerut
Ghaziabad
Bulandshahir
Sonepat
Rohtak
Panipat
FaridabadGurgaon
Gautamruch Nagar
Baghpat
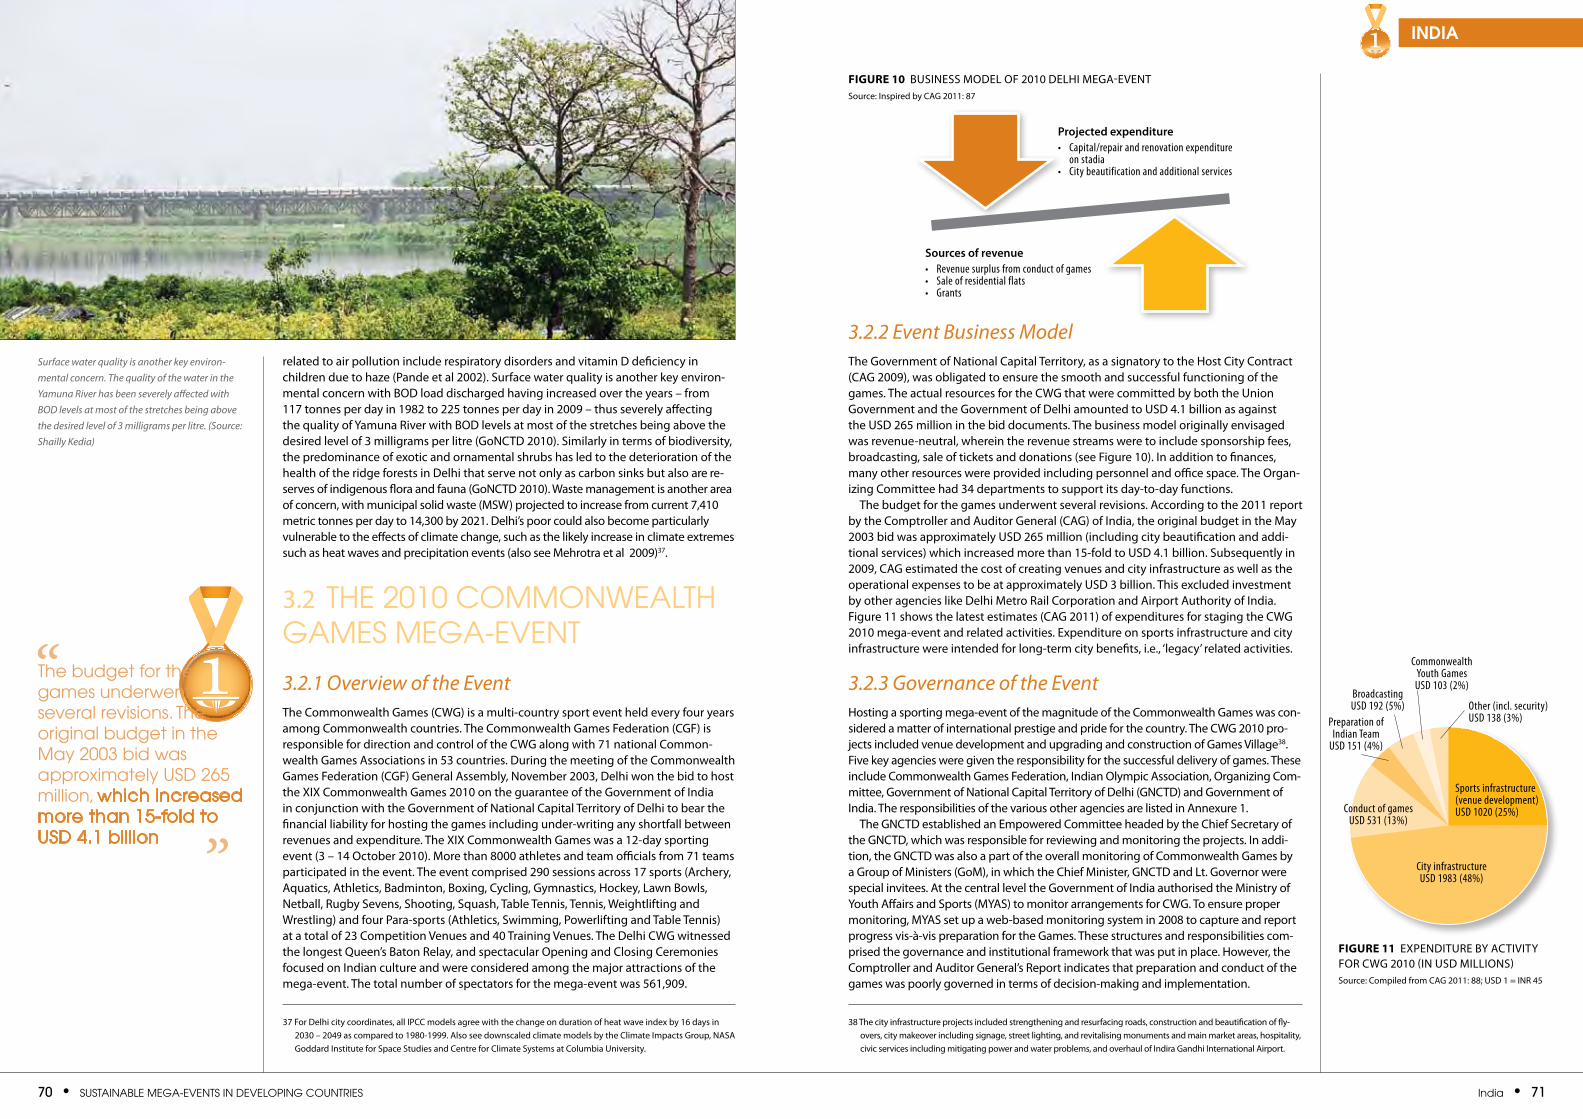
70 • SuStainable Mega-eventS in Developing CountrieS india • 71
india1
11
related to air pollution include respiratory disorders and vitamin D deficiency in children due to haze (Pande et al 2002). Surface water quality is another key environ-mental concern with BOD load discharged having increased over the years – from 117 tonnes per day in 1982 to 225 tonnes per day in 2009 – thus severely affecting the quality of Yamuna River with BOD levels at most of the stretches being above the desired level of 3 milligrams per litre (GoNCTD 2010). Similarly in terms of biodiversity, the predominance of exotic and ornamental shrubs has led to the deterioration of the health of the ridge forests in Delhi that serve not only as carbon sinks but also are re-serves of indigenous flora and fauna (GoNCTD 2010). Waste management is another area of concern, with municipal solid waste (MSW) projected to increase from current 7,410 metric tonnes per day to 14,300 by 2021. Delhi’s poor could also become particularly vulnerable to the effects of climate change, such as the likely increase in climate extremes such as heat waves and precipitation events (also see Mehrotra et al 2009)37.
3.2 the 2010 CoMMonWealth gaMeS Mega-event
3.2.1 Overview of the EventThe Commonwealth Games (CWG) is a multi-country sport event held every four years among Commonwealth countries. The Commonwealth Games Federation (CGF) is responsible for direction and control of the CWG along with 71 national Common-wealth Games Associations in 53 countries. During the meeting of the Commonwealth Games Federation (CGF) General Assembly, November 2003, Delhi won the bid to host the XIX Commonwealth Games 2010 on the guarantee of the Government of India in conjunction with the Government of National Capital Territory of Delhi to bear the financial liability for hosting the games including under-writing any shortfall between revenues and expenditure. The XIX Commonwealth Games was a 12-day sporting event (3 – 14 October 2010). More than 8000 athletes and team officials from 71 teams participated in the event. The event comprised 290 sessions across 17 sports (Archery, Aquatics, Athletics, Badminton, Boxing, Cycling, Gymnastics, Hockey, Lawn Bowls, Netball, Rugby Sevens, Shooting, Squash, Table Tennis, Tennis, Weightlifting and Wrestling) and four Para-sports (Athletics, Swimming, Powerlifting and Table Tennis) at a total of 23 Competition venues and 40 Training venues. The Delhi CWG witnessed the longest Queen’s Baton Relay, and spectacular Opening and Closing Ceremonies focused on Indian culture and were considered among the major attractions of the mega-event. The total number of spectators for the mega-event was 561,909.
3.2.2 Event Business ModelThe Government of National Capital Territory, as a signatory to the Host City Contract (CAG 2009), was obligated to ensure the smooth and successful functioning of the games. The actual resources for the CWG that were committed by both the Union Government and the Government of Delhi amounted to USD 4.1 billion as against the USD 265 million in the bid documents. The business model originally envisaged was revenue-neutral, wherein the revenue streams were to include sponsorship fees, broadcasting, sale of tickets and donations (see Figure 10). In addition to finances, many other resources were provided including personnel and office space. The Organ-izing Committee had 34 departments to support its day-to-day functions.
The budget for the games underwent several revisions. According to the 2011 report by the Comptroller and Auditor General (CAG) of India, the original budget in the May 2003 bid was approximately USD 265 million (including city beautification and addi-tional services) which increased more than 15-fold to USD 4.1 billion. Subsequently in 2009, CAG estimated the cost of creating venues and city infrastructure as well as the operational expenses to be at approximately USD 3 billion. This excluded investment by other agencies like Delhi Metro Rail Corporation and Airport Authority of India. Figure 11 shows the latest estimates (CAG 2011) of expenditures for staging the CWG 2010 mega-event and related activities. Expenditure on sports infrastructure and city infrastructure were intended for long-term city benefits, i.e., ‘legacy’ related activities.
3.2.3 Governance of the EventHosting a sporting mega-event of the magnitude of the Commonwealth Games was con-sidered a matter of international prestige and pride for the country. The CWG 2010 pro-jects included venue development and upgrading and construction of Games village38. Five key agencies were given the responsibility for the successful delivery of games. These include Commonwealth Games Federation, Indian Olympic Association, Organizing Com-mittee, Government of National Capital Territory of Delhi (GNCTD) and Government of India. The responsibilities of the various other agencies are listed in Annexure 1.
The GNCTD established an Empowered Committee headed by the Chief Secretary of the GNCTD, which was responsible for reviewing and monitoring the projects. In addi-tion, the GNCTD was also a part of the overall monitoring of Commonwealth Games by a Group of Ministers (GoM), in which the Chief Minister, GNCTD and Lt. Governor were special invitees. At the central level the Government of India authorised the Ministry of Youth Affairs and Sports (MYAS) to monitor arrangements for CWG. To ensure proper monitoring, MYAS set up a web-based monitoring system in 2008 to capture and report progress vis-à-vis preparation for the Games. These structures and responsibilities com-prised the governance and institutional framework that was put in place. However, the Comptroller and Auditor General’s Report indicates that preparation and conduct of the games was poorly governed in terms of decision-making and implementation.
the budget for the games underwent several revisions. the original budget in the May 2003 bid was approximately uSD 265 million, which increased more than 15-fold to uSD 4.1 billion ”
“
37 For Delhi city coordinates, all IPCC models agree with the change on duration of heat wave index by 16 days in 2030 – 2049 as compared to 1980-1999. Also see downscaled climate models by the Climate Impacts Group, NASA Goddard Institute for Space Studies and Centre for Climate Systems at Columbia University.
Surface water quality is another key environ-mental concern. The quality of the water in the Yamuna River has been severely affected with BOD levels at most of the stretches being above the desired level of 3 milligrams per litre. (Source: Shailly Kedia)
38 The city infrastructure projects included strengthening and resurfacing roads, construction and beautification of fly-overs, city makeover including signage, street lighting, and revitalising monuments and main market areas, hospitality, civic services including mitigating power and water problems, and overhaul of Indira Gandhi International Airport.
Figure 11 EXPENDITURE BY ACTIvITY FOR CWG 2010 (IN USD MILLIONS)Source: Compiled from CAG 2011: 88; USD 1 = INR 45
Sports infrastructure (venue development) USD 1020 (25%)
City infrastructureUSD 1983 (48%)
Conduct of gamesUSD 531 (13%)
Preparation of Indian Team
USD 151 (4%)
Other (incl. security)USD 138 (3%)
BroadcastingUSD 192 (5%)
Commonwealth Youth GamesUSD 103 (2%)
Projected expenditure• Capital/repair and renovation expenditure
on stadia• City beautification and additional services
Sources of revenue• Revenue surplus from conduct of games• Sale of residential flats• Grants
Figure 10 BUSINESS MODEL OF 2010 DELHI MEGA-EvENTSource: Inspired by CAG 2011: 87
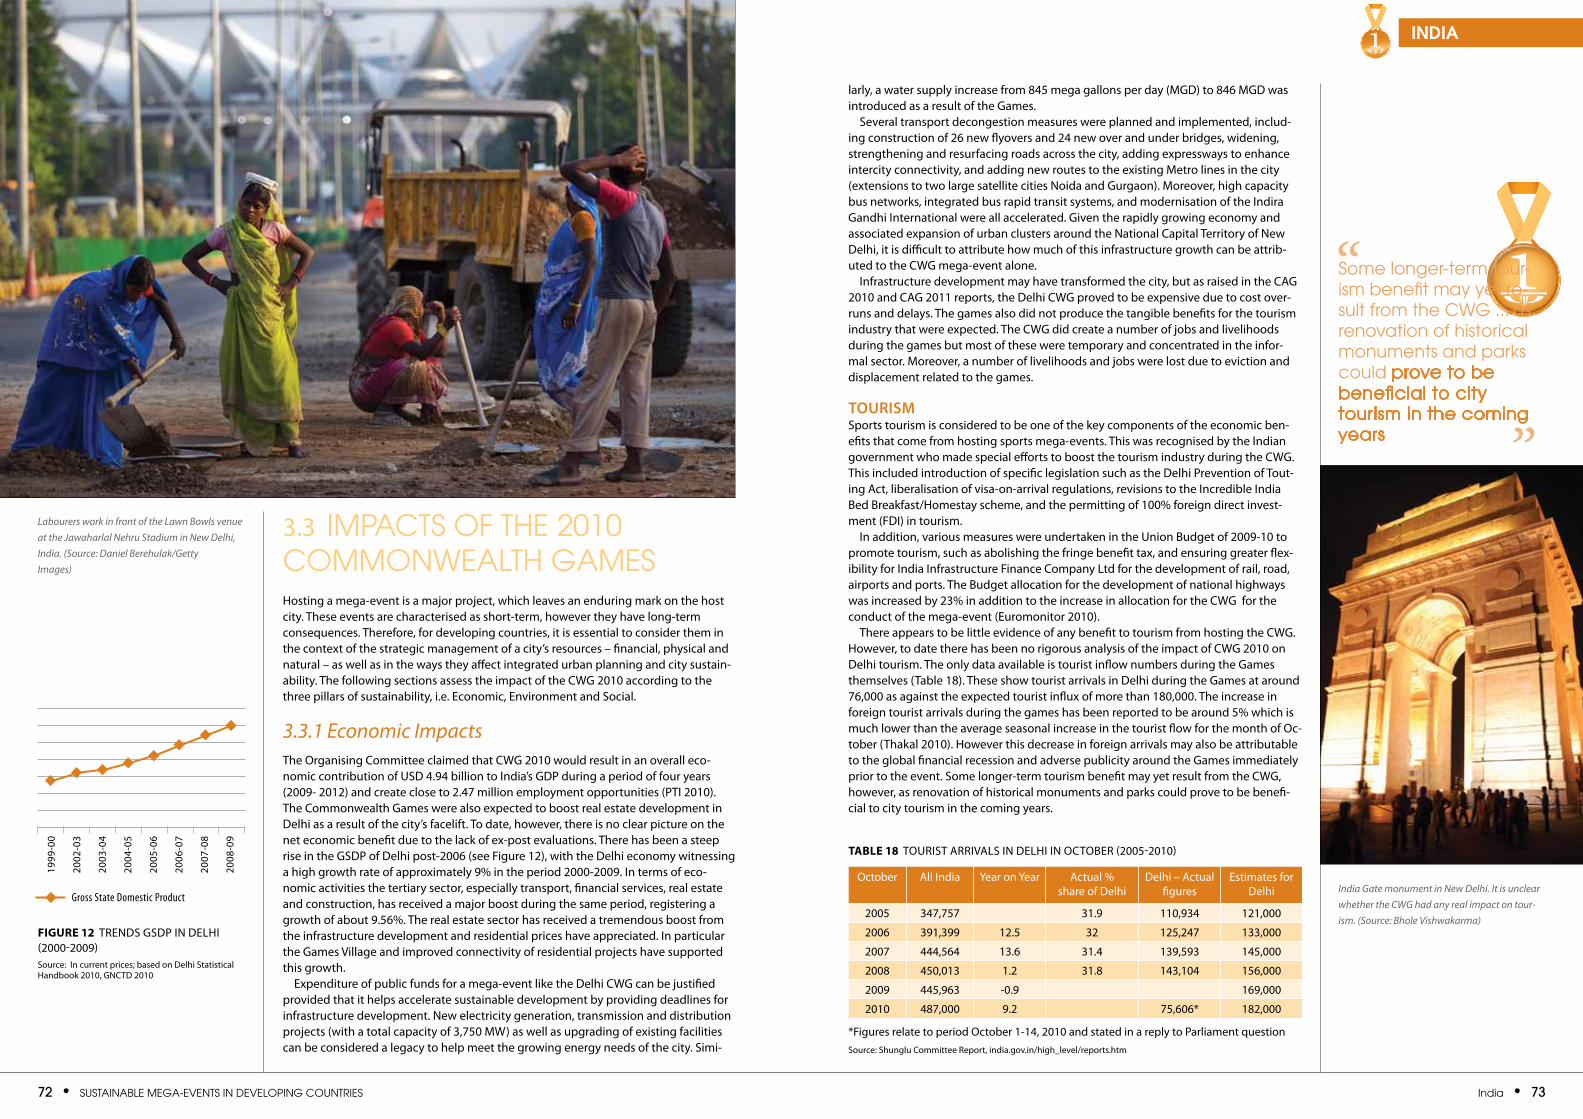
72 • SuStainable Mega-eventS in Developing CountrieS india • 73
india1
11
3.3 iMpaCtS of the 2010 CoMMonWealth gaMeSHosting a mega-event is a major project, which leaves an enduring mark on the host city. These events are characterised as short-term, however they have long-term consequences. Therefore, for developing countries, it is essential to consider them in the context of the strategic management of a city’s resources – financial, physical and natural – as well as in the ways they affect integrated urban planning and city sustain-ability. The following sections assess the impact of the CWG 2010 according to the three pillars of sustainability, i.e. Economic, Environment and Social.
3.3.1 Economic Impacts The Organising Committee claimed that CWG 2010 would result in an overall eco-nomic contribution of USD 4.94 billion to India’s GDP during a period of four years (2009- 2012) and create close to 2.47 million employment opportunities (PTI 2010). The Commonwealth Games were also expected to boost real estate development in Delhi as a result of the city’s facelift. To date, however, there is no clear picture on the net economic benefit due to the lack of ex-post evaluations. There has been a steep rise in the GSDP of Delhi post-2006 (see Figure 12), with the Delhi economy witnessing a high growth rate of approximately 9% in the period 2000-2009. In terms of eco-nomic activities the tertiary sector, especially transport, financial services, real estate and construction, has received a major boost during the same period, registering a growth of about 9.56%. The real estate sector has received a tremendous boost from the infrastructure development and residential prices have appreciated. In particular the Games village and improved connectivity of residential projects have supported this growth.
Expenditure of public funds for a mega-event like the Delhi CWG can be justified provided that it helps accelerate sustainable development by providing deadlines for infrastructure development. New electricity generation, transmission and distribution projects (with a total capacity of 3,750 MW) as well as upgrading of existing facilities can be considered a legacy to help meet the growing energy needs of the city. Simi-
larly, a water supply increase from 845 mega gallons per day (MGD) to 846 MGD was introduced as a result of the Games.
Several transport decongestion measures were planned and implemented, includ-ing construction of 26 new flyovers and 24 new over and under bridges, widening, strengthening and resurfacing roads across the city, adding expressways to enhance intercity connectivity, and adding new routes to the existing Metro lines in the city (extensions to two large satellite cities Noida and Gurgaon). Moreover, high capacity bus networks, integrated bus rapid transit systems, and modernisation of the Indira Gandhi International were all accelerated. Given the rapidly growing economy and associated expansion of urban clusters around the National Capital Territory of New Delhi, it is difficult to attribute how much of this infrastructure growth can be attrib-uted to the CWG mega-event alone.
Infrastructure development may have transformed the city, but as raised in the CAG 2010 and CAG 2011 reports, the Delhi CWG proved to be expensive due to cost over-runs and delays. The games also did not produce the tangible benefits for the tourism industry that were expected. The CWG did create a number of jobs and livelihoods during the games but most of these were temporary and concentrated in the infor-mal sector. Moreover, a number of livelihoods and jobs were lost due to eviction and displacement related to the games.
touriSmSports tourism is considered to be one of the key components of the economic ben-efits that come from hosting sports mega-events. This was recognised by the Indian government who made special efforts to boost the tourism industry during the CWG. This included introduction of specific legislation such as the Delhi Prevention of Tout-ing Act, liberalisation of visa-on-arrival regulations, revisions to the Incredible India Bed Breakfast/Homestay scheme, and the permitting of 100% foreign direct invest-ment (FDI) in tourism.
In addition, various measures were undertaken in the Union Budget of 2009-10 to promote tourism, such as abolishing the fringe benefit tax, and ensuring greater flex-ibility for India Infrastructure Finance Company Ltd for the development of rail, road, airports and ports. The Budget allocation for the development of national highways was increased by 23% in addition to the increase in allocation for the CWG for the conduct of the mega-event (Euromonitor 2010).
There appears to be little evidence of any benefit to tourism from hosting the CWG. However, to date there has been no rigorous analysis of the impact of CWG 2010 on Delhi tourism. The only data available is tourist inflow numbers during the Games themselves (Table 18). These show tourist arrivals in Delhi during the Games at around 76,000 as against the expected tourist influx of more than 180,000. The increase in foreign tourist arrivals during the games has been reported to be around 5% which is much lower than the average seasonal increase in the tourist flow for the month of Oc-tober (Thakal 2010). However this decrease in foreign arrivals may also be attributable to the global financial recession and adverse publicity around the Games immediately prior to the event. Some longer-term tourism benefit may yet result from the CWG, however, as renovation of historical monuments and parks could prove to be benefi-cial to city tourism in the coming years.
Some longer-term tour-ism benefit may yet re-sult from the CWg ... as renovation of historical monuments and parks could prove to be beneficial to city tourism in the coming years ”
“
Table 18 TOURIST ARRIvALS IN DELHI IN OCTOBER (2005-2010)
October All India Year on Year Actual % share of Delhi
Delhi – Actual figures
Estimates for Delhi
2005 347,757 31.9 110,934 121,000
2006 391,399 12.5 32 125,247 133,000
2007 444,564 13.6 31.4 139,593 145,000
2008 450,013 1.2 31.8 143,104 156,000
2009 445,963 -0.9 169,000
2010 487,000 9.2 75,606* 182,000
*Figures relate to period October 1-14, 2010 and stated in a reply to Parliament questionSource: Shunglu Committee Report, india.gov.in/high_level/reports.htm
Figure 12 TRENDS GSDP IN DELHI (2000-2009)Source: In current prices; based on Delhi Statistical Handbook 2010, GNCTD 2010
1999
-00
2002
-03
2003
-04
2004
-05
2005
-06
2006
-07
2007
-08
2008
-09
Gross State Domestic Product
Labourers work in front of the Lawn Bowls venue at the Jawaharlal Nehru Stadium in New Delhi, India. (Source: Daniel Berehulak/Getty Images)
India Gate monument in New Delhi. It is unclear whether the CWG had any real impact on tour-ism. (Source: Bhole Vishwakarma)
74 • SuStainable Mega-eventS in Developing CountrieS india • 75
india1
11
FiScal imPactSThe Governments of India and Delhi undertook complete responsibility for the costs of the Games and agreed to underwrite any capital or operating budget shortfall. The Games proved to be an expensive affair for the country, in turn putting a lot of finan-cial burden on the Government of India as well as Government of National Capital Ter-ritory of New Delhi (see Annexure 2 for budgetary allocations approved at the centre and state levels). The budgetary allocations made towards CWG witnessed substantial increases in their figures over the years. In addition, the Government of Delhi sought special assistance from the Union Government of USD 613.3 million for Games-related expenditures, which may have severe implications for central budget allocations in coming years, particularly for Delhi.
According to CAG 2011, the seven year window from the award of CWG 2010 contract to Delhi in November 2003 to its hosting in October 2010 was not appropri-ately utilised as the period from 2003 to mid 2006, which could have been used for clearances, approvals and planning, was wasted. This could be attributed to a broader political failure, as there was lack of political consensus at the central level regarding the hosting of Games. As can be seen from the budgetary trends of the Government of National Capital Territory of New Delhi, it was only after 2006 that Delhi budget outlays increased, nearly doubling. In order to understand the manner in which these increases in budget relate to the Games, three forecasting scenarios post-2006 were produced. The three scenarios are: 1) linear forecasting following the existing budget trend 2) Non-linear (polynomial) forecasting based on regression using Gross State Domestic Product (GSDP) and budgetary outlays as the independent and dependent variables respectively; and 3) forecasting based on equal weighting of the forecasted values (derived through linear and non-linear forecasting). Figure 13 shows the results of the three scenarios.
What this analysis reveals is that at the state level, government spending would have increased in any case in order to meet the needs of the growing economy with its burgeoning service sector. While it is difficult to forecast what the actual values of such increases would have been, the above scenarios indicate that there has been increased spending post 2005-2006 and that there is much scope for public funds to be utilised effectively as part of the staging of mega-events. Also, as validated by government committee reports, funds could be utilised more effectively had there been effective pre-event planning for resource allocation. However, when details of the sector-specific spending are examined, it is also the case that while trends in
outlays for sectors like transport increased, urban development and social welfare do not show an increase in percentage share. Concerns over the implications of drain-ing resources away from some sectors in order to fund others that were more directly relevant to the needs of Delhi CWG were also raised by civil society.
The claim of revenue neutrality is a powerful means to justify spending the enor-mous financial resources that are required to host a mega-event. In the case of the Delhi CWG, the Indian Olympic Association and the Organizing Committee presented their rationale for hosting the games in a model that was revenue neutral if not show-ing a revenue surplus. This argument, as pointed out in CAG 2011, was also used as a premise to justify lack of government control in the conduct of Games-related affairs. The revenue projection as of July 2008 was USD 410 million. However out of the total committed revenue of USD 157 million by Organising Committee the net revenue generated was USD 101.5 million, and after deducting the revenue generation cost, revenue totalled only USD 40 million. The Games witnessed ballooning expenditure with only limited revenue streams.
Appropriate oversight in terms of monitoring, audit and pre-audit were not set up by the Organising Committee. Both the Shunglu Committee and the Comptrol-ler and Auditor General’s reports show that there was lack of internal control such as maintenance of proper documentation, and no significant objections were raised even though inconsistencies and irregularities were noted. Lack of compliance with public procurement procedures led agencies, especially the Organising Committee, to undertake huge levels of expenditure. The two post-event CWG evaluation com-mittees (CAG 2011; HLC 2011) also found that hasty contracts, failure to conduct price negotiations and delayed decision-making pushed costs up. Such delays indicate poor planning, as does ad-hoc selection of projects, a number of which were abandoned at a later stage because of their infeasibility. There were also no backup plans in case the planned projects were not completed on time, while the poor implementation and lack of monitoring led to poor quality and delayed completion of projects. A larger governance failure was the entrustment of large sums of public money to the Games Organising Committee, a private body which did not follow government budgetary accounting and procurement procedures.
Construction work at Talkatora Stadium in New Delhi, one of the venues for the Commonwealth Games 2010. The Games witnessed ballooning expenditure with only limited revenue streams. (Source: Qamar Sibtain/India TodayGroup/Getty Images)
the claim of revenue neutrality is a powerful means to justify spend-ing the enormous financial resources that are required to host a mega-event
”
“
Actual
Forecasted (GSDP growth factor)
Linear forecasting
1 400 000
1 200 000
1 000 000
800 000
600 000
400 000
200 000
0
1999
-00
2000
-01
2001
-02
2002
-03
2003
-04
2004
-05
2005
-06
2006
-07
2007
-08
2008
-09
2009
-10
2010
-11
XX
XX X X X
X
X
X
X
X
Figure 13 NATIONAL CAPITAL TERRITORY OF NEW DELHI BUDGETARY SCENARIOSSource: Basic data Planning Department (various issues); Delhi Statistical Handbook (various issues)
Average (forecasted)X
76 • SuStainable Mega-eventS in Developing CountrieS india • 77
india1
11
3.3.2 Environmental ImpactsAs with nearly all human activities, mega-events have an effect on the natural environ-ment. Sports federations and organising agencies have begun to acknowledge that the staging of mega-events can and should incorporate the environmental dimension of sustainability. In the case of the Commonwealth Games, this is recognised in the green games vision: “Global sporting events also have a large ecological and consump-tion footprint. This is reflected in substantial material requirements driven by construc-tion activities such as energy requirements, water requirements and waste generation.” However the sphere of the environment is not limited to carbon emissions, but also includes a wider range of ecological issues. In an urban environment land-use is of particular importance, and for the Delhi CWG the role of civil society organisations in the issue of land-use for the CWG Games village on the banks of the Yamuna River was noteworthy.
Green GameSThe vision of the green games strategy of the Commonwealth Games is the follow-ing: “To strive towards reducing carbon footprints and become the benchmark for the multi-disciplinary games in the future”. It was asserted that the 2010 Delhi CWG would be the “greenest Commonwealth Games ever” that also left an environmental legacy beyond roads and infrastructure. With an overall objective to achieve a carbon neutral status for the games, a strategic framework was developed to reduce and offset the key environmental footprints of the event. The framework included eight modules: Green Games vision, Mission and Goals; Green Infrastructure; Green Ceremonies; Green Hospitality; Eco Procurement; Green Sensitization; Greening and Offset; and Sustainability Reporting and Sustainability Indicators. Activities to be implemented included city forest plantations, designing Thyagaraj Stadium as a model green sport-
ing venue, and establishing a Commonwealth Garden (also see the Ecological Codes in Annexure 3).
In addition, multiple sensitisation and communications campaigns were launched that included the Cleaner Delhi campaign, an energy conservation campaign, Water Day celebrations, and a Sustainable Transport Promotion campaign. A ‘Go Green – It Works’ low carbon campaign was developed under a Global Environment Fund (GEF) grant and implemented during the CWG 2010 by the United Nations Development Programme (UNDP) along with the Ministry of Environment and Forests (MoEF), the CWG Organising Committee, the Government of National Capital Territory of Delhi, the Ministry of New and Renewable Energy (MNRE) and the Bureau of Energy Efficiency (BEE). In this campaign young Indian sporting icons promoted green behaviour meant to inspire people to adopt sustainable lifestyles.
Differing carbon emissions estimates for the games have been provided. The Or-ganising Committee estimates that emissions generated for the Games, after taking sustainability measures, were 52,468.9 tCO2e. Estimates are that CWG-related tree planting activities will sequester 81,472.2 tCO2e over a period of 5 years, which would enable the mega-event to be considered ‘carbon neutral’. However if the emissions are the 128,000 tCO2e that has been estimated by another study (IIM-A 2010), the event would not be carbon neutral.
The Ministry of Environment and Forests coordinated tree-planting programmes with support from state governments, the Global Environment Fund (GEF), the UNDP and UNEP. According to estimates, the Pan India plantation saw 713,828 saplings planted at block level and along highways across India (see Figure 14). The Organis-ing Committee also projects that approximately 2.07 million saplings39 were planted overall, exceeding the set target of two million saplings.
While the vision of the Delhi CWG primarily emphasised carbon neutrality, other measures were also taken relating to the local environment. These included monitoring and forecasting of air pollution levels in Delhi through installation of state-of-the-art air pollution measuring devices at 11 strategic locations, including premises of 6 competition venues, as well as initiatives for waste management for non-bio-degradable waste. While these initiatives played an important role in terms of raising awareness, it still cannot be said the extent to which they provide a ‘legacy’ in terms of solving the environmental issues (especially deterioration of air and surface water quality) that were raised in the ‘State of Environment Report’ by the Department of Environment and the Government of National Capital Territory of New Delhi. As a result, it is difficult to attribute any major improvement in the local environment to the Delhi CWG.
land uSe and urbaniSationNew land was acquired for the construction of the Games village, which was to pro-vide accommodation for 8000 athletes and team officials during the Games. The Delhi Development Authority (DDA) was chosen as the nodal agency for development of the Games village. Although the Games had been awarded to India on 13 November 2003, by which point the site for Games village had also been secured, the decision on the mode of development of the Games village was finally taken and agreed only in January 2006, with construction only starting in September 2007.
The Games village was developed on approximately 59 hectares on the banks of the Yamuna River. Development of the site first required an approved ‘change of land use’. According to public notification in 2006, the land use of 42.5 hectares was sought to be changed from ‘agricultural and water body’ to ‘public and semi-public facilities’, with approximately 11 hectares to be changed to ‘residential’ and approximately 5.5 hectares to ‘commercial/hotel’.
Several concerns by civil society organisations were raised regarding the ecological effects of constructing the Games village on the Yamuna River banks. Scientific studies (Spirn and Cherian 2004; Agrawal and Chawla 2006; Gupta et al 2008) indicated that water table changes and poor drainage could result in liquefaction, which could cause damage to infrastructure from even mild tremors. Civil society had also cited these scientific assessments when filing public interest litigation in the high court. Actions taken by civil society included communication to several GOI ministries including
39 This includes UNEP’s activities under ‘Plant a Billion Trees’ campaign, Plantation activities in Delhi and Pune, and planta-tion activities during the Queen’s Baton Relay.
Indian labourers carry trees to plant at the Com-monwealth Games village campus in New Delhi. (Source: Prakash Singh/AFP/Getty Images)
Several concerns by civil society organisations were raised regarding the ecological effects of constructing the games village on the Yamuna river banks
”
“
Figure 14 LOCATIONS OF PAN INDIA PLANTATIONSource: Organising Committee website; http://d2010.thecgf.com/green_games
india
Himachal Pradesh (60K)
Jammu & Kashmir (30K)
Punjab (42K)
Uttaranchal (39.6K)
Uttar Pradesh (52K)
Madhya Pradesh (5K)Gujarat (50.5K)
Maharashtra (65K)
Chhattisgarh (54K)
Orissa (4.3K)Andhra Pradesh (55K)
Karnataka (71.9K)
Kerala (5K)Tamil Naidu (50K)
West Bengal (4K)
Jharkhand (50K)
Bihar (4K)
Sikkim (4.4K)
Tripura (23K)
Assam (4K)
Nagaland (10K)
Youth cadets carrying Green Slogan cards. Also seen is CWG mascot Shera. (Source: CWG Envi-ronment and Sustainability Division)
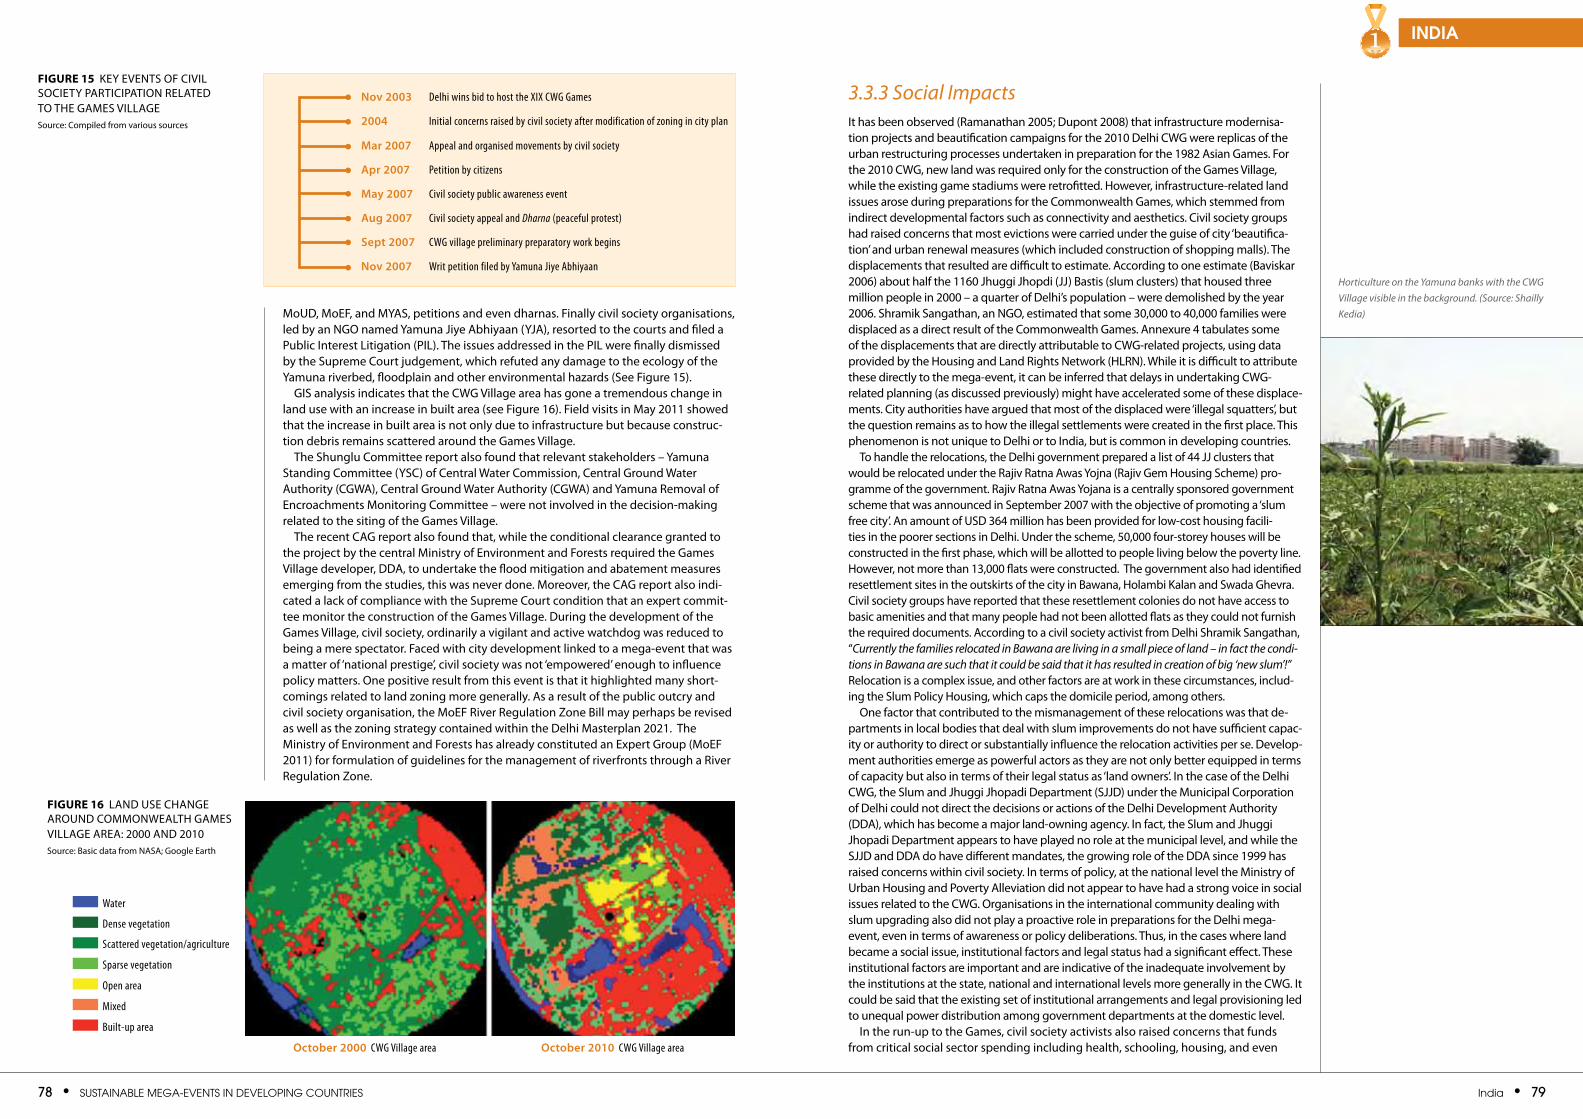
78 • SuStainable Mega-eventS in Developing CountrieS india • 79
india1
MoUD, MoEF, and MYAS, petitions and even dharnas. Finally civil society organisations, led by an NGO named Yamuna Jiye Abhiyaan (YJA), resorted to the courts and filed a Public Interest Litigation (PIL). The issues addressed in the PIL were finally dismissed by the Supreme Court judgement, which refuted any damage to the ecology of the Yamuna riverbed, floodplain and other environmental hazards (See Figure 15).
GIS analysis indicates that the CWG village area has gone a tremendous change in land use with an increase in built area (see Figure 16). Field visits in May 2011 showed that the increase in built area is not only due to infrastructure but because construc-tion debris remains scattered around the Games village.
The Shunglu Committee report also found that relevant stakeholders – Yamuna Standing Committee (YSC) of Central Water Commission, Central Ground Water Authority (CGWA), Central Ground Water Authority (CGWA) and Yamuna Removal of Encroachments Monitoring Committee – were not involved in the decision-making related to the siting of the Games village.
The recent CAG report also found that, while the conditional clearance granted to the project by the central Ministry of Environment and Forests required the Games village developer, DDA, to undertake the flood mitigation and abatement measures emerging from the studies, this was never done. Moreover, the CAG report also indi-cated a lack of compliance with the Supreme Court condition that an expert commit-tee monitor the construction of the Games village. During the development of the Games village, civil society, ordinarily a vigilant and active watchdog was reduced to being a mere spectator. Faced with city development linked to a mega-event that was a matter of ‘national prestige’, civil society was not ‘empowered’ enough to influence policy matters. One positive result from this event is that it highlighted many short-comings related to land zoning more generally. As a result of the public outcry and civil society organisation, the MoEF River Regulation Zone Bill may perhaps be revised as well as the zoning strategy contained within the Delhi Masterplan 2021. The Ministry of Environment and Forests has already constituted an Expert Group (MoEF 2011) for formulation of guidelines for the management of riverfronts through a River Regulation Zone.
3.3.3 Social ImpactsIt has been observed (Ramanathan 2005; Dupont 2008) that infrastructure modernisa-tion projects and beautification campaigns for the 2010 Delhi CWG were replicas of the urban restructuring processes undertaken in preparation for the 1982 Asian Games. For the 2010 CWG, new land was required only for the construction of the Games village, while the existing game stadiums were retrofitted. However, infrastructure-related land issues arose during preparations for the Commonwealth Games, which stemmed from indirect developmental factors such as connectivity and aesthetics. Civil society groups had raised concerns that most evictions were carried under the guise of city ‘beautifica-tion’ and urban renewal measures (which included construction of shopping malls). The displacements that resulted are difficult to estimate. According to one estimate (Baviskar 2006) about half the 1160 Jhuggi Jhopdi (JJ) Bastis (slum clusters) that housed three million people in 2000 – a quarter of Delhi’s population – were demolished by the year 2006. Shramik Sangathan, an NGO, estimated that some 30,000 to 40,000 families were displaced as a direct result of the Commonwealth Games. Annexure 4 tabulates some of the displacements that are directly attributable to CWG-related projects, using data provided by the Housing and Land Rights Network (HLRN). While it is difficult to attribute these directly to the mega-event, it can be inferred that delays in undertaking CWG-related planning (as discussed previously) might have accelerated some of these displace-ments. City authorities have argued that most of the displaced were ‘illegal squatters’, but the question remains as to how the illegal settlements were created in the first place. This phenomenon is not unique to Delhi or to India, but is common in developing countries.
To handle the relocations, the Delhi government prepared a list of 44 JJ clusters that would be relocated under the Rajiv Ratna Awas Yojna (Rajiv Gem Housing Scheme) pro-gramme of the government. Rajiv Ratna Awas Yojana is a centrally sponsored government scheme that was announced in September 2007 with the objective of promoting a ‘slum free city’. An amount of USD 364 million has been provided for low-cost housing facili-ties in the poorer sections in Delhi. Under the scheme, 50,000 four-storey houses will be constructed in the first phase, which will be allotted to people living below the poverty line. However, not more than 13,000 flats were constructed. The government also had identified resettlement sites in the outskirts of the city in Bawana, Holambi Kalan and Swada Ghevra. Civil society groups have reported that these resettlement colonies do not have access to basic amenities and that many people had not been allotted flats as they could not furnish the required documents. According to a civil society activist from Delhi Shramik Sangathan, “Currently the families relocated in Bawana are living in a small piece of land – in fact the condi-tions in Bawana are such that it could be said that it has resulted in creation of big ‘new slum’!” Relocation is a complex issue, and other factors are at work in these circumstances, includ-ing the Slum Policy Housing, which caps the domicile period, among others.
One factor that contributed to the mismanagement of these relocations was that de-partments in local bodies that deal with slum improvements do not have sufficient capac-ity or authority to direct or substantially influence the relocation activities per se. Develop-ment authorities emerge as powerful actors as they are not only better equipped in terms of capacity but also in terms of their legal status as ‘land owners’. In the case of the Delhi CWG, the Slum and Jhuggi Jhopadi Department (SJJD) under the Municipal Corporation of Delhi could not direct the decisions or actions of the Delhi Development Authority (DDA), which has become a major land-owning agency. In fact, the Slum and Jhuggi Jhopadi Department appears to have played no role at the municipal level, and while the SJJD and DDA do have different mandates, the growing role of the DDA since 1999 has raised concerns within civil society. In terms of policy, at the national level the Ministry of Urban Housing and Poverty Alleviation did not appear to have had a strong voice in social issues related to the CWG. Organisations in the international community dealing with slum upgrading also did not play a proactive role in preparations for the Delhi mega-event, even in terms of awareness or policy deliberations. Thus, in the cases where land became a social issue, institutional factors and legal status had a significant effect. These institutional factors are important and are indicative of the inadequate involvement by the institutions at the state, national and international levels more generally in the CWG. It could be said that the existing set of institutional arrangements and legal provisioning led to unequal power distribution among government departments at the domestic level.
In the run-up to the Games, civil society activists also raised concerns that funds from critical social sector spending including health, schooling, housing, and even
Horticulture on the Yamuna banks with the CWG Village visible in the background. (Source: Shailly Kedia)
2004 Initial concerns raised by civil society after modification of zoning in city plan
mar 2007 Appeal and organised movements by civil society
apr 2007 Petition by citizens
may 2007 Civil society public awareness event
aug 2007 Civil society appeal and Dharna (peaceful protest)
Sept 2007 CWG village preliminary preparatory work begins
nov 2007 Writ petition filed by Yamuna Jiye Abhiyaan
Figure 15 KEY EvENTS OF CIvIL SOCIETY PARTICIPATION RELATED TO THE GAMES vILLAGESource: Compiled from various sources
october 2000 CWG Village area october 2010 CWG Village area
Water
Dense vegetation
Scattered vegetation/agriculture
Sparse vegetation
Open area
Mixed
Built-up area
Figure 16 LAND USE CHANGE AROUND COMMONWEALTH GAMES vILLAGE AREA: 2000 AND 2010Source: Basic data from NASA; Google Earth
nov 2003 Delhi wins bid to host the XIX CWG Games
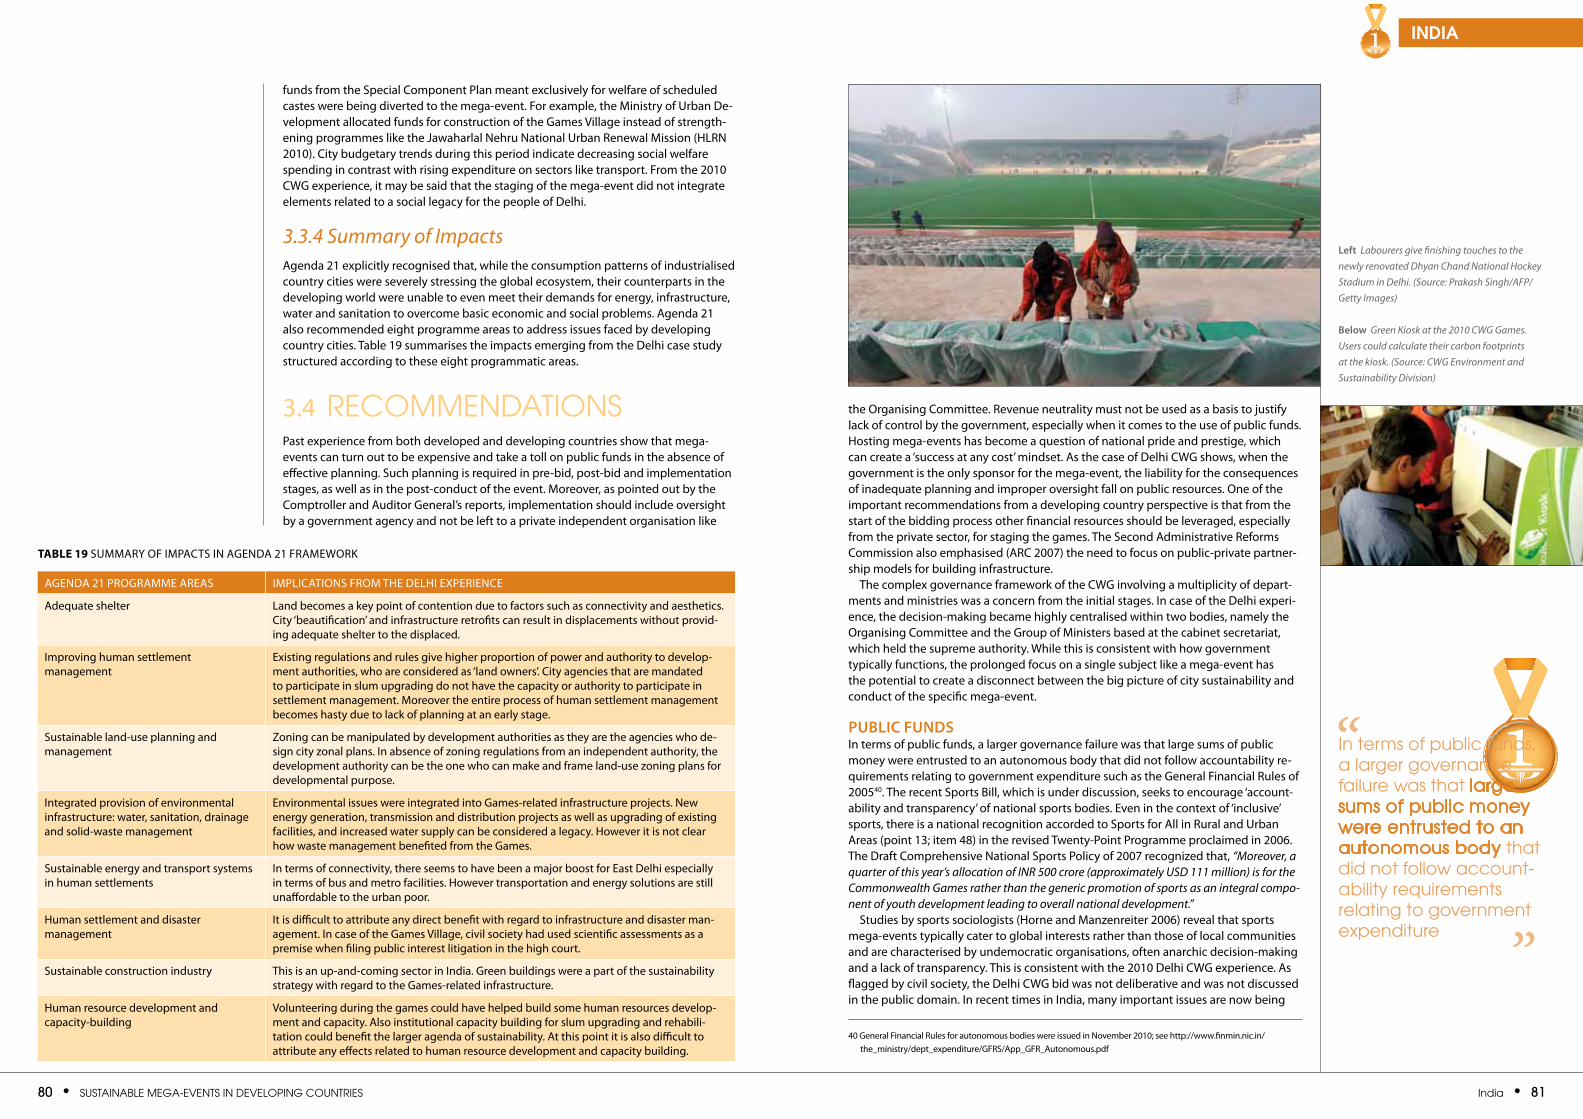
80 • SuStainable Mega-eventS in Developing CountrieS india • 81
india1funds from the Special Component Plan meant exclusively for welfare of scheduled castes were being diverted to the mega-event. For example, the Ministry of Urban De-velopment allocated funds for construction of the Games village instead of strength-ening programmes like the Jawaharlal Nehru National Urban Renewal Mission (HLRN 2010). City budgetary trends during this period indicate decreasing social welfare spending in contrast with rising expenditure on sectors like transport. From the 2010 CWG experience, it may be said that the staging of the mega-event did not integrate elements related to a social legacy for the people of Delhi.
3.3.4 Summary of ImpactsAgenda 21 explicitly recognised that, while the consumption patterns of industrialised country cities were severely stressing the global ecosystem, their counterparts in the developing world were unable to even meet their demands for energy, infrastructure, water and sanitation to overcome basic economic and social problems. Agenda 21 also recommended eight programme areas to address issues faced by developing country cities. Table 19 summarises the impacts emerging from the Delhi case study structured according to these eight programmatic areas.
3.4 reCoMMenDationSPast experience from both developed and developing countries show that mega-events can turn out to be expensive and take a toll on public funds in the absence of effective planning. Such planning is required in pre-bid, post-bid and implementation stages, as well as in the post-conduct of the event. Moreover, as pointed out by the Comptroller and Auditor General’s reports, implementation should include oversight by a government agency and not be left to a private independent organisation like
the Organising Committee. Revenue neutrality must not be used as a basis to justify lack of control by the government, especially when it comes to the use of public funds. Hosting mega-events has become a question of national pride and prestige, which can create a ‘success at any cost’ mindset. As the case of Delhi CWG shows, when the government is the only sponsor for the mega-event, the liability for the consequences of inadequate planning and improper oversight fall on public resources. One of the important recommendations from a developing country perspective is that from the start of the bidding process other financial resources should be leveraged, especially from the private sector, for staging the games. The Second Administrative Reforms Commission also emphasised (ARC 2007) the need to focus on public-private partner-ship models for building infrastructure.
The complex governance framework of the CWG involving a multiplicity of depart-ments and ministries was a concern from the initial stages. In case of the Delhi experi-ence, the decision-making became highly centralised within two bodies, namely the Organising Committee and the Group of Ministers based at the cabinet secretariat, which held the supreme authority. While this is consistent with how government typically functions, the prolonged focus on a single subject like a mega-event has the potential to create a disconnect between the big picture of city sustainability and conduct of the specific mega-event.
Public FundSIn terms of public funds, a larger governance failure was that large sums of public money were entrusted to an autonomous body that did not follow accountability re-quirements relating to government expenditure such as the General Financial Rules of 200540. The recent Sports Bill, which is under discussion, seeks to encourage ‘account-ability and transparency’ of national sports bodies. Even in the context of ‘inclusive’ sports, there is a national recognition accorded to Sports for All in Rural and Urban Areas (point 13; item 48) in the revised Twenty-Point Programme proclaimed in 2006. The Draft Comprehensive National Sports Policy of 2007 recognized that, “Moreover, a quarter of this year’s allocation of INR 500 crore (approximately USD 111 million) is for the Commonwealth Games rather than the generic promotion of sports as an integral compo-nent of youth development leading to overall national development.”
Studies by sports sociologists (Horne and Manzenreiter 2006) reveal that sports mega-events typically cater to global interests rather than those of local communities and are characterised by undemocratic organisations, often anarchic decision-making and a lack of transparency. This is consistent with the 2010 Delhi CWG experience. As flagged by civil society, the Delhi CWG bid was not deliberative and was not discussed in the public domain. In recent times in India, many important issues are now being
left Labourers give finishing touches to the newly renovated Dhyan Chand National Hockey Stadium in Delhi. (Source: Prakash Singh/AFP/Getty Images)
below Green Kiosk at the 2010 CWG Games. Users could calculate their carbon footprints at the kiosk. (Source: CWG Environment and Sustainability Division)
11in terms of public funds, a larger governance failure was that large sums of public money were entrusted to an autonomous body that did not follow account-ability requirements relating to government expenditure ”
“
AGENDA 21 PROGRAMME AREAS IMPLICATIONS FROM THE DELHI EXPERIENCE
Adequate shelter Land becomes a key point of contention due to factors such as connectivity and aesthetics. City ‘beautification’ and infrastructure retrofits can result in displacements without provid-ing adequate shelter to the displaced.
Improving human settlement management
Existing regulations and rules give higher proportion of power and authority to develop-ment authorities, who are considered as ‘land owners’. City agencies that are mandated to participate in slum upgrading do not have the capacity or authority to participate in settlement management. Moreover the entire process of human settlement management becomes hasty due to lack of planning at an early stage.
Sustainable land-use planning and management
Zoning can be manipulated by development authorities as they are the agencies who de-sign city zonal plans. In absence of zoning regulations from an independent authority, the development authority can be the one who can make and frame land-use zoning plans for developmental purpose.
Integrated provision of environmental infrastructure: water, sanitation, drainage and solid-waste management
Environmental issues were integrated into Games-related infrastructure projects. New energy generation, transmission and distribution projects as well as upgrading of existing facilities, and increased water supply can be considered a legacy. However it is not clear how waste management benefited from the Games.
Sustainable energy and transport systems in human settlements
In terms of connectivity, there seems to have been a major boost for East Delhi especially in terms of bus and metro facilities. However transportation and energy solutions are still unaffordable to the urban poor.
Human settlement and disaster management
It is difficult to attribute any direct benefit with regard to infrastructure and disaster man-agement. In case of the Games village, civil society had used scientific assessments as a premise when filing public interest litigation in the high court.
Sustainable construction industry This is an up-and-coming sector in India. Green buildings were a part of the sustainability strategy with regard to the Games-related infrastructure.
Human resource development and capacity-building
volunteering during the games could have helped build some human resources develop-ment and capacity. Also institutional capacity building for slum upgrading and rehabili-tation could benefit the larger agenda of sustainability. At this point it is also difficult to attribute any effects related to human resource development and capacity building.
Table 19 SUMMARY OF IMPACTS IN AGENDA 21 FRAMEWORK
40 General Financial Rules for autonomous bodies were issued in November 2010; see http://www.finmin.nic.in/ the_ministry/dept_expenditure/GFRS/App_GFR_Autonomous.pdf
82 • SuStainable Mega-eventS in Developing CountrieS india • 83
india1
11
have sufficient capacity, including departments dealing with rehabilitation. It is also important that environmental sustainability should not stop at carbon offset-
ting, and low carbon strategies should not be substituted for low emissions. Based on the Delhi experience, developing countries still need to strengthen waste management including debris disposal after construction activities. With the environment becoming an ever-higher priority on the development agenda, mega-events should not be environ-mental publicity stunts, but should lead to ‘greening’ rather than ‘green washing’.
The Delhi experience demonstrates that civil society organisations (CSOs) have been vigilant and have played a proactive role in providing a ‘voice’ for the poor; this has been also strengthened with the enactment of the Right to Information Act of 2005. However, civil society was not able to influence decision-making and implementation during the Commonwealth Games. This indicates a continuing lack of public participation that could shape policy, and future models for mega-events in developing countries should consider taking this into account. It is recommended that governance structure be established in ways that seek out views from civil society groups and knowledge communities, which is especially important during the pre-bid and post-bid stages. In India, holding public forums with the help of the National Advisory Council could satisfy this recommendation.
Social develoPmentSports for Development has been a subject of discussion in the international commu-nity. For example the 2005 World Summit Outcome (UNGA 2006) document stated: “We underline that sports can foster peace and development and can contribute to an atmosphere of tolerance and understanding, and we encourage discussions in the General Assembly for proposals leading to a plan of action on sport and development”. The 2010 Delhi Common-wealth Games experience clearly demonstrates that developing countries like India, with its complex urban issues, face challenges in planning and resource mobilisation, which limit their ability to truly realise the potential of mega-events as a development tool. With regard to the larger development debate, it may be said that mega-events have yet to find their place in mainstream international policy discourses around sustainability, even more so in the context of developing countries. An important question that arises with regard to the larger picture is whether the international development community could have played a more proactive role. In the Delhi experience, international organisations like the Global Environment Facility, United Nations Environment Programme and the United Nations Development Programme have played a role in environmental awareness, however there was a ‘role deficit’ at the planning and execution stages from international organisations dealing with social issues like slum upgrading that are also important to address when it comes to building ‘adaptive capacity’.
For Delhi, the 2010 Commonwealth Games did emerge as an accelerator for infrastruc-ture, especially in the transportation sector at the local (city) level which has the potential to benefit the expanding urban agglomeration around Delhi. Transportation-linked infrastruc-ture projects as well as small projects linked to increasing supplies of energy and water can be considered a beneficial legacy. Apart from awareness-raising initiatives, it is not clear what the environmental legacy of the Games will be in the long run. The social legacy will depend on the status of housing programmes like the Rajiv Gandhi Awaas Yojana that are geared for the economically weaker sections of the society. At the national level, key devel-opment concerns that emerged were linked to public funds and huge cost over-runs.
The successful conduct of the Games indicates that developing countries like India can host such events. For the future, developing countries with collaboration from knowledge communities, the international development community and civil society could engage in a thorough ex-ante exercise on the potential impact of the Games. We hope that the Delhi experience informs decision-making in other developing countries as well as the international community and relevant stakeholders for designing strategies related to mega-events that realise their potential as tools to enhance sustainability in develop-ing countries. Other inter-disciplinary collaborative research projects would strengthen knowledge base of developing countries in emerging fields of policy and practice. Finally from the Delhi experience, it may be said that staging sporting mega-events in develop-ing countries should incorporate benefits related to all the three pillars of sustainability, with governance and institutions in place that have the mandate and resources to drive the sustainability agenda. This is for national governments to realise, the interna-tional community to awaken to, and the two to work in collaboration for realising the potential of mega-events in developing countries.
Socio-economic legacies in developing countries will depend on the success of housing pro-grammes for the economically weaker sections of the society. (Source: Shailly Kedia)
discussed in public domain before being launched by the government, such as the National Food Security Bill, which was put into the public domain to solicit comments. Perhaps such a procedure could have been followed for the CWG too, with involvement from national agencies like the National Advisory Council (NAC). The 2010 Delhi CWG, took place in contravention of democratic governance and planning processes, including zoning modifications in Delhi Master Plan 2021 and the very bid of the Games itself. With such substantial public funds involved, it is worthwhile to facilitate a public discussion on hosting of the events.
land uSaGe and environmental SuStainabilityLand emerges as a key concern on both the social and environment fronts. Preparations for the CWG led to many displacements as well as changes to land-use zoning, despite civil society objections and non-compliance with conditional environmental clearances by the infrastructure executing agency. Moreover, disaster management does not seem to have been integrated into infrastructure planning. Alternative options like portable cabins should be considered as infrastructure alternatives in such cases. While this may seem relatively insignificant in the scope of Delhi’s overall development, if not curtailed it may lead to a domino effect with future infrastructure projects following this example. Given this context, a river regulation zoning strategy is important to put in place at the national level that incorporates the ecological aspects of land-use when it comes to infra-structure development on riverbanks.
In terms of ‘inclusivity’, mega-events have amply demonstrated that ‘global consumers’ are preferred to ‘local publics’. This is not only true at the individual citizen level but is also true at an agency level, where the power balance in favour of games-related agencies (including infrastructure development authorities) has undermined authority of agen-cies related to urban housing and poverty eradication. Even Article IX A of the Indian Constitution allocates power to Municipal Bodies; the Second ARC also raises the concern that infrastructure development agencies must be able to transfer assets like housing to municipal corporations. However all this is possible only if municipal bodies (Kumar 2011)
Women’s 5000 metres final at Jawaharlal Nehru Stadium in Delhi. The successful hosting of the Games indicates that developing countries like India can stage such events. (Source: Mark Dadswell/Getty Images)
land emerges as a key concern on both the social and environ-ment fronts. prepara-tions ... led to many displacements as well as changes to land-use zoning, despite civil society objections and non-compliance with conditional environmen-tal clearances ”
“
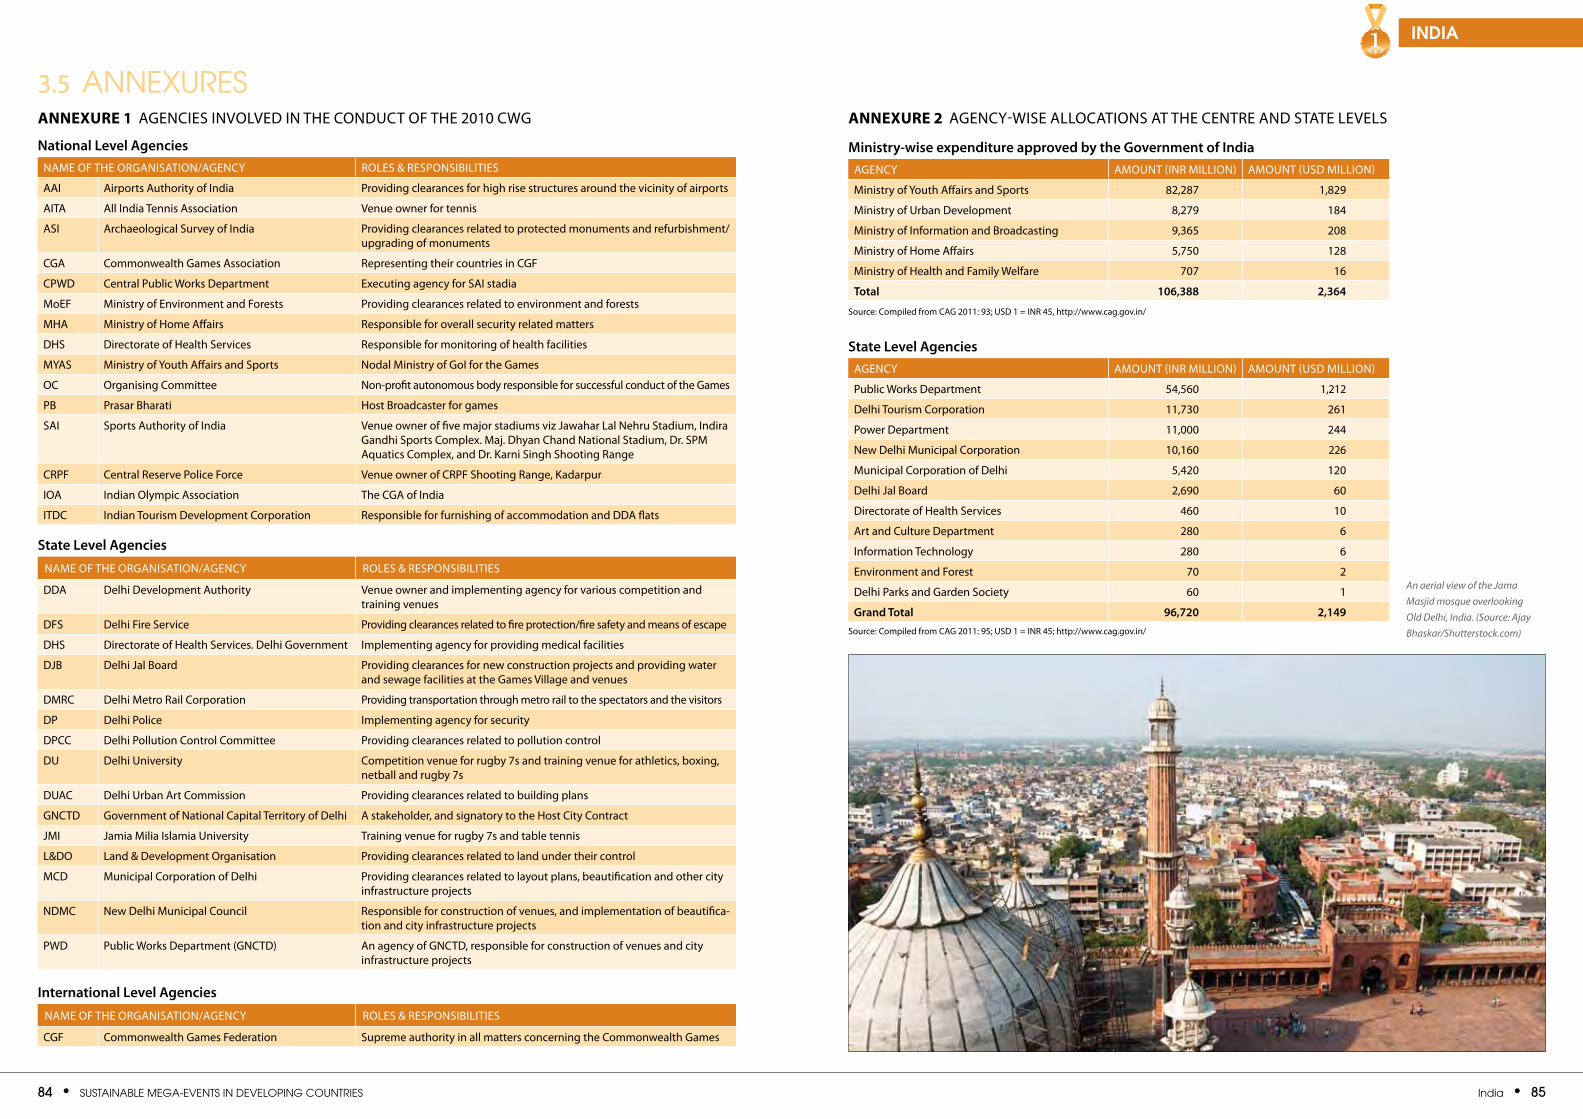
84 • SuStainable Mega-eventS in Developing CountrieS india • 85
india1
national level agenciesNAME OF THE ORGANISATION/AGENCY ROLES & RESPONSIBILITIES
AAI Airports Authority of India Providing clearances for high rise structures around the vicinity of airports
AITA All India Tennis Association venue owner for tennis
ASI Archaeological Survey of India Providing clearances related to protected monuments and refurbishment/upgrading of monuments
CGA Commonwealth Games Association Representing their countries in CGF
CPWD Central Public Works Department Executing agency for SAI stadia
MoEF Ministry of Environment and Forests Providing clearances related to environment and forests
MHA Ministry of Home Affairs Responsible for overall security related matters
DHS Directorate of Health Services Responsible for monitoring of health facilities
MYAS Ministry of Youth Affairs and Sports Nodal Ministry of GoI for the Games
OC Organising Committee Non-profit autonomous body responsible for successful conduct of the Games
PB Prasar Bharati Host Broadcaster for games
SAI Sports Authority of India venue owner of five major stadiums viz Jawahar Lal Nehru Stadium, Indira Gandhi Sports Complex. Maj. Dhyan Chand National Stadium, Dr. SPM Aquatics Complex, and Dr. Karni Singh Shooting Range
CRPF Central Reserve Police Force venue owner of CRPF Shooting Range, Kadarpur
IOA Indian Olympic Association The CGA of India
ITDC Indian Tourism Development Corporation Responsible for furnishing of accommodation and DDA flats
State level agencies
NAME OF THE ORGANISATION/AGENCY ROLES & RESPONSIBILITIES
DDA Delhi Development Authority venue owner and implementing agency for various competition and training venues
DFS Delhi Fire Service Providing clearances related to fire protection/fire safety and means of escape
DHS Directorate of Health Services. Delhi Government Implementing agency for providing medical facilities
DJB Delhi Jal Board Providing clearances for new construction projects and providing water and sewage facilities at the Games village and venues
DMRC Delhi Metro Rail Corporation Providing transportation through metro rail to the spectators and the visitors
DP Delhi Police Implementing agency for security
DPCC Delhi Pollution Control Committee Providing clearances related to pollution control
DU Delhi University Competition venue for rugby 7s and training venue for athletics, boxing, netball and rugby 7s
DUAC Delhi Urban Art Commission Providing clearances related to building plans
GNCTD Government of National Capital Territory of Delhi A stakeholder, and signatory to the Host City Contract
JMI Jamia Milia Islamia University Training venue for rugby 7s and table tennis
L&DO Land & Development Organisation Providing clearances related to land under their control
MCD Municipal Corporation of Delhi Providing clearances related to layout plans, beautification and other city infrastructure projects
NDMC New Delhi Municipal Council Responsible for construction of venues, and implementation of beautifica-tion and city infrastructure projects
PWD Public Works Department (GNCTD) An agency of GNCTD, responsible for construction of venues and city infrastructure projects
international level agencies
NAME OF THE ORGANISATION/AGENCY ROLES & RESPONSIBILITIES
CGF Commonwealth Games Federation Supreme authority in all matters concerning the Commonwealth Games
3.5 anneXureSannexure 1 AGENCIES INvOLvED IN THE CONDUCT OF THE 2010 CWG annexure 2 AGENCY-WISE ALLOCATIONS AT THE CENTRE AND STATE LEvELS
ministry-wise expenditure approved by the Government of india AGENCY AMOUNT (INR MILLION) AMOUNT (USD MILLION)
Ministry of Youth Affairs and Sports 82,287 1,829
Ministry of Urban Development 8,279 184
Ministry of Information and Broadcasting 9,365 208
Ministry of Home Affairs 5,750 128
Ministry of Health and Family Welfare 707 16
total 106,388 2,364
Source: Compiled from CAG 2011: 93; USD 1 = INR 45, http://www.cag.gov.in/
State level agenciesAGENCY AMOUNT (INR MILLION) AMOUNT (USD MILLION)
Public Works Department 54,560 1,212
Delhi Tourism Corporation 11,730 261
Power Department 11,000 244
New Delhi Municipal Corporation 10,160 226
Municipal Corporation of Delhi 5,420 120
Delhi Jal Board 2,690 60
Directorate of Health Services 460 10
Art and Culture Department 280 6
Information Technology 280 6
Environment and Forest 70 2
Delhi Parks and Garden Society 60 1
Grand total 96,720 2,149Source: Compiled from CAG 2011: 95; USD 1 = INR 45; http://www.cag.gov.in/
An aerial view of the Jama Masjid mosque overlooking Old Delhi, India. (Source: Ajay Bhaskar/Shutterstock.com)
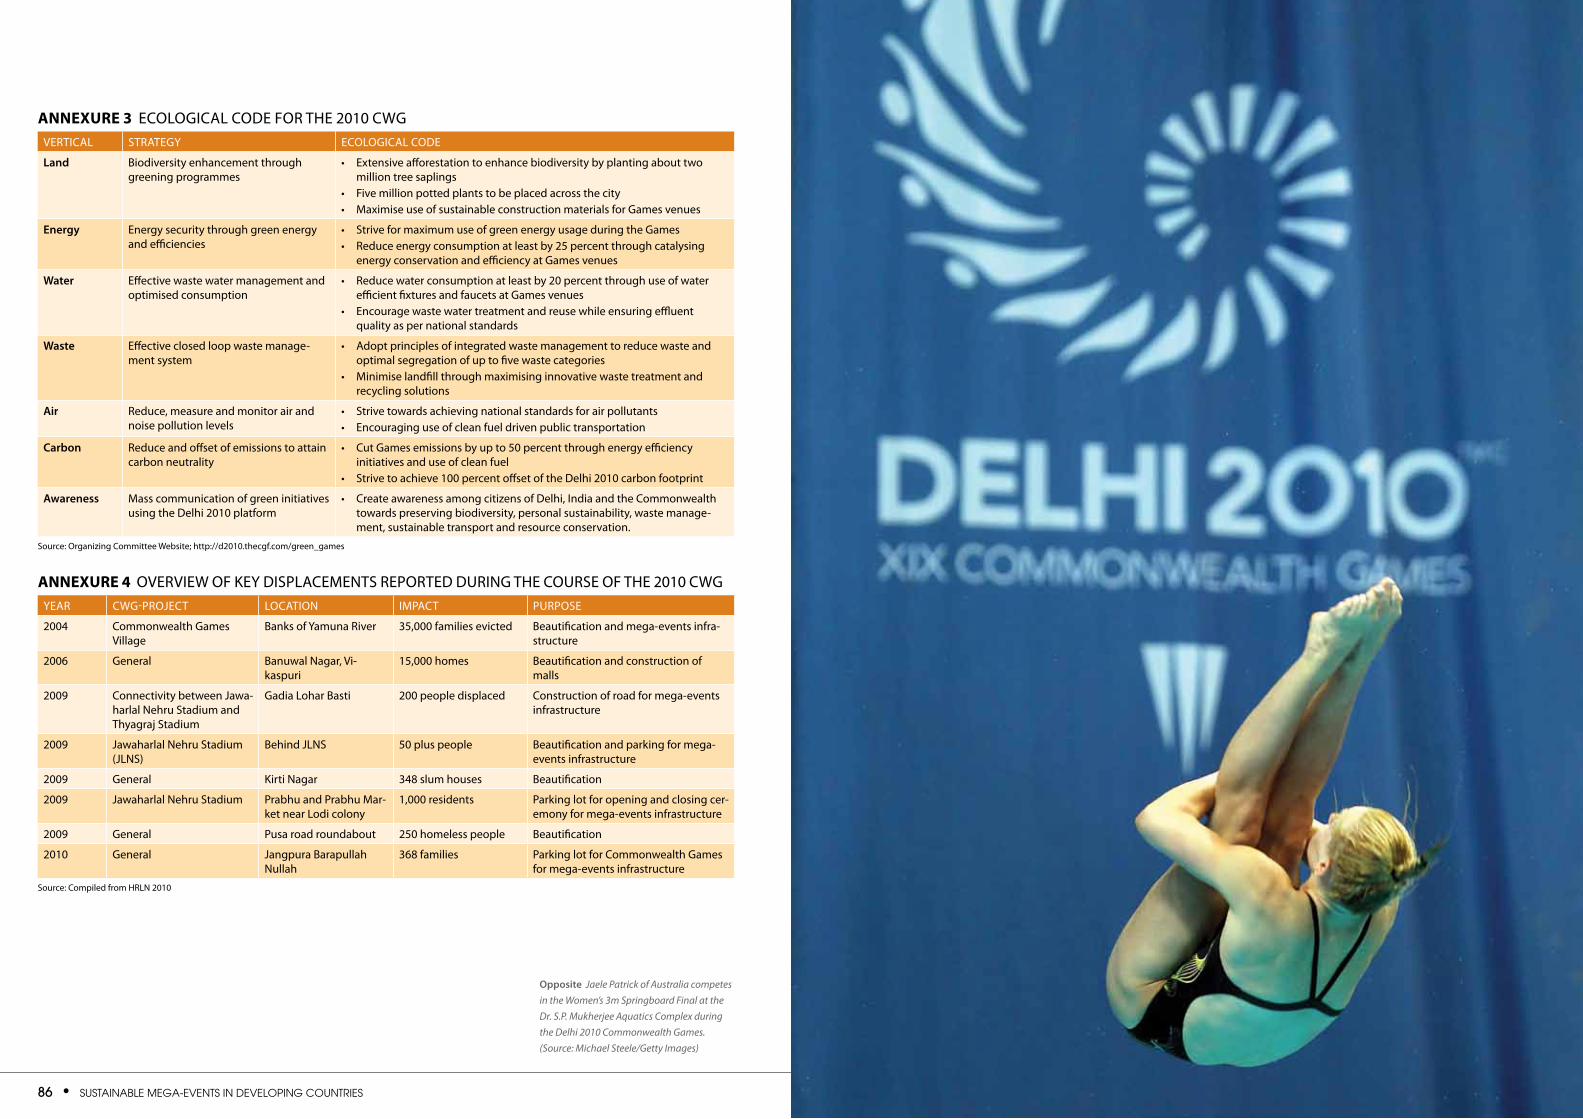
86 • SuStainable Mega-eventS in Developing CountrieS india • 87
india1
vERTICAL STRATEGY ECOLOGICAL CODE
land Biodiversity enhancement through greening programmes
• Extensive afforestation to enhance biodiversity by planting about two million tree saplings
• Five million potted plants to be placed across the city• Maximise use of sustainable construction materials for Games venues
energy Energy security through green energy and efficiencies
• Strive for maximum use of green energy usage during the Games• Reduce energy consumption at least by 25 percent through catalysing
energy conservation and efficiency at Games venues
Water Effective waste water management and optimised consumption
• Reduce water consumption at least by 20 percent through use of water efficient fixtures and faucets at Games venues
• Encourage waste water treatment and reuse while ensuring effluent quality as per national standards
Waste Effective closed loop waste manage-ment system
• Adopt principles of integrated waste management to reduce waste and optimal segregation of up to five waste categories
• Minimise landfill through maximising innovative waste treatment and recycling solutions
air Reduce, measure and monitor air and noise pollution levels
• Strive towards achieving national standards for air pollutants• Encouraging use of clean fuel driven public transportation
carbon Reduce and offset of emissions to attain carbon neutrality
• Cut Games emissions by up to 50 percent through energy efficiency initiatives and use of clean fuel
• Strive to achieve 100 percent offset of the Delhi 2010 carbon footprint
awareness Mass communication of green initiatives using the Delhi 2010 platform
• Create awareness among citizens of Delhi, India and the Commonwealth towards preserving biodiversity, personal sustainability, waste manage-ment, sustainable transport and resource conservation.
Source: Organizing Committee Website; http://d2010.thecgf.com/green_games
annexure 3 ECOLOGICAL CODE FOR THE 2010 CWG
annexure 4 OvERvIEW OF KEY DISPLACEMENTS REPORTED DURING THE COURSE OF THE 2010 CWGYEAR CWG-PROJECT LOCATION IMPACT PURPOSE
2004 Commonwealth Games village
Banks of Yamuna River 35,000 families evicted Beautification and mega-events infra-structure
2006 General Banuwal Nagar, vi-kaspuri
15,000 homes Beautification and construction of malls
2009 Connectivity between Jawa-harlal Nehru Stadium and Thyagraj Stadium
Gadia Lohar Basti 200 people displaced Construction of road for mega-events infrastructure
2009 Jawaharlal Nehru Stadium (JLNS)
Behind JLNS 50 plus people Beautification and parking for mega-events infrastructure
2009 General Kirti Nagar 348 slum houses Beautification
2009 Jawaharlal Nehru Stadium Prabhu and Prabhu Mar-ket near Lodi colony
1,000 residents Parking lot for opening and closing cer-emony for mega-events infrastructure
2009 General Pusa road roundabout 250 homeless people Beautification
2010 General Jangpura Barapullah Nullah
368 families Parking lot for Commonwealth Games for mega-events infrastructure
Source: Compiled from HRLN 2010
opposite Jaele Patrick of Australia competes in the Women’s 3m Springboard Final at the Dr. S.P. Mukherjee Aquatics Complex during the Delhi 2010 Commonwealth Games. (Source: Michael Steele/Getty Images)
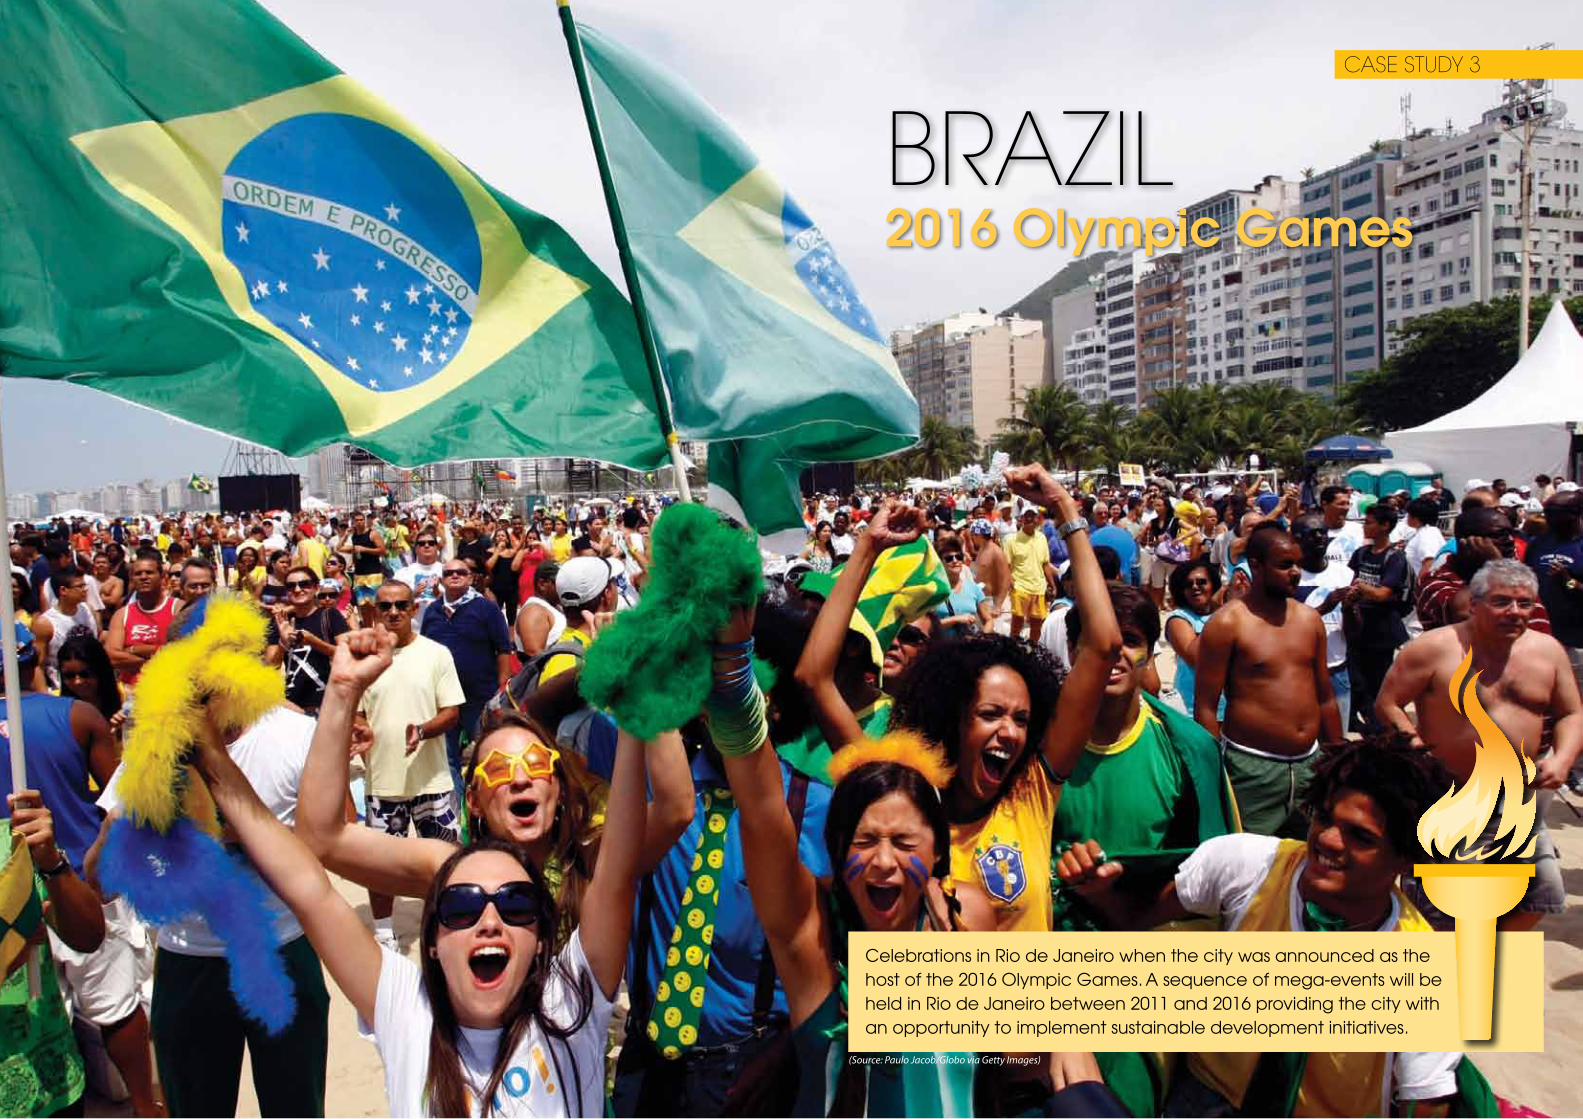
88 • SuStainable Mega-eventS in Developing CountrieS brazil • 89
brazil
2016 Olympic Gamesbrazil
case study 3
Celebrations in rio de Janeiro when the city was announced as the host of the 2016 olympic games. a sequence of mega-events will be held in rio de Janeiro between 2011 and 2016 providing the city with an opportunity to implement sustainable development initiatives.
(Source: Paulo Jacob/Globo via Getty Images)
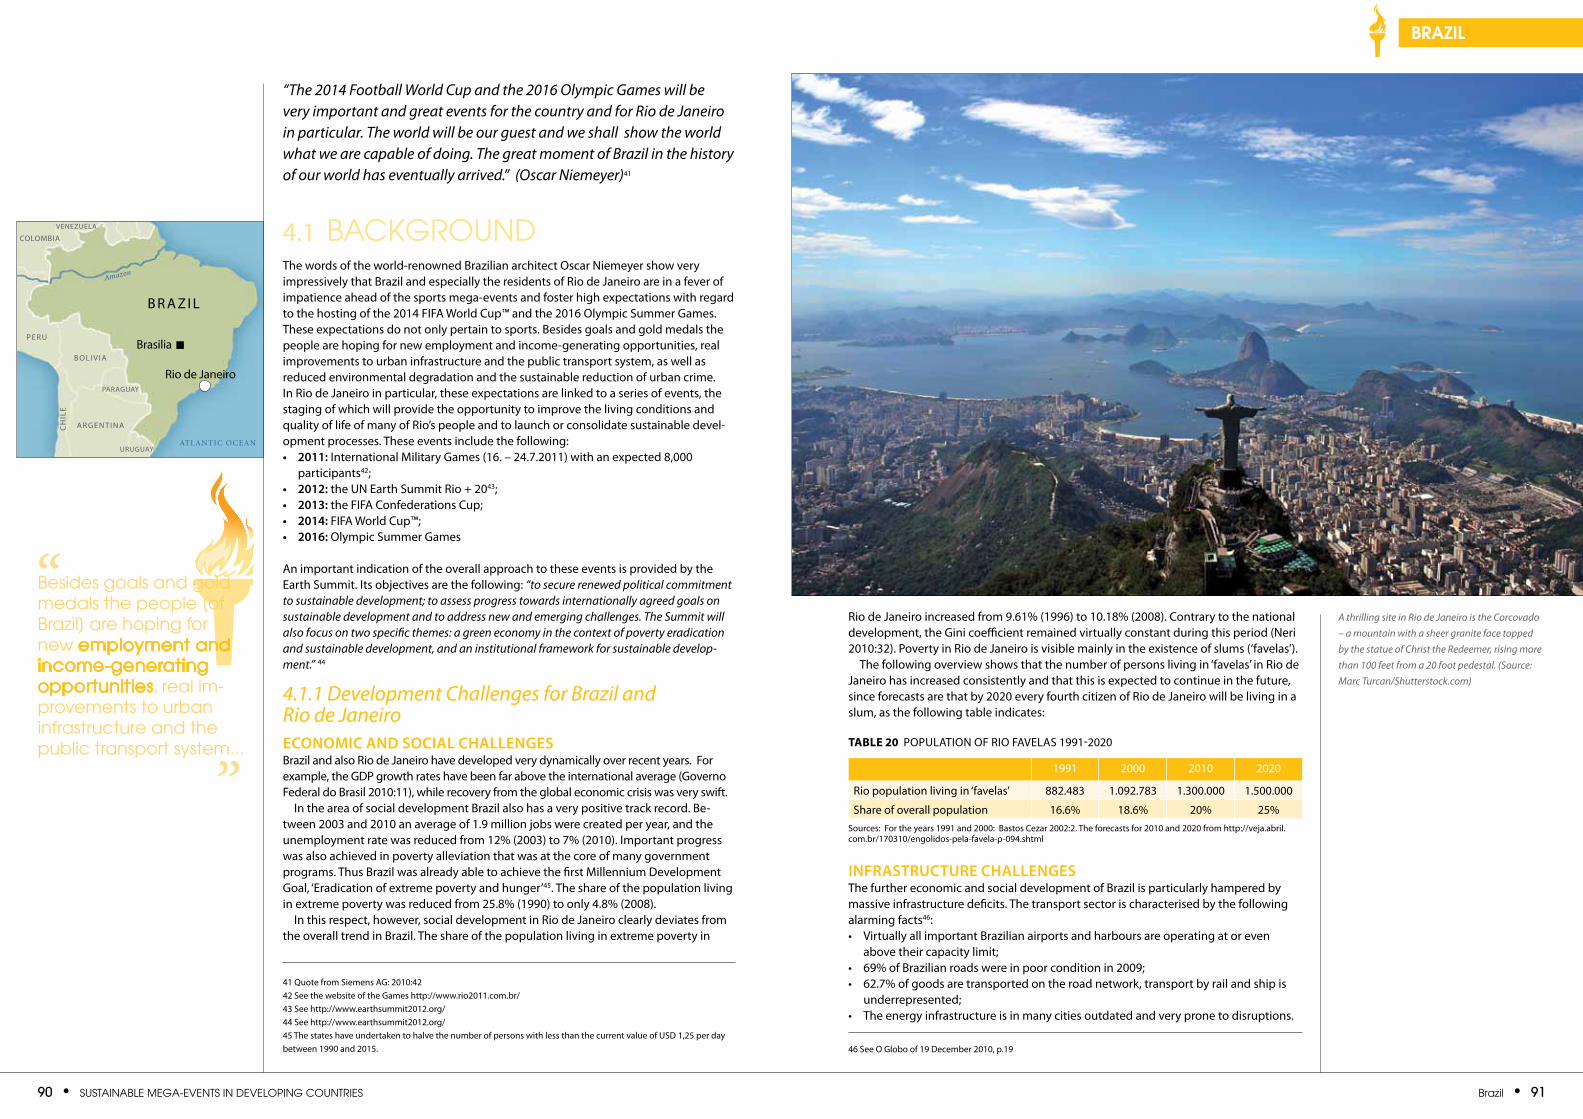
90 • SuStainable Mega-eventS in Developing CountrieS brazil • 91
brazil
“The 2014 Football World Cup and the 2016 Olympic Games will be very important and great events for the country and for Rio de Janeiro in particular. The world will be our guest and we shall show the world what we are capable of doing. The great moment of Brazil in the history of our world has eventually arrived.” (Oscar Niemeyer)41
4.1 baCkgrounDThe words of the world-renowned Brazilian architect Oscar Niemeyer show very impressively that Brazil and especially the residents of Rio de Janeiro are in a fever of impatience ahead of the sports mega-events and foster high expectations with regard to the hosting of the 2014 FIFA World Cup™ and the 2016 Olympic Summer Games. These expectations do not only pertain to sports. Besides goals and gold medals the people are hoping for new employment and income-generating opportunities, real improvements to urban infrastructure and the public transport system, as well as reduced environmental degradation and the sustainable reduction of urban crime. In Rio de Janeiro in particular, these expectations are linked to a series of events, the staging of which will provide the opportunity to improve the living conditions and quality of life of many of Rio’s people and to launch or consolidate sustainable devel-opment processes. These events include the following: • 2011: International Military Games (16. – 24.7.2011) with an expected 8,000
participants42; • 2012: the UN Earth Summit Rio + 2043;• 2013: the FIFA Confederations Cup; • 2014: FIFA World Cup™; • 2016: Olympic Summer Games
An important indication of the overall approach to these events is provided by the Earth Summit. Its objectives are the following: “to secure renewed political commitment to sustainable development; to assess progress towards internationally agreed goals on sustainable development and to address new and emerging challenges. The Summit will also focus on two specific themes: a green economy in the context of poverty eradication and sustainable development, and an institutional framework for sustainable develop-ment.” 44
4.1.1 Development Challenges for Brazil and Rio de JaneiroEconomicandSocialchallEngESBrazil and also Rio de Janeiro have developed very dynamically over recent years. For example, the GDP growth rates have been far above the international average (Governo Federal do Brasil 2010:11), while recovery from the global economic crisis was very swift.
In the area of social development Brazil also has a very positive track record. Be-tween 2003 and 2010 an average of 1.9 million jobs were created per year, and the unemployment rate was reduced from 12% (2003) to 7% (2010). Important progress was also achieved in poverty alleviation that was at the core of many government programs. Thus Brazil was already able to achieve the first Millennium Development Goal, ‘Eradication of extreme poverty and hunger’45. The share of the population living in extreme poverty was reduced from 25.8% (1990) to only 4.8% (2008).
In this respect, however, social development in Rio de Janeiro clearly deviates from the overall trend in Brazil. The share of the population living in extreme poverty in
Rio de Janeiro increased from 9.61% (1996) to 10.18% (2008). Contrary to the national development, the Gini coefficient remained virtually constant during this period (Neri 2010:32). Poverty in Rio de Janeiro is visible mainly in the existence of slums (‘favelas’).
The following overview shows that the number of persons living in ‘favelas’ in Rio de Janeiro has increased consistently and that this is expected to continue in the future, since forecasts are that by 2020 every fourth citizen of Rio de Janeiro will be living in a slum, as the following table indicates:
infraStructurEchallEngESThe further economic and social development of Brazil is particularly hampered by massive infrastructure deficits. The transport sector is characterised by the following alarming facts46: • Virtually all important Brazilian airports and harbours are operating at or even
above their capacity limit; • 69% of Brazilian roads were in poor condition in 2009; • 62.7% of goods are transported on the road network, transport by rail and ship is
underrepresented; • The energy infrastructure is in many cities outdated and very prone to disruptions.
41 Quote from Siemens AG: 2010:4242 See the website of the Games http://www.rio2011.com.br/ 43 See http://www.earthsummit2012.org/ 44 See http://www.earthsummit2012.org/45 The states have undertaken to halve the number of persons with less than the current value of USD 1,25 per day between 1990 and 2015.
A thrilling site in Rio de Janeiro is the Corcovado – a mountain with a sheer granite face topped by the statue of Christ the Redeemer, rising more than 100 feet from a 20 foot pedestal. (Source: Marc Turcan/Shutterstock.com)
besides goals and gold medals the people [of brazil] are hoping for new employment and income-generating opportunities, real im-provements to urban infrastructure and the public transport system...
”
“
Table 20 POPUlATION OF RIO FAVElAS 1991-2020
1991 2000 2010 2020
Rio population living in ‘favelas’ 882.483 1.092.783 1.300.000 1.500.000
Share of overall population 16.6% 18.6% 20% 25%Sources: For the years 1991 and 2000: Bastos Cezar 2002:2. The forecasts for 2010 and 2020 from http://veja.abril.com.br/170310/engolidos-pela-favela-p-094.shtml
46 See O Globo of 19 December 2010, p.19
Brasilia
B R A z I l
A R G E N T I N ACh
IlE
P E R U
B O l I V I A
PARAGUAy
URUGUAy
COlOMBIA
VENEzUElA
Rio de Janeiro
atlantic ocean
Amazon
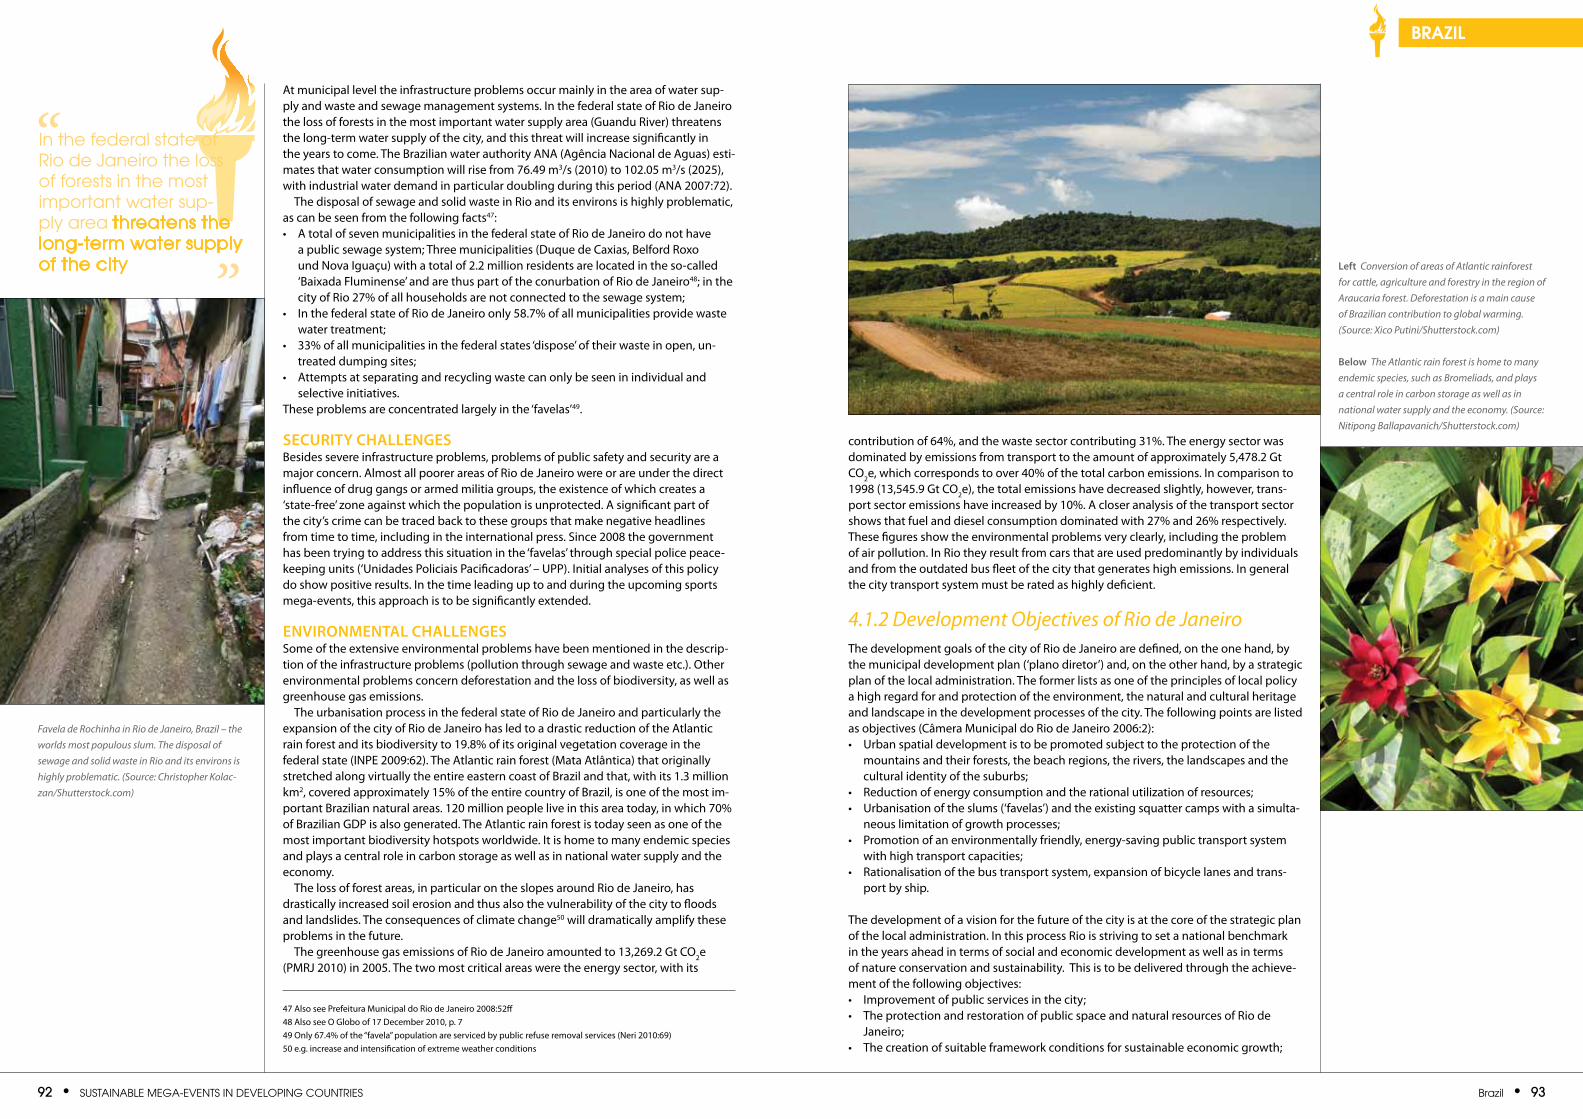
92 • SuStainable Mega-eventS in Developing CountrieS brazil • 93
brazil
At municipal level the infrastructure problems occur mainly in the area of water sup-ply and waste and sewage management systems. In the federal state of Rio de Janeiro the loss of forests in the most important water supply area (Guandu River) threatens the long-term water supply of the city, and this threat will increase significantly in the years to come. The Brazilian water authority ANA (Agência Nacional de Aguas) esti-mates that water consumption will rise from 76.49 m3/s (2010) to 102.05 m3/s (2025), with industrial water demand in particular doubling during this period (ANA 2007:72).
The disposal of sewage and solid waste in Rio and its environs is highly problematic, as can be seen from the following facts47: • A total of seven municipalities in the federal state of Rio de Janeiro do not have
a public sewage system; Three municipalities (Duque de Caxias, Belford Roxo und Nova Iguaçu) with a total of 2.2 million residents are located in the so-called ‘Baixada Fluminense’ and are thus part of the conurbation of Rio de Janeiro48; in the city of Rio 27% of all households are not connected to the sewage system;
• In the federal state of Rio de Janeiro only 58.7% of all municipalities provide waste water treatment;
• 33% of all municipalities in the federal states ‘dispose’ of their waste in open, un-treated dumping sites;
• Attempts at separating and recycling waste can only be seen in individual and selective initiatives.
These problems are concentrated largely in the ‘favelas’49.
SEcuritychallEngESBesides severe infrastructure problems, problems of public safety and security are a major concern. Almost all poorer areas of Rio de Janeiro were or are under the direct influence of drug gangs or armed militia groups, the existence of which creates a ‘state-free’ zone against which the population is unprotected. A significant part of the city’s crime can be traced back to these groups that make negative headlines from time to time, including in the international press. Since 2008 the government has been trying to address this situation in the ‘favelas’ through special police peace-keeping units (‘Unidades Policiais Pacificadoras’ – UPP). Initial analyses of this policy do show positive results. In the time leading up to and during the upcoming sports mega-events, this approach is to be significantly extended.
EnvironmEntalchallEngESSome of the extensive environmental problems have been mentioned in the descrip-tion of the infrastructure problems (pollution through sewage and waste etc.). Other environmental problems concern deforestation and the loss of biodiversity, as well as greenhouse gas emissions.
The urbanisation process in the federal state of Rio de Janeiro and particularly the expansion of the city of Rio de Janeiro has led to a drastic reduction of the Atlantic rain forest and its biodiversity to 19.8% of its original vegetation coverage in the federal state (INPE 2009:62). The Atlantic rain forest (Mata Atlântica) that originally stretched along virtually the entire eastern coast of Brazil and that, with its 1.3 million km2, covered approximately 15% of the entire country of Brazil, is one of the most im-portant Brazilian natural areas. 120 million people live in this area today, in which 70% of Brazilian GDP is also generated. The Atlantic rain forest is today seen as one of the most important biodiversity hotspots worldwide. It is home to many endemic species and plays a central role in carbon storage as well as in national water supply and the economy.
The loss of forest areas, in particular on the slopes around Rio de Janeiro, has drastically increased soil erosion and thus also the vulnerability of the city to floods and landslides. The consequences of climate change50 will dramatically amplify these problems in the future.
The greenhouse gas emissions of Rio de Janeiro amounted to 13,269.2 Gt CO2e (PMRJ 2010) in 2005. The two most critical areas were the energy sector, with its
contribution of 64%, and the waste sector contributing 31%. The energy sector was dominated by emissions from transport to the amount of approximately 5,478.2 Gt CO2e, which corresponds to over 40% of the total carbon emissions. In comparison to 1998 (13,545.9 Gt CO2e), the total emissions have decreased slightly, however, trans-port sector emissions have increased by 10%. A closer analysis of the transport sector shows that fuel and diesel consumption dominated with 27% and 26% respectively. These figures show the environmental problems very clearly, including the problem of air pollution. In Rio they result from cars that are used predominantly by individuals and from the outdated bus fleet of the city that generates high emissions. In general the city transport system must be rated as highly deficient.
4.1.2 Development Objectives of Rio de JaneiroThe development goals of the city of Rio de Janeiro are defined, on the one hand, by the municipal development plan (‘plano diretor’) and, on the other hand, by a strategic plan of the local administration. The former lists as one of the principles of local policy a high regard for and protection of the environment, the natural and cultural heritage and landscape in the development processes of the city. The following points are listed as objectives (Câmera Municipal do Rio de Janeiro 2006:2):• Urban spatial development is to be promoted subject to the protection of the
mountains and their forests, the beach regions, the rivers, the landscapes and the cultural identity of the suburbs;
• Reduction of energy consumption and the rational utilization of resources; • Urbanisation of the slums (‘favelas’) and the existing squatter camps with a simulta-
neous limitation of growth processes; • Promotion of an environmentally friendly, energy-saving public transport system
with high transport capacities; • Rationalisation of the bus transport system, expansion of bicycle lanes and trans-
port by ship.
The development of a vision for the future of the city is at the core of the strategic plan of the local administration. In this process Rio is striving to set a national benchmark in the years ahead in terms of social and economic development as well as in terms of nature conservation and sustainability. This is to be delivered through the achieve-ment of the following objectives:• Improvement of public services in the city; • The protection and restoration of public space and natural resources of Rio de
Janeiro; • The creation of suitable framework conditions for sustainable economic growth;
left Conversion of areas of Atlantic rainforest for cattle, agriculture and forestry in the region of Araucaria forest. Deforestation is a main cause of Brazilian contribution to global warming. (Source: Xico Putini/Shutterstock.com)
Below The Atlantic rain forest is home to many endemic species, such as Bromeliads, and plays a central role in carbon storage as well as in national water supply and the economy. (Source: Nitipong Ballapavanich/Shutterstock.com)
in the federal state of rio de Janeiro the loss of forests in the most important water sup-ply area threatens the long-term water supply of the city ”
“
47 Also see Prefeitura Municipal do Rio de Janeiro 2008:52ff48 Also see O Globo of 17 December 2010, p. 749 Only 67.4% of the “favela” population are serviced by public refuse removal services (Neri 2010:69)50 e.g. increase and intensification of extreme weather conditions
Favela de Rochinha in Rio de Janeiro, Brazil – the worlds most populous slum. The disposal of sewage and solid waste in Rio and its environs is highly problematic. (Source: Christopher Kolac-zan/Shutterstock.com)
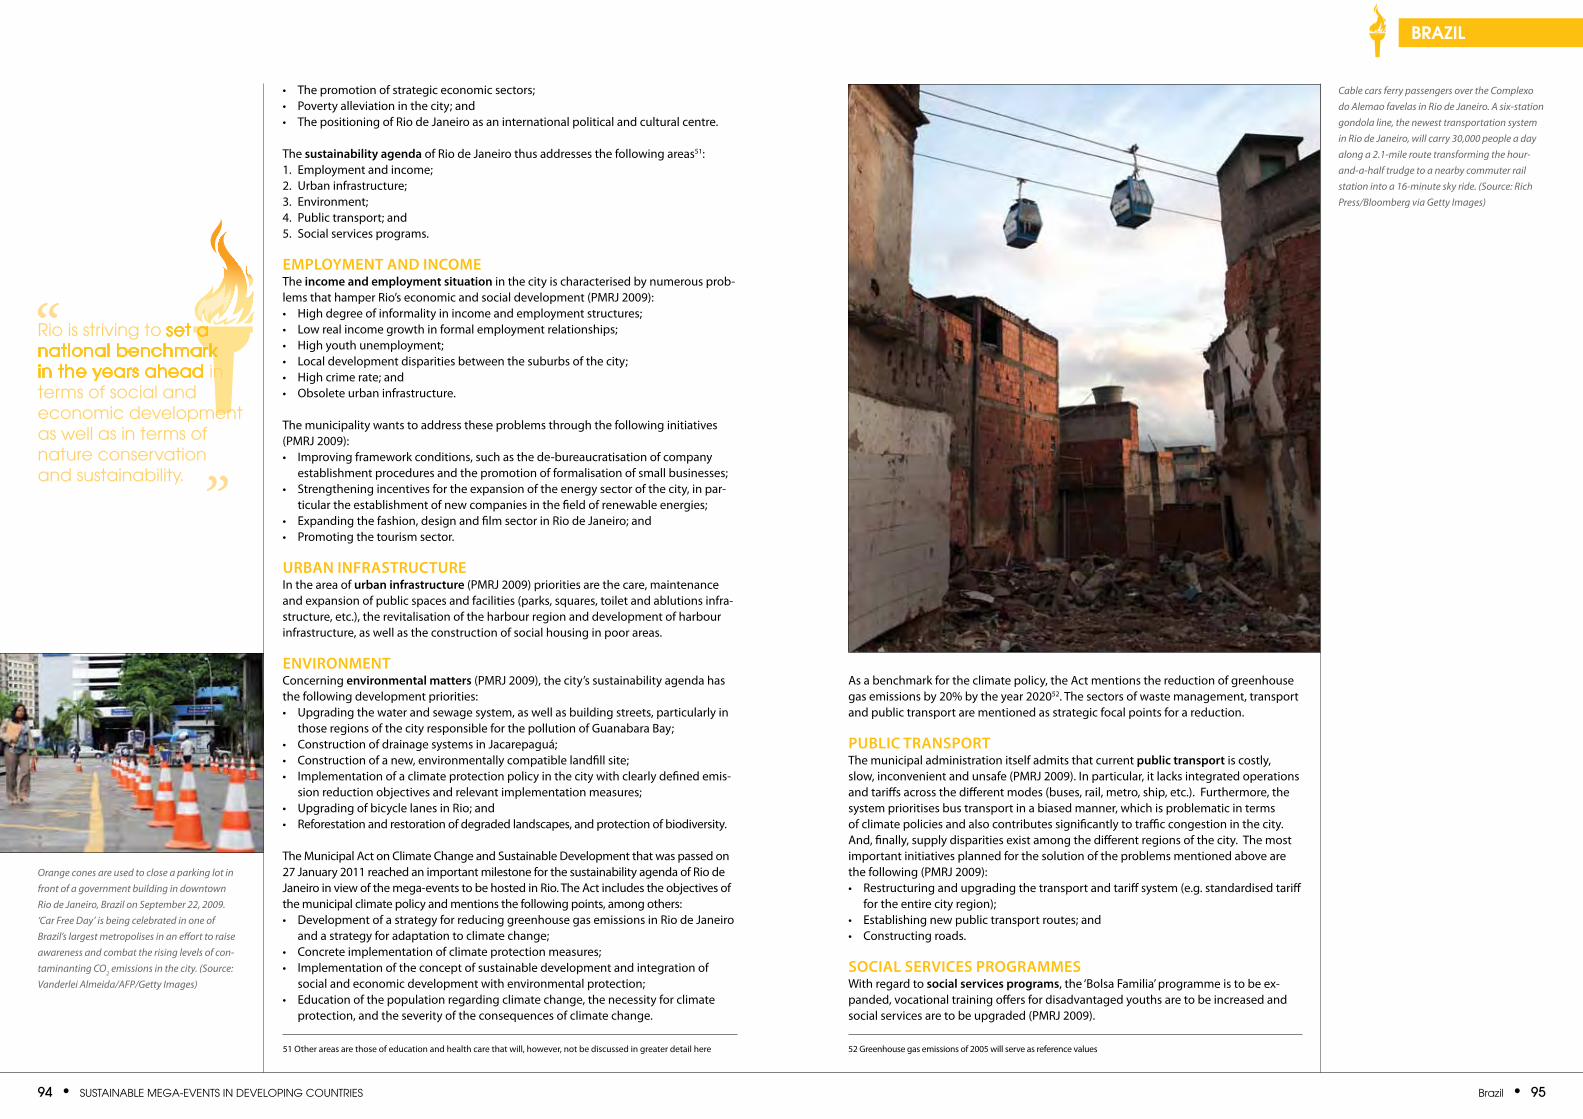
94 • SuStainable Mega-eventS in Developing CountrieS brazil • 95
brazil
• The promotion of strategic economic sectors; • Poverty alleviation in the city; and • The positioning of Rio de Janeiro as an international political and cultural centre.
The sustainabilityagenda of Rio de Janeiro thus addresses the following areas51:1. Employment and income; 2. Urban infrastructure; 3. Environment; 4. Public transport; and 5. Social services programs.
EmploymEntandincomEThe incomeandemploymentsituation in the city is characterised by numerous prob-lems that hamper Rio’s economic and social development (PMRJ 2009):• high degree of informality in income and employment structures; • low real income growth in formal employment relationships; • high youth unemployment; • local development disparities between the suburbs of the city; • high crime rate; and • Obsolete urban infrastructure.
The municipality wants to address these problems through the following initiatives (PMRJ 2009):• Improving framework conditions, such as the de-bureaucratisation of company
establishment procedures and the promotion of formalisation of small businesses; • Strengthening incentives for the expansion of the energy sector of the city, in par-
ticular the establishment of new companies in the field of renewable energies; • Expanding the fashion, design and film sector in Rio de Janeiro; and • Promoting the tourism sector.
urBaninfraStructurEIn the area of urbaninfrastructure (PMRJ 2009) priorities are the care, maintenance and expansion of public spaces and facilities (parks, squares, toilet and ablutions infra-structure, etc.), the revitalisation of the harbour region and development of harbour infrastructure, as well as the construction of social housing in poor areas.
EnvironmEntConcerningenvironmentalmatters (PMRJ 2009), the city’s sustainability agenda has the following development priorities: • Upgrading the water and sewage system, as well as building streets, particularly in
those regions of the city responsible for the pollution of Guanabara Bay; • Construction of drainage systems in Jacarepaguá; • Construction of a new, environmentally compatible landfill site; • Implementation of a climate protection policy in the city with clearly defined emis-
sion reduction objectives and relevant implementation measures; • Upgrading of bicycle lanes in Rio; and• Reforestation and restoration of degraded landscapes, and protection of biodiversity.
The Municipal Act on Climate Change and Sustainable Development that was passed on 27 January 2011 reached an important milestone for the sustainability agenda of Rio de Janeiro in view of the mega-events to be hosted in Rio. The Act includes the objectives of the municipal climate policy and mentions the following points, among others: • Development of a strategy for reducing greenhouse gas emissions in Rio de Janeiro
and a strategy for adaptation to climate change; • Concrete implementation of climate protection measures; • Implementation of the concept of sustainable development and integration of
social and economic development with environmental protection; • Education of the population regarding climate change, the necessity for climate
protection, and the severity of the consequences of climate change.
As a benchmark for the climate policy, the Act mentions the reduction of greenhouse gas emissions by 20% by the year 202052. The sectors of waste management, transport and public transport are mentioned as strategic focal points for a reduction.
puBlictranSportThe municipal administration itself admits that current publictransport is costly, slow, inconvenient and unsafe (PMRJ 2009). In particular, it lacks integrated operations and tariffs across the different modes (buses, rail, metro, ship, etc.). Furthermore, the system prioritises bus transport in a biased manner, which is problematic in terms of climate policies and also contributes significantly to traffic congestion in the city. And, finally, supply disparities exist among the different regions of the city. The most important initiatives planned for the solution of the problems mentioned above are the following (PMRJ 2009):• Restructuring and upgrading the transport and tariff system (e.g. standardised tariff
for the entire city region); • Establishing new public transport routes; and• Constructing roads.
SocialSErvicESprogrammESWith regard to socialservicesprograms, the ‘Bolsa Familia’ programme is to be ex-panded, vocational training offers for disadvantaged youths are to be increased and social services are to be upgraded (PMRJ 2009).
rio is striving to set a national benchmark in the years ahead in terms of social and economic development as well as in terms of nature conservation and sustainability. ”
“
51 Other areas are those of education and health care that will, however, not be discussed in greater detail here
Orange cones are used to close a parking lot in front of a government building in downtown Rio de Janeiro, Brazil on September 22, 2009. ‘Car Free Day’ is being celebrated in one of Brazil’s largest metropolises in an effort to raise awareness and combat the rising levels of con-taminanting CO2 emissions in the city. (Source: Vanderlei Almeida/AFP/Getty Images)
52 Greenhouse gas emissions of 2005 will serve as reference values
Cable cars ferry passengers over the Complexo do Alemao favelas in Rio de Janeiro. A six-station gondola line, the newest transportation system in Rio de Janeiro, will carry 30,000 people a day along a 2.1-mile route transforming the hour-and-a-half trudge to a nearby commuter rail station into a 16-minute sky ride. (Source: Rich Press/Bloomberg via Getty Images)
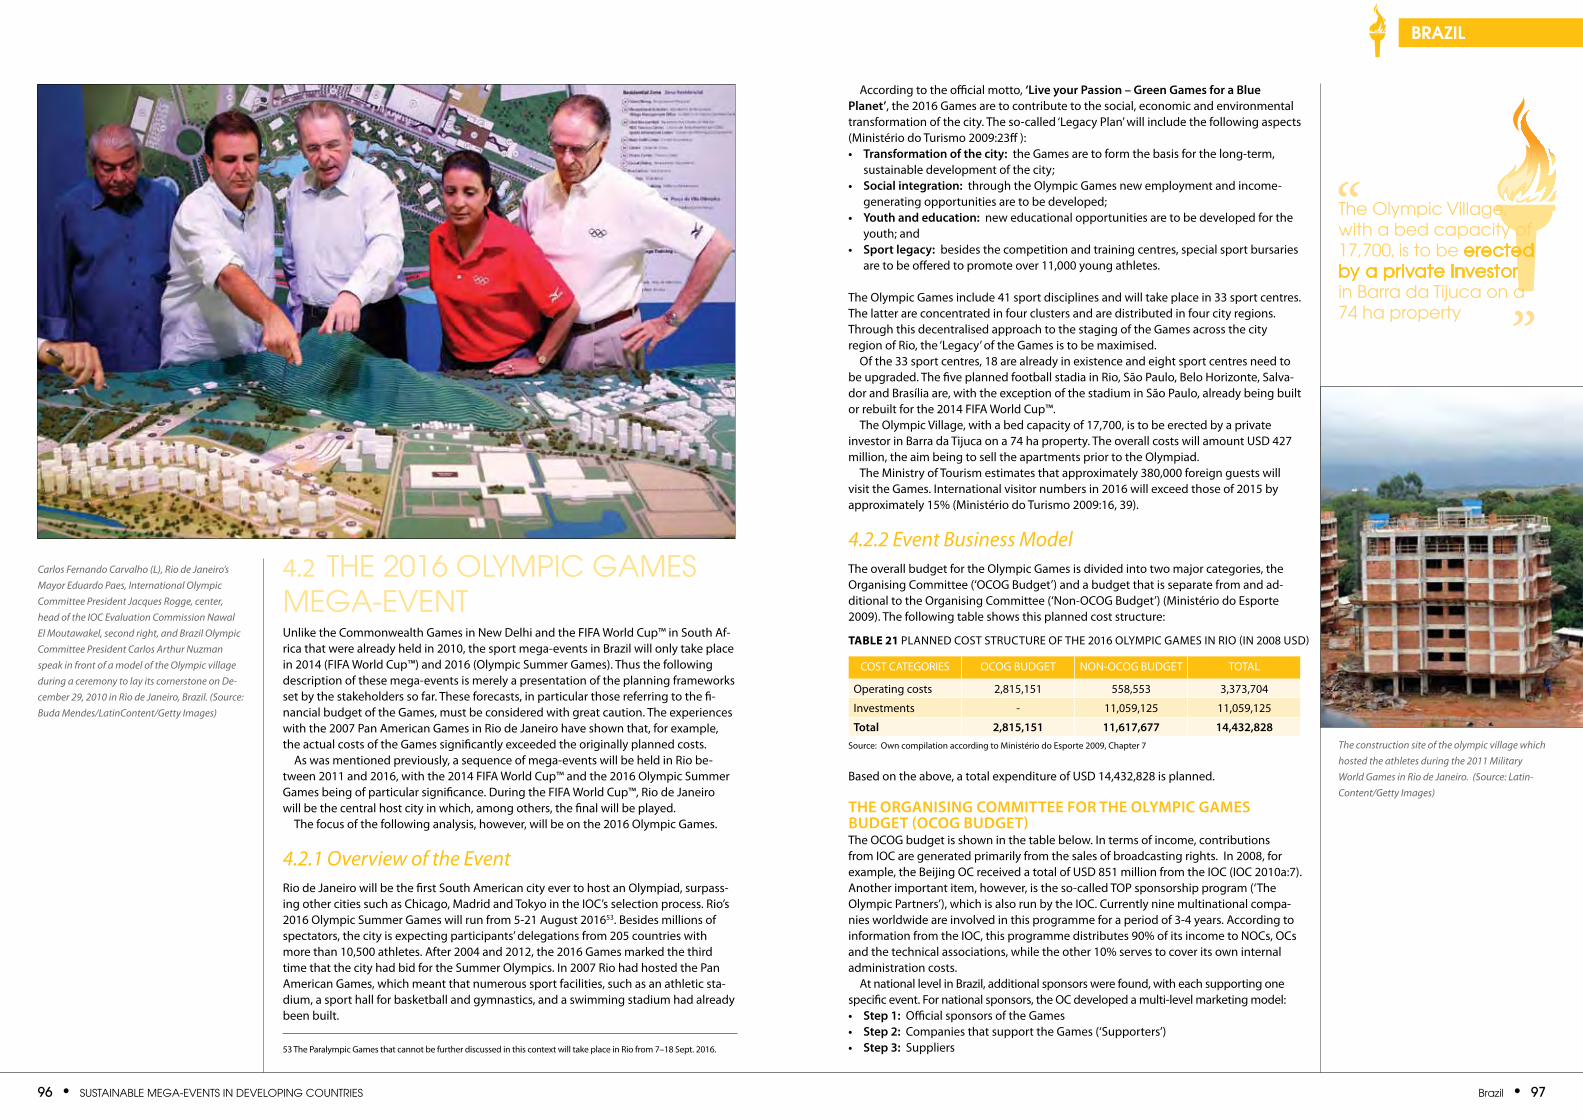
96 • SuStainable Mega-eventS in Developing CountrieS brazil • 97
brazil
4.2 the 2016 olyMpiC gaMeS Mega-eventUnlike the Commonwealth Games in New Delhi and the FIFA World Cup™ in South Af-rica that were already held in 2010, the sport mega-events in Brazil will only take place in 2014 (FIFA World Cup™) and 2016 (Olympic Summer Games). Thus the following description of these mega-events is merely a presentation of the planning frameworks set by the stakeholders so far. These forecasts, in particular those referring to the fi-nancial budget of the Games, must be considered with great caution. The experiences with the 2007 Pan American Games in Rio de Janeiro have shown that, for example, the actual costs of the Games significantly exceeded the originally planned costs.
As was mentioned previously, a sequence of mega-events will be held in Rio be-tween 2011 and 2016, with the 2014 FIFA World Cup™ and the 2016 Olympic Summer Games being of particular significance. During the FIFA World Cup™, Rio de Janeiro will be the central host city in which, among others, the final will be played.
The focus of the following analysis, however, will be on the 2016 Olympic Games.
4.2.1 Overview of the EventRio de Janeiro will be the first South American city ever to host an Olympiad, surpass-ing other cities such as Chicago, Madrid and Tokyo in the IOC’s selection process. Rio’s 2016 Olympic Summer Games will run from 5-21 August 201653. Besides millions of spectators, the city is expecting participants’ delegations from 205 countries with more than 10,500 athletes. After 2004 and 2012, the 2016 Games marked the third time that the city had bid for the Summer Olympics. In 2007 Rio had hosted the Pan American Games, which meant that numerous sport facilities, such as an athletic sta-dium, a sport hall for basketball and gymnastics, and a swimming stadium had already been built.
According to the official motto, ‘liveyourpassion–greengamesforaBlueplanet’, the 2016 Games are to contribute to the social, economic and environmental transformation of the city. The so-called ‘legacy Plan’ will include the following aspects (Ministério do Turismo 2009:23ff ):• transformationofthecity: the Games are to form the basis for the long-term,
sustainable development of the city; • Socialintegration: through the Olympic Games new employment and income-
generating opportunities are to be developed; • youthandeducation: new educational opportunities are to be developed for the
youth; and • Sportlegacy: besides the competition and training centres, special sport bursaries
are to be offered to promote over 11,000 young athletes.
The Olympic Games include 41 sport disciplines and will take place in 33 sport centres. The latter are concentrated in four clusters and are distributed in four city regions. Through this decentralised approach to the staging of the Games across the city region of Rio, the ‘legacy’ of the Games is to be maximised.
Of the 33 sport centres, 18 are already in existence and eight sport centres need to be upgraded. The five planned football stadia in Rio, São Paulo, Belo horizonte, Salva-dor and Brasília are, with the exception of the stadium in São Paulo, already being built or rebuilt for the 2014 FIFA World Cup™.
The Olympic Village, with a bed capacity of 17,700, is to be erected by a private investor in Barra da Tijuca on a 74 ha property. The overall costs will amount USD 427 million, the aim being to sell the apartments prior to the Olympiad.
The Ministry of Tourism estimates that approximately 380,000 foreign guests will visit the Games. International visitor numbers in 2016 will exceed those of 2015 by approximately 15% (Ministério do Turismo 2009:16, 39).
4.2.2 Event Business ModelThe overall budget for the Olympic Games is divided into two major categories, the Organising Committee (‘OCOG Budget’) and a budget that is separate from and ad-ditional to the Organising Committee (‘Non-OCOG Budget’) (Ministério do Esporte 2009). The following table shows this planned cost structure:
Based on the above, a total expenditure of USD 14,432,828 is planned.
thEorganiSingcommittEEforthEolympicgamESBudgEt(ocogBudgEt)The OCOG budget is shown in the table below. In terms of income, contributions from IOC are generated primarily from the sales of broadcasting rights. In 2008, for example, the Beijing OC received a total of USD 851 million from the IOC (IOC 2010a:7). Another important item, however, is the so-called TOP sponsorship program (‘The Olympic Partners’), which is also run by the IOC. Currently nine multinational compa-nies worldwide are involved in this programme for a period of 3-4 years. According to information from the IOC, this programme distributes 90% of its income to NOCs, OCs and the technical associations, while the other 10% serves to cover its own internal administration costs.
At national level in Brazil, additional sponsors were found, with each supporting one specific event. For national sponsors, the OC developed a multi-level marketing model: • Step1: Official sponsors of the Games• Step2: Companies that support the Games (‘Supporters’)• Step3: Suppliers
the olympic village, with a bed capacity of 17,700, is to be erected by a private investor in barra da tijuca on a 74 ha property ”
“
Table 21 PlANNED COST STRUCTURE OF ThE 2016 OlyMPIC GAMES IN RIO (IN 2008 USD)
COST CATEGORIES OCOG BUDGET NON-OCOG BUDGET TOTAl
Operating costs 2,815,151 558,553 3,373,704
Investments - 11,059,125 11,059,125
total 2,815,151 11,617,677 14,432,828Source: Own compilation according to Ministério do Esporte 2009, Chapter 7
Carlos Fernando Carvalho (L), Rio de Janeiro’s Mayor Eduardo Paes, International Olympic Committee President Jacques Rogge, center, head of the IOC Evaluation Commission Nawal El Moutawakel, second right, and Brazil Olympic Committee President Carlos Arthur Nuzman speak in front of a model of the Olympic village during a ceremony to lay its cornerstone on De-cember 29, 2010 in Rio de Janeiro, Brazil. (Source: Buda Mendes/LatinContent/Getty Images)
The construction site of the olympic village which hosted the athletes during the 2011 Military World Games in Rio de Janeiro. (Source: Latin-Content/Getty Images)
53 The Paralympic Games that cannot be further discussed in this context will take place in Rio from 7–18 Sept. 2016.
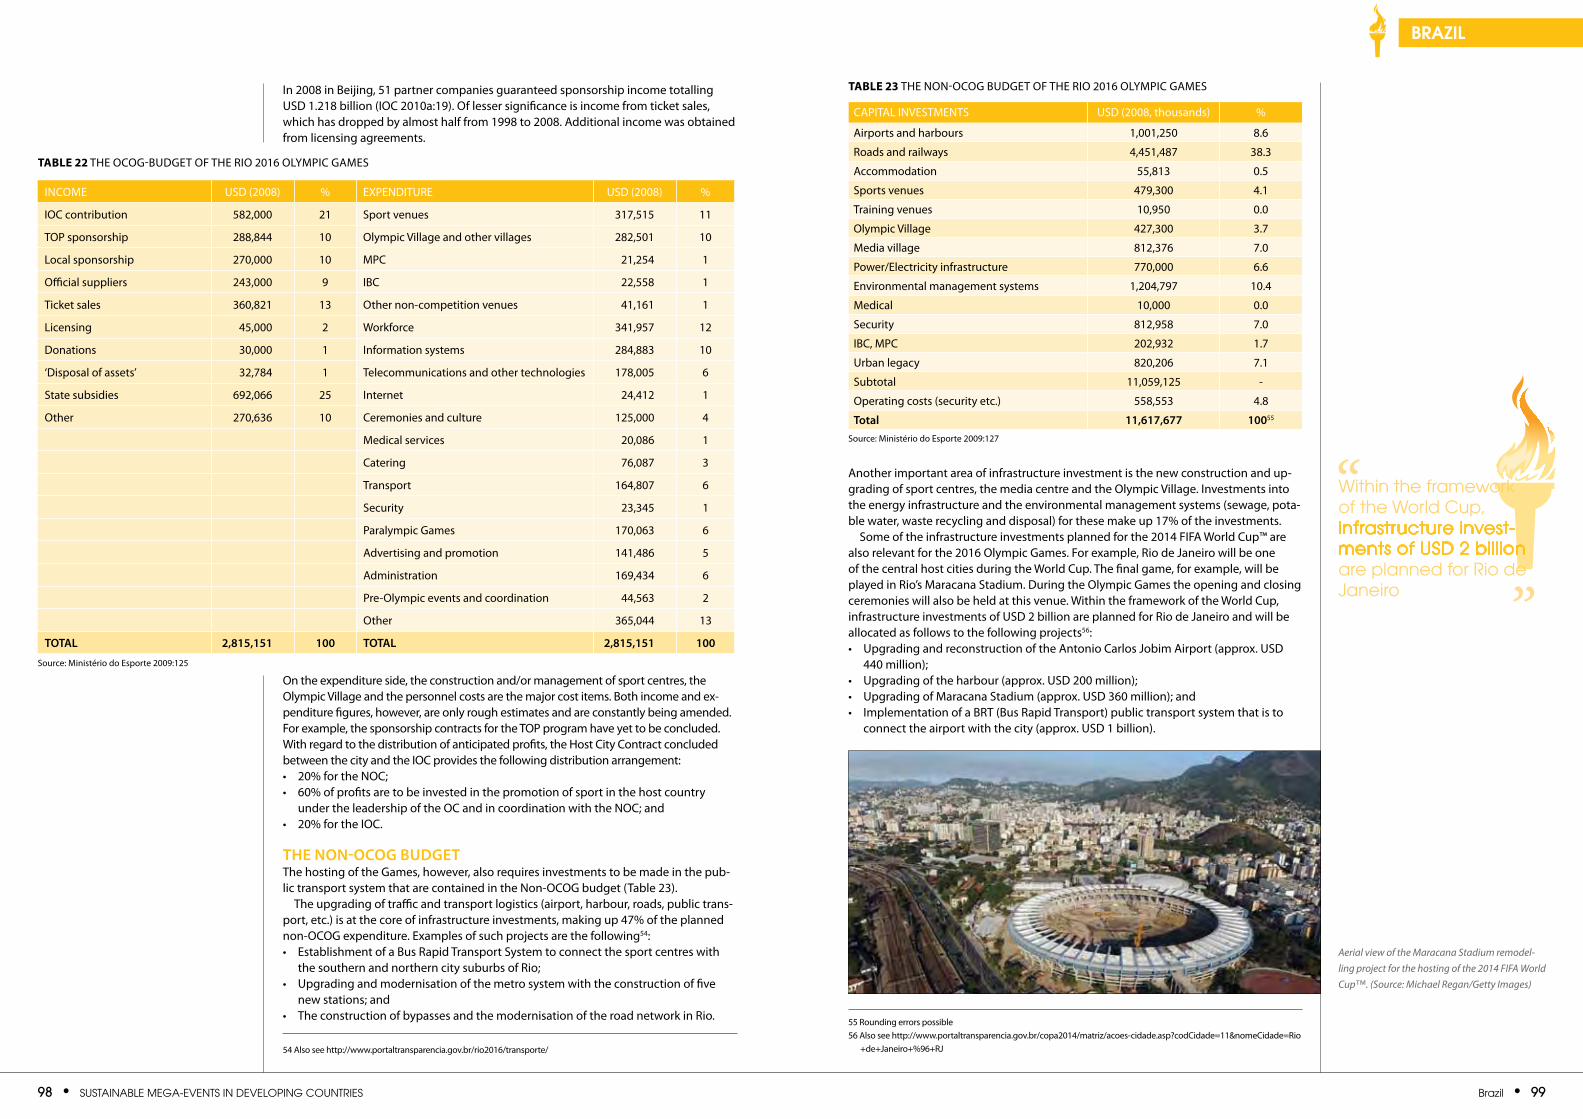
98 • SuStainable Mega-eventS in Developing CountrieS brazil • 99
brazil
In 2008 in Beijing, 51 partner companies guaranteed sponsorship income totalling USD 1.218 billion (IOC 2010a:19). Of lesser significance is income from ticket sales, which has dropped by almost half from 1998 to 2008. Additional income was obtained from licensing agreements.
On the expenditure side, the construction and/or management of sport centres, the Olympic Village and the personnel costs are the major cost items. Both income and ex-penditure figures, however, are only rough estimates and are constantly being amended. For example, the sponsorship contracts for the TOP program have yet to be concluded. With regard to the distribution of anticipated profits, the host City Contract concluded between the city and the IOC provides the following distribution arrangement: • 20% for the NOC; • 60% of profits are to be invested in the promotion of sport in the host country
under the leadership of the OC and in coordination with the NOC; and • 20% for the IOC.
thEnon-ocogBudgEtThe hosting of the Games, however, also requires investments to be made in the pub-lic transport system that are contained in the Non-OCOG budget (Table 23).
The upgrading of traffic and transport logistics (airport, harbour, roads, public trans-port, etc.) is at the core of infrastructure investments, making up 47% of the planned non-OCOG expenditure. Examples of such projects are the following54:• Establishment of a Bus Rapid Transport System to connect the sport centres with
the southern and northern city suburbs of Rio; • Upgrading and modernisation of the metro system with the construction of five
new stations; and • The construction of bypasses and the modernisation of the road network in Rio.
Another important area of infrastructure investment is the new construction and up-grading of sport centres, the media centre and the Olympic Village. Investments into the energy infrastructure and the environmental management systems (sewage, pota-ble water, waste recycling and disposal) for these make up 17% of the investments.
Some of the infrastructure investments planned for the 2014 FIFA World Cup™ are also relevant for the 2016 Olympic Games. For example, Rio de Janeiro will be one of the central host cities during the World Cup. The final game, for example, will be played in Rio’s Maracana Stadium. During the Olympic Games the opening and closing ceremonies will also be held at this venue. Within the framework of the World Cup, infrastructure investments of USD 2 billion are planned for Rio de Janeiro and will be allocated as follows to the following projects56:• Upgrading and reconstruction of the Antonio Carlos Jobim Airport (approx. USD
440 million); • Upgrading of the harbour (approx. USD 200 million); • Upgrading of Maracana Stadium (approx. USD 360 million); and • Implementation of a BRT (Bus Rapid Transport) public transport system that is to
connect the airport with the city (approx. USD 1 billion).
Aerial view of the Maracana Stadium remodel-ling project for the hosting of the 2014 FIFA World Cup™. (Source: Michael Regan/Getty Images)
INCOME USD (2008) % EXPENDITURE USD (2008) %
IOC contribution 582,000 21 Sport venues 317,515 11
TOP sponsorship 288,844 10 Olympic Village and other villages 282,501 10
local sponsorship 270,000 10 MPC 21,254 1
Official suppliers 243,000 9 IBC 22,558 1
Ticket sales 360,821 13 Other non-competition venues 41,161 1
licensing 45,000 2 Workforce 341,957 12
Donations 30,000 1 Information systems 284,883 10
‘Disposal of assets’ 32,784 1 Telecommunications and other technologies 178,005 6
State subsidies 692,066 25 Internet 24,412 1
Other 270,636 10 Ceremonies and culture 125,000 4
Medical services 20,086 1
Catering 76,087 3
Transport 164,807 6
Security 23,345 1
Paralympic Games 170,063 6
Advertising and promotion 141,486 5
Administration 169,434 6
Pre-Olympic events and coordination 44,563 2
Other 365,044 13
total 2,815,151 100 total 2,815,151 100
Source: Ministério do Esporte 2009:125
Table 22 ThE OCOG-BUDGET OF ThE RIO 2016 OlyMPIC GAMES
54 Also see http://www.portaltransparencia.gov.br/rio2016/transporte/
55 Rounding errors possible56 Also see http://www.portaltransparencia.gov.br/copa2014/matriz/acoes-cidade.asp?codCidade=11&nomeCidade=Rio
+de+Janeiro+%96+RJ
Table 23 ThE NON-OCOG BUDGET OF ThE RIO 2016 OlyMPIC GAMES
CAPITAl INVESTMENTS USD (2008, thousands) %
Airports and harbours 1,001,250 8.6
Roads and railways 4,451,487 38.3
Accommodation 55,813 0.5
Sports venues 479,300 4.1
Training venues 10,950 0.0
Olympic Village 427,300 3.7
Media village 812,376 7.0
Power/Electricity infrastructure 770,000 6.6
Environmental management systems 1,204,797 10.4
Medical 10,000 0.0
Security 812,958 7.0
IBC, MPC 202,932 1.7
Urban legacy 820,206 7.1
Subtotal 11,059,125 -
Operating costs (security etc.) 558,553 4.8
total 11,617,677 10055
Source: Ministério do Esporte 2009:127
Within the framework of the World Cup, infrastructure invest-ments of uSD 2 billion are planned for rio de Janeiro ”
“
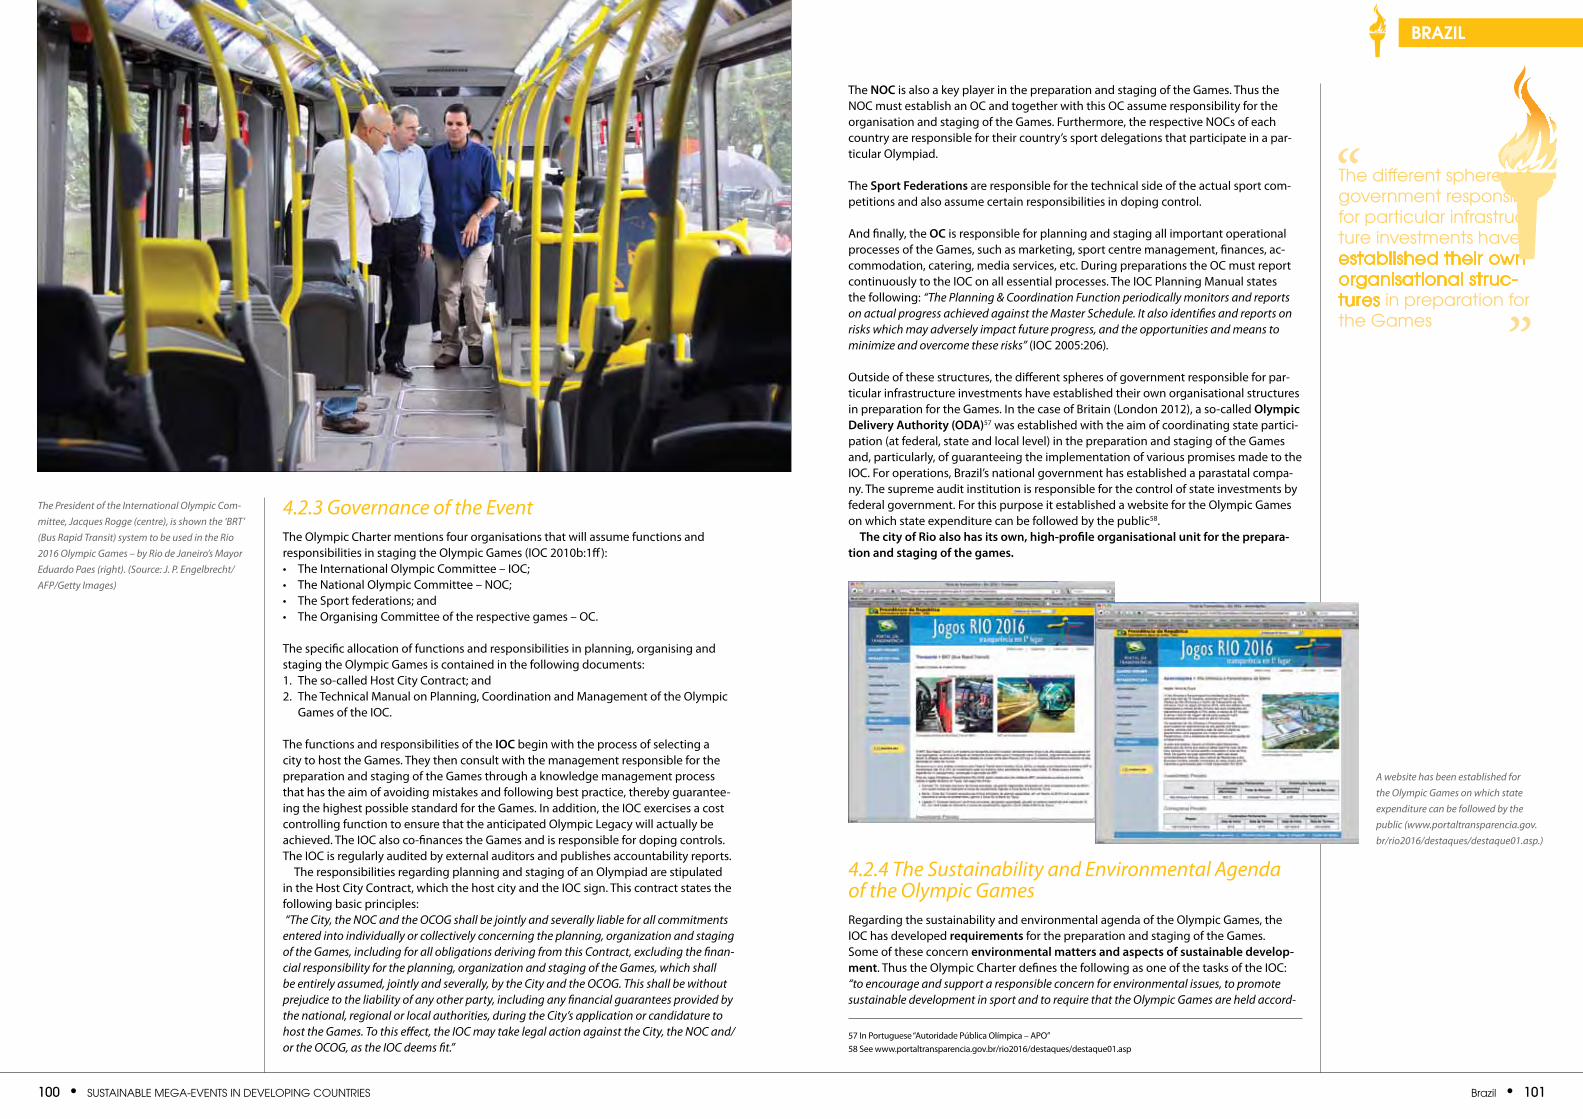
100 • SuStainable Mega-eventS in Developing CountrieS brazil • 101
brazil
4.2.3 Governance of the EventThe Olympic Charter mentions four organisations that will assume functions and responsibilities in staging the Olympic Games (IOC 2010b:1ff):• The International Olympic Committee – IOC; • The National Olympic Committee – NOC; • The Sport federations; and • The Organising Committee of the respective games – OC. The specific allocation of functions and responsibilities in planning, organising and staging the Olympic Games is contained in the following documents: 1. The so-called host City Contract; and2. The Technical Manual on Planning, Coordination and Management of the Olympic
Games of the IOC.
The functions and responsibilities of the IOC begin with the process of selecting a city to host the Games. They then consult with the management responsible for the preparation and staging of the Games through a knowledge management process that has the aim of avoiding mistakes and following best practice, thereby guarantee-ing the highest possible standard for the Games. In addition, the IOC exercises a cost controlling function to ensure that the anticipated Olympic legacy will actually be achieved. The IOC also co-finances the Games and is responsible for doping controls. The IOC is regularly audited by external auditors and publishes accountability reports.
The responsibilities regarding planning and staging of an Olympiad are stipulated in the host City Contract, which the host city and the IOC sign. This contract states the following basic principles: “The City, the NOC and the OCOG shall be jointly and severally liable for all commitments entered into individually or collectively concerning the planning, organization and staging of the Games, including for all obligations deriving from this Contract, excluding the finan-cial responsibility for the planning, organization and staging of the Games, which shall be entirely assumed, jointly and severally, by the City and the OCOG. This shall be without prejudice to the liability of any other party, including any financial guarantees provided by the national, regional or local authorities, during the City’s application or candidature to host the Games. To this effect, the IOC may take legal action against the City, the NOC and/or the OCOG, as the IOC deems fit.”
The NOC is also a key player in the preparation and staging of the Games. Thus the NOC must establish an OC and together with this OC assume responsibility for the organisation and staging of the Games. Furthermore, the respective NOCs of each country are responsible for their country’s sport delegations that participate in a par-ticular Olympiad.
The Sportfederations are responsible for the technical side of the actual sport com-petitions and also assume certain responsibilities in doping control.
And finally, the OC is responsible for planning and staging all important operational processes of the Games, such as marketing, sport centre management, finances, ac-commodation, catering, media services, etc. During preparations the OC must report continuously to the IOC on all essential processes. The IOC Planning Manual states the following: “The Planning & Coordination Function periodically monitors and reports on actual progress achieved against the Master Schedule. It also identifies and reports on risks which may adversely impact future progress, and the opportunities and means to minimize and overcome these risks” (IOC 2005:206).
Outside of these structures, the different spheres of government responsible for par-ticular infrastructure investments have established their own organisational structures in preparation for the Games. In the case of Britain (london 2012), a so-called olympicdeliveryauthority(oda)57 was established with the aim of coordinating state partici-pation (at federal, state and local level) in the preparation and staging of the Games and, particularly, of guaranteeing the implementation of various promises made to the IOC. For operations, Brazil’s national government has established a parastatal compa-ny. The supreme audit institution is responsible for the control of state investments by federal government. For this purpose it established a website for the Olympic Games on which state expenditure can be followed by the public58.thecityofrioalsohasitsown,high-profileorganisationalunitfortheprepara-
tionandstagingofthegames.
4.2.4 The Sustainability and Environmental Agenda of the Olympic GamesRegarding the sustainability and environmental agenda of the Olympic Games, the IOC has developed requirements for the preparation and staging of the Games. Some of these concern environmentalmattersandaspectsofsustainabledevelop-ment. Thus the Olympic Charter defines the following as one of the tasks of the IOC: “to encourage and support a responsible concern for environmental issues, to promote sustainable development in sport and to require that the Olympic Games are held accord-
57 In Portuguese “Autoridade Pública Olímpica – APO”58 See www.portaltransparencia.gov.br/rio2016/destaques/destaque01.asp
The President of the International Olympic Com-mittee, Jacques Rogge (centre), is shown the ‘BRT’ (Bus Rapid Transit) system to be used in the Rio 2016 Olympic Games – by Rio de Janeiro’s Mayor Eduardo Paes (right). (Source: J. P. Engelbrecht/AFP/Getty Images)
the different spheres of government responsible for particular infrastruc-ture investments have established their own organisational struc-tures in preparation for the games ”
“
A website has been established for the Olympic Games on which state expenditure can be followed by the public (www.portaltransparencia.gov.br/rio2016/destaques/destaque01.asp.)
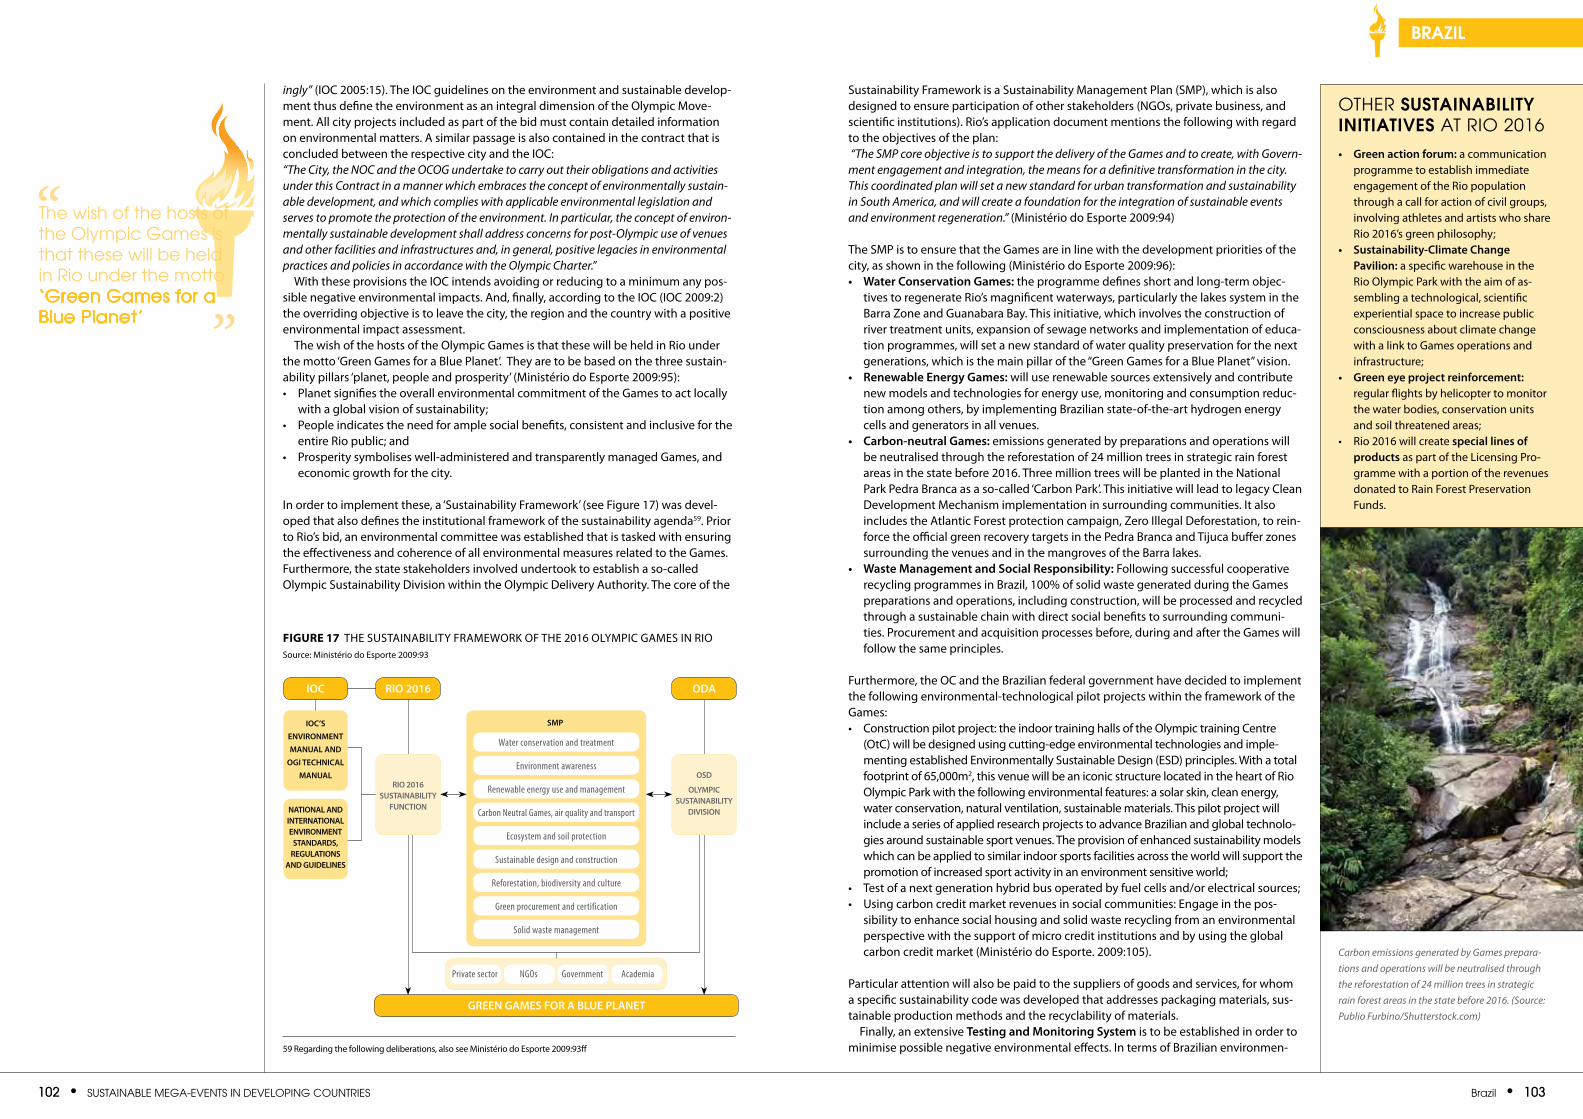
102 • SuStainable Mega-eventS in Developing CountrieS brazil • 103
brazil
ingly” (IOC 2005:15). The IOC guidelines on the environment and sustainable develop-ment thus define the environment as an integral dimension of the Olympic Move-ment. All city projects included as part of the bid must contain detailed information on environmental matters. A similar passage is also contained in the contract that is concluded between the respective city and the IOC: “The City, the NOC and the OCOG undertake to carry out their obligations and activities under this Contract in a manner which embraces the concept of environmentally sustain-able development, and which complies with applicable environmental legislation and serves to promote the protection of the environment. In particular, the concept of environ-mentally sustainable development shall address concerns for post-Olympic use of venues and other facilities and infrastructures and, in general, positive legacies in environmental practices and policies in accordance with the Olympic Charter.”
With these provisions the IOC intends avoiding or reducing to a minimum any pos-sible negative environmental impacts. And, finally, according to the IOC (IOC 2009:2) the overriding objective is to leave the city, the region and the country with a positive environmental impact assessment.
The wish of the hosts of the Olympic Games is that these will be held in Rio under the motto ‘Green Games for a Blue Planet’. They are to be based on the three sustain-ability pillars ‘planet, people and prosperity’ (Ministério do Esporte 2009:95):• Planet signifies the overall environmental commitment of the Games to act locally
with a global vision of sustainability;• People indicates the need for ample social benefits, consistent and inclusive for the
entire Rio public; and • Prosperity symbolises well-administered and transparently managed Games, and
economic growth for the city.
In order to implement these, a ‘Sustainability Framework’ (see Figure 17) was devel-oped that also defines the institutional framework of the sustainability agenda59. Prior to Rio’s bid, an environmental committee was established that is tasked with ensuring the effectiveness and coherence of all environmental measures related to the Games. Furthermore, the state stakeholders involved undertook to establish a so-called Olympic Sustainability Division within the Olympic Delivery Authority. The core of the
Sustainability Framework is a Sustainability Management Plan (SMP), which is also designed to ensure participation of other stakeholders (NGOs, private business, and scientific institutions). Rio’s application document mentions the following with regard to the objectives of the plan: “The SMP core objective is to support the delivery of the Games and to create, with Govern-ment engagement and integration, the means for a definitive transformation in the city. This coordinated plan will set a new standard for urban transformation and sustainability in South America, and will create a foundation for the integration of sustainable events and environment regeneration.” (Ministério do Esporte 2009:94)
The SMP is to ensure that the Games are in line with the development priorities of the city, as shown in the following (Ministério do Esporte 2009:96): • Waterconservationgames: the programme defines short and long-term objec-
tives to regenerate Rio’s magnificent waterways, particularly the lakes system in the Barra zone and Guanabara Bay. This initiative, which involves the construction of river treatment units, expansion of sewage networks and implementation of educa-tion programmes, will set a new standard of water quality preservation for the next generations, which is the main pillar of the “Green Games for a Blue Planet” vision.
• renewableEnergygames: will use renewable sources extensively and contribute new models and technologies for energy use, monitoring and consumption reduc-tion among others, by implementing Brazilian state-of-the-art hydrogen energy cells and generators in all venues.
• carbon-neutralgames: emissions generated by preparations and operations will be neutralised through the reforestation of 24 million trees in strategic rain forest areas in the state before 2016. Three million trees will be planted in the National Park Pedra Branca as a so-called ‘Carbon Park’. This initiative will lead to legacy Clean Development Mechanism implementation in surrounding communities. It also includes the Atlantic Forest protection campaign, zero Illegal Deforestation, to rein-force the official green recovery targets in the Pedra Branca and Tijuca buffer zones surrounding the venues and in the mangroves of the Barra lakes.
• WastemanagementandSocialresponsibility: Following successful cooperative recycling programmes in Brazil, 100% of solid waste generated during the Games preparations and operations, including construction, will be processed and recycled through a sustainable chain with direct social benefits to surrounding communi-ties. Procurement and acquisition processes before, during and after the Games will follow the same principles.
Furthermore, the OC and the Brazilian federal government have decided to implement the following environmental-technological pilot projects within the framework of the Games:• Construction pilot project: the indoor training halls of the Olympic training Centre
(OtC) will be designed using cutting-edge environmental technologies and imple-menting established Environmentally Sustainable Design (ESD) principles. With a total footprint of 65,000m2, this venue will be an iconic structure located in the heart of Rio Olympic Park with the following environmental features: a solar skin, clean energy, water conservation, natural ventilation, sustainable materials. This pilot project will include a series of applied research projects to advance Brazilian and global technolo-gies around sustainable sport venues. The provision of enhanced sustainability models which can be applied to similar indoor sports facilities across the world will support the promotion of increased sport activity in an environment sensitive world;
• Test of a next generation hybrid bus operated by fuel cells and/or electrical sources;• Using carbon credit market revenues in social communities: Engage in the pos-
sibility to enhance social housing and solid waste recycling from an environmental perspective with the support of micro credit institutions and by using the global carbon credit market (Ministério do Esporte. 2009:105).
Particular attention will also be paid to the suppliers of goods and services, for whom a specific sustainability code was developed that addresses packaging materials, sus-tainable production methods and the recyclability of materials.
Finally, an extensive testingandmonitoringSystem is to be established in order to minimise possible negative environmental effects. In terms of Brazilian environmen-
Figure 17 ThE SUSTAINABIlITy FRAMEWORk OF ThE 2016 OlyMPIC GAMES IN RIOSource: Ministério do Esporte 2009:93
59 Regarding the following deliberations, also see Ministério do Esporte 2009:93ff
other SuStainability initiativeS at rio 2016
• greenactionforum: a communication programme to establish immediate engagement of the Rio population through a call for action of civil groups, involving athletes and artists who share Rio 2016’s green philosophy;
• Sustainability-climatechangepavilion: a specific warehouse in the Rio Olympic Park with the aim of as-sembling a technological, scientific experiential space to increase public consciousness about climate change with a link to Games operations and infrastructure;
• greeneyeprojectreinforcement: regular flights by helicopter to monitor the water bodies, conservation units and soil threatened areas;
• Rio 2016 will create speciallinesofproducts as part of the licensing Pro-gramme with a portion of the revenues donated to Rain Forest Preservation Funds.
IOC rio2016 oda
ioc’S
EnvironmEnt
manualand
ogitEchnical
manual
nationalandintErnationalEnvironmEntStandardS,rEgulationS
andguidElinES
rio2016SuStainaBility
function
grEEngamESforaBluEplanEt
oSd
olympicSuStainaBility
diviSion
Smp
Water conservation and treatment
Environment awareness
Renewable energy use and management
Carbon Neutral Games, air quality and transport
Ecosystem and soil protection
Sustainable design and construction
Reforestation, biodiversity and culture
Green procurement and certification
Solid waste management
Private sector NGOs Government Academia
the wish of the hosts of the olympic games is that these will be held in rio under the motto ‘green games for a blue planet’ ”
“
Carbon emissions generated by Games prepara-tions and operations will be neutralised through the reforestation of 24 million trees in strategic rain forest areas in the state before 2016. (Source: Publio Furbino/Shutterstock.com)
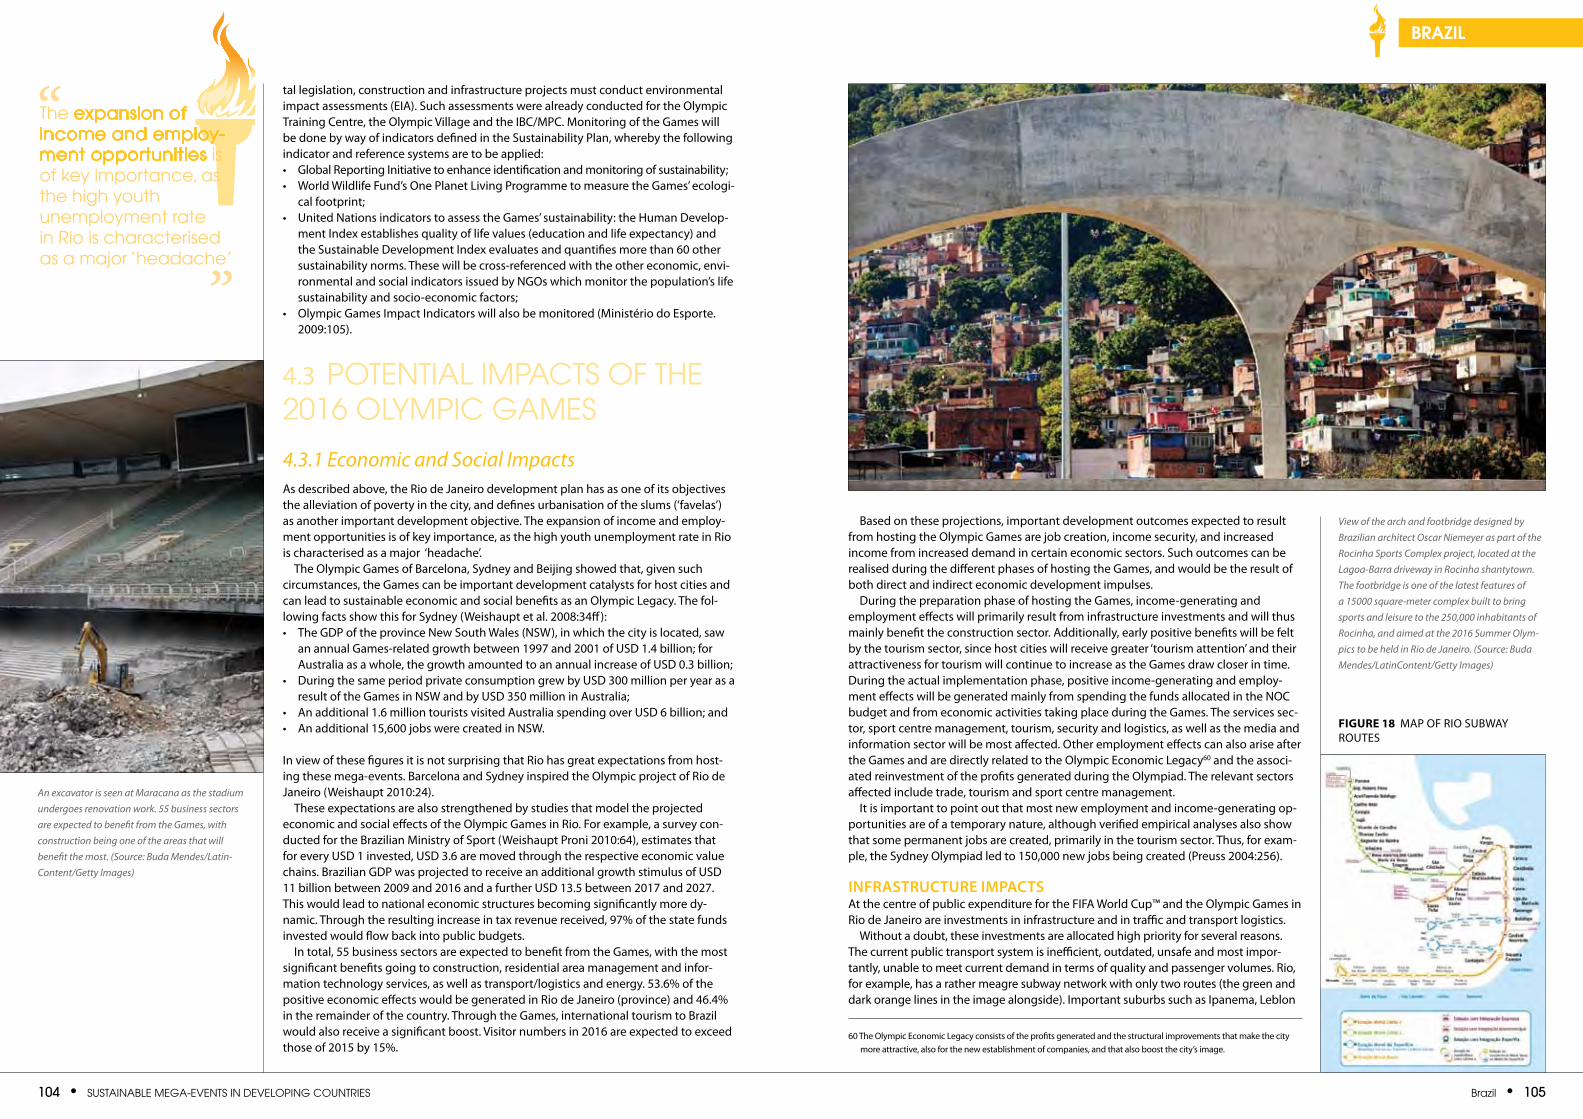
104 • SuStainable Mega-eventS in Developing CountrieS brazil • 105
brazil
tal legislation, construction and infrastructure projects must conduct environmental impact assessments (EIA). Such assessments were already conducted for the Olympic Training Centre, the Olympic Village and the IBC/MPC. Monitoring of the Games will be done by way of indicators defined in the Sustainability Plan, whereby the following indicator and reference systems are to be applied: • Global Reporting Initiative to enhance identification and monitoring of sustainability;• World Wildlife Fund’s One Planet living Programme to measure the Games’ ecologi-
cal footprint;• United Nations indicators to assess the Games’ sustainability: the human Develop-
ment Index establishes quality of life values (education and life expectancy) and the Sustainable Development Index evaluates and quantifies more than 60 other sustainability norms. These will be cross-referenced with the other economic, envi-ronmental and social indicators issued by NGOs which monitor the population’s life sustainability and socio-economic factors;
• Olympic Games Impact Indicators will also be monitored (Ministério do Esporte. 2009:105).
4.3 potential iMpaCtS of the 2016 olyMpiC gaMeS
4.3.1 Economic and Social ImpactsAs described above, the Rio de Janeiro development plan has as one of its objectives the alleviation of poverty in the city, and defines urbanisation of the slums (‘favelas’) as another important development objective. The expansion of income and employ-ment opportunities is of key importance, as the high youth unemployment rate in Rio is characterised as a major ‘headache’.
The Olympic Games of Barcelona, Sydney and Beijing showed that, given such circumstances, the Games can be important development catalysts for host cities and can lead to sustainable economic and social benefits as an Olympic legacy. The fol-lowing facts show this for Sydney (Weishaupt et al. 2008:34ff):• The GDP of the province New South Wales (NSW), in which the city is located, saw
an annual Games-related growth between 1997 and 2001 of USD 1.4 billion; for Australia as a whole, the growth amounted to an annual increase of USD 0.3 billion;
• During the same period private consumption grew by USD 300 million per year as a result of the Games in NSW and by USD 350 million in Australia;
• An additional 1.6 million tourists visited Australia spending over USD 6 billion; and • An additional 15,600 jobs were created in NSW.
In view of these figures it is not surprising that Rio has great expectations from host-ing these mega-events. Barcelona and Sydney inspired the Olympic project of Rio de Janeiro (Weishaupt 2010:24).
These expectations are also strengthened by studies that model the projected economic and social effects of the Olympic Games in Rio. For example, a survey con-ducted for the Brazilian Ministry of Sport (Weishaupt Proni 2010:64), estimates that for every USD 1 invested, USD 3.6 are moved through the respective economic value chains. Brazilian GDP was projected to receive an additional growth stimulus of USD 11 billion between 2009 and 2016 and a further USD 13.5 between 2017 and 2027. This would lead to national economic structures becoming significantly more dy-namic. Through the resulting increase in tax revenue received, 97% of the state funds invested would flow back into public budgets.
In total, 55 business sectors are expected to benefit from the Games, with the most significant benefits going to construction, residential area management and infor-mation technology services, as well as transport/logistics and energy. 53.6% of the positive economic effects would be generated in Rio de Janeiro (province) and 46.4% in the remainder of the country. Through the Games, international tourism to Brazil would also receive a significant boost. Visitor numbers in 2016 are expected to exceed those of 2015 by 15%.
Based on these projections, important development outcomes expected to result from hosting the Olympic Games are job creation, income security, and increased income from increased demand in certain economic sectors. Such outcomes can be realised during the different phases of hosting the Games, and would be the result of both direct and indirect economic development impulses.
During the preparation phase of hosting the Games, income-generating and employment effects will primarily result from infrastructure investments and will thus mainly benefit the construction sector. Additionally, early positive benefits will be felt by the tourism sector, since host cities will receive greater ‘tourism attention’ and their attractiveness for tourism will continue to increase as the Games draw closer in time. During the actual implementation phase, positive income-generating and employ-ment effects will be generated mainly from spending the funds allocated in the NOC budget and from economic activities taking place during the Games. The services sec-tor, sport centre management, tourism, security and logistics, as well as the media and information sector will be most affected. Other employment effects can also arise after the Games and are directly related to the Olympic Economic legacy60 and the associ-ated reinvestment of the profits generated during the Olympiad. The relevant sectors affected include trade, tourism and sport centre management.
It is important to point out that most new employment and income-generating op-portunities are of a temporary nature, although verified empirical analyses also show that some permanent jobs are created, primarily in the tourism sector. Thus, for exam-ple, the Sydney Olympiad led to 150,000 new jobs being created (Preuss 2004:256).
infraStructurEimpactSAt the centre of public expenditure for the FIFA World Cup™ and the Olympic Games in Rio de Janeiro are investments in infrastructure and in traffic and transport logistics.
Without a doubt, these investments are allocated high priority for several reasons. The current public transport system is inefficient, outdated, unsafe and most impor-tantly, unable to meet current demand in terms of quality and passenger volumes. Rio, for example, has a rather meagre subway network with only two routes (the green and dark orange lines in the image alongside). Important suburbs such as Ipanema, leblon
the expansion of income and employ-ment opportunities is of key importance, as the high youth unemployment rate in rio is characterised as a major ‘headache’
”
“
60 The Olympic Economic legacy consists of the profits generated and the structural improvements that make the city more attractive, also for the new establishment of companies, and that also boost the city’s image.
Figure 18 MAP OF RIO SUBWAy ROUTES
View of the arch and footbridge designed by Brazilian architect Oscar Niemeyer as part of the Rocinha Sports Complex project, located at the Lagoa-Barra driveway in Rocinha shantytown. The footbridge is one of the latest features of a 15000 square-meter complex built to bring sports and leisure to the 250,000 inhabitants of Rocinha, and aimed at the 2016 Summer Olym-pics to be held in Rio de Janeiro. (Source: Buda Mendes/LatinContent/Getty Images)
An excavator is seen at Maracana as the stadium undergoes renovation work. 55 business sectors are expected to benefit from the Games, with construction being one of the areas that will benefit the most. (Source: Buda Mendes/Latin-Content/Getty Images)
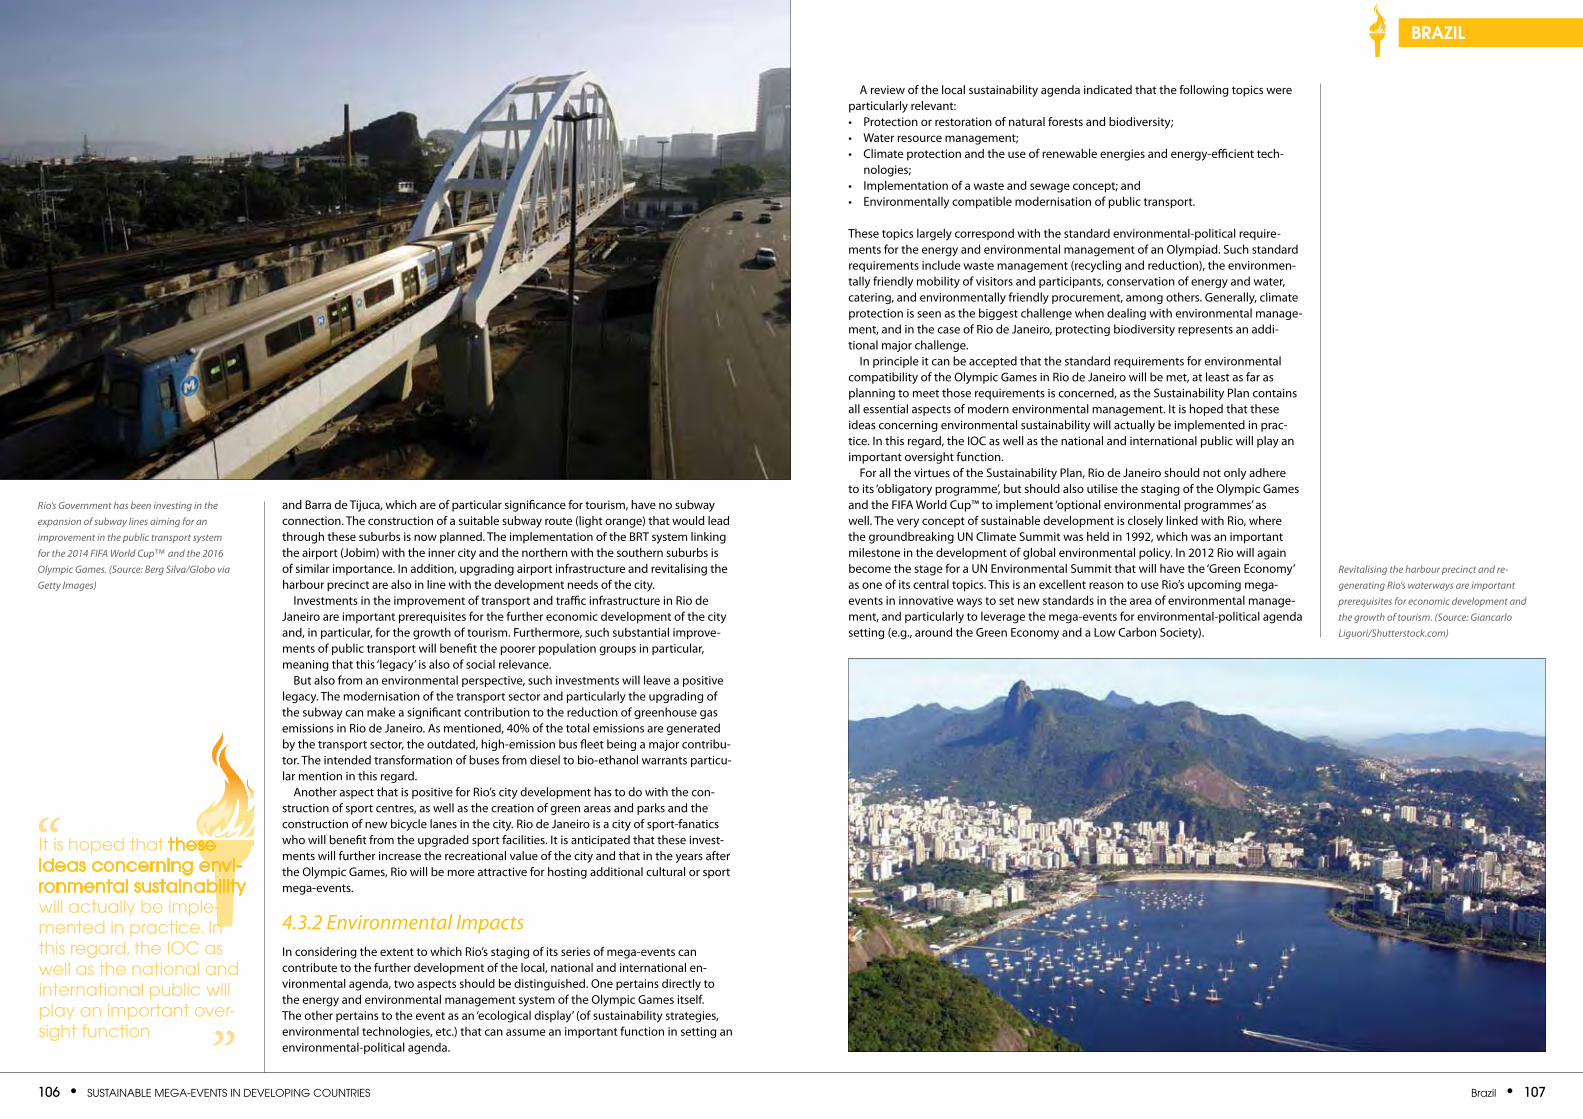
106 • SuStainable Mega-eventS in Developing CountrieS brazil • 107
brazil
A review of the local sustainability agenda indicated that the following topics were particularly relevant: • Protection or restoration of natural forests and biodiversity; • Water resource management; • Climate protection and the use of renewable energies and energy-efficient tech-
nologies; • Implementation of a waste and sewage concept; and • Environmentally compatible modernisation of public transport.
These topics largely correspond with the standard environmental-political require-ments for the energy and environmental management of an Olympiad. Such standard requirements include waste management (recycling and reduction), the environmen-tally friendly mobility of visitors and participants, conservation of energy and water, catering, and environmentally friendly procurement, among others. Generally, climate protection is seen as the biggest challenge when dealing with environmental manage-ment, and in the case of Rio de Janeiro, protecting biodiversity represents an addi-tional major challenge.
In principle it can be accepted that the standard requirements for environmental compatibility of the Olympic Games in Rio de Janeiro will be met, at least as far as planning to meet those requirements is concerned, as the Sustainability Plan contains all essential aspects of modern environmental management. It is hoped that these ideas concerning environmental sustainability will actually be implemented in prac-tice. In this regard, the IOC as well as the national and international public will play an important oversight function.
For all the virtues of the Sustainability Plan, Rio de Janeiro should not only adhere to its ‘obligatory programme’, but should also utilise the staging of the Olympic Games and the FIFA World Cup™ to implement ‘optional environmental programmes’ as well. The very concept of sustainable development is closely linked with Rio, where the groundbreaking UN Climate Summit was held in 1992, which was an important milestone in the development of global environmental policy. In 2012 Rio will again become the stage for a UN Environmental Summit that will have the ‘Green Economy’ as one of its central topics. This is an excellent reason to use Rio’s upcoming mega-events in innovative ways to set new standards in the area of environmental manage-ment, and particularly to leverage the mega-events for environmental-political agenda setting (e.g., around the Green Economy and a low Carbon Society).
Revitalising the harbour precinct and re- generating Rio’s waterways are important prerequisites for economic development and the growth of tourism. (Source: Giancarlo Liguori/Shutterstock.com)
and Barra de Tijuca, which are of particular significance for tourism, have no subway connection. The construction of a suitable subway route (light orange) that would lead through these suburbs is now planned. The implementation of the BRT system linking the airport (Jobim) with the inner city and the northern with the southern suburbs is of similar importance. In addition, upgrading airport infrastructure and revitalising the harbour precinct are also in line with the development needs of the city.
Investments in the improvement of transport and traffic infrastructure in Rio de Janeiro are important prerequisites for the further economic development of the city and, in particular, for the growth of tourism. Furthermore, such substantial improve-ments of public transport will benefit the poorer population groups in particular, meaning that this ‘legacy’ is also of social relevance.
But also from an environmental perspective, such investments will leave a positive legacy. The modernisation of the transport sector and particularly the upgrading of the subway can make a significant contribution to the reduction of greenhouse gas emissions in Rio de Janeiro. As mentioned, 40% of the total emissions are generated by the transport sector, the outdated, high-emission bus fleet being a major contribu-tor. The intended transformation of buses from diesel to bio-ethanol warrants particu-lar mention in this regard.
Another aspect that is positive for Rio’s city development has to do with the con-struction of sport centres, as well as the creation of green areas and parks and the construction of new bicycle lanes in the city. Rio de Janeiro is a city of sport-fanatics who will benefit from the upgraded sport facilities. It is anticipated that these invest-ments will further increase the recreational value of the city and that in the years after the Olympic Games, Rio will be more attractive for hosting additional cultural or sport mega-events.
4.3.2 Environmental Impacts In considering the extent to which Rio’s staging of its series of mega-events can contribute to the further development of the local, national and international en-vironmental agenda, two aspects should be distinguished. One pertains directly to the energy and environmental management system of the Olympic Games itself. The other pertains to the event as an ‘ecological display’ (of sustainability strategies, environmental technologies, etc.) that can assume an important function in setting an environmental-political agenda.
Rio’s Government has been investing in the expansion of subway lines aiming for an improvement in the public transport system for the 2014 FIFA World Cup™ and the 2016 Olympic Games. (Source: Berg Silva/Globo via Getty Images)
it is hoped that these ideas concerning envi-ronmental sustainability will actually be imple-mented in practice. in this regard, the ioC as well as the national and international public will play an important over-sight function ”
“
108 • SuStainable Mega-eventS in Developing CountrieS references • 109
Accountancy SA: World Cup 2010 Report Back. www.accountancysa.org.za. 2011.
Agência Nacional de Aguas (ANA): Plano Estratégico de Recursos Hídricos das Bacias Hidrográficas dos Rio Guandu, da Guarda e Guandu Mirim. Relatório Sistese. Brasília 2007.
Agrawal, S. K. and J. Chawla: “Seismic Hazard assessment for Delhi region.” Current Science 91(12): 1717. 2006.
Second Administrative Reforms Commission (ARC): “Local Governance: An inspiring journey into the future.” Government of India: 422 pages. 2007.
Baade, R. and V. Matheson: ”Bidding for the Olympics: Fool’s Gold?” Transatlantic Sport: The Comparative Econom-ics of North American and European Sports London: Edward Elgar Publishing: 127-151. 2002.
Bastos Cezar, P.: Evolução da População de Favelas na Cidade do Rio de Janeiro: uma Reflexão sobre os Dados Mais Recentes. Rio de Janeiro 2002.
Baviskar, A: “Demolishing Delhi: World Class City in the Making“ Mute. Available from http://www.metamute.org/en/Demolishing-Delhi. 5 September 2006.
Brajer, V. and R. Mead: “Blue skies in Beijing? Looking at the Olympic Effect.” The Journal of Environment and Devel-opment 12(2): 239-263. 2003.
Borchers, M. et al: The Green Goal 2010 Legacy Report. Cape Town 2011.
Burton, R.: “Olympic Games host city marketing: an exploration of expectations and outcomes.” Sport Marketing Quarterly 12(1): 37-47. 2003.
CAEP-TERI: “Environment and Development: China and India (English version).” Joint study by the Chinese Academy for Environmental Planning (CAEP) and The Energy and Resources Institute (TERI), commissioned by CCCED and ICSD New Delhi, TERI Press: 466 pages. 2011.
Câmera Municipal do Rio de Janeiro: Plano de Legado Urbano e Ambiental. Olimpíadas Rio 2016. Rio de Janeiro 2008.
Câmera Municipal do Rio de Janeiro: Substititivo Nr. 3 Politica Urbana – Plano Diretor da Cidade do Rio de Janeiro. Rio de Janeiro 2006.
CEBDS: Guidelines for the Sustainability of Mega-events. Rio de Janeiro 2010.
City of Cape Town: Energy and Climate Change Strategy. 2006.
City of Cape Town: Housing Department Report. 2008.
City of Cape Town: Smart Event Handbook. Cape Town 2010a.
City of Cape Town: 2010/11 Integrated Development Plan. 2010b.
City of Cape Town: Close Out Report for 2010 FIFA World Cup. 2010c.
City of Cape Town: Host City Cape Town 2010 FIFA World Cup™ Green Goal Legacy Report. 2011.
Clinton Foundation: Clinton Foundation Annual Report. 2009.
Comptroller and Auditor General of India (CAG): “Preparedness for the XIX Commonwealth Games 2010.” 2009.
Comptroller and Auditor General of India (CAG): “Audit Report of the XIXth Commonwealth Games 2010.” Govern-ment of India: 743 pages. 2011.
Cottle, E.: A preliminary evaluation of the impact of the 2010 FIFA World Cup: South Africa. September 2010.
Davies, L.: “Sport and economic regeneration: a winning combination?” Sports in Society 13(10): 1438-1457. 2010.
Dickson, G. and G. Schofield: “Globalization and globesity: The impact of 2008 Beijing Olympics on China.” Interna-tional Journal of Sport Management and Marketing 1(1/2): 169-179. 2005.
Dupont, V: “Slum demolitions in Delhi since the 1990s: an appraisal.” Economic and Political Weekly 43(28): 79–87. 2008.
Econ-Poyry: Feasibility Study for a Carbon Neutral 2010 FIFA World Cup in South Africa. Department of Environ-mental Affairs and Tourism and Norwegian Embassy. February 2009.
Equations: ““Humanity-Equality-Destiny?”: Implicating Tourism in the Commonwealth Games 2010.” Equations: 109. 2010.
Euromonitor International: Country Market Insight (2010), “Travel and Tourism – India”, http://www.siimt.com/work/sites/siimt/resources/LocalContent/774/9/tt_india_2010.pdf. June 2010.
FIFA: Financial Report. 2010.
Fundação SOS Mata Atlântica e Instituto Nacional de Pesquisas Espaciais (INPE): Atlas dos Remanescentes Florestais da Mata Atlântica. Período 2005-2008. São Paulo 2009.
Globalscan et al: Megacities Challenges. Munich 2010.
Grant Thornton: Fewer Visitors Staying Longer. www.big4.com April 21 2009.
referenCeSGovernment of India (GoI): “Inputs for the Second Preparatory Committee Meeting, United Nations Conference on Sustainable Development (UNCSD).” Government of India (GoI): Available from http://www.uncsd2012.org/files/response-member-states/Questionnaire-Email-submission-India(Attachment).pdf 2010.
Global Footprint Network and Confederation of Indian Industry (GFN and CII): “India’s Ecological Footprint: a business perspective.” Hyderabad, India. 2008.
Government of India (GoI): Economic Survey. New Delhi: Ministry of Finance, Government of India. 2011.
Government of National Capital Territory Delhi (GoNCTD): Delhi Economic Survey 2008-09. Department of Planning. 2009.
Government of National Capital Territory Delhi (GoNCTD): “State of Environment Report for Delhi, 2010.” Depart-ment of Environment and Forests, Government of National Capital Territory of Delhi (GoNCTD): 70 pages. 2010.
Governo Federal do Brasil: Brasil 2003-2010. Brasília 2010.
Gupta, S., R. Sundaram, et al: “Liquefaction Susceptibility Study at Commonwealth Games Village, Delhi.” Available from http://cengrs.com/images/2_Liquefaction_Susceptibility_Study_at_CWG-IGC-2008.pdf Cengrs Geotech-nica and Indian Institute of Technology. 2008.
Hall, C. M.: “The definition and analysis of hallmark tourist events.” GeoJournal 19(3): 263-268. 1989.
High Level Committee (HLC) constituted by the Government of India: “High Level Committee Report: Common-wealth Games 2010.” Available from http://india.gov.in/high_level/reports.htm. 2011.
Horne, J. and W. Manzenreiter: An Introduction to the Sociology of Sports Mega-events. Sociological Review 54: 2-24. 2006.
Housing and Land Rights Network (HLRN): “Whose Wealth? Whose Common?” Housing and Land Rights Network (HLRN), South Asia Regional Programme, Habitat International Coalition: 77 pages. 2010.
IDASA: What’s left after the World Cup? ePoliticsSA Edition 01, 2010.
Indian Institute of Management-Ahmedabad (IIM-A), as reported in the Times of India: “IIM-A students measure CWG carbon footprint”, http://articles.timesofindia.indiatimes.com/2010-10-23/ahmedabad/28215110_1_ carbon-footprint-cwg-venues-c02. 23 October 2010.
India-Brazil-South Africa (IBSA): Brasília Declaration. IBSA Dialogue Forum Fourth Summit of Heads of State/Government. 16 April 2010.
Instituto Brasileiro de Geografia e Estatísticas (IBGE): Pesquisa Nacional de Saneamento Básico 2008. Rio de Janeiro 2010.
Institute for Security Studies (ISS): Player and Referee: Conflicting interests and the 2010 FIFA World Cup. April 2010.
Instituto de Pesquisa Econômica Aplicada (IPEA): Eventos Internacionais: Compensar Investir? Brasília 2009.
International Olympic Committee (IOC): Planning, Coordination & Management. Technical Manual on Planning, Coordination and Management of the Olympic Games. Lausanne 2005.
International Olympic Committee (IOC): Factsheet – The Environment and the Sustainable Development. Lausanne 2009.
International Olympic Committee (IOC): Olympic Marketing. Lausanne 2010a.
International Olympic Committee (IOC): Factsheet – Roles and Responsibilities during the Olympic Games. Lausanne 2010b.
International Olympic Committee (IOC): Olympic Charter. Lausanne 2010c.
Kumar, R.: Mega-events and city sustainability. Project consultation. S. Kedia, Interviewer. 23 March 2011.
Lefevre, N.: World Cup in South Africa to benefit the poor? 22 June 2010.
Mathen, M: Wits Business School seminar on the IT benefits of the World Cup ICT investments. 25 August 2010.
McKinsey and Company: 2030 Water Resource Group. Charting our Water Future. 2009.
Mehrotra et al: “Framework for City Climate Risk Assessment.” Center for Climate Systems Research at Columbia University. www.uccrn.org/research.html. World Bank. 2009.
Ministério do Esporte, Governo do Estado do Rio de Janeiro und Prefeitura Municipal do Rio de Janeiro: Candi-dature File for Rio de Janeiro to Host the 2016 Olympic and Paralympics Games. Brasília 2009.
Ministry of Environment and Forests (MoEF): “River Zone Control Act.” Government of India: Available from http://www.pib.nic.in/newsite/erelease.aspx?relid=74045. 2011.
Ministry of Health and Family Welfare and The Urban Health Resource Centre (MoHFW-UHRC): “State of Urban Health in Delhi 2007.” Government of India: 108 pages. 2007.
Ministry of Home Affairs (MoHA): “Census 2011 (Provisional estimates).” Ministry of Home Affairs (MoHA), Govern-ment of India. 2011.
110 • SuStainable Mega-eventS in Developing CountrieS references • 111
Ministry of Home Affairs (MoHA): “Crime in India 2009 Statistics” National Crime Records Bureau, Government of India. 2010.
Ministry of Statistics and Programme Implementation (MoSPI): “Millennium Development Goals – India Country Report 2009 (Mid‐Term Statistical Appraisal).” Central Statistical Organization, Ministry of Statistics and Pro-gramme Implementation (MoSPI), Government of India: 94 pages. 2009.
Neri, M.: Desigualdades e Favelas Cariocas. A Cidade Partida está se Integrando? Rio de Janeiro 2010.
OC 2006 FIFA World Cup and the Federal Ministry for the Environment, Nature Conservation and Nuclear Safety: Green Goal Legacy Report. Frankfurt 2006.
Pande J N, Bhatta N, Biswas D, Pandey R M, Ahluwalia G, Siddaramaiah N H, Khilnani G C.: “Outdoor Air Pollution and Emergency Room Visits at a Hospital in Delhi”. The Indian Journal of Chest Diseases & Allied Sciences 44 (1): 13–20. 2002.
Prefeitura Municipal do Rio de Janeiro (PMRJ): Plano Estratégico da Prefeitura do Rio de Janeiro 2009-2012. “Rio Pós 2016”. Rio de Janeiro 2009.
Prefeitura Municipal do Rio de Janeiro (PMRJ): O Inventário das Emissões de Gases de Efeito Estufa da Cidade do Rio de Janeiro. Resumo Executivo. Rio de Janeiro 2010.
Press Trust of India (PTI): “CWG 2010 will result in economic impact of $4,940 million”. http://cwg.ndtv.com/com-monwealth/article/id/spoen20100155170/type/features/CWG-2010-will-result-economic-impact-of-$4,940-million-56576.html. 3 October 2010.
Preuss, H.: The Economics of staging the Olympics. Northhampton 2004.
Preuss, H.: The Economics of Staging the Olympics – A Comparison of the Games 1972-2008. Cheltenham 2004.
Ramanathan, U: “Demolition drive.” Economic and Political Weekly: 2908-2912. 2005.
Roche, M.: “Mega-events and urban policy.” Annals of Tourism Research 21: 1-19. 1994.
Siemens AG: Pictures of the Future. Die Zeitschrift für Forschung und Innovation. Frühjahr 2010. Themenheft “Grüne Städte”. München 2010.
South African LOC (SA LOC): www.sa2010.gov.za. 2010.
South African Ministry of Finance: South Africa’s infrastructure legacy after the 2010 FIFA World Cup and what it means to an emerging economy. Finance Minister Speech, 22 July 2010.
South African Tourism: Impact of 2010 FIFA World Cup. www.southafrica.net/research. 2011.
Spirn, A. W. and D. Cherian: Pairing mega-events and hydrological systems for urban sustainability: strategy framework for Delhi beyond the Commonwealth Games 2010, Massachusetts Institute of Technology. 2004.
Sustainable Energy Africa: Energy Scenarios for Cape Town. January 2011.
Thakal, S.: “Commonwealth Games Impact on Tourism”. Indian Industry Tracker. http://industrytracker.wordpress.com/2010/11/18/commonwealth-games-impact-on-tourism. 18 November 2010.
Trusen, C.: “Green Economy”, “Green Growth” y Estrategias de Crecimiento Sustentables. En: Konrad Adenauer Stiftung (Ed.): Clima, Energia y Medio Ambiente. Santiago de Chile 2010. 67-84.
United Nations Environment Programme (UNEP): Towards a Green Economy. Pathways to Sustainable Develop-ment and Poverty Eradication. A Synthesis for Policy Makers. Nairobi 2011a.
United Nations Environment Programme (UNEP): Towards a Green Economy. Pathways to Sustainable Develop-ment and Poverty Eradication. Full Report. Nairobi 2011b.
United Nations General Assembly (UNGA): G.A. Resolution 265, 60th Session. UN Doc. A/RES/60/265. 2006.
UN-HABITAT: State of the World’s Cities 2008/2009. Harmonious Cities. London 2008.
UN- HABITAT: State of World’s Cities 2010/2011: Bridging the Urban Divide. Nairobi, 2010a.
UN- HABITAT: State of the World’s Cities 2010/2011. Urban Trends: Urbanization and Economic Growth. Nairobi 2010.
UN-HABITAT: “Sustainable Cities and Local Governance.” United Nations Human Settlements Programme. 1998.
United States Census Bureau (US Census Bureau): International Data Base (IDB) estimates; Available from http://www.census.gov/ipc/www/idb/informationGateway.php. 2011.
Uppal, V. “The Impact of the Commonwealth Games 2010 on Urban Development of Delhi.” Theoretical and Empiri-cal Researches in Urban Management 1(10): 7-29. 2009.
Varrel, A. and Kennedy, L: Mega-Events and Megaprojects. Policy Brief 3. Chance2 Sustain, EADI. Bonn 2011.
Weishaupt Proni, M. et al.: Leitura Econômica dos Jogos Olímpicos: Financiamento, Organização e Resultados. IPEA, Rio de Janeiro 2008.
Weishaupt Proni, M.: Observações sobre os Impactos Econômicos Esperados dos Jogos Olímpicos de 2016. Em Motrivivência. No. 32-33. 2010, 49-70.
liSt of tableSTable 1: Drivers of urban population growth in developing countries 16Table 2: Key challenges in the host cities Delhi, Cape Town and Rio de Janeiro 20Table 3: Green Goal lessons learnt, challenges and recommendations 35Table 4: Sustainable development priorities significantly affected by the
2010 FIFA World Cup™ 47Table 5: Key facts for the 2010 FIFA World Cup™ 48Table 6: Key World Cup pillars of FIFA and of the host country 48Table 7: FIFA 2010 financial situation 49Table 8: South African national expenditure breakdown on World Cup 49Table 9: Expenditure on infrastructure in Cape Town 50Table 10: South African stadium expenditure – actual vs. estimated 50Table 11: 2010 FIFA World Cup™ national carbon footprint (pre-event estimates) 53Table 12: Impact of the Cape Town Green Goal programme 55Table 13: Cape Town World Cup carbon footprint (actual post-event figures) 55Table 14: Cape Town’s carbon mitigation and offset initiatives 56Table 15: Estimated vs. actual visitor statistics 57Table 16: Cape Town job creation figures for the World Cup 58Table 17: Summary of main effects linked to sustainable development 60Table 18: Tourist arrivals in Delhi in October (2005-2010) 73Table 19: Summary of impacts in Agenda 21 framework 80Table 20: Population of Rio favelas 1991-2020 91Table 21: Planned cost structure of the 2016 Olympic Games in Rio (in 2008 USD) 97Table 22: The OCOG-Budget of the Rio 2016 Olympic Games 98Table 23: The Non-OCOG Budget of the Rio 2016 Olympic Games 99
liSt of figureSFigure 1: The demand and supply scenario of water 19Figure 2: Components linked to sustainable development 21Figure 3: Proportion of public and private financing of Olympic Games and
study mega-events 27Figure 4: Map of South Africa 45Figure 5: Cape Town energy picture 47Figure 6: Cape Town carbon emissions picture 47Figure 7: Host city locations 48Figure 8: Boundaries of National Capital Territory and National Capital Region 69Figure 9: Trends in population below poverty line in Delhi 69Figure 10: Business model of 2010 Delhi mega-event 71Figure 11: Expenditure by activity for CWG 2010 (in USD millions) 71Figure 12: Trends GSDP in Delhi (2000-2009) 72Figure 13: National Capital Territory of New Delhi budgetary scenarios 74Figure 14: Locations of Pan India Plantation 77Figure 15: Key events of civil society participation related to the Games Village 78Figure 16: Land use change around Commonwealth Games Village area:
2000 and 2010 78Figure 17: The Sustainability Framework of the 2016 Olympic Games in Rio 102Figure 18: Map of Rio subway routes 105

112 • SuStainable Mega-eventS in Developing CountrieS
Konrad-adenauer-STiFTung 60 Hume Road, Dunkeld, Johannesburg 2196, South Africa
Tel: +27 11 214 2900Fax: +27 11 214 2913/4E-mail: [email protected]: www.kas.org.za/www.kas.de
photographiC CreDitS
Jeff AyliffeLeonardo BarbosaCWG Environment and Sustainability DivisioneThekwini MunicipalityGetty Image LibraryShailly KediaStephen LambSheryl OzinskyPeter RetiefNikki RixonShutterstock.comBruce Sutherland, official photographer of the City of Cape TownCoco van OppensBhole Vishwakarma
proDuCtion
Project Manager: Christina TeichmannProject Coordinator: Sheryl Ozinskyauthors: Mark Borchers, SEA (South Africa case study) Shailly Kedia, TERI (India case study) Dr Christoph Trusen, GITEC GmbH (Brazil case study)editor: Kurt Ackermanndesign: Bryony van WykPrinter: Print Communications
© Konrad-Adenauer-Stiftung and the authors 2011
iSBn 978-0-9870243-0-5

![Brazil and Cybersecurity in the Aftermath of the Snowden Revelations [Konrad Adenauer Foundation, 2014]](https://img.pdfslide.net/doc/110x75/631ea95cdc32ad07f307b0d8/brazil-and-cybersecurity-in-the-aftermath-of-the-snowden-revelations-konrad-adenauer.jpg)


