Embed Size (px)
Citation preview
Melting and Phase Relations of CarbonatedEclogite at 9^21GPa and the Petrogenesis ofAlkali-Rich Melts in the Deep Mantle
EKATERINA S. KISEEVA1*, KONSTANTIN D. LITASOV2,3,GREGORY M. YAXLEY1, EIJI OHTANI4 ANDVADIM S. KAMENETSKY5
1RESEARCH SCHOOL OF EARTH SCIENCES, AUSTRALIAN NATIONAL UNIVERSITY, CANBERRA, ACT 0200, AUSTRALIA
2V. S. SOBOLEV INSTITUTE OF GEOLOGY AND MINERALOGY, SIBERIAN BRANCH, RUSSIAN ACADEMY OF SCIENCE,
NOVOSIBIRSK, 630090, RUSSIA
3NOVOSIBIRSK STATE UNIVERSITY, NOVOSIBIRSK, 630090, RUSSIA
4DEPARTMENT OF EARTH AND PLANETARY MATERIAL SCIENCE, FACULTY OF SCIENCE, TOHOKU UNIVERSITY,
SENDAI 980-8578, JAPAN
5ARC CENTRE OF EXCELLENCE IN ORE DEPOSITS AND SCHOOL OF EARTH SCIENCES, UNIVERSITY OF TASMANIA,
HOBART, TAS. 7001, AUSTRALIA
RECEIVED JUNE 15, 2012; ACCEPTED MARCH 15, 2013
The melting and phase relations of carbonated MORB eclogite have
been investigated using the multi-anvil technique at 9^21GPa and
1100^19008C.The starting compositions were two synthetic mixes,
GA1 and Volga, with the CO2 component added as CaCO3 (cc):
GA1þ10%cc (GA1cc) models altered oceanic crust recycled into
the convecting mantle via subduction, and Volgaþ10%cc (Volga-
cc) models subducted oceanic crust that has lost some of its siliceous
component in the sub-arc regime (GA1 minus 6·5 wt % SiO2).The
subsolidus mineral assemblage at 9 and 13 GPa includes garnet,
clinopyroxene, magnesite, aragonite, a high-pressure polymorph of
TiO2 (only at 9 GPa) and stishovite (only at 13 GPa). At 17^
21GPa clinopyroxene is no longer stable; the mineral assemblage con-
sists predominantly of garnet with subordinate magnesite (only at
17 GPa), Na-rich aragonite, stishovite, Ca-perovskite (mostly at
21GPa), and K-hollandite (mostly at 17 GPa). Na-carbonate with
an inferred composition (Na,K)2(Ca,Mg,Fe)(CO3)2 was present
in Volga-cc at 21GPa and 12008C. Diamond (or graphite) crystal-
lized in most runs in the GA1cc composition, but it was absent in ex-
periments with the Volga-cc composition. In Volga-cc, the solidus
temperatures are nearly constant between 1200 and 13008C over the
entire pressure range investigated. In GA1cc, the solidus is located at
similar temperatures at 9^13 GPa, but at higher temperatures of
1300^15008C at 17^21GPa. The difference in solidi between the
GA1cc and Volga-cc compositions can be explained by a change in
Na compatibility between 13 and 17 GPa as omphacitic clinopyroxene
disappears, resulting in the formation of Na-carbonate or Na-rich
melt in Volga-cc. The solidus temperature in GA1cc also increases
with increasing pressure as a consequence of carbonate reduction
and diamond precipitation, possibly brought on either via progressive
Fe2þ^Fe3þ transition in garnet at higher pressures or by a decrease
of the activity of the diopside component in clinopyroxene.The low-
degree melts are highly alkalic (K-rich at 9^13 GPa and Na-rich at
17^21GPa) carbonatites, changing towards SiO2-rich melts with
increasing temperature at constant pressure.The solidi of both com-
positions remain higher than typical subduction pressure^tempera-
ture (P^T) profiles at 5^10 GPa; however, at higher pressures the
flat solidus curve of carbonated eclogite may intersect the subduction
P^T profile in the Transition Zone, where carbonated eclogite can
produce alkali- and carbonate-rich melts. Such subduction-related
alkali-rich melts can be potential analogues of kimberlite and
*Corresponding author. Department of Earth Sciences, South Parks
Road, Oxford, OX13AN, UK; E-mail: [email protected]
� The Author 2013. Published by Oxford University Press. All
rights reserved. For Permissions, please e-mail: journals.permissions@
oup.com
JOURNALOFPETROLOGY VOLUME 0 NUMBER 0 PAGES1^29 2013 doi:10.1093/petrology/egt023
Journal of Petrology Advance Access published May 6, 2013
at Bodleian L
ibrary on May 7, 2013
http://petrology.oxfordjournals.org/D
ownloaded from
carbonatite melt compositions and important agents of mantle meta-
somatism and diamond formation in theTransition Zone and in cra-
tonic roots. Melting of carbonated eclogite produces a garnet-bearing
refractory residue, which could be stored in the Transition Zone or
lower mantle.
KEY WORDS: high-pressure experiments; MORB eclogite; mantle;
Transition Zone; carbonate metasomatism; kimberlite formation;
diamonds
I NTRODUCTION
Subducted slabs of oceanic lithosphere, containing pelagic
sediments and hydrothermally altered basalts (MORB)
formed at a mid-ocean ridge by sea-floor spreading, are
one of the major sources for geochemical heterogeneity in
the mantle, transporting incompatible trace elements and
water. The amount of carbon in the primordial and
modern Earth, and the magnitude of carbon fluxes be-
tween the mantle, the crust, the hydrosphere and the at-
mosphere are highly uncertain (e.g. Zhang & Zindler,
1993; Sleep & Zahnle, 2001; Dasgupta & Hirschmann,
2010). Large amounts of carbon may be introduced into
the mantle by subduction of oceanic crust, which may con-
tain43wt % CO2 in its uppermost few hundred metres
(Alt & Teagle, 1999; Staudigel, 2003). Some of the sub-
ducted material may undergo partial melting in the sub-
arc regime, releasing the most incompatible and volatile
components back to the surface via arc magmatism, or
later by contributing to MORB, hotspot or continental
magmatism. However, both thermal modelling of sub-
ducting slabs and thermodynamic and experimental con-
straints on slab dehydration and decarbonation
indicate that decomposition of carbonate-bearing species
occurs at much higher depths than that of water-bearing
species, allowing preferential subduction of some slab car-
bonate relative to hydrous species (e.g. Yaxley & Green,
1994; Bebout, 1995; Poli & Schmidt, 1995; Kerrick &
Connolly, 2001). Consequently, slabs should transport
H2O-poor and carbonate-rich eclogite deep into the
Earth’s mantle.
Most previous experimental studies on carbonated
eclogite have been performed at pressures �10GPa
(Hammouda, 2003; Dasgupta et al., 2004, 2005; Yaxley &
Brey, 2004; Gerbode & Dasgupta, 2010; Kiseeva et al.,
2012). These studies reported a variety of solidus tempera-
tures and shapes, attributed to compositional differences
in the starting mixes, such as Na2O/CO2, Mg# [molar
Mg/(MgþFe)], Ca# [molar Ca/(CaþMgþFe)], the
abundances of alkali components, and minor but variable
amounts of water.
The solidi of carbonated eclogite at higher pressures
from 10 to 32GPa have been reported only for simplified
chemical systems, such as Na-CMASþ 5% CO2 by
Litasov & Ohtani (2010) and CMASþ 20% CO2 by
Keshav & Gudfinnsson (2010). A previous study of repre-
sentative carbonated eclogites at 3·5^5·5GPa (Kiseeva
et al., 2012) showed the great importance of minor compo-
nents, especially alkalis. Small amounts of K2O and P2O5
in subducted MORB can significantly decrease its solidus
temperature. The present study is the first to investigate at
P410GPa a complex natural composition, which includes
the additional and potentially highly influential compo-
nents FeO and K2O.
The focus of this study is to determine the phase rela-
tions (and particularly solidus temperatures) in the deep
upper mantle and Transition Zone (9^21GPa, correspond-
ing to a depth interval of 180^600 km) of carbonated
eclogite, modelling deeply subducted, altered MORB. The
effects of variable alkali and SiO2 contents on solidus tem-
peratures and phase compositions are examined. The re-
sults are applied to the stability of different carbon-
bearing phases in the deep mantle and their roles in
mantle melting and metasomatism and generation of kim-
berlitic and alkaline magmas.
EXPER IMENTAL AND
ANALYT ICAL PROCEDURES
Starting composition
Two eclogite compositions (GA1 and Volga) were used as
starting materials (Table 1). The GA1 composition repre-
sents altered oceanic basalt (MORB) and is somewhat en-
riched in alkalis compared with fresh MORB
compositions (Yaxley & Green, 1994). Volga is identical to
GA1, but with 6·5% less SiO2. To both compositions, 10 wt
% of pure CaCO3 (cc) was added, producing GA1þ10%
CaCO3 (GA1cc) and Volgaþ10% CaCO3 (Volga-cc).
The GA1cc composition models subducted, altered, mafic
oceanic crust. Volga-cc models subducted altered mafic
crust, which may have lost a siliceous component during
dehydration and/or silicate melting in the subduction
zone. Altered oceanic crust contains typically no more
than 3wt % CaCO3. The enhanced carbonate propor-
tions in the current experiments were designed to aid in
the detection of carbonate phases in experimental run
products. Details of the starting material preparation,
phase relations and mineral assemblage at 3·5^5·5GPa for
GA1cc have been given by Kiseeva et al. (2012).The prepar-
ation of the Volga-cc composition was identical to that for
GA1cc.
Experimental techniques
The experiments were conducted using a 3000 ton Kawai-
type multianvil apparatus at Tohoku University, Sendai,
Japan. For experiments at 9^13GPa, the truncated edge
length (TEL) of the tungsten-carbide anvils was 5·0mm,
and for experiments at 17^21GPa the TEL was 3·5mm.
JOURNAL OF PETROLOGY VOLUME 0 NUMBER 0 MONTH 2013
2
at Bodleian L
ibrary on May 7, 2013
http://petrology.oxfordjournals.org/D
ownloaded from
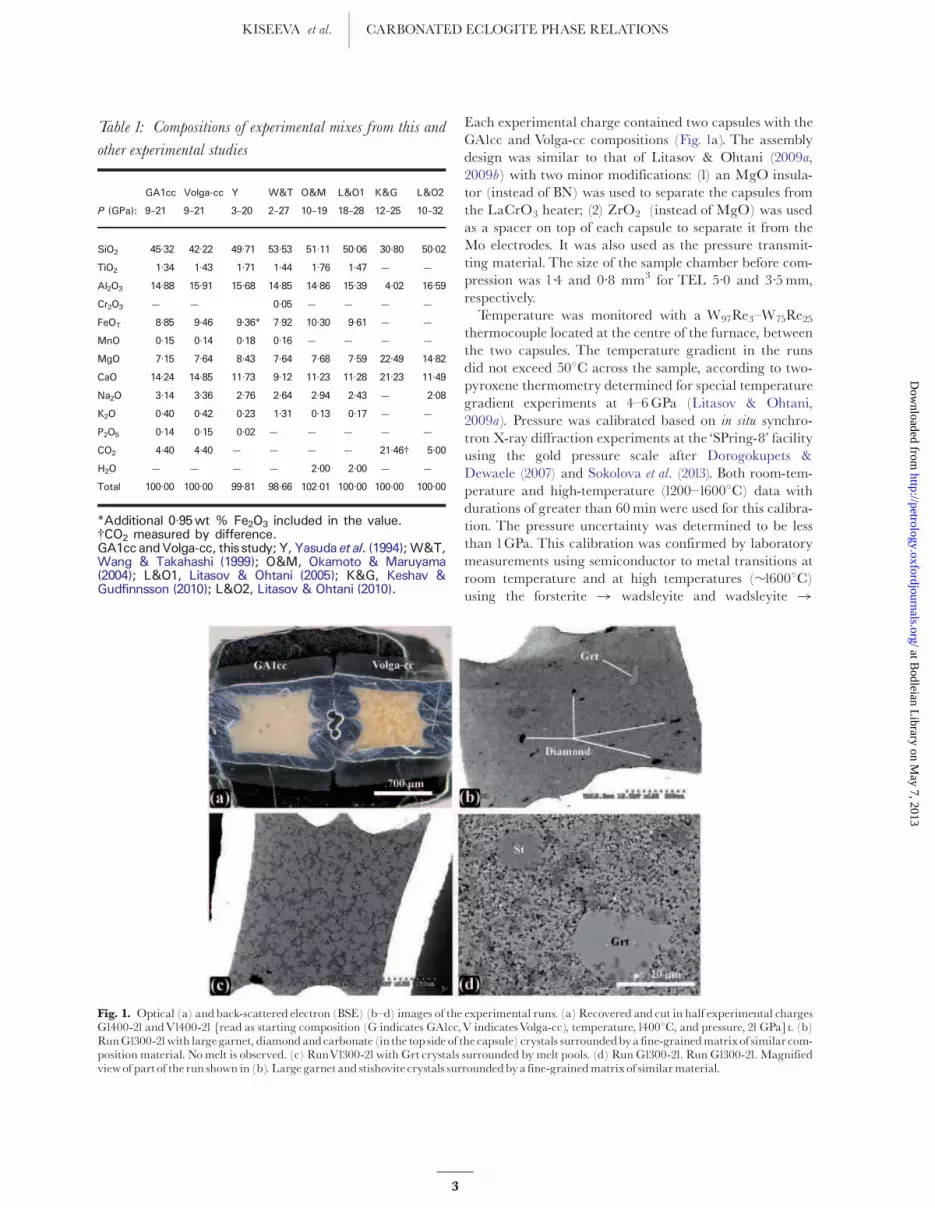
Each experimental charge contained two capsules with the
GA1cc and Volga-cc compositions (Fig. 1a). The assembly
design was similar to that of Litasov & Ohtani (2009a,
2009b) with two minor modifications: (1) an MgO insula-
tor (instead of BN) was used to separate the capsules from
the LaCrO3 heater; (2) ZrO2 (instead of MgO) was used
as a spacer on top of each capsule to separate it from the
Mo electrodes. It was also used as the pressure transmit-
ting material. The size of the sample chamber before com-
pression was 1·4 and 0·8 mm3 for TEL 5·0 and 3·5mm,
respectively.
Temperature was monitored with a W97Re3^W75Re25thermocouple located at the centre of the furnace, between
the two capsules. The temperature gradient in the runs
did not exceed 508C across the sample, according to two-
pyroxene thermometry determined for special temperature
gradient experiments at 4^6GPa (Litasov & Ohtani,
2009a). Pressure was calibrated based on in situ synchro-
tron X-ray diffraction experiments at the ‘SPring-8’ facility
using the gold pressure scale after Dorogokupets &
Dewaele (2007) and Sokolova et al. (2013). Both room-tem-
perature and high-temperature (1200^16008C) data with
durations of greater than 60min were used for this calibra-
tion. The pressure uncertainty was determined to be less
than 1GPa. This calibration was confirmed by laboratory
measurements using semiconductor to metal transitions at
room temperature and at high temperatures (�16008C)
using the forsterite ! wadsleyite and wadsleyite !
Fig. 1. Optical (a) andback-scattered electron (BSE) (b^d) images of the experimental runs. (a) Recovered and cut in half experimental chargesG1400-21andV1400-21 [read as starting composition (G indicates GA1cc,V indicatesVolga-cc), temperature,14008C, and pressure, 21GPa]". (b)RunG1300-21with largegarnet, diamondandcarbonate (inthe top side of the capsule) crystals surroundedbya fine-grainedmatrixof similar com-position material. Nomelt is observed. (c) RunV1300-21with Grt crystals surrounded by melt pools. (d) Run G1300-21. Run G1300-21. Magnifiedviewof part of the run shown in (b). Large garnet and stishovite crystals surroundedbya fine-grainedmatrixof similarmaterial.
Table 1: Compositions of experimental mixes from this and
other experimental studies
GA1cc Volga-cc Y W&T O&M L&O1 K&G L&O2
P (GPa): 9–21 9–21 3–20 2–27 10–19 18–28 12–25 10–32
SiO2 45·32 42·22 49·71 53·53 51·11 50·06 30·80 50·02
TiO2 1·34 1·43 1·71 1·44 1·76 1·47 — —
Al2O3 14·88 15·91 15·68 14·85 14·86 15·39 4·02 16·59
Cr2O3 — — 0·05 — — — —
FeOT 8·85 9·46 9·36* 7·92 10·30 9·61 — —
MnO 0·15 0·14 0·18 0·16 — — — —
MgO 7·15 7·64 8·43 7·64 7·68 7·59 22·49 14·82
CaO 14·24 14·85 11·73 9·12 11·23 11·28 21·23 11·49
Na2O 3·14 3·36 2·76 2·64 2·94 2·43 — 2·08
K2O 0·40 0·42 0·23 1·31 0·13 0·17 — —
P2O5 0·14 0·15 0·02 — — — — —
CO2 4·40 4·40 — — — — 21·46y 5·00
H2O — — — — 2·00 2·00 — —
Total 100·00 100·00 99·81 98·66 102·01 100·00 100·00 100·00
*Additional 0·95wt % Fe2O3 included in the value.yCO2 measured by difference.GA1cc andVolga-cc, this study; Y, Yasuda et al. (1994);W&T,Wang & Takahashi (1999); O&M, Okamoto & Maruyama(2004); L&O1, Litasov & Ohtani (2005); K&G, Keshav &Gudfinnsson (2010); L&O2, Litasov & Ohtani (2010).
KISEEVA et al. CARBONATED ECLOGITE PHASE RELATIONS
3
at Bodleian L
ibrary on May 7, 2013
http://petrology.oxfordjournals.org/D
ownloaded from
ringwoodite transitions in Mg2SiO4 (Litasov & Ohtani,
2009a, 2009b).
Au75Pd25 capsules were used as sample containers,
which were found to be the best material to avoid a hydro-
gen flux into and out of the capsule during the experiments
(Nishihara et al., 2006). Sample parts were fired in the
oven at 8508C and pyrophyllite gaskets were heated at
2308C for several hours prior to the experiment.
Encapsulated starting mixtures were dried in the oven at
3008C for 1h before final sealing by arc welding. These
procedures minimized penetration of hydrogen into the
sample chamber during the experiments.
Experiments were conducted at 9, 13, 17 and 21GPa,
over a range of temperatures between 1100 and 18008C.
After recovery, the Au^Pd capsule was cut in two using
a 0·15 mm thick diamond saw and petroleum benzene cut-
ting fluid to preserve water-soluble phases. One half was
then mounted into epoxy resin and rough polished on
abrasive paper under petroleum benzene (Fig. 1a). The
samples were then reimpregnated with epoxy resin under
vacuum, followed by final polishing with oil-based dia-
mond paste.
Analytical techniques
Run products were analysed using both wavelength- and
energy-dispersive (WDS and EDS) spectroscopy. All
phases were analysed using aJEOL 6400 scanning electron
microscope fitted with an energy-dispersive detector at
the Centre for Advanced Microscopy, ANU. Spectra were
acquired using a 15 kVaccelerating voltage,1 nA beam cur-
rent, and an acquisition time of 120 s. Garnet and clinopyr-
oxene were also analysed on a Cameca SX100 at the
University of Tasmania, using a beam current of 30 nA
and accelerating voltage of 15 kV.
The compositions of garnets and pyroxenes measured
using both EDS andWDS differ by less than 5%, consist-
ent with the work of Spandler et al. (2010), who compared
multiple EDS and WDS analyses (using the electron
microprobe at James Cook University) obtained from the
same phases in experimental run products. The reported
values of garnet and clinipyroxene are averages of both
WDS and EDS analyses.
For crystalline phases, a 1 mm beam with an excitation
diameter of about 1·5 mm was used. To obtain the most
representative composition, at least 10 grains of each
phase were analyzed in each experiment, and only those
analyses close to the theoretical cation sum were accepted.
For the majority of melt analyses a larger area scan was
used. Most of the quenched melts present in the runs
were highly heterogeneous, so as many area scans as pos-
sible were performed on each melt-bearing run.
Detection limits were 0·1^0·2wt %. Analyses were ob-
tained for most melts and mineral phases; however, it
was not always possible to precisely analyse some very
fine-grained accessory phases and the extremely
heterogeneous melt patches present in some runs. Mass-
balance calculations were carried out for each of the
experiments.
Raman spectroscopy was used for identification of
carbon allotropes (graphite or diamond) and carbonates.
The Raman spectra were obtained using a Jasco NRS-
2000 microspectrometer at Tohoku University. A micro-
scope was used to focus the excitation laser beam (the
488 nm lines of a Princeton Instruments Arþ laser) on
the sample surface. Spectra were collected for 120^240 s,
using a laser operating at 12^20mW and a beam 1 mm in
diameter.
RESULTS
A summary of all run conditions and calculated phase pro-
portions for GA1cc and Volga-cc are given in Table 2.
Representative phase compositions are listed in
Tables 3^8. The observed phase assemblages were used to
construct an experimental P^T phase diagram (Fig. 2).
Most runs produced well-crystallized, chemically homoge-
neous mineral assemblages from the glass starting mater-
ial. The homogeneity of phase compositions in most runs
indicates a close approach to chemical equilibrium.
Evidence for disequilibrium was observed in some of the
lowest temperature runs, with incorrect garnet stoichiom-
etry, manifested by cation sums (12 oxygens per formula
unit) substantially less than eight.
Solidus position, phase assemblage andtypes of melt
The solidus temperature at a given pressure was bracketed
based on the presence of visible quenched melt products
and mass-balance calculations. In the case of the lowest de-
grees of melting an additional compositional criterion is
useful to distinguish stable mineral and metastable
quenched phases. Across the entire range of the experi-
ments, the quenched melt products are a mixture of car-
bonate and silicate components, whereas the solid
carbonates are homogeneous and free from silicate
components.
The estimated solidus is between 1250 and 13008C at
9GPa and between 1200 and 13008C at 13GPa for both
starting compositions (Fig. 2). Solidus temperatures are
estimated to lie between 1200 and 13008C at 17 and 21GPa
for the Volga-cc composition and between 1300 and
14008C at 17GPa for the GA1cc composition. Experiments
G1300-21 and G1400-21 [read as starting composition (G
indicates GA1cc), temperature, 14008C, and pressure, 21
GPa] exhibit unusual textures (Fig. 1b and d), distin-
guished by garnet, diamond and to a lesser extent large
crystals of stishovite and K-hollandite (high-pressure ana-
logue of KAlSi3O8) (10^20 mm) surrounded by a fine-
grained (1 mm) matrix of the same minerals. In this case,
JOURNAL OF PETROLOGY VOLUME 0 NUMBER 0 MONTH 2013
4
at Bodleian L
ibrary on May 7, 2013
http://petrology.oxfordjournals.org/D
ownloaded from

large grains of Na-rich aragonite are usually found segre-
gated to the edge of the capsule, although it is not possible
to rule out their presence within the matrix. These runs
are considered to be subsolidus and hence the GA1cc sol-
idus at 21GPa is located at a slightly higher temperature
than 14008C. However, there is a possibility that a small,
undetected melt fraction is present within the fine-grained
matrix.
The subsolidus phase assemblages for both starting ma-
terials at 9^13GPa consist of garnet, clinopyroxene, car-
bonates (aragonite and magnesite, or calcite^magnesite
solid solution), a high-pressure polymorph of TiO2, coesite
or stishovite, graphite or diamond (only in GA1cc runs)
and K-hollandite (only in the V1200-13 run). Na-rich ara-
gonite appeared in the V1300-13 run, whereas no alkali-
rich carbonates were observed in GA1cc runs at 9^13GPa.
At 17^21GPa, the phase assemblages consist of garnet,
stishovite, K-hollandite, magnesite (only at 17GPa), Na-
rich aragonite and Ca-perovskite. Carbonate with a high
Na content (around 20wt % Na2O) was detected in a sub-
solidusV1200-21 run.
Phase relations and compositionsMajor phases
Garnet is the major phase in all the experiments
(Fig. 3a^f). Its modal proportion increases from �40% at
9GPa (except V1050-9, which crystallized only 26%
garnet) to �70% at 13GPa and 80% at 17^21GPa. The
grain size differs significantly and varies from 55 mm in
low-temperature 9GPa runs to 40 mm in 17^21GPa runs.
In most experiments at 9 and 13GPa, garnet occurs as
well-shaped, equant grains, often containing inclusions of
clinopyroxene and coesite or stishovite (Fig. 3a^c). At 17
and 21GPa, large fractured crystals of garnet occupy most
of the experimental charge (Figs 1c and 3d^f), with acces-
sory phases (usually stishovite and K-hollandite) as inclu-
sions and intergranular carbonate or melt. At all
pressures, with increasing temperature the number of in-
clusions in garnet decreases and the grains become larger
and more compositionally homogeneous.
As in previous studies (Yasuda et al., 1994; Litasov &
Ohtani, 2010), high-pressure garnet is generally character-
ized by Si in excess of 3·00 cations per 12-oxygen formula
Table 2: Experimental results and run conditions
T (8C) dT P D (h) Exp. no. Phases present (GA1cc) Exp. no. Phases present (Volga-cc)
1050 50 9 72 G1050-9 Grt(42), Cpx(45), Arag(8), Mst(1·5), Co(3·5), TiO2 V1050-9 Grt(26), Cpx(62), Arag(6·5), Mst(3), Co(2), TiO2
1200 20 9 48 G1200-9 Grt(42), Cpx(45), Arag(5), Mst(4), Co(3·5), TiO2 V1200-9 Grt(49), Cpx(39), Arag(3), Mst(7), Co(1·5), TiO2
1250 60 9 48 G1250-9 Grt(48), Cpx(35), CMss(10), Co(6·5), TiO2 V1250-9 Grt(45), Cpx(44), CMss(10), Co, TiO2
1400 20 9 24 G1400-9 Grt(46), Cpx(40), Co(4), TiO2, LCarb(10) V1400-9 Grt(54), Cpx(35), Co, TiO2, LCarb(10·5)
1200 20 13 80 G1200-13 Grt(84), Cpx(4), Arag(5·5), Mst(4), St(2·5) V1200-13 Grt(83·5), Cpx(5), Arag(8), Mst(2), St(1), K-Holl
1300 20 13 48 G1300-13 Grt(70), Cpx(12), St(6), LSi-Carb(12) V1300-13a Grt(78), Cpx(8), St(2), LCarb(11·5)
1300 20 13 48 V1300-13b Grt(77), Cpx(11), St(2), LCarb(10·5)
1400 20 13 24 G1400-13 Grt(69), Cpx(13), St(6), LSi-Carb(12) V1400-13 Grt(73), Cpx(15), St(1), LCarb(11)
1550 70 13 12 G1550-13 Grt(59), Cpx(19), St(8), LSi-Carb(13) V1550-13 Grt(68), Cpx(16), St(4), LCarb(12)
1100 40 17 48 G1100-17 Grt(89), Arag(9), Mst(1), K-Holl(1), St, CPv V1100-17 Grt(88), Arag(9), Mst(1), St(1), K-Holl, CPv
1200 20 17 48 G1200-17 Grt(87·5), Arag(10), Mst(1), K-Holl(1), St, CPv V1200-17 Grt(85), Arag(10), St(3), K-Holl(2), Mst, CPv
1250 70 17 48 G1250-17 Grt(81), Arag(9·5), St(9), Mst, K-Holl V1250-17 Grt(83), Arag(3·5), St(5·5), K-Holl, Mst, LSi-Carb(7·5)
1400 20 17 24 G1400-17 Grt(74), St(10·5), LSi-Carb(15·5) V1400-17 Grt(81), St(3), LSi-Carb(16)
1500 70 17 12 G1500-17 Grt(73·5), St(8·5), LSi-Carb(18) V1500-17 Grt(81), St(2·5), LSi-Carb(17)
1200 20 21 48 G1200-21 Grt(89·5), Arag(9·5), St, K-Holl, CPv V1200-21 Grt(84·5), Arag(7·5), St(3), K-Holl(1), CPv(1·5),
Na-Carb(2·5)
1300 20 21 48 G1300-21 Grt(79), Arag(9), St(10), K-Holl(2), CPv V1300-21 Grt(80), St(8), CPv(1·5), LCarb(10·5)
1400 20 21 16 G1400-21 Grt(78), Arag(9·5), St(12·5), CPv V1400-21 Grt(78·5), St(10), CPv, LCarb(11)
1650 80 21 16 G1650-21 Grt(79·5), St(8), LSi-Carb(12·5) V1650-21 Grt(82), St(6), CPv, LCarb(12)
1900 100 21 12 G1900-21 Grt(80), St(7), LSi-Carb(14) V1900-21 Grt(83), St(4), LCarb(13)
dT, estimated temperature gradient. D (h), duration of the experiment in hours. We did not identify the structure of theTiO2 phase in the experiments and followed results by Withers et al. (2003) and Sato et al. (1991) for rutile or TiO2 II andfurther phase transitions. Numbers in parentheses are wt % of the phase, extracted from mass-balance calculations. Forphases with no wt % value included, it is considered to be51wt %. Grt, garnet; Cpx, clinopyroxene; Arag, aragonite;Mst, magnesite; Co, coesite; St, stishovite; CMss, calcite–magnesite solid solution; K-Holl, K-hollandite; CPv,Ca-perovskite; Na-Carb, Na-carbonate; LCarb, carbonate melt; LSi-Carb, silicate–carbonate melt.
KISEEVA et al. CARBONATED ECLOGITE PHASE RELATIONS
5
at Bodleian L
ibrary on May 7, 2013
http://petrology.oxfordjournals.org/D
ownloaded from
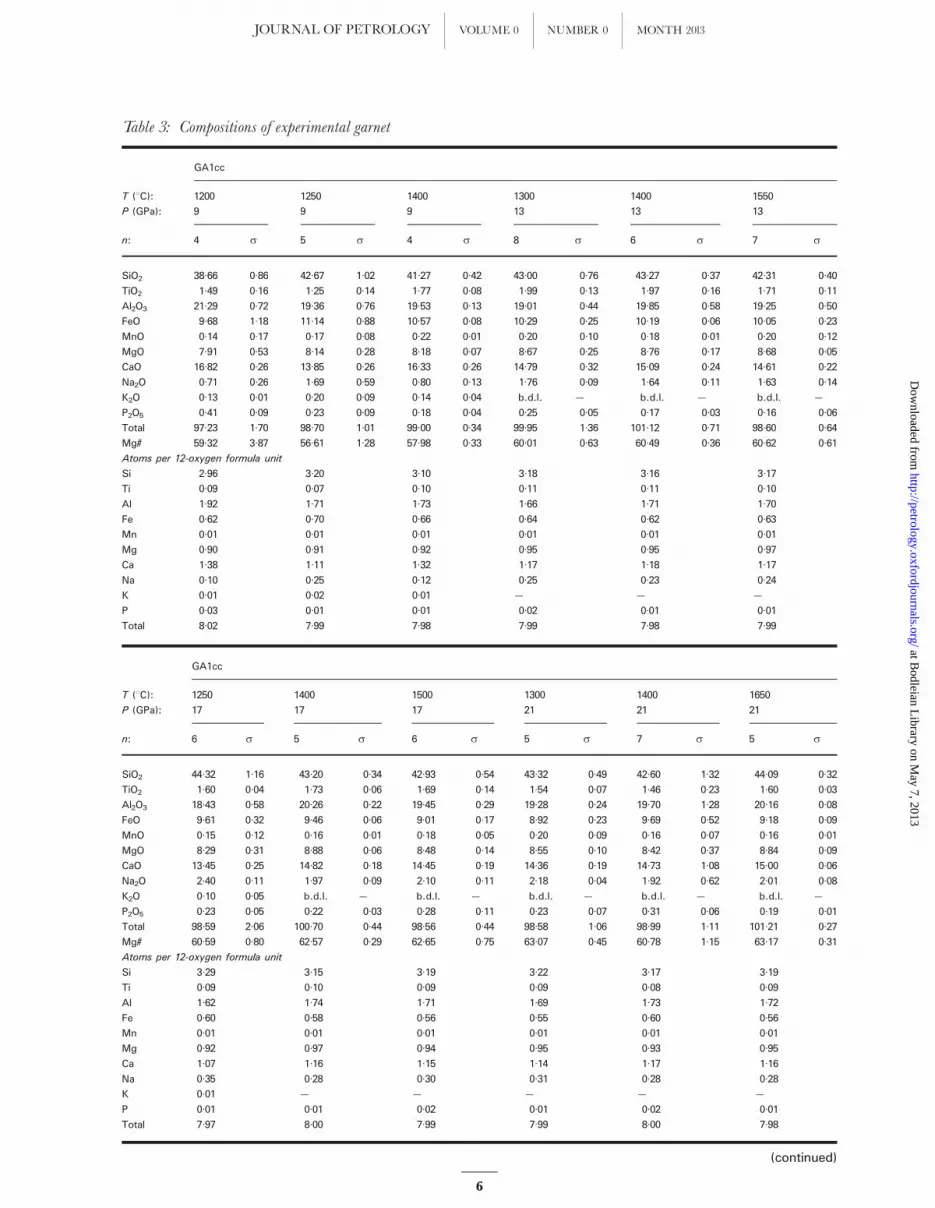
Table 3: Compositions of experimental garnet
GA1cc
T (8C): 1200 1250 1400 1300 1400 1550
P (GPa): 9 9 9 13 13 13
n: 4 s 5 s 4 s 8 s 6 s 7 s
SiO2 38·66 0·86 42·67 1·02 41·27 0·42 43·00 0·76 43·27 0·37 42·31 0·40
TiO2 1·49 0·16 1·25 0·14 1·77 0·08 1·99 0·13 1·97 0·16 1·71 0·11
Al2O3 21·29 0·72 19·36 0·76 19·53 0·13 19·01 0·44 19·85 0·58 19·25 0·50
FeO 9·68 1·18 11·14 0·88 10·57 0·08 10·29 0·25 10·19 0·06 10·05 0·23
MnO 0·14 0·17 0·17 0·08 0·22 0·01 0·20 0·10 0·18 0·01 0·20 0·12
MgO 7·91 0·53 8·14 0·28 8·18 0·07 8·67 0·25 8·76 0·17 8·68 0·05
CaO 16·82 0·26 13·85 0·26 16·33 0·26 14·79 0·32 15·09 0·24 14·61 0·22
Na2O 0·71 0·26 1·69 0·59 0·80 0·13 1·76 0·09 1·64 0·11 1·63 0·14
K2O 0·13 0·01 0·20 0·09 0·14 0·04 b.d.l. — b.d.l. — b.d.l. —
P2O5 0·41 0·09 0·23 0·09 0·18 0·04 0·25 0·05 0·17 0·03 0·16 0·06
Total 97·23 1·70 98·70 1·01 99·00 0·34 99·95 1·36 101·12 0·71 98·60 0·64
Mg# 59·32 3·87 56·61 1·28 57·98 0·33 60·01 0·63 60·49 0·36 60·62 0·61
Atoms per 12-oxygen formula unit
Si 2·96 3·20 3·10 3·18 3·16 3·17
Ti 0·09 0·07 0·10 0·11 0·11 0·10
Al 1·92 1·71 1·73 1·66 1·71 1·70
Fe 0·62 0·70 0·66 0·64 0·62 0·63
Mn 0·01 0·01 0·01 0·01 0·01 0·01
Mg 0·90 0·91 0·92 0·95 0·95 0·97
Ca 1·38 1·11 1·32 1·17 1·18 1·17
Na 0·10 0·25 0·12 0·25 0·23 0·24
K 0·01 0·02 0·01 — — —
P 0·03 0·01 0·01 0·02 0·01 0·01
Total 8·02 7·99 7·98 7·99 7·98 7·99
GA1cc
T (8C): 1250 1400 1500 1300 1400 1650
P (GPa): 17 17 17 21 21 21
n: 6 s 5 s 6 s 5 s 7 s 5 s
SiO2 44·32 1·16 43·20 0·34 42·93 0·54 43·32 0·49 42·60 1·32 44·09 0·32
TiO2 1·60 0·04 1·73 0·06 1·69 0·14 1·54 0·07 1·46 0·23 1·60 0·03
Al2O3 18·43 0·58 20·26 0·22 19·45 0·29 19·28 0·24 19·70 1·28 20·16 0·08
FeO 9·61 0·32 9·46 0·06 9·01 0·17 8·92 0·23 9·69 0·52 9·18 0·09
MnO 0·15 0·12 0·16 0·01 0·18 0·05 0·20 0·09 0·16 0·07 0·16 0·01
MgO 8·29 0·31 8·88 0·06 8·48 0·14 8·55 0·10 8·42 0·37 8·84 0·09
CaO 13·45 0·25 14·82 0·18 14·45 0·19 14·36 0·19 14·73 1·08 15·00 0·06
Na2O 2·40 0·11 1·97 0·09 2·10 0·11 2·18 0·04 1·92 0·62 2·01 0·08
K2O 0·10 0·05 b.d.l. — b.d.l. — b.d.l. — b.d.l. — b.d.l. —
P2O5 0·23 0·05 0·22 0·03 0·28 0·11 0·23 0·07 0·31 0·06 0·19 0·01
Total 98·59 2·06 100·70 0·44 98·56 0·44 98·58 1·06 98·99 1·11 101·21 0·27
Mg# 60·59 0·80 62·57 0·29 62·65 0·75 63·07 0·45 60·78 1·15 63·17 0·31
Atoms per 12-oxygen formula unit
Si 3·29 3·15 3·19 3·22 3·17 3·19
Ti 0·09 0·10 0·09 0·09 0·08 0·09
Al 1·62 1·74 1·71 1·69 1·73 1·72
Fe 0·60 0·58 0·56 0·55 0·60 0·56
Mn 0·01 0·01 0·01 0·01 0·01 0·01
Mg 0·92 0·97 0·94 0·95 0·93 0·95
Ca 1·07 1·16 1·15 1·14 1·17 1·16
Na 0·35 0·28 0·30 0·31 0·28 0·28
K 0·01 — — — — —
P 0·01 0·01 0·02 0·01 0·02 0·01
Total 7·97 8·00 7·99 7·99 8·00 7·98
(continued)
JOURNAL OF PETROLOGY VOLUME 0 NUMBER 0 MONTH 2013
6
at Bodleian L
ibrary on May 7, 2013
http://petrology.oxfordjournals.org/D
ownloaded from

Table 3: Continued
Volga-cc V1300-13a
T (8C): 1050 1200 1250 1400 1200 1300
P (GPa): 9 9 9 9 13 13
n: 3 s 6 s 4 s 5 s 2 s 7 s
SiO2 39·51 0·41 41·42 0·44 40·41 0·40 41·60 0·37 45·05 0·99 43·35 0·43
TiO2 1·07 0·32 1·70 0·09 1·27 0·06 1·48 0·17 1·71 0·10 2·00 0·13
Al2O3 20·29 0·71 20·02 0·21 21·12 0·25 19·96 0·29 17·59 0·30 18·89 0·60
FeO 12·90 0·58 12·58 0·30 14·60 0·30 12·51 0·25 11·11 0·08 10·50 0·29
MnO 0·38 0·06 0·33 0·02 0·38 0·01 0·32 0·01 0·23 0·04 0·20 0·04
MgO 6·75 0·67 6·85 0·23 8·62 0·26 8·65 0·25 7·73 0·74 8·64 0·31
CaO 16·60 0·48 16·99 0·34 13·72 0·21 13·57 0·15 13·05 1·46 14·63 0·61
Na2O 0·73 0·10 1·11 0·16 0·59 0·16 1·02 0·24 2·61 0·12 1·79 0·06
K2O 0·14 0·05 0·10 0·04 b.d.l. — b.d.l. — 0·22 0·03 b.d.l. —
P2O5 0·36 0·16 0·19 0·02 0·15 0·04 b.d.l. — 0·18 0·11 0·21 0·05
Total 98·73 0·82 101·29 0·31 100·86 0·09 99·10 0·66 99·47 0·04 100·21 1·22
Mg# 48·16 1·38 49·24 0·51 51·26 0·57 55·20 0·51 55·28 2·19 59·45 1·32
Atoms per 12-oxygen formula unit
Si 3·02 3·08 3·01 3·12 3·34 3·20
Ti 0·06 0·10 0·07 0·08 0·10 0·11
Al 1·83 1·75 1·85 1·76 1·54 1·64
Fe 0·82 0·78 0·91 0·78 0·69 0·65
Mn 0·02 0·02 0·02 0·02 0·01 0·01
Mg 0·77 0·76 0·96 0·97 0·85 0·95
Ca 1·36 1·35 1·10 1·09 1·04 1·15
Na 0·11 0·16 0·09 0·15 0·37 0·26
K 0·01 0·01 — — 0·02 —
P 0·02 0·01 0·01 — 0·01 0·01
Total 8·03 8·02 8·02 7·99 7·98 7·98
V1300-13b
T (8C): 1300 1400 1550 1100 1200 1250
P (GPa): 13 13 13 17 17 17
n: 2 s 5 s 5 s 4 s 5 s 9 s
SiO2 42·81 0·64 43·87 0·56 42·46 0·99 45·05 0·80 44·32 0·93 43·09 0·98
TiO2 2·02 0·07 1·92 0·07 1·69 0·08 1·56 0·10 1·84 0·38 1·79 0·09
Al2O3 18·50 0·15 19·11 0·43 19·63 0·53 17·49 0·29 18·91 0·29 18·83 0·39
FeO 10·92 0·22 11·45 0·26 11·19 0·22 10·63 0·31 11·15 0·18 10·86 0·14
MnO 0·35 0·12 0·28 0·00 0·31 0·04 0·25 0·04 0·26 0·01 0·27 0·07
MgO 8·16 0·22 8·60 0·49 8·64 0·12 8·31 0·48 8·55 0·41 8·02 0·22
CaO 14·21 0·22 14·48 0·69 14·31 0·55 11·43 1·43 13·33 1·20 14·24 0·27
Na2O 1·70 0·02 1·70 0·18 1·56 0·17 3·08 0·51 2·27 0·32 1·96 0·08
K2O b.d.l. — b.d.l. — b.d.l. — 0·29 0·14 0·12 0·06 b.d.l. —
P2O5 0·11 0·10 0·13 0·03 0·11 0·01 0·19 0·02 0·22 0·03 0·21 0·04
Total 98·78 0·92 101·53 0·18 99·90 1·86 98·27 0·68 100·95 0·21 99·26 0·69
Mg# 57·09 1·17 57·21 0·87 57·89 0·32 58·19 1·38 57·71 0·80 56·81 0·59
Atoms per 12-oxygen formula unit
Si 3·21 3·20 3·15 3·36 3·24 3·21
Ti 0·11 0·11 0·09 0·09 0·10 0·10
Al 1·63 1·64 1·72 1·54 1·63 1·65
Fe 0·68 0·70 0·69 0·66 0·68 0·68
Mn 0·02 0·02 0·02 0·02 0·02 0·02
Mg 0·91 0·94 0·95 0·92 0·93 0·89
Ca 1·14 1·13 1·14 0·91 1·04 1·14
Na 0·25 0·24 0·22 0·45 0·32 0·28
K — — — 0·03 0·01 —
P 0·01 0·01 0·01 0·01 0·01 0·01
Total 7·97 7·98 8·00 8·00 7·99 7·99
(continued)
KISEEVA et al. CARBONATED ECLOGITE PHASE RELATIONS
7
at Bodleian L
ibrary on May 7, 2013
http://petrology.oxfordjournals.org/D
ownloaded from

unit (p.f.u.), and significant amounts of Na (0·09^
0·45 p.f.u.) and low Al contents (1·54^1·92 p.f.u.). Within
the 9^13GPa pressure interval the amount of Si p.f.u. in
garnet sharply increases, from 3·00^3·05 in some of the
9GPa runs to 3·15^3·20 Si p.f.u. in most of the 13 GPa
runs (Fig. 4b), indicating significant increase in the major-
ite component in garnet. The strong positive correlation
between Si and Na is consistent with the Na-majorite
(Na2MgSi5O12) substitution (e.g. Presnall et al., 1978;
Dymshits et al., 2013). Garnet in subsolidus experiments
contains higher Si and Na contents than in partially
molten experiments. The Na content of garnet slightly de-
creases with increasing temperature and degree of melting.
The amount of Na in garnet generally increases with pres-
sure, but the rate of increase becomes lower as pressure in-
creases (Figs 4a, b and 5a).
Clinopyroxene is the dominant phase in the GA1cc
composition at 3·5^5·5GPa (see Kiseeva et al., 2012).
The amount of clinopyroxene decreases from �45^55 at
5GPa to �35^40% at 9GPa (exceptV1050-9 run with esti-
mated 62modal% of clinopyroxene). At13GPa the amount
of clinopyroxene drops steeply and reaches �4^19%
(Fig. 4a). The modal proportion of clinopyroxene increases
with increasing temperature.The clinopyroxene-outbound-
ary in both compositions lies just above 13GPa, because in
subsolidus runs at 13GPa only a few clinopyroxene grains
were observed. Further evidence for this is provided by the
garnet composition.The amount of the majorite component
ingarnet,manifestedbySicationsp.f.u.,doesnot increasesig-
nificantlyover thepressure interval between13and21GPa.
Clinopyroxene is Na-rich and with increasing pressure
the amount of Na increases from around 0·29^0·50Na
p.f.u. (4·3^8·0wt % Na2O) at 9GPa to 0·59^0·80Na p.f.u.
(8·7^12·2wt % Na2O) at 13GPa. It does not show any sig-
nificant correlation with temperature, and does not
change significantly across the solidus (Fig. 5b). However,
the Na content of clinopyroxene correlates with Na in
garnet (Fig. 4a). The amount of M2þ cations (Mg, Fe, Ca,
Mn) in clinopyroxene decreases with increasing
pressure (Fig. 6a), whereas the amount of Al does not
exceed �0·7^0·8 cations p.f.u. (Fig. 6b). Excess of Si (up
to 0·05 Si cations p.f.u. over 2·00) in clinopyroxene
Table 3: Continued
Volga-cc
T (8C): 1400 1500 1200 1300 1400 1650 1900
P (GPa): 17 17 21 21 21 21 21
n: 6 s 5 s 6 s 5 s 7 s 4 s 5 s
SiO2 42·78 0·64 42·89 0·54 44·88 0·74 42·76 0·80 42·24 0·41 43·56 0·18 44·34 0·41
TiO2 1·88 0·14 1·69 0·05 1·23 0·15 1·44 0·14 1·46 0·03 1·68 0·05 1·29 0·04
Al2O3 19·56 0·48 19·28 0·25 18·02 0·75 20·50 0·50 20·43 0·50 19·39 0·59 19·51 0·32
FeO 10·07 0·42 10·19 0·15 11·41 0·16 11·01 0·16 10·96 0·22 10·53 0·38 8·47 0·41
MnO 0·20 0·07 0·25 0·01 0·25 0·11 0·27 0·01 0·23 0·06 0·26 0·04 0·25 0·01
MgO 8·00 0·29 8·32 0·15 8·48 0·37 8·59 0·23 8·35 0·36 8·36 0·17 8·90 0·10
CaO 15·12 0·58 13·96 0·23 12·70 0·67 14·78 0·64 14·77 0·38 14·64 0·65 14·80 0·34
Na2O 1·87 0·16 2·02 0·09 2·29 0·28 1·55 0·15 1·52 0·09 2·03 0·19 2·25 0·08
K2O b.d.l. — 0·33 0·21 0·21 0·07 b.d.l. — b.d.l. — b.d.l. — b.d.l. —
P2O5 0·18 0·04 0·16 0·02 0·19 0·07 0·21 0·03 0·25 0·07 0·15 0·01 0·15 0·03
Total 99·66 0·95 99·07 0·55 99·65 0·97 101·10 0·16 100·20 1·20 100·60 1·36 99·96 0·23
Mg# 58·60 0·99 59·27 0·35 56·94 1·20 58·16 0·36 57·58 0·60 58·58 0·55 65·21 1·32
Atoms per 12-oxygen formula unit
Si 3·17 3·20 3·32 3·13 3·12 3·20 3·24
Ti 0·10 0·09 0·07 0·08 0·08 0·09 0·07
Al 1·71 1·69 1·57 1·77 1·78 1·68 1·68
Fe 0·62 0·64 0·71 0·67 0·68 0·65 0·52
Mn 0·01 0·02 0·02 0·02 0·01 0·02 0·02
Mg 0·88 0·92 0·93 0·94 0·92 0·91 0·97
Ca 1·20 1·11 1·01 1·16 1·17 1·15 1·16
Na 0·27 0·29 0·33 0·22 0·22 0·29 0·32
K — 0·03 0·02 — — — —
P 0·01 0·01 0·01 0·01 0·02 0·01 0·01
Total 7·99 8·01 7·98 8·00 8·00 8·00 7·99
b.d.l., below the detection limit (taken as 0·1 for all EDS measured values).
JOURNAL OF PETROLOGY VOLUME 0 NUMBER 0 MONTH 2013
8
at Bodleian L
ibrary on May 7, 2013
http://petrology.oxfordjournals.org/D
ownloaded from

Table 4: Compositions of experimental clinopyroxene
GA1cc
T (8C): 1050 1200 1250 1400 1200 1300
P (GPa): 9 9 9 9 13 13
n: 11 s 3 s 10 s 8 s 2 s 7 s
SiO2 50·95 0·33 55·20 1·45 53·50 1·12 54·58 0·58 55·14 0·32 57·28 1·13
TiO2 1·43 0·12 0·78 0·16 0·92 0·10 0·80 0·08 0·81 0·00 0·36 0·01
Al2O3 17·23 0·21 16·95 0·48 16·15 0·38 14·16 0·74 17·36 0·06 17·55 0·48
FeO 8·03 0·56 3·65 0·90 4·67 0·50 3·71 0·31 3·64 0·06 2·34 0·19
MnO 0·13 0·01 b.d.l. — b.d.l. — b.d.l. — b.d.l. — b.d.l. —
MgO 7·68 0·31 6·20 0·11 6·90 0·17 7·42 0·25 4·78 0·17 4·67 0·14
CaO 10·23 0·54 9·55 0·62 10·98 0·44 11·65 0·29 7·67 0·32 6·88 0·44
Na2O 4·28 0·34 8·02 0·61 6·38 0·34 6·57 0·23 8·65 0·25 10·52 0·33
K2O 0·55 0·04 0·43 0·05 0·44 0·07 0·44 0·03 0·35 0·06 0·18 0·05
P2O5 0·22 0·02 b.d.l. — 0·14 0·04 b.d.l. — b.d.l. — b.d.l. —
Total 100·73 0·63 100·80 0·09 100·08 0·57 99·32 0·45 98·39 0·30 99·77 1·03
Mg# 63·05 1·32 75·35 4·17 72·54 1·76 78·13 1·02 70·05 1·07 78·06 1·01
Atoms per 6-oxygen formula unit
Si 1·81 1·92 1·89 1·94 1·95 1·99
Ti 0·04 0·02 0·02 0·02 0·02 0·01
Al 0·72 0·70 0·67 0·59 0·73 0·72
Fe 0·24 0·11 0·14 0·11 0·11 0·07
Mn 0·00 — — — — —
Mg 0·41 0·32 0·36 0·39 0·25 0·24
Ca 0·39 0·36 0·42 0·44 0·29 0·26
Na 0·29 0·54 0·44 0·45 0·59 0·71
K 0·02 0·02 0·02 0·02 0·02 0·01
P 0·01 — 0·00 — — —
Total 3·94 3·99 3·97 3·98 3·96 4·00
GA1cc Volga-cc
T (8C): 1400 1550 1050 1200 1250 1400
P (GPa): 13 13 9 9 9 9
n: 6 s 6 s 8 s 8 s 8 s 9 s
SiO2 58·99 1·45 56·66 1·23 47·49 0·36 52·19 2·10 54·67 1·65 55·08 0·97
TiO2 0·40 0·02 0·50 0·11 1·36 0·16 0·75 0·11 0·73 0·32 0·59 0·07
Al2O3 17·17 0·83 16·46 0·46 17·62 0·39 16·08 0·44 14·77 1·04 14·77 0·33
FeO 2·36 0·11 2·49 0·10 9·40 0·36 6·04 1·02 4·67 0·46 4·48 0·32
MnO b.d.l. — b.d.l. — 0·22 0·01 0·11 0·04 b.d.l. — b.d.l. —
MgO 4·99 0·10 5·42 0·33 7·58 0·28 6·17 0·12 7·02 0·35 6·49 0·18
CaO 7·03 0·50 7·42 0·37 11·43 0·61 11·26 1·17 11·19 0·13 9·85 0·28
Na2O 10·21 0·31 9·74 0·29 4·31 0·23 6·94 0·79 6·90 0·36 7·21 0·30
K2O 0·13 0·06 0·11 0·04 0·58 0·03 0·55 0·09 0·31 0·15 0·27 0·03
P2O5 b.d.l. — b.d.l. — 0·18 0·03 0·13 0·02 b.d.l. — b.d.l. —
Total 101·27 1·24 98·80 1·21 100·16 0·52 100·21 0·61 100·26 0·64 98·74 0·57
Mg# 79·04 0·59 79·50 0·43 58·98 0·59 64·75 3·51 72·83 2·29 72·09 1·24
Atoms per 6-oxygen formula unit
Si 2·01 1·99 1·73 1·87 1·93 1·96
Ti 0·01 0·01 0·04 0·02 0·02 0·02
Al 0·69 0·68 0·76 0·68 0·61 0·62
Fe 0·07 0·07 0·29 0·18 0·14 0·13
Mn — — 0·01 0·00 — —
Mg 0·25 0·28 0·41 0·33 0·37 0·34
Ca 0·26 0·28 0·45 0·43 0·42 0·38
Na 0·68 0·66 0·30 0·48 0·47 0·50
K 0·01 0·01 0·03 0·02 0·01 0·01
P — — 0·01 0·00 — —
Total 3·97 3·99 4·01 4·02 3·98 3·97
(continued)
KISEEVA et al. CARBONATED ECLOGITE PHASE RELATIONS
9
at Bodleian L
ibrary on May 7, 2013
http://petrology.oxfordjournals.org/D
ownloaded from

from this and other studies at 13^19GPa (Fig. 6b) can be
potentially explained by the additional clinopyroxene
component NaMg0·5Si0·5Si2O6, synthesized by Gasparik
(1988).
Minor and accessory phases
Crystalline carbonate (magnesite, aragonite, alkali-bear-
ing carbonates) is present at all pressures (Fig. 7a, c and
d). It usually occurs as relatively large (up to 25 mm) subhe-
dral crystals interstitial to garnet (or clinopyroxene at
9^13GPa).Where both phases are present, magnesite usu-
ally occurs along aragonite crystal boundaries (Fig. 7a).
Crystalline carbonates coexisting with low-degree sili-
cate^carbonate melts were observed in only one experi-
ment (V1250-17).
Thetypeandcompositionofcarbonatepresentvarieswith
runtemperatureandpressure (Fig.8).At 9GPaandtempera-
tures of �12008C, in both GA1cc andVolga-cc, nearly pure
aragonite (91·5^95·4mol%CaCO3) coexistswithmagnesite
(72·5^75·6mol % MgCO3) that has significant CaCO3
(10·9^12·1mol %) and FeCO3 (17·5^19·0mol %) compo-
nents. At higher temperatures, inG1250-9 andV1250-9, only
a single carbonate of siderite and magnesite-bearing calcite
composition (61·4^66·1mol % CaCO3, 21·3^27·7mol %
MgCO3, 8·1^9·7mol % FeCO3) is present. This is also the
case for theexperimentsat13GPa. In subsolidusexperiments
G1200-13 andV1200-13 two carbonates, aragonite andmag-
nesite, are observed. However, in theV1300-13 experiment
(in contrast to G1200-13), the carbonate is no longer pure
CaCO3butcontains significantNa-,K-,Mg-andFe-bearing
components. Although the structure of the crystallized car-
bonatehas notbeen determined, its composition is similar to
the aragonite crystallized at high pressures in alkali-car-
bonatite systems (Litasov et al.,2013).
In most experiments at 17GPa, pure aragonite was not
observed and Na-rich aragonite (4·60^8·42wt % Na2O;
Table 4: Continued
Volga-cc V1300-13a V1300-13b
T (8C): 1200 1300 1300 1400 1550
P (GPa): 13 13 13 13 13
n: 5 s 9 s 2 s 8 s 8 s
SiO2 58·27 0·73 56·69 1·77 56·90 0·75 59·45 0·79 58·52 0·74
TiO2 0·21 0·03 0·39 0·07 0·32 0·03 0·39 0·02 0·37 0·02
Al2O3 17·69 0·54 16·29 1·29 16·76 0·31 16·93 0·45 17·30 0·48
FeO 4·74 0·35 3·33 0·24 3·07 0·09 3·02 0·06 3·02 0·17
MnO b.d.l. — b.d.l. — b.d.l. — b.d.l. — b.d.l. —
MgO 2·64 0·23 4·43 0·28 3·98 0·07 4·91 0·17 5·02 0·36
CaO 3·98 0·33 6·73 1·08 6·13 0·54 6·78 0·25 6·80 0·51
Na2O 12·23 0·13 10·50 0·49 10·45 0·30 10·01 0·33 10·35 0·33
K2O b.d.l. — 0·25 0·24 0·28 0·11 b.d.l. — 0·11 0·01
P2O5 b.d.l. — b.d.l. — b.d.l. — b.d.l. — b.d.l. —
Total 99·76 0·69 98·61 2·45 97·87 0·82 101·48 0·36 101·49 0·31
Mg# 49·75 1·01 70·34 1·37 69·77 0·24 74·34 0·69 74·74 0·52
Atoms per 6-oxygen formula unit
Si 2·03 2·00 2·02 2·02 2·00
Ti 0·01 0·01 0·01 0·01 0·01
Al 0·73 0·68 0·70 0·68 0·70
Fe 0·14 0·10 0·09 0·09 0·09
Mn — — — — —
Mg 0·14 0·23 0·21 0·25 0·26
Ca 0·15 0·26 0·23 0·25 0·25
Na 0·83 0·72 0·72 0·66 0·69
K 0·00 0·01 0·01 0·00 0·00
P — — — — —
Total 4·02 4·01 3·99 3·96 3·99
JOURNAL OF PETROLOGY VOLUME 0 NUMBER 0 MONTH 2013
10
at Bodleian L
ibrary on May 7, 2013
http://petrology.oxfordjournals.org/D
ownloaded from
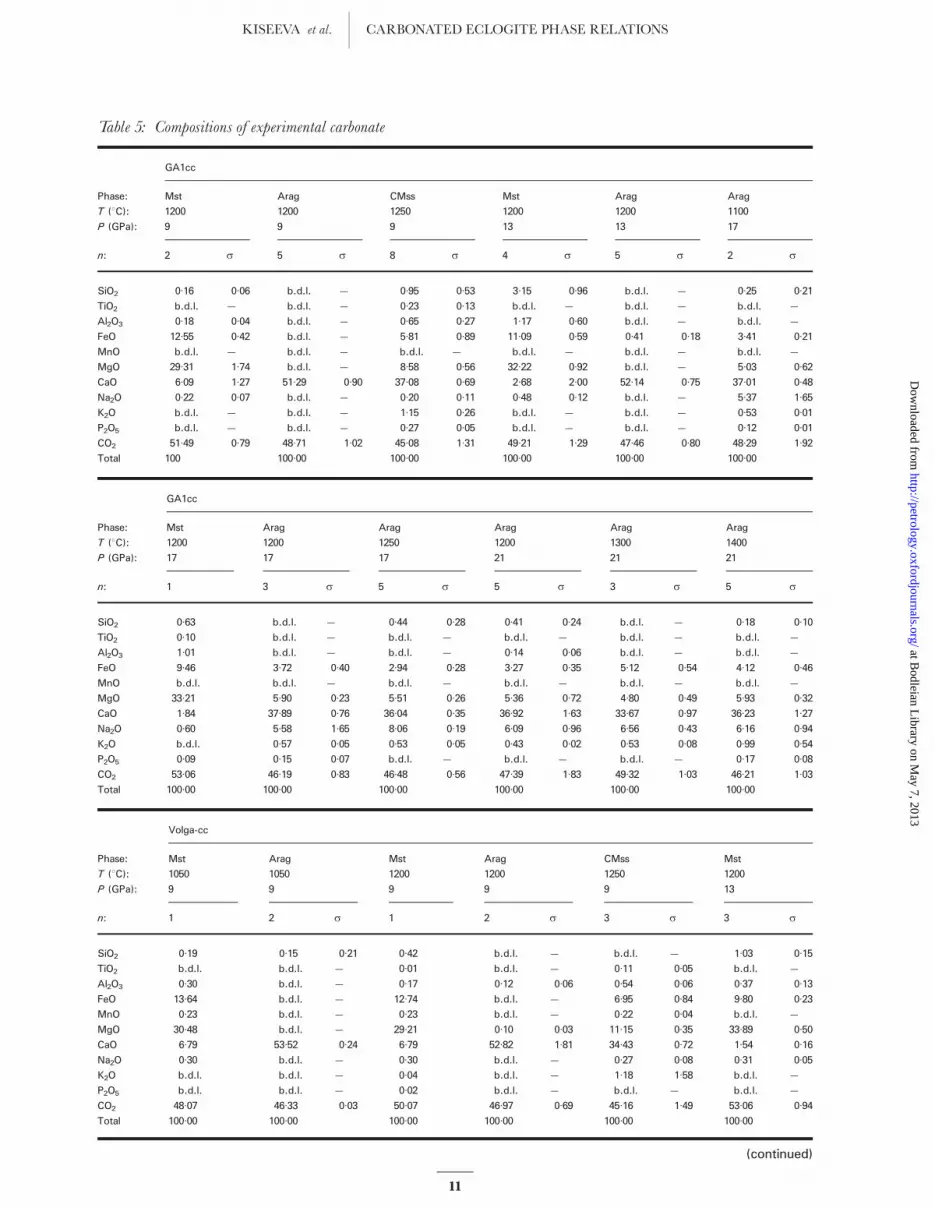
Table 5: Compositions of experimental carbonate
GA1cc
Phase: Mst Arag CMss Mst Arag Arag
T (8C): 1200 1200 1250 1200 1200 1100
P (GPa): 9 9 9 13 13 17
n: 2 s 5 s 8 s 4 s 5 s 2 s
SiO2 0·16 0·06 b.d.l. — 0·95 0·53 3·15 0·96 b.d.l. — 0·25 0·21
TiO2 b.d.l. — b.d.l. — 0·23 0·13 b.d.l. — b.d.l. — b.d.l. —
Al2O3 0·18 0·04 b.d.l. — 0·65 0·27 1·17 0·60 b.d.l. — b.d.l. —
FeO 12·55 0·42 b.d.l. — 5·81 0·89 11·09 0·59 0·41 0·18 3·41 0·21
MnO b.d.l. — b.d.l. — b.d.l. — b.d.l. — b.d.l. — b.d.l. —
MgO 29·31 1·74 b.d.l. — 8·58 0·56 32·22 0·92 b.d.l. — 5·03 0·62
CaO 6·09 1·27 51·29 0·90 37·08 0·69 2·68 2·00 52·14 0·75 37·01 0·48
Na2O 0·22 0·07 b.d.l. — 0·20 0·11 0·48 0·12 b.d.l. — 5·37 1·65
K2O b.d.l. — b.d.l. — 1·15 0·26 b.d.l. — b.d.l. — 0·53 0·01
P2O5 b.d.l. — b.d.l. — 0·27 0·05 b.d.l. — b.d.l. — 0·12 0·01
CO2 51·49 0·79 48·71 1·02 45·08 1·31 49·21 1·29 47·46 0·80 48·29 1·92
Total 100 100·00 100·00 100·00 100·00 100·00
GA1cc
Phase: Mst Arag Arag Arag Arag Arag
T (8C): 1200 1200 1250 1200 1300 1400
P (GPa): 17 17 17 21 21 21
n: 1 3 s 5 s 5 s 3 s 5 s
SiO2 0·63 b.d.l. — 0·44 0·28 0·41 0·24 b.d.l. — 0·18 0·10
TiO2 0·10 b.d.l. — b.d.l. — b.d.l. — b.d.l. — b.d.l. —
Al2O3 1·01 b.d.l. — b.d.l. — 0·14 0·06 b.d.l. — b.d.l. —
FeO 9·46 3·72 0·40 2·94 0·28 3·27 0·35 5·12 0·54 4·12 0·46
MnO b.d.l. b.d.l. — b.d.l. — b.d.l. — b.d.l. — b.d.l. —
MgO 33·21 5·90 0·23 5·51 0·26 5·36 0·72 4·80 0·49 5·93 0·32
CaO 1·84 37·89 0·76 36·04 0·35 36·92 1·63 33·67 0·97 36·23 1·27
Na2O 0·60 5·58 1·65 8·06 0·19 6·09 0·96 6·56 0·43 6·16 0·94
K2O b.d.l. 0·57 0·05 0·53 0·05 0·43 0·02 0·53 0·08 0·99 0·54
P2O5 0·09 0·15 0·07 b.d.l. — b.d.l. — b.d.l. — 0·17 0·08
CO2 53·06 46·19 0·83 46·48 0·56 47·39 1·83 49·32 1·03 46·21 1·03
Total 100·00 100·00 100·00 100·00 100·00 100·00
Volga-cc
Phase: Mst Arag Mst Arag CMss Mst
T (8C): 1050 1050 1200 1200 1250 1200
P (GPa): 9 9 9 9 9 13
n: 1 2 s 1 2 s 3 s 3 s
SiO2 0·19 0·15 0·21 0·42 b.d.l. — b.d.l. — 1·03 0·15
TiO2 b.d.l. b.d.l. — 0·01 b.d.l. — 0·11 0·05 b.d.l. —
Al2O3 0·30 b.d.l. — 0·17 0·12 0·06 0·54 0·06 0·37 0·13
FeO 13·64 b.d.l. — 12·74 b.d.l. — 6·95 0·84 9·80 0·23
MnO 0·23 b.d.l. — 0·23 b.d.l. — 0·22 0·04 b.d.l. —
MgO 30·48 b.d.l. — 29·21 0·10 0·03 11·15 0·35 33·89 0·50
CaO 6·79 53·52 0·24 6·79 52·82 1·81 34·43 0·72 1·54 0·16
Na2O 0·30 b.d.l. — 0·30 b.d.l. — 0·27 0·08 0·31 0·05
K2O b.d.l. b.d.l. — 0·04 b.d.l. — 1·18 1·58 b.d.l. —
P2O5 b.d.l. b.d.l. — 0·02 b.d.l. — b.d.l. — b.d.l. —
CO2 48·07 46·33 0·03 50·07 46·97 0·69 45·16 1·49 53·06 0·94
Total 100·00 100·00 100·00 100·00 100·00 100·00
(continued)
KISEEVA et al. CARBONATED ECLOGITE PHASE RELATIONS
11
at Bodleian L
ibrary on May 7, 2013
http://petrology.oxfordjournals.org/D
ownloaded from

0·38^0·53wt % K2O; 4·89^5·90wt % MgO; 2·94^3·89wt
% FeO) coexists with small amounts of magnesite
(�1 modal %) that usually has about 13·2mol % FeCO3
and 2·1^3·2mol % CaCO3. No magnesite was found in
experiments at 21GPa, leaving Na-rich aragonite as the
only solid carbonate, except in run V1200-21, where Na-
carbonate with the approximate composition
(Na,K)2(Ca,Mg,Fe)(CO3)2 (Fig. 7c) was detected. Owing
to the small grain size and the presence of multiple, tiny in-
clusions in garnet, we do not exclude the possibility that
unobserved magnesite is a subsolidus phase at 21GPa.
Stishovite or coesite (at 9GPa) is an accessory phase at
all pressures in both starting compositions, reaching 10
modal % at 21GPa in G1300-21 andV1400-21. It is usually
present as inclusions in garnet or clinopyroxene, and often
occurs as quench crystals in carbonate-rich melts. At
17^21GPa, the amount of stishovite is higher than at
9^13GPa. At subsolidus conditions it is anhedral to subhe-
dral (Fig. 1d), whereas with increasing temperature the
crystals become euhedral and slightly elongated. In some
of the experiments, stishovite consists of pure SiO2.
However, up to 5wt % Al2O3 was observed in stishovite
Table 5: Continued
Volga-cc
Phase: Arag Mst Arag Arag Mst Arag
T (8C): 1200 1100 1100 1200 1250 1250
P (GPa): 13 17 17 17 17 17
n: 4 s 1 4 s 3 s 2 s 7 s
SiO2 0·69 0·62 2·20 0·26 0·11 0·31 0·00 0·34 0·02 b.d.l. —
TiO2 b.d.l. — b.d.l. b.d.l. — 0·16 0·09 b.d.l. — b.d.l. —
Al2O3 b.d.l. — 0·94 b.d.l. — b.d.l. — b.d.l. — b.d.l. —
FeO 2·92 0·47 9·54 3·62 0·72 3·89 0·38 9·47 0·40 3·21 0·16
MnO b.d.l. — 0·19 b.d.l. — b.d.l. — b.d.l. — b.d.l. —
MgO 4·51 0·54 34·57 4·87 1·36 6·15 0·48 38·51 4·04 5·42 0·36
CaO 36·25 1·75 1·16 35·14 1·78 36·47 1·86 1·22 0·07 34·05 1·09
Na2O 6·41 1·82 0·49 4·60 0·59 6·20 1·26 0·70 0·27 8·42 0·81
K2O 1·50 0·04 b.d.l. 0·38 0·01 0·42 0·03 0·02 0·03 0·49 0·14
P2O5 b.d.l. — b.d.l. 0·13 0·04 0·17 0·08 b.d.l. — b.d.l. —
CO2 47·72 0·99 50·91 51·02 3·91 46·23 1·22 49·74 4·32 48·40 0·75
Total 100·00 100·00 100·00 100·00 100·00 100·00
Volga-cc
Phase: Arag Na-Carb
T (8C): 1200 1200
P (GPa): 21 21
n: 4 s 2 s
SiO2 b.d.l. — 1·26 0·85
TiO2 b.d.l. — b.d.l. —
Al2O3 b.d.l. — b.d.l. —
FeO 3·90 0·76 2·13 0·30
MnO b.d.l. — b.d.l. —
MgO 5·65 0·93 3·48 0·03
CaO 38·08 1·70 13·57 1·03
Na2O 6·38 0·38 21·02 0·33
K2O 0·27 0·03 3·77 0·23
P2O5 b.d.l. — b.d.l. —
CO2 45·72 0·00 54·78 0·01
Total 100·00 100·00
CO2 content was calculated from the mass-balance calculations and EDS totals.
JOURNAL OF PETROLOGY VOLUME 0 NUMBER 0 MONTH 2013
12
at Bodleian L
ibrary on May 7, 2013
http://petrology.oxfordjournals.org/D
ownloaded from

from some experiments, although because of the small
grain size it is hard to measure the composition precisely.
Quenched melt pools exhibit a high proportion of crys-
talline SiO2. No other SiO2-bearing phase is present in
the quenching products. Usually, these crystals are small
and elongated.
K-hollandite is observed mainly in experiments at
17^21GPa, although small amounts were also observed at
subsolidus conditions at 13GPa (i.e.V1200-13). At pressures
of 17 and 21GPa (although more abundant at 17GPa),
K-hollandite is the most common accessory phase in the
subsolidus runs in both compositions. It persists to 21GPa
but in lesser amounts and as smaller crystals. Usually it
forms eudredral, elongated (up to 20 mm long) inclusions
in garnet (Fig. 3e).The amount of K2O in all the measured
K-hollandite crystals varies between 11·7 and 15·4wt %;
other components include CaO (0·61^1·90wt %),
TiO2 (0·27^1·82wt %), Na2O (0·42^1·09wt %) and FeO
(0^0·89wt %).
Ca-perovskite was observed at 21GPa. It is more
abundant in experiments with theVolga-cc starting mater-
ial. It usually forms tiny (�1^3 mm) well-shaped cubic
crystals. Its small grain size prevents precise analysis.
Nevertheless, all the values are consistent and range
within 25·2^37·7wt % TiO2, 28·8^40·4wt % CaO and
18·0^29·3wt % SiO2. The main impurities are Al2O3
Table 6: Compositions of experimental coesite, stishovite and K-hollandite
Composition: GA1cc GA1cc GA1cc GA1cc GA1cc GA1cc Volga-cc Volga-cc Volga-cc
Phase: Co St St St St St St St St
T (8C): 1250 1200 1400 1300 1400 1650 1550 1250 1200
P (GPa): 9 13 17 21 21 21 13 17 21
SiO2 97·20 92·92 94·31 95·62 92·14 96·57 96·39 97·03 89·56
TiO2 b.d.l. 0·83 b.d.l. 0·20 0·35 0·31 0·41 0·19 1·74
Al2O3 0·61 1·87 1·67 1·11 4·31 2·99 1·23 0·45 0·44
FeO 0·50 0·14 0·19 1·11 b.d.l. 0·32 0·66 0·54 0·78
MnO b.d.l. 0·13 b.d.l. 0·10 0·03 b.d.l. b.d.l. b.d.l. b.d.l.
MgO 0·26 0·24 0·19 0·30 0·77 0·59 0·70 0·13 0·54
CaO 0·48 1·00 0·56 0·34 1·30 1·49 1·22 0·57 2·27
Na2O b.d.l. 0·80 1·42 b.d.l. 0·23 0·21 0·27 0·41 1·11
K2O b.d.l. 0·32 0·65 b.d.l. 0·25 b.d.l. b.d.l. b.d.l. 0·50
P2O5 b.d.l. 0·21 b.d.l. b.d.l. b.d.l. b.d.l. b.d.l. b.d.l. 0·11
Total 99·05 98·46 98·99 98·78 99·38 102·48 100·88 99·32 97·05
Composition: Volga-cc GA1cc GA1cc GA1cc Volga-cc Volga-cc Volga-cc Volga-cc
Phase: St K-Holl K-Holl K-Holl K-Holl K-Holl K-Holl K-Holl
T (8C): 1650 1200 1250 1300 1200 1100 1200 1250
P (GPa): 21 17 17 21 13 17 17 17
SiO2 96·43 63·79 67·51 65·13 66·01 62·45 63·24 63·81
TiO2 0·46 0·72 0·38 0·37 0·27 1·82 1·11 0·47
Al2O3 0·97 18·58 18·05 18·11 18·32 17·44 18·77 19·01
FeO 0·35 0·77 b.d.l. 0·54 0·62 0·88 0·62 0·32
MnO 0·12 b.d.l. b.d.l. b.d.l. b.d.l. b.d.l. b.d.l. b.d.l.
MgO 0·47 0·73 b.d.l. 0·20 0·27 0·61 0·18 b.d.l.
CaO 1·28 1·67 0·91 0·89 0·70 1·90 1·08 0·61
Na2O 0·92 0·96 0·98 1·09 0·42 0·76 0·86 0·90
K2O 0·48 13·16 13·87 13·67 15·39 11·71 13·72 14·87
P2O5 b.d.l. b.d.l. b.d.l. b.d.l. b.d.l. 0·27 b.d.l. b.d.l.
Total 101·48 100·39 101·69 100·00 102·00 97·84 99·58 99·97
KISEEVA et al. CARBONATED ECLOGITE PHASE RELATIONS
13
at Bodleian L
ibrary on May 7, 2013
http://petrology.oxfordjournals.org/D
ownloaded from

(which may be related to overlapping crystals), Na2O and
FeO. The abundance of CaO and to a lesser extent TiO2
and Na2O in Ca-perovskite increases with increasing tem-
perature, whereas the amounts of SiO2, Al2O3 and MgO
decrease.
Most of the experiments with the GA1cc starting mater-
ial, at both subsolidus and above-solidus conditions, con-
tained accessory graphite or diamond crystals (Figs 1b, 7b
and 9a, b). Crystal size ranged from 10 to 40 mm. At
9^13GPa, grain shapes were anhedral or sometimes
rounded. Under subsolidus conditions the grains had a
clear basal cleavage indicating that they were graphite. At
17^21GPa, the shape of this phase appeared more crystal-
line, and the hardness of the grains while polishing indi-
cated the formation of diamond for both subsolidus and
supersolidus runs. The presence of diamond in some
runs (e.g. G1400-21) was verified by laser Raman
spectroscopy.
Experimental melts and their compositions
All the supersolidus experiments in this study contain 7·5^
18% melt. Melts did not quench to a glass but instead usu-
ally formed heterogeneous pools of quenched silicate and
carbonate phases, interstitial between coarser residual
crystals of garnet and other phases. The compositions of
these metastable quench crystals could not generally be
determined precisely because of their very fine grain size.
(Figs 1c and 3c, d, f). In some cases, melt partially segre-
gated to distinct zones in the capsules.
All of the melts produced are carbonate-rich (25^46%
CO2). The amount of CO2 in the melt has been estimated
from analytical totals that deviate from 100%, as well as
by mass-balance calculations. As previously reported
(Litasov & Ohtani, 2010), the melt composition evolves
from carbonatitic near the solidus to a more siliceous com-
position with increasing temperature and degree of melt-
ing. The heterogeneity of the produced melts is manifested
mainly by high variations in SiO2, Al2O3 and CaO con-
tents (Table 8). Low-degree melts in both compositions
at 9GPa are very similar to the solid carbonate
compositions (Fig. 8), but contain significant amounts of
TiO2 (2·67^3·18wt %) and SiO2 (1·82^4·64wt %). The
melts for GA1cc and Volga-cc differ slightly at 13GPa,
with different proportions of SiO2, Al2O3 and CaO. The
amount of alkali components, TiO2, FeO and MgO in
both melts is similar. All the melts at 17GPa for both com-
positions (except V1250-17) are silicate^carbonate at rela-
tively high (15·5^18%) degrees of melting. Similar to runs
at 13GPa, melt produced by the GA1cc composition at
21GPa is more SiO2-rich, whereas melts of the Volga-cc
starting material contain much higher concentrations of
CaO. The only low-degree melt (�7·5% melting) that
was analyzed (in experiment V1250-17) coexists with solid
magnesite and aragonite and is alkali-rich (�14·8wt %
Na2O and �3·6wt % K2O).
The Ca# of the melts decreases slightly and Mg# in-
creases slightly with increasing pressure and increasing
degree of melting (Fig. 10a and b). However, the Ca#
for melts at 17GPa is lower than for melts at 21GPa.
Table 7: Compositions of experimental Ca-perovskite
Composition: GA1cc Volga-cc
T (8C): 1300 1400 1200 1200 1300 1400 1400
P (GPa): 21 21 17 21 21 21 21
n: 3 s 4 s 2 s 1 5 s 2 s 2 s
SiO2 26·55 0·85 18·02 9·97 23·03 5·62 29·26 28·78 2·23 26·10 0·70 26·10 0·70
TiO2 26·51 1·67 34·70 11·43 37·73 6·51 25·17 26·82 1·85 26·82 1·70 26·82 1·70
Al2O3 4·98 1·23 1·69 5·91 3·13 0·65 5·56 3·19 1·14 3·55 0·63 3·55 0·63
FeO 1·47 0·46 1·48 1·28 2·63 0·69 2·28 1·03 0·25 1·26 0·33 1·26 0·33
MnO 0·12 0·07 0·11 0·08 b.d.l. — b.d.l. b.d.l. — b.d.l. — b.d.l. —
MgO 1·35 0·48 0·63 1·92 0·84 0·46 1·54 0·67 0·52 0·83 0·42 0·83 0·42
CaO 37·54 1·67 40·40 6·95 28·82 1·00 34·73 37·92 1·83 39·75 1·34 39·75 1·34
Na2O 1·16 0·29 2·44 0·87 2·49 0·26 1·08 1·31 0·63 1·32 0·84 1·32 0·84
K2O 0·33 0·07 0·52 0·25 1·33 0·17 0·38 0·27 0·19 0·38 0·29 0·38 0·29
P2O5 b.d.l. — b.d.l. — b.d.l. — b.d.l. b.d.l. — b.d.l. — b.d.l. —
Total 100·00 100·00 100·00 100·00 100·00 100·00 100·00
JOURNAL OF PETROLOGY VOLUME 0 NUMBER 0 MONTH 2013
14
at Bodleian L
ibrary on May 7, 2013
http://petrology.oxfordjournals.org/D
ownloaded from

Table 8: Compositions of experimental melts
GA1cc
T (8C): 1400 1300 1400 1550 1400 1500
P (GPa): 9 13 13 13 17 17
Type of melt: Carb Si-Carb Si-Carb Si-Carb Si-Carb Si-Carb
n: 6 s 5 s 3 s 5 s 6 s 2 s
SiO2 4·64 1·96 17·28 16·29 18·67 2·94 20·35 7·44 25·90 2·76 25·97 2·24
TiO2 2·67 0·61 0·82 0·26 1·46 0·55 0·54 0·33 0·90 0·19 1·00 0·02
Al2O3 1·48 0·88 3·38 2·95 2·66 2·13 1·62 1·64 4·05 2·32 5·75 4·16
FeO 5·62 0·68 5·14 0·47 5·72 0·56 5·33 0·56 4·81 0·59 5·03 0·21
MnO b.d.l. — b.d.l. — 0·16 0·08 0·19 0·18 0·10 0·03 b.d.l. —
MgO 4·82 0·29 5·97 1·00 5·09 0·38 6·01 0·91 5·27 0·74 5·55 0·67
CaO 31·96 1·88 22·06 2·71 22·00 1·91 25·88 3·69 18·95 1·08 20·94 4·60
Na2O 0·78 0·29 5·12 0·54 5·41 1·03 2·56 1·55 9·06 1·00 8·57 2·14
K2O 2·89 1·77 2·12 0·14 1·43 0·36 1·20 0·84 1·92 0·36 1·88 0·47
P2O5 1·40 0·22 b.d.l. — 0·38 0·07 0·48 0·17 b.d.l. — 0·25 0·07
CO2 43·74 2·71 38·11 15·29 37·00 0·00 35·83 4·60 29·04 3·73 25·06 0·00
Total 100·00 100·00 100·00 100·00 100·00 100·00
Element ratios
Mg# 60·46 67·45 61·31 66·79 66·14 66·28
CaO/SiO2 6·89 1·28 1·18 1·27 0·73 0·81
K2O/Na2O 3·69 0·41 0·26 0·47 0·21 0·22
GA1cc Volga-cc V1300-13a V1300-13b
T (8C): 1650 1400 1300 1300 1400 1550
P (GPa): 21 9 13 13 13 13
Type of melt: Si-Carb Carb Carb Carb Carb Carb
n: 4 s 5 s 5 s 1 s 7 s 8 s
SiO2 23·48 1·84 1·82 1·09 14·57 3·04 7·63 1·89 1·20 3·25 2·80
TiO2 1·17 0·17 3·18 1·34 0·65 0·21 0·21 0·73 0·24 0·93 0·48
Al2O3 0·91 0·50 0·63 0·42 2·24 1·35 0·20 0·73 0·54 1·04 1·18
FeO 3·17 0·24 7·00 0·21 4·72 0·27 5·25 7·13 1·20 7·96 1·36
MnO b.d.l. — 0·24 0·16 b.d.l. — 0·11 b.d.l. — b.d.l. —
MgO 3·88 0·26 5·18 0·83 4·72 0·47 5·39 5·90 1·46 6·74 2·04
CaO 18·84 0·64 32·66 1·05 23·53 1·50 28·71 30·64 1·42 33·00 3·49
Na2O 10·32 0·46 0·82 0·16 6·68 0·63 5·34 3·72 1·25 5·82 3·90
K2O 2·59 0·32 1·82 0·57 3·02 0·27 3·34 1·83 0·91 2·38 2·01
P2O5 0·36 0·03 1·22 0·38 0·37 0·05 0·32 0·63 0·20 0·76 0·34
CO2 35·30 1·34 45·42 1·54 39·49 2·95 43·50 46·79 1·39 38·12 0·00
Total 100·00 100·00 100·00 100·00 100·00 100·00
Element ratios
Mg# 68·57 56·87 64·04 64·66 59·61 60·17
CaO/SiO2 0·80 17·90 1·61 3·76 16·18 10·15
K2O/Na2O 0·25 2·23 0·45 0·63 0·49 0·41
(continued)
KISEEVA et al. CARBONATED ECLOGITE PHASE RELATIONS
15
at Bodleian L
ibrary on May 7, 2013
http://petrology.oxfordjournals.org/D
ownloaded from

Table 8: Continued
Volga-cc
T (8C): 1250 1400 1500 1300 1400 1650 1900
P (GPa): 17 17 17 21 21 21 21
Type of melt: Si-Carb Si-Carb Si-Carb Carb Carb Carb Carb
n: 6 s 4 s 4 s 4 s 5 s 9 s 5 s
SiO2 15·20 8·35 28·08 4·60 28·25 14·08 1·98 0·49 4·50 3·08 5·02 3·61 9·58 3·52
TiO2 0·54 0·13 0·78 0·16 0·89 0·23 0·44 0·19 0·49 0·38 1·53 1·11 3·24 0·41
Al2O3 0·62 0·23 5·37 0·75 3·13 3·37 0·35 0·11 0·95 0·57 0·97 0·45 2·77 1·60
FeO 4·06 0·46 3·83 0·56 4·45 1·01 4·73 0·68 5·42 1·62 6·91 1·09 5·77 0·62
MnO b.d.l. — b.d.l. — b.d.l. — b.d.l. — 0·14 0·04 0·19 0·10 0·12 0·04
MgO 4·18 0·60 4·83 0·55 5·72 1·26 6·52 0·41 5·45 1·08 5·75 0·72 5·18 0·45
CaO 15·99 1·63 16·34 1·65 19·65 4·40 26·32 0·77 24·95 1·55 27·95 1·66 21·96 3·25
Na2O 14·79 1·16 8·56 0·99 7·91 1·72 10·85 0·50 12·42 1·52 9·67 2·82 11·38 3·37
K2O 3·62 0·34 1·97 0·33 3·10 1·35 3·23 0·11 3·49 0·46 3·41 0·69 3·60 0·62
P2O5 0·11 0·04 0·14 0·05 0·38 0·13 b.d.l. — 0·19 0·07 0·58 0·14 1·39 0·25
CO2 40·90 4·73 30·10 0·00 26·52 8·21 45·60 0·36 42·00 0·00 38·00 0·00 35·00 0·00
Total 100·00 100·00 100·00 100·00 100·00 100·00 100·00
Element ratios
Mg# 64·74 69·19 69·61 71·08 64·20 59·72 61·53
CaO/SiO2 1·05 0·58 0·70 13·33 5·54 5·57 2·29
K2O/Na2O 0·24 0·23 0·39 0·30 0·28 0·35 0·32
CO2 content was calculated from the mass-balance calculations and EDS totals. The normalized values of melts totalshave 0·0 standard deviation for CO2, compared with those that have not been normalized.
Fig. 2. Experimental P^T phase diagram for GA1cc andVolga-cc. Abbreviations as inTable 2.Y, solidus of dry eclogite byYasuda et al. (1994);HF, solidus of dry eclogite by Hirose & Fei (2002); K, solidus for GA1cc in Au^Pd capsules at 5GPa (Kiseeva et al., 2012). Gr-D indicates graph-ite^diamond transition (Kennedy & Kennedy, 1976). Circles indicate experimental runs. Diamonds inside the circles indicate the presence ofdiamond or graphite in GA1cc runs.
JOURNAL OF PETROLOGY VOLUME 0 NUMBER 0 MONTH 2013
16
at Bodleian L
ibrary on May 7, 2013
http://petrology.oxfordjournals.org/D
ownloaded from

Unlike Keshav & Gudfinnsson (2010), in this study any
increase in the Mg content of the melt with increasing
pressure is not observed. The amount of alkali compo-
nents in the melt increases dramatically with increasing
pressure, and the Na/K ratio increases up to the point of
K-hollandite saturation, and then subsequently decreases
(Fig. 11a and b).
DISCUSS ION
Solidus of carbonated eclogite andcomparison with previous studies
Experimental data on MORB-like compositions at pres-
sures above 8^10GPa are limited. Studies on volatile-free
MORB and K-rich MORB compositions (Yasuda et al.,
1994; Wang & Takahashi, 1999; Hirose & Fei, 2002)
Fig. 3. BSE images of the experimental runs. (a) RunV1400-9. Mineral assemblage at 9GPa above the solidus. (b) RunV1200-13 subsolidusmineral assemblage at 13GPa. (c) Run G1300-13 showing heterogeneously distributed melt and patches of carbonate melt separated fromareas of silicate^carbonate melt. (d) Run G1400-17. Heterogeneous melt pools. (e) Run G1100-17. K-hollandite crystal included in Grt. (f) RunG1650-21. Heterogeneous silicate^carbonate melt at 21GPa. Carbonate-rich matrix with quenched CAS and stishovite crystals.
KISEEVA et al. CARBONATED ECLOGITE PHASE RELATIONS
17
at Bodleian L
ibrary on May 7, 2013
http://petrology.oxfordjournals.org/D
ownloaded from

reported an increase in solidus temperatures from 16008C
at 8GPa to 2100^22008C at 20GPa. The melts in these
studies are silica-rich, with 50^60wt % SiO2 at pressures
below 20GPa (Yasuda et al., 1994; Wang & Takahashi,
1999). At higher pressures the amount of SiO2 in the
melts decreases to 44^48wt % (Wang & Takahashi,
1999; Hirose & Fei, 2002). The amount of alkali compo-
nents in the low-degree melts is strictly governed by the
Fig. 4. Na content of experimentally crystallized garnet and clinopyroxene. (a) Na distribution amongst the major phases within an eclogite as-semblage. Dashed line indicates 1^1 ratio; numbers indicate pressure in the experimental runs reported in literature. Arrows indicate pressureand the amount of clinopyroxene in the experiments with GA1cc andVolga-cc compositions. (b) Na vs Si in experimental garnet. Pt-Gr, experi-ments in Pt^graphite capsule; Au-Pd, experiments in Au^Pd capsule (see Kiseeva et al. 2012). O&M, hydrous MORB (Okamoto &Maruyama, 2004); L&O, carbonated MORB (Litasov & Ohtani, 2010); Y, dry MORB (Yasuda et al., 1994).
JOURNAL OF PETROLOGY VOLUME 0 NUMBER 0 MONTH 2013
18
at Bodleian L
ibrary on May 7, 2013
http://petrology.oxfordjournals.org/D
ownloaded from

stability of clinopyroxene and K-hollandite, as in the pre-
sent study.
The solidus of hydrous MORB has been estimated by
Okamoto & Maruyama (2004) to lie near 12008C at
19GPa, which is similar to the GA1cc and Volga-cc solidi
and about 10008C below the dry MORB solidus at the
same pressure. Litasov & Ohtani (2005) reported a much
higher solidus temperature for hydrous MORB at
18^28GPa, only �50^1008C lower than the dry MORB
solidus. Those researchers suggested that a small amount
of supercritical fluid was present in the runs even at the
lowest temperatures (10008C), and reported an ‘apparent
solidus’ based on extensive melting of the main silicate
phases, which occurred above 20008C at 20GPa. Similar
to the melts produced from dry MORB compositions, the
melts reported by Litasov & Ohtani (2005) are silica-rich.
There are only twopublishedexperimental studies oncar-
bonated eclogite compositions at pressures above 10GPa,
both in simplified systems: CMAS þ 20% CO2 (Keshav &
Gudfinnsson, 2010) and Na-CMASþ 5% CO2 (Litasov &
Ohtani, 2010). The solidus of carbonated eclogite at 10^
20GPa was reported to lie about 400^5008C below the dry
eclogite solidus (Litasov & Ohtani, 2010). At 10GPa, it was
about 50^1008C higher than the carbonated eclogite solidus
at 9GPaofDasgupta et al. (2004) (Fig.12).
Keshav & Gudfinnsson (2010) referred to their melts as
‘calcio-carbonatites’, with a substantial increase in the
MgCO3 component from low pressures (12^16GPa) to high
pressures (20^25GPa); the amount of SiO2 in themelts does
notexceed2·4wt%.Litasov&Ohtani (2010) facedproblems
with determination of partial melt compositions at 10·5 and
16·5GPa owing to possible coexistence of both carbonatitic
and carbonate-rich silicate melts, which indicate liquid im-
miscibility or heterogeneity across the sample. The Na2O
content in either of these melts does not exceed 3·1wt %
within the stability field of clinopyroxene, and is up to 7·2wt
% Na2O at higher pressures, where clinopyroxene is no
longer stable. This is similar to the melting style of GA1cc
andVolga-cc, which both exhibit a dramatic increase in the
alkali contents of themelts at pressures above clinopyroxene
stability. Both studies reportedmagnesite (ormagnesite and
aragonite together) coexistingwithcarbonatiticmelt.
Unlike at lower pressures (55^6GPa), all of the MORB
solidi except Volga-cc show a gradual increase in solidus
temperature with increasing pressure. However, the
slopes of the various solidi in P^Tspace are highly variable
(Fig. 12). Volatile-free eclogite solidi are very steep and
linear up to the point of clinopyroxene disappearance, but
significantly less steep at higher pressures (Yasuda et al.,
1994; Wang & Takahashi, 1999; Hirose & Fei, 2002). A
steep linear solidus was also reported for CMASþ 20%
CO2 (Keshav & Gudfinnsson, 2010) and MORBþ 2%
H2O (Litasov & Ohtani, 2005). On the other hand, most
alkali-bearing, carbonated eclogites and peridotites
(Ghosh et al., 2009; Litasov & Ohtani, 2009b, 2010) display
essentially flat solidi with increasing pressure from 10 to
20^30GPa, in good agreement with the solidi of GA1cc
andVolga-cc determined in this study.
The probable cause for the dramatic differences in sol-
idus temperatures between different carbonated eclogite
compositions lies in similar compositional parameters
identified in lower pressure studies (Dasgupta et al., 2004,
2005), which include Ca#, amount of CO2 and H2O, and
CaO/MgO and Na2O/CO2 ratios. Litasov et al. (2013) con-
sidered the true solidus of hydrogen-free carbonated eclog-
ite and peridotite to be strongly influenced by the amount
of alkalis and placed it at temperatures similar to this
study. Those researchers also reported a possible negative
slope from 15 to 21GPa for the Na-carbonatite solidus,
which is similar to the solidus determined forVolga-cc.
The main host for K in different starting compositions
differs significantly. In more K-rich compositions, such as
Fig. 5. Na2O content of the experimentally crystallized phases. (a)Garnet. (b) Clinopyroxene.
KISEEVA et al. CARBONATED ECLOGITE PHASE RELATIONS
19
at Bodleian L
ibrary on May 7, 2013
http://petrology.oxfordjournals.org/D
ownloaded from

dry CO2-bearing pelite with 2·21wt % K2O in the start-
ing mixture, a K-bearing phase that incorporates most of
the bulk K2O has been reported by Grassi & Schmidt
(2011a, 2011b) across the entire P^T range studied (e.g.
T¼ 900^15508C; P¼ 5·5^23·5GPa). Those researchers
observed K-feldspar, which crystallized at 59GPa and
was followed by K-hollandite at 49GPa, with other
phases such as clinopyroxene, carbonate or garnet contain-
ing very small amounts of K (usually �1wt %). K-feld-
spar was also reported at 900 and 10008C and 3GPa by
Tsuno & Dasgupta (2012) for carbonated pelite compos-
ition with 1·99wt % K2O in the starting mixture.
Fig. 6. Compositions of experimentally crystallized clinopyroxene. (a) Sum of divalent cations as a function of pressure. (b) Al content as afunction of Si content. Labels as in Fig. 4.
JOURNAL OF PETROLOGY VOLUME 0 NUMBER 0 MONTH 2013
20
at Bodleian L
ibrary on May 7, 2013
http://petrology.oxfordjournals.org/D
ownloaded from

For carbonated eclogite compositions, like those studied
by Litasov et al. (2013), the low solidus temperatures may
be attributed mainly to high alkali/CO2 ratios and to
the stability of alkali carbonates. Although at pressures
higher than around 6GPa in the simple KAlSi3O8 or
(K,Na)AlSi3O8 systems, K-feldspar was noted to trans-
form to wadeiteþkyaniteþ coesite (Urakawa et al., 1994;
Yagi et al., 1994), no potassium-bearing crystalline phase
was detected in most experimental runs on eclogite and
peridotite systems between the stability fields of sanidine
and K-hollandite (Wang & Takahashi, 1999; Ghosh et al.,
2009). Hence within the pressure range 5^13GPa potas-
sium is highly incompatible in silicate phases, and under
anhydrous conditions any potassium would partition into
the melt or a carbonate phase if not incorporated into
clinopyroxene. This was well documented by Wang &
Takahashi (1999), who reported 6·64wt % K2O at 5GPa
in the melt and up to 1·9wt % K2O in clinopyroxene at
about 7GPa. In CO2-bearing starting compositions, a K-
carbonate phase may be a more plausible host for K
than clinopyroxene; however, this needs more
clarification.
With increasing pressure up to the clinopyroxene-out
phase boundary at 14^16GPa, Na becomes more compat-
ible in clinopyroxene. The more Na is in the system, the
more jadeitic clinopyroxene is formed. The disappearance
of clinopyroxene roughly coincides with the appearance of
K-hollandite, which changes the compatibility of Na and
K in opposite senses. K-hollandite incorporates all the K,
whereas Na becomes highly incompatible until the stability
fields of NAL and CF phases (425GPa) are reached
(Hirose & Fei, 2002; Litasov & Ohtani, 2005). Although
some Na2O can be accommodated in majoritic garnet, in
the studied eclogitic systems the N2O concentration in
garnet does not exceed 2^3wt % (Yasuda et al., 1994;
Wang & Takahashi, 1999; Litasov & Ohtani, 2005) and
goes up to 3·1wt % Na2O for majoritic garnet in experi-
ment V1100-17. Thus, in the same manner as K, the ‘excess’
Na either fluxes the formation of low-degree melts, or, in
carbonated systems, it partitions into Na-rich crystalline
carbonates. This suggests that the Na- and K-bearing car-
bonated eclogite solidus will be largely controlled by the
melting of Na- and K-bearing carbonate phases, which
presumably are K-carbonates at 9^13GPa and Na-
Fig. 7. C-bearing phases at different P^T conditions. (a) Run G1200-9. Aragonite and magnesite. (b) Run G1400-13. Diamond or graphitewithin carbonate melt. (c) RunV1200-21. Na-carbonates coexisting with Na-rich aragonite. (d) Run G1400-21. Na-rich aragonite within fine-grained matrix.
KISEEVA et al. CARBONATED ECLOGITE PHASE RELATIONS
21
at Bodleian L
ibrary on May 7, 2013
http://petrology.oxfordjournals.org/D
ownloaded from

carbonates at 17^21GPa. This may be also one of the rea-
sons for the significant difference in GA1cc and Volga-cc
solidus temperatures at 17^21GPa. Whereas most of the
carbon in GA1cc partitions into Na-rich aragonite and dia-
mond, no diamond was observed inVolga-cc, and Na-car-
bonate (with, perhaps, a lower solidus temperature than
Na-rich aragonite) crystallized. This is consistent with the
more sodic character of the clinopyroxene and melts
formed in experiments on the Volga-cc composition.
Carbonate-rich melts in GA1cc and Volga-cc persist up to
the highest temperatures of the experiments, with rela-
tively minor participation of silicates in the melting pro-
cess. This explains the low melt productivity (518%) over
the large range of P^T conditions of the present
experiments.
The alkali/CO2 ratio of the bulk-rock and low solidus
temperatures can also affect the stability fields of the
main phases, including the transformation from eclogite
to garnetite. In carbonate-bearing systems, this transform-
ation should occur at lower pressures (�15GPa) relative
to carbonate-free systems, because of the increased parti-
tioning of Na into Na-aragonite with increasing pressure.
The absence of clinopyroxene in Na-CMASþ 5% CO2 ex-
periments at 16·5GPa (Litasov & Ohtani, 2010) may indir-
ectly indicate the presence of an additional Na-bearing
phase. In contrast, in dry and hydrous eclogite compos-
itions, clinopyroxene can be stable to higher pressures, in
the range of 16^19GPa (Yasuda et al., 1994; Okamoto &
Maruyama, 2004). This has important implications for
mantle melting and density profiles. Owing to the low
melting temperatures of Na-bearing carbonates (511508C
between 10 and 21GPa; Litasov et al., 2010, 2013; this
study), melting of carbonated eclogite may commence in
the deep upper mantle or at the very top of theTransition
Zone. This will effectively remove at least some of the car-
bonate from the system at depths within the upper part of
theTransition Zone.
Stability of carbon-bearing phases in thedeep mantle
Most experimental studies of carbonate stability in the
mantle show that at 5^9GPa dolomite breaks down to ara-
gonite plus magnesite (Martinez et al., 1996; Luth, 2001;
Sato & Katsura, 2001; Buob et al., 2006; Morlidge et al.,
2006). Although there is poor agreement regarding where
this reaction occurs in the CaO^MgO^CO2 system at
lower pressures, most experimental studies place it around
12008C at 9GPa. This study demonstrates that this reac-
tion for compositionally complex natural basaltic compos-
itions at 9GPa occurs at temperatures similar to those in
simplified compositions (i.e. between 1200 and 13008C).
At temperatures below 13008C, pure aragonite and magne-
site are present, whereas at higher temperatures calcite^
magnesite solid solution is observed. In more complicated
Fig. 8. Compositions of crystalline carbonate, melts, garnet and clinopyroxene.
JOURNAL OF PETROLOGY VOLUME 0 NUMBER 0 MONTH 2013
22
at Bodleian L
ibrary on May 7, 2013
http://petrology.oxfordjournals.org/D
ownloaded from

Na- and K-bearing systems at pressures 513GPa, alkali-
rich carbonates either may coexist with magnesite (as
inferred from this study) or may form a solid solution
between alkali-rich and calcite-rich carbonates (�13GPa;
this study) with an estimated composition of
(Na,K)2Ca(CO3)2^CaCO3 or (Na,K)2Ca2(CO3)3^
CaCO3. The amount of K- and Na- component in Na-rich
aragonite is buffered by coexisting K-hollandite and clino-
pyroxene (Grassi & Schmidt, 2011a, 2011b).
Despite some variation in the Na vs K content of Na-rich
aragonite, the proportions of alkali components relative
to (CaþMgþFe) remain constant from 13 to 21GPa
(Fig. 8). The fluctuations observed at 17GPa are within
analytical error, given that Na content may be underesti-
mated during SEM analysis. This may indicate (1) that
the capacity of aragonite to incorporate alkali components
or to create a solid solution with alkali-carbonates is lim-
ited and does not depend on pressure, and (2) the forma-
tion of an alkali-bearing carbonate with a different
structure.
The detailed study of the structure of this alkali-bearing
carbonate is beyond the scope of this study. In any case,
both hypotheses are commensurate with the observation
of Na-carbonate crystals Na2(Ca,Mg,Fe)(CO3)2 (Fig. 7c)
in run V1200-21 coexisting with Na-rich aragonite. The
excess of Na and K that could not be incorporated into
majoritic garnet or alkali-rich carbonate triggered crys-
tallization of additional Na-carbonate under subsolidus
conditions. Recently, Na^Ca carbonate containing
10·1^11·0wt % Na2O and 34·4^38·6wt % CaO was re-
ported by Grassi & Schmidt (2011b) in a carbonate-bear-
ing marine sediment bulk composition at 16^23·5GPa and
1200^14008C, and more Na-rich carbonate with c.
20·8wt % Na2O and c. 36 wt % CaO crystallized at
22^23·5GPa and 1350^14008C. (K,Na)2Ca4(CO3)5 and
(K,Na)2(Mg,Fe,Ca)(CO3)2 carbonates formed at 21GPa
in alkali carbonatite starting mixture have been reported
by Litasov et al. (2013). Similar K2Mg(CO3)2 carbonate
has also been synthesized at 8GPa and 12008C in the
study of Brey et al. (2011).
Another important observation is that alkali-rich carbon-
ates tend to form a solid solution with calcium carbonate
rather than magnesite. The apparent absence of magnesite
at 21GPa could be the result of incorporation of all the Mg
into majorite and Na-rich aragonite. Unlike the previous in-
terpretation that with increasing pressure to theTransition
Zone and lower mantle magnesite remains the only stable
carbonate (Takafuji et al., 2006; Isshiki et al., 2004; Litasov,
2011), there is apossibility that ifCa-bearing rocks of eclogitic
paragenesis are also present at that depth, aragonite (or
alkali-bearing aragonite in the case of high bulk alkali con-
tents)maybecome stable aswell.
The complex phase relations of carbonates at upper-
mantle^Transition Zone pressures are made more complex
by the presence of diamond or graphite. To our knowledge,
this is the first experimental demonstration of diamond
crystallization in a carbonated MORB composition. The
diamond aggregates coexist with either compositionally
variable crystalline carbonates (Fig. 9) or carbonate melts
(Fig. 7b). The fact that diamonds crystallized only in the
GA1cc bulk composition and not the Volga-cc bulk com-
position is of particular interest. A possible explanation
for diamond crystallization in GA1cc is the oxidation of
ferrous iron in silicate garnet as a consequence of the
increased stability of the andradite component (Simakov,
2006). However, the composition and modal proportions
of garnet in GA1cc and Volga-cc at 17^21GPa are almost
the same.
Unfortunately, it was not possible to directly measure
Fe3þ in the garnets from this study, although their cation
sums are consistent with most, if not all, iron being present
as Fe2þ. Another reason would be partial contamination
of the sample by hydrogen derived from cell assembly
parts during the experiment. This is not likely because
then diamond formation would have been expected in
both compositions, which is not the case.
Fig. 9. Carbonate inclusions in diamond or graphite. SEM images ofG1200-9 run.
KISEEVA et al. CARBONATED ECLOGITE PHASE RELATIONS
23
at Bodleian L
ibrary on May 7, 2013
http://petrology.oxfordjournals.org/D
ownloaded from

The following reaction governing diamond formation in
eclogite systems has been proposed by Luth (1993):
CaMg CO3ð Þ2þ2SiO2 ¼ CaMgSi2O6 þ 2CþO2
dolomiteþ coesite ¼ diopsideþ diamondþO2
Applying this reaction to the subsolidus experiments at
9GPa, in which magnesite and aragonite coexist, results in
CaCO3 þMgCO3 þ 2SiO2 ¼ CaMgSi2O6 þ 2CþO2:
The equilibrium constant for this reaction is
K ¼aCaMgSi2O6
� a2C � fO2
aCaCO3� aMgCO3
� a2SiO2
:
Given the presence of both coesite or stishovite and car-
bonates in all the experiments, it is possible to conclude
that the denominator can be assumed to be unity for
almost pure carbonate components. Because GA1cc and
Volga-cc compositions are run simultaneously (in the
same experiment), we assume that the oxygen fugacity in
the two charges is the same.Thus, diamond versus carbon-
ate stability will depend on the activity of the diopside
component. The fact that the diopside component in
GA1cc clinopyroxene from subsolidus experiments at
9GPa is �5^10mol % lower than theVolga-cc clinopyrox-
ene at the same P^Tconditions is consistent with this ana-
lysis. However, the influence of clinopyroxene composition
on diamond formation at constant oxygen fugacity needs
further experimental investigation.
Melting of carbonated eclogite in the deepmantle
There is general agreement, based on experimental studies
and on studies of natural rocks, that substantial amounts
of carbonate survive subduction beyond the sub-arc
regime and into the deeper upper mantle (Kerrick &
Connolly, 2001; Dasgupta & Hirschmann, 2010). Our re-
sults agree with previous studies and demonstrate that the
solidus of the carbonated mafic component of the subduct-
ing slab is at temperatures above most subduction
Fig. 10. Compositions of experimental melts as a function of pressure.(a) Ca#. (b) Mg#.
Fig. 11. Compositions of experimental melts as a function of pressure.(a) Molar Na/K ratio. (b) (NaþK) in mol %. (GrtþCpx) and Grtindicate stability field of the phases coexisting with melts.
JOURNAL OF PETROLOGY VOLUME 0 NUMBER 0 MONTH 2013
24
at Bodleian L
ibrary on May 7, 2013
http://petrology.oxfordjournals.org/D
ownloaded from

geotherms in the upper mantle, although it may intersect
subduction zone geotherms in the Transition Zone
(Fig. 12). Unlike all previous studies on MORB-like com-
positions byYasuda et al. (1994),Wang & Takahashi (1999),
Hirose & Fei (2002), Keshav & Gudfinnsson (2010) and
Litasov & Ohtani (2010), the solidi of GA1cc and Volga-cc
are significantly below the mantle adiabat, at least to
21GPa.
Low-velocity seismic anomalies on top of the 410 km dis-
continuity in the vicinity of subducted slabs have been re-
ported in some geophysical studies (Revenaugh & Sipkin,
1994; Song et al., 2004). Low P-wave velocity zones have
also been observed above the subducted Pacific slab along
almost its entire descending path into theTransition Zone,
in the depth range of 250^500 km (Zhao & Ohtani, 2009).
One possible interpretation of this may be partial melting
of the slab associated with dehydration, decarbonation or
their combined effects. Being located at the top and there-
fore hotter region of the subducted slab, carbonate-rich
(and perhaps some H2O-bearing) rocks are most likely to
be first in the melting sequence. On melting, they may
yield alkali-rich calcio-dolomitic melts across the whole
range of investigated pressures. The concentration of
alkali components in these melts will be dependent on
their content in the bulk-rock, on Na and K compatibil-
ities, and on the degree of partial melting.
Na and K compatibilities in MORB mineral phases
(garnet and clinopyroxene) at higher pressures have been
addressed by many experimental studies (Wang &
Takahashi, 1999; Spandler et al., 2008; Ghosh et al., 2009).
Sodium can be incompatible, partitioning into the melt
relative to clinopyroxene at fairly low pressures of
�53GPa (e.g. Blundy & Dalton, 2000; Dasgupta et al.,
2005; Yaxley & Brey, 2004). It may also be incompatible at
pressures beyond the clinopyroxene stability field (i.e.
P4�15GPa). However, between �4^5 and �15GPa,
sodium is compatible in clinopyroxene because of the high
stability of jadeite. Therefore low-degree, highly sodic
melts are unlikely to form in carbonate eclogite in the
depth range of 90^400 km. Given that the subducting
mafic oceanic crust is expected to have Na/K41, K-rich
and Na-poor low-degree melts may form in this
90^400 km depth range. Conversely, at Transition Zone
pressures, the melts are likely to have higher Na/K ratios
because of the disappearance of clinopyroxene from the
system.
Fig. 12. Comparison of GA1cc and Volga-cc solidi with other experimental studies and mantle and subduction geotherms (field marked withbold lines). OG, oceanic geotherm; CG, cratonic geotherm. Grey field indicates an approximate mantle adiabat with an average ofTp¼13158C (McKenzie & Bickle, 1988; McKenzie & O’Nions, 1991). Black and coloured lines mark the following solidi: WT, solidus of dryeclogite byWang & Takahashi (1999); KG, solidus of carbonated eclogite by Keshav & Gudfinnsson (2010); H, solidus of carbonated eclogiteby Hammouda (2003); D, solidus of carbonated eclogite by Dasgupta et al. (2004); YB, solidus of carbonated eclogite byYaxley & Brey (2004);LO, solidus of carbonated eclogite by Litasov & Ohtani (2010).With light grey lines the following solidi are marked: D, solidus of carbonatedperidotite by Dasgupta & Hirschmann (2006); L, solidus of carbonated peridotite by Litasov & Ohtani (2009b). Subduction geotherms are com-piled from van Keken et al. (2002) and Syracuse et al. (2010). Other labels as in Fig. 2.
KISEEVA et al. CARBONATED ECLOGITE PHASE RELATIONS
25
at Bodleian L
ibrary on May 7, 2013
http://petrology.oxfordjournals.org/D
ownloaded from

Thus, if partial melting of carbonate begins at
250^300 km depth (7·5^9GPa) the melts produced in the
top part of the subducted slab would have K-rich carbonate
compositions. These melts will segregate easily from the
eclogitic residue owing to their low density and low viscos-
ity, removing potassium and other incompatible elements
from the residual slab. The next pulse of partial melting
will most probably start at the eclogite^garnetite trans-
formation, which in carbonated eclogite systems will
begin near the top of the Transition Zone (about
400^450 km depth), corresponding to pressures of around
14^15GPa. Low-degree melts are expected to be extremely
Na-rich, consistent with the sodic nature (14·8wt %
Na2O, Na2O/K2O¼ 4·09) of the low-degree partial melt
(�7·5%) in experiment V1200-17. It is likely that most po-
tassium has been removed from the system before these
depths, during the lower pressure melting pulse described
above. Being of low viscosity, these Na-rich melts will rap-
idly segregate from the garnetite residue, metasomatizing
the surrounding peridotite, or even fluxing its partial melt-
ing, or forming diamond by ‘redox freezing’ (Rohrbach &
Schmidt, 2011). It should be noted that the eclogite^garne-
tite transformation occurs at different pressures depending
on bulk-rock composition.
After considerable partial melting and removal of alkalis
from the carbonated eclogite system, some carbon may
still be preserved in the rock as diamond. This argument
is supported by the formation of diamonds at 17GPa in
equilibrium with alkali-rich carbonate melt, and by the
presence of carbonate inclusions in diamonds from the
Transition Zone^lower mantle (Brenker et al., 2007). The
amount of diamond preserved in the rock will depend on
the bulk-rock composition and on oxygen fugacity.
Overall, we conclude that alkali-bearing carbonated
eclogite in the subducted slab will lose most of its volatile,
carbonate and alkali components during multiple partial
melting events upon descent, leaving only refractory eclog-
ite with small amounts of carbon (stored as diamond) and
water (in normally anyhdrous minerals) as it approaches
the Transition Zone and the top of the lower mantle. This
assumption is supported by low Na contents (�1·5wt %
Na2O) in majorite inclusions in diamonds (Collerson
et al., 2010) although at the pressures of majorite stability
this phase is capable of holding much higher amounts of
Na (Yasuda et al., 1994; Litasov & Ohtani, 2005).
Findings of various high-pressure minerals as inclusions
in natural diamonds (Harte, 2010) reinforce the results of
this study. Here we show that diamonds can crystallize
from Ca-rich carbonate melts (with various amount of
alkali components) that are produced by low-degree melt-
ing of carbonated MORB at all the pressures from 5 to
21GPa (Kiseeva et al., 2012; this study). These melts are
compositionally similar to those proposed as parental to
the Udachnaya-East kimberlites (Kamenetsky et al., 2004;
Litasov et al., 2010; Sharygin et al., 2013) and other kimber-
lites worldwide (Kamenetsky et al., 2009), and can also be
involved in the carbonatite magmatism.
CONCLUSIONS
We have investigated experimentally the melting and
phase relations of two MORB eclogite compositions with
4·4% CO2, at temperatures of 1100^19008C and pressures
of 9^21GPa. The solidus temperatures are above the sub-
duction geotherm but below the estimated mantle adiabat.
(1) The main subsolidus mineral assemblage consists of
garnet, coesite or stishovite, clinopyroxene (9, 13GPa)
and carbonate. Over the range of P^Tconditions stu-
died, carbon-bearing phases include the following:
magnesite and aragonite or calcite^magnesite solid
solution (similar to dolomite composition) at 9GPa;
magnesite and aragonite (GA1cc) or magnesite and
Na-rich aragonite (Volga-cc) at 13GPa; magnesite
and Na-rich aragonite at 17GPa; Na-rich aragonite
(GA1cc, Volga-cc) and Na-carbonate (Volga-cc) at
21GPa; diamond or graphite at 9^21GPa (GA1cc).
(2) Na-rich aragonite is an alternative to clinopyroxene as
a host for K and Na at pressures greater than 13GPa.
(3) In the Volga-cc bulk composition, the solidus curve is
almost flat and falls between 1200 and 13008C over
the entire investigated pressure range. In the GA1cc
bulk composition, the solidus is located at similar
temperatures at 9^13GPa, but lies at higher tempera-
tures (1300^15008C) at 17^21GPa.
(4) The difference in solidi between the GA1cc andVolga-
cc bulk compositions is related to a change in Na com-
patibility between 13 and 17GPa, owing to the dis-
appearance of omphacitic clinopyroxene, resulting in
the formation of Na-bearing carbonate in the Volga-
cc, to carbonate reduction and diamond precipitation,
induced either by progressive Fe2þ^Fe3þ transition in
garnet with pressure or by influence of the diopside
component in the clinopyroxene, in the GA1cc bulk
composition.
(5) Low-degree melts in both compositions are alkali-
rich. The amount of alkalis in the melts increases sig-
nificantly with pressure, and is buffered by the pres-
ence of clinopyroxene and K-hollandite in the system.
(6) Two melting pulses are proposed for subducted slabs
carrying carbonated eclogite in their upper sections.
The first melt pulse at �250^300 km depth, or
�8^9GPa, will produce K-rich carbonatite melts,
whereas the second melt pulse (near the top of the
Transition Zone, at �400^450 km depth, or
�14^15GPa) will produce very Na-rich carbonatite
melts. Some of the carbon will still survive in the
form of diamond and graphite.
JOURNAL OF PETROLOGY VOLUME 0 NUMBER 0 MONTH 2013
26
at Bodleian L
ibrary on May 7, 2013
http://petrology.oxfordjournals.org/D
ownloaded from

(7) Because of their low viscosity, the resulting carbona-
tite melts are assumed to segregate from the main
eclogite body at depths above the Transition Zone,
allowing refractory carbon-bearing eclogite to be
stored in the Transition Zone or lower mantle. These
melts can be involved in generation of such magmas
as kimberlitic or carbonatitic
ACKNOWLEDGEMENTSWe wish to thank Hugh O’Neill and Robert Rapp for valu-able suggestions on improving this paper. We also thankRaj Dasgupta and Oleg Safonov for constructive reviews.The experimental work was performed during Internshipto K.K. as a part of the 21st Century Center-of-Excellenceprogram ‘Advanced Science and Technology Center forthe Dynamic Earth’ at Tohoku University. The authorsgratefully acknowledge Hidenori Terasaki for his help insetting up experiments. Karsten Goemann (CentralScience Laboratory at University of Tasmania) is thankedfor assistance with electron microprobe analyses. FrankBrink and Hua Chen (Centre for Advanced Microscopyat ANU) assisted with the SEM analyses.
FUNDING
E.S.K. was funded by an ANU Postgraduate Scholarship.
The research was partly funded by an Australian
Research Council Discovery Grant to G.Y.
REFERENCES
Alt, J. C. & Teagle, D. A. H. (1999).The uptake of carbon during alter-
ation of ocean crust. Geochimica et Cosmochimica Acta 63, 1527^1535.
Bebout, G. E. (1995). The impact of subduction-zone metamorphism
on mantle^ocean chemical cycling. Chemical Geology 126, 191^218.
Blundy, J. & Dalton, J. (2000). Experimental comparison of trace
element partitioning between clinopyroxene and melt in carbonate
and silicate systems, and implications for mantle metasomatism.
Contributions to Mineralogy and Petrology 139, 356^371.
Brenker, F. E., Vollmer, C., Vincze, L., Vekemans, B., Szymanski, A.,
Janssens, K., Szaloki, I., Nasdala, L., Joswig, W. & Kaminsky, F.
(2007). Carbonates from the lower part of transition zone or even
the lower mantle. Earth and Planetary Science Letters 260, 1^9.
Brey, G. P., Bulatov,V. K. & Girnis, A.V. (2011). Melting of K-rich car-
bonated peridotite at 6^10 GPa and the stability of K-phases in
the upper mantle. Chemical Geology 281, 333^342.
Buob, A., Luth, R. W., Schmidt, M. W. & Ulmer, P. (2006).
Experiments on CaCO3^MgCO3 solid solutions at high pressure
and temperature. American Mineralogist 91, 435^440.
Collerson, K. D.,Williams, Q., Kamber, B. S., Omori, S., Arai, H. &
Ohtani, E. (2010). Majoritic garnet: a new approach to pressure esti-
mation of shock events in meteorites and the encapsulation of sub-
lithospheric inclusions in diamond. Geochimica et Cosmochimica Acta
74, 5939^5957.
Dasgupta, R. & Hirschmann, M. M. (2010). The deep carbon cycle
and melting in Earth’s interior. Earth and Planetary Science Letters
298, 1^13.
Dasgupta, R., Hirschmann, M. M. & Withers, A. C. (2004). Deep
global cycling of carbon constrained by the solidus of anhydrous,
carbonated eclogite under upper mantle conditions. Earth and
Planetary Science Letters 227, 73^85.
Dasgupta, R., Hirschmann, M. M. & Dellas, N. (2005). The effect of
bulk composition on the solidus of carbonated eclogite from partial
melting experiments at 3 GPa. Contributions to Mineralogy and
Petrology 149, 288^305.
Dorogokupets, P. I. & Dewaele, A. (2007). Equations of state of MgO,
Au, Pt, NaCl-B1, and NaCl-B2: Internally consistent high-tempera-
ture pressure scales. High Pressure Research 27, 431^446.
Dymshits, A. M., Bobrov, A. V., Bindi, L., Litvin, Y. A., Litasov, K.
D., Shatskiy, A. F. & Ohtani, E. (2013). Na-bearing majoritic
garnet in the system Na2MgSi5O12^Mg3Al2Si3O12 at 11^20 GPa:
phase relations, structural peculiarities and solid solutions.
Geochimica et Cosmochimica Acta 105, 1^13.
Gasparik, T. (1988). The stability of pyroxene in the transition zone.
Chemical Geology 70, 61.
Gerbode, C. & Dasgupta, R. (2010). Carbonate-fluxed melting of
MORB-like pyroxenite at 2·9 GPa and genesis of HIMU ocean
island basalts. Journal of Petrology 51, 2067^2088.
Ghosh, S., Ohtani, E., Litasov, K. D. & Terasaki, H. (2009). Solidus of
carbonated peridotite from 10 to 20 GPa and origin of magnesio-
carbonatite melt in the Earth’s deep mantle. Chemical Geology 262,
17^28.
Grassi, D. & Schmidt, M. (2011a). Melting of carbonated pelites at 8^
13 GPa: generating K-rich carbonatites for mantle metasomatism.
Contributions to Mineralogy and Petrology 162, 169^191.
Grassi, D. & Schmidt, M.W. (2011b). The melting of carbonated pel-
ites from 70 to 700 km depth. Journal of Petrology 52, 765^789.
Hammouda, T. (2003). High-pressure melting of carbonated eclogite
and experimental constraints on carbon recycling and storage in
the mantle. Earth and Planetary Science Letters 214, 357^368.
Harte, B. (2010). Diamond formation in the deep mantle: the record of
mineral inclusions and their distribution in relation to mantle dehy-
dration zones. Mineralogical Magazine 74, 189^215.
Hirose, K. & Fei,Y.W. (2002). Subsolidus and melting phase relations
of basaltic composition in the uppermost lower mantle. Geochimica
et Cosmochimica Acta 66, 2099^2108.
Isshiki, M., Irifune, T., Hirose, K., Ono, S., Ohishi, Y., Watanuki, T.,
Nishibori, E., Takata, M. & Sakata, M. (2004). Stability of magne-
site and its high-pressure form in the lowermost mantle. Nature
427, 60^63.
Kamenetsky, M. B., Sobolev, A. V., Kamenetsky, V. S., Maas, R.,
Danyushevsky, L.V., Thomas, R., Pokhilenko, N. P. & Sobolev, N.
V. (2004). Kimberlite melts rich in alkali chlorides and
carbonates: A potent metasomatic agent in the mantle. Geology 32,
845^848.
Kamenetsky, V. S., Kamenetsky, M. B., Weiss, Y., Navon, O.,
Nielsen, T. F. D. & Mernagh, T. P. (2009). How unique is the
Udachnaya-East kimberlite? Comparison with kimberlites from
the Slave Craton (Canada) and SW Greenland. Lithos 112,
334^346.
Kennedy, C. S. & Kennedy, G. C. (1976). Equilibrium boundary be-
tween graphite and diamond. Journal of Geophysical Research 81,
2467^2470.
Kerrick, D. M. & Connolly, J. A. D. (2001). Metamorphic devolatiliza-
tion of subducted oceanic metabasalts: implications for seismicity,
arc magmatism and volatile recycling. Earth and Planetary Science
Letters 189, 19^29.
Keshav, S. & Gudfinnsson, G. H. (2010). Experimentally dictated sta-
bility of carbonated oceanic crust to moderately great depths in
the Earth: Results from the solidus determination in the system
KISEEVA et al. CARBONATED ECLOGITE PHASE RELATIONS
27
at Bodleian L
ibrary on May 7, 2013
http://petrology.oxfordjournals.org/D
ownloaded from

CaO^MgO^Al2O3^SiO2^CO2. Journal of Geophysical Researchç
Solid Earth 115, doi: 10.1029/2009JB006457.
Kiseeva, E. S., Yaxley, G. M., Hermann, J., Litasov, K. D.,
Rosenthal, A. & Kamenetsky, V. S. (2012). An experimental study
of carbonated eclogite at 3·5^5·5 GPaçimplications for silicate
and carbonate metasomatism in the cratonic mantle. Journal of
Petrology 53, 727^759.
Litasov, K. D. (2011). Physicochemical conditions for melting in the
Earth’s mantle containing a C^O^H fluid (from experimental
data). Russian Geology and Geophysics 52, 475^492.
Litasov, K. D. & Ohtani, E. (2009a). Phase relations in the peridotite^
carbonate^chloride system at 7·0^16·5 GPa and the role of chlorides
in the origin of kimberlite anddiamond.ChemicalGeology 262,29^41.
Litasov, K. D. & Ohtani, E. (2009b). Solidus and phase relations of
carbonated peridotite in the system CaO^Al2O3^MgO^SiO2^
Na2O^CO2 to the lower mantle depths. Physics of the Earth and
Planetary Interiors 177, 46^58.
Litasov, K. D. & Ohtani, E. (2005). Phase relations in hydrous MORB
at 18^28 GPa: implications for heterogeneity of the lower mantle.
Physics of the Earth and Planetary Interiors 150, 239^263.
Litasov, K. & Ohtani, E. (2010). The solidus of carbonated eclogite in
the system CaO^Al2O3^MgO^SiO2^Na2O^CO2 to 32 GPa and
carbonatite liquid in the deep mantle. Earth and Planetary Science
Letters 295, 115^126.
Litasov, K. D., Sharygin, I. S., Shatskiy, A. F., Ohtani, E. &
Pokhilenko, N. P. (2010). Experimental constraints on the role of
chloride in the origin and evolution of kimberlitic magma. Doklady
Earth Science 435, 1648^1653.
Litasov, K. D., Shatskiy, A. F., Ohtani, E. & Yaxley, G. M. (2013). The
solidus of alkaline carbonatite in the deep mantle. Geology 41, 79^82.
Luth, R.W. (1993). Diamonds, eclogites, and the oxidation state of the
Earth’s mantle. Science 261, 66^68.
Luth, R. W. (2001). Experimental determination of the reaction ara-
gonite þ magnesite ¼ dolomite at 5 to 9 GPa. Contributions to
Mineralogy and Petrology 141, 222^232.
Martinez, I., Zhang, J. Z. & Reeder, R. J. (1996). In situ X-ray diffrac-
tion of aragonite and dolomite at high pressure and high tempera-
ture: evidence for dolomite breakdown to aragonite and
magnesite. American Mineralogist 81, 611^624.
Mckenzie, D. & Bickle, M. J. (1988). The volume and composition of
melt generated by extension of the lithosphere. Journal of Petrology
29, 625^679.
McKenzie, D. & O’Nions, R. K. (1991). Partial melt distributions from
inversion of rare-earth element concentrations. Journal of Petrology
32, 1021^1091.
Morlidge, M., Pawley, A. & Droop, G. (2006). Double carbon-
ate breakdown reactions at high pressures: an experimental
study in the system CaO^MgO^FeO^MnO^CO2. Contributions to
Mineralogy and Petrology 152, 365^373.
Nishihara,Y., Shinmei, T. & Karato, S. (2006). Grain-growth kinetics
in wadsleyite: effects of chemical environment. Physics of the Earth
and Planetary Interiors 154, 30^43.
Okamoto, K. & Maruyama, S. (2004). The eclogite^garnetite trans-
formation in the MORB þ H2O system. Physics of the Earth and
Planetary Interiors 146, 283^296.
Poli, S. & Schmidt, M. W. (1995). H2O transport and release in sub-
duction zones^çexperimental constraints on basaltic and andesitic
systems. Journal of Geophysical ResearchçSolid Earth 100,
22299^22314.
Presnall, D. C., Dixon, S. A., Dixon, J. R., O’Donnell, T. H.,
Brenner, N. L., Schrock, R. L. & Dycus, D. W. (1978). Liquidus
phase relations on join diopside^forsterite^anorthite from 1
atm to 20 kbarçtheir bearing on generation and crystallization
of basaltic magma. Contributions to Mineralogy and Petrology 66,
203^220.
Revenaugh, J. & Sipkin, S. A. (1994). Seismic evidence for
silicate melt atop the 410 km mantle discontinuity. Nature 369,
474^476.
Rohrbach, A. & Schmidt, M.W. (2011). Redox freezing and melting in
the Earth’s deep mantle resulting from carbon^iron redox coupling.
Nature 472, 209^212.
Sato, H., Endo, S., Sugiyama, M., Kikegawa, T., Shimomura, O. &
Kusaba, K. (1991). Baddeleyite-type high-pressure phase of TiO2.
Science 251, 786^788.
Sato, K. & Katsura,T. (2001). Experimental investigation on dolomite
dissociation into aragonite þ magnesite up to 8·5 GPa. Earth and
Planetary Science Letters 184, 529^534.
Sharygin, I. S., Litasov, K. D., Shatskiy, A. F., Golovin, A. V.,
Ohtani, E. & Pokhilenko, N. P. (2013). Melting experiments on kim-
berlite of Udachnaya-East pipe at 3^6·5 GPa and 900�15008Q.
Doklady Earth Science 448, 200^205.
Simakov, S. K. (2006). Redox state of eclogites and peridotites from
sub-cratonic upper mantle and a connection with diamond genesis.
Contributions to Mineralogy and Petrology 151, 282^296.
Sleep, N. H. & Zahnle, K. (2001). Carbon dioxide cycling and implica-
tions for climate on ancient Earth. Journal of Geophysical Researchç
Planets 106, 1373^1399.
Sokolova, T. S., Dorogokupets, P. I. & Litasov, K. D. (2013).
Self-consistent pressure scales based on the equations of state for
ruby, diamond, MgO, B2-NaCl, as well as Au, Pt and other
metals to 4 Mbars and 3000 K. Russian Geology and Geophysics 54,
181^199.
Song,T. R. A., Helmberger, D.V. & Grand, S. P. (2004). Low-velocity
zone atop the 410-km seismic discontinuity in the northwestern
United States. Nature 427, 530^533.
Spandler, C., Yaxley, G., Green, D. H. & Rosenthal, A. (2008). Phase
relations and melting of anhydrous K-bearing eclogite from 1200
to 16008C and 3 to 5 GPa. Journal of Petrology 49, 771^795.
Spandler, C., Yaxley, G., Green, D. H. & Scott, D. (2010).
Experimental phase and melting relations of metapelite in the
upper mantle: implications for the petrogenesis of intraplate
magmas. Contributions to Mineralogy and Petrology 160, 569^589.
Staudigel, H. (2003). Hydrothermal alteration processes in the oceanic
crust. In: Holland, H. D. & Turekian, K. K. (eds) Treatise on
Geochemistry. Oxford: Elsevier^Pergamon, pp. 511^535.
Syracuse, E. M., van Keken, P. E. & Abers, G. A. (2010). The global
range of subduction zone thermal models. Physics of the Earth and
Planetary Interiors 183, 73^90.
Takafuji, N., Fujino, K., Nagai, T., Seto, Y. & Hamane, D. (2006).
Decarbonation reaction of magnesite in subducting slabs at the
lower mantle. Physics and Chemistry of Minerals 33, 651^654.
Tsuno, K. & Dasgupta, R. (2012). The effect of carbonates on near-sol-
idus melting of pelite at 3 GPa: Relative efficiency of H2O and
CO2 subduction. Earth and Planetary Science Letters 319, 185^196.
Urakawa, S., Kondo, T., Igawa, N., Shimomura, O. & Ohno, H.
(1994). Synchrotron radiation study on the high-pressure and high-
temperature phase relations of KAlSi3O8. Physics and Chemistry of
Minerals 21, 387^391.
van Keken, P. E., Kiefer, B. & Peacock, S. M. (2002). High-resolution
models of subduction zones: implications for mineral dehydration
reactions and the transport of water into the deep mantle.
Geochemistry, Geophysics, Geosystems 3, doi:10.1029/2001GC000256.
Wang, W. Y. & Takahashi, E. (1999). Subsolidus and melting experi-
ments of a K-rich basaltic composition to 27 GPa: implication for
the behavior of potassium in the mantle. American Mineralogist 84,
357^361.
JOURNAL OF PETROLOGY VOLUME 0 NUMBER 0 MONTH 2013
28
at Bodleian L
ibrary on May 7, 2013
http://petrology.oxfordjournals.org/D
ownloaded from

Withers, A. C., Essene, E. J. & Zhang, Y. X. (2003). Rutile/TiO2 II
phase equilibria. Contributions to Mineralogy and Petrology 145,
199^204.
Yagi, A., Suzuki,T. & Akaogi, M. (1994). High-pressure transitions in
the system KAlSi3O8^NaAlSi3O8. Physics and Chemistry of Minerals
21, 12^17.
Yasuda, A., Fujii,T. & Kurita, K. (1994). Melting phase relations of an
anhydrous mid-ocean ridge basalt from 3 to 20 GPa: implications
for the behavior of subducted oceanic crust in the mantle. Journal
of Geophysical ResearchçSolid Earth 99, 9401^9414.
Yaxley, G. M. & Brey, G. P. (2004). Phase relations of carbonate-bear-
ing eclogite assemblages from 2·5 to 5·5 GPa: implications for
petrogenesis of carbonatites. Contributions to Mineralogy and Petrology
146, 606^619.
Yaxley, G. M. & Green, D. H. (1994). Experimental demonstration
of refractory carbonate-bearing eclogite and siliceous melt in
the subduction regime. Earth and Planetary Science Letters 128,
313^325.
Zhang, Y. X. & Zindler, A. (1993). Distribution and evolution of
carbon and nitrogen in Earth. Earth and Planetary Science Letters
117, 331^345.
Zhao, D. P. & Ohtani, E. (2009). Deep slab subduction and dehydra-
tion and their geodynamic consequences: evidence from seismology
and mineral physics. Gondwana Research 16, 401^413.
KISEEVA et al. CARBONATED ECLOGITE PHASE RELATIONS
29
at Bodleian L
ibrary on May 7, 2013
http://petrology.oxfordjournals.org/D
ownloaded from


