Embed Size (px)
Citation preview

Membrane bistability in thalamic reticular neurons during spindle oscillations
Pablo Fuentealba1, Igor Timofeev1, Maxim Bazhenov2,
Terrence J. Sejnowski2,3 and Mircea Steriade1,*
1Laboratory of Neurophysiology, Faculty of Medicine, Laval University,
Quebec City, Canada G1K 7P4
2The Salk Institute, Computational Neurobiology Laboratory,
10010 North Torrey Pines Road, La Jolla, CA 92037
3Department of Biology, University of California San Diego, La Jolla CA 92093
Running head: Membrane bistability in thalamic reticular neurons
Address for reprint requests and other correspondence: M. Steriade, Laboratoire de
Neurophysiologie, Faculté de Médecine, Université Laval, Québec, Canada G1K 7P4.
(E-mail: [email protected])
Articles in PresS. J Neurophysiol (August 25, 2004). doi:10.1152/jn.00552.2004
Copyright © 2004 by the American Physiological Society.

2
Fuentealba, Pablo, Igor Timofeev, Maxim Bazhenov, Terrence J. Sejnowski and
Mircea Steriade. Membrane bistability in thalamic reticular neurons during spindle
oscillations. J Neurophysiol 00:00-00. The thalamic reticular (RE) nucleus is a major
source of inhibition in the thalamus. It plays a crucial role in regulating the excitability of
thalamocortical networks and in generating some sleep rhythms. Current clamp
intracellular recordings of RE neurons in cats under barbiturate anesthesia revealed the
presence of membrane bistability in ~20% of neurons. Bistability consisted of two
alternate membrane potentials, separated by ~17-20 mV. While non-bistable (common)
RE neurons fired rhythmic spike-bursts during spindles, bistable RE neurons fired
tonically, with burst modulation, throughout spindle sequences. Bistability was strongly
voltage-dependent and only expressed under resting conditions (i.e. no current injection).
The transition from the silent to the active state was a regenerative event that could be
activated by brief depolarization, while brief hyperpolarizations could switch the
membrane potential from the active to the silent state. These effects outlasted the current
pulses. Corticothalamic stimulation could also switch the membrane potential from silent
to active states. Addition of QX-314 in the recording micropipette either abolished or
disrupted membrane bistability, suggesting INa(p) to be responsible for its generation.
Thalamocortical cells presented various patterns of spindling that reflected the membrane
bistability in RE neurons. Finally, experimental data and computer simulations predicted
a role for RE neurons’ membrane bistability in inducing various patterns of spindling in
target thalamocortical cells. We conclude that membrane bistability of RE neurons is an
intrinsic property, likely generated by INa(p) and modulated by cortical influences, as well

3
as a factor that determines different patterns of spindle rhythms in thalamocortical
neurons.

4
INTRODUCTION
The GABAergic neurons of the thalamic reticular (RE) nucleus play a major role
in modulating the flow of information through the dorsal thalamus and in the generation
of sleep spindles, a thalamically generated rhythm (Steriade et al. 1990). The RE neurons
are reciprocally connected with thalamocortical (TC) cells in dorsal thalamic nuclei
(Jones, 1985) and RE neurons exert powerful inhibitory effects on TC neurons of the
dorsal thalamus (Thomson, 1988; Contreras and Steriade, 1996; Kim and McCormick,
1998b).
Despite the relative homogeneity of this nucleus, some data have pointed to
differential functional features in various types of RE neurons. For example, a subsample
(~20%) of RE neurons do not discharge spike-bursts to depolarizing current pulses even
when the membrane potential (Vm) reaches –100 mV, nor do they fire rebound spike-
bursts after prolonged hyperpolarizations, thus suggesting that such RE neurons do not
express T-type Ca2+ channels (Contreras et al. 1992). This is indeed the case of ventral
lateral geniculate cells (Crunelli et al. 1987) that share a common embryological origin
with RE neurons and similarly do not project to the cerebral cortex (Jones, 1985).
Another difference was found between some RE neurons that, during natural
slow-wave sleep, fire spike-bursts lasting ~50-100 ms, and other RE neurons that display
during the same behavioral state a prolonged (up to 1 or 2 seconds) tonic tail of single
action potentials after the spike-bursts (compare Figs. 4 and 5 in Steriade et al. 1986). In
vitro experiments showed that this prolonged depolarization is due to either a persistent
Na+ current, INa(p), or a Ca2+-activated nonselective cation current (Kim and McCormick,
1998a). The INa(p) can generate plateau potentials and membrane bistability (Crill, 1996;

5
Gola et al. 1998) that has been demonstrated in various neuronal types of the spinal cord
(Bennett et al. 1998), cerebellum (Llinás and Sugimori, 1980), dorsal thalamus (Williams
et al. 1997; Toth et al. 1998; Hughes et al. 1999), neocortex (Schwindt and Crill, 1999),
olfactory bulb (Heyward et al. 2001), and hippocampus (Chuang et al. 2000; Fricker and
Miles, 2000).
If RE neurons displayed exceedingly long or shorter spike-bursts during spindle
oscillations (Steriade et al. 1986), such differences would presumably be reflected in
variant types of inhibition-rebound sequences at the level of target thalamocortical
neurons. This hypothesis was at the origin of the present study. The intrinsic firing
patterns of RE neurons are fundamental toward the understanding of their role in
controlling the electrical activity of target TC neurons. We investigated the membrane
properties of RE neurons in vivo and, in particular, the conditions under which long-
lasting depolarizing plateaus and prolonged hyperpolarizations can be elicited by
intracellular pulses or synaptic volleys. The results show that a subgroup of RE neurons
displays membrane bistability, as indicated by two discrete modes of Vm, with different
responsiveness to cortical inputs. Active membrane properties can amplify and extend in
time the influence of both depolarizing and hyperpolarizing inputs. The membrane
bistability of RE neurons probably plays an important role in shaping the patterns of
spindling oscillation in thalamocortical neurons.

6
METHODS
Animal preparation
Experiments were performed on adult cats (2.5-3.5 kg), anaesthetized with
pentobarbital (25 mg/kg, i.p.). When the cats showed the signs of deep anesthesia, the
animals were paralyzed with gallamine triethiodide and artificially ventilated with control
of the end-tidal CO2 concentration at ~3.5%. Body temperature was maintained at 36-38o
C. The depth of anesthesia was continuously monitored by EEG and additional doses of
anaesthetic were administered at the slightest tendency toward low-voltage and fast EEG
rhythms. At the end of experiments, animals were given a lethal dose of pentobarbital (50
mg/kg i.v.).
Electrophysiological recordings
Current-clamp intracellular recordings from RE neurons (rostral and rostrolateral
sector of the nucleus) and TC neurons from the ventrolateral (VL) nucleus were
performed using glass micropipettes (DC resistance, 30-60 MΩ). To avoid breaking of
recording micropipettes, the cortex and white matter overlying the head of the caudate
nucleus were removed by suction. The pipettes entered ~3 mm through the caudate
nucleus to reach the thalamic RE nucleus. Pipettes were generally filled with 3 M
solution of K-acetate and, in some experiments; with 50 mM of QX-314 (the DC
resistance was identical to that of K-acetate-filled pipettes). The stability of intracellular
recordings was ensured by cisternal drainage, bilateral pneumothorax, hip suspension,
and by filling the hole over the thalamus with 4% agar solution. A high-impedance
amplifier with active bridge circuitry was used to record and inject current inside the

7
cells. Most intracellular recordings included in the database lasted for periods longer than
30 min. Simultaneous extracellular recordings were performed using up to four tungsten
electrodes (10-15 MΩ) inserted through the caudate nucleus, with an inter-electrode
distance of ~0.5 mm. To determine the membrane potential (Vm) of RE neurons, DC
offset was adjusted constantly before and after every recording; and the bridge was also
adjusted through intracellular recordings. Once the recording was finished, the recording
pipette was withdrew from the recording site (10-20 µm) in order to avoid possible DC
offsets due to the extracellular environment close to the neurons and to establish a
reference considered as zero (0 mV) for the intracellular recordings.
Cortical activity was monitored in all experiments by EEG recordings from areas
4 and 6, corresponding to intracellularly recorded RE neurons.
Data analysis
All data were analysed under Igor pro 4.0 (Wametrics, Inc.). Since the correct
determination for Vm was central for this study, precautions were taken during both
experiments and analysis. Action potentials during active states did not affect
significantly Vm measurements because of (a) the short duration of action potentials in
RE neurons (1 ms); and (b) very high sampling rate of intracellular recordings (20 kHz),
which guarantees a sub-millisecond time resolution. Since the time spent by a neuron to
generate spikes is very short (±1 ms) and the spike AHP lasts for ±10 ms the effects of
neuronal firing in the generation of histogram of the membrane potential distribution
should be negligible. Moreover, preliminary analyses were carried out in digitized
filtered waves (0-40 Hz) in order to eliminate spikes from the intracellularly recorded

8
signals. Vm distributions of such signals proved to be very much similar to the non-
filtered signals, and displayed only small shifts in the active peak (2-4 mV) for the cases
of resting and hyperpolarized conditions. For depolarized states, in which RE neurons
undergo sustained (tonic) discharge, filtered signals showed a narrower Vm distribution
when compared to non-filtered signals, with small shifts to depolarized values (2-4 mV).
Therefore, most analyses were performed directly on non-filtered waves.
Membrane potential distributions during intracellular recordings were assessed by
histograms. Intracellular recordings were sampled at high sampling rate (20 kHz)
allowing a high-resolution in time of intracellular events and membrane potential
changes. Histograms were built by segmenting the range of the data (e.g. membrane
potential) into equal sized number of classes. According to the Scott’s rule (Scott, 1979)
the number of classes or interval size (k) in a histogram is k =3.5sn-1/3, where s is the
standard deviation and n is the total number of points in the sample. Since we used a high
sampling rate and long periods of recordings for analysis the number of points was in the
order of 105-106. In this case, the interval size should be around 0.5 mV. However, for
reasons of simplicity we chose a slightly bigger binsize, meaning 1 mV for all
histograms. This binsize did not produce significant differences compared to others (0.25,
0.5, 0.75; data not shown).
Computer simulations
In modeling studies, we examined single-compartment models of RE and TC cells
which included voltage- and Ca2+-dependent currents described by Hodgkin-Huxley
kinetics. For both RE and TC cells we considered a fast Na+ current, INa, a fast K+

9
current, IK, a low-threshold Ca2+-dependent current, IT (Huguenard and McCormick,
1992; Huguenard, 1996), and a K+ leak current, IKL = GKL(V-EKL) A model of
hyperpolarization-activated cation current IH (McCormick and Pape, 1990), taking into
account both voltage and Ca2+ dependencies (Destexhe et al. 1996b) was also included in
TC cells. A persistent Na+ current, INa(p), was included to RE cells to model bistability of
the responses. For INa(p), INa(p) = GNa(p)m(V -50), dm/dt = (m∞ - m)/0.2, m∞ = 1/(1 +
exp(-(V +42)/5)) (Alzheimer et al. 1993). The expressions for voltage- and Ca2+-
dependent transition rates for all currents are given in Bazhenov et al. (1998, 2000).
GABAA and AMPA synaptic currents were modeled by first-order activation
schemes (Destexhe et al. 1994). GABAB receptors were modeled by a higher-order
reaction scheme that took into account activation of K+ channels by G-proteins (Dutar
and Nicoll, 1988; Destexhe et al. 1994, 1996b). The equations for all synaptic currents
are given in Bazhenov et al. (1998, 2000).
A thalamic network was also modeled, and consisted of a one-dimensional two-
layer array of M RE and M TC neurons, where M was varied between 20 and 64. In most
of the simulations the connection fan out was ±3 cells for GABAA mediated RE-RE
synapses; ±3 cell for AMPA mediated TC-RE synapses; ±3 cells for GABAA and
GABAB mediated RE-TC synapses. Other radii of synaptic interconnections were used to
test the sensitivity of the results.

10
RESULTS
All neurons recorded intracellularly (n = 57) and extracellularly (n = 13) within
the rostral pole and rostrolateral sector of the RE nucleus were identified by accelerando-
decelerando spike-bursts (see insets in Fig. 1A for intracellular, and Fig. 4 for
extracellular, recordings). The accelerando-decelerando pattern refers to the initially
increasing, but rapidly decreasing inter-spike intervals that occur within every single
burst of action potentials in RE neurons. This is the typical firing pattern of RE neurons’
spike-bursts during spindling, as described during natural slow-wave sleep (Domich et al.
1986; Steriade et al. 1986), as well as intracellularly in anesthetized animals (Contreras et
al. 1993).
Differences between bistable and non-bistable RE neurons
A subgroup of intracellularly recorded neurons (23%, 13 of 57) displayed a
sustained depolarization during EEG spindles (Fig. 1A, left). This plateau potential was
initiated at the beginning of each spindle sequence and persisted during its whole
duration. At variance, the remaining RE neurons fired spike-bursts interrupted by clear-
cut hyperpolarizing potentials (Fig. 1A, right), as described in previous studies on RE
neurons. Histograms of Vm distribution showed two discrete peaks in the former group of
RE cells (at ~-80 mV and ~-56 mV for the left neuron in Fig. 1A), representing the
sustained depolarization during spindles and the silent phase, whereas only one peak was
detected in the remaining RE neurons (Fig. 1B). Thus, neurons displaying two, discrete
peaks in their Vm distribution were defined as revealing membrane bistability (see
Heyward et al. 2001). Autocorrelograms of action potentials fired by non-bistable

11
neurons displayed clear lags of about 110 ms (Fig. 1C), consistent with firing in the
frequency range of spindles (~9 Hz). At variance, bistable neurons showed much less
pronounced peaks and troughs (Fig 1C).
In those cells where membrane bistability was detected, it was a graded property
since it displayed a variable range of values between resting and active periods. Figure
1D shows the Vm distributions for 3 different RE neurons. All these bistable neurons
were at a resting Vm of ~-80 mV; however, the second peak differed for each cell, not
only in its position but also in its relative amplitude (arrows, Fig. 1D). Bistable cells
spontaneously generated two discrete Vms (Fig. 1E): (a) the first one represented the
active state, with relatively depolarized Vm (-60.8 ± 3.1 mV), coincident with spindle
activity and around the threshold for action potential generation; (b) the second was a
silent state, with a relatively hyperpolarized Vm (-77.7 ± 2.7 mV), occurring during
interspindle lulls. The difference between the two states was 16.8 ± 3.5 mV (range 13-22
mV, n = 9; Fig. 1E). By contrast, non-bistable cells displayed the well-known waxing and
waning pattern of spindle oscillation (see Fig. 1A, right) and their Vm distribution
presented a single peak at ~-80 mV (see Fig. 1B).
Morphological reconstruction of some bistable neurons showed typical features of
RE neurons, with fusiform shape lying parallel to the surface of the dorsal thalamus and
very long dendrites (Fig. 1F-G), suggesting no morphological differences between
bistable and non-bistable neurons.
Similarly to spontaneously generated spindles, bistability was seen in cortically
elicited spindles. Histograms of Vm distributions during evoked spindling showed that
only bistable RE neurons displayed a clear-cut two-peak pattern of membrane bistability,

12
and autocorrelograms of action potentials showed that bistable neurons did not
consistently discharge in the frequency range of spindles (Fig. 2).
Voltage dependency of membrane bistability
We assessed the voltage dependence of bistability in RE neurons (n = 6) (Fig. 3).
The Vm distributions represent the proportion of time spent at each Vm (excluding action
potentials) in resting condition (with no current injection) and during the injection of
negative or positive steady current through the pipette. (a) During resting (0 nA), the
distribution was bimodal, with two peaks reflecting the silent state (-79 mV, i.e.
interspindle lulls) and the active state (-62 mV, i.e. spindles) (Fig. 3B). (b) Positive
current injection (+0.2 nA) abolished bistability, and generated sustained firing with no
repolarization to the resting state (Fig. 3A). The Vm distribution showed a single peak (at
-59 mV), which rapidly decayed up to -70 mV; more negative values of Vm were
virtually absent. (c) With injection of negative current (-0.2 nA), the bimodal distribution
of Vm was also abolished, and a single peak remained (-89 mV), falling sharply up to -80
mV and decaying smoothly at more positive values (Fig. 3C). The abolition of bistability
could be reached with current injections as small as -0.1 nA (not shown).
Thus, injection of different levels of steady current showed that bistability was
exclusively displayed under the resting condition, i.e. when no current was injected. The
Vm of bistable neurons was asymmetrically affected, depending on the sign of the
injected current. Negative current produced a hyperpolarization with higher amplitude
than the depolarization induced by the same amount of current with opposite sign (Fig.
3D). This supposed an asymmetric change in input resistance (Rin) measured from the

13
resting Vm. Actually, in a sample of 6 bistable RE neurons, the Rin was four-fold higher
for hyperpolarized values of Vm than for the depolarized ones (25.3 ± 6.2 MΩ and 6.4 ±
4.0 MΩ respectively). On the other hand, Rin was linearly related to Vm in non-bistable
neurons (not shown). Comparing Rin between non-bistable and bistable neurons (during
periods of negative DC), showed no significant difference (25.3 ± 6.2 MΩ and 31.5 ± 8.5
MΩ, for bistable and non-bistable groups, respectively; p>0.5). An inverse relation was
found for the mean firing frequency. Even though the Rin was lower during states
associated with membrane depolarization, tiny changes in injected current produced large
changes in firing frequency (Fig. 3E). In fact, the gain in firing frequency was much
higher for depolarized membrane values compared to changes in the hyperpolarized
values (84.7 ± 69.3 Hz/nA and 18.7 ± 11.6 Hz/nA, respectively; p<0.05; n = 6). These
results indicate that membrane bistability in RE neurons is strongly voltage dependent,
which would be consistent with the generation of bistability by intrinsic mechanisms.
To investigate whether bistability was an artefact arising from intracellular
recordings, simultaneous extracellular recordings of two or more RE neurons were
performed (n = 13). Figure 4 shows one of those experiments in which two RE neurons
were recorded simultaneously and identified by their spike-bursts with accelerando-
decelerando firing patterns. Differences in firing patterns during spontaneous spindles
between the two cells could be firstly seen by visual inspection. While one neuron only
fired rhythmic spike-bursts (cell 1), the other neuron also displayed tonic tails of
discharges following the bursts (cell 2). Tonic tail refers to low-frequency spikes
(typically <100 Hz) generated by some RE neurons, which fire in single mode towards
the end of spindle waves. Two other cells presented similar features as cell 2 (then, 3 out

14
of the total 13), with initial spike-bursts followed by tonic tails. Plots of instantaneous
firing frequency during spindles showed that cell 1 exclusively discharged high-
frequency bursts (>300 Hz) during the spindle period, whereas cell 2 fired slower bursts
(~200 Hz) followed by tonic firing up to 100 Hz (Fig. 4C). Consistent with these results,
the interspike interval (ISI) histogram for a long period of spontaneous activity showed
for non-bistable neurons, like cell 1, a narrow distribution that peaked at 3 ms (~350 Hz)
and decayed rapidly up to ~10 ms (100 Hz), indicative that tonic firing was virtually
absent (inset, Fig. 4C). A much wider ISI distribution was seen for neurons like cell 2,
which peaked at 4 ms (250 Hz) and decayed smoothly up to 40 ms (25 Hz), which
reflected the tonic firing (inset, Fig. 4C). The same analysis carried out for extracellular
recordings was applied for intracellular recordings, showing that only bistable neurons
displayed an important component of tonic firing in their discharge pattern (data not
shown).
Intrinsic mechanisms generate bistability
The idea that intrinsic mechanisms are implicated in the generation of bistability
was supported by experiments showing that current pulses (200 ms, 1 nA) were able to
activate the plateau potential characteristic for bistability, with very similar kinetics to the
spontaneous one. The initiation of bistability induced by current pulses was twice faster
when compared to the spontaneous one, as shown by the exponential fitting to the rising
phase of the plateau potential (τ of activation, ~21 ms and ~48 ms, respectively; n = 3,
not shown).

15
The artificial generation of membrane bistability by injection of current pulses of
different durations and amplitudes was investigated in 9 bistable RE neurons held at
different values of Vm. Intracellular current pulses were applied at low frequencies (0.3-
to-1 Hz). Depolarizing current pulses (2 nA) applied at rest (0 nA) were able to generate
an initial burst of action potentials, followed by tonic spikes that outlasted the current
pulse (Fig. 5A-B). Under steady hyperpolarization (-2 nA), the depolarizing current
pulses failed to elicit an outlasting plateau potential, even though the pulse amplitude was
greatly increased (Fig. 5C-D). The same failure was obtained by using shorter current
pulses (Fig. 5E). The plot in Fig. 5F summarizes these results, showing the duration of
the plateau potential outlasting the response evoked by the current pulse at the resting Vm
(-80 mV), the absence of such a plateau under steady hyperpolarization (reaching -90
mV), as well as an intermediate level with plateau potential outlasting the duration of the
current pulse, though not as long as in the resting (Vm, -85 mV).
Similarly to the initiation of the active state, the termination of the active period
could be ascribed to intrinsic mechanisms. Thus, brief current pulses were able to mimic
termination of active states. The termination of the active states was fitted with an
exponential function. The average (n = 10) of such fitting functions showed that
termination evoked by current pulses was twice faster than spontaneous termination (τ of
inactivation 75 ms and 131 ms, respectively; n = 3), similarly to what was found for the
activation process (not shown). The presence of such a mechanism for termination of
plateau potentials suggests that this active state is maintained by voltage dependent
mechanisms, which can be deactivated by hyperpolarization.

16
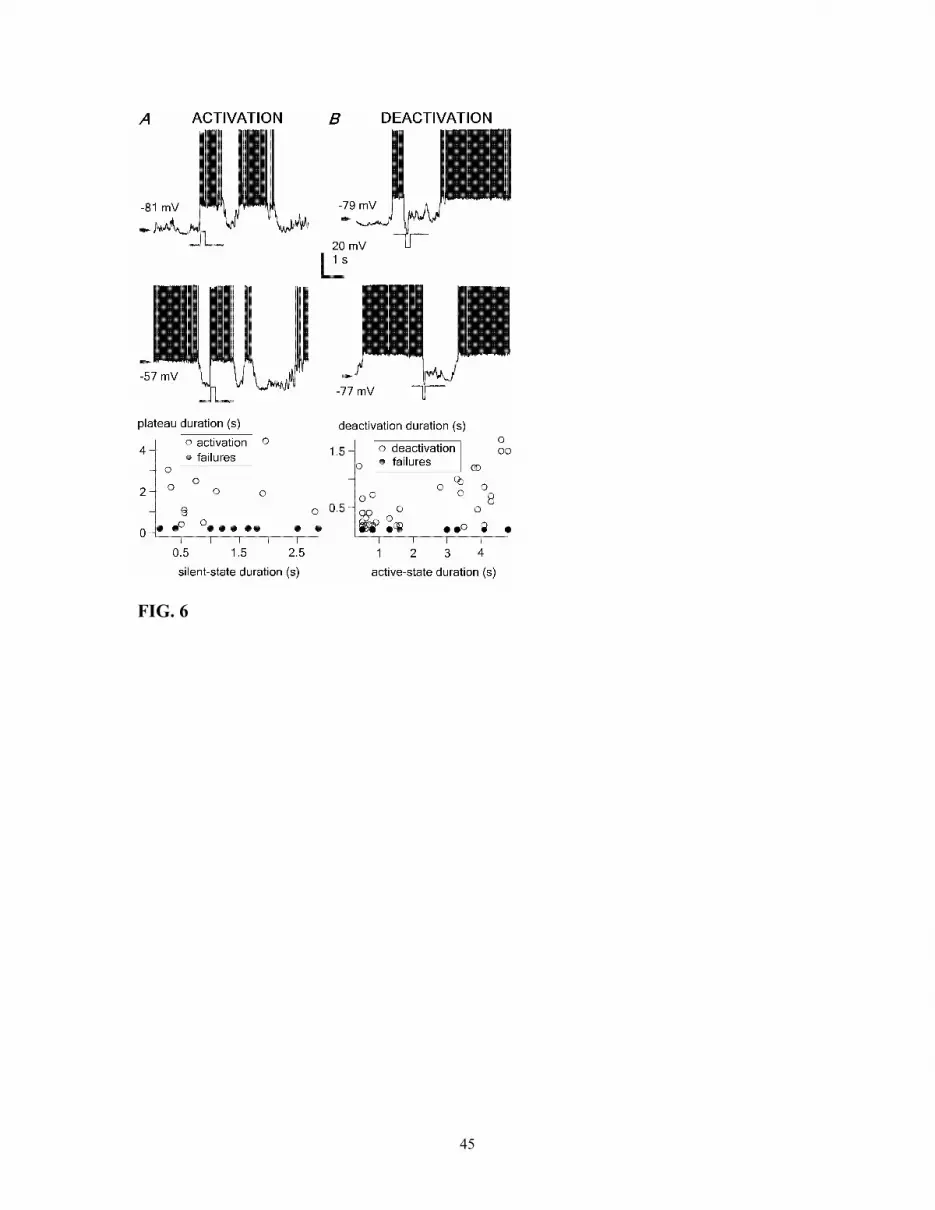
After a relatively long silent period (~2 s), a brief positive current pulse was able
to evoke an active period (Fig. 6, top) very similar to the one generated following a
relatively short silent period (~0.4 s) (Fig. 6A, middle). Similar results were found in
other two neurons. The plot at the bottom of Fig. 6A shows no relation between the
duration of the preceding silent period and the duration of the active period generated by
the current pulse. Current pulses that were not able to produce an outlasting active state
were considered as failures. There was also no relation between the duration of the
preceding silent period and the likelihood of failure (bottom plot in Fig. 6A).
Brief negative current pulses, which were able to terminate the active state, were
effective regardless of the duration of the preceding active state, as either short or long-
lasting plateaus could be equally shunted (Fig. 6B). Similar results were found in other
two neurons. The probability for a given current pulse (100 ms, 2 nA) to terminate an
active state was considerably high (80%) (bottom plot in Fig. 6B). However, there was a
relation between the duration of shunting produced by the hyperpolarizing current pulse
and the preceding active period. Long-lasting active periods (>3 s) were shunted for
longer periods than short-lasting (<2 s) active states (936.7 ± 370.4 ms and 412.5 ± 247.5
ms, respectively; p<0.01). Similarly to the initiation of active periods, the likelihood of
shunting failures was not dependent on the duration of the preceding active period
(bottom plot in Fig. 6B).
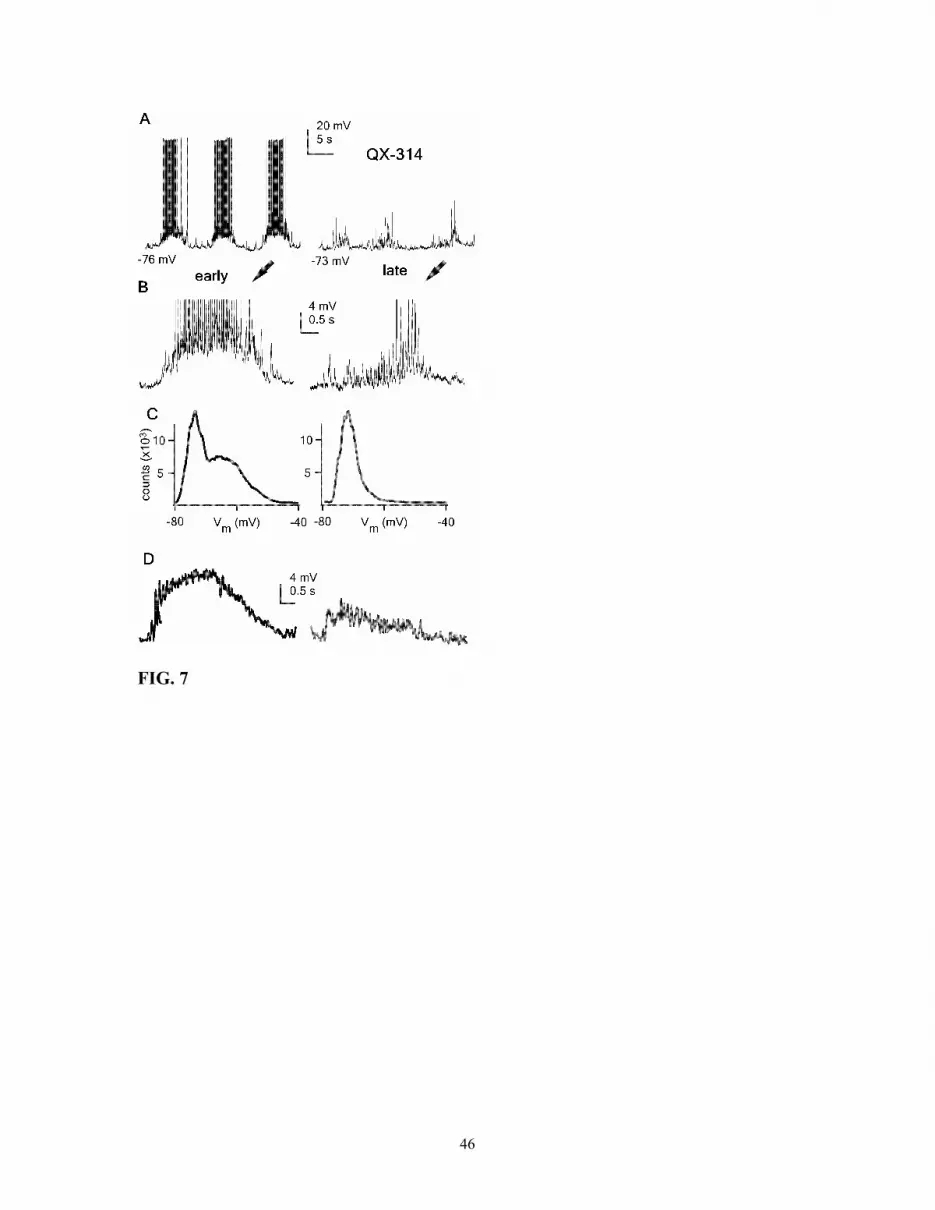
Absence of bistability in RE neurons recorded with QX-314
To elucidate some of the ionic mechanisms underlying the origin of bistability,
and given the antecedent that TTX blocks plateau potentials in RE neurons (Kim and

17
Mccormick, 1998a), intracellular recordings were performed with QX-314 (50 mM) in
the micropipette. From the pool or recorded neurons (n = 19), only in one case was it
possible to recognize bistable membrane behavior (see Discussion). In that case, the RE
neuron displayed clear plateau potentials, consisting of burst and tonic discharges during
the early period of the recording (Fig. 7A,B). The Vm of this neuron presented the
characteristics of bistability, with a double peak in the distribution histogram (early in
Fig. 7C). After a few minutes, QX-314 started to diffuse and action potentials decreased
both in amplitude and frequency. As time elapsed, not only spike generation was
affected, but also the expression of the plateau potential (Fig. 7). The decrease in the
sustained depolarization during spindles was reflected as a change in the Vm distribution
of the cell, since the secondary peak of active states was abolished (late in Fig. 7C).
Measuring the area of depolarization during spindle periods showed a three-fold decrease
in the presence of QX-314 in the recording pipette, after 40 minutes of recording
(40993.1±18607.2 mV*ms and 13499.2±3548.8 mV*ms, p<0.05, 2 min and 40 min;
respectively; Fig. 7D).
In other neurons, we were not able to detect bistable behavior during the early
period of recordings with QX-filled pipettes. Therefore, we compared the depolarization
area during the spindle sequences in bistable neurons and in some of the neurons
recorded with QX-314 (n = 5). At hyperpolarized Vms, the areas of depolarization during
spindles were very similar in bistable and QX-314-recorded neurons (10.1 ± 1.4 and 9 ±
1.5 normalized units, respectively); however, when neurons were at the resting Vm,
bistable cells displayed their characteristic active states increasing considerably the
depolarization area, two-fold larger than in recordings with QX-314 (16.6 ± 2 and 8 ± 1.3

18
normalized units, respectively; p = 0.0001; not shown). These results suggest that QX-
314 either abolishes or disrupts bistability in RE neurons.
Membrane bistability of RE neurons modulates their synaptic responsiveness
Responses to stimulation of the internal capsule where compared during silent and
active states in bistable RE neurons (n = 5). During silent states, corticofugal volleys
elicited short-latency, subthreshold EPSPs, with little variability in amplitude. During
active states, the Vm was depolarized by about ~20 mV and responses to stimulation,
crowned by action potentials, where of two types: either short and fixed-latency spikes or
EPSPs that elicited spikes with much longer and variable latencies (Fig. 8A-C). By
raising the stimulation strength, action potentials could be elicited even during the silent
state (not shown). The threshold intensities for spike generation were quantified for silent
as well as for active states. The half-maximal probability of spike generation was reached
at a stimulation intensity of 130 µA for the active period and 164 µA during the silent
state (Fig. 8D). This shows that stimulus intensities that are sufficient to produce spikes
during the active state did not evoke action potentials in the silent state. Thus, the active
state represents a condition of increased responsiveness to synaptic inputs since it brings
the membrane potential close to the firing threshold, allowing incoming inputs to trigger
action potentials.
Various spindling patterns in thalamocortical neurons may reflect non-bistable or
bistable activity patterns of RE neurons

19
The main output of the RE nucleus is to the dorsal thalamus, whose neurons
receive a powerful, cyclic inhibition from GABAergic RE neurons during spindles
(Steriade et al. 1990, 1993). In order to assess a possible effect of membrane bistability in
RE neurons on spindle waves, we performed intracellular recordings from TC cells (n =
21), identified by their short spike-bursts (<30 ms) and their characteristic sequence of
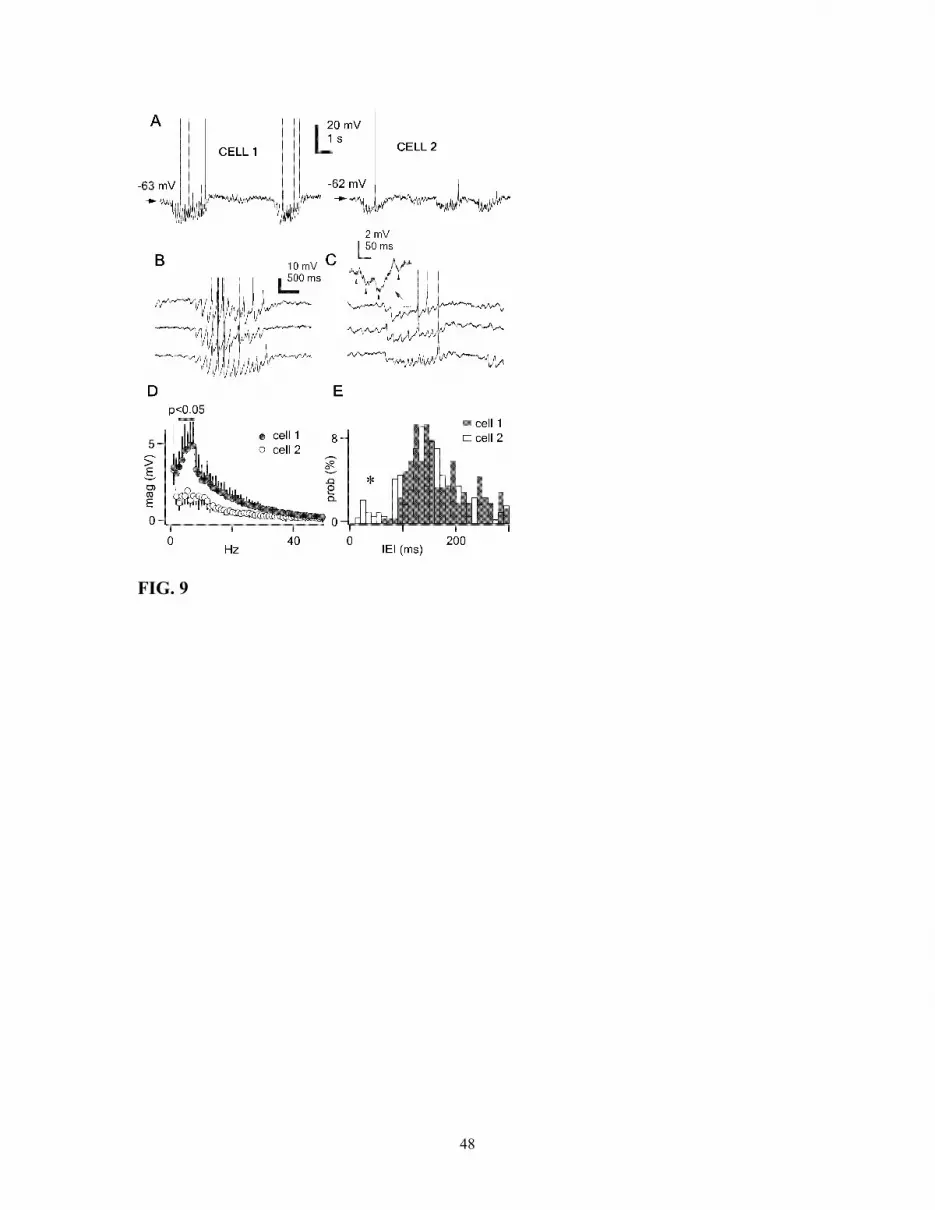
IPSPs during spindle waves (Fig. 9A).
Visual inspection revealed the presence of a sub-group of neurons (14%, 3 of 21)
displaying different types of spindles, compared to all other neurons. One of those cells
(cell 2 in Fig. 9) is shown for comparison with a typical TC neuron (cell 1 in Fig. 9). As
known, during spindles most TC neurons (like cell 1) display regular and powerful
IPSPs, due to the inhibitory action of RE neurons during spindles, which hyperpolarize
the neuronal membrane, thus de-inactivating the IT that, in turn, may generate a burst of
action potentials. Such canonical TC neurons initiate rebound bursts after the initial
three-four IPSPs during spindle periods (Fig. 9B). On the other hand, neurons like cell 2
presented irregular sequences of IPSPs superimposed on a tonic hyperpolarization during
spindles; a spike-burst was not present before the second half of the spindle sequence and
such bursts usually occurred toward the very end of the spindle (Fig. 9C).
In fact, the frequency spectrum of the signals extracted by fast Fourier transform
analysis showed spindles in the frequency range of ~7-10 Hz to be much more
represented in thalamocortical neurons like cell 1 than in neurons like cell 2 (Fig. 9),
consistent with the irregularity seen in IPSPs occurring during spindles in cell 2. Spindle-
related IPSPs were selected and their intervals of incidence measured. Histograms of
inter-event intervals (IEIs) in thalamocortical cell 1 showed that IPSPs during spindles

20
were mostly distributed in the 130-150 ms interval, consistent with the spindle frequency
at ~7 Hz (Fig. 9E). At variance, thalamocortical neurons like cell 2 presented a tail
shifted to shorter intervals (asterisk in Fig. 9E), indicating the presence of faster activities
in some thalamocortical neurons. Indeed, intracellular recordings of neurons like cell 2
revealed the presence of small-amplitude events, presumably IPSPs, during spindle
waves, reflecting higher frequencies (~20 Hz) than the expected frequency at 7-10 Hz for
these periods (see arrowheads in inset, Fig. 9C). Since IPSPs occurring in thalamocortical
neurons during spindle oscillations are exclusively generated by RE neurons, the activity
of thalamocortical neurons could be well regarded as the mirror image or the output of
the RE nucleus; which drives the activity of the dorsal thalamus during spindle
oscillations. Therefore, these results are consistent with the idea of two different
functional groups of RE neurons projecting to the dorsal thalamus, providing different
patterns of inhibition.
Computer simulations predict a role for membrane bistability of RE neurons in
modulating thalamic oscillations
Our results with QX 314 and previous studies performed in slices (Kim and
Mccormick, 1998a) suggested that INa(p) could contribute to the generation of prolonged
depolarizing states in RE neurons. The role INa(p) was further studied in computer
simulations. In a first stage, RE neurons were modeled in order to determine if inclusion
of INa(p) in their repertoire was enough to produce membrane bistability; and furthermore,
if such behavior would have an impact on oscillations in TC neurons. Then, thalamic
networks containing RE and TC neurons were modeled.

21
Computer simulations of typical RE neurons displayed an initial high-frequency
spike-burst followed by a lower-frequency train of action potentials upon stimulation
with a positive current pulse (Fig. 10A, non-bistable). Inclusion of INa(p) in the same
model was able to generate a sustained firing pattern, which outlasted the duration of the
current pulse (Fig. 10A, bistable), a typical feature of membrane bistability in these cells
(see previous figures). As INa(p) had a strong effect in the initial bursting response of RE
neurons (not shown), the values for IT were decreased in those neurons, including the
INa(p) (Fig. 10A). This way, another characteristic of bistable RE neurons was mimicked:
the slightly lower frequency discharges compared to typical non-bistable RE neurons
(plot in Fig. 10A; see also Fig. 4). Activation and deactivation of the plateau potential,
distinctive of membrane bistability, were also seen in RE neurons modeled with the
inclusion of INa(p). Stimulation with a brief positive current pulse to RE neurons in resting
conditions induced transition to the active, depolarized state, which outlasted the duration
of the stimulus and remained indefinitely in the model (bottom black trace, Fig. 10A).
Such an active state or plateau potential could be terminated by the injection of the same
current pulse, but with opposite sign (bottom grey trace, Fig. 10A). In this situation, Vm
returned to initial resting conditions.
Next, we modeled a thalamic network consisting of RE and TC neurons. To
mimic the proportion found in experiments, only a few RE neurons presented INa(p) and,
thus, membrane bistability (see Methods). Thalamic oscillations presented different
patterns in TC neurons, depending on the presence or absence of membrane bistability in
RE neurons. For the majority of RE neurons, bursting within spindle frequency was
evident during active oscillatory periods (Fig. 10B, two upper traces). On the other hand,

22
bistable RE neurons exhibited prolonged firing, by far exceeding the durations of
individual LTSs (~60 ms) (Fig. 10B, two lower traces), consistent with a low correlation
with spindle-frequency activities (see Fig. 1). These different patterns of activity in RE
neurons had a differential effect of target TC neurons, depending on the connectivity in
the reciprocal network. Note that TC cells receive projections from multiple RE neurons;
therefore, the final effect on spindling pattern was a combination between those multiple
inhibitory inputs. Accordingly, TC neurons receiving preferentially projections from non-
bistable RE neurons displayed robust, regular oscillations, with rebound spike-bursts in
most cases (Fig. 10B, two upper traces). Conversely, TC cells receiving inputs mainly
from bistable RE neurons showed irregular rhythms, associated with very low rebound
discharges (Fig. 10B, two lower traces; compare to experimental data in Fig. 9C). In fact,
the spatial-temporal pattern of activity in the modeled thalamic network showed a few
TC neurons that were hyperpolarized and did not fire during the active periods of this
type of thalamic oscillations (not shown).

23
DISCUSSION
The main results of the present study are as follows. (a) A subspopulation of the
recorded cells, consisting in about 23% of cat RE neurons displayed membrane bistability
during spindles in vivo. The bistability consisted of two discrete Vm levels: an active state
(plateau potential) and a silent state, separated by ~17 mV. (b) The membrane bistability
only occurred at the resting Vm, was an intrinsic property of RE neurons, and was
modulated by synaptic activity. (c) Bistability did not appear in neurons recorded with
QX-314. (d) Bistable and non-bistable RE neurons could determine different patterns of
spindling in target thalamocortical neurons. (e) Computer simulation supported the idea
that membrane bistability in RE neurons is generated by the activation of INa(p) and that
such bistable activity is able to modulate the pattern of thalamic spindle oscillations.
The active state in bistable RE neurons has the characteristics of plateau
potentials. Such behavior could be generated either by intrinsic membrane properties or a
particular synaptic activity in the thalamocortical network. The membrane bistability here
reported seems to be intrinsically generated, as is the case described in multiple structures
in the central nervous system (see Introduction). That membrane bistability is an intrinsic,
voltage-dependent property of RE neurons was indicated by its presence only at the
resting Vm, through induction of prolonged depolarizing plateaus by brief intracellular
current pulses, and by termination of these plateaus by hyperpolarizing current pulses.
Our results indicate that intrinsic mechanisms are involved in the generation,
maintenance, and termination of active states during membrane bistability. While the
active state represents a depolarized plateau potential that may be de-activated by
hyperpolarization, the silent state is maintained until sufficient depolarization occurs to

24
initiate an active depolarization toward the active state. The transition from the silent to
the active state proceeds exponentially. The present data showed that small-amplitude
EPSPs are ineffective in spike generation during the silent state. However, when EPSPs
are strong enough, they give rise to action potentials even during the silent state (data not
shown), and the transition to an active state may occur.
The two different modes of Vm bistability are associated with different degrees of
neuronal responsiveness. The active state is around the threshold for action potential
generation, while the silent state is subthreshold. A broader range of depolarizing inputs’
amplitudes may be processed during the silent state, without the generation of a short-
latency and stereotyped spike, than in the active state. On the other hand, small-amplitude
EPSPs, which are ineffective during the silent state, may well trigger action potentials
during the active state. When excitatory inputs occurring during the silent state are strong
enough, transition to the active state might occur. Such transition amplifies the voltage
change produced by transient depolarizing signals.
Actually, corticofugal volleys elicit complex depolarizing responses in RE
neurons, composed by several EPSPs followed by all-or-none events resembling
dendritic spikes or, in less numerous RE neurons, presumably unitary dendritic spikes
(Contreras et al. 1993). The dendritic spikes may contribute to the generation of spindle
oscillations by boosting distal inputs and depolarizing the soma as well as by triggering
dendritic low-threshold spikes (Huguenard and Prince, 1992; Destexhe et al. 1996c;
Huguenard, 1996) that are crucial in the generation of spindle oscillations. Thus, although
an intrinsic membrane property, bistability may strongly be modulated by synaptic
activity.

25
Intracellular recordings of RE neurons in vivo present technical problems due to
instability. In the majority of cases, the initial period of recording (3-5 min) is unstable,
presenting continuous changes in the Vm. To maintain the neuron, this period was
necessarily performed under negative current injection. Since membrane bistability is
present only at resting conditions, and is abolished by current injection in the pipette, it
was not possible to detect bistable behavior in neurons recorded under QX-314. During
the few minutes that are necessary to stabilize the recording, QX-314 is already acting on
its target conductances. This is the probable reason to explain the fact that upon current
removal, and resting conditions recovered, bistable behavior was not seen in most
neurons recorded with QX-314-filled pipettes. The only neuron in which bistability was
seen under QX-314 conditions (see Fig. 7) was stable from the very early period of
recordings (1-2 min) and both action potentials and plateau potentials were rapidly
affected.
The marked effect of QX-314 suggests that generation of bistability requires
activation of voltage-gated Na+ channels. However, QX-314 also blocks low- and high-
voltage activated Ca2+ currents (Talbot and Sayer, 1996), K+ currents (Svoboda et al.
1997; Paré and Lang, 1998) as well as hyperpolarization-activated currents (Perkins and
Wong, 1995). Therefore, the relative contribution of Na+ and other QX-314-sensitive
channels in generating bistability is not yet clear. Still, TTX bath application in
perigeniculate (RE) thalamic slices blocked plateau potentials, suggesting that INa(p) may
generate such activities (Kim and McCormick, 1998a). Furthermore, computer
simulations of RE neurons predicted that by the inclusion of INa(p), otherwise typical RE
neurons became bistable. Thus, the ionic basis of bistability in RE neurons seem to be

26
different than those in TC neurons, where a steady-state residual (“window”) component
of IT is responsible for signal amplification and bistable behavior (Williams et al. 1997).
Membrane bistability in a subgroup of RE neurons may play an important role in
different patterns of spindles displayed by thalamocortical neurons. In vivo (Steriade et al.
1985; Timofeev and Steriade, 1996) and in vitro (Bal et al. 1995a,b) intracellular studies
have revealed the cellular mechanisms responsible for spindle generation, demonstrating
that prolonged, rhythmic IPSPs in TC cells during spindles are time-locked and generated
by spike-bursts fired by RE neurons. Consequently, any change in the bursting pattern of
RE neurons would affect their targets, thalamic relay neurons. Intracellular recordings of
TC cells showed at least two different patterns during spontaneously occurring spindles.
Although simultaneous recordings of RE and TC neurons have not been performed in the
present experiments, the two patterns displayed by cell 1 and cell 2 in Fig. 9 may be
related to the actions exerted by non-bistable and bistable RE neurons, respectively.
Indeed, non-bistable neurons fired stronger bursts, with higher intra-bursts frequencies,
which are assumed to generate deeper and longer IPSPs in TC neurons, giving rise to the
usual frequency range of spindles under barbiturate anesthesia, ~7-10 Hz. By contrast,
IPSPs with lower amplitudes and higher frequency, up to 20 Hz (see inset in Fig. 9C) are
likely to be mainly generated by single action potentials in RE neurons, as they occur
during the depolarizing plateau in bistable cells. In either case, the crucial role of RE
neurons in initiating spindles, even in the absence of feed-back excitatory effects from
TC neurons, is shown by the absence of rebound bursts with fast action potentials after
the first three or four IPSPs in relay cells (Timofeev et al. 2001). Supporting these results,
computational models of thalamic networks, including bistable RE neurons, showed a

27
significant shaping of thalamic oscillations in TC neurons by bistable RE neurons. While
spindles are initiated in the RE nucleus (Steriade et al. 1987), this oscillation is
maintained by reciprocal actions between RE and TC neurons (Steriade et al. 1993; von
Krosigk et al. 1993; Bal et al. 1995a,b).
Acknowledgments
This work was supported by grants from the Canadian Institutes for Health Research
(MT-3689, MOP-36545 and MOP-37862). I.T. is a Scholar of CIHR. We thank P.
Giguère and D. Drolet for technical assistance, and D. Rodriguez for reconstruction of
intracellularly stained RE neurons.

28
REFERENCES
Alzheimer C, Schwindt PC, and Crill WE. Modal gating of Na+ channels as a
mechanism of persistent Na+ current in pyramidal neurons from rat and cat
sensorimotor cortex. J Neurosci 13: 660-673, 1993.
Bal T, von Krosigk M, and McCormick DA. Synaptic and membrane mechanisms
underlying synchronized oscillations in the ferret lateral geniculate nucleus in vitro.
J Physiol 483: 641-663, 1995a.
Bal T, von Krosigk M, and McCormick DA. Role of the ferret perigeniculate nucleus
in the generation of synchronized oscillations in vitro. J Physiol 483: 665-685,
1995b.
Bazhenov M, Timofeev I, Steriade M, and Sejnowski TJ. Cellular and network models
for intrathalamic augmenting responses during 10-hz stimulation. J Neurophysiol
79: 2730-2748, 1998.
Bazhenov M, Timofeev I, Steriade M, and Sejnowski TJ. Patterns of spiking-bursting
activity in the thalamic reticular nucleus initiate sequences of spindle oscillations
in thalamic network. J Neurophysiol 84: 1076-1087, 2000.
Bennett DJ, Hultborn H, Fedirchuk B, and Gorassini M. Synaptic activation of
plateaus in hindlimb motoneurons of decerebrate cats. J Neurophysiol 80: 2023-
2037, 1998.
Chuang SC, Bianchi R, and Wong RK. Group I mGluR activation turns on a voltage-
gated inward current in hippocampal pyramidal cells. J Neurophysiol 83: 2844-
2853, 2000.

29
Contreras D, Curró Dossi R, and Steriade M. Bursting and tonic discharges in two
classes of reticular thalamic neurons in vivo. J Neurophysiol 68: 973-977, 1992.
Contreras D, Curró Dossi R, and Steriade M. Electrophysiological properties of cat
reticular thalamic neurons in vivo. J Physiol 470: 273-294, 1993.
Contreras D and Steriade M. Spindle oscillation: the role of corticothalamic feedback
in a thalamically generated rhythm. J Physiol 490: 159-179, 1996.
Crill WE. Persistent sodium current in mammalian central neurons. Annu Rev Physiol
58: 349-362, 1996.
Crunelli V, Kelly JS, Leresche N, and Pirchio M. The ventral and dorsal lateral
geniculate nucleus of the rat: intracellular recordings in vitro. J Physiol 384: 587-
601, 1987.
Destexhe A, Mainen ZF, and Sejnowski TJ. Synthesis of models for excitable
membranes, synaptic transmission and neuromodulation using a common kinetic
formalism. J Comput Neurosci 1: 195-230, 1994.
Destexhe A, Bal T, McCormick DA, and Sejnowski TJ. Ionic mechanisms underlying
synchronized oscillations and propagating waves in a model of ferret thalamic
slices. J Neurophysiol 76: 2049-2070, 1996a.
Destexhe A, Bal T, McCormick DA, and Sejnowski TJ. Ionic mechanisms underlying
synchronized and propagating waves in a model of ferret thalamic slices. J
Neurophysiol 76: 2049-2070, 1996b.
Destexhe A, Contreras D, Steriade M, and Huguenard JR In vivo, in vitro and
computational analysis of dendritic calcium currents in thalamic reticular neurons. J
Neurosci 16: 169-185, 1996c.

30
Domich L, Oakson G, and Steriade M. Thalamic burst patterns in the naturally sleeping
cat: a comparison between cortically projecting and reticularis neurons. J Physiol
379: 429-449, 1986.
Dutar P and Nicoll RA. A physiological role for GABAB receptors in the central
nervous system. Nature 332: 156-158, 1988.
Fricker D and Miles R. EPSP amplification and the precision of spike timing in
hippocampal neurons. Neuron 28: 559-569, 2000.
Gola M, Delmas P, and Chagneux H. Encoding properties induced by a persistent
voltage-gated muscarinic sodium current in rabbit sympathetic neurons. J Physiol
510: 387-399, 1998.
Heyward P, Ennis M, Keller A, and Shipley MT Membrane bistability in olfactory
bulb mitral cells. J Neurosci 21: 5311-5320, 2001.
Hughes SW, Cope DW, Toth TI, Williams SR, and Crunelli V All thalamocortical
neurons possess a T-type Ca2+ “window” current that enables the expression of
bistability-mediated activities. J Physiol 517: 805-815, 1999.
Huguenard JR. Low-threshold calcium currents in central nervous system neurons. Ann
Rev Physiol 58: 329-348, 1996.
Huguenard JR and Prince DA. A novel T-type current underlies prolonged Ca2+-
dependent burst firing in GABAergic neurons of rat thalamic reticular nucleus. J
Neurosci 12: 3804-3817, 1992.
Huguenard JR and McCormick DA. Simulation of the currents involved in rhythmic
oscillations in thalamic relay neurons. J Neurophysiol 68: 1373-1383, 1992.
Jones EG. The Thalamus. Plenum, New York, 1985.

31
Kim U and McCormick DA. Functional and ionic properties of a slow
afterhyperpolarization in ferret perigeniculate neurons in vitro. J Neurophysiology
80: 1222-1235, 1998a.
Kim U and McCormick DA. The functional influence of burst and tonic firing mode on
synaptic interactions in the thalamus. J Neurosci 18: 9500-9516, 1998b.
Llinás R and Sugimori M. Electrophysiological properties of in vitro Purkinje cell
somata in mammalian cerebellar slices. J Physiol 305: 171-195, 1980.
McCormick DA and Pape HC. Properties of a hyperpolarization-activated cation
current and its role in rhythmic oscillation in thalamic relay neurons. J Physiol
431: 291-318, 1990.
Paré D and Lang EJ. Calcium electrogenesis in neocortical pyramidal neurons in vivo.
Eur J Neurosci 10: 3164-3170, 1998.
Perkins KL and Wong RK. Intracellular QX-314 blocks the hyperpolarization-activated
inward current Iq in hippocampal CA1 pyramidal cells. J Neurophysiol 73: 911-
915, 1995.
Schwindt P and Crill W. Mechanisms underlying burst and regular spiking evoked by
dendritic depolarization of layer 5 cortical pyramidal neurons. J Neurophysiol 81:
1341-1354, 1999.
Scott DW. On optimal and data-based histograms. Biometrika 66: 605–610, 1979.
Steriade M, Deschênes M, Domich L, and Mulle C. Abolition of spindle oscillations in
thalamic neurons disconnected from nucleus reticularis thalami. J Neurophysiol 54:
1473-1497, 1985.

32
Steriade M, Domich L, and Oakson G. Reticularis thalami neurons revisited: activity
changes during shifts in states of vigilance. J Neurosci 6: 68-81, 1986.
Steriade M, Domich L, Oakson G, and Deschênes M. The deafferented reticularis
thalami nucleus generates spindle rhythmicity. J Neurophysiol 57: 260-273, 1987.
Steriade M, Jones EG, and Llinás RR. Thalamic Oscillations and Signaling. Wiley-
Interscience, New York, 1990.
Steriade M, McCormick DA and Sejnowski TJ. Thalamocortical oscillation in the
sleeping and aroused brain. Science 262: 679-685, 1993.
Svoboda K, Denk W, Kleinfeld D and Tank DW. In vivo dendritic calcium dynamics
in neocortical pyramidal neurons. Nature 385: 161-165, 1997.
Talbot MJ and Sayer RJ. Intracellular QX-314 inhibits calcium currents in
hippocampal CA1 pyramidal neurons. J Neurophysiol 76: 2120-2124, 1996.
Timofeeev I and Steriade M. Low-frequency rhythms in the thalamus of intact-cortex
and decorticated cats. J Neurophysiol 76: 4152-4168, 1996.
Timofeev I, Bazhenov M, Sejnowski TJ, and Steriade M. Contribution of intrinsic and
synaptic factors in the desynchronization of thalamic oscillatory activity. Thalamus
& Related Systems 1: 53-69, 2001.
Thomson AM. Inhibitory postsynaptic potentials evoked in thalamic neurons by
stimulation of the reticularis nucleus evoke slow spikes in isolated rat brain slices.
Neuroscience 25: 491-502, 1988.
Toth TI, Hughes SW and Crunelli V. Analysis and biophysical interpretation of
bistable behavior in thalamocortical neurons. Neuroscience 87: 519-523, 1998.

33
Von Krosigk M, Bal T, and McCormick DA. Cellular mechanisms of a synchronized
oscillation in the thalamus. Science 261: 361-364, 1993.
Williams SR, Toth TI, Turner JP, Hughes SW, and Crunelli V. The “window”
component of the low threshold Ca2+ current produces input signal amplification
and bistability in cat and rat thalamocortical neurons. J Physiol 505: 689-705,
1997.

34
LEGENDS
Fig. 1. Membrane bistability in RE neurons during spontaneously occurring spindles. A,
cortical EEG and intracellular recordings from two RE neurons. Typical low-threshold
spike-bursts of each of these RE cells are expanded in insets; scale is same for both
neurons. Bistable neuron displayed sustained depolarizations throughout spindle waves.
Non-bistable neuron fired spike-bursts, separated by phasic hyperpolarizations, during
spindling. Scale bars: 50 ms, 20 mV. B, histograms of Vm distribution from bistable and
non-bistable cells in A, taken from a 5-minute period of spontaneous activity. Only
bistable neurons presented bimodal Vm distributions. Bin size, 1 mV. C,
autocorrelograms of action potentials for the same periods used in B. Non-bistable cells
discharged in the spindle frequency (~9 Hz), showing clear peaks at ~±110 ms delay,
whereas bistable cells showed less marked correlation with spindle frequency. Bin size, 1
ms. D, Bistability is a graded property. Different bistable RE neurons (represented by
different gray tones) displayed diverse patterns of Vm distributions, but all showed two
discrete peaks though at different positions. Note the constancy of the first peak (silent)
and the variable position of the second peak (active, arrows). Bin size, 1 mV. E, Silent
and active states during membrane bistability presented different membrane potentials
(mean ± SD, n = 9); * p<0.001. F, intracellularly stained (Neurobiotin) bistable RE
neuron located in the rostral sector of the nucleus. Photograph (right) and reconstruction
(left). Arrowhead indicates the axon to the dorsal thalamus. Calibration bar = 20 µm for
RE neuron in the photograph and 100 µm for the reconstructed RE neuron. G,
microphotograph of the section where the cellular soma was recovered. Reconstruction

35
shows the relative position of the neuron. Arrowheads point to the rostrolateral sector of
the RE nucleus. Asterisk marks the stimulating electrode in the IC. Abbreviations: AV,
anteroventral nucleus; CA, caudate nucleus; IC, internal capsule; LV, lateral ventricle;
RE, reticular nucleus; VA, ventroanterior nucleus. Scale bar: 500 µm.
Fig. 2. Membrane bistability can be triggered by corticothalamic inputs.A, intracellular
recordings of two RE neurons, displaying spindles triggered by electrical stimulation of
the internal capsule. One of them presents a plateau potential (bistable), while the other
neuron shows a typical sequence of spike-bursts during spindling. The grey line below
both recordings indicates the periods used to compute the histograms in B. B, histograms
of Vm distribution during spindle waves from bistable and non-bistable cells in A, taken
from 50 evoked spindles. Only the bistable neuron presented two discrete peaks in the Vm
distribution. Bin size, 1 mV. Distributions were significantly different (Kruskal-Wallis, H
= 51.5, p < 0.001). C, autocorrelograms of action potentials in both neurons; bin size, 1
ms.
Fig. 3. Membrane bistability is voltage-dependent. Intracellular recording (left column,
A-C) and histograms of Vm distributions (right column) for a RE neuron held at different
levels of DC (3-minute period of intracellular recording in each case). A, positive current
injection (+0.2 nA) depolarized the Vm to –64 mV and caused a sustained, tonic firing
(left). Only a single mode was present in such cases for Vm distribution (right). B, without
current (0 nA, -79 mV), it was possible to distinguish a bimodal Vm distribution (right).
C, negative current injection (-0.2 nA, -90, mV) was equally efficient in abolishing

36
bistability (right), even though firing occurred during spindles (left). D, summary plot of
the relation between injected current (DC) and the resulting membrane potential (Vm).
The resting level (0 nA) is the only two-point case in the Vm axis (-79 mV and -62 mV)
and constitutes an asymmetric axis for the apparent input resistance, Rin (7 MΩ for
positive DC and 22 MΩ for negative DC). E, summary plot of the relation between
injected current (DC) and mean firing frequency of the cell. The resting level marks an
asymmetric axis for the gain in firing frequency (56 Hz/nA for positive DC and 10 Hz/nA
for negative DC). Rin and gain in firing frequency were calculated as the slope for the
linear fitting in D and E, respectively. Each Vm point is the mean of a Gaussian fitting to
the histogram for each DC value. Histograms’ bin size, 1 mV.
Fig. 4. Simultaneous extracellular recordings of non-bistable and bistable RE neurons
show different firing patterns during spindles. To avoid corticofugal influences,
recordings were made in decorticated cats. A, dual extracellular recordings of RE neurons
(cell 1 and cell 2). B, one spindle period chosen from the above panel, for each RE
neuron. Visual inspection reveals the presence of tonic firing in cell 2 (right). Spike-
bursts displaying the accelerando-decelerando pattern identified both RE neurons (see
arrows and insets in B). C, semi-logarithmic plot for firing frequency in cell 1 and cell 2
during spindle sequences shown in B. Note tonic spikes (~20-100 Hz) only in cell 2. Inset
plot depicts inter-spike intervals for a 5-minute period of recording during spontaneous
activity in each cell; bin size, 1 ms.

37
Fig. 5. Active states in membrane bistability evoked by depolarizing current pulses in RE
neurons are graded and voltage-dependent. A, current pulse (200 ms, 2 nA) generated an
outlasting active state at rest (0 nA). B, shorter current pulses (50 ms, 2 nA) were also
able to elicit outlasting active states, but of shorter duration. C-D, hyperpolarization (–2
nA), bringing the Vm to –90 mV, abolished the ability of current pulses to generate
outlasting active state in the same neuron, even though their amplitudes were increased
(+2, +2.4, +2.7, and +3 nA). E, very short current pulses (10 ms, 30 ms) were not able to
elicit active responses under slight hyperpolarization (DC –1 nA). Short current pulses
(50 ms) could trigger a spike occasionally. F, summary plot for the current pulse duration
versus the duration of the evoked plateau outlasting the stimulus. note graded properties
for intermediate levels of membrane polarization (-85 mV).
Fig. 6. Intrinsic membrane properties are involved in the generation, maintenance, and
termination of active states in membrane bistability. A, depolarizing current pulses (200
ms, +2 nA) were able to generate active states, characteristic of membrane bistability in
RE neurons, independent on the duration of the previous silent period (bottom plot). Note
that failures in generating an active state were also independent on the history of the cell.
B, hyperpolarizing current pulses (200 ms, -1 and -2 nA) were effective in shunting the
active states. Note (bottom plot) that long-lasting active periods (>3s) were shunted for
longer periods than short lasting (<2s) active periods; and failures were independent on
the ongoing active state duration.

38
Fig. 7. Ionic basis of membrane bistability. A, RE neuron recorded with QX-314-filled
pipette (50 mM) shown at two different periods of recording: early (2 min) and late (40
min). B, expanded period of the recording shown in A. Each period is indicated by an
arrow and corresponds to a complete spindle oscillation. C, Vm distribution for the two
periods of recording, each histogram computed from a 2-minute episode of spontaneous
activity. Bin size, 1 mV. D, average (n = 20) of spindle oscillations for the two (early and
late) periods of recording shows a neat decrease in plateau potentials during the late
period. Spikes were removed by filtering digitized signals (< 100 Hz).
Fig. 8. Membrane bistability modulates synaptic responsiveness of RE neurons. A,
intracellular recording of RE neuron displaying both silent and active periods, as
stimulated from the internal capsule (140 µA, 1 Hz). B, superimposed responses (n = 5)
during silent states, consisting on short-latency and low-variability EPSPs. C,
superimposed responses (n = 5) during active states, consisting on short-latency, fixed
spikes (arrowhead) and spikes with variable latencies (asterisk). D, summary plot for the
stimulation intensity and the probability of evoking and action potential. Note a shift in
the curve for active states, which require lower stimulation intensities. Spike probability
was calculated as the fraction of stimuli that elicited an action potential.
Fig. 9. Different spindling patterns in thalamocortical cells reflect various firing patterns
in RE neurons. A, intracellular recordings of two TC neurons (VL nucleus) during spindle
activity. B-C, three different spindle sequences for each of the above cells. Note highly
regular activity and early rebound bursting in cell 1. Inset in cell 2 shows three IPSPs

39
(arrows) at much higher frequency (~20 Hz) than the usual frequency range of spindles
(see text). D, average of frequency spectrums of spindle periods (n = 10, mean ± SD) in
both cell 1 and cell 2 neurons. Bin size, 1 Hz. Note a clear peak around 7 Hz for cell 1. E,
histograms of inter-event intervals (IEI) for presumably IPSPs (n = 400) in both cell 1
and cell 2 during spindle waves. Bin size, 10 ms. Note the presence of a tail at short
intervals (<100 ms) for cell 2 (asterisk).
Fig. 10. Computational models predict that membrane bistability of RE neurons
modulates patterns of spindle oscillations in TC neuron. A, single-compartment models of
bistable and non-bistable RE neurons. Bistability was obtained by inclusion of INa(p) in
non-bistable neurons. Non-bistable gT = 3 mS/cm2, INa(p) = 0.3 mS/cm2, bistable gT = 0.75
mS/cm2, gNa(p) = 0.6 mS/cm2 for higher traces; gT = 1 mS/cm2, gNa(p) = 0.6 mS/cm2 for
lower traces. Resting Vm -80 mV. Right plot reflects inter-spike intervals for both types
of cells, notice non-bistable neurons to fire at higher frequencies. B, RE and TC neurons
during active periods in a simulated thalamic network (26 RE cells and 26 TC cells). See
also text.

40
FIG. 1

41
FIG. 2

42
FIG. 3

43
FIG. 4

44
FIG. 5
45
FIG. 6
46
FIG. 7

47
FIG. 8
48
FIG. 9

49
FIG. 10


