Embed Size (px)
Citation preview

lable at ScienceDirect
Journal of Archaeological Science 35 (2008) 2295–2306
lable at ScienceDirect
Contents lists avaiContents lists avaiJournal of Archaeological Science
journal homepage: ht tp: / /www.elsevier .com/locate/ jas
Journal of Archaeological Science
journal homepage: ht tp: / /www.elsevier .com/locate/ jas
Mercury levels in Danish Medieval human bones
Kaare Lund Rasmussen a,*, Jesper Lier Boldsen b, Hans Krongaard Kristensen c, Lilian Skytte a,Katrine Lykke Hansen a, Louise Mølholm a, Pieter M. Grootes d, Marie-Josee Nadeau d,Karen Marie Floche Eriksen a
a Institute of Physics and Chemistry, University of Southern Denmark, Campusvej 55, DK-5230 Odense M, Denmarkb Department of Anthropology, University of Southern Denmark, Campusvej 55, DK-5230 Odense M, Denmarkc Institute of Anthropology, Archaeology and Linguistics, Moesgård Alle 20, DK-8270 Højbjerg, Denmarkd Leibniz-Labor fur Altersbestimmung und Isotopenforschung, Christian-Albrechts-Universitat zu Kiel, Max-Eyth-Str. 11-13, D-24118 Kiel, Germany
a r t i c l e i n f o
Article history:Received 30 October 2007Received in revised form 16 February 2008Accepted 3 March 2008
Keywords:MercuryHuman bonesMedievalSyphilisLeprosy, FOS
* Corresponding author. Tel.: þ45 65502580E-mail address: [email protected] (K.L. Rasmussen).
0305-4403/$ – see front matter � 2008 Elsevier Ltd.doi:10.1016/j.jas.2008.03.003
a b s t r a c t
Mercury has been measured in Danish medieval bones interred at several cemeteries. Bone diagenesis isestimated to play an insignificant role based on measurements of soil samples taken vertically andhorizontally away from the thighbone at three graves. Our study shows that mercury-containing med-icine has been administered in 79% of the leprosy cases and 40% of the syphilis cases. A substantialnumber of the monks interred in the cloister walk of the Cistercian Abbey at Øm show heavily increasedmercury levels, whereas none of the friars interred in the Franciscan Friary of Svendborg show elevatedmercury concentrations. This is interpreted as originating either from exposure to mercury-containingred ink in the scriptorium of the Abbey, or perhaps slightly more likely, from preparing or administeringmercury-containing medicine in the hospital of the Abbey.
� 2008 Elsevier Ltd. All rights reserved.
1. Introduction
Mercury was used throughout medieval times in Europe andtherefore found its way into the body of most human beingsliving at that time. In the present study, we have investigatedthree groups of people potentially exposed to higher mercurylevels than the average medieval man. The first two are victims ofleprosy and syphilis. These diseases have pronounced expressionon the skin, and it is known that diseases visible on the skin weretreated with mercury-containing compounds, at least in latemedieval times. The third group investigated consists of in-dividuals interred in the cloister walks, presumably friars ormonks who lived at the friary or monastery. A certain group ofmonks at an abbey had daily access to the scriptorium, either asreaders or as scribes of illuminated manuscripts. It is well knownthat mercury sulphide was used throughout medieval Europe asa colour pigment for the bright red ink used extensively in illu-minated manuscripts. Another group of monks were occupiedwith treating the sick, and in this capacity they could be exposedto higher levels of mercury from producing or administering themercury-containing medicine.
All rights reserved.
As a control group for the leprosy and syphilis victims, wemeasured mercury levels in other individuals with no visible signsof disease on their bones from the same cemeteries. In the case ofthe monks and friars with possibility of access to the scriptorium ormedicine making, a number of individuals from the adjacent laycemetery were selected as a control group.
Our data from the control groups constitute a good estimate ofthe average mercury level in the non-exposed part of the medievalpopulation. This estimate can act as basic information pertinent tothe discussion of present day mercury pollution.
Mercury can be accumulated in human bones, but the mecha-nism is not yet clear. Presumably the Hg2þ ion substitutes for Ca2þ
in the bone carbonate or hydroxyapatite (Geneser, 2004) althoughit is also possible that other species of mercury, e.g. Hg(CH3)2 couldbe present in the organic parts of the bone. It is considered a gen-eral fact that the concentration in bones is lower than in manyother tissues of the human body. This is supported by Garcia et al.(2001), who found concentrations of Hg in human bone remainsfrom Spain to be lower than 0.05 mg/g, whereas they found levels of0.25 and 0.14 mg/g in kidney and liver, respectively.
Very few studies have reported Hg levels in exhumed humanbones. Yamada et al. (1995) measured the Hg concentrations inJapanese individuals from two different burial sites and from twodifferent time periods (6–7th century and 12–17th century). Theyfound concentrations ranging from 175 to 1700 mg/g in a few cases.

1 Here the term general hypertrophy is used to describe the swelling of bone dueto one of several pathological processes. Readers should be warned that thesedescriptions alone cannot be used as a valid scoring method for syphilis-associatedlesions.
K.L. Rasmussen et al. / Journal of Archaeological Science 35 (2008) 2295–23062296
They also measured the concentration of Hg in soil from the graves.In most cases the Hg concentration in the soil was below the de-tection limit. When this was not the case, there was no correlationbetween soil and bone concentrations.
Diagenesis is an important issue to be addressed when ana-lysing excavated bones. Diagenesis may change the trace elementconcentrations in the bones over the long times of interment due toprocesses such as leaching to the surrounding soil or groundwater,or uptake from the surroundings (Hedges, 2002). Trace elementscan be associated with the bones in different ways. Trace elementscan form complexes with the organic components; they can beadsorbed onto the surface of the hydroxyapatite, or incorporatedinto the hydroxyapatite matrix (Elliott and Grime, 1993). Differentmethods can be used to investigate the degree of diagenesis.Hedges and Millard (1995) used the porosity of the bone asa measure of the dissolution of the hydroxyapatite crystals, whileNelson and Sauer (1984) analysed soil samples to rule out thepossibility of migration of elements from the bone to the soil.
Martinez-Garcia et al. (2005) measured the content of copper,calcium, iron, zinc and lead in human bones from the Cartagenaregion. The bone samples were from different historical times andrecent times. Their results showed an increased amount of ele-ments in the bones through time. However, Millard (2006) questionthese results and point out the possibility of diagenesis in thesebones.
In order to elucidate if Hg had entered or left the bones afterinterment in the present study, we measured earth samples at 1, 2,5, 10 and 20 cm horizontally and vertically away from threeindividuals in a deserted Danish medieval cemetery at TjærbyØdekirke near Randers (Ødekirke means deserted church).
2. Samples selected
The bone samples that were used in the present study are keptin museum collections, deposited at the Anatomical Departmentat University of Southern Denmark, at the Øm Kloster Museumat Silkeborg, and at the Anatomical Department, Panum Institute, atUniversity of Copenhagen. Table 1 gives the sample numbers anddetails of location. The sampling locations are shown in Fig. 1.
The Franciscan Friary in Svendborg was founded in 1236 andsituated close to the medieval shore line. It was dedicated to StCatherine. Two cemeteries were investigated here. One is the friar‘sinterments in the cloister walk. This began in late medieval times,probably after 1400. The interments in the cloister walk must haveceased between 1532, when the Friary was donated to the town ofSvendborg, and 1537, when mendicant orders were prohibited inDenmark. The other is the laymen cemetery situated to the west ofthe friary’s church. Only a small part of the cemetery has beenexcavated, but it seems that the majority of the burials used hereare from after 1500. The cemetery was probably used until themiddle of the 17th century.
Svendborg Sct. Nicolai is a parish churchyard with burials fromca. 1100 until 1800, situated a few hundred meters away from theFranciscan Friary in Svendborg.
The cemetery of the Franciscan Friary in Odense functioned asa mendicant churchyard where in the Middle Ages interment couldbe obtained by paying. After the Reformation it became a parishchurchyard for a poor quarter of Odense, and remained active untilthe beginning of 19th century. So here we undoubtedly havea majority of post-Middle Age graves.
At the Cistercian Abbey at Øm we collected bone material fromgraves in both the cloister walk and the laymen cemetery north ofthe abbey. The laymen cemetery was perhaps started shortly afterthe foundation of the abbey in 1172. There were no parish rights inconnection with Øm, so the interred deliberately wished a burialwith the Cistercians, depending on their prayers to shorten the stay
in the purgatory. In light of the Lutheran movement, there haveprobably only been post-reformational burials in exceptional cases.
The abandoned church in Tjærby near Randers was a parishchurch. It is mentioned for the last time in 1524, and it was prob-ably abandoned shortly after the Reformation. The church wasundoubtedly built in the 12th century, so the burials can encompassca. 400 years.
3. Diseases visible on the bone material
Three quite different diseases are considered here, leprosy,syphilis and the newly discovered and so far unpublished patho-logical condition tentatively called ‘focal osteolytic syndrome’ (FOS).The only thing these diseases have in common is that they leftspecific lesions on the bone and that they were present in Medievaland/or Early Modern Denmark. They were by no means the onlydiseases that might have led to mercury treatment of skin lesions;but they are the conditions for which we have osteological evidence.The two well-known diseases, leprosy and syphilis, are known tocause skin lesions; it is still unknown if FOS also caused skin lesions.
Leprosy is the most extensively studied and best understood ofthese bone diagnosed diseases. Following Boldsen (2005) andBoldsen and Freund (2006) the likelihood that an excavated skel-eton belonged to an individual who suffered from leprosy can bedetermined by scores for seven lesions: (1) the remodelling of theedge of the nasal aperture; (2) atrophy of the anterior nasal spine;(3) atrophy of the alveolar process on the pre-maxilla; (4) porosityor perforation of the palate; (5) subperiostal exostoses on the fib-ula; (6) general hypertrophy (previously called general swelling orporotic hyperostosis) of the fibula; and (7) changes to (the lower/palmar face of) the fifth metatarsal. The presence of a leprosy in-dicating lesion is scored ‘1’ and the definite absence of one is scored‘0’. These scores through a kind of weighted sum are used to createa summary statistical parameter l. Positive values of this statisticalparameter indicate leprosy and negative values indicate absence ofleprosy. In this study all skeletons assumed to come from sufferersof leprosy have l values over þ1 and all controls have l valuesunder �1. Leprosy was a common disease in rural Denmarkthroughout the Middle Ages. In major towns and cities (e.g. Malmoand Odense) it appears that the disease was eliminated during thefirst half of the 14th century (Boldsen and Mollerup, 2006).
Contrary to leprosy, syphilis is primarily a disease of the EarlyModern and Modern Period in Europe. The epidemiology of thepaleopathological diagnosis of syphilis has not been studied in thesame way as has the leprosy diagnosis. As a consequence of this,the sensitivity and specificity of specific syphilis-related lesionshas not been studied. Following standard text books (e.g.Aufderheide and Rodriguez-Martin, 1998) the skeletons have beenscored for seven syphilis indicating lesions: (1) radiating scars tothe exterior of the braincase; (2) general hypertrophy1 of thescapular end of the clavicle; (3) general hypertrophy of (the backside of) distal humerus; (4) general hypertrophy of proximal ulna;(5) general hypertrophy of distal radius; (6) general hypertrophyof distal femur; and (7) general hypertrophy and bending of thetibia (saber shin). The skeletons classified as cases in the presentstudy all had at least two lesions indicating syphilis and thoseclassified as controls had none.
Focal osteolytic syndrome (FOS) was first noticed during workon a series of skeletons excavated in 1996 from the early medievalcemetery in Nordby, just outside Århus in Eastern Jutland (Skov,
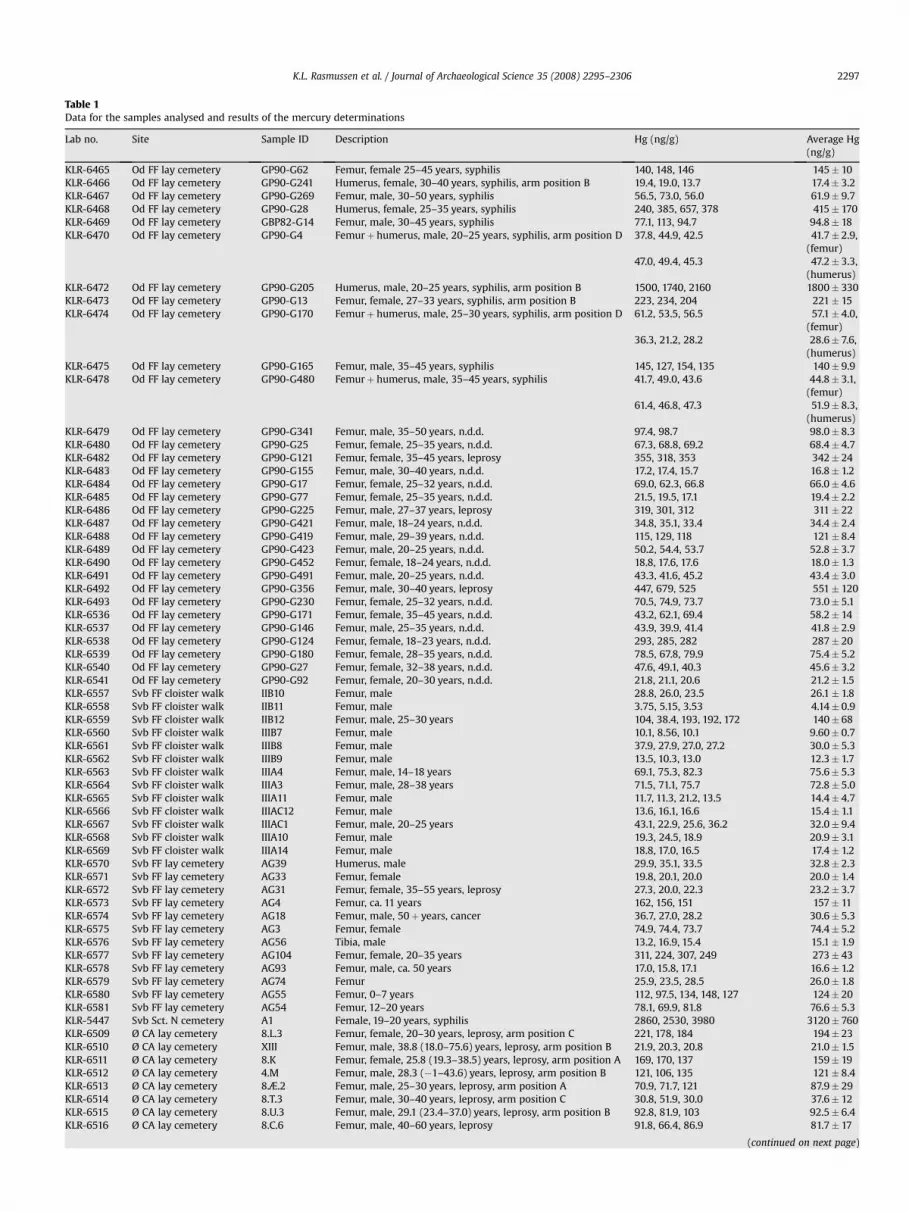
Table 1Data for the samples analysed and results of the mercury determinations
Lab no. Site Sample ID Description Hg (ng/g) Average Hg(ng/g)
KLR-6465 Od FF lay cemetery GP90-G62 Femur, female 25–45 years, syphilis 140, 148, 146 145� 10KLR-6466 Od FF lay cemetery GP90-G241 Humerus, female, 30–40 years, syphilis, arm position B 19.4, 19.0, 13.7 17.4� 3.2KLR-6467 Od FF lay cemetery GP90-G269 Femur, male, 30–50 years, syphilis 56.5, 73.0, 56.0 61.9� 9.7KLR-6468 Od FF lay cemetery GP90-G28 Humerus, female, 25–35 years, syphilis 240, 385, 657, 378 415� 170KLR-6469 Od FF lay cemetery GBP82-G14 Femur, male, 30–45 years, syphilis 77.1, 113, 94.7 94.8� 18KLR-6470 Od FF lay cemetery GP90-G4 Femurþ humerus, male, 20–25 years, syphilis, arm position D 37.8, 44.9, 42.5 41.7� 2.9,
(femur)47.0, 49.4, 45.3 47.2� 3.3,
(humerus)KLR-6472 Od FF lay cemetery GP90-G205 Humerus, male, 20–25 years, syphilis, arm position B 1500, 1740, 2160 1800� 330KLR-6473 Od FF lay cemetery GP90-G13 Femur, female, 27–33 years, syphilis, arm position B 223, 234, 204 221� 15KLR-6474 Od FF lay cemetery GP90-G170 Femurþ humerus, male, 25–30 years, syphilis, arm position D 61.2, 53.5, 56.5 57.1� 4.0,
(femur)36.3, 21.2, 28.2 28.6� 7.6,
(humerus)KLR-6475 Od FF lay cemetery GP90-G165 Femur, male, 35–45 years, syphilis 145, 127, 154, 135 140� 9.9KLR-6478 Od FF lay cemetery GP90-G480 Femurþ humerus, male, 35–45 years, syphilis 41.7, 49.0, 43.6 44.8� 3.1,
(femur)61.4, 46.8, 47.3 51.9� 8.3,
(humerus)KLR-6479 Od FF lay cemetery GP90-G341 Femur, male, 35–50 years, n.d.d. 97.4, 98.7 98.0� 8.3KLR-6480 Od FF lay cemetery GP90-G25 Femur, female, 25–35 years, n.d.d. 67.3, 68.8, 69.2 68.4� 4.7KLR-6482 Od FF lay cemetery GP90-G121 Femur, female, 35–45 years, leprosy 355, 318, 353 342� 24KLR-6483 Od FF lay cemetery GP90-G155 Femur, male, 30–40 years, n.d.d. 17.2, 17.4, 15.7 16.8� 1.2KLR-6484 Od FF lay cemetery GP90-G17 Femur, female, 25–32 years, n.d.d. 69.0, 62.3, 66.8 66.0� 4.6KLR-6485 Od FF lay cemetery GP90-G77 Femur, female, 25–35 years, n.d.d. 21.5, 19.5, 17.1 19.4� 2.2KLR-6486 Od FF lay cemetery GP90-G225 Femur, male, 27–37 years, leprosy 319, 301, 312 311� 22KLR-6487 Od FF lay cemetery GP90-G421 Femur, male, 18–24 years, n.d.d. 34.8, 35.1, 33.4 34.4� 2.4KLR-6488 Od FF lay cemetery GP90-G419 Femur, male, 29–39 years, n.d.d. 115, 129, 118 121� 8.4KLR-6489 Od FF lay cemetery GP90-G423 Femur, male, 20–25 years, n.d.d. 50.2, 54.4, 53.7 52.8� 3.7KLR-6490 Od FF lay cemetery GP90-G452 Femur, female, 18–24 years, n.d.d. 18.8, 17.6, 17.6 18.0� 1.3KLR-6491 Od FF lay cemetery GP90-G491 Femur, male, 20–25 years, n.d.d. 43.3, 41.6, 45.2 43.4� 3.0KLR-6492 Od FF lay cemetery GP90-G356 Femur, male, 30–40 years, leprosy 447, 679, 525 551� 120KLR-6493 Od FF lay cemetery GP90-G230 Femur, female, 25–32 years, n.d.d. 70.5, 74.9, 73.7 73.0� 5.1KLR-6536 Od FF lay cemetery GP90-G171 Femur, female, 35–45 years, n.d.d. 43.2, 62.1, 69.4 58.2� 14KLR-6537 Od FF lay cemetery GP90-G146 Femur, male, 25–35 years, n.d.d. 43.9, 39.9, 41.4 41.8� 2.9KLR-6538 Od FF lay cemetery GP90-G124 Femur, female, 18–23 years, n.d.d. 293, 285, 282 287� 20KLR-6539 Od FF lay cemetery GP90-G180 Femur, female, 28–35 years, n.d.d. 78.5, 67.8, 79.9 75.4� 5.2KLR-6540 Od FF lay cemetery GP90-G27 Femur, female, 32–38 years, n.d.d. 47.6, 49.1, 40.3 45.6� 3.2KLR-6541 Od FF lay cemetery GP90-G92 Femur, female, 20–30 years, n.d.d. 21.8, 21.1, 20.6 21.2� 1.5KLR-6557 Svb FF cloister walk IIB10 Femur, male 28.8, 26.0, 23.5 26.1� 1.8KLR-6558 Svb FF cloister walk IIB11 Femur, male 3.75, 5.15, 3.53 4.14� 0.9KLR-6559 Svb FF cloister walk IIB12 Femur, male, 25–30 years 104, 38.4, 193, 192, 172 140� 68KLR-6560 Svb FF cloister walk IIIB7 Femur, male 10.1, 8.56, 10.1 9.60� 0.7KLR-6561 Svb FF cloister walk IIIB8 Femur, male 37.9, 27.9, 27.0, 27.2 30.0� 5.3KLR-6562 Svb FF cloister walk IIIB9 Femur, male 13.5, 10.3, 13.0 12.3� 1.7KLR-6563 Svb FF cloister walk IIIA4 Femur, male, 14–18 years 69.1, 75.3, 82.3 75.6� 5.3KLR-6564 Svb FF cloister walk IIIA3 Femur, male, 28–38 years 71.5, 71.1, 75.7 72.8� 5.0KLR-6565 Svb FF cloister walk IIIA11 Femur, male 11.7, 11.3, 21.2, 13.5 14.4� 4.7KLR-6566 Svb FF cloister walk IIIAC12 Femur, male 13.6, 16.1, 16.6 15.4� 1.1KLR-6567 Svb FF cloister walk IIIAC1 Femur, male, 20–25 years 43.1, 22.9, 25.6, 36.2 32.0� 9.4KLR-6568 Svb FF cloister walk IIIA10 Femur, male 19.3, 24.5, 18.9 20.9� 3.1KLR-6569 Svb FF cloister walk IIIA14 Femur, male 18.8, 17.0, 16.5 17.4� 1.2KLR-6570 Svb FF lay cemetery AG39 Humerus, male 29.9, 35.1, 33.5 32.8� 2.3KLR-6571 Svb FF lay cemetery AG33 Femur, female 19.8, 20.1, 20.0 20.0� 1.4KLR-6572 Svb FF lay cemetery AG31 Femur, female, 35–55 years, leprosy 27.3, 20.0, 22.3 23.2� 3.7KLR-6573 Svb FF lay cemetery AG4 Femur, ca. 11 years 162, 156, 151 157� 11KLR-6574 Svb FF lay cemetery AG18 Femur, male, 50þ years, cancer 36.7, 27.0, 28.2 30.6� 5.3KLR-6575 Svb FF lay cemetery AG3 Femur, female 74.9, 74.4, 73.7 74.4� 5.2KLR-6576 Svb FF lay cemetery AG56 Tibia, male 13.2, 16.9, 15.4 15.1� 1.9KLR-6577 Svb FF lay cemetery AG104 Femur, female, 20–35 years 311, 224, 307, 249 273� 43KLR-6578 Svb FF lay cemetery AG93 Femur, male, ca. 50 years 17.0, 15.8, 17.1 16.6� 1.2KLR-6579 Svb FF lay cemetery AG74 Femur 25.9, 23.5, 28.5 26.0� 1.8KLR-6580 Svb FF lay cemetery AG55 Femur, 0–7 years 112, 97.5, 134, 148, 127 124� 20KLR-6581 Svb FF lay cemetery AG54 Femur, 12–20 years 78.1, 69.9, 81.8 76.6� 5.3KLR-5447 Svb Sct. N cemetery A1 Female, 19–20 years, syphilis 2860, 2530, 3980 3120� 760KLR-6509 Ø CA lay cemetery 8.L.3 Femur, female, 20–30 years, leprosy, arm position C 221, 178, 184 194� 23KLR-6510 Ø CA lay cemetery XIII Femur, male, 38.8 (18.0–75.6) years, leprosy, arm position B 21.9, 20.3, 20.8 21.0� 1.5KLR-6511 Ø CA lay cemetery 8.K Femur, female, 25.8 (19.3–38.5) years, leprosy, arm position A 169, 170, 137 159� 19KLR-6512 Ø CA lay cemetery 4.M Femur, male, 28.3 (�1–43.6) years, leprosy, arm position B 121, 106, 135 121� 8.4KLR-6513 Ø CA lay cemetery 8.Æ.2 Femur, male, 25–30 years, leprosy, arm position A 70.9, 71.7, 121 87.9� 29KLR-6514 Ø CA lay cemetery 8.T.3 Femur, male, 30–40 years, leprosy, arm position C 30.8, 51.9, 30.0 37.6� 12KLR-6515 Ø CA lay cemetery 8.U.3 Femur, male, 29.1 (23.4–37.0) years, leprosy, arm position B 92.8, 81.9, 103 92.5� 6.4KLR-6516 Ø CA lay cemetery 8.C.6 Femur, male, 40–60 years, leprosy 91.8, 66.4, 86.9 81.7� 17
(continued on next page)
K.L. Rasmussen et al. / Journal of Archaeological Science 35 (2008) 2295–2306 2297

Table 1 (continued)
Lab no. Site Sample ID Description Hg (ng/g) Average Hg(ng/g)
KLR-6517 Ø CA church 7.L.1 Femur, male, 57.0 (31.9–84.5) years, leprosy, arm position C 312, 248, 218 259� 48KLR-6518 Ø CA lay cemetery 8.S.3 Femur, male, 50–65 years, leprosy, arm position B 238, 210, 229 226� 16KLR-6519 Ø CA lay cemetery 4.K.3 Femur, male, 41.4 (28.7–64.6) years, leprosy, arm position C 63.7, 32.1, 28.4 41.4� 19KLR-6520 Ø CA lay cemetery 8.F.1 Femur, male, 30.4 (20.9–44.1) years, n.d.d. 39.7, 42.8, 45.8 42.8� 3.0
73.2, 62.9, 63.3 66.5� 4.6KLR-6521 Ø CA lay cemetery 7.U.5 Femur, male, 19.1 (0–34.4) years, n.d.d. 35.5, 36.1, 36.4 36.0� 2.5KLR-6522 Ø CA lay cemetery 5.K Femur, female, 25.4 (20.8–31.9) years, n.d.d. 5.95, 10.6, 5.98 7.51� 2.7KLR-6523 Ø CA lay cemetery 4.H Femur, male, 44.9 (21.0–86.0) years, n.d.d. 11.7, 13.0, 14.5 13.1� 0.9KLR-6524 Ø CA lay cemetery 5.O.5 Femur, male, 40.0 (27.7–62.6) years, n.d.d. 25.0, 22.8, 23.8 23.9� 1.7KLR-6525 Ø CA lay cemetery 8.P.1 Femur, male, 35–60 years, n.d.d. 44.4, 44.3, 42.8 43.8� 3.0KLR-6526 Ø CA lay cemetery 8.B.2 Femur, male, 26.2 (�1–42.8) years, n.d.d. 60.2, 64.5, 61.1 62.0� 4.3KLR-6527 Ø CA lay cemetery 8.O.3 Femur, male, n.d.d. 46.8, 45.6, 44.8 45.7� 3.2KLR-6528 Ø CA lay cemetery 4.A.5 Femur, male, 15–19 years, n.d.d. 48.4, 38.8, 38.7 42.0� 5.6KLR-6529 Ø CA lay cemetery 5.H.5 Femur, 12–18 years, n.d.d. 28.0, 26.0, 60.0 38.0� 19KLR-6530 Ø CA lay cemetery 9.E Femur, male, 23.27 years, n.d.d. 29.7, 29.5, 29.5 29.6� 2.1KLR-6531 Ø CA lay cemetery 7.A Femur, male, 38.9 (28.1–59.44) years, n.d.d. 30.1, 25.3, 26.4 27.3� 1.9KLR-6582 Ø CA cloister walk A257 Femur, male, 30–40 years 31.4, 33.6, 25.7 30.2� 4.0KLR-6583 Ø CA cloister walk 6.L Femur, male 57.3, 59.9, 56.7 58.0� 4.0KLR-6584 Ø CA cloister walk 6.K Femur, male 90.1, 123, 141, 130 121� 22KLR-6585 Ø CA cloister walk 6.F Femur, male 401, 574, 455, 499 482� 73KLR-6586 Ø CA cloister walk 41.C Femur, male, 40–50 years 9.53, 29.8, 8.26, 24.4, 3.69 15.1� 11KLR-6587 Ø CA cloister walk GED Femur, male, arm position B 254, 259, 265 260� 18KLR-6588 Ø CA cloister walk GBG Femur, male, 40–60 years, arm position A 16.4, 30.7, 10.3, 15.5 18.2� 8.8KLR-6589 Ø CA cloister walk GBE Femur, male, 40–60 years 99.5, 63.2, 78.7, 69.0 77.6� 16KLR-6590 Ø CA cloister walk GBK Femur, male, 40–60 years, arm position A 18.2, 33.5, 16.5, 16.4 21.2� 8.3KLR-6591 Ø CA cloister walk GCA Femur, male, 40–60 years 85.1, 74.1, 51.5, 62.9 68.4� 15KLR-6592 Ø CA cloister walk GBC Femur, male, 60þ years, arm position A 310, 306, 275 297� 21KLR-6593 Ø CA cloister walk GEE Femur, male, adult 412, 285, 238, 256 298� 78KLR-6594 Ø CA cloister walk GBH Femur, male, 40–60 years, arm position C 24.4, 26.1, 32.6 27.7� 4.3KLR-6595 Ø CA lay cemetery 8.V Femur, male, ca. 75 years 43.2, 37.8, 33.6 38.2� 4.8KLR-6596 Ø CA lay cemetery 8.E.2 Femur, male, 30–40 years, arm position A 102, 78.7, 154, 110 111� 32KLR-6597 Ø CA lay cemetery 7.K.4 Femur 19.0, 16.0, 22.7 19.2� 3.3KLR-6598 Ø CA lay cemetery 7.N.4 Femur 42.1, 58.7, 46.6 49.1� 8.6KLR-6599 Ø CA lay cemetery 7.K.5 Tibia, male, ca. 22 years 24.5, 24.2, 19.6 22.8� 2.8KLR-6600 Ø CA lay cemetery 8.D.1 Femur 56.4, 59.1, 51.1 55.5� 3.9KLR-6601 Ø CA lay cemetery 8.L.1 Femur, male, 35–45 years 94.0, 88.6, 156, 107 111� 31KLR-6602 Ø CA lay cemetery 7.U.4 Femur 55.5, 43.6, 47.1 48.8� 6.1KLR-6603 Ø CA lay cemetery 7.O.4 Humerus 40.8, 34.1, 33.5 36.1� 4.0KLR-6532 Ø CA lay cemetery VIIIa Femur, male, 36.3 (20.2–58.7) years, Morbus Nordby 22.7, 35.6, 27.9 28.7� 6.5KLR-6535 Ø CA lay cemetery 5.A Femur, male, 31.0 (24.5–40.1) years, Morbus Nordby 15.2, 14.5, 15.5 15.1� 1.1KLR-6476 Nordby FHM3970-CX Femur, female, 25–35 years, Morbus Nordby 22.8, 23.3, 23.8 23.3� 1.6KLR-6533 Nordby FHM3970-ES Femur, male, 33.5 (25.7–46.6) years, Morbus Nordby 27.1, 26.0, 26.4 26.5� 1.8KLR-6534 Nordby FHM3970-FF Femur, male, 31.2 (23.7–43.9) years, Morbus Nordby 13.1, 13.2, 13.0 13.1� 0.9KLR-6342-1 Tjærby Ødekirke Randers Soil sample 1 cm from A1416, horizontally 19.0, 20.5, 18.9 19.5� 1.4KLR-6342-2 Tjærby Ødekirke Randers Soil sample 1 cm from A1416, vertically 18.3, 21.1, 21.3, 27.7, 26.3, 17.9, 20.1 21.8� 3.8KLR-6343-1 Tjærby Ødekirke Randers Soil sample 2 cm from A1416, horizontally 17.5, 16.0, 16.9 16.8� 1.2KLR-6343-2 Tjærby Ødekirke Randers Soil sample 2 cm from A1416, vertically 11.0, 12.7, 13.1 12.3� 0.9KLR-6344-1 Tjærby Ødekirke Randers Soil sample 5 cm from A1416, horizontally 13.7, 13.1, 15.3 14.0� 1.0KLR-6344-2 Tjærby Ødekirke Randers Soil sample 5 cm from A1416, vertically 21.3, 20.9, 19.7 20.6� 1.4KLR-6345-1 Tjærby Ødekirke Randers Soil sample 10 cm from A1416, horizontally 12.3, 14.2, 14.2 13.6� 0.9KLR-6345-2 Tjærby Ødekirke Randers Soil sample 10 cm from A1416, vertically 13.9, 14.1, 13.3 13.8� 1.0KLR-6346-1 Tjærby Ødekirke Randers Soil sample 20 cm from A1416, horizontally 29.8, 26.4, 23.8, 29.3 27.3� 1.7KLR-6346-2 Tjærby Ødekirke Randers Soil sample 20 cm from A1416, vertically 28.8, 23.0, 24.8, 24.4 25.3� 1.5KLR-6347 Tjærby Ødekirke Randers A1416 Femur 57.9, 59.0, 63.1 60.0� 4.2KLR-6348 Tjærby Ødekirke Randers A1388 Femur 9.01, 8.90, 10.7 9.52� 0.7KLR-6349-1 Tjærby Ødekirke Randers Soil sample 1 cm from A1388, horizontally 15.3, 19.3, 16.7, 18.7, 18.1 17.6� 1.0KLR-6349-2 Tjærby Ødekirke Randers Soil sample 1 cm from A1388, vertically 16.0, 14.9, 16.7 15.8� 1.1KLR-6350-1 Tjærby Ødekirke Randers Soil sample 2 cm from A1388, horizontally 21.9, 20.2, 17.6 19.9� 1.4KLR-6350-2 Tjærby Ødekirke Randers Soil sample 2 cm from A1388, vertically 15.2, 21.6, 15.6, 15.6 17.0� 3.1KLR-6351-1 Tjærby Ødekirke Randers Soil sample 5 cm from A1388, horizontally 17.4, 18.6, 25.1, 18.9 20.0� 3.4KLR-6351-2 Tjærby Ødekirke Randers Soil sample 5 cm from A1388, vertically 15.5, 16.2, 17.7 16.5� 1.1KLR-6352-1 Tjærby Ødekirke Randers Soil sample 10 cm from A1388, horizontally 11.8, 11.3, 11.6 11.6� 0.8KLR-6352-2 Tjærby Ødekirke Randers Soil sample 10 cm from A1388, vertically 15.9, 17.4, 17.0 16.7� 1.2KLR-6353-1 Tjærby Ødekirke Randers Soil sample 20 cm from A1388, horizontally 12.8, 17.2, 13.6, 13.9 14.4� 1.9KLR-6353-2 Tjærby Ødekirke Randers Soil sample 20 cm from A1388, vertically 27.2, 23.8, 27.7, 22.5, 34.1,
27.2, 22.7, 29.926.9� 3.9
KLR-6355 Tjærby Ødekirke Randers A1377 Femur 29.2, 35.0, 24.4, 22.2, 20.5 26.3� 5.9KLR-6356-1 Tjærby Ødekirke Randers Soil sample 1 cm from A1377, horizontally 961, 1093, 1220, 951, 772 999� 170KLR-6356-2 Tjærby Ødekirke Randers Soil sample 1 cm from A1377, vertically 313, 927, 665, 1104, 472 696� 320KLR-6357-1 Tjærby Ødekirke Randers Soil sample 2 cm from A1377, horizontally 1877, 1261, 508, 689, 568, 1414 1050� 550KLR-6357-2 Tjærby Ødekirke Randers Soil sample 2 cm from A1377, vertically 148, 478, 69.5, 97.90, 345, 75.0 202� 170KLR-6358-1 Tjærby Ødekirke Randers Soil sample 5 cm from A1377, horizontally 334, 890, 894, 664, 409 638� 260KLR-6358-2 Tjærby Ødekirke Randers Soil sample 5 cm from A1377, vertically 58.8, 52.4, 35.3 48.8� 12KLR-6359-1 Tjærby Ødekirke Randers Soil sample 10 cm from A1377, horizontally 317, 339, 434, 479 392� 77KLR-6359-2 Tjærby Ødekirke Randers Soil sample 10 cm from A1377, vertically 28.6, 18.1, 28.8, 21.3, 21.8, 20.2 23.1� 4.5
Column 1, laboratory numbers; column 2, sample location (Od FF, Odense Franciscan Friary; Svb FF, Svendborg Franciscan Friary; Svb Sct. N, Svendborg Sct. Nicolai church; ØCA, Øm Cistercian Abbey); column 3, sample ID; column 4, description, including gender and age determination, type of grave, and visible signs of diseases (n.d.d., no discernable disease; column 5, Hg concentrations determined in at least three independent runs; column 6, average Hg concentration and �1 standard deviation.
-
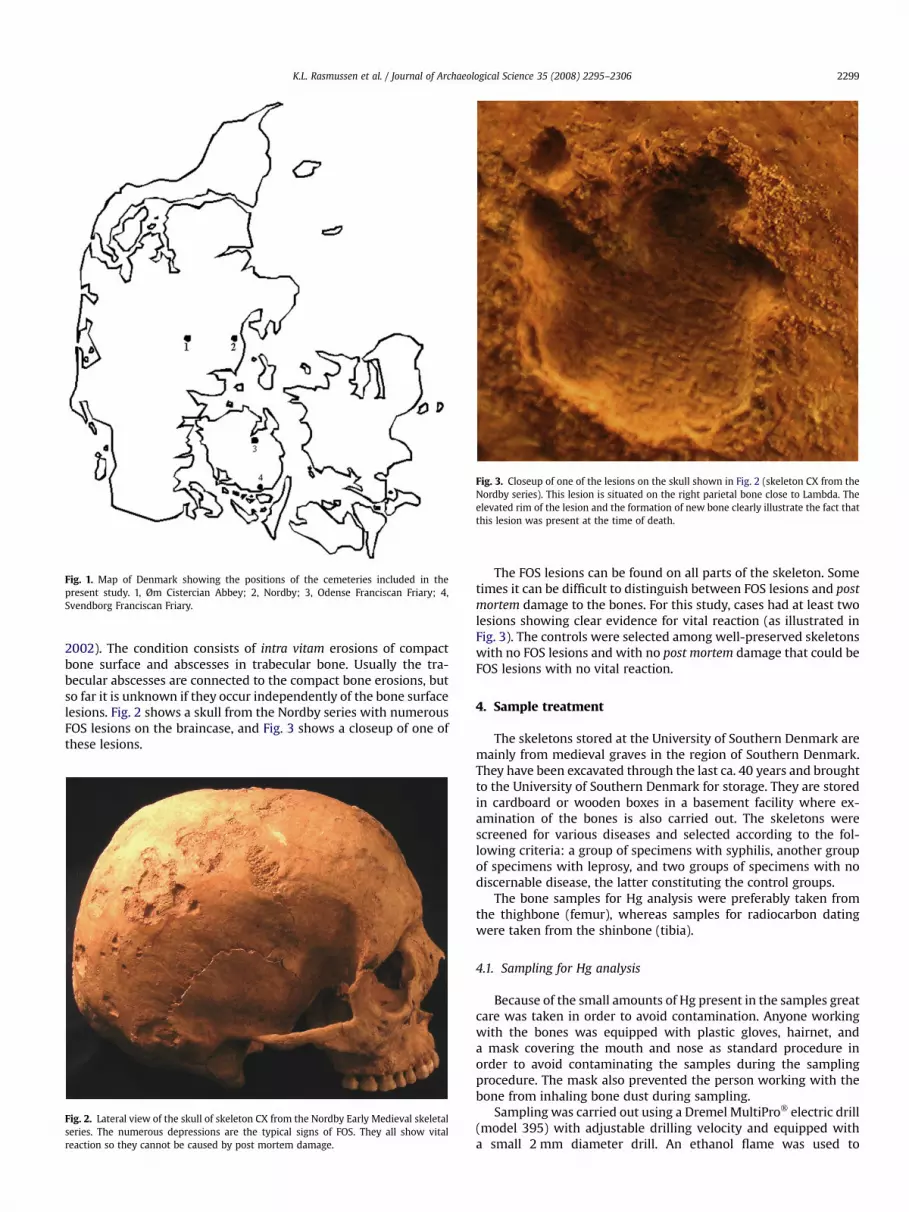
Fig. 1. Map of Denmark showing the positions of the cemeteries included in thepresent study. 1, Øm Cistercian Abbey; 2, Nordby; 3, Odense Franciscan Friary; 4,Svendborg Franciscan Friary.
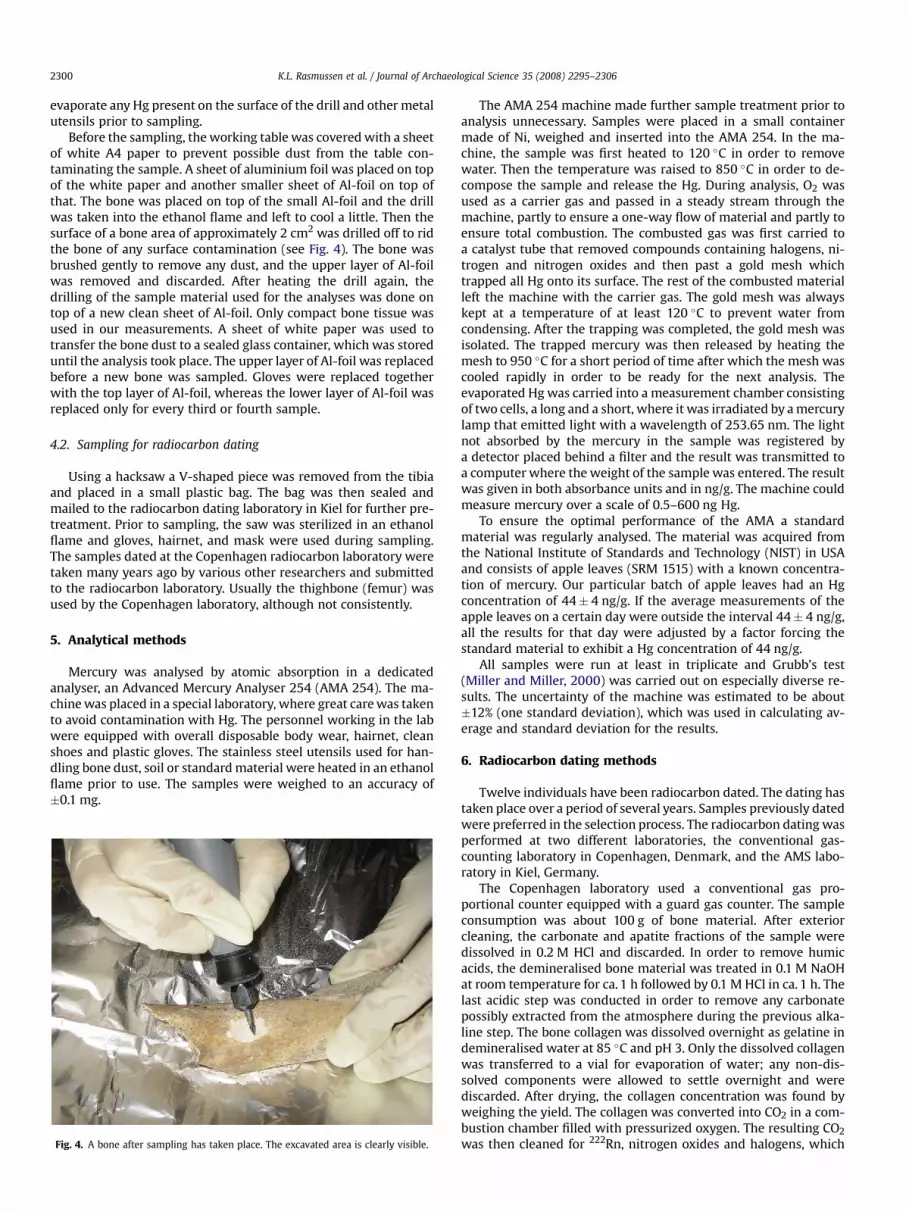
Fig. 3. Closeup of one of the lesions on the skull shown in Fig. 2 (skeleton CX from theNordby series). This lesion is situated on the right parietal bone close to Lambda. Theelevated rim of the lesion and the formation of new bone clearly illustrate the fact thatthis lesion was present at the time of death.
K.L. Rasmussen et al. / Journal of Archaeological Science 35 (2008) 2295–2306 2299
2002). The condition consists of intra vitam erosions of compactbone surface and abscesses in trabecular bone. Usually the tra-becular abscesses are connected to the compact bone erosions, butso far it is unknown if they occur independently of the bone surfacelesions. Fig. 2 shows a skull from the Nordby series with numerousFOS lesions on the braincase, and Fig. 3 shows a closeup of one ofthese lesions.
Fig. 2. Lateral view of the skull of skeleton CX from the Nordby Early Medieval skeletalseries. The numerous depressions are the typical signs of FOS. They all show vitalreaction so they cannot be caused by post mortem damage.
The FOS lesions can be found on all parts of the skeleton. Sometimes it can be difficult to distinguish between FOS lesions and postmortem damage to the bones. For this study, cases had at least twolesions showing clear evidence for vital reaction (as illustrated inFig. 3). The controls were selected among well-preserved skeletonswith no FOS lesions and with no post mortem damage that could beFOS lesions with no vital reaction.
4. Sample treatment
The skeletons stored at the University of Southern Denmark aremainly from medieval graves in the region of Southern Denmark.They have been excavated through the last ca. 40 years and broughtto the University of Southern Denmark for storage. They are storedin cardboard or wooden boxes in a basement facility where ex-amination of the bones is also carried out. The skeletons werescreened for various diseases and selected according to the fol-lowing criteria: a group of specimens with syphilis, another groupof specimens with leprosy, and two groups of specimens with nodiscernable disease, the latter constituting the control groups.
The bone samples for Hg analysis were preferably taken fromthe thighbone (femur), whereas samples for radiocarbon datingwere taken from the shinbone (tibia).
4.1. Sampling for Hg analysis
Because of the small amounts of Hg present in the samples greatcare was taken in order to avoid contamination. Anyone workingwith the bones was equipped with plastic gloves, hairnet, anda mask covering the mouth and nose as standard procedure inorder to avoid contaminating the samples during the samplingprocedure. The mask also prevented the person working with thebone from inhaling bone dust during sampling.
Sampling was carried out using a Dremel MultiPro� electric drill(model 395) with adjustable drilling velocity and equipped witha small 2 mm diameter drill. An ethanol flame was used to
K.L. Rasmussen et al. / Journal of Archaeological Science 35 (2008) 2295–23062300
evaporate any Hg present on the surface of the drill and other metalutensils prior to sampling.
Before the sampling, the working table was covered with a sheetof white A4 paper to prevent possible dust from the table con-taminating the sample. A sheet of aluminium foil was placed on topof the white paper and another smaller sheet of Al-foil on top ofthat. The bone was placed on top of the small Al-foil and the drillwas taken into the ethanol flame and left to cool a little. Then thesurface of a bone area of approximately 2 cm2 was drilled off to ridthe bone of any surface contamination (see Fig. 4). The bone wasbrushed gently to remove any dust, and the upper layer of Al-foilwas removed and discarded. After heating the drill again, thedrilling of the sample material used for the analyses was done ontop of a new clean sheet of Al-foil. Only compact bone tissue wasused in our measurements. A sheet of white paper was used totransfer the bone dust to a sealed glass container, which was storeduntil the analysis took place. The upper layer of Al-foil was replacedbefore a new bone was sampled. Gloves were replaced togetherwith the top layer of Al-foil, whereas the lower layer of Al-foil wasreplaced only for every third or fourth sample.
4.2. Sampling for radiocarbon dating
Using a hacksaw a V-shaped piece was removed from the tibiaand placed in a small plastic bag. The bag was then sealed andmailed to the radiocarbon dating laboratory in Kiel for further pre-treatment. Prior to sampling, the saw was sterilized in an ethanolflame and gloves, hairnet, and mask were used during sampling.The samples dated at the Copenhagen radiocarbon laboratory weretaken many years ago by various other researchers and submittedto the radiocarbon laboratory. Usually the thighbone (femur) wasused by the Copenhagen laboratory, although not consistently.
5. Analytical methods
Mercury was analysed by atomic absorption in a dedicatedanalyser, an Advanced Mercury Analyser 254 (AMA 254). The ma-chine was placed in a special laboratory, where great care was takento avoid contamination with Hg. The personnel working in the labwere equipped with overall disposable body wear, hairnet, cleanshoes and plastic gloves. The stainless steel utensils used for han-dling bone dust, soil or standard material were heated in an ethanolflame prior to use. The samples were weighed to an accuracy of�0.1 mg.
Fig. 4. A bone after sampling has taken place. The excavated area is clearly visible.
The AMA 254 machine made further sample treatment prior toanalysis unnecessary. Samples were placed in a small containermade of Ni, weighed and inserted into the AMA 254. In the ma-chine, the sample was first heated to 120 �C in order to removewater. Then the temperature was raised to 850 �C in order to de-compose the sample and release the Hg. During analysis, O2 wasused as a carrier gas and passed in a steady stream through themachine, partly to ensure a one-way flow of material and partly toensure total combustion. The combusted gas was first carried toa catalyst tube that removed compounds containing halogens, ni-trogen and nitrogen oxides and then past a gold mesh whichtrapped all Hg onto its surface. The rest of the combusted materialleft the machine with the carrier gas. The gold mesh was alwayskept at a temperature of at least 120 �C to prevent water fromcondensing. After the trapping was completed, the gold mesh wasisolated. The trapped mercury was then released by heating themesh to 950 �C for a short period of time after which the mesh wascooled rapidly in order to be ready for the next analysis. Theevaporated Hg was carried into a measurement chamber consistingof two cells, a long and a short, where it was irradiated by a mercurylamp that emitted light with a wavelength of 253.65 nm. The lightnot absorbed by the mercury in the sample was registered bya detector placed behind a filter and the result was transmitted toa computer where the weight of the sample was entered. The resultwas given in both absorbance units and in ng/g. The machine couldmeasure mercury over a scale of 0.5–600 ng Hg.
To ensure the optimal performance of the AMA a standardmaterial was regularly analysed. The material was acquired fromthe National Institute of Standards and Technology (NIST) in USAand consists of apple leaves (SRM 1515) with a known concentra-tion of mercury. Our particular batch of apple leaves had an Hgconcentration of 44� 4 ng/g. If the average measurements of theapple leaves on a certain day were outside the interval 44� 4 ng/g,all the results for that day were adjusted by a factor forcing thestandard material to exhibit a Hg concentration of 44 ng/g.
All samples were run at least in triplicate and Grubb’s test(Miller and Miller, 2000) was carried out on especially diverse re-sults. The uncertainty of the machine was estimated to be about�12% (one standard deviation), which was used in calculating av-erage and standard deviation for the results.
6. Radiocarbon dating methods
Twelve individuals have been radiocarbon dated. The dating hastaken place over a period of several years. Samples previously datedwere preferred in the selection process. The radiocarbon dating wasperformed at two different laboratories, the conventional gas-counting laboratory in Copenhagen, Denmark, and the AMS labo-ratory in Kiel, Germany.
The Copenhagen laboratory used a conventional gas pro-portional counter equipped with a guard gas counter. The sampleconsumption was about 100 g of bone material. After exteriorcleaning, the carbonate and apatite fractions of the sample weredissolved in 0.2 M HCl and discarded. In order to remove humicacids, the demineralised bone material was treated in 0.1 M NaOHat room temperature for ca. 1 h followed by 0.1 M HCl in ca. 1 h. Thelast acidic step was conducted in order to remove any carbonatepossibly extracted from the atmosphere during the previous alka-line step. The bone collagen was dissolved overnight as gelatine indemineralised water at 85 �C and pH 3. Only the dissolved collagenwas transferred to a vial for evaporation of water; any non-dis-solved components were allowed to settle overnight and werediscarded. After drying, the collagen concentration was found byweighing the yield. The collagen was converted into CO2 in a com-bustion chamber filled with pressurized oxygen. The resulting CO2
was then cleaned for 222Rn, nitrogen oxides and halogens, which

K.L. Rasmussen et al. / Journal of Archaeological Science 35 (2008) 2295–2306 2301
could potentially affect the counting. A small subsample of the gaswas extracted and measured for the stable isotope ratio, d13C, inorder to correct the date for any isotopic fractionation that couldhave taken place in ancient times or in the laboratory during pre-treatment.
At the Leibniz Labor fur Altersbestimmung in Kiel, Germany, thecollagen content was first calculated from the concentration ofnitrogen, determined by a colorimetric method as nitrate in a ca.2 mg subsample of bone material, and only the amount of boneneeded for a good AMS sample (0.5–2 g of bone) was sampled afterexterior cleaning of the bone. The bone sample was crushed to 0.5–2 mm pieces to facilitate demineralisation and first treated withacetone, then rinsed with demineralised water to degrease. Thesample was subsequently treated in much the same way as in theCopenhagen laboratory: demineralised in ca. 1% HCl (0.3 M) untilconstant pH <1, washed with H2Odem till pH >4, humic acids re-moved for 1 h at room temperature with 1% NaOH (0.25 M), againwashing, extraction with 1% HCl (20 �C, 1 h), and finally washing tillpH >4 (Grootes et al., 2004). The bone collagen was dissolvedovernight as gelatine in demineralised water at 85 �C and pH 3. Thenon-soluble fraction, which may contain particulate contaminants,was filtered on a 0.45 mm pore silver filter. The gelatine solution wasfreeze-dried, and the gelatine was combusted into CO2 (Longin,1971).
6.1. Reservoir correction
Individuals who received a sizable portion of their diet from themarine food chain will exhibit a ‘‘reservoir age’’ corresponding tothe reduction in 14C concentration caused by the intake of fish andshellfish living in 14C depleted waters. Assuming a d13C of �19.8 fora purely terrestrial diet and �10.9 for a purely ‘‘marine’’ diet anda standard reservoir age of 410 years, the correction for reservoireffect can calculated as:
Kreservoir ¼ 410��
19:8þ d13Csample
�.8:914C-years (1)
This formula was used to calculate marine reservoir correction onhuman bone samples by the Copenhagen Radiocarbon Laboratoryduring the last 10 years of the laboratory’s existence (see e.g. Ras-mussen, 2000,in press). This value is then subtracted from theconventional radiocarbon age prior to calibration. The calibration isperformed using the 2004 curves and the Groningen Calib programversion 5.0.1 (Reimer et al., 2004).
In the Middle Ages (the Catholic period) the Cistercians were inprinciple not allowed to eat meat from four-footed animals. Thismeant that when they obeyed the rule, they mainly ate fish. TheFranciscans were probably more pragmatic, but as a main rule allmedieval people were expected to fast ca. one-third of the year(although some people mostly cheated on this). Fish was not servedevery day, but quite often. Medieval people preferred freshwaterfish to saltwater species, and abbey people most likely ate evenmore freshwater fish than the common population, who wereforced to eat a majority of saltwater fish. Such an intake of fresh-water fish can constitute a problem for the radiocarbon datingtechnique, because it is well known that freshwater fish can exhibita large reservoir effect. In the inland lake Tissø on Sealand, Den-mark, for example, an average freshwater reservoir effect of1034 years has been reported (Fischer and Heinemeier, 2003), andin the interior of the Danish fjords an average reservoir effect of634 years has been observed (Heier-Nielsen et al., 1995). Thesevalues are considerably higher than the open marine value of ca.410 years normally used in Danish waters, a value on which Eq. (1)is also based. Moreover, the d13C values used as an indication of thefraction of marine carbon in the diet (less negative taken as moremarine) become meaningless in this respect when freshwater fish
is involved. A freshwater reservoir effect, i.e. larger than 410 years,can probably be ruled out for the dates of individuals fromSvendborg, as the town is situated on the coastline and does nothave large freshwater systems in its vicinity. For the individualsfrom Øm, there could well be a potential problem, as Øm is situatednear a large freshwater system and a fairly long distance from thesea. The freshwater system consists of Denmark’s second largestlake, Mossø, which is connected to other large lakes via the Gudenåsmall river system. However, only one individual from Øm (8.K)exhibited a significant reservoir effect. The calibrated date for thissample may therefore be artificially too old. For the other samplesfrom Øm, the reservoir correction is so small that the dates cannotbe significantly affected, even if there was an increased freshwaterreservoir effect.
After the Reformation, the lent largely disappeared, and there isnowhere near the same reservoir effect problem, although somespecial social circles maintained a preference for freshwater fish fora while after the Reformation in 1536.
7. Results
7.1. Radiocarbon dating
The radiocarbon dating results are given in Table 2. In additionto the collagen, the Kiel AMS laboratory also dated the ‘bone rest’fraction, i.e. the non-dissolved organic part of the bone remainingon the filter after filtering the gelatinized collagen. The ‘bone rest’fraction consists of non-gelatinizable bone organics, but may alsocomprise organic matter originating from other parts of the humanbody being decomposed or polymerized. In this case, the non-dissolved part poses no problem regarding the radiocarbon dating;collagen and bone rest give the same age. The insoluble fractionmay, however, also stem from polymerized conservational fluids,lacquer applied to make a basis for writing museum numbers on, orparticles of organic matter invading the porous bone structuremany years after interment. This could lead to age differences be-tween collagen and the rest.
The results of the ‘bone rest’ dating are given in Table 2. The agedifference between the collagen and the ‘bone rest’ is not statisti-cally significant for KIA-29656 and 29660. These samples were thusnot significantly contaminated and the age is in this respect reli-able. For KIA-29657 and 29658 the ‘bone rest’ is significantly older,indicating the presence of an older non-soluble contaminant,which could stem either from particles invading the bone from theenvironment of the human body or from polymerised conserva-tional fluids derived from radiocarbon-void crude oil products. Theproblem arises if some of this fraction is included in the datedcollagen sample. This could conceivably happen if, e.g. the particlesizes of the contaminant were smaller than 0.45 mm, or the settlingwas incomplete. However, as the filtering and settling of the col-lagen fraction, dissolved as gelatine, removes the non-solublecontaminants from the collagen and enriches them in the boneresidue fraction, and the residue contained only 10% and 2% of thecarbon recovered for KIA-29657 and 29658, respectively, one mayexpect the residue age to be much more influenced. In view of theobserved age differences, the age of the collagen fraction should bereliable. It is, however, somewhat disturbing that it is preciselythese two samples that have slightly less negative d13C values thanthe rest of the samples from Øm Friary. The d13C values weremeasured at �17.5 and �19.6& VPDB in KIA-29657 and 29658,respectively. A d13C value near �17.5& VPDB is, however, not un-usual amongst Danish medieval bones, as devout Catholics tradi-tionally ate fish in the lent period if not more often. We thus believethat the collagen date probably is trustworthy.
The Copenhagen laboratory did not attempt to assess thepresence of contaminants in this way. However, the Copenhagen
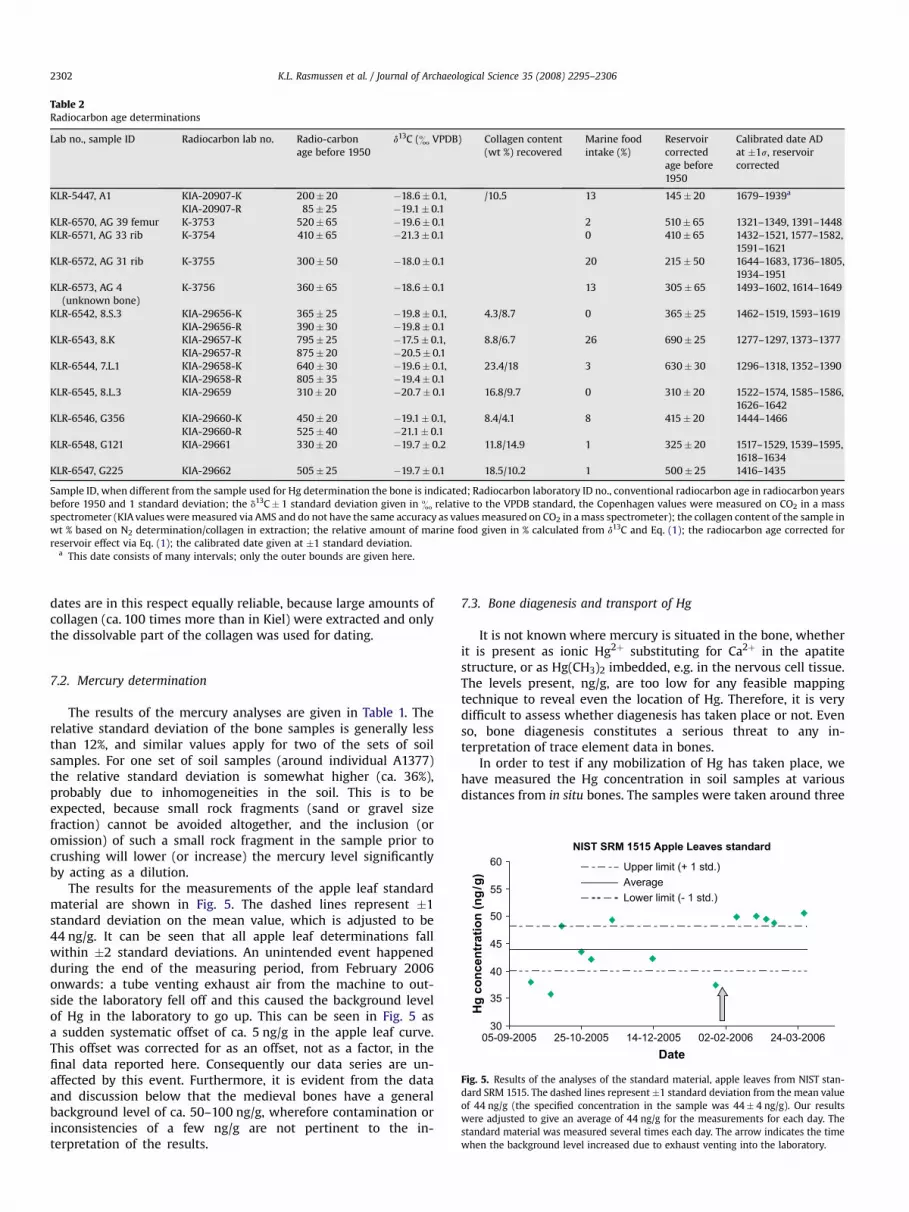
Table 2Radiocarbon age determinations
Lab no., sample ID Radiocarbon lab no. Radio-carbonage before 1950
d13C (& VPDB) Collagen content(wt %) recovered
Marine foodintake (%)
Reservoircorrectedage before1950
Calibrated date ADat �1s, reservoircorrected
KLR-5447, A1 KIA-20907-KKIA-20907-R
200� 2085� 25
�18.6� 0.1,�19.1� 0.1
/10.5 13 145� 20 1679–1939a
KLR-6570, AG 39 femur K-3753 520� 65 �19.6� 0.1 2 510� 65 1321–1349, 1391–1448KLR-6571, AG 33 rib K-3754 410� 65 �21.3� 0.1 0 410� 65 1432–1521, 1577–1582,
1591–1621KLR-6572, AG 31 rib K-3755 300� 50 �18.0� 0.1 20 215� 50 1644–1683, 1736–1805,
1934–1951KLR-6573, AG 4
(unknown bone)K-3756 360� 65 �18.6� 0.1 13 305� 65 1493–1602, 1614–1649
KLR-6542, 8.S.3 KIA-29656-KKIA-29656-R
365� 25390� 30
�19.8� 0.1,�19.8� 0.1
4.3/8.7 0 365� 25 1462–1519, 1593–1619
KLR-6543, 8.K KIA-29657-KKIA-29657-R
795� 25875� 20
�17.5� 0.1,�20.5� 0.1
8.8/6.7 26 690� 25 1277–1297, 1373–1377
KLR-6544, 7.L.1 KIA-29658-KKIA-29658-R
640� 30805� 35
�19.6� 0.1,�19.4� 0.1
23.4/18 3 630� 30 1296–1318, 1352–1390
KLR-6545, 8.L.3 KIA-29659 310� 20 �20.7� 0.1 16.8/9.7 0 310� 20 1522–1574, 1585–1586,1626–1642
KLR-6546, G356 KIA-29660-KKIA-29660-R
450� 20525� 40
�19.1� 0.1,�21.1� 0.1
8.4/4.1 8 415� 20 1444–1466
KLR-6548, G121 KIA-29661 330� 20 �19.7� 0.2 11.8/14.9 1 325� 20 1517–1529, 1539–1595,1618–1634
KLR-6547, G225 KIA-29662 505� 25 �19.7� 0.1 18.5/10.2 1 500� 25 1416–1435
Sample ID, when different from the sample used for Hg determination the bone is indicated; Radiocarbon laboratory ID no., conventional radiocarbon age in radiocarbon yearsbefore 1950 and 1 standard deviation; the d13C� 1 standard deviation given in & relative to the VPDB standard, the Copenhagen values were measured on CO2 in a massspectrometer (KIA values were measured via AMS and do not have the same accuracy as values measured on CO2 in a mass spectrometer); the collagen content of the sample inwt % based on N2 determination/collagen in extraction; the relative amount of marine food given in % calculated from d13C and Eq. (1); the radiocarbon age corrected forreservoir effect via Eq. (1); the calibrated date given at �1 standard deviation.
a This date consists of many intervals; only the outer bounds are given here.
K.L. Rasmussen et al. / Journal of Archaeological Science 35 (2008) 2295–23062302
dates are in this respect equally reliable, because large amounts ofcollagen (ca. 100 times more than in Kiel) were extracted and onlythe dissolvable part of the collagen was used for dating.
NIST SRM 1515 Apple Leaves standard
30
35
40
45
50
55
60
05-09-2005 25-10-2005 14-12-2005 02-02-2006 24-03-2006Date
Hg
co
ncen
tratio
n (n
g/g
)
Upper limit (+ 1 std.)AverageLower limit (- 1 std.)
Fig. 5. Results of the analyses of the standard material, apple leaves from NIST stan-dard SRM 1515. The dashed lines represent �1 standard deviation from the mean valueof 44 ng/g (the specified concentration in the sample was 44� 4 ng/g). Our resultswere adjusted to give an average of 44 ng/g for the measurements for each day. Thestandard material was measured several times each day. The arrow indicates the timewhen the background level increased due to exhaust venting into the laboratory.
7.2. Mercury determination
The results of the mercury analyses are given in Table 1. Therelative standard deviation of the bone samples is generally lessthan 12%, and similar values apply for two of the sets of soilsamples. For one set of soil samples (around individual A1377)the relative standard deviation is somewhat higher (ca. 36%),probably due to inhomogeneities in the soil. This is to beexpected, because small rock fragments (sand or gravel sizefraction) cannot be avoided altogether, and the inclusion (oromission) of such a small rock fragment in the sample prior tocrushing will lower (or increase) the mercury level significantlyby acting as a dilution.
The results for the measurements of the apple leaf standardmaterial are shown in Fig. 5. The dashed lines represent �1standard deviation on the mean value, which is adjusted to be44 ng/g. It can be seen that all apple leaf determinations fallwithin �2 standard deviations. An unintended event happenedduring the end of the measuring period, from February 2006onwards: a tube venting exhaust air from the machine to out-side the laboratory fell off and this caused the background levelof Hg in the laboratory to go up. This can be seen in Fig. 5 asa sudden systematic offset of ca. 5 ng/g in the apple leaf curve.This offset was corrected for as an offset, not as a factor, in thefinal data reported here. Consequently our data series are un-affected by this event. Furthermore, it is evident from the dataand discussion below that the medieval bones have a generalbackground level of ca. 50–100 ng/g, wherefore contamination orinconsistencies of a few ng/g are not pertinent to the in-terpretation of the results.
7.3. Bone diagenesis and transport of Hg
It is not known where mercury is situated in the bone, whetherit is present as ionic Hg2þ substituting for Ca2þ in the apatitestructure, or as Hg(CH3)2 imbedded, e.g. in the nervous cell tissue.The levels present, ng/g, are too low for any feasible mappingtechnique to reveal even the location of Hg. Therefore, it is verydifficult to assess whether diagenesis has taken place or not. Evenso, bone diagenesis constitutes a serious threat to any in-terpretation of trace element data in bones.
In order to test if any mobilization of Hg has taken place, wehave measured the Hg concentration in soil samples at variousdistances from in situ bones. The samples were taken around three

K.L. Rasmussen et al. / Journal of Archaeological Science 35 (2008) 2295–2306 2303
individuals at the deserted cemetery at Tjærby Ødekirke nearRanders in Denmark. Samples were taken both vertically below andhorizontally at distances of 1, 2, 5, 10, and if possible 20 cm from thefemur surface. The results of the analyses are shown in Fig. 6. Thepoints at distance 0 cm are measurements of the bone itself.
The three graphs of Fig. 6 look very different. In each case,however, the horizontally and vertically distributed samples showprincipally the same pattern. It should be noted that the samples at1, 2, and possibly 5 cm are likely to reflect the Hg content of whatwas once the soft tissue, whereas the samples at 10 and 20 cmreflect the Hg content of the surrounding soil. The question iswhether some Hg has been mobilized from the bone and/or the softtissue and diffused into the soil, or whether Hg from the soil hasinvaded the tissue/bone.
In A1416, the bone is significantly higher in Hg than the tissue-affected soil and the more distant soil. In A1388, the situation isreversed: here the bone Hg value is only ca. half that of the soilsamples. In A1377 the bone sample exhibits a very much lower Hgvalue (26 ng/g) than the extremely enriched close surroundings ofthe soft tissue (1100 ng/g). However, the most distant soil sample inthe vertical direction is almost equal to the bone itself (24 ng/g),whereas the most distant soil sample in the horizontal direction ishigher than the bone sample, but lower than the immediate sur-rounds (410 ng/g).
First, it should be noted that the graves in a medieval cemeteryare spaced so close together that interference from neighbouringgraves cannot be excluded. Sometimes undisturbed samples canonly be sampled 10 cm, but not 20 cm away from the femur. Thisfact may introduce noise in our data. Second, there could con-ceivably be alternative Hg sources in the clothing or the coffin.
Tjærby A1377
0200400600800
10001200
0 5 10 15 20Distance from bone (cm)
0 5 10 15 20Distance from bone (cm)
0 5 10 15 20Distance from bone (cm)
Hg
co
ncen
tratio
n
(n
g/g
)
Hg
co
ncen
tratio
n
(n
g/g
)
Hg
co
ncen
tratio
n
(n
g/g
)
Horizontal Vertical
Horizontal Vertical
Horizontal Vertical
Tjærby A1388
010203040506070
Tjærby A1416
010203040506070
a
b
c
Fig. 6. Results of the mercury determinations in the soil samples taken at 1, 2, 5, 10,and 20 cm both horizontally and vertically (downwards) from the femur of threedifferent individuals: a, A1377; b, A1388; c, A1416.
Having these caveats in mind, we will, however, suggest an in-terpretation of the soil data. A1416 could be an individual who hadbeen exposed to large Hg levels earlier in his life, now reflected inhigh Hg value in the bone, and to lower Hg levels late in his life, nowreflected in the low Hg values in the tissue. A1388 could be an in-dividual who had experienced slightly lower Hg levels earlier in hislife (slightly low bone value), and slightly higher Hg levels latein his life (higher tissue values). Alternatively, the Hg from thesurrounding soil could have infiltrated the tissue-affected zone. ForA1377 the interpretation could be that he had only been exposed tobackground levels earlier in his life, but at a time very close to hisdeath, he experienced a large intake of Hg, possibly from the ad-ministration of Hg-containing medicine.
Whether or not these interpretations are indeed correct, it canbe concluded from the three cases that no systematic transport hastaken place with Hg leaving the bone material. Likewise, it can beexcluded that systematic transport of Hg from the surrounding soilinto the bones took place in this cemetery. This leads to the con-clusion that we see no evidence for bone diagenesis related tomercury having taken place in this typical Danish medievalcemetery.
8. Discussion
8.1. Syphilis
Mercury administered as vapour – and most likely as skin tonicas well – was used in late medieval times as a cure for syphilis. Fig. 7shows the mercury levels in the individuals in the control groupand in the individuals with discernable signs of syphilis on the bonematerial, plus three individuals diagnosed to have FOS. For obviousreasons not all victims of syphilis did receive medical treatment, soit must be expected that a certain fraction of the individuals withsyphilis symptoms exhibit only background levels of mercury.
From the data shown in Fig. 7a (the control group) we can de-duce the average bone mercury concentration in individuals notexposed to unusually high levels of mercury. However, it is likelythat a person not affected by syphilis could still be exposed to Hg,e.g. a monk tending the sick and administering Hg-containingmedicine to others, a pharmacist producing the medicine ora novice preparing red ink for illuminating manuscripts. Likewise, itis possible that individuals in the control groups could have suf-fered from syphilis or other diseases that do not show up on thebone material, but on the other hand were severe enough to haveprompted treatment with mercury-containing medicine. One ofthese alternatives seems to have been the case for G124, who ismarkedly higher in Hg than the rest of the control group. If we,therefore, exclude G124, the average Hg content of the rest of thecontrol group becomes 53� 30 ng/g. Thus, judging from thisnumber, in the data shown in Fig. 7b, six individuals show in-creased mercury levels high enough to suggest that they weretreated with mercury-containing medicine (G13, G28, G62, G165,G205, and A1). The data from our limited study therefore suggeststhat 40�16% (¼ 6/15�100%) of the Danish population affectedwith syphilis severely enough to show up on the bone materialreceived treatment with Hg-containing compounds.
8.2. Leprosy
Since it is well known that syphilis was treated with Hg-con-taining compounds in Late Medieval times, we thought it worth-while to test if Hg was also used to treat other skin accentuateddiseases such as leprosy, which was dominant in Early Medievaltimes. Fourteen samples from individuals with symptoms of lep-rosy were measured. The data of these and the control group areshown in Fig. 8.

Syphilis control samples
G 1
7
G 2
5
G 2
7
G 7
7
G 9
2
G 1
24
G 1
46
G 1
55 G 1
71
G 1
80
G 2
30
G 3
41
G 4
19
G 4
21
G 4
23
G 4
52
G 4
91
0
100
200
300
400
500
600
Hg
co
ncen
tratio
n (n
g/g
)
Syphilis
G 4
G 4
(H)
G 1
3
G 1
4 G 6
2
G 1
65
G 1
70
G 1
70 (H
)
G 2
05 (H
)
G 2
41 (H
)
G 2
69
G 4
80
G 4
80 (H
)
5.A VIIIa
CX ES FF A 1
0
100
200
300
400
500
600
Hg
co
ncen
tratio
n (n
g/g
)
G 2
8 (H
)
a
b
Fig. 7. (a) Results of the mercury determination of the control group showing no signs of syphilis from the laymen’s cemetery at the Franciscan Friary at Odense. Light blue colourindicates females, dark blue males. (b) Results of the mercury determination of the group of individuals exhibiting clear signs of syphilis on their bones, plus five individuals havingbeen diagnosed to have Morbus Nordby (5.A, VIIIa, CX, ES, and FF). H in parentheses means that the sample was taken from humerus; all other samples were taken from femur. Lightblue indicates females, dark blue males. The samples are from the Franciscan Friary at Odense (suffix G), the Cistercian Abbey at Øm (5.A and VIIIa), the cemetery of Nordby (CX, ES,and FF), and finally the cemetery of Sct. Nicolai Church in Svendborg (A1).
K.L. Rasmussen et al. / Journal of Archaeological Science 35 (2008) 2295–23062304
All the individuals in the control group seem to be completelyunaffected by Hg. The average Hg concentration in the controlgroup is 34�15 ng/g. Judging from this background level 11 out ofthe 14 individuals affected by leprosy were treated with Hg-con-taining medicine. This is as many as 79� 24%. This high incidenceof Hg-treated leprosy cases must be seen in the context that 11 of
Leprosy co
4.A.
5
4.H 5.
H.5
5.K 5.O
.5
7.A
0
100
200
300
400
500
600
Hg
co
nce
ntratio
n (n
g/g
)
Le
XIII 4.K.
3 4.M
7.L.
1
8.C
.6 8.K 8.
L.3
0
100
200
300
400
500
600
Hg
co
ncen
tratio
n (n
g/g
)
a
b
Fig. 8. (a) Results of the mercury determination of the control group showing no signs of lepfemales, red males, and white non-determined sex (a 12–18 year old juvenile). (b) Results osamples are from the Cistercian Abbey at Øm (the first 11) and from the Franciscan Friary
these individuals were exhumed at the cemetery of the CistercianAbbey of Øm, which is known to have been highly educated, also inthe realm of medicine.
It seems that syphilis was introduced in Europe sometimeshortly after America was discovered in AD 1492. At least we havenever encountered any cases of syphilis that have been radiocarbon
ntrol samples
7.U
.5
8.B.
2
8.F.
1
8.O
.3
8.P.
1
9.E
prosy
8.S.
3
8.T.
3 8.U
.3
8.Æ
.2
G 1
21
G 2
25
G 3
56
rosy from the laymen’s cemetery at the Cistercian Abbey at Øm. Orange colour indicatesf the mercury determination of the group of individuals showing signs of leprosy. The
at Odense (the last three). Orange colour indicates females, red males.

K.L. Rasmussen et al. / Journal of Archaeological Science 35 (2008) 2295–2306 2305
dated to a date significantly older than 1492. It also seems that thedisease was very virulent right from the start and that syphilis tookup much of the niche previously occupied by leprosy. In a very shorttime, syphilis became dominant and leprosy almost vanished. Itwas an aim of this study to test the assumption that syphilis tookover more or less completely from leprosy at around 1500, i.e. canwe identify any individuals showing certain signs of leprosy, whichradiocarbon date to a time after 1492. The answer to this question isthat two out of seven cases of leprosy treated with Hg-containingmedicine are definitely after AD 1492 (G121 and 8.L.3). Therefore,our study shows that leprosy also thrived after the onset of syphilis,at least some time after AD 1500.
8.3. ‘FOS’: Morbus Nordby
Few diseases besides syphilis and leprosy can be revealed by thebone material, but Morbus Nordby or ‘FOS’ is one. Three samplesexhibiting signs of FOS from Nordby Church were analysed (CX, ES,and FF), but none of them exhibited Hg levels in excess of thebackground. Therefore, from this limited data set it seems that FOSwas not treated with mercury-containing medicine. This could bebecause the disease did not have a distinct expression on the skin ofthe victim. An alternative reason for the absence of excess Hg inthese individuals could be that the community around the smallNordby Church was too poor for people to have access to mercury-containing medicine.
8.4. Access to the scriptorium or administration of medicine
The investigation of the friars exhumed in the cloister walk ofSvendborg Franciscan Friary and monks from the cloister walk ofthe Cistercian Abbey in Øm reveal interesting results.
The data from the control group at the laymen cemetery atSvendborg Franciscan Friary show signs of elevated mercury levels
Laymen Svendborg
AG3 AG
4
AG18
AG31
AG33
AG39 AG
54 AG55
AG56
AG74
AG93
AG10
4
0
100
200
300
400
500
600
Hg
co
nce
ntratio
n (n
g/g
)
Friars Svendborg
IIB10
IIB11
IIB12
IIIA3 IIIA4
IIIA1
0
IIIA1
1
IIIA1
4
IIIB7
IIIB8
IIIB9 IIIAC
1
IIIAC
12
0
100
200
300
400
500
600
Hg
co
ncen
tratio
n (n
g/g
)
a
b
Fig. 9. (a) Results of the mercury determination of the control group from the laymen’scemetery at the Franciscan Friary at Svendborg. (b) Results of the mercury de-termination of the monks interred in the cloister walk at the Franciscan Friary atSvendborg.
in three of the individuals (AG4, AG55, and AG104, see Fig. 9a). Theaverage Hg concentration of the other nine individuals is35� 24 ng/g. The data for burials in the cloister walk (Fig. 9b)show only one individual with elevated Hg concentration (IIB12).The average Hg value of the other 12 individuals from the cloisterwalk is 28� 23 ng/g, which is statistically identical to the levelfrom the laymen cemetery. Thus in Svendborg Franciscan Friary,the friars are even less affected than the laymen. Only one in-dividual showed an increased Hg level, whereas in the laymencemetery in Svendborg three individuals showed somewhat in-creased levels of Hg.
In the control group at the Cistercian Abbey at Øm, consisting often individuals interred at the lay cemetery (Fig. 10a), two areslightly higher in Hg than the others, but the differences are sosmall, that we choose to interpret all of them as non-affected. TheHg concentration in the laymen cemetery at the Abbey of Øm isthus calculated to be 56� 33 ng/g. The data from the cloister walkburials at Øm show, however, significantly elevated mercury levelsin five of the 13 monks included in this study (Fig. 10b). The Hg-affected individuals are 6.F, 6.K, GBC, GED, and GEE. Five individualsout of a total of 13 is 38� 17% (¼ 5/13�100%). This is a surprisinglyhigh number, and is in distinct contrast to the lack of Hg-affectedfriars in the cloister walk at the Svendborg Franciscan Friary.
There can be at least two explanations for the difference be-tween Øm and Svendborg. One could be that precisely these fivemonks had long time access to the scriptorium in the Abbey of Øm,and ingested Hg from the red ink used in the scriptorium. The Hgcould either be in the form of solid HgS, Hg0 vapour from heatingHgS, or methyl-mercury from bacterial decomposition of HgS. Analternative explanation could be that the monks exhibiting high Hgvalues were active in the preparation of Hg-containing medicine inthe hospital of the Abbey. In any event, the mercury introducingactivity must have been an activity that took place at Øm and not inSvendborg.
Laymen Øm
7.K.
4
7.K.
5
7.N
.4
7.O
.4
7.U
.4
8.D
.1 8.E.
2
8.F.
1
8.L.
1
8.V
0
100
200
300
400
500
600
Hg
co
ncen
tratio
n (n
g/g
)
Monks Øm
A257
6.F
6.K
6.L
41.C
GBC
GBE
GBG GBH
GBK G
CA
GED G
EE
0
100
200
300
400
500
600
Hg
co
ncen
tratio
n (n
g/g
)
a
b
Fig. 10. (a) Results of the mercury determination of the control group from thelaymen’s cemetery at the Cistercian Abbey at Øm. (b) Results of the mercurydetermination of the monks interred in the cloister walk at the Cistercian Abbey at Øm.

K.L. Rasmussen et al. / Journal of Archaeological Science 35 (2008) 2295–23062306
Cistercians were not allowed to illuminate their incunabula withpictures, but they were allowed to illuminate starting letters, andthey would therefore have used HgS extensively in their scripto-rium. However, from our knowledge of these monastic orders in theLate Middle Ages (ca. AD 1400–1536), where most of the sampledindividuals originate, one would probably expect a larger interestfor literary activities at the Franciscans than at the Cistercians. Inthe High Middle Ages (ca. AD 1200–1400), it might have beendifferent, but in the Late Middle Ages in Denmark the Franciscanswere more intellectually active than the Cistercians. This fact couldbe taken as an indication that it is more likely that the high Hglevels in the five individuals at Øm are due to medicine preparation,rather than derived from activities relating to preparing and usingink in the scriptorium. However, this is not a definitive proof. Ra-diocarbon datings of more individuals may help to resolve this is-sue by placing the individuals in the either the High Middle Age orthe Late Middle Age.
There are several factors relating to the dating of the bonematerial. In the period leading up to the Reformation in 1536, bookswere no longer written by hand but printed, and therefore themonastic use of red ink must have diminished. Although not sta-tistically significant our data seems to indicate that the backgroundlevel of Hg was higher in the control group for syphilis (53� 30 ng/g; see Fig. 7a), which is later than ca. 1500, than in the control groupfor leprosy (34�15 ng/g, see Fig. 8a), which is generally earlier thanca. AD 1500. As we have not systematically radiocarbon dated theindividuals exhibiting Hg background values, we do have in thissense – before and after 1500 – a dating system, which shows thatthe Hg levels seem to increase over time. This should be prioritizedin future studies.
9. Conclusions
We have measured Hg concentrations in medieval bone mate-rial from six different cemeteries in Denmark and from soil samplesin the vicinity of three individuals from one cemetery. Our dataexhibit no signs of bone diagenesis.
Our study shows that Hg was indeed used for treatment of bothsyphilis and leprosy in Late Medieval times.
We see evidence of increased Hg levels in monks interred in thecloister walk in the Cistercian Abbey of Øm, but no evidence forincreased Hg levels in friars buried in the cloister walk of theFranciscan Friary in Svendborg. This must reflect some differencesin the use of Hg. We suggest two explanations: either handling and/or using red ink (HgS) in the scriptorium at Øm, or most likely theproduction or administration of Hg-containing medicine in theAbbey hospital at Øm.
Acknowledgements
The Carlsberg Foundation is thanked for support. Lene Mollerupis thanked for help in connection with the bones from Øm. Ananonymous referee is thanked for constructive criticism.
References
Aufderheide, A.C., Rodriguez-Martin, C., 1998. The Cambridge Encyclopaedia ofHuman Paleopathology. Cambridge University Press, Cambridge.
Boldsen, J.L., 2005. Leprosy and mortality in the Medieval Danish village of Tirup.American Journal of Physical Anthropology 126, 159–168.
Boldsen, J.L., Freund, U.H., 2006. Osteological leprosy – epidemiology and diagnosis.Scandinavian Journal of Forensic Sciences 12, 7–12.
Boldsen, J.L., Mollerup, L., 2006. Outside St. Jørgen: leprosy in the medieval Danishcity of Odense. American Journal of Physical Anthropology 130, 344–351.
Elliott, T.A., Grime, G.W., 1993. Examining the diagenetic alteration of human bonematerial from a range of archaeological burial sites using nuclear microscopy.Nuclear Instruments & Methods in Physics Research B 77 (1-4), 537–547.
Fischer, A., Heinemeier, J., 2003. Freshwater reservoir effect in 14C dates of foodresidue on pottery. Radiocarbon 45 (3), 449–466.
Garcia, F., Ortega, A., Domingo, J.L., Corbella, J., 2001. Accumulation of metals inautopsy tissues of subjects living in Tarragona County, Spain. Journal of Envi-ronmental Science and Health. Part A. Toxic/Hazardous Substances & Environ-mental Engineering 36 (9), 1767–1786.
Geneser, F., 2004. Histologi – på Molekylærbiologisk Grundlag, first ed. Munks-gaard, Copenhagen, Denmark.
Grootes, P.M., Nadeau, M.-J., Rieck, A., 2004. 14C-AMS at the Leibniz-Labor:radiometric dating and isotope research. Nuclear Instruments and Methods B223-224, 55–61.
Hedges, R.E.M., 2002. Bone diagenesis: an overview of processes. Archaeometry 44(3), 319–328.
Hedges, R.E.M., Millard, A.R., 1995. Measurements and relationships of diageneticalteration of bone from three archaeological sites. Journal of ArchaeologicalScience 22, 201–209.
Heier-Nielsen, S., Heinemeier, J., Nielsen, H.L., Rud, N., 1995. Recent reservoir agesfor Danish fjords and marine waters. Radiocarbon 37 (3), 875–882.
Longin, R., 1971. New method of collagen extraction for radiocarbon dating. Nature230, 241–242.
Martinez-Garcia, M.J., Moreno, J.M., Moreno-Clavel, J., Vergara, N., Garcia-Sanchez, A., Guillamon, A., Porti, M., Moreno-Grau, S., 2005. Heavy metals inhuman bones in different historical epochs. Science of the Total Environment348 (1-3), 51–72.
Millard, A., 2006. Comment on Martinez-Garcia, et al. ‘‘Heavy metals in humanbones in different historical epochs’’. Science of the Total Environment 354 (2-3), 295–297.
Miller, J.N., Miller, J.C., 2000. Statistics and Chemometrics for Analytical Chemistry,fourth ed. Pearson Prentice Hall, Harlow, UK.
Nelson, D.A., Sauer, N.J., 1984. An evaluation of postdepositional changes in thetrace element content of human bone. American Antiquity 49 (1), 141–147.
Rasmussen, K.L., 2000. 14C-dateringer, København 1999. Arkæogiske ud-gravningeri Danmark 1999. Det Arkæologiske Nævn, Køben-havn, pp. 314–325.
Rasmussen, K.L., in press. Arkæometriske undersøgelser af Sct. Nicolai Kirke (inpreparation).
Skov, H., 2002. Hellig Nils’ Kilde. Skalk 2, 23–28.Yamada, M., Tohno, S., Tohno, Y., Minami, T., Ichii, M., Okazaki, Y., 1995. Accumu-
lation of mercury in excavated bones of two natives in Japan. Science of theTotal Environment 162 (2,3), 253–256.


