Embed Size (px)
Citation preview

This article appeared in a journal published by Elsevier. The attachedcopy is furnished to the author for internal non-commercial researchand education use, including for instruction at the authors institution
and sharing with colleagues.
Other uses, including reproduction and distribution, or selling orlicensing copies, or posting to personal, institutional or third party
websites are prohibited.
In most cases authors are permitted to post their version of thearticle (e.g. in Word or Tex form) to their personal website orinstitutional repository. Authors requiring further information
regarding Elsevier’s archiving and manuscript policies areencouraged to visit:
http://www.elsevier.com/copyright

Author's personal copy
Merging chironomid training sets: implications for palaeoclimate reconstructions
Naomi Holmes a,*, Peter G. Langdon b, Chris Caseldine a, Stephen J. Brooks c, H. John B. Birks d,e, f,g
a School of Geography, University of Exeter, Cornwall Campus, Treliever Road, Penryn TR10 9EZ, UKb School of Geography, University of Southampton, University Road, Southampton SO17 1BJ, UKcDepartment of Entomology, Natural History Museum, Cromwell Road, London SW7 5BD, UKdDepartment of Biology, University of Bergen, PO Box 7803, N-5020 Bergen, NorwayeBjerknes Centre for Climate Research, Allégaten 55, N-5007 Bergen, Norwayf Environmental Change Research Centre, University College London, Gower Street, London WC1E 6BY, UKg School of Geography and the Environment, University of Oxford, Oxford OX1 3QY, UK
a r t i c l e i n f o
Article history:Received 28 July 2010Received in revised form4 June 2011Accepted 21 June 2011Available online 14 July 2011
Keywords:ChironomidHoloceneIcelandPalaeoclimateTraining set
a b s t r a c t
Icelandic and Norwegian chironomid calibration or training sets were merged to investigate whethera larger combined training set would be useful to apply to subfossil chironomid data from Iceland forperiods such as the early Holocene, the Holocene Thermal Maximum and the Little Ice Age, whentemperatures can be expected to be outside the current temperature range of the Icelandic training set.Following taxonomic harmonisation, the Icelandic and Norwegian data sets were compared before beingmerged to form a combined Norwegian-Icelandic training set. Analyses showed that it was biologicallyand statistically valid to merge the two data sets. The resulting combined inference model for mean Julyair temperature had improved performance statistics (r2jack ¼ 0.87; RMSEPjack ¼ 1.13) when compared tothe best performing Icelandic model (r2jack ¼ 0.61; RMSEPjack ¼ 0.83), due to the longer environmentalgradient covered (Icelandic 6e11 �C; combined 3.5e16 �C), and to the increased number of samples(Icelandic ¼ 53 lakes; combined ¼ 207 lakes) and taxa (Icelandic ¼ 47 taxa; combined ¼ 133 taxa)present within the combined training set. The inference models were applied to an early Holocenechironomid sequence from Vatnamýri, north Iceland, and a 450-year recent record from Myfluguvatn,north-west Iceland, to compare the reconstructions produced. The various inference models producedsimilar trends and patterns of temperature reconstruction, but the inference model based on thecombined training set produced a larger range of reconstructed temperatures than the Icelandic model.It was found that different inference models produced more variation in the reconstruction than whendifferent training sets were used. A comparison of the Myfluguvatn reconstructions with meteorologicalobservations showed that the combined NorwegianeIcelandic inference model produced more reliableresults than the Icelandic or Norwegian inference models alone.
� 2011 Elsevier Ltd. All rights reserved.
1. Introduction
During the past decades several chironomid training sets andresulting temperature calibration or transfer functions have beendeveloped and published (e.g. Walker et al., 1997; Olander et al.,1999; Brooks and Birks, 2000a, 2001, unpubl.; Larocque et al.,2001; Heiri and Lotter, 2003; Langdon et al., 2008; Luoto, 2008).When applied to fossil chironomid assemblages, these calibrationfunctions provide an opportunity to produce quantitative
reconstructions of past temperatures and therefore to providepalaeoclimatic information which is important when addressingissues surrounding natural climate variability and climatic change.However, production of a single training set can be expensive andtime consuming and an important question is whether it isnecessary to produce training sets for different geographicalregions, or can they be applied extra-regionally?
Many previous studies have used training sets to producetemperature reconstructions from outside the region in which theywere developed; for example a Norwegian training set andresulting inference model (Brooks and Birks, 2000a, 2001, unpubl.)have been used to derive temperature reconstructions from Iceland(Caseldine et al., 2003), the UK (Bedford et al., 2004; Brooks and
* Corresponding author.E-mail address: [email protected] (N. Holmes).
Contents lists available at ScienceDirect
Quaternary Science Reviews
journal homepage: www.elsevier .com/locate/quascirev
0277-3791/$ e see front matter � 2011 Elsevier Ltd. All rights reserved.doi:10.1016/j.quascirev.2011.06.013
Quaternary Science Reviews 30 (2011) 2793e2804

Author's personal copy
Birks, 2000b; Lang et al., 2010a, 2010b; Langdon et al., 2004) andFinland (Engels et al., 2008a, 2010). A Swiss training set (Heiri andLotter, 2003) has been used to provide temperature reconstructionsin the Netherlands (Heiri et al., 2007) and Germany (Engels et al.,2008b). A Swedish training set (Larocque et al., 2001) has beenused to reconstruct temperatures from Russian lakes (Andreevet al., 2005; Ilyashuk et al., 2005), and a North American trainingset has been used alongside a Swedish training set to producea temperature reconstruction from Italy (Larocque and Finsinger,2008) and Switzerland (Larocque-Tobler, 2010). In many cases theinferred temperature trends compare favourably with otherpalaeoclimatic proxy evidence (e.g. ice cores, pollen, macrofossils).However, when dealing with the small magnitude temperaturechanges typical of the Holocene the reconstructions need to be asaccurate as possible. There are a number of potential problemswhen applying a training set outside the geographical region inwhich it was assembled. These include non-analogue speciesassemblages, different taxa included within a particular morpho-type and taxa having different temperature optima in differentregions. It is also possible that taxa can respond differently toa number of environmental variables, especially in the earlyHolocene, a period for which we have little understanding ofspecies assemblage development in recently deglaciated fresh-water ecosystems. As a result, calibration sets need to be carefullyevaluated in order to be sure that these problems will not havea major impact on the resulting temperature reconstructions. A keyquestion this paper investigates is whether we can merge regionaltraining sets to expand their applicability towider regions; merginga local training set with an extra-regional training set makes senseboth biologically and statistically and is a better approach thanapplying two extra-regional training sets.
The Icelandic chironomid-mean July air temperature inferencemodel (Langdon et al., 2008) was developed from a training setcovering a mean July air temperature gradient of 6e11 �C. Fromwithin Iceland there is the potential to extend this gradient toa maximum of 4e12 �C. Caseldine et al. (2006) found that sometaxa present in the early Holocene were not present in the moderntraining set, causing non-analogue situations. Even after anexpansion of the modern Icelandic training set to cover the entiremodern temperature gradient, there may not be sites present inIceland today that are analogous to the early Holocene in terms oftaxon assemblage or climate. Therefore, it may be advantageous tomerge the Icelandic training set with a data set from a similarclimatic and zoogeographical region, but covering a widertemperature gradient.
The Norwegian training set (Brooks and Birks, 2000a, 2001,unpubl.) covers a wider temperature gradient (mean July airtemperature 3.5e16 �C) than the Icelandic training set, and includesa temperature range that might be expected to encompasstemperatures experienced during the early Holocene and theHolocene Thermal Maximum (HTM) in Iceland. For these reasonsthe Norwegian training set might provide closer analogues for theearly and mid-Holocene samples than the modern Icelandictraining set.
Work by Lotter et al. (1999) showed that merged North Amer-ican and European modern chironomid data sets producedreasonable reconstructions when applied to late-glacial sequencesfrom each region. These findings suggest that merging the Icelandicand Norwegian training sets should be viable and may enhance theapplicability of the resulting inference models. The precision of thetaxonomy and our comprehension of how inference models workhas improved much since Lotter et al. (1999) and so another look atthis question is timely and particularly relevant for Holocenesequences from Iceland when the temperature gradient of themodern Icelandic training set is probably insufficient to cover the
range of temperatures experienced during this period. In addition,a combined NorwegianeIcelandic training set could potentiallyproduce more reliable temperature reconstructions from IcelandicHolocene chironomid sequences because the estimates of taxonparameters such as optima are likely to be more robust whenestimated from a large data set covering a long environmentalgradient (Birks, 1995,1998; Birks et al., 2010). The aims of this studyare to compare and evaluate the results of the Norwegian andIcelandic inference models when applied to an Icelandic Holocenechironomid sequence and to assess the potential of the mergedtraining set to improve the palaeoclimatic reconstructions fromIceland.
2. Methods
2.1. Data used
The data sets used in this study are the Icelandic chironomidtraining set (Langdon et al., 2008) and the Norwegian chironomidtraining set (Brooks and Birks, 2000a, 2001, unpubl.). The methodsused to develop these two training sets were similar and aredescribed in Brooks and Birks (2001) and Langdon et al. (2008).
2.2. Merging and creation of training sets
The taxonomic approach was largely consistent between thetwo chironomid training sets and is based on Brooks et al. (2007).However, some taxonomic harmonisation was necessary. This ledto the formation of four new training sets: a harmonised taxonomyNorwegian training set, a harmonised taxonomy Icelandic trainingset, a combined NorwegianeIcelandic training set, and a fourthtraining set consisting only of those taxa present in both theNorwegian and Icelandic lakes (reduced taxon combined trainingset). Both original data sets contained 20 or more environmentalvariables. However, only eleven of these were common to both theNorwegian and Icelandic training sets (Table 1), and it is these thatare used in the new combined training sets. All the followinganalyses were carried out on these new data sets.
2.3. Assessing species responses to mean July air temperature
Gaussian logit regression (GLR) was used to fit Gaussianresponse curves to the data (Birks, 1995). The programme GLR(Version 1.1; Juggins, 1994) was used to estimate the temperatureoptimum and tolerances of each taxon. GLR estimates the optimumof a taxon, evenwhen that optimum lies outside the environmentalgradient covered by the training set (Birks, 1995). However, GLR canonly reliably estimate optima for taxa which show a unimodalresponse curve to temperature, and there is no reason to assumethat all organism responses are unimodal or Gaussian (Austin,1976,1980, 2002; Austin and Nicholls, 1997). Huisman et al. (1993)proposed five hierarchical models allowing different types ofspecies responses to be modelled (Table 2). The simplest statisticalmodel should always be used to describe a species response,following the principle of parsimony in statistical modelling. Tofind this, the most complex response model was fitted first.
Table 1Environmental variables included in the training sets.
Climate Data Water Chemistry Lake properties
Mean july air temperature Kþ Ca2þ Maximum depthWater temperature SO4
- Mg2þ TOC (of substrate)Cl- pH
Conductivity
N. Holmes et al. / Quaternary Science Reviews 30 (2011) 2793e28042794

Author's personal copy
Parameters were then removed from the regression model one ata time, until the removal of a parameter resulted in a statisticallysignificant (p < 0.05) change in the model’s deviance. The programHOF (Oksanen and Minchin, 2002) was used to fit the responsemodels to the chironomid data. HOF was only applied to those taxawhich occurred in 10 or more of the training set samples in theNorwegian and Icelandic data sets, while it was applied to taxaoccurring in 20 or more of the samples in the combined Norwe-gianeIcelandic training set. GLR was applied to those taxa whichoccurred in both the Norwegian and the Icelandic training sets. Theoptima and tolerances of taxa occurring in both training sets werecompared, as were the ecological responses of the taxa tomean Julyair temperature. The GLR and HOF results provide importantecological information about the chironomid taxa. However, theseresults are not used in the production of the transfer functions,although the maximum likelihood inference model used involvesGLR and maximum likelihood calibration (Birks et al., 1990).
2.4. Exploratory data analyses
2.4.1. Ordination methodsThe training sets were first analysed by detrended correspon-
dence analysis (DCA) in order to determine the length of the speciescompositional gradients, and hence whether the data showedlinear or unimodal responses (Birks, 1995). Species data weresquare-root transformed, rare taxa were downweighted, anddetrending was by segments. Data with a gradient length greaterthan 2 SD units were treated as primarily showing unimodalresponses, whereas data with a gradient length of less than 2 SDunits were analysed with methods that assume a linear or mono-tonic response (Birks, 1995). Detrended canonical correspondenceanalysis (DCCA) with mean July air temperature as the only envi-ronmental predictor, detrending by segments, and non-linearrescaling, provided an estimate of the compositional turnoveralong the mean July air temperature gradient length in standarddeviation units (Birks, 1995). DCA was carried out in order todetermine the gradient length of the combined Norwe-gianeIcelandic data set, with the larger Norwegian data set activeand the smaller Icelandic data passively plotted on the ordinationplot. This was repeated for canonical correspondence analysis(CCA) in order to constrain the data by the available environmentalinformation. Canoco for Windows (version 4.52; ter Braak and�Smilauer, 2002) and CanoDraw for Windows (version 4.12; terBraak and �Smilauer, 2002) were used to perform and display allordinations.
2.4.2. Comparison of species occurrencesThe presence or absence of species in samples of the Norwegian
training set and the Icelandic training set were investigated, andspecies abundances were compared. The relative abundance of taxapresent in only one training set was investigated in order to seewhat the importance of that taxon was to the training set. A rare
taxon would be expected to have less influence on the inferencemodel produced from a training set than an abundant taxon;however, it could be important if it occurs in the fossil sequence towhich a transfer function is applied.
2.4.3. Determining sample dissimilarity and analoguesThe program R (R, 2010) was used to analyse the data for
analogues. Squared chord distance was calculated between all thesamples. Samples from the Icelandic and Norwegian training setswere compared to determinewhich lakes had the closest analoguesto each other andwhether good analogues existed between trainingsets. Squared chord distances were also calculated for fossil samplesfrom an Icelandic Holocene sequence from Vatnamýri (Caseldineet al., 2006; Holmes, 2006) to determine their closest analogues inthe Icelandic and the combined NorwegianeIcelandic training sets.
2.5. Inference models
2.5.1. Deriving the inference modelsA number of different inference models for mean July air
temperature were created using each training set in order to findthe most appropriate model for each data set. Birks (1998) suggeststhat it may be necessary to produce and apply more than oneinference model to a fossil sequence in order to produce usefulpalaeoenvironmental reconstructions as it may be that no singlemodel can combine low root mean square error of prediction(RMSEP), and low mean and maximum bias, in the part of theenvironmental gradient of interest to the study.
The program C2 (Juggins, 2007) was used to create the inferencemodels. Species data, in percentage format, were square-roottransformed. The different methods used to produce the infer-ence models included both linear and unimodal methods: partialleast squares (PLS; a linear method), maximum likelihood (ML),weighted averaging (WA), and weighted averaging partial leastsquares (WAPLS) (all unimodal methods); as well as a method withno underlying statistical model, namely the modern analoguetechnique (MAT) (Birks et al., 2010). Variations of the same modeltypes were applied to find the best model possible for each trainingset. Outlying samples were detected and removed from the datasets during the process of model development. The best perfor-mance for WA, WAPLS, PLS and ML models was assessed by thosehaving the lowest RMSEPjack, highest r2jack, and lowest average andmaximum biases, all based on leave-one-out jack-knife cross-validation (Birks 1995). Bootstrapped statistics were also takeninto account (Birks et al., 1990). Performance of MAT models wasassessed using r2 and RMSEPboot statistics (Birks et al. 2010).
2.5.2. Testing the inference modelsThe Icelandic inference model was used to predict the mean July
air temperatures from the Norwegian chironomid surface-sampledata, and vice versa. All models were tested against each other, asthe best model, in terms of performance statistics, may not give thebest estimates of the modern temperatures in a different trainingset. Correlation coefficients were calculated for each model’spredictions of the observed mean July air temperature values. Thepercentage of observed values occurring within the sample specificerror of the predicted values was also calculated. These two valueswere also considered when identifying which model produced thebest predictions of observed mean July air temperatures from theother training set.
2.6. Quantitative temperature reconstructions
The best model derived from each of the training sets wasselected and applied to fossil chironomid data from Vatnamýri, N
Table 2The five HOF models of ecological response (Huisman et al., 1993).
Model Ecological response described
Model I No significant trendModel II Increasing or decreasing monotonic sigmoidal trendModel IIIa Increasing or decreasing trend bounded below the maximum
attainable responseModel IV Symmetric unimodal response curveModel V Asymmetric/skewed unimodal response curve
a Model III has the same number of parameters as model IV and a choice betweenthese models cannot be based on any significant increase in the deviance of themodel (Huisman et al., 1993).
N. Holmes et al. / Quaternary Science Reviews 30 (2011) 2793e2804 2795

Author's personal copy
Iceland (Caseldine et al., 2006; Holmes, 2006). Dissimilarity(squared chord distances) between the chironomid assemblages infossil samples and the training set samples were calculated using R(R, 2010). Temperature reconstructions were carried out using thebest performing model produced by each method for the separateIcelandic and Norwegian training sets, the best model producedfrom each method using the combined NorwegianeIcelandictraining set, and also the best WAPLS models from all four trainingsets created during this study. The reconstructions were stand-ardised and compared, and differences between the trendsproduced by the models investigated. To assess the accuracy of thereconstructions, we applied the best WAPLS models from all fourtraining sets to a 450-year record from Myfluguvatn, NW Iceland(Langdon et al., 2011). The reconstructions, and a consensus recon-struction, were then compared with observed meteorological datafrom Stykkishólmur (Veðurstofa Íslands, 2010) and a North Icelandicsea-surface temperature record (NIce-SST) (Hanna et al., 2006).
3. Results
3.1. New training sets
Taxonomic harmonisation between the original Norwegian andIcelandic data sets led to a reduction in the number of taxa in each.The removal of sites with less than 50 chironomid head capsules,the minimum number believed necessary for reliable environ-mental inferences (Heiri and Lotter, 2001; Larocque, 2001; Quinlanand Smol, 2001), reduced the number of sites in the originalNorwegian data set by three. Merging the two harmonised data setsproduced a combined NorwegianeIcelandic training set, whichconsisted of 133 taxa from 207 sites, with data for 11 environmentalvariables at each site. The fourth training set, which comprises onlytaxa present in both Iceland and Norway, is greatly reduced in thenumber of taxa and lakes included. The number of lakes and taxacontained in the training sets are presented in Table 3.
3.2. Species responses to mean July air temperature
GLR (Juggins, 1994) provided estimates of taxon optima andtolerances for taxa occurring in both the Norwegian and Icelandictraining sets. GLR optima estimates are not biased by the sampledensity along the temperature gradient in the data set (Cameronet al., 1999) in the way that WA optima are. Some taxa hadoptima that could not be estimated by a Gaussian logit regressionmodel (Birks et al., 1990) and these were excluded from the resultsof the GLRwhich are presented in Fig.1. Estimated taxon optima aregenerally higher in the Norwegian training set (average 2.9 �Cwarmer than in Iceland), and the estimated tolerances are wider.This may be a property of the longer mean July air temperaturegradient and the larger number of sites covered by the Norwegiandata set, or this could be the ecological truth given the differentenvironmental and biological nature of the two regions.
One of the problems of GLR can be seen by looking at theanomalous values. It is clearly not possible that mean July airtemperatures of �14 �C or 33 �C occur in the areas studied. GLR
assumes all taxa have Gaussian responses to environmental vari-ables, and estimates the optimum of a taxon, even when thatoptimum lies outside the environmental gradient covered by thetraining set (Birks et al., 1990; Birks, 1995). This means that for taxathat do not have unimodal responses in the training sets, GLR cangive unrealistic results by fitting unimodal responses to these taxaanyway. This is one reasonwhy themore robust GLR results need tobe compared with the results of the HOF models.
The HOF models (Huisman et al., 1993) were applied to the datasets. Table 4 summarises the percentage of taxa having eachresponse model for three of the data sets. Only four taxa showedthe same response type to mean July air temperature in all trainingsets as defined by the fitting of the HOFmodels. A far larger number(44%) of taxa in the Icelandic training set showed no statisticallysignificant response to mean July air temperature than in the otherdata sets (4% in the Norwegian and 6% in the combined Norwe-gianeIcelandic training sets). An explanation for this is the muchshorter mean July air temperature gradient of the Icelandic data setwhen compared to that of the other data sets. The reduced numberof taxa present and the smaller number of samples in the Icelandic
Table 3Number of lakes and taxa in the four training sets created in this study.
Training set Number of lakes Number of taxa
Icelandic 53 47Norwegian 154 129Combined (NeI) 207 133Combined (only taxa present
in both N and I)180 43
Fig. 1. Taxon temperature optima (circles) and tolerances (error bars) of taxa occurringin both the Norwegian and Icelandic training sets, estimated by Gaussian logitregression.
Table 4Summary table (in %) of different HOF model responses for taxa in the Norwegian,Icelandic and combined NorwegianeIcelandic training sets.
Model Norwegian Iceland Combined NeI
I 4 44 6II 22 26 18III 0 0 2IV 61 30 62V 13 0 14
N. Holmes et al. / Quaternary Science Reviews 30 (2011) 2793e28042796

Author's personal copy
training set could also be important. A similar percentage of taxa(between 18 and 26%) showed sigmoidal response curves in allthree data sets. The combined NorwegianeIcelandic training sethas the largest percentage of taxa with unimodal responses tomean July air temperature. Overall 76% of the taxa showed unim-odal responses, with 62% showing symmetric unimodal responsesand 14% exhibiting skewed unimodal responses.
3.3. Exploratory data analyses
3.3.1. OrdinationsDCA of the Icelandic data revealed species compositional
gradients of 2.4 SD units (axis 1) and 2.5 SD units (axis 2). Analysisby Langdon et al. (2008) suggests that DCA axis 1 is thought toparallel variation in loss on ignition (LOI) or total organic carbon(TOC) of the lake sediment, while axis 2 reflects the gradient ofmean July air temperature. Although DCA axis 2 has a gradientlength of 2.5 SD units, suggesting unimodal methods should beapplied to the data, detrended CCA (DCCA) using mean July airtemperature as the only constraining variable produced a gradientlength of only 0.9 SD units. This result would suggest the use oflinear-based methods in further numerical analyses of this data set(Birks, 1995).
DCA axis 1 of the harmonised Norwegian data, thought torepresent mean July air temperature (cf. Brooks and Birks, 2001,unpubl.), produced an axis 1 length of 4.2 SD units. DCCA, withmean July air temperature as the only constraining variableproduced a gradient length of 2.6 SD units suggesting the use ofnon-linear, unimodal methods (Birks, 1995).
DCA of the combined NorwegianeIcelandic training setproduced an axis 1 length of 4.3 SD units, indicating a long speciescompositional gradient. The ordination plot (Fig. 2) shows the datato be split into two almost completely distinct groups. The samplesfrom the Norwegian training set plot together, as do those from theIcelandic data set, with very little overlap. DCCA of the combineddata set, with the only constraining environmental variable beingmean July air temperature, produces a gradient length of 2.6 SDunits. These analyses therefore suggest the use of unimodalmethods in further numerical analyses (Birks, 1995).
The biplot produced by CCA of the combined training set data,with the Norwegian samples active and the Icelandic samplesplotted passively, shows that when the Norwegian samples areconstrained by measured environmental data, the Icelandicsamples plot in the same environmental space as the Norwegiansamples (Fig. 3). This is expected, as the environmental gradientscovered by the Icelandic training set samples occur within those
covered by the Norwegian data set. Mean July air temperature isa major component of CCA axis 1, along with water temperature,which can be expected to show similar patterns to mean July airtemperature (Livingstone and Lotter,1998) and TOC, which stronglycovaries with air temperature in the Norwegian data set (Brooksand Birks, unpubl.). CCA axis 2 seems primarily to be constrained bythemaximum depth of the lakes, with influence from several waterchemistry variables. DCA of the combined NorwegianeIcelandicreduced taxa training set produces a gradient of 3.4 SD units,suggesting the application of unimodal methods in further anal-yses. There is little difference between the results produced for thefull taxa and the reduced taxa combined NorwegianeIcelandictraining sets.
3.3.2. Species occurrencesNearly half (86 taxa, 45% of total) of the Norwegian taxa are not
present in the Icelandic training set. The majority of these taxaoccur at low percentages in only a small number of Norwegianlakes and thus they will have little influence on inference modelsproduced from these data. However, one taxonwhich does occur inhigh percentages in a large number of the Norwegian lakes whilstbeing absent from the Icelandic lakes is Sergentia, and this taxonwill have a considerable influence on the inference models. Onlyfour taxa occur solely in the Icelandic lakes (Orthocladius (Pogono-cladius) consobrinus, Orthocladius type I, Corynoneura lobata, Para-smittia), with these mostly occurring in low abundances.
3.3.3. AnaloguesThe squared chord distance between all samples was calculated.
The distances between each sample and all other samples in theNorwegianeIcelandic training set are presented in Fig. 4a. Thedistribution is slightly skewed to the right-hand side, which reflectsthe variation between the samples in this large data set. It wouldnot be expected that all sites within a training set would have lowdissimilarity values, unless covering a small environmentalgradient in which limited taxa are present. The closest analoguesfor the Vatnamýri down-core samples were selected from theIcelandic training set and from the combined NorwegianeIcelandictraining set. The squared chord distances are presented in Figs 4band c. The combined NorwegianeIcelandic training set providesbetter analogues for 16 of the Vatnamýri samples than the Icelandictraining set on its own, although these were selected from a smallnumber of the Norwegian lakes. Interestingly all the samples withFig. 2. DCA scatterplot of the combined NorwegianeIcelandic training set.
Fig. 3. CCA of the combined NorwegianeIcelandic training set. The Norwegiansamples are constrained by the environmental variables. The Icelandic data are plottedpassively.
N. Holmes et al. / Quaternary Science Reviews 30 (2011) 2793e2804 2797

Author's personal copy
better analogues in the combined training set are from the earlyHolocene and this is discussed in detail below.
3.4. Inference models
The fact that closer analogues are found in the combined Nor-wegianeIcelandic training set justifies the production of a combinedNorway-Iceland chironomid-inferred mean July air temperatureinferencemodel. Models were created from all four training sets andwere produced using both linear and unimodal methods.
3.4.1. Icelandic inference models (Table 5)The best performing Icelandic model is a WAPLS 2-component
model. This model has 3 outliers removed from the training set(two of these are also regarded as outliers by Langdon et al., 2008).It was expected that linear-based methods would produce the bestmodels from the Icelandic data set due to the short gradient lengthfound in exploratory DCCA ordination analyses (Birks, 1995);however, both WA and WAPLS outperformed the PLS models. Thefact that 30% of the Icelandic taxa had unimodal responses whenanalysed using HOF models may explain why the unimodal-basedmethods of WA and WAPLS had improved model performances.When the WAPLS model was used to predict the temperatures ofthe Norwegian lakes, 46% of the observed values were found tooccur within the sample specific errors of the predicted values(SSPE). However, none of the inference models produced couldpredict accurately the mean July air temperature for those siteswith a temperature over approximately 12 �C, and many modelsperformed poorly on sites that had mean July air temperaturebelow 5 �C; this is likely to be a direct result of the shortertemperature gradient covered by the Icelandic data set.
3.4.2. Norwegian inference models (Table 6)The best performing inferencemodel (statistically) is theWAPLS
2-component model with 4 outliers (a glacier-fed proglacial lake in
western Norway and three lakes from Svalbard). However, whenthis is used to predict the temperature of the Icelandic sites only23% of the observed values are found to occur within the SSPE ofthe predicted temperatures. This is the lowest value of all themethods used. The PLS model, assuming linear responses, has thehighest value (60%). The Norwegian data are largely unimodal,however the data being inferred (the Icelandic data) are primarilylinear. When a correlation is carried out between the predicted andobserved data, MAT provides the highest correlation (0.51) and has55% of samples predicting the observed temperature within themodel errors. Nearly all the Norwegian models over-predicted theIcelandic temperatures; this is probably due to the fact that manyNorwegian taxa have higher optima than the Icelandic taxa.
3.4.3. Combined NorwegianeIcelandic inference models (Table 7)Outliers varied between the different models, although one lake
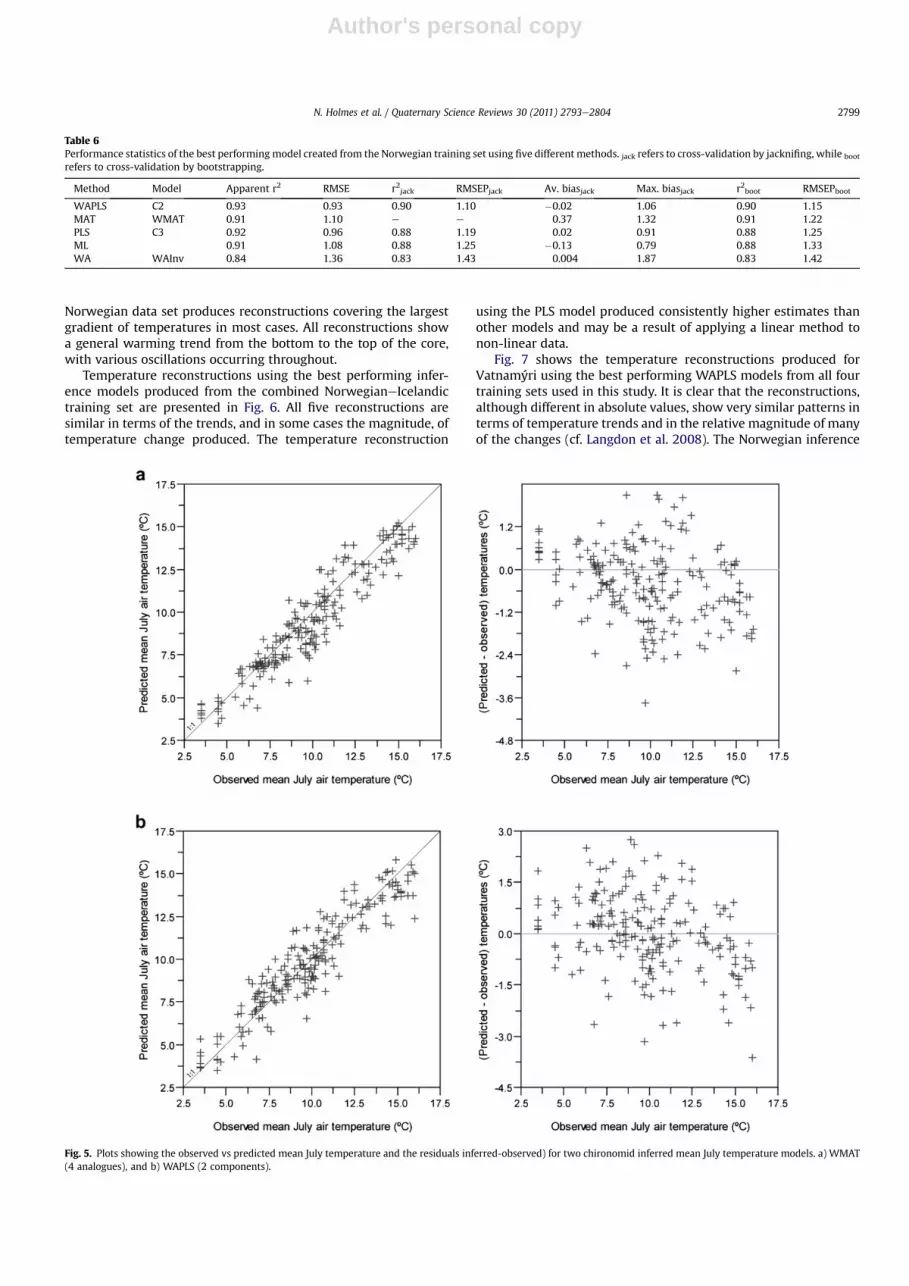
was consistently an outlier whichever model was used. This lake isa glacier-fed proglacial lake in western Norway which has a coolerwater temperature than would be expected for a lake occurring atits location (Brooks and Birks, 2001). When selecting the bestmodel there is little to choose between theWAPLS andMAT (with 4analogues) models (Fig. 5). The MAT model produces a smallerrange of errors and has a tendency to under-predict temperatures,while the WAPLS model generally over-predicts temperatures. Themodels produced from the reduced taxon combined Norwe-gianeIcelandic training set showed some deterioration in perfor-mance statistics when compared with the same models producedfrom the full taxa combined NorwegianeIcelandic training set.
3.5. Temperature reconstructions
Several of the inference models produced were used to recon-struct temperatures for the Vatnamýri lake sediment sequence.These are not all shown but for all the inference models allreconstructions follow the same general trends and patterns. The
Fig. 4. Squared chord distances between a) all samples in the combined NorwegianeIcelandic training set, b) the Vatnamýri samples and the Icelandic training set, and c) theVatnamýri samples and the combined NorwegianeIcelandic training set.
Table 5Performance statistics of the best performing model created from the Icelandic training set using five different methods. jack refers to cross-validation by jacknifing, while boot
refers to cross-validation by bootstrapping.
Method Model Apparent r2 RMSE r2jack RMSEPjack Av. biasjack Max. biasjack r2boot RMSEPboot
WA WACla 0.61 1.05 0.59 0.85 �0.12 0.89 0.60 1.02WAPLS C2 0.81 0.57 0.61 0.83 �0.02 1.08 0.64 0.94PLS C3 0.77 0.62 0.46 0.96 �0.002 1.48 0.48 1.03MAT WMAT 0.57 1.05 e e 0.54 2.13 0.55 1.14ML 0.61 0.95 0.36 1.25 �0.08 1.20 0.44 1.38
N. Holmes et al. / Quaternary Science Reviews 30 (2011) 2793e28042798
Author's personal copy
Norwegian data set produces reconstructions covering the largestgradient of temperatures in most cases. All reconstructions showa general warming trend from the bottom to the top of the core,with various oscillations occurring throughout.
Temperature reconstructions using the best performing infer-ence models produced from the combined NorwegianeIcelandictraining set are presented in Fig. 6. All five reconstructions aresimilar in terms of the trends, and in some cases the magnitude, oftemperature change produced. The temperature reconstruction
using the PLS model produced consistently higher estimates thanother models and may be a result of applying a linear method tonon-linear data.
Fig. 7 shows the temperature reconstructions produced forVatnamýri using the best performing WAPLS models from all fourtraining sets used in this study. It is clear that the reconstructions,although different in absolute values, show very similar patterns interms of temperature trends and in the relative magnitude of manyof the changes (cf. Langdon et al. 2008). The Norwegian inference
Table 6Performance statistics of the best performingmodel created from the Norwegian training set using five different methods. jack refers to cross-validation by jacknifing, while boot
refers to cross-validation by bootstrapping.
Method Model Apparent r2 RMSE r2jack RMSEPjack Av. biasjack Max. biasjack r2boot RMSEPboot
WAPLS C2 0.93 0.93 0.90 1.10 �0.02 1.06 0.90 1.15MAT WMAT 0.91 1.10 e e 0.37 1.32 0.91 1.22PLS C3 0.92 0.96 0.88 1.19 0.02 0.91 0.88 1.25ML 0.91 1.08 0.88 1.25 �0.13 0.79 0.88 1.33WA WAInv 0.84 1.36 0.83 1.43 0.004 1.87 0.83 1.42
Fig. 5. Plots showing the observed vs predicted mean July temperature and the residuals inferred-observed) for two chironomid inferred mean July temperature models. a) WMAT(4 analogues), and b) WAPLS (2 components).
N. Holmes et al. / Quaternary Science Reviews 30 (2011) 2793e2804 2799

Author's personal copy
model produced the most extreme results, having colder temper-atures at the bottom of the sequence than the Icelandic andcombined models and warmer temperatures through most of therest of the core. The combined training set inference models alsoproduce a larger range of values than the Icelandic models. This isprobably due to the extended gradient of these training sets whencompared to the Icelandic one, and is also likely to be the reason forthe magnitude of changes being larger in the combined andNorwegian based reconstructions than in the Icelandic ones.
When the Vatnamýri reconstructions are standardised and pre-sented alongwith a standardised consensus reconstruction (Fig. 8) itis clear that there is more variation in the trends of the recon-structions when different models are used than when differenttraining sets are used. This reinforces the point that the choice ofinference model is very important in environmental reconstruction(cf. Paterson et al., 2002; Birks, 2003; Eggermont et al., 2006).
The results suggest that if it is the past temperature trends thatare required then choice of training set is not critical. The similarreconstructions produced by the inferencemodels based on the twocombined training sets (full and reduced taxa) suggest that thechironomid-inferred temperature reconstructions are really drivenby a limited number of abundant taxa present in the training setand as fossils. The removal of 90 taxa from the full combined Nor-wegianeIcelandic training set to create the reduced taxon trainingset has very little impact on the reconstructed temperatures; in thiscase because taxa abundant as fossils are not removed from thetraining set. This suggests that the dominant taxa are similar in boththe Norwegian and Icelandic training sets and also explains the verysimilar inference patterns produced by all the training sets.
To assess the accuracy of the reconstructions, we applied the bestperforming WAPLS model from each training set to a 450-year
sequence from Myfluguvatn, NW Iceland (Fig. 9a). All the modelsshow similar trends in reconstruction, especially in the earlier part ofthe record. This is clearly shown in Fig. 9b where the reconstructionshave been standardised. The record is less consistent after 1860,a time when Myfluguvatn is dominated by taxa present in lownumbers in the Icelandic training set (see Langdon et al., 2008; 2011).
The Icelandic, combined full training set and consensus recon-structions were standardised and in Fig. 10 are plotted along withobserved meteorological data from Stykkishólmur (mean July airtemperature; Veðurstofa Íslands) and a North Iceland coastal sea-surface temperature (NIce-SST) reconstruction (Hanna et al.,2006), both of which have been standardised. It can be seen fromFig. 10 that the combined full training set and consensus recon-structions show a greater similarity to both the meteorological andthe NIce-SST data than the Icelandic training set reconstruction.This suggests that during the period of colder temperatures(between c. AD 1880 and c. AD 1930) the extended environmentalgradient and larger data set of the combined training set producedmore realistic reconstructions than the smaller Icelandic trainingset; possibly due to the cold stenotherms present in Myfluguvatnbeing present at only a limited number of sites in the Icelandictraining set (cf. Langdon et al., 2011).
4. Discussion
4.1. Harmonising taxonomy and merging training sets
Lotter et al. (1999) produced a training set that was applicable tofossil sequences in North America and Europe by merging Euro-pean and North American chironomid training sets. In the presentstudy we have investigated whether a chironomid-temperature
Table 7Performance statistics of the best performingmodel created from the combined NorwegianeIcelandic training set using five differentmethods. jack refers to cross-validation byjacknifing, while boot refers to cross-validation by bootstrapping.
Method Model Apparent r2 RMSE r2jack RMSEPjack Av. biasjack Max. biasjack r2boot RMSEPboot
WAPLS C2 0.91 0.97 0.87 1.13 �0.005 1.14 0.87 1.19MAT WMAT 0.89 1.12 e e 0.41 1.00 0.89 1.26PLS C4 0.90 1.00 0.85 1.23 0.02 1.18 0.85 1.29ML 0.88 1.16 0.84 1.31 �0.09 0.80 0.84 1.37WA WATCla 0.86 1.27 0.81 1.43 0.007 1.19 0.82 1.61
Fig. 6. Chironomid-inferred mean July air temperature (C-IT) reconstructions for Vatnamýri using the best performing models produced from the combined NorwegianeIcelandictraining set. MAT ¼ modern analogue technique; ML ¼ maximum likelihood; PLS ¼ partial least squares; WA ¼ weighted averaging; WAPLS ¼ weighted averaging partial leastsquares.
N. Holmes et al. / Quaternary Science Reviews 30 (2011) 2793e28042800

Author's personal copy
inference model, produced by merging Icelandic and Norwegiantraining sets, would improve the reliability of temperature esti-mates of an Icelandic Holocene chironomid record. The harmo-nisation of taxonomy between the Icelandic and Norwegian datasets led to some loss of taxonomic resolution. Birks (1994) suggestsa need for high taxonomic precision in studies involving quantita-tive numerical analyses. The performance of the merged Norwe-gian and Icelandic training sets, in comparison with the unmergedtraining sets, might be impaired by the poorer taxonomicresolution.
DCA ordination of the combined training set samples revealedtwo groups of samples which clearly differed from each other.Samples most commonly chosen in one training set as the closestanalogue for lakes from the other training set were frequentlyidentified as outliers amongst their own training set and as a result
were omitted from the calibration functions that had the bestperformance statistics. None of the models that predicted thehighest percentage of observed values in the other training set towithin the SSPE were among the best performing statistically; thismeans that the best performing model may not be the mostappropriate to use. This emphasises the problems of usinga training set outside its region, as they perform well within theregion in which they were developed but not necessarily outside it.
The fact that the different combinations of models and trainingsets produce (for the most part) similar trends and patternssuggests that it is really only a limited number of chironomid taxadriving the temperature transfer functions. The elimination of 90taxa (67% of taxa) (and 27 lakes, 13% of lakes) from the combinedtraining set to create a reduced taxon combined Norwe-gianeIcelandic training set did lead to a loss of model performance
Fig. 7. Chironomid-inferred mean July air temperature (C-IT) reconstructions for Vatnamýri produced by the best performing WAPLS models from all four training sets.
Fig. 8. Standardised chironomid-inferred reconstructions from the Vatnamýri data (a) different models using the combined NorwegianeIcelandic training set, and (b) WAPLSmodels using the different training sets.
N. Holmes et al. / Quaternary Science Reviews 30 (2011) 2793e2804 2801

Author's personal copy
in terms of RMSEP and bias. However, the actual reconstructionsproduced showed very little difference to those produced by thefull combined NorwegianeIcelandic training set. The majority ofthe taxa removed occurred in a limited number of samples at lowpercentages. A few did occur in significant amounts in a largenumber of samples and the impact of deleting these from thetraining set had little effect on the reconstructions. This is similar tothe results of Racca et al. (2003), who found that 85% of the taxacould be removed from a diatom pH training set without affectingthe performance of the model or the information about past pHprovided by a reconstruction.
Merging the two data sets into a combined Norwe-gianeIcelandic training set has the advantage of extending thegradient that would be available if only the Icelandic training setwas available. The merged data set also incorporates some of the
taxa that are rare or absent frommodern Icelandic samples, but areknown to occur from early Holocene sites, or indeed more recentlyduring the LIA as seen at Myfluguvatn. Temperatures in the earlyHolocene in Iceland are expected to have been lower than atpresent, and during the HTM they may have been warmer than atpresent. Theremay thus be nomodern sites analogous to these pastconditions within Iceland today. Extending the geographical andenvironmental gradients by including both Norwegian andIcelandic data increases the possibility of better analogues beingpresent in the training set for past assemblages. Indeed, the Vat-namýri samples which had Norwegian samples as their closestanalogues were from the early Holocene and the training set lakeswere mainly from Svalbard. However, what we do not know atpresent, is whether these lakes have an analogous fauna due totheir present-day mean July air temperature, sediment organic
Fig. 9. Chironomid-inferred reconstructions for Myfluguvatn produced by the best performing WAPLS models from all four training sets and a consensus reconstruction. (a) MeanJuly air temperature reconstructions and (b) standardised chironomid-inferred temperature reconstructions.
Fig. 10. Standardised chironomid-inferred temperature reconstructions (WAPLS; Icelandic and combined full taxa training set and consensus reconstructions) from the Myflu-guvatn data, along with Stykkishólmur meteorological data and a North Iceland sea-surface temperature reconstruction (Hanna et al. 2006).
N. Holmes et al. / Quaternary Science Reviews 30 (2011) 2793e28042802

Author's personal copy
content or catchment development. All of these environmentalfactors would probably be contributing to the composition of theearly Holocene midge fauna at Vatnamýri (Langdon et al., 2010).
4.2. Biogeographical issues
Merging training sets from two different regions raisesbiogeographical issues. Iceland is a relatively isolated island andthere may be biogeographical influences on the chironomid faunapresent. For example, some taxa may live in a wider range ofhabitats in Iceland than elsewhere in Europe because of reducedcompetition as the Icelandic fauna is smaller. This may account forthe differences in the taxon optima between the Norwegian andIcelandic data sets. The mean July air temperature gradient inIceland is naturally shorter than that of Norway because of differ-ences in latitudinal and altitudinal gradients, and also becausea strong oceanicecontinental gradient exists in Norway, while theIcelandic training set lakes are located in a predominantly oceanicclimate. Therefore species may not be living at their optima inIceland or may have different optima in different climatic regimes.Geology and other local catchment characteristics may haveimportant effects on the chironomid fauna that are not linked totemperature or any other environmental variable recorded.
4.3. Application of a calibration function to fossil data outside theregion of the training set
There have been a number of studies in which a non-localcalibration function has been used to produce temperature recon-structions (e.g. Brooks and Birks, 2001; Caseldine et al., 2003;Langdon et al., 2004; Andreev et al., 2005; Ilyashuk et al., 2005;Heiri et al., 2007; Engels et al., 2008a,b; Larocque-Tobler, 2010).The work presented here suggests, in this case, that the overalltrends are likely to be reliable, but that the absolute values may bemore inaccurate than the SSPEs can account for. Before a calibrationfunction is used to produce a temperature reconstruction fromanother area, various analyses should be performed. The dissimi-larity between the fossil samples and those in the training setshould be calculated. The best analogues should be selected foreach fossil sample and should be carefully investigated to see howmany and which lakes are acting as the best analogues. If there area limited number of lakes acting as analogues, then it is unlikelythat the training set will produce reliable results. One approachmay be to produce consensus reconstructions using differenttraining sets if a suitable regional training set is not available.However, the lack of good analogues seemed to be unproblematicfor Lotter et al. (1999, p. 728) who state that ‘The fact that despitea poor analogue situation, the models were able to reliably predictthe actual temperatures, implies that temperature and otherenvironmental reconstructions may be used in no-analogue sit-uations..’. This result is similar to the current application of thecombined NorwegianeIcelandic training set on the early Holocenesamples from Vatnamýri. The larger number of sites in a combinedtraining set is likely to increase the statistical performance (preci-sion) and robustness of the models, although careful evaluation isnecessary in order to assess whether the actual values (accuracy)inferred are improved. A consensus approach may produce themost realistic reconstruction.
5. Conclusions
The results show that although there may be problems whenapplying a training set outside its region, a combination of local andextra-regional training sets can be of help, especially in an area,such as Iceland, in which the modern training set is thought not to
encompass the gradient needed or the range of taxa for a recon-struction. The larger environmental gradient covered, along withthe increased number of taxa present and increased occurrences oftaxa in the combined training set, may allow for more realisticreconstructions of past temperature from fossil chironomidsequences. Our study shows that we can merge regional trainingsets to expand their applicability to wider regions, not just to applythem to other regions. The merged training set improves theaccuracy and reliability of the chironomid-inferred palae-otemperature reconstructions produced from Iceland; this isimportant because there are no other reliable quantitative terres-trial palaeoclimate proxies for Iceland. In applying this approach totwo contrasting Holocene Icelandic records it is believed that morereliable palaeotemperature estimates have been produced than arecurrently published.
Acknowledgements
NH was funded through a NERC studentship (NER/S/A/2002/10368A) and would also like to thank the EU QPALCLIMMarie CurieTraining Site at the University of Bergenwhich funded much of thework presented in this paper. Richard Telford and Gaute Velle arethanked for useful discussions while the research was beingundertaken and Cathy Jenks is acknowledged for editorial help.
References
Andreev, A.A., Tarasov, P.E., Ilyashuk, B.P., Ilyashuk, E.A., Cremer, H., Hermichen,W.-D.,Wischer, F., Hubberten, H.-W., 2005. Holocene environmental history recorded inLake Lyadhej-To sediments, Polar Urals, Russia. Palaeogeography, Palae-oclimatology, Palaeoecology 223, 181e203.
Austin, M.P., 1976. On non-linear species response models in ordination. Vegetatio33, 33e41.
Austin, M.P., 1980. Searching for a model for use in vegetation analysis. Vegetatio 42,11e21.
Austin, M.P., 2002. Spatial prediction of species distribution: an interface betweenecological theory and statistical modeling. Ecological Modelling 157, 101e118.
Austin, M.P., Nicholls, A.O., 1997. To fix or not to fix the species limits, that is theecological question: response to Jari Oksanen. Journal of Vegetation Science 8,743e748.
Bedford, A., Jones, R.T., Lang, B., Brooks, S., Marshall, J., 2004. A Late-glacialchironomid record from Hawes Water, Northwest England. Journal of Quater-nary Science 19, 281e290.
Birks, H.J.B., 1994. The importance of pollen and diatom taxonomic precision inquantitative palaeoenvironmental reconstructions. Review of Palaeobotany andPalynology 83, 107e117.
Birks, H.J.B., 1995. Quantitative palaeoenvironmental reconstructions. In: Maddy, D.,Brew, J.S. (Eds.), Statistical modelling of Quaternary science data. QuaternaryResearch Association, Cambridge, pp. 161e254.
Birks, H.J.B., 1998. Numerical tools in palaeolimnology e progress, potentialities,and problems. Journal of Paleolimnology 20, 307e332.
Birks, H.J.B., 2003. Quantitative palaeoenvironmental reconstructions from Holo-cene biological data. In: Mackay, A.W., Battarbee, R.W., Birks, H.J.B., Oldfield, F.(Eds.), Global change in the Holocene. Arnold, London, pp. 342e357.
Birks, H.J.B., Line, J.M., Juggins, S., Stevenson, A.C., ter Braak, C.J.F., 1990. Diatoms andpH reconstruction. Philosophical Transactions of the Royal Society of LondonSeries B-Biological Sciences 327, 263e278.
Birks, H.J.B., Heiri, O., Seppä, H., Bjune, A.E., 2010. Strengths and weaknesses ofquantitative climate reconstructions based on late-Quaternary biologicalproxies. The Open Ecology Journal 3, 68e110.
Brooks, S.J., Birks, H.J.B., 2000a. Chironomid-inferred Lateglacial-early Holocenemean July air temperatures for Kråkenes Lake, Western Norway. Journal ofPaleolimnology 23, 77e89.
Brooks, S.J., Birks, H.J.B., 2000b. Chironomid-inferred Late-glacial air temperaturesat Whitrig Bog, Southeast Scotland. Journal of Quaternary Science 15, 759e764.
Brooks, S.J., Birks, H.J.B., 2001. Chironomid-inferred air temperatures from lategla-cial and Holocene sites in north-west Europe: progress and problems. Quater-nary Science Reviews 20, 1723e1741.
Brooks, S.J., Langdon, P.G., Heiri, O., 2007. The Identification and Use of PalaearcticChironomidae Larvae in Palaeoecology. QRA Technical Guide 10. QuaternaryResearch Association, London.
Cameron, N.G., Birks, H.J.B., Jones, V.J., Berges, F., Catalan, J., Flower, R.J., Garcia, J.,Kawecka, B., Koinig, K.A., Marchetto, A., Sánchez-Castillo, P., Scmidt, R.,�Si�sko, M., Solovieva, N., �Stefková, E., Toro, M., 1999. Surface-sediment and epi-lithic diatom pH calibration sets for remote European mountain lakes (AL: PE
N. Holmes et al. / Quaternary Science Reviews 30 (2011) 2793e2804 2803

Author's personal copy
Project) and their comparison with the surface waters acidification programme(SWAP) calibration set. Journal of Paleolimnology 22, 291e317.
Caseldine, C., Geirsdóttir, Á, Langdon, P., 2003. Efstadalsvatn e a multi-proxy studyof a Holocene lacustrine sequence from NW Iceland. Journal of Paleolimnology30, 55e73.
Caseldine, C., Langdon, P., Holmes, N., 2006. Early Holocene climate variability andthe timing and extent of the Holocene thermal maximum (HTM) in northernIceland. Quaternary Science Reviews 25, 2314e2331.
Eggermont, H., Heiri, O., Verschuren, D., 2006. Fossil Chironomidae (Insecta:Diptera) as quantitative indicators of past salinity in African lakes. QuaternaryScience Reviews 25, 1966e1994.
Engels, S., Bohncke, S.J.P., Bos, J.A.A., Brooks, S.J., Heiri, O., Helmens, K.F., 2008a.Chironomid-based palaeotemperature estimates for northeast Finland duringoxygen isotope stage 3. Journal of Paleolimnology 40, 49e61.
Engels, S., Bohncke, S.J.P., Bos, J.A.A., Heiri, O., Vandenberghe, J., Wallinga, J., 2008b.Environmental inferences and chironomid-based temperature reconstructionsfrom fragmentary records of the weichselian early glacial and pleniglacialperiods in the Niederlausitz area (eastern Germany). Palaeogeography, Palae-oclimatology, Palaeoecology 260, 405e416.
Engels, S., Helmens, K.F., Väliranta, M., Brooks, S.J., Birks, H.J.B., 2010. EarlyWeichselian (MIS-5d and 5c) palaeoenvironmental and palaeoclimatic changesin northern Fennoscandia: a multi-proxy study on the lacustrine record of Sokli(Finland). Boreas 39, 689e704.
Hanna, E., Jónsson, J., Ólafsson, J., Valdimarsson, H., 2006. Icelandic coastal sea-surface temperature records constructed: putting the pulse on air-sea-climateinteractions in the northern North Atlantic. Part 1: Comparison withHadISST1 open ocean surface temperatures and preliminary analysis of long-term patterns and anomalies of SSTs around Iceland. Journal of Climate 19,5652e5666.
Heiri, O., Lotter, A.F., 2001. Effect of low count sums on quantitative environmentalreconstructions: an example using subfossil chironomids. Journal of Paleo-limnology 26, 343e350.
Heiri, O., Lotter, A.F., 2003. 9000 years of chironomid assemblage dynamics in anAlpine lake: long-term trends, sensitivity to disturbance and resilience of thefauna. Journal of Paleolimnology 30, 273e289.
Heiri, O., Cremer, H., Engels, S., Hoek, W., Peeters, W., Lotter, A.F., 2007. Late-Glacialsummer temperatures in the Northwest European lowlands: a new chironomidrecord from Hijkermeer, the Netherlands. Quaternary Science Reviews 26,2420e2437.
Holmes, N., 2006. Evaluating the use of subfossil chironomids for the reconstructionof Holocene climate in N and NW Iceland. Unpub. PhD Thesis, University of Exeter.
Huisman, J., Olff, H., Fresco, L.F.M., 1993. A hierarchical set of models for speciesresponse analysis. Journal of Vegetation Science 4, 37e46.
Ilyashuk, E.A., Ilyashuk, B.P., Hammarlund, D., Larocque, I., 2005. Holocene climaticand environmental changes inferred from midge records (Diptera: Chirono-midae, Chaoboridae, Ceratopogonidae) at Lake Berkut, southern Kola Peninsula,Russia. The Holocene 15, 897e914.
Juggins, S., 1994. Gaussian Logit Regression. Unpublished computer programme.Newcastle University, Newcastle upon Tyne.
Juggins, S., 2007. C2 Version 1.5 User guide. Software for Ecological and Palae-oecological Data Analysis and Visualisation. Newcastle University, Newcastleupon Tyne.
Lang, B., Bedford, A., Brooks, S.J., Jones, R.T., Richardson, N., Birks, H.J.B.,Marshall, J.D., 2010a. Early-Holocene temperature variability inferred fromchironomid assemblages at Hawes Water, northwest England. The Holocene 20,943e954.
Lang, B., Brooks, S.J., Bedford, A., Jones, R.T., Birks, H.J.B., Marshall, J.D., 2010b.Regional consistency in Late-glacial chironomid-inferred temperature from fivesites in north-west England. Quaternary Science Reviews 29, 1528e1538.
Langdon, P.G., Barber, K.E., Lomas-Clarke, S.H., 2004. Reconstructing climate andenvironmental change in northern England through chironomid and pollenanalyses: evidence from Talkin Tarn, Cumbria. Journal of Paleolimnology 32,197e213.
Langdon, P.G., Holmes, N., Caseldine, C.J., 2008. Environmental controls on modernchironomid faunas from NW and W Iceland: implications for reconstructingclimate change. Journal of Paleolimnology 40, 273e293.
Langdon, P.G., Leng, M.J., Holmes, N., Caseldine, C.J., 2010. Early Holocene rela-tionships between climate and catchment development in records fromnorthern Iceland. The Holocene 20, 205e214.
Langdon, P.G., Caseldine, C.J., Croudace, I.W., Jarvis, S., Wastegård, S., Crowford, T.C.,2011. A chironomid-based reconstruction of summer temperatures in NWIceland since AD 1650. Quaternary Research 75, 451e460.
Larocque, I., 2001. How many chironomid head capsules are enough? A statisticalapproach to determine sample size for palaeoclimatic reconstructions. Palae-ogeography, Palaeoclimatology, Palaeoecology 172, 133e142.
Larocque, I., Finsinger, W., 2008. Late-glacial chironomid-based temperaturereconstructions for Lago Piccolo di Avigliana in the southwestern Alps (Italy).Palaeogeography, Palaeoclimatology, Palaeoecology 257, 207e223.
Larocque, I., Hall, R.I., Grahn, E., 2001. Chironomids as indicators of climate change:a 100-lake training set from a subarctic region of northern Sweden (Lapland).Journal of Paleolimnology 26, 307e322.
Larocque-Tobler, I., 2010. Reconstructing temperature at Egelsee, Switzerland, usingNorth American and Swedish chironomid transfer functions: potential andpitfalls. Journal of Paleolimnology 44, 243e251.
Livingstone, D.M., Lotter, A.F., 1998. The relationship between air and watertemperatures in lakes of the Swiss Plateau: a case study with palae-olimnological implications. Journal of Paleolimnology 19, 181e198.
Lotter, A.F., Walker, I.R., Brooks, S.J., Hofmann, W., 1999. An intercontinentalcomparison of chironomid palaeotemperature inference models: Europe vsNorth America. Quaternary Science Reviews 18, 717e735.
Luoto, T., 2008. Subfossil Chironomidae (Insecta: Diptera) along a latitudinalgradient in Finland: development of a new temperature inference model.Journal of Quaternary Science 24, 150e158.
Oksanen, J., Minchin, P.R., 2002. Continuum theory revisited: what shape arespecies responses along ecological gradients? Ecological Modelling 157,119e129.
Olander, H., Birks, H.J.B., Korhola, A., Blom, T., 1999. An expanded calibration modelfor inferring lakewater and air temperatures from fossil chironomid assem-blages in northern Fennoscandia. The Holocene 9, 279e294.
Paterson, A.M., Cumming, B.F., Dixit, S.S., Smol, J.P., 2002. The importance of modelchoice on pH inferences from scaled chrysophyte assemblages in NorthAmerica. Journal of Paleolimnology 27, 379e391.
Quinlan, R., Smol, J.P., 2001. Setting minimum head capsule abundance and taxadeletion criteria in chironomid-based inference models. Journal of Paleo-limnology 26, 327e342.
R Development Core Team, 2010. R: A language and Environment for StatisticalComputing. R Foundation for Statistical Computing, Vienna, Austria. http://www.R-project.org URL.
Racca, J.M.J., Wild, M., Birks, H.J.B., Prairie, Y.T., 2003. Separating wheat from chaff:diatom taxon selection using an artificial neural network pruning algorithm.Journal of Palaeolimnology 29, 123e133.
ter Braak, C.J.F., �Smilauer, P., 2002. CANOCO Reference Manual and CanoDraw forWindows User’s Guide: Software for Canonical Community Ordination (version4.5). Microcomputer Power, New York.
Veðurstofa Íslands, 2010 http://www.vedur.isWalker, I.R., Levesque, A.J., Cwynar, L.C., Lotter, A.F., 1997. An expanded surface-
water palaeotemperature inference model for use with fossil midges fromeastern Canada. Journal of Paleolimnology 18, 165e178.
N. Holmes et al. / Quaternary Science Reviews 30 (2011) 2793e28042804


