Embed Size (px)
Citation preview

ARTICLE IN PRESS
Journal of Atmospheric and Solar-Terrestrial Physics 71 (2009) 931–942
Contents lists available at ScienceDirect
Journal ofAtmospheric and Solar-Terrestrial Physics
1364-68
doi:10.1
� Corr
E-m1 N
Univers
journal homepage: www.elsevier.com/locate/jastp
Mesosphere summer echoes, temperature, and meridional wind variations atmid- and polar latitudes
Olof Zeller 1, Peter Hoffmann �, Jurgen Bremer, Werner Singer
Leibniz Institute of Atmospheric Physics, Schlossstr. 6, 18225 Kuhlungsborn, Germany
a r t i c l e i n f o
Article history:
Received 9 September 2008
Received in revised form
24 February 2009
Accepted 8 March 2009Available online 21 March 2009
Keywords:
Middle atmosphere dynamics
Mesospheric summer echoes
Planetary waves
Mesospheric temperatures
26/$ - see front matter & 2008 Elsevier Ltd. A
016/j.jastp.2009.03.013
esponding author.
ail address: [email protected] (P. Hoffm
ow at: Department of Physics and Astrono
ity Road, Leicester LE1 7RH, UK.
a b s t r a c t
VHF Radar echoes in the summer mesosphere at mid- and polar latitudes ([P]MSE—[polar] mesosphere
summer echoes) are connected with very cold temperatures where ice particles can exist. Temperature
variations can cause conditions for the generation and evaporation of ice particles and affect the [P]MSE
occurrence. The impact of temperature and meridional wind oscillations on [P]MSE is described.
Generally at mid-latitudes, strong mesosphere summer echoes are strongly affected by meridional wind
variations if the mean temperature is near the frost point of water vapor. In contrast, at polar latitudes
there is mostly no significant impact of the meridional wind on radar echoes. A mean temperature well
below the frost point and a weaker meridional temperature gradient than at mid-latitudes are reasons
for this reduced influence. Due to higher temperatures in 2002, long period temperature and meridional
wind variations impact the PMSE more than during the other years.
& 2008 Elsevier Ltd. All rights reserved.
1. Introduction
Investigations of the dynamics in the mesosphere have beenmade during the last few decades by radar, lidar, and rocket-launched measurements. In particular, the application of radarobservations allows mostly continuous long-time measurements.Exceptional phenomena of radar measurements are very strongradar echoes during summer at 80–92 km at polar and mid-latitudes ([P]MSE—[polar] mesosphere radar echoes). Theseechoes were detected at first already in 1979 both at mid-latitudes in Katlenburg-Lindau, Germany (Czechowsky et al.,1979) and at polar latitudes in Poker Flat, Alaska (Ecklund andBalsley, 1981). Further [P]MSE observations were performedmostly by VHF radars around 50 MHz (e.g., Bremer et al., 2003).These strong radar echoes are closely related to cold temperaturesin the polar summer mesosphere where ice particles can exist.The physical background of PMSE is comprehensively described inKelley et al. (1987), Cho and Rottger (1997), and Rapp and Lubken(2004). Today, it is well established that charged ice particlesdefinitely play a major role for the creation of PMSE (e.g., Rappand Lubken, 2004). PMSE at polar latitudes of the southernhemisphere have been recently investigated by Morris et al.(2006, 2007), mainly to explain their occurrence in relation to thetemperatures and wind characteristics. Simultaneous measure-
ll rights reserved.
ann).
my, University of Leicester,
ments of PMSE by radars and temperatures by rocket-launchedinstruments show that almost all PMSE occurred at temperaturesbelow the frost point of water vapor (Lubken et al., 2002).
Fig. 1 shows typical observations of radar echoes in thesummer mesosphere at polar latitudes (PMSE at Andenes, 691N)and mid-latitudes (MSE at Kuhlungsborn, 541N), both at the sameday on 21 July 2001. To compare these results over an extendedtime interval, we used signal-to-noise ratios (SNRs) estimatedfrom the vertical beam to calculate occurrence rates ORðSNR4SNRminÞ of [P]MSE greater than a given threshold SNRmin.More details on the comparison of different radars are given inSection 2. The mean occurrence rate of PMSE with SNR 44 dB asmeasured at polar latitudes in Andenes with a value between 80%and 90% (Bremer et al., 2003) is larger than in Kuhlungsborn atmid-latitudes where MSE are only observed with a meanoccurrence rate of 7% (Zecha et al., 2003). This difference ismainly caused by higher temperatures and therefore by a reducedoccurrence of ice particles at mid latitudes. At mid-latitudes, themean temperature over Kuhlungsborn at 85 km is near the watervapor frost point (Fig. 2, Gerding et al., 2007), whereas thetemperature at polar latitudes over Andenes is clearly below thisfrost point (Fig. 2, Lubken, 1999).
Simultaneous and continuous common volume measurements of[P]MSE and temperature are generally only possible with restric-tions. Temperature measurements by lidar have been performedmainly during night. Due to technical improvements, lidar measure-ments over Kuhlungsborn at daytime and clear weather conditionsare possible since 2003 (Fricke-Begemann et al., 2002). Butsimultaneous temperature and MSE measurements have only beenperformed for some case studies (Gerding et al., 2007). Additionally,

ARTICLE IN PRESS
Fig. 2. Mean temperature over Kuhlungsborn by potassium lidar measurements
(Gerding et al., 2007) and over Andenes by falling spheres (Lubken, 1999) at an
altitude of 85 km; dashed black line shows the saturation level S ¼ 1 at 85 km for a
water vapor mixing ratio of 4 ppmv.
Fig. 1. Signal-to-noise ratio (SNR) of mesosphere radar echoes over Kuhlungsborn (541N) and Andenes (691N) on 21.07.2001.
O. Zeller et al. / Journal of Atmospheric and Solar-Terrestrial Physics 71 (2009) 931–942932
there are continuous temperature measurements by the meteorradars at Juliusruh and Andenes, and also by the OSWIN VHF radarat Kuhlungsborn since 2005. But these temperatures are only dailymean values at the centroid altitude of the meteor trails between 87and 90 km whereas the mean [P]MSE altitude is about 85 km. Inaddition, there are uncertainties of the temperature determinationwhich can cause errors up to 10–15 K (Singer et al., 2004) and leadtherefore to restrictions by comparing [P]MSE and temperaturesderived from the meteor radar data.
The low temperatures mainly in the upper polar mesospherecan only exist due to upward motions of the air associatedwith adiabatic cooling caused by breaking gravity waves in theupper mesosphere. The resulting mesospheric circulation, e.g. asdescribed in detail by Garcia and Solomon (1985). Shows duringsummer below 90 km strong westward directed winds (negativeu, Fig. 3 top) and a meridional wind directed to the winter pole(negative v, Fig. 3 bottom). The dotted curves in both panels showthe PMSE occurrence mainly persisting during the time intervalwith negative v in accordance with the cold summer conditions inthe upper mesosphere. In this paper we are studying in detail theimpact of day to day variations of temperatures and meridional
winds mainly caused by planetary waves on mesospheric radarechoes at both polar and mid-latitudes.
2. Data
The VHF radars used for the investigations of [P]MSE are theALWIN radar at Andenes (69.31N; 16.01E) and the OSWIN radar atKuhlungsborn (54.11N; 11.81E), both working at 53.5 MHz. Sometechnical details of both radars are summarized in the left part ofTable 1. A detailed description of the ALWIN radar can be found inLatteck et al. (1999) and of the OSWIN radar in Zecha et al. (2003).As the technical properties of both radars are very similar,differences of the derived properties of mesospheric summerechoes at polar and mid-latitudes are mainly caused by differentreasons like temperatures, winds and ionizations influencing thevariation of [P]MSE. For the investigation of MSE, radar data weretaken from the summer months of the years 1998 and 2000–2006whereas for PMSE the data were taken from observations in1999–2005. These data were averaged over 1 h and then used toestimate daily occurrence rates in per cent where the observedecho power (given in values of the SNR) is greater than a thresholdvalue SNRmin. The used SNRmin values were already described inBremer et al. (2006) in detail and depend from the usedmeasuring programs and technical changes. For the ALWINradar, SNRmin ¼ 4 dB were applied for the years 1999–2003 and2005, SNRmin ¼ 1 dB were used for 2004. For the investigation ofMSE with the OSWIN radar, a value of SNRmin ¼ 3 dB has beenused for the years 1998 and 2001–2006 and SNRmin ¼ 6 dB for2000. However, these threshold values are for the investigationsin this paper of less importance.
Data of the wind components at mid-latitude are obtained atJuliusruh (54.61N; 13.41E) by measurements with the MF radar in1998 and 2001–2006 and with the All-Sky meteor radar in 2000.At high latitudes, the mean winds were derived from measure-ments with the MF radar at Andenes in 1999–2005. Detailedtechnical informations of the MF radar at Juliusruh are describedin Singer et al. (1992) and Hoffmann et al. (2002) and of the MFradar at Andenes in Singer et al. (1997). While wind data by MFradar are determined by the spaced antenna method (Briggs,1984), measurements by meteor radar are based on Doppler

ARTICLE IN PRESS
Fig. 3. Zonal (top) and meridional (bottom) wind over Andenes at an altitude range between 70 and 98 km by MF radar measurements in 2002; dotted lines show PMSE
occurrence rate during summer 2002.
Table 1Technical details of the VHF, MF, and the meteor radars used at Andenes, Kuhlungsborn, and Juliusruh for observations of [P]MSE, wind, and temperature, respectively.
Radar ALWIN OSWIN Andenes MF Juliusruh MF All-Sky meteor
Location Andenes Kuhlungsborn Andenes Juliusruh Andenes, Juliusruh
Geographic coordinates 69.31N; 16.01E 54.11N; 11.81E 69.31N; 16.01E 54.61N; 13.41E
Frequency (MHz) 53.5 53.5 1.98 3.18 32.55
Peak power (kW) 36 60 50 128 12
Pulse length ðmsÞ 2 2 27 27 13.3
Range resolution 300 m 300 m 4 km 2 km 2 km
Height range (km) 75–95 75–95 70–98 70–98 80–100
Method DBS SA, DBS SA SA Interferometer
O. Zeller et al. / Journal of Atmospheric and Solar-Terrestrial Physics 71 (2009) 931–942 933
measurements on ionization tracks of invading meteoroids(Hocking et al., 2001; Singer et al., 2003). Technical details ofthese three radars are shown in the right part of Table 1.
Temperature data at an altitude of about 90 km are obtained bymeasurements of the All-Sky meteor radar at Juliusruh in 2000and 2001 and at Andenes in 2002–2005 as well as by meteormeasurements of the OSWIN radar near 87 km at Kuhlungsbornsince 2005. The temperature is estimated from the decay time ofthe meteor echoes (Hocking, 1999; Hocking et al., 2004). It isdetermined at the altitude of the maximum of the heightdistribution of detected meteor tracks. At Andenes (691N),there is an annual weak variation of this altitude, being slightlybelow 90 km during summer and above 90 km during equinoxes(Singer et al., 2004).
As already explained in Section 1, charged ice particles arerequired for the existence of [P]MSE (e.g., Rapp and Lubken, 2004).Therefore, temperatures below the frost point of water vapor arenecessary. The frost point of water vapor is characterized by thesaturation degree S ¼ 1 which corresponds to the ratio of watervapor pressure e and the saturation vapor pressure pS where pS
has to be estimated using the equation of Marti and Mauersberger(1993):
lg pS ¼ �2663:5=T þ 12:357 (1)
and e is calculated using a water vapor mixing ratio m from modeldata (Korner and Sonnemann, 2001). A typical value for the frostpoint of water vapor is 148 K for m ¼ 4 ppmv and for an altitude of85 km.
3. Results
3.1. Temperature and [P]MSE
Rocket-borne temperature measurements in the upper sum-mer mesosphere over Andøya rocket range show that PMSE onlyoccur at temperatures below the water vapor frost point (Inhesteret al., 1994; Lubken et al., 2002). However, a comparison of longterm data of [P]MSE and the temperature is only possible withrestrictions. As mentioned above, there are only a few cases ofsimultaneous measurements of temperature and MSE by lidarmeasurements at Kuhlungsborn (Gerding et al., 2007). Therefore,investigations between MSE and lidar-based temperatures areonly suitable for comparisons at short time scales of hours andminutes where the conditions of the generation of ice particles orthe propagation of gravity waves can be derived. Simultaneousmeasurements of lidar-based temperatures and PMSE at Andeneswere impossible as temperature measurements by the ALOMARRMR lidar reach to an altitude of only 60 km during summer.
There are, however, continuous time series of daily tempera-ture data from measurements by All-Sky meteor radar for analtitude of around 90 km at Juliusruh between November 1999and August 2001 and at Andenes since September 2001. Since2005 there are also temperature data for an altitude of around87 km derived from meteor observation with the OSWIN radar atKuhlungsborn. Fig. 4 shows daily MSE occurrence rates (bottompart) and mean daily temperatures during summer 2005 (dots inthe upper part of Fig. 4). The mean temperature during summer

ARTICLE IN PRESS
Fig. 4. Daily values of MSE occurrence rate (bars, bottom panel) and temperature
at 87 km (top panel) from OSWIN radar during summer 2005 over Kuhlungsborn,
solid curve: polynomial fit of the daily mean temperature, dashed line signs
saturation degree S ¼ 1 for a water vapor concentration of 4 ppmv and an altitude
of 85 km.
O. Zeller et al. / Journal of Atmospheric and Solar-Terrestrial Physics 71 (2009) 931–942934
around the water vapor frost point is shown by a polynomial fit ofthe daily mean temperatures (solid curve). MSE occur often attemperatures below the water vapor frost point, but there are alsodays with MSE observation at temperatures above the frost point.This is only possible, if diurnal temperature deviations are greatenough that, during particular time phases, temperatures belowthe frost point can exist. Such deviations may be caused byatmospheric tides and/or gravity waves and lead to temperaturevariations up to �30 K as observed by lidar measurements(Gerding et al., 2007). Conversely, there are days with meantemperature below the water vapor frost point and without anyMSE which can also be caused by temperature variations due toatmospheric waves. Especially short-time temperature variationswith periods of only a few hours can hinder the growth of iceparticles to sizes, which are great enough ð45 nmÞ for theexistence of MSE (Berger and von Zahn, 2007). Another possiblereason is the freeze-drying effect caused by sedimentation of iceparticles leading to a decrease of the frost point temperature(Berger and von Zahn, 2007). The MSE occurrence rate andthe temperature derived from by OSWIN radar measurementsat Kuhlungsborn are negative correlated (as expected, but notshown here).
At high latitudes, the daily values of temperature at an altitudeof about 90 km (Fig. 5 top left), the PMSE SNR (Fig. 5 bottom left,bars) and its occurrence rate (curves) over Andenes are shown forthe period between 10 May and 5 September 2002 and 2003 inFig. 5 (left). The mean temperatures of 2002 and 2003 are lowerthan the temperature over Kuhlungsborn (see Fig. 4) and, duringsummer, clearly below the water vapor frost point. But in 2002,the temperature is about 10 K higher than in 2003 due toenhanced activities of planetary Rossby waves in the southernhemisphere which give rise to higher temperatures in the upper
summer mesosphere in the northern hemisphere (Becker et al.,2004; Becker and Fritts, 2006). This is in accordance with lowerPMSE SNR and occurrence rate values in 2002 than in 2003 (Fig. 5bottom left). Thus, the mean temperature in 2002 is closer to thesublimation point of water vapor than in 2003. It can be expectedthat temperature variations have more effects on the creation anddisappearance of ice particles in 2002 than in 2003.
To investigate this idea more exactly, sliding correlationsbetween the PMSE SNR and the temperature, using 45-dayintervals, have been performed for the complete PMSE season in2002 and 2003 (Fig. 5, right). Note that most correlation valuesbetween �0:65 and �0:4 during the PMSE season in 2002 aresignificant with 95% as estimated with the Fisher’s F-Test(Taubenheim, 1969), indicating a clear dependence between lowtemperatures and PMSE. These values vary only slightly duringthe PMSE season which confirms the assumption that thetemperature was mostly during this time quite near the sublima-tion point. In contrast, the pattern of the sliding correlation valuesof the PMSE season in 2003 is very different to 2002. At thebeginning and at the end of the season the correlation values aresignificant and strongly negative, being between �0:8 and �0:5,due to variations of the temperature around the sublimation pointof water vapor at these times. However, in the middle of theseason, the correlation is weaker, and leads to values above 0which are not significant. During the middle of the PMSE season in2003, the average temperature is so low that ice particles can existduring whole time. Therefore, temperature variations have only alow impact on PMSE variations at this time, and other impacts onthe PMSE occurrence, e.g., due to variations of the ionization rateplay a more dominant role.
As mentioned above, planetary waves are able to modulate thetemperature characteristics. Their period duration varies between2 and 18 d with preferred periods of 2, 4–7, and 16 d (e.g., Salby,1984). Manson et al. (2004) reported on longitudinal andlatitudinal variations of observed spectra between 8 h and 30 dand they found also for planetary waves different amplitudes anddifferent periods at different sites. To investigate the impact ofplanetary waves on temperature and PMSE, daily variations oftemperature DT and DPMSE have been computed for the summerseasons 2002 and 2003 by a subtraction of a polynomial seasonalfit from the observed temperature and PMSE values. These dataare used for a Morlet wavelet analysis method (e.g., described inTorrence and Compo, 1998). The left part of Fig. 6 shows the powerspectral density (PSD) of DT (above) and DPMSE (bottom) for2002. In the middle of June (days 160–175) temperature and PMSEvariations are determined by a 4 d variation followed by a 7–8 dvariation (days 172–190) until the beginning of July. During thefirst half of July (days 186–200) the PMSE and T fluctuations aredominated by a very marked 4–5 d variation. At the end of July(days 205–211), a 2–3 d variation was most evident followed by aweak 4 d variation at the beginning of August (days 214–220)before the PMSE SNR decreased. A comparison between the PSD ofDT and DPMSE reveals a coincidence of the preferred periods witha confidence level of more than 90% in June and July. The resultsshow that PMSE variations were strongly affected by variations ofthe temperature due to planetary waves with different periods in2002. In contrast there were almost no agreements of preferredperiods between T and PMSE variation in 2003 (right part ofFig. 6). The reason is the clearly lower mean temperature, thusallowing the influence of temperature variations on PMSE to beneglected during the main 2003 PMSE season. These resultsconfirm the results of the sliding correlations in Fig. 5 (rightpanel).
Despite the uncertainties of the temperature values estimatedfrom the meteor radar measurements, the results show a clearcorrelation between the temperature and the mesosphere

ARTICLE IN PRESS
Fig. 5. Left bottom: daily PMSE signal-to-noise ratio (SNR, bars) and PMSE occurrence rate (dotted curve) from ALWIN radar during summer 2002 and 2003; left top:
temperature by All-Sky meteor radar at about 90 km (top panel) over Andenes; right: sliding 45 d correlations sr between temperature and PMSE SNR during summer 2002
(top) and summer 2003 (bottom).
O. Zeller et al. / Journal of Atmospheric and Solar-Terrestrial Physics 71 (2009) 931–942 935
summer echoes at polar latitudes if the temperatures are near thefrost point of water vapor. Comparisons between temperature andpolar mesospheric clouds (PMC) brightness as derived by satellitemeasurements show also a modulation of PMC by temperaturevariations due to planetary waves (Merkel et al., 2008).
3.2. [P]MSE and wind
In addition to the comparison between [P]MSE and tempera-ture, the meridional wind component is used for the comparisonwith [P]MSE. In the upper mesosphere, the horizontal tempera-ture gradient is directed to the equator (e.g., Berger and von Zahn,1999; von Zahn and Berger, 2003). At the altitude range of around85 km there is a well pronounced temperature increase towardsthe equator, particularly south of 701N. A negative meridionalwind (towards equator) will provide an advection of cold airinto lower latitudes, and conversely, a positive meridionalwind (towards North Pole) leads to an advection of warm air intohigh latitudes.
Mean negative meridional winds v during the [P]MSE seasonare presented in Fig. 3, bottom panel. However, v is superimposedby variations which are described as v ¼ vþ Dv whereas Dv is thedeviation of v. Variations with a period of 4–7 d, mainly caused byplanetary Rossby waves, particularly impact the fluctuations ofwind and temperature in the mesosphere, e.g., as a 5 d wave(Geisler and Dickinson, 1976). Observations show significantnegative correlations between the temperature and noctilucentclouds over Northwest Europe at periods of 5 d (Kirkwood and
Stebel, 2003). The 5 d wind variations were also observed at mid-latitudes in the summer mesosphere (Jacobi et al., 1998). Recentinvestigations result also in planetary waves with a preferredperiod of 6.5 d (Liebermann et al., 2003; Liu et al., 2004; Rigginet al., 2006). Therefore, this study focuses on [P]MSE andmeridional wind variations with periods between 4 and 7 d.
To illustrate the possible influence of such wind variations, weassume as a hypothesis the existence of a 6 d wave. The amplitudeof this wave jDvmaxj may be 5 m/s. Negative Dv means anenhancement of cold air advection into southern direction andleads therefore to a temperature decrease. Positive Dv leads to aweakening of cold air advection or in case of Dvþ v40 to a warmair advection into northern direction and leads therefore to atemperature rise. At the transition of Dv from negative to positivevalues, the minimum temperature Tmin should be reached, andvice versa, from positive to negative the temperature maximumTmax (left panels of Fig. 7). Since the largest density of ice particlesis assumed at Tmin, the [P]MSE occurrence rate should have itsmaximum at this moment.
3.2.1. Mid-latitudes
The hypothesis described in Section 3.2 has been tested with asuperimposed epoch analysis (right panels of Fig. 7). Hereintervals of 7 d have been chosen from the data sets of v at84–88 km and the associated MSE occurrence rate. For mid-latitudes, data of v are based on measurements at Juliusruh withMF radar in 1998 and 2001–2006 and in 2000 with meteor radar.The deviations Dv have been derived by a subtraction of the 7 d

ARTICLE IN PRESS
Fig. 6. Spectra power density of a Morlet wavelet analysis for fluctuations of the temperature DT by meteor radar at about 90 km and DPMSE signal-to-noise ratio by ALWIN
radar at 81.2–88.4 km over Andenes during summer 2002 (left) and summer 2003 (right), respectively; white lines show 90% significance level.
Fig. 7. Left: hypothesis concerning the connection between MSE (solid curves) and v (dashed curves) assuming the influence of a 6 d wave; right: superimposed epoch
analysis of v at 84–88 km over Juliusruh (dashed curves) and the corresponding MSE occurrence rate (bars) during the time range 1998 and 2000–2006; top: maximum
increase of v at day 0, bottom: maximum decrease of v at day 0; error bars of MSE mean values at days �3, 0, and +3, respectively, mark the 95% significance level.
O. Zeller et al. / Journal of Atmospheric and Solar-Terrestrial Physics 71 (2009) 931–942936
ARTICLE IN PRESS
O. Zeller et al. / Journal of Atmospheric and Solar-Terrestrial Physics 71 (2009) 931–942 937
mean values to show clearly the influence of the wind variationwith periods smaller than 7 d on the MSE occurrence rates. MSEdata are based on measurements with OSWIN radar at Kuhlungs-born. Day 0 is chosen at moments with a maximum increase of v,where the difference between a v minimum and the following v
maximum has to be at least 5 m/s (Fig. 7, top right panel). To checkthe opposite behavior, the day 0 has been chosen at momentswith a maximum decrease of v (Fig. 7, bottom right panel). Theindividual v and their associated MSE values of the discrete dayshave been averaged.
The obtained Dv variations are in both cases very similar tothose of the hypothesis with the assumed 6 d wave. Also patternand development of the MSE occurrence rate show clearsimilarities with an MSE-maximum in relation to Dv at day 0(Fig. 7 top) and an MSE minimum at day 0 (Fig. 7 bottom). To testthe significance of these results, the following equation is used(Taubenheim, 1969):
F ¼ tðn� 2Þsffiffiffinp (2)
F is the length of the error bar, tðn� 2Þ the Student’s testparameter for a definite significance level, n is the sample number,and s is the standard deviation. If the difference between themaximum and minimum of the MSE occurrence rate is greaterthan the amount of their associated error bars, maximum andminimum will be significantly different. The MSE minimum at day�3 and the maximum at day 0 in Fig. 7 (top right) are significantlydifferent with a confidence level of 95%. The same is also true forthe opposite case as demonstrated by the corresponding values inFig. 7 (bottom right). These results confirm the hypothesis at leastqualitatively and show that MSE are modulated by variations ofthe meridional wind at mid-latitudes.
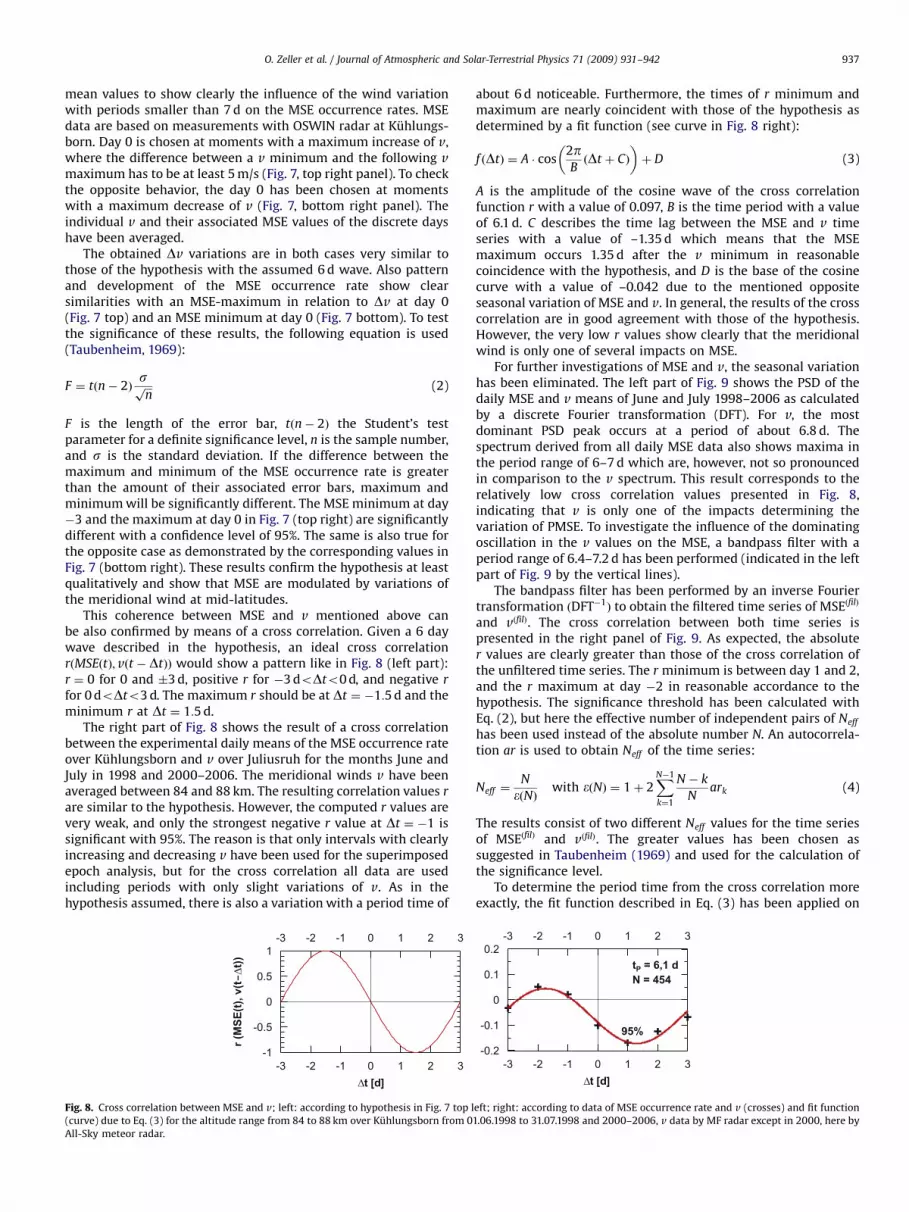
This coherence between MSE and v mentioned above canbe also confirmed by means of a cross correlation. Given a 6 daywave described in the hypothesis, an ideal cross correlationrðMSEðtÞ;vðt � DtÞÞ would show a pattern like in Fig. 8 (left part):r ¼ 0 for 0 and �3 d, positive r for �3 doDto0 d, and negative r
for 0 doDto3 d. The maximum r should be at Dt ¼ �1:5 d and theminimum r at Dt ¼ 1:5 d.
The right part of Fig. 8 shows the result of a cross correlationbetween the experimental daily means of the MSE occurrence rateover Kuhlungsborn and v over Juliusruh for the months June andJuly in 1998 and 2000–2006. The meridional winds v have beenaveraged between 84 and 88 km. The resulting correlation values r
are similar to the hypothesis. However, the computed r values arevery weak, and only the strongest negative r value at Dt ¼ �1 issignificant with 95%. The reason is that only intervals with clearlyincreasing and decreasing v have been used for the superimposedepoch analysis, but for the cross correlation all data are usedincluding periods with only slight variations of v. As in thehypothesis assumed, there is also a variation with a period time of
Fig. 8. Cross correlation between MSE and v; left: according to hypothesis in Fig. 7 top l
(curve) due to Eq. (3) for the altitude range from 84 to 88 km over Kuhlungsborn from 0
All-Sky meteor radar.
about 6 d noticeable. Furthermore, the times of r minimum andmaximum are nearly coincident with those of the hypothesis asdetermined by a fit function (see curve in Fig. 8 right):
f ðDtÞ ¼ A � cos2pBðDt þ CÞ
� �þ D (3)
A is the amplitude of the cosine wave of the cross correlationfunction r with a value of 0.097, B is the time period with a valueof 6.1 d. C describes the time lag between the MSE and v timeseries with a value of –1.35 d which means that the MSEmaximum occurs 1.35 d after the v minimum in reasonablecoincidence with the hypothesis, and D is the base of the cosinecurve with a value of –0.042 due to the mentioned oppositeseasonal variation of MSE and v. In general, the results of the crosscorrelation are in good agreement with those of the hypothesis.However, the very low r values show clearly that the meridionalwind is only one of several impacts on MSE.
For further investigations of MSE and v, the seasonal variationhas been eliminated. The left part of Fig. 9 shows the PSD of thedaily MSE and v means of June and July 1998–2006 as calculatedby a discrete Fourier transformation (DFT). For v, the mostdominant PSD peak occurs at a period of about 6.8 d. Thespectrum derived from all daily MSE data also shows maxima inthe period range of 6–7 d which are, however, not so pronouncedin comparison to the v spectrum. This result corresponds to therelatively low cross correlation values presented in Fig. 8,indicating that v is only one of the impacts determining thevariation of PMSE. To investigate the influence of the dominatingoscillation in the v values on the MSE, a bandpass filter with aperiod range of 6.4–7.2 d has been performed (indicated in the leftpart of Fig. 9 by the vertical lines).
The bandpass filter has been performed by an inverse Fouriertransformation ðDFT�1
Þ to obtain the filtered time series of MSEðfilÞ
and vðfilÞ. The cross correlation between both time series ispresented in the right panel of Fig. 9. As expected, the absoluter values are clearly greater than those of the cross correlation ofthe unfiltered time series. The r minimum is between day 1 and 2,and the r maximum at day �2 in reasonable accordance to thehypothesis. The significance threshold has been calculated withEq. (2), but here the effective number of independent pairs of Neff
has been used instead of the absolute number N. An autocorrela-tion ar is used to obtain Neff of the time series:
Neff ¼N
�ðNÞwith �ðNÞ ¼ 1þ 2
XN�1
k¼1
N � k
Nark (4)
The results consist of two different Neff values for the time seriesof MSEðfilÞ and vðfilÞ. The greater values has been chosen assuggested in Taubenheim (1969) and used for the calculation ofthe significance level.
To determine the period time from the cross correlation moreexactly, the fit function described in Eq. (3) has been applied on
eft; right: according to data of MSE occurrence rate and v (crosses) and fit function
1.06.1998 to 31.07.1998 and 2000–2006, v data by MF radar except in 2000, here by

ARTICLE IN PRESS
Fig. 9. Left: power spectral density of the MSE occurrence rate (bottom) and of v (top) over Kuhlungsborn from 01.06.1998 to 31.07.1998 and of 2000–2006, vertical lines
represent the cut-off periods of the applied rectangle bandpass filter (6.2–7.4 d); right: cross correlation of the filtered data sets vðfilÞ and MSEðfilÞ similar as in Fig. 8 right.
O. Zeller et al. / Journal of Atmospheric and Solar-Terrestrial Physics 71 (2009) 931–942938
the r values derived from the filtered data. Here a dominantperiod of about 6.8 d has been found. These results exhibit asignificant correlation between the daily MSE occurrence rate anddaily means of the meridional wind component v. Qualitativelythe results are in agreement with the hypothesis in Figs. 7 and 8.Therefore the result of the presented analysis confirms that MSEare noticeably affected by planetary waves.
It must be explicitly pointed out that the correlations betweenMSE and v differ from year to year. Investigations of the years1998 and 2000–2006 show that the minimum of the crosscorrelation between the filtered time series of MSE and v is alwaysbetween 0oDto2 d, qualitatively in agreement with the hypoth-esis. The absolute values of the r maximum of the crosscorrelations differ for the discrete years (not shown here).However, these values are mostly significant. The period durationsvary between 4.8 d in 2001 and 6.6 d in 2002. These results showthat the dominant period of the planetary waves changes asdiscussed by Manson et al. (2004) due to different conditions(winds, other wave modes, interaction between gravity waves andplanetary waves).
As an example for the correlation between the MSE occurrenceand the meridional wind v of an individual year, the data from theMSE season of 30.05.2000–31.07.2000 has been chosen. The PSDcomputed by means of the DFT analysis shows in both cases aclear peak at a period of 6.3 d. Hence the bandpass filter is usedwith a period range of 5.7–7.1 d (Fig. 10 left). The cross correlationbetween the filtered time series MSEðfilÞ and vðfilÞ show very large r
values with a maximum of more than 0.8 (Fig. 10 right). Becauseof the filtering, the obtained large correlation values have beenexpected. The period of the fit curve (see Eq. (3)) with 6.3 d andthe minimum of the fit curve at about Dt ¼ 2 d are in reasonableagreement with the cross correlation of the unfiltered MSE and v
data and the hypothesis.However, the PSD describes only the mean status of MSE and v
in 2000. Therefore, a Morlet wavelet analysis has been performedfor MSEðfilÞ (Fig. 11 left bottom) and for vðfilÞ (Fig. 11 left top) toget insight into the PSD characteristics and to detect timeintervals with commonly high PSD amplitudes of MSEðfilÞ andvðfilÞ. During the time interval between the days 172 and 192(20.06.2000–10.07.2000, limited by vertical lines) the PSDamplitudes of both MSEðfilÞ and vðfilÞ are strongly enhanced. Across correlation of this data shows very high r-values of almost 1and a period of 6.5 d (Fig. 11 right). The minimum of the fit curve at1.5 d is again in good agreement with the hypothesis (Fig. 11 right).
Similar to the weak cross correlation presented in Fig. 8, thereason of the weak spectral peaks of the MSE is probably caused
by the use of the data of all years in comparison to the data of onlyone year (Fig. 10) or from a selected period (Fig. 11)
Generally, meridional wind variations clearly impact the MSEoccurrence due to high sensitivity of ice particles owing to smalltemperature variations in the summer mesopause region at midlatitudes. By means of a bandpass filter which eliminatesparticularly irregular disturbances on MSE like solar activityevents, the impact of v on MSE is very marked and stronger duringselected periods (Figs. 10 and 11) in comparison to the use of allyears (Fig. 9).
3.2.2. High latitudes
During the last 10 years, different studies show some impact ofplanetary waves with periods of around 5 d on PMSE and NLC(Kirkwood and Rechou, 1998; Kirkwood et al., 2002; von Savignyet al., 2007; Merkel et al., 2008). Therefore the hypothesis (Fig. 7left) has also been applied on PMSE and meridional windvariations. However, the impact of v on PMSE is expected to beless than at mid-latitudes because of a mean temperature clearlybelow the water vapor frost point (Lubken, 1999) and a smallermeridional temperature gradient at high latitudes (von Zahn andBerger, 2003). The results derived from observations at Andenesshow in fact a weak and not significant impact of v on PMSE. Incontrast to mid-latitudes, minimum and maximum of v and PMSEoccur at same day (Fig. 12 left). This is in agreement with a crosscorrelation between PMSE and v with strongest negative r-valuewith zero time lag (Fig. 12 right). In addition these results are inaccordance with correlations between the temperature and v;here the strongest r-value occurs also without time lag.
Generally, there is only a weak impact of the meridional windvariations on PMSE. The reason could be that v inducedtemperature variations are not great enough to exceed the watervapor frost point regularly. However, the summer 2002 is affectedby abnormal high temperatures due to an enhanced planetarywave activity in the southern hemisphere and an interhemi-spheric coupling (Becker et al., 2004). This fact leads to a strongerdependence of the PMSE on temperature variations (see Fig. 5,right panel). Therefore an impact of v variations on PMSE can beexpected. A PSD is performed for the daily values of the PMSEstrength and the meridional wind in the time range of01.06.2000–23.08.2002 in the same manner as for the PSD ofthe MSE and v in summer 2000 (see Fig. 10). The result is shown inthe left part of Fig. 13. There are common PSD peaks of PMSE and v
within a period of 4–5 d. A bandpass filter has been performed forperiods between 3.8 and 5.3 d to obtain the filtered time seriesPMSEðfilÞ and vðfilÞ. The cross correlation between these data sets

ARTICLE IN PRESS
Fig. 10. Similar as in Fig. 9, but here only for the time range from 30.05.2000 to 31.07.2000 and a bandpass between 5.7 and 7.1 d.
2
4
82
4
8
160
0 80 100604020
170 210200190180
0 5 10 15
Fig. 11. Left: power spectral density of a Morlet wavelet analysis for meridional wind (top) and MSE occurrence rate (bottom) filtered with a rectangle bandpass filter of the
period range between 5.7 and 7.1 d from 30.05.2000 to 31.07.2000 (days 151–213), vertical lines mark the time interval with common high power spectral density
amplitude for vðfilÞ and MSEðfilÞ , areas limited by white lines are significant with 95%; right: cross correlation between fitted curves (Eq. (3)) vðfilÞ and MSEðfilÞ from 20.06.2000
to 10.07.2000 (days 172–192).
Fig. 12. Left: superimposed epoch analysis consisting of 52 samples of v at 84–88 km (dashed curve) and corresponding PMSE signal-to-noise ratio at 81.2–88.4 km (bars) at
Andenes selected from the years 1999–2005 with a maximum increase of v at day 0; right: cross correlation between the daily values of the PMSE strength and v over
Andenes from 01.06 to 31.07 of the years 1999–2005.
O. Zeller et al. / Journal of Atmospheric and Solar-Terrestrial Physics 71 (2009) 931–942 939

ARTICLE IN PRESS
Fig. 13. Left: power spectral density of the PMSE signal-to-noise ratio at 81.2–88.4 km and v at 84–88 km over Andenes from 01.06.2002 to 23.08.2002, vertical lines
represent the cut-off periods of the applied rectangle bandpass filter; right: cross correlation of the filtered data sets vðfilÞ and PMSEðfilÞ from 01.06.2002 to 23.08.2002 similar
as in Fig. 12 right.
0
2
4
82
4
8
160 180 200 220
8060400 20
5 10 15
Fig. 14. Left: power spectral density of a Morlet wavelet analysis for meridional wind (top) and PMSE signal-to-noise ratio (bottom) filtered with a rectangle bandpass filter
with cut-off periods 3.8 and 5.3 d from 01.06.2002 to 23.08.2002 (days 152–235), vertical lines describe the time interval with high power spectral density amplitude for
vðfilÞ and PMSEðfilÞ , areas limited by white lines are significant with 95%; right: cross correlation with fit curve (Eq. (3)) between vðfilÞ and PMSEðfilÞ from 05.07.2000 to
25.07.2000 (days 186–206).
O. Zeller et al. / Journal of Atmospheric and Solar-Terrestrial Physics 71 (2009) 931–942940
show significant r values and a time lag of 0.5 d between the v
minimum and the PMSE maximum (Fig. 13 right). This time lag isin the same direction as in the hypothesis (see Fig. 7 left) butwith a smaller amount of r, thus demonstrating a small impactof v on PMSE.
A Morlet wavelet analysis of the 2002-PMSEðfilÞ and vðfilÞ datashow periods of strong PSD (Fig. 14). An interval with a commonlystrong PSD of PMSEðfilÞ and vðfilÞ has been found between 05.2000and 25.07.2002 (days 186–206) as confined by vertical lines. Thecross correlation of the data during this interval yield very highabsolute correlation values of more than 0.9 and a time lag of 0.7 d(Fig. 14 right). The mean period of about 4.5 d is in accordancewith PMC observations showing periods of 4.3–5.2 d (Merkelet al., 2008). The results show that PMSE are modulated bymeridional wind variations when the mean temperature isabnormal high as in 2002. A similar analysis with MSE data atmid-latitudes during summer 2002 (not shown here) gave adominating period of about 6.6 d thus indicating that the observedoscillations caused by planetary waves may lead to different time
lags between [P]MSE and meridional winds or to differentobserved periods of the planetary waves at different latitudes(e.g., Manson et al., 2004).
4. Conclusion and outlook
In this study the impact of temperature and meridional windvariations on VHF radar echoes in the summer mesosphere atpolar (Andenes, 691N) and mid-latitudes (Kuhlungsborn, 541N) isdiscussed. Generally, [P]MSE variations can be used to support theinvestigation of the thermal and dynamic structures of the uppermesosphere, which are difficult to measure directly. Here thefocus is mainly directed on oscillations with a periodicity between4 and 8 d which is typical for planetary waves. The requirementsfor [P]MSE are ice particles, so the temperature should be belowthe frost point of water vapor. At temperatures around the watervapor frost point, the strongest and significant anticorrelationsbetween temperature and [P]MSE variations were found thusconfirming the need for cold temperatures.

ARTICLE IN PRESS
O. Zeller et al. / Journal of Atmospheric and Solar-Terrestrial Physics 71 (2009) 931–942 941
Meridional wind variations are positively correlated with thetemperature, so an impact on [P]MSE was expected. Comprehen-sive investigations show that the impact of the meridional wind isstrong on MSE over Kuhlungsborn, particularly during selectedperiods. The reason is that even small temperature variations cancause the generation or sublimation of ice particles because themean temperature is here around the water vapor frost point. Atpolar latitudes the impact is only weak and mostly not significant.Here the temperature is clearly below the frost point, sotemperature variations caused by the meridional wind have leadto temperatures that still do not exceed the frost point. Here, otherimpacts like geomagnetic activity and ionization variations affectthe PMSE variability (e.g., Bremer et al., 2006; Zeller and Bremer,2009). Only in 2002 there is a significant impact of the meridionalwind variations due to a higher mean temperature level caused bycirculation anomalies.
These results allow by means of the [P]MSE observationsfurther insights into properties of planetary waves in the meso-sphere and their impact on the thermal structure at differentlatitudes. However, there are some questions which should bedealt in the future:
�
Improvement of temperature data deduced from meteor radarmeasurements, e.g., as proposed by Hocking et al. (2007). � Investigation of the periodicity of wind and temperaturevariation in dependence on the latitude, on longitude, and onthe hemisphere. The use of well calibrated radar echoes asdemonstrated by Latteck et al. (2007, 2008) will improve thesecomparisons.
� Change of dominating periods of radar echoes, temperature,and wind in the upper summer mesosphere from year to yearin context with variations within the global circulation.
Acknowledgments
The authors wish to thank Marius Zecha, Dieter Keuer, RalphLatteck, and Jorg Trautner for their permanent support to run theVHF, Meteor, and MF radars and to analyze the data. The radarexperiments at Andenes received funding from the EU 6thframework programme project ALOMAR eARI CT-2003-506208.The authors are also very grateful to both referees for their helpfulcomments and suggestions.
References
Becker, E., Fritts, D.C., 2006. Enhanced gravity-wave activity and interhemisphericcoupling during the MACWAVE/MIDAS northern summer program 2002. Ann.Geophys. 24, 1175–1188.
Becker, E., Mullemann, A., Lubken, F.-J., Kornich, H., Hoffmann, P., Rapp, M., 2004.High Rossby-wave activity in austral winter 2002: modulation of the generalcirculation of the MLT during the MaCWAVE/MIDAS northern summerprogram. Geophys. Res. Lett. 31, L24S03.
Berger, U., von Zahn, U., 1999. The two-level structure of the mesopause: a modelstudy. J. Geophys. Res. 104, 22083–22093.
Berger, U., von Zahn, U., 2007. Three-dimensional modeling of the trajectories ofvisible noctilucent cloud particles: an indication of particle nucleation wellbelow the mesopause. J. Geophys. Res. 112, D16204.
Bremer, J., Hoffmann, P., Latteck, R., Singer, W., 2003. Seasonal and long-termvariations of PMSE from VHF radar observations at Andenes, Norway.J. Geophys. Res. 108 (D8), 8438.
Bremer, J., Hoffmann, P., Hoffner, J., Latteck, R., Singer, W., Zecha, W., Zeller, O.,2006. Long-term changes of mesospheric summer echoes at polar and middlelatitudes. J. Atmos. Solar Terr. Phys. 68, 1940–1951.
Briggs, B., 1984. The analysis of spaced sensor records by correlation techniques. In:Vincent, R. (Ed.), Middle Atmosphere Program, Handbook for MAP, vol. 13.SCOSTEP Secretariat, University of Illinois, pp. 166–186.
Cho, Y.N., Rottger, J., 1997. An updated review of polar mesosphere summer echoes:observation, theory, and their relationship to noctilucident clouds andsubvisible aerosols. J. Geophys. Res. 102 (D2), 2001–2020.
Czechowsky, P., Ruster, R., Schmidt, G., 1979. Variations of mesospheric structuresin different seasons. Geophys. Res. Lett. 6 (6), 459–462.
Ecklund, W.L., Balsley, B.B., 1981. Long-term observations of the arctic mesospherewith the MST radar at Poker Flat, Alaska. J. Geophys. Res. 86 (A9), 7775–7780.
Fricke-Begemann, C., Alpers, M., Hoffner, J., 2002. Daylight rejection with a newreceiver for potassium resonance temperature lidars. Opt. Lett. 27 (21),1932–1934.
Garcia, R.R., Solomon, S., 1985. The effect of breaking gravity waves on thedynamics and chemical composition of the mesosphere and lower thermo-sphere. J. Geophys. Res. 90, 3850–3868.
Geisler, J.E., Dickinson, R.E., 1976. The five-day wave on a sphere with realisticzonal winds. J. Atmos. Sci. 33, 635–641.
Gerding, M., Hoffner, J., Rauthe, M., Singer, W., Zecha, M., Lubken, F.-J., 2007.Simultaneous observations of NLC, MSE and temperature at a mid-latitudestation (541N). J. Geophys. Res. 112, D12111.
Hocking, W.K., 1999. Temperatures using radar-meteor decay times. Geophys. Res.Lett. 26 (21), 3297–3300.
Hocking, W.K., Fuller, B., Vandepeer, B., 2001. Real-time determination of meteor-related parameters utilizing modern digital technology. J. Atmos. Solar Terr.Phys. 63, 155–169.
Hocking, W.K., Singer, W., Bremer, J., Mitchell, N.J., Batista, P., Clemensha, B.,Donner, M., 2004. Meteor radar temperatures at multiple sites derived withSKiMET radars and compared to OH, rocket and lidar measurements. J. Atmos.Solar Terr. Phys. 66, 585–593.
Hocking, W.K., Argall, P.S., Lowe, R.P., Sica, R.J., Ellinor, H., 2007. Height-dependentmeteor temperatures and comparisons with lidar and OH measurements. Can.J. Phys. 85, 173–187.
Hoffmann, P., Singer, W., Keuer, D., 2002. Variability of the mesospheric wind fieldat middle and arctic latitudes in winter and its relation to stratosphericcirculation disturbances. J. Atmos. Solar Terr. Phys. 64, 1229–1240.
Inhester, B., Klostermeyer, J., Lubken, F.-J., von Zahn, U., 1994. Evidence for iceclouds causing polar mesosphere summer echoes. J. Geophys. Res. 99,20937–20954.
Jacobi, C., Schminder, R., Kurschner, D., 1998. Planetary wave activity obtained fromlong-period (2–18 days) variations of mesopause region winds over CentralEurope (521N, 151E). J. Atmos. Solar Terr. Phys. 60, 81–93.
Kelley, M.C., Farley, D.T., Rottger, J., 1987. The effect of cluster ions on anomalousVHF backscatter from the summer polar mesosphere. Geophys. Res. Lett. 14,1031–1034.
Kirkwood, S., Rechou, A., 1998. Planetary wave modulation of PMSE. Geophys. Res.Lett. 25 (24), 4509–4512.
Kirkwood, S., Stebel, K., 2003. Influence of planetary waves on noctilucident cloudoccurrence over NW Europe. J. Geophys. Res. 108 (D8), 8440.
Kirkwood, S., Barabash, V., Brandstrom, B.U.E., Monstrom, A., Stebel, K., Mitchell,N.J., Hocking, W., 2002. Noctilucident clouds PMSE and 5-day planetary waves:a case study. Geophys. Res. Lett. 29 (10), 1411.
Korner, U., Sonnemann, G.R., 2001. Global three-dimensional modeling of the watervapor concentration of the mesosphere-mesospause region and implicationswith respect to the noctilucident region. J. Geophys. Res. 106 (D9), 9639–9651.
Latteck, R., Singer, W., Bardey, H., 1999. The ALWIN MST radar—technical design andperformance. In: Kaldeich-Schurmann, B. (Ed.), Proceedings of the 14th ESASymposium on European Rocket and Balloon Programmes and Related Research,Potsdam, Germany (ESA SP-437). ESA Publications Division, pp. 179–184.
Latteck, R., Singer, W., Morris, R.J., Holdsworth, D.A., Murphy, D.J., 2007. Observationof polar mesosphere summer echoes with calibrated VHF radars at 69� in thenorthern and southern hemispheres. Geophys. Res. Lett. 34, L14805.
Latteck, R., Singer, W., Morris, R.J., Hocking, W.K., Murphy, D.J., Holdsworth, D.A.,Swarnalingam, N., 2008. Observations of polar mesosphere summer echoeswith calibrated MST radars in the northern and southern hemisphere:interhemispheric similarities and dissimilarities. Ann. Geophys. 26, 2795–2806.
Liebermann, R.S., Riggin, D.M., Franke, S.J., Manson, A.H., Meek, C., Nakamura, T.,Tsuda, T., Vincent, R.A., Reid, I., 2003. The 6.5-day wave in the mesosphere andlower thermosphere: evidence for baroclinic/barotropic instability. J. Geophys.Res. 108 (D20), 4640.
Liu, H.-L., Talaat, E.R., Roble, G., Liebermann, R.S., Riggin, D.M., Yee, J.-H., 2004. The6.5-day wave and its seasonal variability in the middle and upper atmosphere.J. Geophys. Res. 109 (D2), D21112.
Lubken, F.-J., 1999. Thermal structure of the Arctic summer mesosphere.J. Geophys. Res. 104 (9), 9135–9149.
Lubken, F.-J., Rapp, M., Hoffmann, P., 2002. Neutral air turbulence and temperaturein the vicinity of polar mesosphere summer echoes. J. Geophys. Res. 107 (D15),4273.
Manson, A.H., Meek, C.E., Chshyolkova, T., Avery, S.K., Thorsen, D., MacDougall, J.W.,Hocking, W., Murayama, Y., Igarashi, K., Namboothiri, S.P., Kishore, P., 2004.Longitudinal and latitudinal variations in dynamic characteristics of the MLT(70–95 km): a study involving the CUJO network. Ann. Geophys. 22, 347–365.
Marti, J., Mauersberger, K., 1993. A survey and new measurements of ice vaporpressure at temperatures between 170 and 250 K. Geophys. Res. Lett. 20,363–366.
Merkel, A.W., Garcia, R.R., Bailey, S.M., Russell, J.M., 2008. Observational studies ofplanetary waves in PMCs and mesospheric temperature measured by SNOEand SABER. J. Geophys. Res. 113, D14202.
Morris, R.J., Murphy, D.J., Vincent, R.A., Holdsworth, D.A., Klekociuk, A.R., Reid, I.M.,2006. Characteristics of the wind, temperature and PMSE field above Davis,Antarctica. J. Atmos. Solar Terr. Phys. 68, 418–435.
Morris, R.J., Murphy, D.J., Klekociuk, A.R., Holdsworth, D.A., 2007. First completeseason of PMSE observations above Davis, Antarctica and their relation towinds and temperature. Geophys. Res. Lett. 34, L05805.

ARTICLE IN PRESS
O. Zeller et al. / Journal of Atmospheric and Solar-Terrestrial Physics 71 (2009) 931–942942
Rapp, M., Lubken, F.-J., 2004. Polar mesosphere summer echoes (PMSE): review ofobservations and current understanding. Atmos. Chem. Phys. 4, 2601–2633.
Riggin, D.M., Liu, H.-L., Lieberman, R.S., Roble, R.G., Russel III, J.M., Mertens, C.J.,Mlynczak, M.G., Pancheva, D., Franke, S.J., Murayama, Y., Manson, A.H., Meek,C.E., Vincent, R.A., 2006. Observation of the 5-day wave in the mesosphere andlower thermosphere. J. Atmos. Solar Terr. Phys. 68, 323–339.
Salby, M.L., 1984. Survey of planetary-scale traveling waves: the state of theory andobservations. Rev. Geophys. Space Phys. 22, 209–236.
Singer, W., Hoffmann, P., Keuer, D., Schminder, R., Kuerschner, D., 1992. Wind in themiddle atmosphere with partial reflection measurements during winter andspring in Middle Europe. Adv. Space Res. 12 (10), 10229–10302.
Singer, W., Keuer, D., Eriksen, W., 1997. The ALOMAR MF radar: technical designand first results. In: Kaldeich-Schurmann, B. (Ed.), Proceedings of the 13th ESASymposium on European Rocket and Balloon Programmes and RelatedResearch, Oeland, Sweden. ESA Publications Division, pp. 101–103.
Singer, W., Bremer, J., Hocking, W.K., Weiss, J., Latteck, R., Zecha, M., 2003.Temperature and wind tides around the summer mesospause at middle andarctic latitudes. Adv. Space Res. 31 (9), 2055–2060.
Singer, W., Bremer, J., Weiss, J., Hocking, W.K., Hoffner, J., Donner, M., Espy, P., 2004.Meteor radar observations at middle and arctic latitudes, part 1: meantemperatures. J. Atmos. Solar Terr. Phys. 66, 607–616.
Taubenheim, J., 1969. Statistische Auswertung geophysikaler und meteorologischerDaten. Akademische Verlagsgesellschaft Geest und Portig K.-G., Leipzig.
Torrence, C., Compo, G.P., 1998. A practical guide to wavelet analysis. Bull. Am.Meteorol. Soc. 79 (1), 61–78.
von Savigny, C., Robert, C., Bovensmann, H., Burrows, J.P., Schwartz, M., 2007.Satellite observation of the quasi 5-day wave in noctilucent clouds andmesopause temperatures. Geophys. Res. Lett. 34.
von Zahn, U., Berger, U., 2003. Persistent ice cloud in the midsummer uppermesosphere at high latitudes: three-dimensional modelling and cloudinteractions with ambient water vapor. J. Geophys. Res. 108 (D8), 8451.
Zecha, M., Bremer, J., Latteck, R., Singer, W., Hoffmann, P., 2003. Properties of mid-latitude mesosphere summer echoes after three seasons of VHF radarobservations at 541N. J. Geophys. Res. 108 (D8), 9439.
Zeller, O., Bremer, J., 2009. Influence of geomagnetic activity on mesosphericsummer echoes in middle and polar latitudes. Ann. Geophys. 27, 831–837.


