Embed Size (px)
Citation preview
CONNECTINGTESTS
11 . CONNECTING TESTS
In this chapter we describe the basic strategies for connecting tests intended to measure on thesame variable so that the separate measures each test implies are expressed together on one singlecommon scale. The process begins by understanding how to link two tests . Next we consider how toconnect several tests and from there we proceed to plans for connecting all possible tests .
The traditional method for connecting two tests is by equating the equal-percentile scores of asample of persons who take both tests simultaneously . This process requires a large sample of personswith scores broadlyenough distributed to assure an adequate representation of each score-to-percentileconnection .
Rasch measurement enables a more economical and better controlled method for connectingtests andbuilding item banks. Links of 10 to 20 common items are embedded in pairs of tests composedof otherwise different items . Each test is administered to its own sample of persons. No person needtake more than one test . But all items in all tests can be subsequently connectedthroughthe network ofcommon item links.
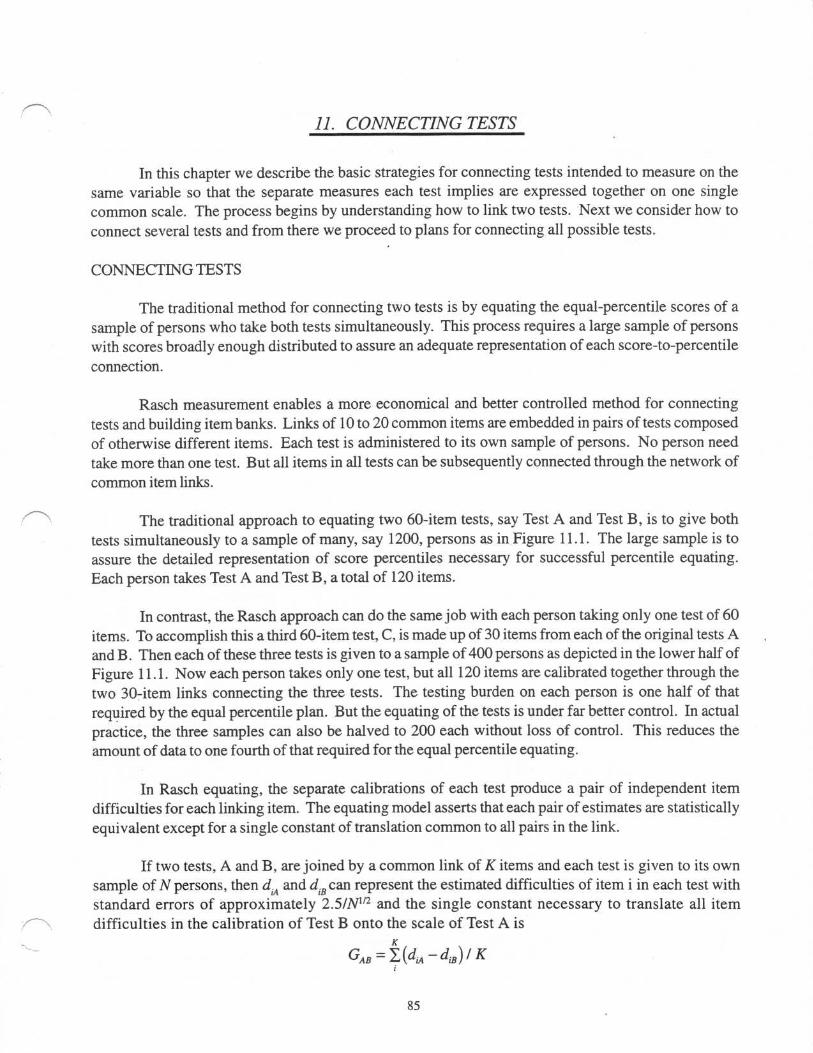
The traditional approach to equating two 60-item tests, say Test A and Test B, is to give bothtests simultaneously to a sample of many, say 1200, persons as in Figure 11 .1 . The large sample is toassure the detailed representation of score percentiles necessary for successful percentile equating .Each person takes Test A and Test B, a total of 120 items.
In contrast, the Rasch approach can do the same job with each person taking only one test of 60items. To accomplish this a third 60-item test, C, is made up of 30 items from each of the original testsAandB . Then each of these three tests is given to a sample of 400persons as depicted in the lower half ofFigure 11 .1 . Now each person takes only one test, but all 120 items are calibrated together through thetwo 30-item links connecting the three tests. The testing burden on each person is one half of thatrequired by the equal percentile plan. But the equating of the tests is under far better control. In actualpractice, the three samples can also be halved to 200 each without loss of control. This reduces theamount of data to one fourth of that required for the equal percentile equating .
In Rasch equating, the separate calibrations of each test produce a pair of independent itemdifficulties for each linking item . The equating modelasserts that each pair of estimates are statisticallyequivalent except for a single constant of translationcommon to all pairs in the link .
If two tests, A and B, are joined by a common link ofK items and each test is given to its ownsample ofN persons, then dA and drB can represent the estimated difficulties of item i in each test withstandard errors of approximately 2.5/N'2 and the single constant necessary to translate all itemdifficulties in the calibration of Test B onto the scale of Test A is
xGAB =
(diA - diB) I K
85
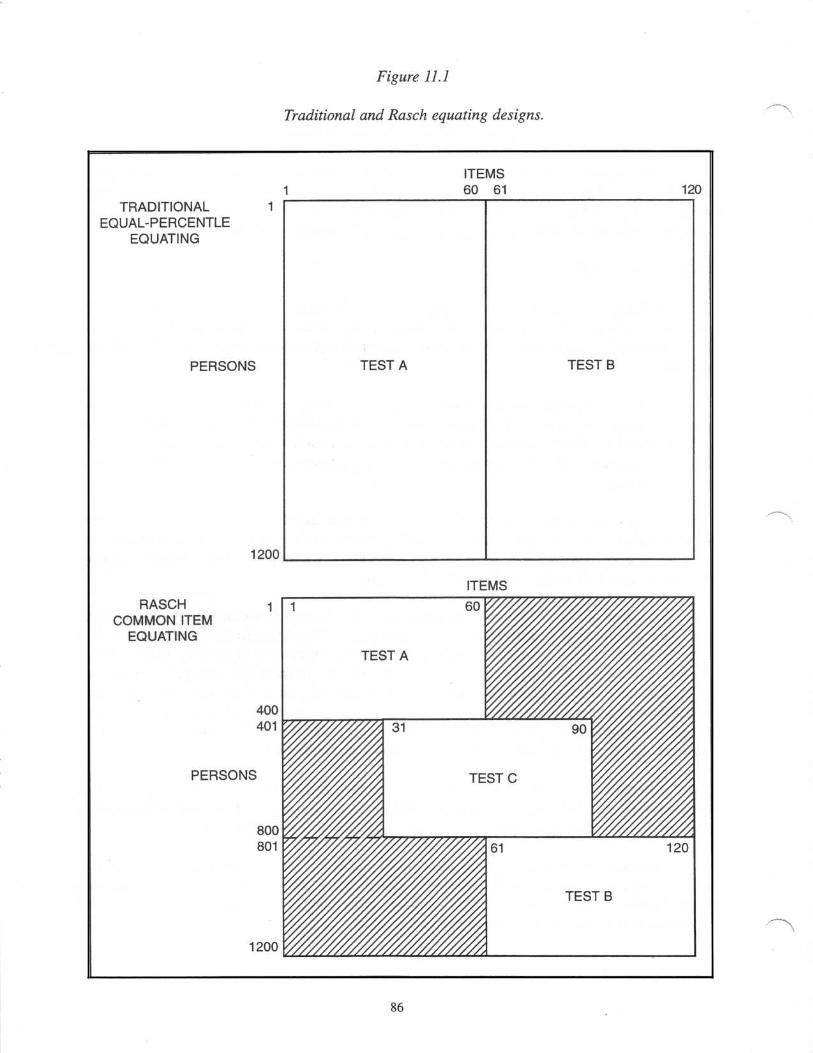
Figure 11.1
Traditional and Rasch equating designs.
TRADITIONALEQUAL-PERCENTLE
EQUATING
RASCHCOMMON ITEMEQUATING
PERSONS
PERSONS
1200
400401
800801
1200
ITEMS1
60 61
120
TEST A TEST B
ITEMS
86
with standard error of approximately 3.5/(NK)'I logits .
In contrast to traditional equating, in whichno quality control is available, the quality of thisRasch link can be evaluated by the fit statistic :
K
(d,, - di, - G")2(N/ 12)[K/ (K-1)] - XKa
which, when the two tests do fit together, will be distributed approximately chi-square with Kdegrees of freedom.
In addition, the individual fit of each item link can be evaluated by
(d;A - di, -GAB) 2(N/ 12)[K/ (K-1)] - X
which, when the performance of that item is consistent with the equating, will be approximatelychi-square with one degree of freedom.
These simple fit statistics enable detailed, item by item control and remediation of testequations.
When using these chi-square statistics to judge link quality we keep in mind how they areaffected by sample size . When N exceeds 500 these chi-squares can detect link flaws too small tomake any noteworthy difference in GAB , too small to matter. (When calibration samples are large,the root mean square misfit is more useful . This statistic can be used to estimate the logit increasein calibration error caused by link flaw.)
In deciding how to act on evaluations of link fit, we also keep in mind that random uncer-tainty in item difficulty of less than .3 logits has no discernible bearing on person measurement(Wright & Douglas, 1975, 35-39) .
Because of the way sample size enters into the calculation of item difficultly and hence intothe evaluation of link quality, we can deduce from these considerations that samples as small as200 persons and links of as few as 10 good items will always be more than enough to supervise linkvalidity at better than .3 logits . In practice we have found that we can construct useful and stableitem banks with sample units as small as 50 persons.
THECOMMON LINK
The basic structure required to calibrate many items onto a single variable is the commonitem link in which one set of linking test items is shared by and so connects together two otherwisedifferent tests. An easy and ahard test can be linked by a common set of intermediate items . Theselinking items are the "hard" items in the easy test butthe "easy" items in the hard test (Figure 11 .2) .
With two or more test links we can build a chain of the kind shown in Figure 11 .3 .
The representation in Figure 11 .3 can be conveyed equally well by the simpler schemeshown in Figure 11 .4 which emphasizes the links and facilitates diagraming more complicated
87
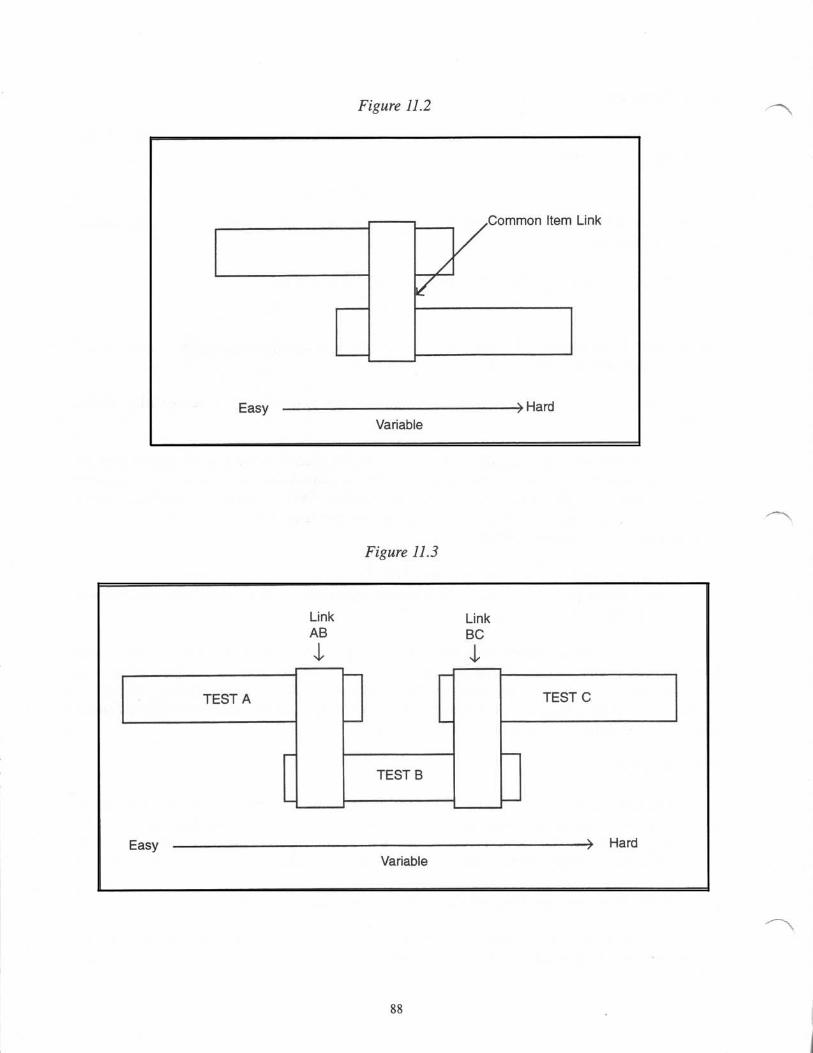
Figure 11.2
Common Item Link
Easy
~HardVariable
Figure 11.3
TEST A
Link
LinkAB
BC
TEST B
TEST C
Easy
- HardVariable
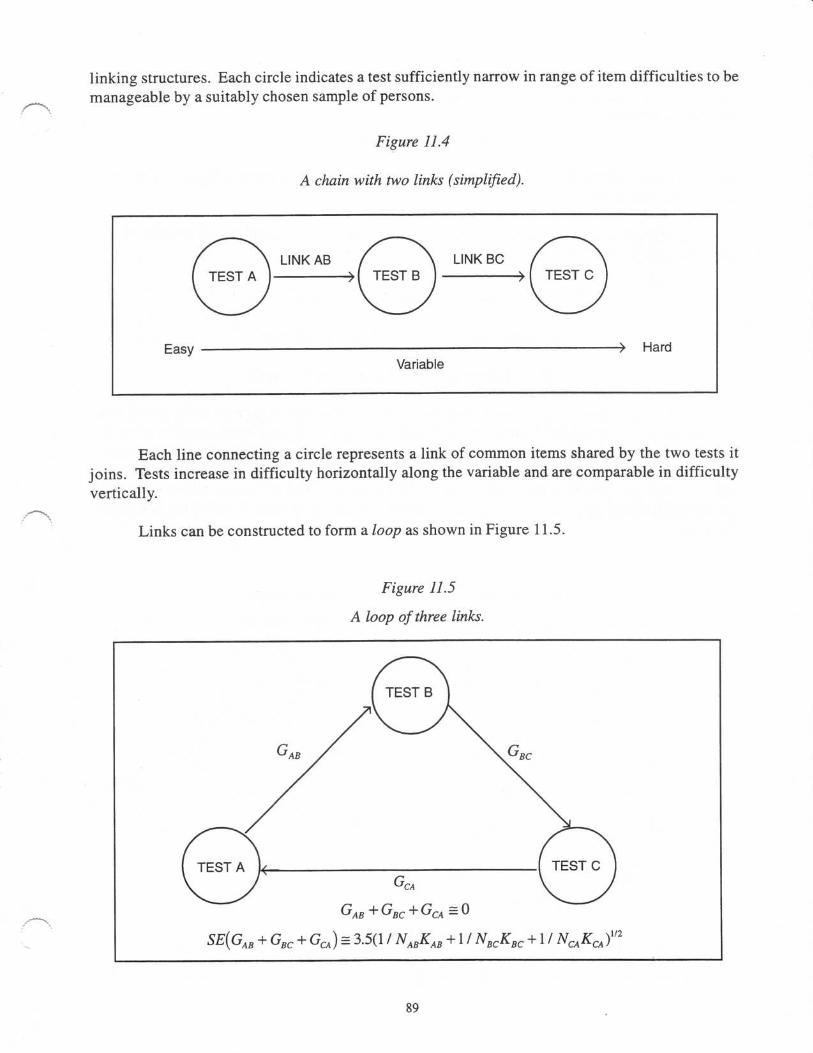
linking structures . Each circle indicates a test sufficiently narrow in range of item difficulties to bemanageable by a suitably chosen sample of persons .
Figure 11.4
A chain with two links (simplified) .
Each line connecting a circle represents a link of common items shared by the two tests itjoins . Tests increase in difficulty horizontally along the variable and are comparable in difficultyvertically.
Links can be constructed to form a loop as shown in Figure 11 .5 .
Figure 11 .5
A loop of three links.
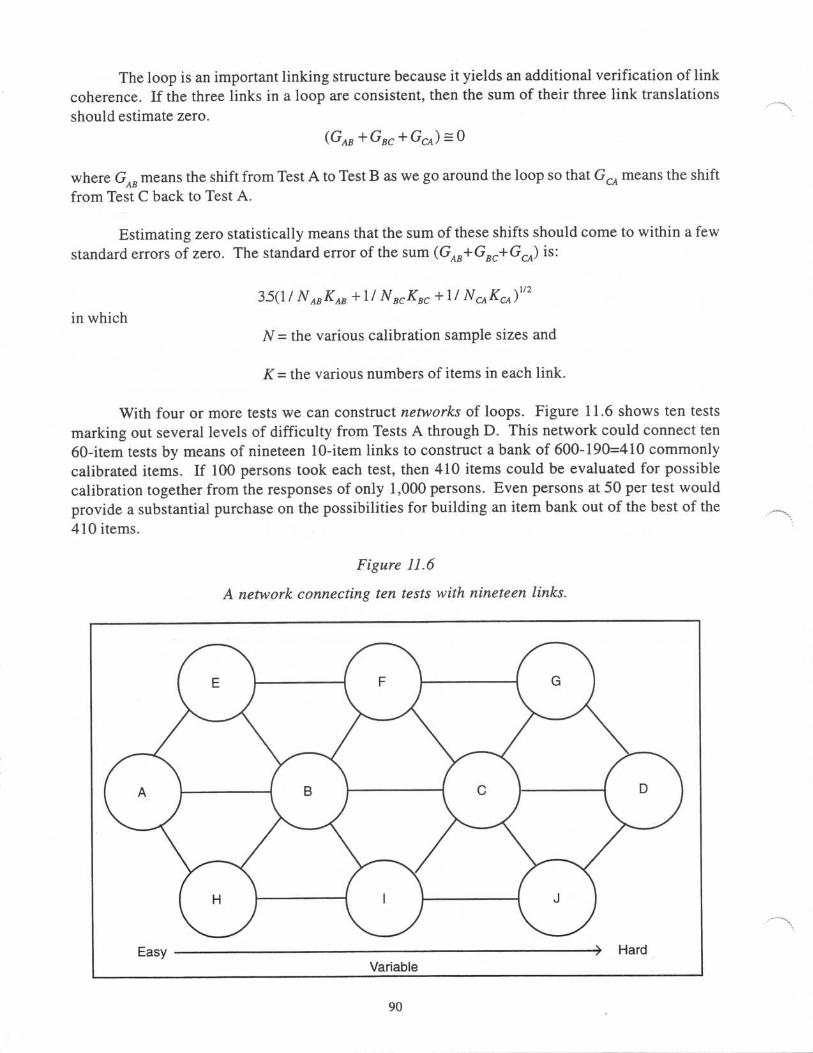
The loop is an important linking structure because it yields an additional verification of linkcoherence . If the three links in a loop are consistent, then the sum of their three link translationsshould estimate zero .
in which
(GAB +GBC +GCA) - 0
where GAB means the shift from Test A to Test B as we go around the loop so that GCA means the shiftfrom Test C back to Test A.
Estimating zero statistically means that the sum of these shifts should come to within a fewstandard errors of zero . The standard error of the sum (GAB+GBC+GcA ) is :
35(1/NABKAB +1/NBCKBC +1/NCAKCA)1/2
N = the various calibration sample sizes and
K= the various numbers of items in each link .
With four or more tests we can construct networks of loops . Figure 11 .6 shows ten testsmarking out several levels of difficulty from Tests A through D. This network could connect ten60-item tests by means of nineteen 10-item links to construct a bank of 600-190=410 commonlycalibrated items . If 100 persons took each test, then 410 items could be evaluated for possiblecalibration together from the responses of only 1,000 persons . Even persons at 50 per test wouldprovide a substantial purchase on the possibilities for building an item bank out of the best of the410 items .
Figure 11 .6
A network connecting ten tests with nineteen links .
90
The building blocks of a test network are the loops of three tests each . When a loop fits theRasch model, then its three translations will sum to within a few standard errors of zero . Thesuccess of the network at linking item calibrations can be evaluated from the magnitudes and directions of these loop sums. Shaky regions can be identified and steps taken to avoid or improve them.
The implementation of test networks leads to banks of commonly calibrated items far largerin number and far more dispersed in difficulty than any single person could ever handle. Theresulting item banks, because of the calibration of their items onto one common variable, providethe item resources for a prolific family of useful tests, long or short, easy or hard, widely spaced initem difficulty or narrowly focused, all equated in the measures they imply.
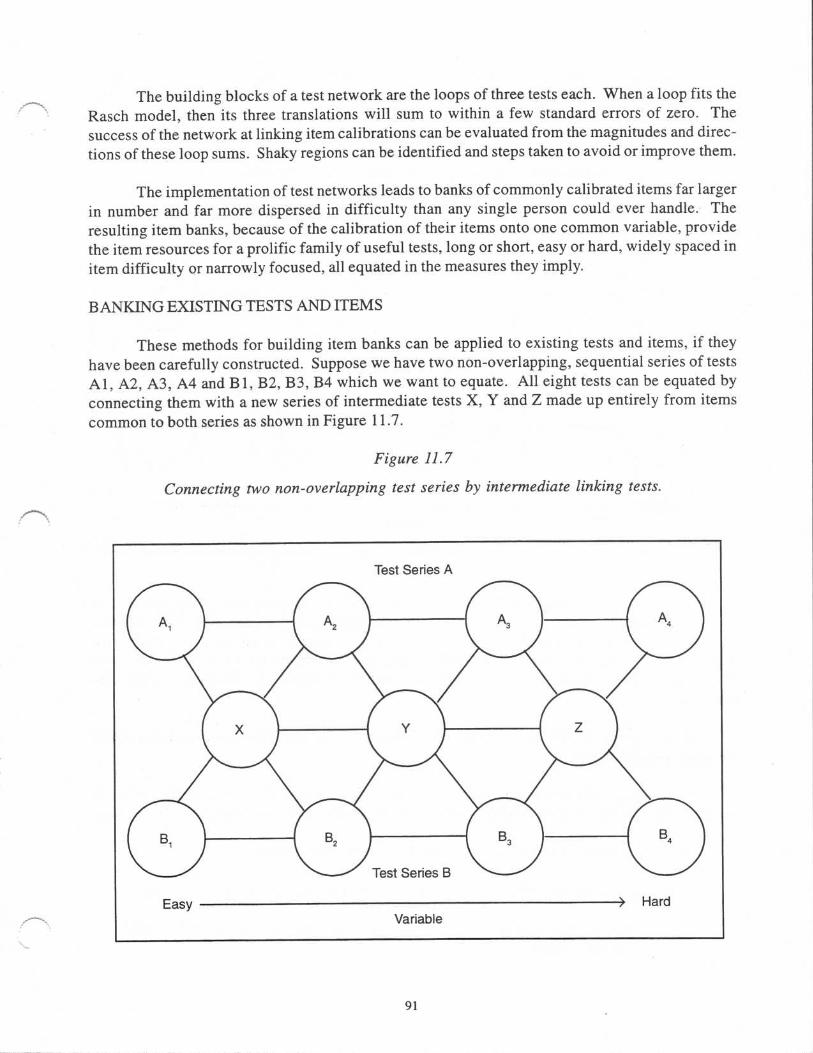
BANKING EXISTING TESTS AND ITEMS
These methods for building item banks can be applied to existing tests and items, if theyhave been carefully constructed . Suppose we have two non-overlapping, sequential series of testsAl, A2, A3, A4 and B1, B2, B3, B4 which we want to equate . All eight tests can be equated byconnecting them with a new series of intermediate tests X, Y and Z made up entirely from itemscommon to both series as shown in Figure 11 .7 .
Figure 11.7
Connecting two non-overlapping test series by intermediate linking tests .
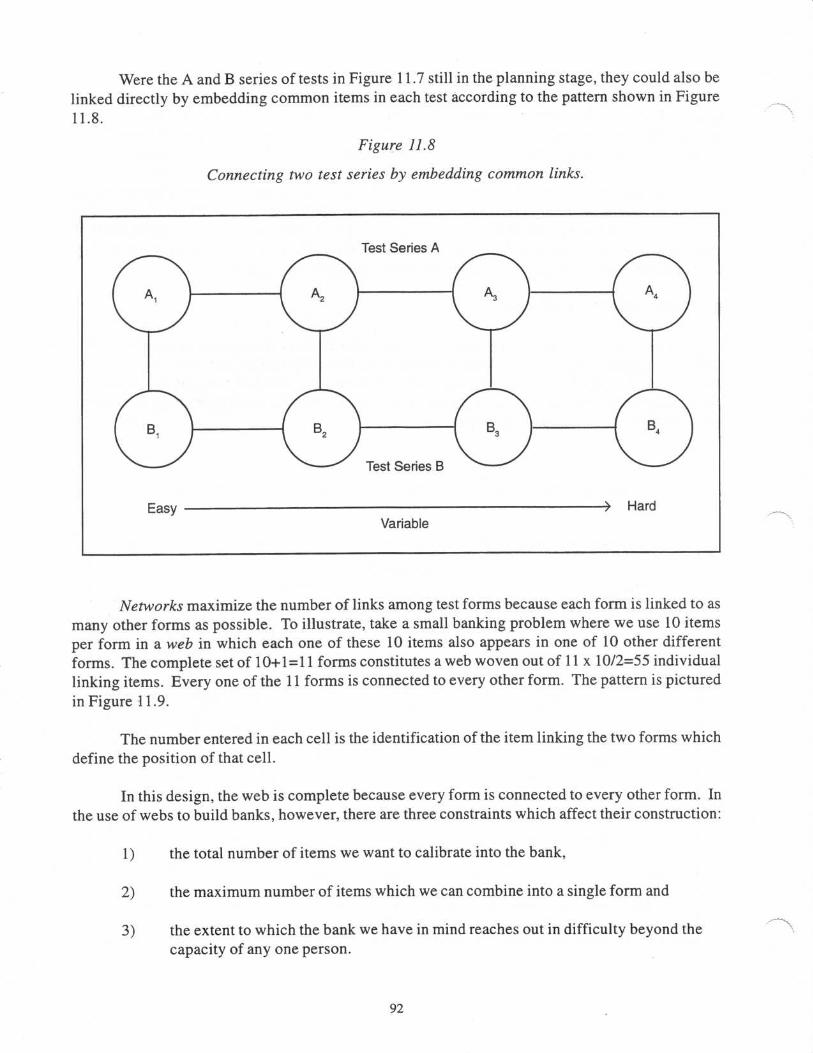
Were the A and B series of tests in Figure 11 .7 still in the planning stage, they could also belinked directly by embedding common items in each test according to the pattern shown in Figure11 .8 .
Figure 11 .8
Connecting two test series by embedding common links.
Networks maximize the number of links among test forms because each form is linked to asmany other forms as possible. To illustrate, take a small banking problem where we use 10 itemsper form in a web in which each one of these 10 items also appears in one of 10 other differentforms . The complete set of 10+1=11 forms constitutes a web woven out of 11 x 10/2=55 individuallinking items . Every one of the 11 forms is connected to every otherform . The pattern is picturedin Figure 11 .9 .
The number entered in each cell is the identification of the item linking the two forms whichdefine the position of that cell .
In this design, the web is complete because every form is connected to every other form. Inthe use of webs to build banks, however, there are three constraints which affect their construction :
1)
the total number of items we want to calibrate into the bank,
2)
themaximum number of items which we can combine into asingle form and
3)
theextent to which the bank we have in mind reaches out in difficulty beyond thecapacity of any one person .

The testing situation and the capacity of the persons taking the test forms limit the number ofitems we can put into a single form. Usually, however, we want to calibrate many more items thatwe can embed in a complete web like the one illustrated in Figure 11 .9 . There are two possibilitiesfor including more items.
A
B
C
D
E
F
G
H
J
K
Figure 11.9
A complete web for parallelforms.
A B C D E F G H I J K2 3 4 5 6 7 8 9 10
1 12 13 14 15 16 17 18 19
20 21 22 23 24 25 26 27
28 29 30 31 32 33 34
35 36 37 38 39 40
41 42 43 44 45
46 47 48 49
50 51 52
53 54
5511 Forms10 Items perform(11x10)/2=55 Items
The simplest, but not the best, is to design a "nuclear" complete web which uses up someportion of the items we can include in a single form. Then we fill outthe required form length withadditional "tag" items. These tag items are calibrated into the bank by means of the link items intheir form. Unlike the link items, however, which always appear in two forms, the tag items appearin only one form and so give no help with linking forms together into one commonly calibratedblank .
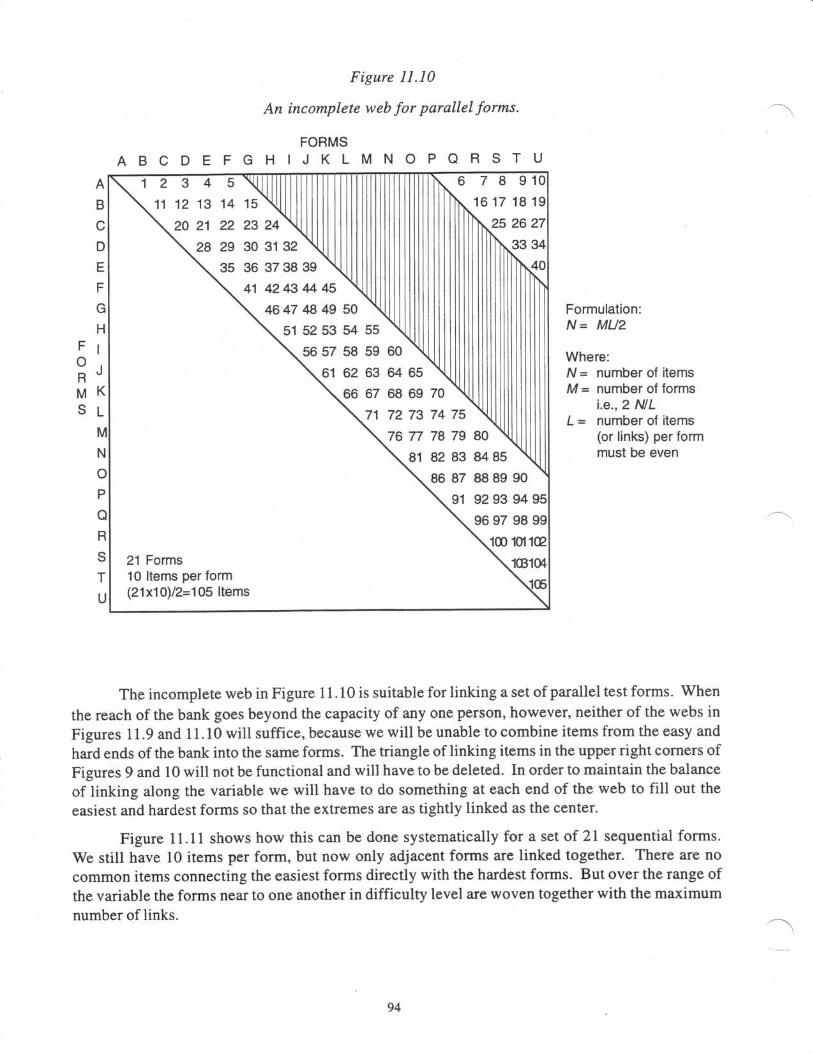
Another possibility, which is better statistically, is to increase the number of forms usedwhile keeping the items per form fixed at the required limit. This makes the web incomplete but ina systematic way. The paired data on every item appearing twice can be used to evaluate thecoherence of bank calibrations . Figure 11 .10 shows an "incomplete" web for a 21 form design with10 items per form, as in Figure 11 .9, but connecting nearly twice as many items.
ABCDEFGH
F I
R J
M KS L
MNOPQRSTU
FORMSA B C D E F G H I J K L M N O P Q R S T U
3 4 5
12 13 14
20 21 2228 29
35
Figure 11 . 1 0
An incomplete web for parallel forms.
243132373839424344464748
51 52
56
4549 5053 5457 5861 62
66
7 8 9101617 1819252627
333440
808485888990929394959697 9899
1001011021(3104
105
Formulation :N = MLI2
Where:N= number of itemsM = number of forms
i .e ., 2 NILL =
number of items(or links) per formmust be even
The incomplete web in Figure 11 .10 is suitable for linking a set of parallel test forms . Whenthe reach of the bank goes beyond the capacity of any one person, however, neither of the webs inFigures 11 .9 and 11 .10 will suffice, because we will be unable to combine items from the easy andhard ends of the bank into the same forms. The triangle of linking items in the upper right corners ofFigures 9 and 10 will not be functional and will have to be deleted . In order to maintain the balanceof linking along the variable we will have to do something at each end of the web to fill out theeasiest and hardest forms so that the extremes are as tightly linked as the center.
Figure 11 .11 shows how this can be done systematically for a set of 21 sequential forms .We still have 10 items per form, but now only adjacent forms are linked together. There are nocommon items connecting the easiest forms directly with the hardest forms . But over the range ofthe variable the forms near to one another in difficulty level are woven together with the maximumnumber of links .
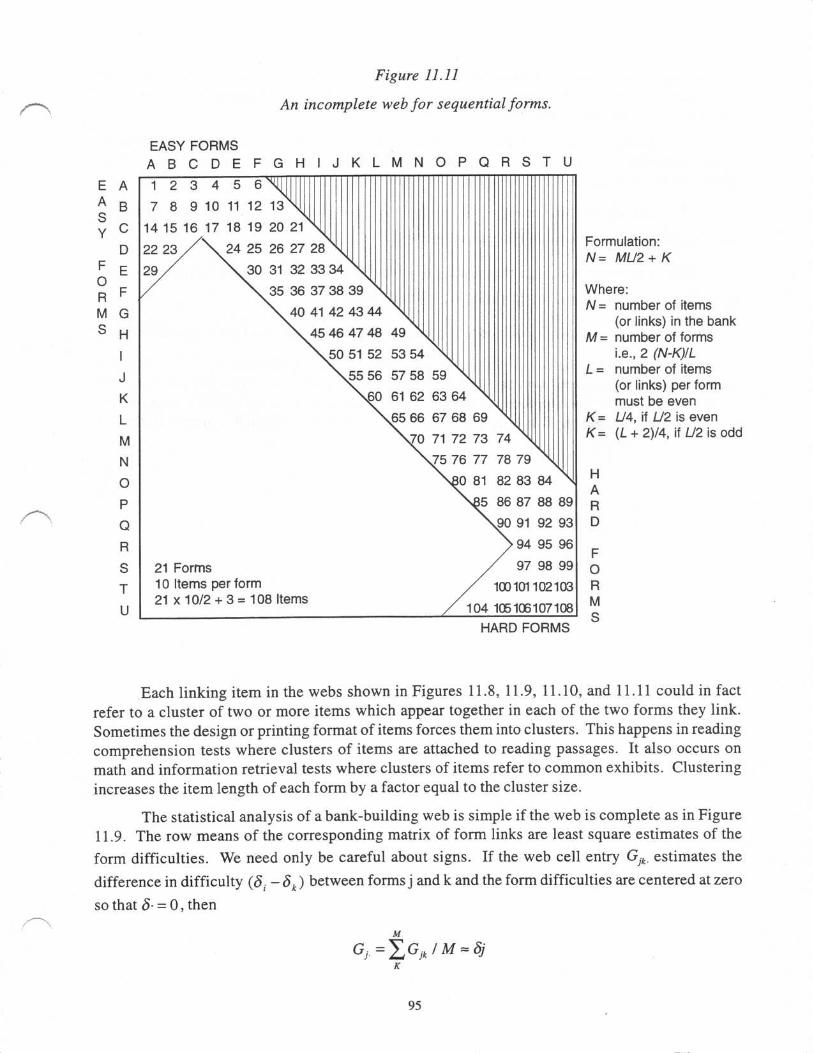
An incomplete web for sequentialforms.
EASY FORMSABC D E F G H I J K L M N O P Q R S T U
21 x 10/2 + 3 = 108 Items
2127 28323334363738394041424344
4546474850 51 52
555660
Figure 11.11
495354
575861 626566\70
596364676871 727576
0
7983 8487 88 8991 92 9394 95 9697 98 99
/
10D 1G1 102103104 105106107108HARD FORMS
Formulation :N = MU2 + K
Where:N= number of items
(or links) in the bankM= number of forms
i .e ., 2 (N-K)ILL =
number of items(or links) per formmust be even
K= L/4, if U2 is evenK= (L + 2)/4, if U2 is odd
HARD
FORMS
Each linking item in the webs shown in Figures 11 .8, 11 .9, 11 .10, and 11 .11 could in factrefer to a cluster of two or more items which appear together in each of the two forms they link .Sometimes the design or printing format of items forces them into clusters . This happens in readingcomprehension tests where clusters of items are attached to reading passages . It also occurs onmath and information retrieval tests where clusters of items refer to common exhibits . Clusteringincreases the item length of each form by a factor equal to the cluster size .
The statistical analysis of a bank-building web is simple if the web is complete as in Figure11 .9 . The row means of the corresponding matrix of form links are least square estimates of theform difficulties . We need only be careful about signs . If the web cell entry GJk . estimates thedifference in difficulty (S ; - Sk ) between forms j and k and the form difficulties are centered at zeroso that S. = 0, then
M
= 1:GIk/M = SjK
95
E A 1 2 3 4 5 6A B 7 8 9 10 11 12 13SY C 14 15 16 17 18 19 20
D 2223 24 25 26F E 29 30 31OR F 35
M G
IJKLMNOPQRS 21 FormsT 10 Items perform
the row means of the link matrix calibrate the forms onto their common variable . Once formdifficulties are obtained, they need only be added to the item difficulties within forms to bring allitems onto the common variable shared by the forms.
The incomplete webs in Figures 11 .10 and 11 .11 require us to estimate row means from amatrix with missing data . The skew symmetry of link matrices helps the solution to this problemwhich can be done satisfactorily by iteration or regression .
When cells of the link matrix of Gjk , are missing, then initial values for Gj . can be obtained
from Equation [6] by using zero's for the missing G;k . .
The next step is to replace the missing Gjk . with estimates from the corresponding Gj . and
Gk . using G;k = Gj . - Gk . and recalculating Gj. by Equation [6].
Iterations of this process will converge to stable values for the test form difficulties G;. .
An even simpler but less informative solution is to express the data for all forms in onelarge matrix in which every item has its own column, every person has their own row and everyintersection, at which a person does not address an item, is recorded as blank. This matrix, with itsmissing data, can be analyzed directly in one step with BIGSTEPS (Wright & Linacre, 1996).

MEASUREMENTESSENTIALS
2nd Edition
BENJAMIN WRIGHT
MARK STONE
Copyright ©1999 by Benjamin D. Wright and Mark H. StoneAll rights reserved .
WIDE RANGE, INC.Wilmington, Delaware