Embed Size (px)
Citation preview
A Method for Automatic Membership FunctionEstimation Based on Fuzzy Measures
Grzegorz Nieradka and Bohdan Butkiewicz
Warsaw University of Technology, Institute of Electronic Systems,Nowowiejska 15/19, 00 - 665 Warsaw, [email protected], [email protected]
Abstract. Estimation of membership function is one of the most impor-tant problems in the application of fuzzy sets. This paper presents oneof approaches to this problem. A method for estimation of membershipfunction is proposed, based on fuzzy measures: fuzzy entropy and fuzzyindex. Examples of generating membership function in the field of imageprocessing are shown.The method presented in this paper can be usedin other fields of computer sciences, where statistical data are available.
1 Introduction
Proper choosing of membership function’s shape and values is usually not aneasy task. There are many methods proposed in the literature also in the imageprocessing field [14]. Some methods adopt an approach based on transformationfrom a probability distribution to a possibility distribution [3]. Sometimes statis-tical data describing an image are clustered by C-means algorithm. Membershipfunctions of pixels’ brightness are chosen based on these clusters [2]. A methodbased on optimization objective function is presented in [4]. The application ofmeasures of the fuzzy set such as specificity or consistency is also proposed in [7].The authors of this paper propose objective function related to entropy measure.
The most similar solution this our proposition is described in [5], but there arenumerous discrepancies between the two approaches. Whereas both the workspertain the idea of maximization of entropy, only this paper refers to the measureof entropy other than the idea of probability of fuzzy event as described in [5].Moreover, this work offers another measure, namely fuzzy index, added for themore exact description of available data image.
In this paper the authors proposed a novel method in which calculated mem-bership function is utilized for modeling linguistic commands used for imageprocessing. Some examples, where such commands are applied prove to be suc-cessful approach.
2 Membership Function
The shape of S-function is commonly used for the representation of the degreeof brightness or whiteness of pixels in grey levels images. This S-function wasoriginally introduced by Zadeh [17].
P. Melin et al. (Eds.): IFSA 2007, LNAI 4529, pp. 451–460, 2007.c© Springer-Verlag Berlin Heidelberg 2007
452 G. Nieradka and B. Butkiewicz
For flexibility another definition of S-function was proposed [6]:
S (x; a, b, c) =
⎧⎪⎪⎪⎨
⎪⎪⎪⎩
0, x ≤ a(x−a)2
(b−a)(c−a) , a < x ≤ b
1 − (x−c)2
(c−b)(c−a) , b < x ≤ c
1, x ≥ c
(1)
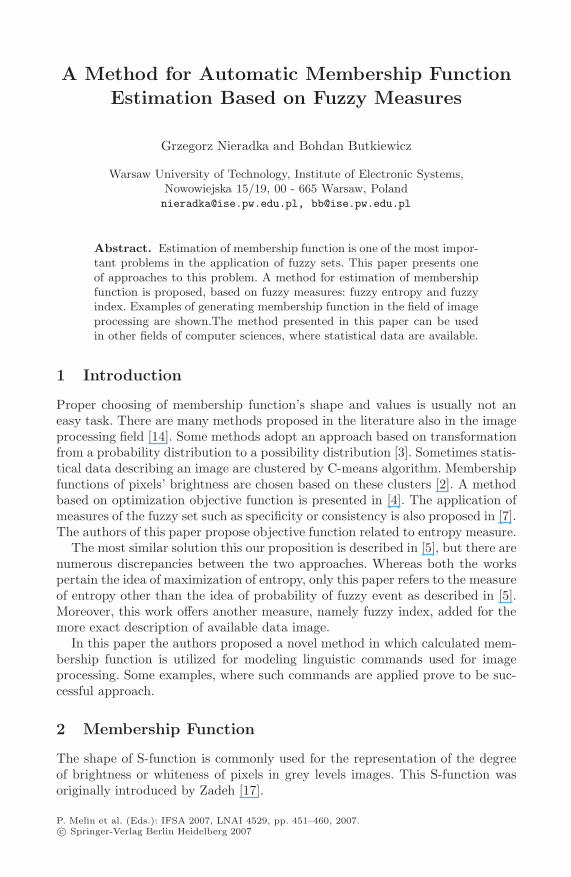
where x is a variable, and a, b and c are parameters determining the shape ofS-function. In this definition b can be any point between a and c. Some examplesof possible shapes of this S-function are shown in the Fig. 1
Fig. 1. Different shapes of S-function depend on a, b and c parameters. Lines denotingparameters: dashed line a = 0, b = 63.5, c = 127.5; solid line a = 0, b = 127.5, c = 255;dotted line a = 127.5, b = 191, c = 255
3 Fuzzy Measures
In the literature many fuzzy measures have been proposed [8] [13] as well asmeasures of fuzzines [15]. This paper incorporates two measures of fuzzy setnamely a fuzzy entropy [1] and index of fuzzines introduced by Kaufmann [10].
3.1 Fuzzy Entropy
Many definitions of fuzzy entropy [15] [1] exist in the literature. For the purposeof this work authors employ definition of total entropy [1] [16] which is describedas follows.
Let I be a set with randomly occuring events {x1, x2, . . . , xn} in an exper-iment, and {p1, p2, . . . , pn} are respective probabilities of events. Fuzzyficationof set I induces two kinds of uncertainties. Total entropy of the set F , beingfuzzified set I, consists of two parts. The first part of total entropy is a mea-sure deduced from ”random” nature of the experiment. Expected value of thisuncertainty is computed as Shannon entropy:
H (p1, p2, . . . , pn) = −n∑
i=1
pi log (pi) (2)
A Method for Automatic Membership Function Estimation 453
The second uncertainty arises from the fuzzines of the fuzzy set F related to theordinary set. This amount of ambiguity is given by:
S (μi) = −μi log (μi) − (1 − μi) log (1 − μi) (3)
The statistical average m of the ambiguity for the whole set is given by equation(4):
m (μ, p1, p2, . . . , pn) =n∑
i=1
piS (μi) (4)
Therefore, the total entropy of the set F is expressed as follows:
Htotal = H (p1, p2, . . . , pn) + m (μ, p1, p2, . . . , pn) (5)
3.2 Index of Fuzziness
Let X be universum of discourse and P power set of X . Kaufmann introducedthe index of fuzzines γ of fuzzy set A ⊆ P :
γ (A) =2nk
× d (A, Anear) (6)
where d is a suitable metric on the universum X , k is positive number andn number of supporting points. Anear is the nearest crisp set to A defined asfollows:
μnearA (x) =
{1 if μA (x) ≥ 0.50 if μA (x) ≤ 0.5 (7)
Using Minkowski’s q-norm as a metric, and putting k = 1q , the index of fuzzines
can be defined as:
γ (A) =2
n1q
{∑
i
|μA (xi) − [1 − μAnear (xi)]|q} 1
q
(8)
In this paper the linear version of this index is used, so the exponential q = 1
γ (A) =2n
∑
i
|μA (xi) − μA (xi)| (9)
where μA (xi) is complement of set A and μA (xi) = 1 − μA (xi). The differencebetween the set and nearest ordinal set can be calculated:
γ (A) =2n
∑
i
[min {μA (xi) , 1 − μA (xi)}] (10)
Obviously, for an image O of size M × N with L levels of grey pixels’ brightnessg, and with the histogram h (g) of the image O, linear index of fuzzines can begiven by:
γlinear (O) =2
MN
L−1∑
g=0
h (g) · min [μO (g) , μO (g)] (11)
where: μO is complement of O and μO = 1 − μO (g)
454 G. Nieradka and B. Butkiewicz
4 Algorithm of Membership Function Calculation
For estimation of membership function the authors used the measures describedabove as objective functions for a maximization problem. We would like to finda function which maximizes the information about an image. This condition isreformulated into entropy principle. Taking into consideration that entropy isthe measure of information, hence the function which has the maximum entropyis the most informative. However, there still exits need to find a function whichdescribes the fuzzy set in the best way. For this purpose the authors used theindex of fuzzines. The result is the function which has the biggest value of indexof fuzzines.
Therefore, the problem was reformulated into looking for the function whichis optimal with regards to total entropy (5) and index of fuzzines (11).
The objective is find the parameters a, b and c of function (1) describingthe shape of function, which fulfils conditions of the maximum entropy as wellas maximum value of index of fuzzines. This issue is defined as a two criteriaproblem. The first criterium is founding the set of parameters aEopt, bEopt, cEopt
for which the total entropy (5) has the maximal value.
Htotal max [S (aEopt, bEopt, cEopt)] = maxa,b,c
{Htotal [S (a, b, c)] : 0 ≤ a, b, c ≤ L}(12)
The second criterium is founding the set of parameters aγopt, bγopt, cγopt for whichthe value of the index of fuzzines (11) has the biggest value.
γlinear max [S (aγopt, bγopt, cγopt)] = maxa,b,c
{γ [S (a, b, c)] : 0 ≤ a, b, c ≤ L} (13)
After solving eq. (12) and eq. (13) there are two sets of parameters. The S-function described by the average values of the parameters has been chosen assolution.
aopt = aEopt+aγopt
2bopt = bEopt+bγopt
2copt = cEopt+cγopt
2
(14)
It is assume that S-function (1) described by set of parameters’ values given by(14) is the one which is the most informative and describes the fuzzy set in thebest way.
Calculations for finding the set of optimal parameters (14) are performedusing well known optimization algorithm Particle Swarm Optimization (in shortPSO), which is well described in the literature [12] [11].
5 Examples of the Algorithm Results
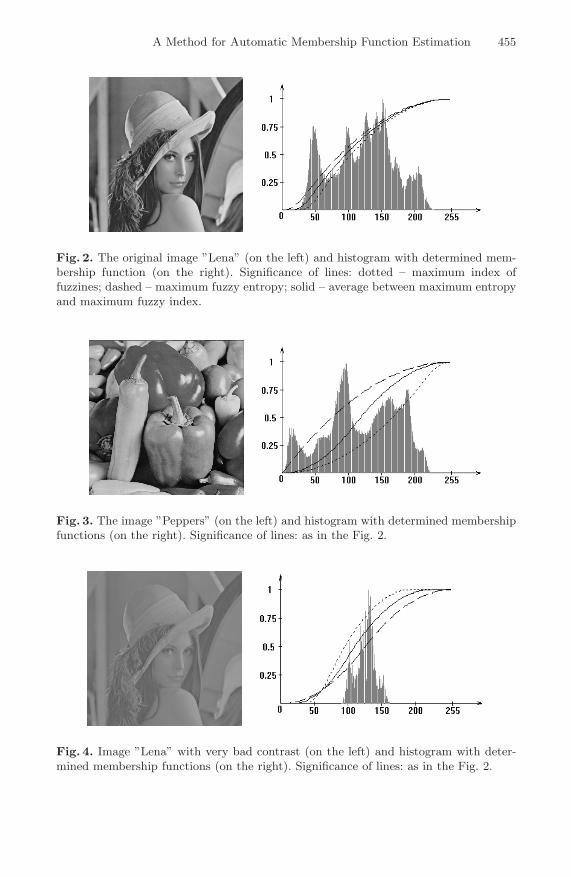
Figures Fig. 2 . . . Fig. 6 present the shapes of membership functions which werecomputed by this algorithm. Five different images with different histograms werechosen for illustration.
A Method for Automatic Membership Function Estimation 455
Fig. 2. The original image ”Lena” (on the left) and histogram with determined mem-bership function (on the right). Significance of lines: dotted – maximum index offuzzines; dashed – maximum fuzzy entropy; solid – average between maximum entropyand maximum fuzzy index.
Fig. 3. The image ”Peppers” (on the left) and histogram with determined membershipfunctions (on the right). Significance of lines: as in the Fig. 2.
Fig. 4. Image ”Lena” with very bad contrast (on the left) and histogram with deter-mined membership functions (on the right). Significance of lines: as in the Fig. 2.
456 G. Nieradka and B. Butkiewicz
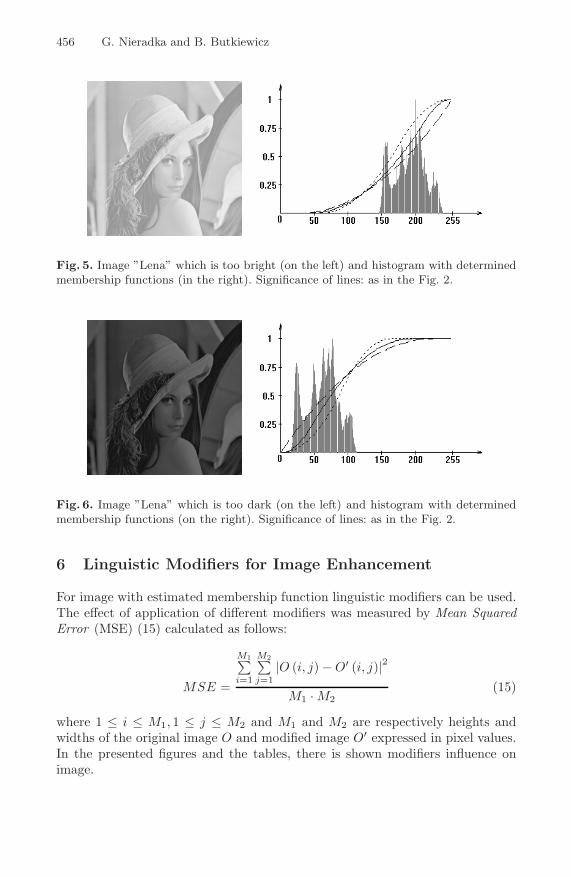
Fig. 5. Image ”Lena” which is too bright (on the left) and histogram with determinedmembership functions (in the right). Significance of lines: as in the Fig. 2.
Fig. 6. Image ”Lena” which is too dark (on the left) and histogram with determinedmembership functions (on the right). Significance of lines: as in the Fig. 2.
6 Linguistic Modifiers for Image Enhancement
For image with estimated membership function linguistic modifiers can be used.The effect of application of different modifiers was measured by Mean SquaredError (MSE) (15) calculated as follows:
MSE =
M1∑
i=1
M2∑
j=1|O (i, j) − O′ (i, j)|2
M1 · M2(15)
where 1 ≤ i ≤ M1, 1 ≤ j ≤ M2 and M1 and M2 are respectively heights andwidths of the original image O and modified image O′ expressed in pixel values.In the presented figures and the tables, there is shown modifiers influence onimage.
A Method for Automatic Membership Function Estimation 457
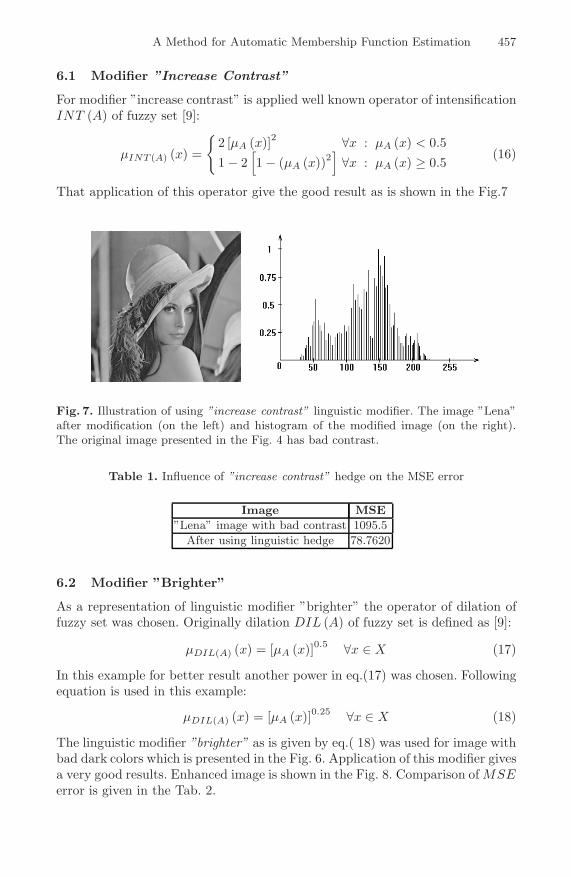
6.1 Modifier ”Increase Contrast”
For modifier ”increase contrast” is applied well known operator of intensificationINT (A) of fuzzy set [9]:
μINT (A) (x) =
{2 [μA (x)]2 ∀x : μA (x) < 0.51 − 2
[1 − (μA (x))2
]∀x : μA (x) ≥ 0.5
(16)
That application of this operator give the good result as is shown in the Fig.7
Fig. 7. Illustration of using ”increase contrast” linguistic modifier. The image ”Lena”after modification (on the left) and histogram of the modified image (on the right).The original image presented in the Fig. 4 has bad contrast.
Table 1. Influence of ”increase contrast” hedge on the MSE error
Image MSE”Lena” image with bad contrast 1095.5
After using linguistic hedge 78.7620
6.2 Modifier ”Brighter”
As a representation of linguistic modifier ”brighter” the operator of dilation offuzzy set was chosen. Originally dilation DIL (A) of fuzzy set is defined as [9]:
μDIL(A) (x) = [μA (x)]0.5 ∀x ∈ X (17)
In this example for better result another power in eq.(17) was chosen. Followingequation is used in this example:
μDIL(A) (x) = [μA (x)]0.25 ∀x ∈ X (18)
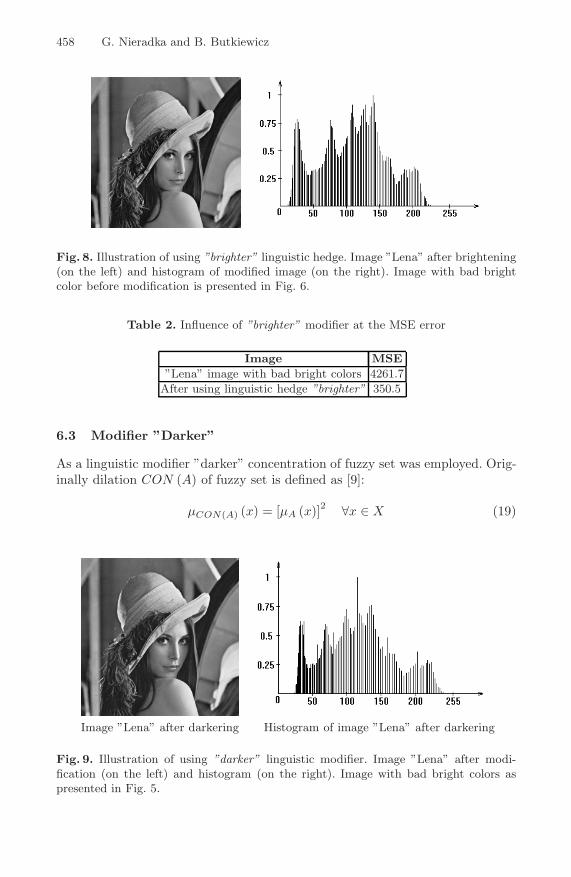
The linguistic modifier ”brighter” as is given by eq.( 18) was used for image withbad dark colors which is presented in the Fig. 6. Application of this modifier givesa very good results. Enhanced image is shown in the Fig. 8. Comparison of MSEerror is given in the Tab. 2.
458 G. Nieradka and B. Butkiewicz
Fig. 8. Illustration of using ”brighter” linguistic hedge. Image ”Lena” after brightening(on the left) and histogram of modified image (on the right). Image with bad brightcolor before modification is presented in Fig. 6.
Table 2. Influence of ”brighter” modifier at the MSE error
Image MSE”Lena” image with bad bright colors 4261.7
After using linguistic hedge ”brighter” 350.5
6.3 Modifier ”Darker”
As a linguistic modifier ”darker” concentration of fuzzy set was employed. Orig-inally dilation CON (A) of fuzzy set is defined as [9]:
μCON(A) (x) = [μA (x)]2 ∀x ∈ X (19)
Image ”Lena” after darkering Histogram of image ”Lena” after darkering
Fig. 9. Illustration of using ”darker” linguistic modifier. Image ”Lena” after modi-fication (on the left) and histogram (on the right). Image with bad bright colors aspresented in Fig. 5.
A Method for Automatic Membership Function Estimation 459
However, here the power equal 1.5 for better result is applied in this case. Themodifier given by eq.(19) with power 1.5, is utilized to image with bad whitecolors, as is shown in the Fig. 5. The result after application of this modifier isshown in the Fig. 9. Comparison of MSE errors is given in the Tab. 3
Table 3. Influence of ”darker” hedge at the MSE error
Image MSE”Lena” image with bad dark colors 5419.0
After using linguistic hedge ”darker” 505.2
7 Conclusion
Fuzzy set theory has been successful applied to many tasks in image processingas image filtering or pattern recognition. However, for each usage of fuzzy setsnot only in image processing but generally, it is needed to know the membershipfunction’s shape and values.
This paper presents the method dealing problem of determination member-ship function. The well known S-function is used for representing pixels’ valueswhich belong to the set of bright pixel. The methodology for choosing parame-ters of S-function in reasonable way is proposed basing on fuzzy measures. Thechosen function is one which compromises the conditions of information andgood fuzzines.
The new application area namely, the linguistic modifiers of image is outlined.The way of modelling natural language is shown with the good effects of usinglinguistic modifiers in image enhancement.
References
1. Al-sharhan S., Karray F., Basir O.: Fuzzy Entropy: a Brief Survey. IEEE Pro-ceedings of the 10th International Conference on Fuzzy Systems, Melbourne, Vic.,Australia 3 (2001) 1135-1138
2. Bezdek J.C.: Pattern Recognition with Fuzzy Objective Function Algorithms.Plenum, New York (1981)
3. Bharathi B., Sarma V.V.S.: Estimation of Fuzzy Membership from Histograms.Information Sciences 35 (1985) 43-59
4. Bloch I., Aurdal L., Bijno D., Muller J.: Estimation of Class Membership Functionsfor Grey Level Based Image Fusion. Proc. of the Int. Conf. of Image Processing(1997) 268-271
5. Cheng H.D., Cheng J.R.: Automatically Determine the Membership FunctionBased on the Maximum Entropy Principle 96 (1997) 163-182
6. Cheng H.D., Cheng Y.H.: Thresholding Based on Fuzzy Partition of 2D Histogram.IEEE International Conference on Pattern Recogition, Australia 2 (1998) 1616-1618
7. Civanlar M.R., Trussel H.J.: Construction Membership Functions using StatisticalData. Fuzzy Sets and Systems 18 (1986) 1-13
460 G. Nieradka and B. Butkiewicz
8. Dubois D., Prade H.: Fuzzy Sets and Systems: Theory and Applications. AcademicPress Inc. (1980)
9. Kacprzyk J.: (in Polish) Fuzzy Sets in Systems Analysis. Panstwowe WydawnictwaNaukowe (1986)
10. Kaufmann A.: Introduction to the theory of fuzzy subsets. Academic Press (1975)11. Kennedy J., Eberhart J.: Particle Swarm Optimization. IEEE International Con-
ference on Neural Networks, Perth, Australia (1995) 1942-14912. Kennedy J., Shi Y..: Swarm Intelligence. Morgan Kaufmann Academic Press (2001)13. Klir G.J., Folger T.A.: Fuzzy Sets, Uncertainty and Information. Prentice Hall,
Englewood Clifs (1988)14. Medasani S., Kim J., Krishnapuram R.: An Overview of membership function gen-
eration techniques for pattern recognition. International Journal of ApproximateReasoning 19 (1998) 391-417
15. Pal N.R., Bezdek J.C.: Measuring Fuzzy Uncertainty. IEEE Transactions of FuzzySystems 2(2) (1994) 107-118
16. Pedrycz W., Czo�lga�la E.: (in Polish) Elements and Methods of fuzzy sets theory.Panstwowe Wydawnictwa Naukowe (1985)
17. Zadeh L.A.: A fuzzy-algorithmic approach to the definition of complex or impreciseconcepts. International Journal Man-Machines Studies 8 (1976) 249-291


