Embed Size (px)
Citation preview

Methylmercury, Fish Consumption, and the PrecautionaryPrinciple
Fred LipfertConsultant, Northport, NY
Sam MorrisConsultant, Port Jefferson, NY
Terry Sullivan and Paul MoskowitzBrookhaven National Laboratory, Upton, NY
Scott RenningerThe Babcock and Wilcox Company, Barberton, OH
ABSTRACTThis paper considers several broad issues in the context ofprobabilistic assessment of the benefits of curtailing mer-cury (Hg) emissions from U.S. coal-fired power plants,based on information developed from recent literatureand epidemiology studies of health effects of methylmer-cury. Exposure of the U.S. population is considered on thenational scale, in large part because of recent questionsarising from survey and experimental data about the rel-ative importance of local deposition of airborne Hg. Al-though epidemiological studies have provided useful in-formation, safe levels of Hg exposure remain uncertain, inpart because of other dietary considerations in the popu-lations that were studied. For example, much of the sea-food consumed in one of the major studies was alsocontaminated with polychlorinated biphenyls, as are fishtaken from some U.S. fresh waters. The primary epidemi-ological approach involves cross-study comparisons in
relation to mean exposures, rather than detailed critiques
of individual effects reported in each study. U.S. expo-
sures are seen to be well below the levels at which adverse
health effects are reported. This analysis supports the
conclusion that unilateral reduction of Hg emissions from
U.S. coal-fired power plants alone is unlikely to realize
significant public health benefits.
INTRODUCTIONMethylmercury (MeHg) is a known neurotoxicant, now
virtually ubiquitous in seafood at various concentra-
tions,1 that originates from atmospheric compounds of
inorganic Hg emitted from both natural and anthropo-
genic sources. These compounds are deposited in water
bodies and their watersheds, where they are converted to
organic forms through microbial reactions. Like some
other air pollutants, the adverse health effects of mercury
(Hg) first came to public attention through several unfor-
tunate accidents in prior decades, in this case involving
industrial wastewater discharges in Japan2 and consump-
tion of bread made from contaminated seed grain during
a famine in Iraq.3
The U.S. Environmental Protection Agency (EPA) set
its original guideline daily MeHg exposure limit (the ref-
erence dose [RfD]) at 0.3 �g/kg of body weight based on
the Iraqi data. More recently, the EPA reduced the RfD to
0.1 �g/kg/day based on data from a study in the Faeroe
Islands and recommendations from a National Academy
of Sciences (NAS) Committee.1 The RfD is defined as the
daily exposure that is “likely to be without a risk of ad-
verse effects when experienced over a lifetime.”1 It is
IMPLICATIONSEarly risk assessments were based largely on the benefitsof reducing local Hg deposition in U.S. freshwaters, asestimated from atmospheric modeling studies. However,local sources contribute a small fraction of total deposition,freshwater fish are only a small fraction of the fish con-sumed, and these fish often contain other contaminants,including polychlorinated biphenyls and lead. Although the“precautionary principle” is invoked to justify action in theface of uncertainty, responsible environmental policy re-quires that emission control programs be effective in termsof the health and other benefits actually realized. Globalreductions in Hg will be required to accomplish this.

frequently based on the most sensitive indicator of re-
sponse found in the most critical study, after consider-
ation of uncertainties. For MeHg, the EPA reduced the RfD
by a factor of 10 to allow for uncertainties. Thus, the RfD
level of exposure does not necessarily represent an exper-
imentally determined threshold for the onset of adverse
health effects.
In this paper, we use the usual elements of risk anal-
ysis: risk characterization (is there a problem?), risk anal-
ysis (how serious is it likely to be?), and risk management
(what can be done about it?). We use recent survey data to
estimate exposures to the U.S. population, including
those who consume self-caught fish, and contrast these
exposures with those of the various populations that have
been considered in epidemiology studies. We then evalu-
ate the likely outcome of reducing Hg emissions from
coal-fired power plants in the context of the “precaution-
ary principle”.
RISK CHARACTERIZATIONRelative Importance of U.S. Sources
The risks from U.S. sources of atmospheric mercury, such
as coal-fired power plants, depend directly on their
relative contributions to atmospheric mercury levels and
deposition. To date, such contributions have been con-
sidered on two different spatial scales: local/regional and
national/global.
Local/Regional Hg Deposition. On the basis of atmosphericdispersion models, local/regional deposition has been es-timated to result primarily from emissions of reactiveforms of gaseous Hg (RGM), including compounds suchas HgCl2, which are then either washed out in precipita-tion or dry-deposited,4-6 usually within �50 km of theplant. However, recent empirical evidence does not sup-port the hypothesis that coal-fired power plants representa major source of Hg deposition on local or statewidescales:
1. Using the data reported in the EPA “MercuryMaps” project,7 we found no excess (e.g., averageHg �0.3 ppm) Hg in fish in the Appalachian re-gion, where the density of U.S. coal-fired powerplants is high (Figure 1).
2. Measurements in a coal-fired power plant plumefound reduction of reactive Hg rather than oxida-tion of elemental Hg,8 suggesting a diminishedrole for RGM.
3. A study of wet deposition in Connecticut9 foundexcesses in urban areas. Specific urban sourceswere not identified, but incinerators were sus-pected. A recent study10 reported that 46% of theHg in urban stormwater runoff was attributable todeposition on rooftops, which also suggests theexistence of urban Hg sources.
4. No significant relationship is apparent between Hgconcentrations in freshwater fish and measured
Figure 1. Percentage reduction in Hg deposition needed to meet the EPA’s maximum MeHg fish concentration criterion for watersheds withno other significant Hg sources (from ref 7). Watersheds highlighted in yellow have significant nondeposition Hg sources, defined as total Hgloads �5% of estimated waterbody delivery at a deposition of 10 �g/m2/yr. Additional reductions may be required to meet most state fishadvisory levels.
Lipfert, Morris, Sullivan, Moskowitz, and Renninger

wet Hg deposition data from the Mercury Deposi-
tion Network (MDN)11 (Figure 2). Furthermore,
the coal-burning states (Pennsylvania, Illinois,
Wisconsin, and Minnesota) that have the data
needed for this plot have among the lowest fish Hg
concentrations and deposition rates. Although the
relationship between fish Hg and deposition is
weakly positive, it is not statistically significant
(r � 0.28 for bass [p � 0.35]; r � 0.14 for the
average of all species [p � 0.6]). This suggests that
the Hg in freshwater fish is governed mainly by
factors other than current rates of wet deposition,
such as aqueous chemistry, dry deposition in and
subsequent releases from watersheds, or releases
from aquatic sediments.
Data on Average Hg Deposition Rates in the United States. To
assess the relative importance of U.S. power plants, we
compared estimates of their annual Hg emissions with the
total annual Hg deposition estimated for the country as a
whole, without regard to detailed location. Such total
deposition estimates have not appeared in the literature,
except for the EPA’s initial estimate of 10 �g/m2/yr.6 The
MDN11 provides data from 1998 to the present on wet
deposition in selected states. Using interpolated data from
MDN data maps, we estimated a national average (area-
weighted) value of 9.2 �g/m2/yr for wet deposition alone.
Dry deposition of Hg depends on the mercury species
present (elemental [Hg0], RGM, or particulate); the types
of surfaces receiving the deposition may also have an
effect. Dry deposition of particulate Hg isdifficult to measure and poorly quantified;it is often assumed to be negligible. Drydeposition rates for Hg0 are much lowerthan for RGM and may reflect either dep-osition or re-emission.12
Various techniques have been used tomeasure total Hg deposition, includingmass balances around defined catch-ments,13,14 peat bog cores,15 deposits onvegetation and measurements of through-fall under a forest canopy,16 and use ofmoss as a deposition collector.17 Thesetechniques have provided reasonably self-consistent estimates of total annual Hgdeposition in the range 54–72 �g/m2/yr,implying large contributions from dry dep-osition. A dry deposition flux of 16 �g/m2/yr was estimated for RGM in the FloridaEverglades18 compared with a wet deposi-tion of 20–23 �g/m2/yr, and even largercontributions from Hg0 were estimated in
Tennessee.16 A range of 20–30 �g/m2/yr total Hg deposi-tion was estimated for Onondaga Lake, near Syracuse,NY.19
An alternative method of estimating dry depositionof an air pollutant involves separate consideration of airconcentration and dry deposition velocity (vd). Typical vd
values for RGM and Hg0 are �2 and 0.02–0.09 cm/sec,respectively. Lindberg and Stratton16 also estimated thatambient RGM tends to average �3% of ambient Hg0.Combining these estimates with a typical average ambi-ent concentration of Hg0 in the United States (1.7 ng/m2)results in dry deposition flux estimates of 32 �g/m2/yr forRGM and 27 �g/m2/yr for Hg0. However, there is consid-erable uncertainty about the net flux of Hg0 because ofthe likelihood of re-emission.
Taking into account all of the information, we con-sider 20 �g/m2/yr to be a reasonable lower estimate fortotal Hg deposition to the United States as a whole and 40�g/m2/yr to be a reasonable upper estimate. Multiplyingby the surface area of the contiguous United States (7.8 �
106 km2) yields an estimated range in total Hg depositionof 156–312 metric tons (t)/yr.
Accounting for U.S. Hg Emissions. Anthropogenic emis-sions of Hg were recently estimated at 176 t/yr for the 48contiguous states.20 Of that total, 43 t/yr were attributedto power plants, with another 14 t/yr attributed to indus-trial combustion, 45 t/yr to municipal waste combustion,and 23 t/yr to smelting processes. Because modeling re-sults indicate that only about one-half of the Hg emittedfrom the United States will deposit there,12 sources other
Figure 2. Statewide average Hg concentrations in fish vs. estimated statewide averagewet deposition of Hg.
Lipfert, Morris, Sullivan, Moskowitz, and Renninger

than power plants appear to contribute between 134 and291 mt/yr of the total Hg deposition. For example, Ha-nisch21 estimated that China contributes �1000 mt/yr tothe global total, some of which likely deposits in theUnited States; because of the forecasted increases in Chi-nese coal usage, this contribution is likely to grow in thefuture. It may also be possible that the U.S. contributionto global Hg is larger than 176 mt/yr because of uncer-tainties in the inventory and the possibility of unreportedurban sources. In any event, the net reduction in Hgdeposited within the Unites States that might be realizedby controlling U.S power plants is seen to be a smallfraction (�5–10%) of the total Hg deposited annually inthe conterminous United States (affecting freshwater fish)and an even smaller fraction (�1%) on a global basis(affecting marine species).
Estimating the Effects of Deposition on the Hg Content ofFreshwater Fish. Assuming that the (nonsignificant) slopeof Figure 2 is appropriate for all fish species, reducing Hgdeposition by 5 or 10% would reduce the average Hgcontent of freshwater fish by only �0.9–1.8% (�0.003ppm). This estimate is much smaller than that obtainedby assuming a linear relationship between Hg depositionand fish Hg content (�40%4,5), which illustrates the largeuncertainty involved in assessing the potential benefitsfrom reducing local Hg emissions.
Fish Consumption and MeHg ExposureFish Consumption Rates in the United States. Because MeHgis found almost exclusively in fish and shell fish, seafoodconsumption rates give an overall measure of populationexposures to MeHg. Data from the U.S. Statistical Abstractindicate that total seafood consumption rates per capitahave been stable over the past decade, at �19–24 g/day.The contribution of commercial freshwater fishing ismuch smaller, even on a regional basis. For example,assuming that one-half of the Michigan freshwater catchis edible and consumed in Michigan, total per capitaconsumption there would be increased by only �0.8g/day.
Assuming that everyone eats at least some fish and anaverage portion size of 140 g, the above total national rateof consumption would average out to one meal per week,or �182 g/portion if only 77% of the population ever eatsfish. These rates are consistent with a previous analysis.4,5
However, although a recent survey indicated that 87.5%of the U.S. population eats fish at least once over thecourse of a year,22 older data23 suggest that in the early1970s, 40–50% of the population reported eating fish“seldom or never”, which would increase the effectiverate of consumption by “users” to �27 g/day at that time.These estimates are also reasonably consistent with those
of Stern et al.24 for New Jersey; their data indicate a meanportion size of 168 g and a median consumption rate of�1.3 meals/week, yielding a median per capita consump-tion rate of �30 g/day. Other comparisons of recent dataon fish consumption rates include 19–24 g/day inGreece,25 �27 g/day in Native American freshwater fish-ers,26 and an assumed value of 32 g/day for a study in thelower Mississippi River area,27 but substantially highervalues in Hong Kong (�150 g/day).28
Average Exposures to MeHg. At a consumption-weightedaverage MeHg concentration in fish of 0.15 ppm,22 aconsumption rate of 19 g/day, and a median body weightof 71.4 kg,4,5 the corresponding population-averageMeHg exposure rate would be �0.039 �g/kg/day, which isbelow the EPA-recommended limit of 0.1 �g/kg/day. Thisestimate is also consistent with the data of Stern et al.(median � 0.043 �g/kg/day)24 and those of Dougherty etal.29 for total Hg in all food sources (0.04–0.08 �g/kg/day,depending on how values below the minimum detectionlimit are handled). However, persons eating more thanthree fish meals per week (11% of the New Jersey popu-lation24) or with a diet limited to fish having substantiallyhigher Hg content would be likely to exceed the EPAguideline. Carrington and Bolger22 indicated that, nation-wide, only �7% of consumers are likely to exceed threefish meals per week. More recent data collected in theNational Health and Nutrition Examination Survey(NHANES) IV study suggest that 8% of the population isabove the EPA reference dose based on blood biomarkersthat reflect all exposures to Hg.30
Recent survey data on consumption of home-pro-duced foods31 indicate that only �2% of the U.S. popu-lation consumes home-caught fish, with a median con-sumption rate of 1.1 g/kg/day for the child-bearing ages of20–39. If this rate of consumption is consistent with thatof all fish consumers, there would be no need to treatconsumers of home-caught fish as a separate special case,which would greatly simplify the risk analysis. Testingthis hypothesis requires estimates of the distribution offish consumption for the general public.
Previous research4,5 indicates that this distribution islog normal with a geometric SD of 2.5. Thus, if the me-dian intake is 0.27 g/kg/day, the 95th percentile would be�1.2 g/kg/day and the 99th percentile would be �2.3g/kg/day. In Table 1, we compare the distributions of fishconsumption for the general public with that for self-caught fish.31 For this purpose, our working hypothesiswas that the distribution of consumption of self-caughtfish, which comprises 2% of that sample, corresponds tothe upper 2% of the distribution of all fish eaters. If this istrue, the median consumption rate for self-caught fish
Lipfert, Morris, Sullivan, Moskowitz, and Renninger
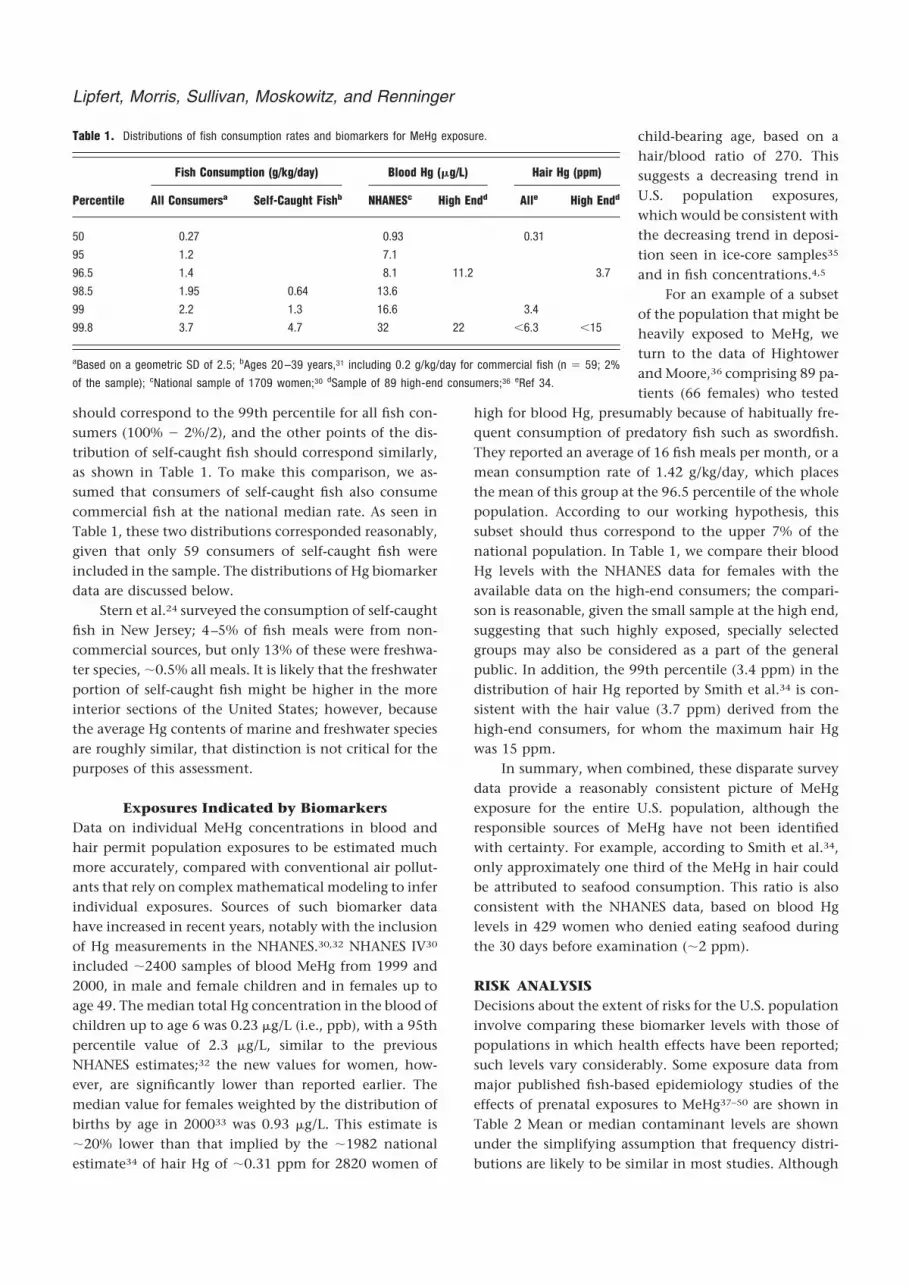
should correspond to the 99th percentile for all fish con-sumers (100% � 2%/2), and the other points of the dis-tribution of self-caught fish should correspond similarly,as shown in Table 1. To make this comparison, we as-sumed that consumers of self-caught fish also consumecommercial fish at the national median rate. As seen inTable 1, these two distributions corresponded reasonably,given that only 59 consumers of self-caught fish wereincluded in the sample. The distributions of Hg biomarkerdata are discussed below.
Stern et al.24 surveyed the consumption of self-caughtfish in New Jersey; 4–5% of fish meals were from non-commercial sources, but only 13% of these were freshwa-ter species, �0.5% all meals. It is likely that the freshwaterportion of self-caught fish might be higher in the moreinterior sections of the United States; however, becausethe average Hg contents of marine and freshwater speciesare roughly similar, that distinction is not critical for thepurposes of this assessment.
Exposures Indicated by BiomarkersData on individual MeHg concentrations in blood andhair permit population exposures to be estimated muchmore accurately, compared with conventional air pollut-ants that rely on complex mathematical modeling to inferindividual exposures. Sources of such biomarker datahave increased in recent years, notably with the inclusionof Hg measurements in the NHANES.30,32 NHANES IV30
included �2400 samples of blood MeHg from 1999 and2000, in male and female children and in females up toage 49. The median total Hg concentration in the blood ofchildren up to age 6 was 0.23 �g/L (i.e., ppb), with a 95thpercentile value of 2.3 �g/L, similar to the previousNHANES estimates;32 the new values for women, how-ever, are significantly lower than reported earlier. Themedian value for females weighted by the distribution ofbirths by age in 200033 was 0.93 �g/L. This estimate is�20% lower than that implied by the �1982 nationalestimate34 of hair Hg of �0.31 ppm for 2820 women of
child-bearing age, based on ahair/blood ratio of 270. Thissuggests a decreasing trend inU.S. population exposures,which would be consistent withthe decreasing trend in deposi-tion seen in ice-core samples35
and in fish concentrations.4,5
For an example of a subsetof the population that might beheavily exposed to MeHg, weturn to the data of Hightowerand Moore,36 comprising 89 pa-tients (66 females) who tested
high for blood Hg, presumably because of habitually fre-quent consumption of predatory fish such as swordfish.They reported an average of 16 fish meals per month, or amean consumption rate of 1.42 g/kg/day, which placesthe mean of this group at the 96.5 percentile of the wholepopulation. According to our working hypothesis, thissubset should thus correspond to the upper 7% of thenational population. In Table 1, we compare their bloodHg levels with the NHANES data for females with theavailable data on the high-end consumers; the compari-son is reasonable, given the small sample at the high end,suggesting that such highly exposed, specially selectedgroups may also be considered as a part of the generalpublic. In addition, the 99th percentile (3.4 ppm) in thedistribution of hair Hg reported by Smith et al.34 is con-sistent with the hair value (3.7 ppm) derived from thehigh-end consumers, for whom the maximum hair Hgwas 15 ppm.
In summary, when combined, these disparate surveydata provide a reasonably consistent picture of MeHgexposure for the entire U.S. population, although theresponsible sources of MeHg have not been identifiedwith certainty. For example, according to Smith et al.34,only approximately one third of the MeHg in hair couldbe attributed to seafood consumption. This ratio is alsoconsistent with the NHANES data, based on blood Hglevels in 429 women who denied eating seafood duringthe 30 days before examination (�2 ppm).
RISK ANALYSISDecisions about the extent of risks for the U.S. populationinvolve comparing these biomarker levels with those ofpopulations in which health effects have been reported;such levels vary considerably. Some exposure data frommajor published fish-based epidemiology studies of theeffects of prenatal exposures to MeHg37–50 are shown inTable 2 Mean or median contaminant levels are shownunder the simplifying assumption that frequency distri-butions are likely to be similar in most studies. Although
Table 1. Distributions of fish consumption rates and biomarkers for MeHg exposure.
Percentile
Fish Consumption (g/kg/day) Blood Hg (�g/L) Hair Hg (ppm)
All Consumersa Self-Caught Fishb NHANESc High Endd Alle High Endd
50 0.27 0.93 0.31
95 1.2 7.1
96.5 1.4 8.1 11.2 3.7
98.5 1.95 0.64 13.6
99 2.2 1.3 16.6 3.4
99.8 3.7 4.7 32 22 �6.3 �15
aBased on a geometric SD of 2.5; bAges 20 –39 years,31 including 0.2 g/kg/day for commercial fish (n � 59; 2%
of the sample); cNational sample of 1709 women;30 dSample of 89 high-end consumers;36 eRef 34.
Lipfert, Morris, Sullivan, Moskowitz, and Renninger

there are questions about many of these studies in terms ofexposure measurements and interpretation of the varioustypes of neurological endpoints that have been used, a“macro” examination across the studies in Table 234 may beinformative. Some key facts from the major studies are asfollows:
1. No adverse effects have been found in the Sey-chelles,45,46 where the children are healthy (and
even precocious), diets are balanced, and levels ofpolychlorinated biphenyl (PCB) and Pb exposure arelow. Median Hg levels in hair there are quite highcompared with those in the United States (Table 1)but similar to those found in Hong Kong.28
2. Pilot whale, which contains high levels of contam-inants, particularly PCBs, is a major feature of theFaeroese diet.51
Table 2. Exposures to fish contaminants in recent major epidemiological studies.
Reference Location Subjects
MeHg PCBs
Blood Pb EffectsHair Blood Cord Cord Blood Milk
Jacobson and
Jacobson37
Lake Michigan 212 mothers and
children
1 (child; age 11) 3 6 841 6 High PCBs � lower
IQ; some effects
of Pb and Hg
Lonky et al.38 Lake Ontario 559 mothers and
babies
(Grouped by implied
PCB exposure)
Those with high
PCBs scored
worst
Stewart et al.39 Lake Ontario 293 mothers and
children
0.50 0.53 Those with heavy Cl
PCBs were worst;
no effect of Hg or
Pb
Stewart et al.40 Lake Ontario 212 children 0.50 0.52 153 1.7 Effects of PCBs;
interaction with
Hg
Darvill et al.41 Lake Ontario 247 mothers and
children
0.50 0.53 153 1.7 High PCBs � lower
score; no effect
of MeHg
Schantz et al.42 Michigan 572 adults who ate
fish
2–4 17 3.9 High PCBs � lower
recall
419 adults who ate
no fish
�2 6 3.5 No effect of Hg or
Pb
Marsh et al.43 Peru 131 mothers and
infants
7 (mothers) No effects
Kjellstrom et al.44 New Zealand 73 mothers and
infants
10 (mothers) 5.6 Lower IQ for highest
Hg exposures
Davidson et al.45
and Myers et al.46
Seychelles 711 mothers and
children
6.8 (mothers); 6.5
(child, age 6)
Not detectable in
blood
2 No effects
Grandjean et al.47 Faeroe Islands 435 mothers and
children
4 26ppb 1.9 Neurological effects;
possible
interaction
between PCBs
and Hg
Steuerwald et al.48 Faeroe Islands 182 births 4 20ppb 1.1 1520 Hg � low neonatal
neurological
function
Weihe et al.49 Greenland 43 mothers and
children
16 (mothers); 5
(children)
Hg effects not
significant
Murata et al.50 Madeira 149 mothers and
children
9.6 (mothers); 3.8
(children)
Effects when
maternal hair Hg
� 10 ppm
Note: Hair Hg levels are in ppm, blood Hg levels are in �g/L, milk PCB levels are in ng/g of lipids, blood Pb is in �g/dL.
Lipfert, Morris, Sullivan, Moskowitz, and Renninger

3. In the Michigan studies,42 Hg was low, Pb andPCBs were higher, and adverse effects were found.
4. In the recent Lake Ontario study,40 PCB concen-trations in umbilical cord blood were statisticallysignificant predictors of reduced cognitive devel-opment, and an interaction was seen between Hgand PCB exposures, but hair Hg (median � 0.5ppm) was not a significant predictor in its ownright.
5. Average lead levels were slightly elevated in NewZealand children.44 In addition, it is important tonote that these 73 children were selected from amuch larger cohort (�10,000) on the basis of highexposures.
6. In all other locations, maternal Hg levels exceededthose in the Seychelles, and adverse effects werereported. Unfortunately, concentrations of allother contaminants were often not reported.
7. The NAS review1 apparently did not consider theGreat Lakes studies.37–42
Determination of ThresholdsFinding a dose–response threshold is often difficult for aweak effect because random noise tends to obscure anydepartures from linearity. Such difficulties are com-pounded when the measure of exposure (such as hair Hg)is a surrogate for the actual agent (brain Hg).52 In thisstudy, we tried to deduce the existence of a threshold ona population rather than an individual level, on the basisof the absence of statistically significant (linear) re-sponses. The data in Table 2 suggest that a populationthreshold for Hg effects may exist around the mean levelof the Seychelles cohort, i.e., �7 ppm in hair, which issimilar to a previous WHO advisory level.44 According tothe analysis of Carrington and Bolger,22 only �0.2% ofU.S. females 16–49 of age would exceed this threshold. Bycontrast, �8% of the female population exceeds a hairlevel of 1.1 ppm, which corresponds to the EPA’s refer-ence dose for MeHg. The findings of adverse effects in theFaeroe Islands and in Michigan are likely to be the resultof other contaminants (PCBs and Pb), perhaps in combi-nation with Hg.53,54 Note that it is not necessary for acontaminant other than Hg to be a confounder (i.e., cor-related with Hg) to have an effect on the outcome of anepidemiological study. Given the likely presence of athreshold for neurological effects, the other contaminantscould reinforce the effects of Hg by acting as an effectmodifier. It is more difficult to establish threshold levelsfor PCBs or Pb relative to normal levels, but Hoover55
cited a value of 238 ng/g for PCBs in Canadian breast milkand Pirkle et al.56 found a mean Pb level of 2.3 �g/dL forU.S. blood samples. Many of the known exposure levels in
Table 2 exceed these reference values, especially the PCBsin the Faeroese population.57
Summary of RisksAn important conclusion from Table 2 is that MeHg is notlikely to be the only contaminant in seafood in manysituations; careful measurements of all exposures will berequired to partition any adverse effects. For now, theGreat Lakes studies may provide the best indications ofeffects in the United States, and the mean Hg levels inthose studies (0.5–1 ppm in hair) were well above themost recent U.S. estimates (median � 0.2 ppm).32 Forexample, using an average hair/intake ratio of 18,52 theEPA’s intake guideline (RfD) of 0.1 �g/kg/day translates toa blood concentration of 5.8 �g/L (1.8 ppm in hair).According to the NHANES exposure data,30 8% of U.S.females exceed this guideline. Furthermore, the WHOguideline of 6 ppm in hair corresponds to an Hg intake of0.3 �g/kg/day (the previous EPA RfD); based on the mostrecent NHANES blood data, the MeHg exposures of�99.5% of the U.S. population would be below this limit,as well as �75% of those eating home-caught fish.
In characterizing risks, it is important to distinguishbetween a public health advisory level, such as the EPARfD, and exposure levels that actually relate to observedrisks (Table 2). To ensure a margin of safety, public healthadvisory levels are deliberately set well below any ob-served thresholds. As a result, predictions of risk or harmbased on such advisory levels may be misleading. Thiscaveat certainly applies to the NAS prediction of largenumbers of American children at risk for “adverse neuro-developmental effects (see p. 327 in reference 1).
It is also important to characterize the nature of suchneurodevelopmental effects. For example, frank manifes-tations of mercury poisoning, such as paresthesia or lossof coordination, have never been an issue at these lowexposure levels. Instead, the types of effects seen in somestudies of children may include delays in first walking ortalking of a few days, intelligence quotient (IQ) deficits ofa few points, or small deficits in performance on testsof memory or dexterity. Furthermore, it has also beenshown that such deficits in young children may not bepermanent.40
RISK MANAGEMENTFrom the outset, it hardly seems necessary to point outthat removing fish from the U.S. diet is not an option. Theultimate goal must be to make fish safe to eat becauseseafood consumption confers many other health benefits.Risk management must therefore consider the best waysto reach this goal, which is quite separate from the tradi-tional concerns of environmental regulation per se. Also,
Lipfert, Morris, Sullivan, Moskowitz, and Renninger
unwarranted concerns about low levels of fish contami-nants could prove to be counterproductive to publichealth.
The Precautionary PrincipleGiven the highly toxic nature of mercury at sufficientlyhigh doses, one might ask, “Why not eliminate all con-sumer uses of Hg and prohibit any and all industrialdischarges, regardless of any scientific or risk assessmentconsiderations?” This evokes the “precautionary princi-ple”, which states: “When an activity raises threats ofharm to human health or the environment, precaution-ary measures should be taken even whether some causeand effect relationships are not fully established scientif-ically.” However, a main tenet of any public health actionshould be, “First, do no harm.”58
Four central components of the precautionary prin-ciple are (1) taking preventive action in the face of uncer-tainty, (2) shifting the burden of proof to the proponentsof an activity, (3) exploring a wide range of alternatives topossible harmful actions, and (4) increasing public partic-ipation in decision-making.59 Public health practitionersalso use the term “primary prevention” in this context.Goldstein60–62 has written extensively on this subject andpoints out that the EPA is not a public health agency inthat punitive actions sometimes tend to be taken withoutregard to unintended consequences.60
In contrast, the primary public health approach isthat of minimization of risk, in this case, neurologicaldamage to the fetus from any of a number of possibletoxic agents, MeHg being only one. Kriebel and Tickner63
point out that “Precaution is relevant to public health,because it can help to prevent unintended consequencesof well-intentioned public health interventions by ensur-ing a more through assessment of the problems and pro-posed solutions.” Some possible unintended conse-quences (i.e., the “doing of harm”) of large-scale removalof Hg from coal-fired power plant flue gas may include thefollowing:
1. Increased electricity costs, with effects throughoutthe economy, including making air conditioningless affordable to those who may need it for healthreasons.
2. Diminution of efforts to abate other sources of Hgin the environment (as listed above).
3. Conversion of the Hg removed from flue gas fromvery dilute levels spread over a wide area to highlyconcentrated levels that must be disposed of assolid waste, at a substantial cost.
4. Creating a false sense of security with respect tothe safety of freshwater fish.
Other actions designed to remove Hg from the envi-ronment and their unintended consequences include
1. unwarranted fears of toxicity from amalgam den-tal fillings containing Hg (unnecessary removal)64;
2. banning of Hg manometers for blood pressuremeasurement in hospitals, clinics, and physicians’offices (the replacement electronic devices tend tobe less accurate);65 and
3. banning of thimerosal, a preservative containingHg, from childhood vaccines (increased costs),64,66
Unintended consequences could also result from theU.S. Department of Defense’s reported intention to dumpits mercury stockpile on the open market, which couldfurther reduce Hg prices and end up in environmentallyunfriendly uses such as gold mining.67 Brazil’s 1989 emis-sion of Hg from gold mining was estimated to be 168 t,which is roughly equivalent to U.S. emissions from allsources. At a price of $12.00/g and a 1:1 ratio of mercuryto gold, it seems to be far cheaper to pay gold miners notto mine gold than to remove Hg from flue gases, whichhas been estimated to cost 3–4 times higher.68
Will Mercury Controls on U.S. Coal-Fired PowerPlants Make the Fish Supply Safe?
The unequivocal answer is “No,” but the question mustbe considered on two levels. First, we assumed that theEPA MeHg intake guideline of 0.1 �g/kg/day must be metto provide a large margin of safety, as discussed above. Forexample, if 70% of the Hg in coal-fired power plant fluegas were removed and permanently sequestered, U.S.emissions would drop by 30 t/yr, with a total Hg deposi-tion reduction of 5–10%, depending on plant location,mercury speciation in the flue gas, and the rates of plumedilution. As seen from Figure 2, this would translate intosmaller reductions in MeHg intake, but only from fresh-water fish (deposition modeling suggests that increaseddeposition would occur only within 50–100 km of thesource; therefore, marine fish are affected mainly byglobal Hg emissions). Lacking data on commercial fresh-water fish consumption, we relied on the figures forhome-caught fish, for which the median intake level was�0.15–0.21 �g/kg/day. As seen in Figure 2, this rangewould be reduced by only 2% to �0.147–0.208 �g/kg/day, changes that are clearly in the noise level but that areexpected to require around $1.4 billion of emission con-trols. Typical avoided health effects are subtle neurologi-cal effects, such as delays in first walking or talking of afew days.69 However, health impacts would occur for onlyvery few babies.
The second level of consideration involves contami-nants other than MeHg in seafood, including PCBs, Pb,Cd, and pesticides. The small reductions in MeHg wouldimpact only an extremely small fraction of the popula-tion, because the maximum MeHg blood level in the
Lipfert, Morris, Sullivan, Moskowitz, and Renninger

NHANES data was above the implied threshold for ad-verse effects for �0.04% of the sample population. Thediscrepancy between the estimate of 0.04% above thethreshold and the fact that 8% are above the EPA expo-sure guideline of 0.1 �g/kg/day is that the EPA applied an“uncertainty factor” of 10 to the risk threshold in derivingits exposure guideline. Even if we apply the reduction of afew percentages in mercury deposition to the populationgroup above the EPA threshold, it would only minimallyreduce the number of people above the threshold. Thequestion remains, however, as to other contaminants infish that might be harmful to the developing fetus. Over-emphasizing MeHg could result in overlooking such othercontaminants, particularly in freshwater species; manystates have fish advisories for PCBs, and farmed salmonhave higher PCB content than wild salmon.70 Publisheddata on other contaminants in fish and seafood include
1. Pb, Cd, Hg, and Se in fish, birds, and mammals inGreenland;71
2. pesticides, PCBs, polycyclic aromatic hydrocar-bons, and Hg in both farmed and wild salmon;70
3. Hg and Se in mollusks, crustaceans, and fish;72
4. high blood Pb levels in Canadian consumers ofsportfish;73
5. PCBs in Lake Michigan fish;74
6. PCBs, chlorinated pesticides, Se, and Hg in QuebecInuit;75
7. Pb and Hg in the Arctic;76,77 and8. Pb, Cd, PCBs, and 1,1,1-trichloro-2,2-bis(p-chloro-
phenyl)ethane (DDT) in consumers of Great Lakesfish.78
Finally, the ability to distinguish the separate effectsof colocated contaminants in epidemiology depends onthe relative accuracy of exposure measurement;52 statisti-cal “transfer of causality” can occur with correlated pol-lutants differing in exposure reliability. Thus, the truecausal agents are not likely to be identified until all con-taminants are measured with equivalent care. This mayhave been the problem with the Faeroe Island study,47
because only a few of the many PCB congeners werestudied. Budtz-Jorgensen et al.79 noted that the effects ofMeHg in the Faeroese cohort “could be reduced to non-significance by assuming a large measurement error forthe PCB biomarker.”
CONCLUSIONSThe precautionary principle requires that a wide range ofpolicy alternatives be considered in terms of the publichealth good or harm that might ensue. The current pro-gram to reduce U.S. mercury emissions should be giventhis same degree of scrutiny. Several elements of potentialharm were listed above; elements of potential good (i.e.,goals) may be examined as follows:
1. If the goal were to improve infant health in theUnited States, imposition of Hg controls on powerplants is likely to be far less cost-effective thandirect expenditures on public health, such as bet-ter access to prenatal care or programs to reducematernal smoking and alcohol use. For example,�17% of the 4 million U.S. births in 2001 receivedno prenatal care during the first trimester;33 theannual cost of Hg controls could provide approx-imately $2000 for each of those births (approxi-mately $100 for each biweekly visit to a clinic).
2. If the goal were to improve seafood safety, themoney would be better spent on more compre-hensive inspection of seafood because only a smallfraction of the catch is likely to have elevatedcontaminant levels. Because 30% of U.S. MeHgintake comes from canned tuna, eliminating thehighest tuna concentrations through factory in-spections could have a substantial impact. For ex-ample, based on U.S. Food and Drug Administra-tion data,22 eliminating the highest 10% from thedistribution of Hg in tuna would reduce the meanU.S. MeHg intake by 6.4%; for the highest 20% oftuna, the dietary benefit in reduced MeHg wouldbe 11%. This would appear to be a much morecost-effective measure than attempting to reduceglobal Hg emissions by 11%, which would requirea reduction of �400 tons/yr (�10 times the U.S.power plant contribution). The power plant con-trol costs discussed above would correspond toapproximately $0.60 per 6-oz can consumed,which could conceivably cover a thorough Hg in-spection program. Such inspections should in-clude a wide range of possible contaminants, notjust MeHg. Safe freshwater fish will not be attaineduntil all contaminants, notably PCBs, are abated.
3. If the goal were to reduce levels of airborne Hg forits own sake and regardless of any local benefits,international trends in Hg emissions must be con-sidered, especially those from gold mining anddeveloping countries in which substantial futuregrowth in coal use might be expected, such asChina. It might be more cost-effective to providetechnical assistance in such situations than tocontrol domestic emissions from selected sourcecategories.
None of these perspectives provides unequivocal sup-port for unilaterally reducing Hg emissions from U.S. coal-fired power plants. Recent epidemiological studies suggestthat only subtle neurological effects are involved and thatthey are associated only with prenatal maternal expo-sures. Expectant mothers and women contemplatingpregnancy are now counseled to stop smoking and to
Lipfert, Morris, Sullivan, Moskowitz, and Renninger

avoid alcohol; it thus seems prudent to add a list ofproblematic fish species to the list of proscriptions untilthe absence of all potentially harmful contaminants maybe assured.
ACKNOWLEDGMENTSThe U.S. Department of Energy, National Energy Technol-ogy Laboratory, Pittsburgh, PA supported this research;Scott Renninger was the project officer. However, theopinions expressed here are those of the authors alone.The authors thank Dr. Clark Carrington for supplying aspreadsheet version of the 1999–2000 NHANES blood Hgdata.
REFERENCES1. Committee on the Toxicological Effects of Methylmercury. Toxicolog-
ical Effects of Methylmercury; National Academy Press: Washington, DC,2000.
2. Harada, M. Minamata Disease. Methylmercury Poisoning in JapanCaused by Environmental Pollution; Crit. Rev. Toxicol. 1995, 25, 1-24.
3. Bakir, F.; Damluji, S.F.; Amin-Zaki, L.; Murtadha, M.; Khalidi, A.;al-Rawi, N.Y.; Tikriti, S.; Dahahir, H.I.; Clarkson, T.W.; Smith, J.C.;Doherty, R.A. Methylmercury Poisoning in Iraq. Science 1973, 181,230-241.
4. Lipfert, F.W.; Moskowitz, P.D.; Fthenakis, V.M;. DePhillipps, M.P.;Viren, J.; Saroff, L. Assessment of Mercury Health Risks to Adults from CoalCombustion, BNL-60435, Brookhaven National Laboratory: Upton, NY,May 1994.
5. Lipfert, F.W.; Moskowitz, P.D.; Fthenakis, V.M.; Saroff, L. ProbabilisticAssessment of Health Risks of Methylmercury from Burning Coal;Neurotoxicology 1996, 17, 197-212.
6. Mercury Study Report to Congress, Vols. 1–9; EPA-452/R-97-003 to EPA-452/R-97-010; U.S. Environmental Protection Agency, U.S. Govern-ment Printing Office: Washington, DC, December 1997.
7. Mercury Maps, a Quantitative Link between Air Deposition and Fish Tissue;EPA-823/R-01-009; Office of Water, U.S. Environmental ProtectionAgency, U.S. Government Printing Office: Washington, DC, Septem-ber 2001.
8. Edgerton, E; Jansen, J; Hartsell, B. Field Observations of Mercury Par-titioning in Power Plant Plumes. Presented at the Third InternationalConference on Air Quality, Arlington, VA, September 2002.
9. Nadim, F.; Perkins, C.; Liu, S.; Carley, R.J.; Hoag, G.E. Long-TermInvestigation of Atmospheric Mercury Contamination in Connecti-cut; Chemosphere 2001, 45, 1033-1043.
10. Van Metre, P.C. The Contribution of Particles Washed from Rooftopsto Contaminant Loading in Urban Streams; Chemosphere 2003, 52,1727-1741.
11. National Atmospheric Deposition Program. Mercury Deposition Net-work: A NADP Network. Available at: http://nadp.sws.uiuc.edu/mdn/(accessed August 2003).
12. Assessment of Mercury Emissions, Transport, Fate, and Cycling for theContinental United States: Model Structure and Evaluation; Electric PowerResearch Institute: Palo Alto, CA, 1999.
13. Schwesig, D; Matzner, E. Pools and Fluxes of Mercury and Methylmer-cury in Two Forested Catchments in Germany. Sci. Total Environ. 2000;260, 213-223.
14. Fostier, A.H.; Forti, M.C.; Guimaraes, J.R.D., Melfi, A.J.; Boilet, R.;Espirito Santo, C.M.; Krug, F.J. Mercury Fluxes in a Natural ForestedAmazonian Catchment (Serra do Navio, Amapa State, Brazil); Sci. TotalEnviron. 2000, 260, 201-211.
15. Martinez-Cortizas, A.; Pontraveda-Pombal, X.; Garci-Rodeja, E.; No-voa-Munoz, J.C.; Shotyk, W. Mercury in a Spanish Peat Bog: Archive ofClimate Change and Atmospheric Metal Deposition; Science 1999,284, 939-942.
16. Lindberg, S.E.; Stratton, W.J. Atmospheric Mercury Speciation: Con-centration and Behavior of Reactive Gaseous Mercury in Ambient Air;Environ. Sci. Technol. 1998, 32, 49-57.
17. Tan, H.; He, J.L.; Liang, L.; Lazoff, S.; Sommer, J.; Xiao, Z.F.; Lindqvist,O. Atmospheric Mercury Deposition in Guizhou, China; Sci. TotalEnviron. 2000, 259, 223-230.
18. Guentzel, J.L.; Landing, W.M.; Gill, G.A.; Pollman, C.D. ProcessesInfluencing Rainfall Deposition of Mercury in Florida; Environ. Sci.Technol. 2001, 35, 863-873.
19. Bigham, G.N.; Vandal, G.M. A Drainage Basin Perspective of MercuryTransport and Bioaccumulation: Onondaga Lake, New York; Neuro-toxicology 1996, 17, 279-290.
20. Pai, P; Niemi, D; Powers B. A North American Inventory of Anthro-pogenic Mercury Emissions; Fuel Process. Technol. 2000, 65-66, 101-115.
21. Hanisch, C. Where Is Mercury Deposition Coming from? Environ. Sci.Technol. 1998, 32, 176A-179A.
22. Carrington, C.; Bolger, M. An Exposure Assessment for Methylmer-cury from Seafood for Consumers in the United States; Risk Analysis2002, 22, 689-699.
23. Dresser, C.M.V. Food Consumption Profiles of White and Black PersonsAged 1–74 Years; Vital and Health Statistics, Series 11, No. 210. DHEWPublication No. (PHS) 79-1658. U.S. Department of Health, Education,and Welfare, National Center for Health Statistics: Hyattsville, MD,1979.
24. Stern, A.H.; Korn, L.R.; Ruppel, B.E. Estimation of Fish Consumptionand Methylmercury Intake in the new Jersey Population; J. Expos.Anal. Environ. Epidemiol. 1996, 6, 503-525.
25. Trichopolou, A.; Costacou, T.; Barnia, C. Adherence to a Mediterra-nean Diet and Survival in a Greek Population; N. Engl. J. Med. 2003,348, 2599-2608.
26. Marien, K.; Patrick, G.M. Exposure Analysis of Five Fish-ConsumingPopulations for Overexposure to Methylmercury; J. Expo. Anal. Envi-ron. Epidemiol. 2001, 11, 193-206.
27. Watanabe, K.H.; Desimone, F.W.; Thiyagarajah, A.; Hartley, W.R.;Hindrichs, A.E. Fish Tissue Quality in the Lower Mississippi River andHealth Risks From Fish Consumption; Sci. Total Environ. 2003, 302,109-126.
28. Dickman, M.D.; Leung, K.M.C. Mercury and Organochlorine Exposurefrom Fish Consumption in Hong Kong; Chemosphere 1998, 37, 991-1015.
29. Dougherty, C.P.; Holtz, S.H.; Reinert, J.C.; Panycosit, L.; Axelrad, D.A.;Woodruff, T.J. Dietary Exposures to Food Contaminants across theUnited States. Environ. Res. 2000, A84, 170-185.
30. Schober, D.E.; Sinks, T.H.; Jones, R.L.; Bolger, P.M.; McDowell, M.;Osterloh, J.; Garrett, E.S.; Canady, R.A.; Dillon, C.F.; Sun, Y.; et al.Blood Mercury Levels in US Children and Women of ChildbearingAge, 1999–2000; JAMA 2003, 289, 1667-1674.
31. Moya, J.; Phillipps, L. Analysis of Consumption of Home-ProducedFoods; J. Expos. Anal. Environ. Epidemiol. 2001, 11, 398-406.
32. Center for Food Safety and Applied Nutrition. Blood and Hair MercuryLevels in Young Children and Women of Childbearing Age–UnitedStates, 1999. Morb. Mortal. Wkly. Rep., 2001, 50, 140-143.
33. Martin, J.A.; Park, M.M.; Sutton, P.D. Births: Preliminary Data for 2001.National Vital Statistics Report 50, No. 10. National Center for HealthStatistics: Hyattsville, MD, June 6, 2002.
34. Smith, J.C.; Allen, P.V.; Von Burg, R. Hair Methylmercury Levels in USWomen; Arch. Environ. Health 1997, 52, 476-480.
35. Shuster, P.F.; Krabbenhoft, D.P.; Naftz, D.L.; Cecil, L.D.; Susong, D.D.;Green, J.R.; Abbott, M.L. Atmospheric Mercury Deposition during theLast 270 Years: A Glacial Ice Core Record of Natural and Anthropo-genic Sources; Environ. Sci. Technol. 2002, 36, 2303-2310.
36. Hightower, J.M.; Moore, D. Mercury Levels in High-End Consumers ofFish; Environ. Health Perspect. 2003, 111, 604-608.
37. Jacobson, J.L.; Jacobson, S.W. Intellectual Impairment in ChildrenExposed to Polychlorinated Biphenyls in Utero; N. Engl. J. Med. 1996,335, 783-789.
38. Lonky, E.; Reihman, J.; Darvill, T.; Mather, J.; Daly, H. NeonatalBehavioral Assessment Scale Performance in Humans Influenced byMaternal Consumption of Environmentally Contaminated Lake On-tario Fish; Great Lakes Res. 1996, 22, 198-212.
39. Stewart, P.; Reihman, J.; Lonky, E.; Darvill, T.; Pagano, J. Prenatal PCBExposure and Neonatal Behavioral Assessment of Scale (NBAS) Perfor-mance; Neurotoxicol. Teratol. 2000, 22, 21-29.
40. Stewart, P.W.; Reihman, J.; Lonky, E.I.; Dsarvill, T.J.; Pagano, J. Cog-nitive Development in Preschool Children Prenatally Exposed to PCBsand MeHg; Neurotoxicol. Teratol. 2003, 25, 11-22.
41. Darvill, T.; Stewart, P.; Reihman, J.; Lonky, E.; Pagano, J. PrenatalExposure to PCBs and Infant Performance on the Fagan Test of InfantIntelligence; Neurotoxicology 2000, 21, 1029-1038.
42. Schantz, S.L.; Gasior, D.M.; Polverejan, E.; McCaffrey, R.J.; Sweeney,A.M.; Humphrey, H.E.B.; Gardiner, J.C. Impairments of Memory andLearning in Older Adults Exposed to Polychlorinated Biphenyls viaConsumption of Great Lakes Fish; Environ. Health Perspect. 2001, 109,605-611.
43. Marsh, D.O.; Turner, M.D.; Smith, J.C.; Allen, P.; Richdale, N. FetalMethylmercury Study in a Peruvian Fish-Eating Population; Neurotoxi-cology 1995, 16, 717-726.
44. Kjellstrom, T.; Kennedy, P.; Wallis, S.; Mantell, C. Physical and MentalDevelopment of Children with Prenatal Exposure to Mercury from Fish.Stage 1, Preliminary Tests at Age 4, Report 3080; Swedish EnvironmentalProtection Board: Solna, Sweden, 1986.
45. Davidson, P.W.; Myers, G.J.; Cox, C.; Axtell, C.; Shamlaye, C.; Sloane-Reeves, J.; Cernichiari, E.; Needham, L.; Choi, A.; Wang, Y.; Berlin, M.;Clarkson, T.W. Effects of Prenatal and Postnatal Methylmercury Ex-posure from Fish Consumption on Neurodevelopment; JAMA 1998,280, 701-707.
Lipfert, Morris, Sullivan, Moskowitz, and Renninger

46. Myers, G.J.; Davidson, P.W.; Cox, C.; Shamlaye, C.; Palumbo, D.;Cernichiari, E.; Sloane-Reeves, J.; Wilding, G.E.; Kost, J.; Huang, L-S.;Clarkson, T.W. Prenatal Methylmercury Exposure from Ocean FishConsumption in the Seychelles Child Development Study; Lancet2003, 361, 1686-1692.
47. Grandjean, P.; Weihe, P.; Burse, V.W.; Needham, L.L.; Storr-Hansen,E.; Heinzow, B.; Debes, F.; Murata, K.; Simonsen, H.; Ellefesen, P.;Budtz-Jorgensen, E.; Keiding, N.; White, R.F. Neurobehavioral DeficitsAssociated with PCB in 7-Year Old Children Prenatally Exposed toSeafood Neurotoxicants; Neurotoxicol. Teratol. 2001, 23, 305-317.
48. Steuerwald, U.; Weihe, W.; Jorgensen, P.J.; Bjerve, K.; Brock, J.; Hein-zow, B.; Budtz-Jorgensen, E.; Grandjean, P. Maternal Seafood Diet,Methylmercury Exposure, and Neonatal Neurologic Function; J. Pedi-atr. 2000, 136, 599-605.
49. Weihe, P.; Hansen, J.C.; Murata, K.; Debes, F.; Jorgensen, P.J.; Steuer-wald, U.; White, R.F.; Grandjean, P. Neurobehavioral Performance ofInuit Children with Increased Prenatal Exposure to Methylmercury;Int. J. Circumpolar Health 2002, 61, 41-49.
50. Murata, K.; Weihe, P.; Renzoni, A.; Debes, F.; Vasconcelos, R.; Ziono,F.; Araki, S.; Jorgensen, P.J.; White, R.F.; Grandjean, P. Delayed EvokedPotentials in Children Exposed to Methylmercury from Seafood; Neu-rotoxicol. Teratol. 1999, 21, 343-348.
51. Weihe, P.; Grandjean, P.; Debes, F.; White, R. Neurobehavioral Perfor-mance of Inuit Children with Increased Prenatal Exposure to Methyl-mercury; Sci. Total Environ. 1996, 186, 141-148.
52. Lipfert, F.W. Estimating Exposure to Methylmercury: Effects of Uncer-tainties; Water Air Soil Pollut. 1997, 97, 119-145.
53. Bemis, J.C.; Seegal, R.F. Polychlorinated Biphenyls and Methylmer-cury Act Synergistically to Reduce Rat Brain Dopamine Content inVitro; Environ. Health Perspect. 1999, 107, 879-885.
54. Nakai, K.; Satoh, H. Developmental Neurotoxicity following PrenatalExposures to Methylmercury and PCBs from Epidemiological Studies;Tohoku J. Exp. Med. 2002, 196, 89-98.
55. Hoover, S.M. Exposure to Persistent Organochlorines in CanadianBreast Milk: A Probabilistic Assessment; Risk Anal. 1999, 19, 527-542.
56. Pirkle, J.L.; Kaufmann, R.B.; Brody, D.J.; Hickman, H.; Gunter, E.W.;Paschal, D.C. Exposure of the US Population to Lead, 1991–1994;Environ. Health Perspect. 1998, 106, 745-750.
57. Longnecker, M.P.; Wolff, M.S.; Gladen, B.C.; Brock, J.W.; Grandjean,P.; Jacobson, J.L.; Korrick, S.A.; Rogan, W.J.; Weisglas-Kuperus, N.;Hertz-Picciotto. I.; et al. Comparison of Polychlorinated BiphenylLevels across Studies of Human Development; Environ. Health Perspect.2003, 111, 65-70.
58. Blendon, R.J.; Rogers, D.E. Cutting Medical Care Costs. Primum nonNocere; JAMA 1983, 250, 1880-1885.
59. Kriebel, D.; Tickner, J.; Epstein, P.; Lemons, J.; Levins, R.; Loechler,E.L.; Quinn, M.; Rudel, R.; Schettler, T.; Stoto, M. The PrecautionaryPrinciple in Environmental Science; Environ. Health Perspect. 2001,109, 871-876.
60. Goldstein, B.D. EPA as a Public Health Agency; Regul. Toxicol. Pharma-col. 1988, 8, 328-334.
61. Goldstein, B.D. The Precautionary Principle and Scientific ResearchAre Not Antithetical; Environ. Health Perspect. 1999, 107, A594-A595.
62. Goldstein, B.D. The Precautionary Principle also Applies to PublicHealth Actions; Am. J. Public Health 2001, 91, 1358-1361.
63. Kriebel, D.; Tickner, J. Reenergizing Public Health through Precaution;Am. J. Public Health 2001, 91, 1351-1354.
64. Clarkson, T.W. The Three Faces of Modern Mercury; Environ. HealthPerspect. 2002, 110 (Suppl), 11-23.
65. Kolata, G. Risks Seen in Move to Replace Gauge of Blood Pressure. NewYork Times, Section 1, p. 1, June 16, 2002.
66. Ball, L.K.; Ball, R.; Pratt, R.D. An Assessment of Thimerosal Use inChildhood Vaccines; Pediatrics 2001, 107, 1147-1154.
67. Murdock, B.S. Mercury Stockpile; Science 1996, 272, 1247-1251.68. Sivrastava, R.K.; Sedman, C.B.; Kilgoe, J.D.; Smith, D.; Renninger, S.
Preliminary Estimates of Performance and Cost of Mercury ControlTechnology on Electric Utility Boilers; J. Air & Waste Manage. Assoc.2001, 51, 1460-1470.
69. Carrington, C.D.; Bolger, P.M. A Pooled Analysis of the Iraqi andSeychelles Methylmercury Studies; Hum. Ecol. Risk Assess. 2000, 6,323-340.
70. Easton, M.D.L., Luszniak, D.; Von der Geest, E. Preliminary Examina-tion of Contaminant Loadings in Farmed Salmon, Wild Salmon, andCommercial Salmon Feed; Chemosphere 2002, 46, 1053-1074.
71. Dietz, R.; Riget, F.; Johansen, P. Lead, Cadmium, Mercury and Sele-nium in Greenland Marine Animals; Sci. Total Environ. 1996, 186,67-93.
72. Cappon, C.J.; Smith, JC. Chemical Form and Distribution of Mercuryand Selenium in Edible Seafood; J. Anal Toxicol. 1982, 6, 10-21.
73. Kosatsky, T.; Przybysz, R.; Weber, J.-P.; Kearney, J. Puzzling Elevationof Blood Lead Levels among Consumers of Freshwater Sportfish; Arch.Environ. Health 2001, 56, 111-115.
74. Schwartz, P.M.; Jacobson, S.W.; Fein, G.; Jacobson, J.L.; Price, H.A.Lake Michigan Fish Consumption as a Source of Polychlorinated Bi-phenyls in Human Cord Serum, Maternal Serum, and Milk; Am. J.Public Health, 1983; 1983, 73, 293-296.
75. Muckle, G.; Ayotte, P.; Dewailly, E.; Jacobson, S.W.; Jacobson, J.L.Prenatal Exposure of the Northern Quebec Inuit Infants to Environ-mental Contaminants; Environ. Health Perspect. 2001, 109, 1291-1299.
76. Dewailly, E.; Ayotte, P.; Bruneau, S.; Laliberte, C.; Mui, D.C.G.;Norstrom, R.J. Inuit Exposure to Organochlorines through the AquaticFood Chain in Arctic Quebec; Environ. Health Perspect. 1993; 101,618-620.
77. Dewailly, E.; Ayotte, P.; Bruneau, S.; Lebel, G.; Levallois, P.; Weber, J.P.Exposure of the Inuit Population of Nunavik (Arctic Quebec) to Leadand Mercury; Arch. Environ. Health 2001, 56, 350-357.
78. Hovinga, M.E.; Sowers, M.; Humphrey, H.E.B. Environmental Expo-sures and Lifestyle Predictors of Lead Cadmium, PCB, and DDT Levelsin Great Lakes Fish Eaters; Arch. Environ. Health 1993, 48, 98-104.
79. Budtz-Jorgensen, E.; Keiding, N.; Grandjean, P.; Weihe, P. Estimationof Health Effects of Prenatal Methylmercury Exposure Using StructuralEquation Models; Environ. Health 2002, 1, 2.
About the AuthorsFred Lipfert is a private consultant in Northport, NY; SamMorris is a private consultant in Port Jefferson, NY; TerrySullivan and Paul Moskowitz are affiliated with Brook-haven National Laboratory, Upton, NY; and Scott Ren-ninger is affiliated with The Babcock and Wilcox Com-pany, Barberton, OH. Address correspondence to: TerrySullivan, Brookhaven National Laboratory, P.O. Box5000, Upton, NY 11973; phone: 1-631-344-2840; e-mail:[email protected].
Lipfert, Morris, Sullivan, Moskowitz, and Renninger


