Embed Size (px)
Citation preview
Micro Focus SecurityArcSight LoggerSoftware Version: 7.2
Administrator's Guide
Document Release Date: May, 2021Software Release Date: May, 2021
Legal NoticesMicro Focus The Lawn22-30 Old Bath RoadNewbury, Berkshire RG14 1QNUK
https://www.microfocus.com
Copyright Notice© Copyright 2021 Micro Focus or one of its affiliates
Confidential computer software. Valid license from Micro Focus required for possession, use or copying. The information contained herein is subject to change without notice.
The only warranties for Micro Focus products and services are set forth in the express warranty statements accompanying such products and services. Nothing herein should be construed as constituting an additional warranty. Micro Focus shall not be liable for technical or editorial errors or omissions contained herein.
No portion of this product's documentation may be reproduced or transmitted in any form or by any means, electronic or mechanical, including photocopying, recording, or information storage and retrieval systems, for any purpose other than the purchaser's internal use, without the express written permission of Micro Focus.
Notwithstanding anything to the contrary in your license agreement for Micro Focus ArcSight software, you may reverse engineer and modify certain open source components of the software in accordance with the license terms for those particular components. See below for the applicable terms.
U.S. Governmental Rights. For purposes of your license to Micro Focus ArcSight software, “commercial computer software” is defined at FAR 2.101. If acquired by or on behalf of a civilian agency, the U.S. Government acquires this commercial computer software and/or commercial computer software documentation and other technical data subject to the terms of the Agreement as specified in 48 C.F.R. 12.212 (Computer Software) and 12.211 (Technical Data) of the Federal Acquisition Regulation (“FAR”) and its successors. If acquired by or on behalf of any agency within the Department of Defense (“DOD”), the U.S. Government acquires this commercial computer software and/or commercial computer software documentation subject to the terms of the Agreement as specified in 48 C.F.R. 227.7202-3 of the DOD FAR Supplement (“DFARS”) and its successors. This U.S. Government Rights Section 18.11 is in lieu of, and supersedes, any other FAR, DFARS, or other clause or provision that addresses government rights in computer software or technical data.
Trademark NoticesAdobe™ is a trademark of Adobe Systems Incorporated.
Microsoft® and Windows® are U.S. registered trademarks of Microsoft Corporation.
UNIX® is a registered trademark of The Open Group.
Documentation UpdatesThe title page of this document contains the following identifying information:
l Software Version number
l Document Release Date, which changes each time the document is updated
l Software Release Date, which indicates the release date of this version of the software
To check for recent updates or to verify that you are using the most recent edition of a document, go to:
https://www.microfocus.com/support-and-services/documentation
Administrator's Guide
Micro Focus Logger (7.2) Page 2 of 743
Support
Phone A list of phone numbers is available on the Technical Support Page: https://softwaresupport.softwaregrp.com/support-contact-information
Support Web Site https://softwaresupport.softwaregrp.com/
ArcSight Product Documentation https://community.softwaregrp.com/t5/ArcSight-Product-Documentation/ct-p/productdocs
Contact Information
About this PDF Version of Online HelpThis document is a PDF version of the online help. This PDF file is provided so you can easily print multiple topics from the help information or read the online help in PDF format. Because this content was originally created to be viewed as online help in a web browser, some topics may not be formatted properly. Some interactive topics may not be present in this PDF version. Those topics can be successfully printed from within the online help.
Administrator's Guide
Micro Focus Logger (7.2) Page 3 of 743
Contents
Chapter 1: Overview 25
Introduction to Logger 25
Logger Events 25
Logger Features 26Storage Configuration 26Receiver Configuration 27Analyzing Events 28Grouping Events 28Exporting Events 29Forwarder Configuration 29User Management 30Other Setup and Maintenance 30
Deployment Scenarios 31Setting up Search Heads for Faster Peer Searches 33Sending IPv6 Data to Logger 33Centralized Management 33Running Logger on Encrypted Appliances 34
Connecting to Logger 34
Navigating the User Interface 36Menus, Take Me To, NavBar, and Bar Gauges 36
NavBar 36Take Me To Navigation Box 37Bar Gauges 38Server Clock, Help and About 38
Changing the Display Theme 39Logger Options and Logout 39
Customizing the Maximum EPS 40Customizing the Logo 40Customizing the Start Page 41Logger User / Roles Report 42System Storage 42
Summary 42Summary Dashboard Panels 44The Effect of Search Group Filters on the Summary Page 45
Chapter 2: Dashboards 46
Page 4 of 743
Out-of-Box Dashboards 46Managing Out-Of-Box Dashboards 48The Monitor Dashboard 49
Monitor Dashboard Summary Panel 50Monitor Dashboard Receivers Panel 51Monitor Dashboard Platform Panel 51Monitor Dashboard Network Panel 52Monitor Dashboard Logger Panel 53Monitor Dashboard Forwarders Panel 54Monitor Dashboard Storage Panel 54
The System Overview Dashboard 55The Intrusion and Configuration Events Dashboard 56The Login and Connection Activity Dashboard 57The Event Count Dashboard 57Malware Overview Dashboard 58The Attacks and Suspicious Activity Dashboard 59Operating System Errors and Warnings Dashboard 60The Vulnerability Overview Dashboard 61The Insecure Services Dashboard 62The DGA Overview Dashboard 63The MITRE Att&ck Overview Dashboard 64The MITRE Att&ck Events Statistics Dashboard 65
Custom Dashboards 66Creating and Managing Custom Dashboards 67
Adding a Custom Dashboard 68Editing a Custom Dashboard 68Deleting a Custom Dashboard 69
Adding and Managing Panels in a Dashboard 69Adding a Panel to a Dashboard 69Editing a Dashboard Panel 71Deleting a Dashboard Panel 72Changing the Layout of a Dashboard 72
Setting a Default Dashboard 73
Chapter 3: Searching and Analyzing Events 74
The Process of Searching Events 74
Understanding Search Field Colors 75
Administrator's Guide
Page 5 of 743
Elements of a Search Query 76Query Expressions 76
Search Operator Portion of a Query 77Indexed Search Portion of a Query 77
Keyword Search (Full-text Search) 77Field-Based Search 79
Field-Based Search Expression Guidelines 80Field Based Search Operators 81
Syntax Reference for Query Expressions 85Constraints 91
Time Range 92Time Stamps in Logger 94Search based on Event Time 95
Fieldsets 95Predefined Fieldsets 96"User-Defined Fields" Fieldset 96"Raw Event" Fieldset 96
Generating Search Results 96Custom Fieldsets 97Classic Search: Custom Fieldsets 98
Search Helper 99Autocomplete Search 99Opening Filters and Saved Searches via Autocomplete 100Search History and Search Operator History 101Examples, Usage, Suggested Next Operators, and Help 101Regex Helper Tool 101Classic Search: Using the Advanced Search Builder 102
Nested Conditions 104Alternate Views for Query Building in Search Builder 104
Search Analyzer 105
Searching for Events 106Running a Search 106Classic Search: Running a Search 109Canceling a Search in Progress 111About Building Search Queries 112Searching for Rare Field Values 113
Using Super-Indexed Fields to Increase Search Speed 113Search Hit Limits 116
Administrator's Guide
Page 6 of 743
Concurrent Searches 116Classic Search: Running Concurrent Searches 118
Search Dashboard 119Searching Peers (Distributed Search) 121
Peer Stats 122Searching for IPv6 Addresses 124
Using the INSUBNET Operator to Search for IPv6 Addresses 126
The Search Results Display 126The Search Results 126Additional Fields in the Search Results 128
User-Defined Fields 128System-Defined Fields 128
Adjusting the Displayed Search Results 129Auto Refresh Search Results 129The Histogram 130
Displaying the Histogram 131Mouse-Over 131Histogram Drill Down 131
Chart Drill Down 131Classic Search: Refining a Search from the Search Results Table 132
Classic Search: Changing the Displayed Search Results Using Field Sets 133Classic Search: Multi-line Data Display 134
The Field Summary Panel 134Displaying the Field Summary Panel 135Selected Fields List 135Field Summary Drill Down 136Discovering Fields in Raw Event Data 137Refining and Charting a Search from Field Summary 138
Saving the Search Results 139Persisting Search Results 139Exporting Search Results 140
Classic Search: Exporting Search Results 143Save a Filter, Saved Search, Dashboard Panel, or Search Results 145
Saving Queries, Creating Saved Searches and Saved Filters. 150
System Filters/Predefined Filters 152Searching with Saved Queries 156
Scheduling Date and Time Options 157
Administrator's Guide
Page 7 of 743
Enriching Logger Data Through Static Correlation 159Indexing 159
Full-Text Indexing (Keyword Indexing) 160Field-Based Indexing 160Superindexing 162
Using Global ID 162
Viewing Alerts 164
Live Event Viewer 165
Chapter 4: Reporting 170
The Reports User Interface 170The Reports Home Page 171
Accessing the Reports Home Page 172
Administrative Prerequisites 172Assigning Access Rights 173
What Access Rights are Necessary? 173Adjusting Timeout Values for Long-Running Reports 173
Using the Right Tool for the Job 174Design Tools: New Reports and Report Objects 175Powerview Designer and Classic Report Designer 176
Finding and Managing Reports 176Reports Explorer 176
Working with Explorer 177Explorer Favorites 179Explorer Options and Context Menus 179
Recent Reports 182Published Reports 182
Working with Published Reports 182Other Reports 184
Filtering the Other Reports List 186Scheduled Reports 186
Working with Scheduled Reports 187Scheduling Report Limitations 188
Private Reports 190
Running Reports 191Report Guidelines 191Run Report Options 192
Administrator's Guide
Page 8 of 743
Run-Time Filters, Criteria, and Parameters 193Additional Filters 193Report Settings 195Selecting Filter Criteria 195Selecting Groups, Devices, and Peers 196
Running a Recent Report 197Running a Report from Explorer 197Running Background Reports 198
Restrict Long Reports to Run in the Background 199Running Distributed Reports 199
Scheduling Reports 200Scheduling a Report with Smart Export option 201
Viewing Reports 202Collaborating on Reports 202The Ad hoc Report Viewer 203
Ad hoc Viewer Menu Options 203Displaying a Table of Contents for a Grouped Report 204Adding a Comment to Ad Hoc Report 205
The Smart Report Viewer 205Smart Viewer Menu Options 206
Report Formats for Viewing 207View Options 208About Report Pagination 211
Exporting and Uploading Reports 212Exporting and Saving a Report 212
Export Options 213Uploading a Report to a Server or FTP Site 214
Shared Folder Upload Options 215FTP Upload Options 215
Publishing Reports 216Publish Report Options 217
Emailing a Report 217Email Delivery Settings 218
Designing Custom Reports 219Create a New Report from an Existing One 219The Smart Report Designer 220
Smart Reports 221
Administrator's Guide
Page 9 of 743
The Powerview Designer 221The Powerview Heading Context Menu 222The Powerview Data Context Menu 223The Powerview Chart Menu 224Creating a Chart for an Ad hoc Report in Powerview 225
Classic: The Ad hoc Report Designer 226Toolbar Buttons 227Creating a New Classic Report 227Working with Logger Report Designers 228Creating an IPv6 Report 229
Searching for IPv6 Addresses in Reports 229Customizing Report Elements 230
Data Source 231Fields 232Filter 233Group 235Totals 236Sort 237Highlight 237Matrix 238Chart 239
Assigning Fields 240Annotating Report Charts 241
Map 242Advanced 245
Building Dashboards 246Dashboard Prerequisites 247What Items Can a Dashboard Include? 247Creating a New Smart Dashboard 248Dashboard Migration Tool 249
Designing Queries, Parameters, and Templates 249Queries 249
How Search and Report Queries Differ 250Overview of Query Design Elements 250Working with Queries 251
Creating a Copy of an Existing Query 251Creating an IPv6 Search Query for Reports 252Modifying a Query Object 253
Administrator's Guide
Page 10 of 743
Deleting a Query Object 253Creating Reports from Filters and Saved Searches. 253
Create a New Query from Smart Designer 255Designing a New Query 256Working with Steps 256The Query Design Process 257Steps 259
Data Source Step 260Join Step 262Union Step 262Filter Step 263Sort Step 263Formula Fields Step 263Dynamic Fields Step 264External Task Step 265Format Step 265Geolocation Lookup 266
Query Object Advanced Properties 268Defining Queries on the Designer 269
SQL Designer 269List of Database Objects 270Design Tab 270Select 271Where 271Group By 271Having 271Order By 272Edit Tab 272Relationship of Edit and Design Tabs 272Result Tab 273To access the Logger Search Reports Designer 273
Data Science Engine Step at Query Object Level 274Predictive Analysis 276What if Analysis 276
Parameters 277Parameter Properties 277Parameter Object Editor 278Creating New Parameters 279
Setting Parameter Name, Data Type, and Default Values 279
Administrator's Guide
Page 11 of 743
Default Value for Date Type Parameter 280Defining Input Type 281
Setting Multiple Default Values 281Setting up Boolean Parameters 282Setting Various Run Time Behaviors 282Setting the Data Source List 283Setting Multiple Default Values 283
Modifying a Parameter 284Deleting a Parameter 284
Parameter Value Groups 285Configuring Parameter Value Groups 285
Template Styles 287Working with Logger Report Templates 287Defining a New Template 288
Reports Administration 288Creating a Reports User Group 289Managing Reports of Deleted Users 289Report Server Configuration 290
Report Configuration 290Investigate Connection 292
Step 1: Configure SSL Vertica 292Step: 2 Import the certificates 292Step 3: Add/ Modify the Vertica DB connection 293
Report Categories 294System-defined Categories 294Placing a System-defined Query or Parameter into a Category 298Adding a New Category 299Deleting a Category 300
Job Execution Status 300Chart 301List of Jobs 301The Filters area 302Filtering the list 303
Backup and Restore Report Content 303iPackager Utility 303
How iPackager Works 303iPackager Actions 304
Selecting Entities 304Opening a Configuration File 305
Administrator's Guide
Page 12 of 743
Selecting Entity Objects 305Adding Entity Objects to a Configuration File 305
Report Category Filters 306Deleting Entity Objects from a Configuration File 307Modifying Entity Object Properties 307
Category Properties 307Report Properties 308Query Properties 309Parameter Properties 310Template Properties 310
Building the CAB File 311Deploying a Report Bundle 311Deleting an iPackager Configuration File 313
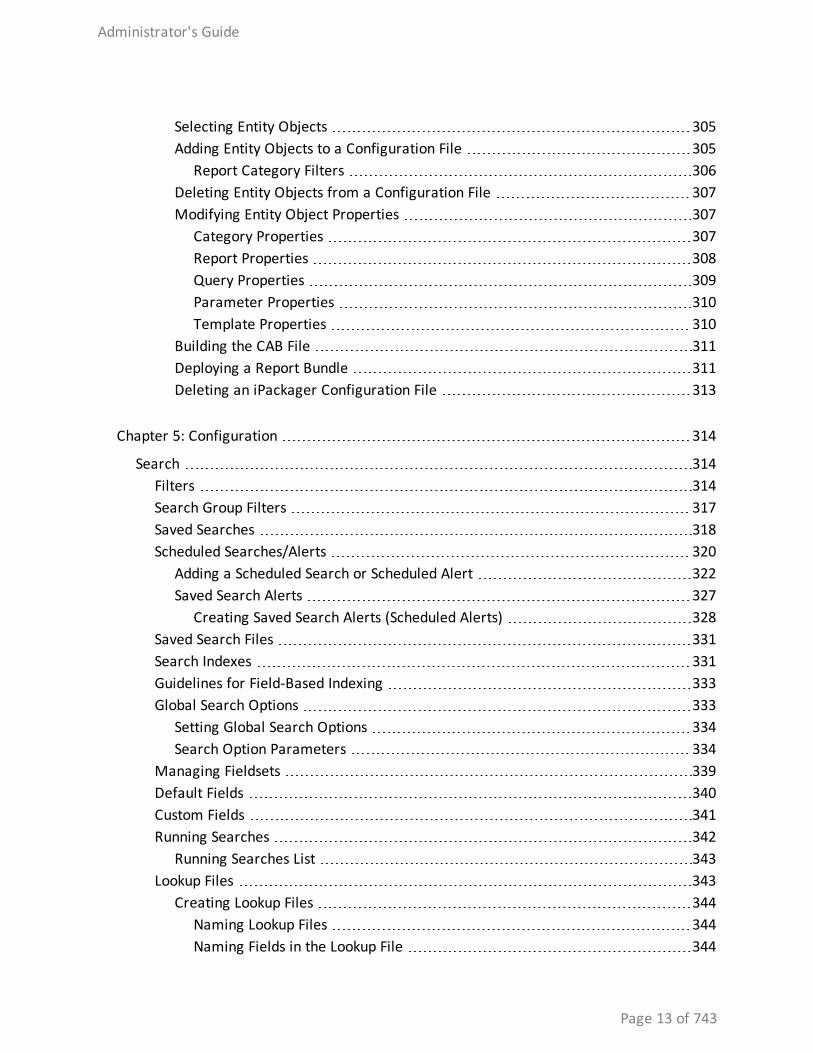
Chapter 5: Configuration 314
Search 314Filters 314Search Group Filters 317Saved Searches 318Scheduled Searches/Alerts 320
Adding a Scheduled Search or Scheduled Alert 322Saved Search Alerts 327
Creating Saved Search Alerts (Scheduled Alerts) 328Saved Search Files 331Search Indexes 331Guidelines for Field-Based Indexing 333Global Search Options 333
Setting Global Search Options 334Search Option Parameters 334
Managing Fieldsets 339Default Fields 340Custom Fields 341Running Searches 342
Running Searches List 343Lookup Files 343
Creating Lookup Files 344Naming Lookup Files 344Naming Fields in the Lookup File 344
Administrator's Guide
Page 13 of 743
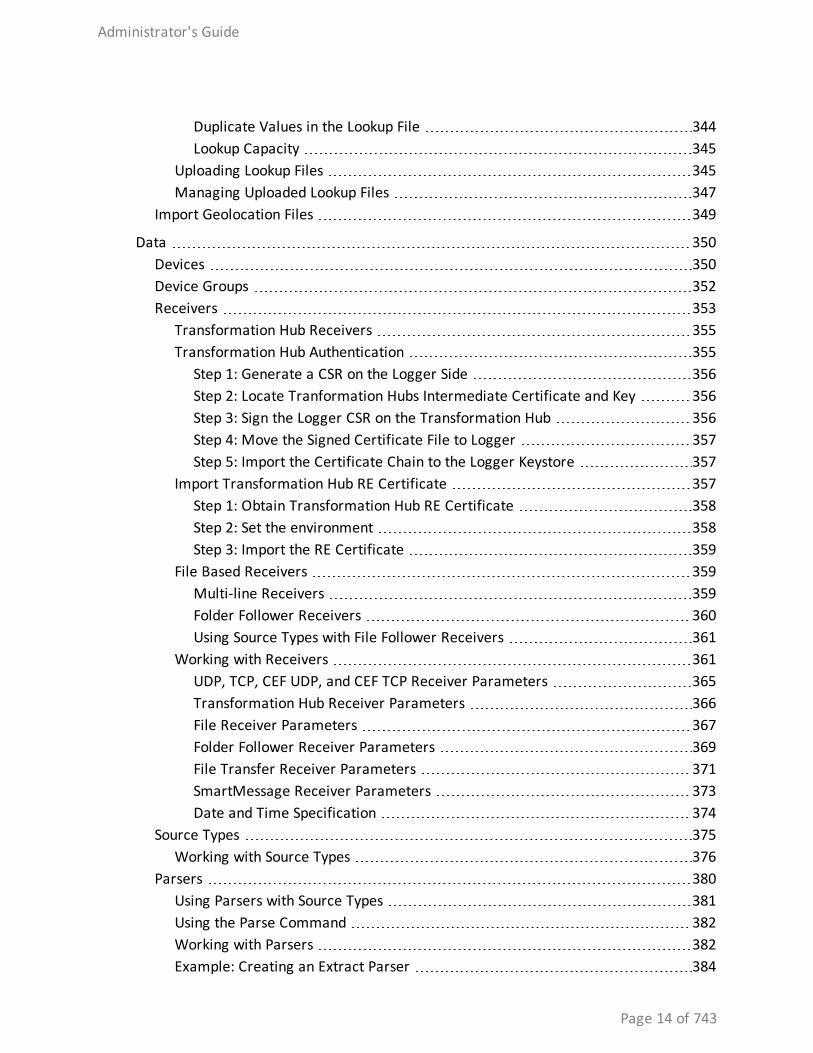
Duplicate Values in the Lookup File 344Lookup Capacity 345
Uploading Lookup Files 345Managing Uploaded Lookup Files 347
Import Geolocation Files 349
Data 350Devices 350Device Groups 352Receivers 353
Transformation Hub Receivers 355Transformation Hub Authentication 355
Step 1: Generate a CSR on the Logger Side 356Step 2: Locate Tranformation Hubs Intermediate Certificate and Key 356Step 3: Sign the Logger CSR on the Transformation Hub 356Step 4: Move the Signed Certificate File to Logger 357Step 5: Import the Certificate Chain to the Logger Keystore 357
Import Transformation Hub RE Certificate 357Step 1: Obtain Transformation Hub RE Certificate 358Step 2: Set the environment 358Step 3: Import the RE Certificate 359
File Based Receivers 359Multi-line Receivers 359Folder Follower Receivers 360Using Source Types with File Follower Receivers 361
Working with Receivers 361UDP, TCP, CEF UDP, and CEF TCP Receiver Parameters 365Transformation Hub Receiver Parameters 366File Receiver Parameters 367Folder Follower Receiver Parameters 369File Transfer Receiver Parameters 371SmartMessage Receiver Parameters 373Date and Time Specification 374
Source Types 375Working with Source Types 376
Parsers 380Using Parsers with Source Types 381Using the Parse Command 382Working with Parsers 382Example: Creating an Extract Parser 384
Administrator's Guide
Page 14 of 743
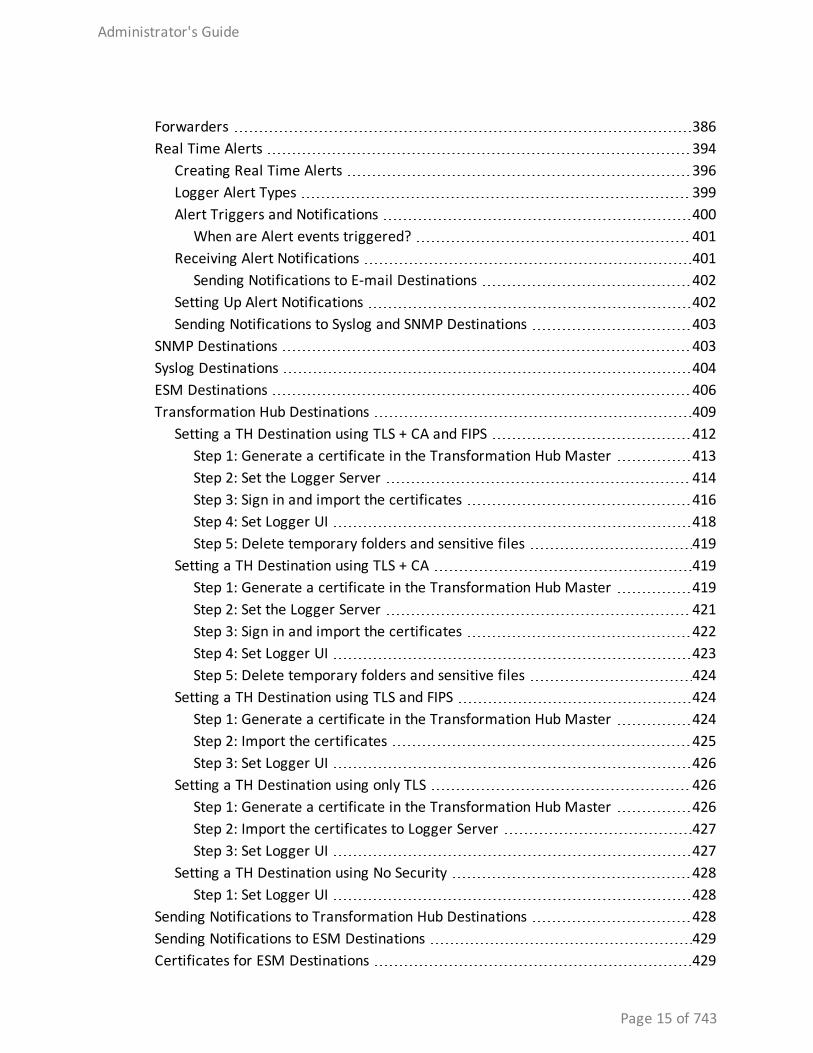
Forwarders 386Real Time Alerts 394
Creating Real Time Alerts 396Logger Alert Types 399Alert Triggers and Notifications 400
When are Alert events triggered? 401Receiving Alert Notifications 401
Sending Notifications to E-mail Destinations 402Setting Up Alert Notifications 402Sending Notifications to Syslog and SNMP Destinations 403
SNMP Destinations 403Syslog Destinations 404ESM Destinations 406Transformation Hub Destinations 409
Setting a TH Destination using TLS + CA and FIPS 412Step 1: Generate a certificate in the Transformation Hub Master 413Step 2: Set the Logger Server 414Step 3: Sign in and import the certificates 416Step 4: Set Logger UI 418Step 5: Delete temporary folders and sensitive files 419
Setting a TH Destination using TLS + CA 419Step 1: Generate a certificate in the Transformation Hub Master 419Step 2: Set the Logger Server 421Step 3: Sign in and import the certificates 422Step 4: Set Logger UI 423Step 5: Delete temporary folders and sensitive files 424
Setting a TH Destination using TLS and FIPS 424Step 1: Generate a certificate in the Transformation Hub Master 424Step 2: Import the certificates 425Step 3: Set Logger UI 426
Setting a TH Destination using only TLS 426Step 1: Generate a certificate in the Transformation Hub Master 426Step 2: Import the certificates to Logger Server 427Step 3: Set Logger UI 427
Setting a TH Destination using No Security 428Step 1: Set Logger UI 428
Sending Notifications to Transformation Hub Destinations 428Sending Notifications to ESM Destinations 429Certificates for ESM Destinations 429
Administrator's Guide
Page 15 of 743
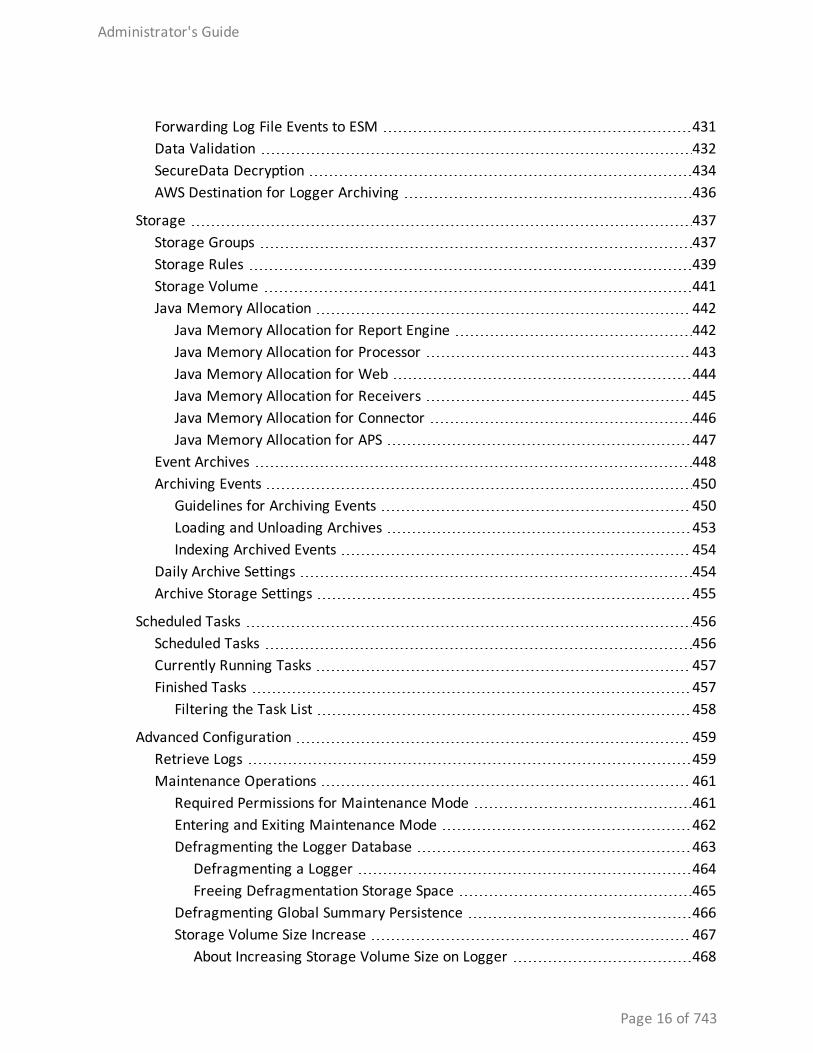
Forwarding Log File Events to ESM 431Data Validation 432SecureData Decryption 434AWS Destination for Logger Archiving 436
Storage 437Storage Groups 437Storage Rules 439Storage Volume 441Java Memory Allocation 442
Java Memory Allocation for Report Engine 442Java Memory Allocation for Processor 443Java Memory Allocation for Web 444Java Memory Allocation for Receivers 445Java Memory Allocation for Connector 446Java Memory Allocation for APS 447
Event Archives 448Archiving Events 450
Guidelines for Archiving Events 450Loading and Unloading Archives 453Indexing Archived Events 454
Daily Archive Settings 454Archive Storage Settings 455
Scheduled Tasks 456Scheduled Tasks 456Currently Running Tasks 457Finished Tasks 457
Filtering the Task List 458
Advanced Configuration 459Retrieve Logs 459Maintenance Operations 461
Required Permissions for Maintenance Mode 461Entering and Exiting Maintenance Mode 462Defragmenting the Logger Database 463
Defragmenting a Logger 464Freeing Defragmentation Storage Space 465
Defragmenting Global Summary Persistence 466Storage Volume Size Increase 467
About Increasing Storage Volume Size on Logger 468
Administrator's Guide
Page 16 of 743
Adding Storage Groups 469Changing MySQL Password 470Adding Fields to the Schema 471
Importing Schema Fields from Peers 473Maintenance Results 477Configuration Backup and Restore 477
Running a Configuration Backup 479Scheduling Reoccurring Backups 481
Running a Configuration Backup with SSH Key 481Step 1: Create a valid SSH-key 481Step 2: Configure the backup -SCP Transfer 481
Restoring from a Configuration Backup 482Content Management 483
User Rights for Importing Content 484Importing Content 484User Rights for Exporting Content 485Exporting Content 486
How does EPS license differ from GB per day license? 487Standalone License Information 488
Logger Standalone EPS License 488Logger Standalone GB per day License 490
Managed by ArcMC License Information 491GB managed by ArcMC License Usage 491EPS managed by ArcMC License Usage 491
Trial Licenses 492Logger Software Installations and Licenses 493Peer Nodes 493
Overview Steps for Configuring Peers 493Guidelines for Configuring Peers 494Authenticating Peers 496
Selecting a Peer Authentication Method 496Authorizing a Peer 497
Adding and Deleting Peer Relationships 497Adding a Peer 497Deleting a Peer 500
Chapter 6: System Admin 501
System 501
Administrator's Guide
Page 17 of 743
System Locale 501System Reboot 501Network 502
System DNS 502Hosts 503NICs 503
NIC Bonding and Trunking 505Static Routes 507Time/NTP 508
Impact of Daylight Savings Time Change on Logger Operations 509SMTP 510Roles 511License & Update 515
Updating Your Logger License 515Upgrading a Logger Appliance 516Standalone Logger with a License Managed by ArcMC 516
Process Status 518System Settings 518SNMP 519
SNMP Metrics Supported 519Configuration on the Logger Appliance 520Configuration on the NMS 522
SSH Access to the Appliance 522Supporting Jumbo Frames 524
Logs 524Audit Logs 524Audit Forwarding 525
Storage 525Remote File Systems 526
Managing a Remote File System 526Creating Multiple Paths to a LUN 529Managing a LUN 530RAID Controller 532
Security 533SSL Server Certificate 533
Generating a Self-Signed Certificate 534Generating a Certificate Signing Request (CSR) 535Importing a Certificate 537
Administrator's Guide
Page 18 of 743
Enabling HTTP Strict Transport Security 537SSL Client Authentication 538
Configuring Logger to Support SSL Client Authentication 539Uploading Trusted Certificates 540Uploading a Certificate Revocation List 540
FIPS 140-2 541FIPS Compliance 541Enabling and Disabling FIPS Mode on Logger 542Installing or Updating a SmartConnector to be FIPS-Compliant 543
Users/Groups 545Authentication 545
Sessions 545Local Password 546Users Exempted From Password Expiration 548Enabling Forgot Password 549External Authentication 551
Local Password Authentication 552Client Certificate Authentication 552Client Certificate and Local Password Authentication 553
RADIUS Authentication 554LDAP/AD and LDAPS Authentication 555Local Password Fallback 557
Login Banner 557User Management 558
Creating and Activating Users 558Adding a User 558Editing and Deleting Users 560Activating Users 560
Setting Logger User Permissions 561Reset a User's Password 561User Groups 562Managing User Groups 563
Creating a New User Group 563Editing and Deleting User Groups 564
Change My Password 564
Other System Administration Information 565Monitoring System Health 565System Health Events 566
Administrator's Guide
Page 19 of 743
Using the Appliance Command Line Interface 568Software Logger Command Line Options 571Firewall Rules 573Configuring the Firewall on Logger Appliance 573
Appendix A: Search Operators 575
CEF (Deprecated) 575
chart 576
dedup 580
eval 581
extract 587
fields 589
head 590
keys 590
lookup 592
parse 596
rare 597
regex 598
rename 599
replace 600
rex 602
sort 604
tail 605
top 606
transaction 607
where 609
Appendix B: Reporting Cheatsheet 611
Appendix C: Using SmartConnectors to Collect Events 614
SmartMessage 614
Configuring a SmartConnector to Send Events to Logger 614
Administrator's Guide
Page 20 of 743
Configuring SmartConnectors to Send Events to Both Logger and an ArcSight Manager 615
Configuring SmartConnectors for Failover Destinations 616
Sending Events from ArcSight ESM to Logger 616
Appendix D: Using the Rex Operator 618
Syntax of the rex Operator 618
Understanding the rex Operator Syntax 618
Ways to Create a rex Expression 619
Creating a rex Expression Manually 620
Example rex Expressions 621
Appendix E: Logger Audit Events 625
Types of Audit Events 625
Information in an Audit Event 625
Platform Events 626
Application Events 636
Appendix F: System Health Events 662
Appendix G: Event Field Name Mappings 668
Appendix H: Logger Content 676
Reports 676Device Monitoring 676
Anti-Virus 677CrossDevice 677Database 681Firewall 681IDS-IPS 682Identity Management 683Network 684Operating System 684VPN 685DNS 686
Administrator's Guide
Page 21 of 743
Foundation 687Configuration Monitoring 687MITRE Monitoring 689Intrusion Monitoring 690
Attackers 693Resource Access 696Targets 697User Tracking 699
NetFlow Monitoring 699Network Monitoring 700Vulnerabilities 701
Logger Administration 703SANS Top 5 703
1 - Attempts to Gain Access through Existing Accounts 7032 - Failed File or Resource Access Attempts 7043 - Unauthorized Changes to Users Groups and Services 7054 - Systems Most Vulnerable to Attack 7065 - Suspicious or Unauthorized Network Traffic Patterns 707
OWASP 709A1 - Injections 709A2- Broken Authentication 710A3- Sensitive Data Exposure 710A4- XML External Entities 710A5- Broken Access Control 711A6- Security Misconfiguration 711A7- Cross-Site Scripting 711A8- Insecure Deserialization 711A9 - Using Components with Known Vulnerabilities 712A10 - Insufficient Logging AND Monitoring 712
Cloud 713CSA 713
Treacherous 12 713Abuse and Nefarious Use of Cloud Services 713Account Hijacking 714Advanced Persistent Threats 715Data Breaches 715Data Loss 715Denial of Service 716Insecure Interfaces and APIs 716
Administrator's Guide
Page 22 of 743
Insufficient Due Diligence 716Insufficient Identity Credential and Access Management 717Malicious Insiders 717System Vulnerabilities 717Vulnerabilities in Shared Technologies 718
Parameters 718IPAddress 718categoryObjectParameter 719commonlyBlockedPorts 719destinationAddress 719destinationPort 720deviceGroupParameter 720deviceProduct 720deviceSeverityParameter 720deviceVendor 721dmBandwidthParameter 721dmConfigurationParameter 721dmLoginParameter 721eventNameParameter 722resourceTypeParameter 722webPorts 722zoneParameter 723zones 723userName Parameter 723hostName Parameter 724
System Filters 724
Appendix I: Restoring Factory Settings 731
Before Restoring Your System 731
Restoring LX600 or LX700 Appliance Models 731
Appendix J: Logger Search From ArcSight ESM 734
Understanding the Integrated Search Functionality 734
Setup and Configuration 735Configuring on ESM 735Configuring on Logger 736
Supported Search Options 736
Administrator's Guide
Page 23 of 743
Guidelines 736
Searching on Logger From ArcSight Console 737
Appendix K: Searching Logger's Event Data from Recon 739
Prerequisites 739
Install VSQL Client Driver 740
Migrate Logger data to Recon 741
Delete Logger Data in Recon 742
Send Documentation Feedback 743
Administrator's Guide
Page 24 of 743
Chapter 1: OverviewThis document provides information about the administration, configuration and use of ArcSight Logger 7.2. It includes information on storage, receiver, and forwarder configuration; working with events; user management; and setup and maintenance considerations.
Introduction to LoggerLogger is a log management solution that is optimized for extremely high event throughput, efficient long-term storage, and rapid data analysis. Logger receives and stores events; supports search, retrieval, and reporting; and can optionally forward selected events. Logger compresses raw data, but can always retrieve unmodified data on demand for forensics-quality litigation data.
Logger is available in appliance and software form factors. The appliance-based solution is a hardened, dedicated, enterprise-class system. The software-based solution is similar in feature and functionality to the appliance-based solution, however, the software solution enables you to install ArcSight Logger on a supported platform of your choice. The software version is available as a VMware virtual machine, as well as on Amazon Web Service (AWS), and Microsoft Azure cloud computing platforms.
You can have a single Logger or as many as you need. Multiple Loggers can work together to scale up to support extremely high event volume with search queries distributed across all Loggers. Logger can be managed by ArcSight Management Center and that includes license and configuration management.
Note: Where there are no specific differences, all types of Logger are called Logger in this document. Where there are differences, the specific type of Logger is indicated.
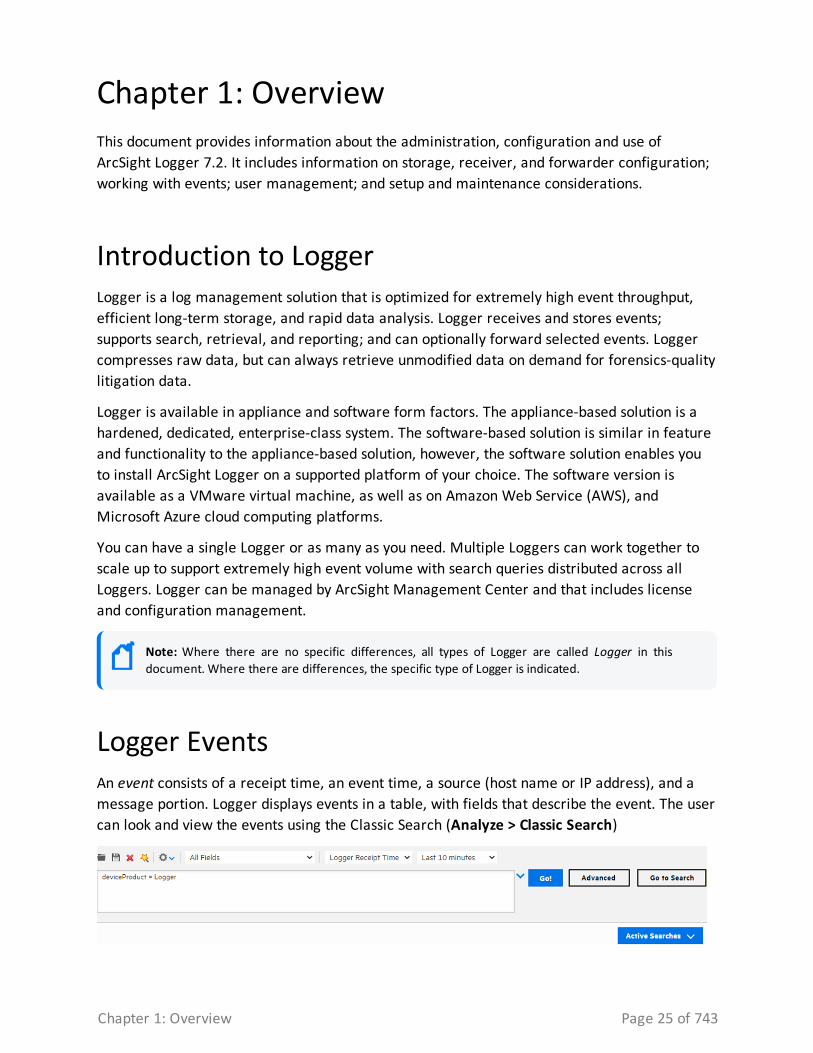
Logger EventsAn event consists of a receipt time, an event time, a source (host name or IP address), and a message portion. Logger displays events in a table, with fields that describe the event. The user can look and view the events using the Classic Search (Analyze > Classic Search)
Chapter 1: Overview Page 25 of 743
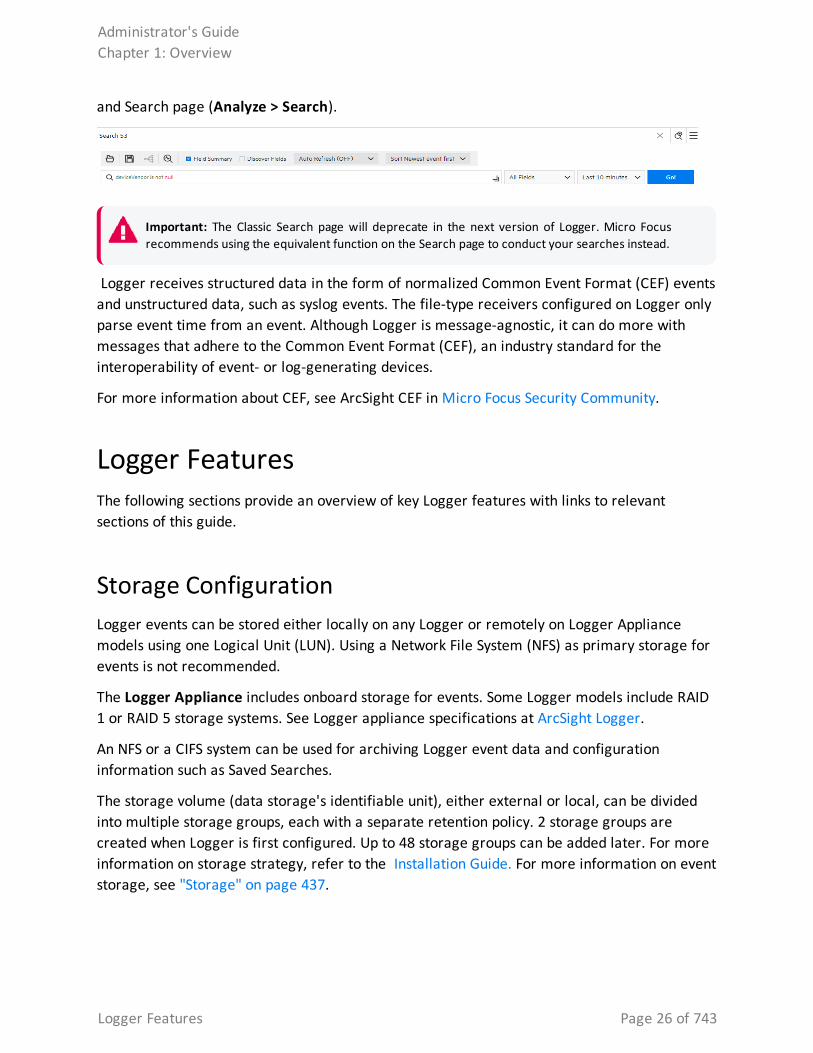
and Search page (Analyze > Search).
Important: The Classic Search page will deprecate in the next version of Logger. Micro Focus recommends using the equivalent function on the Search page to conduct your searches instead.
Logger receives structured data in the form of normalized Common Event Format (CEF) events and unstructured data, such as syslog events. The file-type receivers configured on Logger only parse event time from an event. Although Logger is message-agnostic, it can do more with messages that adhere to the Common Event Format (CEF), an industry standard for the interoperability of event- or log-generating devices.
For more information about CEF, see ArcSight CEF in Micro Focus Security Community.
Logger FeaturesThe following sections provide an overview of key Logger features with links to relevant sections of this guide.
Storage ConfigurationLogger events can be stored either locally on any Logger or remotely on Logger Appliance models using one Logical Unit (LUN). Using a Network File System (NFS) as primary storage for events is not recommended.
The Logger Appliance includes onboard storage for events. Some Logger models include RAID 1 or RAID 5 storage systems. See Logger appliance specifications at ArcSight Logger.
An NFS or a CIFS system can be used for archiving Logger event data and configuration information such as Saved Searches.
The storage volume (data storage's identifiable unit), either external or local, can be divided into multiple storage groups, each with a separate retention policy. 2 storage groups are created when Logger is first configured. Up to 48 storage groups can be added later. For more information on storage strategy, refer to the Installation Guide. For more information on event storage, see "Storage" on page 437.
Administrator's GuideChapter 1: Overview
Logger Features Page 26 of 743
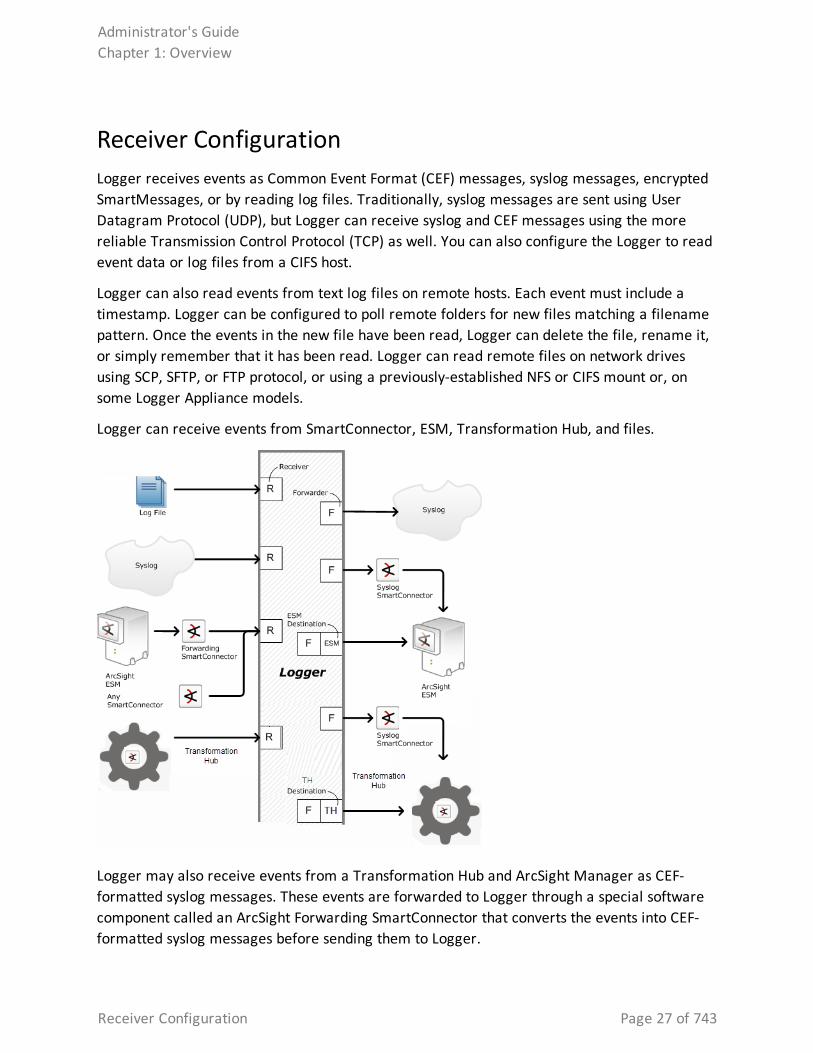
Receiver ConfigurationLogger receives events as Common Event Format (CEF) messages, syslog messages, encrypted SmartMessages, or by reading log files. Traditionally, syslog messages are sent using User Datagram Protocol (UDP), but Logger can receive syslog and CEF messages using the more reliable Transmission Control Protocol (TCP) as well. You can also configure the Logger to read event data or log files from a CIFS host.
Logger can also read events from text log files on remote hosts. Each event must include a timestamp. Logger can be configured to poll remote folders for new files matching a filename pattern. Once the events in the new file have been read, Logger can delete the file, rename it, or simply remember that it has been read. Logger can read remote files on network drives using SCP, SFTP, or FTP protocol, or using a previously-established NFS or CIFS mount or, on some Logger Appliance models.
Logger can receive events from SmartConnector, ESM, Transformation Hub, and files.
Logger may also receive events from a Transformation Hub and ArcSight Manager as CEF-formatted syslog messages. These events are forwarded to Logger through a special software component called an ArcSight Forwarding SmartConnector that converts the events into CEF-formatted syslog messages before sending them to Logger.
Administrator's GuideChapter 1: Overview
Receiver Configuration Page 27 of 743
l For more information on setting up receivers, see "Receivers" on page 353.
l For more information on setting up SmartConnectors, refer to the Logger Installation Guide.
l For more information on collecting events from ArcSight ESM, refer to the Logger Installation Guide.
Analyzing EventsEvents can be searched, retrieving a table of events that match a particular query. Queries can be entered manually or automatically (by clicking on terms in the event table). Queries can be based on plain English keywords (full-text search), predefined fields, or specified as regular expressions. Logger supports a flow-based search language that allows you to specify multiple search commands in a pipeline format.
By default, a Logger queries only the primary data store even if peer Loggers are configured. However, you can configure it to distribute a query across peer Loggers of your choice.
Queries can be saved as a filter or as a saved search. Saved filters can be used to select events for forwarding or to filter for the same things later. A Saved Search is used to export selected events or to save results to a file, typically as a scheduled task.
The following topics provide more information about analyzing events:
l "Searching for Events" on page 106
l "Saving Queries, Creating Saved Searches and Saved Filters." on page 150
l "Filters" on page 314
l "Saved Searches" on page 318
l "Parsers" on page 380
Grouping EventsThe combination of a source IP address and a Logger receiver is called a device. As events are received, devices are automatically created for each IP/receiver pair. Devices can also be created manually.
Devices can be categorized by membership in one or more device groups. While an incoming event belongs to one and only one device, it can be associated with more than one device group.
Storage rules associate a device group with a storage group. Storage rules are ordered by priority, and the first matching rule determines to which storage group an incoming event will be sent.
Administrator's GuideChapter 1: Overview
Analyzing Events Page 28 of 743
Device groups, devices, storage groups, and peer Loggers can each be used to filter events using Search Constraints, which can be specified interactively on the Analyze page as well as when creating filters or Saved Searches.
The following topics provide more information about grouping events:
l "Event Archives" on page 448
l "Storage Rules" on page 439
l "Searching Peers (Distributed Search)" on page 121
Exporting EventsA Logger Appliance can export events to various sources. Events that match the current query can be exported locally, to an NFS mount, a CIFS mount, as a file .
Events from a Software Logger can be exported locally to the Logger (to the <install_dir>/data/logger directory) or to the browser from which you connect to the Logger. The <install_dir>/data/logger directory can be mounted to an NFS or CIFS.
Events can be exported in Comma-Separated Values (CSV) format for easy processing by external applications or as a PDF file for generating a quick report. A PDF report includes a table of search results and charts (if generated). Both raw (unstructured data) and CEF events (structured data) can be included in the PDF exported report.
Events in Common Event Format (CEF) have more columns defined, making the data more useful, but non-CEF events can be exported as well, if desired. The user can control which fields are exported.
Exports can be scheduled to run regularly by creating a Saved Search Job. First, a Saved Search is created, either manually or by saving a query on the Analyze page. A Saved Search can be based on an existing filter. A Saved Search Job combines one or more Saved Searches and a schedule with export options.
The following topics provide more information about exporting events:
l "Exporting Search Results" on page 140
l "Time/NTP" on page 508
l " Scheduled Searches/Alerts" on page 320
Forwarder ConfigurationLogger can send events (as they are received or stored events) to other hosts using UDP or TCP, to a Logger, SmartConnector, Transformation Hub or to an ESM. The events sent to a particular
Administrator's GuideChapter 1: Overview
Exporting Events Page 29 of 743
host can be filtered by a query. Outgoing syslog messages can be configured to either pass the original source IP and timestamp or to use Logger's “send time” and IP address.
Logger can send CEF events directly to an ArcSight Manager using its built-in SmartConnector. Logger can act as a funnel, receiving events at very high volumes and sending fewer, filtered events on to an ArcSight Manager, as depicted under "Logger can act as a funnel, forwarding selected events to ESM" on the next page.
The following topics provide more information about forwarding events:
l "Forwarders" on page 386
l "ESM Destinations" on page 406
l "Transformation Hub Destinations" on page 409
User ManagementUser accounts can be created by the Logger administrator for different users of the system. User accounts inherit privileges from the User Group to which they belong. User Groups can have an enforced event filter called Search Group filters applied to them. This will limit the events that a specific user can see.
The following topics provide more information about user management:
l "Users/Groups" on page 545
l "Change My Password" on page 564
l "Search Group Filters" on page 317
Other Setup and MaintenanceLogger configuration settings, such as receivers, filters, saved search jobs, and so on—everything except events—can be backed up as a configuration backup file to any disk and later restored.
Logs detailing Logger activity can be downloaded through the browser on demand, for debugging or other reasons. Other system information is available for viewing. Some system settings can be modified and will require a system reboot or restart for the changes to take effect.
The Logger Appliance can be rebooted using controls in the user interface. For Software Logger, the Logger service and related processes can be restarted. Follow instructions in "Software Logger Command Line Options" on page 571 to start, stop, or restart Software Logger.
The following topics provide more information about setup and maintenance:
Administrator's GuideChapter 1: Overview
User Management Page 30 of 743
l "Configuration Backup and Restore" on page 477
l "Retrieve Logs" on page 459
l "Storage" on page 525
l "System" on page 501
l "License & Update" on page 515
l "Network" on page 502
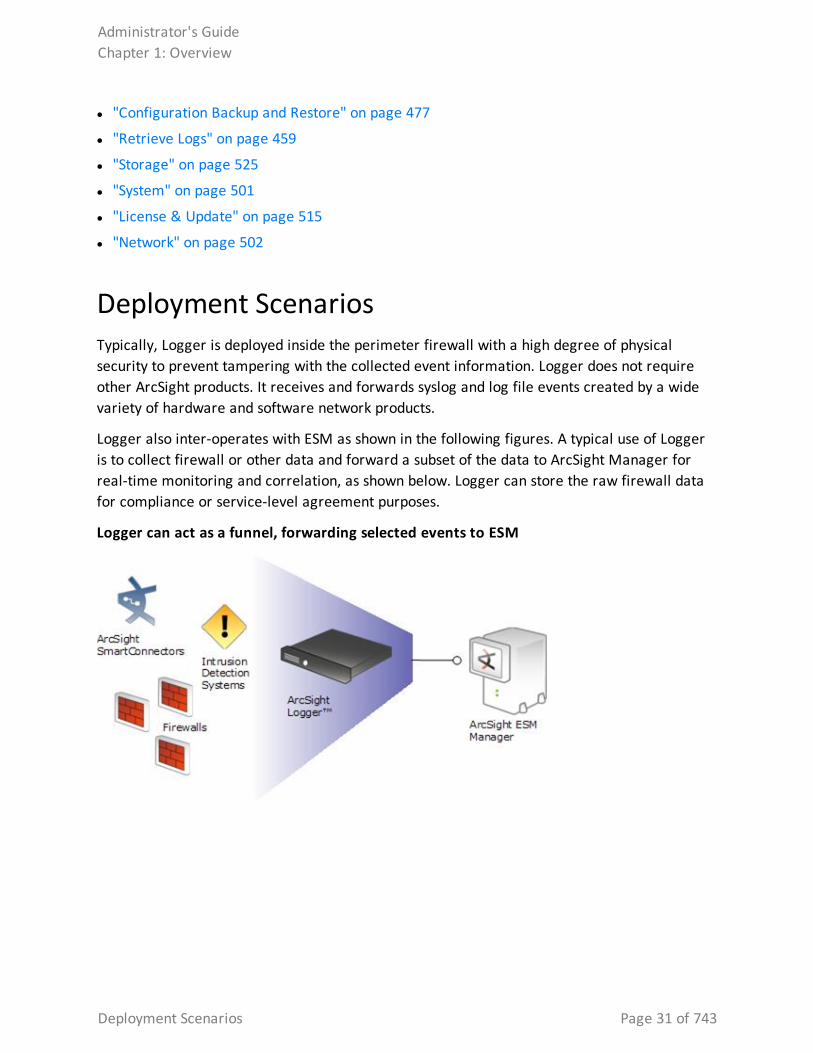
Deployment ScenariosTypically, Logger is deployed inside the perimeter firewall with a high degree of physical security to prevent tampering with the collected event information. Logger does not require other ArcSight products. It receives and forwards syslog and log file events created by a wide variety of hardware and software network products.
Logger also inter-operates with ESM as shown in the following figures. A typical use of Logger is to collect firewall or other data and forward a subset of the data to ArcSight Manager for real-time monitoring and correlation, as shown below. Logger can store the raw firewall data for compliance or service-level agreement purposes.
Logger can act as a funnel, forwarding selected events to ESM
Administrator's GuideChapter 1: Overview
Deployment Scenarios Page 31 of 743
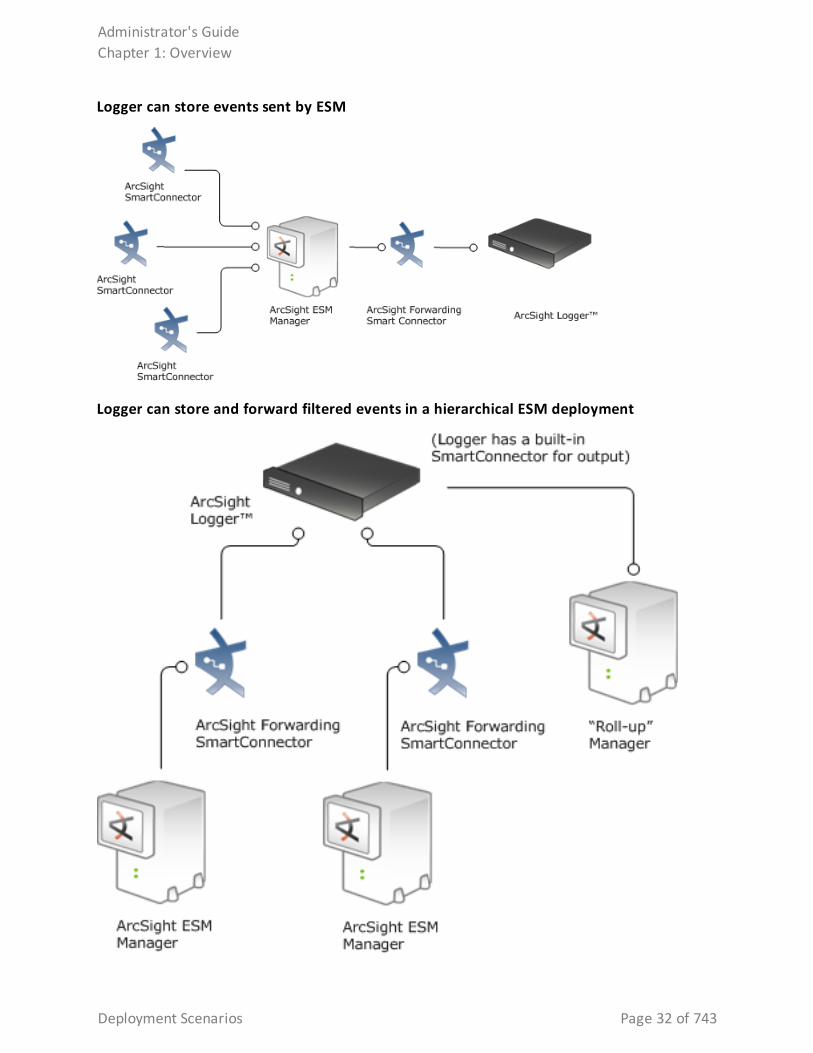
Logger can store events sent by ESM
Logger can store and forward filtered events in a hierarchical ESM deployment
Administrator's GuideChapter 1: Overview
Deployment Scenarios Page 32 of 743
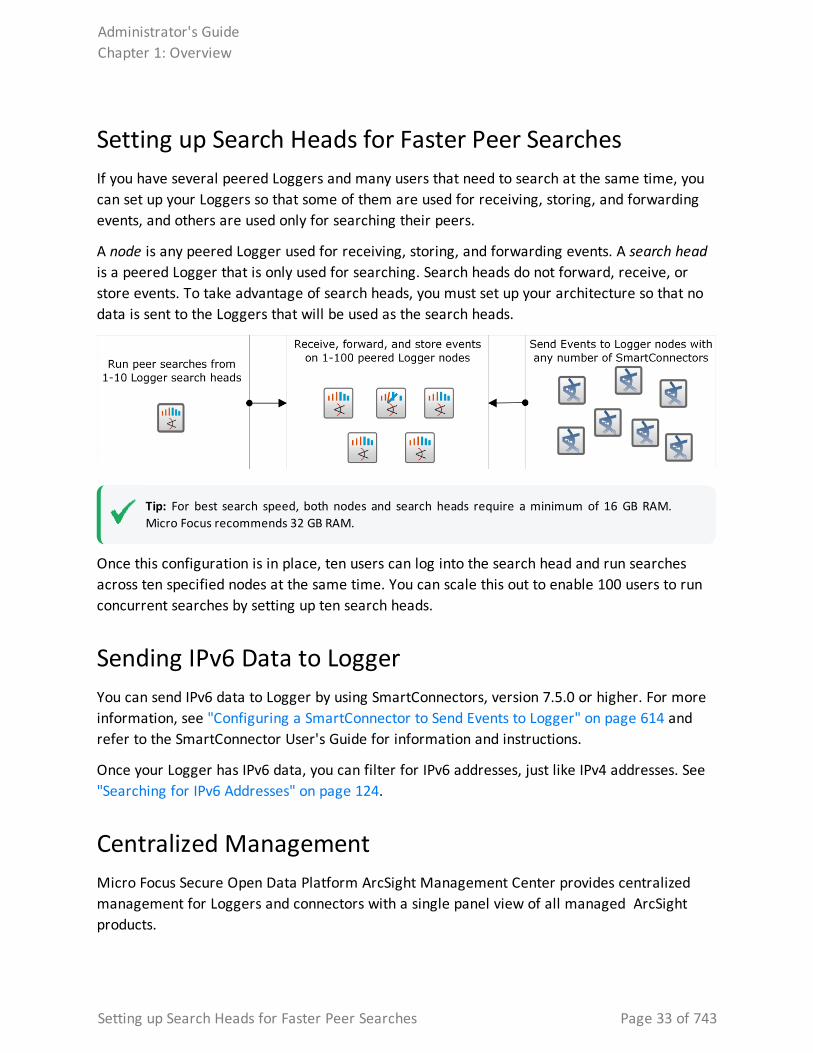
Setting up Search Heads for Faster Peer SearchesIf you have several peered Loggers and many users that need to search at the same time, you can set up your Loggers so that some of them are used for receiving, storing, and forwarding events, and others are used only for searching their peers.
A node is any peered Logger used for receiving, storing, and forwarding events. A search head is a peered Logger that is only used for searching. Search heads do not forward, receive, or store events. To take advantage of search heads, you must set up your architecture so that no data is sent to the Loggers that will be used as the search heads.
Tip: For best search speed, both nodes and search heads require a minimum of 16 GB RAM. Micro Focus recommends 32 GB RAM.
Once this configuration is in place, ten users can log into the search head and run searches across ten specified nodes at the same time. You can scale this out to enable 100 users to run concurrent searches by setting up ten search heads.
Sending IPv6 Data to LoggerYou can send IPv6 data to Logger by using SmartConnectors, version 7.5.0 or higher. For more information, see "Configuring a SmartConnector to Send Events to Logger" on page 614 and refer to the SmartConnector User's Guide for information and instructions.
Once your Logger has IPv6 data, you can filter for IPv6 addresses, just like IPv4 addresses. See "Searching for IPv6 Addresses" on page 124.
Centralized ManagementMicro Focus Secure Open Data Platform ArcSight Management Center provides centralized management for Loggers and connectors with a single panel view of all managed ArcSight products.
Administrator's GuideChapter 1: Overview
Setting up Search Heads for Faster Peer Searches Page 33 of 743
Using ArcSight Management Center, you can create or import configurations for managed products, and then rapidly push them to products of the same type across your network, ensuring consistent configuration for managed products with one action. You can perform a variety of remote management tasks, singly and in bulk, on Loggers, and connectors. Logger tasks you can perform using ArcSight Management Center include initial configuration, peer configuration, and user management.
For more information, consult your sales representative or refer to the ArcSight Management Center Administrator's Guide.
Running Logger on Encrypted AppliancesLogger can run on encrypted hardware to help you to meet compliance regulations and privacy challenges by securing your sensitive data at rest.
You can encrypt your Logger Appliance by using Micro Focus Secure Encryption, available from the Server Management Software > Micro Focus Secure Encryption web page. For instructions, refer to the Micro Focus Secure Encryption Installation and User Guide, available in PDF and CHM formats through the Technical Support / Manuals link on that page.
Logger Appliances come pre- installed with everything necessary to use the Micro Focus Secure Encryption. The encryption time will vary depending on the amount of data on the server. You can continue using Logger during the encryption process. After the encryption, you can perceive some performance degradation.
Caution: After encryption, you cannot restore your Logger to its previously unencrypted state.
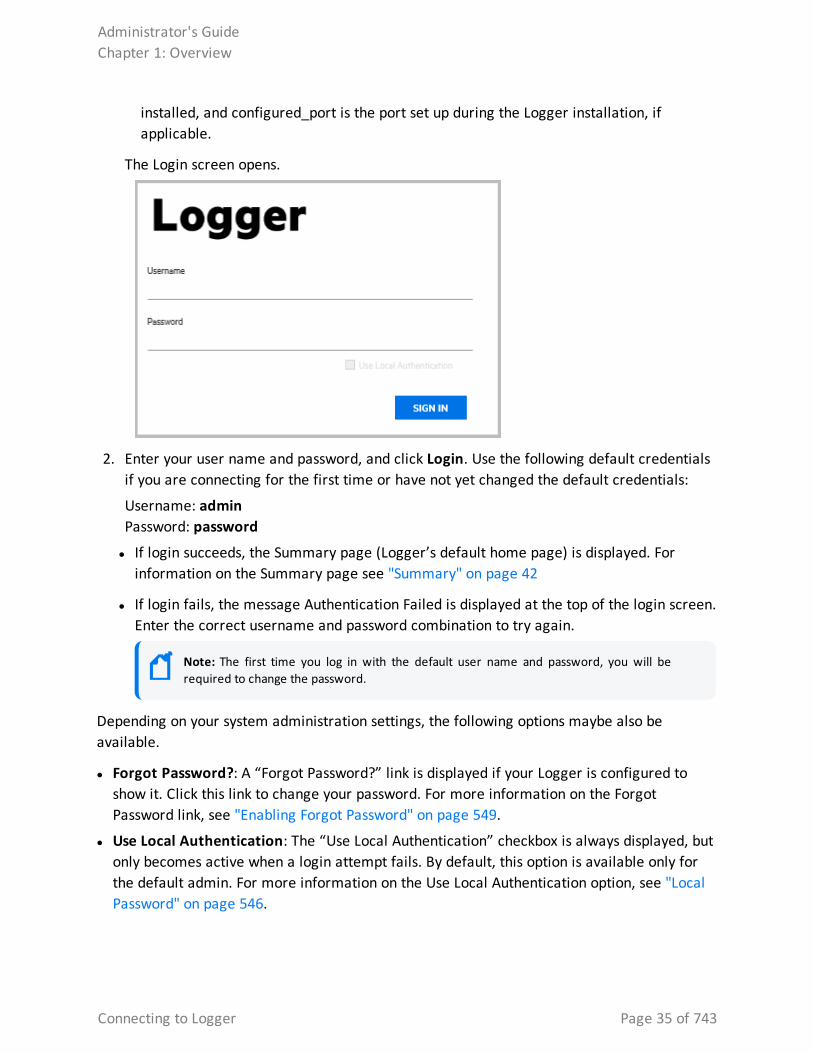
Connecting to LoggerYou can connect to Logger and log in with most browsers, including Chrome and Firefox. Refer to the Release Notes for a list of browsers supported in this release.
To connect and log into Logger:
1. Use the URL configured during Logger installation to connect to Logger through a supported browser.
l For the Logger appliance, use https://<hostname or IP address> The End User License Agreement is displayed. Review and accept the EULA.
l For Software Logger, use https://<hostname or IP address>:<configured_port>, where the hostname or IP address is the system on which the Logger software is
Administrator's GuideChapter 1: Overview
Running Logger on Encrypted Appliances Page 34 of 743
installed, and configured_port is the port set up during the Logger installation, if applicable.
The Login screen opens.
2. Enter your user name and password, and click Login. Use the following default credentials if you are connecting for the first time or have not yet changed the default credentials:
Username: adminPassword: password
l If login succeeds, the Summary page (Logger’s default home page) is displayed. For information on the Summary page see "Summary" on page 42
l If login fails, the message Authentication Failed is displayed at the top of the login screen. Enter the correct username and password combination to try again.
Note: The first time you log in with the default user name and password, you will be required to change the password.
Depending on your system administration settings, the following options maybe also be available.
l Forgot Password?: A “Forgot Password?” link is displayed if your Logger is configured to show it. Click this link to change your password. For more information on the Forgot Password link, see "Enabling Forgot Password" on page 549.
l Use Local Authentication: The “Use Local Authentication” checkbox is always displayed, but only becomes active when a login attempt fails. By default, this option is available only for the default admin. For more information on the Use Local Authentication option, see "Local Password" on page 546.
Administrator's GuideChapter 1: Overview
Connecting to Logger Page 35 of 743
Navigating the User InterfaceA navigation and information bar (navbar) runs across every page in the user interface.
Menus, Take Me To, NavBar, and Bar GaugesThe Summary, Analyze, Dashboards, and Reports menu tabs provide access to various Logger functions and data. You can configure system settings and administrative functions in the Configuration and System Admin menus.
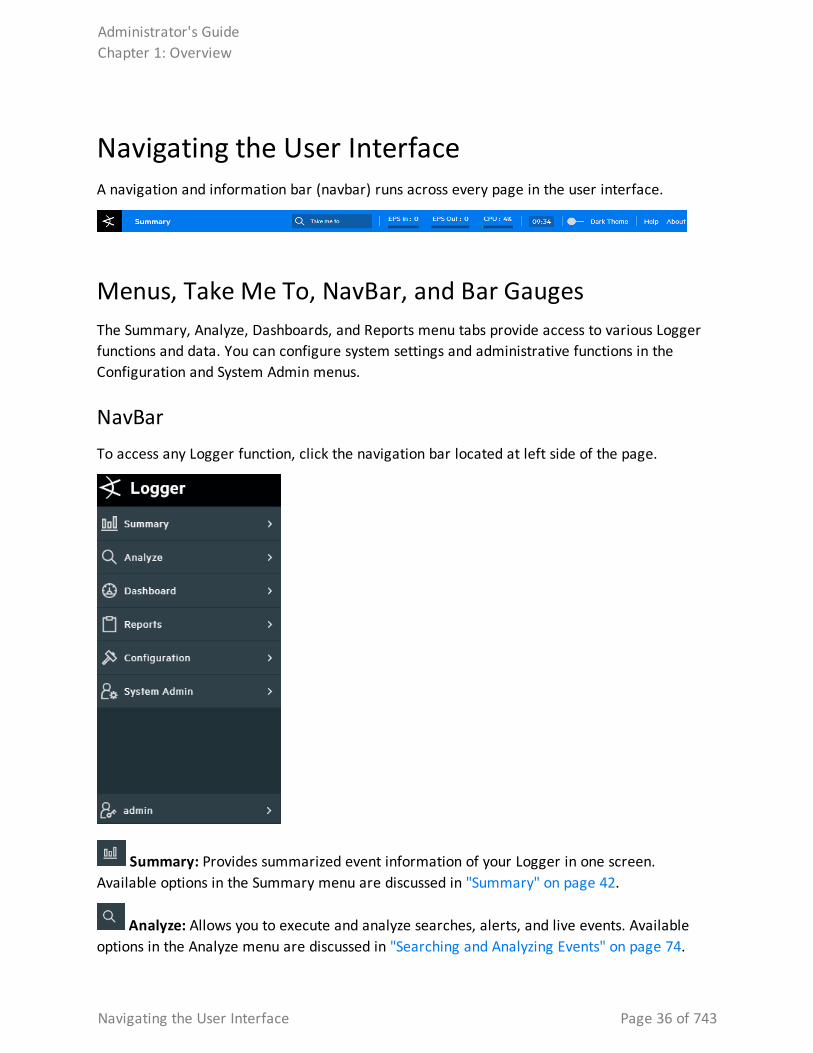
NavBarTo access any Logger function, click the navigation bar located at left side of the page.
Summary: Provides summarized event information of your Logger in one screen. Available options in the Summary menu are discussed in "Summary" on page 42.
Analyze: Allows you to execute and analyze searches, alerts, and live events. Available options in the Analyze menu are discussed in "Searching and Analyzing Events" on page 74.
Administrator's GuideChapter 1: Overview
Navigating the User Interface Page 36 of 743
Dashboard: Displays several out of the box dashboards. You can also customize dashboards as needed. Available options in the Dashboards menu are discussed in "Dashboards" on page 46.
Report: Enables you to create, view, save, and export reports. Available options in the Reports menu are discussed in "Reporting" on page 170.
Configuration: Allows you to configure and manage receivers, forwarders, devices, device groups, SmartConnectors, and filters. Available options in the Configuration menu are discussed in "Configuration" on page 314.
System Admin: Create and manage users and user groups, configure security settings, SMTP, and other system settings. Available options in the System Admin menu are discussed in "System Admin" on page 501.
Admin: Access Logger options and logout.
You can also expand/collapse the navigation bar by clicking the icon if needed. EPS and CPU usage can also be displayed in the right top corner of this page.
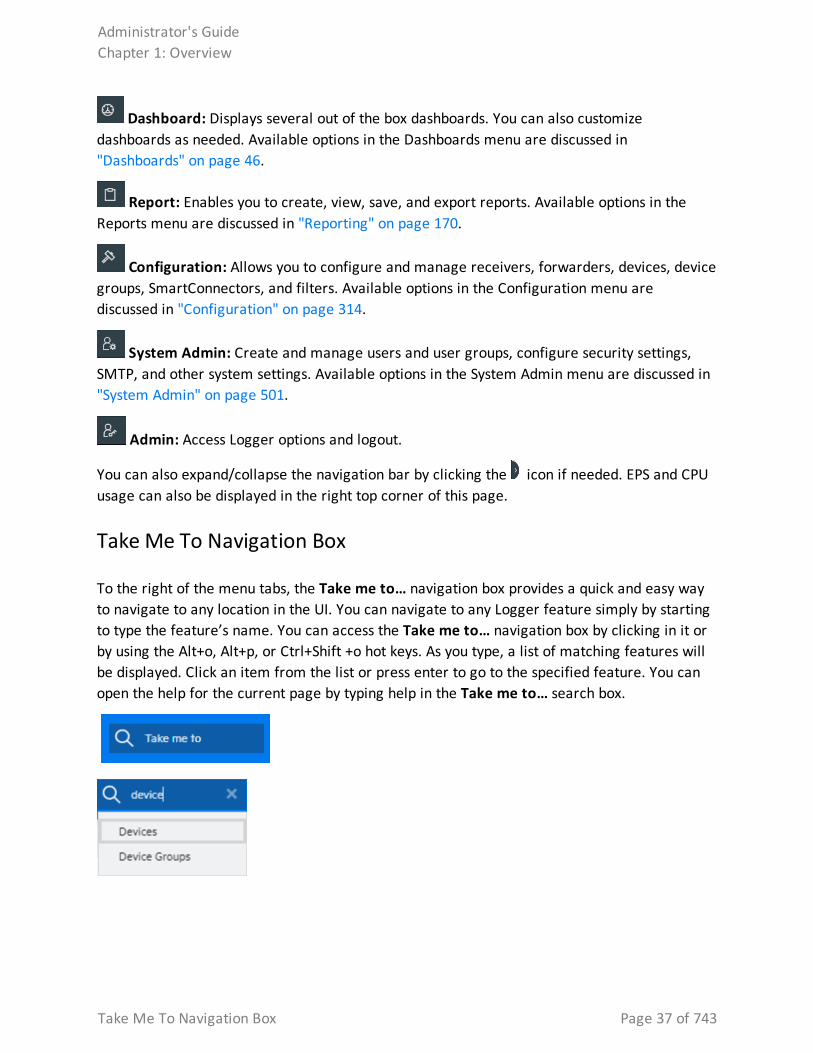
Take Me To Navigation Box
To the right of the menu tabs, the Take me to… navigation box provides a quick and easy way to navigate to any location in the UI. You can navigate to any Logger feature simply by starting to type the feature’s name. You can access the Take me to… navigation box by clicking in it or by using the Alt+o, Alt+p, or Ctrl+Shift +o hot keys. As you type, a list of matching features will be displayed. Click an item from the list or press enter to go to the specified feature. You can open the help for the current page by typing help in the Take me to… search box.
Administrator's GuideChapter 1: Overview
Take Me To Navigation Box Page 37 of 743
Note: Take me to navigation box has been disabled for overall reports section. Instead, the user can directly be redirected to an specific report by typing: Reports: YourReportSearch. For example: Reports:Most C
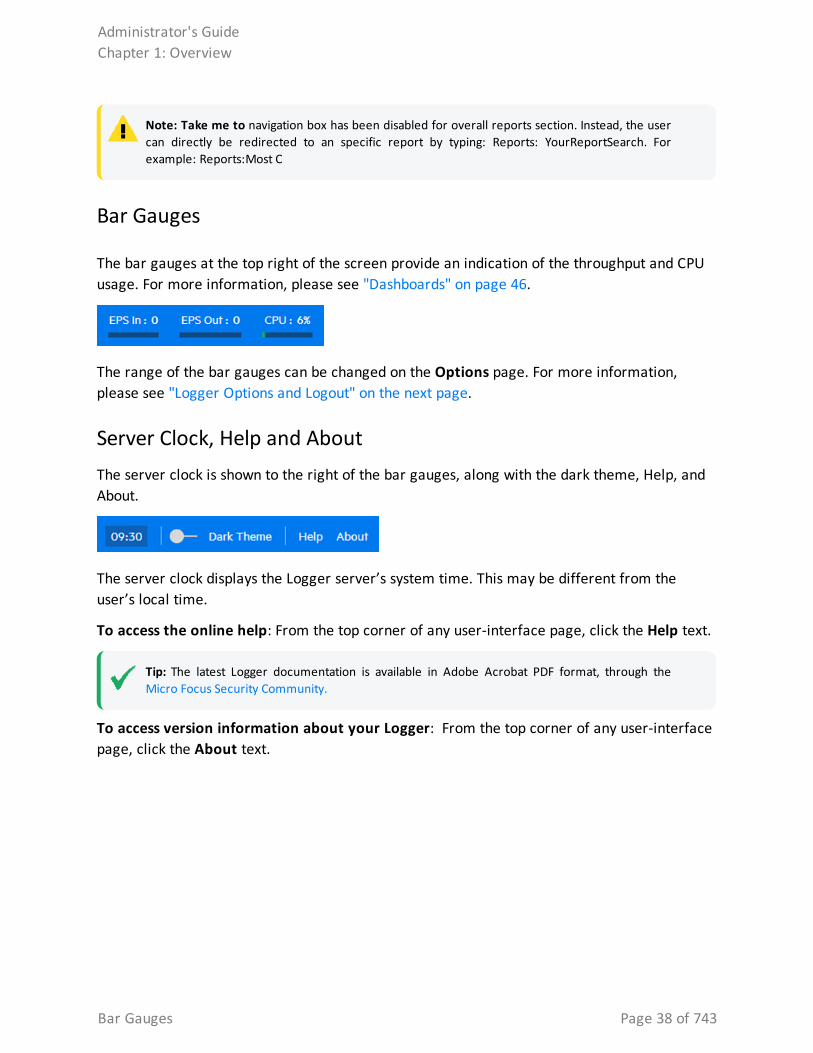
Bar Gauges
The bar gauges at the top right of the screen provide an indication of the throughput and CPU usage. For more information, please see "Dashboards" on page 46.
The range of the bar gauges can be changed on the Options page. For more information, please see "Logger Options and Logout" on the next page.
Server Clock, Help and AboutThe server clock is shown to the right of the bar gauges, along with the dark theme, Help, and About.
The server clock displays the Logger server’s system time. This may be different from the user’s local time.
To access the online help: From the top corner of any user-interface page, click the Help text.
Tip: The latest Logger documentation is available in Adobe Acrobat PDF format, through the Micro Focus Security Community.
To access version information about your Logger: From the top corner of any user-interface page, click the About text.
Administrator's GuideChapter 1: Overview
Bar Gauges Page 38 of 743
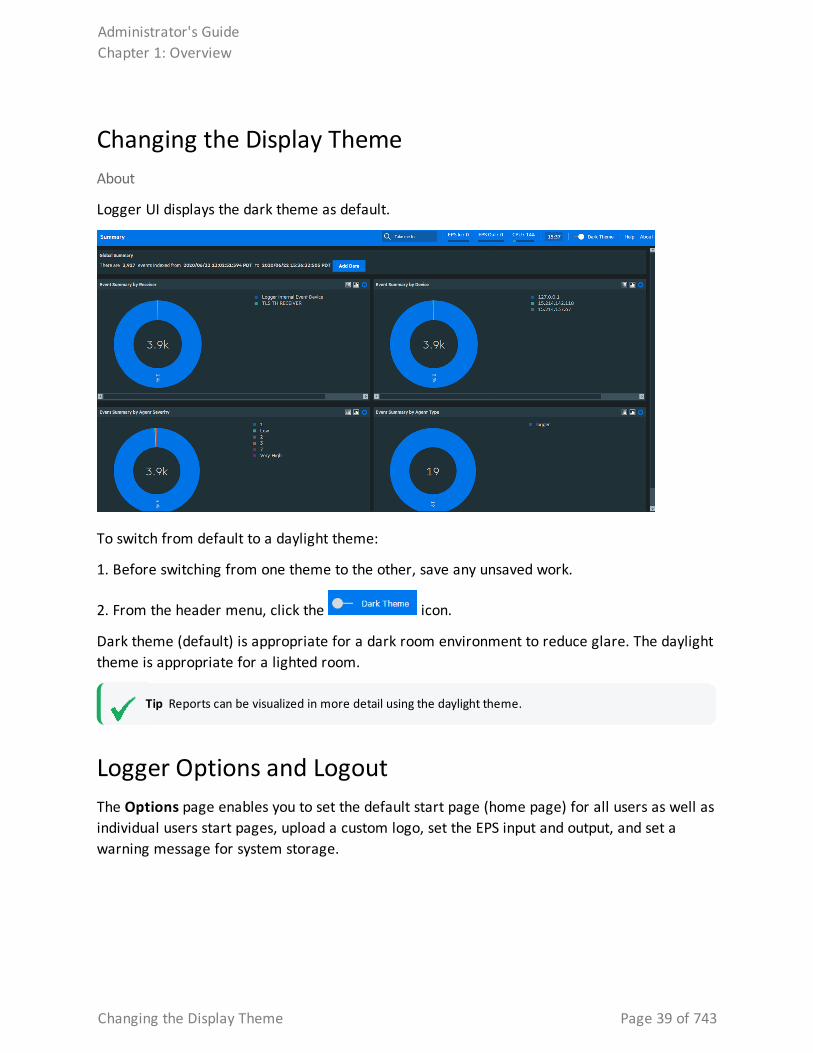
Changing the Display ThemeAbout
Logger UI displays the dark theme as default.
To switch from default to a daylight theme:
1. Before switching from one theme to the other, save any unsaved work.
2. From the header menu, click the icon.
Dark theme (default) is appropriate for a dark room environment to reduce glare. The daylight theme is appropriate for a lighted room.
Tip Reports can be visualized in more detail using the daylight theme.
Logger Options and LogoutThe Options page enables you to set the default start page (home page) for all users as well as individual users start pages, upload a custom logo, set the EPS input and output, and set a warning message for system storage.
Administrator's GuideChapter 1: Overview
Changing the Display Theme Page 39 of 743
To access the Options page:
From the navigation bar of any user interface , click the admin icon and then select Options.
To Login/Logout:
From the navigation bar, click the admin icon and then select Logout. You will be returned to the Login screen.
Tip: Logging out is good security practice, to eliminate the chance of unauthorized use of an unattended Logger session. Logger automatically logs you out after a user-configurable length of time (15 minutes by default). To change this length of time, see "Users/Groups" on page 545.
Caution: Simply closing the browser window does not automatically log you out. Click the Logout link to prevent the possibility of a malicious user restarting the browser and resuming your Logger session.
Customizing the Maximum EPSYou can set the maximum rate on the EPS In and EPS Out bar gauges by using the EPS Input rate bar gauge max and EPS output rate bar gauge max dropdowns in the Options menu. If the event rate exceeds the specified maximum, the range is automatically increased.
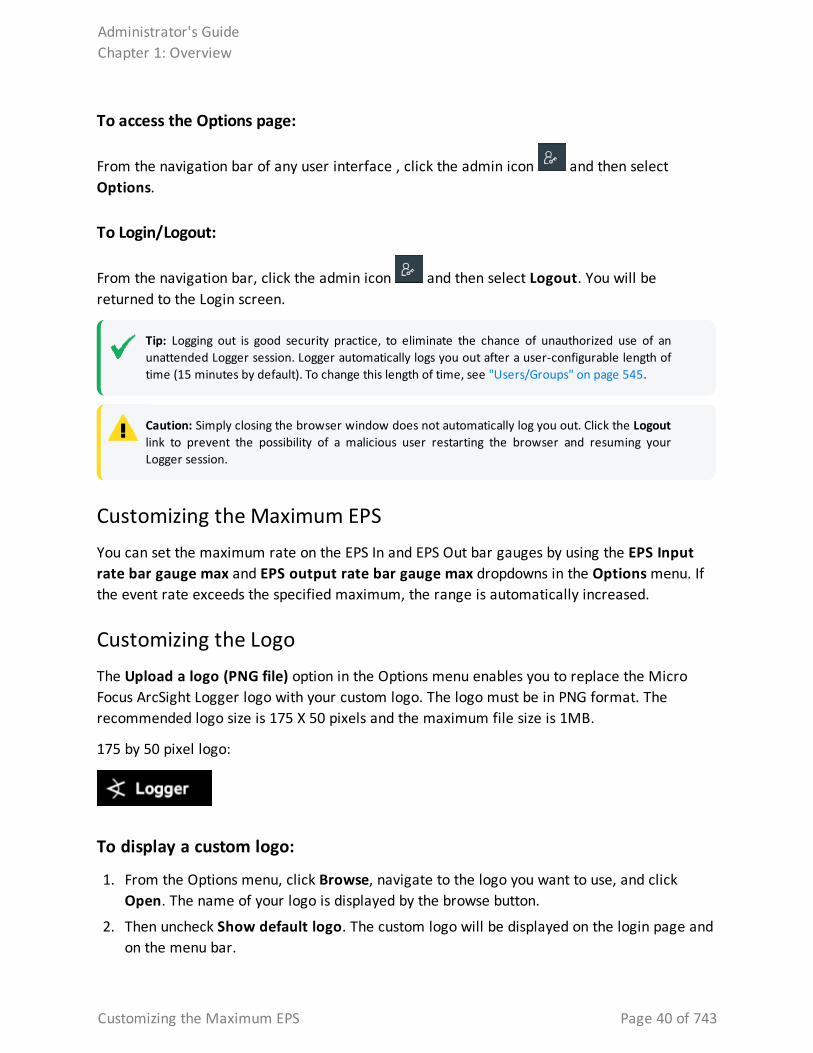
Customizing the LogoThe Upload a logo (PNG file) option in the Options menu enables you to replace the Micro Focus ArcSight Logger logo with your custom logo. The logo must be in PNG format. The recommended logo size is 175 X 50 pixels and the maximum file size is 1MB.
175 by 50 pixel logo:
To display a custom logo:
1. From the Options menu, click Browse, navigate to the logo you want to use, and click Open. The name of your logo is displayed by the browse button.
2. Then uncheck Show default logo. The custom logo will be displayed on the login page and on the menu bar.
Administrator's GuideChapter 1: Overview
Customizing the Maximum EPS Page 40 of 743
To display the default Micro Focus ArcSight logo:
Check the Show default logo checkbox.
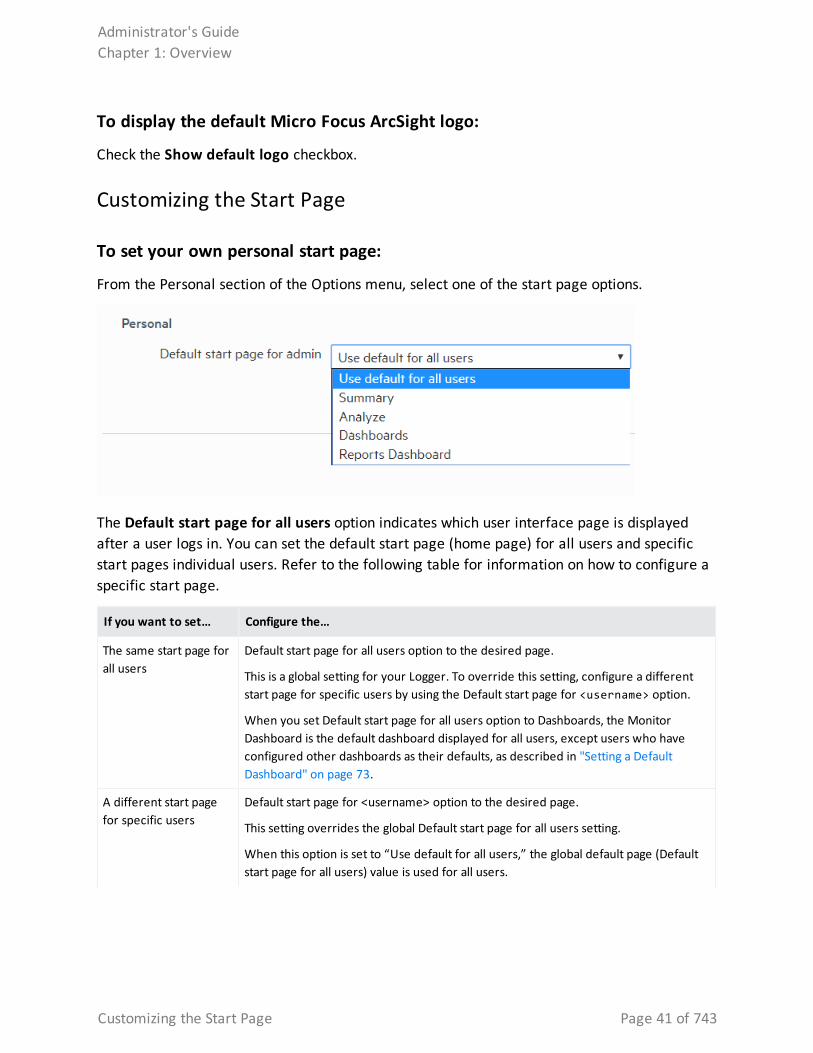
Customizing the Start Page
To set your own personal start page:
From the Personal section of the Options menu, select one of the start page options.
The Default start page for all users option indicates which user interface page is displayed after a user logs in. You can set the default start page (home page) for all users and specific start pages individual users. Refer to the following table for information on how to configure a specific start page.
If you want to set… Configure the…
The same start page for all users
Default start page for all users option to the desired page.
This is a global setting for your Logger. To override this setting, configure a different start page for specific users by using the Default start page for <username> option.
When you set Default start page for all users option to Dashboards, the Monitor Dashboard is the default dashboard displayed for all users, except users who have configured other dashboards as their defaults, as described in "Setting a Default Dashboard" on page 73.
A different start page for specific users
Default start page for <username> option to the desired page.
This setting overrides the global Default start page for all users setting.
When this option is set to “Use default for all users,” the global default page (Default start page for all users) value is used for all users.
Administrator's GuideChapter 1: Overview
Customizing the Start Page Page 41 of 743
If you want to set… Configure the…
A specific dashboard for a specific user
OR
A specific dashboard for all users
Default start page for <username> option to Dashboards.
The Monitor Dashboard is the default dashboard displayed for all users. However, if you want to display a different dashboard for one or more users, set the desired dashboard as the default when logged in as those users. For details, see "Setting a Default Dashboard" on page 73.
Logger User / Roles ReportThe user can render a report listing all the users and their respective roles. To access this report, click the download button from the export section of the Options menu.
Tip: Make sure to have manage user group permissions. Otherwise, this functionality will not be displayed. For more information, see "Setting Logger User Permissions" on page 561.
System Storage Logger now allows you to display a warning at a specific storage space available. This alert message prevents Logger from being unresponsive due to a lack of memory. To configure the alert, update the System Storage section of the Options page.
You can specify the storage space limit using a Fixed (specific number of gigabytes or terabytes) or a Percentage value. Once the quantity has reached, the warning displays on the Summary page only.
To disable the alert message, set to false the options.storage.isCheckEnabled property in the logger.properties file.
SummaryLogger’s default home page is the Summary page. (For information on how to use a different page as your home page, see "Logger Options and Logout" on page 39. ) The Summary page is a dashboard that provides summarized event information about your Logger in one screen. It enables you to gauge incoming events activity and the status of indexing. The events that are in Logger’s primary storage (not aged out due to retention or archived data) are used to generate the summary information.
Logger's home page, the Summary page, displays data in four panels. Each panel is displayed in a donut chart by default. You can change the display setting for each panel by clicking the appropriate icon.
Administrator's GuideChapter 1: Overview
Logger User / Roles Report Page 42 of 743
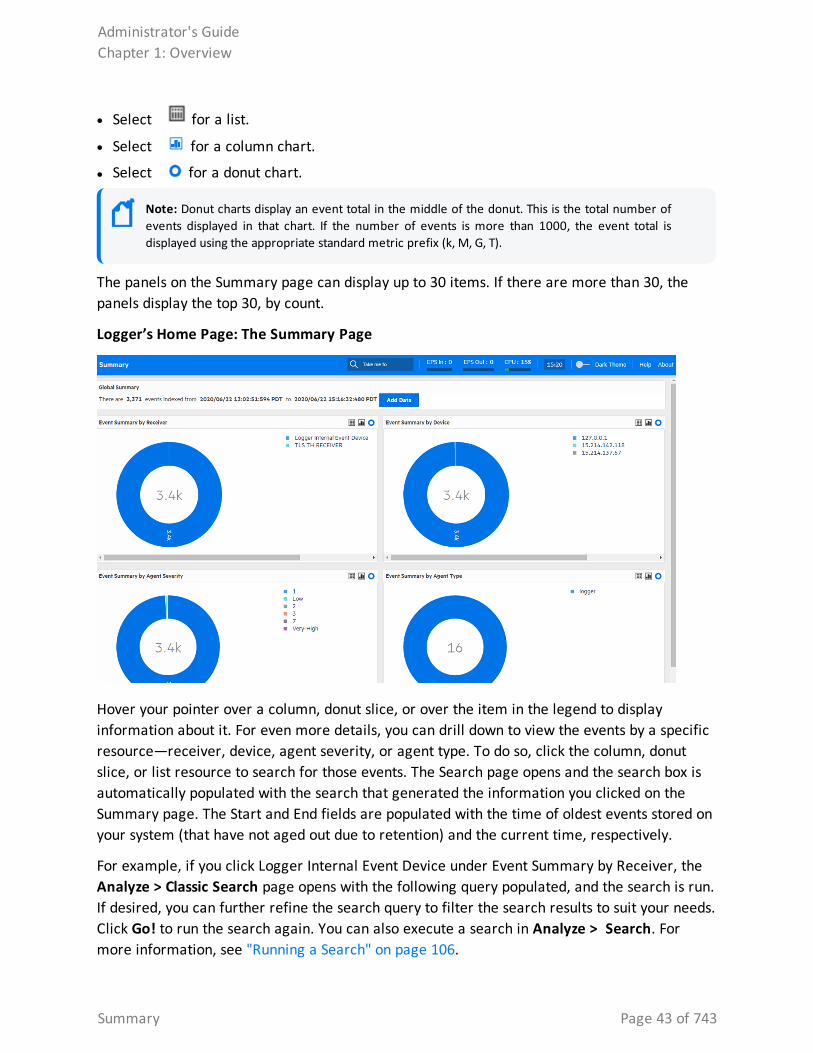
l Select for a list.
l Select for a column chart.
l Select for a donut chart.
Note: Donut charts display an event total in the middle of the donut. This is the total number of events displayed in that chart. If the number of events is more than 1000, the event total is displayed using the appropriate standard metric prefix (k, M, G, T).
The panels on the Summary page can display up to 30 items. If there are more than 30, the panels display the top 30, by count.
Logger’s Home Page: The Summary Page
Hover your pointer over a column, donut slice, or over the item in the legend to display information about it. For even more details, you can drill down to view the events by a specific resource—receiver, device, agent severity, or agent type. To do so, click the column, donut slice, or list resource to search for those events. The Search page opens and the search box is automatically populated with the search that generated the information you clicked on the Summary page. The Start and End fields are populated with the time of oldest events stored on your system (that have not aged out due to retention) and the current time, respectively.
For example, if you click Logger Internal Event Device under Event Summary by Receiver, the Analyze > Classic Search page opens with the following query populated, and the search is run. If desired, you can further refine the search query to filter the search results to suit your needs. Click Go! to run the search again. You can also execute a search in Analyze > Search. For more information, see "Running a Search" on page 106.
Administrator's GuideChapter 1: Overview
Summary Page 43 of 743
You cannot change or add other panels to the Summary page. If you need to display other information, you can create a custom Dashboard as described in "Dashboards" on page 46.
The information displayed on the Summary page is for your local Logger only, and does not include information about peer Loggers even if peers are configured.
Summary Dashboard Panels l Global Summary: The number of events indexed on your Logger during the time period
displayed on the screen. This time period is dependent on the retention policy set on your Logger. The start is the time of the oldest event stored in the Logger since the Logger was restarted, that has not aged out due to retention; the end time is current time. The Add Data ( ) button at the top opens the Receivers page where you can add and manage the receivers that put log data into your Logger. For more information on managing receivers, see "Receivers" on page 353.
Note: Kindly note Global Summary and Search page might differ significantly in the amount of events displayed as search time granularity used in both pages is different.
l Event Summary By Receiver: The list of receivers configured on your Logger, the number of events received on each receiver (that are in Logger’s primary storage, not aged out due to retention or archived data), and the timestamp of the last event received on each receiver. If a receiver is deleted, the summary information for it will continue to display until the events received on it age out from Logger’s primary storage. However, the receiver name is changed to the receiver ID (a numerical string) associated with the deleted receiver.
l Event Summary By Device: A device is a named event source, comprising of an IP address (or hostname) and a receiver name. The Devices panel lists devices configured on your Logger, the number of events received on each device (that are in Logger’s primary storage, not aged out due to retention or archived data), and the timestamp of the last event received on each device. If a device is deleted, the summary information for it will continue to display until the events received on it age out from Logger’s primary storage. However, you cannot click the device name to view the events associated with the deleted device.
l Event Summary By Agent Severity: The list of severity levels of the incoming events from ArcSight SmartConnectors to your Logger, the number of events received of each severity level, and the timestamp of the last event received of each severity level. Only events in Logger’s primary storage (not aged out due to retention or archived data) are considered when summarizing this information.
l Event Summary By Agent Type: The list of ArcSight SmartConnectors sending events to your Logger, the number of events received from each SmartConnector (for events that are in Logger’s primary storage, not aged out due to retention or archived data), and the timestamp of the last event received from each SmartConnector. If a SmartConnector is
Administrator's GuideChapter 1: Overview
Summary Dashboard Panels Page 44 of 743
deleted, the summary information for it will continue to display until the events received from it age out from Logger’s primary storage.
The Effect of Search Group Filters on the Summary PageSearch Group filters that enforce privileges on storage groups are applied to the content displayed on the Summary page. However, Search Group filters that enforce privileges on device groups are not applied. Therefore, the Summary page includes counts of events in device groups to which a user does not have privileges. However, if the user tries to drill down to view events, search results in accordance with access privileges are returned as the search query is run on the Analyze page, which enforces all types of Search Group filters. Similarly, if a Search Group filter enforces privileges on both, storage groups and device groups, only the storage group enforcement is applied on the Summary page.
Administrator's GuideChapter 1: Overview
The Effect of Search Group Filters on the Summary Page Page 45 of 743
Chapter 2: DashboardsThe following topics provide an overview of how to connect to Logger, and explores Logger's dashboards. Logger includes standard dashboards that display the real-time and historical status of receivers and forwarders as well as storage, CPU, and disk usage statistics. You can create your own dashboards for an all-in-one view of Logger information that is of interest to you.
Dashboards are an all-in-one view of the Logger information of interest to you. You can select and view any of several out-of-box dashboards or create and display your own custom dashboard.
Each Logger dashboard contains one or more panels of these types:
l Search Results: Search Results panels display events that match the query associated with the panel.
l Monitor: Monitor panels display the real-time and historical status of various Logger components such as receivers, forwarders, storage, CPU, and disk.
l Summary: Summary panels display summarized event information about your Logger—the number of events received of a specific resource or field type, and the time stamp of the last event received for that resource or field type.
Out-of-Box DashboardsLogger comes with several out-of-box dashboards, described below. The Monitor dashboard is displayed by default unless you configure another dashboard to display as your default.
l The Event Count dashboard, described in "The Event Count Dashboard" on page 57, displays how many events each receiver or forwarder handled.
l The Intrusion and Configuration Events dashboard, described in "The Intrusion and Configuration Events Dashboard" on page 56, displays information about configuration changes and intrusions on your system.
l The Login and Connection Activity dashboard, described in "The Login and Connection Activity Dashboard" on page 57, displays information about login and connection activity on your system.
l The Monitor dashboard displays the Summary panel, which shows the status of CPU Usage, Event Flow, Receivers, Forwarders, and Storage Groups in a summarized view. The other panels available in this dashboard are Platform, Network, Logger, Receivers, Forwarders, and Storage. These views are described in detail in "The Monitor Dashboard" on page 49.
You cannot change or adjust the panels available in the out-of-box dashboards, except the System Overview dashboard (See "The System Overview Dashboard" on page 55). However,
Chapter 2: Dashboards Page 46 of 743
you can add specific Search Results panels to a custom dashboard, as described in "Creating and Managing Custom Dashboards" on page 67.
You can add also Monitor and Summary panels to it. These panels provide the same information available through the default Monitor dashboard and the default Summary dashboard , however in a modular form that enables you to choose specific views. (See "Summary" on page 42 for more information about default Summary dashboard.)
For example, if you want to view the EPS for the last 4 hours on all receivers, add the panel Type “Monitor Graph”, and select “(Logger) All EPS Out-All EPS In - 4 hour” as the Graph, or if you want to view the EPS on Forwarders in a table form, select the “Monitor (Forwarders)” panel Type. Similarly, if you want to view only the summary information for receivers on your Logger, add the panel of Type “Summary (Receivers)”. Besides the four Summary panels (Agent Severities, Agent Types, Receivers, and Devices), you can also create a user-defined Summary panel in which you can select any indexed, non-time field by which you want to categorize event summary. For example, if you want to add a Summary panel to display event summary categorized by “destinationAddress”, you can add a panel of Type “Summary (User Defined)” for this field if it is indexed on your Logger.
You can also drill down on any of the resources listed in Monitor and Summary panels you add to view events by a specific resource or field value on the Analyze (Search) page. For example, you can click on a storage group in a Monitor panel to view its events in the last 24 hours, or you can click on an event name “Network Usage - Inbound” to view all events of that name in the last one hour. Additionally, you can access the Configuration page for any of the resources listed in the Monitor panels to configure them. For example, if you want to configure a receiver, click the Configure link on top of the Monitor (Receiver) panel.
Search Group filters that restrict privileges on device groups are not enforced on Summary panels. Therefore, Summary panels include counts of events in device groups to which a user does not have privileges. However, if the user tries to drill down to view events, search results in accordance with access privileges are returned as the search query is run on the Analyze page, which enforces all types of Search Group filters. Similarly, if a Search Group filter enforces privileges on both, storage groups and device groups, only the storage group enforcement is applied on Summary panels.
Users can create both shared and private dashboards.
l Shared dashboards are visible to all users with the appropriate privileges.
l Private dashboards are visible only to the creator or users with "admin" privileges.
l Only the creator or users with "admin" privileges can edit or delete dashboards of either type.
A user accessing a shared dashboard must have privileges to view the information displayed in the dashboard; otherwise, the information to which they do not have the privileges is not
Administrator's GuideChapter 2: Dashboards
Out-of-Box Dashboards Page 47 of 743
displayed, and the associated panel displays a message that indicates the reason for the undisplayed information.
Managing Out-Of-Box Dashboards Each dashboard displays the search results of a Saved Search found in the standard system content along with the time and date the query was most recently refreshed.
While you cannot update the system content used in the out-of-box dashboard, you can then edit the search to meet your needs, save your changes, and use your new saved search in your own dashboard to find exactly what you are interested in. To create a new dashboard, follow the instruction in "Creating and Managing Custom Dashboards" on page 67.
Note: Dashboards that display charts are aggregated queries. Therefore, the entire search must complete before the chart is displayed. This can take some time if there are a large number of events.
l The dashboards are not automatically refreshed. Click refresh to refresh the search results.
l Click View on Search Page to open the Analyze > Classic Search page and run the Saved Search automatically.
l Click a chart value (a column, bar, or donut section) to drill down to events with specific field values. (Drill-down is not available for dashboards that display tables.)
Chart Drill-Down
When you click on a chart value (a column, bar, or donut section), the query is rerun on the Analyze > Classic Search page with an additional WHERE operator clause that includes the field name and value you clicked on the chart.
The drill-down information includes a histogram and a table of the search results. You can drill down on the histogram for further information. For more information on drilling down on a histogram, see "Histogram Drill Down" on page 131.
Note: The saved search query associated with the Search Results panel in the dashboard is not modified. If you need to return to the dashboard from the drill-down screen, use the Back function of your browser.
Administrator's GuideChapter 2: Dashboards
Managing Out-Of-Box Dashboards Page 48 of 743
The Monitor DashboardThe Monitor Dashboard, displayed by default, contains the real-time and historical status of receivers, forwarders, and storage, CPU, and disk usage statistics. On Software Logger, the CPU and disk usage statistics indicate the total use of these resources on the system, not just the use of these resources by the Logger process.
The Monitor panels, available through a pull-down menu display Summary, Platform, Network, Logger, Receivers, Forwarders, and Storage information. You cannot change or adjust any of these out-of-box panels, but you can create your own dashboards to monitor the things in which you are most interested. For more information, see "Creating and Managing Custom Dashboards" on page 67.
All monitor panels, except the Summary panel, include a pull-down menu for duration control. The summary panel has buttons instead. In both cases, you can choose one of the following time spans for historical data: 4 hours, 24 hours, 7 days, 30 days, 90 days, or 365 days. As you hover your pointer over the data, more details are displayed. In the case of dashboards that displays two fields, details of both are displayed, and a legend indicates the color that represents each field.
In these dashboards, events per second (e/s) are displayed using standard metric prefixes (k, M, G, T) for numbers over 1000. Numbers under 1000 are displayed as integers.
The System Overview dashboard provides a different view of these panels. See "The System Overview Dashboard" on page 55 for more information about that view.
Administrator's GuideChapter 2: Dashboards
The Monitor Dashboard Page 49 of 743
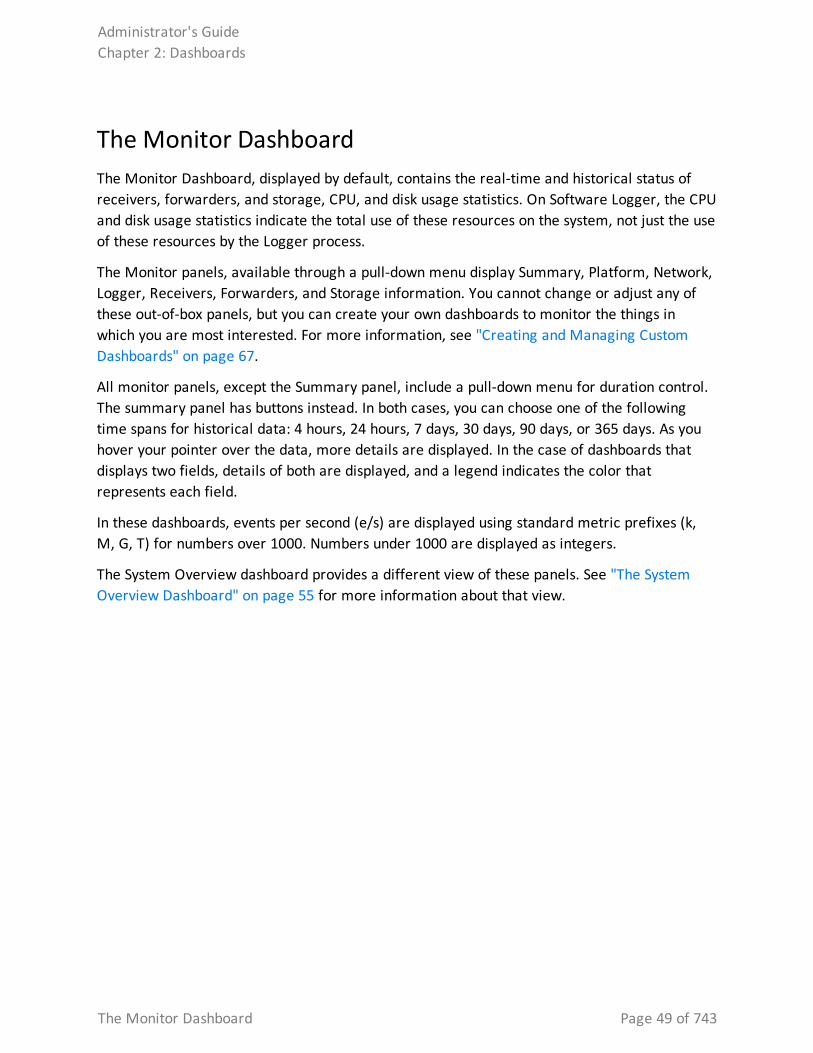
Monitor Dashboard Summary Panel
The summary panel, displayed by default, shows the status of CPU Usage, Event Flow, Receivers, Forwarders, and Storage Groups in a summarized view.
Monitor dashboard - Summary panel
On the Summary panel, click on a Receiver, Forwarder, or Storage Group name to jump to the Search page and include the selected resource in the query.
Additionally, you can click Configure to open the Configuration page for Receivers, Forwarders, and Storage Groups.
Note: The total space allocated for a storage group includes a certain amount that has been set aside to ensure that the group can receive new events when it is almost full. As a result, the percentage of used space for a storage group never reaches 100% (as displayed on the Monitor > Summary panel). For Software Loggers installed using the Minimal setting, the maximum % Used (On the Monitor > Summary panel) for each storage group reaches up to 66.33%. (Two storage groups of 3 GB each; 1 GB is set aside for new events in each group. After 2 GB of space has been used and the new events are being written to the last 1 GB, Logger automatically triggers retention and reclaims 1 GB of the used space. Thus, the % Used field for each storage group only reaches up to 66.33%.)
Administrator's GuideChapter 2: Dashboards
Monitor Dashboard Summary Panel Page 50 of 743
Monitor Dashboard Receivers Panel
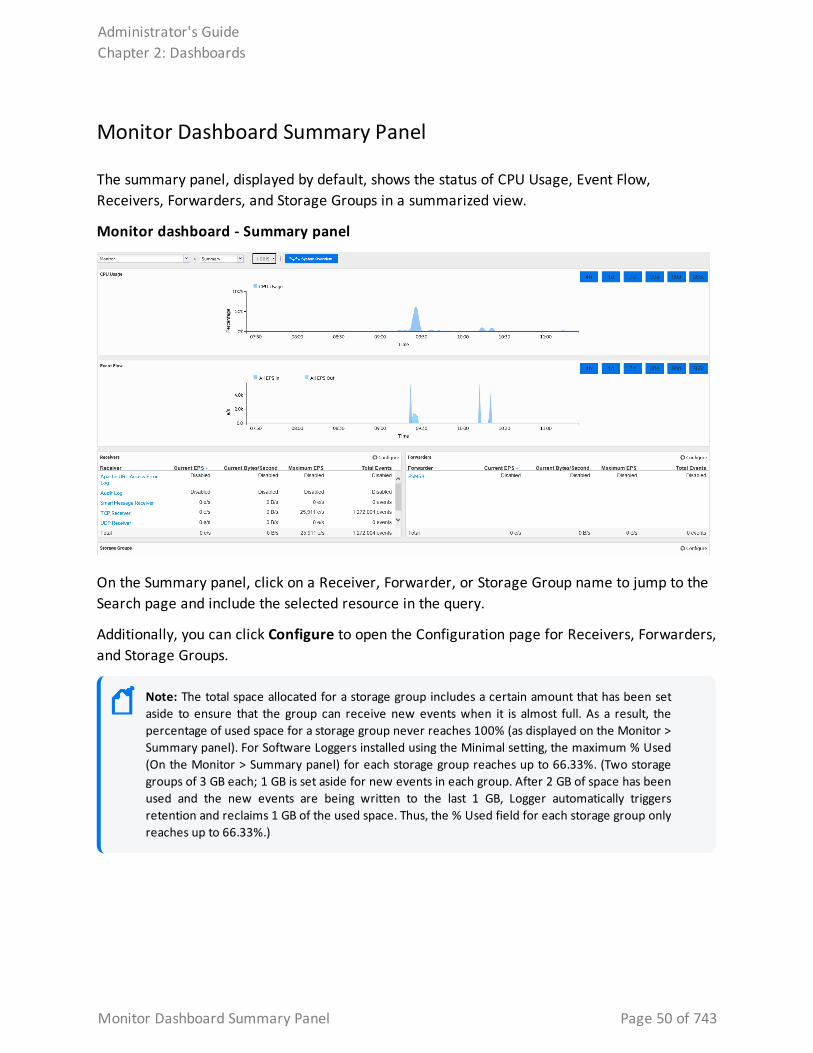
The Receivers monitor panel shows the total Events per Second (EPS) received and displays values for each configured receiver. The list of receivers includes all receivers known to the system, including those that are disabled. (To create a new receiver, or to enable or disable one, see "Working with Receivers" on page 361.)
Monitor dashboard - Receivers panel
Monitor Dashboard Platform Panel
The Platform monitor panel displays information about CPU usage, memory usage, bytes received and sent on the network, and raw disk reads and writes.
Monitor dashboard - Platform panel
Administrator's GuideChapter 2: Dashboards
Monitor Dashboard Receivers Panel Page 51 of 743
Monitor Dashboard Network Panel
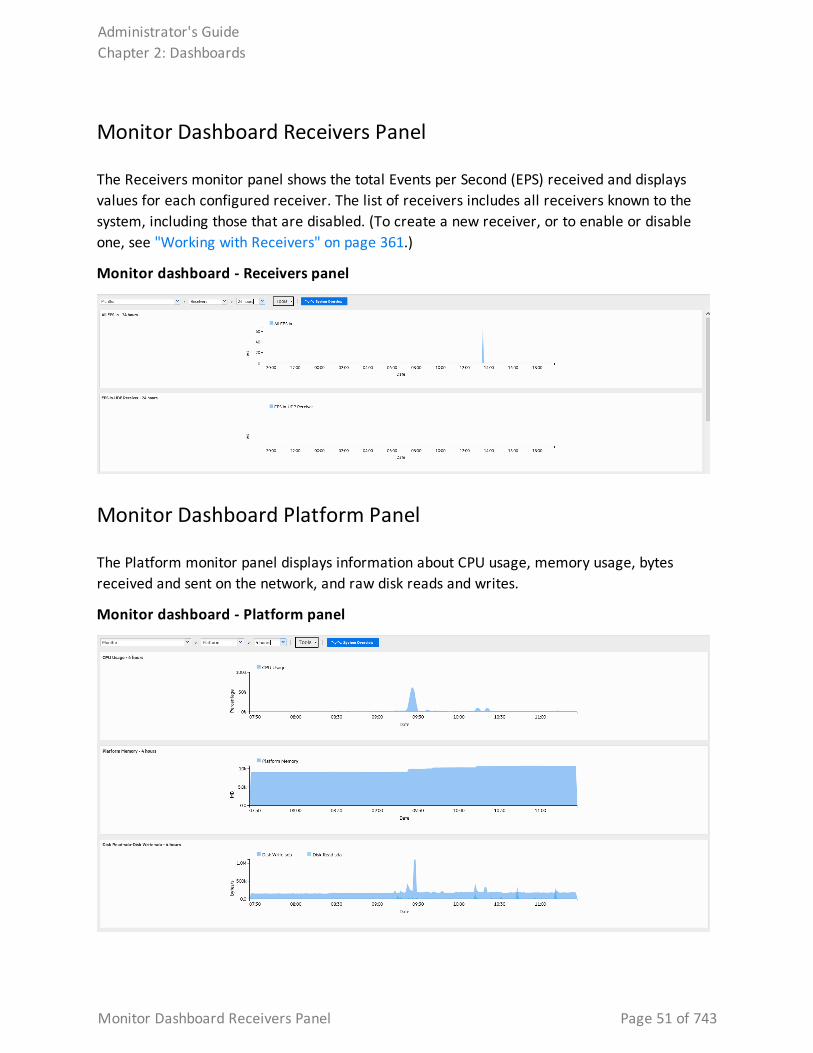
The Network monitor panel display a graph for each network interface card. (The number of network interface cards varies by the hardware model.) The graph displays the bytes transmitted, overlaid on the bytes received.
Monitor dashboard - Network panel
Administrator's GuideChapter 2: Dashboards
Monitor Dashboard Network Panel Page 52 of 743
Monitor Dashboard Logger Panel
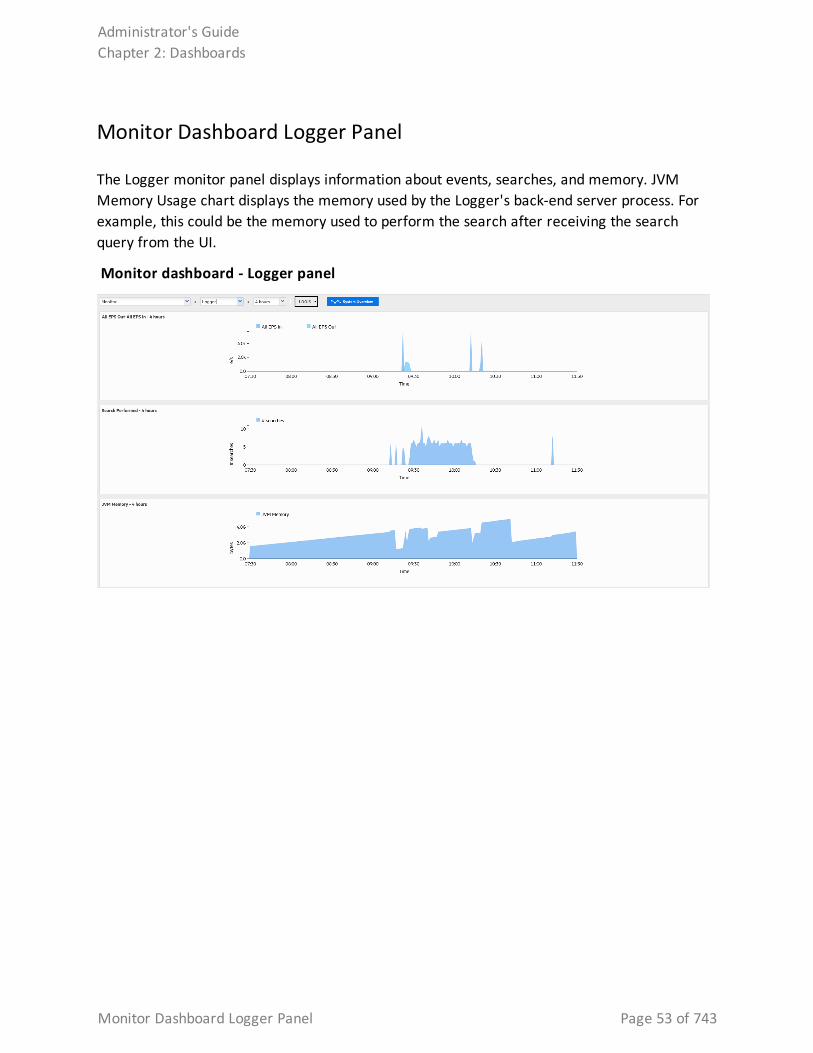
The Logger monitor panel displays information about events, searches, and memory. JVM Memory Usage chart displays the memory used by the Logger's back-end server process. For example, this could be the memory used to perform the search after receiving the search query from the UI.
Monitor dashboard - Logger panel
Administrator's GuideChapter 2: Dashboards
Monitor Dashboard Logger Panel Page 53 of 743
Monitor Dashboard Forwarders Panel
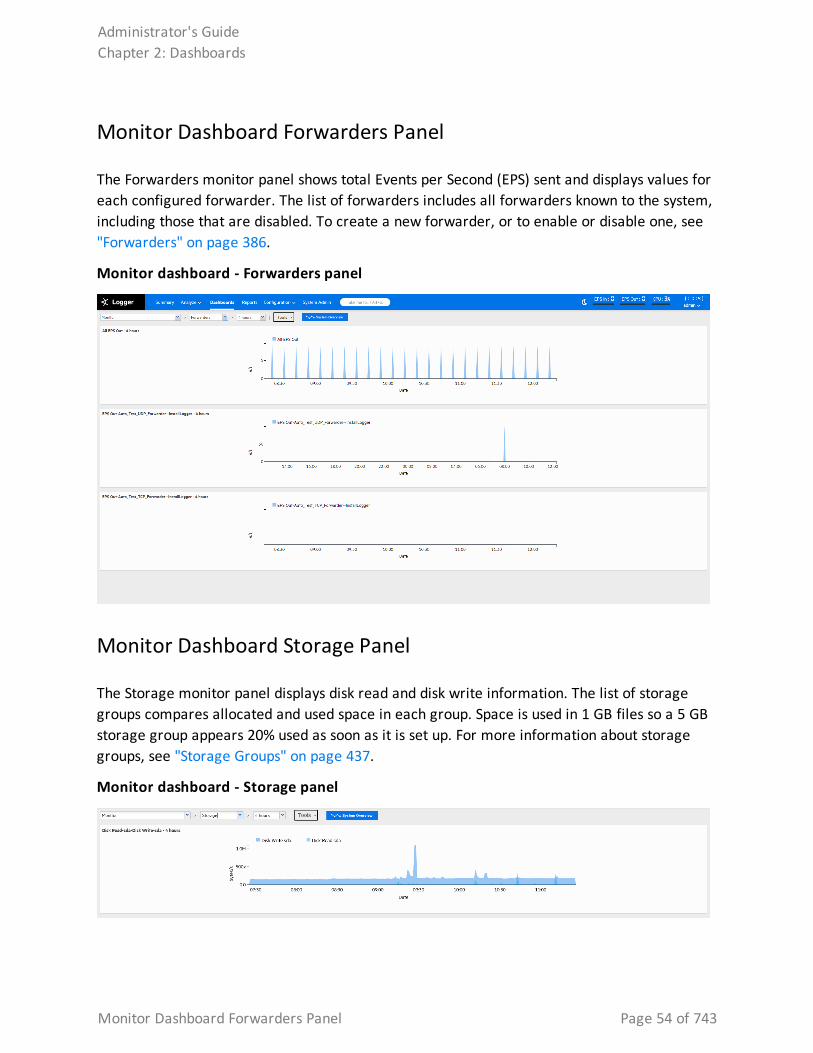
The Forwarders monitor panel shows total Events per Second (EPS) sent and displays values for each configured forwarder. The list of forwarders includes all forwarders known to the system, including those that are disabled. To create a new forwarder, or to enable or disable one, see "Forwarders" on page 386.
Monitor dashboard - Forwarders panel
Monitor Dashboard Storage Panel
The Storage monitor panel displays disk read and disk write information. The list of storage groups compares allocated and used space in each group. Space is used in 1 GB files so a 5 GB storage group appears 20% used as soon as it is set up. For more information about storage groups, see "Storage Groups" on page 437.
Monitor dashboard - Storage panel
Administrator's GuideChapter 2: Dashboards
Monitor Dashboard Forwarders Panel Page 54 of 743
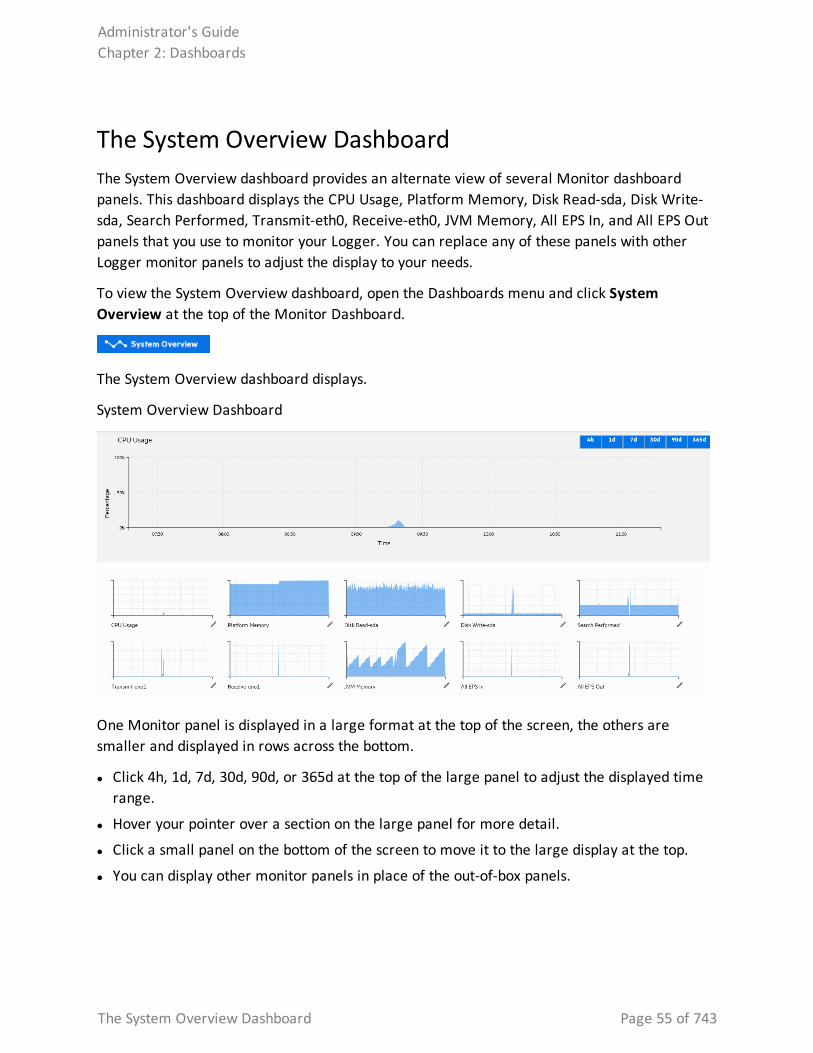
The System Overview DashboardThe System Overview dashboard provides an alternate view of several Monitor dashboard panels. This dashboard displays the CPU Usage, Platform Memory, Disk Read-sda, Disk Write-sda, Search Performed, Transmit-eth0, Receive-eth0, JVM Memory, All EPS In, and All EPS Out panels that you use to monitor your Logger. You can replace any of these panels with other Logger monitor panels to adjust the display to your needs.
To view the System Overview dashboard, open the Dashboards menu and click System Overview at the top of the Monitor Dashboard.
The System Overview dashboard displays.
System Overview Dashboard
One Monitor panel is displayed in a large format at the top of the screen, the others are smaller and displayed in rows across the bottom.
l Click 4h, 1d, 7d, 30d, 90d, or 365d at the top of the large panel to adjust the displayed time range.
l Hover your pointer over a section on the large panel for more detail.
l Click a small panel on the bottom of the screen to move it to the large display at the top.
l You can display other monitor panels in place of the out-of-box panels.
Administrator's GuideChapter 2: Dashboards
The System Overview Dashboard Page 55 of 743
Note: You can only display existing monitor panels; you cannot display search results or summary panels.
The Forwarder, Receiver and Storage panels available for display varies, based on your Logger configuration.
To display a custom panel in place of one of the out-of-box panels:
1. Click the edit icon next to the panel's name.
2. Start typing in the text box to see the list of available panels. For example, to display a receiver, start typing "re".
3. Click a panel in the list to select it, or click the cancel icon to close the dialog without selecting another panel.
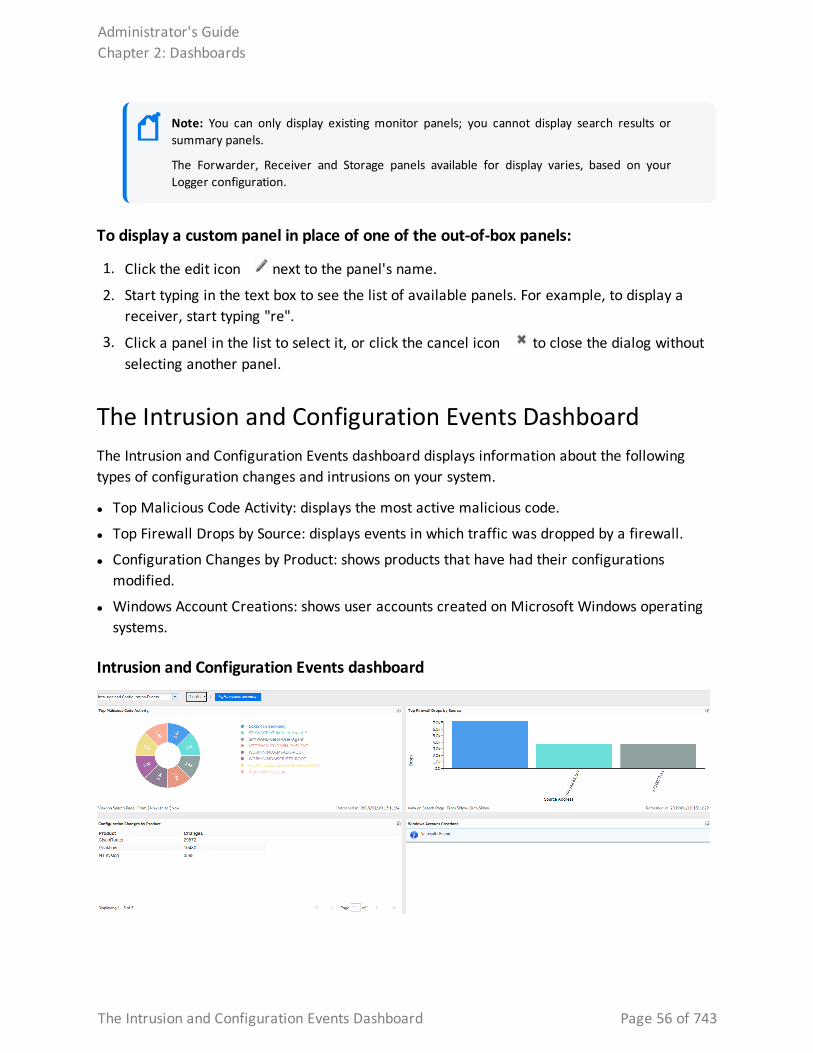
The Intrusion and Configuration Events DashboardThe Intrusion and Configuration Events dashboard displays information about the following types of configuration changes and intrusions on your system.
l Top Malicious Code Activity: displays the most active malicious code.
l Top Firewall Drops by Source: displays events in which traffic was dropped by a firewall.
l Configuration Changes by Product: shows products that have had their configurations modified.
l Windows Account Creations: shows user accounts created on Microsoft Windows operating systems.
Intrusion and Configuration Events dashboard
Administrator's GuideChapter 2: Dashboards
The Intrusion and Configuration Events Dashboard Page 56 of 743
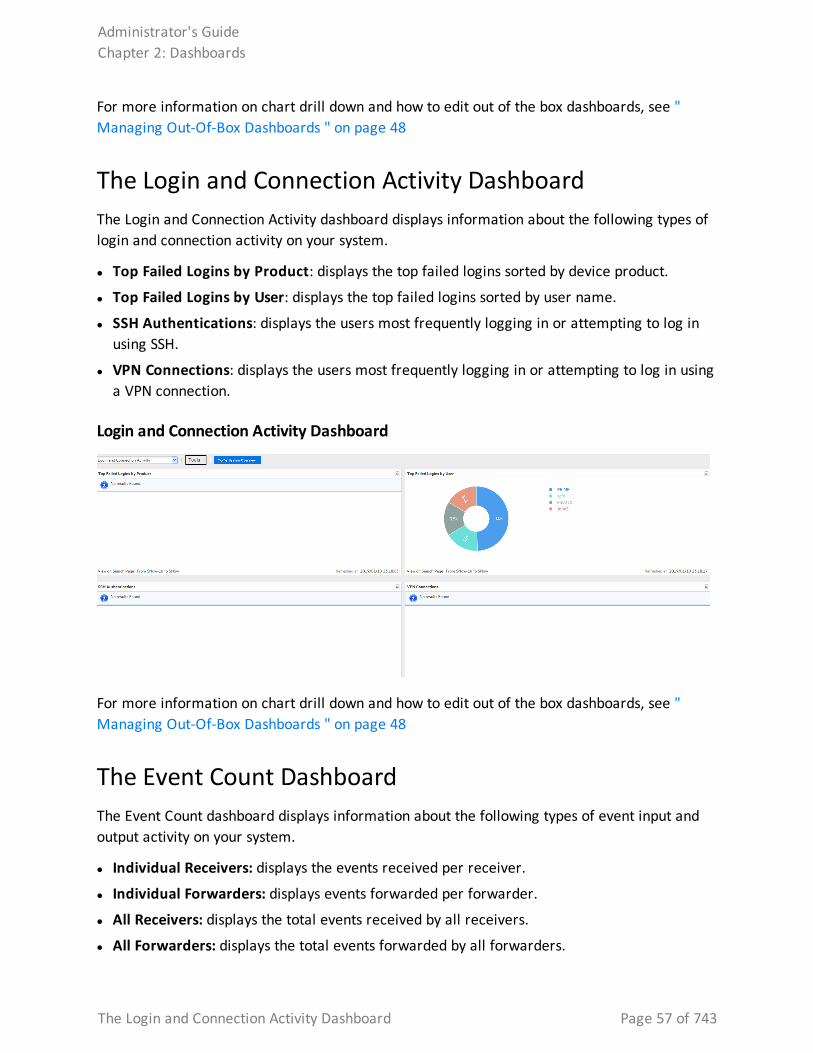
For more information on chart drill down and how to edit out of the box dashboards, see " Managing Out-Of-Box Dashboards " on page 48
The Login and Connection Activity DashboardThe Login and Connection Activity dashboard displays information about the following types of login and connection activity on your system.
l Top Failed Logins by Product: displays the top failed logins sorted by device product.
l Top Failed Logins by User: displays the top failed logins sorted by user name.
l SSH Authentications: displays the users most frequently logging in or attempting to log in using SSH.
l VPN Connections: displays the users most frequently logging in or attempting to log in using a VPN connection.
Login and Connection Activity Dashboard
For more information on chart drill down and how to edit out of the box dashboards, see " Managing Out-Of-Box Dashboards " on page 48
The Event Count DashboardThe Event Count dashboard displays information about the following types of event input and output activity on your system.
l Individual Receivers: displays the events received per receiver.
l Individual Forwarders: displays events forwarded per forwarder.
l All Receivers: displays the total events received by all receivers.
l All Forwarders: displays the total events forwarded by all forwarders.
Administrator's GuideChapter 2: Dashboards
The Login and Connection Activity Dashboard Page 57 of 743
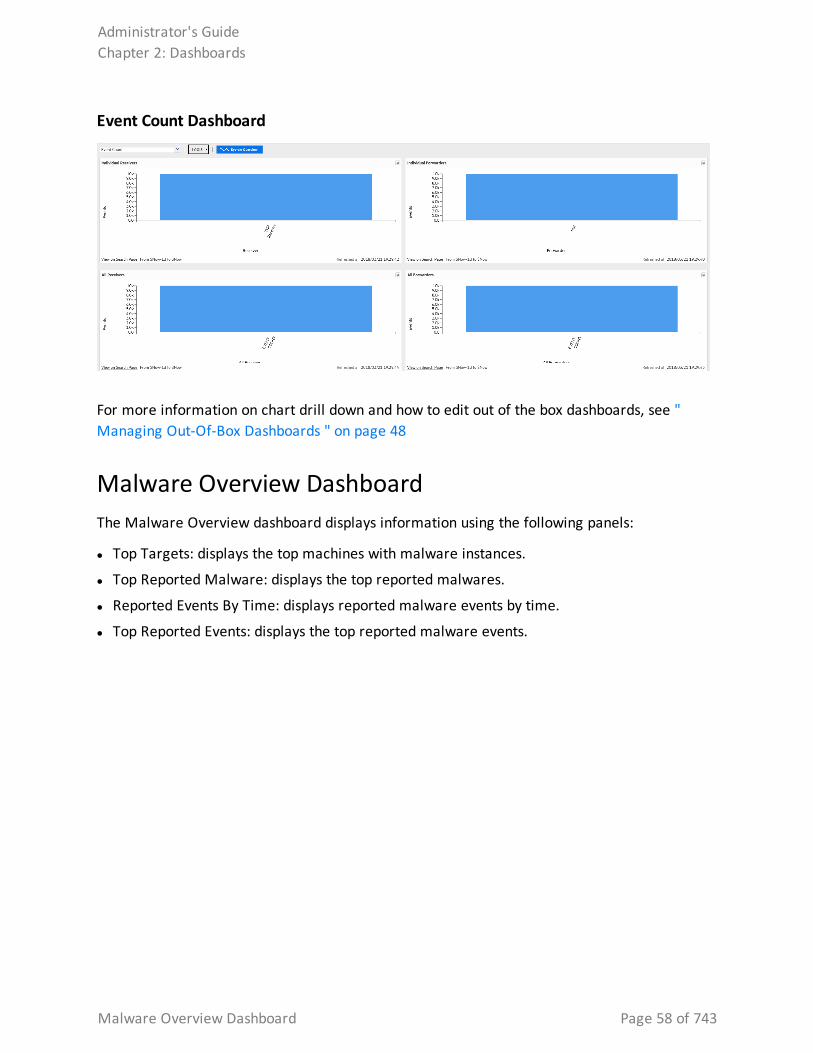
Event Count Dashboard
For more information on chart drill down and how to edit out of the box dashboards, see " Managing Out-Of-Box Dashboards " on page 48
Malware Overview Dashboard The Malware Overview dashboard displays information using the following panels:
l Top Targets: displays the top machines with malware instances.
l Top Reported Malware: displays the top reported malwares.
l Reported Events By Time: displays reported malware events by time.
l Top Reported Events: displays the top reported malware events.
Administrator's GuideChapter 2: Dashboards
Malware Overview Dashboard Page 58 of 743
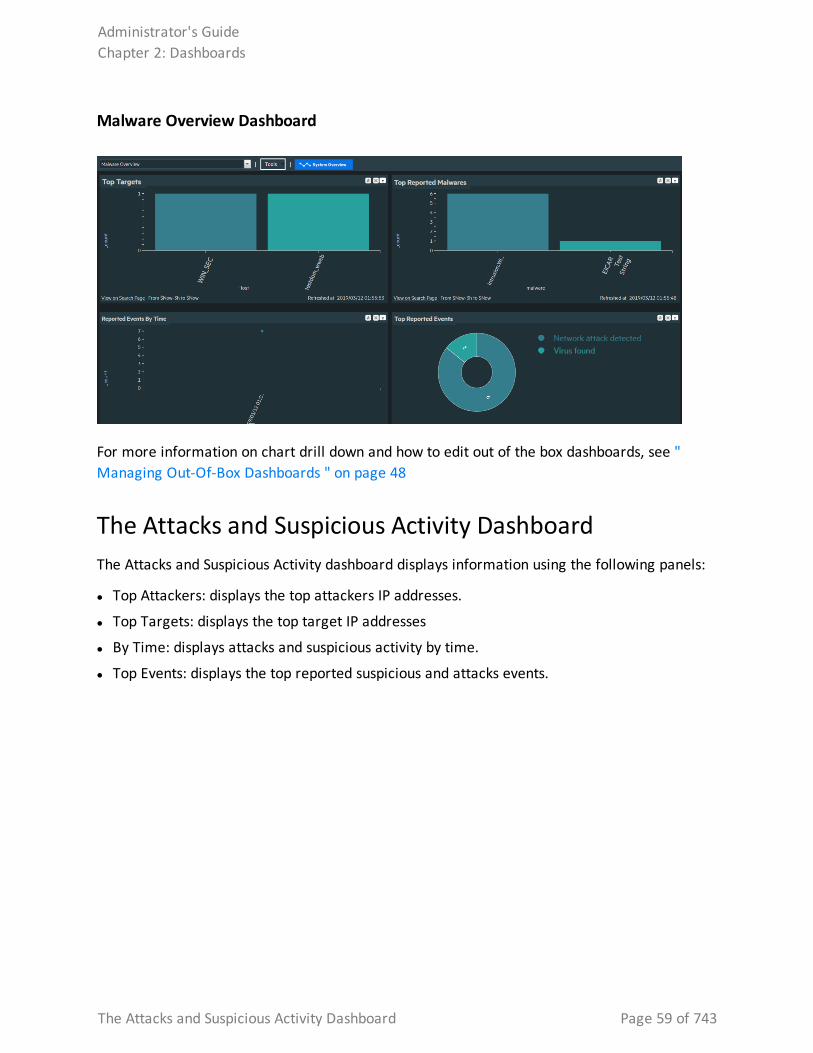
Malware Overview Dashboard
For more information on chart drill down and how to edit out of the box dashboards, see " Managing Out-Of-Box Dashboards " on page 48
The Attacks and Suspicious Activity DashboardThe Attacks and Suspicious Activity dashboard displays information using the following panels:
l Top Attackers: displays the top attackers IP addresses.
l Top Targets: displays the top target IP addresses
l By Time: displays attacks and suspicious activity by time.
l Top Events: displays the top reported suspicious and attacks events.
Administrator's GuideChapter 2: Dashboards
The Attacks and Suspicious Activity Dashboard Page 59 of 743
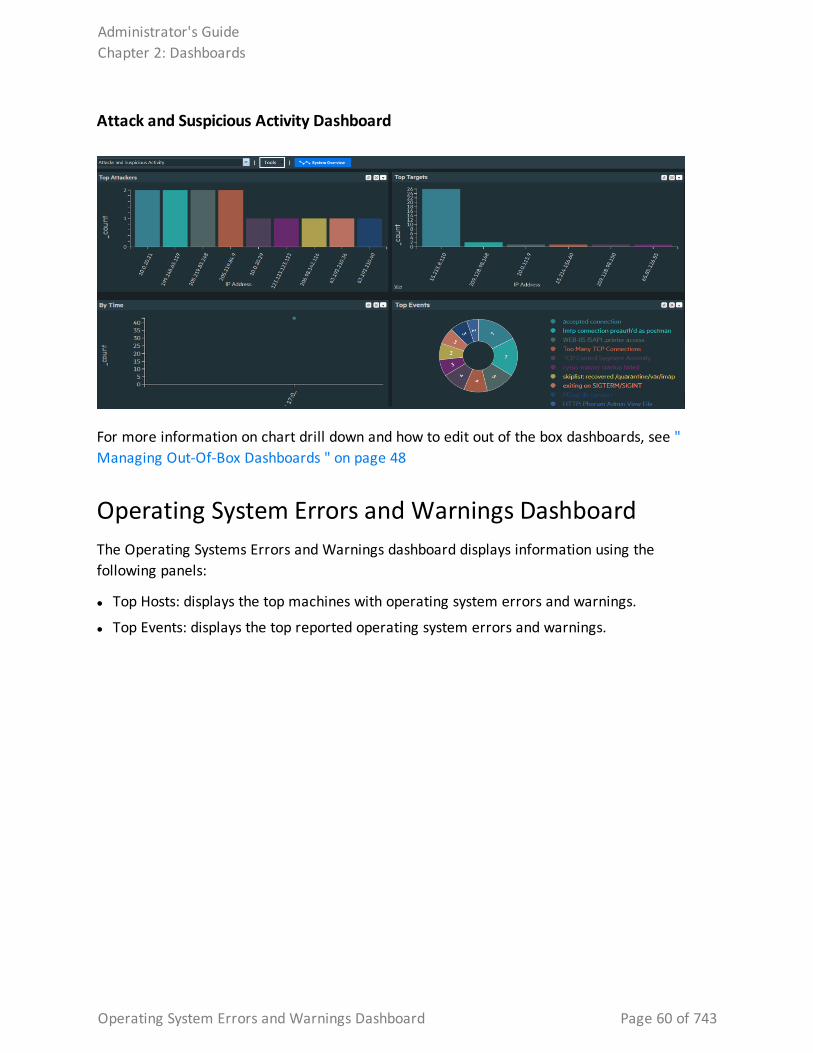
Attack and Suspicious Activity Dashboard
For more information on chart drill down and how to edit out of the box dashboards, see " Managing Out-Of-Box Dashboards " on page 48
Operating System Errors and Warnings Dashboard The Operating Systems Errors and Warnings dashboard displays information using the following panels:
l Top Hosts: displays the top machines with operating system errors and warnings.
l Top Events: displays the top reported operating system errors and warnings.
Administrator's GuideChapter 2: Dashboards
Operating System Errors and Warnings Dashboard Page 60 of 743
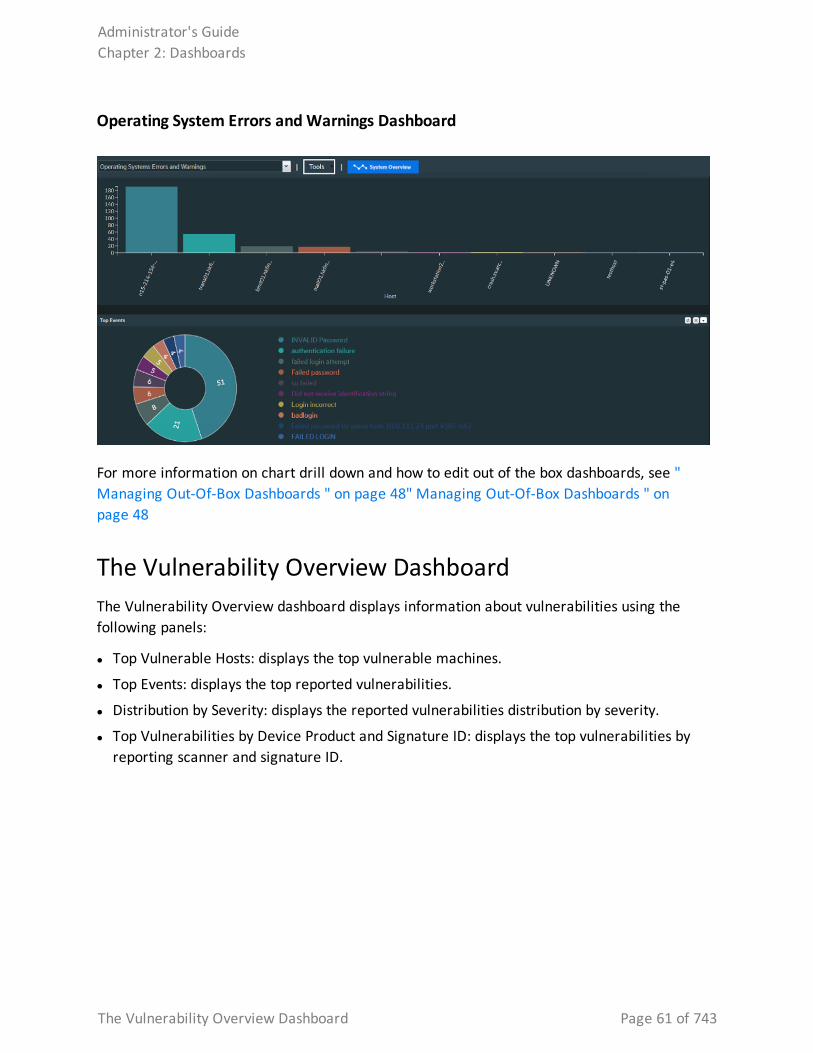
Operating System Errors and Warnings Dashboard
For more information on chart drill down and how to edit out of the box dashboards, see " Managing Out-Of-Box Dashboards " on page 48" Managing Out-Of-Box Dashboards " on page 48
The Vulnerability Overview Dashboard The Vulnerability Overview dashboard displays information about vulnerabilities using the following panels:
l Top Vulnerable Hosts: displays the top vulnerable machines.
l Top Events: displays the top reported vulnerabilities.
l Distribution by Severity: displays the reported vulnerabilities distribution by severity.
l Top Vulnerabilities by Device Product and Signature ID: displays the top vulnerabilities by reporting scanner and signature ID.
Administrator's GuideChapter 2: Dashboards
The Vulnerability Overview Dashboard Page 61 of 743
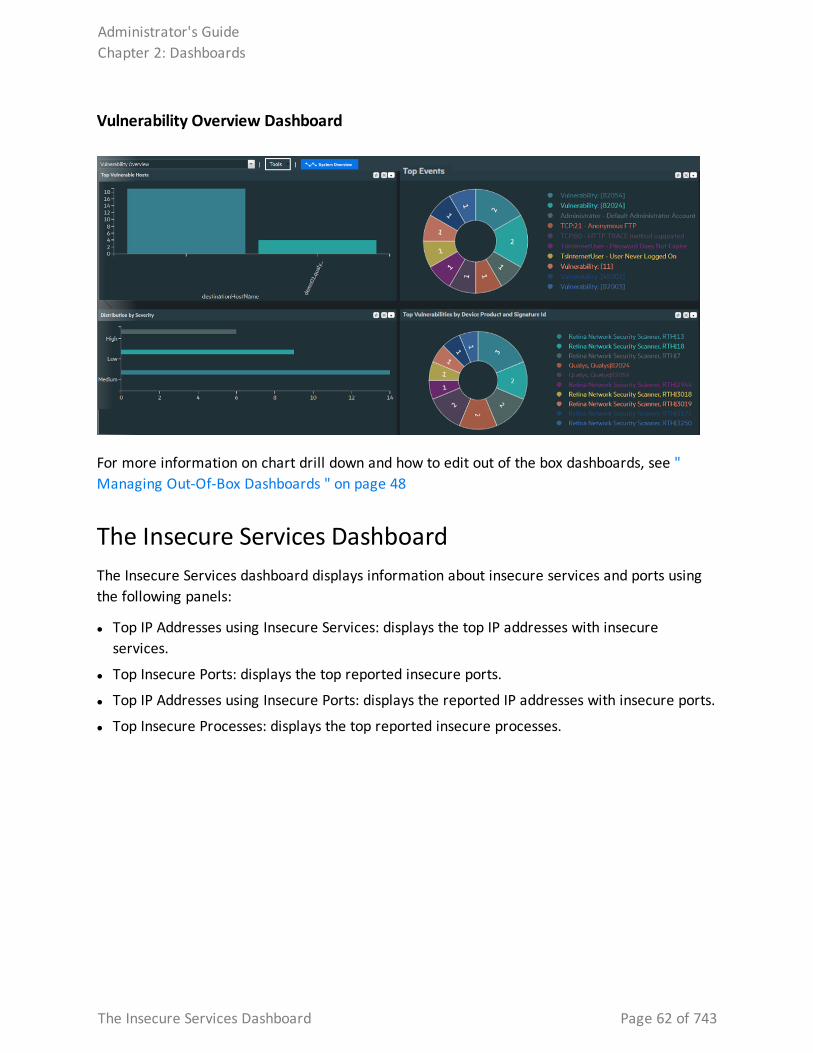
Vulnerability Overview Dashboard
For more information on chart drill down and how to edit out of the box dashboards, see " Managing Out-Of-Box Dashboards " on page 48
The Insecure Services Dashboard The Insecure Services dashboard displays information about insecure services and ports using the following panels:
l Top IP Addresses using Insecure Services: displays the top IP addresses with insecure services.
l Top Insecure Ports: displays the top reported insecure ports.
l Top IP Addresses using Insecure Ports: displays the reported IP addresses with insecure ports.
l Top Insecure Processes: displays the top reported insecure processes.
Administrator's GuideChapter 2: Dashboards
The Insecure Services Dashboard Page 62 of 743
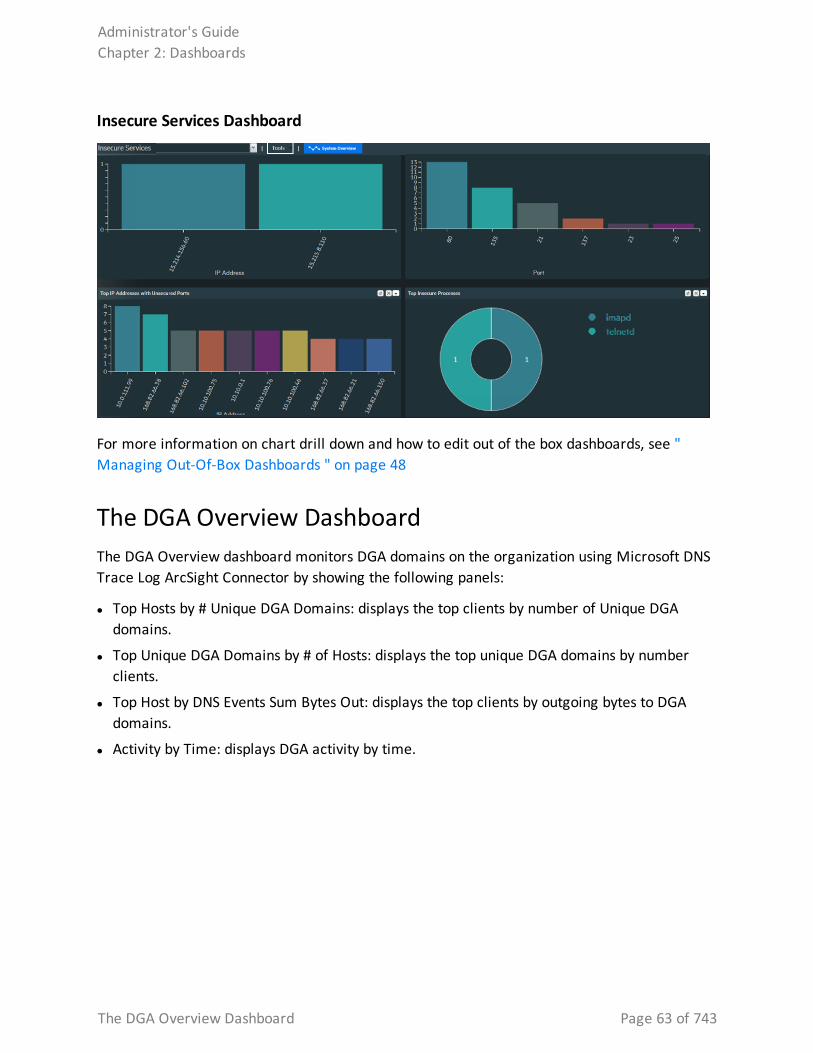
Insecure Services Dashboard
For more information on chart drill down and how to edit out of the box dashboards, see " Managing Out-Of-Box Dashboards " on page 48
The DGA Overview Dashboard The DGA Overview dashboard monitors DGA domains on the organization using Microsoft DNS Trace Log ArcSight Connector by showing the following panels:
l Top Hosts by # Unique DGA Domains: displays the top clients by number of Unique DGA domains.
l Top Unique DGA Domains by # of Hosts: displays the top unique DGA domains by number clients.
l Top Host by DNS Events Sum Bytes Out: displays the top clients by outgoing bytes to DGA domains.
l Activity by Time: displays DGA activity by time.
Administrator's GuideChapter 2: Dashboards
The DGA Overview Dashboard Page 63 of 743
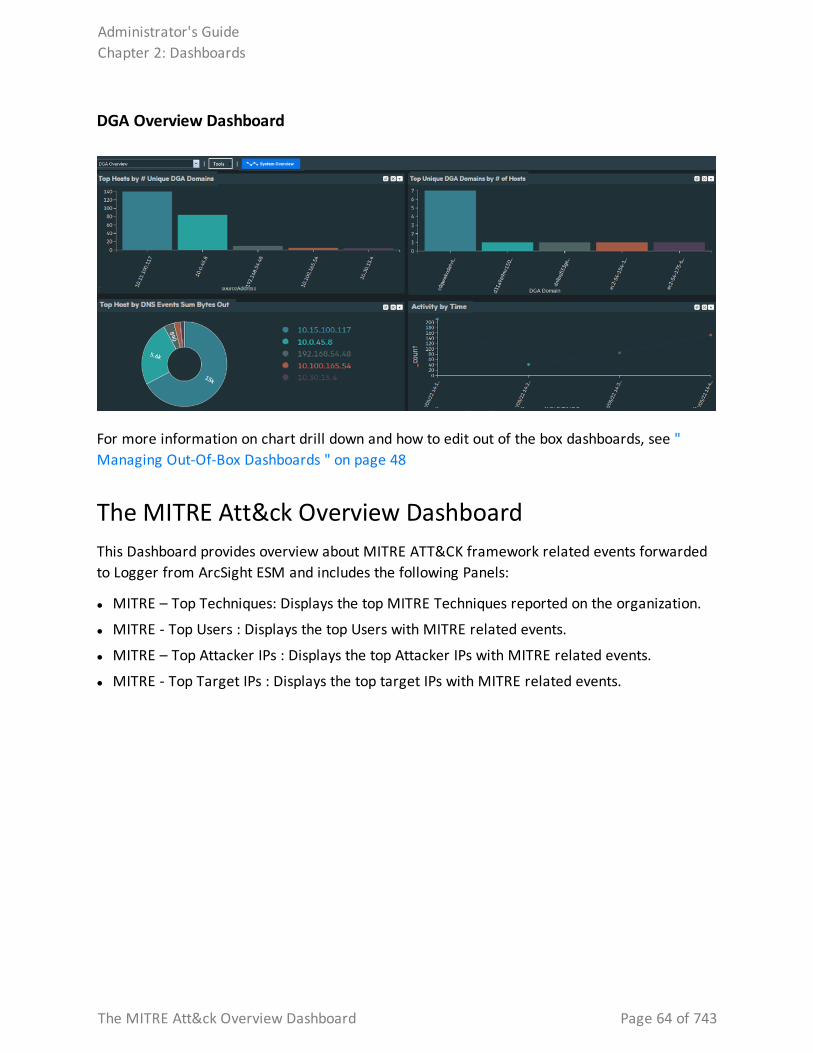
DGA Overview Dashboard
For more information on chart drill down and how to edit out of the box dashboards, see " Managing Out-Of-Box Dashboards " on page 48
The MITRE Att&ck Overview Dashboard This Dashboard provides overview about MITRE ATT&CK framework related events forwarded to Logger from ArcSight ESM and includes the following Panels:
l MITRE – Top Techniques: Displays the top MITRE Techniques reported on the organization.
l MITRE - Top Users : Displays the top Users with MITRE related events.
l MITRE – Top Attacker IPs : Displays the top Attacker IPs with MITRE related events.
l MITRE - Top Target IPs : Displays the top target IPs with MITRE related events.
Administrator's GuideChapter 2: Dashboards
The MITRE Att&ck Overview Dashboard Page 64 of 743
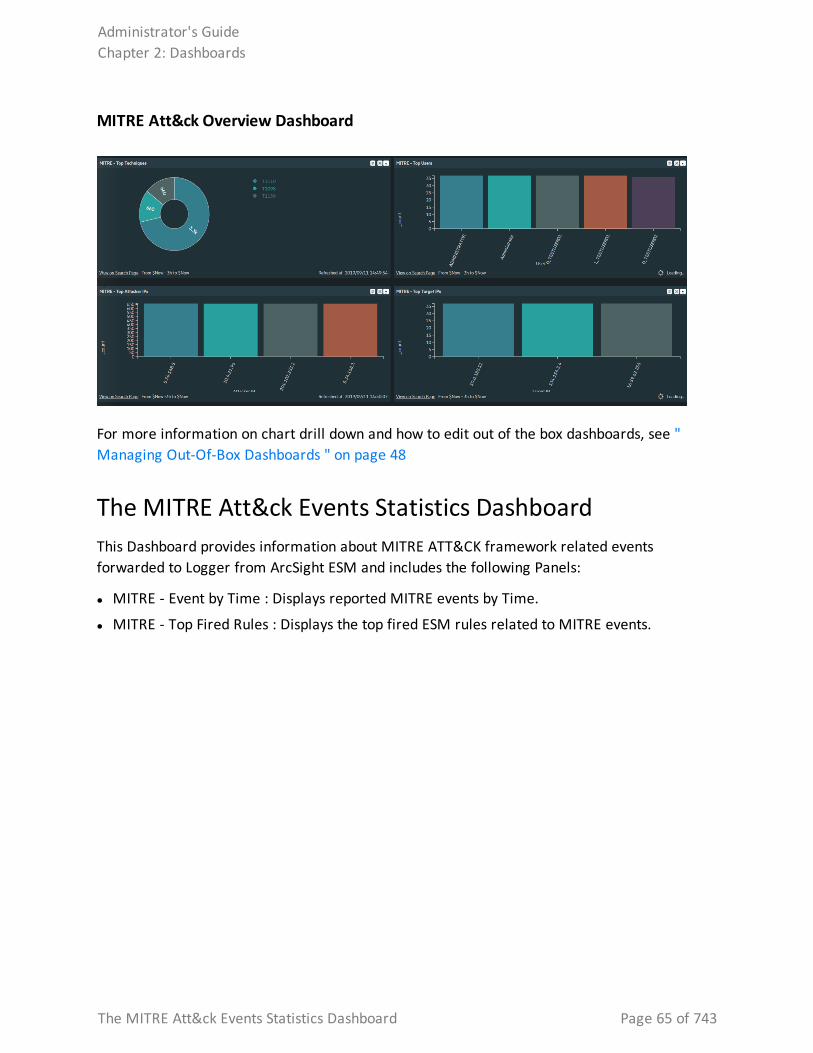
MITRE Att&ck Overview Dashboard
For more information on chart drill down and how to edit out of the box dashboards, see " Managing Out-Of-Box Dashboards " on page 48
The MITRE Att&ck Events Statistics Dashboard This Dashboard provides information about MITRE ATT&CK framework related events forwarded to Logger from ArcSight ESM and includes the following Panels:
l MITRE - Event by Time : Displays reported MITRE events by Time.
l MITRE - Top Fired Rules : Displays the top fired ESM rules related to MITRE events.
Administrator's GuideChapter 2: Dashboards
The MITRE Att&ck Events Statistics Dashboard Page 65 of 743
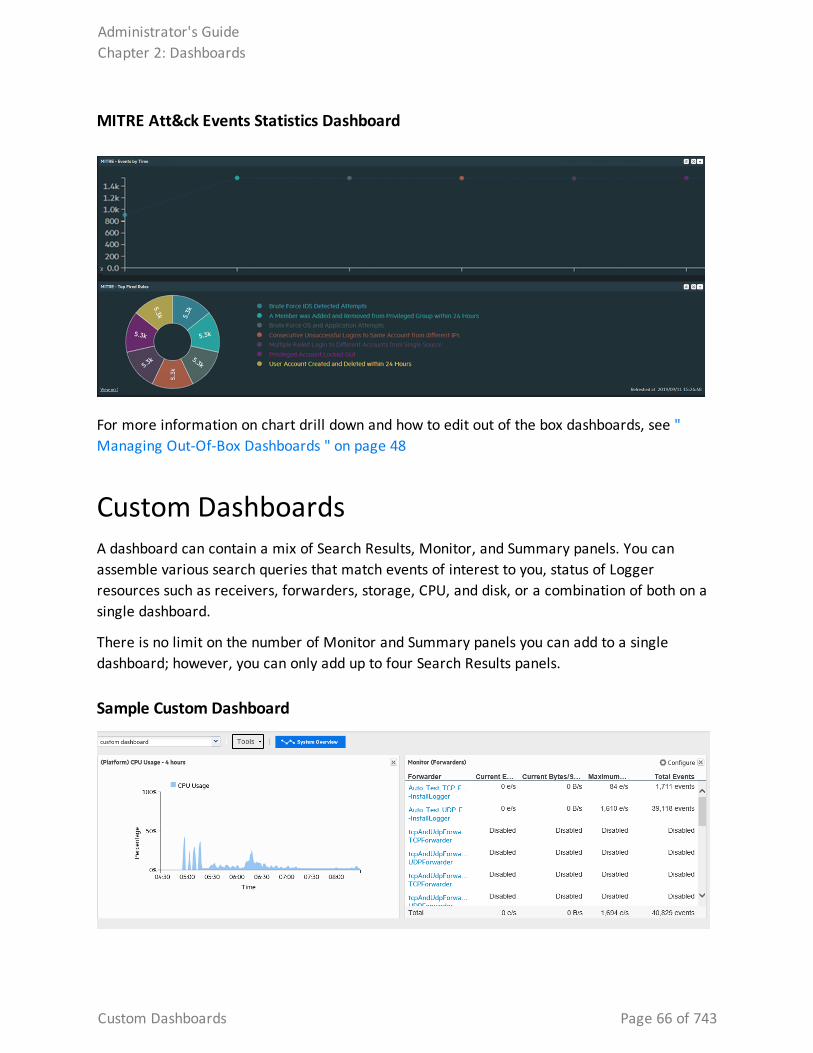
MITRE Att&ck Events Statistics Dashboard
For more information on chart drill down and how to edit out of the box dashboards, see " Managing Out-Of-Box Dashboards " on page 48
Custom DashboardsA dashboard can contain a mix of Search Results, Monitor, and Summary panels. You can assemble various search queries that match events of interest to you, status of Logger resources such as receivers, forwarders, storage, CPU, and disk, or a combination of both on a single dashboard.
There is no limit on the number of Monitor and Summary panels you can add to a single dashboard; however, you can only add up to four Search Results panels.
Sample Custom Dashboard
Administrator's GuideChapter 2: Dashboards
Custom Dashboards Page 66 of 743
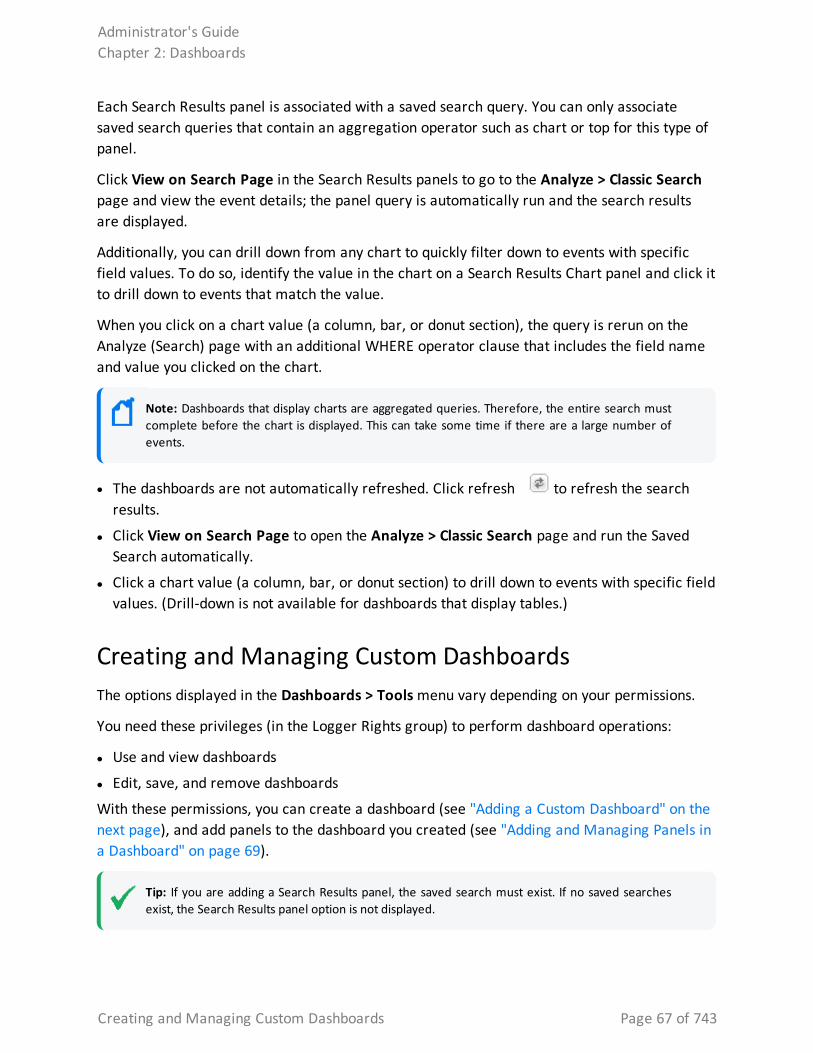
Each Search Results panel is associated with a saved search query. You can only associate saved search queries that contain an aggregation operator such as chart or top for this type of panel.
Click View on Search Page in the Search Results panels to go to the Analyze > Classic Search page and view the event details; the panel query is automatically run and the search results are displayed.
Additionally, you can drill down from any chart to quickly filter down to events with specific field values. To do so, identify the value in the chart on a Search Results Chart panel and click it to drill down to events that match the value.
When you click on a chart value (a column, bar, or donut section), the query is rerun on the Analyze (Search) page with an additional WHERE operator clause that includes the field name and value you clicked on the chart.
Note: Dashboards that display charts are aggregated queries. Therefore, the entire search must complete before the chart is displayed. This can take some time if there are a large number of events.
l The dashboards are not automatically refreshed. Click refresh to refresh the search results.
l Click View on Search Page to open the Analyze > Classic Search page and run the Saved Search automatically.
l Click a chart value (a column, bar, or donut section) to drill down to events with specific field values. (Drill-down is not available for dashboards that display tables.)
Creating and Managing Custom DashboardsThe options displayed in the Dashboards > Tools menu vary depending on your permissions.
You need these privileges (in the Logger Rights group) to perform dashboard operations:
l Use and view dashboards
l Edit, save, and remove dashboards
With these permissions, you can create a dashboard (see "Adding a Custom Dashboard" on the next page), and add panels to the dashboard you created (see "Adding and Managing Panels in a Dashboard" on page 69).
Tip: If you are adding a Search Results panel, the saved search must exist. If no saved searches exist, the Search Results panel option is not displayed.
Administrator's GuideChapter 2: Dashboards
Creating and Managing Custom Dashboards Page 67 of 743
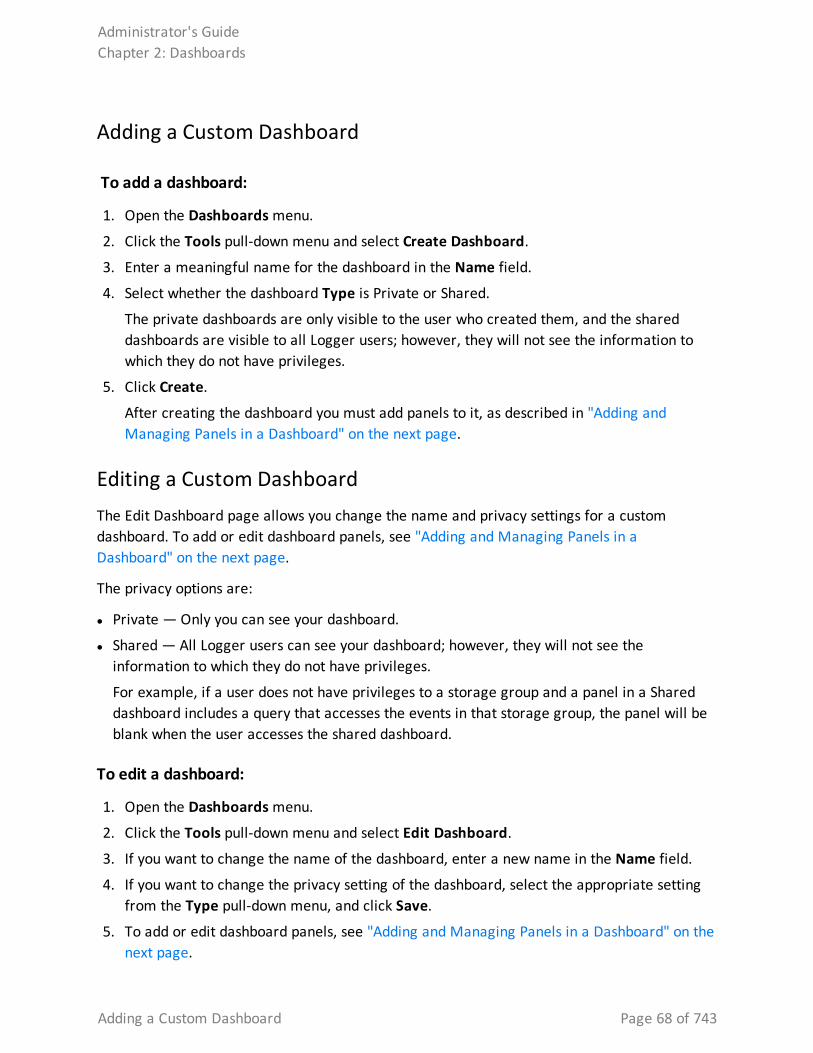
Adding a Custom Dashboard
To add a dashboard:
1. Open the Dashboards menu.
2. Click the Tools pull-down menu and select Create Dashboard.
3. Enter a meaningful name for the dashboard in the Name field.
4. Select whether the dashboard Type is Private or Shared.
The private dashboards are only visible to the user who created them, and the shared dashboards are visible to all Logger users; however, they will not see the information to which they do not have privileges.
5. Click Create.
After creating the dashboard you must add panels to it, as described in "Adding and Managing Panels in a Dashboard" on the next page.
Editing a Custom DashboardThe Edit Dashboard page allows you change the name and privacy settings for a custom dashboard. To add or edit dashboard panels, see "Adding and Managing Panels in a Dashboard" on the next page.
The privacy options are:
l Private — Only you can see your dashboard.
l Shared — All Logger users can see your dashboard; however, they will not see the information to which they do not have privileges.
For example, if a user does not have privileges to a storage group and a panel in a Shared dashboard includes a query that accesses the events in that storage group, the panel will be blank when the user accesses the shared dashboard.
To edit a dashboard:
1. Open the Dashboards menu.
2. Click the Tools pull-down menu and select Edit Dashboard.
3. If you want to change the name of the dashboard, enter a new name in the Name field.
4. If you want to change the privacy setting of the dashboard, select the appropriate setting from the Type pull-down menu, and click Save.
5. To add or edit dashboard panels, see "Adding and Managing Panels in a Dashboard" on the next page.
Administrator's GuideChapter 2: Dashboards
Adding a Custom Dashboard Page 68 of 743
Deleting a Custom Dashboard
To delete a dashboard:
1. Open the Dashboards menu.
2. Select the dashboard that you want to delete.
3. Click the Tools pull-down menu and select Delete Dashboard.
4. Click Yes to confirm your action in the confirmation message, or click No to exit without making a change.
Adding and Managing Panels in a DashboardAfter you create a dashboard, you need to add panels to display the information you want to see. A dashboard can contain a mix of Search Results, Monitor, and Summary panels. There is no limit on the number of Monitor and Summary panels you add to a single dashboard; however, you can only add up to four Search Results panels for optimum performance.
Before you can add panels to a dashboard, you must first create the dashboard. See "Creating and Managing Custom Dashboards" on page 67 for more information.
You can add the following types of panels:
l Search Results: Chart and Table
l Monitor: All four types available under the default Monitor dashboard
l Summary: All four types available under the default Summary dashboard and user-defined Summary panels.
Adding a Panel to a Dashboard
To add a panel to a dashboard:
1. Open the Dashboards menu.
2. Select the dashboard to which you want to add the panel.
3. Click the Tools pull-down menu and select Add Panel.
4. Configure these parameters and click Add.
Administrator's GuideChapter 2: Dashboards
Deleting a Custom Dashboard Page 69 of 743
Parameter Description
Type Select the type of panel:
l Search Results (Chart): Displays search results in a chart form.
l Search Results (Table): Displays search results in a table form.
l Monitor (Graph): Displays a graph of the selected resource.
l Monitor (Forwarders): Displays forwarder information in a table form.
l Monitor (Receivers): Displays receiver information in a table form.
l Monitor (Storage Groups): Displays storage group information in a table form.
l Summary (Agent Severities): Displays event summary categorized by agent severities configured on your Logger.
l Summary (Agent Types): Displays event summary categorized by receivers configured on your Logger.
l Summary (Receivers): Displays event summary categorized by receivers configured on your Logger.
l Summary (Devices): Displays event summary categorized by devices configured on your Logger.
l Summary (User Defined): Displays event summary categorized by the field you select when adding the panel.
Note: If no saved search queries exist on your Logger, the “Saved Search” panel types are not available as selections in the pull-down menu.
Title Enter a meaningful name for the panel.
A default name is present in this field, but you can change it.
Graph Only applicable to Monitor Graph panels.
Select the type of graph you want the panel to display. Some of the available options are CPU Usage - 4 hour, Platform Memory Usage - Daily, and Disk Read-Write - Weekly.
Saved Search Only applicable to Search panels.
Select the saved search query to use for searching events that will be displayed in the panel.
Administrator's GuideChapter 2: Dashboards
Adding a Panel to a Dashboard Page 70 of 743
Parameter Description
Chart Type Only applicable to Search Result Chart panels.
Type of chart to display matching events. You can select from:
Column, Bar, Donut, Area, Line, Stacked Column, Stacked Bar.
Default: Column
Chart Limit Only applicable to Search Result Chart panels.
Number of unique values to plot. Default: 10
Field Name Only applicable to Summary (User Defined) panels.
The event field name by which the event summary on a Summary panel will be categorized. Default: agentSeverity
Editing a Dashboard PanelOnce you add a panel to a dashboard, whether you can edit it depends on the type of panel. You can edit the Search Results panels and the user-defined Summary panels; the Monitor panels and some of the Summary panels are not editable.
The following table lists the panels you can edit and what you can edit in them.
Action Description
All Panels
Delete Removes a panel from a dashboard.
Search Result Panels
Edit Panel Change Title, associated saved search, Chart Type, or Chart Limit
Edit Saved Search Access the Edit Saved search page to edit the associated saved search query
View on Search Page
Runs the panel’s query on the Search Results page (Analyze > Classic Search) and displays matching events on that page
Refresh Refreshes the current contents of the panel.
Note: All other panel types are automatically refreshed; therefore, an explicit refresh is not required for them.
Summary Panels - User Defined
Edit Panel Change Title or field name by which events are categorized.
To edit a panel:
1. Open the Dashboards menu.
2. Select the dashboard that contains the panel you want to edit.
Administrator's GuideChapter 2: Dashboards
Editing a Dashboard Panel Page 71 of 743
3. If you are editing a user-defined Summary panel:
a. Click the Edit ( ) icon.
b. Edit the title, field name, or both.
4. If you are editing a Search Result panel:
a. Click the ( ) icon.
b. Select Edit Panel if you want to edit the panel title, select a different saved search; or, if applicable, chart type or chart limit.
c. Select Edit Saved Search if you want to access the Edit Saved Search page (Configuration | Search > Saved Searches) to edit the saved search query.
5. Click Save.
Deleting a Dashboard Panel
To delete a panel from a dashboard:
You cannot delete panels from the default Monitor dashboard or the default Summary dashboard. However, Monitor and Summary panels added to the dashboards you created under the Dashboards menu option can be deleted.
1. Open the Dashboards menu.
2. Select the dashboard that contains the panel you want to delete.
3. Click the ( ) icon.
4. Click Yes to confirm your action in the confirmation message, or click No to exit without making a change.
Changing the Layout of a Dashboard
To change the layout of a dashboard:
You can only change the layout of the dashboards you create. The Monitor dashboard layout cannot be changed.
1. Open the Dashboards menu.
2. Select the dashboard that contains the panel you want to rearrange.
3. Click the Tools pull-down menu and select Change Layout.
4. Point your cursor in the blue band that shows the panel title and drag the panel to a different position.
5. Click Save after you rearrange the panels.
Administrator's GuideChapter 2: Dashboards
Deleting a Dashboard Panel Page 72 of 743
Setting a Default DashboardWhen you set a dashboard as default, it is the default dashboard screen that displays when you navigate to the Dashboards menu. This setting is user-specific; therefore, your default dashboard can be different from that of another user.
The Summary page (accessible from the Summary navigation option in the top-level menu bar) is the default home page for all Logger users. That is, unless another page has been selected as your home page, the Summary page is displayed when you first log in.
You can configure Logger to display a specific dashboard as your home page, including one your created.
To select a specific dashboard as your home page:
1. Select the Dashboard option when configuring the Personal Default start page for <username>, following the instructions in "Logger Options and Logout" on page 39.
2. Open the Dashboards menu.
3. Select the dashboard that you want to configure as default.
4. Click the Tools pull-down menu and select Select as Default.
5. Click Yes to confirm your action in the confirmation message, or click No to exit without making a change.
Administrator's GuideChapter 2: Dashboards
Setting a Default Dashboard Page 73 of 743
Chapter 3: Searching and Analyzing EventsWhen you want to analyze events matching specific criteria, include them in a report, or forward them to another system such as ArcSight ESM, you need to search for them. To search for events, you create queries. The queries you create can vary in complexity based on your needs. Queries can be simple search terms or they can be complex enough to match events that include multiple IP addresses or ports, and that occurred between specific time ranges from a specific storage group.
The following topics describe how to search for specific events in Logger using the search pages. They discuss the methods available for search, how to query for events, how to save a defined query and the events that the query finds for future use. They also describe how to set up alerts to notify particular users when Logger receives events that match specified criteria.
Important: The Classic Search page has been deprecated on this release. Micro Focus recommends using the equivalent function on the Search page to conduct your searches instead.
The Process of Searching EventsThe search process uses an optimized search language that allows you to specify multiple search commands in a pipeline format. In addition, you can customize the display of search results, view search results as charts, and so on.
The most straightforward way to run a search is to enter the keywords or information you are searching for (the query) in the Search text box, select the time range, and click Go! You can enter a simple keyword, such as, hostA.companyxyz.com or a complex query that includes Boolean expressions, keywords, fields, and regular expressions. The system searches for data that matches the criteria you specified and displays the results in color-coded columns indicating its index status. For more information, see "Understanding Search Field Colors" on the next page.
The search results are displayed in the table and as a histogram as soon as they are returned, even if the query has not finished scanning all data. The Dashboard page displays any searches in progress, as well as completed searches that have not yet expired. You can also add a chart to your search to display the most important information in a more meaningful fashion. Charts are not displayed until all the data is returned.
There are several convenient ways to enter a search query. You can type the query in the Search text box, click a field in the current search results, or use a previously saved query (referred to as a filter or saved search).
Chapter 3: Searching and Analyzing Events Page 74 of 743
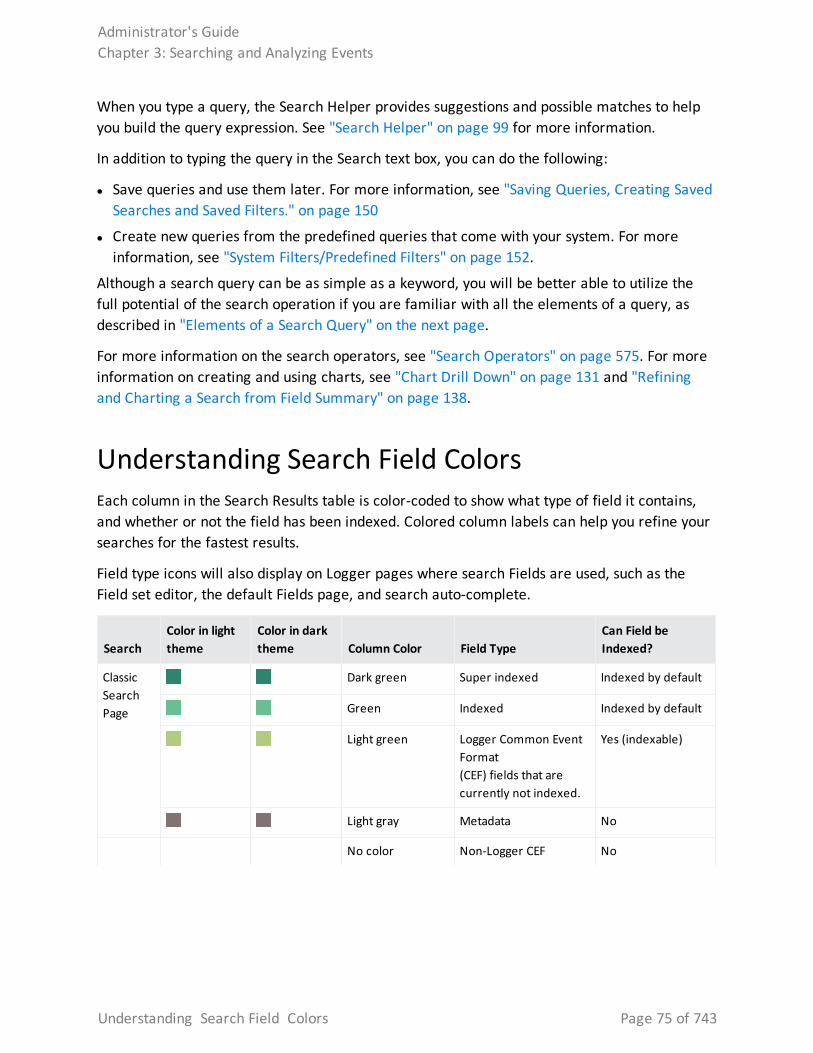
When you type a query, the Search Helper provides suggestions and possible matches to help you build the query expression. See "Search Helper" on page 99 for more information.
In addition to typing the query in the Search text box, you can do the following:
l Save queries and use them later. For more information, see "Saving Queries, Creating Saved Searches and Saved Filters." on page 150
l Create new queries from the predefined queries that come with your system. For more information, see "System Filters/Predefined Filters" on page 152.
Although a search query can be as simple as a keyword, you will be better able to utilize the full potential of the search operation if you are familiar with all the elements of a query, as described in "Elements of a Search Query" on the next page.
For more information on the search operators, see "Search Operators" on page 575. For more information on creating and using charts, see "Chart Drill Down" on page 131 and "Refining and Charting a Search from Field Summary" on page 138.
Understanding Search Field ColorsEach column in the Search Results table is color-coded to show what type of field it contains, and whether or not the field has been indexed. Colored column labels can help you refine your searches for the fastest results.
Field type icons will also display on Logger pages where search Fields are used, such as the Field set editor, the default Fields page, and search auto-complete.
Search Color in light theme
Color in dark theme Column Color Field Type
Can Field be Indexed?
Classic Search Page
Dark green Super indexed Indexed by default
Green Indexed Indexed by default
Light green Logger Common Event Format (CEF) fields that are currently not indexed.
Yes (indexable)
Light gray Metadata No
No color Non-Logger CEF No
Administrator's GuideChapter 3: Searching and Analyzing Events
Understanding Search Field Colors Page 75 of 743
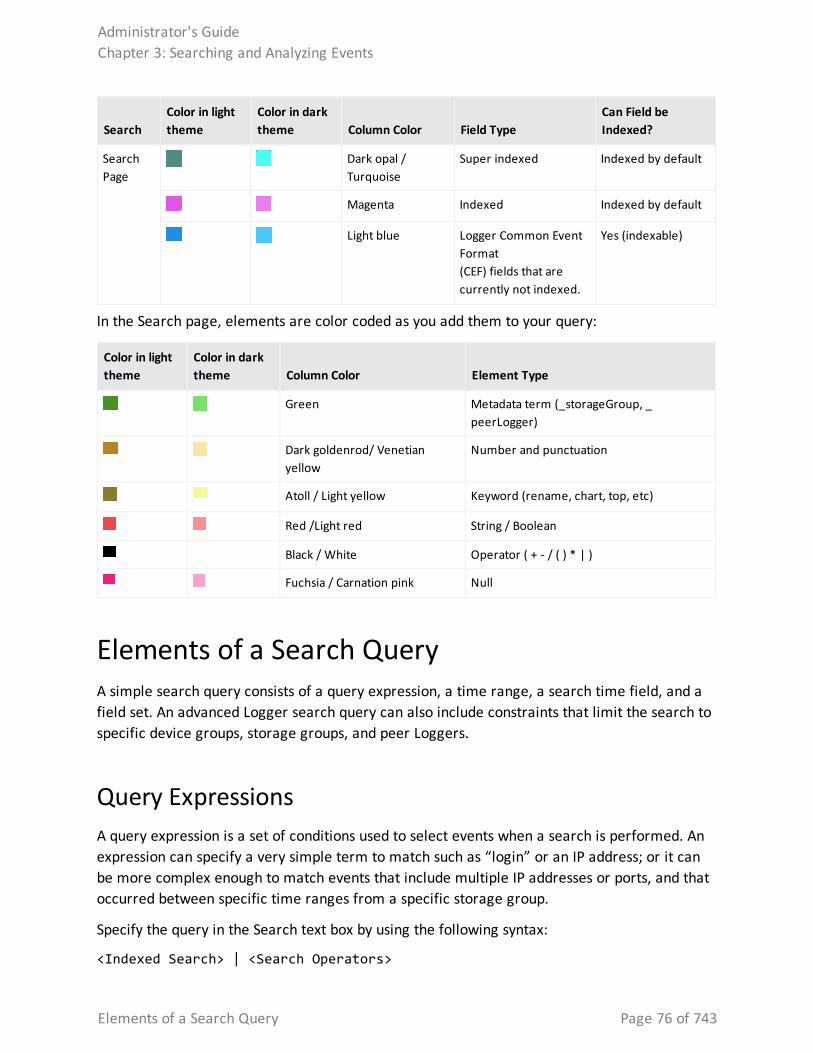
Search Color in light theme
Color in dark theme Column Color Field Type
Can Field be Indexed?
Search Page
Dark opal / Turquoise
Super indexed Indexed by default
Magenta Indexed Indexed by default
Light blue Logger Common Event Format (CEF) fields that are currently not indexed.
Yes (indexable)
In the Search page, elements are color coded as you add them to your query:
Color in light theme
Color in dark theme Column Color Element Type
Green Metadata term (_storageGroup, _peerLogger)
Dark goldenrod/ Venetian yellow
Number and punctuation
Atoll / Light yellow Keyword (rename, chart, top, etc)
Red /Light red String / Boolean
Black / White Operator ( + - / ( ) * | )
Fuchsia / Carnation pink Null
Elements of a Search QueryA simple search query consists of a query expression, a time range, a search time field, and a field set. An advanced Logger search query can also include constraints that limit the search to specific device groups, storage groups, and peer Loggers.
Query ExpressionsA query expression is a set of conditions used to select events when a search is performed. An expression can specify a very simple term to match such as “login” or an IP address; or it can be more complex enough to match events that include multiple IP addresses or ports, and that occurred between specific time ranges from a specific storage group.
Specify the query in the Search text box by using the following syntax:
<Indexed Search> | <Search Operators>
Administrator's GuideChapter 3: Searching and Analyzing Events
Elements of a Search Query Page 76 of 743
The query expression is evaluated from left to right in a pipeline fashion. First, events matching the specified Indexed Search portion of the query are found. The search operator after the first pipe (|) character is then applied to the matched events followed by the next search operator, and so on to further refine the search results.
The search results table and the histogram display the events that match the query as they are found. As additional events are matched, the search results table and the histogram are refreshed. Aggregation operators such as HEAD and TAIL, require a query to finish running before search results can be displayed. See "Search Operators" on page 575 for more information.
l The indexed search section of the query is described in "Indexed Search Portion of a Query" below.
l The search operator portion of the query is described in "Search Operator Portion of a Query" below.
l Additional points to take into consideration when writing queries are described in "About Building Search Queries" on page 112.
Search Operator Portion of a QueryThe Search Operators portion of the query enables you to further refine the data that matched the indexed search filter. See "Search Operators" on page 575 for a complete list of search operators and examples of how to use them.
The rex search operator is useful for syslog events (raw or unstructured data) or if you want to extract information from a specific point in an event, such as the 15th character in an event. Other operators such as head, tail, top, rare, chart, sort, fields, and eval are applied to the fields you specify or the information you extract using the rex operator.
Indexed Search Portion of a QueryThe Indexed Search section of the query uses fields to search for relevant data quickly and efficiently. You can use a search expression to specify keywords to search for in the event text or to search using field-based expressions in a Boolean format.
Keyword Search (Full-text Search)
Keywords are simply the words you want to search for, such as failed, login, and so on. You can specify multiple keywords in one query expression by using Boolean operators (AND, OR, or NOT) between them. Boolean expressions can be nested, for example, (John OR Jane) AND Doe*. If you need to search for the literal occurrence of AND, OR, or NOT (in upper-, lower-, or
Administrator's GuideChapter 3: Searching and Analyzing Events
Search Operator Portion of a Query Page 77 of 743
mixed case), enclose them in double quotes (“ ”) so the search engine does not interpret them as operators.
Note: Although the Boolean operators AND , OR , and NOT can be specified in upper-, lower-, or mixed case when used as an operator, Micro Focus recommends that you use uppercase for ease of reading the query.
Guidelines for Writing Keyword Search Expressions
Follow these guidelines when specifying keyword search expressions:
l Follow the requirements described in "Syntax Reference for Query Expressions" on page 85.
l Addition points to take into consideration when writing queries are described in "About Building Search Queries" on page 112.
l Keyword search is not case sensitive.
l Use Boolean operators (AND, OR, or NOT) to connect multiple keywords. If no Boolean operator is specified between two keywords, the AND operator is applied by default. Also, use the Boolean operators to connect keywords to fields you specify.
l Use double quotes (“ ”) to enclose a single word for an exact match. Otherwise, the word is treated as <search string>*. For example, to search for log, type “log”. If you type log (without the double quotes), the search will match all words that begin with log; for example, log, logger, logging, and so on.
l When specifying Boolean operators (AND, OR, or NOT) as keywords, enclose them in double quotes (“ ”). For example, “AND”.
. l Use the backslash (\) as an escape character for \, “, and *. However, the backslash will not
escape these characters if the keyword is enclosed in double quotes.
Administrator's GuideChapter 3: Searching and Analyzing Events
Keyword Search (Full-text Search) Page 78 of 743
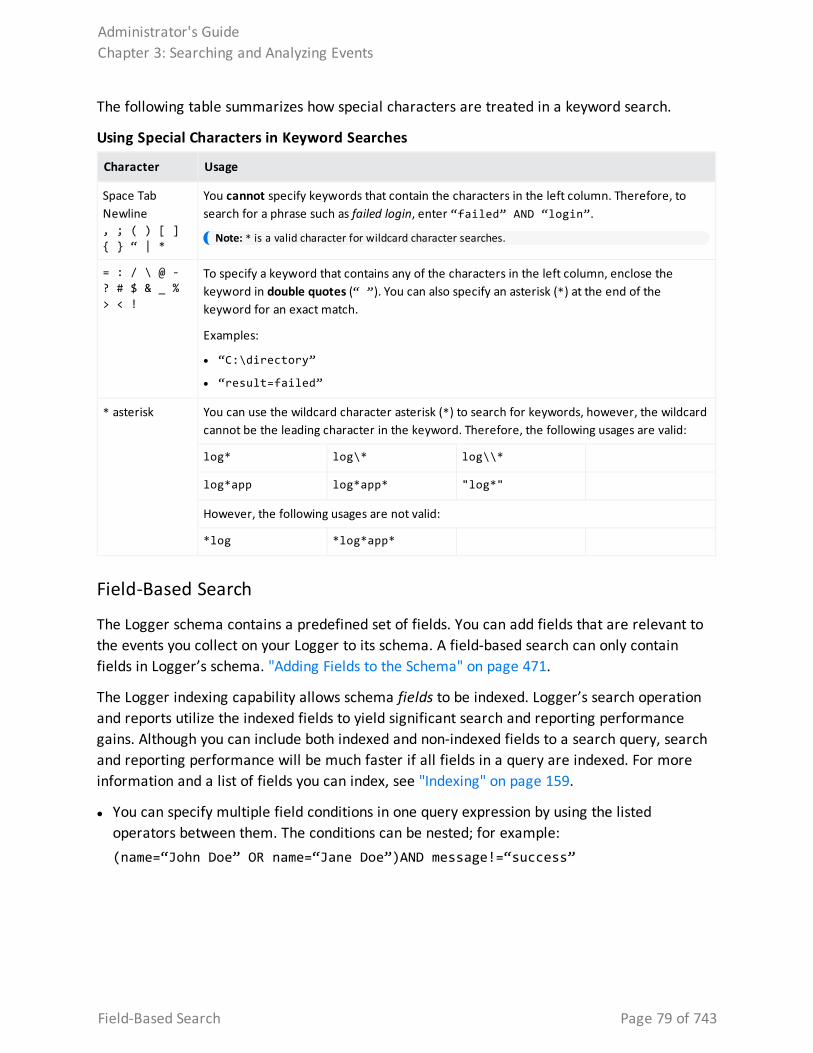
The following table summarizes how special characters are treated in a keyword search.
Character Usage
Space Tab Newline, ; ( ) [ ] { } “ | *
You cannot specify keywords that contain the characters in the left column. Therefore, to search for a phrase such as failed login, enter “failed” AND “login”.
Note: * is a valid character for wildcard character searches.
= : / \ @ - ? # $ & _ % > < !
To specify a keyword that contains any of the characters in the left column, enclose the keyword in double quotes (“ ”). You can also specify an asterisk (*) at the end of the keyword for an exact match.
Examples:
l “C:\directory”
l “result=failed”
* asterisk You can use the wildcard character asterisk (*) to search for keywords, however, the wildcard cannot be the leading character in the keyword. Therefore, the following usages are valid:
log* log\* log\\*
log*app log*app* "log*"
However, the following usages are not valid:
*log *log*app*
Using Special Characters in Keyword Searches
Field-Based Search
The Logger schema contains a predefined set of fields. You can add fields that are relevant to the events you collect on your Logger to its schema. A field-based search can only contain fields in Logger’s schema. "Adding Fields to the Schema" on page 471.
The Logger indexing capability allows schema fields to be indexed. Logger’s search operation and reports utilize the indexed fields to yield significant search and reporting performance gains. Although you can include both indexed and non-indexed fields to a search query, search and reporting performance will be much faster if all fields in a query are indexed. For more information and a list of fields you can index, see "Indexing" on page 159.
l You can specify multiple field conditions in one query expression by using the listed operators between them. The conditions can be nested; for example:(name=“John Doe” OR name=“Jane Doe”)AND message!=“success”
Administrator's GuideChapter 3: Searching and Analyzing Events
Field-Based Search Page 79 of 743
Note: If a query includes the Boolean operator OR and the metadata identifiers (discussed in "Constraints" on page 91 ), the expression to be evaluated with OR must be enclosed in parentheses, as shown in this example:
(success OR fail) _storageGroup IN [“Default Storage Group”]
If the expression is not enclosed in parentheses, an error message displays.
l Any literal operator in the table can be specified in upper-, lower-, or mixed case. To search for these words as literals in events, enclose them in double quotes (“”). For example:message CONTAINS “Between”
l To determine the data type of a field, see "Default Fields" on page 340.
l To determine the size of a custom field, see "Custom Fields" on page 341.
Field-Based Search Expression Guidelines
Follow these guidelines when specifying field-based search expressions:
l Follow the requirements described in "Syntax Reference for Query Expressions" on page 85.
l Addition points to take into consideration when writing queries are described in "About Building Search Queries" on page 112.
l For faster searches, follow the recommendations in "Searching for Rare Field Values" on page 113
l By default, field-based search is case sensitive. You can change the sensitivity from the Field Search Options section of the Configuration > Search > Search Options page. For more information, see "Global Search Options" on page 333.
l You can specify any predefined Logger schema field. For example, cat = /Monitor/CPU/Usage. For a complete list, see "Indexing" on page 159.
l You can specify any custom field you have added to the schema. For example, SSN=333-333-3333. For more information about custom schema fields, see "Adding Fields to the Schema" on page 471.
l You cannot specify user-defined fields created through a predefined or user-defined parser in the Indexed Search portion of a query. (The Indexed Search portion of a query is the expression before the first pipeline character.)
A query expression (Indexed Search | Search Operators) is evaluated from left to right in a pipeline fashion. By design, a parser—predefined or user-defined—is applied to an event when the Search Operators are processed in a search query. Therefore, field creation when a parser is applied to an event occurs later than the Indexed Search stage. As a result, you cannot specify these fields in a field-based search query.
For example, the Apache Access Log parser creates the field SourceHost. You cannot specify the following query expression:
Administrator's GuideChapter 3: Searching and Analyzing Events
Field-Based Search Expression Guidelines Page 80 of 743
SourceHost=“192.0.2.0”
However, you can use this field after the first pipeline, as shown in this example.
| where SourceHost=“192.0.2.0”
Or, if you want to search only the Apache Access Logs for SourceHost=“192.0.2.0”, you can specify this expression:
| where parser=“Apache Access Log” and clientIP=“192.0.2.0”
Additionally, you can run a full-text (keyword) search on “192.0.2.0”, as follows:
“123.456.789” | where SourceHost=“192.0.2.0”
l If an event field contains data of an unexpected type (for example, a string when an integer is expected), the data is ignored. Therefore, search for that data value will not yield any results. For example, if the port field contains a value 8080A (alphanumeric) instead of 8080 (numeric), the alphanumeric value is ignored. The data types of the schema fields are available from the Configuration > Search > Default Fields page. For more information on how to view this information, see "Default Fields" on page 340.
l For optimal search performance, make sure that event fields on ALL peers are indexed for the time range specified in a query. If an event field is indexed on one system but not on its peers for a specific time range, a distributed search will run slower on the peers. However, it will run at optimal speed on the local system. Therefore, the search performance in such a setup will be slow.
l For faster report generation, ALL fields of a report (including the fields being displayed in the report) need to be indexed. That is, in addition to the fields in the WHERE clause of the query, the fields in the SELECT clause also need to be indexed.
Field Based Search Operators
The field operators you can use in a query expression are listed in the table below. In addition to the field operators, you can use search operators, as discussed in "Search Operator Portion of a Query" on page 77.
Operator Example Notes
AND name=“Data List” AND message=“Hello” AND 1.2.3.4
Valid for all data types.
OR (name=“TestEvent” OR message=“Hello”) AND type=2 AND 1.2.4.3
Valid for all data types.
Field-Based Search Operators
Administrator's GuideChapter 3: Searching and Analyzing Events
Field Based Search Operators Page 81 of 743
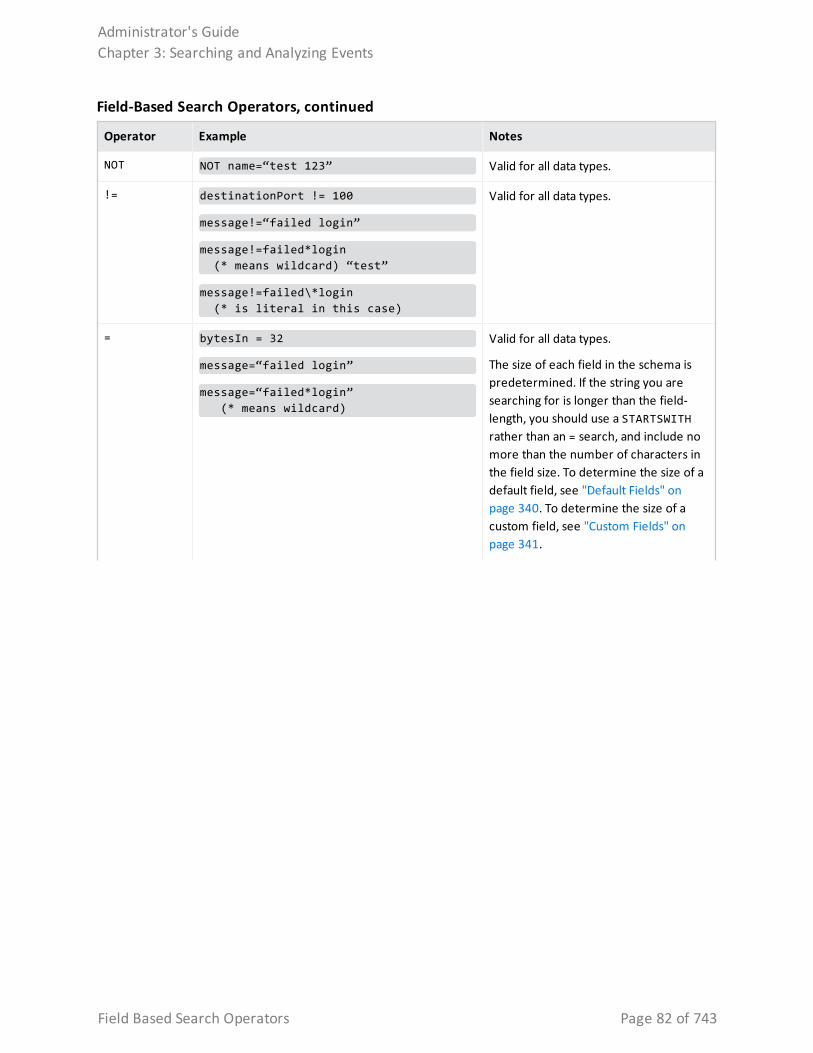
Operator Example Notes
NOT NOT name=“test 123” Valid for all data types.
!= destinationPort != 100
message!=“failed login”
message!=failed*login (* means wildcard) “test”
message!=failed\*login (* is literal in this case)
Valid for all data types.
= bytesIn = 32
message=“failed login”
message=“failed*login” (* means wildcard)
Valid for all data types.
The size of each field in the schema is predetermined. If the string you are searching for is longer than the field-length, you should use a STARTSWITH rather than an = search, and include no more than the number of characters in the field size. To determine the size of a default field, see "Default Fields" on page 340. To determine the size of a custom field, see "Custom Fields" on page 341.
Field-Based Search Operators, continued
Administrator's GuideChapter 3: Searching and Analyzing Events
Field Based Search Operators Page 82 of 743
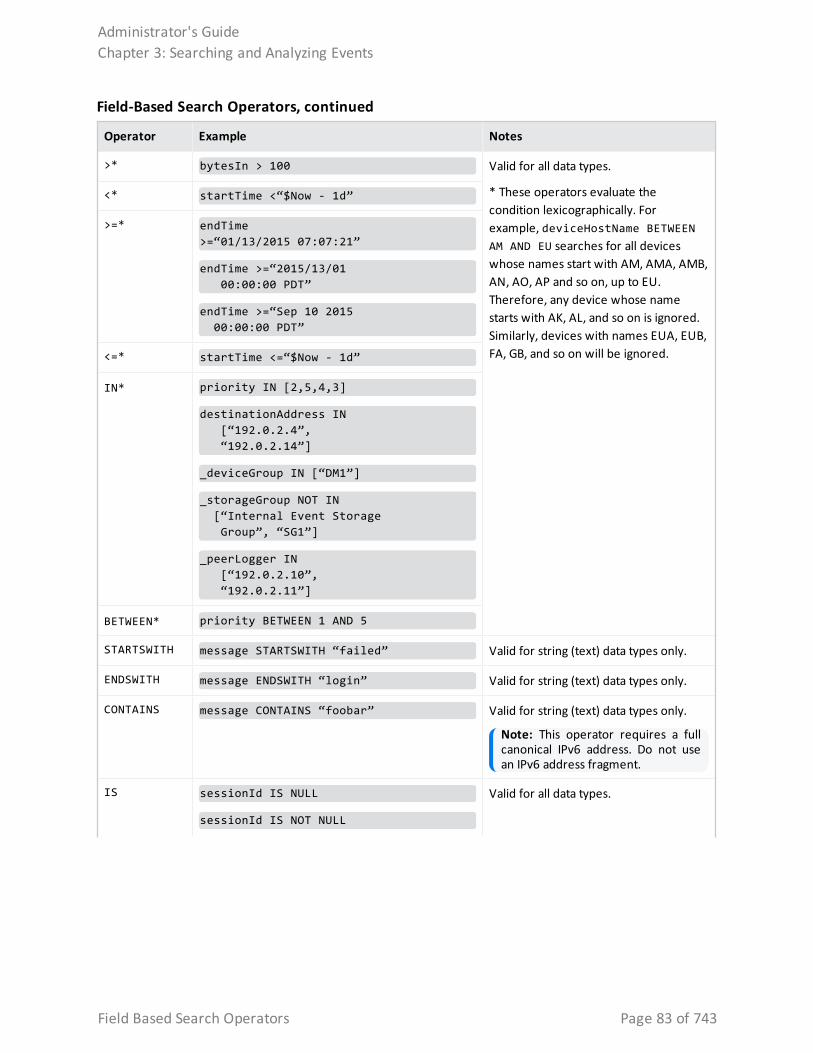
Operator Example Notes
>* bytesIn > 100 Valid for all data types.
* These operators evaluate the condition lexicographically. For example, deviceHostName BETWEEN AM AND EU searches for all devices whose names start with AM, AMA, AMB, AN, AO, AP and so on, up to EU. Therefore, any device whose name starts with AK, AL, and so on is ignored. Similarly, devices with names EUA, EUB, FA, GB, and so on will be ignored.
<* startTime <“$Now - 1d”
>=* endTime >=“01/13/2015 07:07:21”
endTime >=“2015/13/01 00:00:00 PDT”
endTime >=“Sep 10 2015 00:00:00 PDT”
<=* startTime <=“$Now - 1d”
IN* priority IN [2,5,4,3]
destinationAddress IN [“192.0.2.4”, “192.0.2.14”]
_deviceGroup IN [“DM1”]
_storageGroup NOT IN [“Internal Event Storage Group”, “SG1”]
_peerLogger IN [“192.0.2.10”, “192.0.2.11”]
BETWEEN* priority BETWEEN 1 AND 5
STARTSWITH message STARTSWITH “failed” Valid for string (text) data types only.
ENDSWITH message ENDSWITH “login” Valid for string (text) data types only.
CONTAINS message CONTAINS “foobar” Valid for string (text) data types only.
Note: This operator requires a full canonical IPv6 address. Do not use an IPv6 address fragment.
IS sessionId IS NULL
sessionId IS NOT NULL
Valid for all data types.
Field-Based Search Operators, continued
Administrator's GuideChapter 3: Searching and Analyzing Events
Field Based Search Operators Page 83 of 743
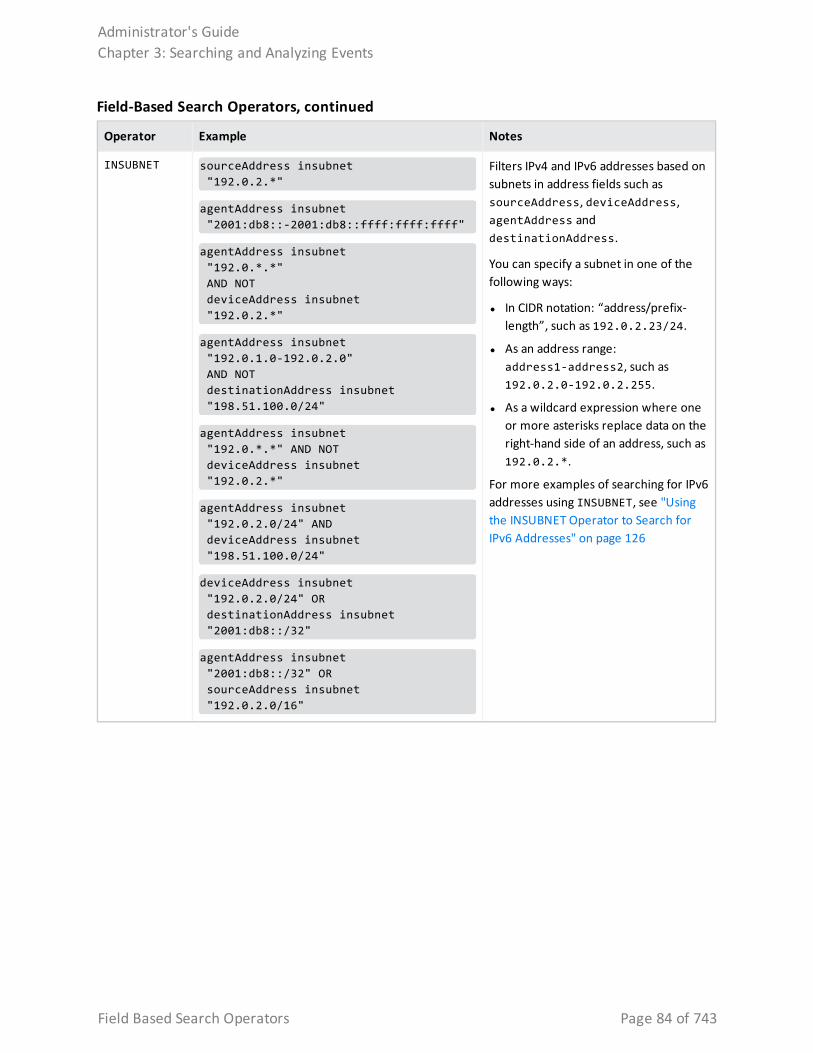
Operator Example Notes
INSUBNET sourceAddress insubnet "192.0.2.*"
agentAddress insubnet "2001:db8::-2001:db8::ffff:ffff:ffff"
agentAddress insubnet "192.0.*.*" AND NOT deviceAddress insubnet "192.0.2.*"
agentAddress insubnet "192.0.1.0-192.0.2.0" AND NOT destinationAddress insubnet "198.51.100.0/24"
agentAddress insubnet "192.0.*.*" AND NOT deviceAddress insubnet "192.0.2.*"
agentAddress insubnet "192.0.2.0/24" AND deviceAddress insubnet "198.51.100.0/24"
deviceAddress insubnet "192.0.2.0/24" OR destinationAddress insubnet "2001:db8::/32"
agentAddress insubnet "2001:db8::/32" OR sourceAddress insubnet "192.0.2.0/16"
Filters IPv4 and IPv6 addresses based on subnets in address fields such as sourceAddress, deviceAddress, agentAddress and destinationAddress.
You can specify a subnet in one of the following ways:
l In CIDR notation: “address/prefix-length”, such as 192.0.2.23/24.
l As an address range: address1-address2, such as 192.0.2.0-192.0.2.255.
l As a wildcard expression where one or more asterisks replace data on the right-hand side of an address, such as 192.0.2.*.
For more examples of searching for IPv6 addresses using INSUBNET, see "Using the INSUBNET Operator to Search for IPv6 Addresses" on page 126
Field-Based Search Operators, continued
Administrator's GuideChapter 3: Searching and Analyzing Events
Field Based Search Operators Page 84 of 743
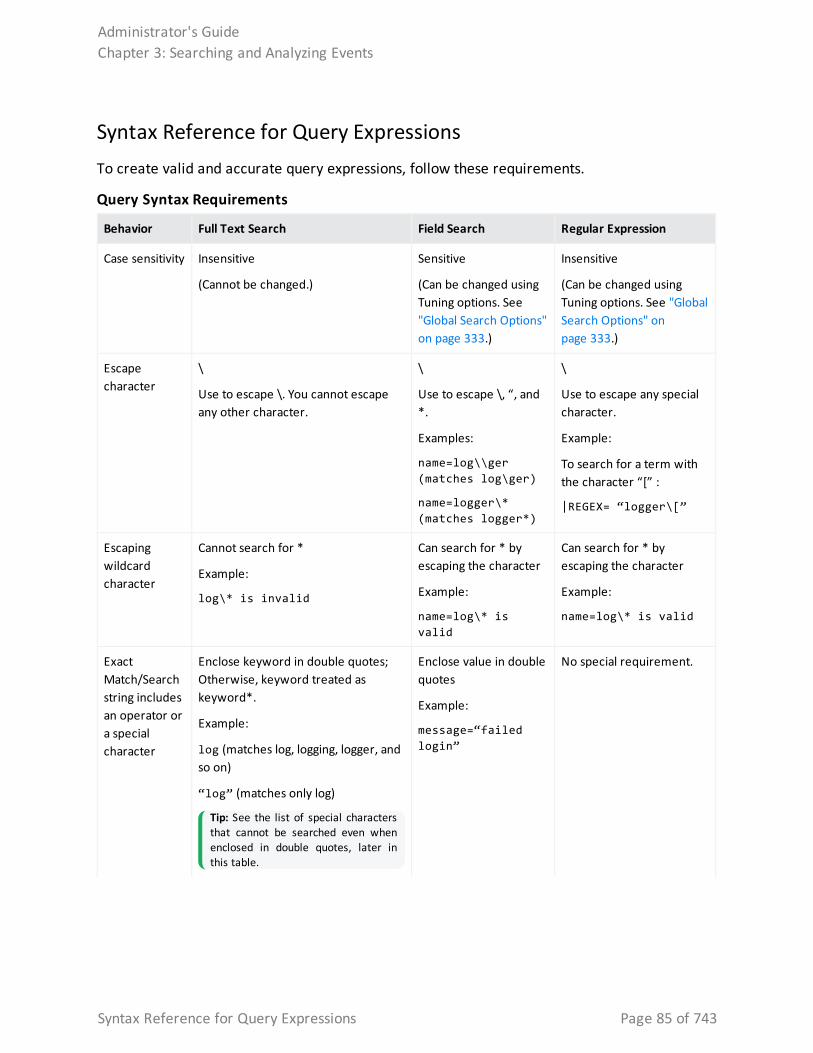
Syntax Reference for Query ExpressionsTo create valid and accurate query expressions, follow these requirements.
Behavior Full Text Search Field Search Regular Expression
Case sensitivity Insensitive
(Cannot be changed.)
Sensitive
(Can be changed using Tuning options. See "Global Search Options" on page 333.)
Insensitive
(Can be changed using Tuning options. See "Global Search Options" on page 333.)
Escape character
\
Use to escape \. You cannot escape any other character.
\
Use to escape \, “, and *.
Examples:
name=log\\ger (matches log\ger)
name=logger\* (matches logger*)
\
Use to escape any special character.
Example:
To search for a term with the character “[” :
|REGEX= “logger\[”
Escaping wildcard character
Cannot search for *
Example:
log\* is invalid
Can search for * by escaping the character
Example:
name=log\* is valid
Can search for * by escaping the character
Example:
name=log\* is valid
Exact Match/Search string includes an operator or a special character
Enclose keyword in double quotes; Otherwise, keyword treated as keyword*.
Example:
log (matches log, logging, logger, and so on)
“log” (matches only log)
Tip: See the list of special characters that cannot be searched even when enclosed in double quotes, later in this table.
Enclose value in double quotes
Example:
message=“failed login”
No special requirement.
Query Syntax Requirements
Administrator's GuideChapter 3: Searching and Analyzing Events
Syntax Reference for Query Expressions Page 85 of 743
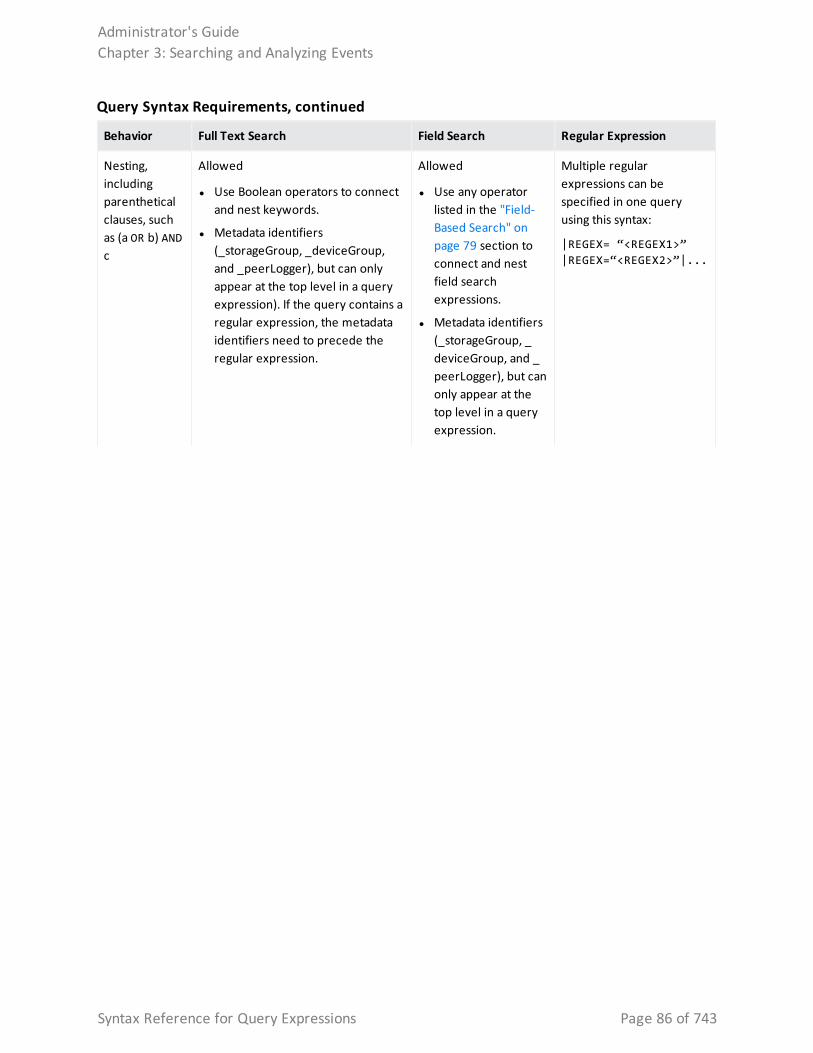
Behavior Full Text Search Field Search Regular Expression
Nesting, including parenthetical clauses, such as (a OR b) AND c
Allowed
l Use Boolean operators to connect and nest keywords.
l Metadata identifiers (_storageGroup, _deviceGroup, and _peerLogger), but can only appear at the top level in a query expression). If the query contains a regular expression, the metadata identifiers need to precede the regular expression.
Allowed
l Use any operator listed in the "Field-Based Search" on page 79 section to connect and nest field search expressions.
l Metadata identifiers (_storageGroup, _deviceGroup, and _peerLogger), but can only appear at the top level in a query expression.
Multiple regular expressions can be specified in one query using this syntax:
|REGEX= “<REGEX1>” |REGEX=“<REGEX2>”|...
Query Syntax Requirements, continued
Administrator's GuideChapter 3: Searching and Analyzing Events
Syntax Reference for Query Expressions Page 86 of 743
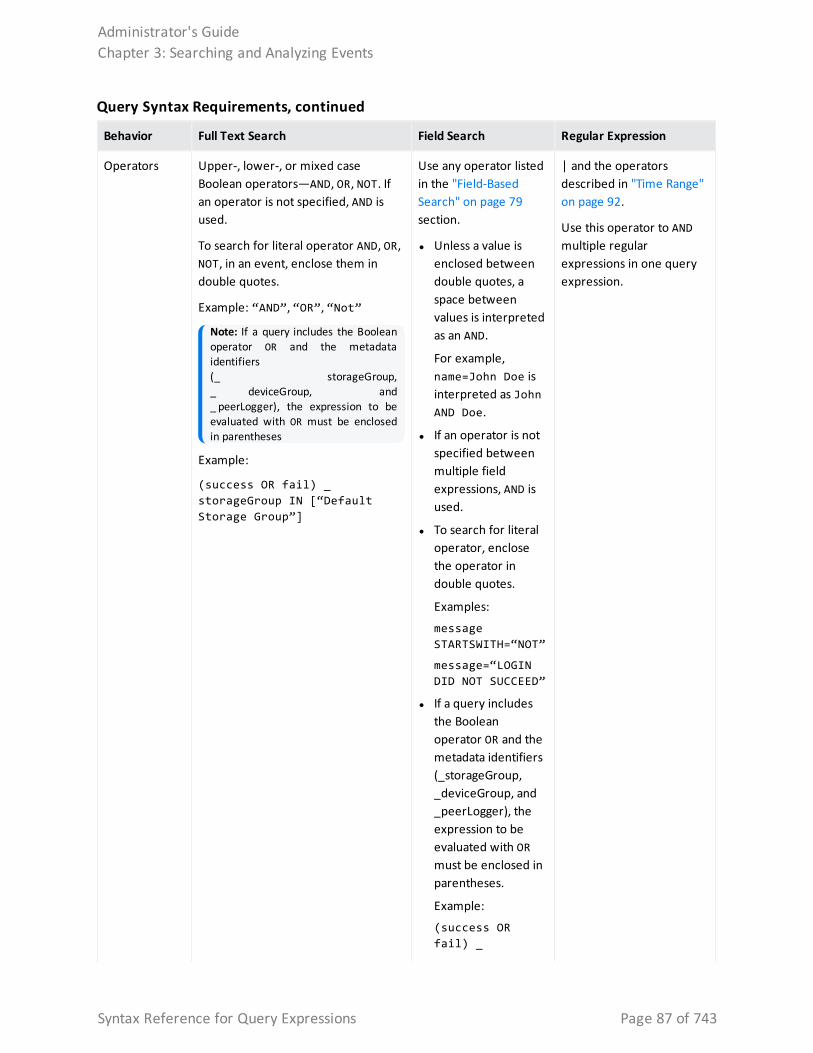
Behavior Full Text Search Field Search Regular Expression
Operators Upper-, lower-, or mixed case Boolean operators—AND, OR, NOT. If an operator is not specified, AND is used.
To search for literal operator AND, OR, NOT, in an event, enclose them in double quotes.
Example: “AND”, “OR”, “Not”
Note: If a query includes the Boolean operator OR and the metadata identifiers (_ storageGroup, _ deviceGroup, and _ peerLogger), the expression to be evaluated with OR must be enclosed in parentheses
Example:
(success OR fail) _storageGroup IN [“Default Storage Group”]
Use any operator listed in the "Field-Based Search" on page 79 section.
l Unless a value is enclosed between double quotes, a space between values is interpreted as an AND.
For example, name=John Doe is interpreted as John AND Doe.
l If an operator is not specified between multiple field expressions, AND is used.
l To search for literal operator, enclose the operator in double quotes.
Examples:
message STARTSWITH=“NOT”
message=“LOGIN DID NOT SUCCEED”
l If a query includes the Boolean operator OR and the metadata identifiers (_storageGroup, _deviceGroup, and _peerLogger), the expression to be evaluated with OR must be enclosed in parentheses.
Example:
(success OR fail) _
| and the operators described in "Time Range" on page 92.
Use this operator to AND multiple regular expressions in one query expression.
Query Syntax Requirements, continued
Administrator's GuideChapter 3: Searching and Analyzing Events
Syntax Reference for Query Expressions Page 87 of 743
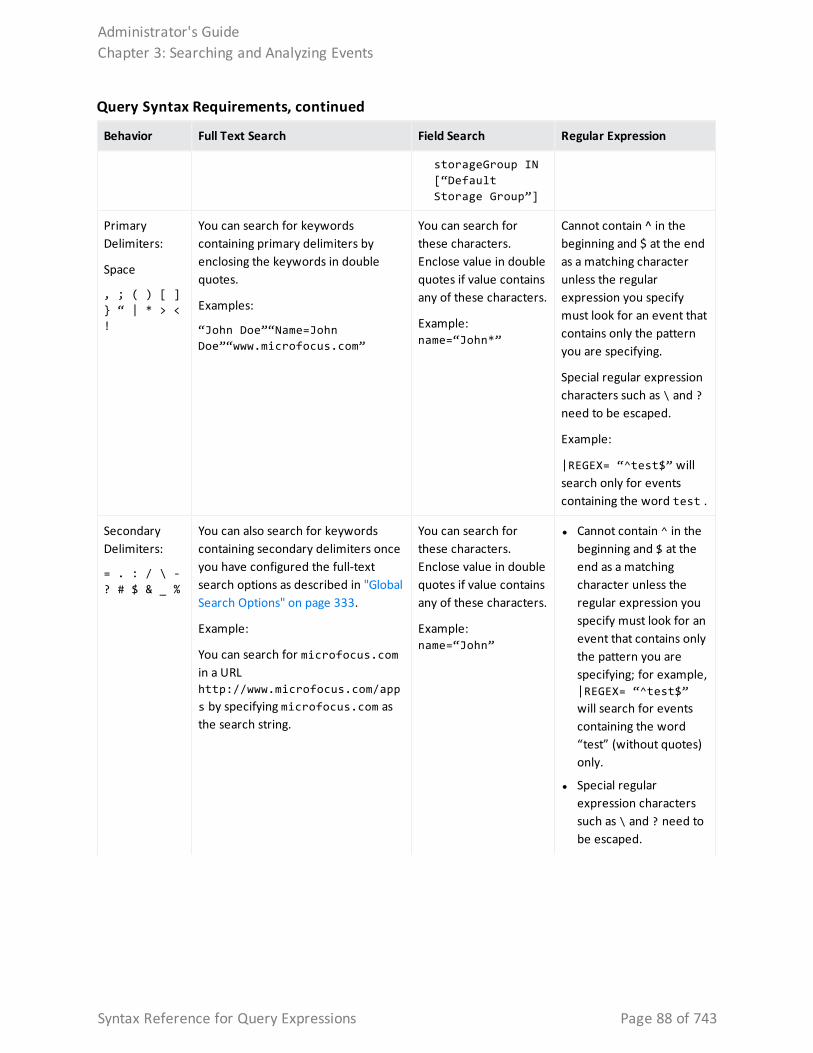
Behavior Full Text Search Field Search Regular Expression
storageGroup IN [“Default Storage Group”]
Primary Delimiters:
Space
, ; ( ) [ ] } “ | * > < !
You can search for keywords containing primary delimiters by enclosing the keywords in double quotes.
Examples:
“John Doe”“Name=John Doe”“www.microfocus.com”
You can search for these characters. Enclose value in double quotes if value contains any of these characters.
Example: name=“John*”
Cannot contain ^ in the beginning and $ at the end as a matching character unless the regular expression you specify must look for an event that contains only the pattern you are specifying.
Special regular expression characters such as \ and ? need to be escaped.
Example:
|REGEX= “^test$” will search only for events containing the word test .
Secondary Delimiters:
= . : / \ - ? # $ & _ %
You can also search for keywords containing secondary delimiters once you have configured the full-text search options as described in "Global Search Options" on page 333.
Example:
You can search for microfocus.com in a URL http://www.microfocus.com/apps by specifying microfocus.com as the search string.
You can search for these characters. Enclose value in double quotes if value contains any of these characters.
Example: name=“John”
l Cannot contain ^ in the beginning and $ at the end as a matching character unless the regular expression you specify must look for an event that contains only the pattern you are specifying; for example, |REGEX= “^test$” will search for events containing the word “test” (without quotes) only.
l Special regular expression characters such as \ and ? need to be escaped.
Query Syntax Requirements, continued
Administrator's GuideChapter 3: Searching and Analyzing Events
Syntax Reference for Query Expressions Page 88 of 743
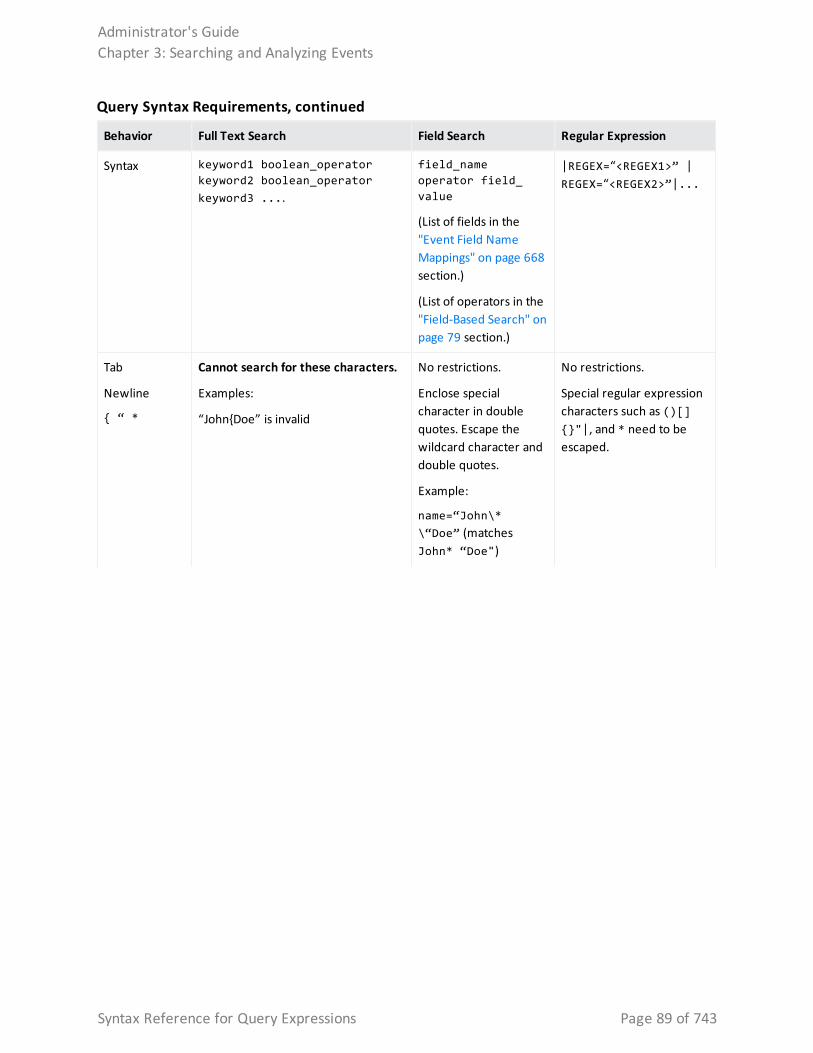
Behavior Full Text Search Field Search Regular Expression
Syntax keyword1 boolean_operator keyword2 boolean_operator keyword3 ....
field_name operator field_value
(List of fields in the "Event Field Name Mappings" on page 668 section.)
(List of operators in the "Field-Based Search" on page 79 section.)
|REGEX=“<REGEX1>” | REGEX=“<REGEX2>”|...
Tab
Newline
{ “ *
Cannot search for these characters.
Examples:
“John{Doe” is invalid
No restrictions.
Enclose special character in double quotes. Escape the wildcard character and double quotes.
Example:
name=“John\* \“Doe” (matches John* “Doe")
No restrictions.
Special regular expression characters such as ()[]{}"|, and * need to be escaped.
Query Syntax Requirements, continued
Administrator's GuideChapter 3: Searching and Analyzing Events
Syntax Reference for Query Expressions Page 89 of 743
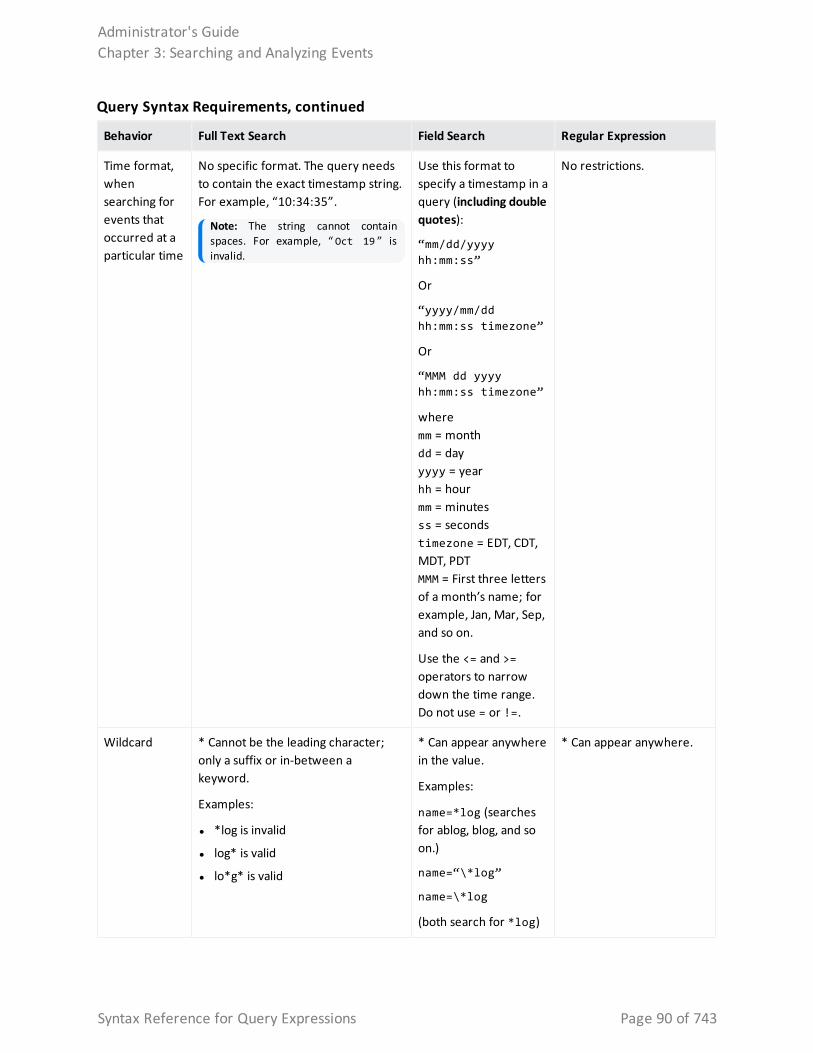
Behavior Full Text Search Field Search Regular Expression
Time format, when searching for events that occurred at a particular time
No specific format. The query needs to contain the exact timestamp string. For example, “10:34:35”.
Note: The string cannot contain spaces. For example, “ Oct 19 ” is invalid.
Use this format to specify a timestamp in a query (including double quotes):
“mm/dd/yyyy hh:mm:ss”
Or
“yyyy/mm/dd hh:mm:ss timezone”
Or
“MMM dd yyyy hh:mm:ss timezone”
where mm = monthdd = dayyyyy = yearhh = hourmm = minutesss = secondstimezone = EDT, CDT, MDT, PDTMMM = First three letters of a month’s name; for example, Jan, Mar, Sep, and so on.
Use the <= and >= operators to narrow down the time range. Do not use = or !=.
No restrictions.
Wildcard * Cannot be the leading character; only a suffix or in-between a keyword.
Examples:
l *log is invalid
l log* is valid
l lo*g* is valid
* Can appear anywhere in the value.
Examples:
name=*log (searches for ablog, blog, and so on.)
name=“\*log”
name=\*log
(both search for *log)
* Can appear anywhere.
Query Syntax Requirements, continued
Administrator's GuideChapter 3: Searching and Analyzing Events
Syntax Reference for Query Expressions Page 90 of 743
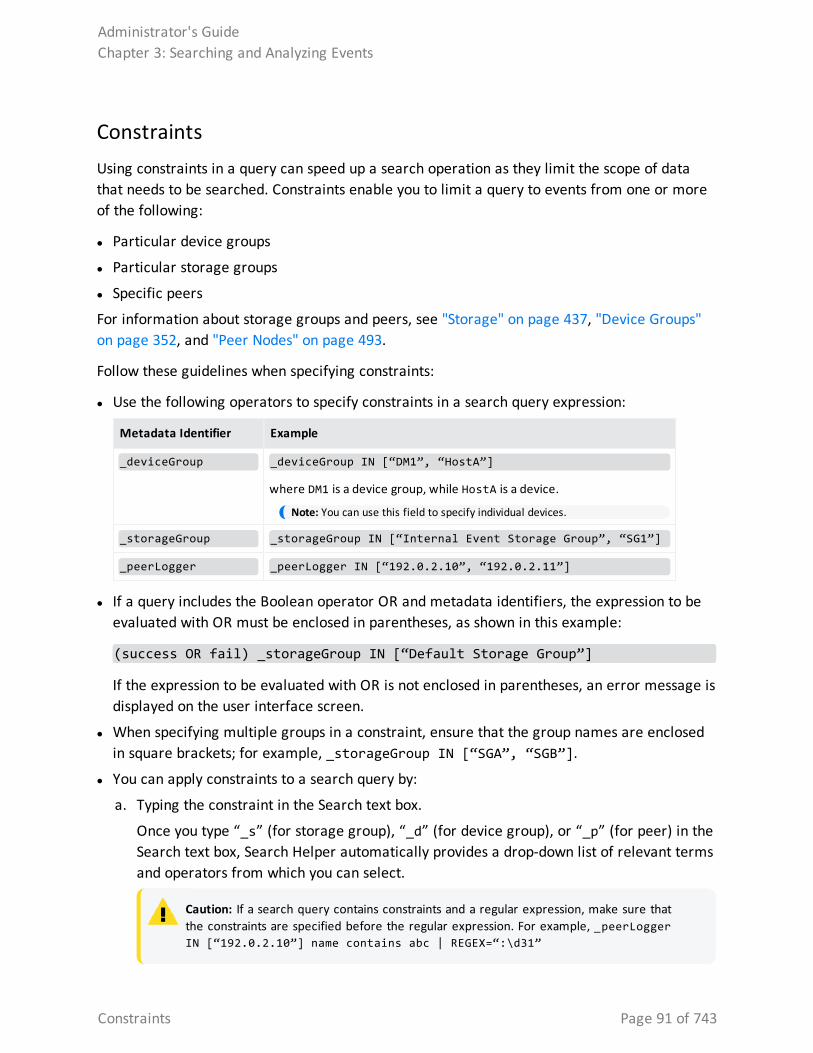
ConstraintsUsing constraints in a query can speed up a search operation as they limit the scope of data that needs to be searched. Constraints enable you to limit a query to events from one or more of the following:
l Particular device groups
l Particular storage groups
l Specific peers
For information about storage groups and peers, see "Storage" on page 437, "Device Groups" on page 352, and "Peer Nodes" on page 493.
Follow these guidelines when specifying constraints:
l Use the following operators to specify constraints in a search query expression:
Metadata Identifier Example
_deviceGroup _deviceGroup IN [“DM1”, “HostA”]
where DM1 is a device group, while HostA is a device.
Note: You can use this field to specify individual devices.
_storageGroup _storageGroup IN [“Internal Event Storage Group”, “SG1”]
_peerLogger _peerLogger IN [“192.0.2.10”, “192.0.2.11”]
l If a query includes the Boolean operator OR and metadata identifiers, the expression to be evaluated with OR must be enclosed in parentheses, as shown in this example:
(success OR fail) _storageGroup IN [“Default Storage Group”]
If the expression to be evaluated with OR is not enclosed in parentheses, an error message is displayed on the user interface screen.
l When specifying multiple groups in a constraint, ensure that the group names are enclosed in square brackets; for example, _storageGroup IN [“SGA”, “SGB”].
l You can apply constraints to a search query by:
a. Typing the constraint in the Search text box.
Once you type “_s” (for storage group), “_d” (for device group), or “_p” (for peer) in the Search text box, Search Helper automatically provides a drop-down list of relevant terms and operators from which you can select.
Caution: If a search query contains constraints and a regular expression, make sure that the constraints are specified before the regular expression. For example, _peerLogger IN [“192.0.2.10”] name contains abc | REGEX=“:\d31”
Administrator's GuideChapter 3: Searching and Analyzing Events
Constraints Page 91 of 743
b. Selecting Storage Groups or peers from the Advanced Search tool. To access the Advanced Search tool, click Advanced Search beneath the text box where you type the query. See " Classic Search: Using the Advanced Search Builder" on page 102.
Time RangeAn event is timestamped with the receipt time when it is received on the Logger. By default, a search query uses the receipt time to search for matching events. However, user can also use the event time as a search option.
Under most circumstances, the Logger receipt time is same as the event time. However, the event time and the Logger receipt time for an event can be different because there is usually a small lag between the time an event leaves a device and it is received at the Logger. If the device’s clock is ahead or behind the Logger clock, the lag or lead can be significant.
A search operation requires you to specify the time range within which events would be searched. You can select from many predefined time ranges or define a custom time range to suit your needs.
When defining a time range for your query, be sure to take the information in "Impact of Daylight Savings Time Change on Logger Operations" on page 509 into consideration.
Predefined time range: When you select a predefined time range such as “Last 2 Hours” or “Today”, the time range is relative to the current time. For example, if you select “Last 2 Hours” at 2:00:00 PM on July 13th, events from 12:00:00 to 2:00:00 PM on July 13th will be searched. If you refresh your search results at 5:00:00 PM on the same day, the time window is recalculated. Therefore, events that match the specified criteria and occurred between 3:00:00 and 5:00:00 PM on July 13th are displayed.
Custom time range: You can specify a time range in a 24-hour format to suit your needs. For example, a custom time range is:
Start: 8/13/2020 13:36:30End: 8/13/2020 22:36:30
By default, the end time for a custom time range is the current time on your Logger and the start time is two hours before the current time. You can also use variables to specify custom time ranges.
Dynamic time range: The dynamic search is relative to the time the query is run. Scheduled search operations use this mechanism to search through newer event data each time they are run. A dynamic date range might start at $Now - 2h (two hours ago) and end at $Now (the current time).
Administrator's GuideChapter 3: Searching and Analyzing Events
Time Range Page 92 of 743
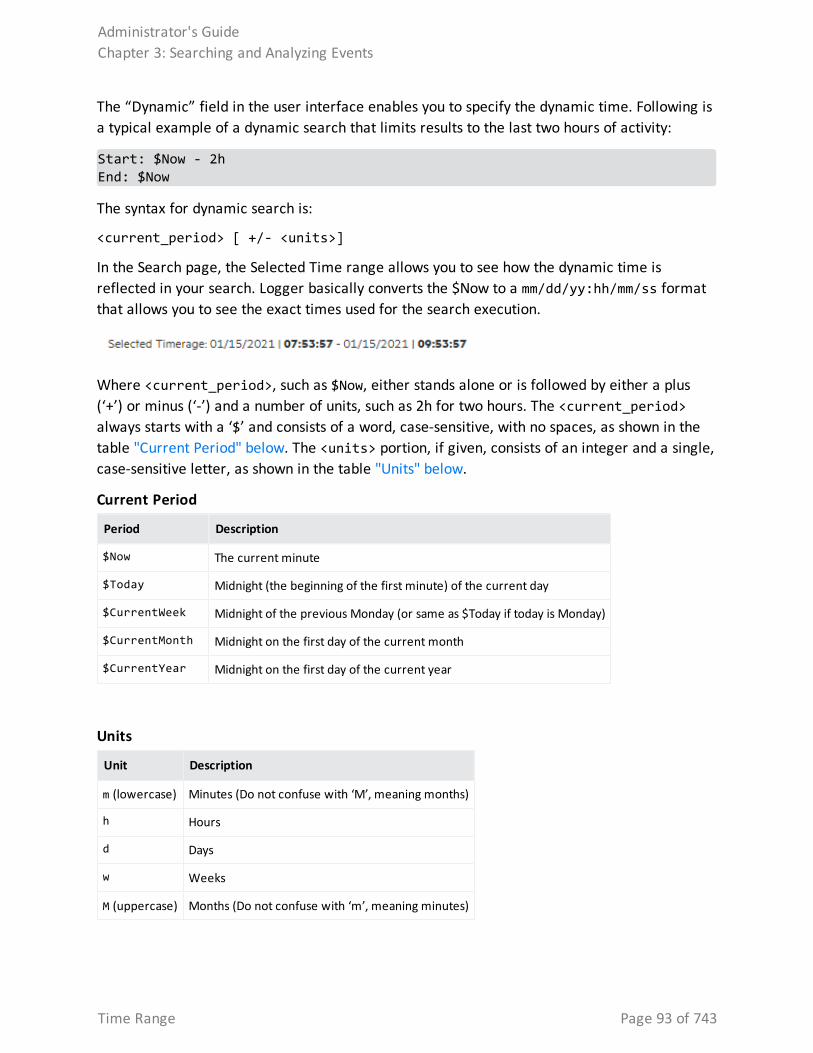
The “Dynamic” field in the user interface enables you to specify the dynamic time. Following is a typical example of a dynamic search that limits results to the last two hours of activity:
Start: $Now - 2hEnd: $Now
The syntax for dynamic search is:
<current_period> [ +/- <units>]
In the Search page, the Selected Time range allows you to see how the dynamic time is reflected in your search. Logger basically converts the $Now to a mm/dd/yy:hh/mm/ss format that allows you to see the exact times used for the search execution.
Where <current_period>, such as $Now, either stands alone or is followed by either a plus (‘+’) or minus (‘-’) and a number of units, such as 2h for two hours. The <current_period> always starts with a ‘$’ and consists of a word, case-sensitive, with no spaces, as shown in the table "Current Period" below. The <units> portion, if given, consists of an integer and a single, case-sensitive letter, as shown in the table "Units" below.
Period Description
$Now The current minute
$Today Midnight (the beginning of the first minute) of the current day
$CurrentWeek Midnight of the previous Monday (or same as $Today if today is Monday)
$CurrentMonth Midnight on the first day of the current month
$CurrentYear Midnight on the first day of the current year
Current Period
Unit Description
m (lowercase) Minutes (Do not confuse with ‘M’, meaning months)
h Hours
d Days
w Weeks
M (uppercase) Months (Do not confuse with ‘m’, meaning minutes)
Units
Administrator's GuideChapter 3: Searching and Analyzing Events
Time Range Page 93 of 743
Time Stamps in LoggerEvents consist of a receipt time, event time, a source (host name or IP address), and an un-parsed message portion. The following are the most common time stamps in Logger events:
l End Time is the time at which the activity related to the event ended.
l Logger Receipt Time is the time the events are written to the Storage Group (disk). All events are timestamped with the receipt time when received on the Logger.
Note: Typically, the Logger receipt time is same as the event time. However, these times might differ due to a small lag between the time an event is received and when it is stored on the Logger. For example, if the event time parsing is enabled in file receiver, the receipt time may lag behind event time.
Guidelines
l Logger uses the receipt time field to find matching events when forwarding as well as for storage retention and archives.
l The Logger receipt time is used to analyze the forwarded events to a destination where the forwarder filter specifies a time range.
l Logger uses the receipt time of an event to determine its archival day.
l Search results are sorted based on the search time field selected.
l The histogram is based on the search time field selected.
l The default fields are automatically indexed. For the remaining fields, Logger uses the receipt time of an event and the time when a field was added to the index to determine whether that event will be indexed. If the receipt time of the event is equal to or later than the time when the field was added to the index, the event is indexed; otherwise, it is not.
You may see several other time stamps in Logger events like the following:
l Agent Receipt Time is the time the Connector received the event. Logger does not use this field but you can search it.
l Device Receipt Time is the time the event related to the activity was received. Logger use this field as backup when executing search based on even time if end time is not present in the CEF event.
l Event Time is the original time of the event on the device. Logger use this field as default when executing search based on event time.
l Manager Receipt Time is the time the ESM received the event. Logger does not use this field, but you can search it.
Administrator's GuideChapter 3: Searching and Analyzing Events
Time Stamps in Logger Page 94 of 743
Search based on Event TimeSearch based on event time allows the user to easily find an event by executing a search based on the time this one actually occurred or was received in Logger. When executing a search or an operation that depends on it, search type parameter is added and could be one of the following:
• End time (Event Time): Look for events that occurred within the time range specified.
• Logger Receipt time: Look for events received by Logger within the time range specified.
Enable / disable:
It only applies to non-indexed fields searches
By default, this feature is enabled. However, the user has the possibility of disabling it at a global scale during the ingestion and replace the event time by the receipt time for all the events sent to Logger. To disable it, access the Logger properties file and set the following: receivers.timeparsing.enable=false. Then, restart the receivers process.
Search end time and CEF
End time search is only supported in CEF events. For non CEF events, Logger uses the receipt time as search time.
Note: Set the receiver as CEF in the source type to properly use the search end time functionality.
In CEF events, the event time is displayed as EndTime field (“end” in the raw event). If this is not available, Logger uses the ReceiptTime field instead (“rt” in the raw event). In case none of the values (“rt” and “end”) are available, Logger will use the ReceiptTime as the default option.
Searches based on event time for CEF events must contain millisecond values for EndTime (“end”) or ReceiptTime (“rt”) fields. Other search formats for this search type functionality are not currently supported by Logger.
Fieldsets A fieldset determines the fields that are displayed in the search results for each event that matched a search query. By selecting the fieldset, you select which fields you see in the search results.
Administrator's GuideChapter 3: Searching and Analyzing Events
Search based on Event Time Page 95 of 743
Predefined FieldsetsThe system provides a number of predefined fieldsets. For more information about fieldsets, see "Managing Fieldsets" on page 339.
Note: If you select the All Fields fieldset, only fields available for matched events are displayed in a search results display (or the exported file).
"User-Defined Fields" FieldsetWhen you use a search operator that defines a new field, such as rex, rename, or eval, a new column for each field is added to the currently selected display. These newly defined fields are displayed by default. The User Defined Fields fieldset enables you to view only the newly-defined fields.
"Raw Event" FieldsetThe Raw Event fieldset displays the whole raw syslog event in a column called rawEvent, with the event formatted to fit in the column.
Although the Raw Event field is most applicable for syslog events, you can also display the raw event associated with CEF events in the rawEvent column. To do so, make sure the connector that is sending events to the Logger populates the rawEvent field with the raw event.
Note: To see the raw events in the rawEvent column, enable the Search Option, “Populate rawEvent field for syslog events”. See "Global Search Options" on page 333 for more information.
Generating Search Results
If Raw Event is selected as the only system fieldset in the search, results are displayed. However, these results cannot be exported as Logger generates an empty report.
When exporting search results, Logger discards automatically the raw messages. All other data selected by the user is used to create the export file. Moreover, fieldsets that contains only rawMessages, displays no results.
Administrator's GuideChapter 3: Searching and Analyzing Events
Predefined Fieldsets Page 96 of 743
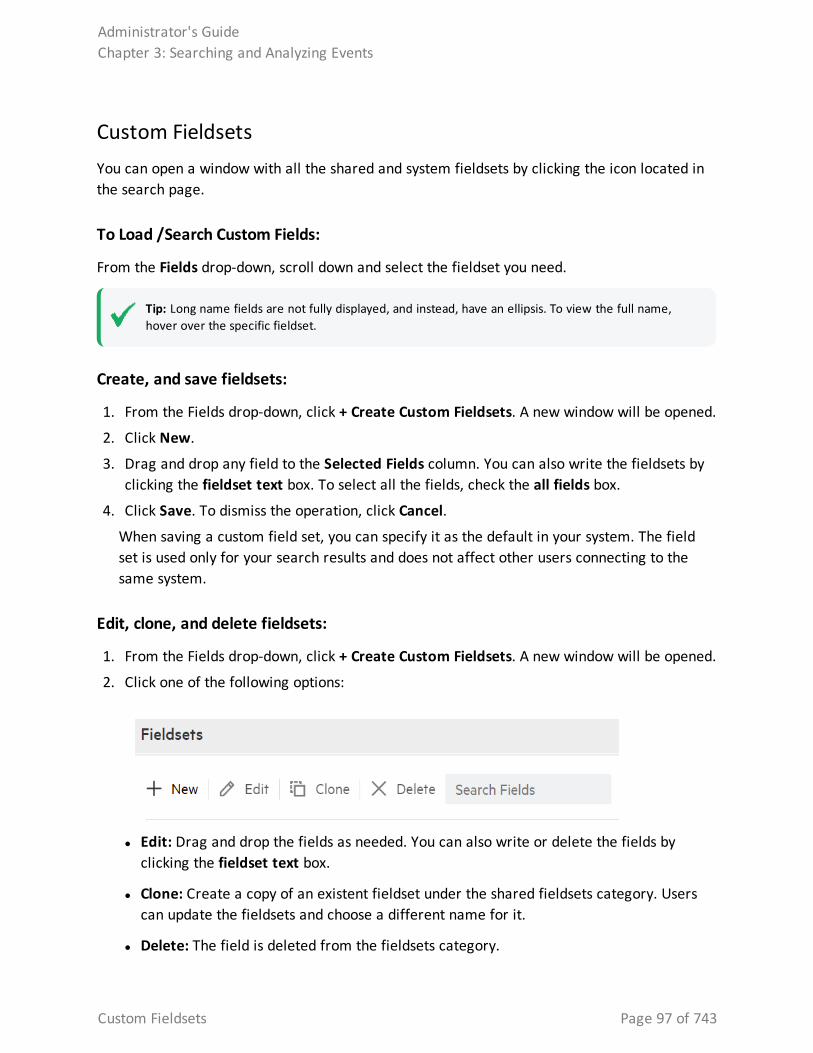
Custom FieldsetsYou can open a window with all the shared and system fieldsets by clicking the icon located in the search page.
To Load /Search Custom Fields:
From the Fields drop-down, scroll down and select the fieldset you need.
Tip: Long name fields are not fully displayed, and instead, have an ellipsis. To view the full name, hover over the specific fieldset.
Create, and save fieldsets:
1. From the Fields drop-down, click + Create Custom Fieldsets. A new window will be opened.
2. Click New.
3. Drag and drop any field to the Selected Fields column. You can also write the fieldsets by clicking the fieldset text box. To select all the fields, check the all fields box.
4. Click Save. To dismiss the operation, click Cancel.
When saving a custom field set, you can specify it as the default in your system. The field set is used only for your search results and does not affect other users connecting to the same system.
Edit, clone, and delete fieldsets:
1. From the Fields drop-down, click + Create Custom Fieldsets. A new window will be opened.
2. Click one of the following options:
l Edit: Drag and drop the fields as needed. You can also write or delete the fields by clicking the fieldset text box.
l Clone: Create a copy of an existent fieldset under the shared fieldsets category. Users can update the fieldsets and choose a different name for it.
l Delete: The field is deleted from the fieldsets category.
Administrator's GuideChapter 3: Searching and Analyzing Events
Custom Fieldsets Page 97 of 743
Tip: Only shared fieldsets can be deleted.
3. Click Save. To dismiss the operation, click Cancel. A message confirming this action will be displayed. Click Ok to proceed.
When saving, editing, or cloning a custom field set, you can designate it as your default. The fieldset will only be used for your search results and will not affect other users connecting to the same system.
Classic Search: Custom Fieldsets
The Analyze > Classic Search page has been deprecated on this release. Micro Focus recommends to use the "Custom Fieldsets" on the previous page function from the Analyze > Search page instead.
You can create your own field set by selecting Customize from the Fields pull-down menu. To add a fieldset, drag and drop a field to the selected fields column. You can also click the field and use the arrow to add a fieldset in the selected fields column.
You can save the custom field set or use it only for the current session. If you click OK, the field set appears in the Custom category. It is labeled as “Custom (not saved)” and is not visible to other users. It will remain available to you for this session. Once you log out of the current session, the temporary field set will be deleted. You can only have one temporary custom field set at a time.
If you click Save, the field set appears under the Shared Fieldsets category and is visible and available to the other users, as shown in the following figure. After a field set is saved, you can edit and delete it.
When saving a custom field set, you can specify it as the default in your system. The field set is used only for your search results and does not affect other users connecting to the same system. For information about deleting custom field sets, see "Managing Fieldsets" on page 339.
Note: Field sets are not included in the saved filter definition.
The *user field, shown below, controls the display of fields defined by search operators (rex, rename, extract, or eval) as well as the fields created when a parser is applied to an event. When *user is included in the Selected Fields list of a custom field set, the created or defined fields display.
Administrator's GuideChapter 3: Searching and Analyzing Events
Classic Search: Custom Fieldsets Page 98 of 743
Search HelperSearch Helper is a search-specific utility that automatically displays relevant information based on the query currently entered in the Search text box. Search Helper displays auto-complete search functionality, a search history, a search operator history, a link to the help system, and suggested next operators.
The Search Helper is enabled by default. To disabled it in the Classic Search page, click the Auto-open is ON link (which will update it to Auto-open is OFF). To access Search Helper after disable, click the link one more time.
Autocomplete SearchThe autocomplete functionality provides full-text keywords and field suggestions based on the text currently entered in the search box. The suggestions enable you to select keywords, fields, field values, search operators, or metadata terms from a list instead of typing them in, thus enabling you to build a query expression more quickly.
When you start typing, the suggestion list displays many types of entries. If the entered text is contained in both full-text keywords and schema fields, all of them are displayed in the suggested list. The arrows located at the top of the autocomplete box allows you to collapse (
) or expand ( ) the box as needed. Additionally, click the to clear the query text-box.
Take in consideration the following information that displays in the autocomplete box:
l If you type the pipeline character | , the list of operators available on Logger are displayed. For additional information, see "Search Operators" on page 575.
l The full-text keyword suggestions are obtained from the full-text keywords already indexed on your Logger.
l To navigate between the terms, use the following 4 keys: Up, Down, Enter, and Tab.
o Up: Navigates above the term selected.
o Down: Navigates below the term selected.
o Tab: Puts the selected term into the text area.
o Enter: Puts the selected term into the text area, and executes the search.
l Both the Logger schema fields and their respective index icon (indexed, superindexed, or indexable) are color coded. See "Understanding Search Field Colors" on page 75 for more information.
Administrator's GuideChapter 3: Searching and Analyzing Events
Search Helper Page 99 of 743
Note: System- defined fields are not available as fields in the auto- complete . For more information about system- defined fields and Logger searches, see "About Building Search Queries" on page 112 and "Additional Fields in the Search Results" on page 128.
l The full-text keywords and field values display a count next to each suggestion that indicates the number of the instances of the keyword or field value stored on Logger. The count is dependent on many factors including the time range, search constraints, and search operators for the query.
Note: The autocomplete suggestions and counts are based on data stored on the local system only. Counts are reset when the Logger restarts. Peer data is not included.
l Search Group filters (that restrict privileges on storage and device groups) are not enforced on the autocomplete list. Therefore, the list includes keywords, fields, field values, and counts of events in storage and device groups to which a user might not have privileges.
l When an archive is loaded back on Logger, the autocomplete list does not include the full-text keywords or field values that were available before the events were archived. This happens because summary data is not archived along with the event data. Therefore, when the event data is loaded back from an archive, the archive data is not included in the summary.
Opening Filters and Saved Searches via AutocompleteThe autocomplete constants $filter$ and $ss$ enable you to open filters and saved searches directly from the search box.
If you type $filter$ in the search box, the available filters show up in the autocomplete. Filters include only the query.
If you type $ss$ in the search box, the available saved searches show up in the autocomplete. Saved searches displayed include the query, the start date/time, the end date/time, local only, and so on.
To use an autocomplete suggestion:
1. Type $filter$ or $ss$ in the search box.
2. From the search list, click the suggested search of your interest. Otherwise, continue typing the saved search name to narrow down the options.
3. Click to run that search, or continue typing to narrow your search further. Once you select a filter from the autocomplete, Logger replaces the search box contents with the filter definition.
Administrator's GuideChapter 3: Searching and Analyzing Events
Opening Filters and Saved Searches via Autocomplete Page 100 of 743
Search History and Search Operator HistoryThe Search History displays recently run queries that match the currently entered search. To
see the search history, start typing a search or click the down-arrow next to the button. The Search History displays the fields used previously with the search operator that is currently typed in the Search text box. The Search History only displays if you have previously used the operator that you are typing. Click the operator to add it to your search.
To hide the Search History window in the Analyze> Search page, click the icon. To display the window again, click the icon.
Examples, Usage, Suggested Next Operators, and HelpThe Examples section lists examples relevant to the latest query operator you have typed in the Search text box.
The Usage section provides the syntax for the search operator.
The Suggested Next Operators section provides a list of operators that generally follow the currently typed query. For example, if you type logger |, the operators that often follow are rex, extract, or regex. You can select one of the listed operators to automatically append to the currently typed query in the Search text box. This list saves you from guessing the next possible operators and manually typing them in.
The Help section provides context-sensitive help for the last-listed operator in the query that is currently typed in the Search text box. Additionally, if you click the icon, Logger online help launches.
Regex Helper ToolThe Regex Helper tool enables you to create regular expressions that can be used with the rex pipeline operator to extract fields of interest from an event. This tool not only simplifies the task of creating regular expressions for the rex operator but also makes it efficient and error free. For information about rex, see "Search Operator Portion of a Query" on page 77 or "Using the Rex Operator" on page 618.
The tool, which is only available for non-CEF events (unstructured data), parses raw syslog events into fields and displays them in a table with 3 columns: Field Name, Raw Event Value, and Regex Value. You select the fields that you want to include in the rex expression of a query. The selected fields are automatically inserted in a search query as a rex expression.
Administrator's GuideChapter 3: Searching and Analyzing Events
Search History and Search Operator History Page 101 of 743
Using the Regex Helper Tool
1. Enter a search query that finds events of interest to you. For information about running a search, see Running a Search.
2. Identify a syslog event that you want to analyze further.
3. Click the arrow (in the left-most column) for the identified event.
4. Next to the word RAW, click the icon.
5. Click the field that you need to include in the query. To select several fields CTRL + Click. To select a group of fields lined up in order, press SHIFT+ Click .
Tip: To select all fields, click Select All located on top of the field name. To deselect the fields, click Clear Selection.
6. Click Load. Otherwise, click Close to cancel the action.
The rex expressions pertaining to the selected fields are automatically entered in the search query box. In this example we want to extract the IP addresses from events. Therefore, the IPAddress_1 field is selected in the Regex Helper tool.
Once the IP address is selected and you click Load, the rex expression that includes the regular expression for those IP addresses is displayed in the Search text box, as shown in the following example.
_deviceGroup in ["Logger Internal Event Device [Apache URL Access Error Log]"] | rex "(?<IPAddress_1>\d+\.\d+\.\d+\.\d+) \S+ \S+ \[(?<TimeStamp_1>\d+/\S+/\d+:\d+:\d+:\d+ \S+)\.*"
From this point, you can include additional pipeline operators in this query to create charts, identify the top five IP addresses, and so on. In the following example, the above query is modified to identify the top IP addresses.
_deviceGroup in ["Logger Internal Event Device [Apache URL Access Error Log]"] | rex "(?<IPAddress_1>\d+\.\d+\.\d+\.\d+) \S+ \S+ \[(?<TimeStamp_1>\d+/\S+/\d+:\d+:\d+:\d+ \S+)\.*" | top IPAddress_1
Classic Search: Using the Advanced Search Builder
The Analyze > Classic Search page has been deprecated on this release. Micro Focus recommends to use the different functions from the Analyze > Search page instead.
The Advanced Search tool is a Boolean-logic conditions editor that enables you to build search queries quickly and accurately. The tool provides a visual representation of the conditions you are including in a query. You can specify keywords, field-based conditions, and regular
Administrator's GuideChapter 3: Searching and Analyzing Events
Classic Search: Using the Advanced Search Builder Page 102 of 743
expressions using this tool. You can also specify search constraints such as peers, device groups, and storage groups (see "Constraints" on page 91). This section describes how to use the tool.
To display the Advanced Search builder:
Click Analyze > Classic Search to open the search page, and then click Advanced Search, to the right of the go button. The Advanced Search builder displays.
To build a new search query in the Advanced Search builder:
1. Click Analyze > Classic Search to open the search page, and then click Advanced Search.
2. Select the Boolean operator that applies to the condition you are adding from the top of Search Builder. You can select these operators:
Operator Meaning
AND
OR
NOT
To load a system or saved filter, or a saved search, click the icon. Select the filter or
the saved search from the displayed list and click
To add a keyword (full-text search) or field condition:
a. Locate the field you want to add under the Name column.To specify a keyword (full-text search), use the fullText field under the Name column.
b. Click the Operator column associated with the field, select the operator from the displayed list, and press Enter. Only operators applicable to a field are displayed in the list.
c. In the Condition column associated with the field, enter a value and press Enter.
To edit a condition, right click on the condition for a pull-down menu that enables you to edit, cut, copy, or delete the condition.
Note: You cannot specify a range of IP addresses. Therefore, to search for multiple IP addresses in a range, use the CONTAINS operator and wildcard characters in the Condition column; for example, enter 192.0.2.*.
3. Repeat the steps above until you have added all the conditions.
4. To include a regular expression, type it in the Regex field.
Administrator's GuideChapter 3: Searching and Analyzing Events
Classic Search: Using the Advanced Search Builder Page 103 of 743
To constrain your search query to specific device groups, storage groups, and Loggers, click the icon next to the constraint category. Select the relevant groups and Loggers. (To select multiple groups, hold the Ctrl-key down.)
You can specify devices or device groups in the Device Groups constraint.
The Logger constraint category is displayed only if Loggers are configured on your Logger.
If multiple values are selected for a constraint, those values are OR’ed together. For example, if you specify Device Group A, B, C, the query will find events in Device Group A, B, or C.
5. Click Go.
The query is automatically displayed in the Search text box and is ready to be run. You can also click the icon to save the query (referred as Saved Filter or a Saved Search) for a later use.
Nested Conditions
The Analyze > Classic Search page has been deprecated on this release. Micro Focus recommends to use the different functions from the Analyze > Search page instead.
You can create search queries with nested conditions in Search Builder. To do so, click the operator under which you want to nest the next condition and add the condition as described in " Classic Search: Using the Advanced Search Builder" on page 102
To add a nested condition:
1. Select the new operator from the icons above the query.
2. Select a condition from the menu below the query.
3. Add an operator and a supported condition for the query, for example deviceProduct = Microsoft.
4. Click Go!
Alternate Views for Query Building in Search Builder
The Analyze > Classic Search page has been deprecated on this release. Micro Focus recommends to use the different functions from the Analyze > Search page instead.
By default, a tree view representation of the conditions is displayed, as shown in the previous figures in this section. You can change the view to a color-block scheme and the location where
Administrator's GuideChapter 3: Searching and Analyzing Events
Nested Conditions Page 104 of 743
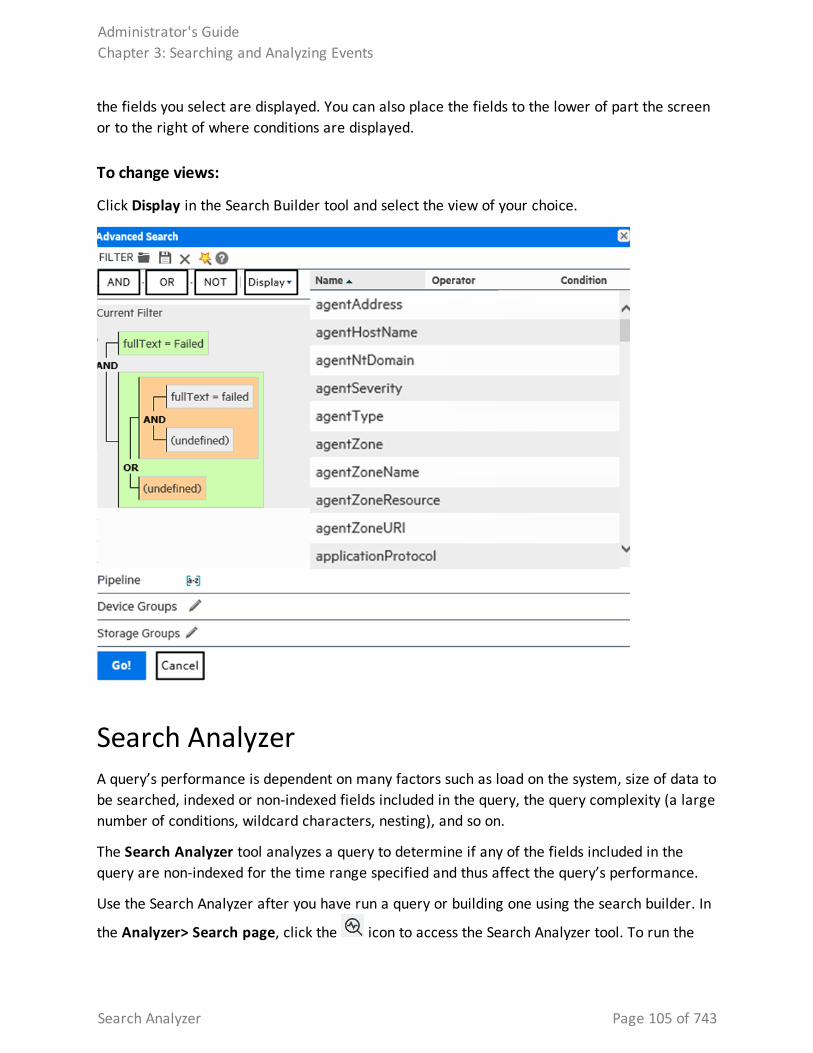
the fields you select are displayed. You can also place the fields to the lower of part the screen or to the right of where conditions are displayed.
To change views:
Click Display in the Search Builder tool and select the view of your choice.
Search AnalyzerA query’s performance is dependent on many factors such as load on the system, size of data to be searched, indexed or non-indexed fields included in the query, the query complexity (a large number of conditions, wildcard characters, nesting), and so on.
The Search Analyzer tool analyzes a query to determine if any of the fields included in the query are non-indexed for the time range specified and thus affect the query’s performance.
Use the Search Analyzer after you have run a query or building one using the search builder. In
the Analyzer> Search page, click the icon to access the Search Analyzer tool. To run the
Administrator's GuideChapter 3: Searching and Analyzing Events
Search Analyzer Page 105 of 743
data, click Run. To delete the information, click Clear All. Otherwise, click Cancel to exit the Search Analyzer tool. To access the online help, click .
Searching for EventsThe topics in this section explain how to search for events on Logger.
Permissions and Prerequisites
Enable the following User Group permissions for Logger search users:
l Default Logger Search Group > Search > Search for events (local searches only)
l Default Logger Search Group > Search > Search for events on remote peers (for distributed searches)
l Default Logger Rights > Peers > View registered peers (to see peers)
Other permissions may also apply. See "Setting Logger User Permissions" on page 561 for more information.
Running a SearchSearch page displays the number of events scanned and found, execution time, and amount of events displayed per page. To access this page, click the Search option from the Analyze drop-down.
To execute a search, type the query expression in the search text box and click . The
query gets color-code as you type different categories. You can expand or collapse the query text-box as needed. For information about building a query expression, including lists of applicable operators, see "Elements of a Search Query" on page 76.
Note: Refer to "Keyword Search (Full-text Search)" on page 77, "Field-Based Search" on page 79, and "Searching for Rare Field Values" on page 113 for instructions, exceptions, and invalid characters before you create a query expression.
To refine the search, click each of the following icons:
Administrator's GuideChapter 3: Searching and Analyzing Events
Searching for Events Page 106 of 743
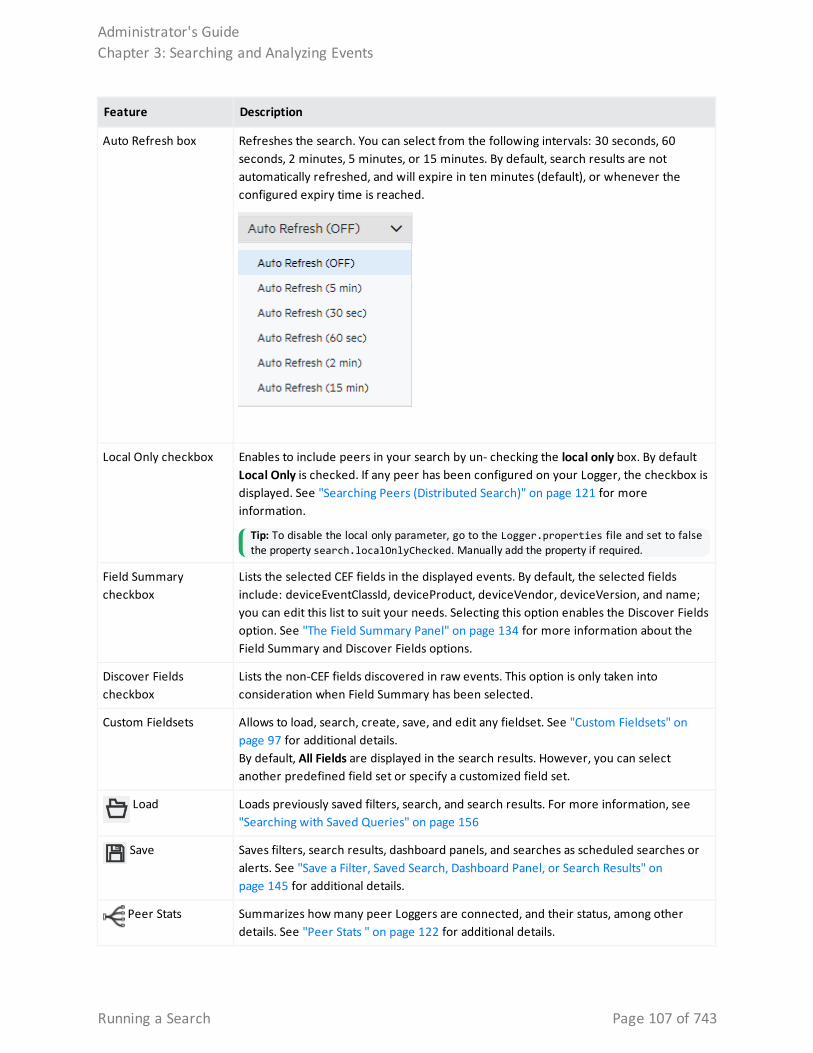
Feature Description
Auto Refresh box Refreshes the search. You can select from the following intervals: 30 seconds, 60 seconds, 2 minutes, 5 minutes, or 15 minutes. By default, search results are not automatically refreshed, and will expire in ten minutes (default), or whenever the configured expiry time is reached.
Local Only checkbox Enables to include peers in your search by un- checking the local only box. By default Local Only is checked. If any peer has been configured on your Logger, the checkbox is displayed. See "Searching Peers (Distributed Search)" on page 121 for more information.
Tip: To disable the local only parameter, go to the Logger.properties file and set to false the property search.localOnlyChecked. Manually add the property if required.
Field Summary checkbox
Lists the selected CEF fields in the displayed events. By default, the selected fields include: deviceEventClassId, deviceProduct, deviceVendor, deviceVersion, and name; you can edit this list to suit your needs. Selecting this option enables the Discover Fields option. See "The Field Summary Panel" on page 134 for more information about the Field Summary and Discover Fields options.
Discover Fields checkbox
Lists the non-CEF fields discovered in raw events. This option is only taken into consideration when Field Summary has been selected.
Custom Fieldsets Allows to load, search, create, save, and edit any fieldset. See "Custom Fieldsets" on page 97 for additional details. By default, All Fields are displayed in the search results. However, you can select another predefined field set or specify a customized field set.
Load Loads previously saved filters, search, and search results. For more information, see "Searching with Saved Queries" on page 156
Save Saves filters, search results, dashboard panels, and searches as scheduled searches or alerts. See "Save a Filter, Saved Search, Dashboard Panel, or Search Results" on page 145 for additional details.
Peer Stats Summarizes how many peer Loggers are connected, and their status, among other details. See "Peer Stats " on page 122 for additional details.
Administrator's GuideChapter 3: Searching and Analyzing Events
Running a Search Page 107 of 743
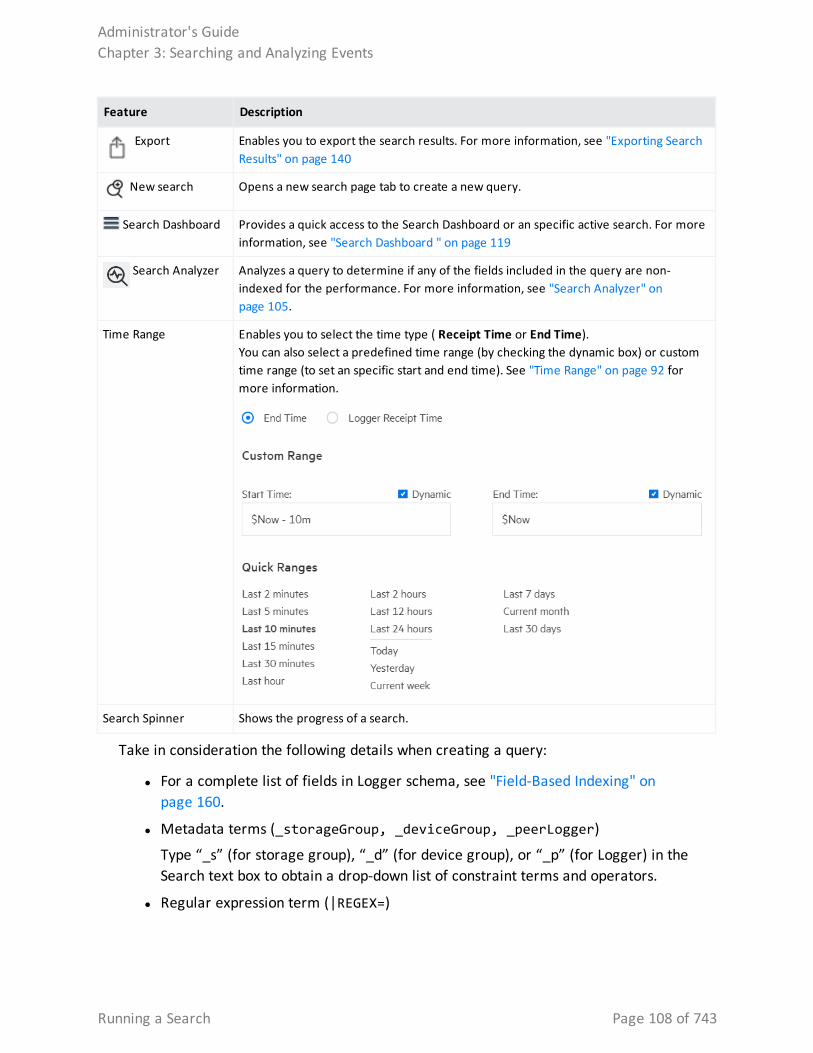
Feature Description
Export Enables you to export the search results. For more information, see "Exporting Search Results" on page 140
New search Opens a new search page tab to create a new query.
Search Dashboard Provides a quick access to the Search Dashboard or an specific active search. For more information, see "Search Dashboard " on page 119
Search Analyzer Analyzes a query to determine if any of the fields included in the query are non-indexed for the performance. For more information, see "Search Analyzer" on page 105.
Time Range Enables you to select the time type ( Receipt Time or End Time). You can also select a predefined time range (by checking the dynamic box) or custom time range (to set an specific start and end time). See "Time Range" on page 92 for more information.
Search Spinner Shows the progress of a search.
Take in consideration the following details when creating a query:
l For a complete list of fields in Logger schema, see "Field-Based Indexing" on page 160.
l Metadata terms (_storageGroup, _deviceGroup, _peerLogger)
Type “_s” (for storage group), “_d” (for device group), or “_p” (for Logger) in the Search text box to obtain a drop-down list of constraint terms and operators.
l Regular expression term (|REGEX=)
Administrator's GuideChapter 3: Searching and Analyzing Events
Running a Search Page 108 of 743
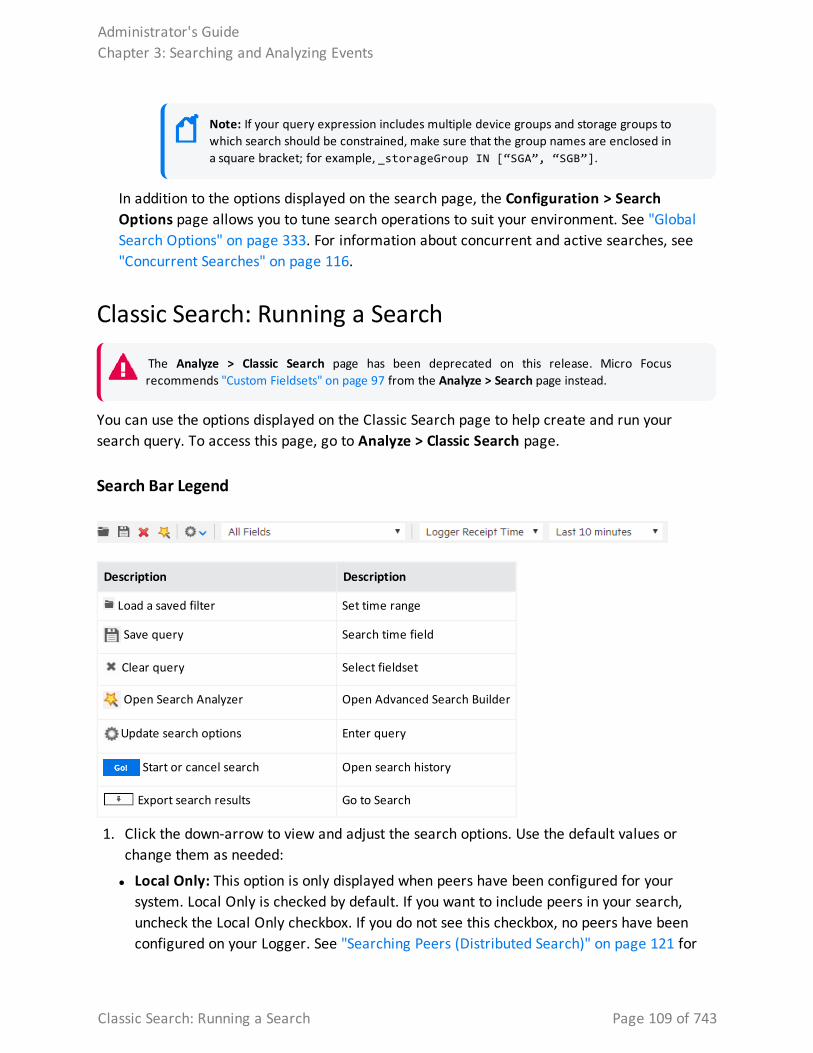
Note: If your query expression includes multiple device groups and storage groups to which search should be constrained, make sure that the group names are enclosed in a square bracket; for example, _storageGroup IN [“SGA”, “SGB”].
In addition to the options displayed on the search page, the Configuration > Search Options page allows you to tune search operations to suit your environment. See "Global Search Options" on page 333. For information about concurrent and active searches, see "Concurrent Searches" on page 116.
Classic Search: Running a Search
The Analyze > Classic Search page has been deprecated on this release. Micro Focus recommends "Custom Fieldsets" on page 97 from the Analyze > Search page instead.
You can use the options displayed on the Classic Search page to help create and run your search query. To access this page, go to Analyze > Classic Search page.
Search Bar Legend
Description Description
Load a saved filter Set time range
Save query Search time field
Clear query Select fieldset
Open Search Analyzer Open Advanced Search Builder
Update search options Enter query
Start or cancel search Open search history
Export search results Go to Search
1. Click the down-arrow to view and adjust the search options. Use the default values or change them as needed:
l Local Only: This option is only displayed when peers have been configured for your system. Local Only is checked by default. If you want to include peers in your search, uncheck the Local Only checkbox. If you do not see this checkbox, no peers have been configured on your Logger. See "Searching Peers (Distributed Search)" on page 121 for
Administrator's GuideChapter 3: Searching and Analyzing Events
Classic Search: Running a Search Page 109 of 743
more information.
To disable this parameter (both in Classic and Search page), go to the Logger.properties.file and set to false the property search.localOnlyChecked. Manually add the property if required.
l Field Summary: Lists the selected CEF fields in the displayed events. By default, the selected fields include: deviceEventClassId, deviceProduct, deviceVendor, deviceVersion, and name; you can edit this list to suit your needs. Selecting this option enables the Discover Fields option. See "The Field Summary Panel" on page 134 for more information about the Field Summary and Discover Fields options.
l Discover Fields: Lists the non-CEF fields discovered in raw events. This option is only taken into consideration when Field Summary has been selected.
l Auto Refresh: By default, search results are not automatically refreshed, and will expire in ten minutes (the default), or whenever the configured expiry time is reached (See "Concurrent Searches" on page 116). Select this option to have the Search results auto refresh for the selected search. You can select from the following refresh intervals: 30 seconds, 60 seconds, 2 minutes, 5 minutes, or 15 minutes.
l Sort: Select Oldest Event First or Newest Event First, depending on how you want the search results to display.
l Fieldset: By default, all fields (All Fields) are displayed in the search results. However, you can select another predefined field set or specify a customized field set. See "Fieldsets " on page 95 for more information.
l Time Range: By default, the query is run on the data received in the last ten minutes. Click the drop-down list to select another predefined time range or specify a custom time range. See "Time Range" on page 92 for more information.
l Search type: Allows to search based on the time events occurred or were receipt by the Logger. See "Search based on Event Time" on page 95 for more information.
1. Specify a query expression in the Search text box using one or more of the following methods.
Note: Refer to "Keyword Search (Full-text Search)" on page 77, "Field-Based Search" on page 79, and "Searching for Rare Field Values" on page 113 for instructions, exceptions, and invalid characters before you create a query expression.
a. Type the query expression in the Search text box. For information about building a query expression, including lists of applicable operators, see "Elements of a Search Query" on page 76.
Administrator's GuideChapter 3: Searching and Analyzing Events
Classic Search: Running a Search Page 110 of 743
b. When you type a query, Logger’s Search Helper enables you to quickly build a query expression by automatically providing suggestions, possible matches, and applicable operators. See "Search Helper" on page 99 for more information.
c. Use these guidelines to include various elements in a search query:
l For a complete list of fields in Logger schema, see "Field-Based Indexing" on page 160.
l Metadata terms (_storageGroup, _deviceGroup, _peerLogger)
Type “_s” (for storage group), “_d” (for device group), or “_p” (for Logger) in the Search text box to obtain a drop-down list of constraint terms and operators.
l Regular expression term (|REGEX=)
Note: If your query expression includes multiple device groups and storage groups to which search should be constrained, make sure that the group names are enclosed in a square bracket; for example, _storageGroup IN [“SGA”, “SGB”].
l Click Advanced to use the Search Builder tool. (See " Classic Search: Using the Advanced Search Builder" on page 102 for more information.) Also, use this option to specify device groups, storage groups, and Loggers to which search should be limited.
d. Click the icon to load a saved filter, a system filter, or a saved search. Select the filter or the saved search from the displayed list and click Load+Close. For more information, see "Searching with Saved Queries" on page 156 and "System Filters/Predefined Filters" on page 152.
Optionally, you can start a concurrent search in a new browser tab. See "Concurrent Searches" on page 116.
Canceling a Search in ProgressWhen a query is running, search results are displayed as matching events are found. Therefore, when you click Cancel while the search is in progress, any matching events found so far are displayed without actually deleting the search. This might be helpful in cases when the query needs to scan a large data set, but the search results displayed so far display the events you were looking for. You can further process the displayed (partial) results; for example, export the results, use the histogram to drill down in the results, or click on any text in the Search Results to add it to the query for further drill-down in the search results.
Note: Partial results do not display if a query includes the operators HEAD , TAIL , or SORT . Additionally, if a query includes chart operators such as CHART , RARE , or TOP , and the query is terminated early, Logger does not display a chart of the partial results.
Administrator's GuideChapter 3: Searching and Analyzing Events
Canceling a Search in Progress Page 111 of 743
About Building Search QueriesTake the following points into consideration when writing search queries.
l Values in the system-defined fields, which include Time, Device, Logger, parser, source, and sourceType, cannot be searched by either keyword or field based searches. These fields are system-defined and do not exist in the raw event text. Therefore, searching for data in these fields returns no result.
While the parser field includes only the name of the parser and is not searchable, the parser defines fields based on its associated source type, and those fields are searchable. See "Additional Fields in the Search Results" on page 128 for more information.
l Null values are not included in the Search results. For example, when performing a search on event data such as NOT deviceCustomString1=bar, the search returns results that match deviceCustomString1 not equal to "bar", but does not return events where the deviceCustomString1 value is NULL. You must explicitly call out NULL values with <field> IS NOT NULL or <field> IS NULL.
Note: Logger can be configured to make NOT search conditions include NULL values, by setting the search option Include NULL field value in NOT operator results to yes. For more information, see "Global Search Options" on page 333.
l Data contained within a string that has already been tokenized cannot be searched. Searchable keywords are determined by the set of delimiters used to parse the raw text string into searchable units called tokens. These delimiters are controlled on the Configuration > Search Options page.
o Logger includes the following primary delimiters for use during full-text (keyword) search: space, tab, newline, comma, semi-colon, (, ), [, ], {, }, ", |, and *. If only these primary delimiters are set to yes on the Configuration > Search Options screen and the raw event contains a string like this: dmz:10.9.9.9/20, then that entire string would be a single, searchable keyword.
o The Configuration > Search Options screen also enables you to use secondary delimiters when searching. If the secondary delimiters are also set to yes, the following list of delimiters would further tokenize the string: =, . , :, /, \, @, -, ?, #, &, _, >, and <. As a result, if the raw event contains the string: dmz:10.9.9.9/20, then the searchable keywords for this event, will be dmz, 10, 9, and 20.
See "Global Search Options" on page 333 for more information on setting primary and secondary delimiters.
Administrator's GuideChapter 3: Searching and Analyzing Events
About Building Search Queries Page 112 of 743
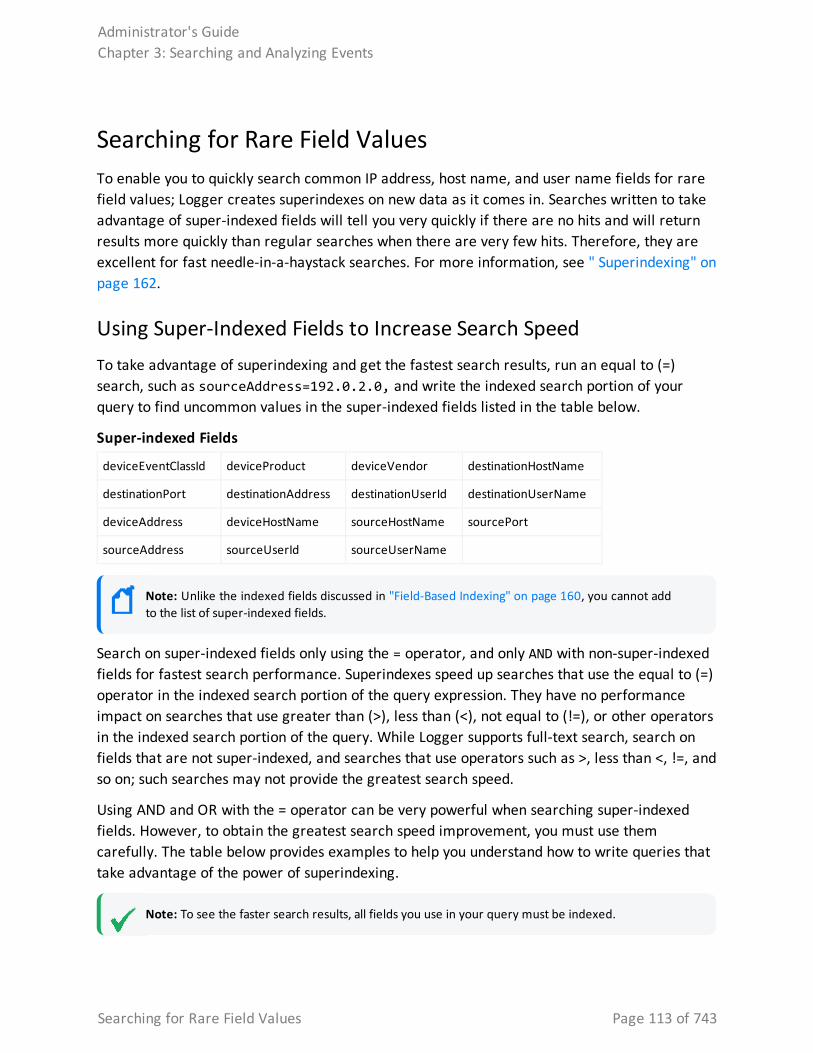
Searching for Rare Field ValuesTo enable you to quickly search common IP address, host name, and user name fields for rare field values; Logger creates superindexes on new data as it comes in. Searches written to take advantage of super-indexed fields will tell you very quickly if there are no hits and will return results more quickly than regular searches when there are very few hits. Therefore, they are excellent for fast needle-in-a-haystack searches. For more information, see " Superindexing" on page 162.
Using Super-Indexed Fields to Increase Search SpeedTo take advantage of superindexing and get the fastest search results, run an equal to (=) search, such as sourceAddress=192.0.2.0, and write the indexed search portion of your query to find uncommon values in the super-indexed fields listed in the table below.
deviceEventClassId deviceProduct deviceVendor destinationHostName
destinationPort destinationAddress destinationUserId destinationUserName
deviceAddress deviceHostName sourceHostName sourcePort
sourceAddress sourceUserId sourceUserName
Super-indexed Fields
Note: Unlike the indexed fields discussed in "Field-Based Indexing" on page 160, you cannot add to the list of super-indexed fields.
Search on super-indexed fields only using the = operator, and only AND with non-super-indexed fields for fastest search performance. Superindexes speed up searches that use the equal to (=) operator in the indexed search portion of the query expression. They have no performance impact on searches that use greater than (>), less than (<), not equal to (!=), or other operators in the indexed search portion of the query. While Logger supports full-text search, search on fields that are not super-indexed, and searches that use operators such as >, less than <, !=, and so on; such searches may not provide the greatest search speed.
Using AND and OR with the = operator can be very powerful when searching super-indexed fields. However, to obtain the greatest search speed improvement, you must use them carefully. The table below provides examples to help you understand how to write queries that take advantage of the power of superindexing.
Note: To see the faster search results, all fields you use in your query must be indexed.
Administrator's GuideChapter 3: Searching and Analyzing Events
Searching for Rare Field Values Page 113 of 743
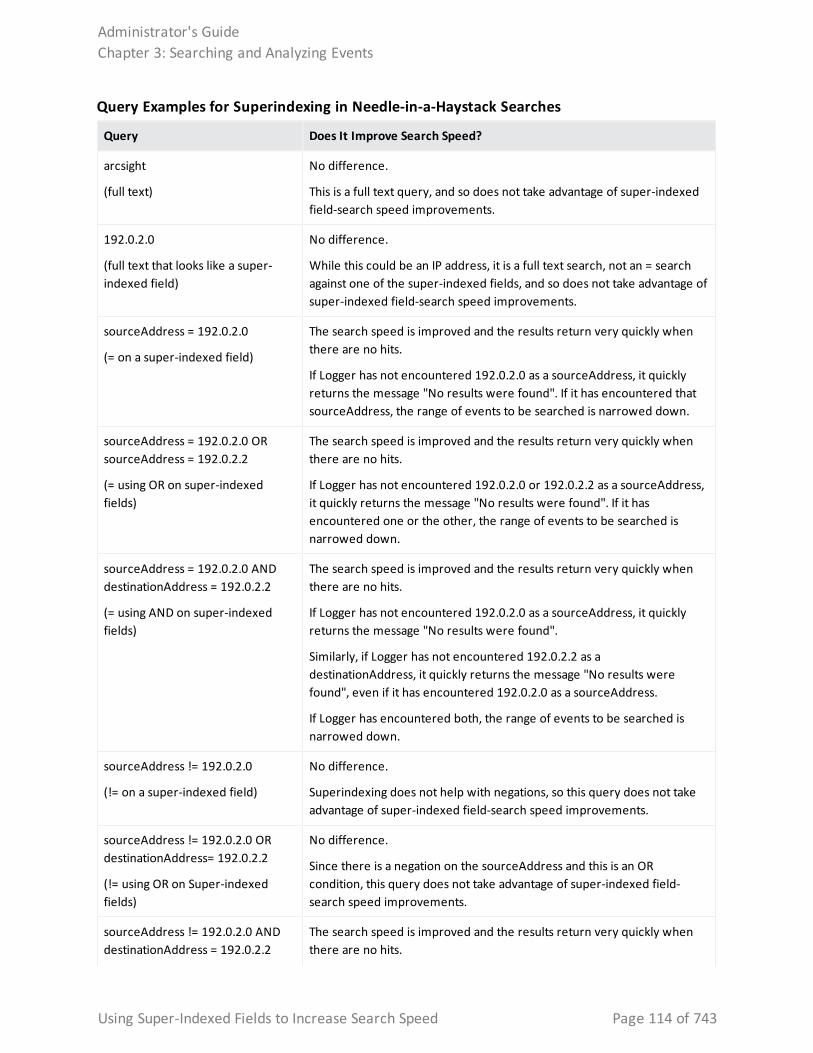
Query Does It Improve Search Speed?
arcsight
(full text)
No difference.
This is a full text query, and so does not take advantage of super-indexed field-search speed improvements.
192.0.2.0
(full text that looks like a super-indexed field)
No difference.
While this could be an IP address, it is a full text search, not an = search against one of the super-indexed fields, and so does not take advantage of super-indexed field-search speed improvements.
sourceAddress = 192.0.2.0
(= on a super-indexed field)
The search speed is improved and the results return very quickly when there are no hits.
If Logger has not encountered 192.0.2.0 as a sourceAddress, it quickly returns the message "No results were found". If it has encountered that sourceAddress, the range of events to be searched is narrowed down.
sourceAddress = 192.0.2.0 OR sourceAddress = 192.0.2.2
(= using OR on super-indexed fields)
The search speed is improved and the results return very quickly when there are no hits.
If Logger has not encountered 192.0.2.0 or 192.0.2.2 as a sourceAddress, it quickly returns the message "No results were found". If it has encountered one or the other, the range of events to be searched is narrowed down.
sourceAddress = 192.0.2.0 AND destinationAddress = 192.0.2.2
(= using AND on super-indexed fields)
The search speed is improved and the results return very quickly when there are no hits.
If Logger has not encountered 192.0.2.0 as a sourceAddress, it quickly returns the message "No results were found".
Similarly, if Logger has not encountered 192.0.2.2 as a destinationAddress, it quickly returns the message "No results were found", even if it has encountered 192.0.2.0 as a sourceAddress.
If Logger has encountered both, the range of events to be searched is narrowed down.
sourceAddress != 192.0.2.0
(!= on a super-indexed field)
No difference.
Superindexing does not help with negations, so this query does not take advantage of super-indexed field-search speed improvements.
sourceAddress != 192.0.2.0 OR destinationAddress= 192.0.2.2
(!= using OR on Super-indexed fields)
No difference.
Since there is a negation on the sourceAddress and this is an OR condition, this query does not take advantage of super-indexed field-search speed improvements.
sourceAddress != 192.0.2.0 AND destinationAddress = 192.0.2.2
The search speed is improved and the results return very quickly when there are no hits.
Query Examples for Superindexing in Needle-in-a-Haystack Searches
Administrator's GuideChapter 3: Searching and Analyzing Events
Using Super-Indexed Fields to Increase Search Speed Page 114 of 743
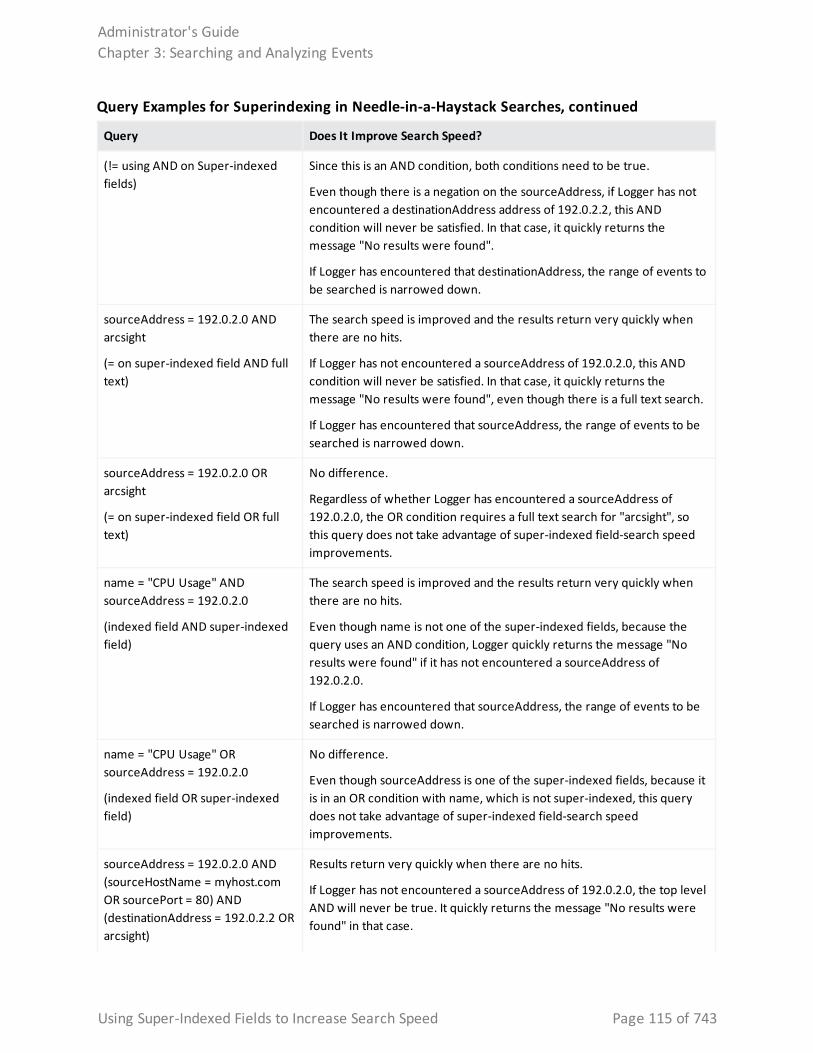
Query Does It Improve Search Speed?
(!= using AND on Super-indexed fields)
Since this is an AND condition, both conditions need to be true.
Even though there is a negation on the sourceAddress, if Logger has not encountered a destinationAddress address of 192.0.2.2, this AND condition will never be satisfied. In that case, it quickly returns the message "No results were found".
If Logger has encountered that destinationAddress, the range of events to be searched is narrowed down.
sourceAddress = 192.0.2.0 AND arcsight
(= on super-indexed field AND full text)
The search speed is improved and the results return very quickly when there are no hits.
If Logger has not encountered a sourceAddress of 192.0.2.0, this AND condition will never be satisfied. In that case, it quickly returns the message "No results were found", even though there is a full text search.
If Logger has encountered that sourceAddress, the range of events to be searched is narrowed down.
sourceAddress = 192.0.2.0 OR arcsight
(= on super-indexed field OR full text)
No difference.
Regardless of whether Logger has encountered a sourceAddress of 192.0.2.0, the OR condition requires a full text search for "arcsight", so this query does not take advantage of super-indexed field-search speed improvements.
name = "CPU Usage" AND sourceAddress = 192.0.2.0
(indexed field AND super-indexed field)
The search speed is improved and the results return very quickly when there are no hits.
Even though name is not one of the super-indexed fields, because the query uses an AND condition, Logger quickly returns the message "No results were found" if it has not encountered a sourceAddress of 192.0.2.0.
If Logger has encountered that sourceAddress, the range of events to be searched is narrowed down.
name = "CPU Usage" OR sourceAddress = 192.0.2.0
(indexed field OR super-indexed field)
No difference.
Even though sourceAddress is one of the super-indexed fields, because it is in an OR condition with name, which is not super-indexed, this query does not take advantage of super-indexed field-search speed improvements.
sourceAddress = 192.0.2.0 AND (sourceHostName = myhost.com OR sourcePort = 80) AND (destinationAddress = 192.0.2.2 OR arcsight)
Results return very quickly when there are no hits.
If Logger has not encountered a sourceAddress of 192.0.2.0, the top level AND will never be true. It quickly returns the message "No results were found" in that case.
Query Examples for Superindexing in Needle-in-a-Haystack Searches, continued
Administrator's GuideChapter 3: Searching and Analyzing Events
Using Super-Indexed Fields to Increase Search Speed Page 115 of 743
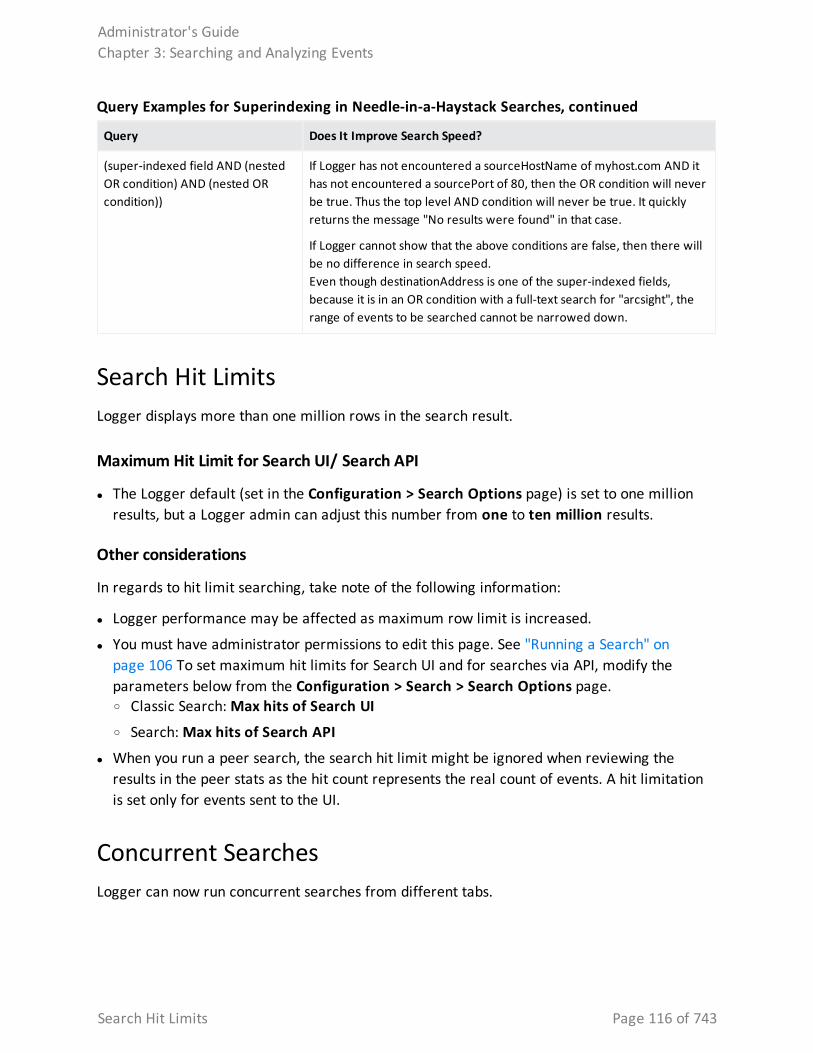
Query Does It Improve Search Speed?
(super-indexed field AND (nested OR condition) AND (nested OR condition))
If Logger has not encountered a sourceHostName of myhost.com AND it has not encountered a sourcePort of 80, then the OR condition will never be true. Thus the top level AND condition will never be true. It quickly returns the message "No results were found" in that case.
If Logger cannot show that the above conditions are false, then there will be no difference in search speed. Even though destinationAddress is one of the super-indexed fields, because it is in an OR condition with a full-text search for "arcsight", the range of events to be searched cannot be narrowed down.
Query Examples for Superindexing in Needle-in-a-Haystack Searches, continued
Search Hit Limits Logger displays more than one million rows in the search result.
Maximum Hit Limit for Search UI/ Search API
l The Logger default (set in the Configuration > Search Options page) is set to one million results, but a Logger admin can adjust this number from one to ten million results.
Other considerations
In regards to hit limit searching, take note of the following information:
l Logger performance may be affected as maximum row limit is increased.
l You must have administrator permissions to edit this page. See "Running a Search" on page 106 To set maximum hit limits for Search UI and for searches via API, modify the parameters below from the Configuration > Search > Search Options page. o Classic Search: Max hits of Search UI
o Search: Max hits of Search API
l When you run a peer search, the search hit limit might be ignored when reviewing the results in the peer stats as the hit count represents the real count of events. A hit limitation is set only for events sent to the UI.
Concurrent SearchesLogger can now run concurrent searches from different tabs.
Administrator's GuideChapter 3: Searching and Analyzing Events
Search Hit Limits Page 116 of 743
Maximum Concurrent Searches
The number of concurrent searches you can run depends on your system load, search size, and other factors.
l The Logger default (set in the Configuration > Search Options page) is set to 0 (unlimited) running or finished searches, but a Logger admin can adjust this number to between 1 (no concurrent searches) and 1000.
l This value limits the total number of searches in memory (running or finished) by the Logger, not by the user.
For example: For a Logger set to a maximum of ten concurrent searches, if user A is running six searches, user B will get an error if she tries to run more than four concurrent searches before any of the searches expire.
Expiry Time
The amount of time Logger holds the search results in memory before deleting them can also affect your search capacity. Each search you run consumes Logger storage space and CPU bandwidth.
l For this reason, the default expiry time for searches is ten minutes. A Logger admin can adjust this time to between 1-60 minutes.
l Clicking the Session ID opens the search results in a new tab and resets the expiry time. Using the pagination link (moving through the display pages) for a search also resets the expiry time.
l The expiry time affects both concurrent and standalone search results.
Other considerations
When running concurrent searches, take note of the following information:
l The maximum search and expiry time is set from the Configuration > Search > Search Options page. You must have administrator permissions to use this page. See "Concurrent Search Options" on page 338.
l Administrators can view and delete ongoing searches from the Configuration > Search > Running Searches page. See "Running Searches" on page 342.
l Dashboard searches, while they are running, are included in the search maximum, but are not listed in the search dashboard page.
l Maximum search limits do not apply to saved or scheduled searches.
Administrator's GuideChapter 3: Searching and Analyzing Events
Concurrent Searches Page 117 of 743
l Maximum search limits do not apply to searches and queries run from the Reports tool. However, running reports while also running search queries will likely affect your performance.
l When configuring the maximum search limit, take in consideration the number of Logger Search Reports and the limit of concurrent searches. Maximum search limits do not apply to searches and queries executed from reports tool using MySQL Reports but it is impacted by the Logger Search Reports. Running Reports while also running search queries will likely affect your performance.
Prerequisites
Users must be assigned to the following User Groups to access this feature:
1. To enable and configure concurrent searches: Default System Admin Group
2. To run concurrent searches: Default Logger Search Group
See "Setting Logger User Permissions" on page 561
Tip: Your Admin can tell you what the search limit and expiry time is for your Logger.
Classic Search: Running Concurrent Searches
The Analyze > Classic Search page has been deprecated on this release. Micro Focus recommends to run and view several searches from the "Search Dashboard " on the next page page instead.
To run two or more concurrent searches:
1. From the Analyze > Classic Search main page, start a search. See "Classic Search: Running a Search" on page 109
2. While the first search is underway, open a new browser tab, and log into the same Logger.
3. Enter the next search string and start the second search.
4. Repeat steps 2 and 3 to run more concurrent searches, up to the maximum specified for your Logger.
Viewing active searches:
The Active Search list is enabled for viewing whenever you have running or unexpired searches in Logger memory.
The Active Search displays information about your running and completed searches, until they reach the configured expiry time, are reopened.
Administrator's GuideChapter 3: Searching and Analyzing Events
Classic Search: Running Concurrent Searches Page 118 of 743
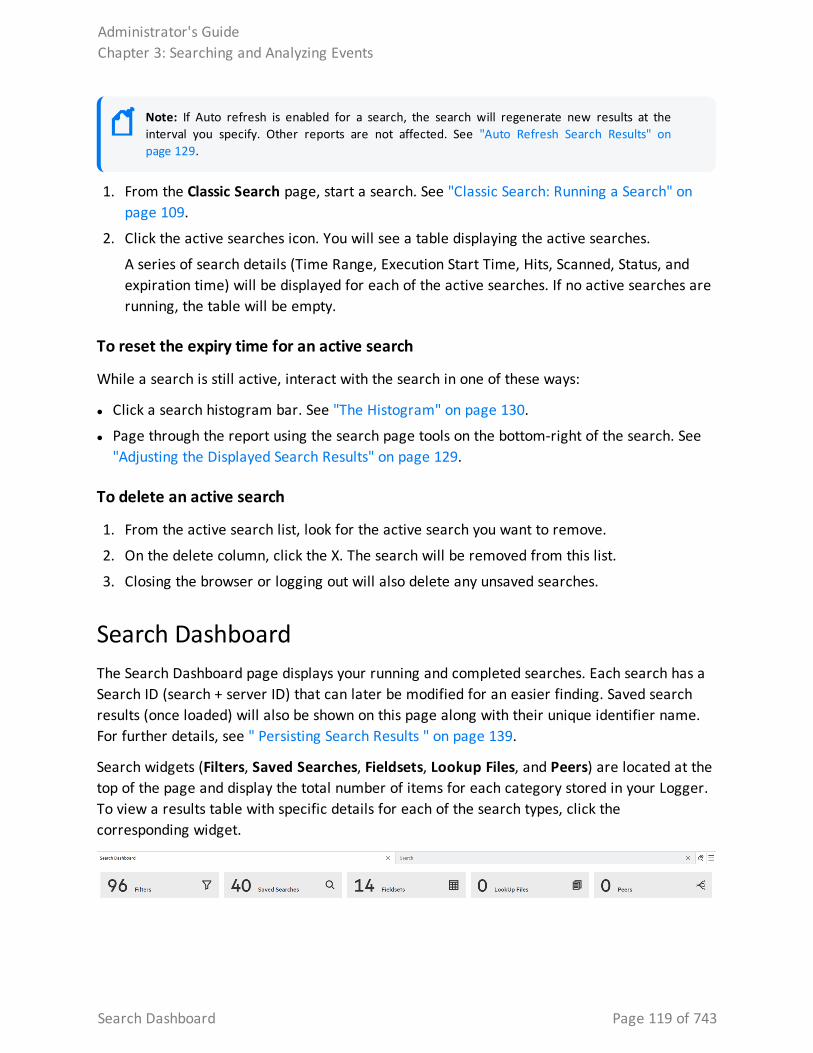
Note: If Auto refresh is enabled for a search, the search will regenerate new results at the interval you specify. Other reports are not affected. See "Auto Refresh Search Results" on page 129.
1. From the Classic Search page, start a search. See "Classic Search: Running a Search" on page 109.
2. Click the active searches icon. You will see a table displaying the active searches.
A series of search details (Time Range, Execution Start Time, Hits, Scanned, Status, and expiration time) will be displayed for each of the active searches. If no active searches are running, the table will be empty.
To reset the expiry time for an active search
While a search is still active, interact with the search in one of these ways:
l Click a search histogram bar. See "The Histogram" on page 130.
l Page through the report using the search page tools on the bottom-right of the search. See "Adjusting the Displayed Search Results" on page 129.
To delete an active search
1. From the active search list, look for the active search you want to remove.
2. On the delete column, click the X. The search will be removed from this list.
3. Closing the browser or logging out will also delete any unsaved searches.
Search Dashboard The Search Dashboard page displays your running and completed searches. Each search has a Search ID (search + server ID) that can later be modified for an easier finding. Saved search results (once loaded) will also be shown on this page along with their unique identifier name. For further details, see " Persisting Search Results " on page 139.
Search widgets (Filters, Saved Searches, Fieldsets, Lookup Files, and Peers) are located at the top of the page and display the total number of items for each category stored in your Logger. To view a results table with specific details for each of the search types, click the corresponding widget.
Administrator's GuideChapter 3: Searching and Analyzing Events
Search Dashboard Page 119 of 743
To view an Active Search:
1. From the Search page, execute a search. See "Running a Search" on page 106.
2. Go to Analyze > Search Dashboard. A series of search details (Time Range, Execution Start Time, Local Only, Time Type, Hits, Scanned, Status, and expiration time) will be displayed for each of the active searches. If no active searches are running, the search dashboard page will be empty.
3. To review the search parameters, click the icon. A tab redirecting to the actual search page will be opened. Notice a maximum of 10 tabs (including the search dashboard) can be opened. After reaching this limit, Logger will not redirect you to any search (even to ones in existing tabs) unless you close a tab.
Tip: If you modify any search parameter and then execute the search, Logger will considered it a new active search.
To rename the search (except the search results loaded), double click the tab and add a unique name. Click outside the title box or press enter to save the changes.
4. To close the active search tab, simply click the icon.
You can also access the Search Dashboard from the Search page. Click the icon to open an specific search or the Search Dashboard.
To create a new search, click the icon. See "Running a Search" on page 106 for further details.
Delete an active search
1. From the Dashboard Search, look for the active search you want to remove.
2. Click the . The search will be removed from the list.
Other considerations:
l To modify the maximum number of active searches displayed in this page, go to Configuration > Search Options > Max Concurrent Searches.
l The expiration time is reset whenever there is a request for fetching events, for example:
o A page update in the search result table.
o A drill down by clicking the histogram.
o A search opened from the search dashboard page.
Administrator's GuideChapter 3: Searching and Analyzing Events
Search Dashboard Page 120 of 743
Searching Peers (Distributed Search)When you run a search query, by default, only your local Logger is searched for matching events. However, you can specify in your query to run the search on the peer Loggers
Prerequisites
To perform peer searches and view their search results, you need the following groups and permissions:
l Logger Search Group with “Search for events on remote peers” enabled.
l Logger Rights Group with the “View registered peers” enabled.
Follow these guidelines for searching across peers:
l Specify the peer Loggers to search, as described in "Constraints" on page 91.
l Logger supports searching up to 100 peers in the same search.
l For best search performance and functionality, all peers must be on the latest version of Logger. Searches across peers are limited by the ability of the earliest version peer.
o If an operator does not exist on a peer version, the query will not run on that peer.
o Peers on earlier version will have the performance of that version, so search result for those peers will be returned more slowly.
l For best performance of non-pipeline searches, do not include the regex, rex, parse, keys, transaction, extract, or lookup search operators in the query.
l If the peer Loggers do not have the same storage or device group names, a search query operation skips searching for events for those groups on those peers.
l If there are custom schema fields in your Logger schema, those fields must exist on all peers. A search query containing those fields will not run across peers, and will return an error. See "Adding Fields to the Schema" on page 471.
l When a Logger becomes unavailable during a search operation, error messages are displayed. The displayed message varies depending on the error detected. This is most likely because there is a problem with the network or the peer is down. In some cases it may be because there is an issue with the peering relationship. The error messages may still display for the search that was in progress even after the problem is fixed. However, you can ignore such messages if they go away when you run a new distributed search. For more information about peers, see "Peer Nodes" on page 493.
l Using search heads enables faster peer searches for searches that use search operators, particularly aggregation operators, such as chart, sort, top. For best search performance, specify all peers to be searched in the query and exclude the local Logger. See "Setting up
Administrator's GuideChapter 3: Searching and Analyzing Events
Searching Peers (Distributed Search) Page 121 of 743
Search Heads for Faster Peer Searches" on page 33.
Note: Peer search speed improvements gained by using search heads apply only to searches run through the user interface. Using search heads does not improve the speed of scheduled searches or searches run though Logger Web Services.
Example queries for searching across peers:
Search that sorts five fields:
_peerLogger IN [“peer1”, “peer2”, …] | sort deviceEventCategory eventId deviceCustomNumber1 deviceCustomNumber2 deviceCustomNumber3
Search with field extraction:
_peerLogger IN [“peer1”, “peer2”, …] | rex "(?<src_ip>\d{1,3}\.\d{1,3}\.\d{1,3}\.\d{1,3})"
Search evaluating a variable:
_peerLogger IN [“peer1”, “peer2”, …] | eval (int)urllength=len(requestUrl) |sort urllength
Search with results grouped and counted as a top 50 list:
_peerLogger IN [“peer1”, “peer2”, …] | and priority > 0 | top 50 name
Search for events with a long URL:
_peerLogger IN [“peer1”, “peer2”, …] | eval n=len(requestUrl) | where n = "1023"
Peer Stats Peer stats allow you to view the status of the peer nodes associated to your Logger in both graph and table. Any exception triggered by the system (including nodes that cannot be reached out or search results from unreacheable peers) will also be displayed in this page.
To view peer stats:
1. Run a search with the local only box unchecked from the Analyze > Search page.
2. Click the statistics by peer icon . The search spinner displays and indicates the connection to each peer is in progress.
Tip: The message "The search will exclude or skip the following peers due to a communication error" pops up if an issue is encountered.
Administrator's GuideChapter 3: Searching and Analyzing Events
Peer Stats Page 122 of 743
A diagram will show a color-coded peer search status (as depicted in the legend box). At the end of each colored line, you will see the hit count of each peer node. Additionally, if you hover any peer node, a window will display additional details such as: name, search status, scan and hit count.
The following results will also be displayed in this window:
l Total Scan Count: Total of scanned events by all the peer nodes during the search.
l Total Hit Count: Total of events from all the peer nodes that matched the indexed search portion of the query. For more details, see "Query Expressions" on page 76.
Note: Search page hit count will be different for aggregate functions since the head will only count the summarized events.
3. If you click the statistics by graph icon, a table with the following information will be displayed:
Stats Description
Peer name Name designated by the user.
Peer Reachability
Reachable: Proper communication between the peer head and the node (marked with a green icon).
Unreachable: Non- existent communication between the peer head and the node (marked with a red icon). No available information (labeled as NA) will be found in peer search status, scan count, hit count , and scan rate.
Slow: Communication between peer and head takes more than 1 second. This status can be easily changed to reachable status.
Peer Search Status
Execution status when conducting a search. Each status is displayed with a different color.
Failed: Failed search executions are marked with a red icon.
Completed: Successful search executions are marked with a green icon.
Not available: Unavailable connections due to an unreachable peer are marked with a white icon.
Running: Search is still in progress and marked with a yellow icon.
Scan Count Number of events scanned by the peer during the search.
Hit Count Number of events (sent from peers to the head) that matched the query.
Administrator's GuideChapter 3: Searching and Analyzing Events
Peer Stats Page 123 of 743
Stats Description
Scan Rate Scans the count events divided by total search time (in seconds).
Elapsed Time Final search time on each peer node.
CPU Updates the CPU usage every 6 seconds.
Memory Calculates memory usage in both percentage and actual megabytes.
Long name fields are not fully displayed, and instead, have an ellipsis. To view the full number, hover over the memory.
Data is updated every 6 seconds.
Total Scan Count and Hit Count are also displayed at the right-bottom of this window.
To access the online help, click . You can also review the internal events of peer statistics (Scan/hit count, scan rate, CPU usage and memory, reachability) in the Search page view. For further details, see "Application Events" on page 636. To enable view and customize the internal stats, see "Peer Nodes" on page 493.
Searching for IPv6 AddressesIf you have IPv6 address fields configured in your Logger, you can filter on IPv6 addresses in Logger address fields as you would for IPv4 addresses.
Canonical Format for IPv6 addresses
When using a query search operator to search for full or partial IPv6 addresses, the address must be in canonical (normalized) format. Do not use IPv4-mapped IPv6 addresses.
l Address fields that are indexed by default require canonical format for IPv6 addresses. They include: o destinationAddress
o deviceAddress
o sourceAddress
l Address fields that are not indexed are not limited to canonical IPv6 addresses. They include: o agentAddress
However, queries on the agentAddress field will be slower, due to on-the-fly, just-in-time indexing of that field. If you issue many queries on the agentAddress field, consider indexing that field on Logger. If you need additional fields normalized, contact Customer Support. If you need to index additional fields, see "Search Indexes" on page 331.
Administrator's GuideChapter 3: Searching and Analyzing Events
Searching for IPv6 Addresses Page 124 of 743
Tip: In searches containing a search operator, IPv6 addresses in the results are displayed in canonical format. To view the original IPv6 address, expand the 'raw message' tab in the search results. See "Search Operators" on page 575 and "Classic Search: Changing the Displayed Search Results Using Field Sets" on page 133.
Searching for Partial IPv6 Addresses
You can search for a partial IP address if the partial address you enter is already in the canonical format. All IPv6 address you enter in queries are converted to the canonical format, so that they will match the IPv6 address as stored in the database. If your query includes a partial address that is not in the correct format, it will not match the IPv6 address as stored in the database, and so will not return any results.
Field-based and Keyword Searches
If you run a keyword or field-based search for one of these address fields, it will find ALL matching events for equivalent IPv6 values, regardless of the format of the original IPv6 addresses.
IPv4-mapped IPv6 addresses are matched with IPv4 addresses, and vice-versa. For example, src=::ffff:10.10.11.12 will match events in which src=10.10.11.12.
Note: This functionality is not available for the INSUBNET operator or for the lookup function. See "Using the INSUBNET Operator to Search for IPv6 Addresses" on the next page.
Aggregation Operators with IPv6
Aggregation operators behave the same for both field-based or keyword searches. The results will be combined for equivalent IPv6 addresses into one line displaying the IPv6 address in canonical format. You can search for IPv6 addresses by entering them in any valid format. Note that this pertains only to the results display. Logger does not change any of the actual events and values.
Example: IPv6 address searches
l sourceAddress IS NULL
l destinationAddress = 2001:db8:85a3:0042:1000:8a2e:0370:7334
l deviceAddress IS NOT NULL
Administrator's GuideChapter 3: Searching and Analyzing Events
Searching for IPv6 Addresses Page 125 of 743
Using the INSUBNET Operator to Search for IPv6 AddressesYou can use the INSUBNET operator to filter IPv4 and IPv6 addresses in the regular Logger address fields and any custom fields added to the Logger schema. Examples of filtering for IPv4 addresses are given in "Field-Based Search" on page 79.
Example: Use INSUBNET to filter IPv6 addresses:
l sourceAddress insubnet "2001:db8::/32"
l agentAddress insubnet "2001:db8::-2001:db8::ffff:ffff:ffff"
l destinationAddress insubnet "2001:db8::*:*:*"
Example: Use INSUBNET to filter a combination of IPv4 and IPv6 addresses:
l deviceAddress INSUBNET "192.0.2.0/24" OR destinationAddress INSUBNET "2001:db8::/32"
l agentAddress INSUBNET "2001:db8::/32" OR sourceAddress INSUBNET "192.0.2.0/16"
The Search Results DisplayAfter you have initiated a search, the search results are displayed in the bottom section of the same screen in which you ran the search. A search operation can take time when millions of events need to be searched. When the first screen of events that match the specified conditions is available, Logger automatically pauses the search and displays the matched events.
Event data is categorized by field name and each field is displayed as a separate color-coded column. For example, the time when an event was received on the Logger (Logger Receipt Time) is displayed in a gray-shaded column indicating metadata and labeled Time.
The Search Results The search results table displays the number of events scanned, the number of events found, the index status of each event type, and execution time. Each event is available in its raw form or parsed data. By default, the parsed data is displayed.
Below the histogram, events are shown in table form, one row per event. In the Analyze > Search page, the view menu bar allows the user to review the data in 3 different ways as described below. Next to the view menu bar, you can see the total number of events scanned and displayed and the time it took to execute the search.
Administrator's GuideChapter 3: Searching and Analyzing Events
Using the INSUBNET Operator to Search for IPv6 Addresses Page 126 of 743
1. RAW view: It only exhibits the Logger and Raw Data along with Event Time, Receipt Time and DeviceReceiptTime.
2. Column View: It displays events per columns.
3. Grid View: This is the view where events are distributed per rows. It permits comparison between specific (CEF and non-CEF) events in a pivot table format. Within this view, you can also access the following information:
l Event Details: This emergent window appears by clicking on the event and it shows the raw event, agent, destination, device, deviceCustom, extra fields and root data. In this
window, the following icons allows you to review first, previous, next and last event information as well as show/ hide null fields, and expand / collapse categories. This emergent window can be closed at any time.
Note: If more than 1 event is selected in the grid view, this window is not displayed. Logger will enable the Compare Events window instead.
l Compare Events: This emergent window compares from 2 to 10 events per column. This window can be minimized, maximized, or closed as appropriate.
l Show/ Hide RAW: When the grid view is active, click the arrow on the top left side of the table to view the raw data for all events. Click the arrow to hide the events. To view the specific event raw data, click the arrow icon on each event.
On top of the histogram, you can hide or show the histogram information by clicking the arrows accordingly.
Terms that match your query are highlighted. As you roll the mouse over other terms in the events table will be highlighted, both raw data and the other values displayed in the column. You can hover and highlight any matching results along the whole table and not just the columns.
Tip: In the Search page, you can also add highlight terms into your search by simply clicking on the term. The item will be automatically added into the search box.
You can drill down into the displayed search results by clicking a green-highlighted term to add it to the current query. For example, if you search for “login” and roll over the word “fail” in the search results, “fail” will highlight in green. Click the word “fail” to change the query to “login AND fail.”
By default, a Field Summary panel is displayed on the left side of the matched events. This section lists the fields that occur in matching events and the number of unique values for each in those events. For more information, see "The Field Summary Panel" on page 134.
Administrator's GuideChapter 3: Searching and Analyzing Events
The Search Results Page 127 of 743
Additional Fields in the Search ResultsIn addition to Logger's schema fields, you may see other types of fields in the Search results.
User-Defined Fields
User-defined fields are created when a search query includes operators such as rex, extract, and rename. See "Search Operators" on page 575 for information on these operators. These fields are displayed as additional columns in the All Fields view (of the System Fieldsets). To view only these columns, select User Defined Fieldsets from the System Fieldsets list.
System-Defined Fields
When a search query matches events that were received from a defined source type and were parsed using a pre-defined or user-defined parser, the search results include a parser field, and may include fields for the source type, and source, depending on the setting in the Search Options page. For more information, see "Global Search Options" on page 333.
System-defined fields contain no event data and are not searchable. See "About Building Search Queries" on page 112 for more information.
Field Description
parser Indicates whether or not an event was parsed, and if so, which parser was used.
Note: While the parser field itself is not searchable, the parser defines searchable fields based on its associated source type. These fields vary based on the source type. For more information, see "Parsers" on page 380.
If the event was parsed, this field contains the name of the parser. If the event was not parsed successfully, this field contains “Not parsed”. If no parser is defined for the source type or if there is no source type, the field is blank.
source type The type of file from which the event was received, as defined on the Source Type page (Configuration | Data > Source Types). For more information, see "Source Types" on page 375.
If no source type was applied when the event was received, this field is blank. You can control whether this field is displayed from the Search Options page.
source The name of the log file from which the event was received. For example, /opt/mnt/testsoft/web_server.out.log.
If no source was applied when the event was received, this field is blank. You can control whether this field is displayed from the Search Options page.
Administrator's GuideChapter 3: Searching and Analyzing Events
Additional Fields in the Search Results Page 128 of 743
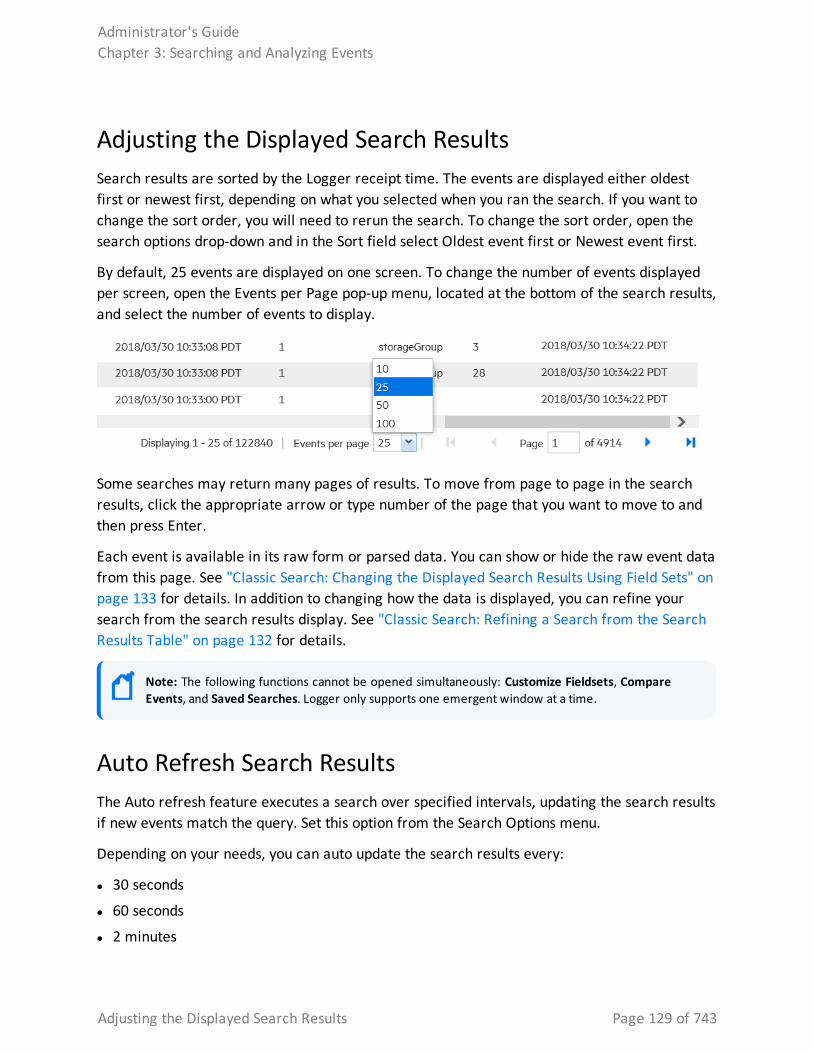
Adjusting the Displayed Search ResultsSearch results are sorted by the Logger receipt time. The events are displayed either oldest first or newest first, depending on what you selected when you ran the search. If you want to change the sort order, you will need to rerun the search. To change the sort order, open the search options drop-down and in the Sort field select Oldest event first or Newest event first.
By default, 25 events are displayed on one screen. To change the number of events displayed per screen, open the Events per Page pop-up menu, located at the bottom of the search results, and select the number of events to display.
Some searches may return many pages of results. To move from page to page in the search results, click the appropriate arrow or type number of the page that you want to move to and then press Enter.
Each event is available in its raw form or parsed data. You can show or hide the raw event data from this page. See "Classic Search: Changing the Displayed Search Results Using Field Sets" on page 133 for details. In addition to changing how the data is displayed, you can refine your search from the search results display. See "Classic Search: Refining a Search from the Search Results Table" on page 132 for details.
Note: The following functions cannot be opened simultaneously: Customize Fieldsets, Compare Events, and Saved Searches. Logger only supports one emergent window at a time.
Auto Refresh Search ResultsThe Auto refresh feature executes a search over specified intervals, updating the search results if new events match the query. Set this option from the Search Options menu.
Depending on your needs, you can auto update the search results every:
l 30 seconds
l 60 seconds
l 2 minutes
Administrator's GuideChapter 3: Searching and Analyzing Events
Adjusting the Displayed Search Results Page 129 of 743
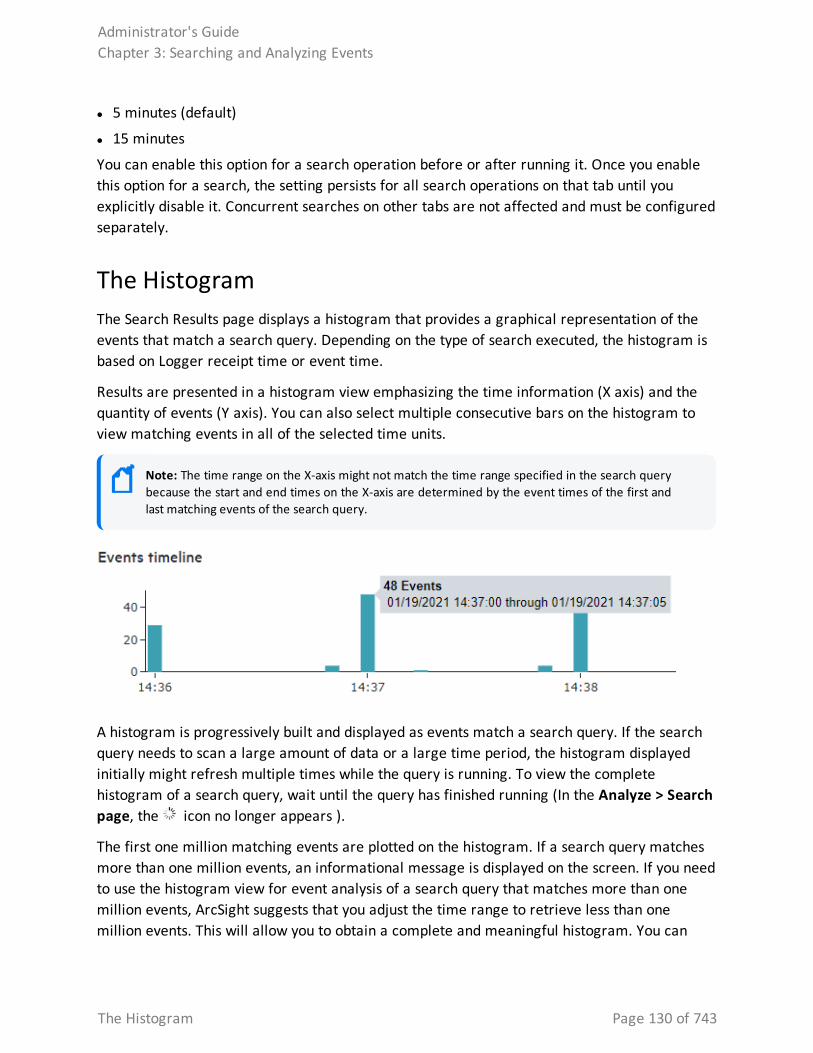
l 5 minutes (default)
l 15 minutes
You can enable this option for a search operation before or after running it. Once you enable this option for a search, the setting persists for all search operations on that tab until you explicitly disable it. Concurrent searches on other tabs are not affected and must be configured separately.
The HistogramThe Search Results page displays a histogram that provides a graphical representation of the events that match a search query. Depending on the type of search executed, the histogram is based on Logger receipt time or event time.
Results are presented in a histogram view emphasizing the time information (X axis) and the quantity of events (Y axis). You can also select multiple consecutive bars on the histogram to view matching events in all of the selected time units.
Note: The time range on the X-axis might not match the time range specified in the search query because the start and end times on the X-axis are determined by the event times of the first and last matching events of the search query.
A histogram is progressively built and displayed as events match a search query. If the search query needs to scan a large amount of data or a large time period, the histogram displayed initially might refresh multiple times while the query is running. To view the complete histogram of a search query, wait until the query has finished running (In the Analyze > Search page, the icon no longer appears ).
The first one million matching events are plotted on the histogram. If a search query matches more than one million events, an informational message is displayed on the screen. If you need to use the histogram view for event analysis of a search query that matches more than one million events, ArcSight suggests that you adjust the time range to retrieve less than one million events. This will allow you to obtain a complete and meaningful histogram. You can
Administrator's GuideChapter 3: Searching and Analyzing Events
The Histogram Page 130 of 743
also use a pipeline operator such as top, head, or chart to further refine search results so that the total number of hits is under one million events.
Displaying the Histogram
You cannot disable the histogram; however, you can click the icon above the upper-right corner of the histogram to hide it. To display a hidden histogram, click the icon again.
Mouse-OverYou can mouse-over any histogram bar to highlight it and view the number of matching events and the date and time period that the bar represents. The matching events listed below the histogram do not change, and the histogram continues to display all matching events.
Histogram Drill DownYou can drill down to events in a specific time period by clicking the bar on the histogram that represents that time period. The bar you drilled down to is highlighted and the events matching that time period are listed below the histogram. To deselect the time period, click the bar again. To analyze the information from several items on the train, make sure these are in a consecutive order. Otherwise, Logger only shows the data of the last column selected.
Chart Drill DownAggregated search operators such as CHART, TOP, and RARE generate charts of search results. The chart drill down feature enables you to quickly filter down to events with specific field values.
You identify the value on a search results chart and click it to drill down to events that match the value. For example, in the following chart, if you want to see events in which the device event class ID is eps 102, click the column labeled eps:102 to display events shown in the second figure.
When you click on a chart value (a column, bar, or donut section), the existing search query is modified to include the WHERE operator with the field name and value, and automatically rerun.
Search results can also be displayed in a chart format. When the user executes a search with a chart operator, Logger delivers a chart along with a correspondent table of events distributed by category. When this format is enabled, view menu bar is replaced with the following icons:
Administrator's GuideChapter 3: Searching and Analyzing Events
Displaying the Histogram Page 131 of 743
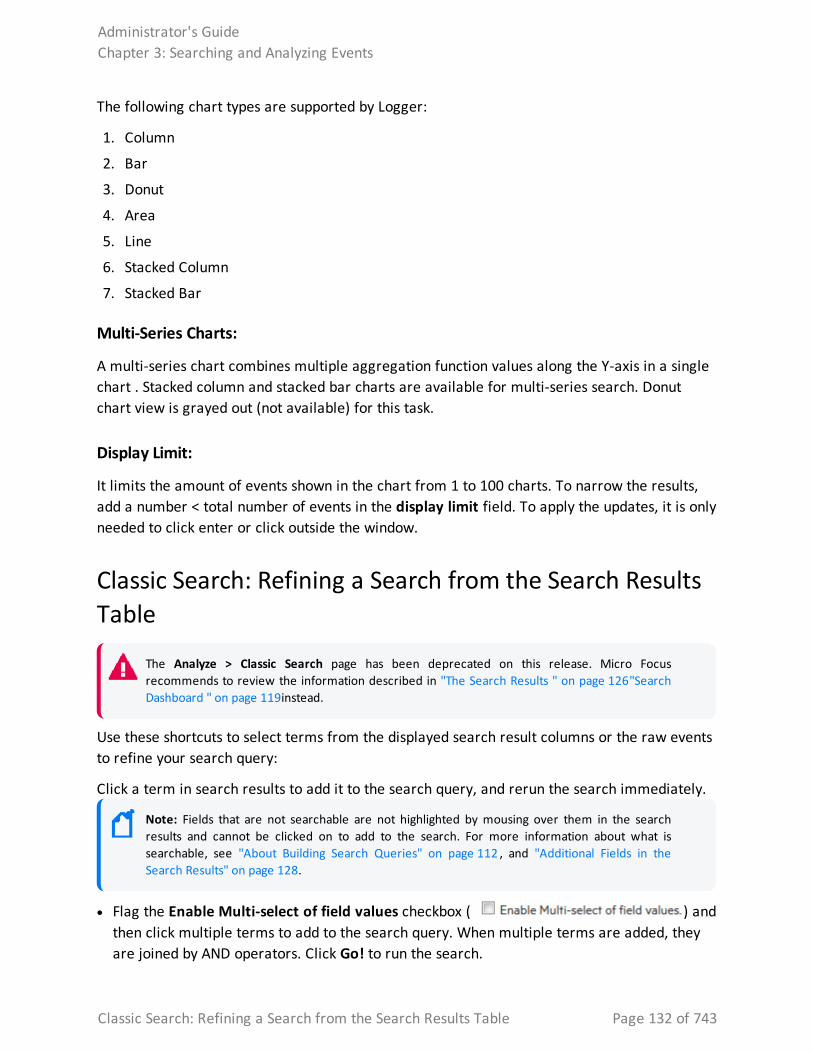
The following chart types are supported by Logger:
1. Column
2. Bar
3. Donut
4. Area
5. Line
6. Stacked Column
7. Stacked Bar
Multi-Series Charts:
A multi-series chart combines multiple aggregation function values along the Y-axis in a single chart . Stacked column and stacked bar charts are available for multi-series search. Donut chart view is grayed out (not available) for this task.
Display Limit:
It limits the amount of events shown in the chart from 1 to 100 charts. To narrow the results, add a number < total number of events in the display limit field. To apply the updates, it is only needed to click enter or click outside the window.
Classic Search: Refining a Search from the Search Results Table
The Analyze > Classic Search page has been deprecated on this release. Micro Focus recommends to review the information described in "The Search Results " on page 126"Search Dashboard " on page 119instead.
Use these shortcuts to select terms from the displayed search result columns or the raw events to refine your search query:
Click a term in search results to add it to the search query, and rerun the search immediately.
Note: Fields that are not searchable are not highlighted by mousing over them in the search results and cannot be clicked on to add to the search. For more information about what is searchable, see "About Building Search Queries" on page 112 , and "Additional Fields in the Search Results" on page 128.
l Flag the Enable Multi-select of field values checkbox ( ) and then click multiple terms to add to the search query. When multiple terms are added, they are joined by AND operators. Click Go! to run the search.
Administrator's GuideChapter 3: Searching and Analyzing Events
Classic Search: Refining a Search from the Search Results Table Page 132 of 743
l Ctrl+click to replace the entire search query with <field name> + "CONTAINS" + <selected term>, and rerun the search immediately.
l Alt or Shift + click the term in search results to add NOT to the term, and rerun the query, thus eliminating the events that match the term you selected.
l Add multiple NOT conditions by holding the Alt key and selecting terms in search results. When multiple conditions are added, they are joined by AND operators. If Enable Multi-select of field values is checked, click Go! to run the search. If it is not checked, the search runs when you click the term.
l Combine Ctrl+Alt, (or Ctrl+Shift) to replace the search query withNOT + <field name> + "CONTAINS" + <selected term>.
Classic Search: Changing the Displayed Search Results Using Field Sets
The Analyze > Classic Search page has been deprecated on this release. Micro Focus recommends to review the different view results from the Analyze > Search page described in "The Search Results " on page 126.
By default, the Search Results are displayed using the All Fields field set, which displays all fields contained in an event. Once you select another field set, it becomes your default view until you change it the next time. For a detailed discussion about field sets, see "Fieldsets " on page 95.
If you view the Search Results using the Raw Event field set, remember these guidelines:
l Even though the rawEvent column displays the raw event, this column is not added to the Logger database and is not indexed. Therefore, you can only run a keyword (full-text) or regular expression to search on the event.
l You can use the Regex Helper tool to identify strings from the raw syslog events in the rawEvent column that you want to add to a query. (You cannot use the Regex Helper for CEF events displayed in the rawEvent column.) See " Regex Helper Tool" on page 101 for more details.
To View Raw Events field sets
To view the raw data of an event, click the icon to the left of the event. Otherwise, click
to observe raw data for all displayed events.
Administrator's GuideChapter 3: Searching and Analyzing Events
Classic Search: Changing the Displayed Search Results Using Field Sets Page 133 of 743
Note: You can also view the Syslog raw events in a formatted column called rawEvent if you have enabled the “Populate rawEvent field for syslog events” option on the Search Options page. See "Global Search Options" on page 333. See "Predefined Fieldsets" on page 96 to learn more about displaying raw events.
Classic Search: Multi-line Data Display
The Analyze > Classic Search page has been deprecated on this release. Micro Focus recommends to review the different functions that offers the Analyze > Search page.
An event field might span multiple lines separated by characters such as newline (\n) or carriage return (\r). For example,
0x0000: 0000 0100 0000 0000 0000 0000 0000 0000 ................ 0x0010: 0000 0000 0000 0000 0000 0000 0000 0000 ................ 0x0020: 0000 0000 0000 0000 0000 0000 0000 ..............
The Logger user interface displays these in multi-line format and does not remove the line separators and collapse the message into one line.
The Field Summary PanelWhen a query is run, the Field Summary panel lists the CEF and non-CEF fields that occur in matching events and the number of unique values for each in those events. This panel is only displayed for queries that do not generate charts. If a peer search is performed, the summarized field values include counts from peer Loggers.
Administrator's GuideChapter 3: Searching and Analyzing Events
Classic Search: Multi-line Data Display Page 134 of 743
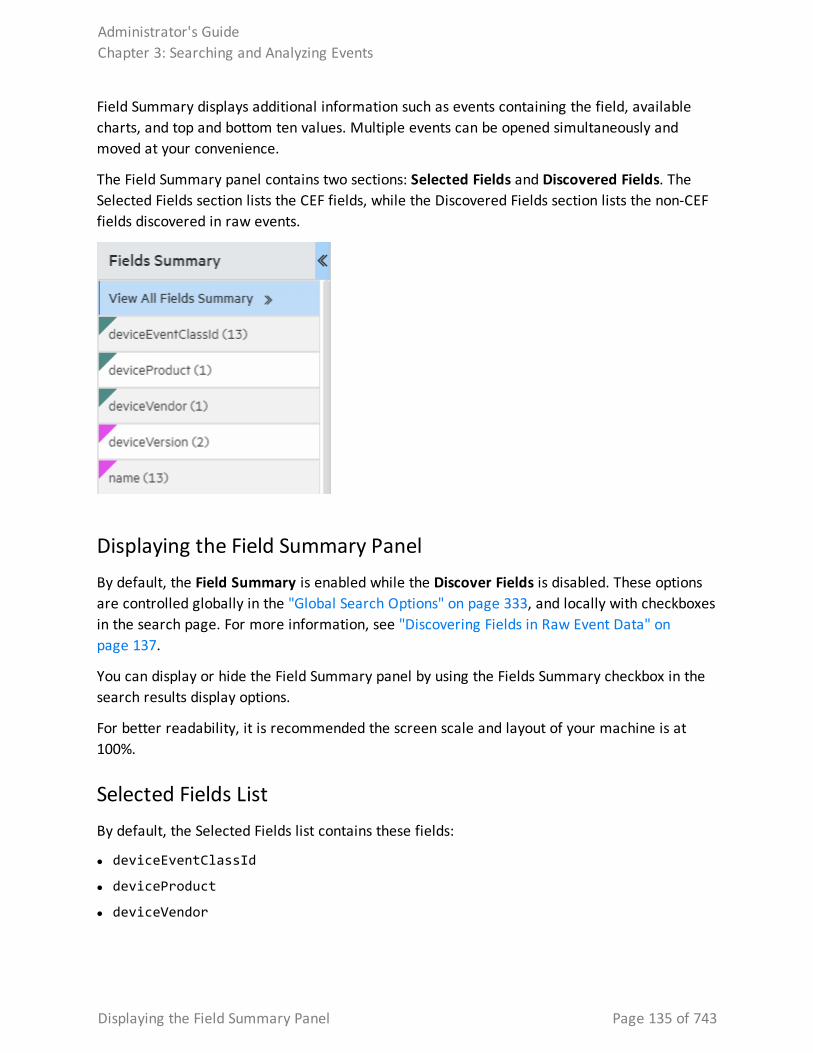
Field Summary displays additional information such as events containing the field, available charts, and top and bottom ten values. Multiple events can be opened simultaneously and moved at your convenience.
The Field Summary panel contains two sections: Selected Fields and Discovered Fields. The Selected Fields section lists the CEF fields, while the Discovered Fields section lists the non-CEF fields discovered in raw events.
Displaying the Field Summary PanelBy default, the Field Summary is enabled while the Discover Fields is disabled. These options are controlled globally in the "Global Search Options" on page 333, and locally with checkboxes in the search page. For more information, see "Discovering Fields in Raw Event Data" on page 137.
You can display or hide the Field Summary panel by using the Fields Summary checkbox in the search results display options.
For better readability, it is recommended the screen scale and layout of your machine is at 100%.
Selected Fields ListBy default, the Selected Fields list contains these fields:
l deviceEventClassId
l deviceProduct
l deviceVendor
Administrator's GuideChapter 3: Searching and Analyzing Events
Displaying the Field Summary Panel Page 135 of 743
l deviceVersion
l name
You can edit this list to suit your needs. By default, this list displays the top 10 values for each field.
You can change the fields displayed in the Field Summary panel's Selected Fields list by changing the field-set. You can use one of the predefined fieldsets or create your own to include only the fields you need.
To change the Selected Fields list:
1. Define or update an existing custom field set to include fields you want the Selected Fields list to contain. See "Fieldsets " on page 95 for information on creating custom field sets.
2. Select the custom field set you defined to view search results.
3. After running a search query, if you select a different field set, the Field Summary panel displays the following message: "The Field Summary is out of sync with the events table".
This message indicates that the fields listed in the Field Summary panel do not match the ones specified in the newly selected field set. To display the fields specified in the new field set, click Update now.
Field Summary Drill DownYou can drill down on any of the listed fields or a specific value of the listed fields in the Fields Summary panel.
For example, you might want to view all events containing deviceEventClassId (specific field) or you might want to view events of deviceEventClassId “storagegroup:100” (specific value of a field).
For fields whose values are of type STRING, you can view all events, view the top ten, or create charts of the matching events. For fields whose values are of type NUMERIC, you can perform mathematical operations such as average, min, and max.
Every time you run a query or drill down on a specific field or value, a new query using the newly selected criteria is run and the Field Summary list is updated.
Administrator's GuideChapter 3: Searching and Analyzing Events
Field Summary Drill Down Page 136 of 743
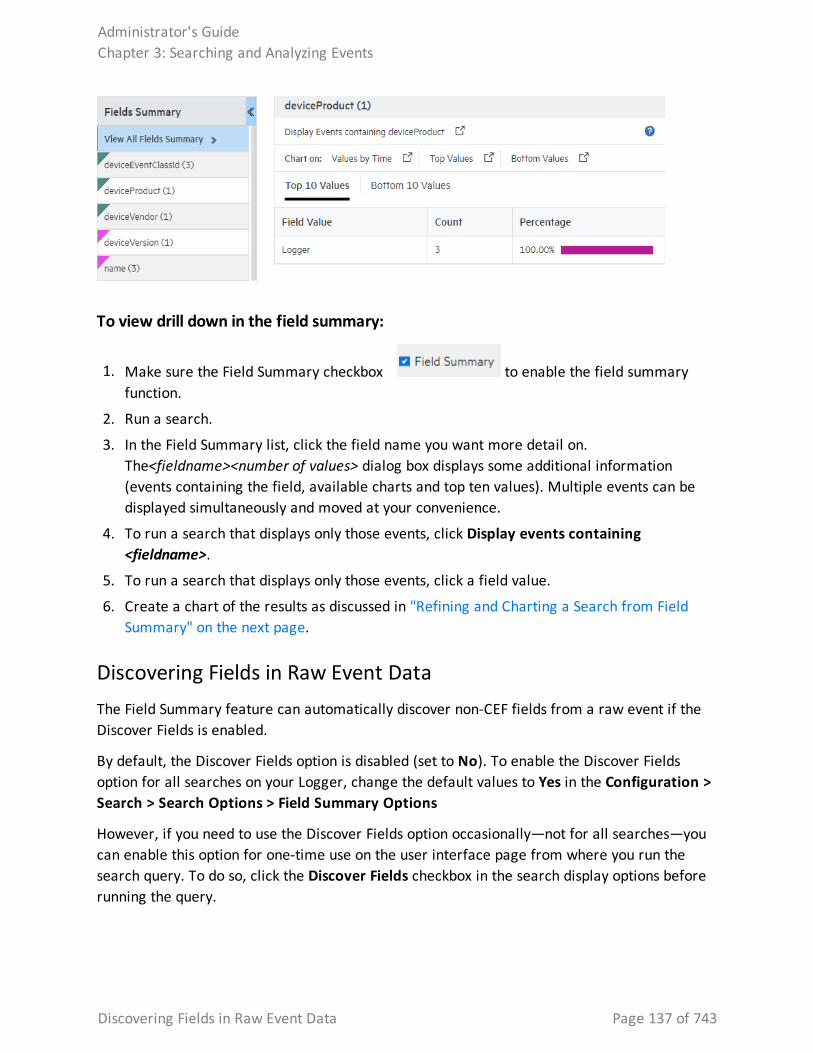
To view drill down in the field summary:
1. Make sure the Field Summary checkbox to enable the field summary function.
2. Run a search.
3. In the Field Summary list, click the field name you want more detail on. The<fieldname><number of values> dialog box displays some additional information (events containing the field, available charts and top ten values). Multiple events can be displayed simultaneously and moved at your convenience.
4. To run a search that displays only those events, click Display events containing <fieldname>.
5. To run a search that displays only those events, click a field value.
6. Create a chart of the results as discussed in "Refining and Charting a Search from Field Summary" on the next page.
Discovering Fields in Raw Event DataThe Field Summary feature can automatically discover non-CEF fields from a raw event if the Discover Fields is enabled.
By default, the Discover Fields option is disabled (set to No). To enable the Discover Fields option for all searches on your Logger, change the default values to Yes in the Configuration > Search > Search Options > Field Summary Options
However, if you need to use the Discover Fields option occasionally—not for all searches—you can enable this option for one-time use on the user interface page from where you run the search query. To do so, click the Discover Fields checkbox in the search display options before running the query.
Administrator's GuideChapter 3: Searching and Analyzing Events
Discovering Fields in Raw Event Data Page 137 of 743
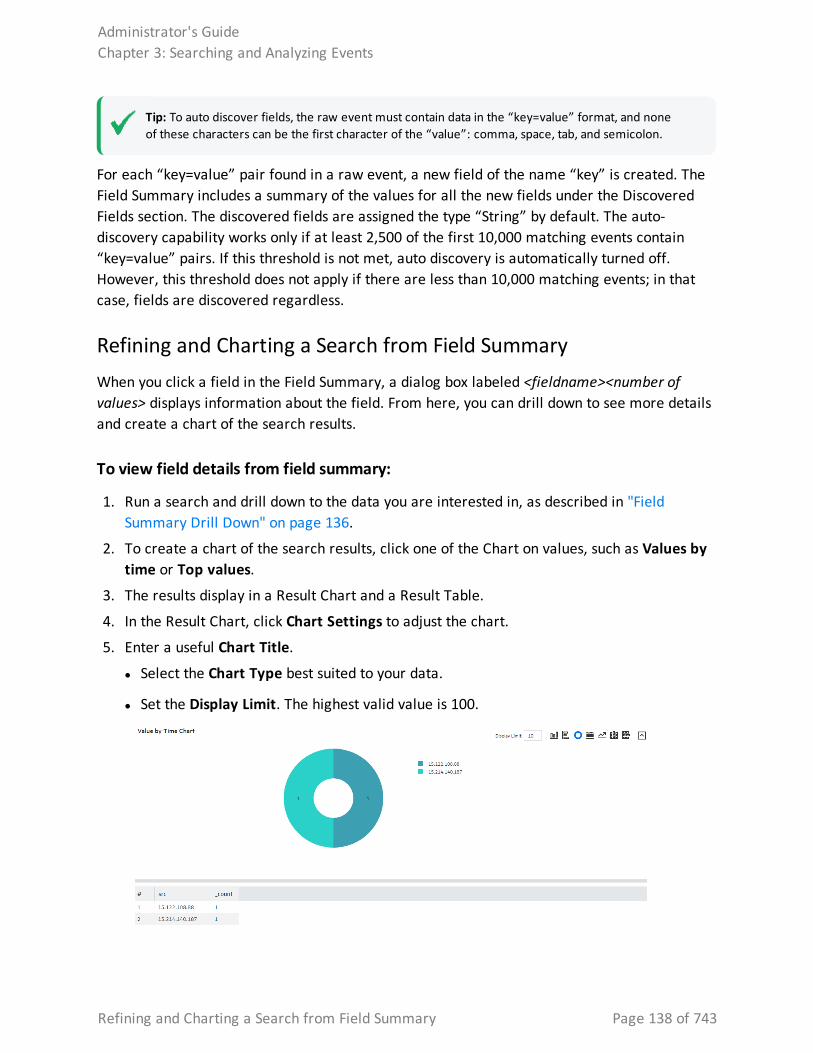
Tip: To auto discover fields, the raw event must contain data in the “key=value” format, and none of these characters can be the first character of the “value”: comma, space, tab, and semicolon.
For each “key=value” pair found in a raw event, a new field of the name “key” is created. The Field Summary includes a summary of the values for all the new fields under the Discovered Fields section. The discovered fields are assigned the type “String” by default. The auto-discovery capability works only if at least 2,500 of the first 10,000 matching events contain “key=value” pairs. If this threshold is not met, auto discovery is automatically turned off. However, this threshold does not apply if there are less than 10,000 matching events; in that case, fields are discovered regardless.
Refining and Charting a Search from Field SummaryWhen you click a field in the Field Summary, a dialog box labeled <fieldname><number of values> displays information about the field. From here, you can drill down to see more details and create a chart of the search results.
To view field details from field summary:
1. Run a search and drill down to the data you are interested in, as described in "Field Summary Drill Down" on page 136.
2. To create a chart of the search results, click one of the Chart on values, such as Values by time or Top values.
3. The results display in a Result Chart and a Result Table.
4. In the Result Chart, click Chart Settings to adjust the chart.
5. Enter a useful Chart Title.
l Select the Chart Type best suited to your data.
l Set the Display Limit. The highest valid value is 100.
Administrator's GuideChapter 3: Searching and Analyzing Events
Refining and Charting a Search from Field Summary Page 138 of 743
6. In the Result Table, you can use navigation buttons to move forward and backward through list of results, and refresh the search.
To create a PDF or CSV file containing the search results, click Export Results . For more information, see "Exporting Search Results" on the next page.
Saving the Search ResultsYou can save the results of any search by exporting them in PDF or CSV format:
l PDF: Useful in generating a quick report of the search results. The report includes a table of search results and any charts generated for the results. Both raw (unstructured data) and CEF (structured data) events, can be included in the exported report.
l Comma-separated values (CSV) file: Useful for further analysis with other software applications. The report includes a table of search results. Charts cannot be included in this format.
Data for the following time fields is exported in human-readable format: deviceReceiptTime, startTime, endTime, agentReceiptTime. For example, 2015/03/21 20:22:09 PDT.
Additionally, you can also schedule your export results. Take into consideration though, export execution time is proportional to the number of events being exported. Micro Focus recommends that you schedule a high event export operation to be performed at a later time by saving the query and time parameters as a saved search, and then scheduling a saved search Job. For more information, see " Scheduled Searches/Alerts" on page 320.
Persisting Search Results When persisting search results, users can save data and view the results at a later time, allowing you to save time and perform other activities meanwhile.
To persist searches, make sure to be granted the following minimum rights:
l Logger Search Rights for search events.
l Logger Search Rights for search events on remote peers.
l Search Results for use and view search result.
l Search Results for save search result.
The save active search function will be enabled once a query has been inserted and the preliminary results are displayed on the page. To save a search result, go to Analyze > Search page, you can enter a query and save it. Each search result must have a unique name. For
Administrator's GuideChapter 3: Searching and Analyzing Events
Saving the Search Results Page 139 of 743
more details on how to save your search result, see "Save a Filter, Saved Search, Dashboard Panel, or Search Results" on page 145.
Search results are not included in the Logger configuration backup.
Caution: Make sure the retention period added for the search result is lower than the retention of the storage groups involved in the search.
Loading a Search Result
To access the search result, click the icon. Logger will not execute the search again, but rather load the results, decreasing the waiting time significantly. Depending on the query details you added, a chart or histogram will retrieve the original search result details ( field summary, discover fields, time range, query, hit events, scanned events, local only, and time type).
The search result limit is determined by the parameters described below. These are not individual values but rather shared among all users of the Logger.
1. Maximum limit size on disk (default value is 1GB).
2. Maximum limit quantity of search result (default value is 1000).
When loading data, take into consideration the following details:
l Retention period is not expired as the search result references will be removed from the system.
l The original search is already completed and not longer active.
l The search result is not being retrieved in multiple tabs of Logger.
Caution: The peer stats, fieldset, and chart type values are not persisted by Logger. Therefore, these values will not be retrieved when loading the results.
For more information on how to load a search result, see "Searching with Saved Queries" on page 156.
Exporting Search Results
To export the results of your search:
1. Run a search query from the Search page.
2. Click the Export Results icon above the histogram.
3. Select the appropriate export option:
Administrator's GuideChapter 3: Searching and Analyzing Events
Exporting Search Results Page 140 of 743
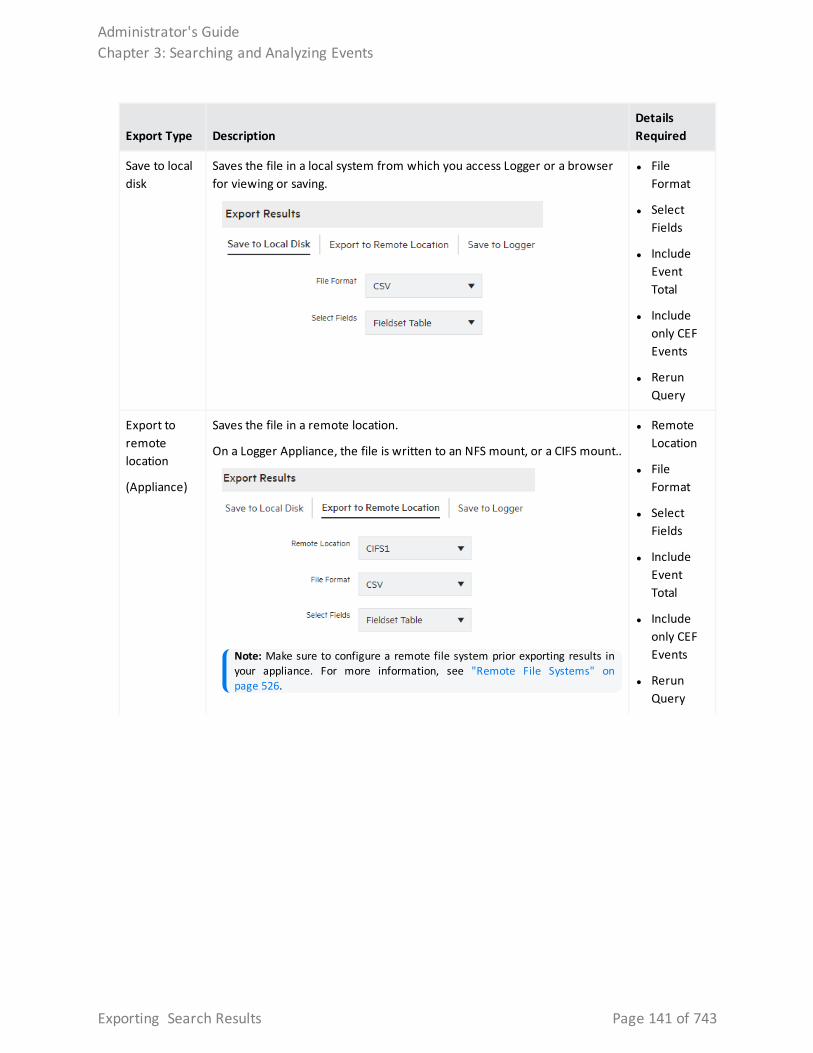
Export Type DescriptionDetails Required
Save to local disk
Saves the file in a local system from which you access Logger or a browser for viewing or saving.
l File Format
l Select Fields
l Include Event Total
l Include only CEF Events
l Rerun Query
Export to remote location
(Appliance)
Saves the file in a remote location.
On a Logger Appliance, the file is written to an NFS mount, or a CIFS mount..
Note: Make sure to configure a remote file system prior exporting results in your appliance. For more information, see "Remote File Systems" on page 526.
l Remote Location
l File Format
l Select Fields
l Include Event Total
l Include only CEF Events
l Rerun Query
Administrator's GuideChapter 3: Searching and Analyzing Events
Exporting Search Results Page 141 of 743
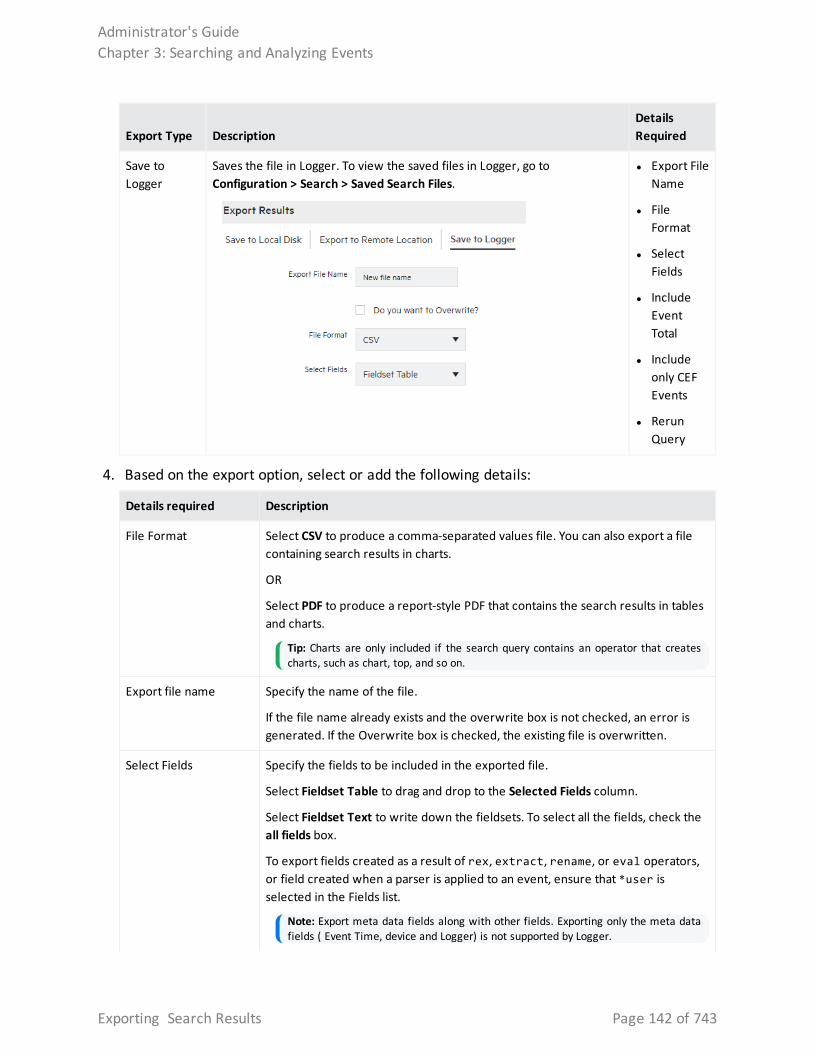
Export Type DescriptionDetails Required
Save to Logger
Saves the file in Logger. To view the saved files in Logger, go to Configuration > Search > Saved Search Files.
l Export File Name
l File Format
l Select Fields
l Include Event Total
l Include only CEF Events
l Rerun Query
4. Based on the export option, select or add the following details:
Details required Description
File Format Select CSV to produce a comma-separated values file. You can also export a file containing search results in charts.
OR
Select PDF to produce a report-style PDF that contains the search results in tables and charts.
Tip: Charts are only included if the search query contains an operator that creates charts, such as chart, top, and so on.
Export file name Specify the name of the file.
If the file name already exists and the overwrite box is not checked, an error is generated. If the Overwrite box is checked, the existing file is overwritten.
Select Fields Specify the fields to be included in the exported file.
Select Fieldset Table to drag and drop to the Selected Fields column.
Select Fieldset Text to write down the fieldsets. To select all the fields, check the all fields box.
To export fields created as a result of rex, extract, rename, or eval operators, or field created when a parser is applied to an event, ensure that *user is selected in the Fields list.
Note: Export meta data fields along with other fields. Exporting only the meta data fields ( Event Time, device and Logger) is not supported by Logger.
Administrator's GuideChapter 3: Searching and Analyzing Events
Exporting Search Results Page 142 of 743
Details required Description
Title (for PDF only) Enter a meaningful name that appears on top of the PDF file.
Make sure to select the All Fields option for this option to appear.
If no title is specified, search result will be named as “Untitled”.
Chart Type (for PDF only)
Select the type of chart to include in the PDF file. You can select from: Column, Bar, Donut, Area, Line, Stacked Column, Stacked Bar.
Note: If the Chart Type is different from the chart displayed on the Search Results screen, the value selected for this option overrides the one shown in the screen.
Chart Result Limit (for PDF only)
Specify the number of unique values to plot. Default: 10
If the configured Chart Result Limit is less than the number of unique values for a query, the top values equal to the Chart Result Limit are plotted.
Include Event Total Select to include the total number of events in the exported search results.
Include only CEF Events
Select to include CEF events in the exported search results.
Rerun query Select to rerun the query before exporting the search results.
5. Click Export. To exit the operation, click Cancel.
To view the export results status (query, timeline, events scanned, and progress), go to the section based on the option you selected.
l Save to Local Disk: Click on download results.
l Save to Logger: Click on Saved Search Files.
l Export to Remove Location: In the NFS drop down, click the NFS in which the results were saved. You will be redirected to the VM which later needs to be accessed.
Classic Search: Exporting Search Results
The Analyze > Classic Search page has been deprecated on this release. Micro Focus recommends to use the "Exporting Search Results" on page 140 "Search Dashboard " on page 119from the Analyze > Search page instead.
Caution: Before exporting, configure a remote file system. For more information, see "Remote File Systems" on page 526.
Administrator's GuideChapter 3: Searching and Analyzing Events
Classic Search: Exporting Search Results Page 143 of 743
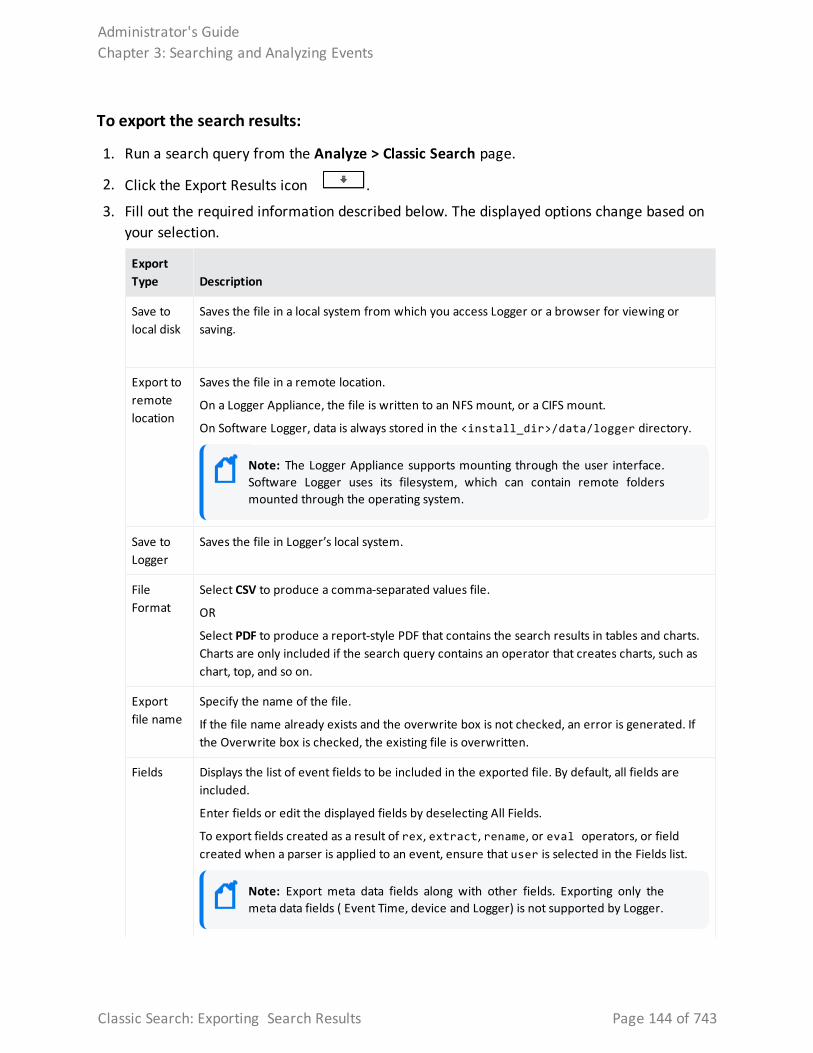
To export the search results:
1. Run a search query from the Analyze > Classic Search page.
2. Click the Export Results icon .
3. Fill out the required information described below. The displayed options change based on your selection.
Export Type Description
Save to local disk
Saves the file in a local system from which you access Logger or a browser for viewing or saving.
Export to remote location
Saves the file in a remote location.
On a Logger Appliance, the file is written to an NFS mount, or a CIFS mount.
On Software Logger, data is always stored in the <install_dir>/data/logger directory.
Note: The Logger Appliance supports mounting through the user interface. Software Logger uses its filesystem, which can contain remote folders mounted through the operating system.
Save to Logger
Saves the file in Logger’s local system.
File Format
Select CSV to produce a comma-separated values file.
OR
Select PDF to produce a report-style PDF that contains the search results in tables and charts. Charts are only included if the search query contains an operator that creates charts, such as chart, top, and so on.
Export file name
Specify the name of the file.
If the file name already exists and the overwrite box is not checked, an error is generated. If the Overwrite box is checked, the existing file is overwritten.
Fields Displays the list of event fields to be included in the exported file. By default, all fields are included.
Enter fields or edit the displayed fields by deselecting All Fields.
To export fields created as a result of rex, extract, rename, or eval operators, or field created when a parser is applied to an event, ensure that user is selected in the Fields list.
Note: Export meta data fields along with other fields. Exporting only the meta data fields ( Event Time, device and Logger) is not supported by Logger.
Administrator's GuideChapter 3: Searching and Analyzing Events
Classic Search: Exporting Search Results Page 144 of 743
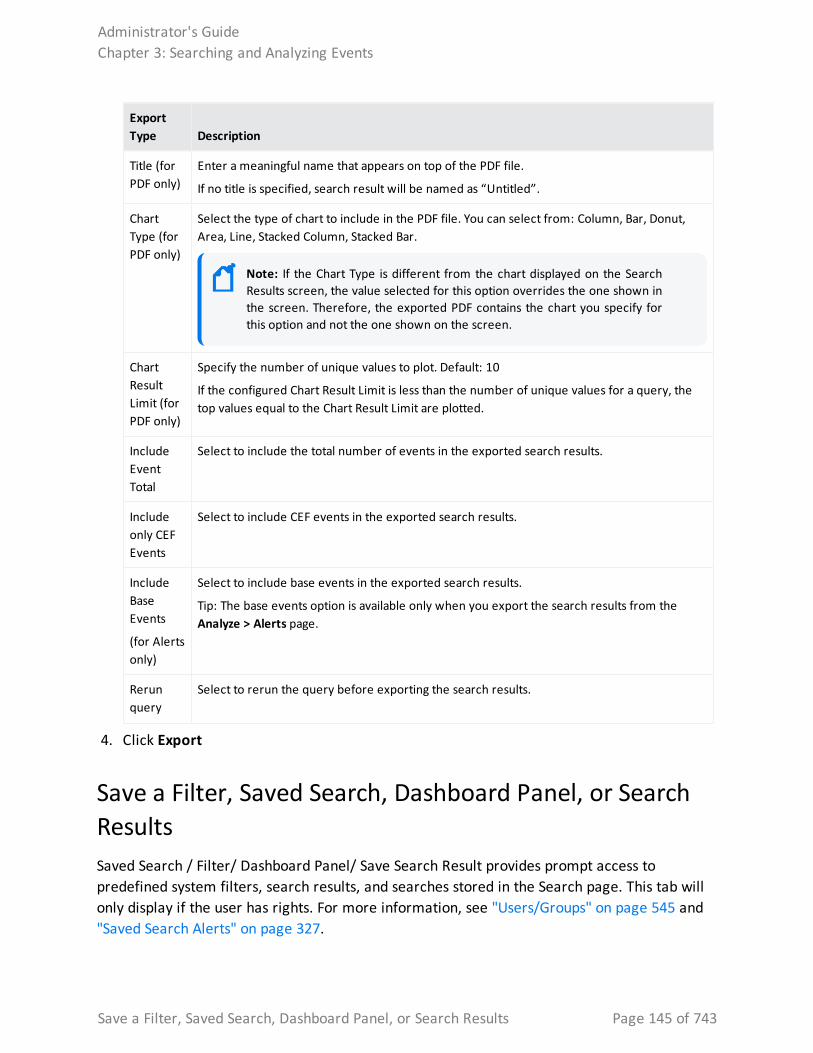
Export Type Description
Title (for PDF only)
Enter a meaningful name that appears on top of the PDF file.
If no title is specified, search result will be named as “Untitled”.
Chart Type (for PDF only)
Select the type of chart to include in the PDF file. You can select from: Column, Bar, Donut, Area, Line, Stacked Column, Stacked Bar.
Note: If the Chart Type is different from the chart displayed on the Search Results screen, the value selected for this option overrides the one shown in the screen. Therefore, the exported PDF contains the chart you specify for this option and not the one shown on the screen.
Chart Result Limit (for PDF only)
Specify the number of unique values to plot. Default: 10
If the configured Chart Result Limit is less than the number of unique values for a query, the top values equal to the Chart Result Limit are plotted.
Include Event Total
Select to include the total number of events in the exported search results.
Include only CEF Events
Select to include CEF events in the exported search results.
Include Base Events
(for Alerts only)
Select to include base events in the exported search results.
Tip: The base events option is available only when you export the search results from the Analyze > Alerts page.
Rerun query
Select to rerun the query before exporting the search results.
4. Click Export
Save a Filter, Saved Search, Dashboard Panel, or Search ResultsSaved Search / Filter/ Dashboard Panel/ Save Search Result provides prompt access to predefined system filters, search results, and searches stored in the Search page. This tab will only display if the user has rights. For more information, see "Users/Groups" on page 545 and "Saved Search Alerts" on page 327.
Administrator's GuideChapter 3: Searching and Analyzing Events
Save a Filter, Saved Search, Dashboard Panel, or Search Results Page 145 of 743
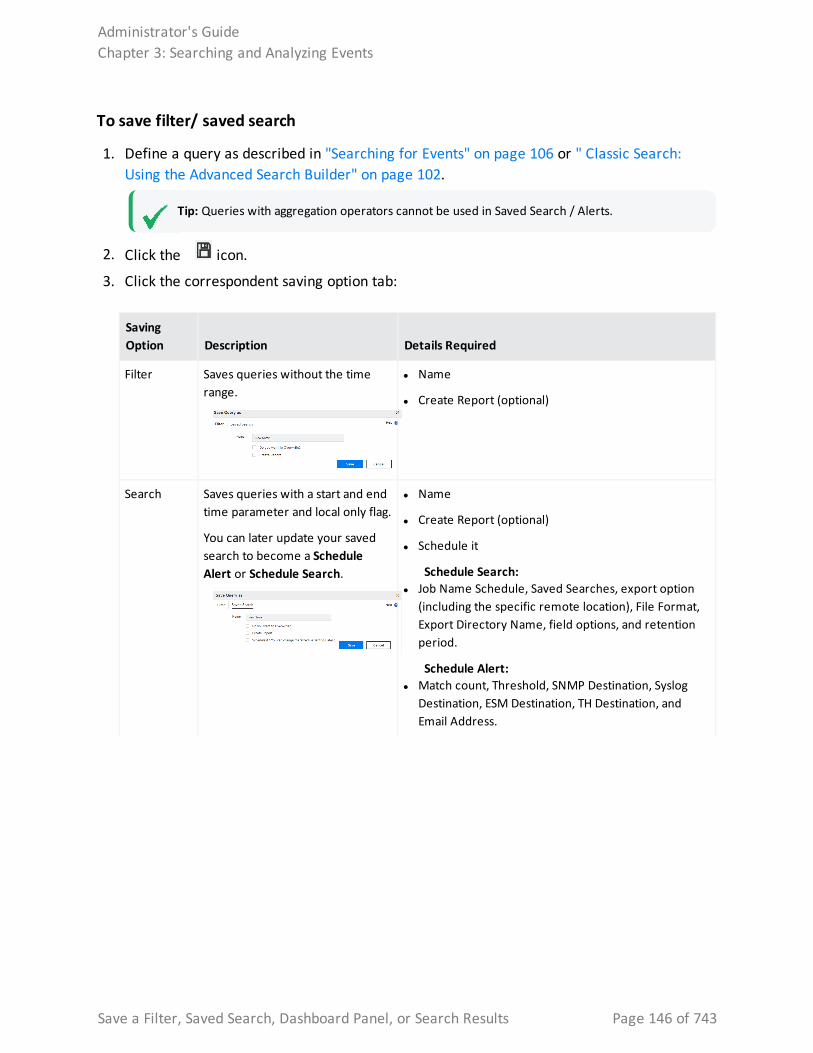
To save filter/ saved search
1. Define a query as described in "Searching for Events" on page 106 or " Classic Search: Using the Advanced Search Builder" on page 102.
Tip: Queries with aggregation operators cannot be used in Saved Search / Alerts.
2. Click the icon.
3. Click the correspondent saving option tab:
Saving Option Description Details Required
Filter Saves queries without the time range.
l Name
l Create Report (optional)
Search Saves queries with a start and end time parameter and local only flag.
You can later update your saved search to become a Schedule Alert or Schedule Search.
l Name
l Create Report (optional)
l Schedule it
Schedule Search: l Job Name Schedule, Saved Searches, export option
(including the specific remote location), File Format, Export Directory Name, field options, and retention period.
Schedule Alert: l Match count, Threshold, SNMP Destination, Syslog
Destination, ESM Destination, TH Destination, and Email Address.
Administrator's GuideChapter 3: Searching and Analyzing Events
Save a Filter, Saved Search, Dashboard Panel, or Search Results Page 146 of 743
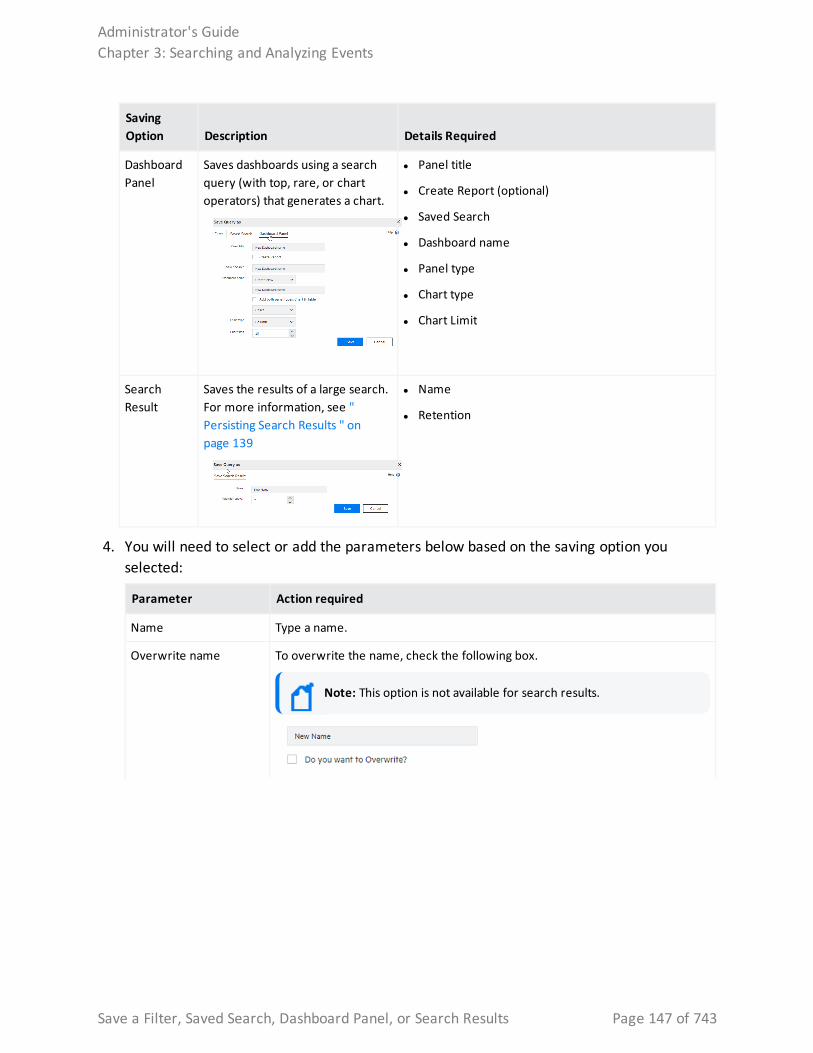
Saving Option Description Details Required
Dashboard Panel
Saves dashboards using a search query (with top, rare, or chart operators) that generates a chart.
l Panel title
l Create Report (optional)
l Saved Search
l Dashboard name
l Panel type
l Chart type
l Chart Limit
Search Result
Saves the results of a large search. For more information, see " Persisting Search Results " on page 139
l Name
l Retention
4. You will need to select or add the parameters below based on the saving option you selected:
Parameter Action required
Name Type a name.
Overwrite name To overwrite the name, check the following box.
Note: This option is not available for search results.
Administrator's GuideChapter 3: Searching and Analyzing Events
Save a Filter, Saved Search, Dashboard Panel, or Search Results Page 147 of 743
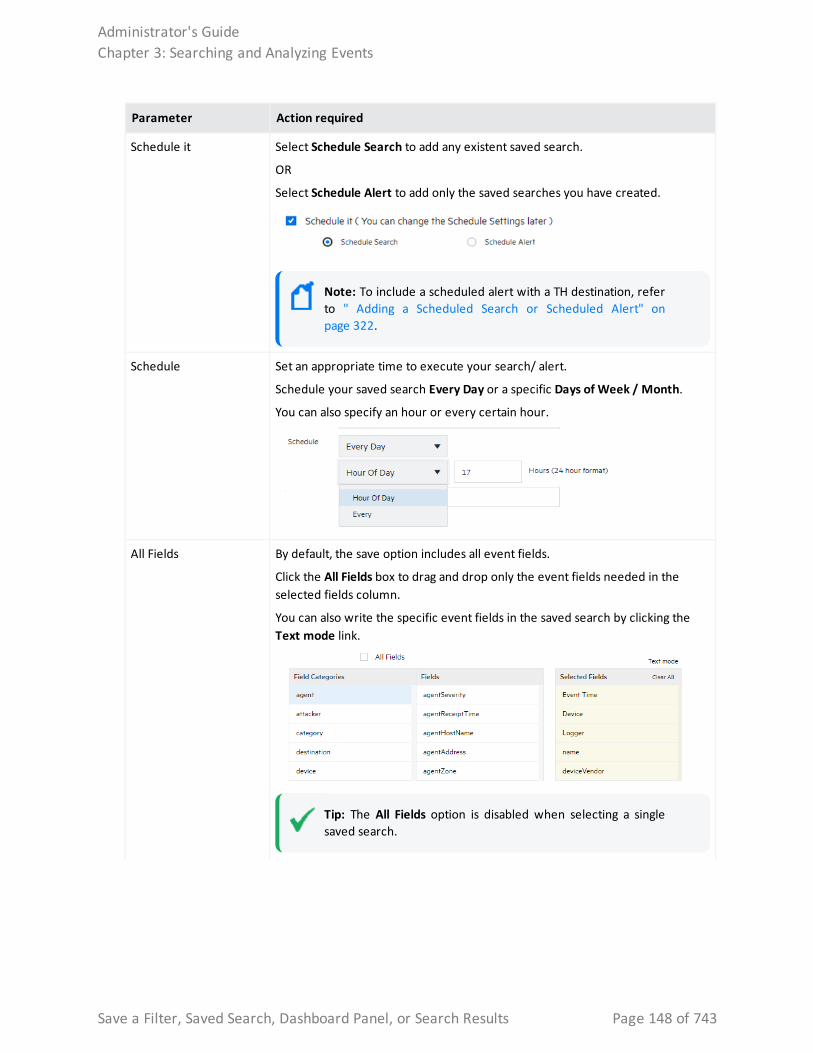
Parameter Action required
Schedule it Select Schedule Search to add any existent saved search.
OR
Select Schedule Alert to add only the saved searches you have created.
Note: To include a scheduled alert with a TH destination, refer to " Adding a Scheduled Search or Scheduled Alert" on page 322.
Schedule Set an appropriate time to execute your search/ alert.
Schedule your saved search Every Day or a specific Days of Week / Month.
You can also specify an hour or every certain hour.
All Fields By default, the save option includes all event fields.
Click the All Fields box to drag and drop only the event fields needed in the selected fields column.
You can also write the specific event fields in the saved search by clicking the Text mode link.
Tip: The All Fields option is disabled when selecting a single saved search.
Administrator's GuideChapter 3: Searching and Analyzing Events
Save a Filter, Saved Search, Dashboard Panel, or Search Results Page 148 of 743
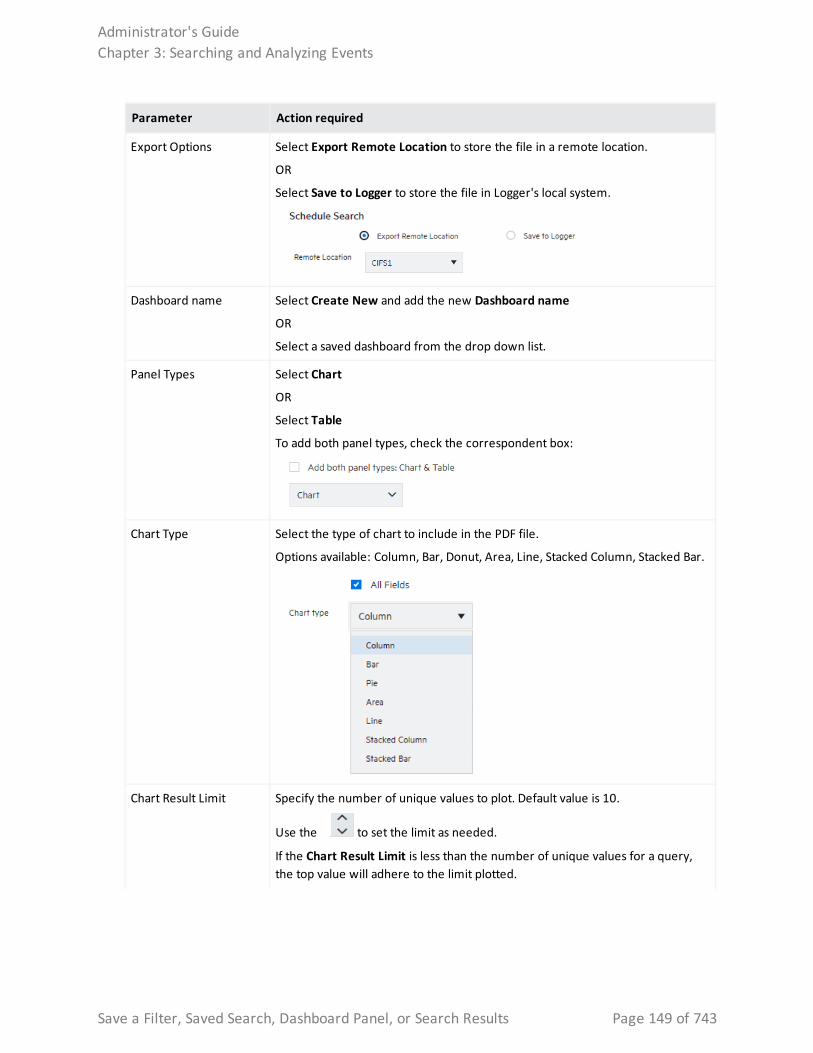
Parameter Action required
Export Options Select Export Remote Location to store the file in a remote location.
OR
Select Save to Logger to store the file in Logger's local system.
Dashboard name Select Create New and add the new Dashboard name
OR
Select a saved dashboard from the drop down list.
Panel Types Select Chart
OR
Select Table
To add both panel types, check the correspondent box:
Chart Type Select the type of chart to include in the PDF file.
Options available: Column, Bar, Donut, Area, Line, Stacked Column, Stacked Bar.
Chart Result Limit Specify the number of unique values to plot. Default value is 10.
Use the to set the limit as needed.
If the Chart Result Limit is less than the number of unique values for a query, the top value will adhere to the limit plotted.
Administrator's GuideChapter 3: Searching and Analyzing Events
Save a Filter, Saved Search, Dashboard Panel, or Search Results Page 149 of 743
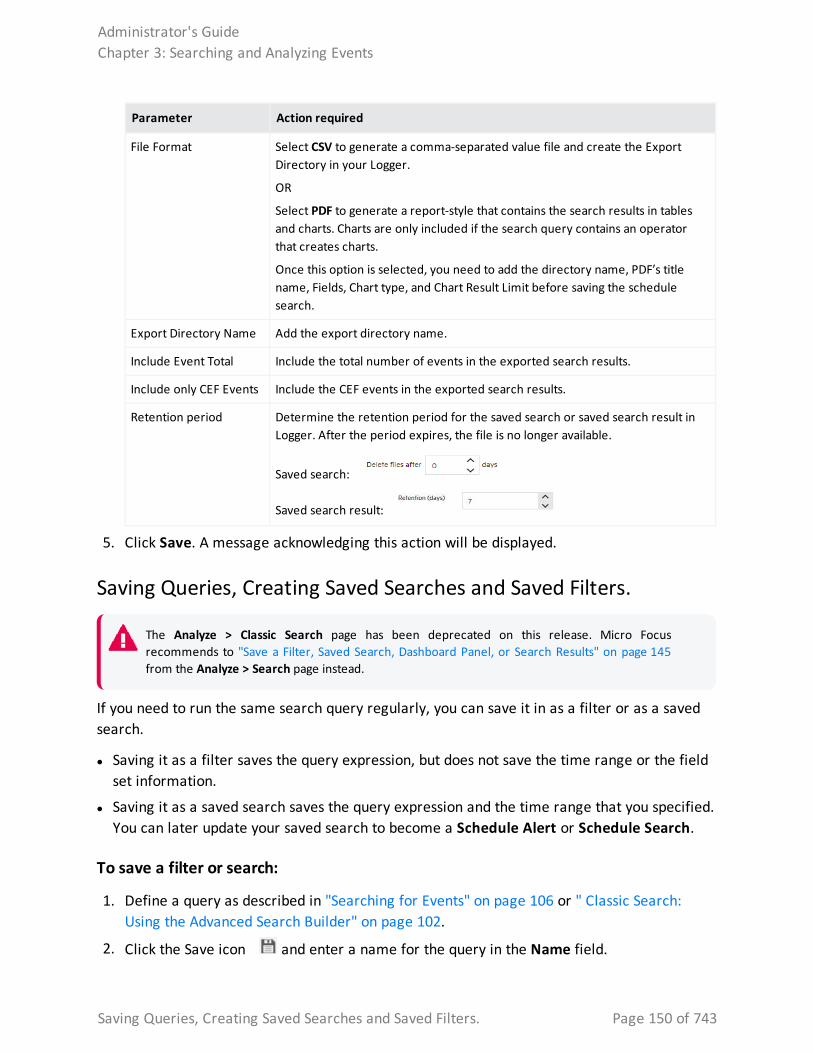
Parameter Action required
File Format Select CSV to generate a comma-separated value file and create the Export Directory in your Logger.
OR
Select PDF to generate a report-style that contains the search results in tables and charts. Charts are only included if the search query contains an operator that creates charts.
Once this option is selected, you need to add the directory name, PDF’s title name, Fields, Chart type, and Chart Result Limit before saving the schedule search.
Export Directory Name Add the export directory name.
Include Event Total Include the total number of events in the exported search results.
Include only CEF Events Include the CEF events in the exported search results.
Retention period Determine the retention period for the saved search or saved search result in Logger. After the period expires, the file is no longer available.
Saved search:
Saved search result:
5. Click Save. A message acknowledging this action will be displayed.
Saving Queries, Creating Saved Searches and Saved Filters.
The Analyze > Classic Search page has been deprecated on this release. Micro Focus recommends to "Save a Filter, Saved Search, Dashboard Panel, or Search Results" on page 145 from the Analyze > Search page instead.
If you need to run the same search query regularly, you can save it in as a filter or as a saved search.
l Saving it as a filter saves the query expression, but does not save the time range or the field set information.
l Saving it as a saved search saves the query expression and the time range that you specified. You can later update your saved search to become a Schedule Alert or Schedule Search.
To save a filter or search:
1. Define a query as described in "Searching for Events" on page 106 or " Classic Search: Using the Advanced Search Builder" on page 102.
2. Click the Save icon and enter a name for the query in the Name field.
Administrator's GuideChapter 3: Searching and Analyzing Events
Saving Queries, Creating Saved Searches and Saved Filters. Page 150 of 743
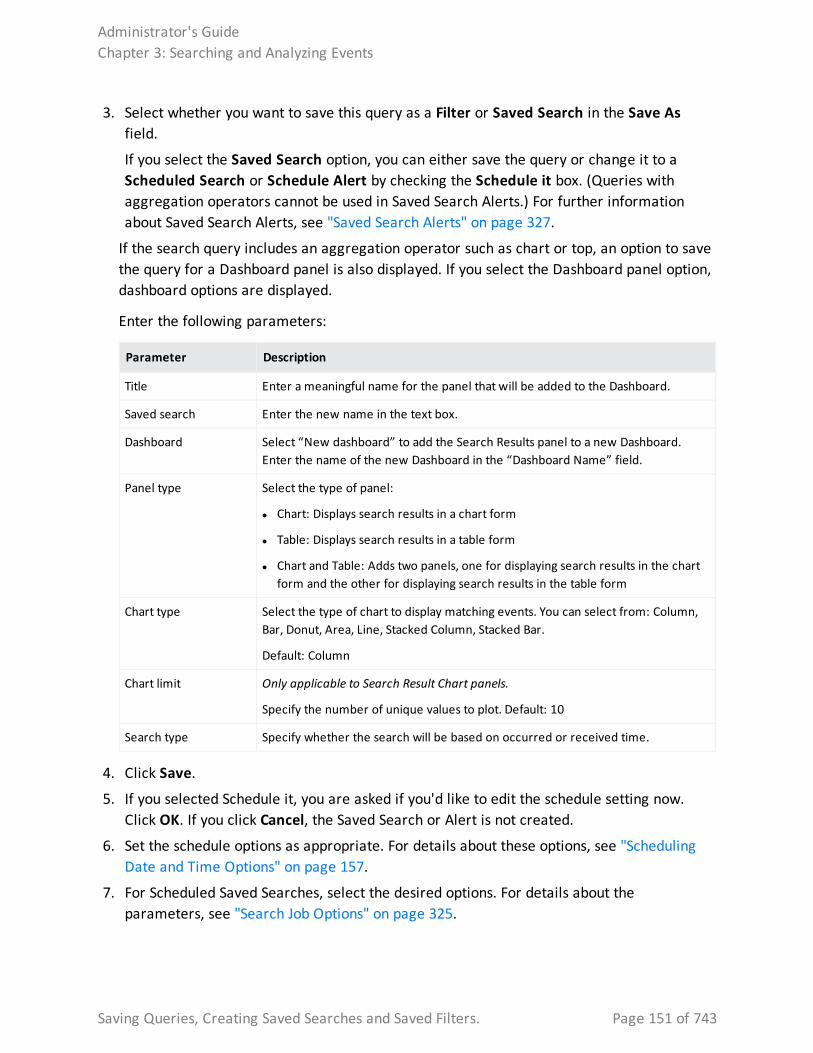
3. Select whether you want to save this query as a Filter or Saved Search in the Save As field.
If you select the Saved Search option, you can either save the query or change it to a Scheduled Search or Schedule Alert by checking the Schedule it box. (Queries with aggregation operators cannot be used in Saved Search Alerts.) For further information about Saved Search Alerts, see "Saved Search Alerts" on page 327.
If the search query includes an aggregation operator such as chart or top, an option to save the query for a Dashboard panel is also displayed. If you select the Dashboard panel option, dashboard options are displayed.
Enter the following parameters:
Parameter Description
Title Enter a meaningful name for the panel that will be added to the Dashboard.
Saved search Enter the new name in the text box.
Dashboard Select “New dashboard” to add the Search Results panel to a new Dashboard. Enter the name of the new Dashboard in the “Dashboard Name” field.
Panel type Select the type of panel:
l Chart: Displays search results in a chart form
l Table: Displays search results in a table form
l Chart and Table: Adds two panels, one for displaying search results in the chart form and the other for displaying search results in the table form
Chart type Select the type of chart to display matching events. You can select from: Column, Bar, Donut, Area, Line, Stacked Column, Stacked Bar.
Default: Column
Chart limit Only applicable to Search Result Chart panels.
Specify the number of unique values to plot. Default: 10
Search type Specify whether the search will be based on occurred or received time.
4. Click Save.
5. If you selected Schedule it, you are asked if you'd like to edit the schedule setting now. Click OK. If you click Cancel, the Saved Search or Alert is not created.
6. Set the schedule options as appropriate. For details about these options, see "Scheduling Date and Time Options" on page 157.
7. For Scheduled Saved Searches, select the desired options. For details about the parameters, see "Search Job Options" on page 325.
Administrator's GuideChapter 3: Searching and Analyzing Events
Saving Queries, Creating Saved Searches and Saved Filters. Page 151 of 743
8. For Scheduled Alerts, select the desired options. For details about the parameters, see "Alert Job Options" on page 327.
9. Click Save.
To save a query as a report:
a. From Analyze > Classic Search, insert query.
Specific events will be displayed.
b. Select if you want to save a Filter or a Saved Search and click Create Report
Note: The report will be saved with the name of your preference. Saving the same query as a report on a different date will automatically save it in a sequential order.
Tip: Users may change the fields of query objects based on Logger filters or saved searches. The report layouts of report objects cannot be changed but users can customize the report and select the new fields. When updating a query that includes a chart, a new report must be created.
System Filters/Predefined FiltersYour Logger ships with a number of predefined filters, also known as system filters. These filters define queries for commonly searched events. For example, unsuccessful login attempts or the number of events by source. Filter queries are available as Unified queries and as Regular Expression queries. Unified queries can be used for searching and reporting while Regular Expression queries are for defining alerts and forwarders.
Note: To effectively use the Firewall or UNIX Server use case filters (listed in the following table), define device groups that include the firewall devices or UNIX servers that you are interested in and then constrain your search to those device groups. If you do not create device groups specific to device types, the search results would match all Deny, Drop, or Permit events from all devices instead of only the firewall devices. Similarly, the “Unix-IO Errors and Warnings” filter would include IO errors and warnings from all devices and not only the UNIX servers.
The following is a list of all the system filters. For a description of each filter, see "System Filters" on page 724.
To use a predefined system filter, follow instructions in "Searching with Saved Queries" on page 156.
Administrator's GuideChapter 3: Searching and Analyzing Events
System Filters/Predefined Filters Page 152 of 743
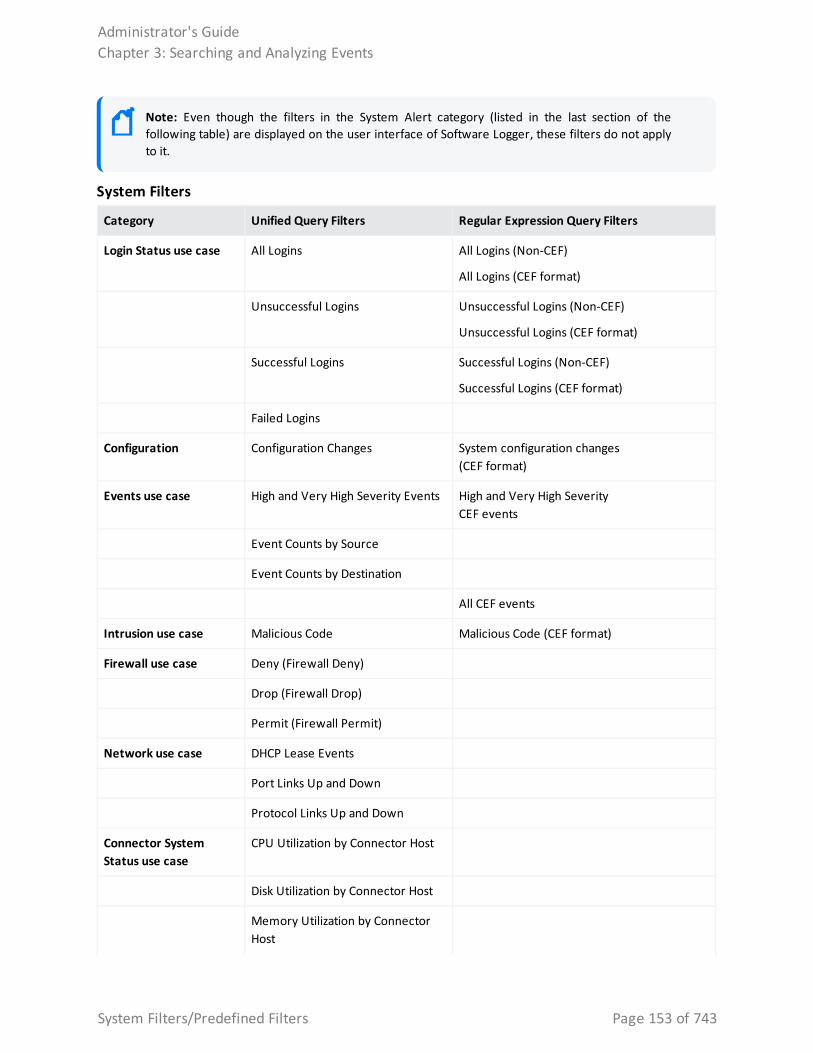
Note: Even though the filters in the System Alert category (listed in the last section of the following table) are displayed on the user interface of Software Logger, these filters do not apply to it.
Category Unified Query Filters Regular Expression Query Filters
Login Status use case All Logins All Logins (Non-CEF)
All Logins (CEF format)
Unsuccessful Logins Unsuccessful Logins (Non-CEF)
Unsuccessful Logins (CEF format)
Successful Logins Successful Logins (Non-CEF)
Successful Logins (CEF format)
Failed Logins
Configuration Configuration Changes System configuration changes (CEF format)
Events use case High and Very High Severity Events High and Very High Severity CEF events
Event Counts by Source
Event Counts by Destination
All CEF events
Intrusion use case Malicious Code Malicious Code (CEF format)
Firewall use case Deny (Firewall Deny)
Drop (Firewall Drop)
Permit (Firewall Permit)
Network use case DHCP Lease Events
Port Links Up and Down
Protocol Links Up and Down
Connector System Status use case
CPU Utilization by Connector Host
Disk Utilization by Connector Host
Memory Utilization by Connector Host
System Filters
Administrator's GuideChapter 3: Searching and Analyzing Events
System Filters/Predefined Filters Page 153 of 743
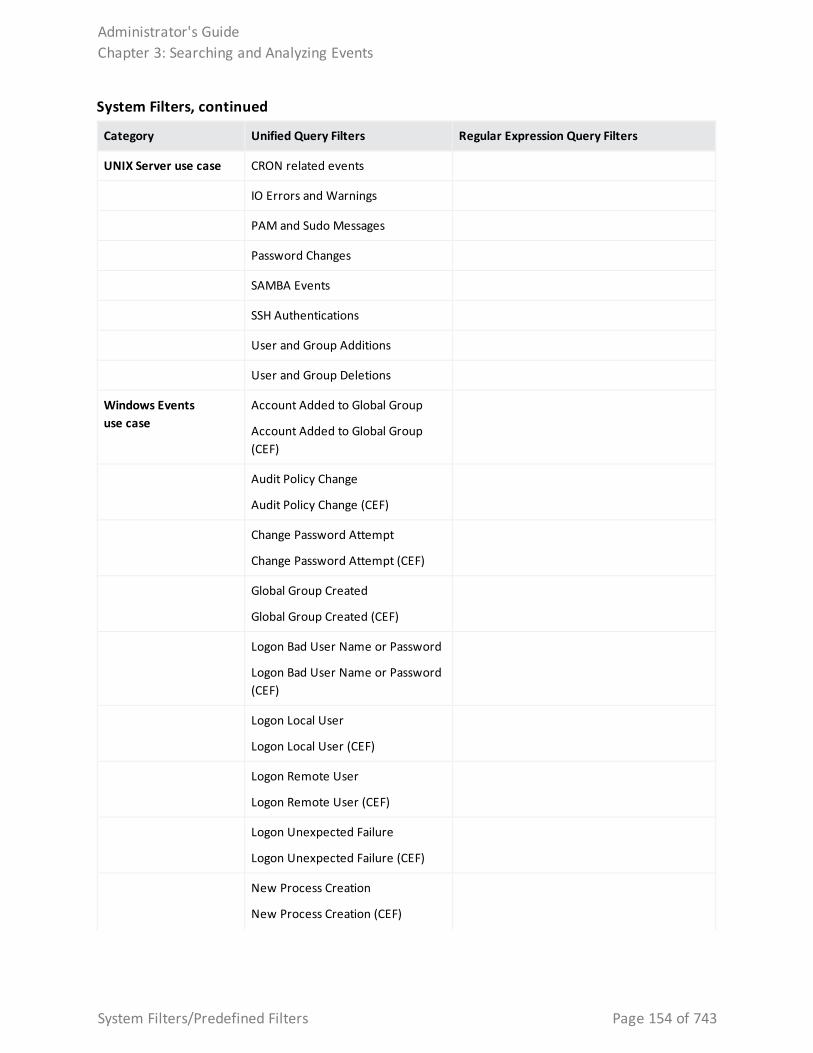
Category Unified Query Filters Regular Expression Query Filters
UNIX Server use case CRON related events
IO Errors and Warnings
PAM and Sudo Messages
Password Changes
SAMBA Events
SSH Authentications
User and Group Additions
User and Group Deletions
Windows Events use case
Account Added to Global Group
Account Added to Global Group (CEF)
Audit Policy Change
Audit Policy Change (CEF)
Change Password Attempt
Change Password Attempt (CEF)
Global Group Created
Global Group Created (CEF)
Logon Bad User Name or Password
Logon Bad User Name or Password (CEF)
Logon Local User
Logon Local User (CEF)
Logon Remote User
Logon Remote User (CEF)
Logon Unexpected Failure
Logon Unexpected Failure (CEF)
New Process Creation
New Process Creation (CEF)
System Filters, continued
Administrator's GuideChapter 3: Searching and Analyzing Events
System Filters/Predefined Filters Page 154 of 743
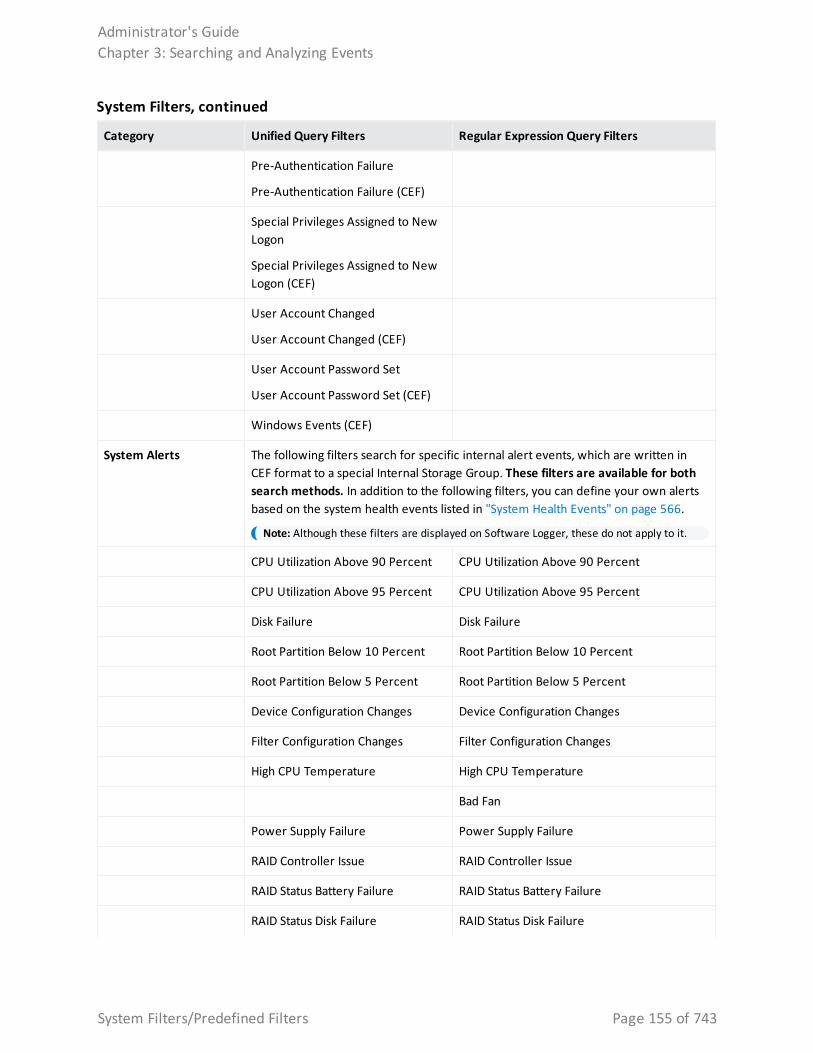
Category Unified Query Filters Regular Expression Query Filters
Pre-Authentication Failure
Pre-Authentication Failure (CEF)
Special Privileges Assigned to New Logon
Special Privileges Assigned to New Logon (CEF)
User Account Changed
User Account Changed (CEF)
User Account Password Set
User Account Password Set (CEF)
Windows Events (CEF)
System Alerts
The following filters search for specific internal alert events, which are written in CEF format to a special Internal Storage Group. These filters are available for both search methods. In addition to the following filters, you can define your own alerts based on the system health events listed in "System Health Events" on page 566.
Note: Although these filters are displayed on Software Logger, these do not apply to it.
CPU Utilization Above 90 Percent CPU Utilization Above 90 Percent
CPU Utilization Above 95 Percent CPU Utilization Above 95 Percent
Disk Failure Disk Failure
Root Partition Below 10 Percent Root Partition Below 10 Percent
Root Partition Below 5 Percent Root Partition Below 5 Percent
Device Configuration Changes Device Configuration Changes
Filter Configuration Changes Filter Configuration Changes
High CPU Temperature High CPU Temperature
Bad Fan
Power Supply Failure Power Supply Failure
RAID Controller Issue RAID Controller Issue
RAID Status Battery Failure RAID Status Battery Failure
RAID Status Disk Failure RAID Status Disk Failure
System Filters, continued
Administrator's GuideChapter 3: Searching and Analyzing Events
System Filters/Predefined Filters Page 155 of 743
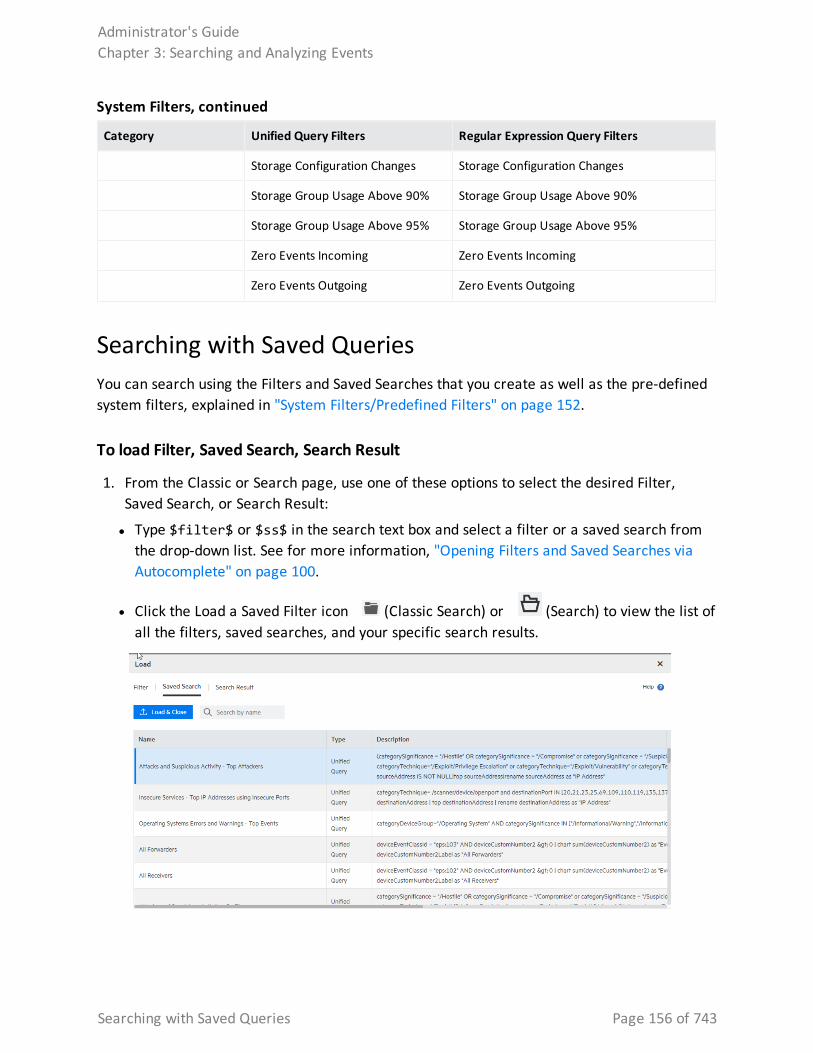
Category Unified Query Filters Regular Expression Query Filters
Storage Configuration Changes Storage Configuration Changes
Storage Group Usage Above 90% Storage Group Usage Above 90%
Storage Group Usage Above 95% Storage Group Usage Above 95%
Zero Events Incoming Zero Events Incoming
Zero Events Outgoing Zero Events Outgoing
System Filters, continued
Searching with Saved QueriesYou can search using the Filters and Saved Searches that you create as well as the pre-defined system filters, explained in "System Filters/Predefined Filters" on page 152.
To load Filter, Saved Search, Search Result
1. From the Classic or Search page, use one of these options to select the desired Filter, Saved Search, or Search Result:
l Type $filter$ or $ss$ in the search text box and select a filter or a saved search from the drop-down list. See for more information, "Opening Filters and Saved Searches via Autocomplete" on page 100.
l Click the Load a Saved Filter icon (Classic Search) or (Search) to view the list of all the filters, saved searches, and your specific search results.
Administrator's GuideChapter 3: Searching and Analyzing Events
Searching with Saved Queries Page 156 of 743
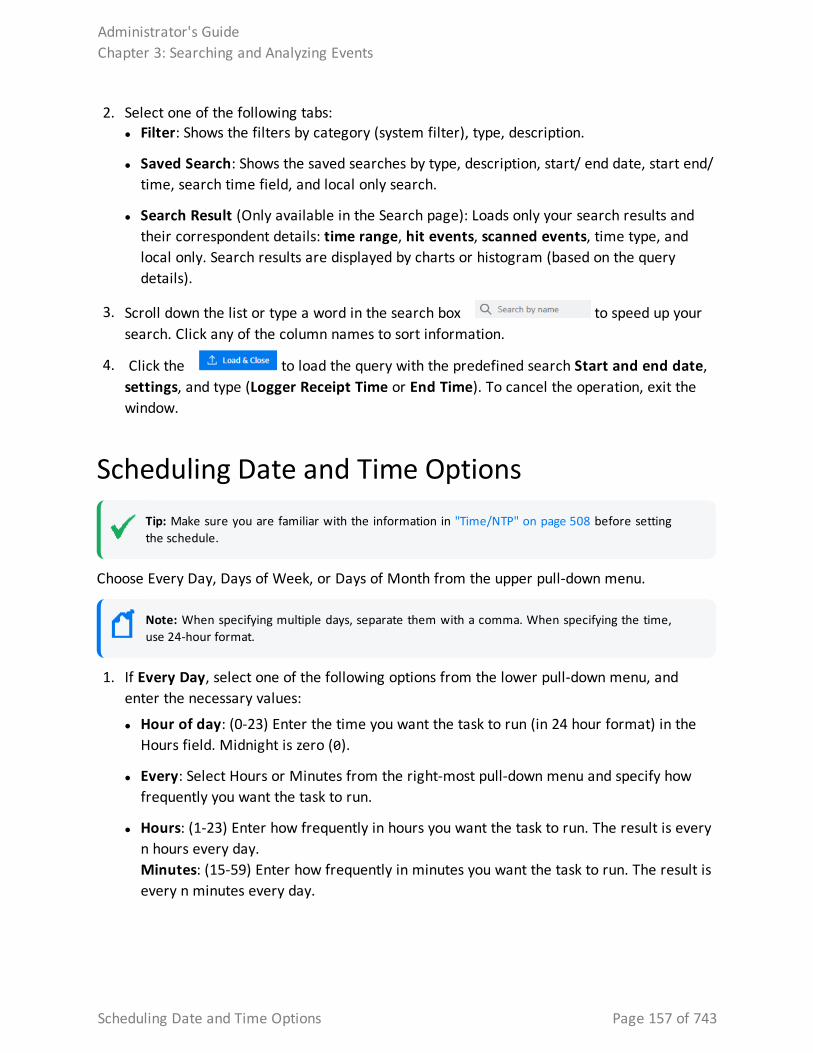
2. Select one of the following tabs: l Filter: Shows the filters by category (system filter), type, description.
l Saved Search: Shows the saved searches by type, description, start/ end date, start end/ time, search time field, and local only search.
l Search Result (Only available in the Search page): Loads only your search results and their correspondent details: time range, hit events, scanned events, time type, and local only. Search results are displayed by charts or histogram (based on the query details).
3. Scroll down the list or type a word in the search box to speed up your search. Click any of the column names to sort information.
4. Click the to load the query with the predefined search Start and end date, settings, and type (Logger Receipt Time or End Time). To cancel the operation, exit the window.
Scheduling Date and Time OptionsTip: Make sure you are familiar with the information in "Time/NTP" on page 508 before setting the schedule.
Choose Every Day, Days of Week, or Days of Month from the upper pull-down menu.
Note: When specifying multiple days, separate them with a comma. When specifying the time, use 24-hour format.
1. If Every Day, select one of the following options from the lower pull-down menu, and enter the necessary values:
l Hour of day: (0-23) Enter the time you want the task to run (in 24 hour format) in the Hours field. Midnight is zero (0).
l Every: Select Hours or Minutes from the right-most pull-down menu and specify how frequently you want the task to run.
l Hours: (1-23) Enter how frequently in hours you want the task to run. The result is every n hours every day.Minutes: (15-59) Enter how frequently in minutes you want the task to run. The result is every n minutes every day.
Administrator's GuideChapter 3: Searching and Analyzing Events
Scheduling Date and Time Options Page 157 of 743
2. If Days of Week, select from the following options from the lower pull-down menu, and enter the necessary values:
l Days: (1-7) Enter the days of the week you want the task to run (Sunday=1, Monday=2, and so on).
l Hour of Day: (0-23) Enter the time you want the task to run in the text field to the right. 0 is midnight.
l Every: Select Hours or Minutes from the right-most pull-down menu and specify how frequently you want the task to run.
Hours: (1-23) Enter how frequently in hours you want the task to run. The result is every n hours on the selected days.Minutes: (15-59) Enter how frequently in minutes you want the task to run. The result is every n minutes on the selected days.
3. If Days of Month, select from the following options from the lower pull-down menu, and enter the necessary values:
l Days: (1-31) Enter the day or days of the month you want the task to run.
Note: The number of days in a month varies. Scheduled tasks will only run if the specified day exists for that month. Tasks scheduled on the 31st day of the month will not run in April, February, June, November, and September. Tasks scheduled on the 29th day of the month will only run in February during leap years.
l Hour of Day: (0-23) Enter the time of day you want the task to run. (You cannot select Every for this option.)
Examples:
l To run the scheduled job every 45 minutes of every day, select Every Day in the upper Schedule pull-down menu. Choose Every from the lower pull-down menu, enter 45 in the text box and select Minutes.
l To run the scheduled job every four hours on Tuesdays and Thursdays, select Days of Week from the upper Schedule pull-down menu and enter 3,5 as the Days. Then choose Every from the lower pull-down menu, enter 4 in the text box.
l To run the scheduled job on the 14th of each month at 3 AM, select Days of Month from the upper Schedule pull-down menu and enter 14 as the Days. Then choose Hour of day from the lower pull-down menu and enter 3 in the text box. (To run the scheduled job at 3 AM and 3 PM, you would enter 3,15.)
Administrator's GuideChapter 3: Searching and Analyzing Events
Scheduling Date and Time Options Page 158 of 743
Enriching Logger Data Through Static CorrelationThe lookup search operator enables you to augment data in Logger with data from an external file. This enables geo-tagging, asset tagging, user identification, and so on, through static correlation.
You can use the lookup operator to add information to your search results that is not part of the original data stored on Logger. You do this by creating an external file containing the data, uploading that Lookup file to Logger, and then using the lookup operator to create a join between Logger events and the uploaded Lookup file.
For example, if you want Logger search results to include which country source IP addresses are located in, you can create a file listing the IP addresses and countries and then upload that file to Logger as a Lookup file. After that, you can use the lookup operator to perform a join between the sourceAddress field in the Logger events and the IP address column in the Lookup file, and display the country in the search results.
l For information about creating Lookup files and uploading them to Logger, see "Lookup Files" on page 343.
l For information on how to use the lookup operator when searching, see "lookup" on page 592.
IndexingOnce you have initialized Logger, it starts scanning events automatically and indexing them.
Logger’s storage technology enables automatic indexing of events in these ways:
l Full-text indexing: Each event is tokenized and indexed. See "Full-Text Indexing (Keyword Indexing)" on the next page.
l Field-based indexing: Event fields are indexed based on a predetermined schema. See "Field-Based Indexing" on the next page.
l Superindexing: Certain event fields are super-indexed so that you can find rare field values quickly. See " Superindexing" on page 162.
All events received after initialization are indexed for full-text search, a default set of fields is indexed for field-based search, and a default set of fields is superindexed for fast needle-in-a-haystack searches.
All events are timestamped with the receipt time when received on the Logger. The default fields are automatically indexed. For the remaining fields, Logger uses the receipt time of an
Administrator's GuideChapter 3: Searching and Analyzing Events
Enriching Logger Data Through Static Correlation Page 159 of 743
event and the time when a field was added to the index to determine whether that event will be indexed. If the receipt time of the event is equal to or later than the time when the field was added to the index, the event is indexed; otherwise, it is not.
Full-Text Indexing (Keyword Indexing)For full-text indexing, each event (CEF or non-CEF) received on Logger is scanned and divided into keywords and stored on the Logger. The full-text search options control the manner in which an event is tokenized as described the Full-text Search Options section of the "Global Search Options" on page 333.
Field-Based IndexingThe field-based indexing capability allows for fields of events to be indexed. The fields are based on a predetermined schema. The Logger’s reports and the field search method utilize these indexed fields to yield significant search and reporting performance gains.
Field-based indexing for a recommended set of fields is automatically enabled at Logger initialization time. You can add more fields to an index at any time. (See "To add fields to the field-based index:" on page 332 for instructions.) Once a field has been added, you cannot remove it.
A list of the default index fields, along with their field descriptions is available from the Logger Configuration menu. For instructions on how to view the default Logger Schema fields, see "Default Fields" on page 340.
Note: Micro Focus strongly recommends that you index fields that you will be using in search and report queries.
The fields created when a predefined or user-defined rex parser parses the non-CEF events cannot be indexed using the field-based indexing capability. See "Parsers" on page 380 for more information about rex parsers.
In addition to indexing the fields included in the field-based indexing list, Logger indexes event metadata fields—event time, Logger receipt time, and device address—for every event. The event metadata fields are also known as “internal” fields.
The following fields are available for indexing. The fields that Logger starts indexing automatically after Logger initialization are indicated in bold font.
Note: Logger allows indexing of the requestUrl field. This field returns website addresses from the World Wide Web. Indexing requestUrl will return results faster, but will also significantly increase the size of your search results, which may impact your search storage capacity.
Administrator's GuideChapter 3: Searching and Analyzing Events
Full-Text Indexing (Keyword Indexing) Page 160 of 743
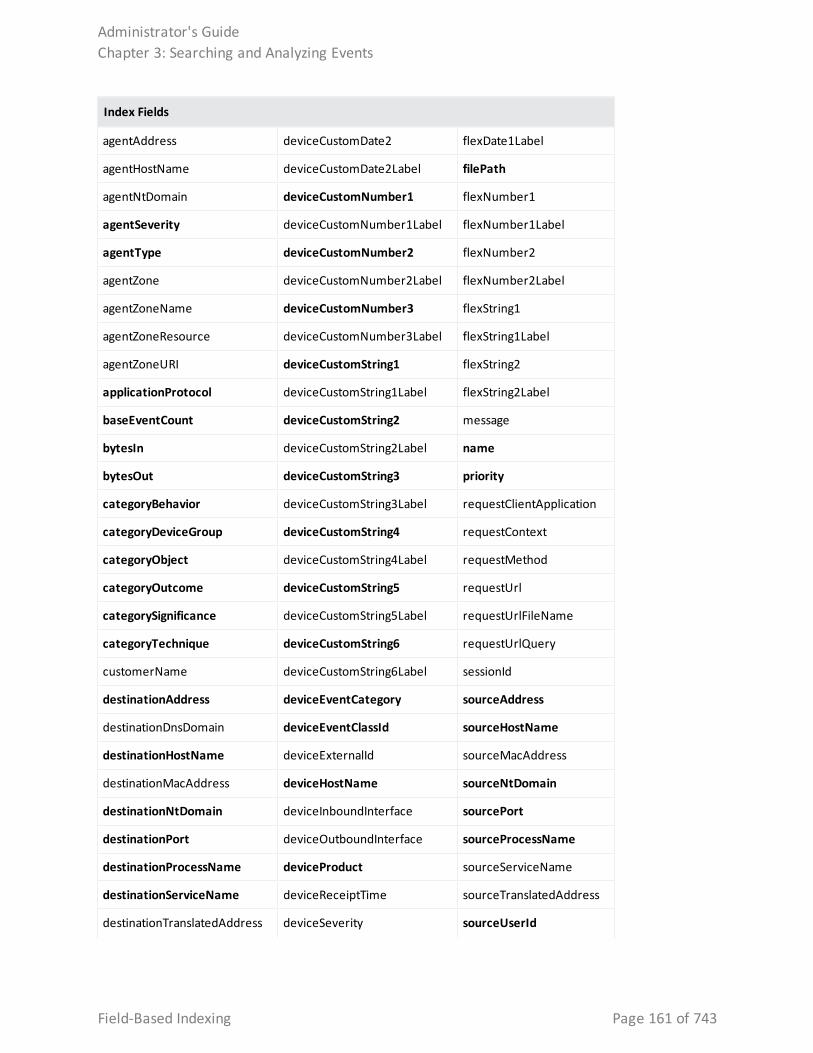
Index Fields
agentAddress deviceCustomDate2 flexDate1Label
agentHostName deviceCustomDate2Label filePath
agentNtDomain deviceCustomNumber1 flexNumber1
agentSeverity deviceCustomNumber1Label flexNumber1Label
agentType deviceCustomNumber2 flexNumber2
agentZone deviceCustomNumber2Label flexNumber2Label
agentZoneName deviceCustomNumber3 flexString1
agentZoneResource deviceCustomNumber3Label flexString1Label
agentZoneURI deviceCustomString1 flexString2
applicationProtocol deviceCustomString1Label flexString2Label
baseEventCount deviceCustomString2 message
bytesIn deviceCustomString2Label name
bytesOut deviceCustomString3 priority
categoryBehavior deviceCustomString3Label requestClientApplication
categoryDeviceGroup deviceCustomString4 requestContext
categoryObject deviceCustomString4Label requestMethod
categoryOutcome deviceCustomString5 requestUrl
categorySignificance deviceCustomString5Label requestUrlFileName
categoryTechnique deviceCustomString6 requestUrlQuery
customerName deviceCustomString6Label sessionId
destinationAddress deviceEventCategory sourceAddress
destinationDnsDomain deviceEventClassId sourceHostName
destinationHostName deviceExternalId sourceMacAddress
destinationMacAddress deviceHostName sourceNtDomain
destinationNtDomain deviceInboundInterface sourcePort
destinationPort deviceOutboundInterface sourceProcessName
destinationProcessName deviceProduct sourceServiceName
destinationServiceName deviceReceiptTime sourceTranslatedAddress
destinationTranslatedAddress deviceSeverity sourceUserId
Administrator's GuideChapter 3: Searching and Analyzing Events
Field-Based Indexing Page 161 of 743
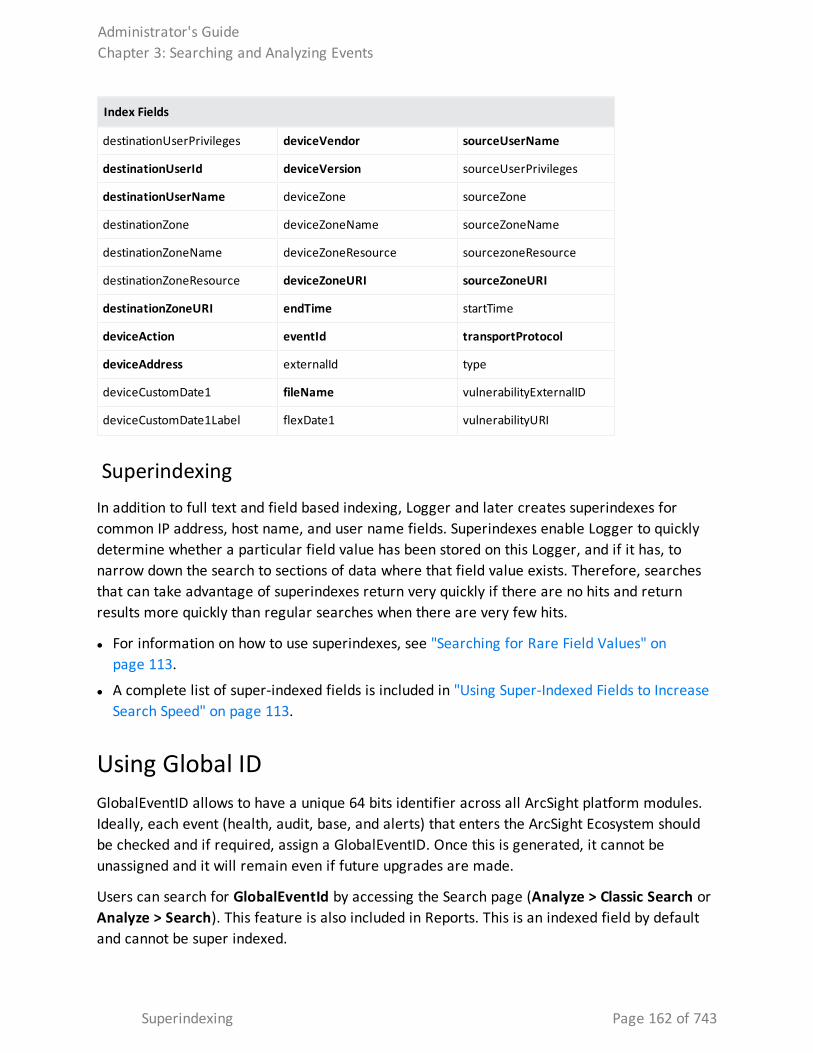
Index Fields
destinationUserPrivileges deviceVendor sourceUserName
destinationUserId deviceVersion sourceUserPrivileges
destinationUserName deviceZone sourceZone
destinationZone deviceZoneName sourceZoneName
destinationZoneName deviceZoneResource sourcezoneResource
destinationZoneResource deviceZoneURI sourceZoneURI
destinationZoneURI endTime startTime
deviceAction eventId transportProtocol
deviceAddress externalId type
deviceCustomDate1 fileName vulnerabilityExternalID
deviceCustomDate1Label flexDate1 vulnerabilityURI
SuperindexingIn addition to full text and field based indexing, Logger and later creates superindexes for common IP address, host name, and user name fields. Superindexes enable Logger to quickly determine whether a particular field value has been stored on this Logger, and if it has, to narrow down the search to sections of data where that field value exists. Therefore, searches that can take advantage of superindexes return very quickly if there are no hits and return results more quickly than regular searches when there are very few hits.
l For information on how to use superindexes, see "Searching for Rare Field Values" on page 113.
l A complete list of super-indexed fields is included in "Using Super-Indexed Fields to Increase Search Speed" on page 113.
Using Global ID GlobalEventID allows to have a unique 64 bits identifier across all ArcSight platform modules. Ideally, each event (health, audit, base, and alerts) that enters the ArcSight Ecosystem should be checked and if required, assign a GlobalEventID. Once this is generated, it cannot be unassigned and it will remain even if future upgrades are made.
Users can search for GlobalEventId by accessing the Search page (Analyze > Classic Search or Analyze > Search). This feature is also included in Reports. This is an indexed field by default and cannot be super indexed.
Administrator's GuideChapter 3: Searching and Analyzing Events
Superindexing Page 162 of 743
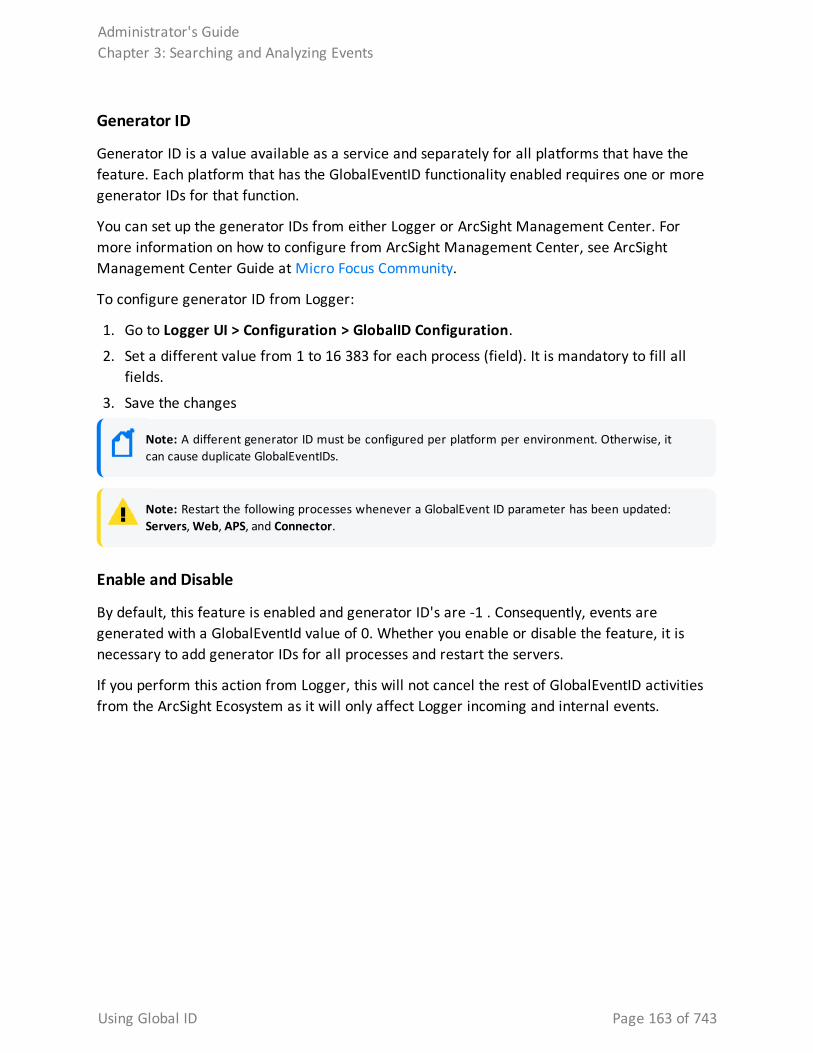
Generator ID
Generator ID is a value available as a service and separately for all platforms that have the feature. Each platform that has the GlobalEventID functionality enabled requires one or more generator IDs for that function.
You can set up the generator IDs from either Logger or ArcSight Management Center. For more information on how to configure from ArcSight Management Center, see ArcSight Management Center Guide at Micro Focus Community.
To configure generator ID from Logger:
1. Go to Logger UI > Configuration > GlobalID Configuration.
2. Set a different value from 1 to 16 383 for each process (field). It is mandatory to fill all fields.
3. Save the changes
Note: A different generator ID must be configured per platform per environment. Otherwise, it can cause duplicate GlobalEventIDs.
Note: Restart the following processes whenever a GlobalEvent ID parameter has been updated: Servers, Web, APS, and Connector.
Enable and Disable
By default, this feature is enabled and generator ID's are -1 . Consequently, events are generated with a GlobalEventId value of 0. Whether you enable or disable the feature, it is necessary to add generator IDs for all processes and restart the servers.
If you perform this action from Logger, this will not cancel the rest of GlobalEventID activities from the ArcSight Ecosystem as it will only affect Logger incoming and internal events.
Administrator's GuideChapter 3: Searching and Analyzing Events
Using Global ID Page 163 of 743
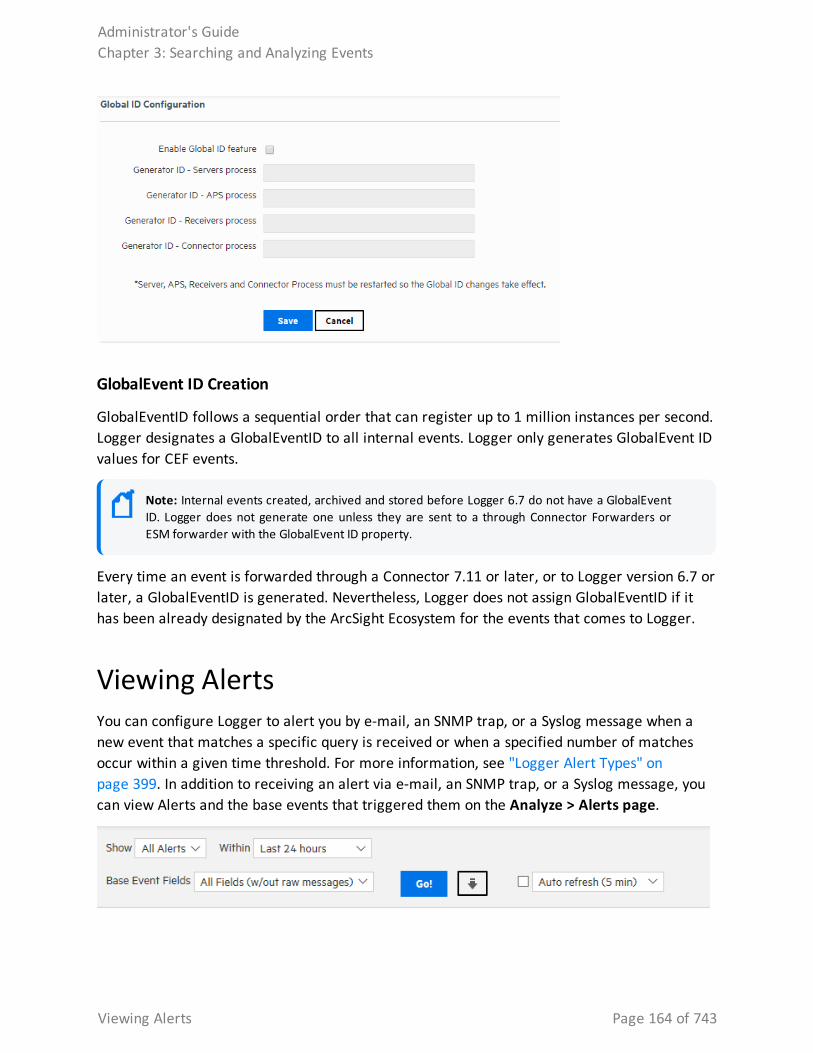
GlobalEvent ID Creation
GlobalEventID follows a sequential order that can register up to 1 million instances per second. Logger designates a GlobalEventID to all internal events. Logger only generates GlobalEvent ID values for CEF events.
Note: Internal events created, archived and stored before Logger 6.7 do not have a GlobalEvent ID. Logger does not generate one unless they are sent to a through Connector Forwarders or ESM forwarder with the GlobalEvent ID property.
Every time an event is forwarded through a Connector 7.11 or later, or to Logger version 6.7 or later, a GlobalEventID is generated. Nevertheless, Logger does not assign GlobalEventID if it has been already designated by the ArcSight Ecosystem for the events that comes to Logger.
Viewing AlertsYou can configure Logger to alert you by e-mail, an SNMP trap, or a Syslog message when a new event that matches a specific query is received or when a specified number of matches occur within a given time threshold. For more information, see "Logger Alert Types" on page 399. In addition to receiving an alert via e-mail, an SNMP trap, or a Syslog message, you can view Alerts and the base events that triggered them on the Analyze > Alerts page.
Administrator's GuideChapter 3: Searching and Analyzing Events
Viewing Alerts Page 164 of 743
To view Alerts, choose a predefined time range, such as “Last 2 hours” or “Today,” or choose “Custom Time Range” to reveal additional fields for specifying a time range manually. This aspect works like Search. Refer to "Time Range" on page 92 for more detail. Alerts search only considers internal events. Consequently, no search type option is displayed for this functionality.
Name the alert after it has been created. Use the Show options to view only events associated with a particular Alert. The default is All Alerts.
Alert events are labeled as ‘Action Engine’ and are triggered by base events. You can also select whether to view the base events and which fields to view by using the Base Event Fields: option.
Like on the Search page, the Go button triggers the search, the Export Results button enables you to create a PDF or CSV file that contains the search results, and the Auto Refresh option determines whether and how frequently the displayed search results are updated.
Live Event ViewerThe Live Event Viewer provides real-time view of the incoming events that match the criteria you specify. This functionality is useful in environments where the need to view an event quickly is important; for example, a financial institution might be interested in viewing a specific transaction type as soon as it occurs. Because the latency between the events arriving at Logger and the display time is quite less, events might not have been indexed on Logger before being displayed.
The Live Event Viewer composes of two tabs—Search Composer and Search Results. The Search Composer is for defining the search criteria and the Search Results tab displays the matching events in real time.
The following figure shows the Search Composer. If you specify more than one search term, the resulting query uses the AND operator to combine them. For example, if the first search term searches for “failure” and the second one excludes “admin,” the resulting query is “failure AND NOT admin.”
Administrator's GuideChapter 3: Searching and Analyzing Events
Live Event Viewer Page 165 of 743
Search Composer
Search Composer Legend
Feature Description Feature Description
Load a saved filterSave the current filterAdd a filter rowRemove a filter rowRemove all filters
Specify device groupsSpecify storage groups
Enter search criteria Start or Stop Live Event Viewer
The Search Results tab provides the Play, Pause, Stop, Clear, and Export buttons that enable you to control the display in a manner similar to any electronic device, as shown in the following figure.
Administrator's GuideChapter 3: Searching and Analyzing Events
Live Event Viewer Page 166 of 743
Search Results Tab
Search Results Legend
Feature Description Feature Description
Play / Pause / Stop / Delete / Export Events scanned so far
Filter specified in Search Composer Events display maximum
Current state Search timer
Events found so far Matching event number
The following list highlights the features of Search Results display:
l Events are displayed in the raw event format and not in the columnar, table form as displayed in the Search Results page (Analyze > Classic Search) when you run a search query.
l A user can launch a maximum of one Live Event Viewer. There can be a maximum of five Live Event Viewers running on Logger at any time.
l The regular expression search method is used to identify matching events. Therefore, you can specify regular expressions as the search term in the Search Composer.
l Buffer Size defines the maximum number of events displayed in the Viewer. By default, the Buffer Size is 1000; however, it can be set to any number between the range of 20 and 5000.
l By default, the search is run for 15 minutes and then stopped to preserve system resources. If you need to run the search for longer than 15 minutes, click the icon next to the countdown timer to reset the timer to 15 minutes.
l When you click Pause, the Search Results display is frozen. However, the search operation continues in the background and the new matching events are buffered until a maximum of 1000 events have been buffered or the search timer, which continues to count down even when the Search Results display is frozen, reaches 00:00.
Administrator's GuideChapter 3: Searching and Analyzing Events
Live Event Viewer Page 167 of 743
l If the timer has not reached 00:00, you can click Play to resume the paused search operation. When you click Play, the buffered events are displayed. The newly found events are appended to the previously found events on the Search Results display screen.
l When you click Stop, the search for matching events and the countdown of the search timer stop. When you click Play, the search is started afresh—the currently displayed events are cleared from the Search Results screen, the search timer is reset to 15 minutes, and the search starts again.
l You must stop the search operation to export the matching events.
To launch a Live Event Viewer:
Note: Live Event Viewer is a resource- intensive application that can impact the overall performance of your Logger if run for a long period of time. Therefore, use this feature selectively and for short periods of time.
1. Open the Analyze menu and click Live Event Viewer.
2. In the Search Composer tab, enter the search terms or click the ( ) icon to select a saved filter.
Tip: A filter cannot be saved without search parameters. If the search field is empty, the system will display an error.
You can enter search terms that the event must contain (Search For:) or terms that the events must not contain (Exclude From Search:). Click the “Search For:” field to display a drop-down list from which you can select “Exclude From Search:”.
If you specify more than one search term Logger uses the AND operator to combine them in the resulting search query.
l To add additional search term click the ( ) icon.
l To remove a search term, click the ( ) icon.
l To remove all search terms, click the ( ) icon.
3. Enter constraints to limit your search to specific device groups, devices, or storage groups in the “Where do you want to look?” section. Click the ( ) icon to display a list from which you can choose the constraints.
4. Click Start.
5. The search results are automatically displayed in the Search Results display screen.
Administrator's GuideChapter 3: Searching and Analyzing Events
Live Event Viewer Page 168 of 743
To update the Live Event Viewer query:
1. In the Search Composer tab of the Live Event Viewer, update the search terms.
2. Click Stop first and then click Start to start search using the new search terms.
To export Search Results display:
1. Make sure you have stopped the Live Event Viewer. To do so, click the ( ) icon in the Search Results display window.
2. Click the ( ) icon to open the Export Options window.
3. To export the displayed search results, select the Export options, as described in "To export the results of your search:" on page 140 then click Export.
Administrator's GuideChapter 3: Searching and Analyzing Events
Live Event Viewer Page 169 of 743
Chapter 4: ReportingReporting is an essential tool for communicating the state of your network security to internal and external stakeholders. A report is a captured view or summary of events. Reports can be viewed from within Logger, or exported for sharing in a variety of file formats.
The Reports User InterfaceReport activities open within tabs. Logger supports up to ten open report tabs, so you can easily move from screen to screen as you create, manage, and generate reports.
l The first tab is the Home page. See "The Reports Home Page" on the next page.
l Reports, dashboards, queries, and other report functions can run concurrently in different tabs (but this may affect your Logger performance). See "Report Guidelines" on page 191.
The Reports menu gives you easy access to all the reporting tools from any tab or page within Reports.
Note: Access permissions to these tools must be granted by an administrator. See "Administrative Prerequisites" on page 172.
Feature Description
Explorer Navigate to a desired report, query, parameter, dashboard, dashboard widget, or favorite item. See "Reports Explorer" on page 176.
Report status Use to view published reports and other reports. You can search by date, owner, root, execution type, status and name.
Schedule Reports
Use to run reports at times of low activity, at regular intervals, or to run reports that would otherwise time out after an hour. As part of scheduling a report job, you can set delivery options to, for example, email, save, or publish the resulting reports. See "Scheduled Reports" on page 186.
Design Use tools to create and customize the different "objects" that together make up a report. See "Design Tools: New Reports and Report Objects" on page 175.
l Dashboards Easily create Smart dashboards that can display multiple charts using different queries. See "Building Dashboards" on page 246.
l New Report Create, customize, and modify any Ad hoc or Smart report. The Smart View page will get you where you need to go to complete your objective. See "Smart Reports" on page 221.
l Queries Create and edit the queries that power your reports. See "Queries" on page 249.
l Parameters Create and edit the parameters that define the data values within report queries. See "Parameters" on page 277.
Chapter 4: Reporting Page 170 of 743
Feature Description
l Parameter Value Groups Create and edit groups of parameter values to make applying report run-time values easier. See "Parameter Value Groups" on page 285.
l Template Styles Create and customize report template styles, giving it a custom, finished look. See "Template Styles" on page 287.
Classic Use tools to create and customize Ad hoc reports in the Ad hoc Report Designer. See "Classic: The Ad hoc Report Designer" on page 226.
Administration Use tools to customize and configure your Logger Reports environment, troubleshoot report jobs, and backup and restore Report content. Administration tools are for users who support and maintain the Logger Reports environment.
l Deploy Report Bundler Load and deploy packages of new or updated reports to your Logger system. See "Deploying a Report Bundle" on page 311.
l Report Configuration View or modify the report server configuration values, including investigate connection configuration. See "Report Configuration" on page 290.
l Report Category Filters Assign and remove search group filters. See "Report Category Filters" on page 306.
l Report Categories Add, modify, and delete Explorer Categories. See "Report Categories" on page 294.
l Job Execution Status Admins can view the status of all Report jobs. See " Job Execution Status" on page 300.
l iPackager Package reports and report objects, which can be imported to other Loggers, or redeployed after an upgrade. You can also deploy a report configuration on multiple Loggers. See "iPackager Utility" on page 303.
The Reports Home PageThe ReportsHome Page is available in the Home tab, providing easy access to the following widgets:
l Smart Report Designer provides access to create a smart report. See "The Smart Report Designer" on page 220
l View Dashboard provides direct access to create a dashboard. See "Creating a New Smart Dashboard " on page 248
l Job Execution Status lists the succeeded, failed and completed jobs. See " Job Execution Status" on page 300
l Report Execution Status provides direct access to other reports. See "Other Reports" on page 184
l iPackager allows to package repository objects, users and settings from local file system. See "iPackager Actions" on page 304
Administrator's GuideChapter 4: Reporting
The Reports Home Page Page 171 of 743
l Deploy Report Bundle allows to load and deploy new reports packages. See "Deploying a Report Bundle" on page 311
l Favorites lists the Favorite Entities.
l Recent Reports lists the ten most recently run reports by run time. See "Recent Reports" on page 182.
l Published Reports lists reports for which the output results have been saved for subsequent use. See "Publishing Reports" on page 216.
The functions available to you from each list will vary by report type, display format, user permissions, and so forth.
Accessing the Reports Home Page
To access the Reports home page:
1. From the Logger navigation bar, click Reports.
To return to the Reports home page from within the Reporting tool:
1. Click the home tab (the upper-left tab)
Administrative PrerequisitesBefore users can create and view reports, a Logger Administrator must perform the following tasks:
l Assign access rights to users and any user groups. See "Assigning Access Rights" on the next page.
l Make sure to have search permissions before running a report based on Logger searches. See "Setting Logger User Permissions" on page 561.
l Optionally, your system may require an adjustment to the Database Connection Timeout value, one of the Report Administration settings. See "Adjusting Timeout Values for Long-Running Reports" on the next page.
Note: Your Logger must be running a valid GB per day or EPS license. Otherwise, Reporting is not available.
For a complete list of all the administrative report tools and options, see "Reports Administration" on page 288.
Administrator's GuideChapter 4: Reporting
Accessing the Reports Home Page Page 172 of 743
Assigning Access RightsAdministrators can set access rights to various report categories, reports, and report options (such as view, publish, and edit) based on user roles and Logger Report Group affiliation. For example, you can grant privileges to view some reports but not others, to view but not schedule or publish a report, or to view and schedule but not edit a report.
Access rights for report options and user groups are configured and managed from the User Management link on the System Admin menu. For more information on System Admin User/Group management, see "Setting Logger User Permissions" on page 561.
What Access Rights are Necessary?Access rights are applied at the folder level. To access a particular report, a user must have access rights to all the higher-level folders in its path.
For example, if a user needs access to User Tracking reports (Foundation > Intrusion Monitoring > User Tracking), you must give them access rights to Foundation and Intrusion Monitoring nodes as well as User Tracking.
Some users may require access to a more limited subset of reports:
l If a user needs access to specific report categories, create a User Group with the access rights to just those categories, and assign them to that User Group. See "Creating a Reports User Group" on page 289.
l If a user needs access to specific reports, you can create a new category folder with only the required reports, and give them rights to that folder. See "Report Categories" on page 294.
Adjusting Timeout Values for Long-Running ReportsThere are two timeout values that can affect long-running reports.
l The client timeout is 1 hour. If an ad hoc report takes more than an hour to run, it will time out. Use a scheduled report instead.
l The default database connection timeout for scheduled reports is 4 hours. If a scheduled report takes more than 4 hours to run, you can increase the database connection timeout from the Report Configuration page. See "Report Configuration" on page 290.
Another option is to restrict large reports to run only in the background. See "Restrict Long Reports to Run in the Background" on page 199.
Administrator's GuideChapter 4: Reporting
Assigning Access Rights Page 173 of 743
Using the Right Tool for the JobUse this handy table to understand the Logger workflow for Reports and Dashboards:
To Do ThisWith (report object) Execute From Opens In Mode
Explorer Menu Report Menu
l View a report Smart report Any Run option None Smartview View*
Ad hoc or Studio report
Any Run option except "Run as Smart Report"
None Powerview View only
l Modify a report
l Create a new report from an old one
l Create a new report
Smart report Customize Design > New Report
Smartview View*
Ad hoc or Studio report
Customize Classic > New Report
Ad hoc Report Designer
Design
l Publish a report Smart report Smartview None Smartview View*
Ad hoc or Studio report
Powerview None Powerview View only
l Create a new dashboard Published Smart report
Design > Dashboards
Smartview Dashboard Design
l View a dashboard Smart dashboard
View Dashboard
Design > Dashboards
Smartview Dashboard Design
l Modify a dashboard
l Create a new dashboard from an old one
Smart dashboard
Design > Dashboards
Smartview Dashboards
Design
* Click the Edit Mode/Design mode toggle in Smartview to select the mode
Reports and Dashboards
Administrator's GuideChapter 4: Reporting
Using the Right Tool for the Job Page 174 of 743
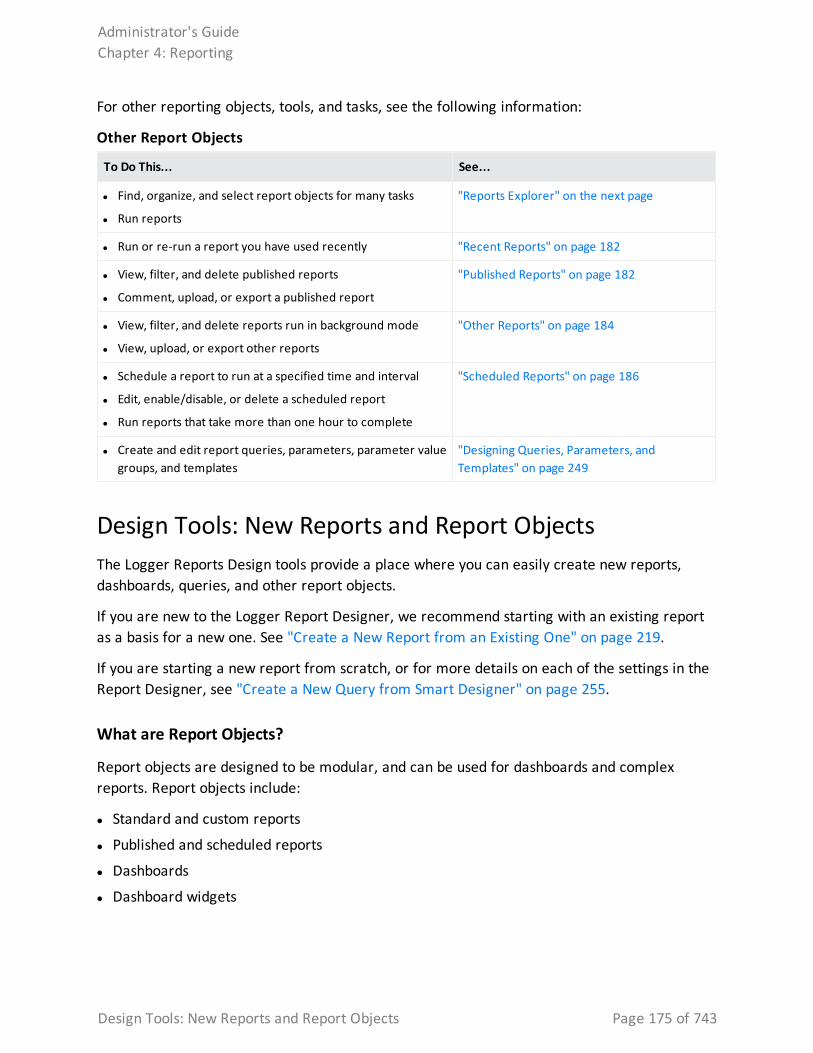
For other reporting objects, tools, and tasks, see the following information:
To Do This... See...
l Find, organize, and select report objects for many tasks
l Run reports
"Reports Explorer" on the next page
l Run or re-run a report you have used recently "Recent Reports" on page 182
l View, filter, and delete published reports
l Comment, upload, or export a published report
"Published Reports" on page 182
l View, filter, and delete reports run in background mode
l View, upload, or export other reports
"Other Reports" on page 184
l Schedule a report to run at a specified time and interval
l Edit, enable/disable, or delete a scheduled report
l Run reports that take more than one hour to complete
"Scheduled Reports" on page 186
l Create and edit report queries, parameters, parameter value groups, and templates
"Designing Queries, Parameters, and Templates" on page 249
Other Report Objects
Design Tools: New Reports and Report ObjectsThe Logger Reports Design tools provide a place where you can easily create new reports, dashboards, queries, and other report objects.
If you are new to the Logger Report Designer, we recommend starting with an existing report as a basis for a new one. See "Create a New Report from an Existing One" on page 219.
If you are starting a new report from scratch, or for more details on each of the settings in the Report Designer, see "Create a New Query from Smart Designer" on page 255.
What are Report Objects?
Report objects are designed to be modular, and can be used for dashboards and complex reports. Report objects include:
l Standard and custom reports
l Published and scheduled reports
l Dashboards
l Dashboard widgets
Administrator's GuideChapter 4: Reporting
Design Tools: New Reports and Report Objects Page 175 of 743
Powerview Designer and Classic Report DesignerAny Ad hoc report can be modified in either the Powerview designer, or the Ad hoc Report Designer. Both tools have the same capabilities. However, the Powerview designer allows you to work right from the report viewer, seeing changes in real-time as you make them. Right-click within the report to access the option menus.
l Powerview designer — Work right from the report viewer, seeing changes in real-time as you make them. Right-click within the report to access the option menus. See "The Powerview Designer" on page 221.
l Ad hoc Report Designer — Work from a toolkit environment, with different report elements available in tabs within the tool. See "Classic: The Ad hoc Report Designer" on page 226.
Finding and Managing ReportsLogger has a number of tools to help you find, organize, and manage reports.
l Dynamic report lists — Recent Reports, Published Reports, and Other Reports dynamically display the reports you use most often.
l Report storage — Explorer stores and manages all report, query, parameter, dashboard, dashboard widget, or Favorite report object for which you have access permissions. See "Reports Explorer" below.
l Report Administration — Report Admins can use Administrative tools to manage report jobs and the category folders where they reside. See "Reports Administration" on page 288.
Tip: Reports users with limited access rights will only see reports for which they have rights. See "Assigning Access Rights" on page 173.
Reports ExplorerExplorer is an organization tool that gives you quick access to any existing report, query, parameter, dashboard, dashboard widget, or Favorite report object for which you have access permissions. Explorers have been consolidated into one convenient tool for all report objects.
Reports and report objects, such as queries and parameters, are organized and grouped based on their function into folders (called Categories). For example, a report pertaining to a database can be stored under the Database category.
Administrator's GuideChapter 4: Reporting
Powerview Designer and Classic Report Designer Page 176 of 743
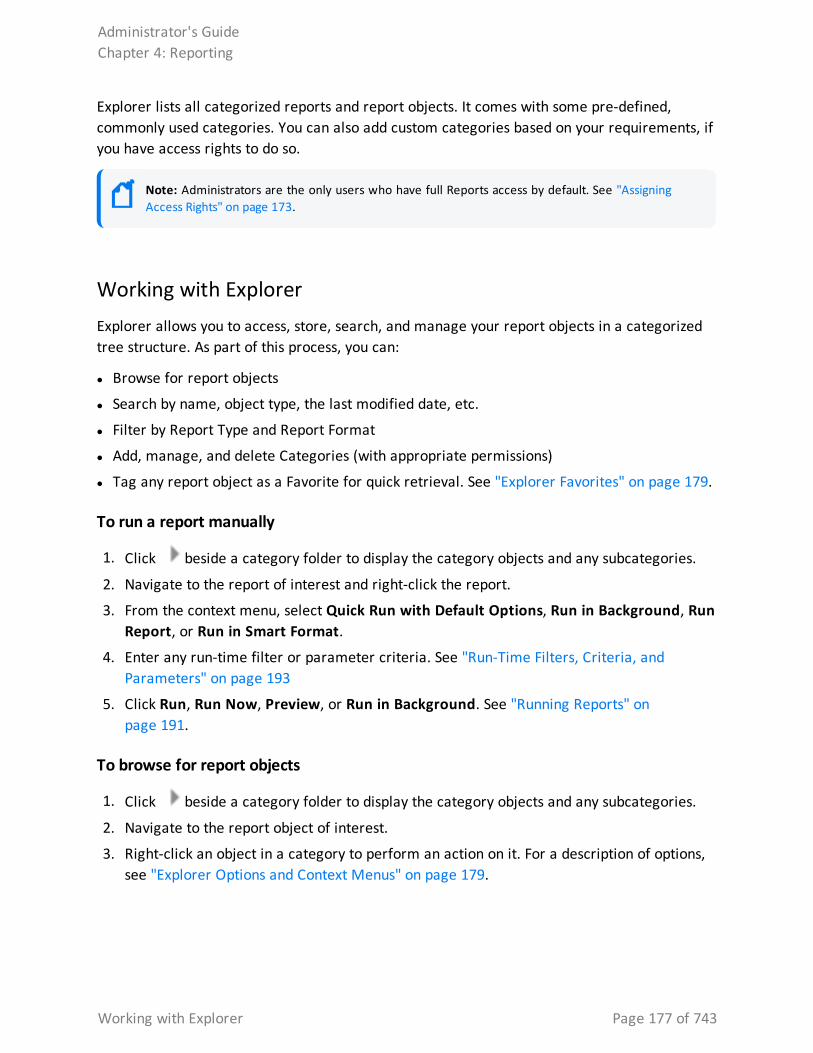
Explorer lists all categorized reports and report objects. It comes with some pre-defined, commonly used categories. You can also add custom categories based on your requirements, if you have access rights to do so.
Note: Administrators are the only users who have full Reports access by default. See "Assigning Access Rights" on page 173.
Working with ExplorerExplorer allows you to access, store, search, and manage your report objects in a categorized tree structure. As part of this process, you can:
l Browse for report objects
l Search by name, object type, the last modified date, etc.
l Filter by Report Type and Report Format
l Add, manage, and delete Categories (with appropriate permissions)
l Tag any report object as a Favorite for quick retrieval. See "Explorer Favorites" on page 179.
To run a report manually
1. Click beside a category folder to display the category objects and any subcategories.
2. Navigate to the report of interest and right-click the report.
3. From the context menu, select Quick Run with Default Options, Run in Background, Run Report, or Run in Smart Format.
4. Enter any run-time filter or parameter criteria. See "Run-Time Filters, Criteria, and Parameters" on page 193
5. Click Run, Run Now, Preview, or Run in Background. See "Running Reports" on page 191.
To browse for report objects
1. Click beside a category folder to display the category objects and any subcategories.
2. Navigate to the report object of interest.
3. Right-click an object in a category to perform an action on it. For a description of options, see "Explorer Options and Context Menus" on page 179.
Administrator's GuideChapter 4: Reporting
Working with Explorer Page 177 of 743
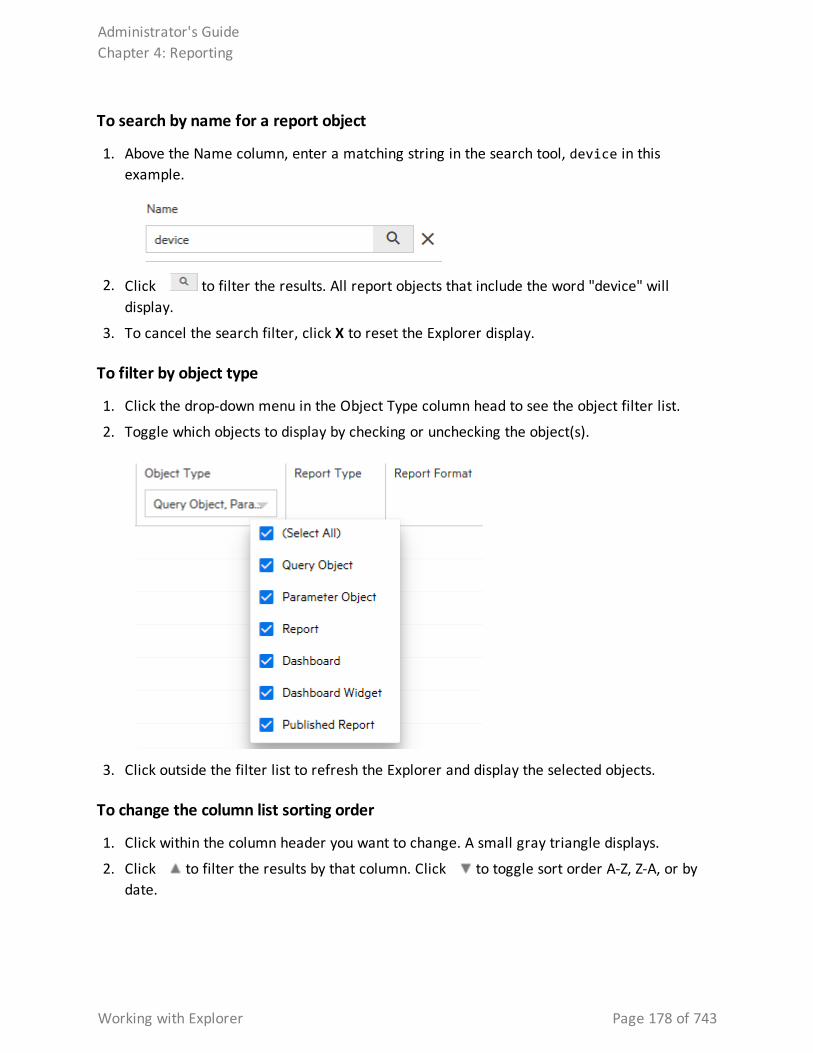
To search by name for a report object
1. Above the Name column, enter a matching string in the search tool, device in this example.
2. Click to filter the results. All report objects that include the word "device" will display.
3. To cancel the search filter, click X to reset the Explorer display.
To filter by object type
1. Click the drop-down menu in the Object Type column head to see the object filter list.
2. Toggle which objects to display by checking or unchecking the object(s).
3. Click outside the filter list to refresh the Explorer and display the selected objects.
To change the column list sorting order
1. Click within the column header you want to change. A small gray triangle displays.
2. Click to filter the results by that column. Click to toggle sort order A-Z, Z-A, or by date.
Administrator's GuideChapter 4: Reporting
Working with Explorer Page 178 of 743
To manage Explorer categories:
1. Navigate to a category folder of interest.
2. Right-click the category folder. The Category context menu displays.
3. Select an action from the menu. See "Explorer Options and Context Menus" below.
Tip: Report Admins can also work with Categories and Category filters directly, using the Reports Administration tools. See "Report Categories" on page 294 and "Report Category Filters" on page 306.
Explorer FavoritesFor quick access to frequently-used items, you can mark any report, query, parameter, dashboard, or dashboard widget as a favorite.
Note: Favorite objects cannot be organized into categories.
To add a Report object as a Favorite:
1. From Explorer, select the report object for which you want easy access.
2. Right-click the object. The action menu displays.
3. Click Add to Favorites. A confirmation message displays.
To access an object from your Favorites list:
1. From Explorer, click the Favorites star to the left of the X (close) icon. Report objects that you have designated as Favorites display.
2. Select the report object and right-click to open the action menu.
3. Select an action.
To remove an object from your Favorites list:
1. From Explorer, click to open your Favorites list.
2. Right-click the report object.
3. Select Delete from Favorites.
Explorer Options and Context MenusExplorer is the central location for accessing and maintaining existing reports and report objects. Right-click on a category folder or other report object to open a context menu for that
Administrator's GuideChapter 4: Reporting
Explorer Favorites Page 179 of 743
folder or option. Menu options vary with the object type and parameter requirements.
All Explorer objects have these menu options.
Icon Menu Option Description
Add to FavoritesDelete from Favorites
Include or remove this object from your Explorer Favorites list. See "Explorer Favorites" on the previous page.
Copy {object}Paste
Use this option to copy an Explorer object into another Category folder. Right-click a category folder and select Paste to save the copy.
Cut {object}Paste
Use this option to move an Explorer object into another Category folder. Right-click a category folder and select Paste to move the object.
Delete {object} Deletes the Explorer object.
Caution: Take care to only delete copies of the default object, not the default object itself.
All Explorer Objects
Reports generally have these Explorer menu options. For a description of the various run options, see "Run Report Options" on page 192
Menu Option Description
Quick Run with Default Options
Run the report using default or last saved preferences. If the report has user parameters, enter them in the Report Parameter tab and select Run Now or Run in Background to run the report.
Run in Background Run the report as a background process, using the default or last saved preferences. If the report has user parameters, enter them in the Report Parameter tab and select Run Now or Run in Background to run the report.
Run Report Run the report after setting new preferences, such as the report format.
Run in Smart Format Generate the report in multipage interactive HTML format. These Smart reports open in a paginated web format, and allow you to customize the grid and interactive charts.
List Published Outputs Displays a list of the published reports for the selected report in a new tab.
Customize Report Opens either the Smart Designer (for Smart reports) or the Ad hoc Report Designer, ready for modifications or saving as a new report.
Tip: To customize a report using Powerview designer, run an editable Ad hoc report.
Copy Selection to Clipboard Copy the Report file to the clipboard.
Copy Report as Link Add a link to a report object in another directory, similar to a shortcut.
Properties Displays the Properties window for the report.
Explorer Reports
Administrator's GuideChapter 4: Reporting
Explorer Options and Context Menus Page 180 of 743
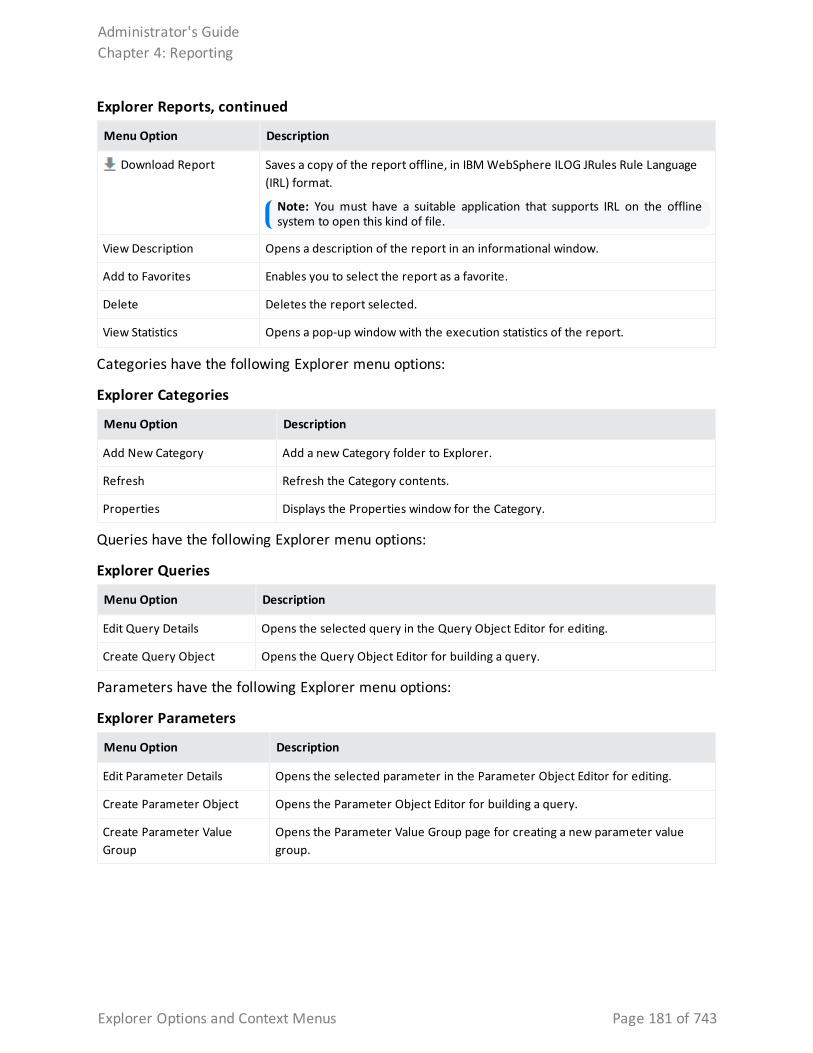
Menu Option Description
Download Report Saves a copy of the report offline, in IBM WebSphere ILOG JRules Rule Language (IRL) format.
Note: You must have a suitable application that supports IRL on the offline system to open this kind of file.
View Description Opens a description of the report in an informational window.
Add to Favorites Enables you to select the report as a favorite.
Delete Deletes the report selected.
View Statistics Opens a pop-up window with the execution statistics of the report.
Explorer Reports, continued
Categories have the following Explorer menu options:
Menu Option Description
Add New Category Add a new Category folder to Explorer.
Refresh Refresh the Category contents.
Properties Displays the Properties window for the Category.
Explorer Categories
Queries have the following Explorer menu options:
Menu Option Description
Edit Query Details Opens the selected query in the Query Object Editor for editing.
Create Query Object Opens the Query Object Editor for building a query.
Explorer Queries
Parameters have the following Explorer menu options:
Menu Option Description
Edit Parameter Details Opens the selected parameter in the Parameter Object Editor for editing.
Create Parameter Object Opens the Parameter Object Editor for building a query.
Create Parameter Value Group
Opens the Parameter Value Group page for creating a new parameter value group.
Explorer Parameters
Administrator's GuideChapter 4: Reporting
Explorer Options and Context Menus Page 181 of 743
Recent ReportsThe Recent Reports widget lists the last ten reports of currently running, recently run, or accessed reports (removed automatically after 30 minutes or otherwise specified in the property file). By default, all reports display, except scheduled reports. For details on how to run or re-run a recent report, see "Running a Recent Report" on page 197.
Caution: When you run reports from this list, reports open in their respective designer, not the usual viewer. This allows you modify the report, not just export or comment on it. Remember to Save As before you modify an original report.
Published ReportsOnce a report has run and been published, you can view, export, or delete them from the Published Reports widget on the Recent Reports tab.
To open a published report from the Published Reports widget
1. From the Recent Reports tab, click to open Published Reports. You can also access from the published reports widget at reports home tab.
2. Optionally, use the Filters menu to filter the results. See "Working with Published Reports" below.
3. Select a published report.
4. Optionally, click to open the Show Comments window for that report.
5. Select a view icon for the report (See "View Options" on page 208). The report then renders in the selected view format.
l Reports that are run in Smart Format display in the Smart Viewer. See "The Smart Report Viewer" on page 205.
l Ad hoc reports display in the Ad hoc Viewer. See "The Ad hoc Report Viewer" on page 203.
To publish a report, see "Publishing Reports" on page 216
Working with Published ReportsYou can render, save, and delete reports from the Published Reports widget, as well as view any comments attached to the report. How the report displays or generates within the widget depends on the file format you select:
Administrator's GuideChapter 4: Reporting
Recent Reports Page 182 of 743
l Report formats that can display within a browser display in a new tab.
l Report formats that must be viewed in another application open in a new window, where you can save, export, and upload the report.
If the list of Published Reports is long, you can filter the list by published name, date, source report, and other options.
To view a published report
1. From the Report Status tab, click to open Published Reports.
2. Select a published report.
3. From the icon menu, click a view format. See "View Options" on page 208. The report displays in the appropriate viewer. See "Report Formats for Viewing " on page 207.
4. Click Apply.
To download a published report
1. From the Recent Reports tab, click to open Published Reports.
2. Select a published report.
3. From the icon menu, click a file format such as PDF, CSV, Excel, Word, or Text. See "View Options" on page 208.
4. Click on Open or Save option before closing this window or tab.
5. Enter any necessary information and click OK.
To view comments for a published report
1. From the Recent Reports tab, click to open Published Reports.
2. Select a published report.
3. From the icon menu, click . The Show Comment window displays any comments made to that report.
4. When you are finished, click Done. See "Adding a Comment to Ad Hoc Report" on page 205.
To delete a Published Report
1. From the Recent Reports tab, click to open Published Reports.
2. Select a published report.
3. Click the icon and confirm your request. The report instance is deleted from the Published Reports list.
Administrator's GuideChapter 4: Reporting
Working with Published Reports Page 183 of 743
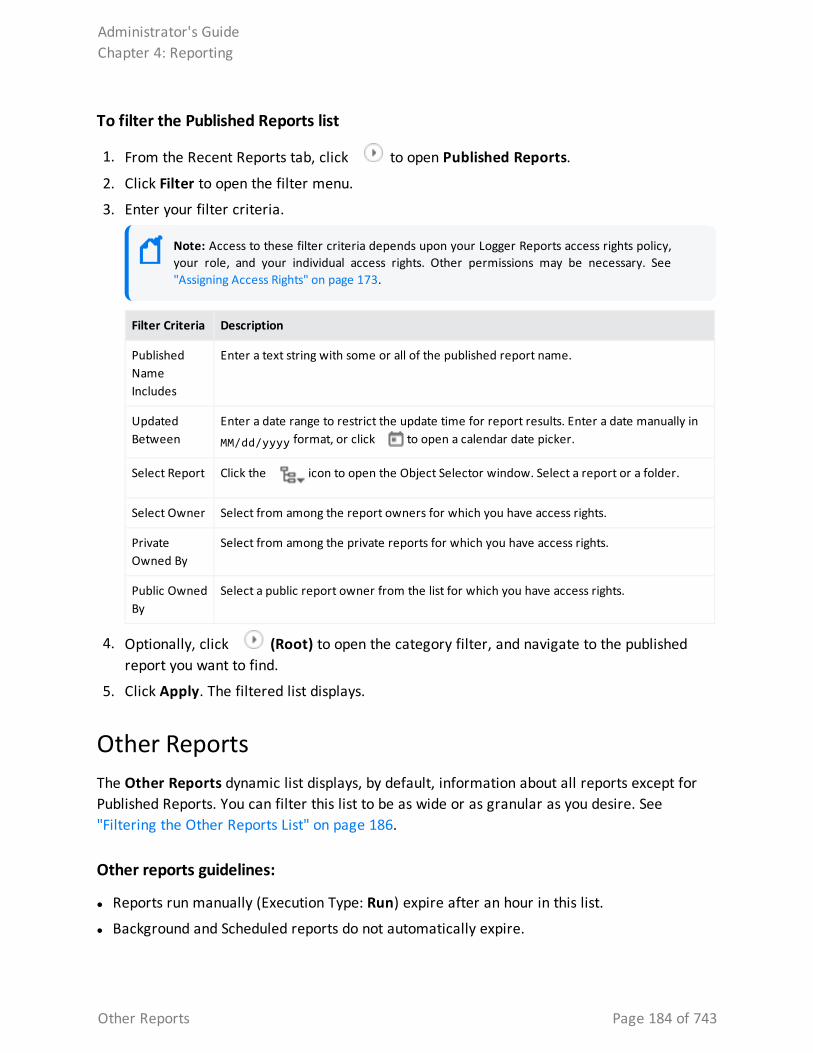
To filter the Published Reports list
1. From the Recent Reports tab, click to open Published Reports.
2. Click Filter to open the filter menu.
3. Enter your filter criteria.
Note: Access to these filter criteria depends upon your Logger Reports access rights policy, your role, and your individual access rights. Other permissions may be necessary. See "Assigning Access Rights" on page 173.
Filter Criteria Description
Published Name Includes
Enter a text string with some or all of the published report name.
Updated Between
Enter a date range to restrict the update time for report results. Enter a date manually in
MM/dd/yyyy format, or click to open a calendar date picker.
Select Report Click the icon to open the Object Selector window. Select a report or a folder.
Select Owner Select from among the report owners for which you have access rights.
Private Owned By
Select from among the private reports for which you have access rights.
Public Owned By
Select a public report owner from the list for which you have access rights.
4. Optionally, click (Root) to open the category filter, and navigate to the published report you want to find.
5. Click Apply. The filtered list displays.
Other ReportsThe Other Reports dynamic list displays, by default, information about all reports except for Published Reports. You can filter this list to be as wide or as granular as you desire. See "Filtering the Other Reports List" on page 186.
Other reports guidelines:
l Reports run manually (Execution Type: Run) expire after an hour in this list.
l Background and Scheduled reports do not automatically expire.
Administrator's GuideChapter 4: Reporting
Other Reports Page 184 of 743
l Completion date as well as execution time allow the user to review the time used for that particular report.
To view or download a report on the Other Reports list
1. Select a report to see the options for viewing, or downloading the report for viewing elsewhere. See "View Options" on page 208.
Tip: Only Smart reports include iHTML and Smart report options.
Edit Other Reports
First, go to System Admin > User Management > Groups, and check the following boxes:
l Edit and save report style. o Report folder (Default Reports): view, published reports.
o Report folder (Default Reports): view, run, and scheduled reports.
o Report folder (Default Reports): edit and save reports.
Tip: The boxes checked will allow you to access the majority of reports. If you need to access a particular type of report, make sure to select the correspondent boxes.
Once boxes are checked and these changes are saved, you can go to the Other Reports > Report Status, and edit the report from there. If no rights were granted from the System Admin page, the following error will be displayed while attempting to edit the report: failed to generate report.
To delete background reports
1. Select a report with an execution type of Run in Background.
2. Click to the right of that report. Confirm the deletion.
Tip: Only background reports can be deleted from this list.
Administrator's GuideChapter 4: Reporting
Other Reports Page 185 of 743
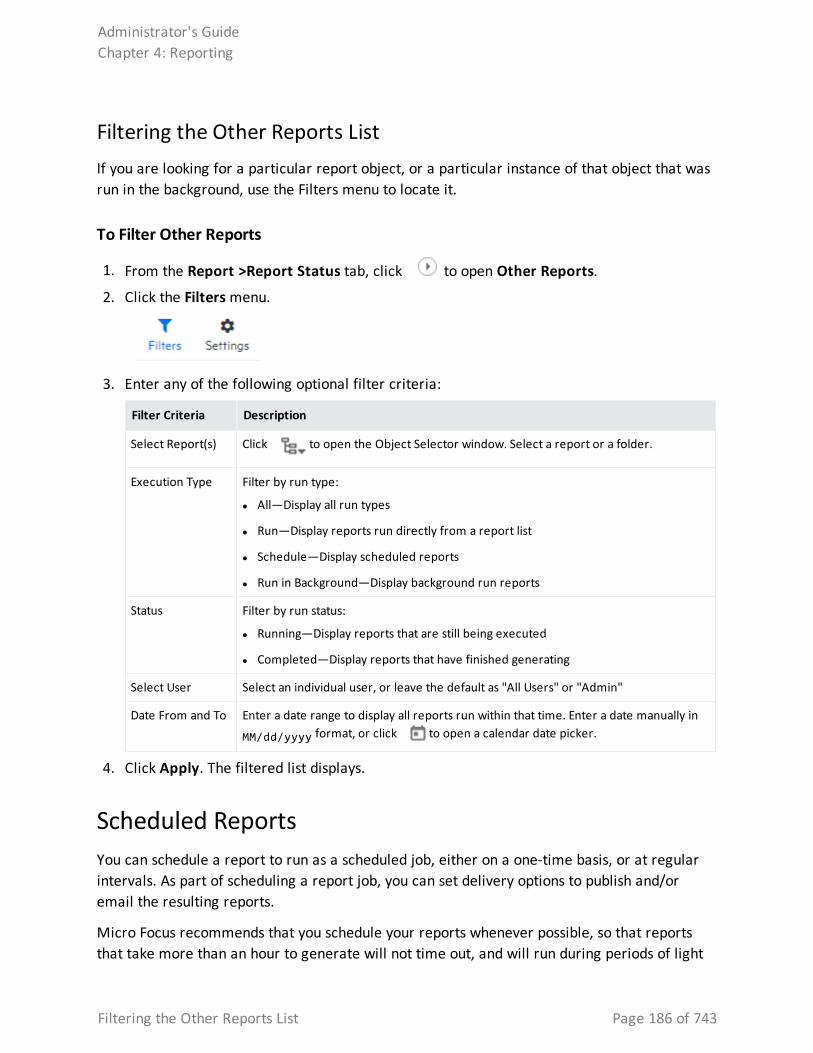
Filtering the Other Reports ListIf you are looking for a particular report object, or a particular instance of that object that was run in the background, use the Filters menu to locate it.
To Filter Other Reports
1. From the Report >Report Status tab, click to open Other Reports.
2. Click the Filters menu.
3. Enter any of the following optional filter criteria:
Filter Criteria Description
Select Report(s) Click to open the Object Selector window. Select a report or a folder.
Execution Type Filter by run type:
l All—Display all run types
l Run—Display reports run directly from a report list
l Schedule—Display scheduled reports
l Run in Background—Display background run reports
Status Filter by run status:
l Running—Display reports that are still being executed
l Completed—Display reports that have finished generating
Select User Select an individual user, or leave the default as "All Users" or "Admin"
Date From and To Enter a date range to display all reports run within that time. Enter a date manually in
MM/dd/yyyy format, or click to open a calendar date picker.
4. Click Apply. The filtered list displays.
Scheduled ReportsYou can schedule a report to run as a scheduled job, either on a one-time basis, or at regular intervals. As part of scheduling a report job, you can set delivery options to publish and/or email the resulting reports.
Micro Focus recommends that you schedule your reports whenever possible, so that reports that take more than an hour to generate will not time out, and will run during periods of light
Administrator's GuideChapter 4: Reporting
Filtering the Other Reports List Page 186 of 743
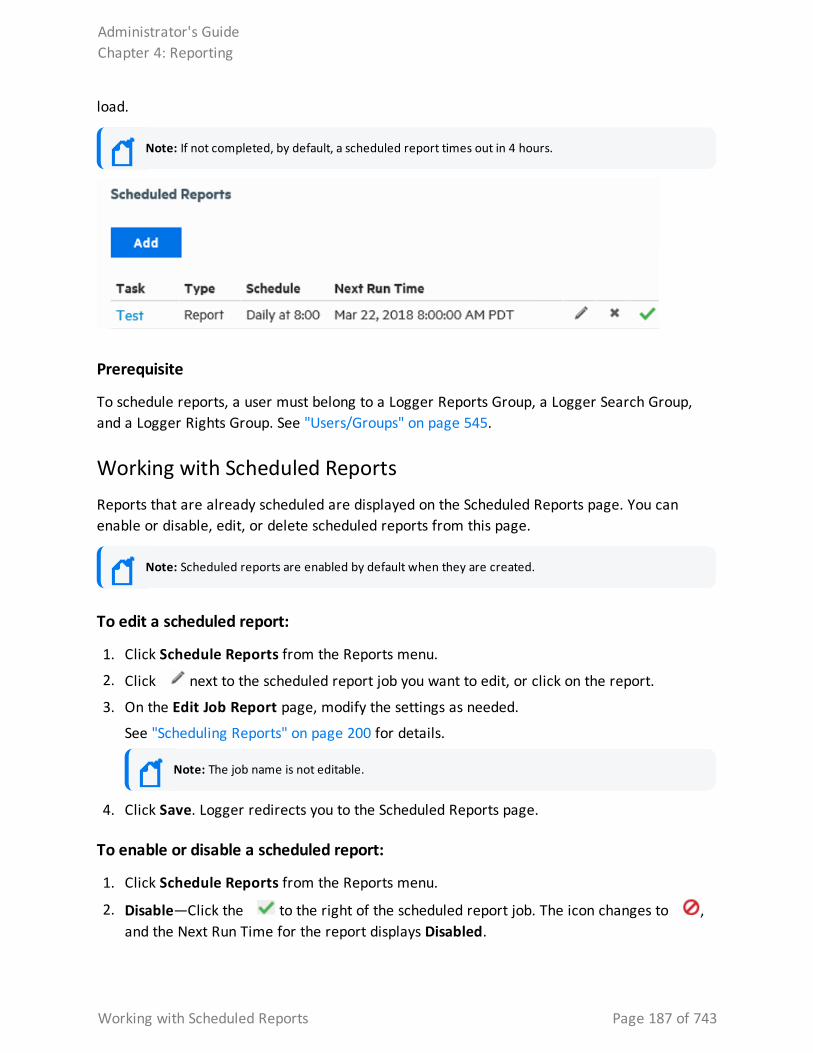
load.
Note: If not completed, by default, a scheduled report times out in 4 hours.
Prerequisite
To schedule reports, a user must belong to a Logger Reports Group, a Logger Search Group, and a Logger Rights Group. See "Users/Groups" on page 545.
Working with Scheduled ReportsReports that are already scheduled are displayed on the Scheduled Reports page. You can enable or disable, edit, or delete scheduled reports from this page.
Note: Scheduled reports are enabled by default when they are created.
To edit a scheduled report:
1. Click Schedule Reports from the Reports menu.
2. Click next to the scheduled report job you want to edit, or click on the report.
3. On the Edit Job Report page, modify the settings as needed.
See "Scheduling Reports" on page 200 for details.
Note: The job name is not editable.
4. Click Save. Logger redirects you to the Scheduled Reports page.
To enable or disable a scheduled report:
1. Click Schedule Reports from the Reports menu.
2. Disable—Click the to the right of the scheduled report job. The icon changes to , and the Next Run Time for the report displays Disabled.
Administrator's GuideChapter 4: Reporting
Working with Scheduled Reports Page 187 of 743
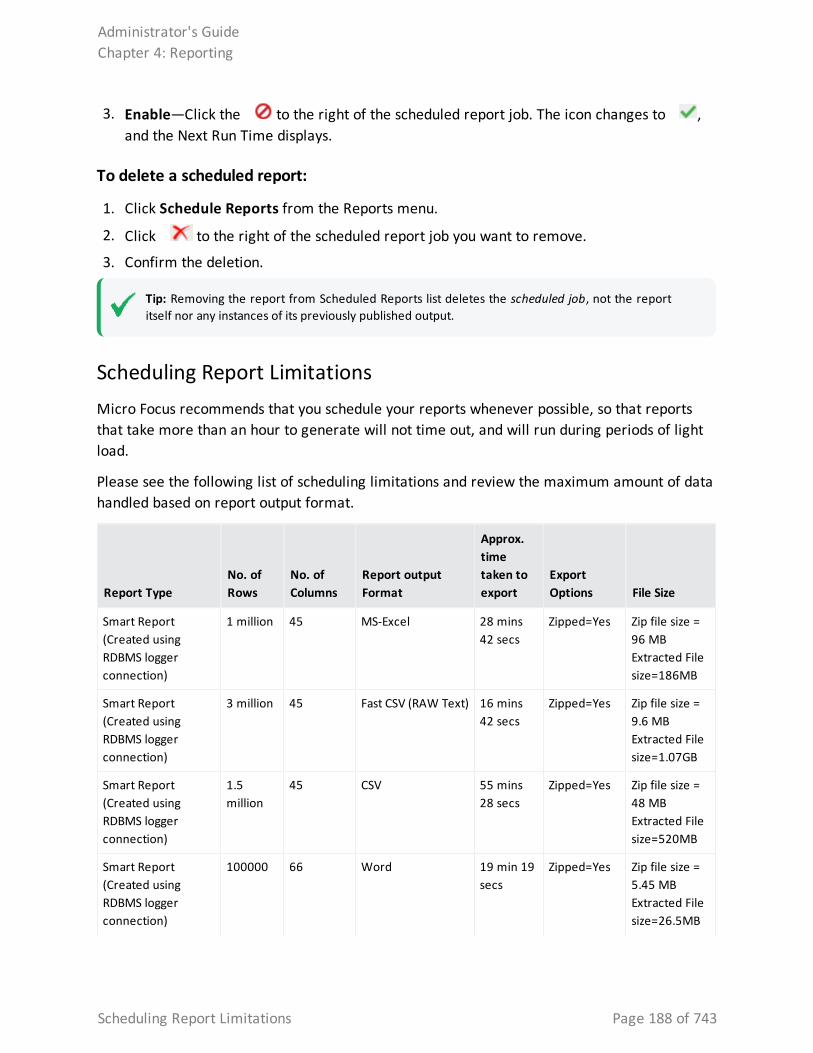
3. Enable—Click the to the right of the scheduled report job. The icon changes to , and the Next Run Time displays.
To delete a scheduled report:
1. Click Schedule Reports from the Reports menu.
2. Click to the right of the scheduled report job you want to remove.
3. Confirm the deletion.
Tip: Removing the report from Scheduled Reports list deletes the scheduled job, not the report itself nor any instances of its previously published output.
Scheduling Report Limitations Micro Focus recommends that you schedule your reports whenever possible, so that reports that take more than an hour to generate will not time out, and will run during periods of light load.
Please see the following list of scheduling limitations and review the maximum amount of data handled based on report output format.
Report TypeNo. of Rows
No. of Columns
Report output Format
Approx. time taken to export
Export Options File Size
Smart Report(Created using RDBMS logger connection)
1 million 45 MS-Excel 28 mins 42 secs
Zipped=Yes Zip file size = 96 MB Extracted File size=186MB
Smart Report(Created using RDBMS logger connection)
3 million 45 Fast CSV (RAW Text) 16 mins 42 secs
Zipped=Yes Zip file size = 9.6 MB Extracted File size=1.07GB
Smart Report(Created using RDBMS logger connection)
1.5 million
45 CSV 55 mins 28 secs
Zipped=Yes Zip file size = 48 MB Extracted File size=520MB
Smart Report(Created using RDBMS logger connection)
100000 66 Word 19 min 19 secs
Zipped=Yes Zip file size = 5.45 MB Extracted File size=26.5MB
Administrator's GuideChapter 4: Reporting
Scheduling Report Limitations Page 188 of 743
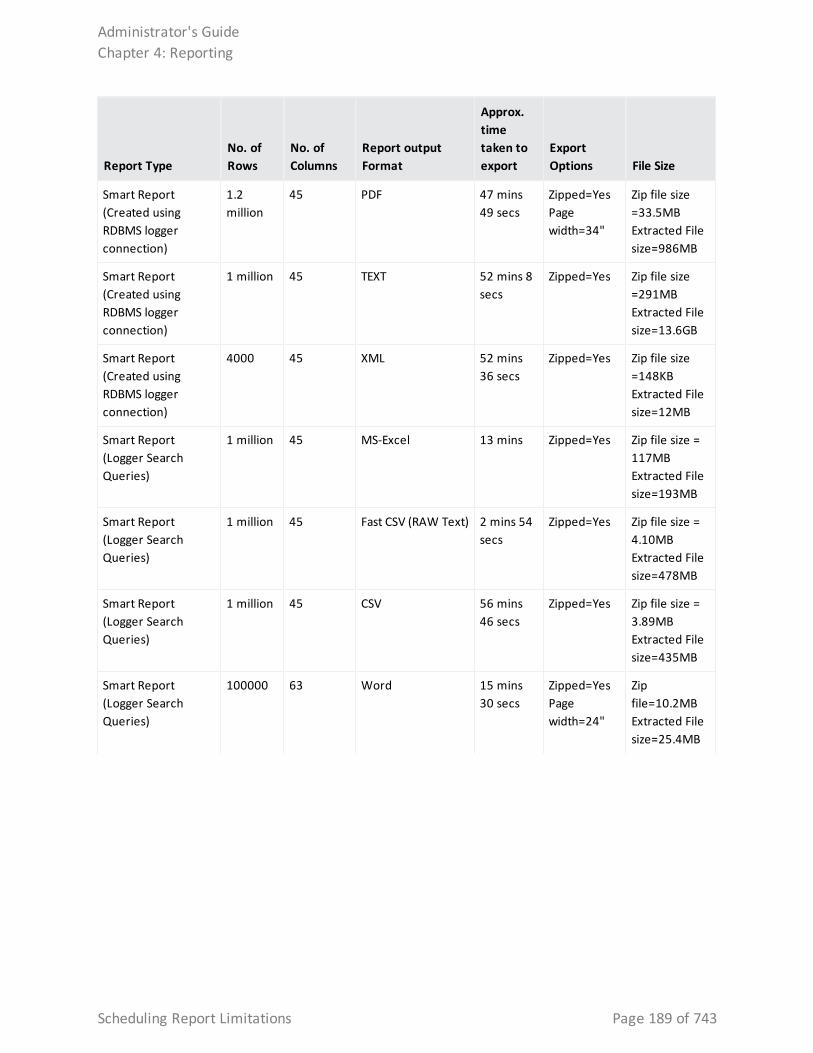
Report TypeNo. of Rows
No. of Columns
Report output Format
Approx. time taken to export
Export Options File Size
Smart Report(Created using RDBMS logger connection)
1.2 million
45 PDF 47 mins 49 secs
Zipped=Yes Page width=34"
Zip file size =33.5MB Extracted File size=986MB
Smart Report(Created using RDBMS logger connection)
1 million 45 TEXT 52 mins 8 secs
Zipped=Yes Zip file size =291MB Extracted File size=13.6GB
Smart Report(Created using RDBMS logger connection)
4000 45 XML 52 mins 36 secs
Zipped=Yes Zip file size =148KB Extracted File size=12MB
Smart Report (Logger Search Queries)
1 million 45 MS-Excel 13 mins Zipped=Yes Zip file size = 117MB Extracted File size=193MB
Smart Report (Logger Search Queries)
1 million 45 Fast CSV (RAW Text) 2 mins 54 secs
Zipped=Yes Zip file size = 4.10MB Extracted File size=478MB
Smart Report (Logger Search Queries)
1 million 45 CSV 56 mins 46 secs
Zipped=Yes Zip file size = 3.89MB Extracted File size=435MB
Smart Report (Logger Search Queries)
100000 63 Word 15 mins 30 secs
Zipped=Yes Page width=24"
Zip file=10.2MB Extracted File size=25.4MB
Administrator's GuideChapter 4: Reporting
Scheduling Report Limitations Page 189 of 743
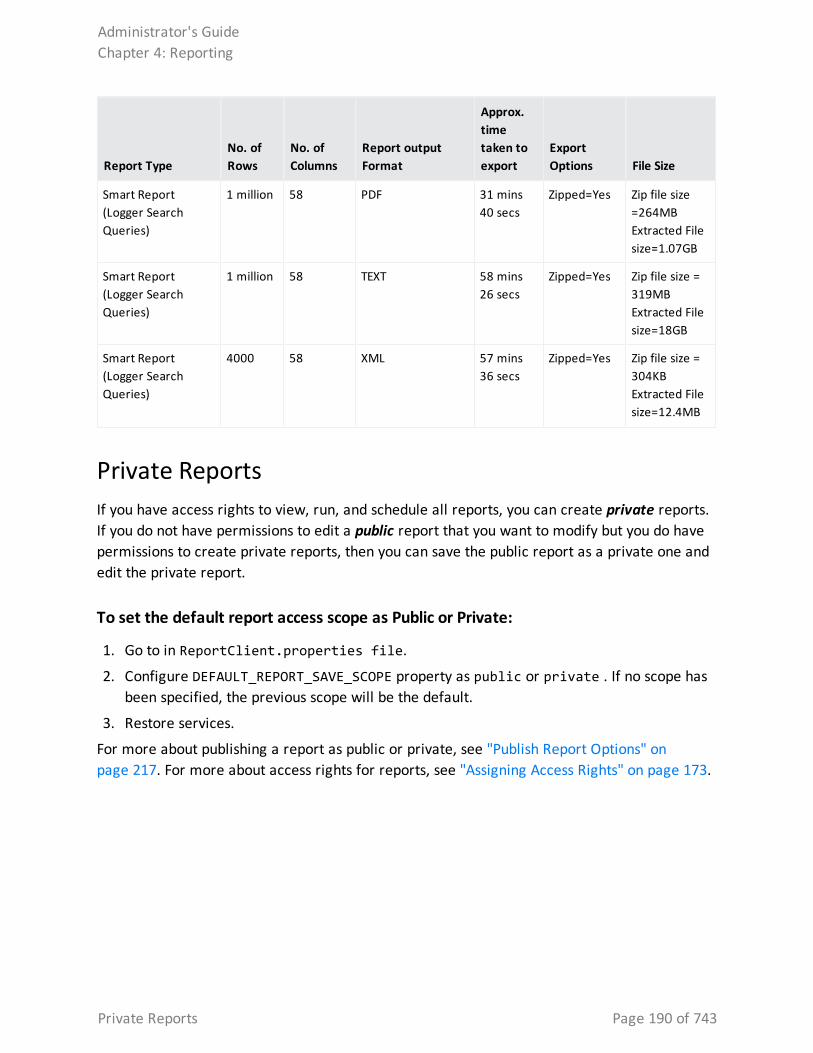
Report TypeNo. of Rows
No. of Columns
Report output Format
Approx. time taken to export
Export Options File Size
Smart Report (Logger Search Queries)
1 million 58 PDF 31 mins 40 secs
Zipped=Yes Zip file size =264MB Extracted File size=1.07GB
Smart Report (Logger Search Queries)
1 million 58 TEXT 58 mins 26 secs
Zipped=Yes Zip file size = 319MB Extracted File size=18GB
Smart Report (Logger Search Queries)
4000 58 XML 57 mins 36 secs
Zipped=Yes Zip file size = 304KB Extracted File size=12.4MB
Private ReportsIf you have access rights to view, run, and schedule all reports, you can create private reports. If you do not have permissions to edit a public report that you want to modify but you do have permissions to create private reports, then you can save the public report as a private one and edit the private report.
To set the default report access scope as Public or Private:
1. Go to in ReportClient.properties file.
2. Configure DEFAULT_REPORT_SAVE_SCOPE property as public or private . If no scope has been specified, the previous scope will be the default.
3. Restore services.
For more about publishing a report as public or private, see "Publish Report Options" on page 217. For more about access rights for reports, see "Assigning Access Rights" on page 173.
Administrator's GuideChapter 4: Reporting
Private Reports Page 190 of 743
Running ReportsYou can run Logger reports from many locations, and choose the run option that works best for that report.
Tip: You can also run reports as part of the design process. This section deals with run-ready reports.
Report GuidelinesLogger is designed to process events while running reports, but event processing has priority. Running a complex report while the event processing system is under load will result in report timeout rather than dropped events.
l To effectively manage demands for system resources, Micro Focus recommends using Scheduled Reports. Run ad hoc reports (if any) during periods of light load. See "Scheduling Reports" on page 200.
l You can also run large reports in the background. See "Restrict Long Reports to Run in the Background" on page 199.
l If you are running a distributed report, also see the best practices discussed in "Selecting Groups, Devices, and Peers" on page 196.
l Smart Reports support up to 20k rows. For larger reports, "Restrict Long Reports to Run in the Background" on page 199.
l Logger reports based on filters or saved searches should not include Wildcards in the fieldsets.
l When running a report based on Logger resources (filters, saved searches), a template (including columns) is created based on sample data. Any update made after the report creation (search query output from data grid to chart, time window, or the query itself ), will not automatically update the template displaying fewer columns than the original set of fields. To refresh the report template, update the report object.
l To confirm new fields have been included after updating the report object, use the fieldsets without Wildcards.
l Fields not explicitly defined in the fieldset search (existent fields like custom or out of the box + additional fields not added in Logger) are dynamically represented with an asterisk *.
Administrator's GuideChapter 4: Reporting
Running Reports Page 191 of 743
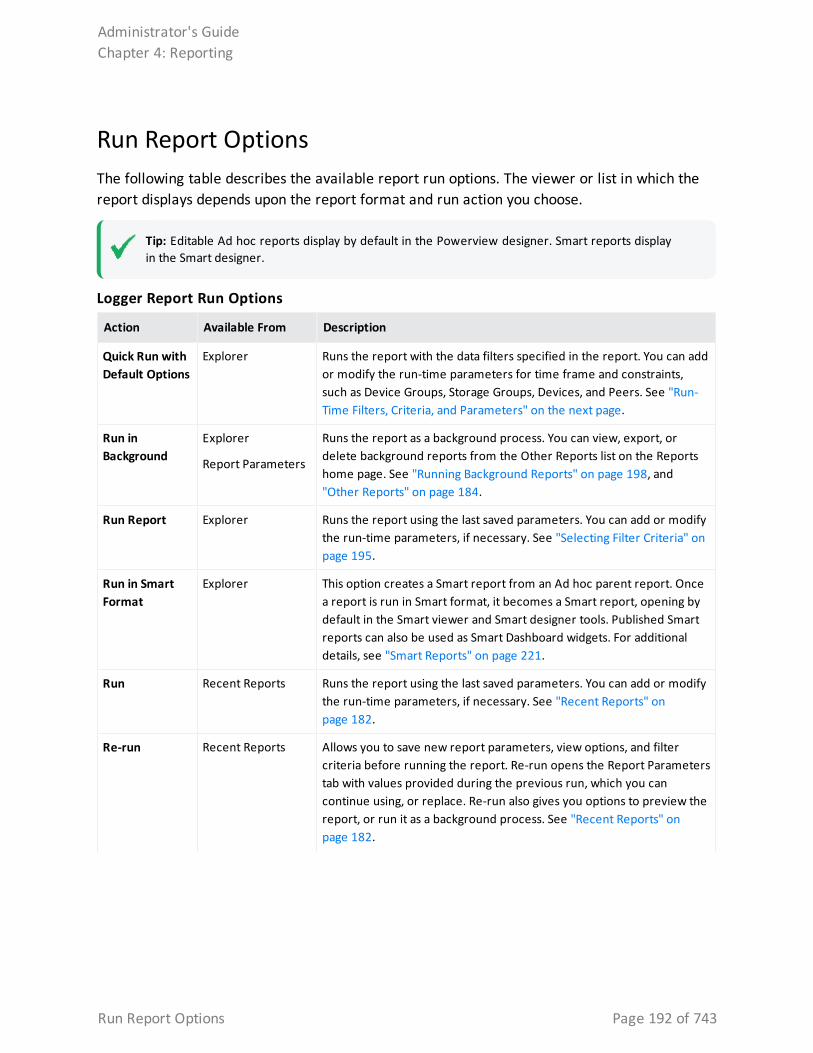
Run Report OptionsThe following table describes the available report run options. The viewer or list in which the report displays depends upon the report format and run action you choose.
Tip: Editable Ad hoc reports display by default in the Powerview designer. Smart reports display in the Smart designer.
Action Available From Description
Quick Run with Default Options
Explorer Runs the report with the data filters specified in the report. You can add or modify the run-time parameters for time frame and constraints, such as Device Groups, Storage Groups, Devices, and Peers. See "Run-Time Filters, Criteria, and Parameters" on the next page.
Run in Background
Explorer
Report Parameters
Runs the report as a background process. You can view, export, or delete background reports from the Other Reports list on the Reports home page. See "Running Background Reports" on page 198, and "Other Reports" on page 184.
Run Report Explorer Runs the report using the last saved parameters. You can add or modify the run-time parameters, if necessary. See "Selecting Filter Criteria" on page 195.
Run in Smart Format
Explorer This option creates a Smart report from an Ad hoc parent report. Once a report is run in Smart format, it becomes a Smart report, opening by default in the Smart viewer and Smart designer tools. Published Smart reports can also be used as Smart Dashboard widgets. For additional details, see "Smart Reports" on page 221.
Run Recent Reports Runs the report using the last saved parameters. You can add or modify the run-time parameters, if necessary. See "Recent Reports" on page 182.
Re-run Recent Reports Allows you to save new report parameters, view options, and filter criteria before running the report. Re-run opens the Report Parameters tab with values provided during the previous run, which you can continue using, or replace. Re-run also gives you options to preview the report, or run it as a background process. See "Recent Reports" on page 182.
Logger Report Run Options
Administrator's GuideChapter 4: Reporting
Run Report Options Page 192 of 743
Action Available From Description
Preview Report Parameters Displays a short sample of the report, including title and column headings. You can add or modify the run-time parameters, if necessary. See "Run-Time Filters, Criteria, and Parameters" below.
Run Now Report Parameters Runs the report immediately and displays in the appropriate viewer. See "Run-Time Filters, Criteria, and Parameters" below.
Refresh Data Smart Viewer Runs the report with existing filters and options.
Logger Report Run Options, continued
Run-Time Filters, Criteria, and ParametersMost reports give you the option to set appropriate run-time filters, select device and other search criteria, and parameters. This section explains how to use these customization tools to display the data you want as you want it.
You can define filters, or modify default filters if any are already built into the report. The filter expression is applied when the report runs, narrowing the focus of the report to the specified criteria.
For example, you could set the filter criteria for a report on Top Password Changes to report only on password changes related to specified user names or involving specified IP addresses. For details on how to create these filters (with Field, Criteria, and Value fields), see "Filter" on page 233.
The Report Run Parameters are displayed whenever you are creating a report, prior executing a report, and when adding or editing an scheduled report. If you run the report without specifying any override run-time parameters here, the report is generated with the defaults specified at design time for this report. You can run a report in the background after specifying the Run Report parameters.
Note: Filter criteria defined at report run time applies only to this run of the report. Filters set in this way are not saved nor made available to other users. You can also set built-in, default filter criteria as a part of designing a report.
Additional FiltersWhen you run a report, you have the option to select additional run-time filters on time frame and constraints, such as Device Groups, Storage Groups, Devices, and Peers. If nothing is selected, all groups and devices are included.
Administrator's GuideChapter 4: Reporting
Run-Time Filters, Criteria, and Parameters Page 193 of 743
Note: Peers are not included by default. They must be explicitly selected to include them. See "Running Distributed Reports" on page 199.
Option Description
Device Type Some reports allow you to select which device types to include in the report.
Start Specify the starting point for the data gathering from the events database.
By default, the start time is specified with a dynamic data expression ($Now-2h).
You can modify the dynamic expression to specify a different dynamic start time, or disable Dynamic and use the calendar options to specify a fixed start time.
End Specify the ending point for the data gathering that is some time after the starting point.
Keep in mind that large time spans can mean large amounts of data, which can affect system performance.
By default, the end time is specified with a dynamic data expression ($Now).
You can modify the dynamic expression to specify a different dynamic end time, or disable Dynamic and use the calendar options to specify a fixed end time.
Search Time Field Select the search time type: Logger Receipt Time or End Time (Event time).
Scan Limit Specify the number of events to scan.
When you specify a scan limit, the number of events scanned for manually run reports is restricted to the specified limit. Doing so results in faster report generation and is beneficial in situations when you only want to process the latest N number of events in the specified time range instead of all the events stored in Logger.
The scan limit is 100,000 by default. If you set the scan limit to 0 (zero), all events are scanned.
Note: This setting does not apply to Scheduled reports.
Device Groups Select specific device groups on which to run the report query, if any. See "Selecting Groups, Devices, and Peers" on page 196.
Storage Groups Select specific storage groups on which to run the report query. See "Selecting Groups, Devices, and Peers" on page 196.
Devices Select specific devices on which to run the report query. See "Selecting Groups, Devices, and Peers" on page 196.
Peers Select any peer Loggers (if peers are configured) on which to run the report query. See "Selecting Groups, Devices, and Peers" on page 196. The Local only box will be unchecked for searches that include _peerLogger operator.
Additional Filters Report Parameters
Administrator's GuideChapter 4: Reporting
Additional Filters Page 194 of 743
Report SettingsWhen you choose the Run Report option for a report, you can choose a file format, specify pagination, and modify the data filter criteria for this run of the report. If you run the report without specifying any override run-time parameters here, the report is generated with the defaults specified at design time for this report.
The following table describes the Report Settings options.
Option Description
Template Select the template to apply to this report. The templates pull-down menu shows supplied templates, and any custom templates you may have added. To include the start time, end time, scan limit, device group, storage group, and devices information (used to run a report) in a report, choose the BlankWithHeader template. See "Template Styles" on page 287.
Report Format Specify a file type or “format” option of the output. See "Report Formats for Viewing " on page 207.
View Options Select from the available options for that report. See "View Options" on page 208
Filter tab Optional, Define filters or modify existing default filters, if any. See "Selecting Filter Criteria" below
The filter expression is applied when the report runs, narrowing the focus of the report to the specified criteria.
For example, for the report "Top Password Changes," you could set the filter criteria to display only password changes related to specified user names or specified IP addresses.
For details on how to create these filters (with Field, Criteria, and Value fields), See "Filter" on page 233.
Note: Filter criteria defined at report run time applies only to this run of the report. Filters set in this way are not saved nor made available to other users. You can also set built-in, default filter criteria as a part of designing a report.
Report Settings
Selecting Filter CriteriaWhen you choose the Run Report link for a report, filter options are available to modify the data filter criteria for only this run of the report. You can define filters, or modify default filters if any are already built into the report. The filter expression is applied when the report runs, narrowing the focus of the report to the specified criteria.
For example, you could set the filter criteria for a report on Top Password Changes to report only on password changes related to specified user names or involving specified IP addresses.
Administrator's GuideChapter 4: Reporting
Report Settings Page 195 of 743
For details on how to create these filters (with Field, Criteria, and Value fields), see "Filter" on page 233.
If you run the report without specifying any override run-time parameters here, the report is generated with the defaults specified at design time for this report. You can run a report in the background after specifying the Run Report parameters.
Note: Filter criteria defined at report run time applies only to this run of the report. Filters set in this way are not saved nor made available to other users. You can also set built-in, default filter criteria as a part of designing a report.
Selecting Groups, Devices, and PeersYou can select which data sources within Device Groups, Storage Groups, Devices, or Peers to include in your report, as a part of setting the Additional Filters settings.
By default, events from all groups and devices are included, because nothing is selected. Select specific groups or devices to limit the data gathering to only those sources when the report is run.
Note: Peers must be explicitly selected to run a report query on them. If none of the peers are selected, the query will only run on the local Logger.
The selected items in the Device Groups, the Devices lists, and Peers are appended to the report query with an OR operator. They are appended to other selected items, such as Storage Groups, with an AND operator.
To select specific data sources:
1. Click an item to select it.
2. Use Ctrl-click to select or deselect multiple items.
To select all available data sources:
1. Deselect any selected data sources.
Administrator's GuideChapter 4: Reporting
Selecting Groups, Devices, and Peers Page 196 of 743
Running a Recent Report
To run or re-run a recent report:
1. From the Report > Report Status tab, click to open Other Reports.
2. If necessary, filter the reports by clicking the Filters icon. You can also establish a refresh interval by clicking the Settings icon. For additional details, see "Filtering the Other Reports List" on page 186.
3. Click the recent report. Select a rendering format. For further details, see "Report Formats for Viewing " on page 207.
4. The report generates using the last saved parameters. Reports that are run in Smart Format display in the Smart Viewer. See "The Smart Report Viewer" on page 205. Ad hoc reports display in the Ad hoc Viewer. See "The Ad hoc Report Viewer" on page 203.
Running a Report from ExplorerThere are many ways and places to run reports, but Explorer will likely provide you the most selection of options. For full information, See "Reports Explorer" on page 176.
To open Explorer:
From the top of the Reports menu, click Explorer. This action toggles the Explorer to open or close, without opening a new tab. In this way, Explorer is available from any tab, and out of the way when you don't need it.
To run a report from Explorer:
1. Go to Reports > Explorer and select a report.
2. Right-click the report. The action menu displays for that report. See "Explorer Options and Context Menus" on page 179.
Select Customize Report to Save, Preview, or Run the report and return to Explorer. You can also click Run in Smart Format to run and open the report in the Smart viewer.
3. Select a run option for that report. See "Run Report Options" on page 192.
4. Enter any run-time filter or parameter criteria. See "Run-Time Filters, Criteria, and Parameters" on page 193.
Administrator's GuideChapter 4: Reporting
Running a Recent Report Page 197 of 743
Click Run, Run in Background, or Preview. Logger then runs the report, and opens the report in the appropriate designer, where you can customize the report and create and edit charts to display the data.
Tip: To run a report from using the smart report designer, see "The Smart Report Designer" on page 220.
Viewing, and Publishing Reports
Reports are available under their respective categories. You can run, view, and publish reports you create, as well as reports in categories for which the administrator has given you user access rights. You can run up to 5 Ad Hoc reports or up to 10 scheduled reports, concurrently. For more information about report categories, see "Reports Explorer" on page 176.
Note: When scheduling reports, consider recurrence to avoid overlapping executions.
Running Background ReportsYou can run a background report in Report Status >Other Reports.
To run a background report from Explorer
1. From Explorer, navigate to a report you want to run.
2. Right-click the report name, and select Run in Background.
3. Configure any additional filters or report parameters.
4. Click Run in Background.
To run a background report from a filter or parameter page
1. From Recent Report widget, select a report you want to run.
2. Click to re-run the report.
3. Configure any additional filters or report parameters.
4. Click Run in Background.
To delete a background report
1. Click Other Reports on the Reports Status tab. The Other Reports list displays.
2. Click the to the right of the background report you want to delete.
3. Confirm the deletion.
Administrator's GuideChapter 4: Reporting
Running Background Reports Page 198 of 743
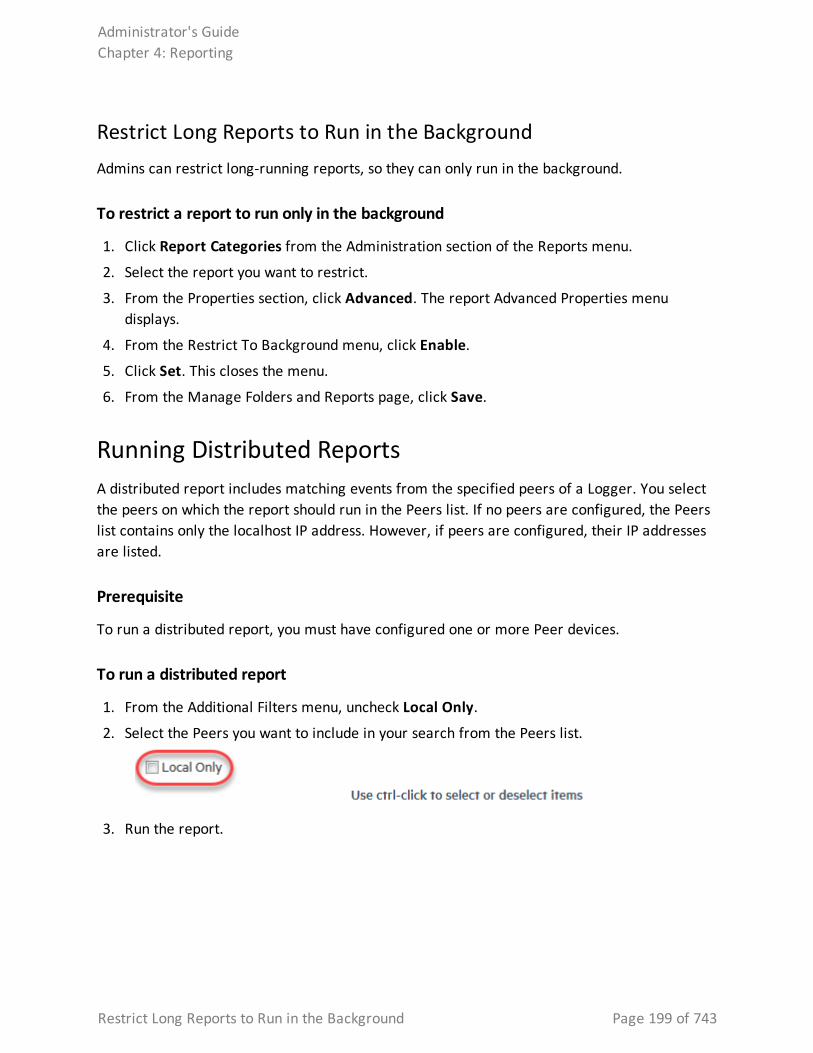
Restrict Long Reports to Run in the BackgroundAdmins can restrict long-running reports, so they can only run in the background.
To restrict a report to run only in the background
1. Click Report Categories from the Administration section of the Reports menu.
2. Select the report you want to restrict.
3. From the Properties section, click Advanced. The report Advanced Properties menu displays.
4. From the Restrict To Background menu, click Enable.
5. Click Set. This closes the menu.
6. From the Manage Folders and Reports page, click Save.
Running Distributed ReportsA distributed report includes matching events from the specified peers of a Logger. You select the peers on which the report should run in the Peers list. If no peers are configured, the Peers list contains only the localhost IP address. However, if peers are configured, their IP addresses are listed.
Prerequisite
To run a distributed report, you must have configured one or more Peer devices.
To run a distributed report
1. From the Additional Filters menu, uncheck Local Only.
2. Select the Peers you want to include in your search from the Peers list.
3. Run the report.
Administrator's GuideChapter 4: Reporting
Restrict Long Reports to Run in the Background Page 199 of 743
Scheduling ReportsYou can schedule a report to run daily at a specified time or every so many hours, or on specified days of week or month, at a specified time.
Tip: Time changes at the beginning or end of Daylight Savings Time and may affect your scheduled reports. For more information, see "Impact of Daylight Savings Time Change on Logger Operations" on page 509.
To configure a scheduled report:
Caution: Once the schedule report is updated and saved, the latest editor will automatically become the report owner.
1. Click Schedule Reports from the Reports menu. The Schedule Reports page opens in a tab.
a. If there are scheduled reports you have privileges to view, they are listed. Your reports include options to edit or delete them.
b. If there are no scheduled reports, you see "There are no report jobs to display."
2. Click Add to display the Add Report Job page.
3. In the Name field, enter the report display name.
4. Select the search type: event occurred or receipt time.
5. Use the Schedule options to specify how frequently the report should run:
l Every day—Run a daily report at a specified time, or every specified number of hours.
l Days of week—Run the report on a specified day of the week. For example: Su, M, T, W, Th, F, Sa.
l Days of month—Run the report on a specified day of the month. For example: 1,5,20,21.
l Hour of day—Run the report at a specific time of day. For example: 0300.
l Every—Run the report every specified number of hours or minutes. For example, 90 minutes.
6. Select a report from the Report Name pull-down menu, then click to load the report.
7. In the Delivery Operations section, configure one or both of the following options:
l Publish—(Selected by default) Publish the report at the scheduled time. For details on setting publishing options, see "Publish Report Options" on page 217
Administrator's GuideChapter 4: Reporting
Scheduling Reports Page 200 of 743
l Email—Send the report as a link or an email attachment at the scheduled time. For details on setting email delivery options, see "Email Delivery Settings" on page 218.
l Upload — Upload the report to FTP or a Shared Folder . For details on how to send reports via FTP, see "Uploading a Report to a Server or FTP Site" on page 214
Tip: It isn't necessary to save the report before moving from one tab to another. Just remember to save the report before closing the page.
8. In the Report Format section, select a report format and delivery options.
When choosing the report format for scheduled reports with several columns, change the paper size to Auto.
l Select a report format. See "Report Formats for Viewing " on page 207
l Select a delivery option. See "Export Options" on page 213
l If you want an Excel, Word, or PDF file to be available in its native format, click Smart Export. See "Scheduling a Report with Smart Export option" below.
9. In the Report Parameters section, you can either accept the default parameters, or modify them here. For information on specifying report parameters, see "Parameters" on page 277.
10. Please review the query that is about to be executed. The Local only box has been unchecked for searches that include _peerLogger operator.
11. Click Save.
The report you added is scheduled, and now shows on the Scheduled Reports list.
To export a list of scheduled report:
Once a schedule report is added and saved, Logger enables you to export the Task, Type, Schedule, and Next Run Time of that report in a list.
1. Click the button.
2. Select your export format: PDF or CSV.
3. Select download.
Scheduling a Report with Smart Export optionThe Smart Export option is available for Scheduled Reports using MS Excel, Acrobat PDF, and MS Word formats. Reports are exported into their native formats, so that users can leverage
Administrator's GuideChapter 4: Reporting
Scheduling a Report with Smart Export option Page 201 of 743
the functionality of their respective tools. See "Report Formats for Viewing " on page 207
l The grid information is exported as its equivalent table in Excel, Word and PDF.
l The matrix is exported as a Pivot table in Excel and as a table in Word and PDF.
l Report charts are exported as a chart in Excel, Word, and as an image in PDF.
Smart Export is enabled by default for scheduled reports in these three formats.
To enable Smart Export for a report:
1. From the Scheduled Reports page, edit an existing scheduled report, or click Add to start a new scheduled report. See "Scheduling Reports" on page 200.
2. From the Report Format section, select either MS Excel, Acrobat PDF, or MS Word. The Smart Export checkbox becomes available.
l Checked (default) — The report will be exported as a native file for its supported program.
l Unchecked — The report will be a normal export, with charts exported as images.
3. Make sure all other information and changes have been made to the report.
4. Click Save.
Viewing ReportsOnce a report is run and in the Smart or Ad hoc Viewer, you can publish it for further use, add comments, email, upload, or export it in different output formats.
The options you have in the report viewer are limited to attaching comments and sending the report out somewhere. To modify and customize your report, see "Designing Custom Reports" on page 219.
For information about modifying report results, such as adding logos, charts, and changing the display options, see Smart Reports.
Collaborating on ReportsLogger users can collaborate on a Published report by opening the report in HTML format to view and comment on it. Optionally, you can specify the users who can view the comments.
Tip: You must have Run and Publish access rights to a report to add comments.
Administrator's GuideChapter 4: Reporting
Viewing Reports Page 202 of 743
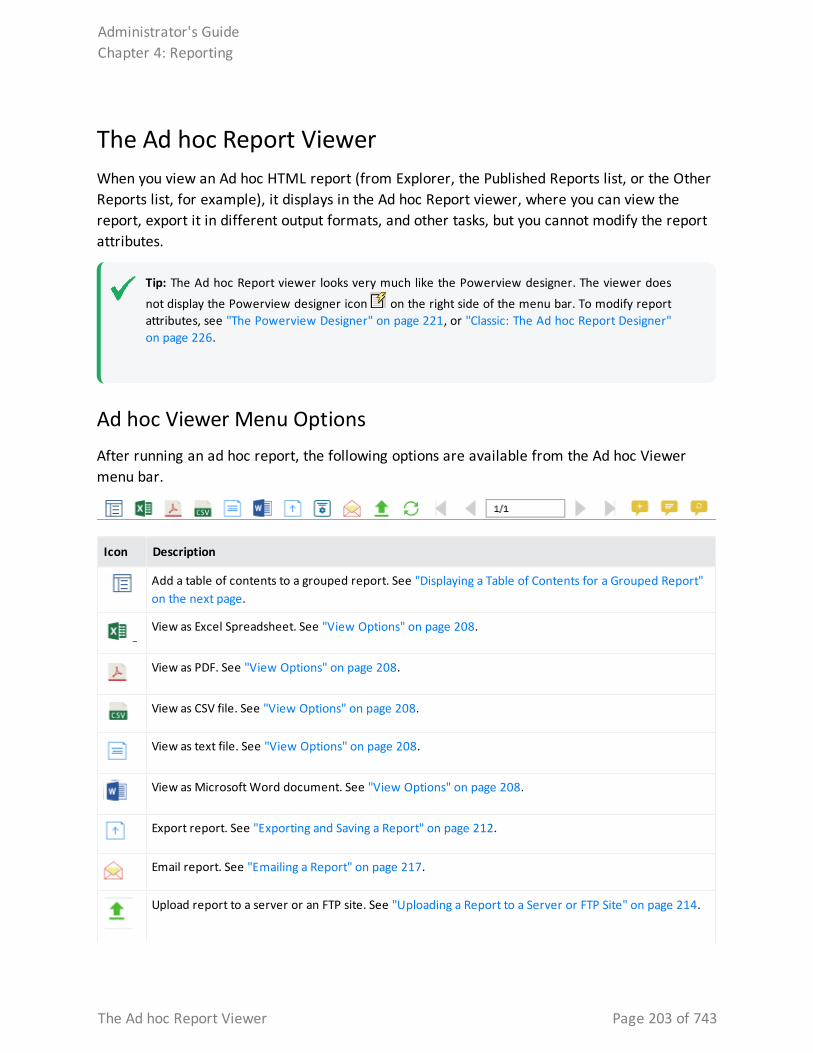
The Ad hoc Report ViewerWhen you view an Ad hoc HTML report (from Explorer, the Published Reports list, or the Other Reports list, for example), it displays in the Ad hoc Report viewer, where you can view the report, export it in different output formats, and other tasks, but you cannot modify the report attributes.
Tip: The Ad hoc Report viewer looks very much like the Powerview designer. The viewer does
not display the Powerview designer icon on the right side of the menu bar. To modify report attributes, see "The Powerview Designer" on page 221, or "Classic: The Ad hoc Report Designer" on page 226.
Ad hoc Viewer Menu OptionsAfter running an ad hoc report, the following options are available from the Ad hoc Viewer menu bar.
Icon Description
Add a table of contents to a grouped report. See "Displaying a Table of Contents for a Grouped Report" on the next page.
View as Excel Spreadsheet. See "View Options" on page 208.
View as PDF. See "View Options" on page 208.
View as CSV file. See "View Options" on page 208.
View as text file. See "View Options" on page 208.
View as Microsoft Word document. See "View Options" on page 208.
Export report. See "Exporting and Saving a Report" on page 212.
Email report. See "Emailing a Report" on page 217.
Upload report to a server or an FTP site. See "Uploading a Report to a Server or FTP Site" on page 214.
Administrator's GuideChapter 4: Reporting
The Ad hoc Report Viewer Page 203 of 743
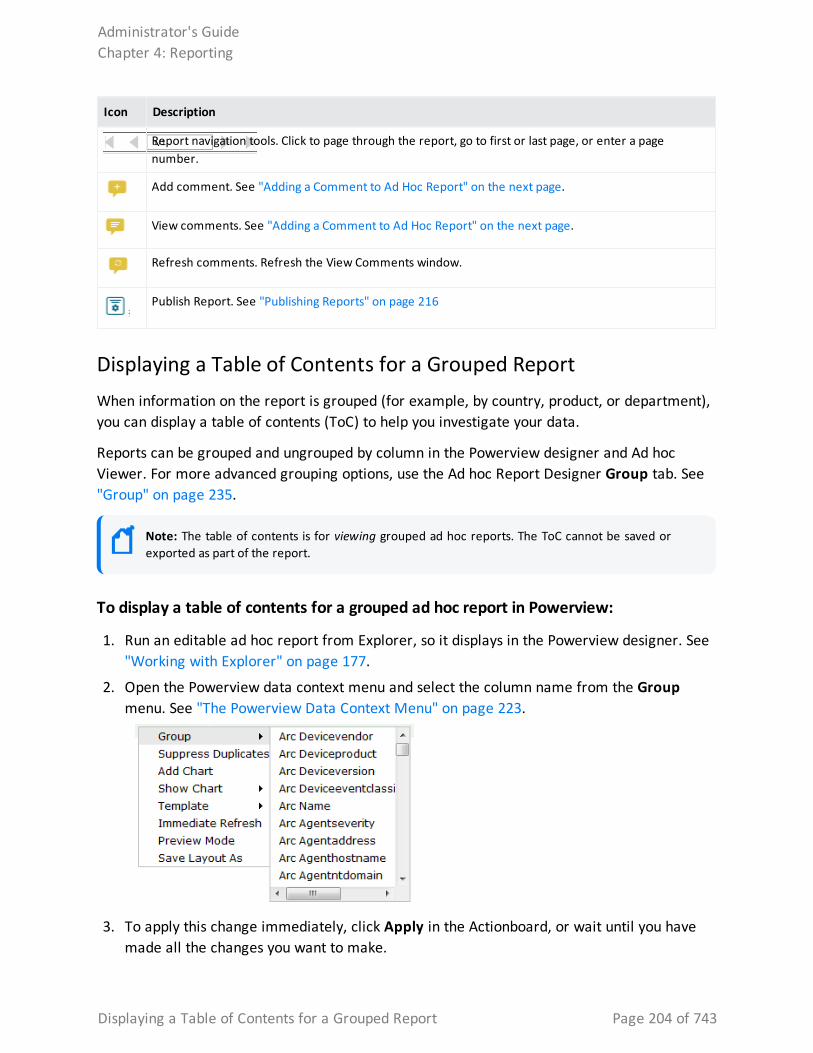
Icon Description
Report navigation tools. Click to page through the report, go to first or last page, or enter a page number.
Add comment. See "Adding a Comment to Ad Hoc Report" on the next page.
View comments. See "Adding a Comment to Ad Hoc Report" on the next page.
Refresh comments. Refresh the View Comments window.
Publish Report. See "Publishing Reports" on page 216
Displaying a Table of Contents for a Grouped ReportWhen information on the report is grouped (for example, by country, product, or department), you can display a table of contents (ToC) to help you investigate your data.
Reports can be grouped and ungrouped by column in the Powerview designer and Ad hoc Viewer. For more advanced grouping options, use the Ad hoc Report Designer Group tab. See "Group" on page 235.
Note: The table of contents is for viewing grouped ad hoc reports. The ToC cannot be saved or exported as part of the report.
To display a table of contents for a grouped ad hoc report in Powerview:
1. Run an editable ad hoc report from Explorer, so it displays in the Powerview designer. See "Working with Explorer" on page 177.
2. Open the Powerview data context menu and select the column name from the Group menu. See "The Powerview Data Context Menu" on page 223.
3. To apply this change immediately, click Apply in the Actionboard, or wait until you have made all the changes you want to make.
Administrator's GuideChapter 4: Reporting
Displaying a Table of Contents for a Grouped Report Page 204 of 743
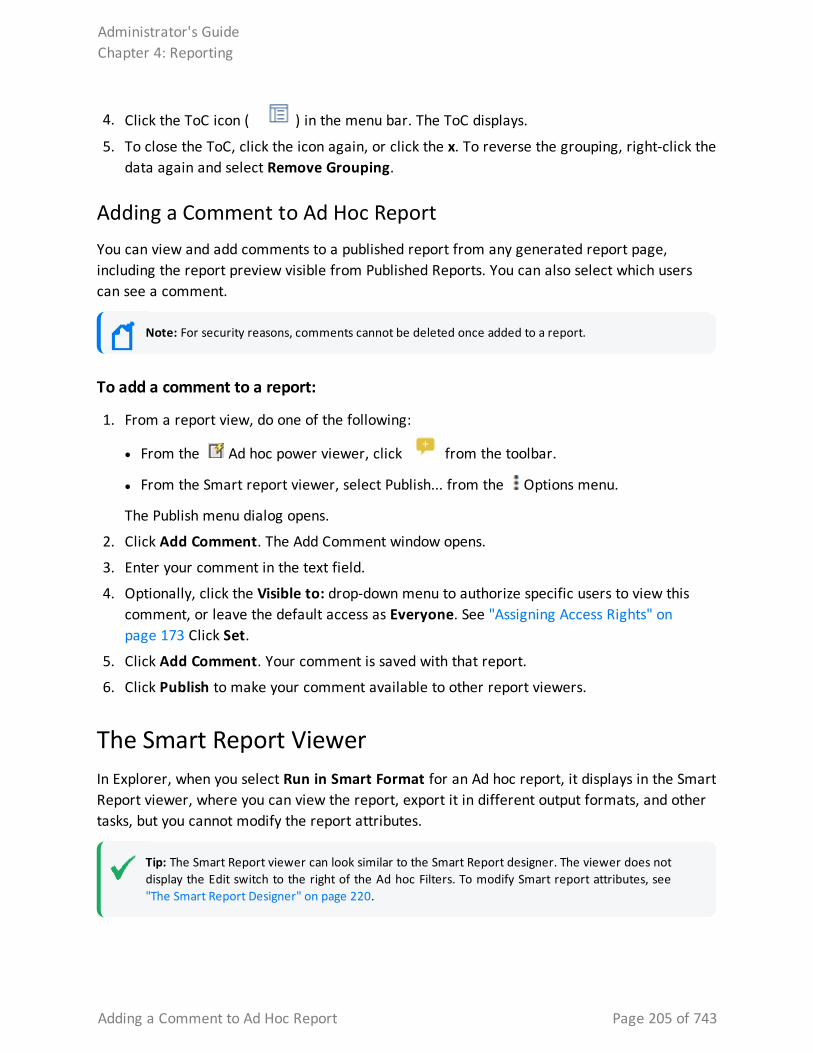
4. Click the ToC icon ( ) in the menu bar. The ToC displays.
5. To close the ToC, click the icon again, or click the x. To reverse the grouping, right-click the data again and select Remove Grouping.
Adding a Comment to Ad Hoc ReportYou can view and add comments to a published report from any generated report page, including the report preview visible from Published Reports. You can also select which users can see a comment.
Note: For security reasons, comments cannot be deleted once added to a report.
To add a comment to a report:
1. From a report view, do one of the following:
l From the Ad hoc power viewer, click from the toolbar.
l From the Smart report viewer, select Publish... from the Options menu.
The Publish menu dialog opens.
2. Click Add Comment. The Add Comment window opens.
3. Enter your comment in the text field.
4. Optionally, click the Visible to: drop-down menu to authorize specific users to view this comment, or leave the default access as Everyone. See "Assigning Access Rights" on page 173 Click Set.
5. Click Add Comment. Your comment is saved with that report.
6. Click Publish to make your comment available to other report viewers.
The Smart Report ViewerIn Explorer, when you select Run in Smart Format for an Ad hoc report, it displays in the Smart Report viewer, where you can view the report, export it in different output formats, and other tasks, but you cannot modify the report attributes.
Tip: The Smart Report viewer can look similar to the Smart Report designer. The viewer does not display the Edit switch to the right of the Ad hoc Filters. To modify Smart report attributes, see "The Smart Report Designer" on page 220.
Administrator's GuideChapter 4: Reporting
Adding a Comment to Ad Hoc Report Page 205 of 743
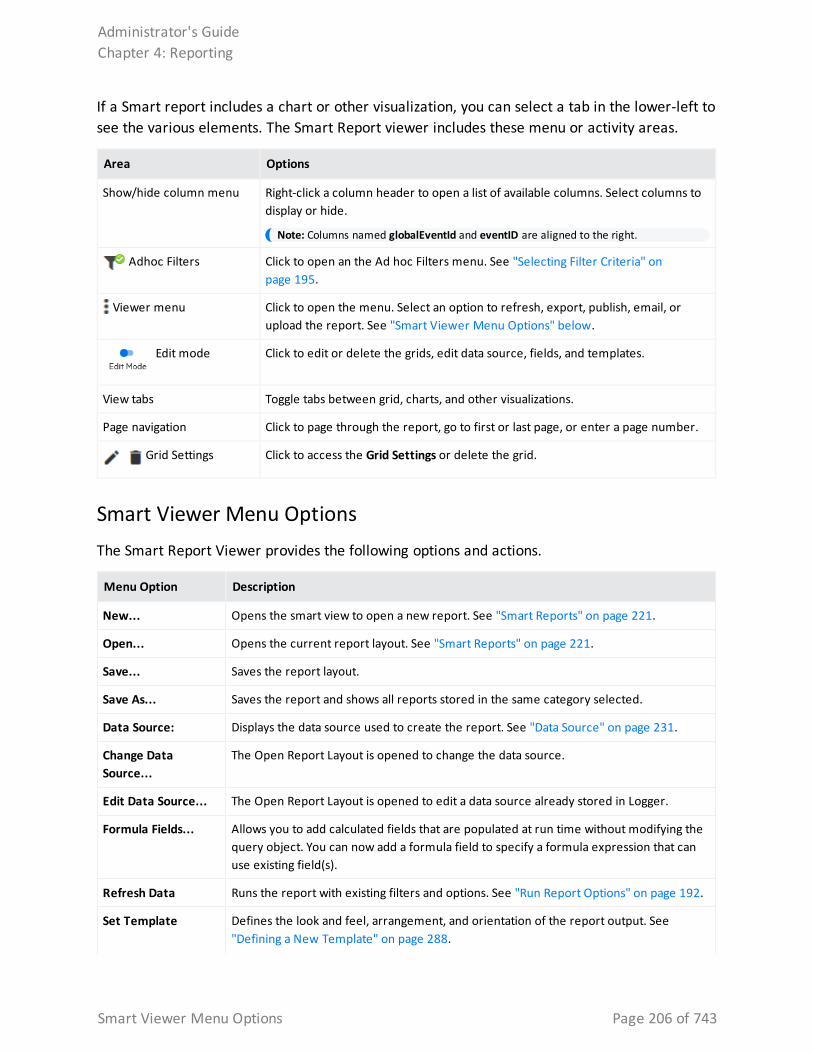
If a Smart report includes a chart or other visualization, you can select a tab in the lower-left to see the various elements. The Smart Report viewer includes these menu or activity areas.
Area Options
Show/hide column menu Right-click a column header to open a list of available columns. Select columns to display or hide.
Note: Columns named globalEventId and eventID are aligned to the right.
Adhoc Filters Click to open an the Ad hoc Filters menu. See "Selecting Filter Criteria" on page 195.
Viewer menu Click to open the menu. Select an option to refresh, export, publish, email, or upload the report. See "Smart Viewer Menu Options" below.
Edit mode Click to edit or delete the grids, edit data source, fields, and templates.
View tabs Toggle tabs between grid, charts, and other visualizations.
Page navigation Click to page through the report, go to first or last page, or enter a page number.
Grid Settings Click to access the Grid Settings or delete the grid.
Smart Viewer Menu OptionsThe Smart Report Viewer provides the following options and actions.
Menu Option Description
New... Opens the smart view to open a new report. See "Smart Reports" on page 221.
Open... Opens the current report layout. See "Smart Reports" on page 221.
Save... Saves the report layout.
Save As... Saves the report and shows all reports stored in the same category selected.
Data Source: Displays the data source used to create the report. See "Data Source" on page 231.
Change Data Source...
The Open Report Layout is opened to change the data source.
Edit Data Source... The Open Report Layout is opened to edit a data source already stored in Logger.
Formula Fields... Allows you to add calculated fields that are populated at run time without modifying the query object. You can now add a formula field to specify a formula expression that can use existing field(s).
Refresh Data Runs the report with existing filters and options. See "Run Report Options" on page 192.
Set Template Defines the look and feel, arrangement, and orientation of the report output. See "Defining a New Template" on page 288.
Administrator's GuideChapter 4: Reporting
Smart Viewer Menu Options Page 206 of 743
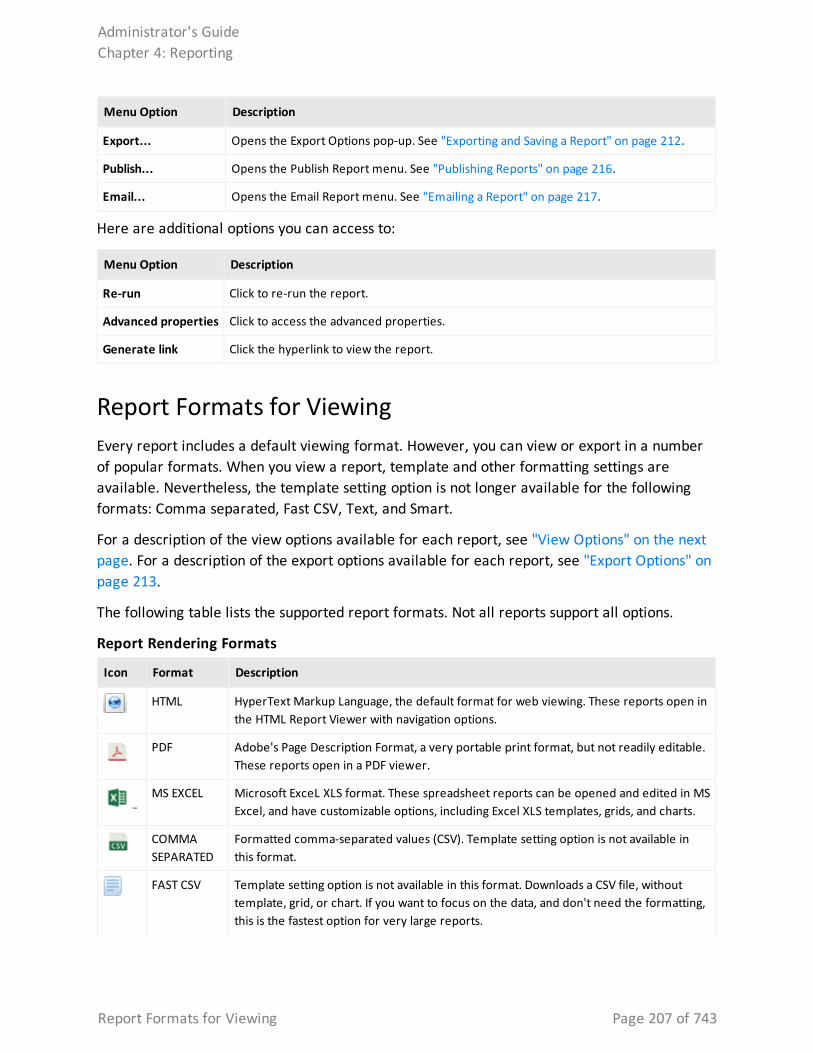
Menu Option Description
Export... Opens the Export Options pop-up. See "Exporting and Saving a Report" on page 212.
Publish... Opens the Publish Report menu. See "Publishing Reports" on page 216.
Email... Opens the Email Report menu. See "Emailing a Report" on page 217.
Here are additional options you can access to:
Menu Option Description
Re-run Click to re-run the report.
Advanced properties Click to access the advanced properties.
Generate link Click the hyperlink to view the report.
Report Formats for Viewing Every report includes a default viewing format. However, you can view or export in a number of popular formats. When you view a report, template and other formatting settings are available. Nevertheless, the template setting option is not longer available for the following formats: Comma separated, Fast CSV, Text, and Smart.
For a description of the view options available for each report, see "View Options" on the next page. For a description of the export options available for each report, see "Export Options" on page 213.
The following table lists the supported report formats. Not all reports support all options.
Icon Format Description
HTML HyperText Markup Language, the default format for web viewing. These reports open in the HTML Report Viewer with navigation options.
PDF Adobe's Page Description Format, a very portable print format, but not readily editable. These reports open in a PDF viewer.
MS EXCEL Microsoft ExceL XLS format. These spreadsheet reports can be opened and edited in MS Excel, and have customizable options, including Excel XLS templates, grids, and charts.
COMMA SEPARATED
Formatted comma-separated values (CSV). Template setting option is not available in this format.
FAST CSV Template setting option is not available in this format. Downloads a CSV file, without template, grid, or chart. If you want to focus on the data, and don't need the formatting, this is the fastest option for very large reports.
Report Rendering Formats
Administrator's GuideChapter 4: Reporting
Report Formats for Viewing Page 207 of 743
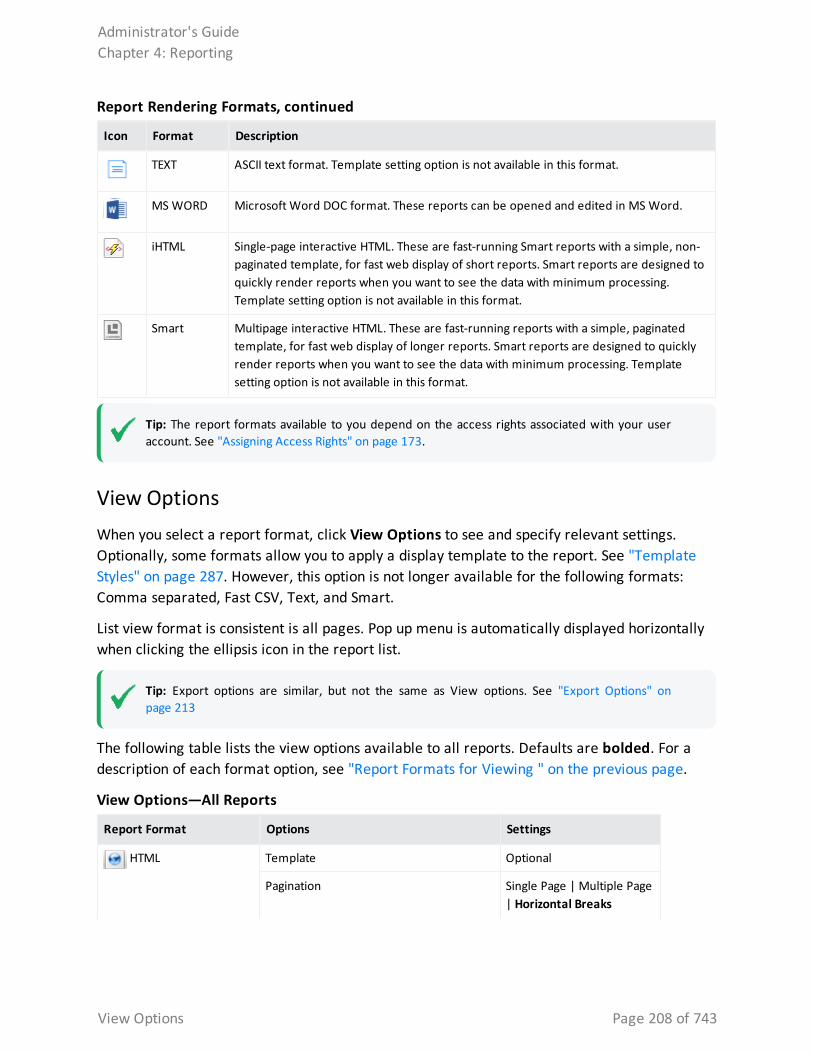
Icon Format Description
TEXT ASCII text format. Template setting option is not available in this format.
MS WORD Microsoft Word DOC format. These reports can be opened and edited in MS Word.
iHTML Single-page interactive HTML. These are fast-running Smart reports with a simple, non-paginated template, for fast web display of short reports. Smart reports are designed to quickly render reports when you want to see the data with minimum processing. Template setting option is not available in this format.
Smart Multipage interactive HTML. These are fast-running reports with a simple, paginated template, for fast web display of longer reports. Smart reports are designed to quickly render reports when you want to see the data with minimum processing. Template setting option is not available in this format.
Report Rendering Formats, continued
Tip: The report formats available to you depend on the access rights associated with your user account. See "Assigning Access Rights" on page 173.
View OptionsWhen you select a report format, click View Options to see and specify relevant settings. Optionally, some formats allow you to apply a display template to the report. See "Template Styles" on page 287. However, this option is not longer available for the following formats: Comma separated, Fast CSV, Text, and Smart.
List view format is consistent is all pages. Pop up menu is automatically displayed horizontally when clicking the ellipsis icon in the report list.
Tip: Export options are similar, but not the same as View options. See "Export Options" on page 213
The following table lists the view options available to all reports. Defaults are bolded. For a description of each format option, see "Report Formats for Viewing " on the previous page.
Report Format Options Settings
HTML Template Optional
Pagination Single Page | Multiple Page | Horizontal Breaks
View Options—All Reports
Administrator's GuideChapter 4: Reporting
View Options Page 208 of 743
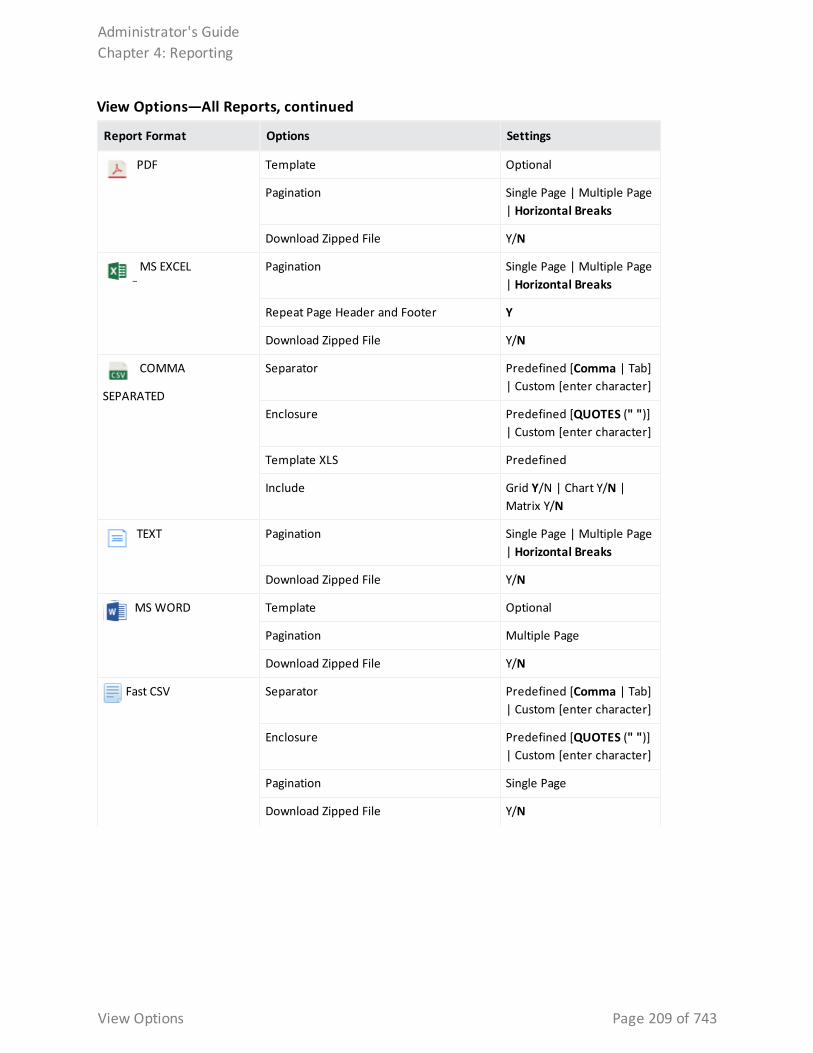
Report Format Options Settings
PDF Template Optional
Pagination Single Page | Multiple Page | Horizontal Breaks
Download Zipped File Y/N
MS EXCEL Pagination Single Page | Multiple Page | Horizontal Breaks
Repeat Page Header and Footer Y
Download Zipped File Y/N
COMMA
SEPARATED
Separator Predefined [Comma | Tab] | Custom [enter character]
Enclosure Predefined [QUOTES (" ")] | Custom [enter character]
Template XLS Predefined
Include Grid Y/N | Chart Y/N | Matrix Y/N
TEXT Pagination Single Page | Multiple Page | Horizontal Breaks
Download Zipped File Y/N
MS WORD Template Optional
Pagination Multiple Page
Download Zipped File Y/N
Fast CSV Separator Predefined [Comma | Tab] | Custom [enter character]
Enclosure Predefined [QUOTES (" ")] | Custom [enter character]
Pagination Single Page
Download Zipped File Y/N
View Options—All Reports, continued
Administrator's GuideChapter 4: Reporting
View Options Page 209 of 743
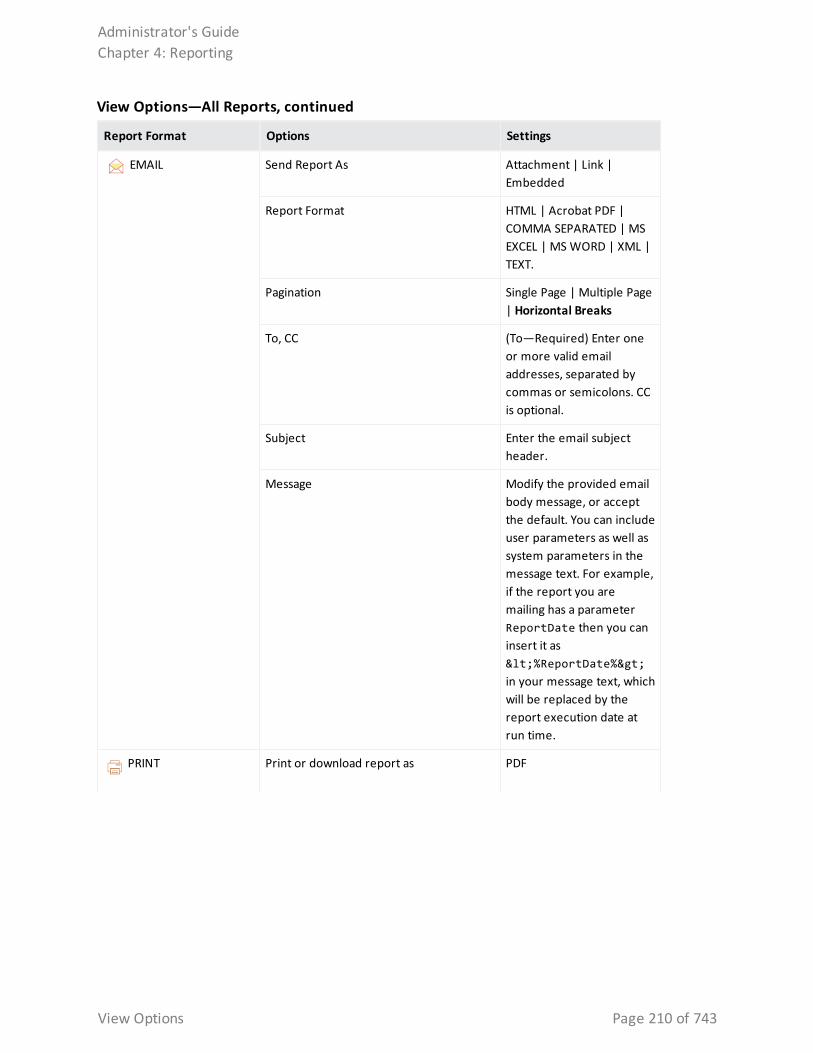
Report Format Options Settings
EMAIL Send Report As Attachment | Link | Embedded
Report Format HTML | Acrobat PDF | COMMA SEPARATED | MS EXCEL | MS WORD | XML | TEXT.
Pagination Single Page | Multiple Page | Horizontal Breaks
To, CC (To—Required) Enter one or more valid email addresses, separated by commas or semicolons. CC is optional.
Subject Enter the email subject header.
Message Modify the provided email body message, or accept the default. You can include user parameters as well as system parameters in the message text. For example, if the report you are mailing has a parameter ReportDate then you can insert it as <%ReportDate%> in your message text, which will be replaced by the report execution date at run time.
PRINT Print or download report as PDF
View Options—All Reports, continued
Administrator's GuideChapter 4: Reporting
View Options Page 210 of 743
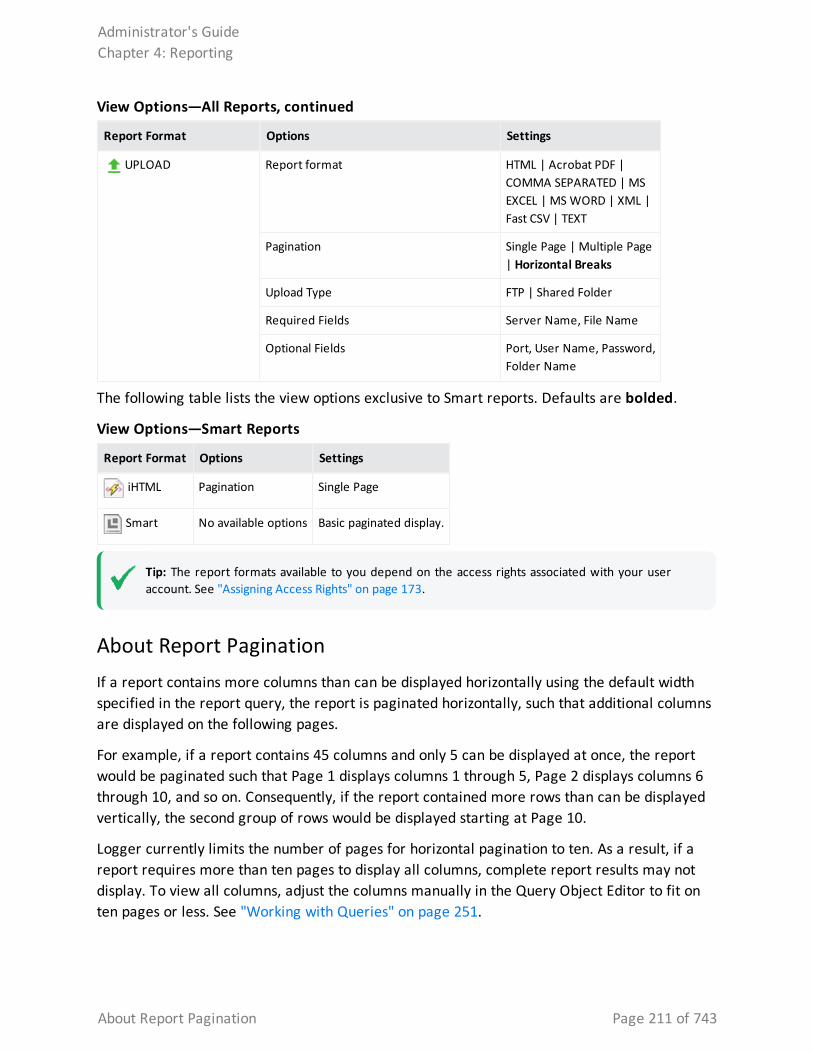
Report Format Options Settings
UPLOAD Report format HTML | Acrobat PDF | COMMA SEPARATED | MS EXCEL | MS WORD | XML | Fast CSV | TEXT
Pagination Single Page | Multiple Page | Horizontal Breaks
Upload Type FTP | Shared Folder
Required Fields Server Name, File Name
Optional Fields Port, User Name, Password, Folder Name
View Options—All Reports, continued
The following table lists the view options exclusive to Smart reports. Defaults are bolded.
Report Format Options Settings
iHTML Pagination Single Page
Smart No available options Basic paginated display.
View Options—Smart Reports
Tip: The report formats available to you depend on the access rights associated with your user account. See "Assigning Access Rights" on page 173.
About Report PaginationIf a report contains more columns than can be displayed horizontally using the default width specified in the report query, the report is paginated horizontally, such that additional columns are displayed on the following pages.
For example, if a report contains 45 columns and only 5 can be displayed at once, the report would be paginated such that Page 1 displays columns 1 through 5, Page 2 displays columns 6 through 10, and so on. Consequently, if the report contained more rows than can be displayed vertically, the second group of rows would be displayed starting at Page 10.
Logger currently limits the number of pages for horizontal pagination to ten. As a result, if a report requires more than ten pages to display all columns, complete report results may not display. To view all columns, adjust the columns manually in the Query Object Editor to fit on ten pages or less. See "Working with Queries" on page 251.
Administrator's GuideChapter 4: Reporting
About Report Pagination Page 211 of 743
Single-page reports are displayed within a scrolling window, as shown in the following example.
Tip: Use this option for short reports. For long reports, the full results may not be visible, or may be missing. Use the multiple page option for these reports.
Exporting and Uploading ReportsOnce you generate a report, you can export it for use in other formats, or upload it to an FTP site or shared folder.
Exporting and Saving a ReportYou can export a report to a file format of your choice and save it.
To export and save a report:
1. While viewing a report, do one of the following actions:
l From the Smart report viewer, click the in the upper right to open the Viewer menu and click Export.
l From the Ad hoc report viewer, click the Export icon to open the Export dialog.
2. In the Export Options dialog, specify the Export Format and associated settings you want. See "Export Options" on the next page.
Depending on the export format you choose, other settings are displayed as appropriate.
Tip: When rendering super-sized reports, Logger does not recommend to select PDF or MS Word as these are limited formats. Instead, select MS Excel, CSV, Fast CSV, or Text.
3. Click Export.
You can save the generated report as a file locally or elsewhere just as you would any other file.
Administrator's GuideChapter 4: Reporting
Exporting and Uploading Reports Page 212 of 743
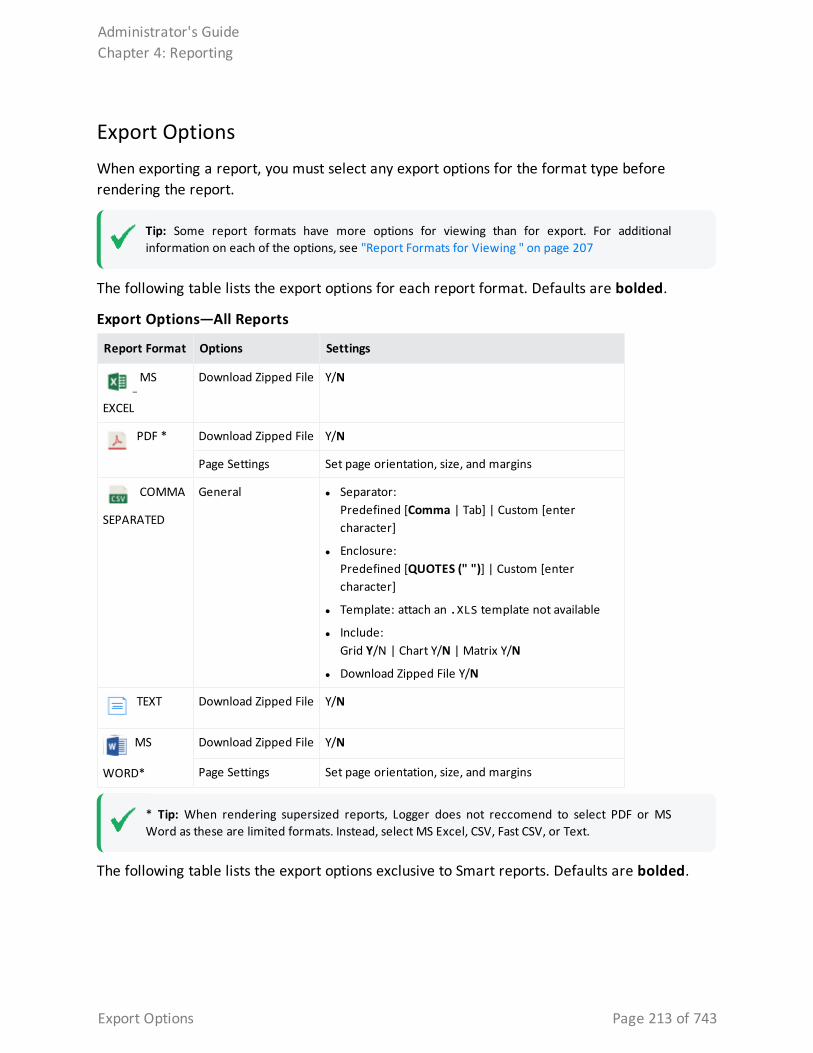
Export OptionsWhen exporting a report, you must select any export options for the format type before rendering the report.
Tip: Some report formats have more options for viewing than for export. For additional information on each of the options, see "Report Formats for Viewing " on page 207
The following table lists the export options for each report format. Defaults are bolded.
Report Format Options Settings
MS
EXCEL
Download Zipped File Y/N
PDF * Download Zipped File Y/N
Page Settings Set page orientation, size, and margins
COMMA
SEPARATED
General l Separator:Predefined [Comma | Tab] | Custom [enter character]
l Enclosure:Predefined [QUOTES (" ")] | Custom [enter character]
l Template: attach an .XLS template not available
l Include:Grid Y/N | Chart Y/N | Matrix Y/N
l Download Zipped File Y/N
TEXT Download Zipped File Y/N
MS
WORD*
Download Zipped File Y/N
Page Settings Set page orientation, size, and margins
Export Options—All Reports
* Tip: When rendering supersized reports, Logger does not reccomend to select PDF or MS Word as these are limited formats. Instead, select MS Excel, CSV, Fast CSV, or Text.
The following table lists the export options exclusive to Smart reports. Defaults are bolded.
Administrator's GuideChapter 4: Reporting
Export Options Page 213 of 743
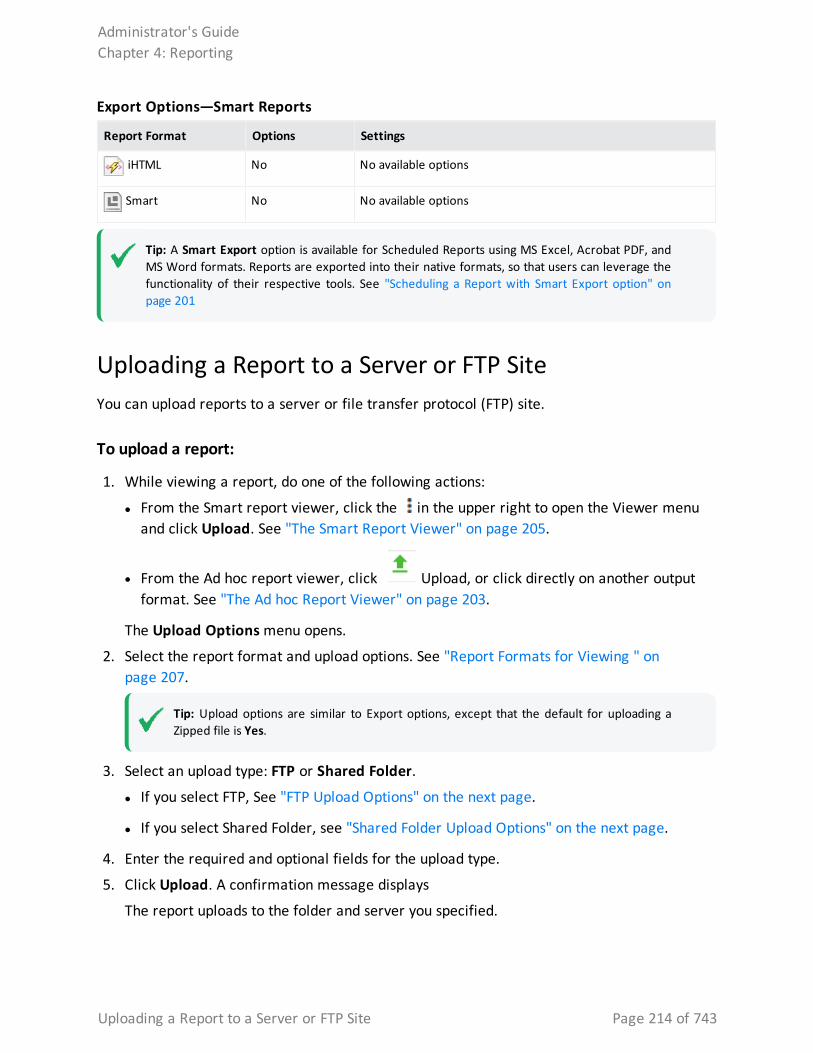
Report Format Options Settings
iHTML No No available options
Smart No No available options
Export Options—Smart Reports
Tip: A Smart Export option is available for Scheduled Reports using MS Excel, Acrobat PDF, and MS Word formats. Reports are exported into their native formats, so that users can leverage the functionality of their respective tools. See "Scheduling a Report with Smart Export option" on page 201
Uploading a Report to a Server or FTP SiteYou can upload reports to a server or file transfer protocol (FTP) site.
To upload a report:
1. While viewing a report, do one of the following actions:
l From the Smart report viewer, click the in the upper right to open the Viewer menu and click Upload. See "The Smart Report Viewer" on page 205.
l From the Ad hoc report viewer, click Upload, or click directly on another output format. See "The Ad hoc Report Viewer" on page 203.
The Upload Options menu opens.
2. Select the report format and upload options. See "Report Formats for Viewing " on page 207.
Tip: Upload options are similar to Export options, except that the default for uploading a Zipped file is Yes.
3. Select an upload type: FTP or Shared Folder.
l If you select FTP, See "FTP Upload Options" on the next page.
l If you select Shared Folder, see "Shared Folder Upload Options" on the next page.
4. Enter the required and optional fields for the upload type.
5. Click Upload. A confirmation message displays
The report uploads to the folder and server you specified.
Administrator's GuideChapter 4: Reporting
Uploading a Report to a Server or FTP Site Page 214 of 743
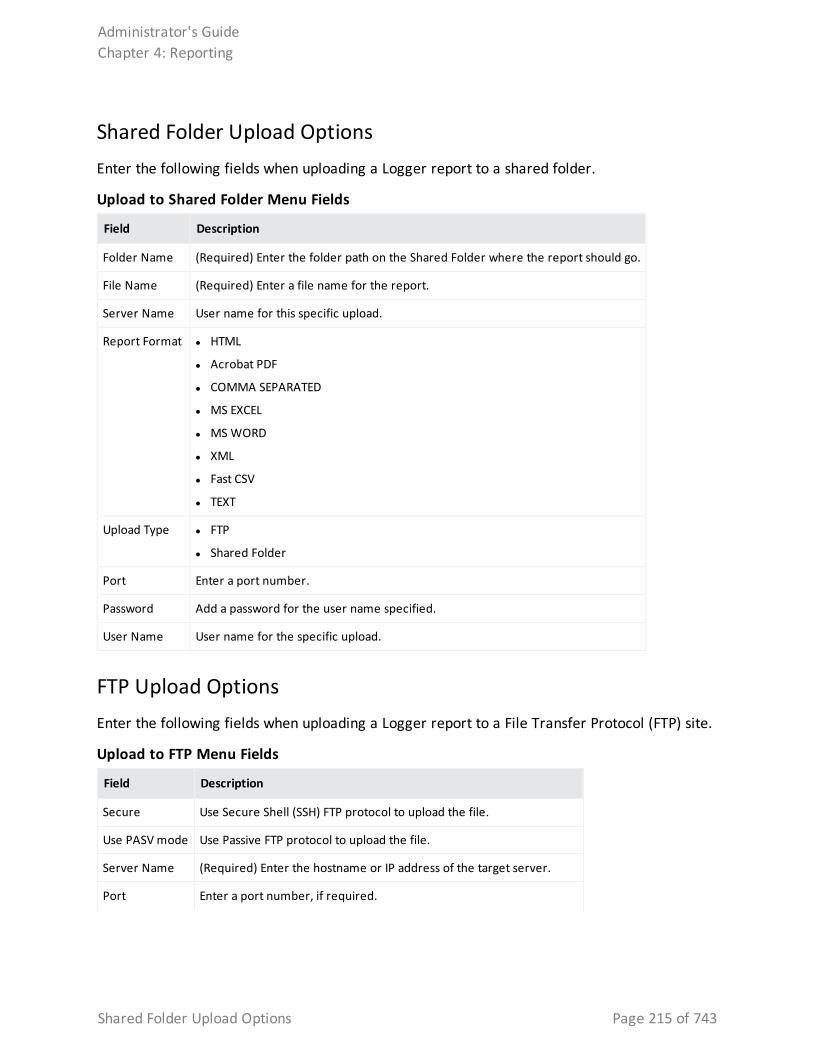
Shared Folder Upload OptionsEnter the following fields when uploading a Logger report to a shared folder.
Field Description
Folder Name (Required) Enter the folder path on the Shared Folder where the report should go.
File Name (Required) Enter a file name for the report.
Server Name User name for this specific upload.
Report Format l HTML
l Acrobat PDF
l COMMA SEPARATED
l MS EXCEL
l MS WORD
l XML
l Fast CSV
l TEXT
Upload Type l FTP
l Shared Folder
Port Enter a port number.
Password Add a password for the user name specified.
User Name User name for the specific upload.
Upload to Shared Folder Menu Fields
FTP Upload OptionsEnter the following fields when uploading a Logger report to a File Transfer Protocol (FTP) site.
Field Description
Secure Use Secure Shell (SSH) FTP protocol to upload the file.
Use PASV mode Use Passive FTP protocol to upload the file.
Server Name (Required) Enter the hostname or IP address of the target server.
Port Enter a port number, if required.
Upload to FTP Menu Fields
Administrator's GuideChapter 4: Reporting
Shared Folder Upload Options Page 215 of 743
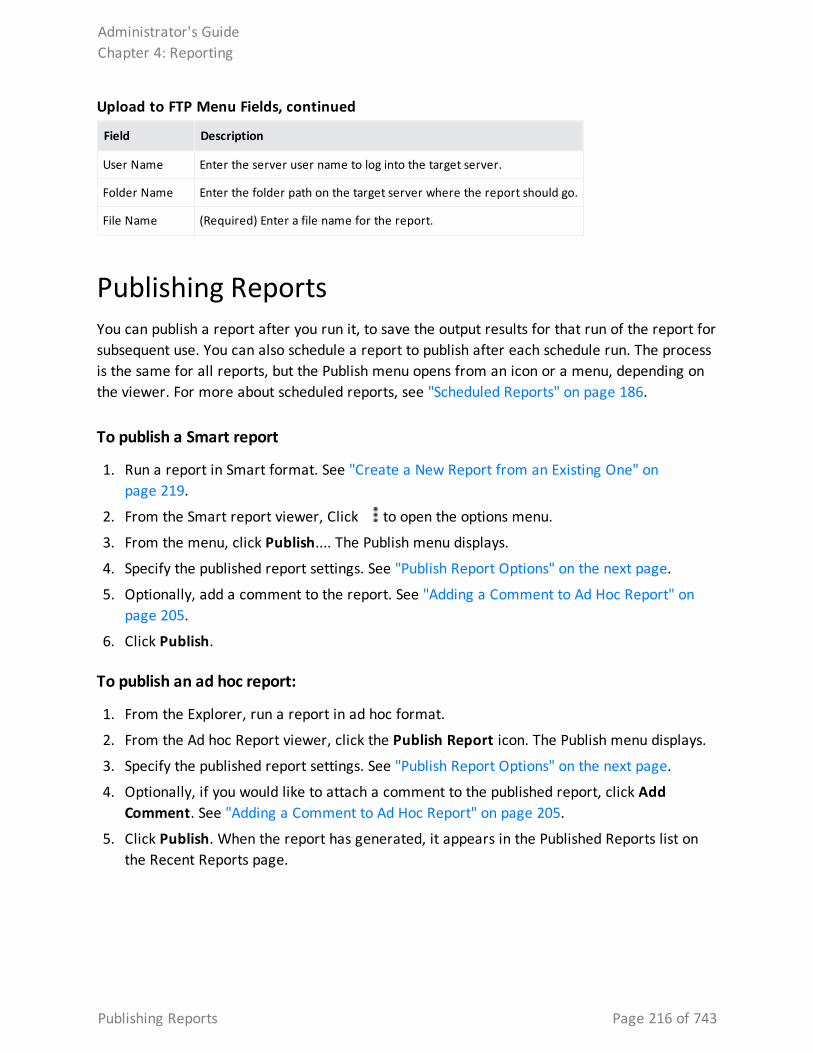
Field Description
User Name Enter the server user name to log into the target server.
Folder Name Enter the folder path on the target server where the report should go.
File Name (Required) Enter a file name for the report.
Upload to FTP Menu Fields, continued
Publishing ReportsYou can publish a report after you run it, to save the output results for that run of the report for subsequent use. You can also schedule a report to publish after each schedule run. The process is the same for all reports, but the Publish menu opens from an icon or a menu, depending on the viewer. For more about scheduled reports, see "Scheduled Reports" on page 186.
To publish a Smart report
1. Run a report in Smart format. See "Create a New Report from an Existing One" on page 219.
2. From the Smart report viewer, Click to open the options menu.
3. From the menu, click Publish.... The Publish menu displays.
4. Specify the published report settings. See "Publish Report Options" on the next page.
5. Optionally, add a comment to the report. See "Adding a Comment to Ad Hoc Report" on page 205.
6. Click Publish.
To publish an ad hoc report:
1. From the Explorer, run a report in ad hoc format.
2. From the Ad hoc Report viewer, click the Publish Report icon. The Publish menu displays.
3. Specify the published report settings. See "Publish Report Options" on the next page.
4. Optionally, if you would like to attach a comment to the published report, click Add Comment. See "Adding a Comment to Ad Hoc Report" on page 205.
5. Click Publish. When the report has generated, it appears in the Published Reports list on the Recent Reports page.
Administrator's GuideChapter 4: Reporting
Publishing Reports Page 216 of 743
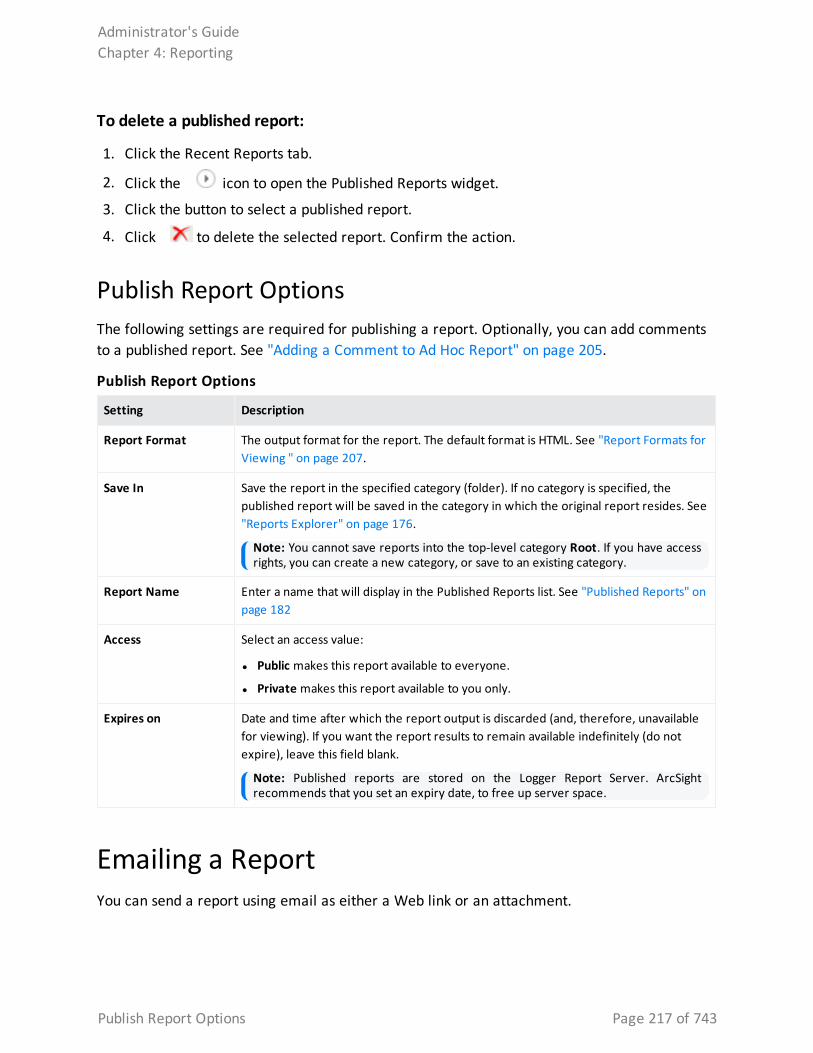
To delete a published report:
1. Click the Recent Reports tab.
2. Click the icon to open the Published Reports widget.
3. Click the button to select a published report.
4. Click to delete the selected report. Confirm the action.
Publish Report OptionsThe following settings are required for publishing a report. Optionally, you can add comments to a published report. See "Adding a Comment to Ad Hoc Report" on page 205.
Setting Description
Report Format The output format for the report. The default format is HTML. See "Report Formats for Viewing " on page 207.
Save In Save the report in the specified category (folder). If no category is specified, the published report will be saved in the category in which the original report resides. See "Reports Explorer" on page 176.
Note: You cannot save reports into the top-level category Root. If you have access rights, you can create a new category, or save to an existing category.
Report Name Enter a name that will display in the Published Reports list. See "Published Reports" on page 182
Access Select an access value:
l Public makes this report available to everyone.
l Private makes this report available to you only.
Expires on Date and time after which the report output is discarded (and, therefore, unavailable for viewing). If you want the report results to remain available indefinitely (do not expire), leave this field blank.
Note: Published reports are stored on the Logger Report Server. ArcSight recommends that you set an expiry date, to free up server space.
Publish Report Options
Emailing a ReportYou can send a report using email as either a Web link or an attachment.
Administrator's GuideChapter 4: Reporting
Publish Report Options Page 217 of 743
Prerequisite
Before you can email a report, you must first set up SMTP for reports. Navigate to System Admin> SMTP and configure the SMTP settings.
To email a report:
1. From the Ad hoc report viewer, click the Email Report icon ( ) from the menu bar.
2. Specify the email delivery settings. See "Email Delivery Settings" below.
3. Click Email to send the report.
Email Delivery SettingsEnter the following settings when setting up a generated email for a scheduled or other report. You may also need to specify other settings, including format, delivery options, and parameters.
Setting Description
Send Report As Choose one of these:
l Link—Generates a link to the report in the body of the email.
l Attachment—Sends the report as an attachment to the email.
l Embedded—Sends the report in the body of the email.
Note: The formats allowed are HTML and Text.
File Name Enter a file name for the report.
Suffix Timestamp Format
(Optional) Check if you want a timestamp appended to the file name. Select the timestamp format from the drop-down menu.
To, Cc, Bcc To—(Required) Enter one or more valid email addresses, separated by commas or semicolons. Cc and Bcc are optional.
Subject Enter the email subject header.
Message Modify the provided email body message, or accept the default.
Include place holder: <%SAVED_REPORT_LINK%>. Otherwise, message will be sent empty.
You can include user parameters as well as system parameters in the message text. For example, if the report you are mailing has a parameter ReportDate, then you can insert it as <%ReportDate%> in your message text, which will be replaced by the report execution date at run time.
Email Delivery Settings
Administrator's GuideChapter 4: Reporting
Email Delivery Settings Page 218 of 743
Designing Custom ReportsYou can create new or customized reports using report objects such as custom queries, templates, and search parameters. This section explains how to use the report design tools to bring these objects together as a new report.
For information about building the report objects themselves, see "Designing Queries, Parameters, and Templates" on page 249.
Create a New Report from an Existing OneSince Logger ships with a variety of useful, pre-built reports for common security scenarios, you can use these not only to run as-is but also as templates for building new reports. A good way to get familiar with the process is to start with an existing report that has some of the features you want, save the original report under a new name, and then modify it.
Caution: Modifications to reports and other ArcSight - defined content may be overwritten without warning when the content is upgraded. Do not modify ArcSight-defined content directly.
Make modifications to a copy of any ArcSight - defined content as a general practice, and subsequent upgrades will not affect the modifications.
To create a new report based on an existing Logger report:
1. In the Explorer, browse to the report you want to use as a starting point.
2. Select and click Customize Report from the context menu.
Note: Some reports, such as Logger default reports or other custom reports, might not be editable. If the Customize Report link is disabled, save a copy of the report and customize that one.
l Smart reports run and display in the Smart designer. See "The Smart Report Designer" on the next page.
l Ad hoc reports open directly in the Ad hoc Report Designer. See "Classic: The Ad hoc Report Designer" on page 226.
3. Modify the report according to your needs. See "Customizing Report Elements" on page 230.
4. Save your new report.
Administrator's GuideChapter 4: Reporting
Designing Custom Reports Page 219 of 743
l From Smart Designer: In the bottom-right corner, click the next to Save to open the menu. Click Save As.
l From Ad hoc Report Designer: Click Save As from the top right menu.
This displays the Save Report Layout As dialog for the selected report (and shows all reports stored in the same category as the one you selected).
5. In Report Name, enter a name for your report.
6. Click Options (next to the Cancel button), and enter values for the following fields:
Option Description
ID Enter a custom ID for the report, if desired. Alternatively, Select System Generated to automatically generate one (selected by default).
Public/Private Select one. If public, everyone will have access to this report; if private, only you.
Copy Access Rights
When checked (the default) the report will inherit the access rights of the source report.
Description Optionally, enter a description for the report.
7. Click Save.
8. Click OK to confirm the save. Your new report is now available in the selected category folder.
The Smart Report DesignerSmart View is a web-based, interactive interface designed to visualize and analyze large amounts of data. Use the Smart report designer to make your Smart reports retrieve, display, and look exactly the way you want them to.
To open Smart Report Designer from Design:
From Reports > Design, click New Report. The Smart View page opens in a new Report tab.
l If you double-click a report from the Select Query Object list, Logger runs the report, and opens it for editing in the Smart designer. From there, you can save and modify the report. To have the latest report version, right click and select the refresh option on each category. Additionally, the below menu will be displayed whenever you right click a query object. For information about modifying report results, such as adding logos, charts, and changing the display options, see Smart Reports.
l If you click Open Existing Report... in the lower-right corner, you can select a copy of a report you have previously saved. Logger will run the report and display it in the Smart designer. From there, you can save and modify the report.
Administrator's GuideChapter 4: Reporting
The Smart Report Designer Page 220 of 743
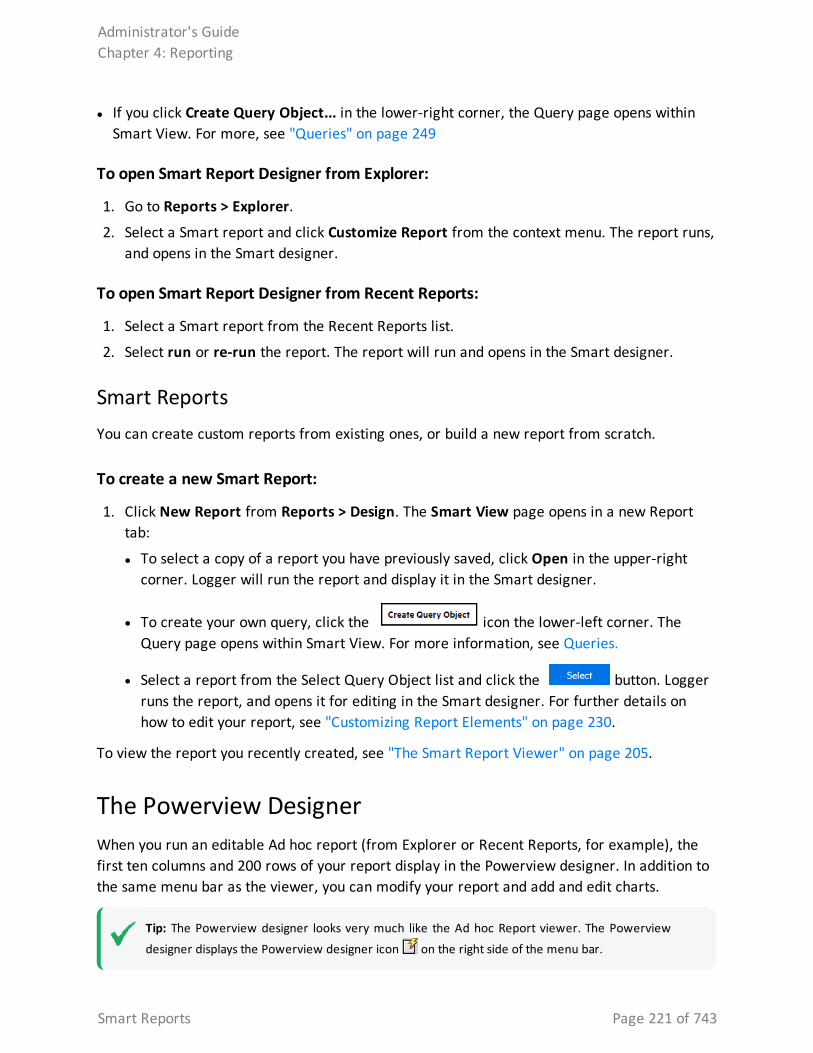
l If you click Create Query Object... in the lower-right corner, the Query page opens within Smart View. For more, see "Queries" on page 249
To open Smart Report Designer from Explorer:
1. Go to Reports > Explorer.
2. Select a Smart report and click Customize Report from the context menu. The report runs, and opens in the Smart designer.
To open Smart Report Designer from Recent Reports:
1. Select a Smart report from the Recent Reports list.
2. Select run or re-run the report. The report will run and opens in the Smart designer.
Smart ReportsYou can create custom reports from existing ones, or build a new report from scratch.
To create a new Smart Report:
1. Click New Report from Reports > Design. The Smart View page opens in a new Report tab:
l To select a copy of a report you have previously saved, click Open in the upper-right corner. Logger will run the report and display it in the Smart designer.
l To create your own query, click the icon the lower-left corner. The Query page opens within Smart View. For more information, see Queries.
l Select a report from the Select Query Object list and click the button. Logger runs the report, and opens it for editing in the Smart designer. For further details on how to edit your report, see "Customizing Report Elements" on page 230.
To view the report you recently created, see "The Smart Report Viewer" on page 205.
The Powerview DesignerWhen you run an editable Ad hoc report (from Explorer or Recent Reports, for example), the first ten columns and 200 rows of your report display in the Powerview designer. In addition to the same menu bar as the viewer, you can modify your report and add and edit charts.
Tip: The Powerview designer looks very much like the Ad hoc Report viewer. The Powerview
designer displays the Powerview designer icon on the right side of the menu bar.
Administrator's GuideChapter 4: Reporting
Smart Reports Page 221 of 743
In the Powerview designer, your home page includes your sample report data and any chart or matrix, with report format, configuration, and display options available through context menus. In contrast, the Ad hoc Report Designer uses the Data Source menu tab as its home page, and you must click the Preview or Run button to see the report as it will display. You can choose which designer you prefer. See "Classic: The Ad hoc Report Designer" on page 226.
Tip: Right-click within the report headers or report body to open the Powerview designer context menus. Hover above the chart to see the chart menu.
When a report with a chart opens in Powerview designer, the chart opens above the data grid. You won't see the chart menu until you move your mouse near the top of the chart. For a description of these menus, see "The Powerview Chart Menu" on page 224.
The Powerview designer includes these menu activity areas:
Area Options See
Menu bar Click an icon to publish, export, or page through the report, or add and view comments. Only the designer displays the Powerview icon on the far right.
"Ad hoc Viewer Menu Options" on page 203.
Heading context menu
Right-click a column header to open an option menu of available data editing tools.
"The Powerview Heading Context Menu" below.
Data context menu
Right-click within the data to open an option menu of report options such as Add Chart and Save Layout As.
"The Powerview Data Context Menu" on the next page.
Chart context menu
When a chart is present, hover towards the top of the chart to display the chart context menu. The menu remains hidden until it is moused-over.
"The Powerview Chart Menu" on page 224.
The Powerview Heading Context MenuWhen you right-click within the report headers, a context menu displays. The header menu deals mostly with modifying the report results display by column. In contrast, the data context menu deals more with global report options. See "The Powerview Data Context Menu" on the next page.
To change an option from the heading context menu:
1. Right-click over the data column you want to group by and select from the menu.
2. You will see the action ready for confirmation in the Action Board. To apply this change immediately, click Apply in the Actionboard, or wait until you have made all the changes you want to make.
Administrator's GuideChapter 4: Reporting
The Powerview Heading Context Menu Page 222 of 743
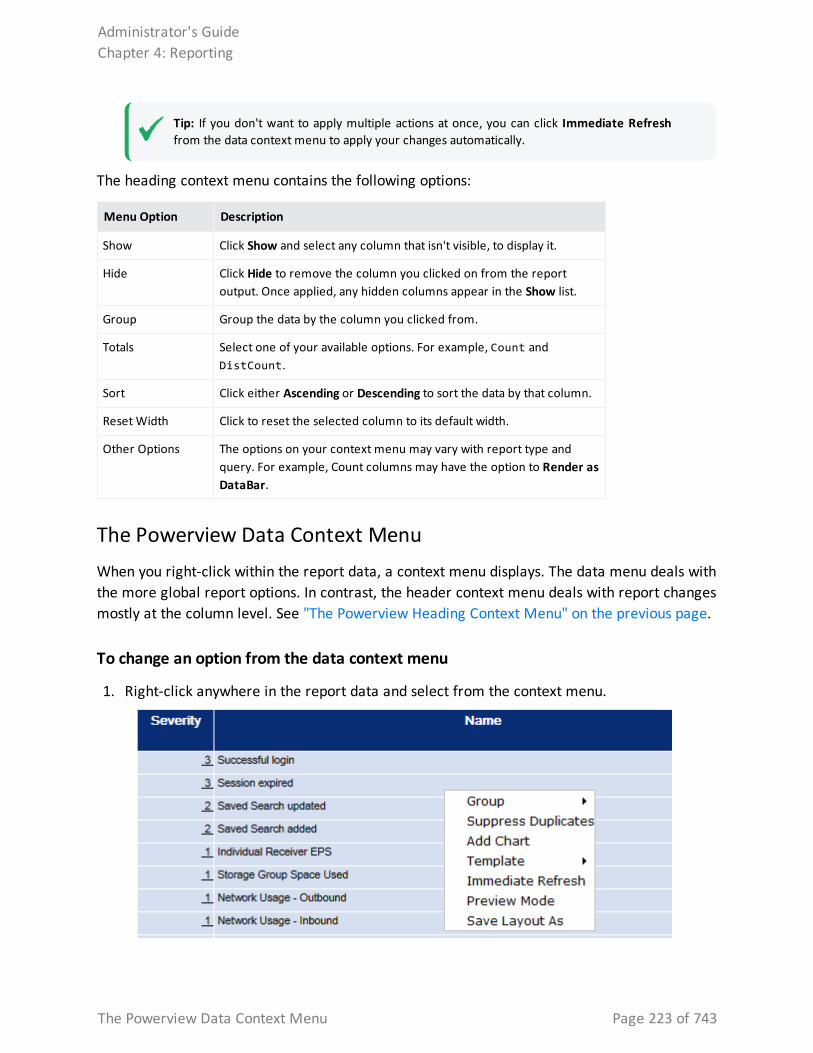
Tip: If you don't want to apply multiple actions at once, you can click Immediate Refresh from the data context menu to apply your changes automatically.
The heading context menu contains the following options:
Menu Option Description
Show Click Show and select any column that isn't visible, to display it.
Hide Click Hide to remove the column you clicked on from the report output. Once applied, any hidden columns appear in the Show list.
Group Group the data by the column you clicked from.
Totals Select one of your available options. For example, Count and DistCount.
Sort Click either Ascending or Descending to sort the data by that column.
Reset Width Click to reset the selected column to its default width.
Other Options The options on your context menu may vary with report type and query. For example, Count columns may have the option to Render as DataBar.
The Powerview Data Context MenuWhen you right-click within the report data, a context menu displays. The data menu deals with the more global report options. In contrast, the header context menu deals with report changes mostly at the column level. See "The Powerview Heading Context Menu" on the previous page.
To change an option from the data context menu
1. Right-click anywhere in the report data and select from the context menu.
Administrator's GuideChapter 4: Reporting
The Powerview Data Context Menu Page 223 of 743
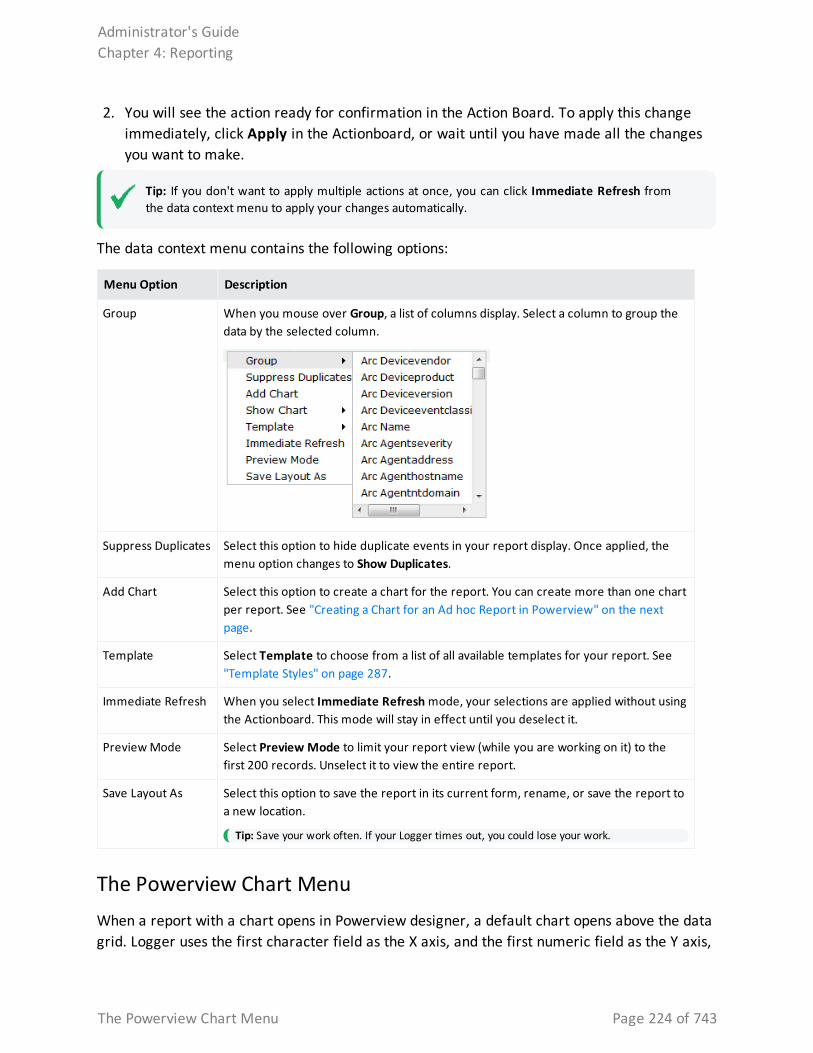
2. You will see the action ready for confirmation in the Action Board. To apply this change immediately, click Apply in the Actionboard, or wait until you have made all the changes you want to make.
Tip: If you don't want to apply multiple actions at once, you can click Immediate Refresh from the data context menu to apply your changes automatically.
The data context menu contains the following options:
Menu Option Description
Group When you mouse over Group, a list of columns display. Select a column to group the data by the selected column.
Suppress Duplicates Select this option to hide duplicate events in your report display. Once applied, the menu option changes to Show Duplicates.
Add Chart Select this option to create a chart for the report. You can create more than one chart per report. See "Creating a Chart for an Ad hoc Report in Powerview" on the next page.
Template Select Template to choose from a list of all available templates for your report. See "Template Styles" on page 287.
Immediate Refresh When you select Immediate Refresh mode, your selections are applied without using the Actionboard. This mode will stay in effect until you deselect it.
Preview Mode Select Preview Mode to limit your report view (while you are working on it) to the first 200 records. Unselect it to view the entire report.
Save Layout As Select this option to save the report in its current form, rename, or save the report to a new location.
Tip: Save your work often. If your Logger times out, you could lose your work.
The Powerview Chart MenuWhen a report with a chart opens in Powerview designer, a default chart opens above the data grid. Logger uses the first character field as the X axis, and the first numeric field as the Y axis,
Administrator's GuideChapter 4: Reporting
The Powerview Chart Menu Page 224 of 743
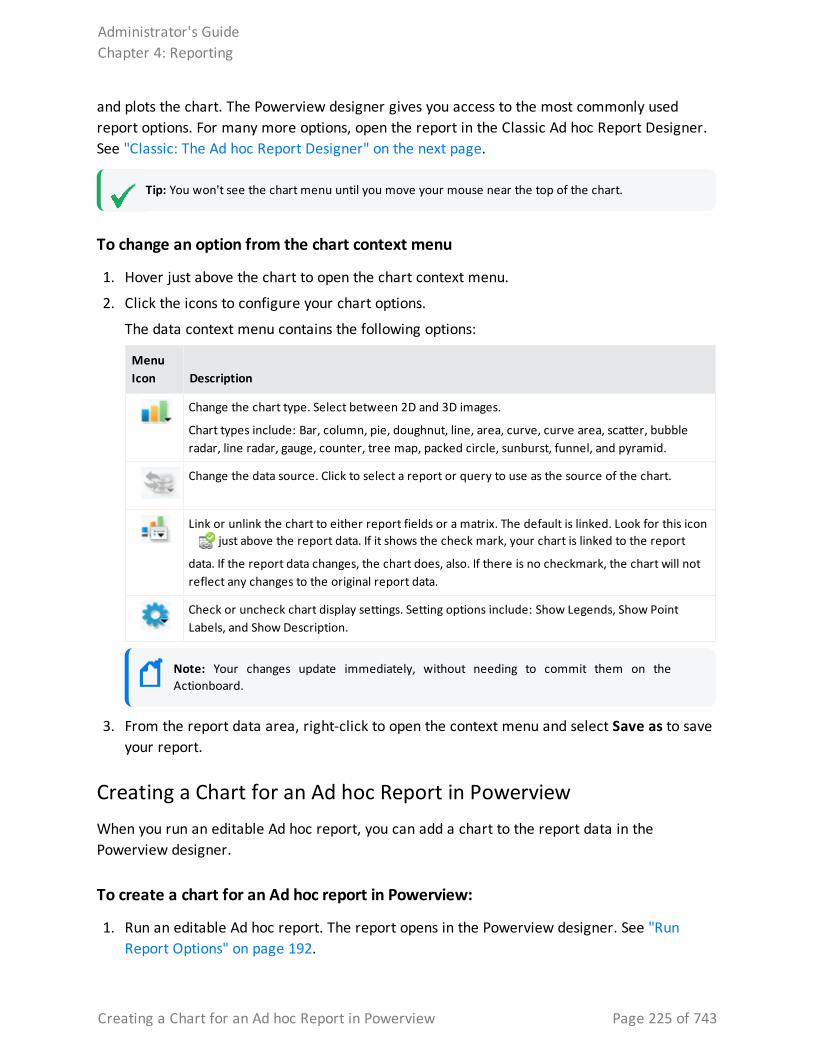
and plots the chart. The Powerview designer gives you access to the most commonly used report options. For many more options, open the report in the Classic Ad hoc Report Designer. See "Classic: The Ad hoc Report Designer" on the next page.
Tip: You won't see the chart menu until you move your mouse near the top of the chart.
To change an option from the chart context menu
1. Hover just above the chart to open the chart context menu.
2. Click the icons to configure your chart options.
The data context menu contains the following options:
Menu Icon Description
Change the chart type. Select between 2D and 3D images.
Chart types include: Bar, column, pie, doughnut, line, area, curve, curve area, scatter, bubble radar, line radar, gauge, counter, tree map, packed circle, sunburst, funnel, and pyramid.
Change the data source. Click to select a report or query to use as the source of the chart.
Link or unlink the chart to either report fields or a matrix. The default is linked. Look for this icon just above the report data. If it shows the check mark, your chart is linked to the report
data. If the report data changes, the chart does, also. If there is no checkmark, the chart will not reflect any changes to the original report data.
Check or uncheck chart display settings. Setting options include: Show Legends, Show Point Labels, and Show Description.
Note: Your changes update immediately, without needing to commit them on the Actionboard.
3. From the report data area, right-click to open the context menu and select Save as to save your report.
Creating a Chart for an Ad hoc Report in PowerviewWhen you run an editable Ad hoc report, you can add a chart to the report data in the Powerview designer.
To create a chart for an Ad hoc report in Powerview:
1. Run an editable Ad hoc report. The report opens in the Powerview designer. See "Run Report Options" on page 192.
Administrator's GuideChapter 4: Reporting
Creating a Chart for an Ad hoc Report in Powerview Page 225 of 743
2. Right-click within the report data (not the headers) to open the Powerview data context menu. See "The Powerview Data Context Menu" on page 223.
3. Select Add Chart. Please wait while Logger generates a default chart for your report from the first ten columns and 200 rows of your report display.
4. Hover above the chart to display the chart menu. Make any adjustments to the chart from the available menu options. See "The Powerview Chart Menu" on page 224.
5. Select Save Layout As from the Powerview data context menu to save the report.
This displays the Save Report Layout As dialog for the selected report (and shows all reports stored in the same category as the one you selected).
6. In Report Name, enter a name for your report.
7. Click Options (next to the Cancel button), and enter values for the following fields:
Option Description
ID Enter a custom ID for the report, if desired. Alternatively, Select System Generated to automatically generate one (selected by default).
Public/Private Select one. If public, everyone will have access to this report; if private, only you.
Copy Access Rights
When checked (the default) the report will inherit the access rights of the source report.
Description Optionally, enter a description for the report.
8. Click Save.
9. Click OK to confirm the save. Your new report is now available in the selected category folder.
Classic: The Ad hoc Report DesignerWhen you click New Report from the Classic menu, or when you select Customize Report for an Ad hoc report in Explorer, you are redirected to the Ad hoc Report Designer.
In the Ad hoc Report Designer (ARD), you build your report using the Data Source menu tab as
a home page. As you make your changes between tabs, you can click the Preview button to see the report as it will display. You can use this designer to create and edit reports, if you prefer these classic tools to the Powerview designer. The tools and capabilities between the Powerview and ARD are the same; the differences lie in the user interface. See "The Powerview Designer" on page 221.
Administrator's GuideChapter 4: Reporting
Classic: The Ad hoc Report Designer Page 226 of 743
To open the Ad hoc Report Designer:
1. Select New Report from the Classic Reports menu. The Ad hoc Report Designer opens in a new tab.
Toolbar ButtonsThe toolbar includes these buttons.
l Click Run to test the current version of the report.
l Click Preview to preview the report before saving it.
l Click Open to open another report in the Report Designer.
l Click Save to save the report.
l Click Save As to save it under a different name.
Creating a New Classic Report
To create a new Classic report:
1. Under Classic, click the New Report link in the left panel. The Ad hoc Report Designer > Untitled Report page displays. See "Classic: The Ad hoc Report Designer" on the previous page.
2. From the Data Source tab, either select a query from the repository menu, or click Query Editor... to create your own. See "Queries" on page 249.
Enter basic report design information, such as title, template, and format, in the Report Settings section. See "Data Source Design Settings" on page 231.
3. Configure the report display fields from the Fields tab. See "Fields" on page 232.
4. Enter any filter criteria from the Filter tab. See "Filter" on page 233.
5. Enter any grouping criteria from the Group tab. See "Group" on page 235.
6. Enter any column totals criteria from the Total tab. See "Totals" on page 236.
7. Enter any sorting criteria from the Sort tab. See "Sort" on page 237.
8. Enter any highlight criteria from the Highlight tab. See "Highlight" on page 237.
Administrator's GuideChapter 4: Reporting
Toolbar Buttons Page 227 of 743
9. Enter any matrix criteria from the Matrix tab. See "Matrix" on page 238.
10. Enter any charting criteria from the Chart tab. See " Chart" on page 239.
11. Click Save to save the new report.
Working with Logger Report Designers
Customize an Ad hoc report in the Powerview designer:
1. From the Reports menu, click Explorer.
2. Right-click the report you want to customize and open the context menu. See"Explorer Options and Context Menus" on page 179.
3. Select either Run Report or Run in background. See "Run Report Options" on page 192.
4. Open the report in the Powerview designer. See "The Powerview Designer" on page 221.
5. To preserve the original report, right-click within the tabular results and click Save Layout As.
Customize an Ad hoc or Smart report in the Smart designer:
1. Go to Reports > Design > New Report.
2. Click Open Existing Report... in the lower right.
3. Navigate to the report you want to customize and select it.
4. Click Open. The report runs, and opens in the Smart designer. See "The Smart Report Designer" on page 220.
Tip: Saving an Ad hoc report in the Smart designer will convert it to a Smart report.
5. To preserve the original Ad hoc report, click Save As from the bottom-right menu.
Customize an Ad hoc or Studio report in the Ad hoc Report Designer:
From Classic:
1. Go to Reports > Classic > New Report.
2. Click Open from the upper right menu.
3. Navigate to the report you want to customize and select it.
4. Click Open to open the report in the Ad hoc Report Designer. See "Classic: The Ad hoc Report Designer" on page 226.
5. To preserve the original report, click Save As from the upper-right menu.
Administrator's GuideChapter 4: Reporting
Working with Logger Report Designers Page 228 of 743
From Explorer:
1. Click Explorer from the Reports menu.
2. Right-click the report you want to customize. See"Explorer Options and Context Menus" on page 179.
3. Click Customize to open the report in the Ad hoc designer. See "The Powerview Designer" on page 221.
4. To preserve the original report, click Save As from the upper-right menu.See also
l "Smart Reports" on page 221
l "The Smart Report Designer" on page 220
l "Create a New Report from an Existing One" on page 219
l "The Smart Report Viewer" on page 205
Creating an IPv6 Report
Prerequisites
Before you can create a report displaying IPv6 events, you must first create the query to capture IPv6 information. See "Creating an IPv6 Search Query for Reports" on page 252.
To create a report that incorporates an IPv6 query:
1. Navigate to Reports > Classic > New Reports.
2. Open the Fields tab. Select the fields in the Selected Fields column that you want to appear in the report. Select all of the IPv6 address fields.
3. Save the report. It will now be available through the Explorer.
Tip: If you check under the filter tab, you should see the list of fields. The filter can be configured ahead of time to run by default and they are also available at runtime.
Searching for IPv6 Addresses in Reports
You can use AdHoc filters to search fields that contain IPv6 addresses. To have these fields available in the AdHoc filters, you must build a query object that include the fields. You can then include the query in a report. To build this query, see "Creating an IPv6 Search Query for Reports" on page 252.
The following fields can contain IPv6 addresses:
Administrator's GuideChapter 4: Reporting
Creating an IPv6 Report Page 229 of 743
l deviceAddress
l agentAddress
l sourceAddress
l destinationAddress
IPv6 Address Format
If you use IPv6 addresses in your query object, the addresses must be in canonical format for the Logger to return results, for example:
SELECT from arc_deviceAddress, arc_agentAddress, arc_sourceAddress, arc_destinationAddress
FROM events
WHERE arc_destinationAddress = "3ffe:b00::1:0:0:a"
(Valid alphanumeric characters are 0-9 and a-f. Upper case characters, such as A-F, are not valid)
The query above will not return any results if you use the non-canonical format, such as 3FFE:B00:0000:0000:0001:0:0:000A .
For more information, see "Creating an IPv6 Search Query for Reports" on page 252. For information on canonical format, refer to IETF Documents.
Customizing Report ElementsNo matter which report designer you choose, the main report configuration elements are the same. To access the report configuration pages from a designer, click the tab for the configuration element you want to modify.
Report Components
A report consists of different components, which can each affect the way the data displays in the report. Click a component tab at the top of the Designer page to open the component configuration page.
Tab Description
Data Source
See "Data Source" on the next page for more information.
Fields See "Fields" on page 232 for more information.
Administrator's GuideChapter 4: Reporting
Customizing Report Elements Page 230 of 743
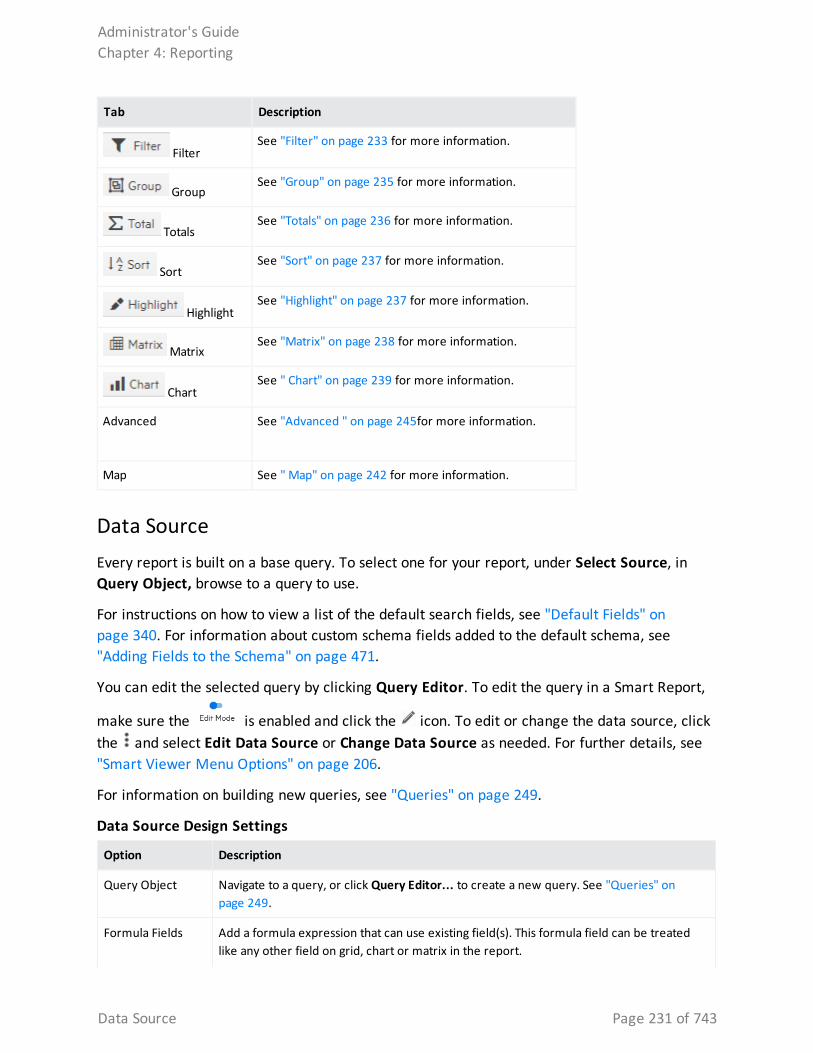
Tab Description
Filter See "Filter" on page 233 for more information.
Group See "Group" on page 235 for more information.
Totals See "Totals" on page 236 for more information.
Sort See "Sort" on page 237 for more information.
Highlight See "Highlight" on page 237 for more information.
Matrix See "Matrix" on page 238 for more information.
Chart See " Chart" on page 239 for more information.
Advanced See "Advanced " on page 245for more information.
Map See " Map" on page 242 for more information.
Data SourceEvery report is built on a base query. To select one for your report, under Select Source, in Query Object, browse to a query to use.
For instructions on how to view a list of the default search fields, see "Default Fields" on page 340. For information about custom schema fields added to the default schema, see "Adding Fields to the Schema" on page 471.
You can edit the selected query by clicking Query Editor. To edit the query in a Smart Report,
make sure the is enabled and click the icon. To edit or change the data source, click the and select Edit Data Source or Change Data Source as needed. For further details, see "Smart Viewer Menu Options" on page 206.
For information on building new queries, see "Queries" on page 249.
Option Description
Query Object Navigate to a query, or click Query Editor... to create a new query. See "Queries" on page 249.
Formula Fields Add a formula expression that can use existing field(s). This formula field can be treated like any other field on grid, chart or matrix in the report.
Data Source Design Settings
Administrator's GuideChapter 4: Reporting
Data Source Page 231 of 743
Option Description
Report Title Give this report a title.
Template Select the template to apply to this report. The templates pull-down menu shows supplied templates, and any custom templates you may have added. To include the start time, end time, scan limit, device group, storage group, and devices information (used to run a report) in a report, choose the “BlankWithHeader” template. See "Template Styles" on page 287.
Report Format Select the default format for the report. See "Report Formats for Viewing " on page 207.
Report Contents Select whether report should detailed or summarized. Default is Detailed.
Data Source Design Settings, continued
FieldsOnce you select a query to use in the report, the display fields it contains are shown in the Available Fields list. You can select which of these display fields you want to use in your report. . For information on building new queries, see "Queries" on page 249.
To edit the fields on the Classic Report, click the Query Editor link. To edit the query in a Smart
Report, make sure the is enabled and click the icon.
Note: In addition to the fields in the WHERE clause of the query, the fields in the SELECT clause also need to be indexed to yield faster report generation. For more information about indexing fields, see "Indexing" on page 159.
In the Classic Report, enter a title for the report in the Report Title field, and then select whether the report contents should be Detailed or Summarized in the Report Contents field. The report title is displayed at the top of a report.
Select the query you want to use from the drop-down list located on top of the Select Display fields section. Select the fields to use in the report by moving fields from Available Fields into the Selected Fields list.
Note: You must move at least some available fields to the Selected Fields list, or the report will not run correctly
l Select a field in Available Fields (in Design reports, make sure to select the box) and click arrow to move it into the Selected Fields list, or click to add all fields.
l To deselect fields from the report, select a field in the Selected Fields list and click to move it back to the Available Fields list, or click to deselect all fields. You can also drag and drop to the available fields column.
Administrator's GuideChapter 4: Reporting
Fields Page 232 of 743
l Use the move up and move down arrows to order the Selected Fields.
l In Smart reports, you can also add new fields at runtime by checking the correspondent box. To set the rendering details, make sure to update and render as boxes and drill-down accordingly.
Tip: For information on how to create query objects for use in reports, see "Queries" on page 249. All available queries, including new queries you create, show up in the pull-down menu in the Select Display Fields section of the Ad hoc Report Designer.
FilterFilter criteria are defined as part of a report design. When other users run the report, they receive the built-in filters by default. You can also set filter criteria and row limits on an ad hoc basis when you run a report. However, values set at run time are not built in to the report like those set at design time. Run-time parameters are only applicable to a particular report run and do not persist.
If a report does include default filter criteria, users have the option to run the report with the defaults, or modify or remove the built-in filters at run time. For more information, see "Run-Time Filters, Criteria, and Parameters" on page 193.
You can set filters on the results of the base query with logical expressions to narrow the focus of the report results. For example, you could set the filter criteria on a report on Top Password Changes to report only on password changes related to specified user names or involving specified IP addresses.
You can limit the number of rows in a report by defining a Max. Rows value, or require filtering on one or more fields of your choice using the Mandatory option.
To edit the selected filter on the Classic Report, click the Query Editor link. To edit the query in
a Smart Report, make sure the is enabled and click the icon.
Administrator's GuideChapter 4: Reporting
Filter Page 233 of 743
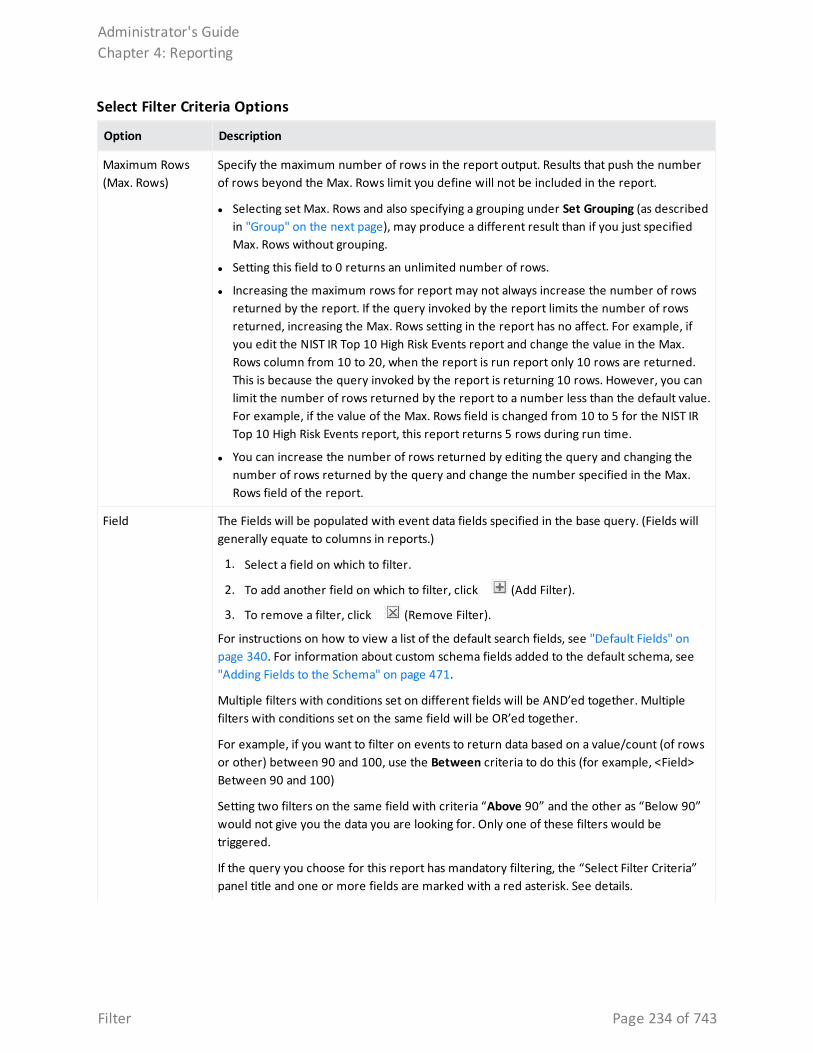
Option Description
Maximum Rows (Max. Rows)
Specify the maximum number of rows in the report output. Results that push the number of rows beyond the Max. Rows limit you define will not be included in the report.
l Selecting set Max. Rows and also specifying a grouping under Set Grouping (as described in "Group" on the next page), may produce a different result than if you just specified Max. Rows without grouping.
l Setting this field to 0 returns an unlimited number of rows.
l Increasing the maximum rows for report may not always increase the number of rows returned by the report. If the query invoked by the report limits the number of rows returned, increasing the Max. Rows setting in the report has no affect. For example, if you edit the NIST IR Top 10 High Risk Events report and change the value in the Max. Rows column from 10 to 20, when the report is run report only 10 rows are returned. This is because the query invoked by the report is returning 10 rows. However, you can limit the number of rows returned by the report to a number less than the default value. For example, if the value of the Max. Rows field is changed from 10 to 5 for the NIST IR Top 10 High Risk Events report, this report returns 5 rows during run time.
l You can increase the number of rows returned by editing the query and changing the number of rows returned by the query and change the number specified in the Max. Rows field of the report.
Field The Fields will be populated with event data fields specified in the base query. (Fields will generally equate to columns in reports.)
1. Select a field on which to filter.
2. To add another field on which to filter, click (Add Filter).
3. To remove a filter, click (Remove Filter).
For instructions on how to view a list of the default search fields, see "Default Fields" on page 340. For information about custom schema fields added to the default schema, see "Adding Fields to the Schema" on page 471.
Multiple filters with conditions set on different fields will be AND’ed together. Multiple filters with conditions set on the same field will be OR’ed together.
For example, if you want to filter on events to return data based on a value/count (of rows or other) between 90 and 100, use the Between criteria to do this (for example, <Field> Between 90 and 100)
Setting two filters on the same field with criteria “Above 90” and the other as “Below 90” would not give you the data you are looking for. Only one of these filters would be triggered.
If the query you choose for this report has mandatory filtering, the “Select Filter Criteria” panel title and one or more fields are marked with a red asterisk. See details.
Select Filter Criteria Options
Administrator's GuideChapter 4: Reporting
Filter Page 234 of 743
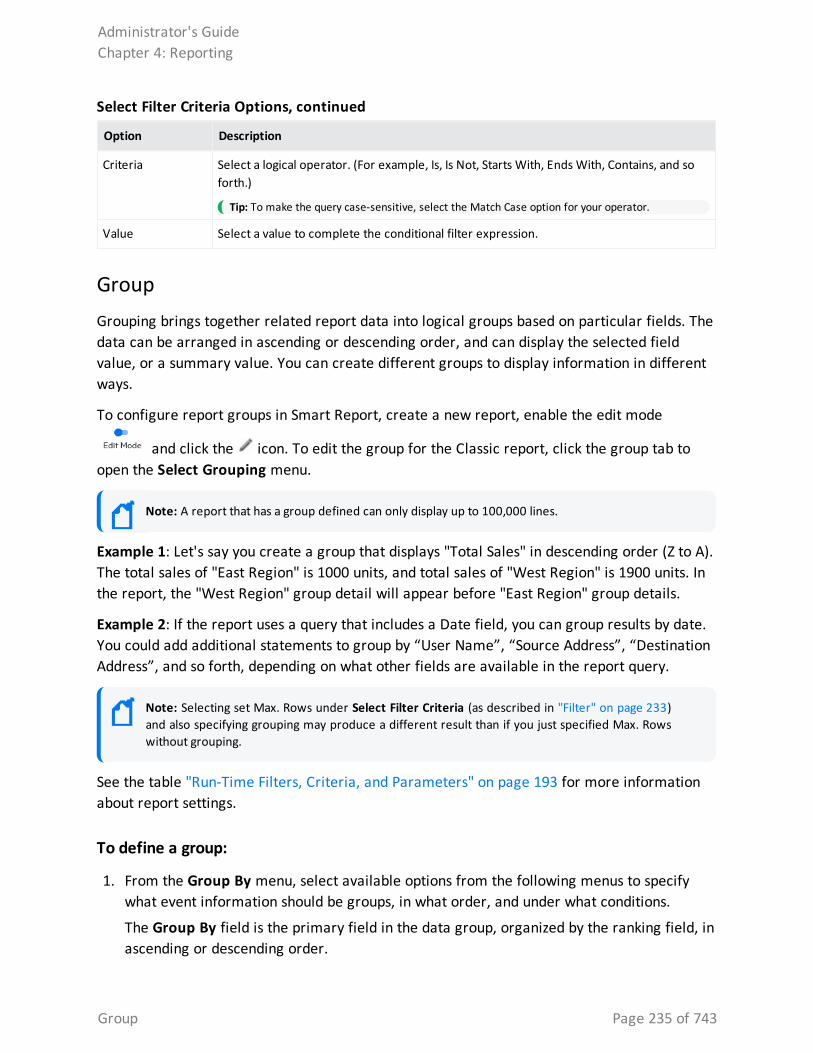
Option Description
Criteria Select a logical operator. (For example, Is, Is Not, Starts With, Ends With, Contains, and so forth.)
Tip: To make the query case-sensitive, select the Match Case option for your operator.
Value Select a value to complete the conditional filter expression.
Select Filter Criteria Options, continued
GroupGrouping brings together related report data into logical groups based on particular fields. The data can be arranged in ascending or descending order, and can display the selected field value, or a summary value. You can create different groups to display information in different ways.
To configure report groups in Smart Report, create a new report, enable the edit mode
and click the icon. To edit the group for the Classic report, click the group tab to open the Select Grouping menu.
Note: A report that has a group defined can only display up to 100,000 lines.
Example 1: Let's say you create a group that displays "Total Sales" in descending order (Z to A). The total sales of "East Region" is 1000 units, and total sales of "West Region" is 1900 units. In the report, the "West Region" group detail will appear before "East Region" group details.
Example 2: If the report uses a query that includes a Date field, you can group results by date. You could add additional statements to group by “User Name”, “Source Address”, “Destination Address”, and so forth, depending on what other fields are available in the report query.
Note: Selecting set Max. Rows under Select Filter Criteria (as described in "Filter" on page 233) and also specifying grouping may produce a different result than if you just specified Max. Rows without grouping.
See the table "Run-Time Filters, Criteria, and Parameters" on page 193 for more information about report settings.
To define a group:
1. From the Group By menu, select available options from the following menus to specify what event information should be groups, in what order, and under what conditions.
The Group By field is the primary field in the data group, organized by the ranking field, in ascending or descending order.
Administrator's GuideChapter 4: Reporting
Group Page 235 of 743
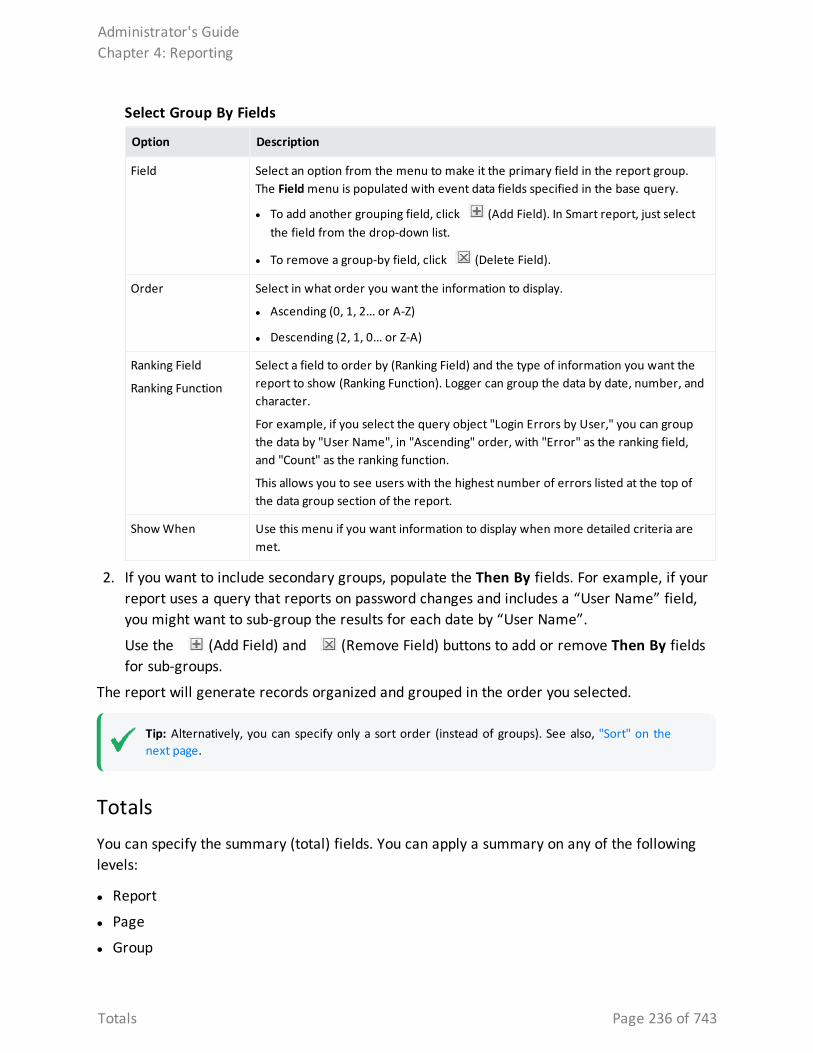
Option Description
Field Select an option from the menu to make it the primary field in the report group. The Field menu is populated with event data fields specified in the base query.
l To add another grouping field, click (Add Field). In Smart report, just select the field from the drop-down list.
l To remove a group-by field, click (Delete Field).
Order Select in what order you want the information to display.
l Ascending (0, 1, 2... or A-Z)
l Descending (2, 1, 0... or Z-A)
Ranking Field
Ranking Function
Select a field to order by (Ranking Field) and the type of information you want the report to show (Ranking Function). Logger can group the data by date, number, and character.
For example, if you select the query object "Login Errors by User," you can group the data by "User Name", in "Ascending" order, with "Error" as the ranking field, and "Count" as the ranking function.
This allows you to see users with the highest number of errors listed at the top of the data group section of the report.
Show When Use this menu if you want information to display when more detailed criteria are met.
Select Group By Fields
2. If you want to include secondary groups, populate the Then By fields. For example, if your report uses a query that reports on password changes and includes a “User Name” field, you might want to sub-group the results for each date by “User Name”.
Use the (Add Field) and (Remove Field) buttons to add or remove Then By fields for sub-groups.
The report will generate records organized and grouped in the order you selected.
Tip: Alternatively, you can specify only a sort order (instead of groups). See also, "Sort" on the next page.
TotalsYou can specify the summary (total) fields. You can apply a summary on any of the following levels:
l Report
l Page
l Group
Administrator's GuideChapter 4: Reporting
Totals Page 236 of 743
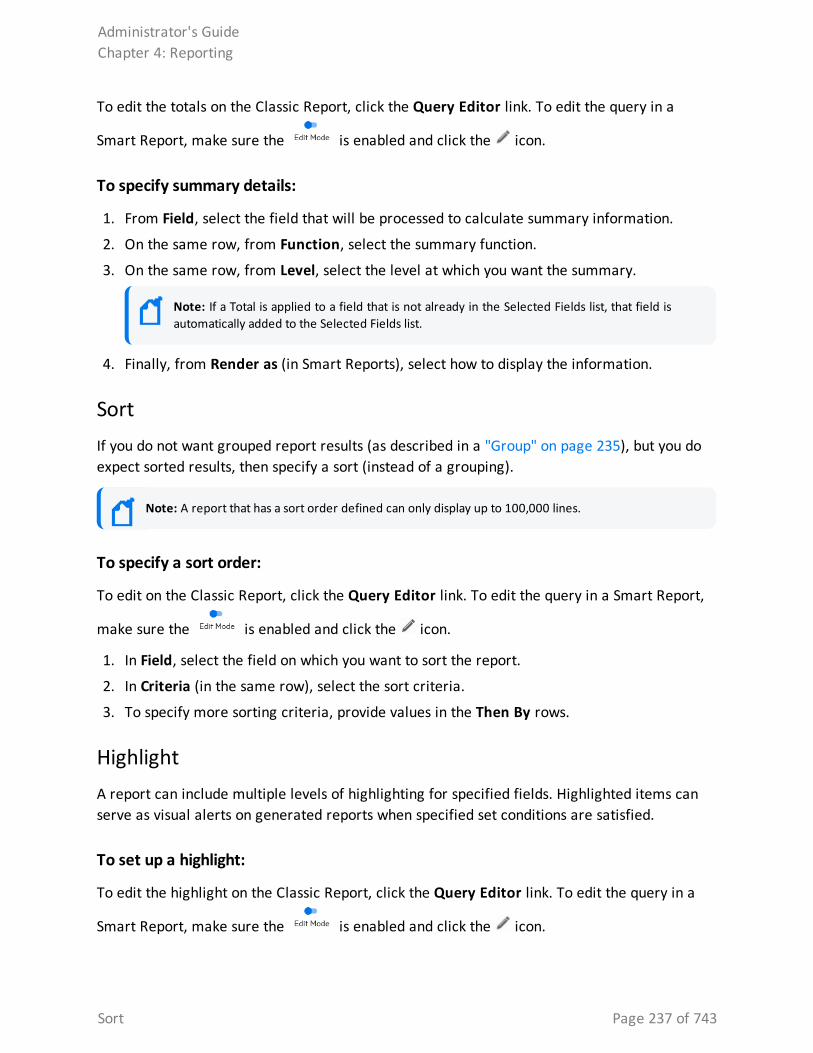
To edit the totals on the Classic Report, click the Query Editor link. To edit the query in a
Smart Report, make sure the is enabled and click the icon.
To specify summary details:
1. From Field, select the field that will be processed to calculate summary information.
2. On the same row, from Function, select the summary function.
3. On the same row, from Level, select the level at which you want the summary.
Note: If a Total is applied to a field that is not already in the Selected Fields list, that field is automatically added to the Selected Fields list.
4. Finally, from Render as (in Smart Reports), select how to display the information.
SortIf you do not want grouped report results (as described in a "Group" on page 235), but you do expect sorted results, then specify a sort (instead of a grouping).
Note: A report that has a sort order defined can only display up to 100,000 lines.
To specify a sort order:
To edit on the Classic Report, click the Query Editor link. To edit the query in a Smart Report,
make sure the is enabled and click the icon.
1. In Field, select the field on which you want to sort the report.
2. In Criteria (in the same row), select the sort criteria.
3. To specify more sorting criteria, provide values in the Then By rows.
HighlightA report can include multiple levels of highlighting for specified fields. Highlighted items can serve as visual alerts on generated reports when specified set conditions are satisfied.
To set up a highlight:
To edit the highlight on the Classic Report, click the Query Editor link. To edit the query in a
Smart Report, make sure the is enabled and click the icon.
Administrator's GuideChapter 4: Reporting
Sort Page 237 of 743
1. In Highlight, select the field that should be highlighted. l To highlight an entire record, Entire Row.
l Otherwise, select the specific fields or groups.
2. In Using Style, select the style to be applied to highlight it. You can customize a style if required.
3. Select Alert checkbox to receive a visual alert on report viewer.
4. In Field, select the fields to evaluate for highlight (alert).
5. In Level, select the level at which the selected field should be evaluated:
l Detail evaluates each row (record)
l Report evaluates at the end of report
l Respective groups evaluate at the end of each group
l Page evaluates at the end of the page
When Report or Page is selected in Level, select a Function to be applied.
6. Select Criteria and specify its Value.
7. Select the relation.
Click - on the left of the criteria entry to delete an entry. To add another entry, click +. Click Apply to save the changes. Otherwise, click Cancel.
MatrixYou might choose to include a matrix in your report, since it presents a summary of data. Make sure that the appropriate query object is selected (under Select Display Fields).
To create a matrix:
To edit the matrix on the Classic Report, click the Query Editor link. To edit the query in a
Smart Report, make sure the is enabled and click the icon.
1. To place a field in Row or Column, click the field and drag it to the Row Fields or Column Fields boxes.
2. To place a field as a cell (summary), click the field and drag into the Summary Fields box.
3. Select a Function from the pull-down menu provided for a field placed in Summary Fields.
4. Optionally, for numeric or date fields in columns or rows, specify a Group By function in the pull-down menu provided.
5. Optionally, for fields in columns or rows, check the Totals checkbox to view a row or column.
Administrator's GuideChapter 4: Reporting
Matrix Page 238 of 743
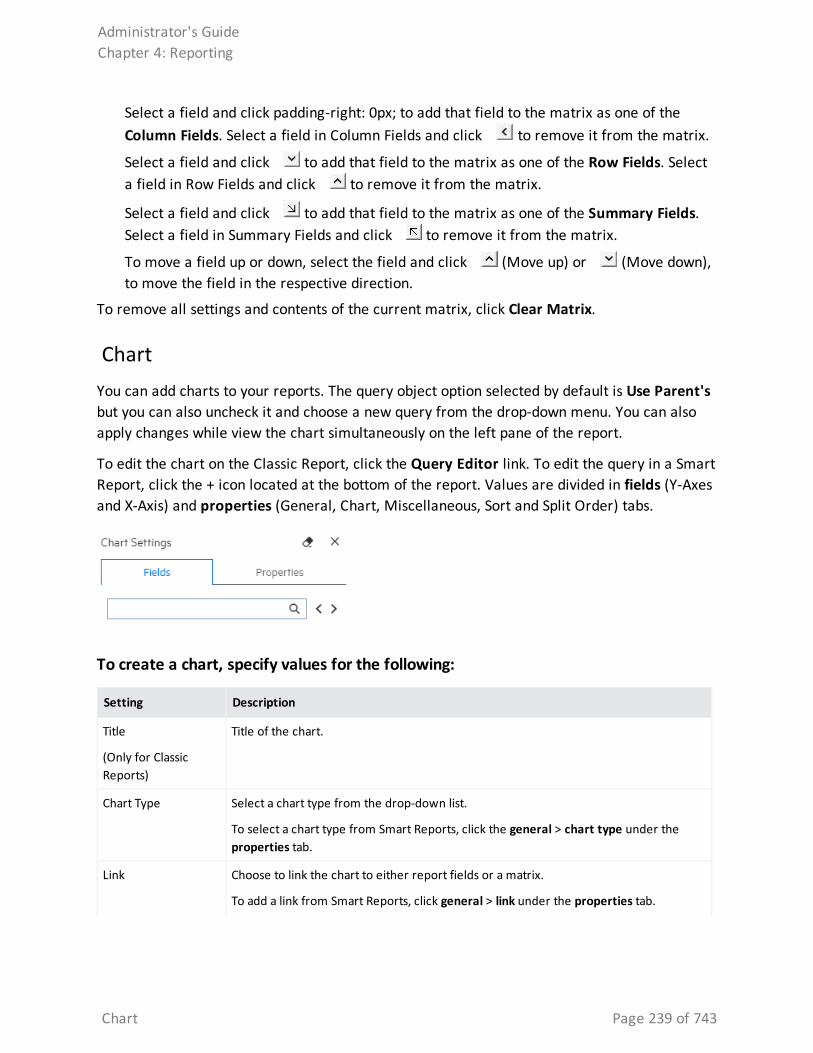
Select a field and click padding-right: 0px; to add that field to the matrix as one of the Column Fields. Select a field in Column Fields and click to remove it from the matrix.
Select a field and click to add that field to the matrix as one of the Row Fields. Select a field in Row Fields and click to remove it from the matrix.
Select a field and click to add that field to the matrix as one of the Summary Fields. Select a field in Summary Fields and click to remove it from the matrix.
To move a field up or down, select the field and click (Move up) or (Move down), to move the field in the respective direction.
To remove all settings and contents of the current matrix, click Clear Matrix.
ChartYou can add charts to your reports. The query object option selected by default is Use Parent's but you can also uncheck it and choose a new query from the drop-down menu. You can also apply changes while view the chart simultaneously on the left pane of the report.
To edit the chart on the Classic Report, click the Query Editor link. To edit the query in a Smart Report, click the + icon located at the bottom of the report. Values are divided in fields (Y-Axes and X-Axis) and properties (General, Chart, Miscellaneous, Sort and Split Order) tabs.
To create a chart, specify values for the following:
Setting Description
Title
(Only for Classic Reports)
Title of the chart.
Chart Type Select a chart type from the drop-down list.
To select a chart type from Smart Reports, click the general > chart type under the properties tab.
Link Choose to link the chart to either report fields or a matrix.
To add a link from Smart Reports, click general > link under the properties tab.
Administrator's GuideChapter 4: Reporting
Chart Page 239 of 743
Setting Description
Available Fields Available Fields are drawn from the report query. Using the > button, assign these fields to Value Fields (Y-axes on the chart) or Group Fields.
To select the fields from Smart Reports, go to the fields tab. Then, simply drag and drop the fields where needed.
Settings l Show Title (only in Classic Reports): if selected, the chart title displays.
l Show Legends: if selected, the chart will show legends for each field. Use the drop-down to select where it needs to be displayed: left, right, top, or bottom.
l Show Point Labels: if selected, a label is shown with the number of matches for a value of a field in a chart.
l Show Description: If selected, a description is displayed.
l Align (only in Classic Reports): Select an alignment for chart placement.
l Level (only in Classic Reports): Select a level from which to draw data for the chart:
o Report: Data will be plotted with data from entire report
o Page: Data will be plotted with data from the page where the chart is located)
To display the legends, point labels, and description from Smart Reports, go to the chart section under the properties tab.
Sort Order Select a sort order for the chart.
To sort the order from Smart Reports, click the sort order section under the properties tab.
Split Order Determine how to split the chart.
To split the chart from Smart Reports, click the split order section under the properties tab.
Description Add a description of the chart. For more details, see "Annotating Report Charts" on the next page.
Assigning Fields
You can set value and sort fields for a chart.
To Set Value Fields (Y-Axis):
1. Click and drag the field in Series (Y-Axis) section. In Classic Reports, you can use the button (Add field) to add the selected field.
2. In Classic Reports, select summary function for the field.
3. In Smart Reports, set the function, series type, trend and info graphics as needed. To re-
position fields in Classic Reports, select a field and click the or arrows as needed.
Administrator's GuideChapter 4: Reporting
Assigning Fields Page 240 of 743
Tip: To change the size of the chart labels, the user must set the Axis.maxHeight property in the bar.ict file
To Set Group Fields (X-Axis):
1. Click and drag the field in Categories (X-Axis) section. You can also select the field and
click the arrow. In Classic Reports, you can use the button (Add field) to add the selected field.
2. Select the method to group (for Numeric or date type).
You can specify groups in numeric fields. For example, to have groups of 10, specify 10 in Groups box.
You can specify groups in date fields. From the drop-down box select from Day, Week (Sunday to Saturday), Month, Quarter (Jan-Mar, Apr - Jun, Jul - Sep, Oct - Dec), Year.
Tip: To remove fields from Value fields (Y-Axis) or Group Fields (X-Axis), drag them out of
the respective box or use the arrow (Remove field) on selected fields.
In Classic Reports: To display one chart per field, go the field line and click split. To remove all settings and contents of the current chart, click Clear Chart. To specify the screen percentage space, use the Max Height value. To establish the maximum number of characters for view in the chart label, use Max Characteres value.
In Smart Reports, select the display field and group drop-down as well as the pivot or split boxes as needed.
To save a chart as an image:
1. Right-click on the chart and choose the saving format. 2. Click Save.
Annotating Report Charts
You can annotate (add explanation or comment) to report charts through the Description field in the Chart Properties menu. See " Chart" on page 239 for more information on Chart properties.
To annotate a Smart report
1. From Explorer, run a Smart report that includes a chart.
2. Make sure the report is in Edit Mode .
Administrator's GuideChapter 4: Reporting
Annotating Report Charts Page 241 of 743
3. Click the + located at the bottom of the page. Then, click the Add Chart option.
4. From the Miscellaneous section, click the icon to open the Description menu. A window will be displayed.
5. Create your annotation and click OK. Then click Apply. The annotation displays in the chart.
Tip: Where you position the description, and how large it is, can affect the size of the chart visualization. If the chart is part of a Dashboard, consider adding a Rich Text widget to the layout, which can display the information without compressing the chart.
6. Click Save or Save As (in the bottom-right) to save the report with the description.
To annotate a Classic report
1. From Classic reports, click the tab.
2. From the Miscellaneous section, click the icon to open the Description menu. A window will be displayed.
3. Create your annotation and click OK.
Tip: Where you position the description, and how large it is, can affect the size of the chart visualization. If the chart is part of a Dashboard, consider adding a Rich Text widget to the layout, which can display the information without compressing the chart.
4. Click Save or Save As (in the bottom-right) to save the report with the description.
MapThis topic only applies to Smart Reports
Your report can include a GIS (Geographic Information System) map based on your data.
Administrator's GuideChapter 4: Reporting
Map Page 242 of 743
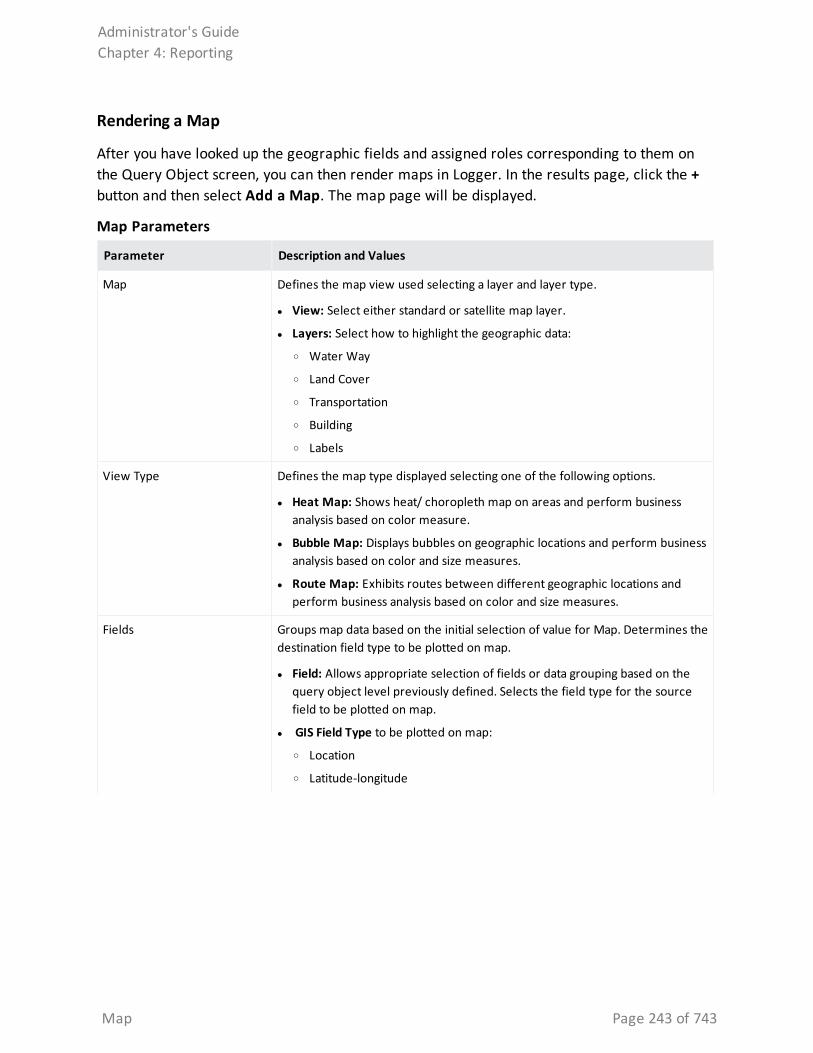
Rendering a Map
After you have looked up the geographic fields and assigned roles corresponding to them on the Query Object screen, you can then render maps in Logger. In the results page, click the + button and then select Add a Map. The map page will be displayed.
Parameter Description and Values
Map Defines the map view used selecting a layer and layer type.
l View: Select either standard or satellite map layer.
l Layers: Select how to highlight the geographic data:
o Water Way
o Land Cover
o Transportation
o Building
o Labels
View Type Defines the map type displayed selecting one of the following options.
l Heat Map: Shows heat/ choropleth map on areas and perform business analysis based on color measure.
l Bubble Map: Displays bubbles on geographic locations and perform business analysis based on color and size measures.
l Route Map: Exhibits routes between different geographic locations and perform business analysis based on color and size measures.
Fields Groups map data based on the initial selection of value for Map. Determines the destination field type to be plotted on map.
l Field: Allows appropriate selection of fields or data grouping based on the query object level previously defined. Selects the field type for the source field to be plotted on map.
l GIS Field Type to be plotted on map:
o Location
o Latitude-longitude
Map Parameters
Administrator's GuideChapter 4: Reporting
Map Page 243 of 743
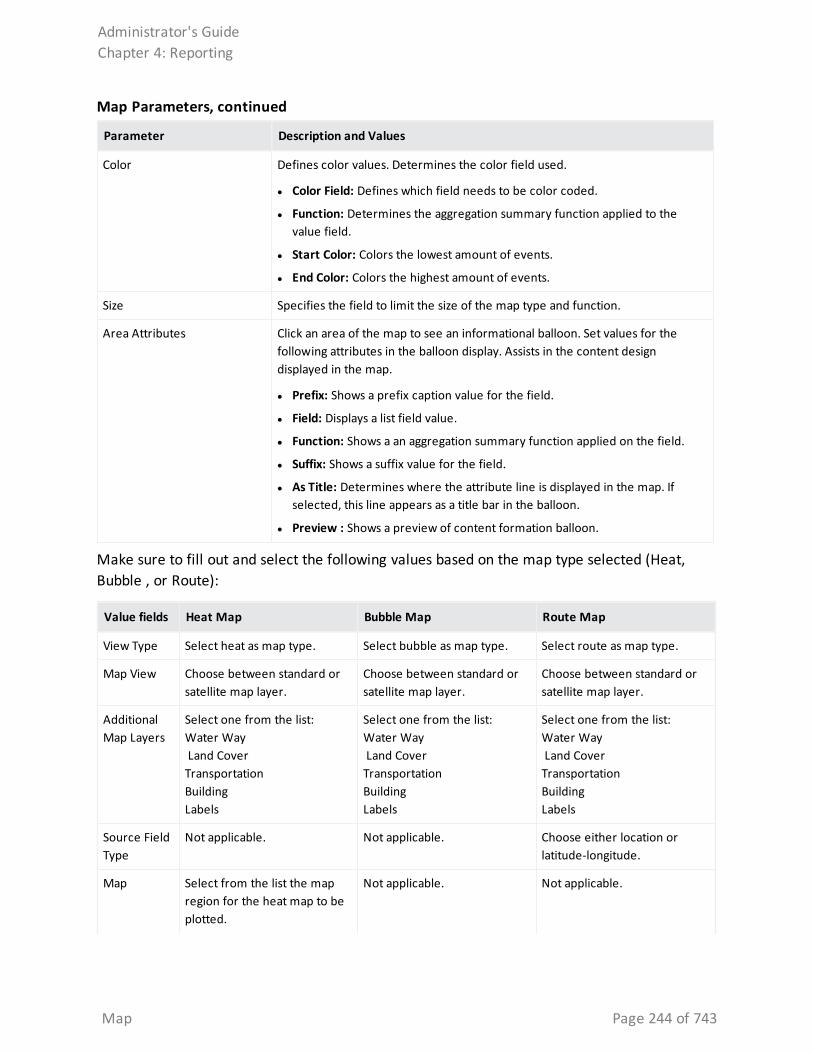
Parameter Description and Values
Color Defines color values. Determines the color field used.
l Color Field: Defines which field needs to be color coded.
l Function: Determines the aggregation summary function applied to the value field.
l Start Color: Colors the lowest amount of events.
l End Color: Colors the highest amount of events.
Size Specifies the field to limit the size of the map type and function.
Area Attributes Click an area of the map to see an informational balloon. Set values for the following attributes in the balloon display. Assists in the content design displayed in the map.
l Prefix: Shows a prefix caption value for the field.
l Field: Displays a list field value.
l Function: Shows a an aggregation summary function applied on the field.
l Suffix: Shows a suffix value for the field.
l As Title: Determines where the attribute line is displayed in the map. If selected, this line appears as a title bar in the balloon.
l Preview : Shows a preview of content formation balloon.
Map Parameters, continued
Make sure to fill out and select the following values based on the map type selected (Heat, Bubble , or Route):
Value fields Heat Map Bubble Map Route Map
View Type Select heat as map type. Select bubble as map type. Select route as map type.
Map View Choose between standard or satellite map layer.
Choose between standard or satellite map layer.
Choose between standard or satellite map layer.
Additional Map Layers
Select one from the list: Water Way Land Cover Transportation Building Labels
Select one from the list: Water Way Land Cover Transportation Building Labels
Select one from the list: Water Way Land Cover Transportation Building Labels
Source Field Type
Not applicable. Not applicable. Choose either location or latitude-longitude.
Map Select from the list the map region for the heat map to be plotted.
Not applicable. Not applicable.
Administrator's GuideChapter 4: Reporting
Map Page 244 of 743
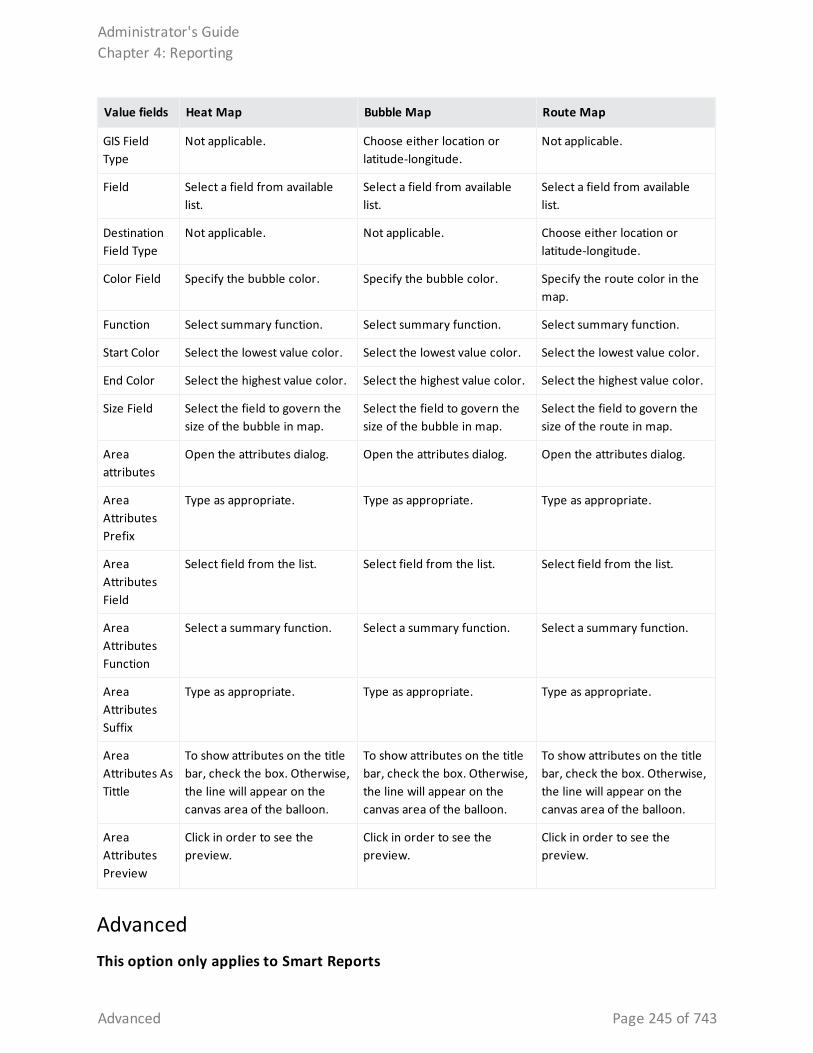
Value fields Heat Map Bubble Map Route Map
GIS Field Type
Not applicable. Choose either location or latitude-longitude.
Not applicable.
Field Select a field from available list.
Select a field from available list.
Select a field from available list.
Destination Field Type
Not applicable. Not applicable. Choose either location or latitude-longitude.
Color Field Specify the bubble color. Specify the bubble color. Specify the route color in the map.
Function Select summary function. Select summary function. Select summary function.
Start Color Select the lowest value color. Select the lowest value color. Select the lowest value color.
End Color Select the highest value color. Select the highest value color. Select the highest value color.
Size Field Select the field to govern the size of the bubble in map.
Select the field to govern the size of the bubble in map.
Select the field to govern the size of the route in map.
Area attributes
Open the attributes dialog. Open the attributes dialog. Open the attributes dialog.
Area Attributes Prefix
Type as appropriate. Type as appropriate. Type as appropriate.
Area Attributes Field
Select field from the list. Select field from the list. Select field from the list.
Area Attributes Function
Select a summary function. Select a summary function. Select a summary function.
Area Attributes Suffix
Type as appropriate. Type as appropriate. Type as appropriate.
Area Attributes As Tittle
To show attributes on the title bar, check the box. Otherwise, the line will appear on the canvas area of the balloon.
To show attributes on the title bar, check the box. Otherwise, the line will appear on the canvas area of the balloon.
To show attributes on the title bar, check the box. Otherwise, the line will appear on the canvas area of the balloon.
Area Attributes Preview
Click in order to see the preview.
Click in order to see the preview.
Click in order to see the preview.
Advanced This option only applies to Smart Reports
Administrator's GuideChapter 4: Reporting
Advanced Page 245 of 743

To edit even more your report, go to the Advanced tab.
To specify the Advanced options:
Edit the query in a Smart Report, make sure the is enabled and click the icon.
1. In Report Contents, select between Detailed or Summarized options.
Tip: Make sure to select the group fields prior when selecting the summarized option
2. Select the Group Expansion Mode: Fetch on Demand, Prefetched, or Expanded.
3. To load all data for all columns, click the correspondent checkbox.
Building DashboardsA dashboard displays multiple pieces of information arranged on a single screen, so that it can be viewed and monitored at a glance. A dashboard can display reports as well as web content. It acts as an interface for business analysts and application administrators to analyze their systems in a comprehensive and personalized manner.
Dashboards use widgets, which are display modules that can display supported objects. You first create the widgets, then you can place and display them within the dashboard.
For example:
l You can add one or more reports to a dashboard, and configure reports to auto-refresh on a specified interval (for example, every hour). The dashboard will access the latest published reports results, in this case, every hour.
l If you have also scheduled the reports to run and publish every hour, your dashboard will show current results. This eliminates the need to manually run and view each report once per hour in order to retrieve the same information updates.
Administrator's GuideChapter 4: Reporting
Building Dashboards Page 246 of 743
Dashboard PrerequisitesDashboards are built from widgets created from published reports, which are generated by running an existing report, or creating a new one. You must follow these high-level steps to create the objects that populate your dashboard.
High-level steps to create a dashboard
The process for configuring dashboards consists of these tasks:
1. Run a report (modify an existing one, or create a new one).
2. Add charts and modifications to the report.
3. Publish the report.
4. Create a new widget from that report.
5. Create a new dashboard.
Note: Users can only create private dashboards.
From the Smart Dashboard designer (Design > Dashboards): a. Optionally, repeat steps 1-4 (above) to create additional dashboard widgets.
b. Click Design > Dashboards. A blank dashboard displays.
c. Use the Elements menu to drag and drop your widgets and other dashboard objects, to the dashboard.
What Items Can a Dashboard Include?The following information is available for placement on a dashboard. However, each report or Web Link must be placed inside a widget and the widget in turn is placed into the dashboard.
A dashboard can contain one or more widgets containing any of the following:
l Published Reports: The dashboard will show the latest published version of the report. See "Publishing Reports" on page 216.
Note: Reports must be published in order for the report data to be accessible to users on the Dashboard View. If no published results are available for a report on a dashboard, the Dashboard View will display a message indicating this. When the report is published, a refresh of the Dashboard view will display the report.
Administrator's GuideChapter 4: Reporting
Dashboard Prerequisites Page 247 of 743
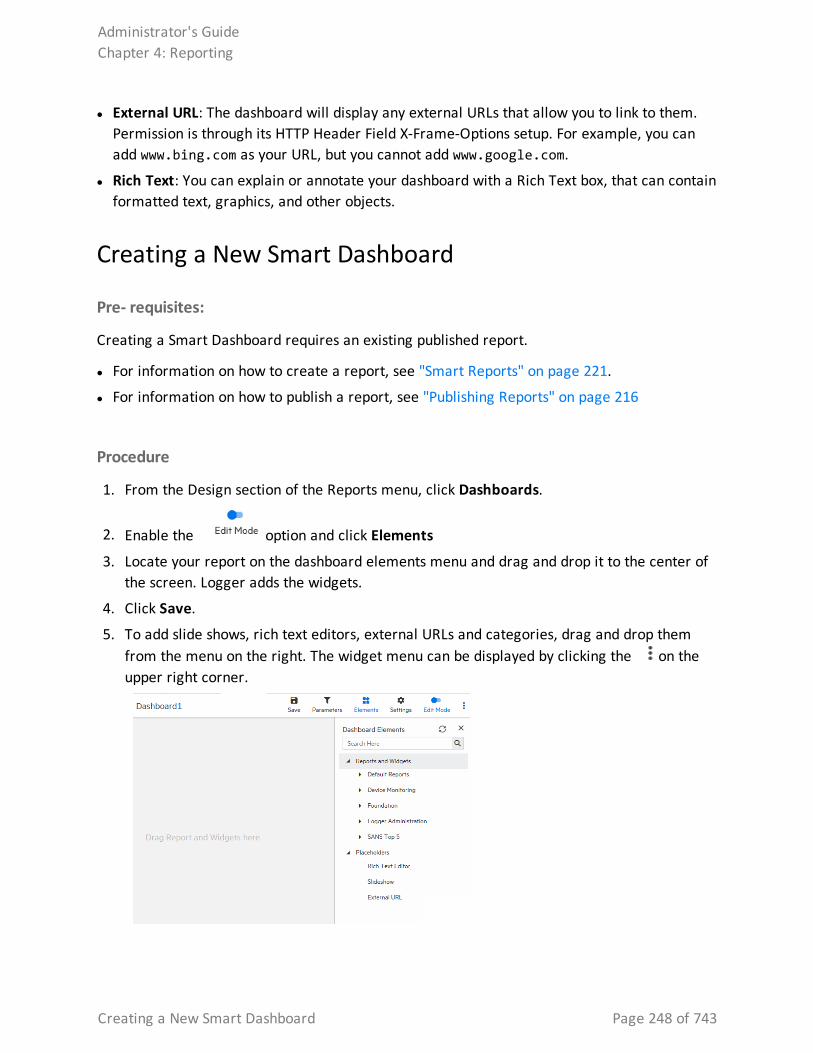
l External URL: The dashboard will display any external URLs that allow you to link to them. Permission is through its HTTP Header Field X-Frame-Options setup. For example, you can add www.bing.com as your URL, but you cannot add www.google.com.
l Rich Text: You can explain or annotate your dashboard with a Rich Text box, that can contain formatted text, graphics, and other objects.
Creating a New Smart Dashboard
Pre- requisites:
Creating a Smart Dashboard requires an existing published report.
l For information on how to create a report, see "Smart Reports" on page 221.
l For information on how to publish a report, see "Publishing Reports" on page 216
Procedure
1. From the Design section of the Reports menu, click Dashboards.
2. Enable the option and click Elements
3. Locate your report on the dashboard elements menu and drag and drop it to the center of the screen. Logger adds the widgets.
4. Click Save.
5. To add slide shows, rich text editors, external URLs and categories, drag and drop them from the menu on the right. The widget menu can be displayed by clicking the on the upper right corner.
Administrator's GuideChapter 4: Reporting
Creating a New Smart Dashboard Page 248 of 743
l From External URL settings you can change the name of the URL, set the refreshing time and add a description.
l From rich text settings you can change the name of the widget, enter text, edit the format and insert images or tables.
l From report settings you can name your widget, change the report you want to use, select a job, set the refreshing time, add a description, and change viewer toolbar options and instance navigation.
l From slideshow settings you can modify the refreshing time.
6. To edit a Smart Dashboard, enable the option.
7. To delete a Smart Dashboard, click Remove from the three dot menu.
8. To add a new Smart Dashboard click Add New Dashboard .
Dashboard Migration Tool Classic > Dashboard > Classic Designer page is no longer supported by Logger causing the user to no longer create or edit classic dashboards. Instead, a message is displayed confirming this information. A dashboard page will store the 6.7.1 dashboard data thanks to one time execution of the Migration Tool available for users when upgrading from 6.7.1 to 7.0. In Reports > Explorer > Root > Converted Classic Dashboard, the user can look for saved dashboards in a private scope unlike the widgets which will be available to the public.
Designing Queries, Parameters, and TemplatesYou can create and modify report objects like queries, parameters, parameter value groups, and templates using familiar Logger Design tools.
QueriesQuery objects (which comprise queries bundled with additional metadata) are used as the basis for designing reports. Logger Reporting provides a set of pre-built queries, which are used as the basis for the System-defined Reports and Solutions Reports to address common security use cases.
You can browse or select query objects in Explorer. See "Reports Explorer" on page 176. You can use a provided query object as is, as the basis for your own reports, or design new query
Administrator's GuideChapter 4: Reporting
Dashboard Migration Tool Page 249 of 743
objects on the Query Object List page. You can use existing query objects as a starting point for new ones.
Note: Some queries may require parameters. We recommend first designing all needed parameter objects before creating the query object that will use those parameter objects.
For information on developing parameter objects, see "Parameters" on page 277.
For instructions on how to view a list of the default search fields, see "Default Fields" on page 340. For information about custom schema fields added to the default schema, see "Adding Fields to the Schema" on page 471.
Reports that directly invoke SQL queries can use the standard insubnet SQL function as follows: insubnet( "subnet string", address_column )
Caution: Modifications to reports and other ArcSight - defined content may be overwritten without warning when the content is upgraded. It is not good practice to modify ArcSight-defined content directly.
Make modifications to a copy of any ArcSight - defined content as a general practice, and subsequent upgrades will not affect the modifications.
This topic explains how to design new query objects (either from scratch or based on existing ones).
How Search and Report Queries DifferThis topic applies both to Classic Search and Search page
Even though a search and a report query both perform the same function (finding events that match specific conditions) the two queries are distinct in these ways:
l You use Logger’s Query Object Editor to create a report query. See "Queries" on the previous page.
Tip: Report queries and field name queries can use indexed fields to expedite the underlying search.
l You use the Logger’s Search UI to create a search query. The query can be specified using plain English keywords, field names, or regular expressions. See "Searching for Events" on page 106.
Overview of Query Design ElementsTo create a new query object, you need to specify a query name, define a data transformation, and save it. The data source for Logger Report queries is always the Logger databases, so there
Administrator's GuideChapter 4: Reporting
How Search and Report Queries Differ Page 250 of 743
is no need to specify this as part of the query object.
Optionally, you can specify formulas, set field properties, define transformations, define formatting, define field groups, provide hyperlinking, define lookup values, and build mandatory filtering into the query.
Working with Queries
To search for an existing query by name or other criteria:
1. In the Reports menu, under Design, click Queries.
2. On the toolbar, click Open.
3. Click Search.
4. In the criteria dialog, select the criteria for your search.
5. Click Search. All queries matching your criteria are returned.
Creating a Copy of an Existing Query
To use an existing query object as the basis for a new one:
1. From the Explorer, click on a category and select the name of the query that you want to copy from the query list.
2. Right-click to expand the context menu. See "Explorer Options and Context Menus" on page 179.
3. Click Copy Query Object.
Administrator's GuideChapter 4: Reporting
Working with Queries Page 251 of 743
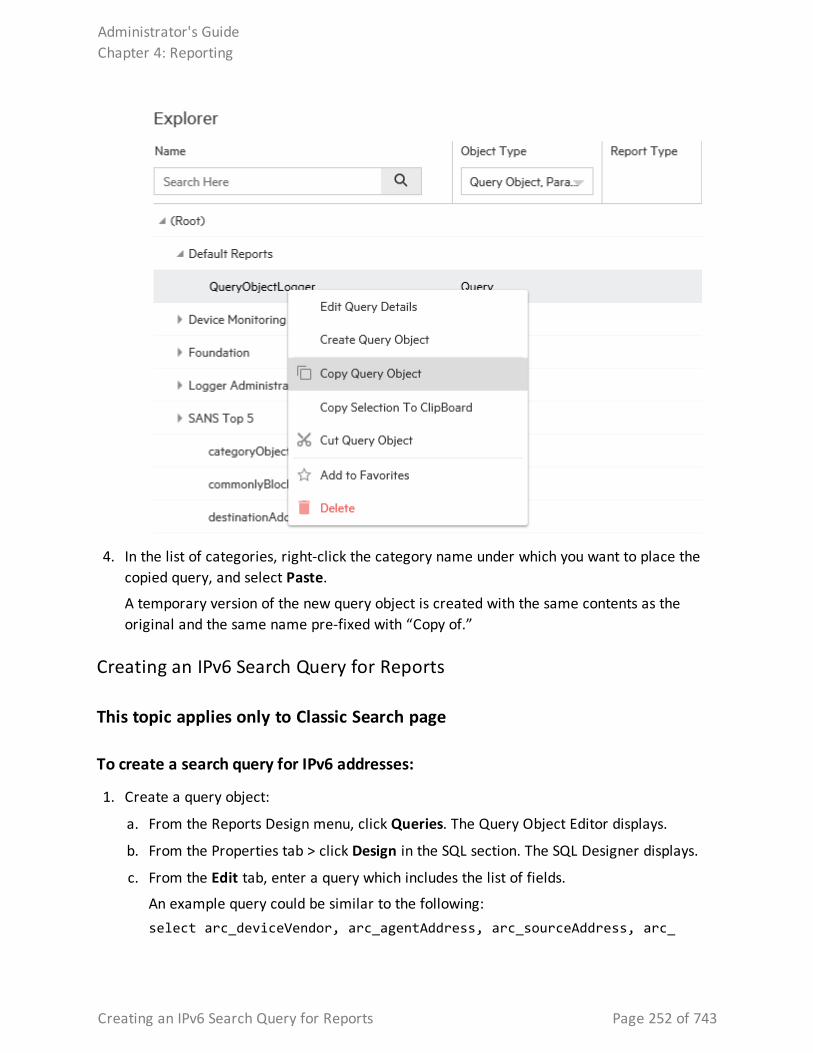
4. In the list of categories, right-click the category name under which you want to place the copied query, and select Paste.
A temporary version of the new query object is created with the same contents as the original and the same name pre-fixed with “Copy of.”
Creating an IPv6 Search Query for Reports
This topic applies only to Classic Search page
To create a search query for IPv6 addresses:
1. Create a query object:
a. From the Reports Design menu, click Queries. The Query Object Editor displays.
b. From the Properties tab > click Design in the SQL section. The SQL Designer displays.
c. From the Edit tab, enter a query which includes the list of fields.
An example query could be similar to the following:select arc_deviceVendor, arc_agentAddress, arc_sourceAddress, arc_
Administrator's GuideChapter 4: Reporting
Creating an IPv6 Search Query for Reports Page 252 of 743
destinationAddress FROM events
d. Click OK. The fields display in the SQL section of the Query Object Editor.
2. Define each field as an IPv6 field. Refer to the following image for reference:
a. Click the Format icon. The Properties tab now displays the query fields.
b. From the Fields list, select a field.
c. Click the three dot icon next to OutputFormat.
d. In the Data Format pop-up , select Network Id, then IP Address (IPv6).
e. Click OK to dismiss the pop-up.
3. When you are finished defining each of the IPv6 fields, enter a name for the query object and save the query.
Modifying a Query Object
Use the Query Object editor to modify existing queries.
Tip: We recommend that you not modify queries provided with Logger or add-on Solution packs. If you want to use a supplied query as a starting point for your own queries, copy them and edit the copies, as described in "Creating a Copy of an Existing Query" on page 251.
To modify an existing query:
1. In the Query Explorer, click the category in the Query Objects column where you have stored the query and click the Edit Query Details button.
2. Edit the query as needed (see "Working with Queries" on page 251 and click Save.
Deleting a Query Object
You can remove custom queries, but not supplied queries provided with Logger or add-on Solution packs.
To remove a query:
In the Query Explorer, click the category in the Query Objects column where you have stored the query and click the Delete button.
Creating Reports from Filters and Saved Searches.
Users can create and save reports based on existing Logger filters or saved searches.
Administrator's GuideChapter 4: Reporting
Modifying a Query Object Page 253 of 743
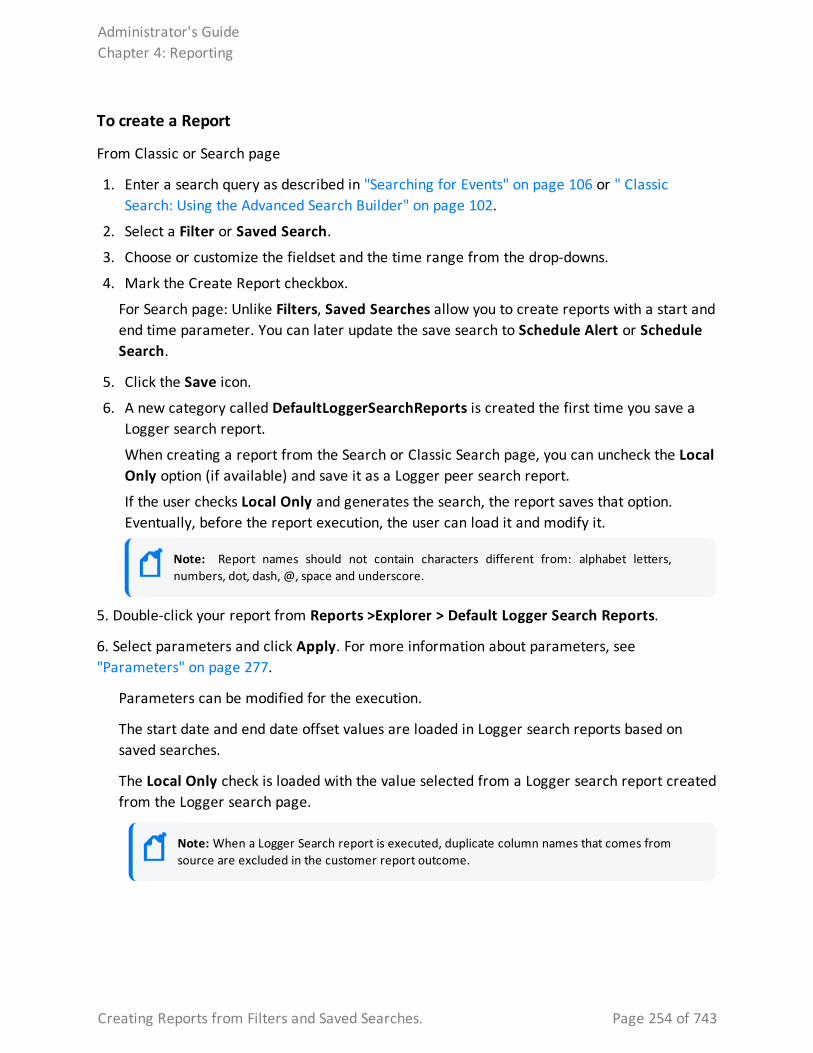
To create a Report
From Classic or Search page
1. Enter a search query as described in "Searching for Events" on page 106 or " Classic Search: Using the Advanced Search Builder" on page 102.
2. Select a Filter or Saved Search.
3. Choose or customize the fieldset and the time range from the drop-downs.
4. Mark the Create Report checkbox.
For Search page: Unlike Filters, Saved Searches allow you to create reports with a start and end time parameter. You can later update the save search to Schedule Alert or Schedule Search.
5. Click the Save icon.
6. A new category called DefaultLoggerSearchReports is created the first time you save a Logger search report.
When creating a report from the Search or Classic Search page, you can uncheck the Local Only option (if available) and save it as a Logger peer search report.
If the user checks Local Only and generates the search, the report saves that option. Eventually, before the report execution, the user can load it and modify it.
Note: Report names should not contain characters different from: alphabet letters, numbers, dot, dash, @, space and underscore.
5. Double-click your report from Reports >Explorer > Default Logger Search Reports.
6. Select parameters and click Apply. For more information about parameters, see "Parameters" on page 277.
Parameters can be modified for the execution.
The start date and end date offset values are loaded in Logger search reports based on saved searches.
The Local Only check is loaded with the value selected from a Logger search report created from the Logger search page.
Note: When a Logger Search report is executed, duplicate column names that comes from source are excluded in the customer report outcome.
Administrator's GuideChapter 4: Reporting
Creating Reports from Filters and Saved Searches. Page 254 of 743
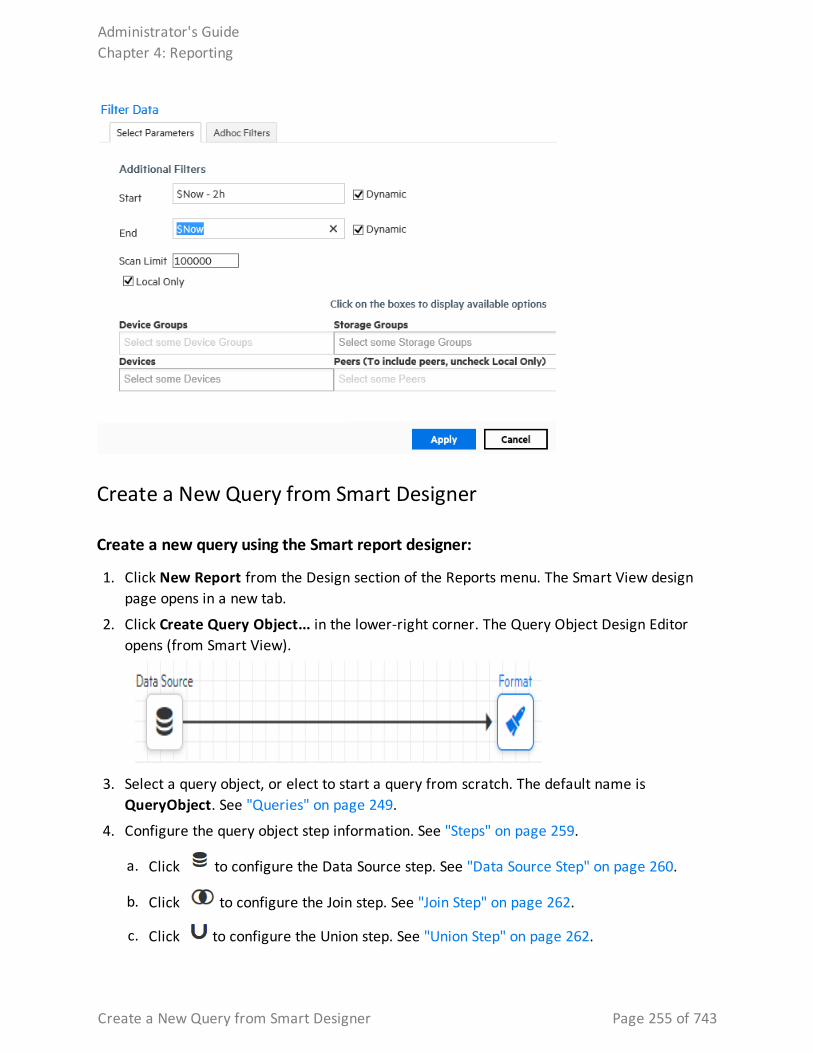
Create a New Query from Smart Designer
Create a new query using the Smart report designer:
1. Click New Report from the Design section of the Reports menu. The Smart View design page opens in a new tab.
2. Click Create Query Object... in the lower-right corner. The Query Object Design Editor opens (from Smart View).
3. Select a query object, or elect to start a query from scratch. The default name is QueryObject. See "Queries" on page 249.
4. Configure the query object step information. See "Steps" on page 259.
a. Click to configure the Data Source step. See "Data Source Step" on page 260.
b. Click to configure the Join step. See "Join Step" on page 262.
c. Click to configure the Union step. See "Union Step" on page 262.
Administrator's GuideChapter 4: Reporting
Create a New Query from Smart Designer Page 255 of 743
d. Click to configure the Filter step. See "Filter Step" on page 263.
e. Click to configure the Sort step. See "Sort Step" on page 263.
f. Click to configure the Formula Fields step. See "Formula Fields Step" on page 263.
g. Click to configure the Dynamic Fields step. See "Dynamic Fields Step" on page 264.
h. Click to configure the External Task step. See "External Task Step" on page 265.
i. Click to configure the GIS Lookup. See " Geolocation Lookup " on page 266
j. Click to configure the Format step. See "Format Step" on page 265.
5. Click the Parameter tab to configure parameters for the query. See "Parameters" on page 277.
6. Optionally, click the Parameter Value Groups tab to configure parameter values for the query. See "Parameter Value Groups" on page 285.
7. Save the query, as necessary.
8. When you are satisfied with your new query, click Apply and Close, in the upper-right.
Designing a New QueryA query object represents a data transformation, which comprises a set of steps (elements) to produce the final output. A step can be a data source, a sort, a filter, an output, or other element. You design a query interactively using the Query Object Editor.
Procedure
1. From the Design section of the Reports menu, click Queries.
The Query Object Editor opens.
The Query Object Editor is shown here. Highlighted are the Steps list and the Transformation workspace.
To create a transformation, you drag query elements (steps) from the Steps list to the Transformation workspace, linking them in the sequence in which they will be evaluated. Then, you specify properties for each Step.
Working with StepsHere are some of the ways you can use Steps.
Administrator's GuideChapter 4: Reporting
Designing a New Query Page 256 of 743
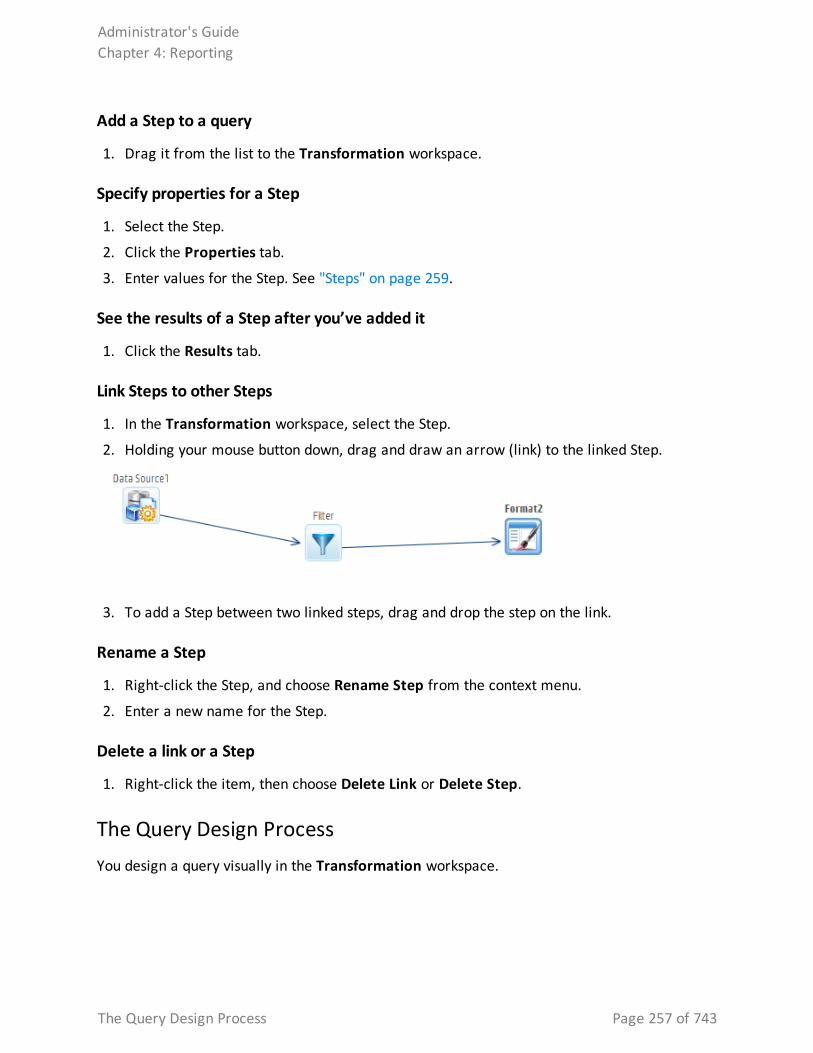
Add a Step to a query
1. Drag it from the list to the Transformation workspace.
Specify properties for a Step
1. Select the Step.
2. Click the Properties tab.
3. Enter values for the Step. See "Steps" on page 259.
See the results of a Step after you’ve added it
1. Click the Results tab.
Link Steps to other Steps
1. In the Transformation workspace, select the Step.
2. Holding your mouse button down, drag and draw an arrow (link) to the linked Step.
3. To add a Step between two linked steps, drag and drop the step on the link.
Rename a Step
1. Right-click the Step, and choose Rename Step from the context menu.
2. Enter a new name for the Step.
Delete a link or a Step
1. Right-click the item, then choose Delete Link or Delete Step.
The Query Design ProcessYou design a query visually in the Transformation workspace.
Administrator's GuideChapter 4: Reporting
The Query Design Process Page 257 of 743
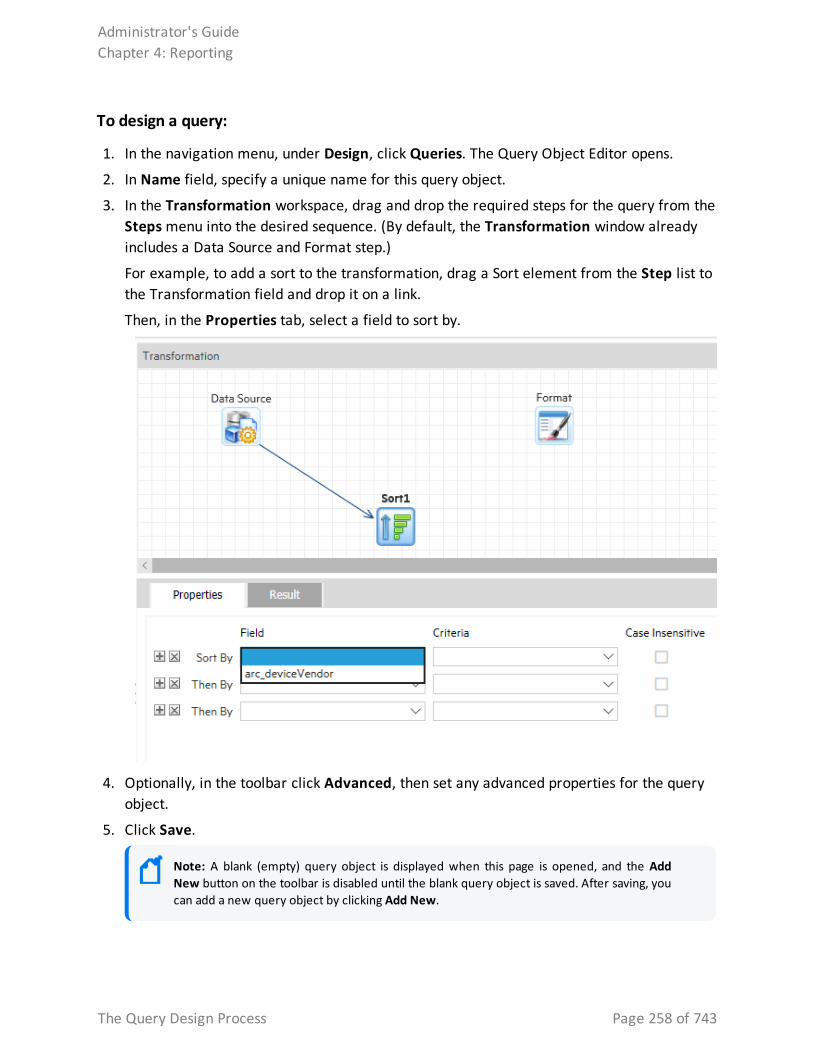
To design a query:
1. In the navigation menu, under Design, click Queries. The Query Object Editor opens.
2. In Name field, specify a unique name for this query object.
3. In the Transformation workspace, drag and drop the required steps for the query from the Steps menu into the desired sequence. (By default, the Transformation window already includes a Data Source and Format step.)
For example, to add a sort to the transformation, drag a Sort element from the Step list to the Transformation field and drop it on a link.
Then, in the Properties tab, select a field to sort by.
4. Optionally, in the toolbar click Advanced, then set any advanced properties for the query object.
5. Click Save.
Note: A blank (empty) query object is displayed when this page is opened, and the Add New button on the toolbar is disabled until the blank query object is saved. After saving, you can add a new query object by clicking Add New.
Administrator's GuideChapter 4: Reporting
The Query Design Process Page 258 of 743
StepsA step is an element of a transformation, used in the construction of query objects. To use a step, drag it from the Steps menu to the Transformation window. The behavior of a step depends on the properties you assign to it on the Properties tab. You can check the results of a step on the data on the step’s Result tab.
The following steps are available for use in the Query Object Editor:
Step Description
Data Source Brings data into the query object. You must have at least 1 data source. For more information, see "Data Source Step" on the next page.
JoinJoins two inputs. For more information, see "Join Step" on page 262.
Union Appends one input to another. For more information, see "Union Step" on page 262.
Filter Applies pre-defined filters and sets lookup values. For more information, see "Filter Step" on page 263.
SortSets sorting criteria. For more information, see "Sort Step" on page 263.
Formula Fields
Enables addition of calculated fields populated at runtime. For more information, see "Formula Fields Step" on page 263.
Dynamic Fields
Add or remove fields to the query object at runtime. For more information, see "Dynamic Fields Step" on page 264.
External TaskCall standard and custom 3rd party procedures. For more information, see "External Task Step" on page 265.
GIS LookupAllows the user to search for a particular event based on its Geo-location. For more information, see " Geolocation Lookup " on page 266
FormatLists all fields provided by the query object. Generally, the format step is the last one in the transformation work flow. For more information, see "Format Step" on page 265.
Data Science Brings data from the Logger database or an existing query object into the query object. For more information, see "Data Source Step" on the next page.
Steps
Administrator's GuideChapter 4: Reporting
Steps Page 259 of 743
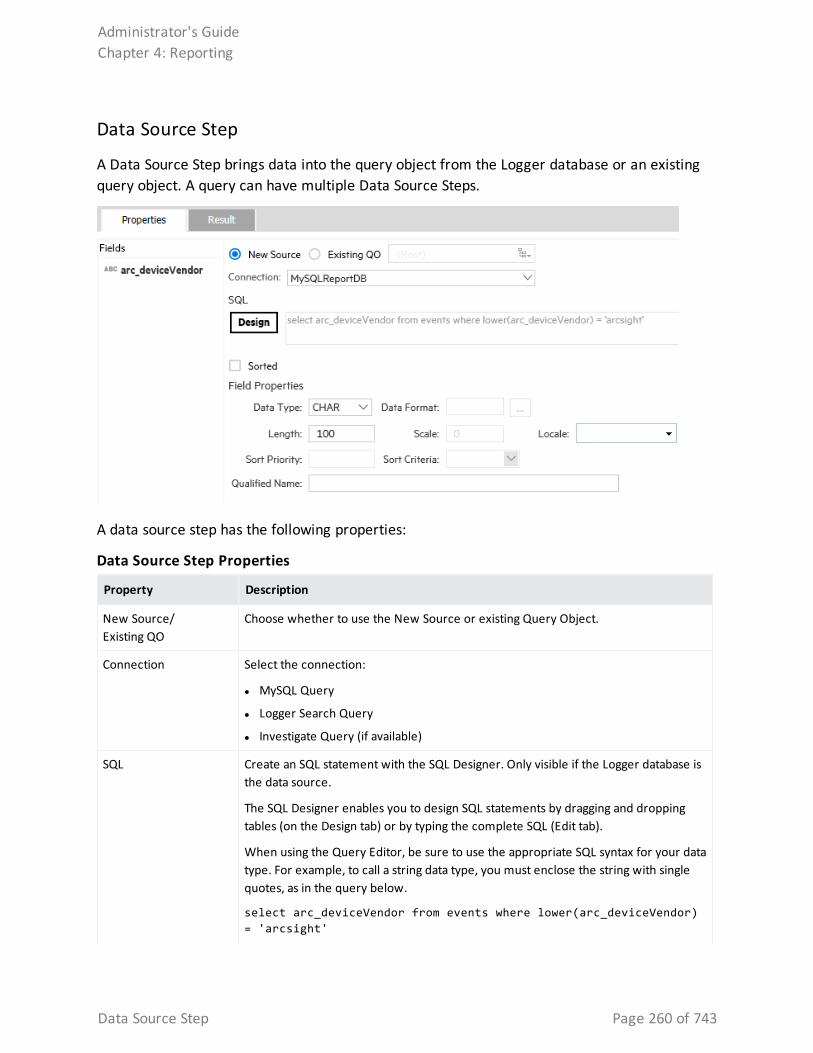
Data Source Step
A Data Source Step brings data into the query object from the Logger database or an existing query object. A query can have multiple Data Source Steps.
A data source step has the following properties:
Property Description
New Source/Existing QO
Choose whether to use the New Source or existing Query Object.
Connection Select the connection:
l MySQL Query
l Logger Search Query
l Investigate Query (if available)
SQL Create an SQL statement with the SQL Designer. Only visible if the Logger database is the data source.
The SQL Designer enables you to design SQL statements by dragging and dropping tables (on the Design tab) or by typing the complete SQL (Edit tab).
When using the Query Editor, be sure to use the appropriate SQL syntax for your data type. For example, to call a string data type, you must enclose the string with single quotes, as in the query below.
select arc_deviceVendor from events where lower(arc_deviceVendor) = 'arcsight'
Data Source Step Properties
Administrator's GuideChapter 4: Reporting
Data Source Step Page 260 of 743
Property Description
Logger Search Query Create a Filter or Saved Search Query.
Logger Search Query enables you to design a query by clicking any Filter (Shared or System Filter) or Saved Search previously stored in Logger.
Select Fieldset Select All Fields or choose the specific fields by clicking the drop down.
Parameters Parameter sub-menu allows to set a start and end time depending on the search time type (based on event time or receipt time).
Sorted If selected, the data is sorted.
Field Properties The Field Properties sub-menu (when enabled) allows you to configure the properties of the selected field. See the "Field Properties Sub-menu" below for a description of these properties.
Data Source Step Properties, continued
Field Properties Sub-menu
Property Values Comments
Data Type CHAR, NUMBER, DATE, BINARY Select the data type of the incoming data.
Data Format Format String Specify the format of the incoming data. This is useful only if the Date or IP Address type data are incoming in CHAR fields, but need to be converted to Date and Number types for further use.
Database Time Zone
Select Time zone from the list Specify the time zone in which the incoming date data is stored. This is useful only if date time data needs to be converted to other time zone data based on reporting requirement.
For example when incoming GMT data should be converted to another time zone in the report, specify that the incoming data is GMT. The output format is generally specified in the Format Step or in user preferences.
Length/Precision Enter Enter the length of field for Char data types, and the precision or length of field for the Number data type.
Scale Enter Enter the Scale or number of digits after the decimal point.
Locale Select from menu Select the language/ country in which the incoming date data is stored.
Administrator's GuideChapter 4: Reporting
Data Source Step Page 261 of 743
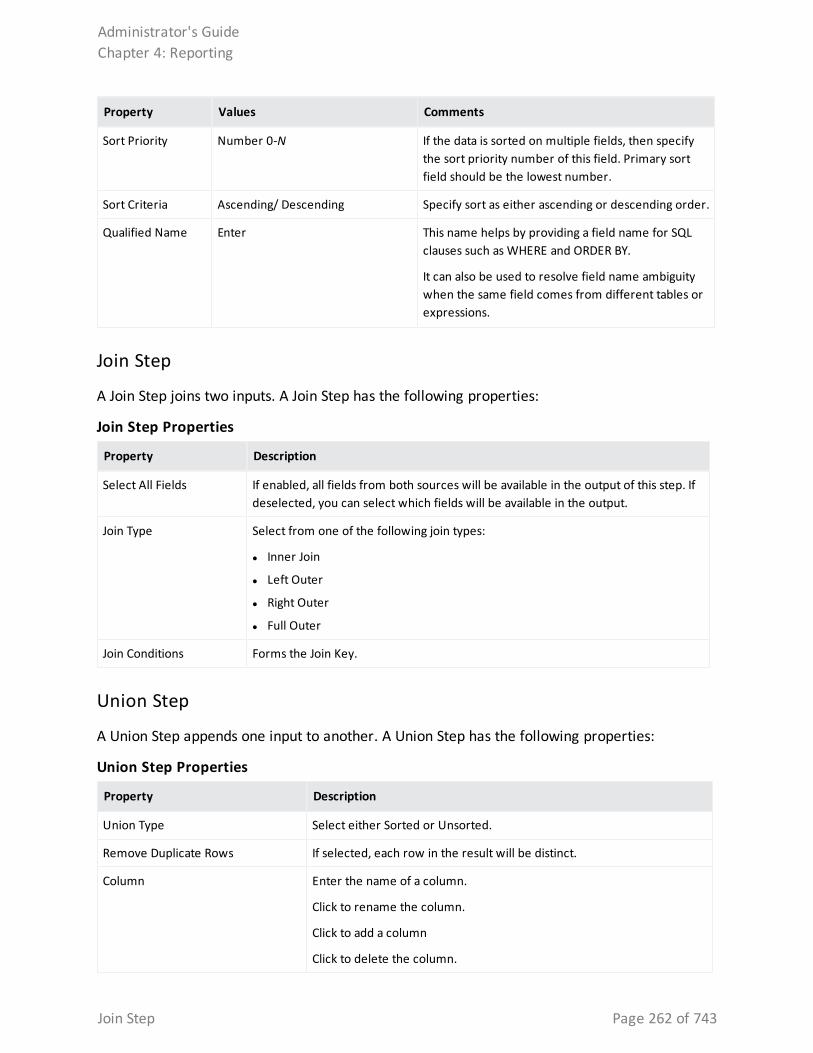
Property Values Comments
Sort Priority Number 0-N If the data is sorted on multiple fields, then specify the sort priority number of this field. Primary sort field should be the lowest number.
Sort Criteria Ascending/ Descending Specify sort as either ascending or descending order.
Qualified Name Enter This name helps by providing a field name for SQL clauses such as WHERE and ORDER BY.
It can also be used to resolve field name ambiguity when the same field comes from different tables or expressions.
Join Step
A Join Step joins two inputs. A Join Step has the following properties:
Property Description
Select All Fields If enabled, all fields from both sources will be available in the output of this step. If deselected, you can select which fields will be available in the output.
Join Type Select from one of the following join types:
l Inner Join
l Left Outer
l Right Outer
l Full Outer
Join Conditions Forms the Join Key.
Join Step Properties
Union Step
A Union Step appends one input to another. A Union Step has the following properties:
Property Description
Union Type Select either Sorted or Unsorted.
Remove Duplicate Rows If selected, each row in the result will be distinct.
Column Enter the name of a column.
Click to rename the column.
Click to add a column
Click to delete the column.
Union Step Properties
Administrator's GuideChapter 4: Reporting
Join Step Page 262 of 743
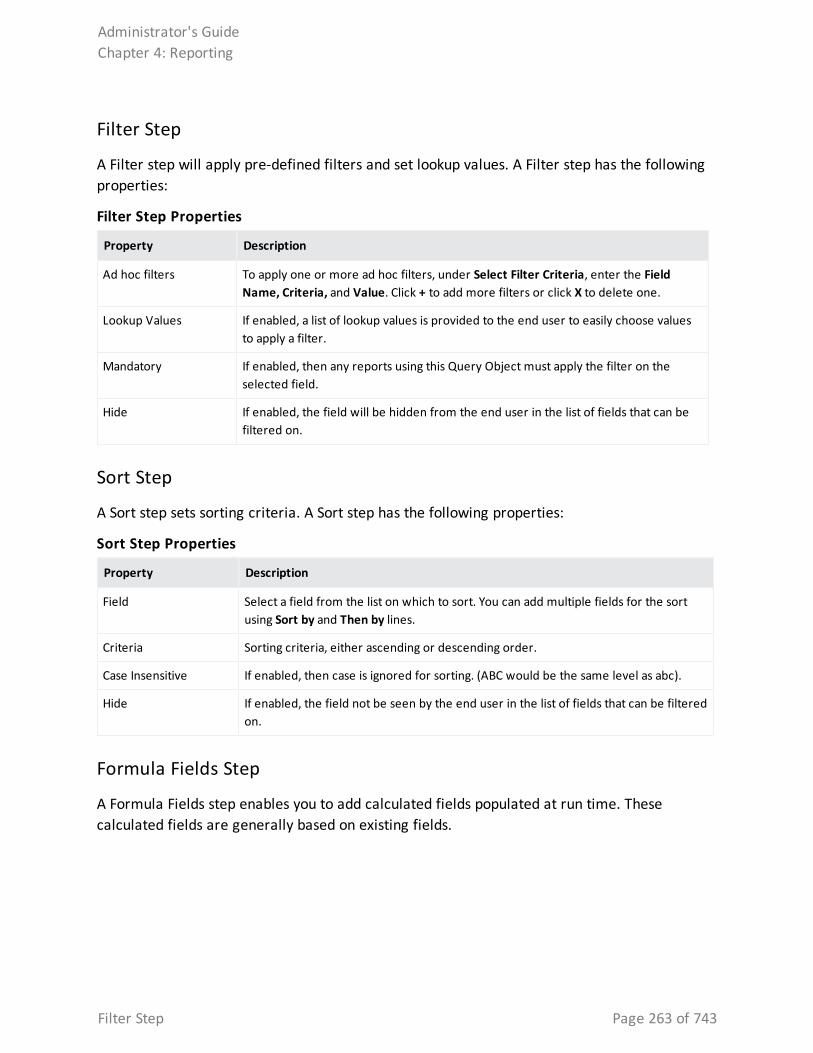
Filter Step
A Filter step will apply pre-defined filters and set lookup values. A Filter step has the following properties:
Property Description
Ad hoc filters To apply one or more ad hoc filters, under Select Filter Criteria, enter the Field Name, Criteria, and Value. Click + to add more filters or click X to delete one.
Lookup Values If enabled, a list of lookup values is provided to the end user to easily choose values to apply a filter.
Mandatory If enabled, then any reports using this Query Object must apply the filter on the selected field.
Hide If enabled, the field will be hidden from the end user in the list of fields that can be filtered on.
Filter Step Properties
Sort Step
A Sort step sets sorting criteria. A Sort step has the following properties:
Property Description
Field Select a field from the list on which to sort. You can add multiple fields for the sort using Sort by and Then by lines.
Criteria Sorting criteria, either ascending or descending order.
Case Insensitive If enabled, then case is ignored for sorting. (ABC would be the same level as abc).
Hide If enabled, the field not be seen by the end user in the list of fields that can be filtered on.
Sort Step Properties
Formula Fields Step
A Formula Fields step enables you to add calculated fields populated at run time. These calculated fields are generally based on existing fields.
Administrator's GuideChapter 4: Reporting
Filter Step Page 263 of 743
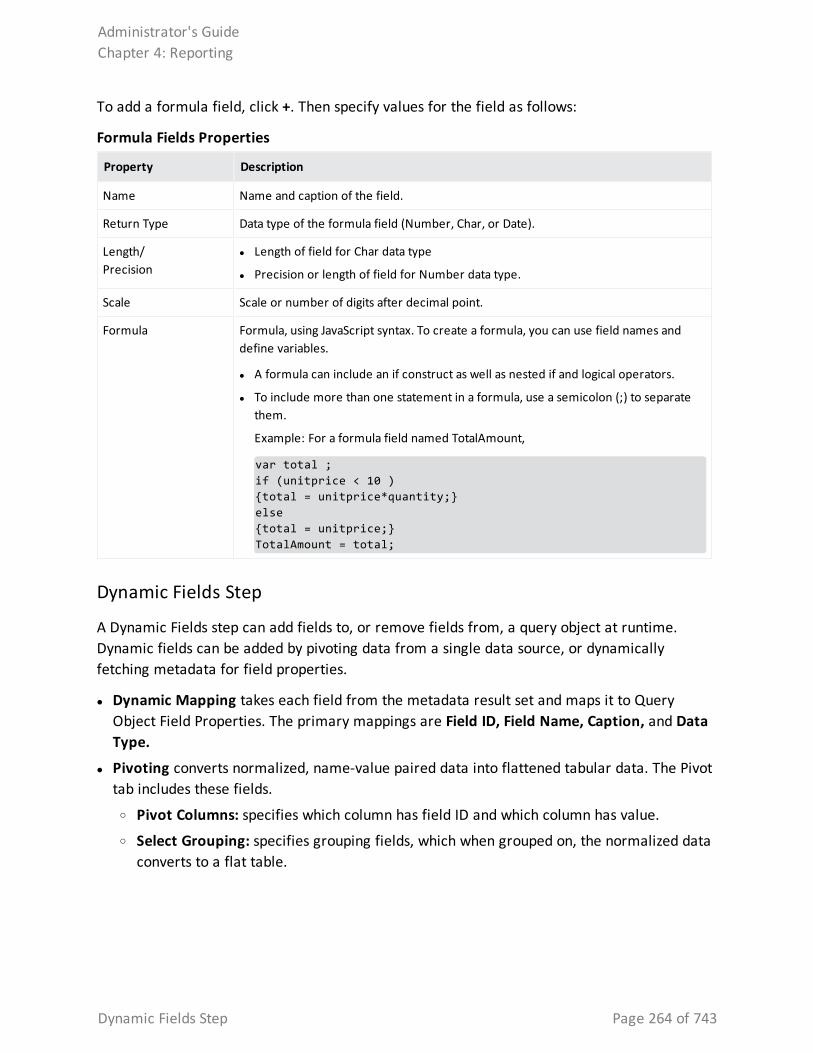
To add a formula field, click +. Then specify values for the field as follows:
Property Description
Name Name and caption of the field.
Return Type Data type of the formula field (Number, Char, or Date).
Length/Precision
l Length of field for Char data type
l Precision or length of field for Number data type.
Scale Scale or number of digits after decimal point.
Formula Formula, using JavaScript syntax. To create a formula, you can use field names and define variables.
l A formula can include an if construct as well as nested if and logical operators.
l To include more than one statement in a formula, use a semicolon (;) to separate them.
Example: For a formula field named TotalAmount,
var total ; if (unitprice < 10 ) {total = unitprice*quantity;} else {total = unitprice;} TotalAmount = total;
Formula Fields Properties
Dynamic Fields Step
A Dynamic Fields step can add fields to, or remove fields from, a query object at runtime. Dynamic fields can be added by pivoting data from a single data source, or dynamically fetching metadata for field properties.
l Dynamic Mapping takes each field from the metadata result set and maps it to Query Object Field Properties. The primary mappings are Field ID, Field Name, Caption, and Data Type.
l Pivoting converts normalized, name-value paired data into flattened tabular data. The Pivot tab includes these fields.
o Pivot Columns: specifies which column has field ID and which column has value.
o Select Grouping: specifies grouping fields, which when grouped on, the normalized data converts to a flat table.
Administrator's GuideChapter 4: Reporting
Dynamic Fields Step Page 264 of 743
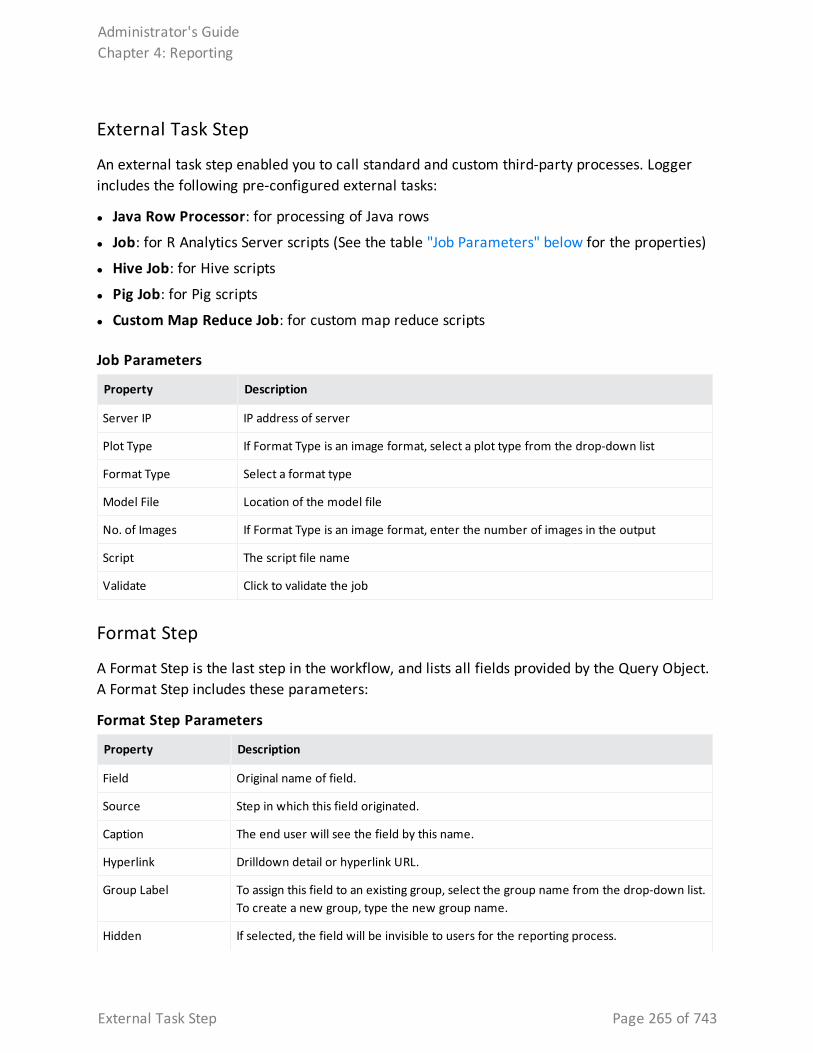
External Task Step
An external task step enabled you to call standard and custom third-party processes. Logger includes the following pre-configured external tasks:
l Java Row Processor: for processing of Java rows
l Job: for R Analytics Server scripts (See the table "Job Parameters" below for the properties)
l Hive Job: for Hive scripts
l Pig Job: for Pig scripts
l Custom Map Reduce Job: for custom map reduce scripts
Property Description
Server IP IP address of server
Plot Type If Format Type is an image format, select a plot type from the drop-down list
Format Type Select a format type
Model File Location of the model file
No. of Images If Format Type is an image format, enter the number of images in the output
Script The script file name
Validate Click to validate the job
Job Parameters
Format Step
A Format Step is the last step in the workflow, and lists all fields provided by the Query Object. A Format Step includes these parameters:
Property Description
Field Original name of field.
Source Step in which this field originated.
Caption The end user will see the field by this name.
Hyperlink Drilldown detail or hyperlink URL.
Group Label To assign this field to an existing group, select the group name from the drop-down list. To create a new group, type the new group name.
Hidden If selected, the field will be invisible to users for the reporting process.
Format Step Parameters
Administrator's GuideChapter 4: Reporting
External Task Step Page 265 of 743
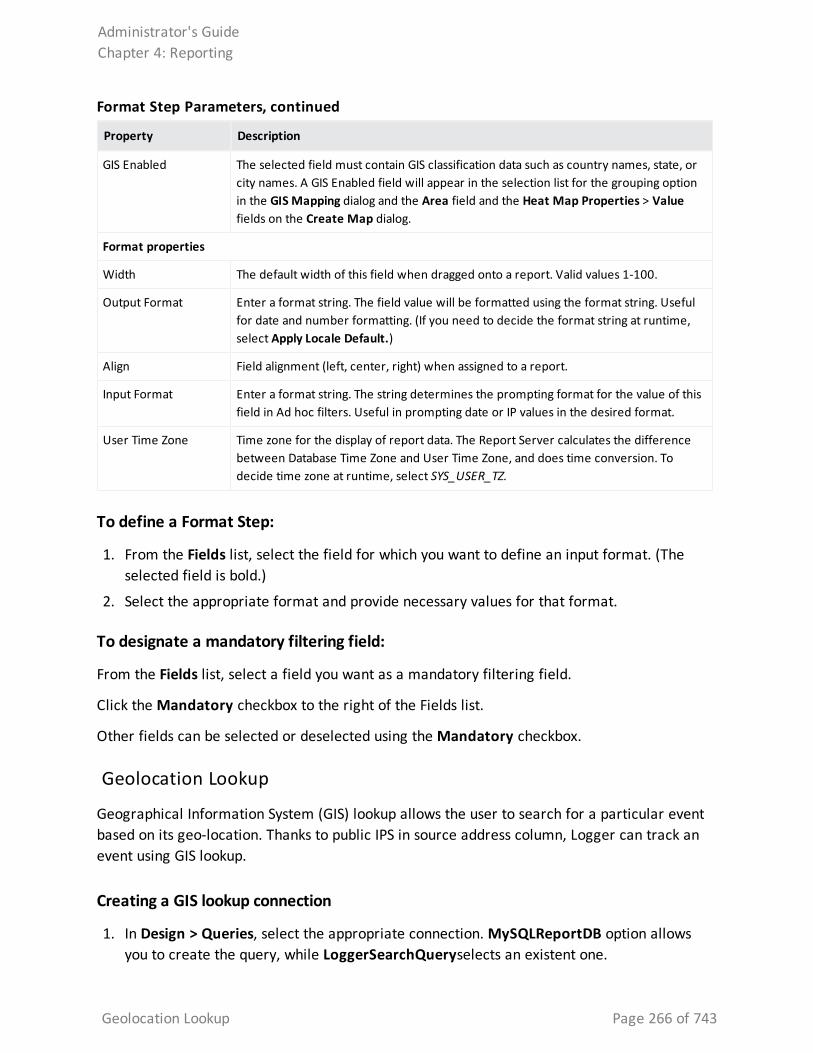
Property Description
GIS Enabled The selected field must contain GIS classification data such as country names, state, or city names. A GIS Enabled field will appear in the selection list for the grouping option in the GIS Mapping dialog and the Area field and the Heat Map Properties > Value fields on the Create Map dialog.
Format properties
Width The default width of this field when dragged onto a report. Valid values 1-100.
Output Format Enter a format string. The field value will be formatted using the format string. Useful for date and number formatting. (If you need to decide the format string at runtime, select Apply Locale Default.)
Align Field alignment (left, center, right) when assigned to a report.
Input Format Enter a format string. The string determines the prompting format for the value of this field in Ad hoc filters. Useful in prompting date or IP values in the desired format.
User Time Zone Time zone for the display of report data. The Report Server calculates the difference between Database Time Zone and User Time Zone, and does time conversion. To decide time zone at runtime, select SYS_USER_TZ.
Format Step Parameters, continued
To define a Format Step:
1. From the Fields list, select the field for which you want to define an input format. (The selected field is bold.)
2. Select the appropriate format and provide necessary values for that format.
To designate a mandatory filtering field:
From the Fields list, select a field you want as a mandatory filtering field.
Click the Mandatory checkbox to the right of the Fields list.
Other fields can be selected or deselected using the Mandatory checkbox.
Geolocation Lookup
Geographical Information System (GIS) lookup allows the user to search for a particular event based on its geo-location. Thanks to public IPS in source address column, Logger can track an event using GIS lookup.
Creating a GIS lookup connection
1. In Design > Queries, select the appropriate connection. MySQLReportDB option allows you to create the query, while LoggerSearchQueryselects an existent one.
Administrator's GuideChapter 4: Reporting
Geolocation Lookup Page 266 of 743
2. Click Design >Category, select GIS filter. Click Result and then OK.
3. Drag the GIS lookup to the diagram and change the connection to MaxMindLookup.
4. Select a field in the lookup fields.
5. Type the parameter on each lookup field. As you type a word in the value field, the options will auto- populate or appear as drop down.
6. Type [/] on the request path field to eventually click get patterns so a new window will display in which you can select the additional columns that will appear in the results page.
7. Click get patterns to search for all possible record patterns. Choose an specific field from the list to perform a search.
Specifying the Geographical role.
From the format icon, modify the following property value fields for this process:
l Caption: Name the fields list during the report design stage.
l Hyperlink: Add a link for a web page or cross- reference another report.
l Group Label: To create a new group, type the name as appropriate. Otherwise, select an existing group from the drop down list.
l Hidden: To make this field unable to be seen during the reporting process, check the correspondent box.
l Geographic Role: Select the corresponding geographical roles that are automatically populated: o Continent
o Country
o State
o County
o City
o Latitude
o Longitude
l GIS Format: Pick between signed degrees format, degrees minutes, and degrees only. This applies for both geographic role: latitude and longitude.
l Width: Define the report width from a range of 1 to 100.
l Output format: The format string is used to configure Date and Number. To select the format string at run time, select Apply Locale Default in the selector dialog.
l Input format: This format string decides the prompting format for the field value in Ad hoc Filter screen. This is useful when prompting date values in a desired format or to input IP Address format for number values.
Administrator's GuideChapter 4: Reporting
Geolocation Lookup Page 267 of 743
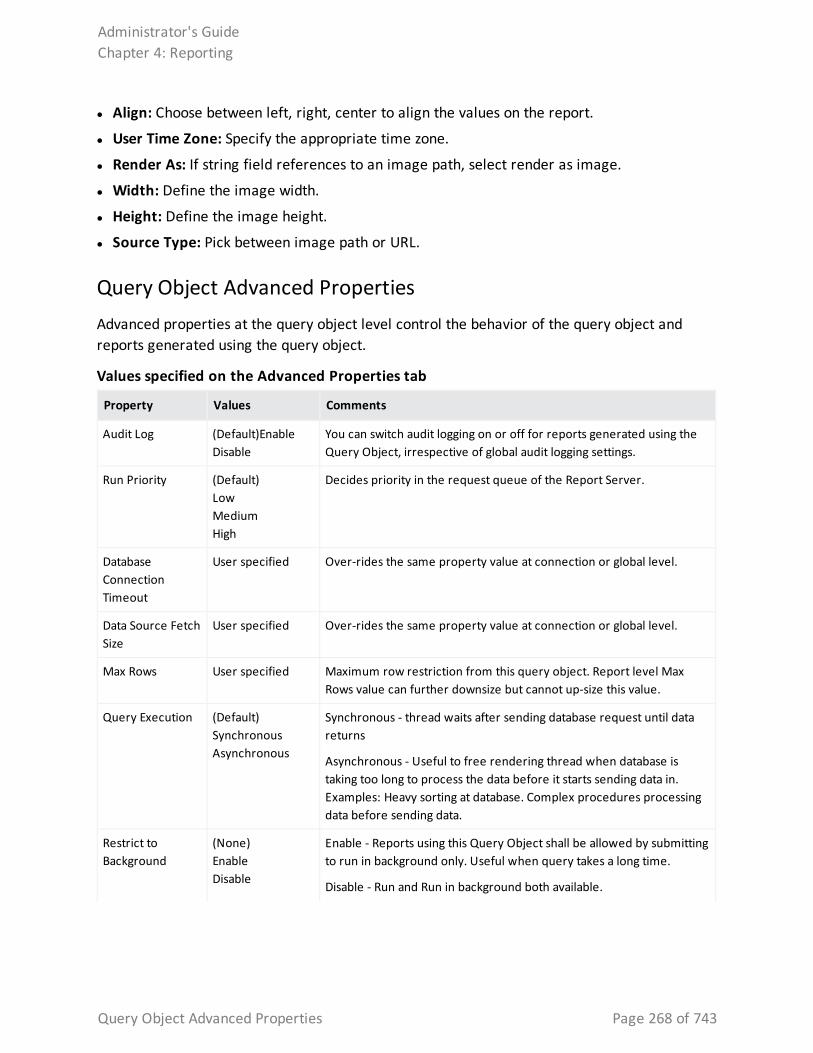
l Align: Choose between left, right, center to align the values on the report.
l User Time Zone: Specify the appropriate time zone.
l Render As: If string field references to an image path, select render as image.
l Width: Define the image width.
l Height: Define the image height.
l Source Type: Pick between image path or URL.
Query Object Advanced PropertiesAdvanced properties at the query object level control the behavior of the query object and reports generated using the query object.
Property Values Comments
Audit Log (Default)EnableDisable
You can switch audit logging on or off for reports generated using the Query Object, irrespective of global audit logging settings.
Run Priority (Default)LowMediumHigh
Decides priority in the request queue of the Report Server.
Database Connection Timeout
User specified Over-rides the same property value at connection or global level.
Data Source Fetch Size
User specified Over-rides the same property value at connection or global level.
Max Rows User specified Maximum row restriction from this query object. Report level Max Rows value can further downsize but cannot up-size this value.
Query Execution (Default)SynchronousAsynchronous
Synchronous - thread waits after sending database request until data returns
Asynchronous - Useful to free rendering thread when database is taking too long to process the data before it starts sending data in. Examples: Heavy sorting at database. Complex procedures processing data before sending data.
Restrict to Background
(None)EnableDisable
Enable - Reports using this Query Object shall be allowed by submitting to run in background only. Useful when query takes a long time.
Disable - Run and Run in background both available.
Values specified on the Advanced Properties tab
Administrator's GuideChapter 4: Reporting
Query Object Advanced Properties Page 268 of 743
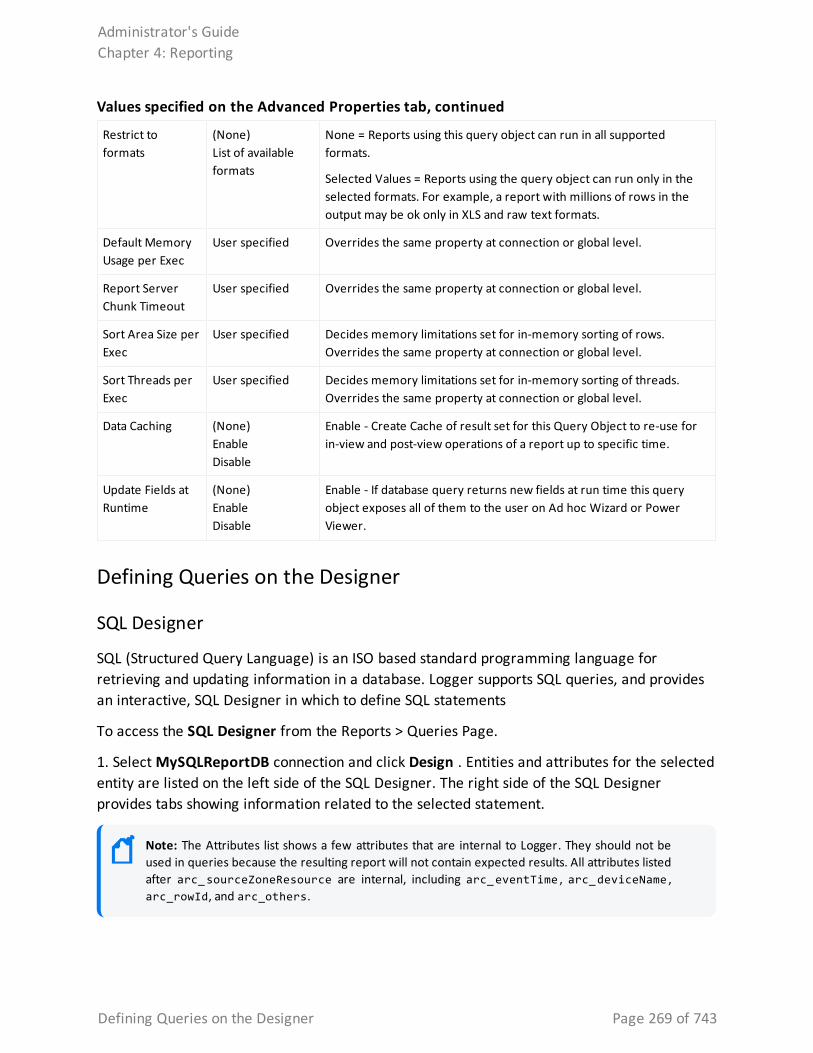
Restrict to formats
(None)List of available formats
None = Reports using this query object can run in all supported formats.
Selected Values = Reports using the query object can run only in the selected formats. For example, a report with millions of rows in the output may be ok only in XLS and raw text formats.
Default Memory Usage per Exec
User specified Overrides the same property at connection or global level.
Report Server Chunk Timeout
User specified Overrides the same property at connection or global level.
Sort Area Size per Exec
User specified Decides memory limitations set for in-memory sorting of rows. Overrides the same property at connection or global level.
Sort Threads per Exec
User specified Decides memory limitations set for in-memory sorting of threads. Overrides the same property at connection or global level.
Data Caching (None)EnableDisable
Enable - Create Cache of result set for this Query Object to re-use for in-view and post-view operations of a report up to specific time.
Update Fields at Runtime
(None)EnableDisable
Enable - If database query returns new fields at run time this query object exposes all of them to the user on Ad hoc Wizard or Power Viewer.
Values specified on the Advanced Properties tab, continued
Defining Queries on the Designer
SQL Designer
SQL (Structured Query Language) is an ISO based standard programming language for retrieving and updating information in a database. Logger supports SQL queries, and provides an interactive, SQL Designer in which to define SQL statements
To access the SQL Designer from the Reports > Queries Page.
1. Select MySQLReportDB connection and click Design . Entities and attributes for the selected entity are listed on the left side of the SQL Designer. The right side of the SQL Designer provides tabs showing information related to the selected statement.
Note: The Attributes list shows a few attributes that are internal to Logger. They should not be used in queries because the resulting report will not contain expected results. All attributes listed after arc_sourceZoneResource are internal, including arc_eventTime , arc_deviceName , arc_rowId, and arc_others.
Administrator's GuideChapter 4: Reporting
Defining Queries on the Designer Page 269 of 743
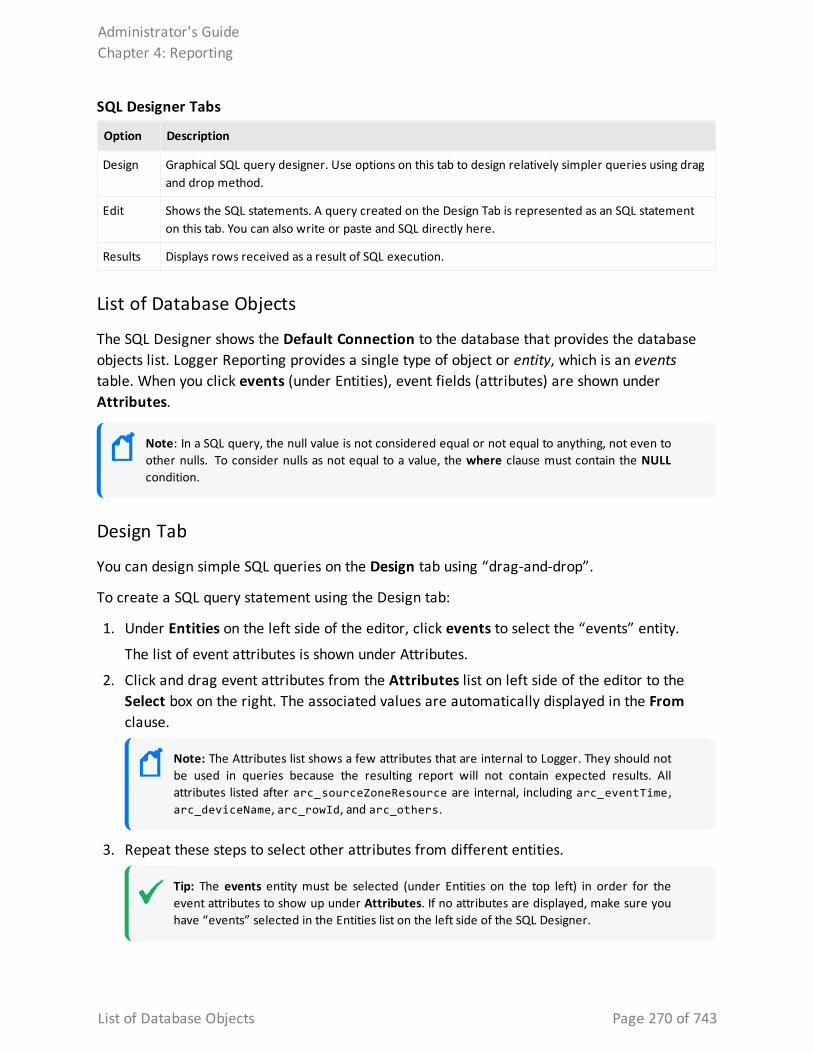
Option Description
Design Graphical SQL query designer. Use options on this tab to design relatively simpler queries using drag and drop method.
Edit Shows the SQL statements. A query created on the Design Tab is represented as an SQL statement on this tab. You can also write or paste and SQL directly here.
Results Displays rows received as a result of SQL execution.
SQL Designer Tabs
List of Database Objects
The SQL Designer shows the Default Connection to the database that provides the database objects list. Logger Reporting provides a single type of object or entity, which is an events table. When you click events (under Entities), event fields (attributes) are shown under Attributes.
Note: In a SQL query, the null value is not considered equal or not equal to anything, not even to other nulls. To consider nulls as not equal to a value, the where clause must contain the NULL condition.
Design Tab
You can design simple SQL queries on the Design tab using “drag-and-drop”.
To create a SQL query statement using the Design tab:
1. Under Entities on the left side of the editor, click events to select the “events” entity.
The list of event attributes is shown under Attributes.
2. Click and drag event attributes from the Attributes list on left side of the editor to the Select box on the right. The associated values are automatically displayed in the From clause.
Note: The Attributes list shows a few attributes that are internal to Logger. They should not be used in queries because the resulting report will not contain expected results. All attributes listed after arc_sourceZoneResource are internal, including arc_eventTime , arc_deviceName, arc_rowId, and arc_others.
3. Repeat these steps to select other attributes from different entities.
Tip: The events entity must be selected (under Entities on the top left) in order for the event attributes to show up under Attributes. If no attributes are displayed, make sure you have “events” selected in the Entities list on the left side of the SQL Designer.
Administrator's GuideChapter 4: Reporting
List of Database Objects Page 270 of 743
Select
The Select box shows the attributes selected for a given entity.
Where
The Where area shows the “where” clause for the query.
l To add a row at the top, click (Insert first condition) in the left-most cell of column header.
l To add a row below the current row, click (Add a condition) in the row below which you want to add a row for condition. A row in inserted in the row below the respective row.
l To remove a condition, click (Remove this condition) in the row for the condition you want to remove.
l To specify a where clause, form a condition by selecting Operand1, Operand2 and Operator.
l To join conditions, create two conditions, and select a relation in the right-most column of the first condition (of the two being joined).
l To group conditions, specify opening brace and closing brace in the right row.
Group By
In the Group By clause you can provide grouping criteria for the SQL statement. To place an entity in Group By, click the entity in the Entity List and drag it in the box below Group By.
Having
To build a “Having” clause, use the same settings as described in the “Where” clause.
Note: Be sure to include appropriate summary function in “Select” clause so that it can be used in the “Having” clause.
Administrator's GuideChapter 4: Reporting
Select Page 271 of 743
Order By
In the Order By clause you can provide sorting (ascending/ descending) criteria for the SQL statement. For a report with grouping, the “Order By” clause must have the columns in the same order as the respective sections in the Layout Editor.
Caution: An order-by report query that involves millions of events can fail to run and display the following error messages: “The server is too busy, try again later”.
Therefore, Micro Focus Recommends that you follow these best practices:
l Use the ‘scan limit’ parameter to limit the number of events that will be scanned.
l Rewrite the report query to group by name or group by time to reduce the granularity of events scanned.
Edit Tab
When you switch from the Design tab to Edit tab, the SQL in the Design tab is constructed and displayed as a complete SQL statement in the Edit tab. You can use the Edit tab to view and write more complex SQL statements that cannot be defined in the Design tab.
SQL Designer: Edit Tab
Relationship of Edit and Design Tabs
The SQL Designer manages the SQL statement being constructed to prevent a complex query (defined in the Edit tab) from being unintentionally overwritten with changes made subsequently on the Design tab.
If you first enter a complex query on the Edit tab, then click back to the Design tab and make changes there, then click the Edit tab again. A dialog prompts whether you want to overwrite the original statement on the Edit tab with the changes you made on the Design tab.
l If you click OK, your changes in the Edit tab are overwritten, because the SQL in the Design tab will be reconstructed.
l If you click Cancel, the SQL in the Edit tab remains intact and is used as the final SQL.
The SQL statement as reflected in the Edit tab will be used as the final SQL for compilation.
Administrator's GuideChapter 4: Reporting
Order By Page 272 of 743
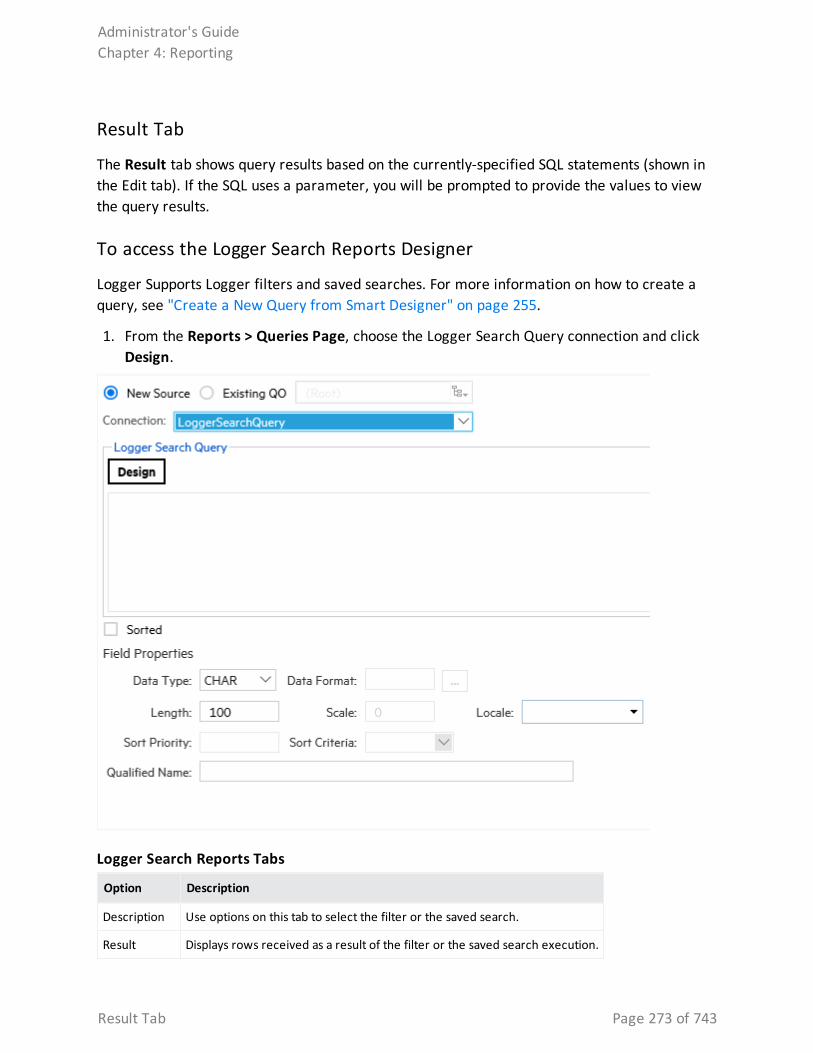
Result Tab
The Result tab shows query results based on the currently-specified SQL statements (shown in the Edit tab). If the SQL uses a parameter, you will be prompted to provide the values to view the query results.
To access the Logger Search Reports Designer
Logger Supports Logger filters and saved searches. For more information on how to create a query, see "Create a New Query from Smart Designer" on page 255.
1. From the Reports > Queries Page, choose the Logger Search Query connection and click Design.
Option Description
Description Use options on this tab to select the filter or the saved search.
Result Displays rows received as a result of the filter or the saved search execution.
Logger Search Reports Tabs
Administrator's GuideChapter 4: Reporting
Result Tab Page 273 of 743
2. The list of fields that will include your report is displayed. Select the fieldset from the drop-down on the Logger Search Designer. You may also select either a filter or a saved search for the report. For more information, see "Filters" on page 314 and "Saved Searches" on page 318.
3. Click Ok.
Note: Time range selection is displayed for Saved Searches.
Data Science Engine Step at Query Object Level Data Science Engine enables you to perform predictive analysis by allowing adding additional variables and columns to reports for further scrutiny. Query object permits extracting the data from different datasources and transform it to either load or use in reporting.
Caution: By default, Data Science is disabled (set as false). To enable this functionality, go to the logger.properties file and set to true the reports.data.science.component.enable property. Manually add the property if required. Restart the ReportEngine and Web processes afterwards.
Adding Data Science Engine step
Data Science Engine step functionality behaves similar to other transformation steps within reports. It needs to be dragged and dropped from the left pane in the transformation area and create the necessary links. Data Science Engine step can be incorporated before or after adding any other transformation step.
This functionality can be used not only for training but also in prediction data using both independent ( fields that estimate the value of dependent values) and dependent variables when the following conditions are met:
l Specific data for training and prediction has been added. Otherwise, the same data will be used for the 2 processes.
l Training data is added if no trained model is available in the script.
Adding Data Science Engine script
You can write data science scripts using Python. Logger suggests to create these scripts similarly at a query object level to display training and prediction options only at the time of report execution.
Caution: If CentOS/RHELLinux version 8.1 is used in Software Logger, make sure to install the Python 2.7.1 using the command: yum install python2 and enable the data science. Restart the Logger processes afterwards.
Administrator's GuideChapter 4: Reporting
Data Science Engine Step at Query Object Level Page 274 of 743
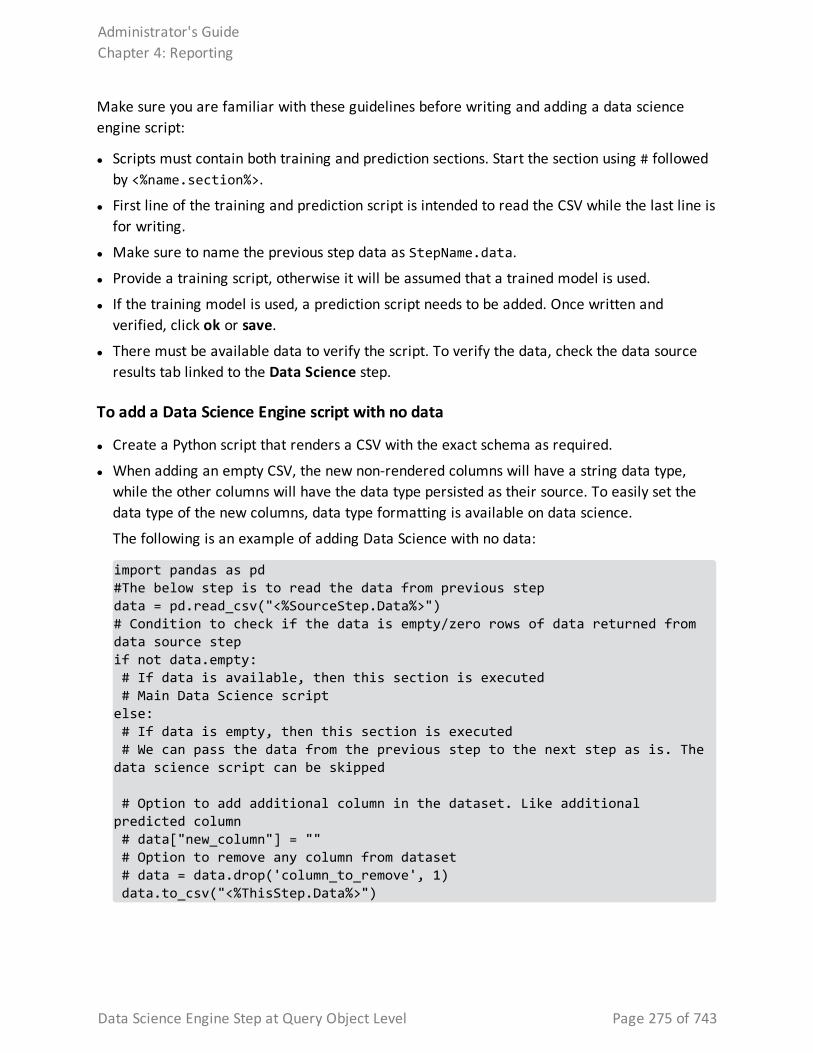
Make sure you are familiar with these guidelines before writing and adding a data science engine script:
l Scripts must contain both training and prediction sections. Start the section using # followed by <%name.section%>.
l First line of the training and prediction script is intended to read the CSV while the last line is for writing.
l Make sure to name the previous step data as StepName.data.
l Provide a training script, otherwise it will be assumed that a trained model is used.
l If the training model is used, a prediction script needs to be added. Once written and verified, click ok or save.
l There must be available data to verify the script. To verify the data, check the data source results tab linked to the Data Science step.
To add a Data Science Engine script with no data
l Create a Python script that renders a CSV with the exact schema as required.
l When adding an empty CSV, the new non-rendered columns will have a string data type, while the other columns will have the data type persisted as their source. To easily set the data type of the new columns, data type formatting is available on data science.
The following is an example of adding Data Science with no data:
import pandas as pd #The below step is to read the data from previous stepdata = pd.read_csv("<%SourceStep.Data%>")# Condition to check if the data is empty/zero rows of data returned from data source stepif not data.empty: # If data is available, then this section is executed # Main Data Science scriptelse: # If data is empty, then this section is executed # We can pass the data from the previous step to the next step as is. The data science script can be skipped
# Option to add additional column in the dataset. Like additional predicted column # data["new_column"] = "" # Option to remove any column from dataset # data = data.drop('column_to_remove', 1) data.to_csv("<%ThisStep.Data%>")
Administrator's GuideChapter 4: Reporting
Data Science Engine Step at Query Object Level Page 275 of 743
Running Reports
In this stage, you can choose between prediction only or training and prediction analysis. To perform retraining based on results prior the actual prediction, select training and prediction option. Otherwise, use prediction only.
Predictive Analysis
Predictive Analytics helps you to input your script directly at report level and bring out predictions on your data. Adding script at report level is most useful when your predictions are not forming new variables or columns in your data reports.
Creating predictive analysis
1. Turn on the edit mode to view option for Predictive Analytics. You can perform predictive analysis in Smart View Reports.
2. Modify the following property value fields for this process: l Fields: Choose the fields showing in the report. Clicking any field will give you the ability
to write Data Science script for that field.
l Data Science Connection: Pick the Data Science Engine needed to generate predictions.
l Prediction Script: Write the script for the field(s) you choose.
l Prediction Data Source: Provide the data and set the independent variables to create predictions on dependent variables.
l Auto: Provide the prediction data point in numeric value.
l Data Source: Specify the query object containing the pre-decided values. Add its correspondent script.
3. Once script is added, check for no errors. Click Ok.
What if Analysis
What-if analysis enables the user to perform predictions of different fields based on various business scenarios. This will help you to take planned future actions and make operational decisions based on the predictions you derive.
Creating what-if analysis
1. Select Filters option and select What-if tab.
Administrator's GuideChapter 4: Reporting
Predictive Analysis Page 276 of 743
2. Use the slider to define the percentage values of different independent variables or manually set them. The values can be positive or negative, which implies the quantity you are increasing or decreasing from the current value.
3. Click Ok.
4. Download the report in PDF format.
ParametersReports retrieve data by running pre-built query objects. If a query needs a value at report run time, it uses built-in, run-time parameters. At report run time, the user is prompted to provide values for run-time parameters as a prerequisite for running the report. The report is then generated based on the user-provided values for those parameters.
Parameters are stored on the server, and therefore can be used in one or more report and query objects.
Note: We recommend first designing all needed parameter objects before creating the query object that will use those parameter objects. (For information on creating queries, see "Queries" on page 249.)
See also
l "Creating New Parameters" on page 279
l "Parameter Object Editor" on the next page
l "Parameter Properties" on page 310
l "Parameter Value Groups" on page 285
l "Placing a System-defined Query or Parameter into a Category" on page 298
l "Configuring Parameter Value Groups" on page 285
l "Modifying a Parameter" on page 284
l "Deleting a Parameter" on page 284
Parameter PropertiesWhen you click on a parameter in the navigation tree of the iPackager page, the following property page opens. The Parameter Object box is pre-populated with the parameter object name that is found on the report server. You can change the name of the parameter object. If you change the name here, the parameter object is packaged with the new name, but its original name on the report server will not change.See also
Administrator's GuideChapter 4: Reporting
Parameters Page 277 of 743
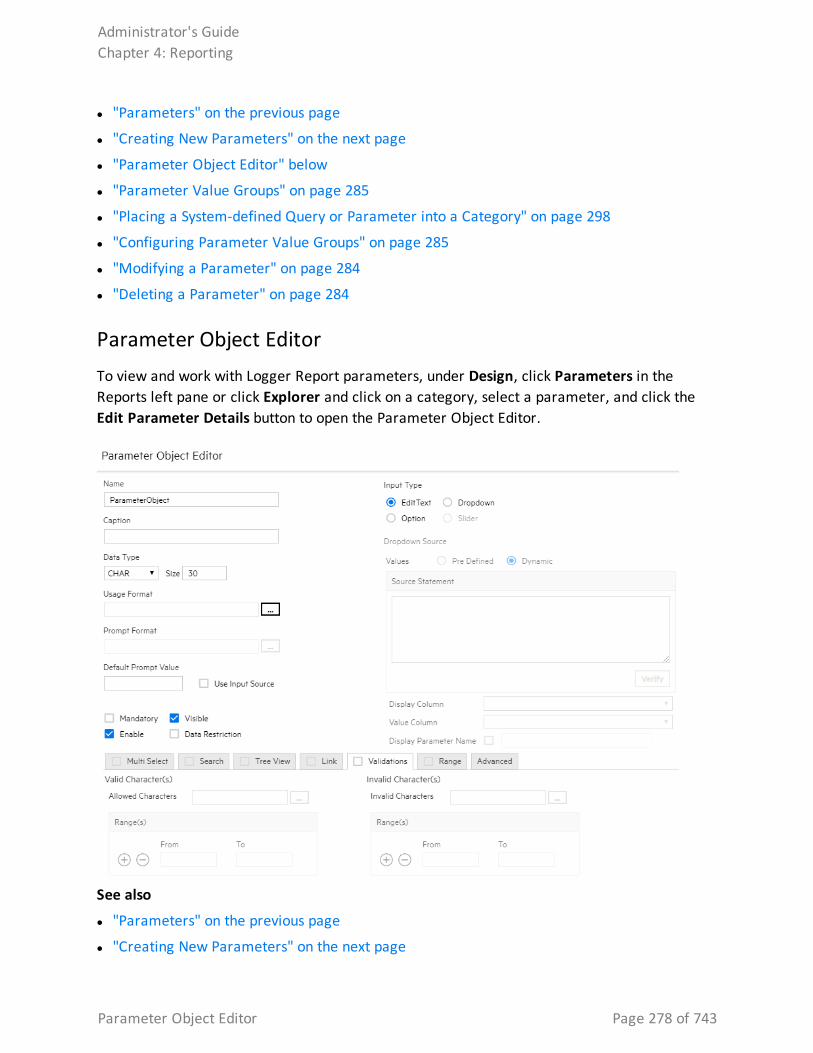
l "Parameters" on the previous page
l "Creating New Parameters" on the next page
l "Parameter Object Editor" below
l "Parameter Value Groups" on page 285
l "Placing a System-defined Query or Parameter into a Category" on page 298
l "Configuring Parameter Value Groups" on page 285
l "Modifying a Parameter" on page 284
l "Deleting a Parameter" on page 284
Parameter Object EditorTo view and work with Logger Report parameters, under Design, click Parameters in the Reports left pane or click Explorer and click on a category, select a parameter, and click the Edit Parameter Details button to open the Parameter Object Editor.
See also
l "Parameters" on the previous page
l "Creating New Parameters" on the next page
Administrator's GuideChapter 4: Reporting
Parameter Object Editor Page 278 of 743
l "Parameter Properties" on page 310
l "Parameter Value Groups" on page 285
l "Placing a System-defined Query or Parameter into a Category" on page 298
l "Configuring Parameter Value Groups" on page 285
l "Modifying a Parameter" on page 284
l "Deleting a Parameter" on page 284
Creating New Parameters
To create a new parameter:
1. In the Parameter Object Editor, click the Add New button located at the top left.
2. Specify values for the new parameter. (Details are given in the topics below.)
Caution: The parameter name must be unique amongst all parameters in the system.
3. After providing all required values, click Save.
4. The parameter is added to the Parameters list.
Note: A blank (empty) parameter object is displayed when this page is opened, and the Add New button on the toolbar is disabled until the blank parameter object is saved. After saving, you can add a new parameter object by clicking Add New.
Setting Parameter Name, Data Type, and Default Values
Specify the parameter unique ID, display name, data type, size, format, and default value as described in the table below.
Option Description
Name Provide a name to uniquely identify this parameter. This name should be unique amongst all parameters in the system.
Prompt Parameter name displayed to the user at report run time.
Data Type Specify type of value the user must provide at report run time:
l CHAR - Value may include alphabetical characters, numbers and special characters.
l NUMBER - Value may include digits and decimal points
l DATE - A date or part of a date, like day, month, or year
l BOOLEAN (For more information, see "Setting up Boolean Parameters" on page 282.)
Parameter Name, Data Type, and Default Values
Administrator's GuideChapter 4: Reporting
Creating New Parameters Page 279 of 743
Option Description
Size Specify number of characters or digits this parameter should accept.
Note: This is only applicable to CHAR and NUMBER data types, not for BOOLEAN or DATE parameters.
Format Select the appropriate format in which user should provide value for this parameter. Click
to open a Data Format dialog box. Based on the format you have selected, a format string is displayed in the entry box.
Default Value
Specify a default value that is appropriate in most cases to provide for this parameter at report run time.
The default value will be automatically selected at report run time. The user can change the default value, if needed. If the user does not change it, the report will run using the default value you specify here for this parameter.
Parameter Name, Data Type, and Default Values, continued
Default Value for Date Type Parameter
For a date type parameter, the Default Value field provides a pull-down menu and a calendar. Click the calendar icon to provide an explicit date, or select one of these dynamic variable values from the pull-down menu:
l CURRENT_DATE
l MONTH_START_DATE
l YEAR_START_DATE
You can also set a default date that is relative to any of the above three dynamic variable dates.
For example, to set a default date as 3 days after CURRENT_DATE, specify CURRENT_DATE + 3.
To set a default date as 5 days before MONTH_START_DATE, specify MONTH_START_DATE - 5.
To provide a value that is relative to a dynamic variable, select one of the dynamic variables, then type a suffix to it in the Default Value field by adding + or - and the number.
At report run time, a parameter with a Date format will display with the default date set here.
Administrator's GuideChapter 4: Reporting
Default Value for Date Type Parameter Page 280 of 743
Defining Input Type
The parameter input type describes the style of interface provided to users at report run time in which to enter a value for this parameter. Choose from Text Box, Combo, or Option as described below.
Note: In the Reports Designer, changing the parameter type TextBox to another type causes an error. If you need to change the parameter type to TextBox, do not edit an existing parameter, delete that parameter and add a new one.
Option Description
Text Box Select Text Box input type if you want the user to type the value for the parameter.
Combo Select Combo if you want the user to select one value or multiple values from a pull-down menu.
Select the Multi Select checkbox so that user can select multiple values from the box.
See "Setting Multiple Default Values" on page 283 to configure other settings for this option.
Option Select Option if you want the user to select values represented as options.
Select the Multi Select checkbox to have value options in the form of checkboxes.
Keep the Multi Select checkbox deselected to have options in the form of radio buttons.
Input Type
Setting Multiple Default Values
If you selected Combo Input Type (see "Defining Input Type" above), you need to define the following settings in the Parameter editor:
l Maximum Selectable Values: Specify the maximum number of values that can be selected or provided for a parameter.
l Enclosed By: Specify the character to use to enclose the set of values. This will depend on the database.
l Separator: Specify the character to use to separate the two values. This will depend on the database.
l Select Default Values: Specify the number of default values to display at report run time. You can choose from the following:
a. Selected: Only values for the selected parameters are displayed.
b. All: Values for all parameters are displayed.
c. None: No default values are defined.
Administrator's GuideChapter 4: Reporting
Defining Input Type Page 281 of 743
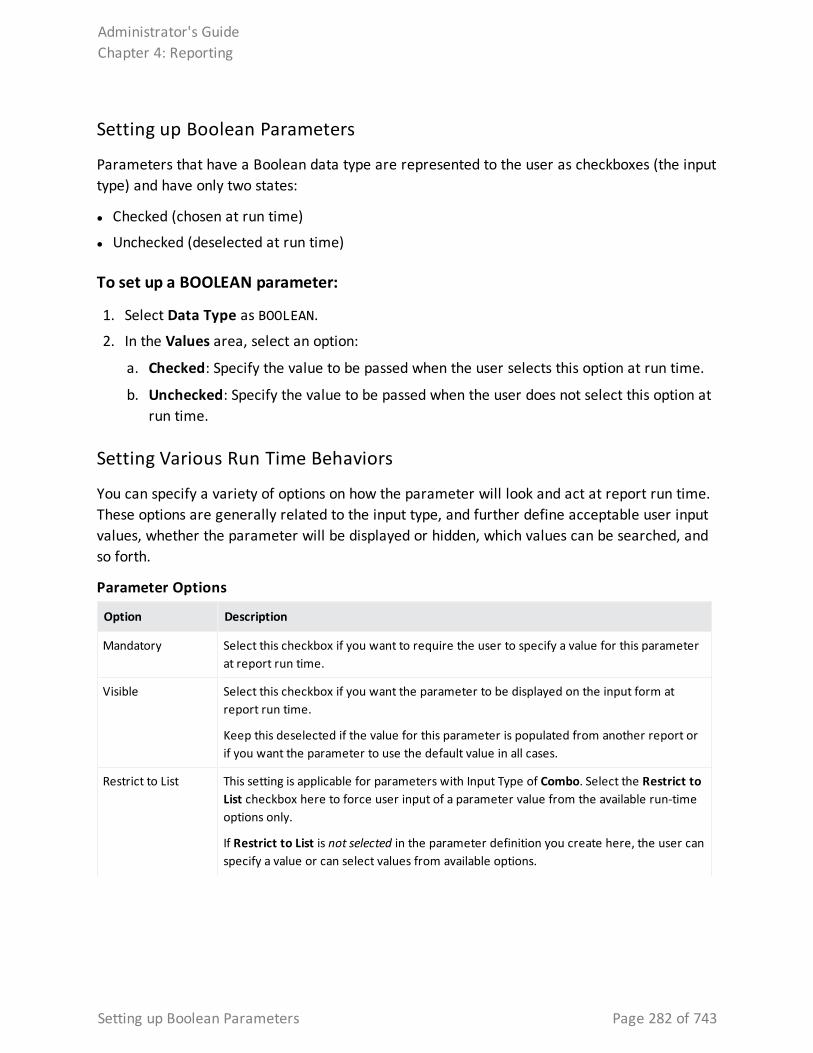
Setting up Boolean Parameters
Parameters that have a Boolean data type are represented to the user as checkboxes (the input type) and have only two states:
l Checked (chosen at run time)
l Unchecked (deselected at run time)
To set up a BOOLEAN parameter:
1. Select Data Type as BOOLEAN.
2. In the Values area, select an option:
a. Checked: Specify the value to be passed when the user selects this option at run time.
b. Unchecked: Specify the value to be passed when the user does not select this option at run time.
Setting Various Run Time Behaviors
You can specify a variety of options on how the parameter will look and act at report run time. These options are generally related to the input type, and further define acceptable user input values, whether the parameter will be displayed or hidden, which values can be searched, and so forth.
Option Description
Mandatory Select this checkbox if you want to require the user to specify a value for this parameter at report run time.
Visible Select this checkbox if you want the parameter to be displayed on the input form at report run time.
Keep this deselected if the value for this parameter is populated from another report or if you want the parameter to use the default value in all cases.
Restrict to List This setting is applicable for parameters with Input Type of Combo. Select the Restrict to List checkbox here to force user input of a parameter value from the available run-time options only.
If Restrict to List is not selected in the parameter definition you create here, the user can specify a value or can select values from available options.
Parameter Options
Administrator's GuideChapter 4: Reporting
Setting up Boolean Parameters Page 282 of 743
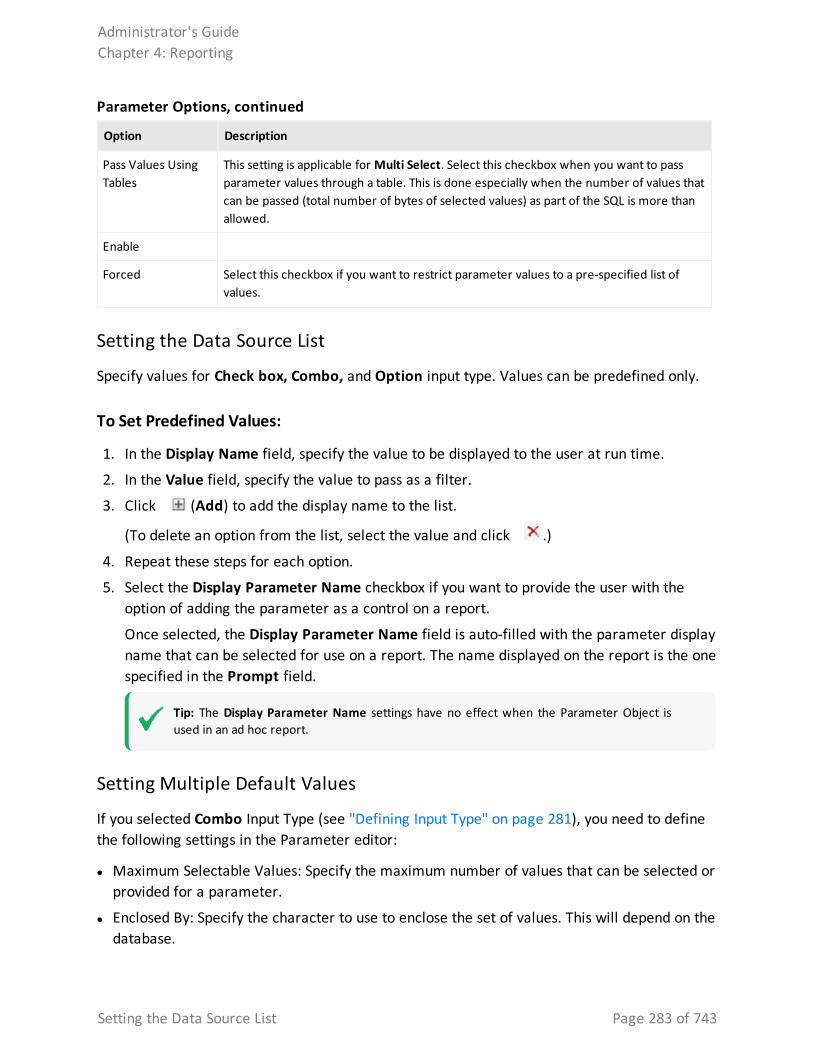
Option Description
Pass Values Using Tables
This setting is applicable for Multi Select. Select this checkbox when you want to pass parameter values through a table. This is done especially when the number of values that can be passed (total number of bytes of selected values) as part of the SQL is more than allowed.
Enable
Forced Select this checkbox if you want to restrict parameter values to a pre-specified list of values.
Parameter Options, continued
Setting the Data Source List
Specify values for Check box, Combo, and Option input type. Values can be predefined only.
To Set Predefined Values:
1. In the Display Name field, specify the value to be displayed to the user at run time.
2. In the Value field, specify the value to pass as a filter.
3. Click (Add) to add the display name to the list.
(To delete an option from the list, select the value and click .)
4. Repeat these steps for each option.
5. Select the Display Parameter Name checkbox if you want to provide the user with the option of adding the parameter as a control on a report.
Once selected, the Display Parameter Name field is auto-filled with the parameter display name that can be selected for use on a report. The name displayed on the report is the one specified in the Prompt field.
Tip: The Display Parameter Name settings have no effect when the Parameter Object is used in an ad hoc report.
Setting Multiple Default Values
If you selected Combo Input Type (see "Defining Input Type" on page 281), you need to define the following settings in the Parameter editor:
l Maximum Selectable Values: Specify the maximum number of values that can be selected or provided for a parameter.
l Enclosed By: Specify the character to use to enclose the set of values. This will depend on the database.
Administrator's GuideChapter 4: Reporting
Setting the Data Source List Page 283 of 743
l Separator: Specify the character to use to separate the two values. This will depend on the database.
l Select Default Values: Specify the number of default values to display at report run time. You can choose from the following:
a. Selected: Only values for the selected parameters are displayed.
b. All: Values for all parameters are displayed.
c. None: No default values are defined.
Modifying a Parameter
To modify a parameter:
1. On the Reports right panel menu, click Parameter Explorer to display the Parameter Object list.
2. Browse to the parameter you want to modify.
3. In the Actions menu, click Edit Parameter Details.
4. Edit the parameter as needed (using the settings described in "Creating New Parameters" on page 279) and click Save.
See also
l "Parameters" on page 277
l "Creating New Parameters" on page 279
l "Parameter Object Editor" on page 278
l "Parameter Properties" on page 310
l "Parameter Value Groups" on the next page
l "Placing a System-defined Query or Parameter into a Category" on page 298
l "Configuring Parameter Value Groups" on the next page
l "Deleting a Parameter" below
Note: Only custom parameters can be modified, not supplied parameters, since supplied parameters are required for use in system Reports and Solution pack add-ons.
Deleting a Parameter
To delete a parameter:
1. On the Reports left panel, click Parameter Explorer to display the Parameters Object list.
2. Browse to the parameter you want to modify.
Administrator's GuideChapter 4: Reporting
Modifying a Parameter Page 284 of 743
3. In the Actions menu, click Delete.
4. Click Yes to confirm deletion.
Note: Only custom parameters can be removed, not supplied parameters, since supplied parameters are required for use in foundation Reports and Solution pack add-ons.
Parameter Value GroupsSome reports require multiple run-time values, like a country list, for example. Selecting a handful of country name from a long list can be difficult. To address this problem, Administrators can create parameter value groups, that allows a user to select a group that includes multiple parameters.
Examples of parameter value groups:
l Americas (countries in the North American sub-continent)
l Europe (countries in Europe)
l Asia (countries in Asia)
l Africa (countries in Africa).
At run time, when a user selects a group, values belonging to that group will appear as selected. User does not have to manually select each of the countries every time the user runs the report. This saves time, as well as reduces the chance of errors.
Configuring Parameter Value GroupsSome reports may require users to provide multiple run-time values that would be easier to select if they were grouped. For example, a report that requires a user to select more than one country name might be a good candidate for parameter value groups. Users might find it difficult to select a few country names from a single, long list of countries.
As an alternative, the query designer could create parameter value groups for the Americas, Europe, Asia, Africa, and so forth. Each parameter value group would contain lists of countries belonging to those continents or areas. At report run time, when the user selects a group, values belonging to the group are pre-selected. Users do not have to manually select countries in parameter groups for every report run. Selections are saved from one report run to the next.
Using parameter value groups as a part of your query design strategy can save users time and reduce error at report run time.
To view and work with Logger Report parameter value groups, under Design, click Parameter Value Groups on the Reports left panel.
Administrator's GuideChapter 4: Reporting
Parameter Value Groups Page 285 of 743
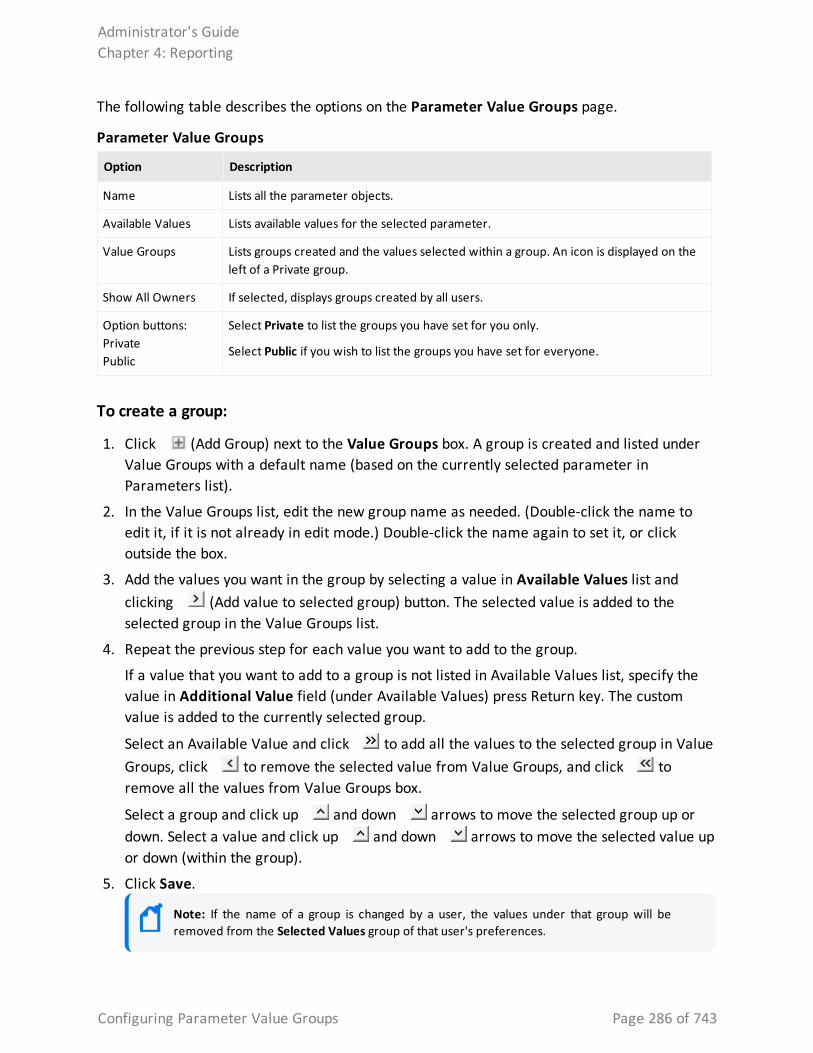
The following table describes the options on the Parameter Value Groups page.
Option Description
Name Lists all the parameter objects.
Available Values Lists available values for the selected parameter.
Value Groups Lists groups created and the values selected within a group. An icon is displayed on the left of a Private group.
Show All Owners If selected, displays groups created by all users.
Option buttons:Private Public
Select Private to list the groups you have set for you only.
Select Public if you wish to list the groups you have set for everyone.
Parameter Value Groups
To create a group:
1. Click (Add Group) next to the Value Groups box. A group is created and listed under Value Groups with a default name (based on the currently selected parameter in Parameters list).
2. In the Value Groups list, edit the new group name as needed. (Double-click the name to edit it, if it is not already in edit mode.) Double-click the name again to set it, or click outside the box.
3. Add the values you want in the group by selecting a value in Available Values list and clicking (Add value to selected group) button. The selected value is added to the selected group in the Value Groups list.
4. Repeat the previous step for each value you want to add to the group.
If a value that you want to add to a group is not listed in Available Values list, specify the value in Additional Value field (under Available Values) press Return key. The custom value is added to the currently selected group.
Select an Available Value and click to add all the values to the selected group in Value Groups, click to remove the selected value from Value Groups, and click to remove all the values from Value Groups box.
Select a group and click up and down arrows to move the selected group up or down. Select a value and click up and down arrows to move the selected value up or down (within the group).
5. Click Save.
Note: If the name of a group is changed by a user, the values under that group will be removed from the Selected Values group of that user's preferences.
Administrator's GuideChapter 4: Reporting
Configuring Parameter Value Groups Page 286 of 743
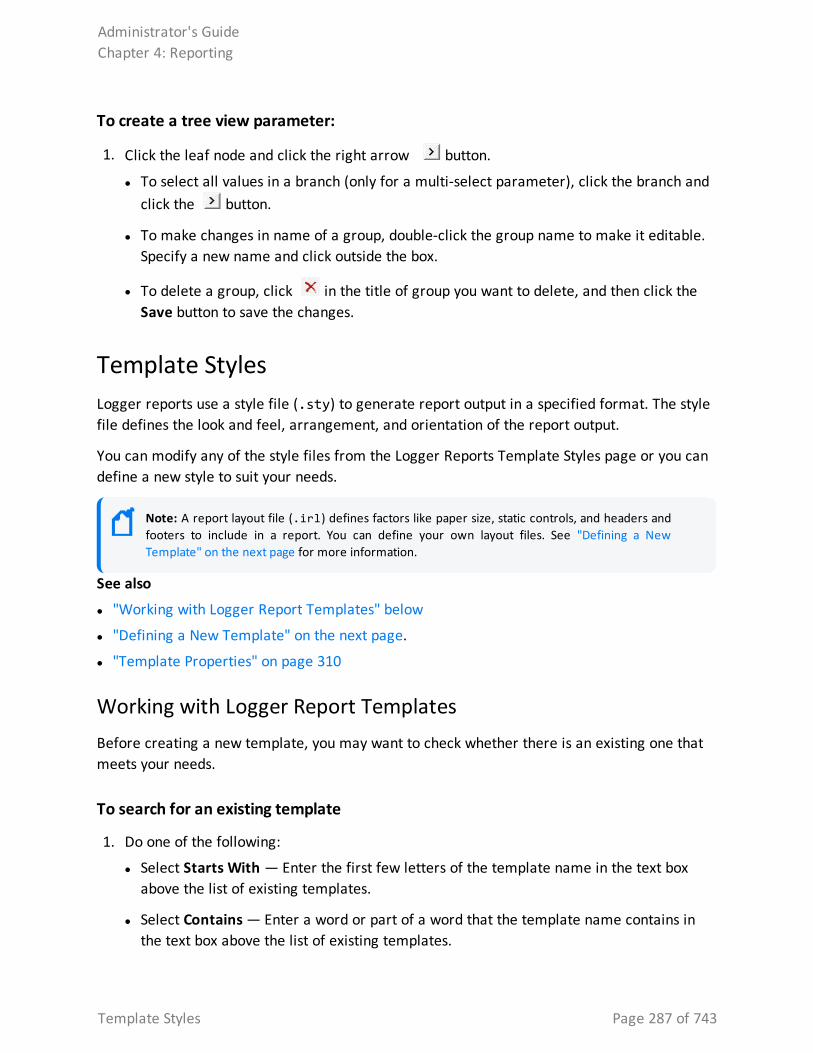
To create a tree view parameter:
1. Click the leaf node and click the right arrow button.
l To select all values in a branch (only for a multi-select parameter), click the branch and click the button.
l To make changes in name of a group, double-click the group name to make it editable. Specify a new name and click outside the box.
l To delete a group, click in the title of group you want to delete, and then click the Save button to save the changes.
Template StylesLogger reports use a style file (.sty) to generate report output in a specified format. The style file defines the look and feel, arrangement, and orientation of the report output.
You can modify any of the style files from the Logger Reports Template Styles page or you can define a new style to suit your needs.
Note: A report layout file (.irl) defines factors like paper size, static controls, and headers and footers to include in a report. You can define your own layout files. See "Defining a New Template" on the next page for more information.
See also
l "Working with Logger Report Templates" below
l "Defining a New Template" on the next page.
l "Template Properties" on page 310
Working with Logger Report TemplatesBefore creating a new template, you may want to check whether there is an existing one that meets your needs.
To search for an existing template
1. Do one of the following:
l Select Starts With — Enter the first few letters of the template name in the text box above the list of existing templates.
l Select Contains — Enter a word or part of a word that the template name contains in the text box above the list of existing templates.
Administrator's GuideChapter 4: Reporting
Template Styles Page 287 of 743
To view and work with Logger Report template styles
1. Click Template Styles on the Reports menu.
2. Select an existing template, or create a new layout. See "Defining a New Template" below.
3. Make modifications as needed.
4. Click Preview to display the template with sample data.
5. Click Save to save the layout. Your template will now display in the Templates list.See also
l "Defining a New Template" below.
l "Template Properties" on page 310
l "Template Styles" on the previous page
Defining a New Template
To define a new template
1. Under Design, click Template Styles on the Reports left menu bar.
2. Click the icon in the right panel.
3. Define the Items and Item Properties for the template.
4. Optionally, if you want to define or change the report layout file, click Edit Layout. See "To include a header or footer in a report" below.
5. Click Save.
To include a header or footer in a report
1. From the top of the templates page, click Edit Layout.
2. Click Report Header to include a header or Page Footer to include a footer.
3. Click Insert > Layout Control.
4. Select an option from the sub-menu and fill in the required information.
Reports AdministrationThis section explains the administration processes for configuring and managing Logger Reports.
Administrator's GuideChapter 4: Reporting
Defining a New Template Page 288 of 743
Creating a Reports User GroupIf multiple users need similar Report access rights, user groups can make administering those rights easier. Create a user group for each set of permissions, and then simply add the user to the appropriate groups. For more information, see "Users/Groups" on page 545.
To create a new User Group and give it Logger Reports Rights:
1. Click System Admin in the menu bar.
2. Click User Management in the Users/Groups section on the left panel.
3. Click the Groups tab, and click Add.
4. Type in a Name for the group and add a description.
5. Select Logger Reports from the Group Type drop down menu.
6. Click the arrow to display the list of Logger Reports Rights.
7. Click Clear All to remove all permissions.
8. Click the box next to each permission you want to give the user group.
For example, if you wanted to give the rights to view, run, and schedule reports from Foundation > Intrusion Monitoring > Attackers, put a mark in the box next to each of the following access rights:
Report folder [Attackers]: view, run, and schedule reportsReport folder [Foundation]: view, run, and schedule reportsReport folder [Intrusion Monitoring]: view, run, and schedule reports
9. Click Save and Edit Membership.
10. Click Add in the Edit Group Membership dialog.
11. Put a mark in the box for the user you want to add to the group, and click OK.
12. Log in as a member of the group you created and test whether you can perform the desired functions. For the example, the user should be able to view, run, and schedule the Attackers reports only.
Managing Reports of Deleted UsersBecause reports are often used by more than just one individual, Logger reports are not deleted when the report owner is inactivated as a Logger user. Keep in mind the following information:
l Scheduled reports continue to run after the user is deleted.
l An Administrator can delete or modify an inactive user's Public and Scheduled reports.
Administrator's GuideChapter 4: Reporting
Creating a Reports User Group Page 289 of 743
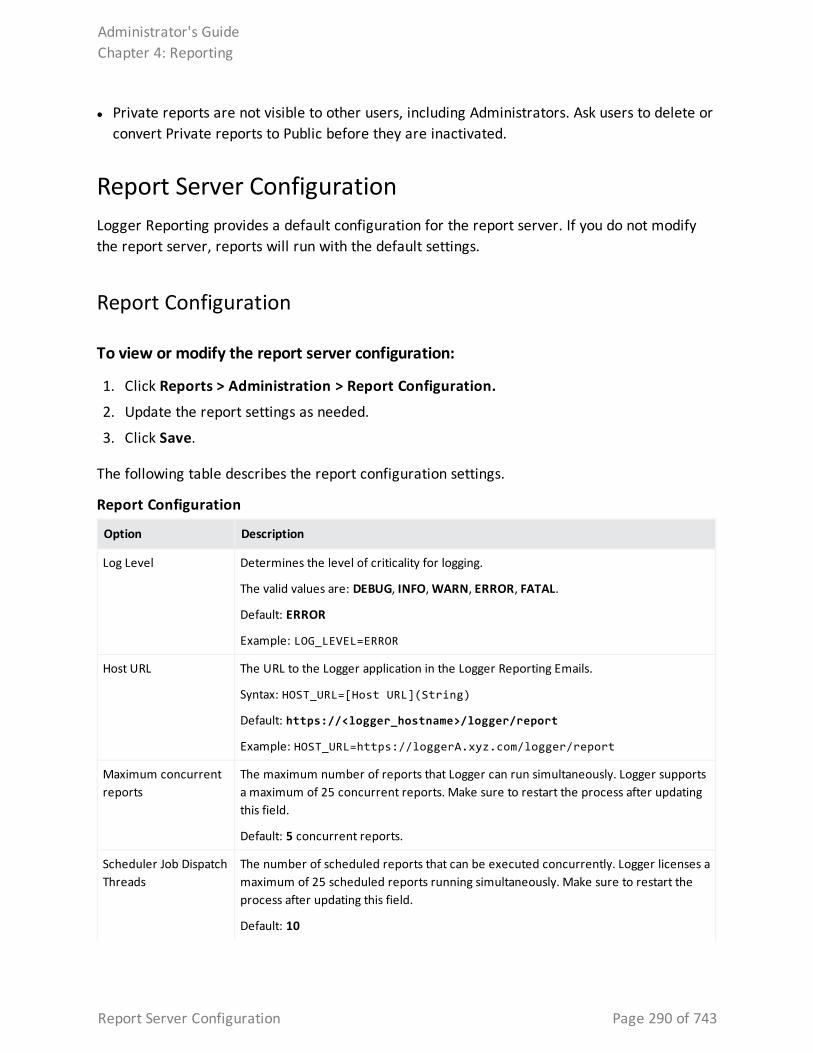
l Private reports are not visible to other users, including Administrators. Ask users to delete or convert Private reports to Public before they are inactivated.
Report Server ConfigurationLogger Reporting provides a default configuration for the report server. If you do not modify the report server, reports will run with the default settings.
Report Configuration
To view or modify the report server configuration:
1. Click Reports > Administration > Report Configuration.
2. Update the report settings as needed.
3. Click Save.
The following table describes the report configuration settings.
Option Description
Log Level Determines the level of criticality for logging.
The valid values are: DEBUG, INFO, WARN, ERROR, FATAL.
Default: ERROR
Example: LOG_LEVEL=ERROR
Host URL The URL to the Logger application in the Logger Reporting Emails.
Syntax: HOST_URL=[Host URL](String)
Default: https://<logger_hostname>/logger/report
Example: HOST_URL=https://loggerA.xyz.com/logger/report
Maximum concurrent reports
The maximum number of reports that Logger can run simultaneously. Logger supports a maximum of 25 concurrent reports. Make sure to restart the process after updating this field.
Default: 5 concurrent reports.
Scheduler Job Dispatch Threads
The number of scheduled reports that can be executed concurrently. Logger licenses a maximum of 25 scheduled reports running simultaneously. Make sure to restart the process after updating this field.
Default: 10
Report Configuration
Administrator's GuideChapter 4: Reporting
Report Server Configuration Page 290 of 743
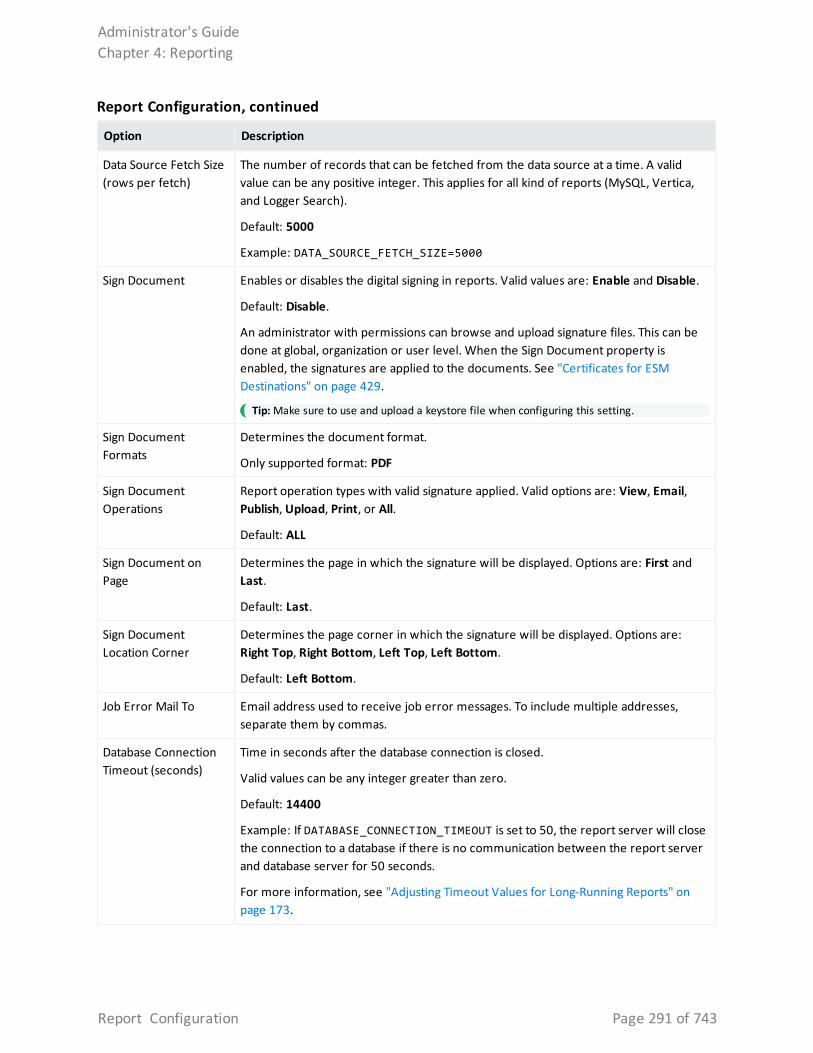
Option Description
Data Source Fetch Size (rows per fetch)
The number of records that can be fetched from the data source at a time. A valid value can be any positive integer. This applies for all kind of reports (MySQL, Vertica, and Logger Search).
Default: 5000
Example: DATA_SOURCE_FETCH_SIZE=5000
Sign Document Enables or disables the digital signing in reports. Valid values are: Enable and Disable.
Default: Disable.
An administrator with permissions can browse and upload signature files. This can be done at global, organization or user level. When the Sign Document property is enabled, the signatures are applied to the documents. See "Certificates for ESM Destinations" on page 429.
Tip: Make sure to use and upload a keystore file when configuring this setting.
Sign Document Formats
Determines the document format.
Only supported format: PDF
Sign Document Operations
Report operation types with valid signature applied. Valid options are: View, Email, Publish, Upload, Print, or All.
Default: ALL
Sign Document on Page
Determines the page in which the signature will be displayed. Options are: First and Last.
Default: Last.
Sign Document Location Corner
Determines the page corner in which the signature will be displayed. Options are: Right Top, Right Bottom, Left Top, Left Bottom.
Default: Left Bottom.
Job Error Mail To Email address used to receive job error messages. To include multiple addresses, separate them by commas.
Database Connection Timeout (seconds)
Time in seconds after the database connection is closed.
Valid values can be any integer greater than zero.
Default: 14400
Example: If DATABASE_CONNECTION_TIMEOUT is set to 50, the report server will close the connection to a database if there is no communication between the report server and database server for 50 seconds.
For more information, see "Adjusting Timeout Values for Long-Running Reports" on page 173.
Report Configuration, continued
Administrator's GuideChapter 4: Reporting
Report Configuration Page 291 of 743
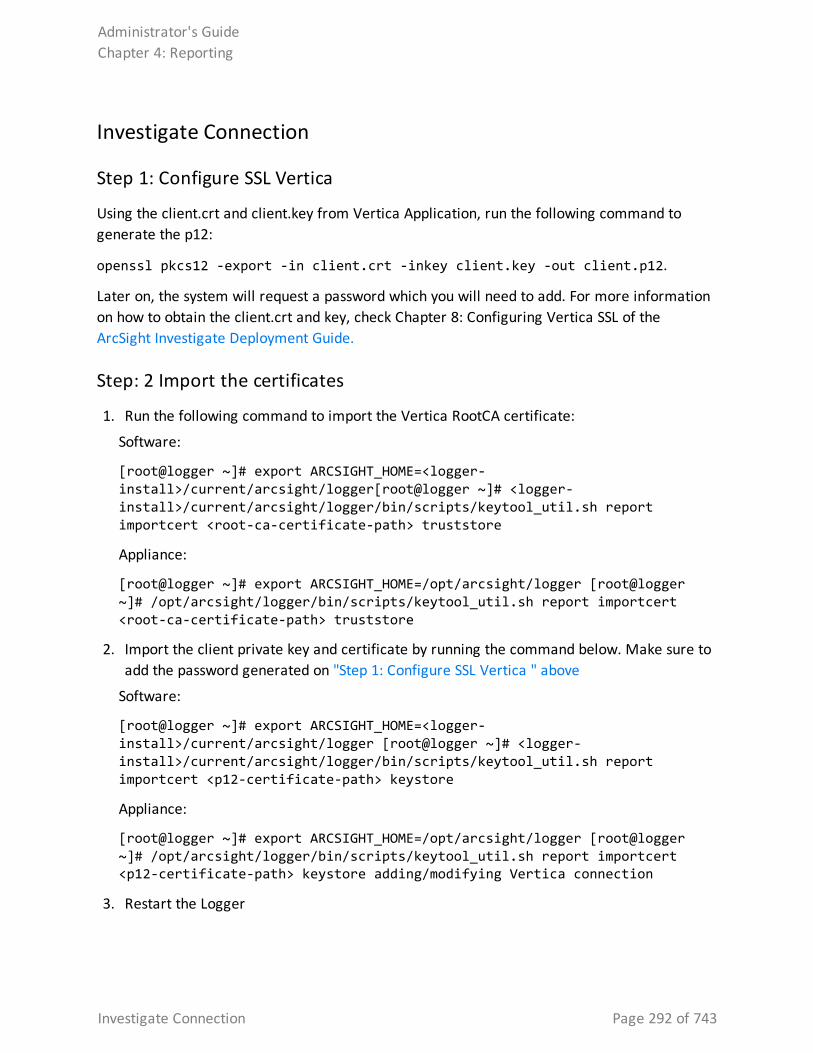
Investigate Connection
Step 1: Configure SSL Vertica
Using the client.crt and client.key from Vertica Application, run the following command to generate the p12:
openssl pkcs12 -export -in client.crt -inkey client.key -out client.p12.
Later on, the system will request a password which you will need to add. For more information on how to obtain the client.crt and key, check Chapter 8: Configuring Vertica SSL of the ArcSight Investigate Deployment Guide.
Step: 2 Import the certificates
1. Run the following command to import the Vertica RootCA certificate:
Software:
[root@logger ~]# export ARCSIGHT_HOME=<logger-install>/current/arcsight/logger[root@logger ~]# <logger-install>/current/arcsight/logger/bin/scripts/keytool_util.sh report importcert <root-ca-certificate-path> truststore
Appliance:
[root@logger ~]# export ARCSIGHT_HOME=/opt/arcsight/logger [root@logger ~]# /opt/arcsight/logger/bin/scripts/keytool_util.sh report importcert <root-ca-certificate-path> truststore
2. Import the client private key and certificate by running the command below. Make sure to add the password generated on "Step 1: Configure SSL Vertica " above
Software:
[root@logger ~]# export ARCSIGHT_HOME=<logger-install>/current/arcsight/logger [root@logger ~]# <logger-install>/current/arcsight/logger/bin/scripts/keytool_util.sh report importcert <p12-certificate-path> keystore
Appliance:
[root@logger ~]# export ARCSIGHT_HOME=/opt/arcsight/logger [root@logger ~]# /opt/arcsight/logger/bin/scripts/keytool_util.sh report importcert <p12-certificate-path> keystore adding/modifying Vertica connection
3. Restart the Logger
Administrator's GuideChapter 4: Reporting
Investigate Connection Page 292 of 743
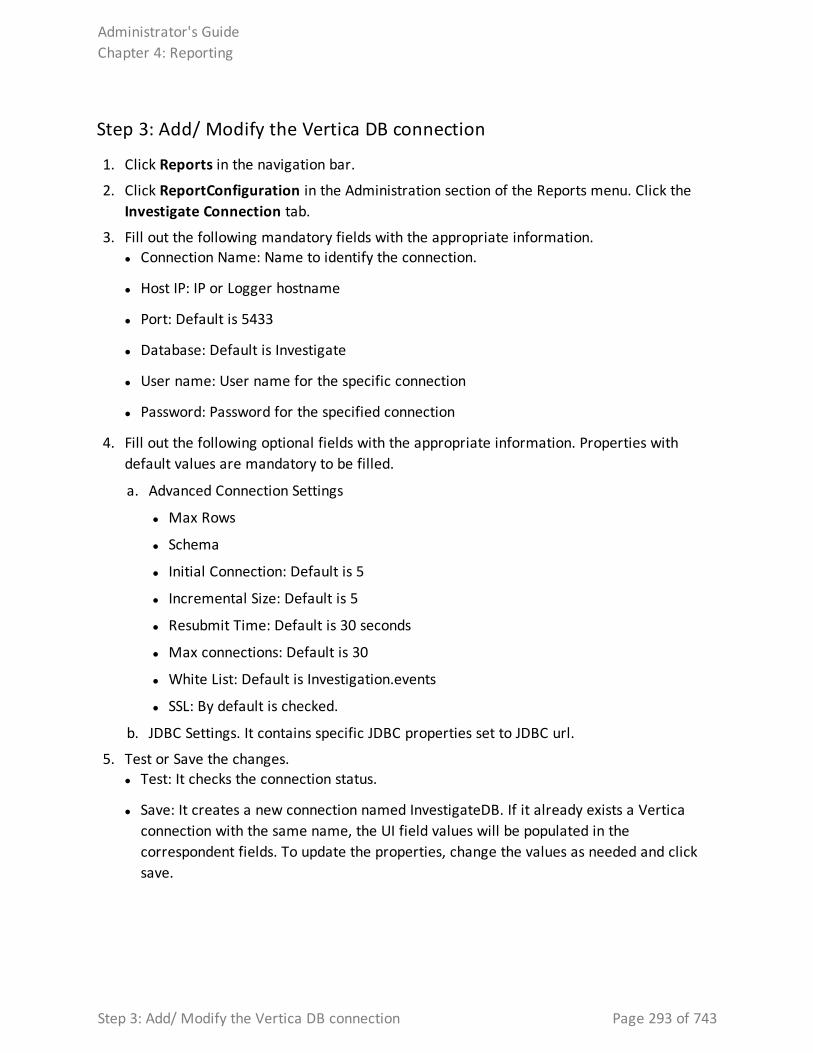
Step 3: Add/ Modify the Vertica DB connection
1. Click Reports in the navigation bar.
2. Click ReportConfiguration in the Administration section of the Reports menu. Click the Investigate Connection tab.
3. Fill out the following mandatory fields with the appropriate information. l Connection Name: Name to identify the connection.
l Host IP: IP or Logger hostname
l Port: Default is 5433
l Database: Default is Investigate
l User name: User name for the specific connection
l Password: Password for the specified connection
4. Fill out the following optional fields with the appropriate information. Properties with default values are mandatory to be filled.
a. Advanced Connection Settings
l Max Rows
l Schema
l Initial Connection: Default is 5
l Incremental Size: Default is 5
l Resubmit Time: Default is 30 seconds
l Max connections: Default is 30
l White List: Default is Investigation.events
l SSL: By default is checked.
b. JDBC Settings. It contains specific JDBC properties set to JDBC url.
5. Test or Save the changes. l Test: It checks the connection status.
l Save: It creates a new connection named InvestigateDB. If it already exists a Vertica connection with the same name, the UI field values will be populated in the correspondent fields. To update the properties, change the values as needed and click save.
Administrator's GuideChapter 4: Reporting
Step 3: Add/ Modify the Vertica DB connection Page 293 of 743
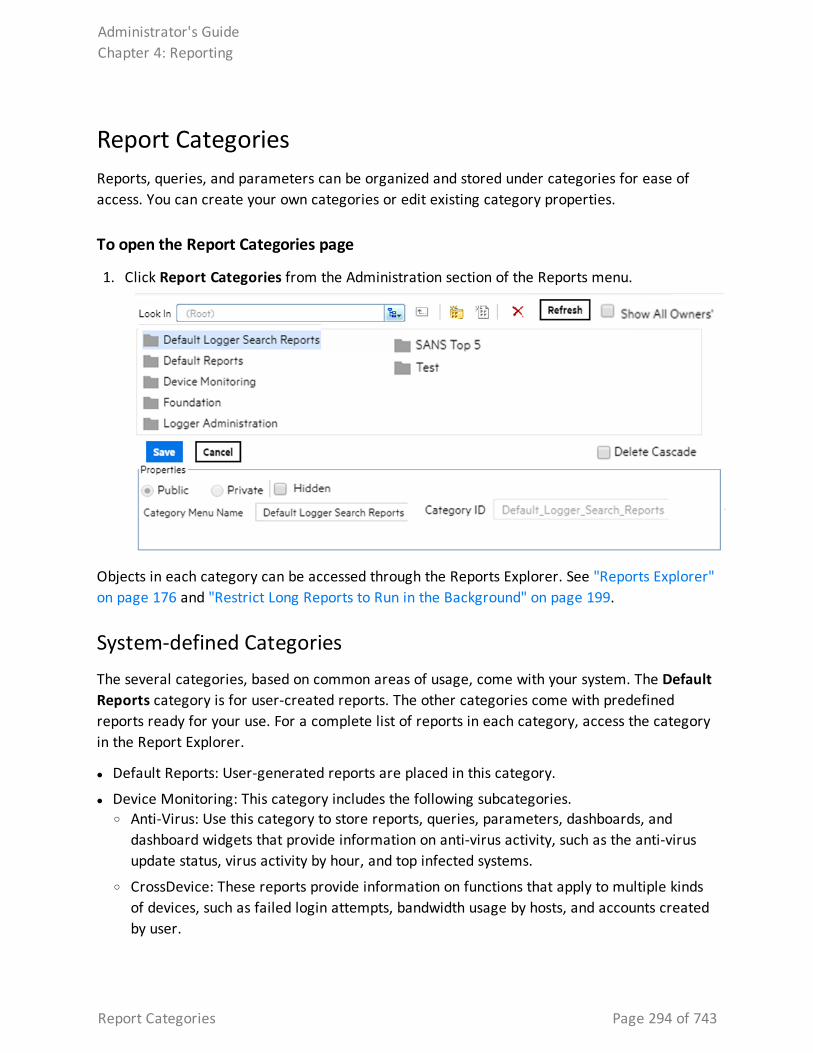
Report CategoriesReports, queries, and parameters can be organized and stored under categories for ease of access. You can create your own categories or edit existing category properties.
To open the Report Categories page
1. Click Report Categories from the Administration section of the Reports menu.
Objects in each category can be accessed through the Reports Explorer. See "Reports Explorer" on page 176 and "Restrict Long Reports to Run in the Background" on page 199.
System-defined CategoriesThe several categories, based on common areas of usage, come with your system. The Default Reports category is for user-created reports. The other categories come with predefined reports ready for your use. For a complete list of reports in each category, access the category in the Report Explorer.
l Default Reports: User-generated reports are placed in this category.
l Device Monitoring: This category includes the following subcategories. o Anti-Virus: Use this category to store reports, queries, parameters, dashboards, and
dashboard widgets that provide information on anti-virus activity, such as the anti-virus update status, virus activity by hour, and top infected systems.
o CrossDevice: These reports provide information on functions that apply to multiple kinds of devices, such as failed login attempts, bandwidth usage by hosts, and accounts created by user.
Administrator's GuideChapter 4: Reporting
Report Categories Page 294 of 743
o Database: The report in this category provides information on database errors and warnings.
o Firewall: These reports provide information on firewall activity, such as denied connections by port, address, and hour.
o Identity Management: This report provides information on the number of connections per user as reported by the Identity Management devices in your network.
o IDS-IPS: These reports provides information on activity involving Intrusion Detection Systems (IDS) and Intrusion Prevention Systems (IPS), such as alert count by device, port, severity, top alert destinations, worm-infected systems, and related metrics.
o Network: These reports provide information on activity involving network infrastructure, including interface status, device errors, and SNMP authentication failures.
o Operating System: These reports provide information on activity involving operating systems, such as login errors per user, user and user group creation, and modification events.
o VPN: These reports provide information on activity involving VPN connections, including authentication errors, connection information such as counts, accepted and denied by address, and related metrics.
Tip: More reports may be available for download as report packages on the Micro Focus Customer Support Site SSO. (For information about deploying report packages, see "Deploying a Report Bundle" on page 311.)
l Foundation: This category includes the following subcategories. o Configuration Monitoring: Logger provides reports that address configuration monitoring.
o Intrusion Monitoring Reports: Logger provides reports that address intrusion monitoring. For example, reports are provided to track password changes, firewall configuration events, firewall traffic, top attackers traversing firewalls, and so forth.
o Intrusion Monitoring Reports: Logger provides reports that address intrusion monitoring. For example, reports are provided to track password changes, firewall configuration events, firewall traffic, top attackers traversing firewalls, and so forth.
o Netflow Monitoring: Netflow Monitoring reports IP traffic information.
o Network Monitoring Reports: Network Monitoring reports describe activities on Virtual Private Networks.
l Logger Administration: This category includes Logger Administration tasks such as Daily Byte Count.
l SANS Top 5 Reports
Logger provides reports that address the SANS Top 5 log reports scenarios, all pre-built and available to run on-demand or schedule for a specified frequency.
Administrator's GuideChapter 4: Reporting
System-defined Categories Page 295 of 743
The SANS Institute is a cooperative training, certification, and research organization with a focus on developing solutions for securing information against a variety of potential threats. SANS facilitates and supports a collaborative effort of a large number of security practitioners in various industries and sectors around the world to share experience, solutions, and resources related to information security.
Note: SANS stands for “SysAdmin, Audit, Network, Security”. More information is available on their Web site at Sans organization
The SANS Top 5 represents the current set of most critical log reports for a wide cross-section of the security community, and should be reviewed on a regular basis. This quote from the SANS Web site describes the strategy and focus of the SANS Top 5 Essential Log Reports:
“The goal is to include reports that have the highest likelihood of identifying suspect activity, while generating the lowest number of false positive report entries. The log reports may not always clearly indicate the extent of an intrusion, but will at least give sufficient information to the appropriate administrator that suspect activity has been detected and requires further investigation.”
The SANS Top 5 log reports cover the following five scenarios:
l 1 - Attempts to gain access through existing accounts
l 2 - Failed file or resource access attempts
l 3 - Unauthorized changes to users, groups and services
l 4 - Systems most vulnerable to attack
l 5 - Suspicious or unauthorized network traffic patterns
The Logger SANS Top 5 Reports offered to address these threat scenarios are:
l SANS Top 5 - 1 Number of Failed Logins
l SANS Top 5 - 1 Top Users with Failed Logins
l SANS Top 5 - 2 Failed Resource Access by Users and Drilldown
l SANS Top 5 - 2 Failed Resource Access Events and Drilldown
l SANS Top 5 - 3 Password Changes
l SANS Top 5 - 3 User Account Creations, Deletions, and Modifications
l SANS Top 5 - 4 Vulnerability Scanner Logs by Host or by Vulnerability
l SANS Top 5 - 5 Alerts from IDS
l SANS Top 5 - 5 IDS Signature Destinations and Source
l SANS Top 5 - 5 Top 10 Talkers
l SANS Top 5 - 5 Top 10 Types of Traffic
Administrator's GuideChapter 4: Reporting
System-defined Categories Page 296 of 743
l SANS Top 5 - 5 Top Destination and Target IPs
l SANS Top 5 - 1 Number of Failed Logins
l SANS Top 5 - 1 Top Users with Failed Logins
l SANS Top 5 - 2 Failed Resource Access by Users and Drilldown
l SANS Top 5 - 2 Failed Resource Access Events and Drilldown
l SANS Top 5 - 3 Password Changes
l SANS Top 5 - 3 User Account Creations, Deletions, and Modifications
l SANS Top 5 - 4 Vulnerability Scanner Logs by Host or by Vulnerability
l SANS Top 5 - 5 Alerts from IDS
l SANS Top 5 - 5 IDS Signature Destinations and Source
l SANS Top 5 - 5 Top 10 Talkers
l SANS Top 5 - 5 Top 10 Types of Traffic
l SANS Top 5 - 5 Top Destination and Target IPs >Solution ReportsAny solution packages installed on the Logger are listed in separate report groups. Solution packages address specific compliance requirements or scenarios and are installed separately. Solutions Reports are available as add-on packages to Logger for specific compliance requirements or scenarios.
Note: You must log into Logger and open the Reports page at least once before installing any Solutions package.
The available solution packages include:
l ITGov (ISO 27002 & NIST 800-53 based reports)
l Payment Card Industry, (PCI based reports)
l SOX (Sarbanes-Oxley compliance reports)
For information on deploying Solutions Packages, see "Deploying a Report Bundle" on page 311. Once deployed, these solution reports are listed in categories under the Solution Reports report group. To access these reports (once deployed), click Reports | Solutions Reports |<report category name> on the left menu, where <report category name> is the solution name, for example: Payment Card Industry.
For more information on report categories, including how to edit them, see "Report Categories" on page 294.
Administrator's GuideChapter 4: Reporting
System-defined Categories Page 297 of 743
Placing a System-defined Query or Parameter into a CategoryYou can place a pre-defined query or parameter into a category. Use the cut/paste feature to do so because cutting and pasting will preserve its ID.
To cut and paste a query or parameter:
1. Click Explorer in the Reports menu. Explorer displays.
2. Navigate to and select the pre-defined query or parameter you want to move.
3. Right-click Cut Query Object or Cut Parameter Object from the context menu.
4. Click the category name under which you would like to place this query or parameter.
Note: You cannot save a report in the root category. Save it in one of the existing subcategories, or create a new category.
5. Right-click again and click Paste.
Tip: Do not copy and paste a query or parameter to place it in a category. Doing so will give the query or parameter a new ID and render it unusable to reports or other existing objects that are using it. Use cut and paste, instead.
You can schedule any report to run once at a later date or on a specified frequency (such as daily or weekly). Monthly reports cannot be scheduled currently. For more on this, see "Scheduled Reports" on page 186.
You can run, publish, and save the results of any type of report. For information on these common reporting tasks available on all reports, see "Running Reports" on page 191 and "Published Reports" on page 182.)See also
l "Parameters" on page 277
l "Creating New Parameters" on page 279
l "Parameter Object Editor" on page 278
l "Parameter Properties" on page 310
l "Parameter Value Groups" on page 285
l "Configuring Parameter Value Groups" on page 285
l "Modifying a Parameter" on page 284
l "Deleting a Parameter" on page 284
Administrator's GuideChapter 4: Reporting
Placing a System-defined Query or Parameter into a Category Page 298 of 743
Adding a New CategoryIn addition to using the existing report categories, you can create additional categories to meet your business needs.
To add a custom category:
1. Click Report Categories in the Administration section in the left pane.
The Deploy Reports and Categories displays the available categories. A toolbar across the top of the page displays buttons for the available actions.
2. Click Add New Category .
3. Define the properties for the new category and click the Save button.
Property Used for…
Public Setting this as Public makes the category available to everyone
Private Setting this as Private make the category available to you only
Hidden Select the Hidden checkbox to hide the display of this category in the Report Explorer. It will still be displayed in other Explorers.
Category Menu Name
Name of the Category
Category ID Category ID should be unique across all the categories. By default, the Category ID is auto-generated by the system. To specify the Category ID manually, deselect the System Generated checkbox and specify the category ID.
System Generated
To specify the Category ID manually, deselect the System Generated checkbox and specify the category ID.
Delete Cascade You can delete a category only if it is empty. To delete a category including its contents, check the Delete Cascade checkbox.
Note: Once set, Category ID and scope (Public / Private options) cannot be changed.
4. You can optionally add a report to the category. To do so, double-click any category to
open it and click the Add New Report button. Define the following properties in the Properties box:
Property Used for…
Public Setting this as Public makes the report available to everyone
Private Setting this as Private make the report available to you only
Administrator's GuideChapter 4: Reporting
Adding a New Category Page 299 of 743
Property Used for…
Hidden Check the Hidden checkbox, if you do not want to display this report in any of the dialogs and pages (except in the Report Explorer). Mark a report as hidden to stop users from directly accessing it.
Report File An existing data file from which a report is generated.
Report Name The Report Name has to be unique within a category
Report ID A unique ID for the report that is auto-generated by the system by default when you run and publish the report. To manually enter an ID of your choice, deselect the System Generated checkbox and enter an ID in the Report ID field.
Design Mode Text in Design Mode indicates if the report was designed using Studio (Web Studio or Desktop Studio) or ad hoc Report Wizard.
Deployment Type
A report deployed as Read Only cannot be modified and uploaded with same name. A report deployed as Custom can be modified and uploaded with the same name.
Output Format
Output Formats in which this report can be generated. Formats not selected here will not be available for this report.
System Generated
To specify a Report ID manually, deselect the System Generated checkbox and specify the Report ID.
Deleting a Category
To delete a custom category:
1. Click Report Categories in the Administration section in the left pane.
The Deploy Reports and Categories display the available categories. A toolbar across the top of the page displays buttons for the available actions.
2. Select the category that needs to be removed.
3. Click .
Note: Before eliminating the category, make sure it contains no reports . Otherwise, an error message will appear.
4. Refresh the page in order to allow sync with Report Explorer.
Job Execution StatusThe status of your scheduled reports can be displayed from this option. To open the Job Execution Status Page, go to Reports > Administration > Job Execution Status
Administrator's GuideChapter 4: Reporting
Deleting a Category Page 300 of 743
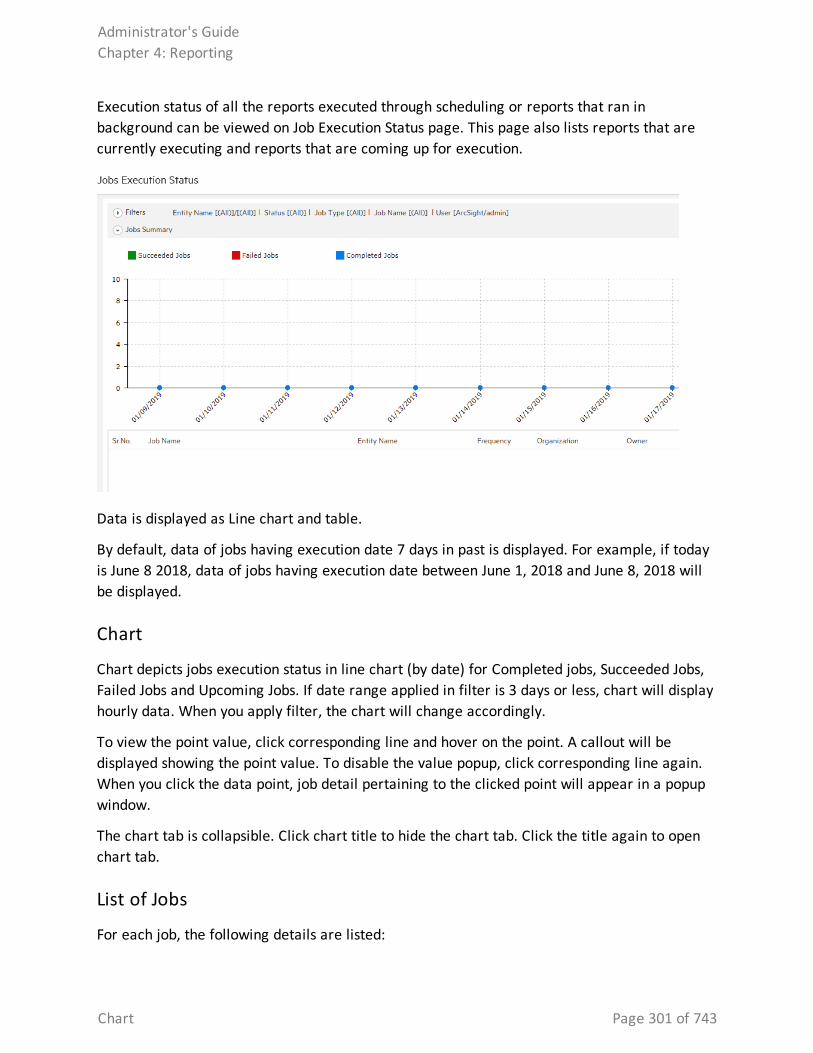
Execution status of all the reports executed through scheduling or reports that ran in background can be viewed on Job Execution Status page. This page also lists reports that are currently executing and reports that are coming up for execution.
Data is displayed as Line chart and table.
By default, data of jobs having execution date 7 days in past is displayed. For example, if today is June 8 2018, data of jobs having execution date between June 1, 2018 and June 8, 2018 will be displayed.
Chart
Chart depicts jobs execution status in line chart (by date) for Completed jobs, Succeeded Jobs, Failed Jobs and Upcoming Jobs. If date range applied in filter is 3 days or less, chart will display hourly data. When you apply filter, the chart will change accordingly.
To view the point value, click corresponding line and hover on the point. A callout will be displayed showing the point value. To disable the value popup, click corresponding line again. When you click the data point, job detail pertaining to the clicked point will appear in a popup window.
The chart tab is collapsible. Click chart title to hide the chart tab. Click the title again to open chart tab.
List of Jobs
For each job, the following details are listed:
Administrator's GuideChapter 4: Reporting
Chart Page 301 of 743
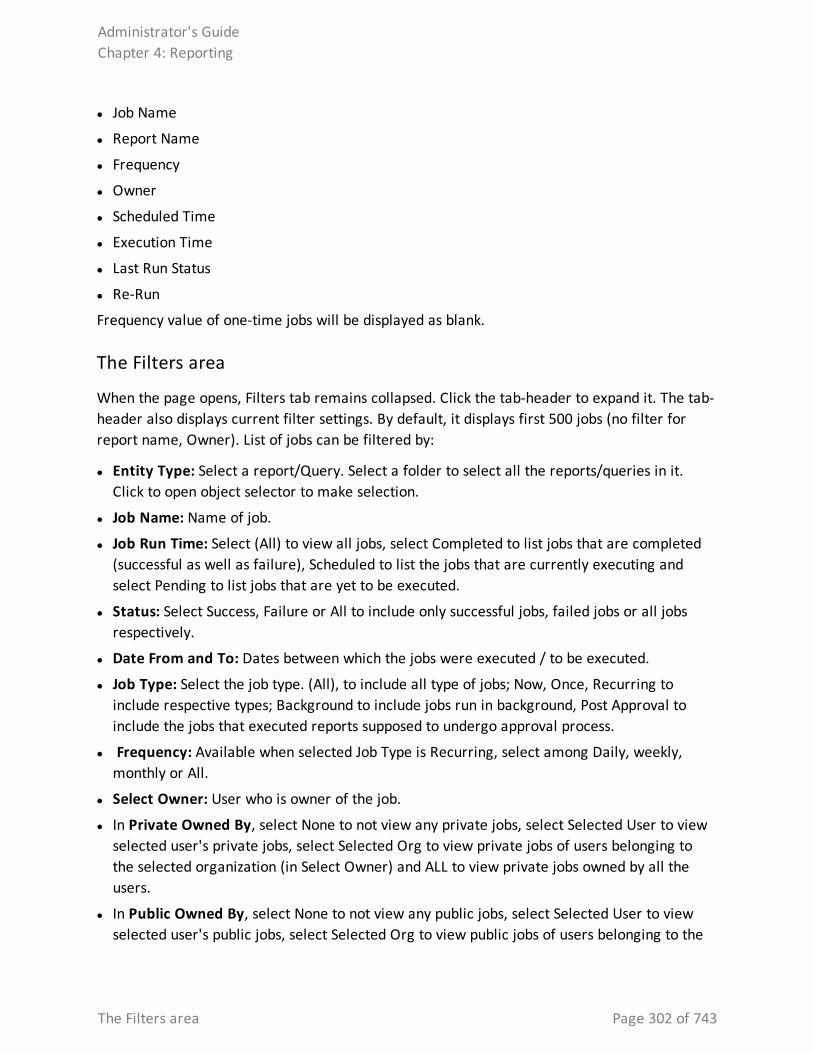
l Job Name
l Report Name
l Frequency
l Owner
l Scheduled Time
l Execution Time
l Last Run Status
l Re-Run
Frequency value of one-time jobs will be displayed as blank.
The Filters area
When the page opens, Filters tab remains collapsed. Click the tab-header to expand it. The tab-header also displays current filter settings. By default, it displays first 500 jobs (no filter for report name, Owner). List of jobs can be filtered by:
l Entity Type: Select a report/Query. Select a folder to select all the reports/queries in it. Click to open object selector to make selection.
l Job Name: Name of job.
l Job Run Time: Select (All) to view all jobs, select Completed to list jobs that are completed (successful as well as failure), Scheduled to list the jobs that are currently executing and select Pending to list jobs that are yet to be executed.
l Status: Select Success, Failure or All to include only successful jobs, failed jobs or all jobs respectively.
l Date From and To: Dates between which the jobs were executed / to be executed.
l Job Type: Select the job type. (All), to include all type of jobs; Now, Once, Recurring to include respective types; Background to include jobs run in background, Post Approval to include the jobs that executed reports supposed to undergo approval process.
l Frequency: Available when selected Job Type is Recurring, select among Daily, weekly, monthly or All.
l Select Owner: User who is owner of the job.
l In Private Owned By, select None to not view any private jobs, select Selected User to view selected user's private jobs, select Selected Org to view private jobs of users belonging to the selected organization (in Select Owner) and ALL to view private jobs owned by all the users.
l In Public Owned By, select None to not view any public jobs, select Selected User to view selected user's public jobs, select Selected Org to view public jobs of users belonging to the
Administrator's GuideChapter 4: Reporting
The Filters area Page 302 of 743
selected organization (in Select Owner) and ALL to view public jobs owned by all the users.
l Show (selecting the number): Select Top 100 to view first 100 jobs from the filtered list, select Top 500, Top 1000 and Top 4000 to view first 500, 1000 and 4000 jobs respectively.
Tip: Click a date to show jobs for that day in a pop-up.
Note: Jobs are listed in the ascending order of the time of execution.
Filtering the list
Provide filter criteria and click the Apply button. List of jobs having jobs that meet the filter criteria will be listed and will be plotted on chart.
Backup and Restore Report ContentYou can back up, restore, and disseminate report content and configuration information, using iPackager to create a CAB file, and Deploy Report Bundler to deploy it. For more information, see "iPackager Utility" below, and "Deploying a Report Bundle" on page 311.
iPackager UtilityThe iPackager utility enables you to package reports and report objects residing in Logger. This package can be later imported to a different Logger installation. If you own multiple Loggers, you can use the packages to configure reporting features on them. This method eliminates the need to configure reporting features for each Logger.
Note: The iPackager utility requires administrator privileges.
To access the iPackager utility:
1. Click Reports from the top navigation bar. The Reports home page displays.
2. Click Administration from the Reports menu. The Administration menu opens.
3. Click iPackager at the bottom of the menu. The iPackager page displays.
How iPackager Works
You first create a configuration (.conf) file, in which you can collect (import) the references for all the entity objects that you want to include in the package. You can save the configuration file and edit it at any time. Once you are satisfied with the contents of the .conf
Administrator's GuideChapter 4: Reporting
Filtering the list Page 303 of 743
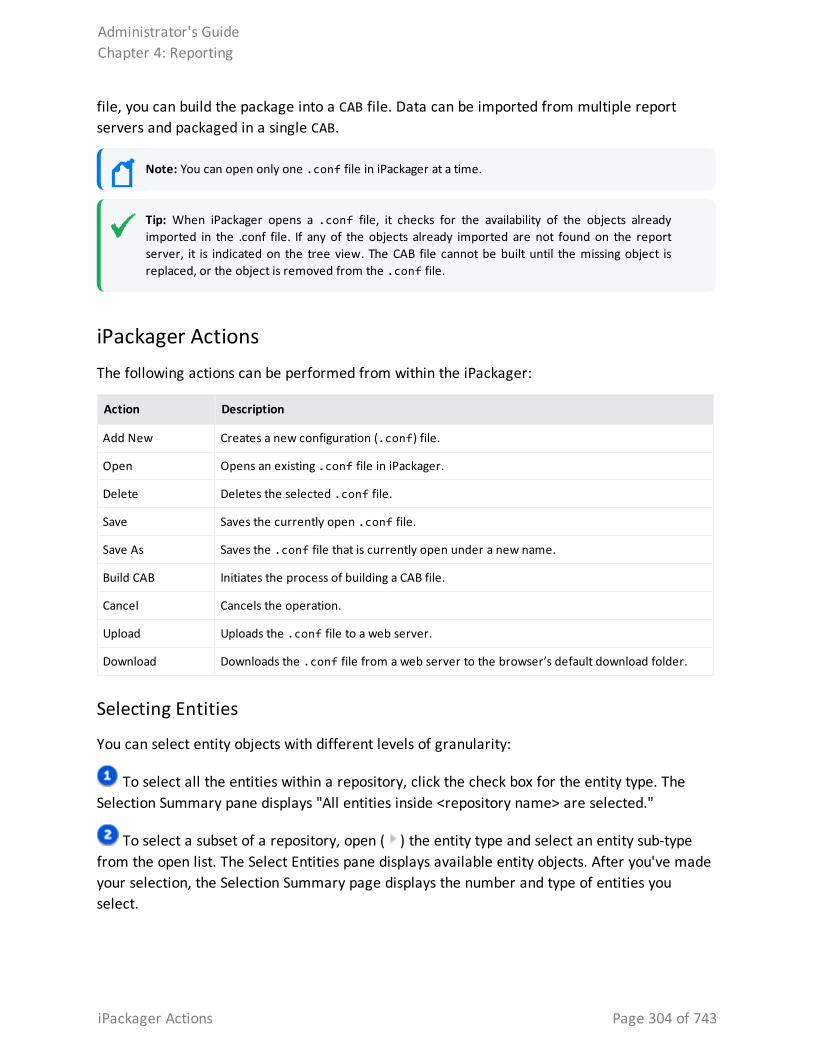
file, you can build the package into a CAB file. Data can be imported from multiple report servers and packaged in a single CAB.
Note: You can open only one .conf file in iPackager at a time.
Tip: When iPackager opens a .conf file, it checks for the availability of the objects already imported in the .conf file. If any of the objects already imported are not found on the report server, it is indicated on the tree view. The CAB file cannot be built until the missing object is replaced, or the object is removed from the .conf file.
iPackager ActionsThe following actions can be performed from within the iPackager:
Action Description
Add New Creates a new configuration (.conf) file.
Open Opens an existing .conf file in iPackager.
Delete Deletes the selected .conf file.
Save Saves the currently open .conf file.
Save As Saves the .conf file that is currently open under a new name.
Build CAB Initiates the process of building a CAB file.
Cancel Cancels the operation.
Upload Uploads the .conf file to a web server.
Download Downloads the .conf file from a web server to the browser’s default download folder.
Selecting Entities
You can select entity objects with different levels of granularity:
To select all the entities within a repository, click the check box for the entity type. The Selection Summary pane displays "All entities inside <repository name> are selected."
To select a subset of a repository, open ( ) the entity type and select an entity sub-type from the open list. The Select Entities pane displays available entity objects. After you've made your selection, the Selection Summary page displays the number and type of entities you select.
Administrator's GuideChapter 4: Reporting
iPackager Actions Page 304 of 743
To select all the entities from the report server, click "Select All Data From Report Server" at the bottom of the Entity Type pane. The Selection Summary pane displays "All data from report server is selected." Click "Deselect Complete Data" to revert the selection.
Opening a Configuration File
To open an existing .conf file in iPackager:
1. Click Open in the iPackager toolbar. The Open Configuration File dialog opens.
2. Select an available configuration file.
3. Click Open.
Selecting Entity ObjectsYou can select entity objects with different levels of granularity:
l To select all the entities within a repository, click the check box for the entity type. The Selection Summary pane displays "All entities inside <repository name> are selected."
l To select a subset of a repository, open ( ) the entity type and select an entity sub-type from the open list. The Select Entities pane displays available entity objects. After you've made your selection, the Selection Summary page displays the number and type of entities you select.
l To select all the entities from the report server, click "Select All Data From Report Server" at the bottom of the Entity Type pane. The Selection Summary pane displays "All data from report server is selected." Click "Deselect Complete Data" to revert the selection.
Adding Entity Objects to a Configuration FileYou can import entity object references from a report server into a .conf file.
Note: Only references to the entities will be imported. The actual components will be imported during the creation of the CAB file.
To add entity object references to a .conf file:
1. Select the entity objects you want to import. See "Selecting Entity Objects" above.
2. Click Save or Save As to open the Save Configuration File dialog box.
3. Enter a name for the configuration file.
4. Click Save. If successful, a confirmation message displays at the top of the page.
Administrator's GuideChapter 4: Reporting
Opening a Configuration File Page 305 of 743
Note: The Add New button is now available, which clears the entity selection panes for a new configuration file.
Report Category Filters
A Search Group filter can be optionally assigned to each report category. Assigning a Search Group filter to a report category means that all the reports in the category will only process events returned by this filter.
To assign a search group filter to a report category:
1. Create the filter that you would like to apply to every report in a given category. See "Filters" on page 314 for the details of creating a filter of type Search Group.
2. Open the Reports page.
3. In the menu, under Administration, click Report Category Filters.
4. Select the desired filter for each category.
To accelerate the search, the query type is listed next to the Search Group filter name in the list page. List is displayed in alphabetical order.
Note: For Unified Queries: Duplicate Storage Groups and Search Groups are not supported. The user is unable to create reports with duplicate parameters. Therefore, if the same condition added previously as filter is selected, a warning message is displayed. On the other hand, with the exception of MySQL reports, the peers option is currently disabled.
Note: Report category filter in a Logger Search Report will override the Search Group Filter. If the category of the Logger Search Report does not have a filter, the system will apply the filter in the Search Group Filter.
5. Click Save.
To remove a search group filter from a report category:
1. Open the Reports page. In the menu, under Administration, click Report Category Filters.
2. In the pull-down menu associated with the report category from which you want to remove the filter, select None.
3. Click Save.
Administrator's GuideChapter 4: Reporting
Report Category Filters Page 306 of 743
Deleting Entity Objects from a Configuration File
To delete an entity object within a .conf file:
1. Open the .conf file in iPackager.
2. Open the repository that contains the entity object.
3. Deselect the check box for the object.
4. Click Save.
Modifying Entity Object PropertiesYou can modify the properties for entity objects in an open .conf file.
To modify an entity object property:
1. Click Open to open an existing .conf file.
2. Select the entity types to open the object you would like to modify.
3. From the Select Entity pane, right-click the object and click Properties from the popup menu.
Object names are pre-populated with the object name from the report server. You can change the name of the object. If you change the name here, the object is packaged with the new name, but its original name on the report server will not change.
In addition, all objects have some variation of the following Deployment Options:
l If Exists:
o Overwrite — While importing, if the component is found in the package, replace the one in package with the one on the report server.
o Delete — While importing, if the component is found in the package, delete it.
o Cascade Delete (Category folders only) — Delete the category folder, even if it contains reports.
l If Not Exists:
o Add — While importing, if the component is not found in the package, add it to the package.
Category Properties
While creating a CAB file in iPackager, you can change the name for a selected Category. If you change the name here, the category is packaged with the new name, but its original name
Administrator's GuideChapter 4: Reporting
Deleting Entity Objects from a Configuration File Page 307 of 743
on the report server will not change.
Change a Category name in iPackager
1. From the Navigation tree in iPackager, select a Category you want to re-name.
2. Right-click and select Properties. The Category Properties dialog opens.
3. Change the properties as needed.
4. Click Update. The new Category name displays in the iPackager.
Report Properties
When you click on a report in the navigation tree of the iPackager page, the following property page opens.
Administrator's GuideChapter 4: Reporting
Report Properties Page 308 of 743
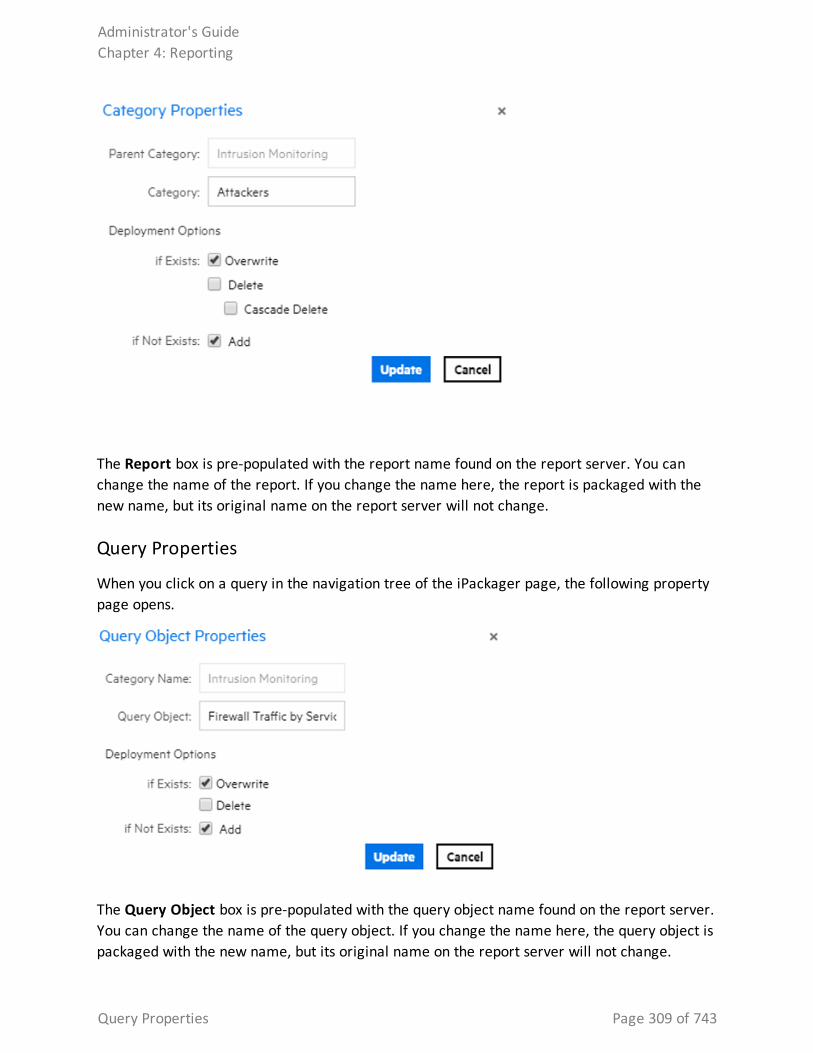
The Report box is pre-populated with the report name found on the report server. You can change the name of the report. If you change the name here, the report is packaged with the new name, but its original name on the report server will not change.
Query Properties
When you click on a query in the navigation tree of the iPackager page, the following property page opens.
The Query Object box is pre-populated with the query object name found on the report server. You can change the name of the query object. If you change the name here, the query object is packaged with the new name, but its original name on the report server will not change.
Administrator's GuideChapter 4: Reporting
Query Properties Page 309 of 743
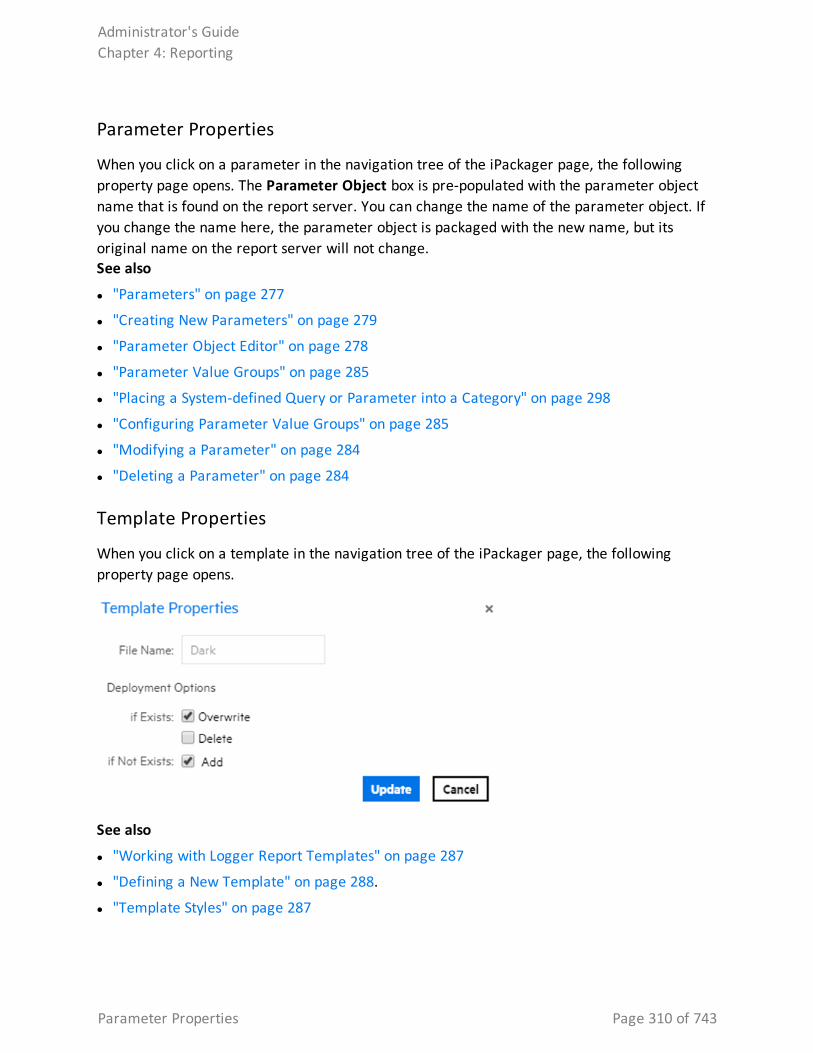
Parameter Properties
When you click on a parameter in the navigation tree of the iPackager page, the following property page opens. The Parameter Object box is pre-populated with the parameter object name that is found on the report server. You can change the name of the parameter object. If you change the name here, the parameter object is packaged with the new name, but its original name on the report server will not change.See also
l "Parameters" on page 277
l "Creating New Parameters" on page 279
l "Parameter Object Editor" on page 278
l "Parameter Value Groups" on page 285
l "Placing a System-defined Query or Parameter into a Category" on page 298
l "Configuring Parameter Value Groups" on page 285
l "Modifying a Parameter" on page 284
l "Deleting a Parameter" on page 284
Template Properties
When you click on a template in the navigation tree of the iPackager page, the following property page opens.
See also
l "Working with Logger Report Templates" on page 287
l "Defining a New Template" on page 288.
l "Template Styles" on page 287
Administrator's GuideChapter 4: Reporting
Parameter Properties Page 310 of 743
Building the CAB FileWhen you issue command to build the CAB file, the actual objects specified in the references in your open .conf file are actually picked up from the respective locations and a CAB file is built. This CAB file will contain all the objects.
If any of the information saved in the .conf file is not available at the right source while building the CAB, then you will see an error message and the CAB building process stops. You will need to fix any errors before rebuilding the CAB file.
To build the CAB file:
1. Click Build CAB.
2. On the Build Properties dialog, enter a name for the file. Make sure the filename only contains alphanumeric and dash characters. Otherwise, you cannot deploy the file afterwards.
3. Optionally, enter information in the Author, Company, Version, and Comment fields.
4. Click Build and Download. The Build Status window displays the status. To halt the process, click Cancel Build.
5. When the CAB file is complete, follow the prompts to view the objects included in the file.
Deploying a Report BundleYou might obtain additional sets of reports from ArcSight to address new security scenarios, add packaged solutions, or enhance your current coverage with updated reports. You can use the Deploy Report Bundle page to load and deploy packages of new reports onto your Logger system.
To deploy a report CAB file:
On the Reports page left panel menu, click the Deploy Report Bundle link to start.
A report package (or CAB file) can contain many types of reporting resources, including:
l Categories and reports
l Organization information
l Portal properties and server properties
l Parameter objects
l Query objects
l Ad hoc report templates
Administrator's GuideChapter 4: Reporting
Building the CAB File Page 311 of 743
l Printer settings
l Database connections
To upload and deploy a report package:
1. In the entry box provided under Step 1, specify the reports package file name and with its full path. Click Browse to locate the file.
2. Click Upload. The content is uploaded and information is displayed about the included categories and report objects.
3. To create a deployment process log, select the Create Log File option.
4. Click Deploy to continue with the deployment process, or click Cancel to discontinue. A log file will be created if the Create Log File checkbox was selected.
Status information is displayed about the objects in the package being deployed. A legend is displayed just below the Deploy button. Information about each of the components in the package is displayed in respective tabs.
Note: Overwrite behaviors are determined when the package was created.
For example, protocol on whether or not an object in the deployed package will overwrite an existing object on the system, and under what circumstances, is determined at package creation time. Therefore, these settings on package deployment are not available to you at deploy time. See "iPackager Utility" on page 303.
5. Click Download Log
The content of the deployed reports package is available on the respective Logger Reports pages. Solution Reports will be listed under Solution Reports on the left panel menu. For more information about these types of reports, see "System-defined Categories" on page 294.
To customize the cab information:
When deploying a CAB file from a source Logger to a target Logger, if the categories being imported do not have identical names and IDs on both Loggers, the deployment may fail.
To customize the information during deployment and look for any failures, Go to ReportClient.properties file and update these values:
l Enable the events. By default, this value is false
l Configure the class path as appropriate.
Should you encounter this issue, rename the conflicting category in the target Logger or the source Logger (you will need to recreate the CAB file if you do this on the source Logger) such that the category has a unique name or ID. Then, redeploy the CAB file.
Administrator's GuideChapter 4: Reporting
Deploying a Report Bundle Page 312 of 743
Note: If a CAB file is created for Logger Search Reports, users may need to relink the filter or the saved search once the report object is in the Destination Logger.
Deleting an iPackager Configuration File
To delete a configuration file:
1. Open the .conf file in iPackager.
2. Click Delete.
3. On the warning dialog, click Yes to confirm the deletion.
Administrator's GuideChapter 4: Reporting
Deleting an iPackager Configuration File Page 313 of 743
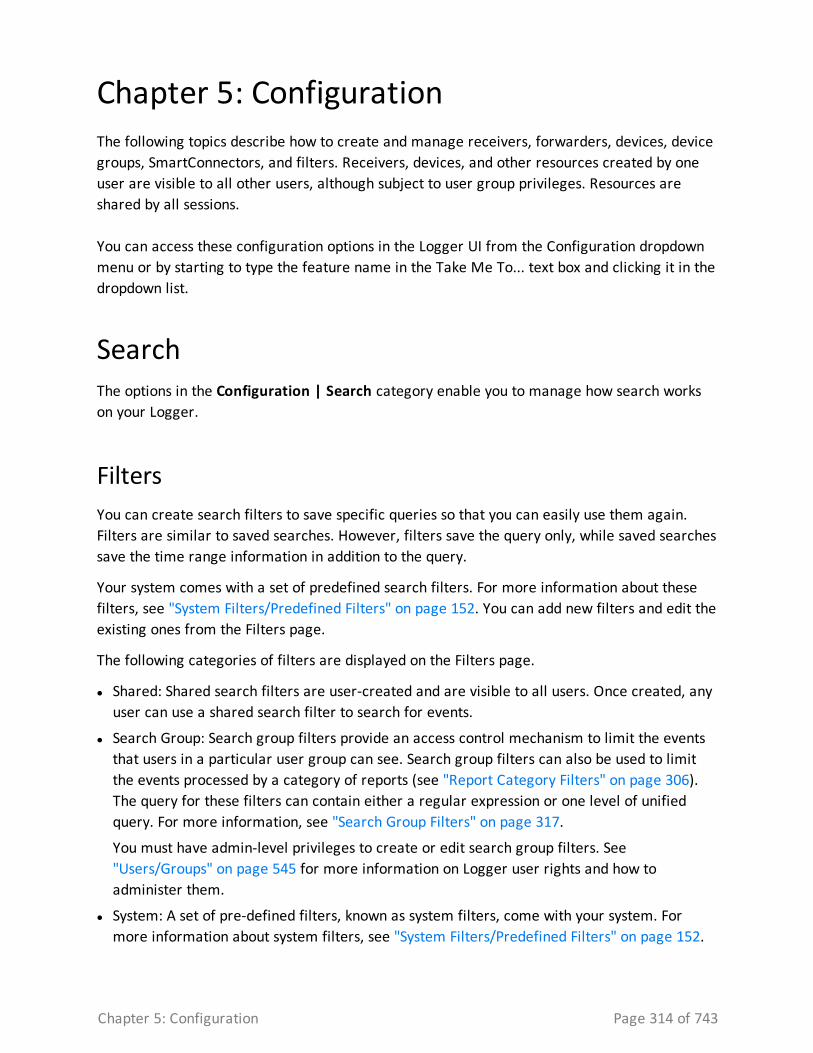
Chapter 5: ConfigurationThe following topics describe how to create and manage receivers, forwarders, devices, device groups, SmartConnectors, and filters. Receivers, devices, and other resources created by one user are visible to all other users, although subject to user group privileges. Resources are shared by all sessions.
You can access these configuration options in the Logger UI from the Configuration dropdown menu or by starting to type the feature name in the Take Me To... text box and clicking it in the dropdown list.
SearchThe options in the Configuration | Search category enable you to manage how search works on your Logger.
FiltersYou can create search filters to save specific queries so that you can easily use them again. Filters are similar to saved searches. However, filters save the query only, while saved searches save the time range information in addition to the query.
Your system comes with a set of predefined search filters. For more information about these filters, see "System Filters/Predefined Filters" on page 152. You can add new filters and edit the existing ones from the Filters page.
The following categories of filters are displayed on the Filters page.
l Shared: Shared search filters are user-created and are visible to all users. Once created, any user can use a shared search filter to search for events.
l Search Group: Search group filters provide an access control mechanism to limit the events that users in a particular user group can see. Search group filters can also be used to limit the events processed by a category of reports (see "Report Category Filters" on page 306). The query for these filters can contain either a regular expression or one level of unified query. For more information, see "Search Group Filters" on page 317.
You must have admin-level privileges to create or edit search group filters. See "Users/Groups" on page 545 for more information on Logger user rights and how to administer them.
l System: A set of pre-defined filters, known as system filters, come with your system. For more information about system filters, see "System Filters/Predefined Filters" on page 152.
Chapter 5: Configuration Page 314 of 743
Search filters can have one of two different types of query:
l Unified Query: Unified Query (Unified) search queries specify keywords and fields.
l Regular Expression: Regular Expression (Regex Query) search queries specify a regular expression. Regular expression based search filters are useful for creating real time alerts, which accept only regex queries.
l The Search Group Filters manage the association of User Groups with Search Group Filters. Search Group Filters can be used to restrict events in the following two ways: Unified or Regex queries.
To create a filter
1. From the navigation bar Configuration menu, select Filters to open the Filter page.
2. Click Add. The Add Filter page displays.
3. Enter a name for the new filter in the Name field. Filter names are case-sensitive.
4. Select the category from the type drop down:
l For Shared Filter: Select whether is Unified or Regex. Click next
l For Search Group filter: select search group filter. Click next.
Note: If you create a Search Group filter, make sure that you associate it to a user group, as described in "Search Group Filters" on page 317.
5. If Search Group Filter is the category, select the type: Unified or Regex Query from the type drop down.
Once you select the type, the following message will be displayed: The search group will be automatically updated in the database. Do you want to continue? If click cancel, the current category remains selected.
6. Enter the query for the new filter.
Administrator's GuideChapter 5: Configuration
Filters Page 315 of 743
l For Unified queries:
Type a query. Logger’s Search Helper enables you to quickly build a query expression by automatically providing suggestions, possible matches, and applicable operators. See "Search Helper" on page 99 for more information. Duplicate Storage Groups and Search Groups are not supported. The user is unable to create reports with duplicate parameters.
OR
Click Advanced Search to use the Search Builder Tool to create the query. For details about using the Search Builder Tool, see " Classic Search: Using the Advanced Search Builder" on page 102.
When adding a filter in Device Groups or Storage Groups, Logger displays a confirmation message as this action limits future searches for both search and report.
l For Regex queries: Enter the regular expression in the Query text box.
7. Click Save.
To create a filter by copying an existing one:
1. From the navigation bar Configuration menu, select Filters to open the Filter page.
2. Locate the filter that you want to copy from the list of filters. Click the Copy icon ( ).
A new filter with the name “Copy of <filtername>” is created.
3. Change the name of the filter and edit the query for the new filter if necessary.
4. Click Save.
To edit a filter:
1. From the navigation bar Configuration menu, select Filters to open the Filter page.
2. Find the filter that you want to edit and click the Edit icon ( ) on that row.
3. Change the information accordingly based on the query type:
4. Click Save
Note: Logger does not support right click functions. If any of the options is selected, an invalid page is opened or saved . Make sure to edit the search group filter by double clicking the filter name or click the correspondent edit button.
Peer /Pipeline Operator:
It applies for Regex /Unified filter only. The query textbox in the search group category does not allow either [_peer] or [|] to use pipeline expressions.
Administrator's GuideChapter 5: Configuration
Filters Page 316 of 743
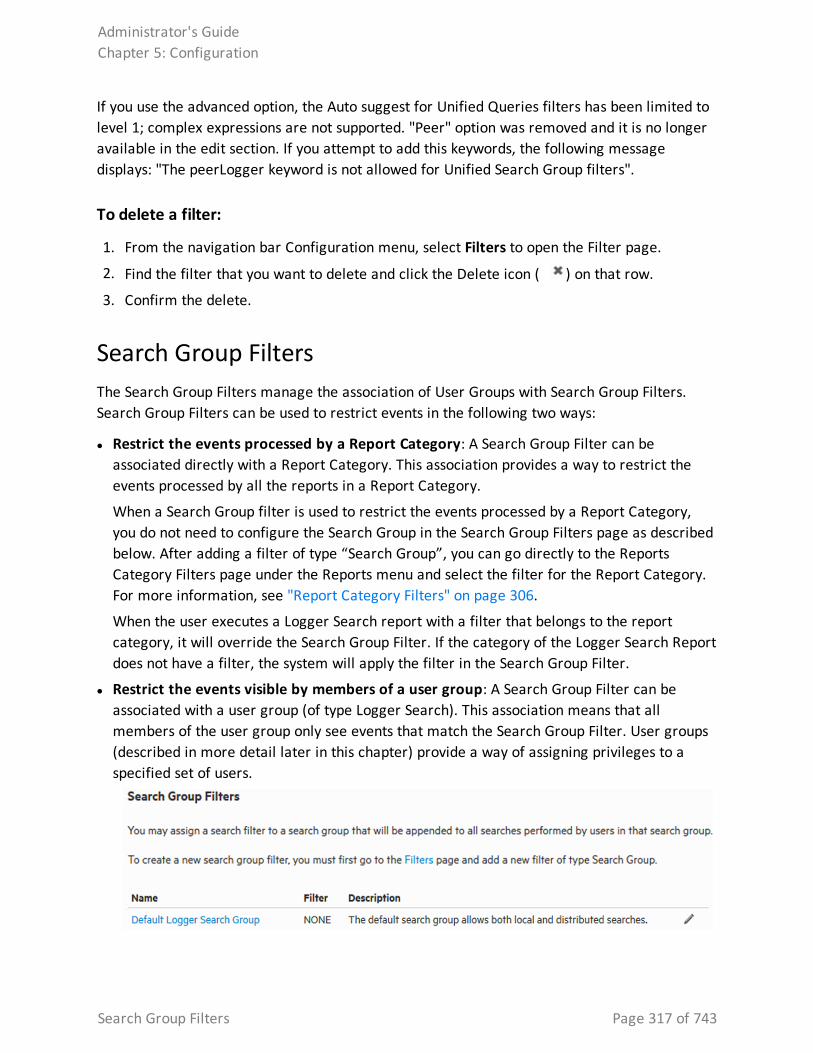
If you use the advanced option, the Auto suggest for Unified Queries filters has been limited to level 1; complex expressions are not supported. "Peer" option was removed and it is no longer available in the edit section. If you attempt to add this keywords, the following message displays: "The peerLogger keyword is not allowed for Unified Search Group filters".
To delete a filter:
1. From the navigation bar Configuration menu, select Filters to open the Filter page.
2. Find the filter that you want to delete and click the Delete icon ( ) on that row.
3. Confirm the delete.
Search Group FiltersThe Search Group Filters manage the association of User Groups with Search Group Filters. Search Group Filters can be used to restrict events in the following two ways:
l Restrict the events processed by a Report Category: A Search Group Filter can be associated directly with a Report Category. This association provides a way to restrict the events processed by all the reports in a Report Category.
When a Search Group filter is used to restrict the events processed by a Report Category, you do not need to configure the Search Group in the Search Group Filters page as described below. After adding a filter of type “Search Group”, you can go directly to the Reports Category Filters page under the Reports menu and select the filter for the Report Category. For more information, see "Report Category Filters" on page 306.
When the user executes a Logger Search report with a filter that belongs to the report category, it will override the Search Group Filter. If the category of the Logger Search Report does not have a filter, the system will apply the filter in the Search Group Filter.
l Restrict the events visible by members of a user group: A Search Group Filter can be associated with a user group (of type Logger Search). This association means that all members of the user group only see events that match the Search Group Filter. User groups (described in more detail later in this chapter) provide a way of assigning privileges to a specified set of users.
Administrator's GuideChapter 5: Configuration
Search Group Filters Page 317 of 743
Tip: The User Group of type Default Logger Search Group is listed in the Name column and the associated filter is listed in the middle column.
Users who belong to a User Group that does not have a Search Group Filter will see all events.
To add, edit, or delete Search Group Filters, see "Filters" on page 314. To add, edit, or delete User Groups, see "Users/Groups" on page 545 for more information on Logger user rights and how to administer. Only users that are members of a Logger Rights group can assign Search Group Filters.
To associate a Search Group Filter with a User Group:
1. If the User Group that you want to associate with the Search Group Filter does not exist, create a new User Group of type Search Group. For instructions, see "Users/Groups" on page 545.
2. If the Search Group Filter you want to associate with the User Group does not exist, create a filter of type Search Group. For instructions, see "To create a filter" on page 315. When creating the filter, from the Type pull-down menu select the Search Group option.
3. From the navigation bar Configuration menu, select Search Group Filters.
4. Select the User Group in the Search Group Filters table. Click the Edit icon ( ).
To accelerate the search, the query type is listed next to the Search Group filter name in the list page.
5. Select a filter from the pulldown list. (Only Search Group type filters are listed.)
6. Click Save.
Saved SearchesA saved search, unlike a search filter, recalls a specific query with its time range and fieldset. Saving the time range supports scheduled searches and reports. Fieldsets (using the fieldset text box or drag and drop) allows selecting the specific event fields to display in the results. You can schedule a Saved Search to run at a specific interval or generate an alert. For more information, see " Scheduled Searches/Alerts" on page 320.
The Saved Searches page displays and supports adding, editing, and deleting all saved searches. You can add a saved search here or directly from the Search page.
Saved Search Page
For information on how to save a search from the Search page, see "Saving Queries, Creating Saved Searches and Saved Filters." on page 150
Administrator's GuideChapter 5: Configuration
Saved Searches Page 318 of 743
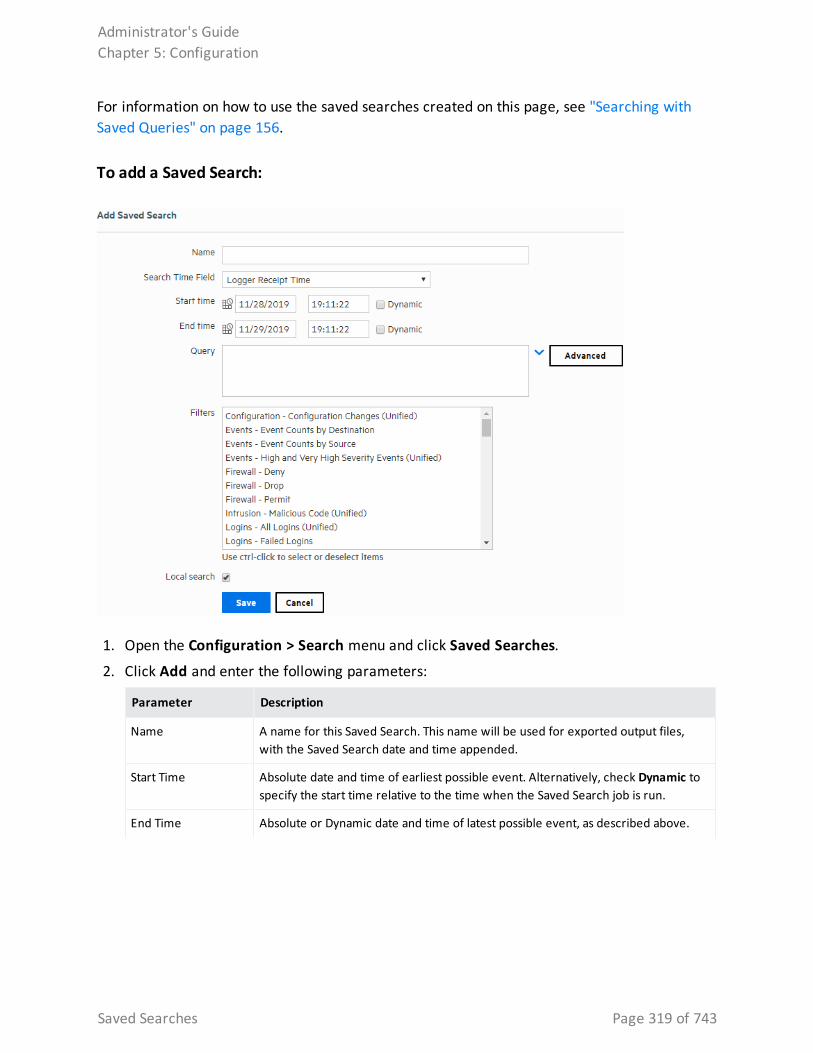
For information on how to use the saved searches created on this page, see "Searching with Saved Queries" on page 156.
To add a Saved Search:
1. Open the Configuration > Search menu and click Saved Searches.
2. Click Add and enter the following parameters:
Parameter Description
Name A name for this Saved Search. This name will be used for exported output files, with the Saved Search date and time appended.
Start Time Absolute date and time of earliest possible event. Alternatively, check Dynamic to specify the start time relative to the time when the Saved Search job is run.
End Time Absolute or Dynamic date and time of latest possible event, as described above.
Administrator's GuideChapter 5: Configuration
Saved Searches Page 319 of 743
Parameter Description
Search Time Fields Select the search time type: Logger Receipt Time or End Time (Event time).
Query Terms Enter the query in the text field or select one or more Filters from the list below the text field.
When you type a query, Logger’s Search Helper enables you to quickly build a query expression by automatically providing suggestions, possible matches, and applicable operators. See "Search Helper" on page 99 for more information.
Local Search Check this box to limit the Saved Search to the local Logger box. If the Local Search box is left unchecked, the Saved Search will include all Peer Loggers as well as the local Logger.
3. Click Save to add the new Saved Search, or Cancel to quit.
To edit a Saved Search:
1. Open the Configuration > Search menu and click Saved Searches.
2. Find the Saved Search that you want to edit and click the Edit icon ( ) on that row.
3. Change the information in the form and click Save.
To delete a Saved Search:
1. Open the Configuration > Search menu and click Saved Searches.
2. Find the Saved Search that you want to delete and click the Delete icon ( ) on that row.
3. Confirm the action.
Scheduled Searches/AlertsYou can schedule a Saved Search to run at a specific interval. A scheduled Saved Search can be configured to generate an alert. The results of a scheduled search are written to a file, as described in "Saved Search Files" on page 331. The results of a scheduled Alert are sent to a specified destination.
The Scheduled Searches/Alerts page displays a list of currently scheduled Saved Searches and Alerts. From here you can add a new Scheduled Search or Alert and manage existing ones. For more information about scheduled Saved Search Alerts, see "Saved Search Alerts" on page 327.
Note: Before you schedule a Saved Search Alert, you must have created at least one Saved Search. Saved searches used in Alerts cannot contain aggregation operators such as chart or top.
Administrator's GuideChapter 5: Configuration
Scheduled Searches/Alerts Page 320 of 743
To add an new Scheduled Search or Alert:
You can add a new Scheduled Search or Alert from the Configuration menu or directly from the search results page.
l To set up a Scheduled Search Alert from the search results page (Analyze > Classic Search), see "Creating Saved Search Alerts (Scheduled Alerts)" on page 328.
l To set up a Scheduled Search from the search results page (Analyze > Classic Search), follow the instruction in "Saving Queries, Creating Saved Searches and Saved Filters." on page 150, set the Type to Scheduled Search and select the Schedule it option.
l To set up a Scheduled Search or Alert from the configuration menu (Configuration | Search > Scheduled Searches/Alerts, see " Adding a Scheduled Search or Scheduled Alert" on the next page.
To see list of the existing Scheduled Searches and Alerts:
Open the Configuration | Search menu and click Scheduled Searches/Alerts.
A list of the current Scheduled Searches and Alerts is displayed.
To edit an existing Scheduled Search or Alert:
1. Open the Configuration | Search menu and click Scheduled Searches/Alerts.
2. Locate the Scheduled Search/Alert that you want to edit and click the Edit icon ( ) on that row.
3. Click the Edit icon ( ) and update the parameters as needed. For details about the settings, see "To set up a Scheduled Search or Alert from the Scheduled Searches/Alerts page:" on the next page.
4. Click Save to update the Scheduled Search/Alert or Cancel to abandon your changes.
To remove a Scheduled Search or Alert:
1. Open the Configuration | Search menu and click Scheduled Searches/Alerts.
2. Identify the Scheduled Search/Alert that you want to remove, and click the Remove icon () on that row.
3. Click OK to confirm the removal, or click Cancel to keep the Scheduled Search/Alert.
To enable or disable a Scheduled Search or Alert
1. Open the Configuration | Search menu and click Scheduled Searches/Alerts.
2. Identify the Scheduled Search/Alert that you want to enable.
3. Click the associated icon ( or ) to enable or disable the alert.
Administrator's GuideChapter 5: Configuration
Scheduled Searches/Alerts Page 321 of 743
To view triggered Alerts:
See "Viewing Alerts" on page 164.
Adding a Scheduled Search or Scheduled AlertYou can schedule a Saved Search or an Alert to run at any time. Before you schedule a Saved Search or Alert to run, you must have created or saved at least one Saved Search. See "Saving Queries, Creating Saved Searches and Saved Filters." on page 150.
You can add a new Scheduled Search or Alert from the Configuration menu or directly from the search results page.
l To set up a Scheduled Search Alert from the search results page (Classic or Search), see "Creating Saved Search Alerts (Scheduled Alerts)" on page 328.
l To set up a Scheduled Search from the search results page (Classic o Search), follow the instruction in "Saving Queries, Creating Saved Searches and Saved Filters." on page 150, set the Type to Scheduled Search and select the Schedule it option.
To set up a Scheduled Search or Alert from the Scheduled Searches/Alerts page:
1. Open the Configuration > Search menu and click Scheduled Searches/Alerts.
2. Click Add. A screen like the following is displayed.
Administrator's GuideChapter 5: Configuration
Adding a Scheduled Search or Scheduled Alert Page 322 of 743
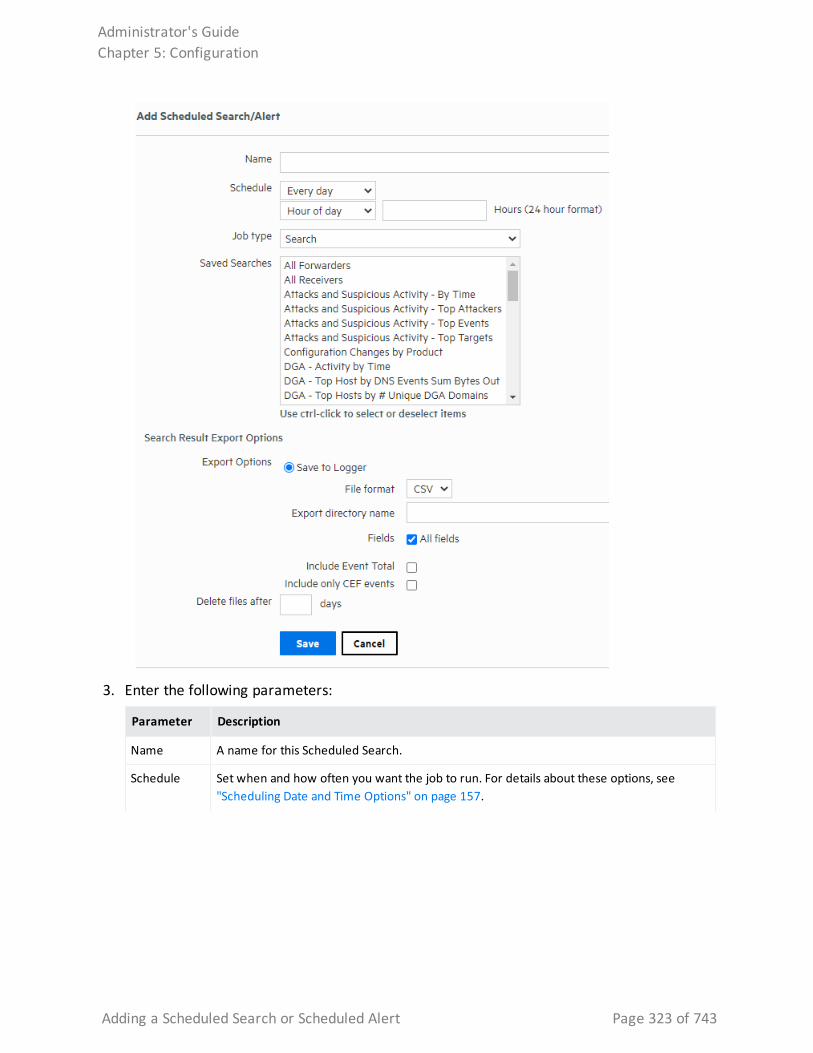
3. Enter the following parameters:
Parameter Description
Name A name for this Scheduled Search.
Schedule Set when and how often you want the job to run. For details about these options, see "Scheduling Date and Time Options" on page 157.
Administrator's GuideChapter 5: Configuration
Adding a Scheduled Search or Scheduled Alert Page 323 of 743
Parameter Description
Job Type Select Search to schedule a Saved Search.
Select Alert to schedule a Saved Search Alert.
Saved Searches
Select from the list of saved searches. If none of the saved searches suits your needs, click the Saved Searches page to define a new search. Then come back to this page to schedule it. For more information about defining a Saved Search query, see "Saved Searches" on page 318.
You can use Ctrl+click to select and remove items from the list.
Note: When multiple saved searches are specified in one scheduled search job, the resulting file contains the number of hits for each saved search and not the actual events.
Note: You can only select one Saved Search for each Alert you configure.
Note: Aggregation operators such as chart and top cannot be included in the search query for Scheduled Alerts. Saved searches that contain aggregation operators are not displayed in the selection list after you specify searches you have created are not displayed in the selection list for Saved Search Alerts.
4. If you selected the job type Search, specify the Search Result Export Options
Administrator's GuideChapter 5: Configuration
Adding a Scheduled Search or Scheduled Alert Page 324 of 743
Parameter Description
Export Options
Select one of these options:
l (Appliance only) Export to remote location: The file is written to an NFS mount, or a CIFS mount location that you specify.
l Save in Logger: The file is saved to the Logger’s onboard disk. If the file is saved locally, you can use the Saved Search Files ("Saved Search Files" on page 331) feature to access those files.
l Save in local disk: The file is saved in a local system from which you access Logger or a browser for viewing or saving.
Tip: The Logger Appliance supports mounting through the user interface. Software Logger uses its filesystem, which can contain remote locations mounted through the operating system.
File Format Select a format for the exported search results.
l CSV, for comma-separated values file.
l PDF, for a report-style file that contains search results as charts and in tables. You must specify a title for the report in the Title field. If the search query contains an operator that creates charts such as chart, top, and so on, charts are included in the PDF file. In that case, you can also set the Chart Type and Chart Result Limit fields. These fields are described later in this table.
Remote Location
This field is only available on the Logger Appliance. Use the drop down to select an existing Remote File System location. If there are none, a link to the Remote File System location page is displayed.
Export Directory Name
For the Logger Appliance, select the directory where the search results will be exported from the pull-down menu.
For Software Logger, enter the directory path in this field, which can be a path to a local directory or to a mount point on the machine on which Software Logger is installed.
By default, all saved searches are stored in /opt/arcsight/logger/userdata/logger/user/logger/data/savedsearch.
Tip: To group your searches in folders, indicate a subdirectory in which to store them.
If a directory of the specified name does not exist, it is created. If a directory of the specified name exists and the Overwrite box is not checked, an error is generated. If the Overwrite box is checked, the existing directory contents are overwritten.
Search Job Options
Administrator's GuideChapter 5: Configuration
Adding a Scheduled Search or Scheduled Alert Page 325 of 743
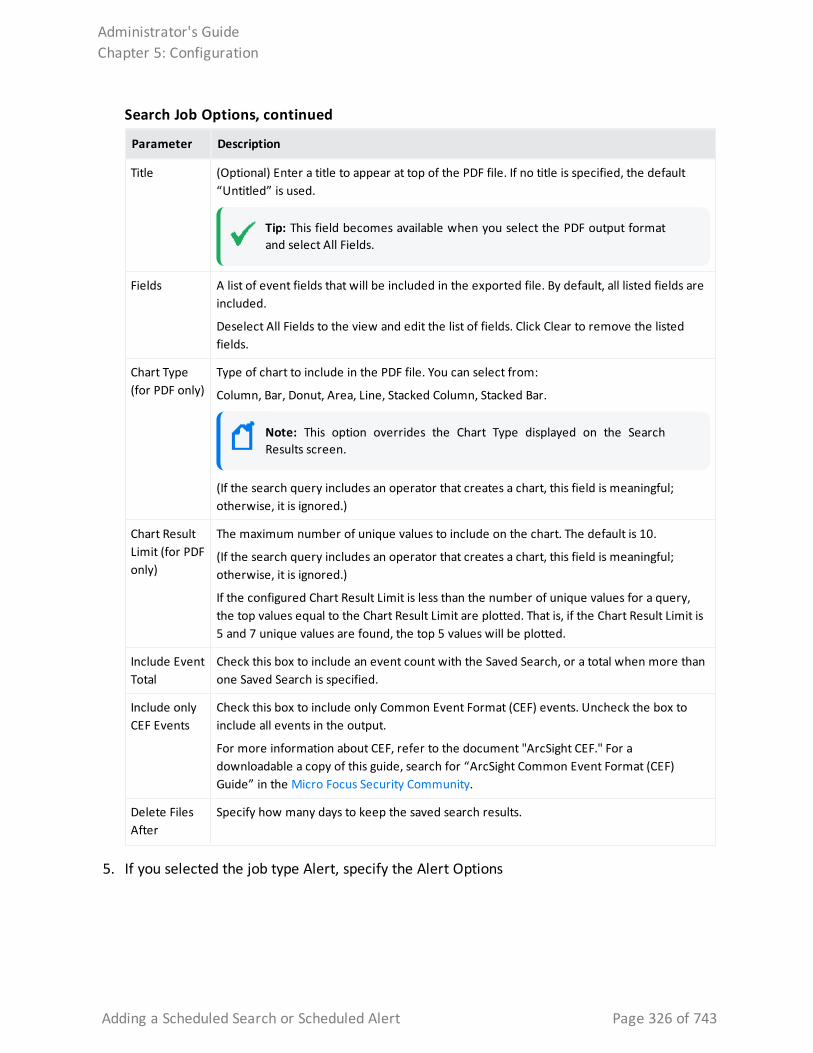
Parameter Description
Title (Optional) Enter a title to appear at top of the PDF file. If no title is specified, the default “Untitled” is used.
Tip: This field becomes available when you select the PDF output format and select All Fields.
Fields A list of event fields that will be included in the exported file. By default, all listed fields are included.
Deselect All Fields to the view and edit the list of fields. Click Clear to remove the listed fields.
Chart Type (for PDF only)
Type of chart to include in the PDF file. You can select from:
Column, Bar, Donut, Area, Line, Stacked Column, Stacked Bar.
Note: This option overrides the Chart Type displayed on the Search Results screen.
(If the search query includes an operator that creates a chart, this field is meaningful; otherwise, it is ignored.)
Chart Result Limit (for PDF only)
The maximum number of unique values to include on the chart. The default is 10.
(If the search query includes an operator that creates a chart, this field is meaningful; otherwise, it is ignored.)
If the configured Chart Result Limit is less than the number of unique values for a query, the top values equal to the Chart Result Limit are plotted. That is, if the Chart Result Limit is 5 and 7 unique values are found, the top 5 values will be plotted.
Include Event Total
Check this box to include an event count with the Saved Search, or a total when more than one Saved Search is specified.
Include only CEF Events
Check this box to include only Common Event Format (CEF) events. Uncheck the box to include all events in the output.
For more information about CEF, refer to the document "ArcSight CEF." For a downloadable a copy of this guide, search for “ArcSight Common Event Format (CEF) Guide” in the Micro Focus Security Community.
Delete Files After
Specify how many days to keep the saved search results.
Search Job Options, continued
5. If you selected the job type Alert, specify the Alert Options
Administrator's GuideChapter 5: Configuration
Adding a Scheduled Search or Scheduled Alert Page 326 of 743
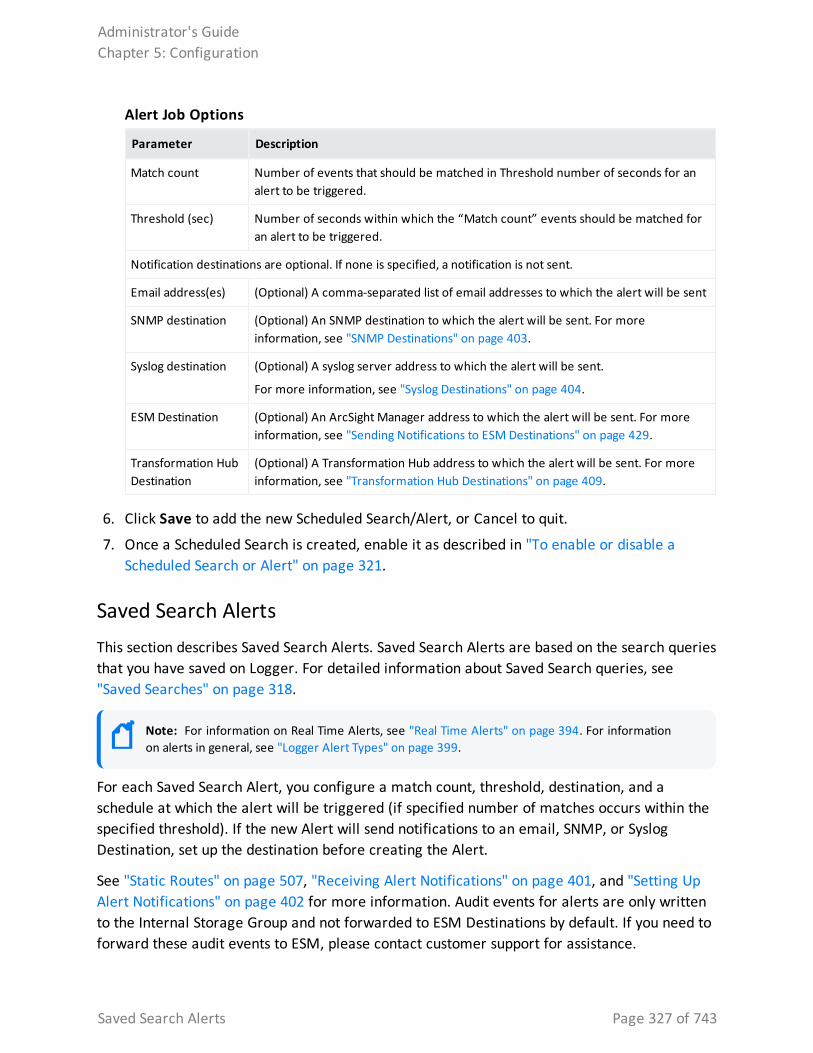
Parameter Description
Match count Number of events that should be matched in Threshold number of seconds for an alert to be triggered.
Threshold (sec) Number of seconds within which the “Match count” events should be matched for an alert to be triggered.
Notification destinations are optional. If none is specified, a notification is not sent.
Email address(es) (Optional) A comma-separated list of email addresses to which the alert will be sent
SNMP destination (Optional) An SNMP destination to which the alert will be sent. For more information, see "SNMP Destinations" on page 403.
Syslog destination (Optional) A syslog server address to which the alert will be sent.
For more information, see "Syslog Destinations" on page 404.
ESM Destination (Optional) An ArcSight Manager address to which the alert will be sent. For more information, see "Sending Notifications to ESM Destinations" on page 429.
Transformation Hub Destination
(Optional) A Transformation Hub address to which the alert will be sent. For more information, see "Transformation Hub Destinations" on page 409.
Alert Job Options
6. Click Save to add the new Scheduled Search/Alert, or Cancel to quit.
7. Once a Scheduled Search is created, enable it as described in "To enable or disable a Scheduled Search or Alert" on page 321.
Saved Search AlertsThis section describes Saved Search Alerts. Saved Search Alerts are based on the search queries that you have saved on Logger. For detailed information about Saved Search queries, see "Saved Searches" on page 318.
Note: For information on Real Time Alerts, see "Real Time Alerts" on page 394. For information on alerts in general, see "Logger Alert Types" on page 399.
For each Saved Search Alert, you configure a match count, threshold, destination, and a schedule at which the alert will be triggered (if specified number of matches occurs within the specified threshold). If the new Alert will send notifications to an email, SNMP, or Syslog Destination, set up the destination before creating the Alert.
See "Static Routes" on page 507, "Receiving Alert Notifications" on page 401, and "Setting Up Alert Notifications" on page 402 for more information. Audit events for alerts are only written to the Internal Storage Group and not forwarded to ESM Destinations by default. If you need to forward these audit events to ESM, please contact customer support for assistance.
Administrator's GuideChapter 5: Configuration
Saved Search Alerts Page 327 of 743
Note: This change only applies to audit events generated for alerts; other audit events are can be sent to ESM Destinations.
Note: To ensure system performance, a maximum of 200 alerts are allowed per saved search alert job. Therefore, if a saved search alert job triggers more than 200 alerts, only the first 200 alerts are sent out for that job iteration; the rest are not sent. Additionally, the job is aborted so it does not trigger more alerts for that iteration and the status for that job is marked “Failed” in the Finished Tasks page (Configuration| Scheduled Tasks > Finished Tasks). The job runs as scheduled at the next scheduled interval and alerts are sent out until the maximum limit is reached.
This limit does not exist on the real-time alerts.
Creating Saved Search Alerts (Scheduled Alerts)
This section describes how to schedule Saved Searches to run as Scheduled Alerts. For information on creating Real Time Alerts, see "Creating Real Time Alerts" on page 396. For a description of the types of alerts, see "Logger Alert Types" on page 399.
You can schedule a Saved Search to run at any time. Before you schedule a Saved Search Alert, you must have created at least one Saved Search.
Note: Saved searches used in Alerts cannot contain aggregation operators such as chart or top. See "Saving Queries, Creating Saved Searches and Saved Filters." on page 150 for more information.
You can add a new Scheduled Search or Alert from the Configuration menu or directly from the search results page.
l To set up a Scheduled Search Alert from the search results page (Analyze > Classic Search), see "Creating Saved Search Alerts (Scheduled Alerts)" above.
l To set up a Scheduled Search from the search results page (Analyze > Classic Search), follow the instruction in "Saving Queries, Creating Saved Searches and Saved Filters." on page 150, set the Type to Scheduled Search and select the Schedule it option.
l You can set up a Scheduled Search or Alert from the Analyze > Search page or Configuration > Search > Scheduled Searches/Alerts page. For further details, see " Adding a Scheduled Search or Scheduled Alert" on page 322.
To set up a Saved Search Alert from the search results page:
1. Run a search, as described in "Searching for Events" on page 106.
2. Click the Save icon ( ) and enter the following settings.
Administrator's GuideChapter 5: Configuration
Creating Saved Search Alerts (Scheduled Alerts) Page 328 of 743
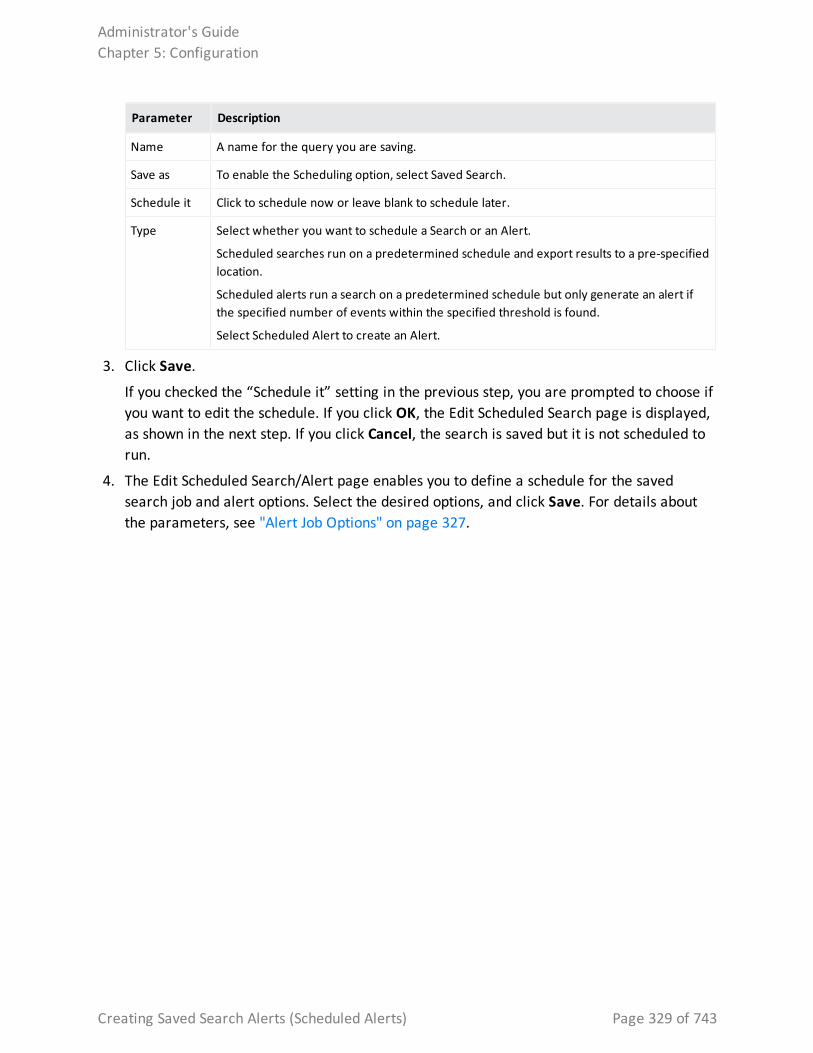
Parameter Description
Name A name for the query you are saving.
Save as To enable the Scheduling option, select Saved Search.
Schedule it Click to schedule now or leave blank to schedule later.
Type Select whether you want to schedule a Search or an Alert.
Scheduled searches run on a predetermined schedule and export results to a pre-specified location.
Scheduled alerts run a search on a predetermined schedule but only generate an alert if the specified number of events within the specified threshold is found.
Select Scheduled Alert to create an Alert.
3. Click Save.
If you checked the “Schedule it” setting in the previous step, you are prompted to choose if you want to edit the schedule. If you click OK, the Edit Scheduled Search page is displayed, as shown in the next step. If you click Cancel, the search is saved but it is not scheduled to run.
4. The Edit Scheduled Search/Alert page enables you to define a schedule for the saved search job and alert options. Select the desired options, and click Save. For details about the parameters, see "Alert Job Options" on page 327.
Administrator's GuideChapter 5: Configuration
Creating Saved Search Alerts (Scheduled Alerts) Page 329 of 743
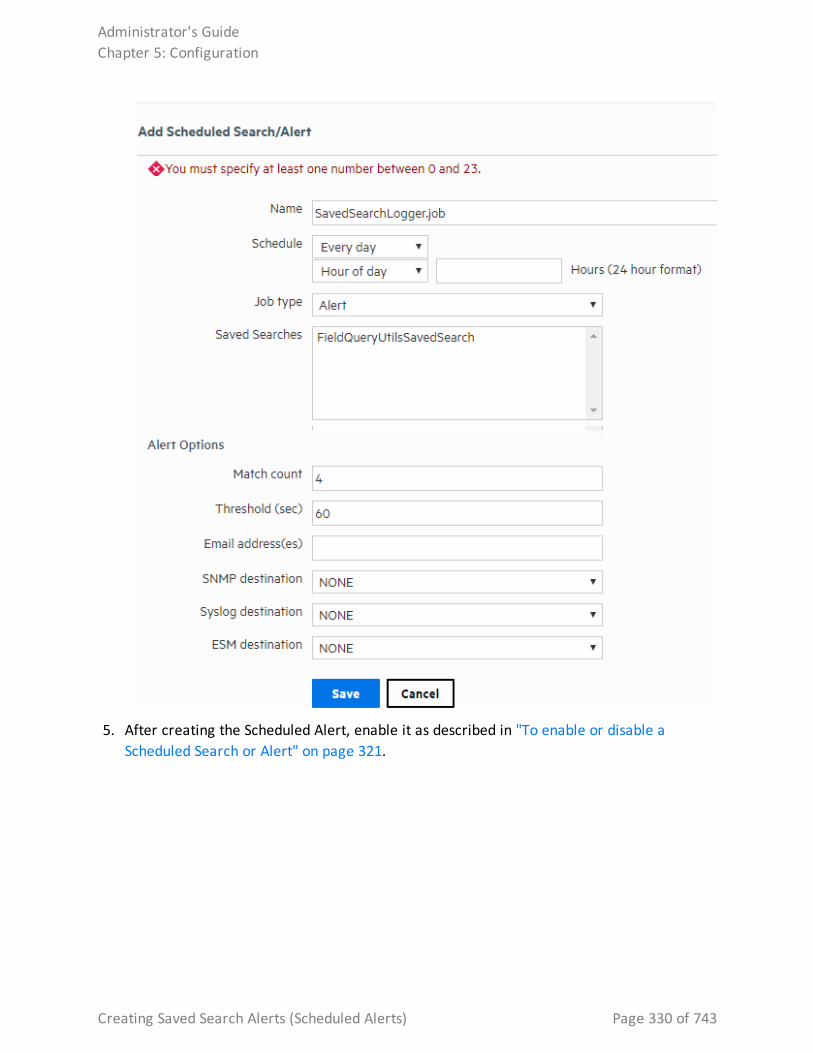
5. After creating the Scheduled Alert, enable it as described in "To enable or disable a Scheduled Search or Alert" on page 321.
Administrator's GuideChapter 5: Configuration
Creating Saved Search Alerts (Scheduled Alerts) Page 330 of 743
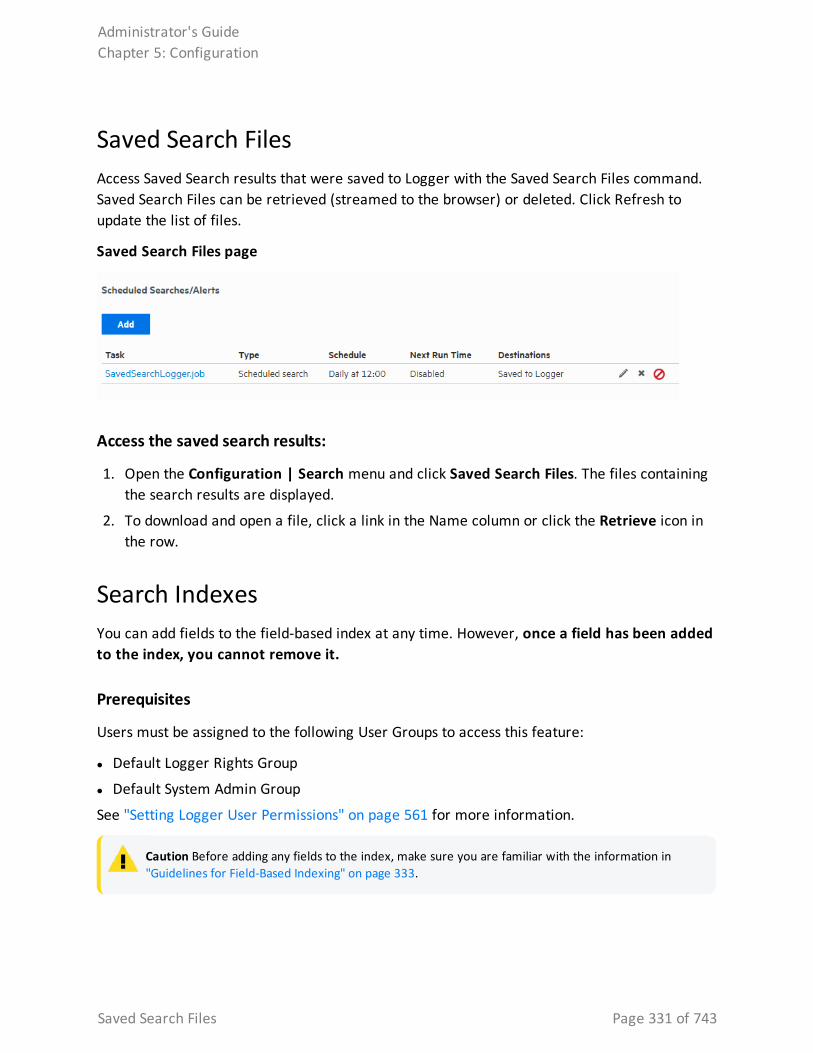
Saved Search FilesAccess Saved Search results that were saved to Logger with the Saved Search Files command. Saved Search Files can be retrieved (streamed to the browser) or deleted. Click Refresh to update the list of files.
Saved Search Files page
Access the saved search results:
1. Open the Configuration | Search menu and click Saved Search Files. The files containing the search results are displayed.
2. To download and open a file, click a link in the Name column or click the Retrieve icon in the row.
Search IndexesYou can add fields to the field-based index at any time. However, once a field has been added to the index, you cannot remove it.
Prerequisites
Users must be assigned to the following User Groups to access this feature:
l Default Logger Rights Group
l Default System Admin Group
See "Setting Logger User Permissions" on page 561 for more information.
Caution Before adding any fields to the index, make sure you are familiar with the information in "Guidelines for Field-Based Indexing" on page 333.
Administrator's GuideChapter 5: Configuration
Saved Search Files Page 331 of 743
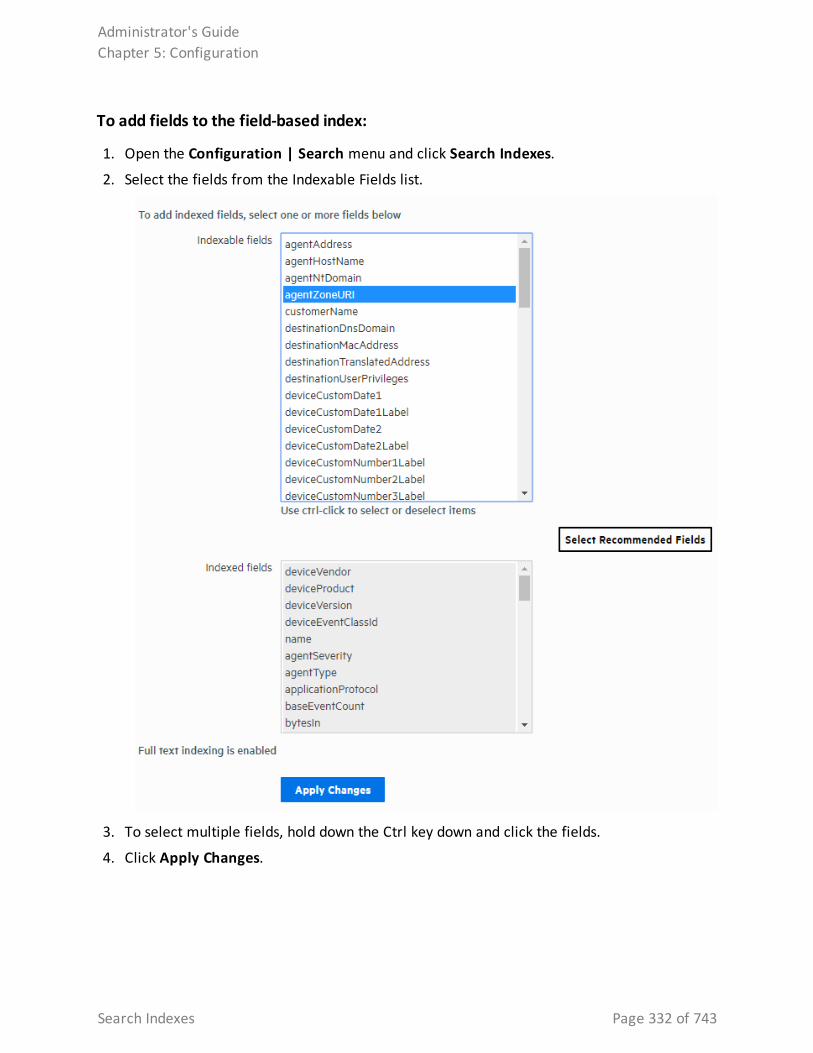
To add fields to the field-based index:
1. Open the Configuration | Search menu and click Search Indexes.
2. Select the fields from the Indexable Fields list.
3. To select multiple fields, hold down the Ctrl key down and click the fields.
4. Click Apply Changes.
Administrator's GuideChapter 5: Configuration
Search Indexes Page 332 of 743

Guidelines for Field-Based IndexingMake sure you are familiar with these guidelines before you index any fields:
l Events are indexed by the fields in the “Indexed fields” list (on the Search Indexes page) and the default event metadata fields—event time, Logger event, and device address.
l You can index up to 123 fields on Logger. This number includes the custom schema fields you may have added to your Logger.
l Once a field has been added to the index, it cannot be undone.
l Only users belonging to a System Admin Group can add fields to index.
l After you add a field to the index, Logger might not immediately start indexing on that field. Therefore, allow some time between adding a field and using it in the search query. If Logger is in the process of indexing on a field and you use that field to run a search query, the search performance for that operation will be slower than expected.
l If an event field contains data of unexpected type (for example, a string when an integer is expected), the data is ignored. Therefore, search for that data value will not yield any results. For example, if the port field contains a value 8080A (alphanumeric) instead of 8080 (numeric), the alphanumeric value is ignored.
l For faster report generation, ALL fields of a report (including the fields being displayed in the report) need to be indexed. That is, in addition to the fields in the WHERE clause of the query, the fields in the SELECT clause also need to be indexed.
l For optimal search performance, make sure that event fields on ALL peers are indexed for the time range specified in a query. If an event field is indexed on a Logger but not on its peers for a specific time range, a distributed search will run slower on the Loggers. However, it will run at optimal speed on the local Logger. Therefore, the search performance in such a setup will be slow.
l Logger supports indexing of the requestUrl field. This field returns website addresses from the World Wide Web. Indexing requestUrl will return results faster, but will also significantly increase the size of your search results, which may impact your search storage capacity.
Global Search OptionsThe Edit Search Options page allows Administrators to configure global search settings for field, full-text, regular expression, and concurrent search options, as well as search display, and field summary options.
To adjust these options, open the Configuration | Search menu and click Search Options.
Administrator's GuideChapter 5: Configuration
Guidelines for Field-Based Indexing Page 333 of 743
Tip: The search options on this page support internationalization (i18n) choices.
Prerequisites
Users must be assigned to the following User Groups to access this feature:
l Default Logger Rights Group
l Default System Admin Group
See "Setting Logger User Permissions" on page 561 for more information.
Setting Global Search OptionsThe Edit Search Options page allows you to configure global search settings for Logger.
To view or modify Logger global search settings:
1. From the navigation bar, click Search Options from the Configuration | Search menu. The Edit Search Options page opens.
2. View or modify the settings according to "Search Option Parameters" below.
3. Click Save to retain the changes.
Note: Some of these options will require you to reboot your Logger Appliance or restart your Software Logger.
Search Option ParametersThese parameters configure advanced global search options on the Edit Search Options page. Any search from the Analyzer > Search page will enable you to conduct any search from a URL using the parameters described below. To adjust these options, click Search Options from the Configuration > Search menu.
Note: Some hyperlinks (summary page, dashboard page and integration with other systems: ESM or NNMi) now redirect to the Analyzer > Search page.
Administrator's GuideChapter 5: Configuration
Setting Global Search Options Page 334 of 743
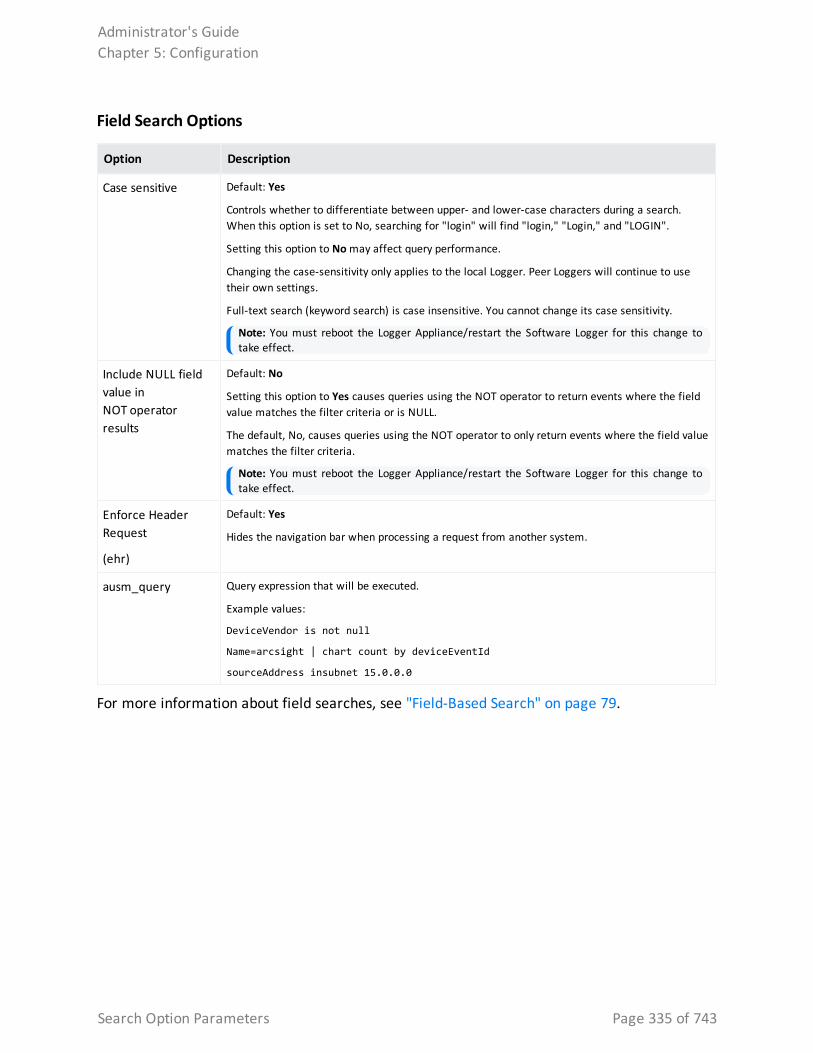
Field Search Options
Option Description
Case sensitive Default: Yes
Controls whether to differentiate between upper- and lower-case characters during a search. When this option is set to No, searching for "login" will find "login," "Login," and "LOGIN".
Setting this option to No may affect query performance.
Changing the case-sensitivity only applies to the local Logger. Peer Loggers will continue to use their own settings.
Full-text search (keyword search) is case insensitive. You cannot change its case sensitivity.
Note: You must reboot the Logger Appliance/restart the Software Logger for this change to take effect.
Include NULL field value in NOT operator results
Default: No
Setting this option to Yes causes queries using the NOT operator to return events where the field value matches the filter criteria or is NULL.
The default, No, causes queries using the NOT operator to only return events where the field value matches the filter criteria.
Note: You must reboot the Logger Appliance/restart the Software Logger for this change to take effect.
Enforce Header Request
(ehr)
Default: Yes
Hides the navigation bar when processing a request from another system.
ausm_query Query expression that will be executed.
Example values:
DeviceVendor is not null
Name=arcsight | chart count by deviceEventId
sourceAddress insubnet 15.0.0.0
For more information about field searches, see "Field-Based Search" on page 79.
Administrator's GuideChapter 5: Configuration
Search Option Parameters Page 335 of 743
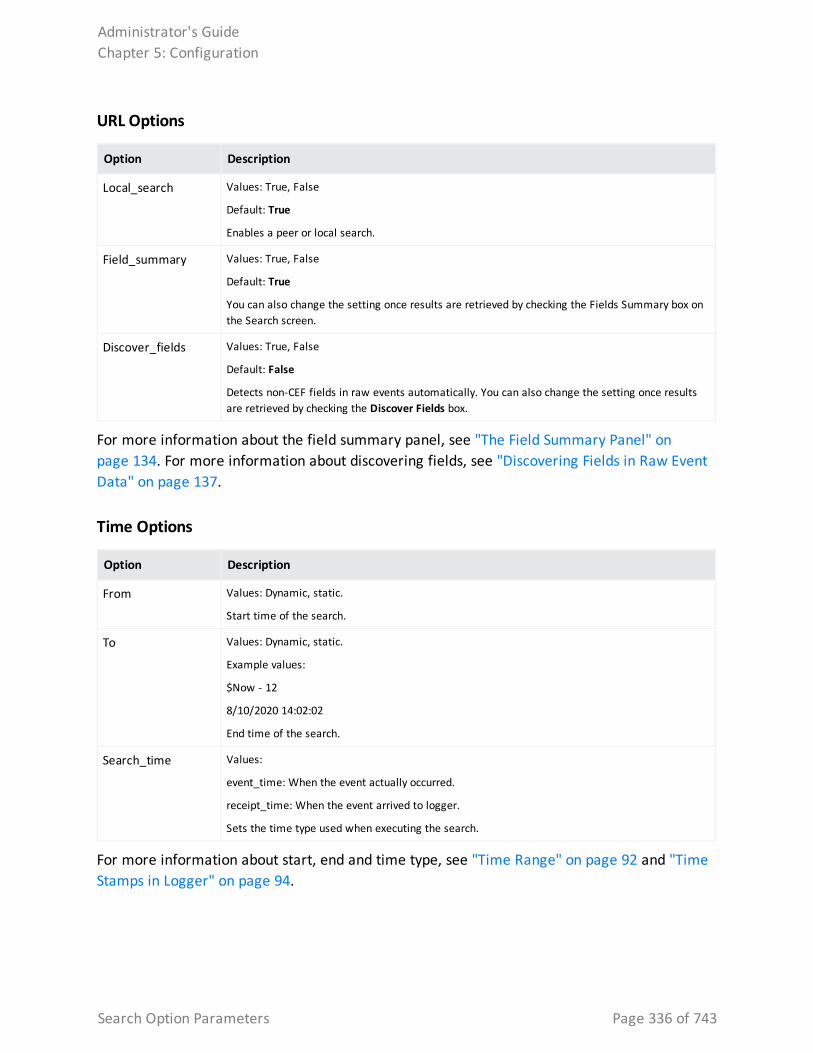
URL Options
Option Description
Local_search Values: True, False
Default: True
Enables a peer or local search.
Field_summary Values: True, False
Default: True
You can also change the setting once results are retrieved by checking the Fields Summary box on the Search screen.
Discover_fields Values: True, False
Default: False
Detects non-CEF fields in raw events automatically. You can also change the setting once results are retrieved by checking the Discover Fields box.
For more information about the field summary panel, see "The Field Summary Panel" on page 134. For more information about discovering fields, see "Discovering Fields in Raw Event Data" on page 137.
Time Options
Option Description
From Values: Dynamic, static.
Start time of the search.
To Values: Dynamic, static.
Example values:
$Now - 12
8/10/2020 14:02:02
End time of the search.
Search_time Values:
event_time: When the event actually occurred.
receipt_time: When the event arrived to logger.
Sets the time type used when executing the search.
For more information about start, end and time type, see "Time Range" on page 92 and "Time Stamps in Logger" on page 94.
Administrator's GuideChapter 5: Configuration
Search Option Parameters Page 336 of 743
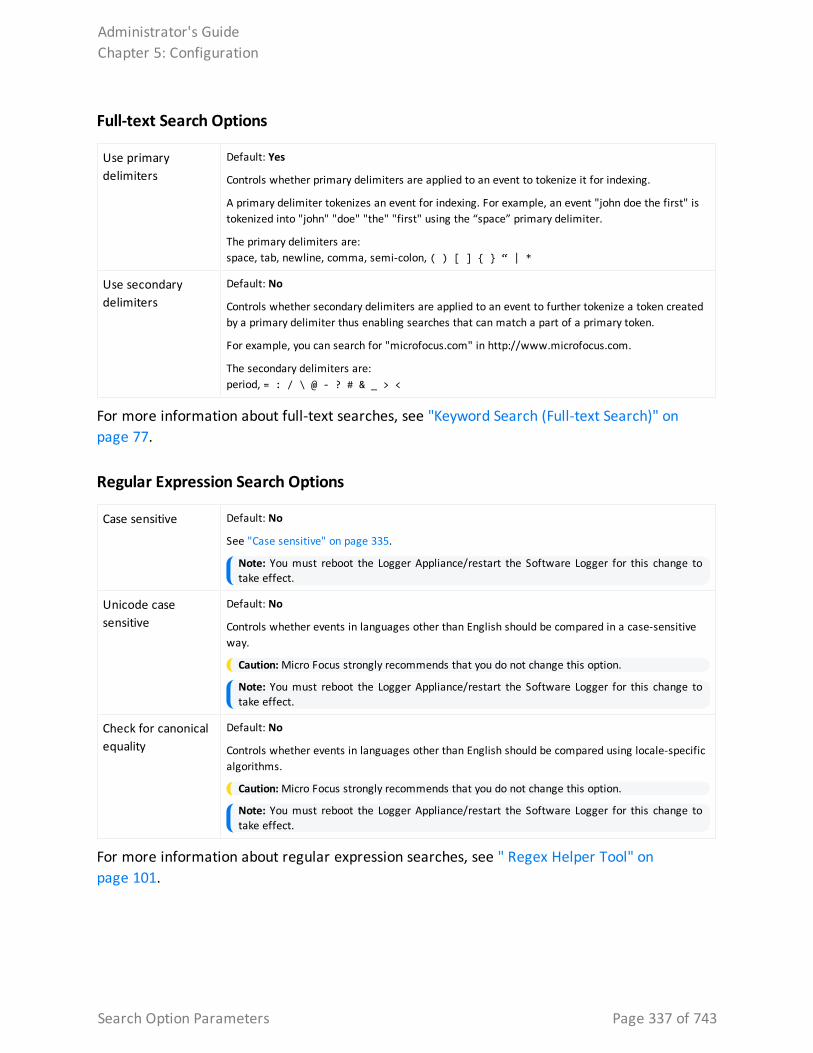
Full-text Search Options
Use primary delimiters
Default: Yes
Controls whether primary delimiters are applied to an event to tokenize it for indexing.
A primary delimiter tokenizes an event for indexing. For example, an event "john doe the first" is tokenized into "john" "doe" "the" "first" using the “space” primary delimiter.
The primary delimiters are: space, tab, newline, comma, semi-colon, ( ) [ ] { } “ | *
Use secondary delimiters
Default: No
Controls whether secondary delimiters are applied to an event to further tokenize a token created by a primary delimiter thus enabling searches that can match a part of a primary token.
For example, you can search for "microfocus.com" in http://www.microfocus.com.
The secondary delimiters are: period, = : / \ @ - ? # & _ > <
For more information about full-text searches, see "Keyword Search (Full-text Search)" on page 77.
Regular Expression Search Options
Case sensitive Default: No
See "Case sensitive" on page 335.
Note: You must reboot the Logger Appliance/restart the Software Logger for this change to take effect.
Unicode case sensitive
Default: No
Controls whether events in languages other than English should be compared in a case-sensitive way.
Caution: Micro Focus strongly recommends that you do not change this option.
Note: You must reboot the Logger Appliance/restart the Software Logger for this change to take effect.
Check for canonical equality
Default: No
Controls whether events in languages other than English should be compared using locale-specific algorithms.
Caution: Micro Focus strongly recommends that you do not change this option.
Note: You must reboot the Logger Appliance/restart the Software Logger for this change to take effect.
For more information about regular expression searches, see " Regex Helper Tool" on page 101.
Administrator's GuideChapter 5: Configuration
Search Option Parameters Page 337 of 743
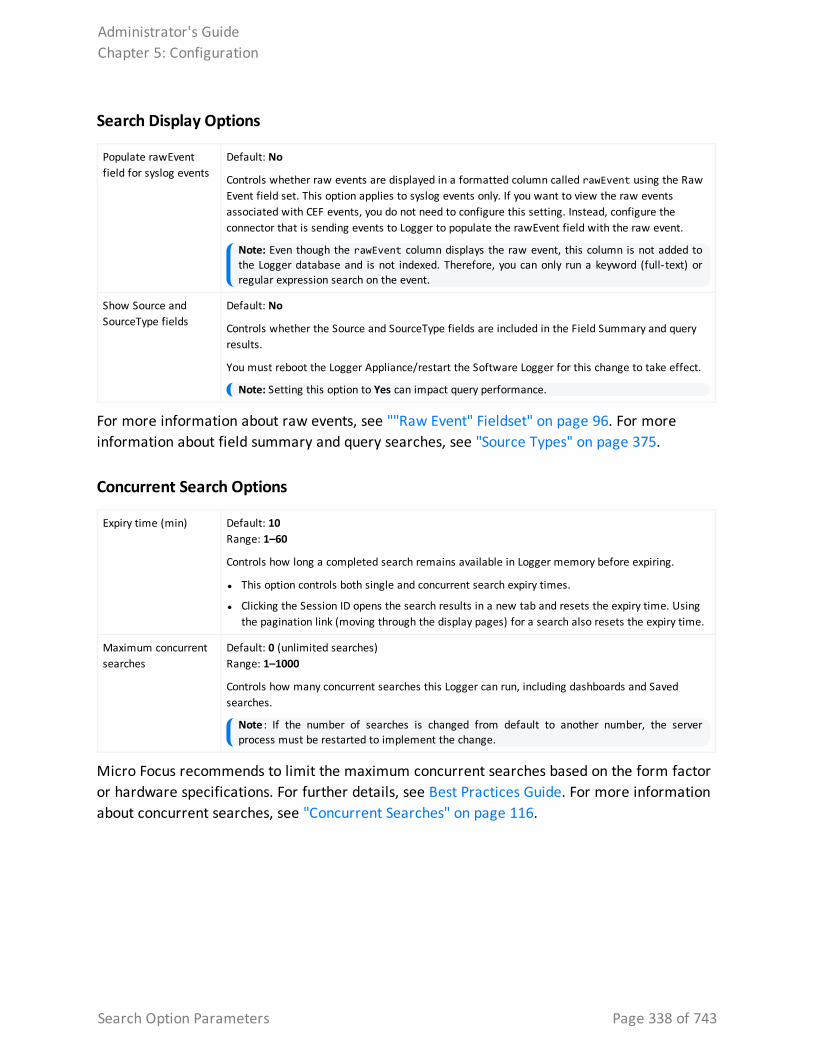
Search Display Options
Populate rawEvent field for syslog events
Default: No
Controls whether raw events are displayed in a formatted column called rawEvent using the Raw Event field set. This option applies to syslog events only. If you want to view the raw events associated with CEF events, you do not need to configure this setting. Instead, configure the connector that is sending events to Logger to populate the rawEvent field with the raw event.
Note: Even though the rawEvent column displays the raw event, this column is not added to the Logger database and is not indexed. Therefore, you can only run a keyword (full-text) or regular expression search on the event.
Show Source and SourceType fields
Default: No
Controls whether the Source and SourceType fields are included in the Field Summary and query results.
You must reboot the Logger Appliance/restart the Software Logger for this change to take effect.
Note: Setting this option to Yes can impact query performance.
For more information about raw events, see ""Raw Event" Fieldset" on page 96. For more information about field summary and query searches, see "Source Types" on page 375.
Concurrent Search Options
Expiry time (min) Default: 10 Range: 1–60
Controls how long a completed search remains available in Logger memory before expiring.
l This option controls both single and concurrent search expiry times.
l Clicking the Session ID opens the search results in a new tab and resets the expiry time. Using the pagination link (moving through the display pages) for a search also resets the expiry time.
Maximum concurrent searches
Default: 0 (unlimited searches)Range: 1–1000
Controls how many concurrent searches this Logger can run, including dashboards and Saved searches.
Note : If the number of searches is changed from default to another number, the server process must be restarted to implement the change.
Micro Focus recommends to limit the maximum concurrent searches based on the form factor or hardware specifications. For further details, see Best Practices Guide. For more information about concurrent searches, see "Concurrent Searches" on page 116.
Administrator's GuideChapter 5: Configuration
Search Option Parameters Page 338 of 743
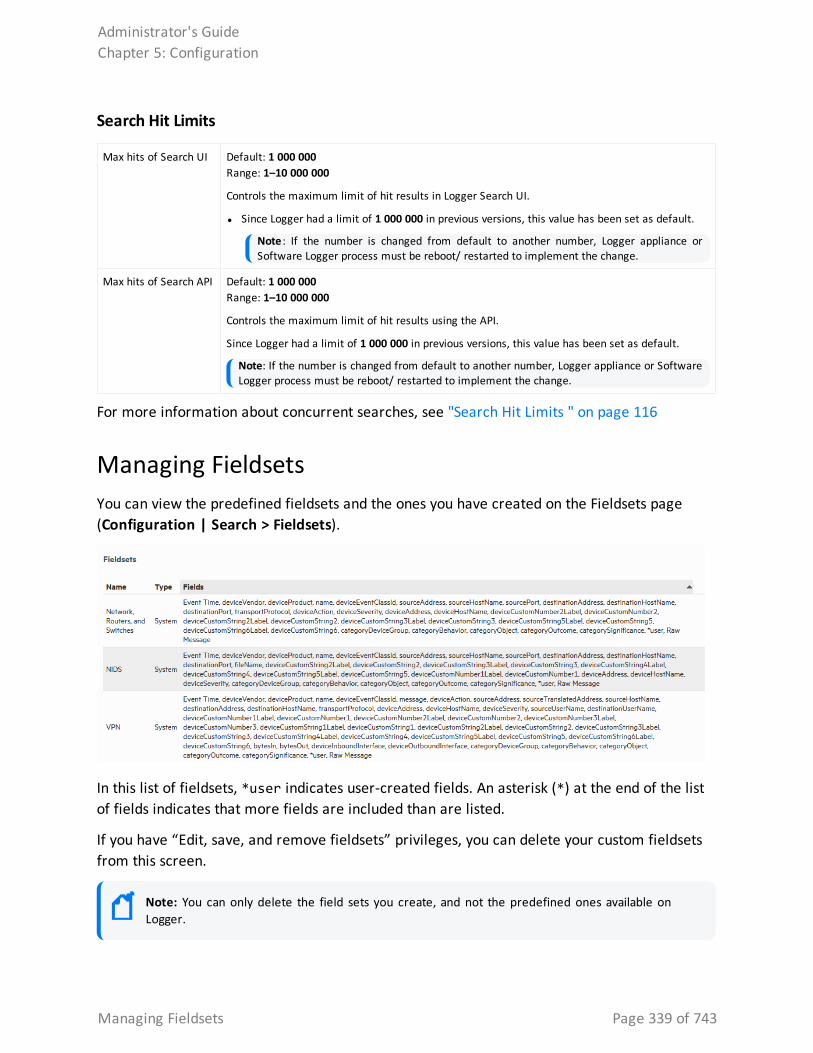
Search Hit Limits
Max hits of Search UI Default: 1 000 000Range: 1–10 000 000
Controls the maximum limit of hit results in Logger Search UI.
l Since Logger had a limit of 1 000 000 in previous versions, this value has been set as default.
Note : If the number is changed from default to another number, Logger appliance or Software Logger process must be reboot/ restarted to implement the change.
Max hits of Search API Default: 1 000 000 Range: 1–10 000 000
Controls the maximum limit of hit results using the API.
Since Logger had a limit of 1 000 000 in previous versions, this value has been set as default.
Note: If the number is changed from default to another number, Logger appliance or Software Logger process must be reboot/ restarted to implement the change.
For more information about concurrent searches, see "Search Hit Limits " on page 116
Managing FieldsetsYou can view the predefined fieldsets and the ones you have created on the Fieldsets page (Configuration | Search > Fieldsets).
In this list of fieldsets, *user indicates user-created fields. An asterisk (*) at the end of the list of fields indicates that more fields are included than are listed.
If you have “Edit, save, and remove fieldsets” privileges, you can delete your custom fieldsets from this screen.
Note: You can only delete the field sets you create, and not the predefined ones available on Logger.
Administrator's GuideChapter 5: Configuration
Managing Fieldsets Page 339 of 743
To delete a custom field set:
1. Open the Configuration | Search menu and click Fieldsets.
2. Identify the field set you want to delete and click the Delete icon ( ).
3. Confirm the deletion.
Default FieldsThe Logger schema comes with a set of predefined fields. Some of these fields are already indexed for improved search speed and efficiency. You can add custom fields to Logger's schema and index them for field-based search. A field-based search can only use fields in the schema.
Note: The size of each field in the schema is predetermined. If the string you are searching for is longer than the field-length, you should use a STARTSWITH rather than an = search, and include no more than the number of characters in the field size. For more information, see “Field-based Search” on page 1.
The Default Fields page (Configuration | Search > Default Fields) displays the predefined fields included in the schema. It includes the Display Name, Type, Length, and Field Name for each default field. To view information on existing custom fields, see "Custom Fields" on the next page.
Prerequisites
Users must be assigned to the following User Groups to access this feature:
l Default Logger Rights Group
l Default System Admin Group
See "Setting Logger User Permissions" on page 561 for more information.
Administrator's GuideChapter 5: Configuration
Default Fields Page 340 of 743
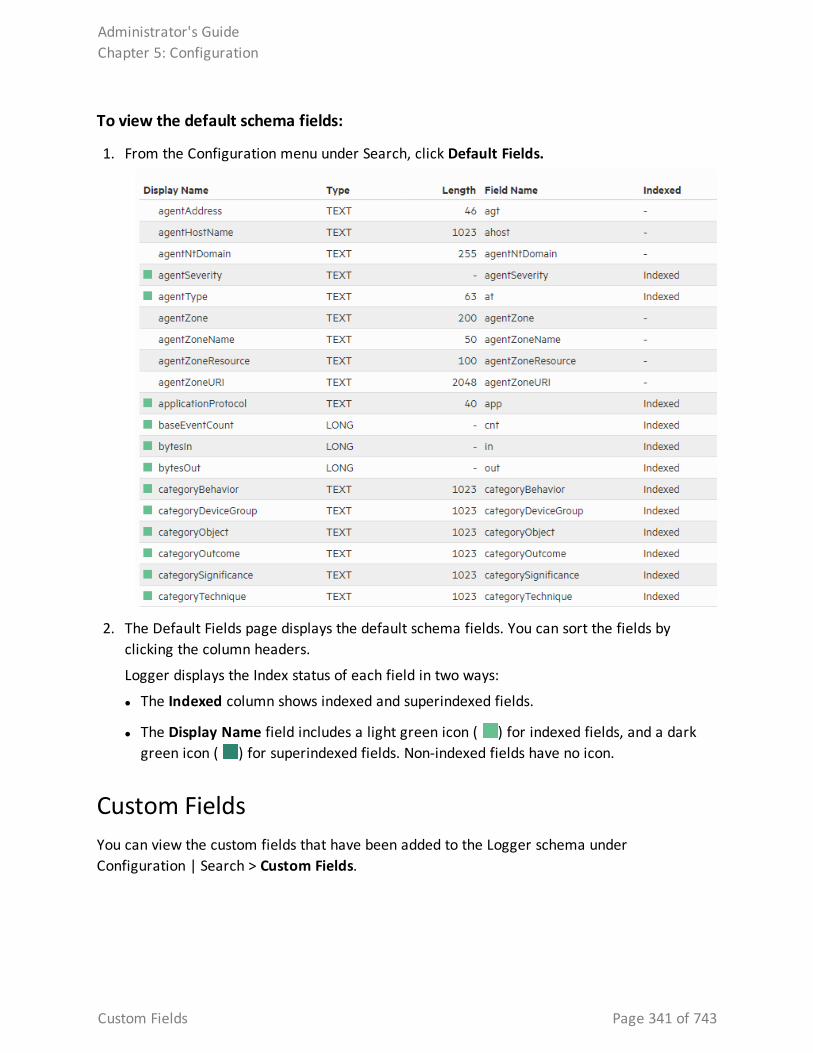
To view the default schema fields:
1. From the Configuration menu under Search, click Default Fields.
2. The Default Fields page displays the default schema fields. You can sort the fields by clicking the column headers.
Logger displays the Index status of each field in two ways:
l The Indexed column shows indexed and superindexed fields.
l The Display Name field includes a light green icon ( ) for indexed fields, and a dark green icon ( ) for superindexed fields. Non-indexed fields have no icon.
Custom FieldsYou can view the custom fields that have been added to the Logger schema under Configuration | Search > Custom Fields.
Administrator's GuideChapter 5: Configuration
Custom Fields Page 341 of 743
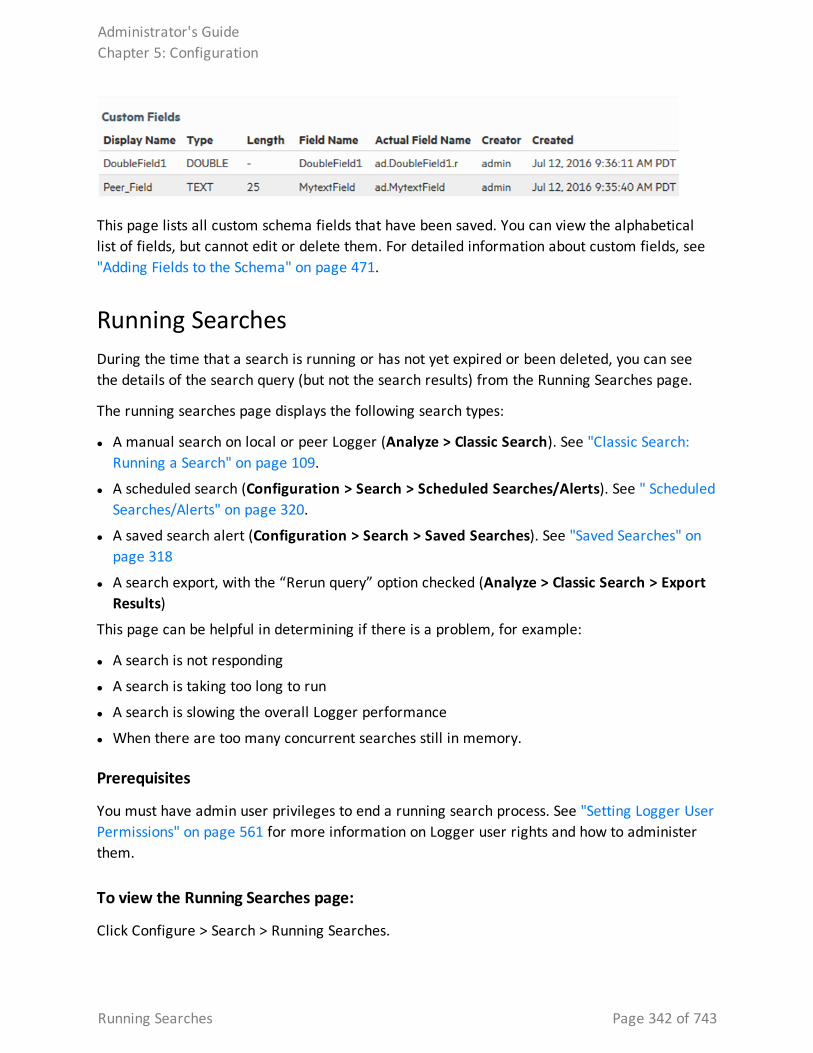
This page lists all custom schema fields that have been saved. You can view the alphabetical list of fields, but cannot edit or delete them. For detailed information about custom fields, see "Adding Fields to the Schema" on page 471.
Running SearchesDuring the time that a search is running or has not yet expired or been deleted, you can see the details of the search query (but not the search results) from the Running Searches page.
The running searches page displays the following search types:
l A manual search on local or peer Logger (Analyze > Classic Search). See "Classic Search: Running a Search" on page 109.
l A scheduled search (Configuration > Search > Scheduled Searches/Alerts). See " Scheduled Searches/Alerts" on page 320.
l A saved search alert (Configuration > Search > Saved Searches). See "Saved Searches" on page 318
l A search export, with the “Rerun query” option checked (Analyze > Classic Search > Export Results)
This page can be helpful in determining if there is a problem, for example:
l A search is not responding
l A search is taking too long to run
l A search is slowing the overall Logger performance
l When there are too many concurrent searches still in memory.
Prerequisites
You must have admin user privileges to end a running search process. See "Setting Logger User Permissions" on page 561 for more information on Logger user rights and how to administer them.
To view the Running Searches page:
Click Configure > Search > Running Searches.
Administrator's GuideChapter 5: Configuration
Running Searches Page 342 of 743
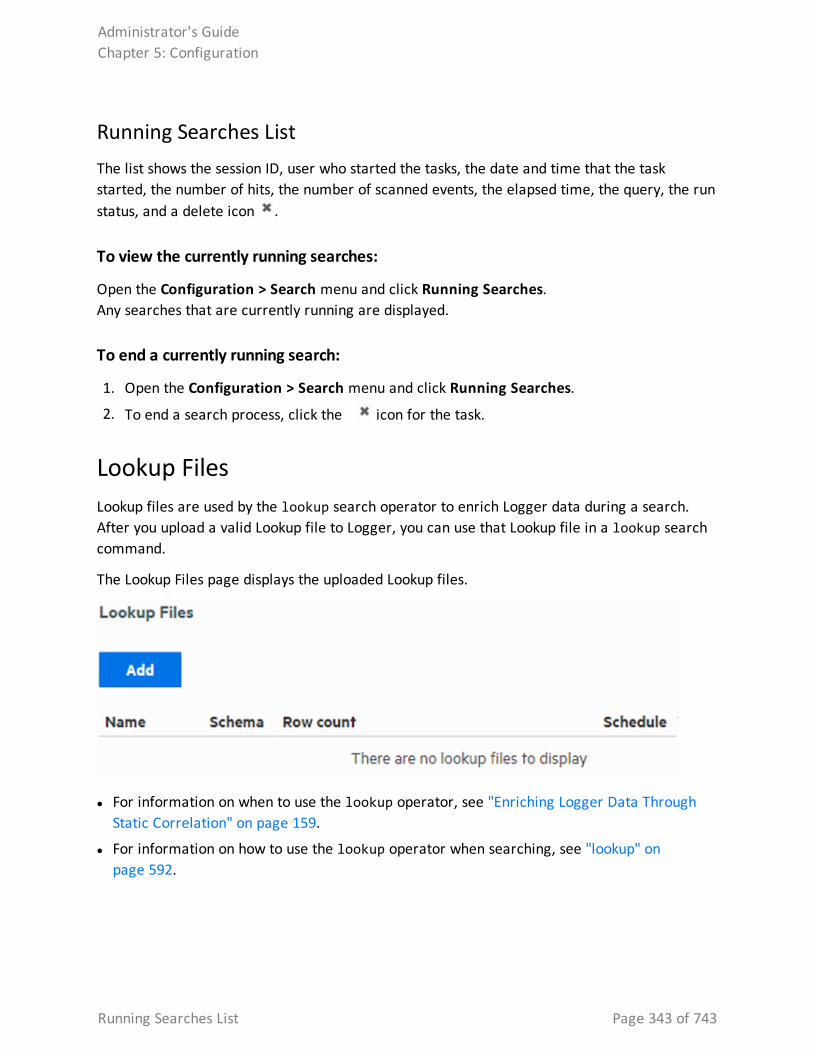
Running Searches ListThe list shows the session ID, user who started the tasks, the date and time that the task started, the number of hits, the number of scanned events, the elapsed time, the query, the run status, and a delete icon .
To view the currently running searches:
Open the Configuration > Search menu and click Running Searches. Any searches that are currently running are displayed.
To end a currently running search:
1. Open the Configuration > Search menu and click Running Searches.
2. To end a search process, click the icon for the task.
Lookup FilesLookup files are used by the lookup search operator to enrich Logger data during a search. After you upload a valid Lookup file to Logger, you can use that Lookup file in a lookup search command.
The Lookup Files page displays the uploaded Lookup files.
l For information on when to use the lookup operator, see "Enriching Logger Data Through Static Correlation" on page 159.
l For information on how to use the lookup operator when searching, see "lookup" on page 592.
Administrator's GuideChapter 5: Configuration
Running Searches List Page 343 of 743
Creating Lookup FilesLookup files must be in CSV format with the Lookup field names (individual column in the Lookup file). The rows are loaded sequentially in the table. The first row acts as the column definition. Any subsequent row with a different number of comma-separated values than the first row will be skipped by the lookup operator during the search as the lookup file page only loads the contents from the file without processing. If a search using the lookup operator needs to skip one or more rows, a warning message displays on the search page. Micro Focus recommends you to check the table with a tool such as Microsoft Excel to make sure that each row has the same number of columns as the header row before uploading it as a lookup file.
Naming Lookup Files
The Lookup filenames can contain only alphanumeric characters and underscore, and must NOT begin with a number. Do not include +, -, or * in the filename. These characters are reserved for the lookup command.
Creating a short and meaningful Lookup filenames make it easy to identify Lookup fields in the output. To help differentiate them from Logger fields, fields from the Lookup file are appended with the first six characters of the Lookup file name when displayed in the search results.
As an example, look at the following search:
lookup _table_20160608 ip as src output hostname
In this example, “_table_” will be appended to the Lookup field "hostname”. The date (20160608) will not be included. The name displayed in the search results will be "hostname_table_" because only the first six characters of the Lookup file name are appended.
Naming Fields in the Lookup File
Lookup fieldnames can contain only alphanumeric characters and underscore, and must NOT begin with a number. Do not include +, -, or * in the fieldname. These characters are reserved for the lookup command.
Duplicate Values in the Lookup File
When there are multiple rows with identical values in a Lookup column, the lookup operation only uses the first row that matches and ignores any subsequent matches.
When using Logger exported search results as Lookup file, you can use "dedup" operator to remove the duplicate values in the fields that will be used as Lookup fields. For more information on duplication in Lookup fields, see the lookup operator "lookup" on page 592. For more information on the dedup operator, see "dedup" on page 580.
Administrator's GuideChapter 5: Configuration
Creating Lookup Files Page 344 of 743
Lookup Capacity
l The maximum size Lookup file that can be uploaded is 50 MB (uncompressed or compressed)
l The maximum disk space allocated for storing Lookup files is 1 GB. This is the cap on overall disk space allowed for storing all Lookup files.
l Maximum number of Lookup entries is 5,000,000 (A Lookup entry is an individual comma-separated value in the Lookup file.)
For example, if a Lookup file has four columns and ten rows, the total number of lookup entries is 4x10=40. When such a Lookup file is used in the search, all of its entries will be loaded into memory. It is worth noting that the maximum number of rows loaded for lookup varies depending on the number of columns in the Lookup file.
For example, if a Lookup file contains 500 columns, the maximum number of rows allowed for lookup will be 5,000,000/500 = 10,000 rows, and any subsequent rows will not be used. On the other hand, if the table has only four columns, the maximum number rows allowed for lookup will be 5,000,000/4 = 1,250,000 rows.
When exporting Logger search results to use them as Lookup files, uncheck All Fields and export only the fields you need.
Since there is an overall limit of 5 million lookup entries, exporting only the necessary fields will reduce the number of rows loaded for lookup.
Uploading Lookup FilesClick Add on the Lookup Files page to upload a Lookup file in .csv, .zip, or .gz format. You can upload an individual Lookup file from your local desktop or schedule a lookup file to be uploaded regularly from a location accessible to Logger.
Uncompressed files (files uploaded in .csv format) will be compressed into .zip format and stored with the name you specified (<name>.zip.) Compressed files will be uploaded and stored in their original compression format with the name you specified (<name>.zip or <name>.gz.) Upload compressed Lookup files (.zip or .gz) when possible. This saves upload time and loads more information for the same upload file size. You can only include one Lookup file in .csv format in each .zip or .gz file.
For information on how to use the lookup operator when searching, see "lookup" on page 592.
To add a Lookup file:
1. Open the Configuration | Search menu and click Lookup Files.
2. Click Add. The Add Lookup File page opens.
Administrator's GuideChapter 5: Configuration
Lookup Capacity Page 345 of 743
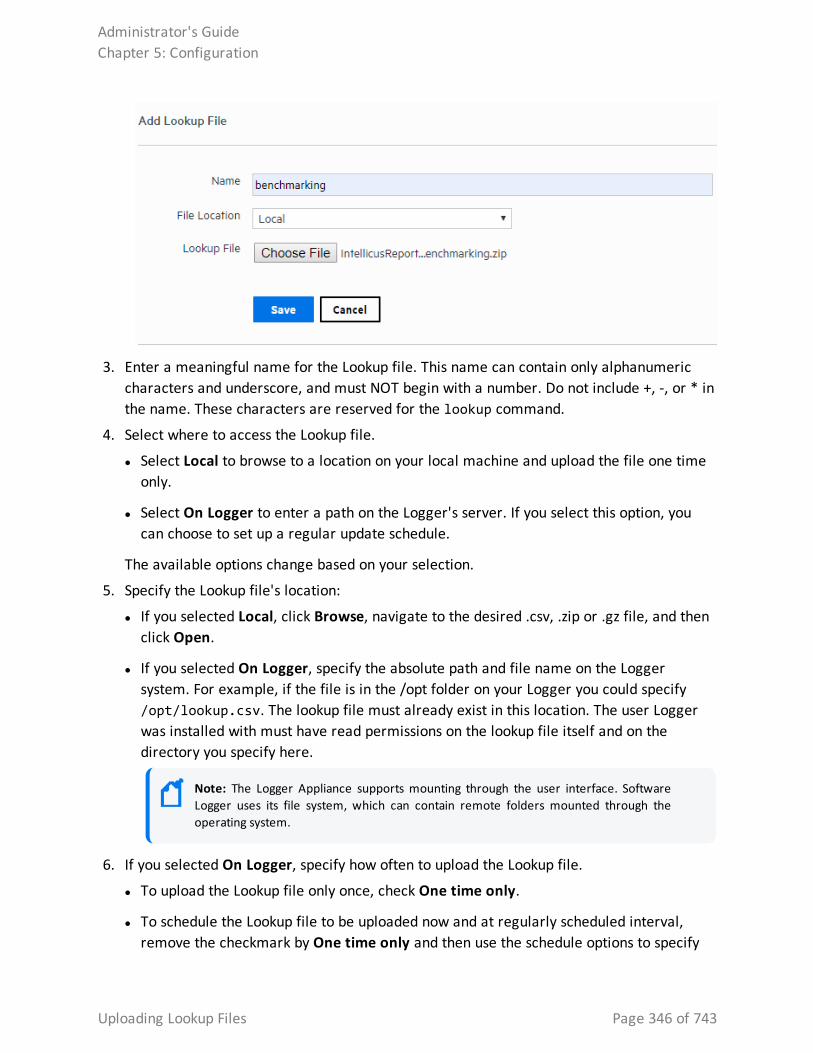
3. Enter a meaningful name for the Lookup file. This name can contain only alphanumeric characters and underscore, and must NOT begin with a number. Do not include +, -, or * in the name. These characters are reserved for the lookup command.
4. Select where to access the Lookup file.
l Select Local to browse to a location on your local machine and upload the file one time only.
l Select On Logger to enter a path on the Logger's server. If you select this option, you can choose to set up a regular update schedule.
The available options change based on your selection.
5. Specify the Lookup file's location:
l If you selected Local, click Browse, navigate to the desired .csv, .zip or .gz file, and then click Open.
l If you selected On Logger, specify the absolute path and file name on the Logger system. For example, if the file is in the /opt folder on your Logger you could specify /opt/lookup.csv. The lookup file must already exist in this location. The user Logger was installed with must have read permissions on the lookup file itself and on the directory you specify here.
Note: The Logger Appliance supports mounting through the user interface. Software Logger uses its file system, which can contain remote folders mounted through the operating system.
6. If you selected On Logger, specify how often to upload the Lookup file.
l To upload the Lookup file only once, check One time only.
l To schedule the Lookup file to be uploaded now and at regularly scheduled interval, remove the checkmark by One time only and then use the schedule options to specify
Administrator's GuideChapter 5: Configuration
Uploading Lookup Files Page 346 of 743
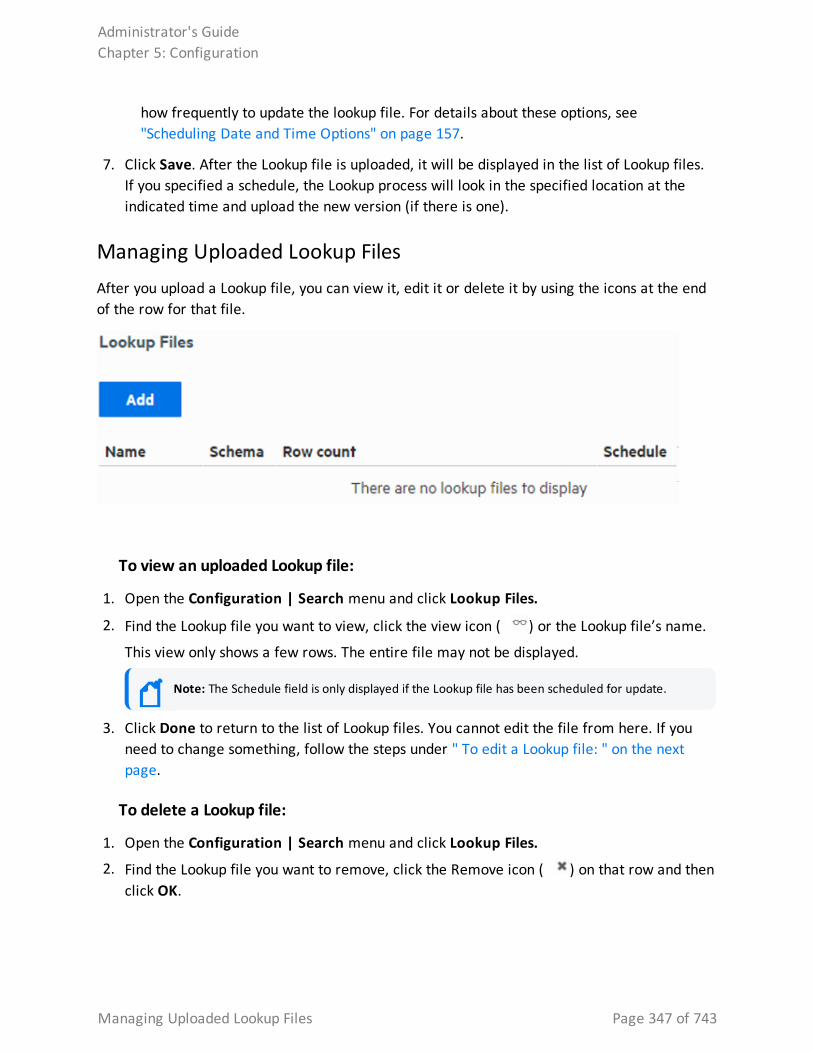
how frequently to update the lookup file. For details about these options, see "Scheduling Date and Time Options" on page 157.
7. Click Save. After the Lookup file is uploaded, it will be displayed in the list of Lookup files. If you specified a schedule, the Lookup process will look in the specified location at the indicated time and upload the new version (if there is one).
Managing Uploaded Lookup FilesAfter you upload a Lookup file, you can view it, edit it or delete it by using the icons at the end of the row for that file.
To view an uploaded Lookup file:
1. Open the Configuration | Search menu and click Lookup Files.
2. Find the Lookup file you want to view, click the view icon ( ) or the Lookup file’s name.
This view only shows a few rows. The entire file may not be displayed.
Note: The Schedule field is only displayed if the Lookup file has been scheduled for update.
3. Click Done to return to the list of Lookup files. You cannot edit the file from here. If you need to change something, follow the steps under " To edit a Lookup file: " on the next page.
To delete a Lookup file:
1. Open the Configuration | Search menu and click Lookup Files.
2. Find the Lookup file you want to remove, click the Remove icon ( ) on that row and then click OK.
Administrator's GuideChapter 5: Configuration
Managing Uploaded Lookup Files Page 347 of 743
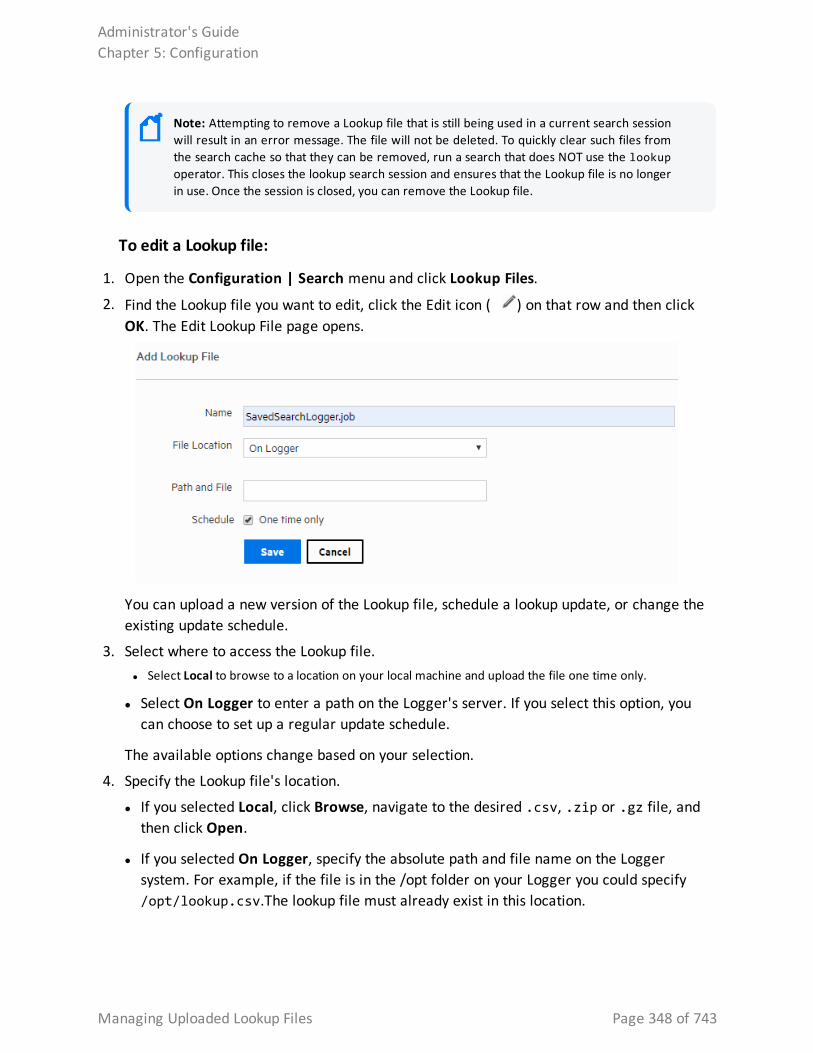
Note: Attempting to remove a Lookup file that is still being used in a current search session will result in an error message. The file will not be deleted. To quickly clear such files from the search cache so that they can be removed, run a search that does NOT use the lookup operator. This closes the lookup search session and ensures that the Lookup file is no longer in use. Once the session is closed, you can remove the Lookup file.
To edit a Lookup file:
1. Open the Configuration | Search menu and click Lookup Files.
2. Find the Lookup file you want to edit, click the Edit icon ( ) on that row and then click OK. The Edit Lookup File page opens.
You can upload a new version of the Lookup file, schedule a lookup update, or change the existing update schedule.
3. Select where to access the Lookup file. l Select Local to browse to a location on your local machine and upload the file one time only.
l Select On Logger to enter a path on the Logger's server. If you select this option, you can choose to set up a regular update schedule.
The available options change based on your selection.
4. Specify the Lookup file's location.
l If you selected Local, click Browse, navigate to the desired .csv, .zip or .gz file, and then click Open.
l If you selected On Logger, specify the absolute path and file name on the Logger system. For example, if the file is in the /opt folder on your Logger you could specify /opt/lookup.csv.The lookup file must already exist in this location.
Administrator's GuideChapter 5: Configuration
Managing Uploaded Lookup Files Page 348 of 743
Note: The Logger Appliance supports mounting through the user interface. Software Logger uses its file system, which can contain remote folders mounted through the operating system.
5. If you selected On Logger, specify how often to upload the Lookup file.
l To upload the Lookup file only once, check One time only.
l To schedule the Lookup file to be uploaded now and at regularly scheduled interval, remove the checkmark by One time only and then select a schedule. For scheduling information, see "Scheduling Date and Time Options" on page 157.
6. Click Save. After the Lookup file is uploaded, it will be displayed in the list of Lookup files. If you specified a schedule, the Lookup process will look in the specified location at the indicated time and upload the new version (if there is one).
Import Geolocation Files Geo localization functionality is ready for use in Logger 7.2 . Yet, context updates are released every month. To have the most updated geolocation data, user is required to manually import the files to Logger on a monthly basis.
To import files:
User needs to download the file at Micro Focus Entitlement page. For more information, see ArcSight Context Update Release Notes. Once the file has been downloaded and stored in a secure network location, proceed with the following steps:
1. From the Configuration menu, go to import content.
2. Click choose file and look for the Arcsight_Context_Update_CurrentMonth_year.xxxxxx.zip package.
3. Click import. Logger will display a message acknowledging the request has been completed.
4. Verify the file has been correctly imported in <loggerInstallation>/config/logger/server/. A new file named ipdataV6.mmdb should appear.
As new release files are imported into Logger every month, previous release files are automatically renamed using the following format: ipdataV6_year-month.mmbd.
Note: By default, Logger stores a maximum of 4 geolocation files. Reports outside storage period are executed using the latest imported file.
Administrator's GuideChapter 5: Configuration
Import Geolocation Files Page 349 of 743
To extend file storage:
1. Go to <LoggerInstallation>/config/logger/logger.defaults.properties
2. Edit the property mm.num.old.versions.keep to > 4. (Manually add the property if it is not available)
3. Restart the Logger.
DataThe options in the Configuration | Data category enable you to control the data going in and out of your Logger.
DevicesA device is a named event source, comprising of an IP address (or hostname) and a receiver name. Two receivers can receive events from the same IP address, so IP address alone is insufficient to identify a device. Event source is the device that directly sends the event to Logger. When an event is sent through a SmartConnector, the event source is the system on which the SmartConnector is running and not the device that sent the event to the SmartConnector.
Devices can be added to device groups, and device groups can be referenced in filters and queries. Receivers perform autodiscovery by automatically creating a device for each source IP address. Devices created by autodiscovery are named for their hostname, or if the hostname cannot be determined, their IP address.
The Devices page displays all defined devices and includes controls to add, edit, or delete them.
Devices page
Maximum number of devices that can be defined on Logger: No limit.
Autodiscovery creates devices automatically, but you can also define them manually.
Administrator's GuideChapter 5: Configuration
Data Page 350 of 743
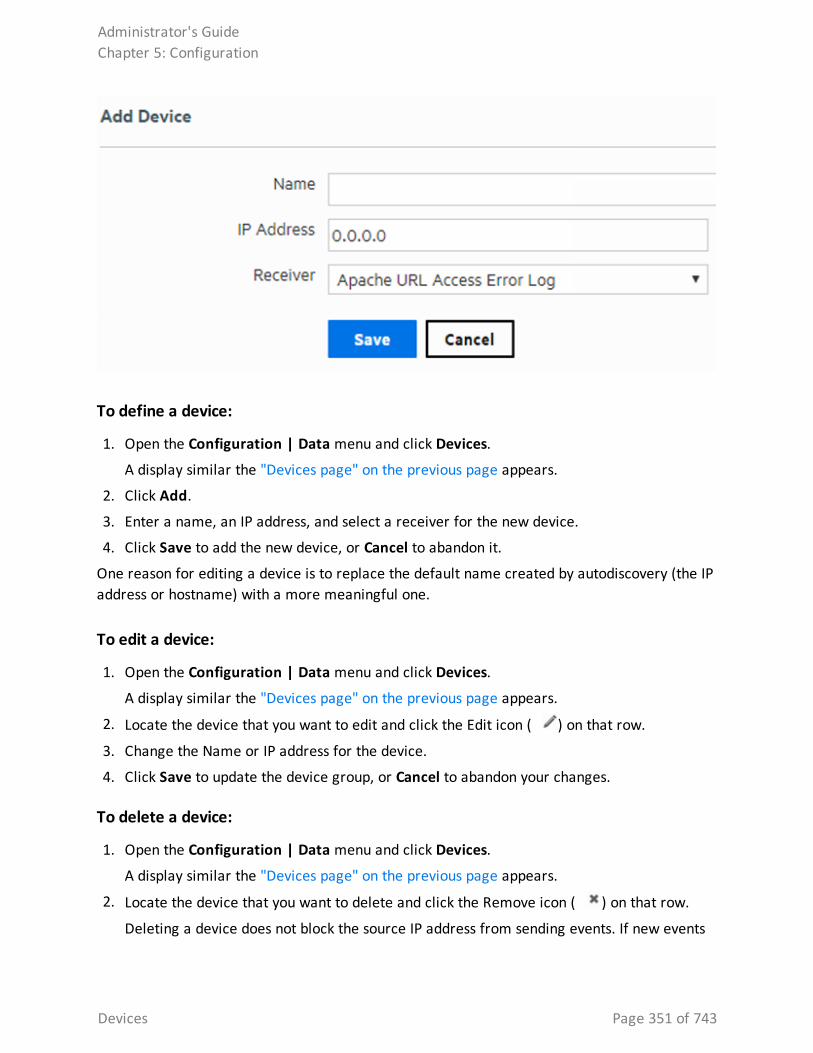
To define a device:
1. Open the Configuration | Data menu and click Devices.
A display similar the "Devices page" on the previous page appears.
2. Click Add.
3. Enter a name, an IP address, and select a receiver for the new device.
4. Click Save to add the new device, or Cancel to abandon it.
One reason for editing a device is to replace the default name created by autodiscovery (the IP address or hostname) with a more meaningful one.
To edit a device:
1. Open the Configuration | Data menu and click Devices.
A display similar the "Devices page" on the previous page appears.
2. Locate the device that you want to edit and click the Edit icon ( ) on that row.
3. Change the Name or IP address for the device.
4. Click Save to update the device group, or Cancel to abandon your changes.
To delete a device:
1. Open the Configuration | Data menu and click Devices.
A display similar the "Devices page" on the previous page appears.
2. Locate the device that you want to delete and click the Remove icon ( ) on that row.
Deleting a device does not block the source IP address from sending events. If new events
Administrator's GuideChapter 5: Configuration
Devices Page 351 of 743
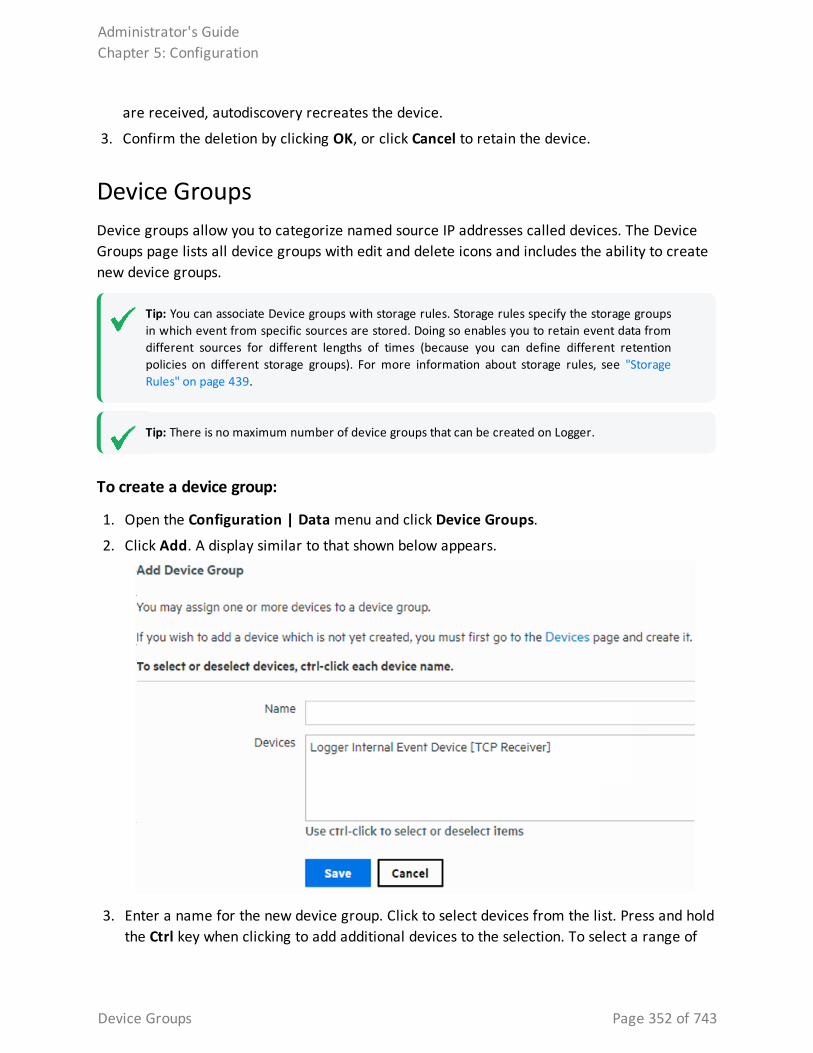
are received, autodiscovery recreates the device.
3. Confirm the deletion by clicking OK, or click Cancel to retain the device.
Device GroupsDevice groups allow you to categorize named source IP addresses called devices. The Device Groups page lists all device groups with edit and delete icons and includes the ability to create new device groups.
Tip: You can associate Device groups with storage rules. Storage rules specify the storage groups in which event from specific sources are stored. Doing so enables you to retain event data from different sources for different lengths of times (because you can define different retention policies on different storage groups). For more information about storage rules, see "Storage Rules" on page 439.
Tip: There is no maximum number of device groups that can be created on Logger.
To create a device group:
1. Open the Configuration | Data menu and click Device Groups.
2. Click Add. A display similar to that shown below appears.
3. Enter a name for the new device group. Click to select devices from the list. Press and hold the Ctrl key when clicking to add additional devices to the selection. To select a range of
Administrator's GuideChapter 5: Configuration
Device Groups Page 352 of 743
devices, click to select the first device, then press and hold the Shift key while clicking the last device.
4. Click Save to create the new device group, or Cancel to abandon it.
To edit a device group:
1. Open the Configuration | Data menu and click Device Groups.
2. Locate the device group that you want to edit and click the Edit icon ( ) on that row.
3. Change the Name, add, or remove devices from the selection. Ctrl-Click devices that are not selected to select them, or Ctrl-Click selected devices to remove them from the selection.
4. Click Save to update the device group, or Cancel to abandon your changes.
To delete a device group:
1. Open the Configuration | Data menu and click Device Groups.
2. Locate the device group that you want to delete and click the Remove icon ( ) on that row. Deleting a device group does not affect the set of devices.
3. Confirm the deletion by clicking OK, or click Cancel to retain the device group.
ReceiversLogger can receive text events, either sent through the network or read from a file. From the Receivers page, you can set up and configure the receivers that will capture event data, and populate each event with information about its origin. Some receivers capture streaming events transmitted over the network by devices, applications, services, and so on. Other types of receivers monitor individual files for events or monitor files selected from a directory tree, based on a pattern you specify. Since receivers can only receive events of a single source type, you should set up separate receivers for each type of log file.
To start receiving events, direct your event sources to the default receivers. For more information about the default receivers, refer to the Logger Installation guide.
Receiver types include UDP, TCP, SmartMessage, and three types of file based receivers, File Transfer, File Receiver, and Folder Follower Receiver.
Administrator's GuideChapter 5: Configuration
Receivers Page 353 of 743
Before the receiver can receive data, the port it is listening on must be opened through the firewall. For more information, see "Firewall Rules" on page 573.
You can configure the following types of receivers:
l UDP Receiver: UDP receivers listen for User Datagram Protocol messages on the port you specify. Logger comes pre-configured with a UDP Receiver on port 514 or 8514, enabled by default. For Software Loggers, this port may vary based on the port numbers available at installation time.
l CEF UDP Receiver: UDP receivers that receive events in Common Event Format.
l TCP Receiver: TCP receivers listen for Transmission Control Protocol messages on the port you specify. Logger comes pre-configured with a TCP receiver on port 515 or 8515, enabled by default. For Software Loggers, this port may vary based on the port numbers available at installation time.
l CEF TCP Receiver: TCP receivers that receive events in Common Event Format.
l Transformation Hub Receiver: Transformation Hub receivers are consumers for the Transformation Hub's publish-subscribe messaging system. They subscribe to event topics and receive events in Common Event Format (CEF) from Transformation Hub.
l File Receiver: Depending on the type of Logger, file receivers read log files from a local file system, Network File System (NFS), or Common Internet File System (CIFS). File receivers read single or multi-line log files. They provide a snapshot of a log file at a single point in time.
l Folder Follower Receiver: Folder follower receivers actively read the log files in a specified directory as they are updated. If the source directory contains different types of log files, you can create a receiver for each type of file that you want to monitor. Logger comes pre-configured with folder follower receivers for Logger’s Apache Access Error Log, the system Messages Log, and Audit Log (when auditing is enabled). You must enable these receivers in order to use them.
l File Transfer: File Transfer receivers read remote log files using SCP, SFTP, or FTP protocol. These receivers can read single- or multi-line log files. You can schedule the receiver to read a file or batch of files periodically.
Note: Be aware of the following when setting up file transfer receivers.
o The SCP, SFTP, and FTP file transfer receivers depend on the FTP (File Transfer Protocol) SCP (Secure Copy Protocol) and SFTP (SSH file transfer protocol) clients installed on your system. Ensure that the appropriate client is installed on the system before you create the receiver.
o The SCP and SFTP protocols on Logger Appliances are not FIPS compliant.
l SmartMessage Receiver: SmartMessage receivers listen for encrypted messages from ArcSight SmartConnectors. Logger comes pre-configured with a SmartMessage receiver with
Administrator's GuideChapter 5: Configuration
Receivers Page 354 of 743
the name “SmartMessage Receiver.” To use this receiver to receive events from a SmartConnector, set the Receiver Name to be “SmartMessage Receiver” when configuring the SmartConnector’s destination. For more information on SmartConnectors, see "Using SmartConnectors to Collect Events" on page 614.
Transformation Hub ReceiversLogger's Transformation Hub receivers connect to Secure Open Data Platform Transformation Hubs and consume all events for the topics that they subscribe to. Loggers receiving events from the Transformation Hub can be part of a pool of Loggers for balanced distribution and redundancy. The events will be distributed among Loggers in the pool in a round-robin fashion. If one Logger in the pool is down, the events will be sent to one of the others.
You can configure multiple Loggers with Transformation Hub receivers that subscribe to the same Event Topic List and belong to the same Consumer Group. Each Logger Transformation Hub receiver in the group will receive events from a different subset of partitions in the topic. The Transformation Hub will balance the partitions between all Transformation Hub receivers configured in the same Consumer Group.
The events are published to the Transformation Hub by ArcSight SmartConnector. When configuring your SmartConnector to send data to a Transformation Hub receiver, use the "Transformation Hub" option.
To configure Transformation Hub receiver using Client Authentication or FIPS, you must set up two way authentication between the Logger and the TH. For information and instructions, see "Transformation Hub Authentication" below. On the other hand, if Transformation Hub is configured using TLS, the user is only required to create the TH receiver and import the certificates; CSR, Sign in, and import are done automatically.
Before using Transformation Hub receivers in appliances, DNS must be configured. For more information, see "System DNS" on page 502.
For more information about ArcSight Transformation Hub, refer to the ArcSight Transformation Hub Administrator's Guide, available at the Micro Focus Security Community.
For more information about SmartConnectors, refer to the SmartConnector User's Guide, available at the Micro Focus Security Community.
Transformation Hub AuthenticationBefore configuring a Transformation Hub receiver using Client Authentication, a two-way authentication between the Logger and the Transformation Hub needs to be established. The steps detailed below need to be executed for FIPS as well.
To set up two-way authentication, follow the steps in these sections:
Administrator's GuideChapter 5: Configuration
Transformation Hub Receivers Page 355 of 743
l Step 1: Generate a CSR on the Logger Side
l Step 2: Locate Tranformation Hubs Intermediate Certificate and Key
l Step 3: Sign the Logger CSR on the Transformation Hub
l Step 4: Move the Signed Certificate File to Logger
l Step 5: Import the Certificate Chain to the Logger Keystore
Repeat these steps for each Logger that needs to receive data from Transformation Hub. Authentication can be performed for a new Logger at any time.
Step 1: Generate a CSR on the Logger Side
1. Log in to the Logger host using your operating system credentials.
2. Run the th_cert_tool script to generate a CSR: th_cert_tool.sh --generate-csr --th-host <FQDN of TH master> --key-length 2048.
On the Logger appliance, the script is located in: /opt/arcsight/logger/bin/scripts/th_cert_tool.sh.
On Software Logger, the script is located in: <install_dir>/current/arcsight/logger/bin/scripts/th_cert_tool.sh.
3. Copy the CSR text file to the Transformation Hub host.
For example: scp /tmp/csr.csr root@<th_host_ip>:/tmp/.
Step 2: Locate Tranformation Hubs Intermediate Certificate and Key
Obtain TH's intermediate certificate, key and the CA certificate.
1. Self signed certificate for TH is automatically generated during TH installation and it is located in: /opt/arcsight/kubernetes/ssl/ca.crt and ca.key.
2. If CA-signed certificate is used, acquire TH´s intermediate certificate and key issued by the root CA.
Step 3: Sign the Logger CSR on the Transformation Hub
For information, refer to the Arcsight Transformation Hub Guide.
1. Log in to the Transformation Hub host.
2. Run the following command to sign the CSR:openssl x509 -req -CA <path to intermediate certificate> -CAkey <path to intermediate key> -in /tmp/csr.csr -out /tmp/signedLoggerCert.pem -days 3650 -CAcreateserial -- passin pass <password> -sha256.
Administrator's GuideChapter 5: Configuration
Step 1: Generate a CSR on the Logger Side Page 356 of 743
Step 4: Move the Signed Certificate File to Logger
1. If self-signed certificate is used, copy the signed certificate to the Logger host, for example: scp /tmp/signedLoggerCert.pem [Logger IP]:/tmp/.
2. If CA-signed certificate is used, generate the chained certificates by cat: <path to TH's CA certificate> <path to intermediate certificate> <path to signed certificate> <path to new chained PEM file> . After the information is retrieved, copy the chained certificate to Logger: scp <path to new chained PEM file> [Logger IP]:/tmp/.
Step 5: Import the Certificate Chain to the Logger Keystore
Note: If you are reusing the same Logger from previous test (Not freshly installed Logger):
1. Remove previous import by using the command:
mv <arcsight_ home>/user/logger/fips/receiver/bcfks_ ks <arcsight_home>/user/logger/fips/receiver/bcfks_ks.bak.
2. Restart logger.
1. Log in to the Logger host using operating system credentials. Use the same credentials that were used to generate the CSR.
2. Run the th_cert_tool to import the certificate:
On Software Appliance: /opt/arcsight/logger/current/arcsight/logger/bin/scripts/th_cert_tool.sh --import-cert --th-host <FQDN of TH master> --cert-path <path to the chained PEM file>
On Logger Appliance: /opt/arcsight/logger/bin/scripts/th_cert_tool.sh --import-cert --th-host <FQDN of TH master> --cert-path <location of cert signed by TH>
3. Follow the instructions in "Working with Receivers" on page 361 to configure Transformation Hub Receivers for the Transformation Hub. Only one signed certificate is required for each Transformation Hub or Transformation Hub Cluster.
4. Repeat the steps in each section of this topic for all Transformation Hubs that do not have the same CA certificate, from which Logger needs to receive events.
You can now configure Transformation Hub receivers on your Logger.
Import Transformation Hub RE Certificate The user is required to manually import the Realm External CA (RE CA) certificate exported from the TH cluster prior the Kafka receiver creation. The RE certificate does not change if the
Administrator's GuideChapter 5: Configuration
Step 4: Move the Signed Certificate File to Logger Page 357 of 743
Transformation Hub is restarted or redeployed. Any newly generated certificates after restart are trusted by this RE CA enabling the receiver to continue accepting events.
To configure Transformation Hub using TLS, the user is only required to create the TH receiver and import the files as described below; Authentication and Sign in are done automatically. Meanwhile, for Client Authentication, you must set up two way authentication between the Logger as described in "Transformation Hub Authentication" on page 355.
Step 1: Obtain Transformation Hub RE Certificate
1. On Transformation Hub 3.0 SSH console, run the following command to retrieve Transformation Hub RE certificate: /opt/kubernetes/scripts/cdf-updateRE.sh > /tmp/RE.crt
2. Copy the /tmp/RE.crt obtained from step 1 to Logger box at /tmp;.
Step 2: Set the environment
1. Set the ARCSIGHT_HOME environment variable:
l Appliance: export ARCSIGHT_HOME=/opt/arcsight/logger
l Software: export ARCSIGHT_HOME=[logger install directory]/current/arcsight/logger
For existing Kafka receivers only:
1. In Logger SSH console, look for the previous TH certificate(s) from Logger receiver trust store running the script available at:
l Appliance: /opt/arcsight/logger/bin/scripts/keytool_util.sh.
l Software:[Install dir]/current/arcsight/logger/bin/scripts/keytool_util.sh
Caution: <verisignserverca> uses a 1000-bit RSA key which is considered a security risk.
2. Delete the TH certificate(s) from previous step in Logger receiver trust store running the script available at: /opt/arcsight/logger/bin/scripts/keytool_util.sh
Make sure to execute the command as it follows: ./keytool_util.sh receiver delete [alias]
Administrator's GuideChapter 5: Configuration
Step 1: Obtain Transformation Hub RE Certificate Page 358 of 743
Step 3: Import the RE Certificate
1. In Logger SSH console, import the new TH RE certificate using the RE.crt file copied from TH running the script available at:
/opt/arcsight/logger/bin/scripts/keytool_util.sh.
Make sure to execute the command as it follows: ./keytool_util.sh receiver importcert [certificate]
2. Confirm TH FQDN is settled in Logger DNS before creating Kafka receivers in SSL mode in Logger.
For existing Kafka receivers:
Restart the receiver processes available at:
l Appliance: /opt/arcsight/logger/bin/loggerd restart receivers
l Software: [install dir]/current/arcsight/logger/bin/loggerd restart receivers
File Based ReceiversFile based receiver types include File Receivers, File Transfer Receivers, and Folder Follower Receivers. You can set them up as multiline receivers, and configure them to use source types with associated parsers to extract data from captured events.
Note: When a receiver cannot read the file it logs from, such as when the file or folder is deleted or renamed, Logger records a message in current/arcsight/logger/logs/logger_receiver.log
Multi-line Receivers
TCP and UDP receivers interpret line break characters, such as \r or \n, as the end of the event. If the input event contains embedded \r or \n characters, the event will be treated as more than one event. If your events span more than one line, you may want to use a multi-line receiver. Multi-line receivers include the File Transfer, File Receiver, and Folder Follower Receivers.
A multi-line receiver can read events that span more than one line, such as a server log. You could set up the receiver to handle stack traces reported in the log by reading the entire stack trace as a single event instead of reading each line separately.
Administrator's GuideChapter 5: Configuration
Step 3: Import the RE Certificate Page 359 of 743
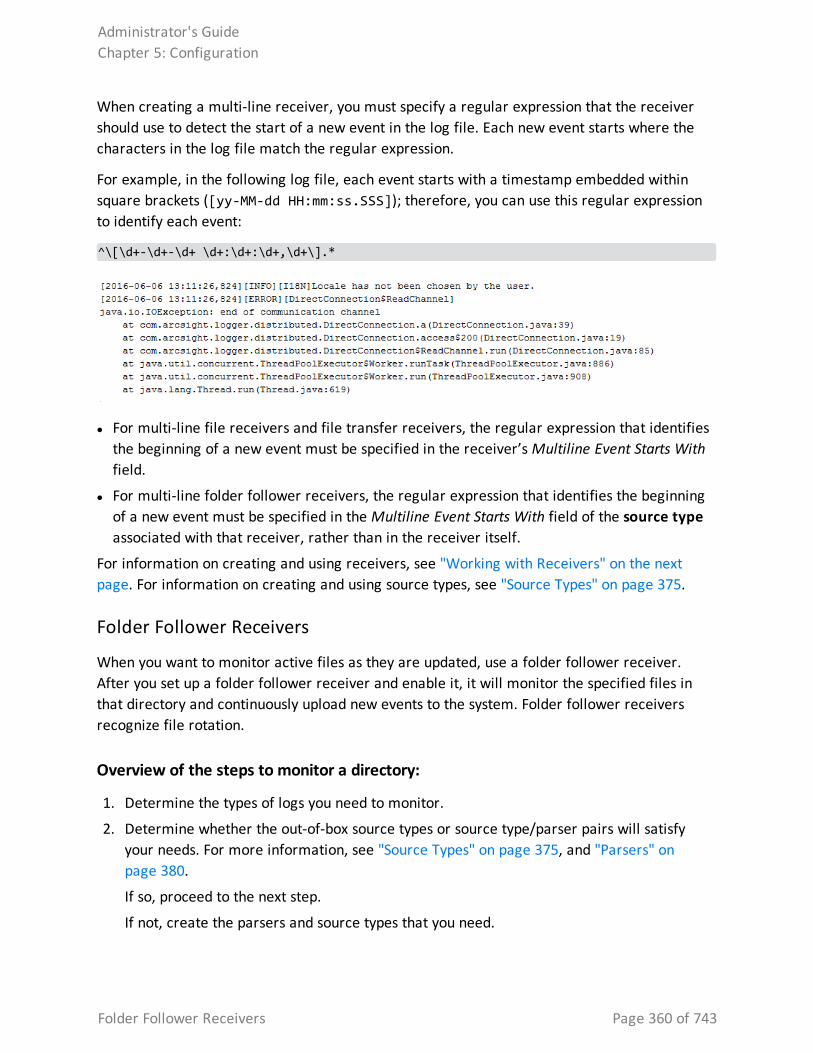
When creating a multi-line receiver, you must specify a regular expression that the receiver should use to detect the start of a new event in the log file. Each new event starts where the characters in the log file match the regular expression.
For example, in the following log file, each event starts with a timestamp embedded within square brackets ([yy-MM-dd HH:mm:ss.SSS]); therefore, you can use this regular expression to identify each event:
^\[\d+-\d+-\d+ \d+:\d+:\d+,\d+\].*
l For multi-line file receivers and file transfer receivers, the regular expression that identifies the beginning of a new event must be specified in the receiver’s Multiline Event Starts With field.
l For multi-line folder follower receivers, the regular expression that identifies the beginning of a new event must be specified in the Multiline Event Starts With field of the source type associated with that receiver, rather than in the receiver itself.
For information on creating and using receivers, see "Working with Receivers" on the next page. For information on creating and using source types, see "Source Types" on page 375.
Folder Follower Receivers
When you want to monitor active files as they are updated, use a folder follower receiver. After you set up a folder follower receiver and enable it, it will monitor the specified files in that directory and continuously upload new events to the system. Folder follower receivers recognize file rotation.
Overview of the steps to monitor a directory:
1. Determine the types of logs you need to monitor.
2. Determine whether the out-of-box source types or source type/parser pairs will satisfy your needs. For more information, see "Source Types" on page 375, and "Parsers" on page 380.
If so, proceed to the next step.
If not, create the parsers and source types that you need.
Administrator's GuideChapter 5: Configuration
Folder Follower Receivers Page 360 of 743
a. Select an appropriate parser or set of parser for the log files in the directory you want to follow. If the out-of-box parsers do not provide what you need, create appropriate parsers.
b. Assign a source type for each parser. If the out-of-box source types do not provide what you need, create appropriate source types.
3. Create the folder follower receivers required to monitor the logs in the directory, selecting the source type you chose or created, above. For more information, see "Working with Receivers" below.
4. Enable the receivers.
5. Optionally, to forward log file events, set up and configure one or more forwarders. For more information, see "Forwarders" on page 386.
Using Source Types with File Follower Receivers
Logger uses the parser associated with the source type you select for a receiver to extract fields and their respective values from the received events. These fields are parsed at search time. For more information on using source types and parsers, see "Source Types" on page 375, and "Parsers" on page 380.
When creating a file follower receiver, you must select a source type appropriate to monitor a specific type of log file. After you select the source type for the file follower receiver, ensure that the parser associated with it works with your source files.
Events from different versions of the same source type can be in different formats. Similarly, events from different source types of the same vendor might be formatted differently. Therefore, if the source type of your source file does not exactly match the specifications of your source type, the associated parser will not parse events correctly, and the search results will not display any parsed fields.
To confirm whether the source type has a valid parser for your source type, after you have set up the receiver, check whether the incoming events are parsed. To determine this, run a search and review the “parser” field in the search results. The parser used in the search will be displayed in the parser column of the search results. If the event was parsed, this field contains the name of the parser. If the event was not parsed successfully, this field contains “Not parsed.” If no parser is defined for the source type or if there is no source type, the field is blank.
Working with ReceiversSeveral receivers come set up on your system. You can add other receivers as needed. The maximum number of receivers that you can create is limited by system resources—memory,
Administrator's GuideChapter 5: Configuration
Using Source Types with File Follower Receivers Page 361 of 743
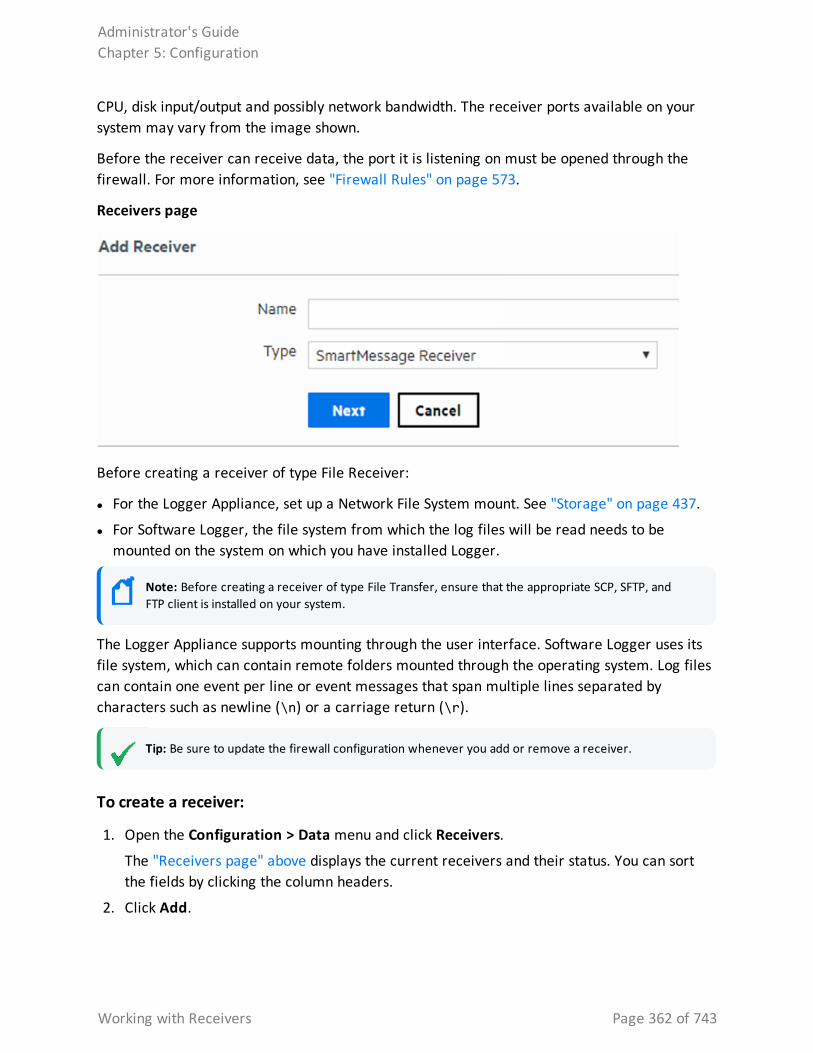
CPU, disk input/output and possibly network bandwidth. The receiver ports available on your system may vary from the image shown.
Before the receiver can receive data, the port it is listening on must be opened through the firewall. For more information, see "Firewall Rules" on page 573.
Receivers page
Before creating a receiver of type File Receiver:
l For the Logger Appliance, set up a Network File System mount. See "Storage" on page 437.
l For Software Logger, the file system from which the log files will be read needs to be mounted on the system on which you have installed Logger.
Note: Before creating a receiver of type File Transfer, ensure that the appropriate SCP, SFTP, and FTP client is installed on your system.
The Logger Appliance supports mounting through the user interface. Software Logger uses its file system, which can contain remote folders mounted through the operating system. Log files can contain one event per line or event messages that span multiple lines separated by characters such as newline (\n) or a carriage return (\r).
Tip: Be sure to update the firewall configuration whenever you add or remove a receiver.
To create a receiver:
1. Open the Configuration > Data menu and click Receivers.
The "Receivers page" above displays the current receivers and their status. You can sort the fields by clicking the column headers.
2. Click Add.
Administrator's GuideChapter 5: Configuration
Working with Receivers Page 362 of 743
3. Enter a name for the new receiver. Provide a name that is unique and not likely to be duplicated elsewhere. SmartMessage receiver names are used when configuring the associated ArcSight SmartConnectors.
4. Choose the receiver type. Select UDP Receiver, TCP Receiver, CEF UDP Receiver, CEF TCP Receiver, File Receiver, Folder Follower Receiver, File Transfer, or SmartMessage Receiver. The receiver type cannot be changed after the receiver is created.
Note: Before you can configure a Transformation Hub receiver, you must set up two way authentication between the Logger and the Transformation Hub. For information and instructions, see "Transformation Hub Authentication" on page 355 "Transformation Hub Authentication" on page 355.
5. Click Next to edit receiver parameters.
The fields displayed in the Edit Receiver dialog box vary according to the type of Logger and the type of receiver.
6. Fill in the appropriate fields. Refer to the following tables for field descriptions.
l "UDP, TCP, CEF UDP, and CEF TCP Receiver Parameters" on page 365
l " Transformation Hub Receiver Parameters" on page 366
l "File Receiver Parameters" on page 367
l "Folder Follower Receiver Parameters" on page 369
l "File Transfer Receiver Parameters" on page 371
l "SmartMessage Receiver Parameters" on page 373
7. The Enable checkbox is flagged by default, so that the receiver will be enabled immediately after you create. If you do not want to enable the receiver now, click the checkbox to remove the flag. You can enable it later.
8. Click Save.
To enable or disable a receiver:
Note: Before enabling the following preconfigured folder follower receivers for Software Logger, ensure that the files are readable by the non-root user that you installed with or specified during installation.
l /var/log/messages
l /var/log/audit/audit.log
1. Open the Configuration > Data menu and click Receivers.
The "Receivers page" on the previous page displays the current receivers and their status. You can sort the fields by clicking the column headers.
Administrator's GuideChapter 5: Configuration
Working with Receivers Page 363 of 743
2. Locate the receiver that you want to enable or disable.
l If the receiver is currently disabled, click the Disabled icon ( ) to enable it.
l If the receiver is currently enabled, click the Enabled icon ( ) to disable it.
Tip: Wait a few minutes after enabling a receiver before disabling it. Likewise, wait before enabling a receiver that has just been disabled. Background tasks initiated by enabling or disabling a receiver can produce unexpected results if they are interrupted.
To edit a receiver:
1. Open the Configuration > Data menu and click Receivers.
The "Receivers page" on page 362 displays the current receivers and their status. You can sort the fields by clicking the column headers.
2. Locate the receiver that you want to update and click the Edit icon ( ) on that row.
The fields displayed in the Edit Receiver dialog box vary according to the type of Logger and the type of Receiver.
3. Edit the appropriate fields. Refer to the following tables for field descriptions.
l "UDP, TCP, CEF UDP, and CEF TCP Receiver Parameters" on the next page
l " Transformation Hub Receiver Parameters" on page 366
l "File Receiver Parameters" on page 367
l "Folder Follower Receiver Parameters" on page 369
l "File Transfer Receiver Parameters" on page 371
l "SmartMessage Receiver Parameters" on page 373
4. Flag the Enable checkbox to have the receiver immediately enabled, or remove the flag from the checkbox to enable the receiver later.
5. Click Save.
To delete a receiver:
1. Open the Configuration > Data menu and click Receivers.
The "Receivers page" on page 362 displays the current receivers and their status. You can sort the fields by clicking the column headers.
2. Locate the receiver that you want to delete and click the Remove icon ( ) on that row.
3. Click OK to confirm the delete.
Administrator's GuideChapter 5: Configuration
Working with Receivers Page 364 of 743
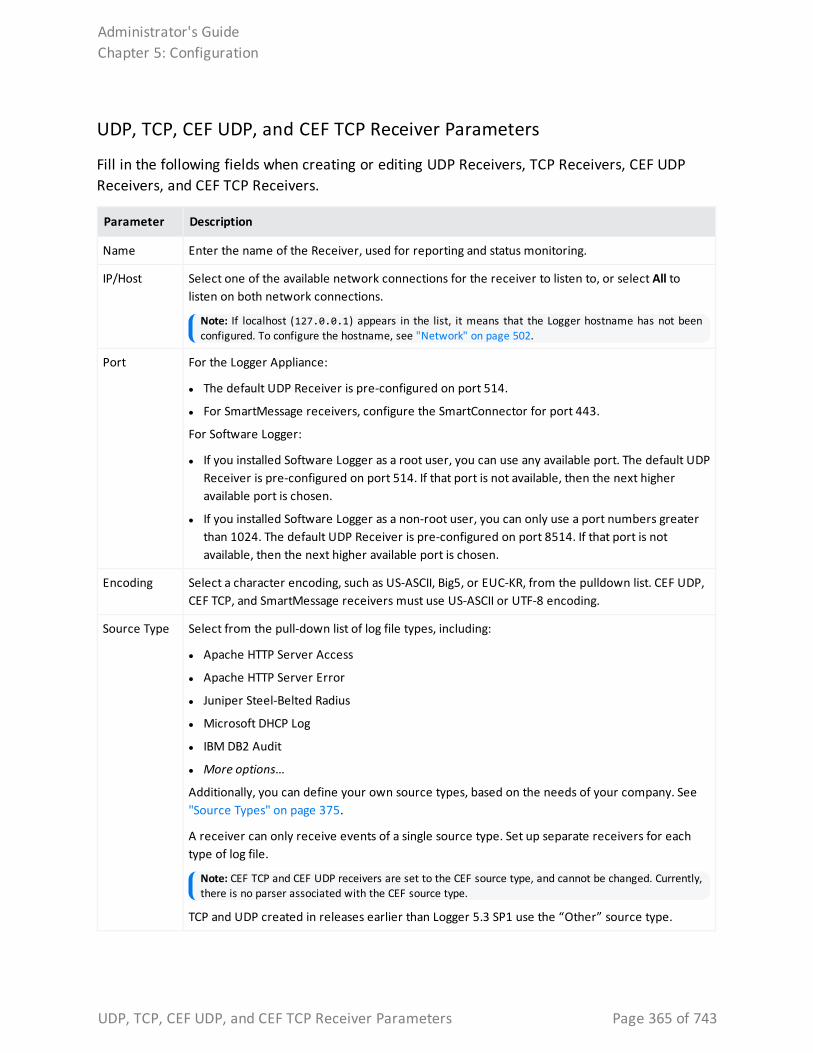
UDP, TCP, CEF UDP, and CEF TCP Receiver Parameters
Fill in the following fields when creating or editing UDP Receivers, TCP Receivers, CEF UDP Receivers, and CEF TCP Receivers.
Parameter Description
Name Enter the name of the Receiver, used for reporting and status monitoring.
IP/Host Select one of the available network connections for the receiver to listen to, or select All to listen on both network connections.
Note: If localhost (127.0.0.1) appears in the list, it means that the Logger hostname has not been configured. To configure the hostname, see "Network" on page 502.
Port For the Logger Appliance:
l The default UDP Receiver is pre-configured on port 514.
l For SmartMessage receivers, configure the SmartConnector for port 443.
For Software Logger:
l If you installed Software Logger as a root user, you can use any available port. The default UDP Receiver is pre-configured on port 514. If that port is not available, then the next higher available port is chosen.
l If you installed Software Logger as a non-root user, you can only use a port numbers greater than 1024. The default UDP Receiver is pre-configured on port 8514. If that port is not available, then the next higher available port is chosen.
Encoding Select a character encoding, such as US-ASCII, Big5, or EUC-KR, from the pulldown list. CEF UDP, CEF TCP, and SmartMessage receivers must use US-ASCII or UTF-8 encoding.
Source Type Select from the pull-down list of log file types, including:
l Apache HTTP Server Access
l Apache HTTP Server Error
l Juniper Steel-Belted Radius
l Microsoft DHCP Log
l IBM DB2 Audit
l More options...
Additionally, you can define your own source types, based on the needs of your company. See "Source Types" on page 375.
A receiver can only receive events of a single source type. Set up separate receivers for each type of log file.
Note: CEF TCP and CEF UDP receivers are set to the CEF source type, and cannot be changed. Currently, there is no parser associated with the CEF source type.
TCP and UDP created in releases earlier than Logger 5.3 SP1 use the “Other” source type.
Administrator's GuideChapter 5: Configuration
UDP, TCP, CEF UDP, and CEF TCP Receiver Parameters Page 365 of 743
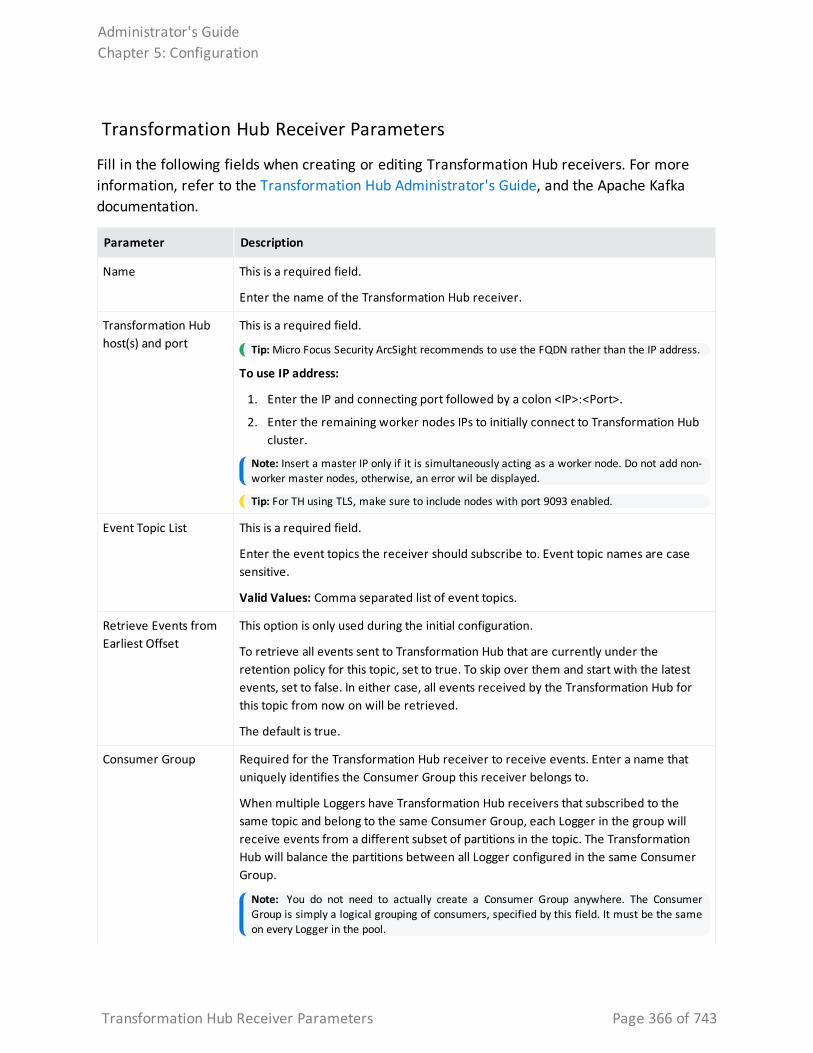
Transformation Hub Receiver Parameters
Fill in the following fields when creating or editing Transformation Hub receivers. For more information, refer to the Transformation Hub Administrator's Guide, and the Apache Kafka documentation.
Parameter Description
Name This is a required field.
Enter the name of the Transformation Hub receiver.
Transformation Hub host(s) and port
This is a required field.
Tip: Micro Focus Security ArcSight recommends to use the FQDN rather than the IP address.
To use IP address:
1. Enter the IP and connecting port followed by a colon <IP>:<Port>.
2. Enter the remaining worker nodes IPs to initially connect to Transformation Hub cluster.
Note: Insert a master IP only if it is simultaneously acting as a worker node. Do not add non-worker master nodes, otherwise, an error wil be displayed.
Tip: For TH using TLS, make sure to include nodes with port 9093 enabled.
Event Topic List This is a required field.
Enter the event topics the receiver should subscribe to. Event topic names are case sensitive.
Valid Values: Comma separated list of event topics.
Retrieve Events from Earliest Offset
This option is only used during the initial configuration.
To retrieve all events sent to Transformation Hub that are currently under the retention policy for this topic, set to true. To skip over them and start with the latest events, set to false. In either case, all events received by the Transformation Hub for this topic from now on will be retrieved.
The default is true.
Consumer Group Required for the Transformation Hub receiver to receive events. Enter a name that uniquely identifies the Consumer Group this receiver belongs to.
When multiple Loggers have Transformation Hub receivers that subscribed to the same topic and belong to the same Consumer Group, each Logger in the group will receive events from a different subset of partitions in the topic. The Transformation Hub will balance the partitions between all Logger configured in the same Consumer Group.
Note: You do not need to actually create a Consumer Group anywhere. The Consumer Group is simply a logical grouping of consumers, specified by this field. It must be the same on every Logger in the pool.
Administrator's GuideChapter 5: Configuration
Transformation Hub Receiver Parameters Page 366 of 743
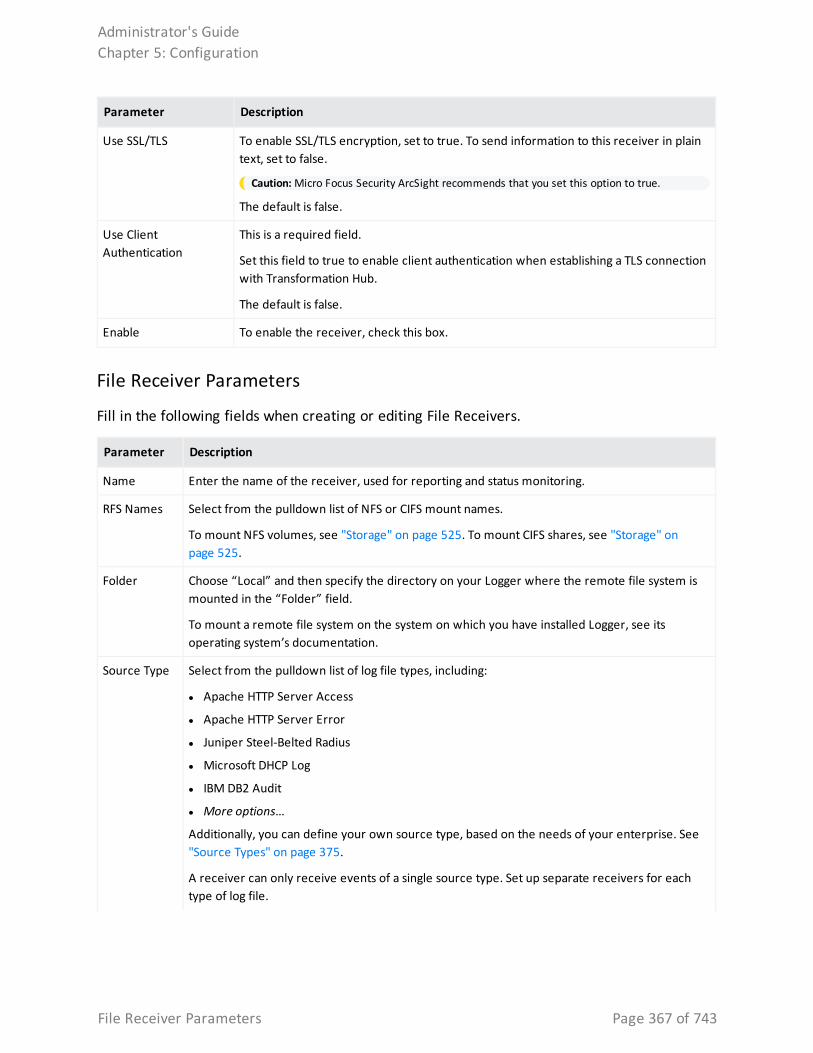
Parameter Description
Use SSL/TLS To enable SSL/TLS encryption, set to true. To send information to this receiver in plain text, set to false.
Caution: Micro Focus Security ArcSight recommends that you set this option to true.
The default is false.
Use Client Authentication
This is a required field.
Set this field to true to enable client authentication when establishing a TLS connection with Transformation Hub.
The default is false.
Enable To enable the receiver, check this box.
File Receiver Parameters
Fill in the following fields when creating or editing File Receivers.
Parameter Description
Name Enter the name of the receiver, used for reporting and status monitoring.
RFS Names Select from the pulldown list of NFS or CIFS mount names.
To mount NFS volumes, see "Storage" on page 525. To mount CIFS shares, see "Storage" on page 525.
Folder Choose “Local” and then specify the directory on your Logger where the remote file system is mounted in the “Folder” field.
To mount a remote file system on the system on which you have installed Logger, see its operating system’s documentation.
Source Type Select from the pulldown list of log file types, including:
l Apache HTTP Server Access
l Apache HTTP Server Error
l Juniper Steel-Belted Radius
l Microsoft DHCP Log
l IBM DB2 Audit
l More options...
Additionally, you can define your own source type, based on the needs of your enterprise. See "Source Types" on page 375.
A receiver can only receive events of a single source type. Set up separate receivers for each type of log file.
Administrator's GuideChapter 5: Configuration
File Receiver Parameters Page 367 of 743
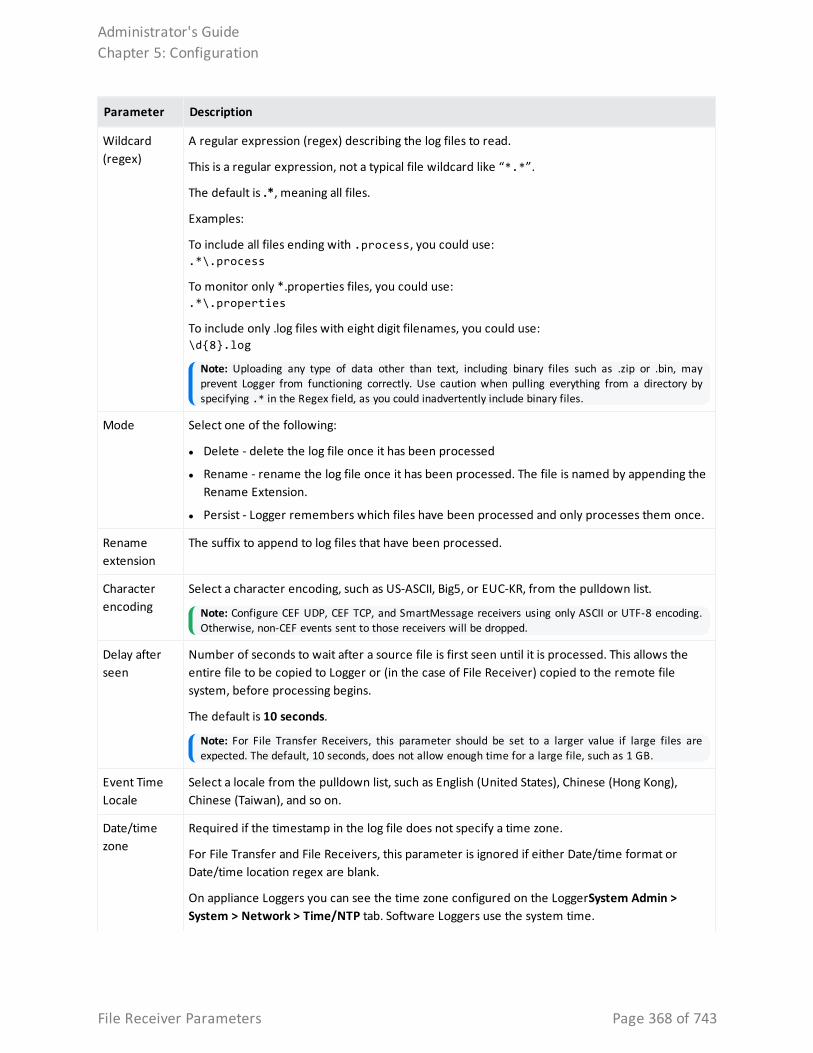
Parameter Description
Wildcard (regex)
A regular expression (regex) describing the log files to read.
This is a regular expression, not a typical file wildcard like “*.*”.
The default is .*, meaning all files.
Examples:
To include all files ending with .process, you could use:.*\.process
To monitor only *.properties files, you could use:.*\.properties
To include only .log files with eight digit filenames, you could use: \d{8}.log
Note: Uploading any type of data other than text, including binary files such as .zip or .bin, may prevent Logger from functioning correctly. Use caution when pulling everything from a directory by specifying .* in the Regex field, as you could inadvertently include binary files.
Mode Select one of the following:
l Delete - delete the log file once it has been processed
l Rename - rename the log file once it has been processed. The file is named by appending the Rename Extension.
l Persist - Logger remembers which files have been processed and only processes them once.
Rename extension
The suffix to append to log files that have been processed.
Character encoding
Select a character encoding, such as US-ASCII, Big5, or EUC-KR, from the pulldown list.
Note: Configure CEF UDP, CEF TCP, and SmartMessage receivers using only ASCII or UTF-8 encoding. Otherwise, non-CEF events sent to those receivers will be dropped.
Delay after seen
Number of seconds to wait after a source file is first seen until it is processed. This allows the entire file to be copied to Logger or (in the case of File Receiver) copied to the remote file system, before processing begins.
The default is 10 seconds.
Note: For File Transfer Receivers, this parameter should be set to a larger value if large files are expected. The default, 10 seconds, does not allow enough time for a large file, such as 1 GB.
Event Time Locale
Select a locale from the pulldown list, such as English (United States), Chinese (Hong Kong), Chinese (Taiwan), and so on.
Date/time zone
Required if the timestamp in the log file does not specify a time zone.
For File Transfer and File Receivers, this parameter is ignored if either Date/time format or Date/time location regex are blank.
On appliance Loggers you can see the time zone configured on the LoggerSystem Admin > System > Network > Time/NTP tab. Software Loggers use the system time.
Administrator's GuideChapter 5: Configuration
File Receiver Parameters Page 368 of 743
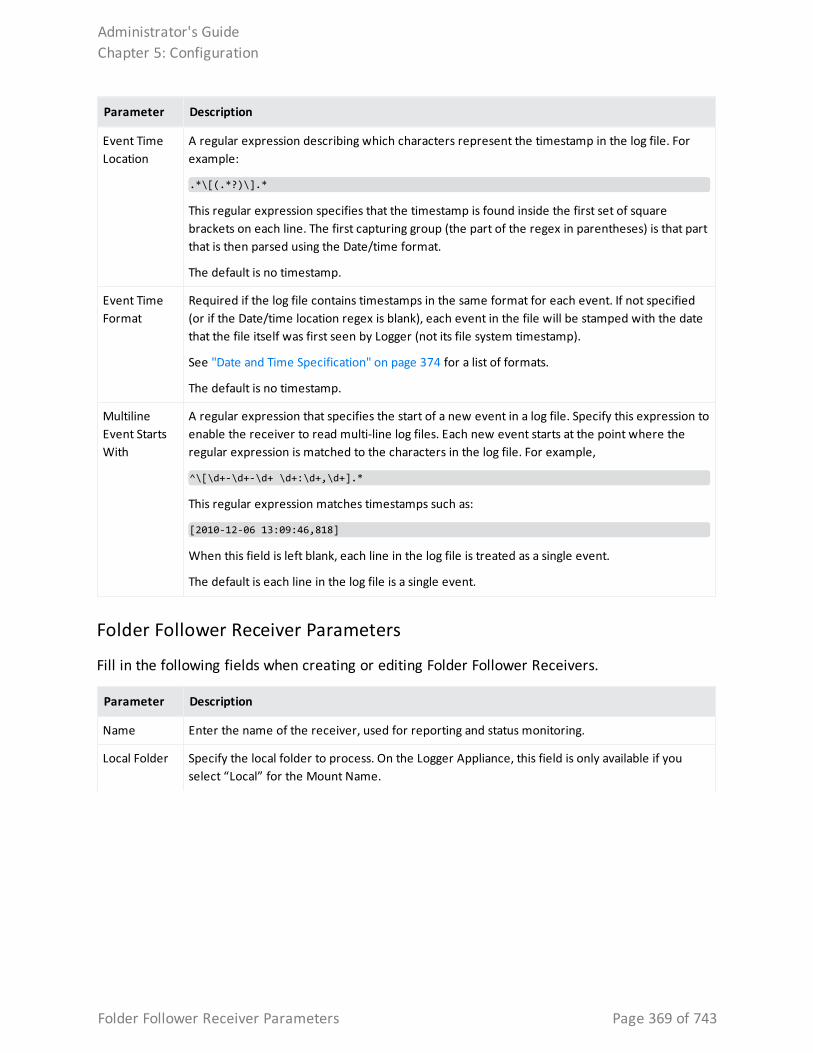
Parameter Description
Event Time Location
A regular expression describing which characters represent the timestamp in the log file. For example:
.*\[(.*?)\].*
This regular expression specifies that the timestamp is found inside the first set of square brackets on each line. The first capturing group (the part of the regex in parentheses) is that part that is then parsed using the Date/time format.
The default is no timestamp.
Event Time Format
Required if the log file contains timestamps in the same format for each event. If not specified (or if the Date/time location regex is blank), each event in the file will be stamped with the date that the file itself was first seen by Logger (not its file system timestamp).
See "Date and Time Specification" on page 374 for a list of formats.
The default is no timestamp.
Multiline Event Starts With
A regular expression that specifies the start of a new event in a log file. Specify this expression to enable the receiver to read multi-line log files. Each new event starts at the point where the regular expression is matched to the characters in the log file. For example,
^\[\d+-\d+-\d+ \d+:\d+,\d+].*
This regular expression matches timestamps such as:
[2010-12-06 13:09:46,818]
When this field is left blank, each line in the log file is treated as a single event.
The default is each line in the log file is a single event.
Folder Follower Receiver Parameters
Fill in the following fields when creating or editing Folder Follower Receivers.
Parameter Description
Name Enter the name of the receiver, used for reporting and status monitoring.
Local Folder Specify the local folder to process. On the Logger Appliance, this field is only available if you select “Local” for the Mount Name.
Administrator's GuideChapter 5: Configuration
Folder Follower Receiver Parameters Page 369 of 743
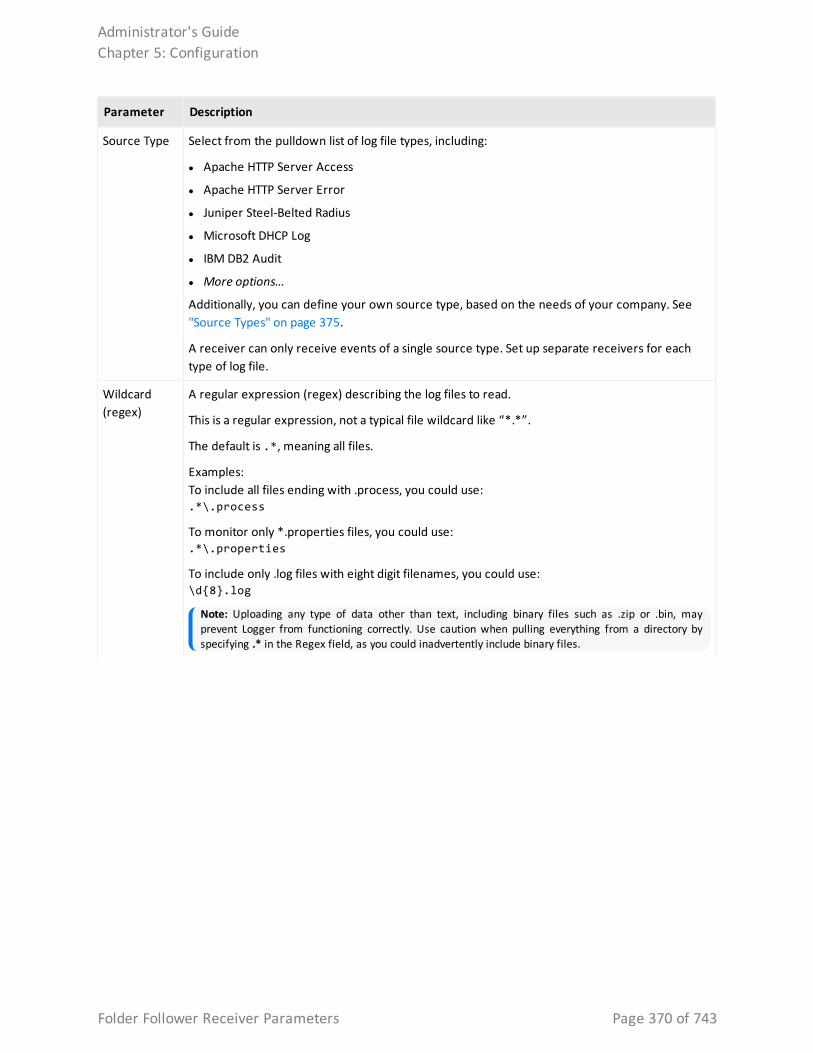
Parameter Description
Source Type Select from the pulldown list of log file types, including:
l Apache HTTP Server Access
l Apache HTTP Server Error
l Juniper Steel-Belted Radius
l Microsoft DHCP Log
l IBM DB2 Audit
l More options...
Additionally, you can define your own source type, based on the needs of your company. See "Source Types" on page 375.
A receiver can only receive events of a single source type. Set up separate receivers for each type of log file.
Wildcard (regex)
A regular expression (regex) describing the log files to read.
This is a regular expression, not a typical file wildcard like “*.*”.
The default is .*, meaning all files.
Examples:To include all files ending with .process, you could use:.*\.process
To monitor only *.properties files, you could use:.*\.properties
To include only .log files with eight digit filenames, you could use: \d{8}.log
Note: Uploading any type of data other than text, including binary files such as .zip or .bin, may prevent Logger from functioning correctly. Use caution when pulling everything from a directory by specifying .* in the Regex field, as you could inadvertently include binary files.
Administrator's GuideChapter 5: Configuration
Folder Follower Receiver Parameters Page 370 of 743
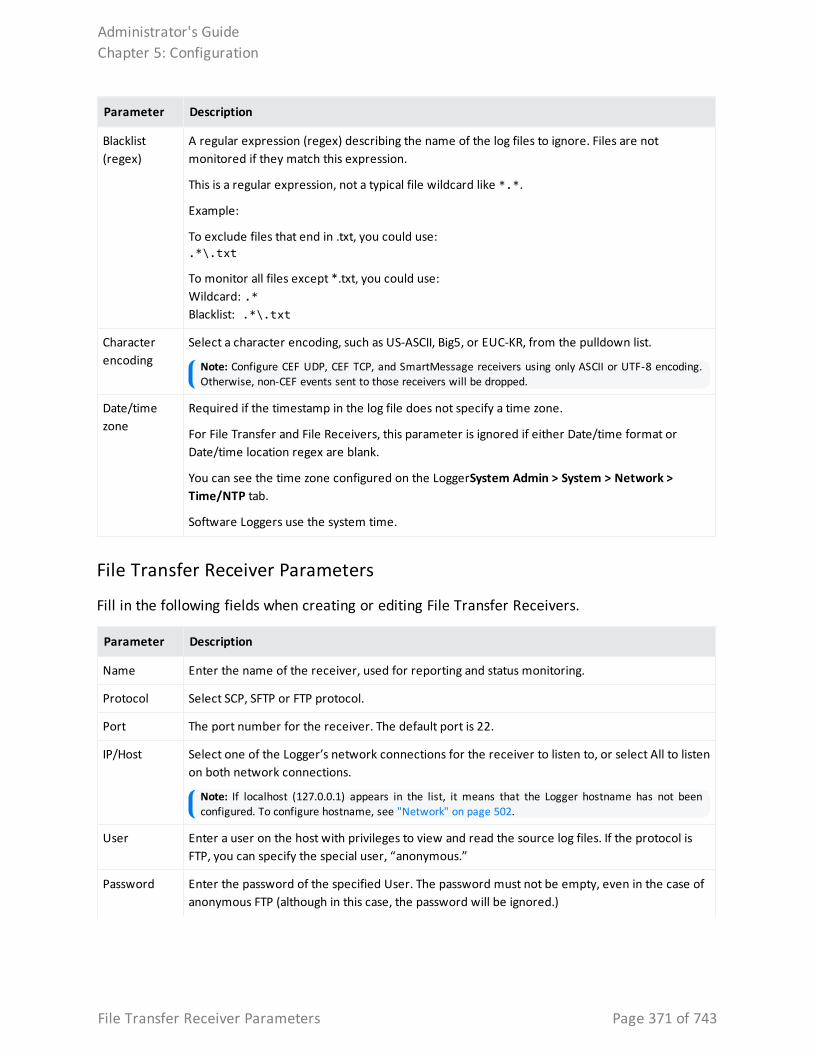
Parameter Description
Blacklist (regex)
A regular expression (regex) describing the name of the log files to ignore. Files are not monitored if they match this expression.
This is a regular expression, not a typical file wildcard like *.*.
Example:
To exclude files that end in .txt, you could use:.*\.txt
To monitor all files except *.txt, you could use: Wildcard: .*Blacklist: .*\.txt
Character encoding
Select a character encoding, such as US-ASCII, Big5, or EUC-KR, from the pulldown list.
Note: Configure CEF UDP, CEF TCP, and SmartMessage receivers using only ASCII or UTF-8 encoding. Otherwise, non-CEF events sent to those receivers will be dropped.
Date/time zone
Required if the timestamp in the log file does not specify a time zone.
For File Transfer and File Receivers, this parameter is ignored if either Date/time format or Date/time location regex are blank.
You can see the time zone configured on the LoggerSystem Admin > System > Network > Time/NTP tab.
Software Loggers use the system time.
File Transfer Receiver Parameters
Fill in the following fields when creating or editing File Transfer Receivers.
Parameter Description
Name Enter the name of the receiver, used for reporting and status monitoring.
Protocol Select SCP, SFTP or FTP protocol.
Port The port number for the receiver. The default port is 22.
IP/Host Select one of the Logger’s network connections for the receiver to listen to, or select All to listen on both network connections.
Note: If localhost (127.0.0.1) appears in the list, it means that the Logger hostname has not been configured. To configure hostname, see "Network" on page 502.
User Enter a user on the host with privileges to view and read the source log files. If the protocol is FTP, you can specify the special user, “anonymous.”
Password Enter the password of the specified User. The password must not be empty, even in the case of anonymous FTP (although in this case, the password will be ignored.)
Administrator's GuideChapter 5: Configuration
File Transfer Receiver Parameters Page 371 of 743
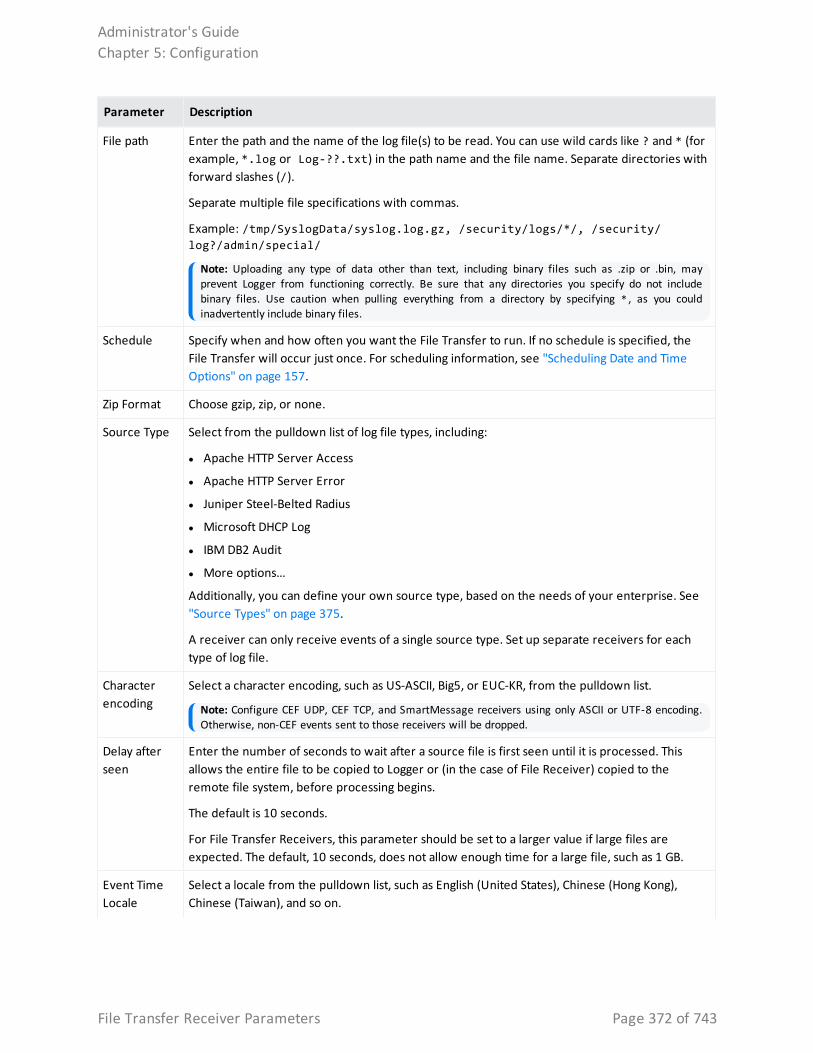
Parameter Description
File path Enter the path and the name of the log file(s) to be read. You can use wild cards like ? and * (for example, *.log or Log-??.txt) in the path name and the file name. Separate directories with forward slashes (/).
Separate multiple file specifications with commas.
Example: /tmp/SyslogData/syslog.log.gz, /security/logs/*/, /security/ log?/admin/special/
Note: Uploading any type of data other than text, including binary files such as .zip or .bin, may prevent Logger from functioning correctly. Be sure that any directories you specify do not include binary files. Use caution when pulling everything from a directory by specifying * , as you could inadvertently include binary files.
Schedule Specify when and how often you want the File Transfer to run. If no schedule is specified, the File Transfer will occur just once. For scheduling information, see "Scheduling Date and Time Options" on page 157.
Zip Format Choose gzip, zip, or none.
Source Type Select from the pulldown list of log file types, including:
l Apache HTTP Server Access
l Apache HTTP Server Error
l Juniper Steel-Belted Radius
l Microsoft DHCP Log
l IBM DB2 Audit
l More options...
Additionally, you can define your own source type, based on the needs of your enterprise. See "Source Types" on page 375.
A receiver can only receive events of a single source type. Set up separate receivers for each type of log file.
Character encoding
Select a character encoding, such as US-ASCII, Big5, or EUC-KR, from the pulldown list.
Note: Configure CEF UDP, CEF TCP, and SmartMessage receivers using only ASCII or UTF-8 encoding. Otherwise, non-CEF events sent to those receivers will be dropped.
Delay after seen
Enter the number of seconds to wait after a source file is first seen until it is processed. This allows the entire file to be copied to Logger or (in the case of File Receiver) copied to the remote file system, before processing begins.
The default is 10 seconds.
For File Transfer Receivers, this parameter should be set to a larger value if large files are expected. The default, 10 seconds, does not allow enough time for a large file, such as 1 GB.
Event Time Locale
Select a locale from the pulldown list, such as English (United States), Chinese (Hong Kong), Chinese (Taiwan), and so on.
Administrator's GuideChapter 5: Configuration
File Transfer Receiver Parameters Page 372 of 743
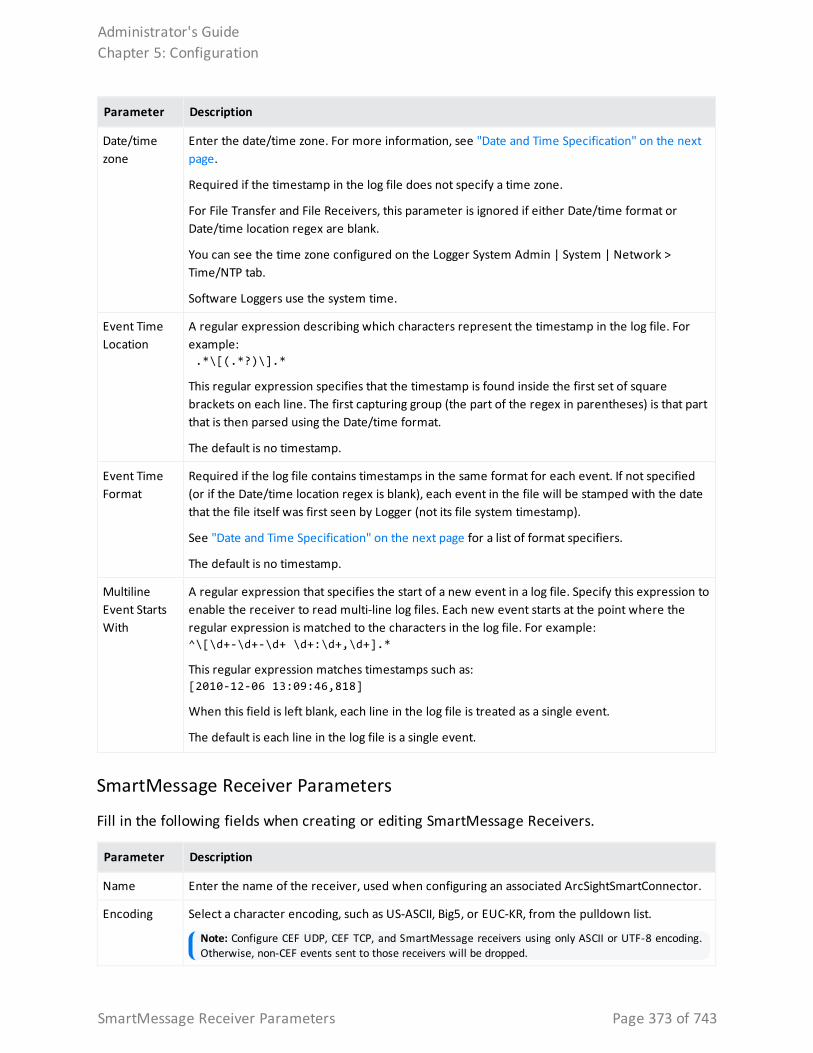
Parameter Description
Date/time zone
Enter the date/time zone. For more information, see "Date and Time Specification" on the next page.
Required if the timestamp in the log file does not specify a time zone.
For File Transfer and File Receivers, this parameter is ignored if either Date/time format or Date/time location regex are blank.
You can see the time zone configured on the Logger System Admin | System | Network > Time/NTP tab.
Software Loggers use the system time.
Event Time Location
A regular expression describing which characters represent the timestamp in the log file. For example: .*\[(.*?)\].*
This regular expression specifies that the timestamp is found inside the first set of square brackets on each line. The first capturing group (the part of the regex in parentheses) is that part that is then parsed using the Date/time format.
The default is no timestamp.
Event Time Format
Required if the log file contains timestamps in the same format for each event. If not specified (or if the Date/time location regex is blank), each event in the file will be stamped with the date that the file itself was first seen by Logger (not its file system timestamp).
See "Date and Time Specification" on the next page for a list of format specifiers.
The default is no timestamp.
Multiline Event Starts With
A regular expression that specifies the start of a new event in a log file. Specify this expression to enable the receiver to read multi-line log files. Each new event starts at the point where the regular expression is matched to the characters in the log file. For example: ^\[\d+-\d+-\d+ \d+:\d+,\d+].*
This regular expression matches timestamps such as: [2010-12-06 13:09:46,818]
When this field is left blank, each line in the log file is treated as a single event.
The default is each line in the log file is a single event.
SmartMessage Receiver Parameters
Fill in the following fields when creating or editing SmartMessage Receivers.
Parameter Description
Name Enter the name of the receiver, used when configuring an associated ArcSightSmartConnector.
Encoding Select a character encoding, such as US-ASCII, Big5, or EUC-KR, from the pulldown list.
Note: Configure CEF UDP, CEF TCP, and SmartMessage receivers using only ASCII or UTF-8 encoding. Otherwise, non-CEF events sent to those receivers will be dropped.
Administrator's GuideChapter 5: Configuration
SmartMessage Receiver Parameters Page 373 of 743
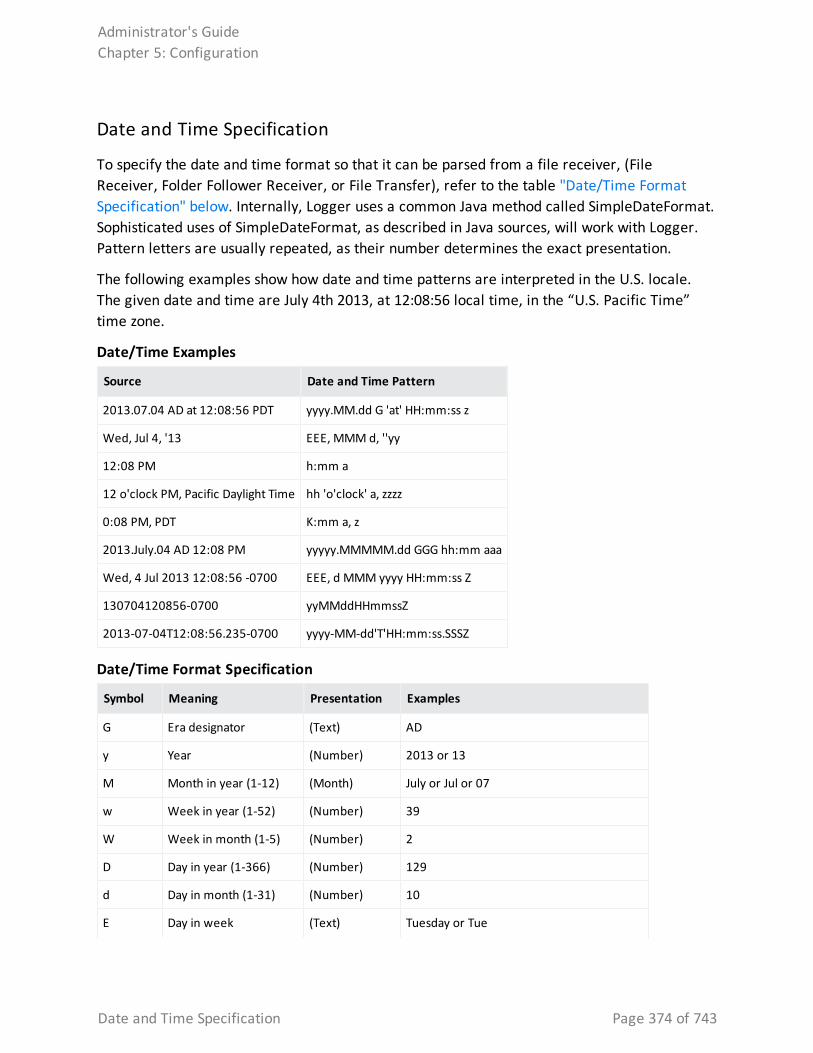
Date and Time Specification
To specify the date and time format so that it can be parsed from a file receiver, (File Receiver, Folder Follower Receiver, or File Transfer), refer to the table "Date/Time Format Specification" below. Internally, Logger uses a common Java method called SimpleDateFormat. Sophisticated uses of SimpleDateFormat, as described in Java sources, will work with Logger. Pattern letters are usually repeated, as their number determines the exact presentation.
The following examples show how date and time patterns are interpreted in the U.S. locale. The given date and time are July 4th 2013, at 12:08:56 local time, in the “U.S. Pacific Time” time zone.
Source Date and Time Pattern
2013.07.04 AD at 12:08:56 PDT yyyy.MM.dd G 'at' HH:mm:ss z
Wed, Jul 4, '13 EEE, MMM d, ''yy
12:08 PM h:mm a
12 o'clock PM, Pacific Daylight Time hh 'o'clock' a, zzzz
0:08 PM, PDT K:mm a, z
2013.July.04 AD 12:08 PM yyyyy.MMMMM.dd GGG hh:mm aaa
Wed, 4 Jul 2013 12:08:56 -0700 EEE, d MMM yyyy HH:mm:ss Z
130704120856-0700 yyMMddHHmmssZ
2013-07-04T12:08:56.235-0700 yyyy-MM-dd'T'HH:mm:ss.SSSZ
Date/Time Examples
Symbol Meaning Presentation Examples
G Era designator (Text) AD
y Year (Number) 2013 or 13
M Month in year (1-12) (Month) July or Jul or 07
w Week in year (1-52) (Number) 39
W Week in month (1-5) (Number) 2
D Day in year (1-366) (Number) 129
d Day in month (1-31) (Number) 10
E Day in week (Text) Tuesday or Tue
Date/Time Format Specification
Administrator's GuideChapter 5: Configuration
Date and Time Specification Page 374 of 743
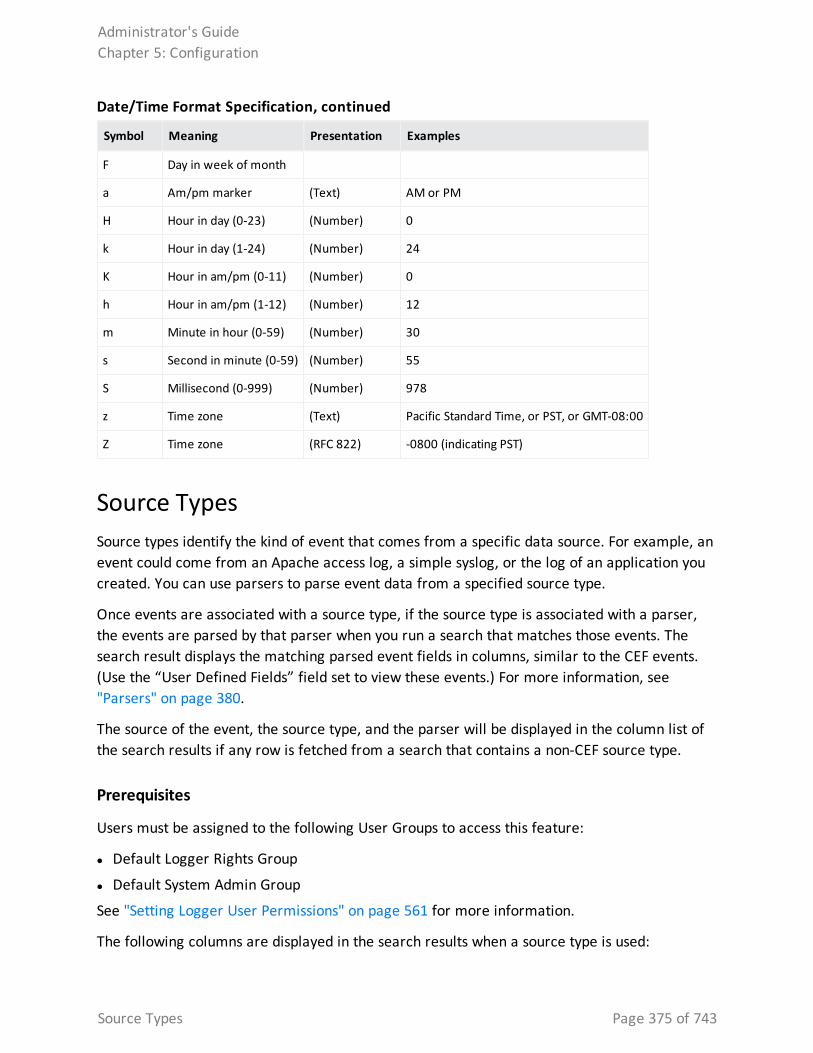
Symbol Meaning Presentation Examples
F Day in week of month
a Am/pm marker (Text) AM or PM
H Hour in day (0-23) (Number) 0
k Hour in day (1-24) (Number) 24
K Hour in am/pm (0-11) (Number) 0
h Hour in am/pm (1-12) (Number) 12
m Minute in hour (0-59) (Number) 30
s Second in minute (0-59) (Number) 55
S Millisecond (0-999) (Number) 978
z Time zone (Text) Pacific Standard Time, or PST, or GMT-08:00
Z Time zone (RFC 822) -0800 (indicating PST)
Date/Time Format Specification, continued
Source TypesSource types identify the kind of event that comes from a specific data source. For example, an event could come from an Apache access log, a simple syslog, or the log of an application you created. You can use parsers to parse event data from a specified source type.
Once events are associated with a source type, if the source type is associated with a parser, the events are parsed by that parser when you run a search that matches those events. The search result displays the matching parsed event fields in columns, similar to the CEF events. (Use the “User Defined Fields” field set to view these events.) For more information, see "Parsers" on page 380.
The source of the event, the source type, and the parser will be displayed in the column list of the search results if any row is fetched from a search that contains a non-CEF source type.
Prerequisites
Users must be assigned to the following User Groups to access this feature:
l Default Logger Rights Group
l Default System Admin Group
See "Setting Logger User Permissions" on page 561 for more information.
The following columns are displayed in the search results when a source type is used:
Administrator's GuideChapter 5: Configuration
Source Types Page 375 of 743
l Source: The name of the log file from which the event was received.
For example, /opt/mnt/testsoft/web_server.out.log. If no source was applied when the event was received, this field is blank. You can control whether this field is displayed from the Search Options page. See "Global Search Options" on page 333 for how to set this option.
l Source Type: The type of file from which the event was received, as defined on the Source Type page (Configuration > Data > Source Types). If no source type was applied when the event was received, this field is blank. You can control whether this field is displayed from the Search Options page. See "Global Search Options" on page 333 for how to set this option.
l Parser: If the event was parsed, this field contains the name of the parser. If the event was not parsed successfully, this field contains “Not parsed.” If no parser is defined for the source type or if there is no source type, the field is blank.
Working with Source TypesLogger provides a number of source types with pre-configured parsers. Additionally, you can define new source types and assign parsers to them. This lets you choose the set of fields you want to extract for a given kind of event. Only one parser can be associated with a source type, however, multiple source types can be associated with a parser. Out-of-box source types cannot be edited or deleted, but you can copy them to make similar source types to meet your needs. You can edit or delete custom source types, as desired. The source types available on your Logger may vary from the image below.
Administrator's GuideChapter 5: Configuration
Working with Source Types Page 376 of 743
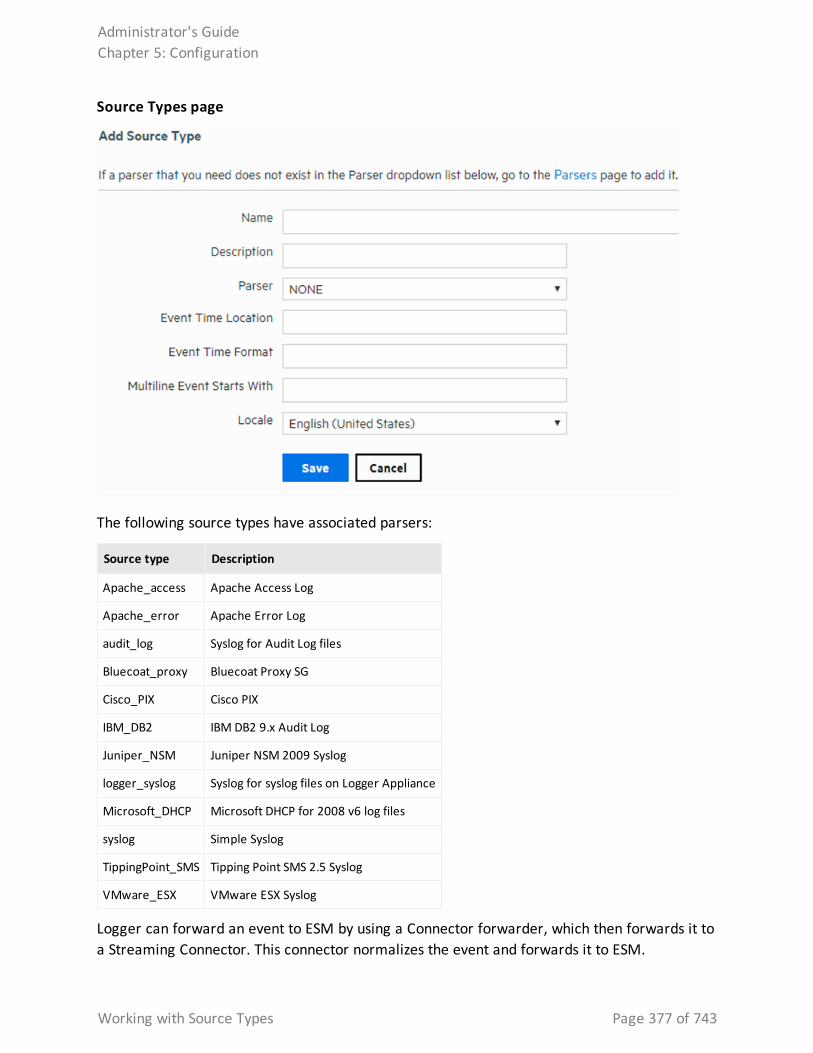
Source Types page
The following source types have associated parsers:
Source type Description
Apache_access Apache Access Log
Apache_error Apache Error Log
audit_log Syslog for Audit Log files
Bluecoat_proxy Bluecoat Proxy SG
Cisco_PIX Cisco PIX
IBM_DB2 IBM DB2 9.x Audit Log
Juniper_NSM Juniper NSM 2009 Syslog
logger_syslog Syslog for syslog files on Logger Appliance
Microsoft_DHCP Microsoft DHCP for 2008 v6 log files
syslog Simple Syslog
TippingPoint_SMS Tipping Point SMS 2.5 Syslog
VMware_ESX VMware ESX Syslog
Logger can forward an event to ESM by using a Connector forwarder, which then forwards it to a Streaming Connector. This connector normalizes the event and forwards it to ESM.
Administrator's GuideChapter 5: Configuration
Working with Source Types Page 377 of 743
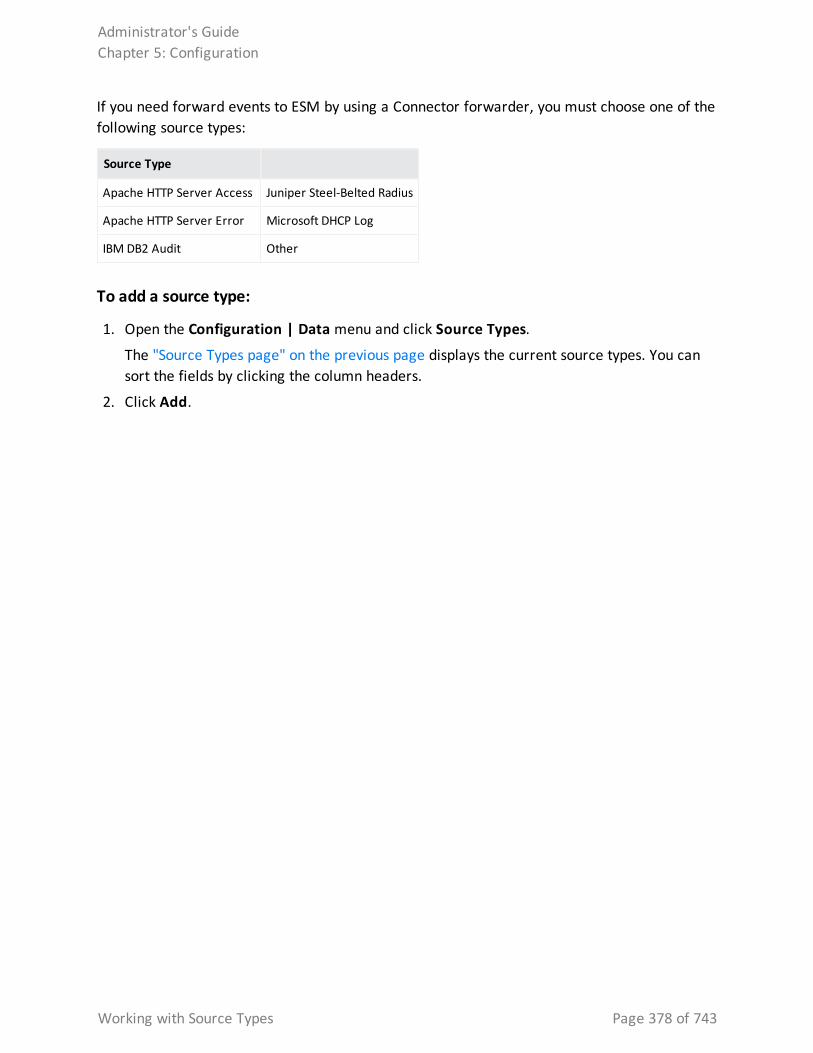
If you need forward events to ESM by using a Connector forwarder, you must choose one of the following source types:
Source Type
Apache HTTP Server Access Juniper Steel-Belted Radius
Apache HTTP Server Error Microsoft DHCP Log
IBM DB2 Audit Other
To add a source type:
1. Open the Configuration | Data menu and click Source Types.
The "Source Types page" on the previous page displays the current source types. You can sort the fields by clicking the column headers.
2. Click Add.
Administrator's GuideChapter 5: Configuration
Working with Source Types Page 378 of 743
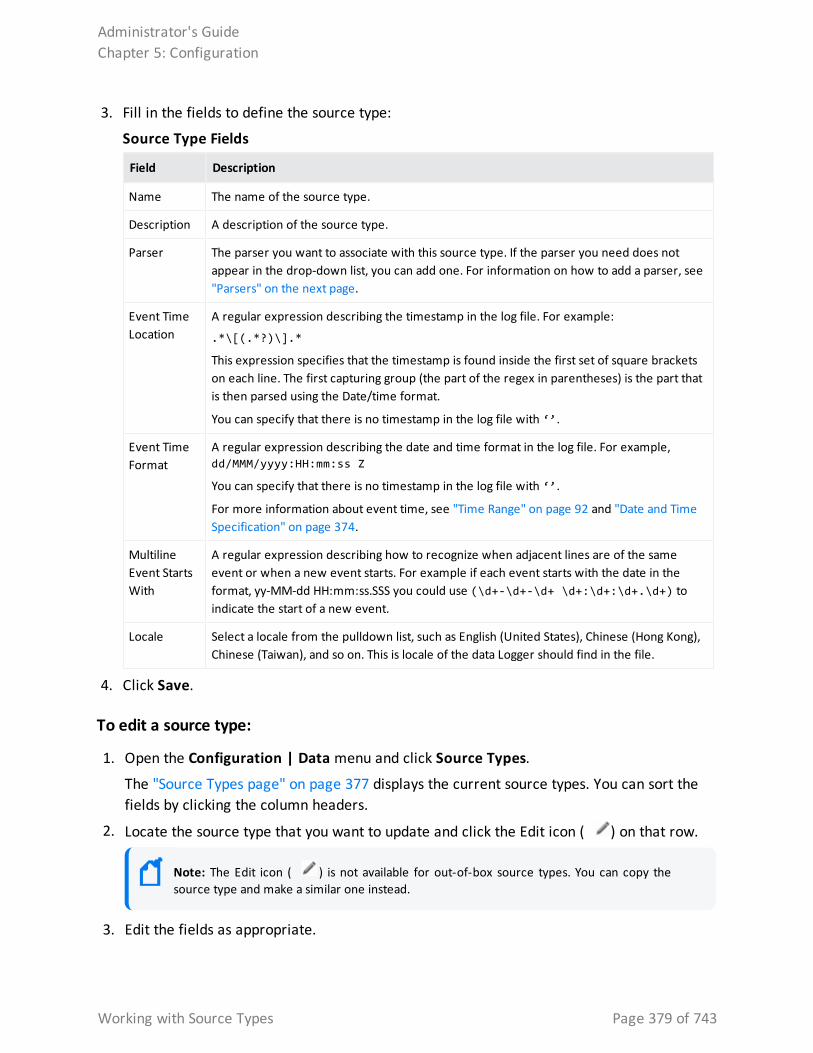
3. Fill in the fields to define the source type:
Field Description
Name The name of the source type.
Description A description of the source type.
Parser The parser you want to associate with this source type. If the parser you need does not appear in the drop-down list, you can add one. For information on how to add a parser, see "Parsers" on the next page.
Event Time Location
A regular expression describing the timestamp in the log file. For example:
.*\[(.*?)\].*
This expression specifies that the timestamp is found inside the first set of square brackets on each line. The first capturing group (the part of the regex in parentheses) is the part that is then parsed using the Date/time format.
You can specify that there is no timestamp in the log file with ‘’.
Event Time Format
A regular expression describing the date and time format in the log file. For example, dd/MMM/yyyy:HH:mm:ss Z
You can specify that there is no timestamp in the log file with ‘’.
For more information about event time, see "Time Range" on page 92 and "Date and Time Specification" on page 374.
Multiline Event Starts With
A regular expression describing how to recognize when adjacent lines are of the same event or when a new event starts. For example if each event starts with the date in the format, yy-MM-dd HH:mm:ss.SSS you could use (\d+-\d+-\d+ \d+:\d+:\d+.\d+) to indicate the start of a new event.
Locale Select a locale from the pulldown list, such as English (United States), Chinese (Hong Kong), Chinese (Taiwan), and so on. This is locale of the data Logger should find in the file.
Source Type Fields
4. Click Save.
To edit a source type:
1. Open the Configuration | Data menu and click Source Types.
The "Source Types page" on page 377 displays the current source types. You can sort the fields by clicking the column headers.
2. Locate the source type that you want to update and click the Edit icon ( ) on that row.
Note: The Edit icon ( ) is not available for out-of-box source types. You can copy the source type and make a similar one instead.
3. Edit the fields as appropriate.
Administrator's GuideChapter 5: Configuration
Working with Source Types Page 379 of 743
See the table "Source Type Fields" on the previous page for field details.
4. Click Save.
5. Disable and then re-enable any receivers that use this source type.
Note: Changes in source type are not reflected in the associated receivers until you have re-enabled them.
To copy a source type:
1. Open the Configuration | Data menu and click Source Types.
The "Source Types page" on page 377 displays the current source types. You can sort the fields by clicking the column headers.
2. Locate the source type that you want to copy and click the Copy icon ( ) on that row.
3. Enter a name for the new source type and edit the fields as appropriate.
See the table "Source Type Fields" on the previous page for field details.
4. Click Save.
To delete a source type:
1. Open the Configuration | Data menu and click Source Types.
The "Source Types page" on page 377 displays the current source types. You can sort the fields by clicking the column headers.
2. Locate the source type that you want to delete and click the Remove icon ( ) on that row.
Note: The Remove icon ( ) is not available for out-of-box source types. You can only remove source types that you added.
3. Click OK to confirm the removal.
ParsersParsers enable you to extract and manipulate raw events (non-CEF data) from different sources in your network environment. Once you have parsed event fields, you can easily search for data, chart it, and perform other operations on it. One user with in-depth knowledge of the events can create the parser, and then all users who look at those events will get the benefit of that work.
Parsers provide you with a simple way to read events. Instead of looking at raw event data and trying to figure out what it means, you can use a parser to extract portions of non-CEF events
Administrator's GuideChapter 5: Configuration
Parsers Page 380 of 743
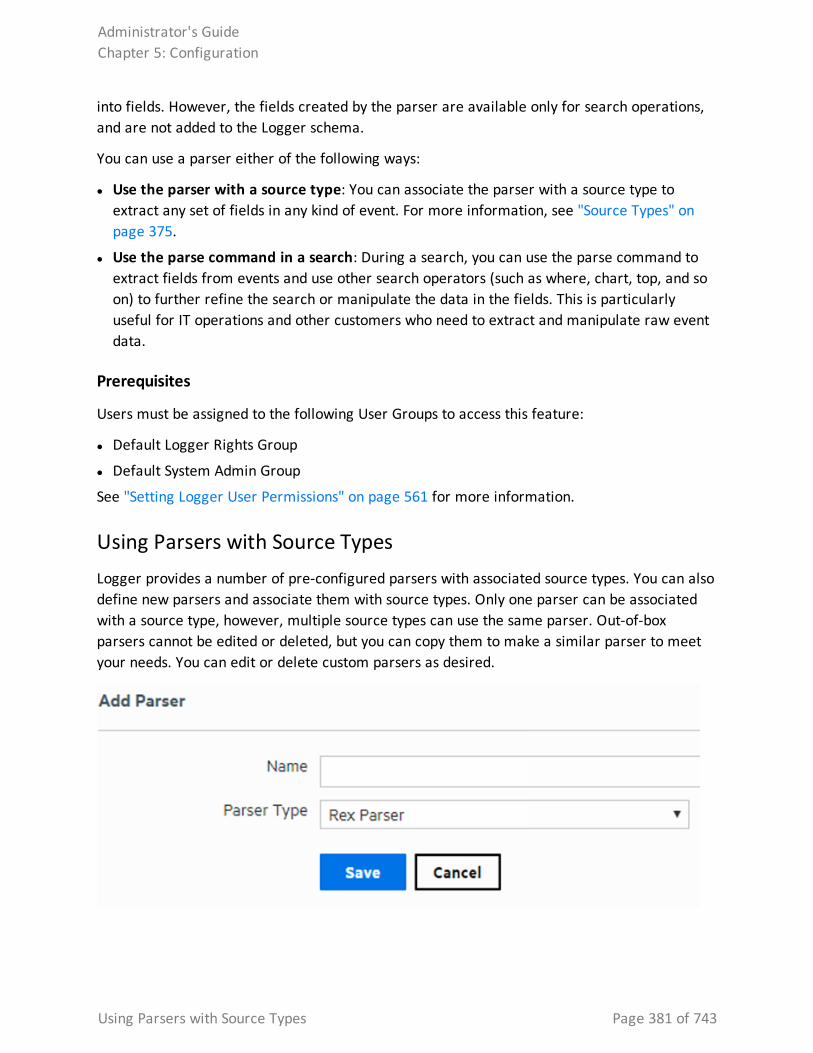
into fields. However, the fields created by the parser are available only for search operations, and are not added to the Logger schema.
You can use a parser either of the following ways:
l Use the parser with a source type: You can associate the parser with a source type to extract any set of fields in any kind of event. For more information, see "Source Types" on page 375.
l Use the parse command in a search: During a search, you can use the parse command to extract fields from events and use other search operators (such as where, chart, top, and so on) to further refine the search or manipulate the data in the fields. This is particularly useful for IT operations and other customers who need to extract and manipulate raw event data.
Prerequisites
Users must be assigned to the following User Groups to access this feature:
l Default Logger Rights Group
l Default System Admin Group
See "Setting Logger User Permissions" on page 561 for more information.
Using Parsers with Source TypesLogger provides a number of pre-configured parsers with associated source types. You can also define new parsers and associate them with source types. Only one parser can be associated with a source type, however, multiple source types can use the same parser. Out-of-box parsers cannot be edited or deleted, but you can copy them to make a similar parser to meet your needs. You can edit or delete custom parsers as desired.
Administrator's GuideChapter 5: Configuration
Using Parsers with Source Types Page 381 of 743
Using the Parse CommandThe parse command can be used to invoke a parser on any non-CEF events that are returned by a search. It applies the definition of the parser, such as the regular expression of a rex parser, to each event. Then it adds the fields that are extracted by that regular expression to the fields that are being passed through. For a REX parser, this is functionally the same as having a rex command with the same regular expression as the definition of the parser, so you can think of a REX parse command as invoking a saved rex expression.
For more information about the parse command, see "parse" on page 596. For information about searching in general, see "Searching and Analyzing Events" on page 74.
Working with ParsersYou can define two types of parsers—a REX parser or an Extract parser. Before adding the parser, you need to define the query you want to use for parsing events.
For a Rex parser, one way to do this is to use the rex search operator to test and adjust a regular expression until it returns the desired fields from the events that you want it to handle. Then copy the rex expression and paste it into the parser’s Definition field. For an Extract parser, use the extract operator. For more information about the search operators, see "parse" on page 596, "rex" on page 602, and "extract" on page 587.
The parser used in a search will be displayed in the Parser column of the search results. If the event was parsed, this field contains the name of the parser. If the event was not parsed successfully, this field contains “Not parsed.” If no parser is defined for the source type or if there is no source type, the field is blank.
Prerequisites
Users must be assigned to the following User Groups to access this feature:
l Default Logger Rights Group
l Default System Admin Group
See "Setting Logger User Permissions" on page 561 for more information.
To add a parser:
1. Open the Configuration | Data menu and click Parsers.
The Parsers page, shown in "Parsers" on page 380, displays the current parsers. You can sort the fields by clicking the column headers.
2. Click Add.
Administrator's GuideChapter 5: Configuration
Using the Parse Command Page 382 of 743
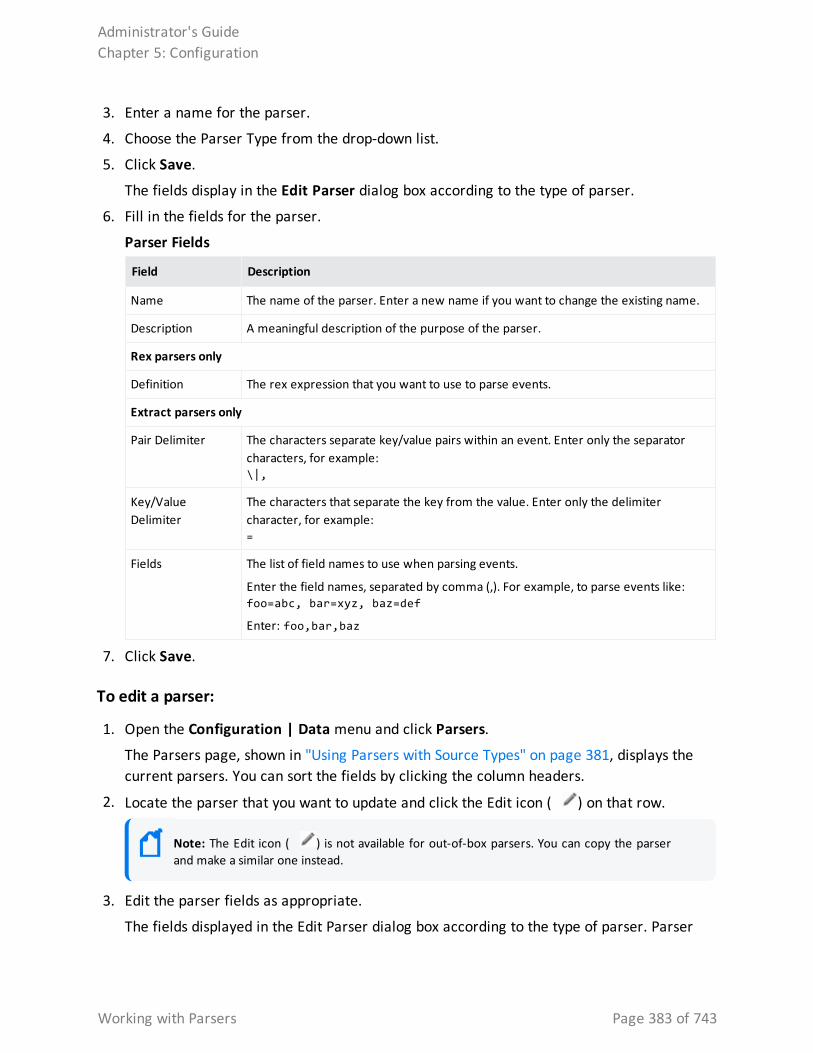
3. Enter a name for the parser.
4. Choose the Parser Type from the drop-down list.
5. Click Save.
The fields display in the Edit Parser dialog box according to the type of parser.
6. Fill in the fields for the parser.
Field Description
Name The name of the parser. Enter a new name if you want to change the existing name.
Description A meaningful description of the purpose of the parser.
Rex parsers only
Definition The rex expression that you want to use to parse events.
Extract parsers only
Pair Delimiter The characters separate key/value pairs within an event. Enter only the separator characters, for example:\|,
Key/Value Delimiter
The characters that separate the key from the value. Enter only the delimiter character, for example: =
Fields The list of field names to use when parsing events.
Enter the field names, separated by comma (,). For example, to parse events like: foo=abc, bar=xyz, baz=def
Enter: foo,bar,baz
Parser Fields
7. Click Save.
To edit a parser:
1. Open the Configuration | Data menu and click Parsers.
The Parsers page, shown in "Using Parsers with Source Types" on page 381, displays the current parsers. You can sort the fields by clicking the column headers.
2. Locate the parser that you want to update and click the Edit icon ( ) on that row.
Note: The Edit icon ( ) is not available for out-of-box parsers. You can copy the parser and make a similar one instead.
3. Edit the parser fields as appropriate.
The fields displayed in the Edit Parser dialog box according to the type of parser. Parser
Administrator's GuideChapter 5: Configuration
Working with Parsers Page 383 of 743
fields are documented in the table "Parser Fields" on the previous page.
4. Click Save.
To copy a parser:
1. Open the Configuration | Data menu and click Parsers.
The Parsers page, shown in "Using Parsers with Source Types" on page 381, displays the current parsers. You can sort the fields by clicking the column headers.
2. Locate the parser that you want to copy and click the Copy icon ( ) on that row.
The fields displayed in the Edit Parser dialog box according to the type of parser.
3. Enter a name for the new parser and edit the fields as appropriate.
Parser fields are documented in the table "Parser Fields" on the previous page, above.
4. Click Save.
To delete a parser:
1. Open the Configuration | Data menu and click Parsers.
The Parsers page, shown in "Using Parsers with Source Types" on page 381, displays the current parsers. You can sort the fields by clicking the column headers.
2. Locate the parser that you want to delete and click the Remove icon ( ) on that row.
Note: The Remove icon ( ) not available for out-of-box parsers. You can only remove parsers that you added.
3. Click OK to confirm the removal.
Tip: Be cautious when deleting a parser. Logger doesn't warn you when you modify or delete a parser that is associated with a Source Type.
Example: Creating an Extract ParserSuppose you want to create a parser to find the contents of the INT, MAC, DST, and SRC fields of a log like the one below.
Jul 12 14:30:31 n15-214-128-h92 kernel: IN=eth2 MAC=00:24:e8:60:cb:82:00:50:56:92:2a:d5:08:00 SRC=192.0.2.9 | DST=192.0.2.2 LEN=52 TOS=0x00 PREC=0x00 TTL=128 ID=21408 DF PROTO=TCP SPT=56978 DPT=443 WINDOW=8192 RES=0x00 SYN URGP=0Jul 12 14:30:31 n15-214-128-h92 kernel: IN=eth2 | MAC=00:24:e8:60:cb:82:00:50:56:92:2a:d5:08:00 | SRC=192.0.2.9 | DST=192.0.2.2 LEN=52 TOS=0x00 PREC=0x00 TTL=128 ID=21408 DF PROTO=TCP SPT=56978 DPT=443
Administrator's GuideChapter 5: Configuration
Example: Creating an Extract Parser Page 384 of 743
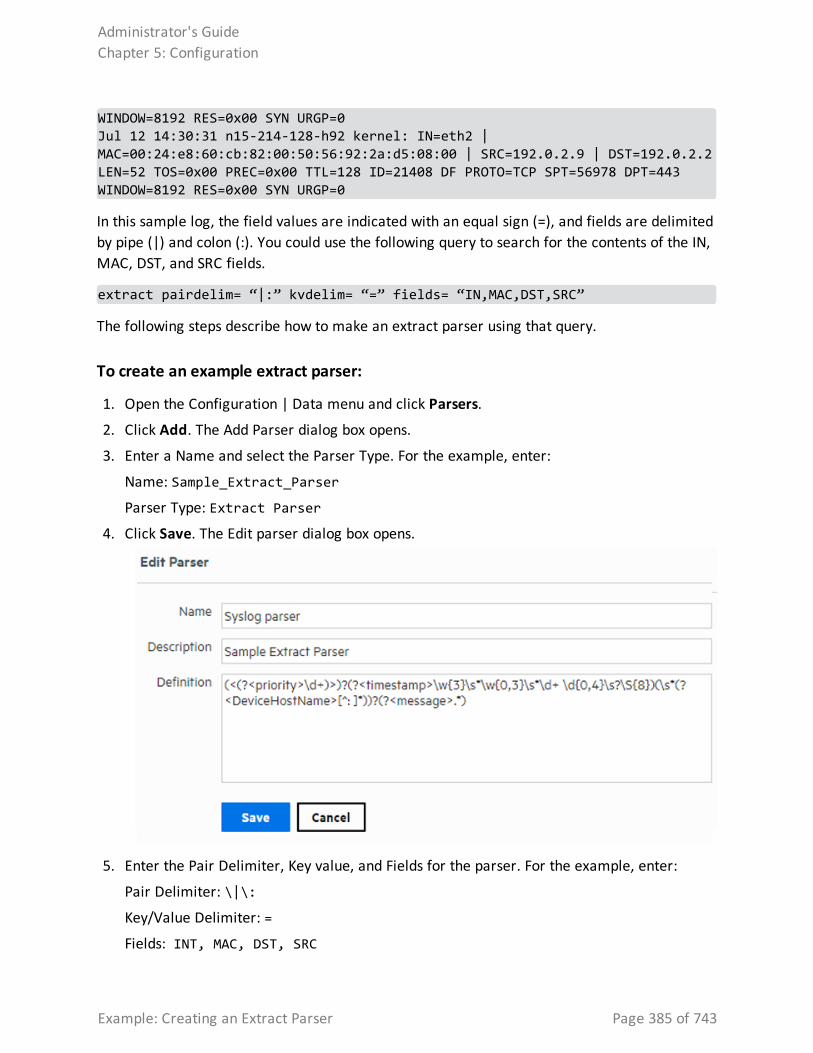
WINDOW=8192 RES=0x00 SYN URGP=0Jul 12 14:30:31 n15-214-128-h92 kernel: IN=eth2 | MAC=00:24:e8:60:cb:82:00:50:56:92:2a:d5:08:00 | SRC=192.0.2.9 | DST=192.0.2.2 LEN=52 TOS=0x00 PREC=0x00 TTL=128 ID=21408 DF PROTO=TCP SPT=56978 DPT=443 WINDOW=8192 RES=0x00 SYN URGP=0
In this sample log, the field values are indicated with an equal sign (=), and fields are delimited by pipe (|) and colon (:). You could use the following query to search for the contents of the IN, MAC, DST, and SRC fields.
extract pairdelim= “|:” kvdelim= “=” fields= “IN,MAC,DST,SRC”
The following steps describe how to make an extract parser using that query.
To create an example extract parser:
1. Open the Configuration | Data menu and click Parsers.
2. Click Add. The Add Parser dialog box opens.
3. Enter a Name and select the Parser Type. For the example, enter:
Name: Sample_Extract_Parser
Parser Type: Extract Parser
4. Click Save. The Edit parser dialog box opens.
5. Enter the Pair Delimiter, Key value, and Fields for the parser. For the example, enter:
Pair Delimiter: \|\:
Key/Value Delimiter: =
Fields: INT, MAC, DST, SRC
Administrator's GuideChapter 5: Configuration
Example: Creating an Extract Parser Page 385 of 743
Note: You need to escape the pipe (|) and the colon (:) with a backslash (\).
6. Click Save. The Parsers page displays the new parser.
ForwardersForwarders send all events, or events that match a particular filter, on to a particular host or destination such as ArcSight Manager.
The ability to define a different filter for each forwarder allows Logger to divide traffic among several destinations. For example, because Logger can handle much higher event rates than ArcSight Manager, Logger might be used to forward events to a number of ArcSight Managers. Forwarder filters make it possible to split the flow between the Managers, using one forwarder for each Manager. Additionally, forwarding enables you to send a subset of events to other destinations for further processing while maintaining all events on Logger for long-term storage.
The forwarding filter is a query that searches for matching events, optionally within a time range. You can create two types of forwarder filters—continuous and time-range bound.
l A continuous filter constantly evaluates the incoming events and forwards the matching ones to the specified destination.
l A time-range bound filter uses a time range in addition to the specified condition to determine whether an event should be forwarded to the destination. If the event falls within the specified time range and matches the specified condition, it is forwarded; otherwise, it is not. The Logger receipt time of an event is used to determine whether an event will be forwarded to a destination when a forwarder filter specifies a time range by which events are evaluated for forwarding. Once a forwarder has forwarded all events within a time range, it does not forward any more events.
A forwarder only forwards events from the Logger that it is configured on; it cannot forward events from peers.
A forwarder’s operation can be paused and resumed at any point in time. When a forwarder resumes operation, forwarding resumes from the last checkpoint that was established before the forwarding operation was paused.
You can also disable and re-enable a forwarder. When you re-enable a forwarder, all previously established checkpoints are removed and forwarding starts over again as per the forwarder configuration-forwarders with continuous filters start from the current time, while forwarders with time-range bound filters start from beginning of the configured time range.
Forwarder types include UDP Forwarder, TCP Forwarder, Connector Forwarder, TH Forwarder, and ArcSight ESM Forwarder:
Administrator's GuideChapter 5: Configuration
Forwarders Page 386 of 743
l UDP Forwarder UDP forwarders forward events by using the User Datagram Protocol.
l TCP Forwarder: TCP forwarders forward events by using the Transmission Control Protocol.
l Connector Forwarder: Connector forwarders send events to the Logger Streaming Connector.
l TH Forwarder: Transformation Hub forwarders send Common Event Format (CEF) events to a TH destination.
l ArcSight ESM CEF Forwarders: ArcSight ESM CEF forwarders send Common Event Format (CEF) events to an ESM Destination. The built-in connector on Logger is used to forward these events to ESM.
Note: In order to create an ArcSight ESM forwarder, you must first create an ESM Destination. See "ESM Destinations" on page 406 for more information.
As a best practice, do not add more than ten regular expression forwarders. Even though each additional forwarder improves the forwarding rate, the relation is not proportional. In high EPS (events per second) situations or situations where other resource-intensive features are running in parallel (alerts, reports, and several search operations) and the forwarding filter is complex, adding too many forwarders may reduce performance because forwarders have to compete for the same Logger resources besides competing for the same built-in connector for forwarding.
You can specify a regular expression or an indexed search query (Unified Query) for the filter. Doing so enables you to take advantage of the indexing technology to quickly and efficiently search for events to forward.
Note: Unified query-based forwarders forward events once they have been indexed. Therefore, these forwarders can exhibit “bursty” behavior because indexing occurs in batches on Logger. You might notice the bursty behavior in the EPS out bar gauge (on top of the Logger interface screen)—the bar gauge will display high EPS level as a burst of data is forwarded and then drop back to normal level.
To create a forwarder:
1. Open the Configuration > Data menu and click Forwarders.
2. Click Add to display the following form.
3. Enter a name for the new forwarder. Provide a name that is unique and not likely to be duplicated elsewhere. For example, if you create an Alert called "MyTest" and a forwarder called "MyTest," you will get an error message asking for a unique name.
4. Choose the forwarder type appropriate for your needs: UDP Forwarder, TCP Forwarder, Connector Forwarder, TH (CEF) Forwarder, or ArcSight ESM (CEF) Forwarder type.
Administrator's GuideChapter 5: Configuration
Forwarders Page 387 of 743
5. Select the type of forwarding filter you want this forwarder to use—Unified or Regular Expression. Select “Unified” if you want to specify an indexed search query or “Regular Expression” to specify a regular expression query.
6. Click Next.
7. Enter additional type-specific information as described in the following table.
Administrator's GuideChapter 5: Configuration
Forwarders Page 388 of 743
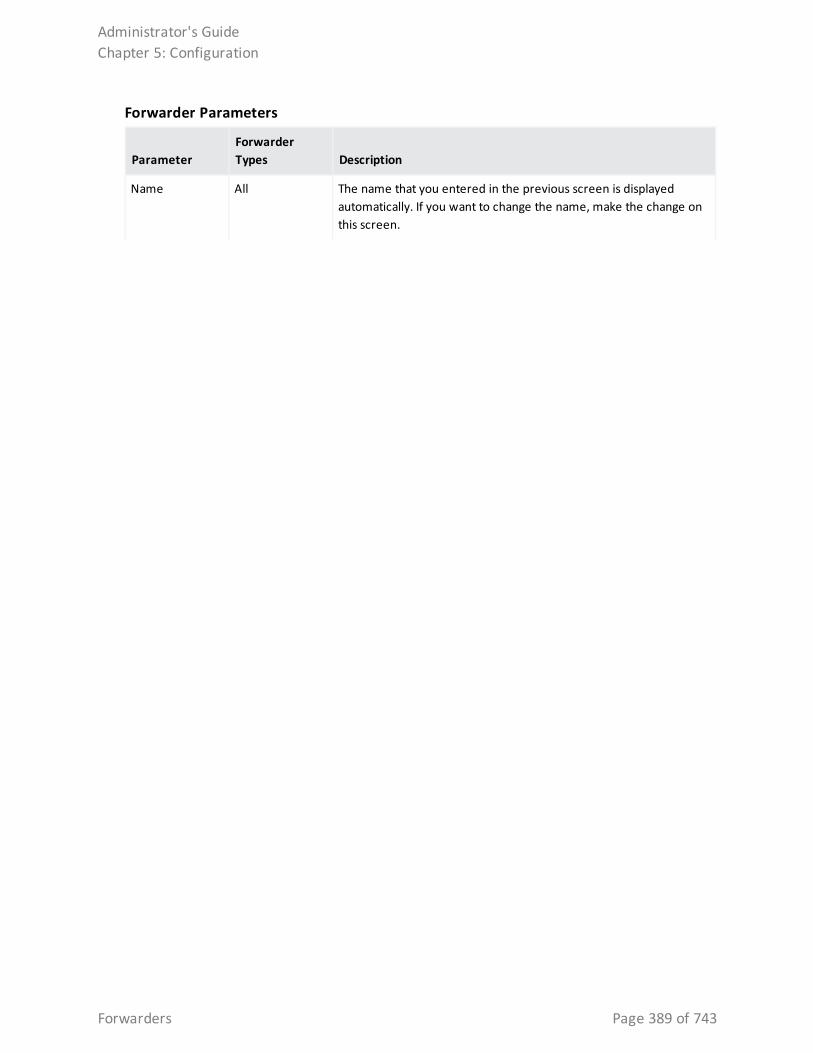
ParameterForwarder Types Description
Name All The name that you entered in the previous screen is displayed automatically. If you want to change the name, make the change on this screen.
Forwarder Parameters
Administrator's GuideChapter 5: Configuration
Forwarders Page 389 of 743
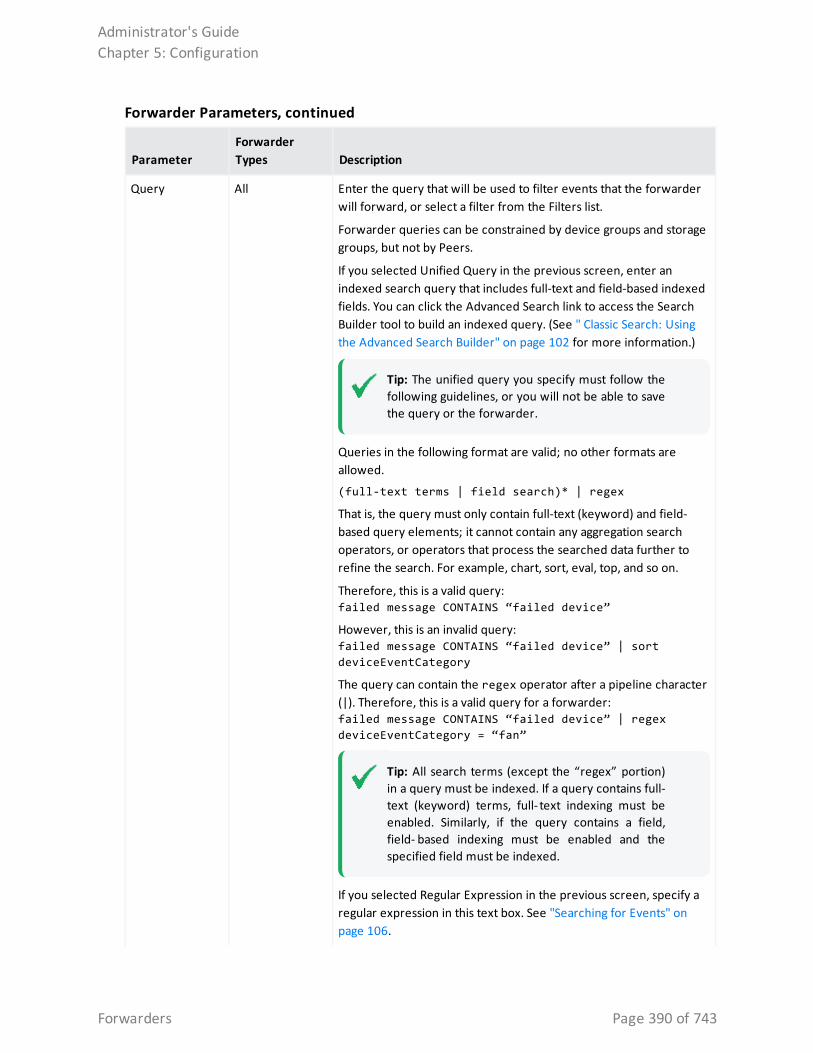
ParameterForwarder Types Description
Query All Enter the query that will be used to filter events that the forwarder will forward, or select a filter from the Filters list.
Forwarder queries can be constrained by device groups and storage groups, but not by Peers.
If you selected Unified Query in the previous screen, enter an indexed search query that includes full-text and field-based indexed fields. You can click the Advanced Search link to access the Search Builder tool to build an indexed query. (See " Classic Search: Using the Advanced Search Builder" on page 102 for more information.)
Tip: The unified query you specify must follow the following guidelines, or you will not be able to save the query or the forwarder.
Queries in the following format are valid; no other formats are allowed.
(full-text terms | field search)* | regex
That is, the query must only contain full-text (keyword) and field-based query elements; it cannot contain any aggregation search operators, or operators that process the searched data further to refine the search. For example, chart, sort, eval, top, and so on.
Therefore, this is a valid query: failed message CONTAINS “failed device”
However, this is an invalid query: failed message CONTAINS “failed device” | sort deviceEventCategory
The query can contain the regex operator after a pipeline character (|). Therefore, this is a valid query for a forwarder: failed message CONTAINS “failed device” | regex deviceEventCategory = “fan”
Tip: All search terms (except the “regex” portion) in a query must be indexed. If a query contains full-text (keyword) terms, full- text indexing must be enabled. Similarly, if the query contains a field, field- based indexing must be enabled and the specified field must be indexed.
If you selected Regular Expression in the previous screen, specify a regular expression in this text box. See "Searching for Events" on page 106.
Forwarder Parameters, continued
Administrator's GuideChapter 5: Configuration
Forwarders Page 390 of 743
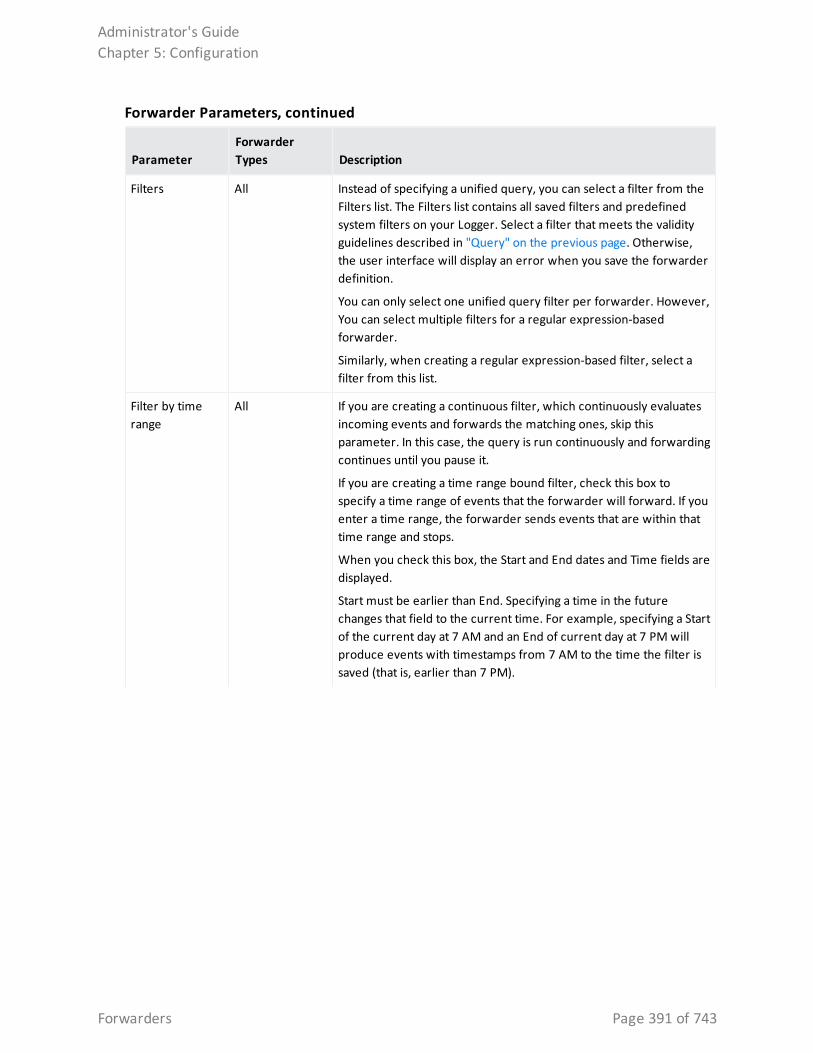
ParameterForwarder Types Description
Filters All Instead of specifying a unified query, you can select a filter from the Filters list. The Filters list contains all saved filters and predefined system filters on your Logger. Select a filter that meets the validity guidelines described in "Query" on the previous page. Otherwise, the user interface will display an error when you save the forwarder definition.
You can only select one unified query filter per forwarder. However, You can select multiple filters for a regular expression-based forwarder.
Similarly, when creating a regular expression-based filter, select a filter from this list.
Filter by time range
All If you are creating a continuous filter, which continuously evaluates incoming events and forwards the matching ones, skip this parameter. In this case, the query is run continuously and forwarding continues until you pause it.
If you are creating a time range bound filter, check this box to specify a time range of events that the forwarder will forward. If you enter a time range, the forwarder sends events that are within that time range and stops.
When you check this box, the Start and End dates and Time fields are displayed.
Start must be earlier than End. Specifying a time in the future changes that field to the current time. For example, specifying a Start of the current day at 7 AM and an End of current day at 7 PM will produce events with timestamps from 7 AM to the time the filter is saved (that is, earlier than 7 PM).
Forwarder Parameters, continued
Administrator's GuideChapter 5: Configuration
Forwarders Page 391 of 743
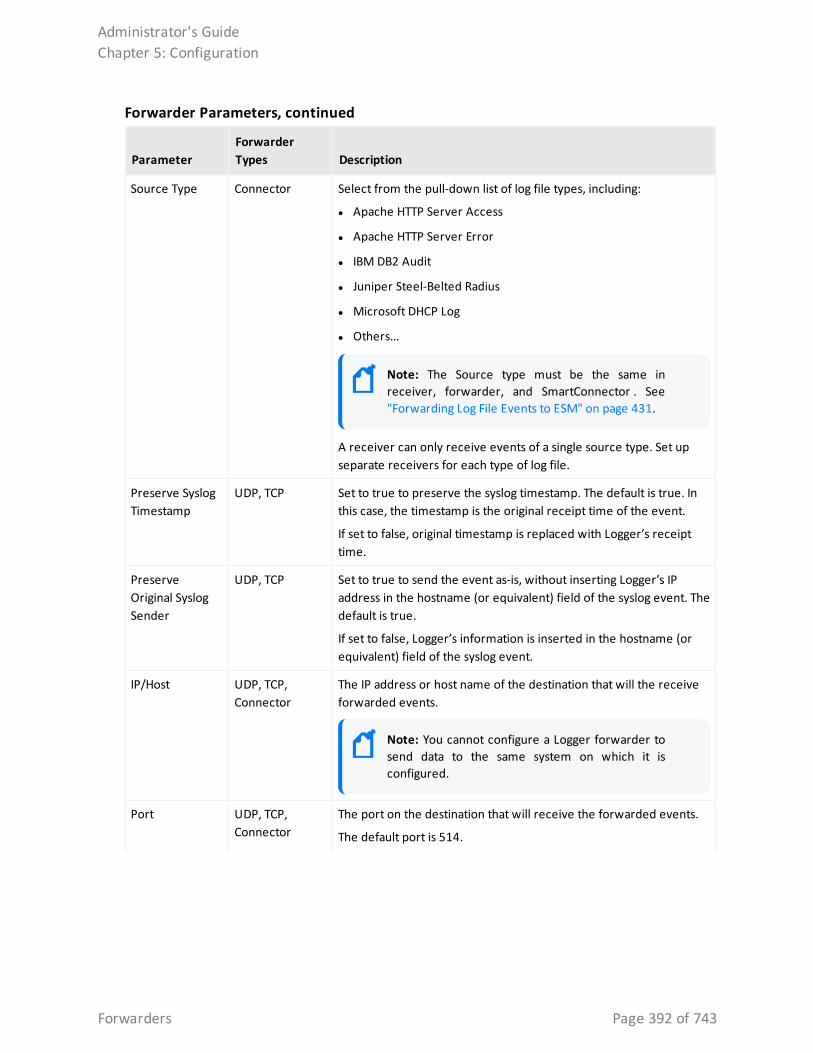
ParameterForwarder Types Description
Source Type Connector Select from the pull-down list of log file types, including:
l Apache HTTP Server Access
l Apache HTTP Server Error
l IBM DB2 Audit
l Juniper Steel-Belted Radius
l Microsoft DHCP Log
l Others...
Note: The Source type must be the same in receiver, forwarder, and SmartConnector . See "Forwarding Log File Events to ESM" on page 431.
A receiver can only receive events of a single source type. Set up separate receivers for each type of log file.
Preserve Syslog Timestamp
UDP, TCP Set to true to preserve the syslog timestamp. The default is true. In this case, the timestamp is the original receipt time of the event.
If set to false, original timestamp is replaced with Logger’s receipt time.
Preserve Original Syslog Sender
UDP, TCP Set to true to send the event as-is, without inserting Logger’s IP address in the hostname (or equivalent) field of the syslog event. The default is true.
If set to false, Logger’s information is inserted in the hostname (or equivalent) field of the syslog event.
IP/Host UDP, TCP, Connector
The IP address or host name of the destination that will the receive forwarded events.
Note: You cannot configure a Logger forwarder to send data to the same system on which it is configured.
Port UDP, TCP, Connector
The port on the destination that will receive the forwarded events.
The default port is 514.
Forwarder Parameters, continued
Administrator's GuideChapter 5: Configuration
Forwarders Page 392 of 743
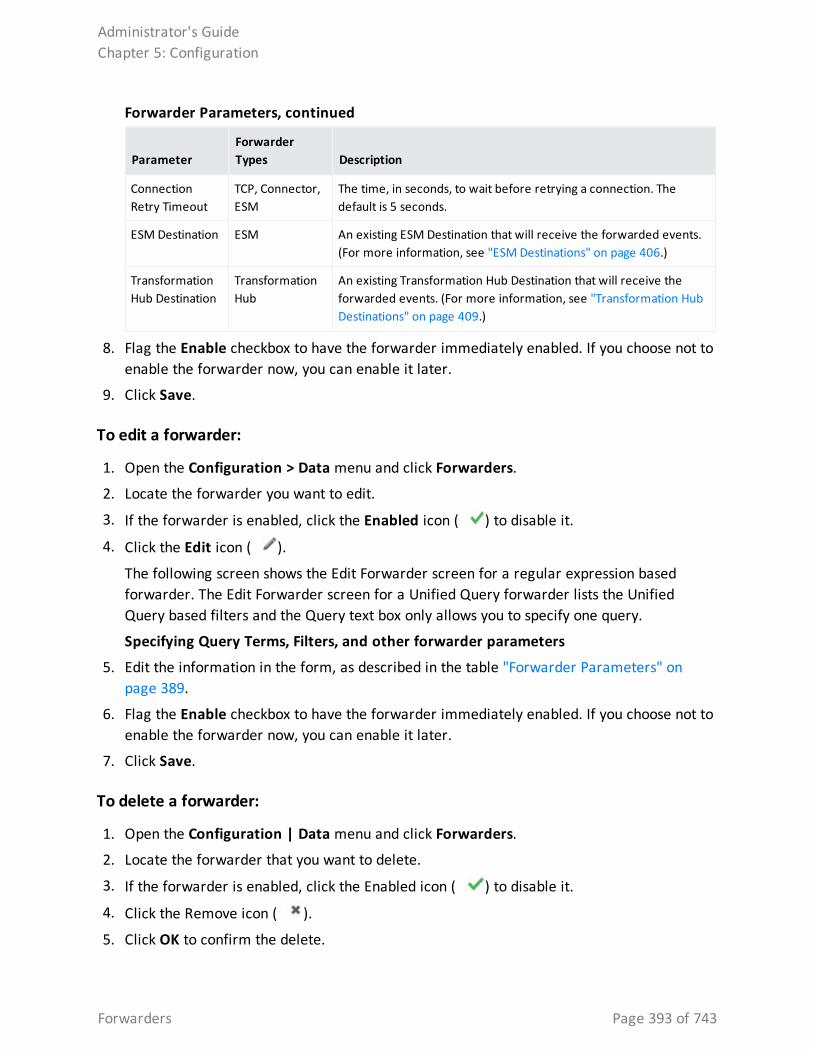
ParameterForwarder Types Description
Connection Retry Timeout
TCP, Connector, ESM
The time, in seconds, to wait before retrying a connection. The default is 5 seconds.
ESM Destination ESM An existing ESM Destination that will receive the forwarded events. (For more information, see "ESM Destinations" on page 406.)
Transformation Hub Destination
Transformation Hub
An existing Transformation Hub Destination that will receive the forwarded events. (For more information, see "Transformation Hub Destinations" on page 409.)
Forwarder Parameters, continued
8. Flag the Enable checkbox to have the forwarder immediately enabled. If you choose not to enable the forwarder now, you can enable it later.
9. Click Save.
To edit a forwarder:
1. Open the Configuration > Data menu and click Forwarders.
2. Locate the forwarder you want to edit.
3. If the forwarder is enabled, click the Enabled icon ( ) to disable it.
4. Click the Edit icon ( ).
The following screen shows the Edit Forwarder screen for a regular expression based forwarder. The Edit Forwarder screen for a Unified Query forwarder lists the Unified Query based filters and the Query text box only allows you to specify one query.
Specifying Query Terms, Filters, and other forwarder parameters
5. Edit the information in the form, as described in the table "Forwarder Parameters" on page 389.
6. Flag the Enable checkbox to have the forwarder immediately enabled. If you choose not to enable the forwarder now, you can enable it later.
7. Click Save.
To delete a forwarder:
1. Open the Configuration | Data menu and click Forwarders.
2. Locate the forwarder that you want to delete.
3. If the forwarder is enabled, click the Enabled icon ( ) to disable it.
4. Click the Remove icon ( ).
5. Click OK to confirm the delete.
Administrator's GuideChapter 5: Configuration
Forwarders Page 393 of 743
To pause a forwarder:
1. Open the Configuration | Data menu and click Forwarders.
2. Locate the forwarder that you want to pause.
3. Click the Running icon ( ) to pause the forwarder.
To resume a forwarder:
1. Open the Configuration | Data menu and click Forwarders.
2. Locate the forwarder whose operation you want to resume.
3. Click the Paused icon ( ) to resume forwarder operation.
To disable a forwarder:
1. Open the Configuration | Data menu and click Forwarders.
2. Click Event Output in the left panel.
3. Locate the forwarder that you want to disable.
4. Click the Enabled icon ( ) to disable it.
To enable or re-enable a forwarder:
Tip: Wait a few minutes to disable a forwarder that was just enabled. Likewise, wait before enabling a forwarder that has just been disabled. Background tasks initiated by enabling or disabling a forwarder can produce unexpected results if they are interrupted.
1. Open the Configuration | Data menu and click Forwarders.
2. Locate the forwarder that you want to enable or re-enable.
3. Click the Disabled icon ( ).
Real Time AlertsThis section describes Real Time Alerts. For information on Saved Search Alerts, see "Saved Search Alerts" on page 327. For a description of the types of alerts, see "Logger Alert Types" on page 399.
You can set up real time alerts that will be triggered by specified events or event patterns, and optionally, send notifications to previously configured destinations such as an email address or an SNMP server. Event patterns are specified events that occur above a particular frequency (a threshold number of events in a specified period). For example, you could create alert that is generated when five events from a specific device contain the word “unauthorized” within a
Administrator's GuideChapter 5: Configuration
Real Time Alerts Page 394 of 743
five-minute interval. Additionally, alerts can also be generated for internal events such as storage capacity warnings or, on some Logger Appliance models, CPU temperature warnings.
To create an Alert, you will need to specify a query or filter, event aggregation values (Match count and Threshold), and (optional) one or more notification destinations. If the new Alert will send notifications to an email, SNMP, ESM Destination, Transformation Hub Destination, or Syslog Destination, set up the destination before creating the Alert. See "Static Routes" on page 507, "Receiving Alert Notifications" on page 401, and "Setting Up Alert Notifications" on page 402 for more information.
Audit events for alerts are only written to the Internal Storage Group and not forwarded to ESM or Transformation Hub Destinations by default. If you need to forward these audit events to ESM, please contact customer support for assistance.
Note: This change only applies to audit events generated for alerts; other audit events are can be sent to Transformation Hub or ESM Destinations.
Logger comes with predefined filters with commonly needed event patterns that enables you to quickly create the alerts you need. You can also create new filters that to find specific event patterns of interest.
To see a list of the configured Real Time Alerts, go to Configuration > Data> Alerts. To add a real time alert, See "Creating Real Time Alerts" on the next page.
To enable or disable a Real Time Alert:
1. Open the Configuration > Data menu and click Alerts.
2. Locate the Alert that you want to disable or enable. Click the associated icon ( or ) to enable or disable the Alert.
Note: A maximum of 25 alerts can be enabled at one time. To enable an additional alert, you will need to disable a currently enabled alert.
If you have the maximum number of alerts enabled, and the receiver EPS is higher than 30k, you may see some slow-down in receiver EPS to prevent slower search times.
To edit a Real Time Alert:
1. Open the Configuration > Data menu and click Alerts.
2. Locate the Alert that you want to edit and click the Edit icon ( ) on that row.
A screen similar to the on in "Creating Real Time Alerts" on the next page is displayed. Only alphanumeric characters can be used in an Alert name.
Administrator's GuideChapter 5: Configuration
Real Time Alerts Page 395 of 743
To remove a Real Time Alert:
1. Open the Configuration > Data menu and click Alerts.
2. Locate the Alert that you want to remove and click the Remove icon ( ) on that row.
3. Confirm the deletion by clicking OK, or click Cancel to retain the Alert.
To view triggered alerts:
See "Viewing Alerts" on page 164.
Creating Real Time AlertsThis section describes how to create real time alerts. For information on Saved Search alerts, see "Creating Saved Search Alerts (Scheduled Alerts)" on page 328. For a description of the types of alerts, see "Logger Alert Types" on page 399.
To create a real time alert:
1. Go to the Configuration > Data > Realtime Alerts
2. Click Add. The Add Realtime Alert dialog box is displayed.
Administrator's GuideChapter 5: Configuration
Creating Real Time Alerts Page 396 of 743
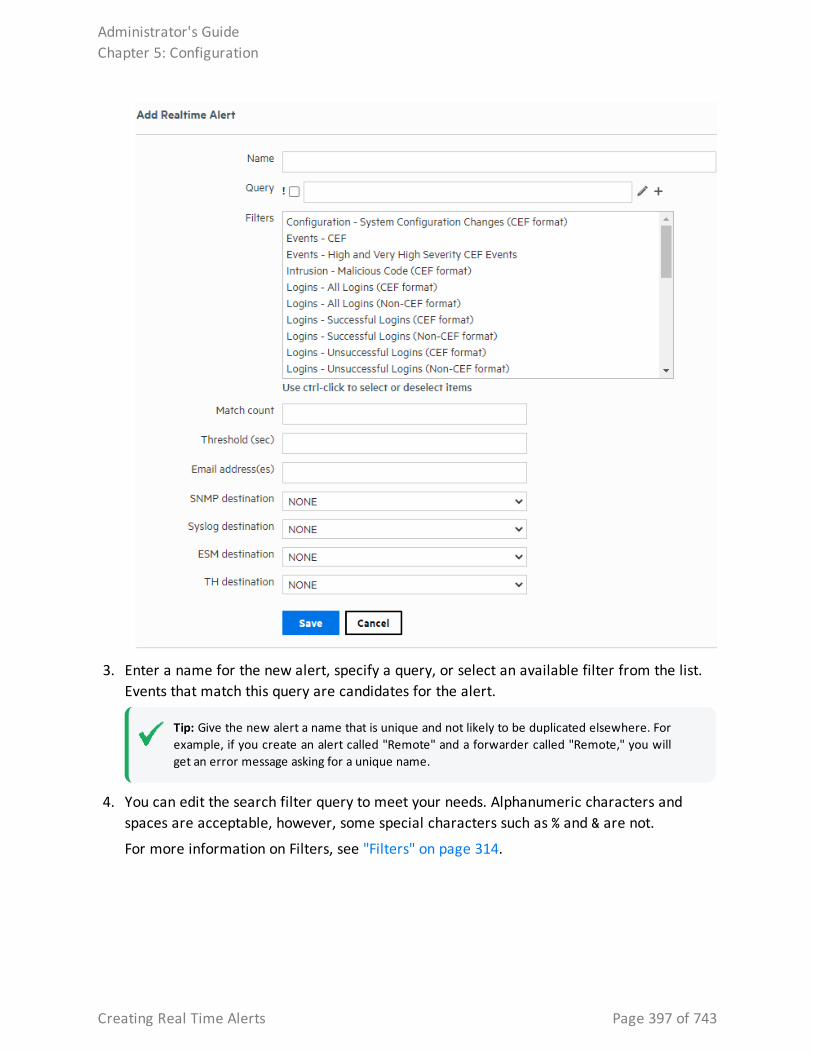
3. Enter a name for the new alert, specify a query, or select an available filter from the list. Events that match this query are candidates for the alert.
Tip: Give the new alert a name that is unique and not likely to be duplicated elsewhere. For example, if you create an alert called "Remote" and a forwarder called "Remote," you will get an error message asking for a unique name.
4. You can edit the search filter query to meet your needs. Alphanumeric characters and spaces are acceptable, however, some special characters such as % and & are not.
For more information on Filters, see "Filters" on page 314.
Administrator's GuideChapter 5: Configuration
Creating Real Time Alerts Page 397 of 743
Tip: To test the validity of an alert query, use the Search user interface. Enter the query in the Search text box in the following format:
Real time alert: |regex “regex expression”
Scheduled saved alert: _ deviceGroup IN [ “ 192.0.2.3 [TCPC] ” ] name=“*[4924TestAlert]*” AND (“192.0.*” OR categoryBehavior CONTAINS Stop)
If the query is valid, cut and paste the regular expression between the double quotes (“ ”) in the Query text box on the Add Alert page.
5. Enter Match count and Threshold values. If the number of candidate events equals or exceeds the Match count within the Threshold number of seconds, the alert will be triggered.
If you want to be notified when any event matches the filter (for example, for an internal event such as High CPU Temperature), enter a Match count of 1 and a Threshold of 1.
Note: To maintain an optimal size of an alert event, the event does not contain event IDs of all the triggering events if you specify Match count of 101 or higher . As a result, the baseEventCount field in the event does not reflect the true number of matching events for such alert events.
Triggering events are truncated in multiples of 100. Therefore, if you specify a Match count of 101, only one event is included in the alert event and the baseEventCount field value is 1. Similarly, if you specify a Match count of 720, only 20 events are included and the baseEventCount field value is 20.
6. Enter notification destinations. Enter any combination of:
l One or more e-mail addresses, separated by commas
l An SNMP Destination—for more information, see "SNMP Destinations" on page 403.
l A Syslog Destination—for more information, see "Syslog Destinations" on page 404.
l A TH Destination - for more information, see "Transformation Hub Destinations" on page 409.
l An ArcSight Manager—for more information, see "Sending Notifications to ESM Destinations" on page 429.
7. Click Save.
When you create an alert, it is in disabled state. Enable it using the instructions in "To enable or disable a Real Time Alert:" on page 395.
Administrator's GuideChapter 5: Configuration
Creating Real Time Alerts Page 398 of 743
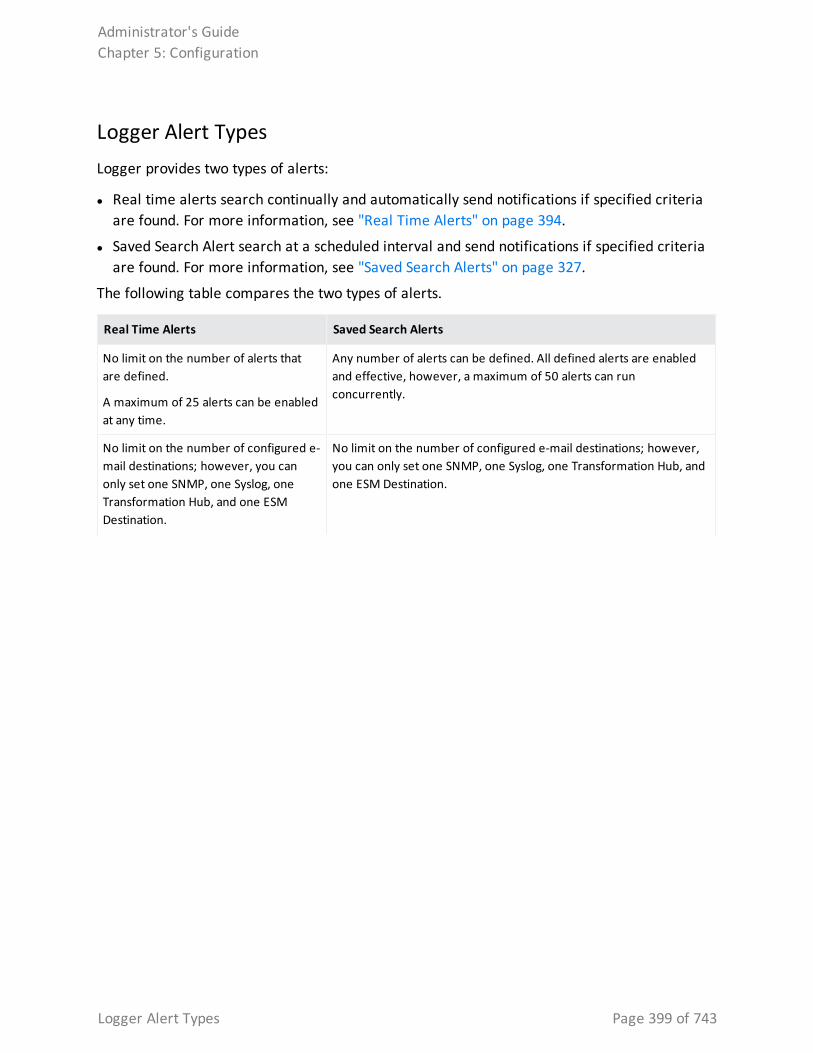
Logger Alert TypesLogger provides two types of alerts:
l Real time alerts search continually and automatically send notifications if specified criteria are found. For more information, see "Real Time Alerts" on page 394.
l Saved Search Alert search at a scheduled interval and send notifications if specified criteria are found. For more information, see "Saved Search Alerts" on page 327.
The following table compares the two types of alerts.
Real Time Alerts Saved Search Alerts
No limit on the number of alerts that are defined.
A maximum of 25 alerts can be enabled at any time.
Any number of alerts can be defined. All defined alerts are enabled and effective, however, a maximum of 50 alerts can run concurrently.
No limit on the number of configured e-mail destinations; however, you can only set one SNMP, one Syslog, one Transformation Hub, and one ESM Destination.
No limit on the number of configured e-mail destinations; however, you can only set one SNMP, one Syslog, one Transformation Hub, and one ESM Destination.
Administrator's GuideChapter 5: Configuration
Logger Alert Types Page 399 of 743
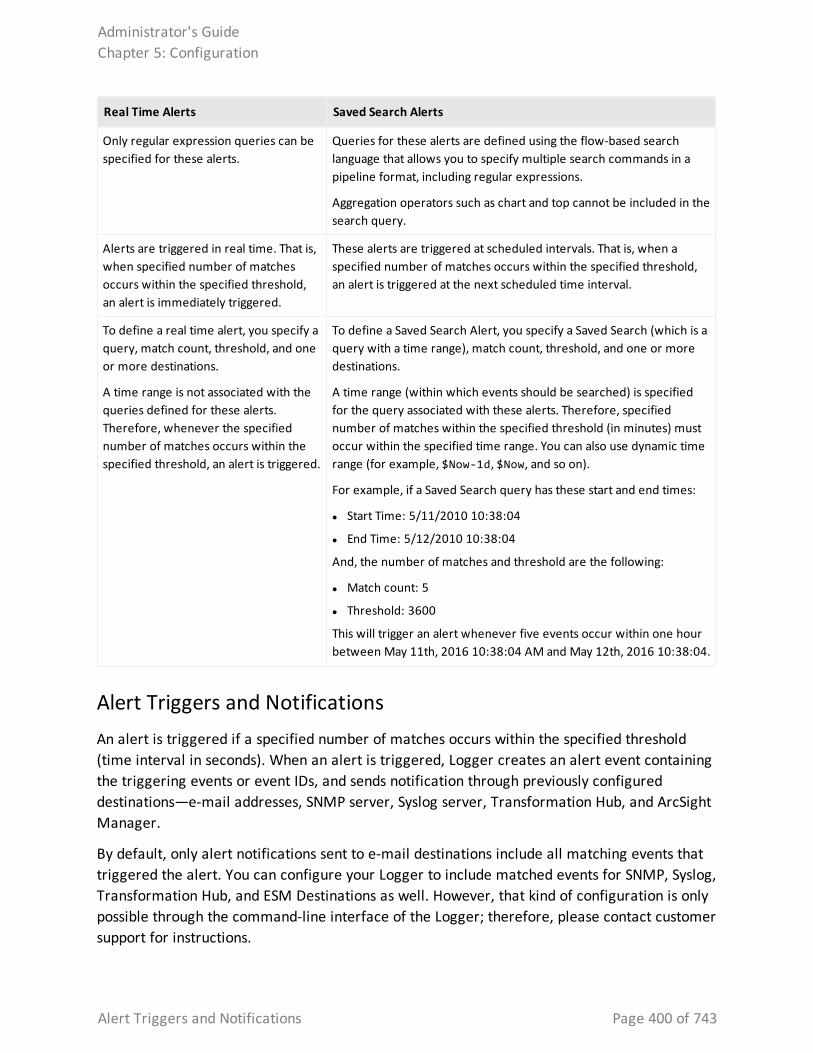
Real Time Alerts Saved Search Alerts
Only regular expression queries can be specified for these alerts.
Queries for these alerts are defined using the flow-based search language that allows you to specify multiple search commands in a pipeline format, including regular expressions.
Aggregation operators such as chart and top cannot be included in the search query.
Alerts are triggered in real time. That is, when specified number of matches occurs within the specified threshold, an alert is immediately triggered.
These alerts are triggered at scheduled intervals. That is, when a specified number of matches occurs within the specified threshold, an alert is triggered at the next scheduled time interval.
To define a real time alert, you specify a query, match count, threshold, and one or more destinations.
A time range is not associated with the queries defined for these alerts. Therefore, whenever the specified number of matches occurs within the specified threshold, an alert is triggered.
To define a Saved Search Alert, you specify a Saved Search (which is a query with a time range), match count, threshold, and one or more destinations.
A time range (within which events should be searched) is specified for the query associated with these alerts. Therefore, specified number of matches within the specified threshold (in minutes) must occur within the specified time range. You can also use dynamic time range (for example, $Now-1d, $Now, and so on).
For example, if a Saved Search query has these start and end times:
l Start Time: 5/11/2010 10:38:04
l End Time: 5/12/2010 10:38:04
And, the number of matches and threshold are the following:
l Match count: 5
l Threshold: 3600
This will trigger an alert whenever five events occur within one hour between May 11th, 2016 10:38:04 AM and May 12th, 2016 10:38:04.
Alert Triggers and NotificationsAn alert is triggered if a specified number of matches occurs within the specified threshold (time interval in seconds). When an alert is triggered, Logger creates an alert event containing the triggering events or event IDs, and sends notification through previously configured destinations—e-mail addresses, SNMP server, Syslog server, Transformation Hub, and ArcSight Manager.
By default, only alert notifications sent to e-mail destinations include all matching events that triggered the alert. You can configure your Logger to include matched events for SNMP, Syslog, Transformation Hub, and ESM Destinations as well. However, that kind of configuration is only possible through the command-line interface of the Logger; therefore, please contact customer support for instructions.
Administrator's GuideChapter 5: Configuration
Alert Triggers and Notifications Page 400 of 743
When are Alert events triggered?
You also specify a time window and a number of matching events. When that number of matching events is detected within the time window, an alert event is triggered.
Logger resets the count after detecting 100 matching events. Therefore, all events that occur in the time window will not necessarily be recorded in an alert. For example, if you configure the alert to be sent when there are 20 matching events in two minutes, and 152 events occur within two minutes, you will get seven alerts, and 12 matching events will not be included in any alert. In this situation, the following alert events are triggered:
l Alert one has 20 matching events.
l Alert two has 40 matching events.
l Alert three has 60 matching events.
l Alert four has 80 matching events.
l Alert five has 100 matching events (1-100).
l Alert six has 20 matching events (101-120).
l Alert seven has 40 matching events (101-140).
The remaining 12 events are being held, waiting to meet the threshold of 20 more events in a two-minute interval.
Receiving Alert NotificationsIn order to receive notification from an alert, set up the alert to be sent to a previously configured destination, such as an e-mail address, SNMP server, Syslog server, Transformation Hub, and ESM.
By default, only alerts to e-mail destinations include all matched events that triggered the alert. You can configure your Logger to include matched events for SNMP, Syslog, Transformation Hub Destinations, and ESM Destinations as well. However, such a configuration is only possible through the command-line interface of the Logger; therefore, please contact customer support for instructions.
For information on how to configure destinations, see "ESM Destinations" on page 406, "Transformation Hub Destinations" on page 409, and "Syslog Destinations" on page 404. To configure e-mail destinations, see "Static Routes" on page 507, as well.
Note: Audit events for alerts are only written to the Internal Storage Group and not forwarded to ESM by default. If you need to forward these audit events to ESM destinations, please contact customer support for assistance. This only applies to audit events generated for alerts; other audit events can be sent to ESM destinations.
Administrator's GuideChapter 5: Configuration
When are Alert events triggered? Page 401 of 743
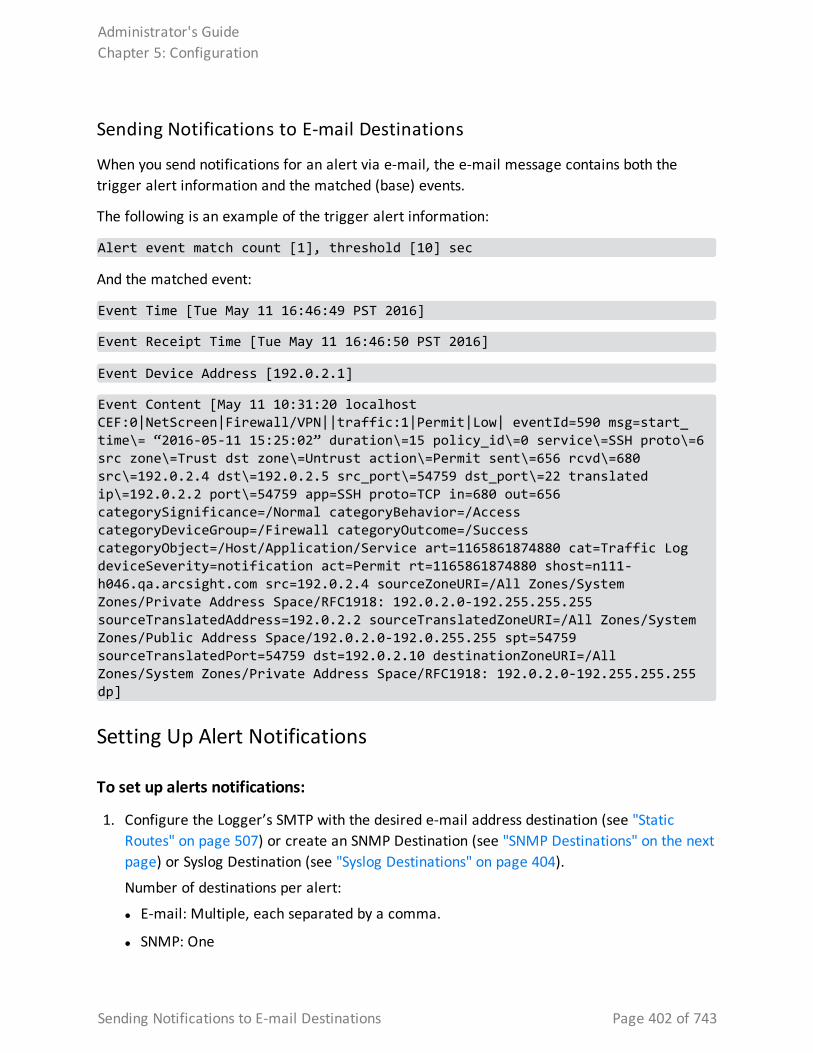
Sending Notifications to E-mail Destinations
When you send notifications for an alert via e-mail, the e-mail message contains both the trigger alert information and the matched (base) events.
The following is an example of the trigger alert information:
Alert event match count [1], threshold [10] sec
And the matched event:
Event Time [Tue May 11 16:46:49 PST 2016]
Event Receipt Time [Tue May 11 16:46:50 PST 2016]
Event Device Address [192.0.2.1]
Event Content [May 11 10:31:20 localhost CEF:0|NetScreen|Firewall/VPN||traffic:1|Permit|Low| eventId=590 msg=start_time\= “2016-05-11 15:25:02” duration\=15 policy_id\=0 service\=SSH proto\=6 src zone\=Trust dst zone\=Untrust action\=Permit sent\=656 rcvd\=680 src\=192.0.2.4 dst\=192.0.2.5 src_port\=54759 dst_port\=22 translated ip\=192.0.2.2 port\=54759 app=SSH proto=TCP in=680 out=656 categorySignificance=/Normal categoryBehavior=/Access categoryDeviceGroup=/Firewall categoryOutcome=/Success categoryObject=/Host/Application/Service art=1165861874880 cat=Traffic Log deviceSeverity=notification act=Permit rt=1165861874880 shost=n111-h046.qa.arcsight.com src=192.0.2.4 sourceZoneURI=/All Zones/System Zones/Private Address Space/RFC1918: 192.0.2.0-192.255.255.255 sourceTranslatedAddress=192.0.2.2 sourceTranslatedZoneURI=/All Zones/System Zones/Public Address Space/192.0.2.0-192.0.255.255 spt=54759 sourceTranslatedPort=54759 dst=192.0.2.10 destinationZoneURI=/All Zones/System Zones/Private Address Space/RFC1918: 192.0.2.0-192.255.255.255 dp]
Setting Up Alert Notifications
To set up alerts notifications:
1. Configure the Logger’s SMTP with the desired e-mail address destination (see "Static Routes" on page 507) or create an SNMP Destination (see "SNMP Destinations" on the next page) or Syslog Destination (see "Syslog Destinations" on page 404).
Number of destinations per alert:
l E-mail: Multiple, each separated by a comma.
l SNMP: One
Administrator's GuideChapter 5: Configuration
Sending Notifications to E-mail Destinations Page 402 of 743
l Syslog: One
2. Create a query to find the events of interest; save the query as a filter. See "Saving Queries, Creating Saved Searches and Saved Filters." on page 150.
Note: Only regular expressions can be used in queries specified for alerts.
3. Create an Alert that uses the new filter and specify match count and threshold (see "Saved Searches" on page 318.)
4. Enable the new Alert.
Sending Notifications to Syslog and SNMP DestinationsWhen configuring Logger to send alerts to SNMP and Syslog destinations, you should be familiar with this information:
l Logger only supports SNMP v2c when configuring the SNMP destination from the Configuration > Data > SNMP Destinations.
l Unlike an e-mail alert, a trigger alert is sent separately from the alert that contains the matched (base) events that triggered the alert.
l All SNMP alerts are sent as SNMP traps; therefore, trigger alerts and their associated matched (base) events are received as SNMP traps on an SNMP destination. The SNMP trap includes the trigger event, but it does not include the events that caused the alert to trigger (matched events). The trigger event does include the event IDs of all the matched events. You can use the event IDs in the trigger alert to identify the associated matched events.
Note: Non-CEF events do not contain event IDs. If you need to associate such base events with their trigger alert, send such events to Logger through a connector.
l SNMP uses UDP to send packets. As a result, the order in which alerts arrive at an SNMP destination is not guaranteed.
l When Syslog events are sent using UDP, the order in which the trigger alert and matched events arrive is not guaranteed.
l Avoid sending alerts to SNMP using non-ASCII characters in the community field as the trap displays "??" characters. However, this does not impact SNMP authentication to Logger.
SNMP DestinationsSNMP Destinations describe how Alert notifications should be sent using Simple Network Management Protocol (SNMP). Set up SNMP Destinations before creating Alerts that will use
Administrator's GuideChapter 5: Configuration
Sending Notifications to Syslog and SNMP Destinations Page 403 of 743
them. Before configuring SNMP destinations, you should be familiar with the information in "Sending Notifications to Syslog and SNMP Destinations" on the previous page.
To add an SNMP Destination:
1. Open the Configuration > Data menu and click SNMP Destinations.
2. Click the Add button.
3. Enter parameters:
Parameter Description
SNMP Destination Name A name for this destination.
Connector Name The SmartConnector name.
Connector Location The physical location of the SmartConnector machine. If you do not want to specify a location, enter “None.”
Logger Location Optional comment describing Logger’s physical location.
SNMP Host Host name or IP address.
SNMP Port 162, by default.
Community Name SNMP community name.
4. Click Save to create the new SNMP Destination.
To remove an SNMP Destination:
1. Go to the Configuration > Data > SNMP Destinations.
2. Locate the SNMP Destination that you want to remove and click the Remove icon ( ) on that row.
3. Confirm the deletion by clicking OK, or click Cancel to retain the SNMP Destination.
Syslog DestinationsSyslog Destinations describe how Alert notifications should be sent using the comparatively simple syslog protocol. You need to set up Syslog Destinations before creating Alerts that will use them. Before configuring Syslog destinations, you should be familiar with the information in "Sending Notifications to Syslog and SNMP Destinations" on the previous page.
To add a Syslog Destination:
1. Go to Configuration > Data >Syslog Destinations.
2. Click the Add button.
Administrator's GuideChapter 5: Configuration
Syslog Destinations Page 404 of 743
3. Enter parameters:
Parameter Description
Name A name for this destination.
Note: Syslog Destination requires a unique name.
Type UDP or TCP Syslog.
Note: This choice cannot be edited later.
4. Click Next. Enter the secondary parameters:
Parameter Description
Name The name for the destination.
Type This is the value you entered in the previous screen. This value cannot be changed.
Ip/Host Host name or IP address.
Port Port (default is 514).
Connection Retry Timeout
(Only for TCP Syslog Destinations) The time, in seconds, to wait before retrying a connection. The default is 5 seconds.
5. Click Save to create the new Syslog Destination.
To edit a Syslog Destination:
1. Go to the Configuration > Data > Syslog Destinations.
2. Click the Edit icon ( ). You can edit the parameters of the Syslog Destination except its type.
3. Click Save to make the changes, or Cancel to return to the Syslog Destination table.
To remove a Syslog Destination:
1. Go to the Configuration > Data > Syslog Destinations.
2. Locate the Syslog Destination that you want to remove and click the Remove icon ( ) on that row.
3. Confirm the deletion by clicking OK, or click Cancel to retain the Syslog Destination.
Administrator's GuideChapter 5: Configuration
Syslog Destinations Page 405 of 743
ESM DestinationsAn ESM Destination establishes a trusted connection between Logger and an ArcSight Manager so that you can forward events and alerts in Common Event Format (CEF) from the Logger to the Manager using Logger’s built-in SmartConnector.
The CEF events are already normalized or categorized. For more information about CEF, refer to the document "Implementing ArcSight CEF". For a down-loadable copy of this guide, search for "ArcSight Common Event Format (CEF) Guide" in the Micro Focus Security Community.
Logger can forward these types of events to an ArcSight Manager:
l Syslog events to an ArcSight Syslog SmartConnector that is connected to an ArcSight Manager
l Common Event Format (CEF) events directly to an ArcSight Manager using Logger ESM Destinations. An ESM Destination appears as a SmartConnector to an ArcSight Console.
l Events received by file receivers where the type specified is not Other. Such events are forwarded using the ArcSight Streaming SmartConnector.
Maximum ESM Destinations: As many destinations as are allowable on the SmartConnectors you are using. However, for performance reasons, Micro Focus ArcSight recommends that you create no more than two ESM Destinations pointing to a single ArcSight Manager. (One should suffice in most cases.)
Do not use basic aggregation for Logger’s built-in SmartConnector because it is resource intensive. (Basic aggregation is set using the Enable Aggregation (in seconds) field from the ArcSight Console.) Instead, follow these steps on the ArcSight Console to configure field-based aggregation:
1. Ensure that Processor > Enable Aggregation (in seconds) is set to Disabled, to disable basic aggregation.
2. Right-click the connector and select inspect/edit/.
For additional details about configuring field-based aggregation, refer to the ArcSight SmartConnector User’s Guide.
To setup Logger to forward events to an ArcSight Manager:
1. Copy the server SSL certificate file from an ArcSight Console or other component that is already communicating with the target Manager, and upload the certificate file to Logger, as described "Uploading a Certificate to the Logger:" on page 429.
Administrator's GuideChapter 5: Configuration
ESM Destinations Page 406 of 743
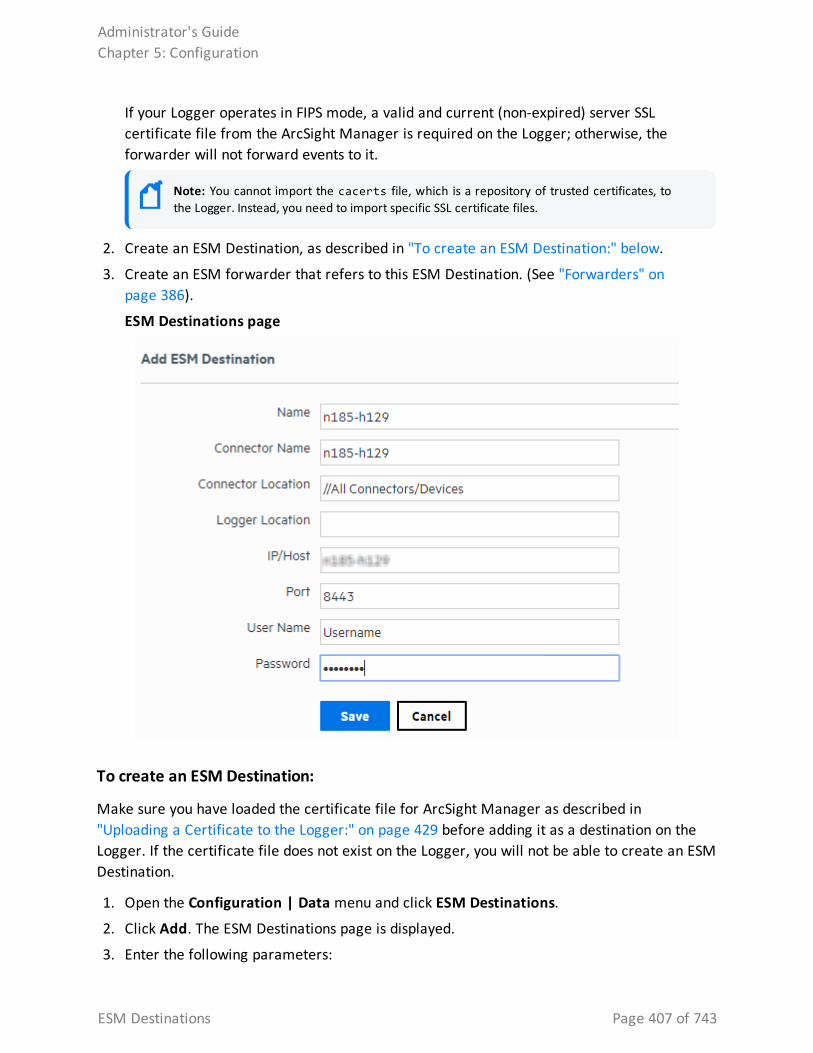
If your Logger operates in FIPS mode, a valid and current (non-expired) server SSL certificate file from the ArcSight Manager is required on the Logger; otherwise, the forwarder will not forward events to it.
Note: You cannot import the cacerts file, which is a repository of trusted certificates, to the Logger. Instead, you need to import specific SSL certificate files.
2. Create an ESM Destination, as described in "To create an ESM Destination:" below.
3. Create an ESM forwarder that refers to this ESM Destination. (See "Forwarders" on page 386).
ESM Destinations page
To create an ESM Destination:
Make sure you have loaded the certificate file for ArcSight Manager as described in "Uploading a Certificate to the Logger:" on page 429 before adding it as a destination on the Logger. If the certificate file does not exist on the Logger, you will not be able to create an ESM Destination.
1. Open the Configuration | Data menu and click ESM Destinations.
2. Click Add. The ESM Destinations page is displayed.
3. Enter the following parameters:
Administrator's GuideChapter 5: Configuration
ESM Destinations Page 407 of 743
Parameter Description
Name The name for this ESM Destination.
Connector Name
The SmartConnector name.
Connector Location
The physical location of the SmartConnector machine. If you do not want to specify a location, enter “None.”
Logger Location
The physical location of the Logger. If you do not want to specify a location, enter “None.”
IP or Host The ArcSight Manager to which the forwarder will direct events.
Note: Make sure the name or IP address you specify in this field is exactly the name or IP address configured on the ArcSight Manager. If the two names or IP addresses do not match, you will not be able to set up an ESM Destination successfully.
Port Typically 8443.
User Name The name of an existing User of the ArcSight Manager with administrator privileges.
Password The password for the Login user.
This password cannot contain the special characters percent (%), equal to (=), semicolon (;), double quote (“), single quote (‘), less than (<), or greater than (>).
Caution: While ArcSight Manager allows these special characters in passwords, Logger does not. If the ArcSight Manager user’s password contains those characters, you will need to change the password in ArcSight Manager before configuring this password.
4. Click Save.
Tip: If you receive the following error when adding a new ESM Destination, make sure the host name you specified in the IP or Host field exactly matches the name configured on the ArcSight Manager.
There was a problem: Failed to add destination
Additionally, if the ArcSight Manager is configured using a host name instead of IP address, make sure you add the ArcSight Manager host name and IP address in the Logger’s hosts file (System Admin > Network > Hosts).
Administrator's GuideChapter 5: Configuration
ESM Destinations Page 408 of 743
To delete an ESM Destination:
1. Open the Configuration | Data menu and click ESM Destinations (or click Alerts and then open the ESM Destinations page if you are deleting an ESM Destination for forwarding Alerts.)
2. Locate the ESM Destination that you want to delete and click the Delete icon ( ) on that row.
3. Confirm the deletion by clicking OK, or click Cancel to retain the ESM Destination.
Transformation Hub DestinationsA Transformation Hub Destination establishes a trusted connection between Logger and a Transformation Hub so that you can forward events.
Logger can forward these types of events to a Transformation Hub:
l Syslog events to an ArcSight Syslog SmartConnector that is connected to a Transformation Hub.
l AVRO Format events directly to a Transformation Hub using Logger TH Destinations. Events are translated from CEF/Syslog Format to AVRO Format by the Onboard Connector at forwarding time.
Note: SSL/TLS Security is required for AVRO Destinations. You cannot set an AVRO destination with a Plain Text Connection.
l Common Event Format (CEF) events directly to a Transformation Hub using Logger TH Destinations. A TH Destination appears as a SmartConnector to an Arcsight Console.
Note: You can only send cef 0 events.
Guidelines for TH Destination:
l Before adding Transformation Hub destinations in appliances, DNS must be configured. For more information, see "System DNS" on page 502
l For further details on each of the security options, see: o "Setting a TH Destination using TLS + CA " on page 419
o "Setting a TH Destination using TLS + CA and FIPS" on page 412
o "Setting a TH Destination using TLS and FIPS" on page 424
o "Setting a TH Destination using only TLS " on page 426
o "Setting a TH Destination using No Security" on page 428
Administrator's GuideChapter 5: Configuration
Transformation Hub Destinations Page 409 of 743
l You can set as many TH destinations on the SmartConnectors as needed. However, Micro Focus ArcSight recommends that you create no more than two TH Destinations pointing to a single Transformation Hub.
l Do not use basic aggregation for Logger’s built-in SmartConnector as it is resource intensive. Instead, follow these steps on the ArcSight Console to configure field-based aggregation:
o Ensure that Processor > Enable Aggregation (in seconds) is set to Disabled.
o Right-click the connector and select inspect/edit/.
To create a TH Destination
1. From the Configuration > Data > TH Destination, click the Add button.
1. Enter the following parameters:
Parameter Description
Name A name for this destination.
Initial Host Port The initial host port Kafka nodes will start using.
Kafka Broker Host:Port
The Transformation Hub worker nodes to which the forwarder will direct events. For secure connections, use port 9093. Otherwise, use 9092.
Note: Make sure the name or IP address you specify in this field is the same used when configuring the worker nodes of the Transformation Hub.
Connector Name The SmartConnector name. The name of the agent that OBC creates to point to the destination.
Connector Location The physical location of the SmartConnector machine.
To not specify a location, enter None.
Logger Location The Logger’s physical location.
Content Format Content format that will be transferred to the TH Destination.
l Avro: ArcSight 2020.3 or later.
l CEF (for IPv4): Logger 6.3.0 or earlier.
l CEF (for IPv4 and IPv6): Logger 6.4.0 or later.
l ESM Binary: ESM-only event format for all versions of ESM.
Content Type Type of content that will be transferred to the TH Destination.
Select one of the following content types:
l Logger/Investigate/Hadoop/3rd parties
l Logger 6.4 or higher/IPv6/Investigate
l ESM
Administrator's GuideChapter 5: Configuration
Transformation Hub Destinations Page 410 of 743
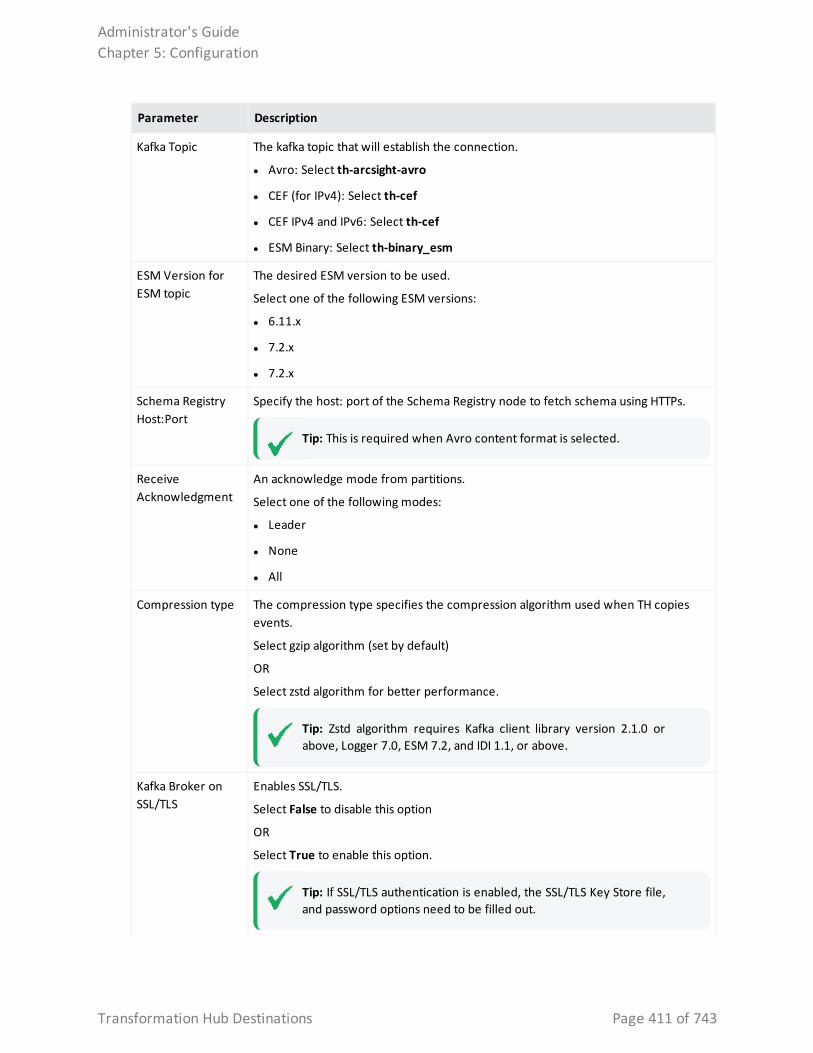
Parameter Description
Kafka Topic The kafka topic that will establish the connection.
l Avro: Select th-arcsight-avro
l CEF (for IPv4): Select th-cef
l CEF IPv4 and IPv6: Select th-cef
l ESM Binary: Select th-binary_esm
ESM Version for ESM topic
The desired ESM version to be used.
Select one of the following ESM versions:
l 6.11.x
l 7.2.x
l 7.2.x
Schema Registry Host:Port
Specify the host: port of the Schema Registry node to fetch schema using HTTPs.
Tip: This is required when Avro content format is selected.
Receive Acknowledgment
An acknowledge mode from partitions.
Select one of the following modes:
l Leader
l None
l All
Compression type The compression type specifies the compression algorithm used when TH copies events.
Select gzip algorithm (set by default)
OR
Select zstd algorithm for better performance.
Tip: Zstd algorithm requires Kafka client library version 2.1.0 or above, Logger 7.0, ESM 7.2, and IDI 1.1, or above.
Kafka Broker on SSL/TLS
Enables SSL/TLS.
Select False to disable this option
OR
Select True to enable this option.
Tip: If SSL/TLS authentication is enabled, the SSL/TLS Key Store file, and password options need to be filled out.
Administrator's GuideChapter 5: Configuration
Transformation Hub Destinations Page 411 of 743
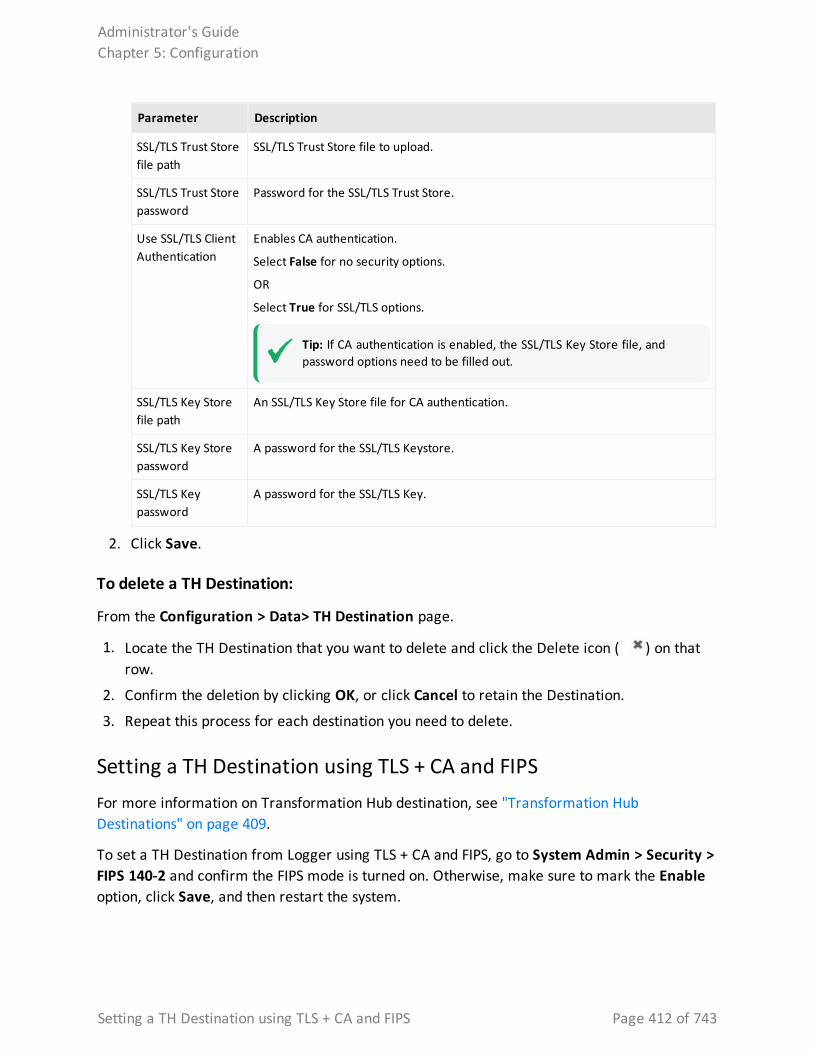
Parameter Description
SSL/TLS Trust Store file path
SSL/TLS Trust Store file to upload.
SSL/TLS Trust Store password
Password for the SSL/TLS Trust Store.
Use SSL/TLS Client Authentication
Enables CA authentication.
Select False for no security options.
OR
Select True for SSL/TLS options.
Tip: If CA authentication is enabled, the SSL/TLS Key Store file, and password options need to be filled out.
SSL/TLS Key Store file path
An SSL/TLS Key Store file for CA authentication.
SSL/TLS Key Store password
A password for the SSL/TLS Keystore.
SSL/TLS Key password
A password for the SSL/TLS Key.
2. Click Save.
To delete a TH Destination:
From the Configuration > Data> TH Destination page.
1. Locate the TH Destination that you want to delete and click the Delete icon ( ) on that row.
2. Confirm the deletion by clicking OK, or click Cancel to retain the Destination.
3. Repeat this process for each destination you need to delete.
Setting a TH Destination using TLS + CA and FIPSFor more information on Transformation Hub destination, see "Transformation Hub Destinations" on page 409.
To set a TH Destination from Logger using TLS + CA and FIPS, go to System Admin > Security > FIPS 140-2 and confirm the FIPS mode is turned on. Otherwise, make sure to mark the Enable option, click Save, and then restart the system.
Administrator's GuideChapter 5: Configuration
Setting a TH Destination using TLS + CA and FIPS Page 412 of 743
Caution: Before any change in Logger UI, it is required to access both the Transformation Hub Master and Logger machines. Make sure to keep the sessions open (for TH and Logger) while adding the destination.
Step 1: Generate a certificate in the Transformation Hub Master
Tip: To add a self-signed certificate, make sure to follow all steps below. This is a one-time only process.
1. To replace the self-signed certificates, obtain your company's root CA certificate, intermediate certificate, and key pair. Copy to /tmp as shown below: /tmp/intermediate.cert.pem
/tmp/intermediate.key.pem
/tmp/ca.cert.pem
2. Add the certificate to Transformation Hub:/opt/arcsight/kubernetes/scripts/cdf-updateRE.sh write --re-key=/tmp/intermediate.key.pem --re-crt=/tmp/intermediate.cert.pem --reca=/tmp/ca.cert.pem
Note: After importing the certificate, make sure to uninstall and re- install the Transformation Hub with FIPS and Client Authentication enabled. For further details, see Transformation Hub Deployment Guide.
3. Set the variables and create the directory: export CA_CERT=/tmp/ca.cert.pem
export INTERMEDIATE_CA_CRT=/tmp/intermediate.cert.pem
export INTERMEDIATE_CA_KEY=/tmp/intermediate.key.pem
export FIPS_CA_TMP=/opt/fips_ca_tmp
export TH=<Transformation Hub hostname>_<Transformation Hub port>
mkdir $FIPS_CA_TMP
Administrator's GuideChapter 5: Configuration
Step 1: Generate a certificate in the Transformation Hub Master Page 413 of 743
Step 2: Set the Logger Server
Administrator's GuideChapter 5: Configuration
Step 2: Set the Logger Server Page 414 of 743
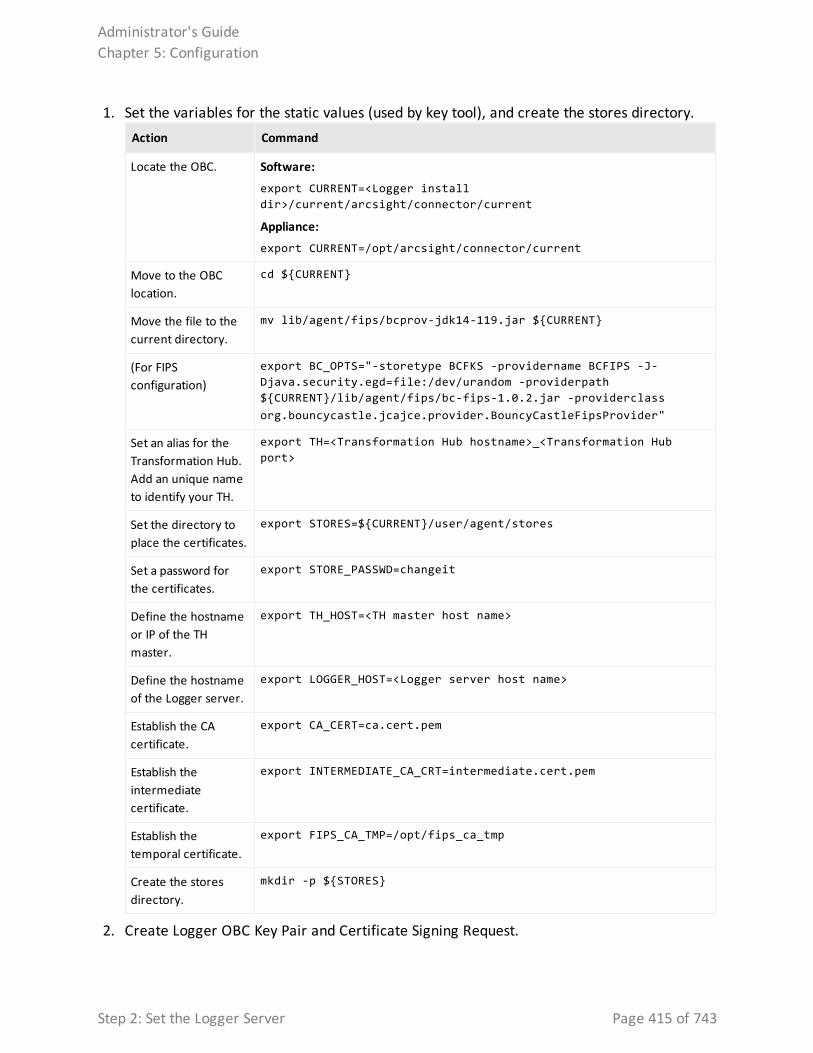
1. Set the variables for the static values (used by key tool), and create the stores directory. Action Command
Locate the OBC. Software:
export CURRENT=<Logger install dir>/current/arcsight/connector/current
Appliance:
export CURRENT=/opt/arcsight/connector/current
Move to the OBC location.
cd ${CURRENT}
Move the file to the current directory.
mv lib/agent/fips/bcprov-jdk14-119.jar ${CURRENT}
(For FIPS configuration)
export BC_OPTS="-storetype BCFKS -providername BCFIPS -J-Djava.security.egd=file:/dev/urandom -providerpath ${CURRENT}/lib/agent/fips/bc-fips-1.0.2.jar -providerclass org.bouncycastle.jcajce.provider.BouncyCastleFipsProvider"
Set an alias for the Transformation Hub. Add an unique name to identify your TH.
export TH=<Transformation Hub hostname>_<Transformation Hub port>
Set the directory to place the certificates.
export STORES=${CURRENT}/user/agent/stores
Set a password for the certificates.
export STORE_PASSWD=changeit
Define the hostname or IP of the TH master.
export TH_HOST=<TH master host name>
Define the hostname of the Logger server.
export LOGGER_HOST=<Logger server host name>
Establish the CA certificate.
export CA_CERT=ca.cert.pem
Establish the intermediate certificate.
export INTERMEDIATE_CA_CRT=intermediate.cert.pem
Establish the temporal certificate.
export FIPS_CA_TMP=/opt/fips_ca_tmp
Create the stores directory.
mkdir -p ${STORES}
2. Create Logger OBC Key Pair and Certificate Signing Request.
Administrator's GuideChapter 5: Configuration
Step 2: Set the Logger Server Page 415 of 743
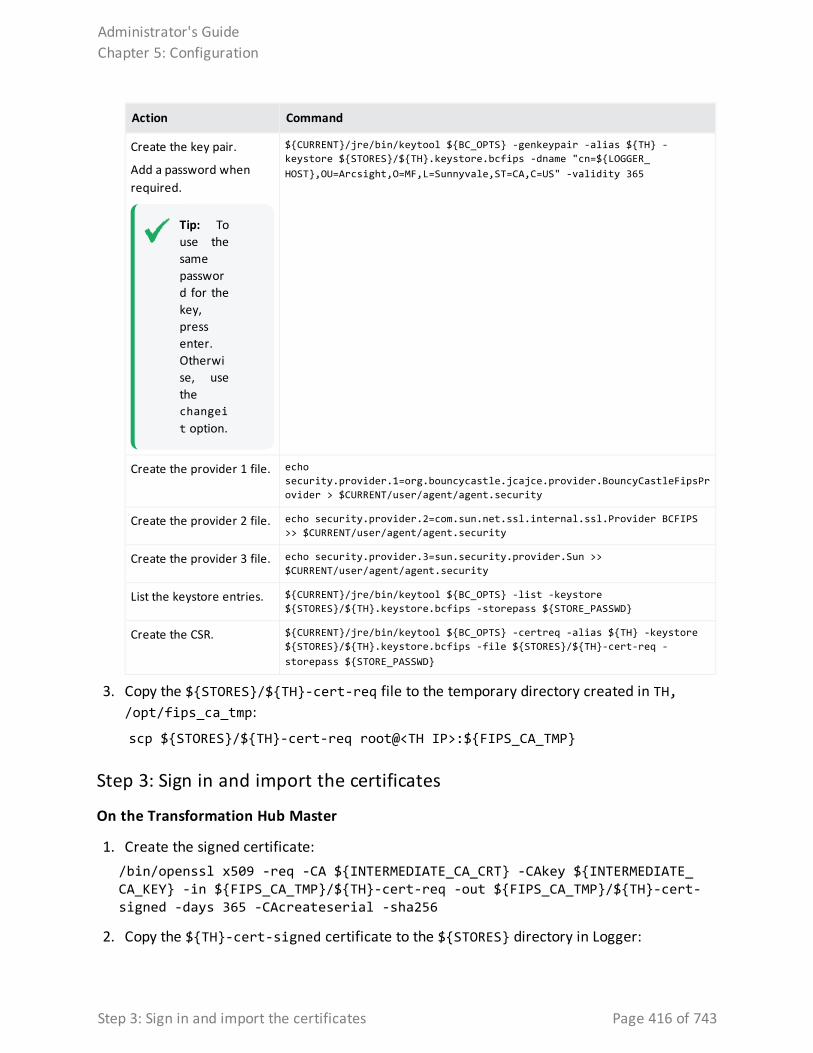
Action Command
Create the key pair.
Add a password when required.
Tip: To use the same password for the key, press enter. Otherwise, use the changeit option.
${CURRENT}/jre/bin/keytool ${BC_OPTS} -genkeypair -alias ${TH} -keystore ${STORES}/${TH}.keystore.bcfips -dname "cn=${LOGGER_HOST},OU=Arcsight,O=MF,L=Sunnyvale,ST=CA,C=US" -validity 365
Create the provider 1 file. echo security.provider.1=org.bouncycastle.jcajce.provider.BouncyCastleFipsProvider > $CURRENT/user/agent/agent.security
Create the provider 2 file. echo security.provider.2=com.sun.net.ssl.internal.ssl.Provider BCFIPS >> $CURRENT/user/agent/agent.security
Create the provider 3 file. echo security.provider.3=sun.security.provider.Sun >> $CURRENT/user/agent/agent.security
List the keystore entries. ${CURRENT}/jre/bin/keytool ${BC_OPTS} -list -keystore ${STORES}/${TH}.keystore.bcfips -storepass ${STORE_PASSWD}
Create the CSR. ${CURRENT}/jre/bin/keytool ${BC_OPTS} -certreq -alias ${TH} -keystore ${STORES}/${TH}.keystore.bcfips -file ${STORES}/${TH}-cert-req -storepass ${STORE_PASSWD}
3. Copy the ${STORES}/${TH}-cert-req file to the temporary directory created in TH, /opt/fips_ca_tmp:
scp ${STORES}/${TH}-cert-req root@<TH IP>:${FIPS_CA_TMP}
Step 3: Sign in and import the certificates
On the Transformation Hub Master
1. Create the signed certificate: /bin/openssl x509 -req -CA ${INTERMEDIATE_CA_CRT} -CAkey ${INTERMEDIATE_CA_KEY} -in ${FIPS_CA_TMP}/${TH}-cert-req -out ${FIPS_CA_TMP}/${TH}-cert-signed -days 365 -CAcreateserial -sha256
2. Copy the ${TH}-cert-signed certificate to the ${STORES} directory in Logger:
Administrator's GuideChapter 5: Configuration
Step 3: Sign in and import the certificates Page 416 of 743
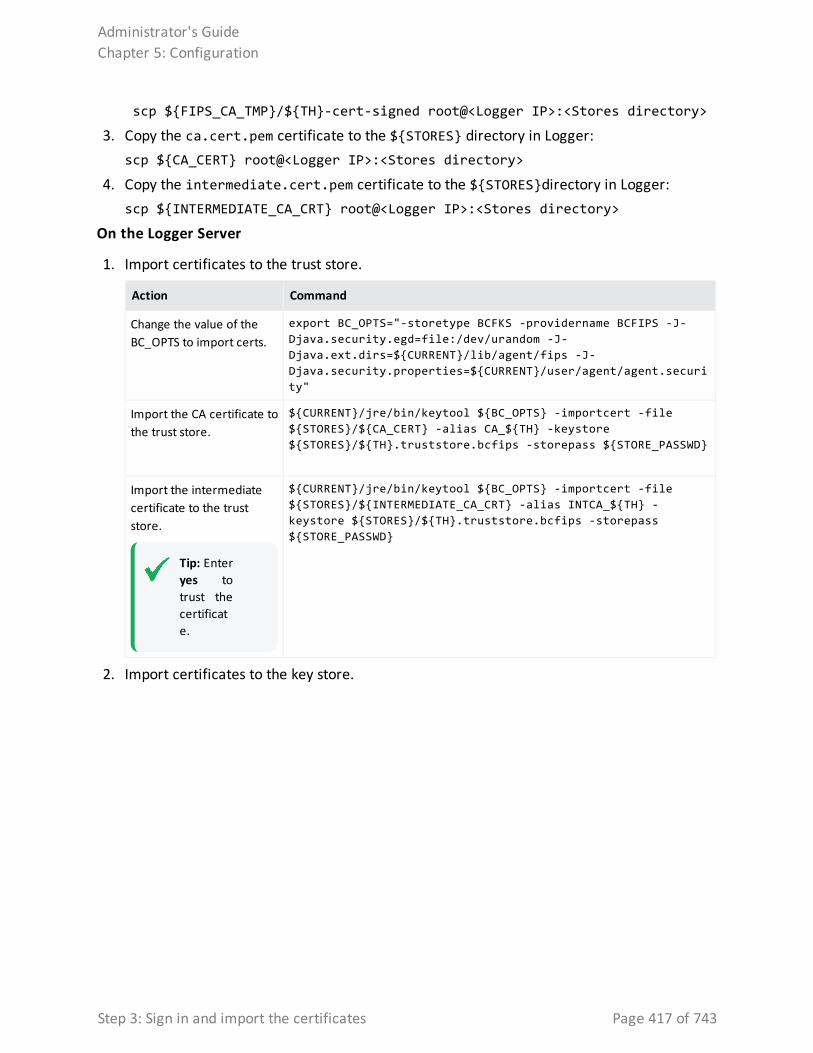
scp ${FIPS_CA_TMP}/${TH}-cert-signed root@<Logger IP>:<Stores directory>
3. Copy the ca.cert.pem certificate to the ${STORES} directory in Logger: scp ${CA_CERT} root@<Logger IP>:<Stores directory>
4. Copy the intermediate.cert.pem certificate to the ${STORES}directory in Logger: scp ${INTERMEDIATE_CA_CRT} root@<Logger IP>:<Stores directory>
On the Logger Server
1. Import certificates to the trust store.
Action Command
Change the value of the BC_OPTS to import certs.
export BC_OPTS="-storetype BCFKS -providername BCFIPS -J-Djava.security.egd=file:/dev/urandom -J-Djava.ext.dirs=${CURRENT}/lib/agent/fips -J-Djava.security.properties=${CURRENT}/user/agent/agent.security"
Import the CA certificate to the trust store.
${CURRENT}/jre/bin/keytool ${BC_OPTS} -importcert -file ${STORES}/${CA_CERT} -alias CA_${TH} -keystore ${STORES}/${TH}.truststore.bcfips -storepass ${STORE_PASSWD}
Import the intermediate certificate to the trust store.
Tip: Enter yes to trust the certificate.
${CURRENT}/jre/bin/keytool ${BC_OPTS} -importcert -file ${STORES}/${INTERMEDIATE_CA_CRT} -alias INTCA_${TH} -keystore ${STORES}/${TH}.truststore.bcfips -storepass ${STORE_PASSWD}
2. Import certificates to the key store.
Administrator's GuideChapter 5: Configuration
Step 3: Sign in and import the certificates Page 417 of 743
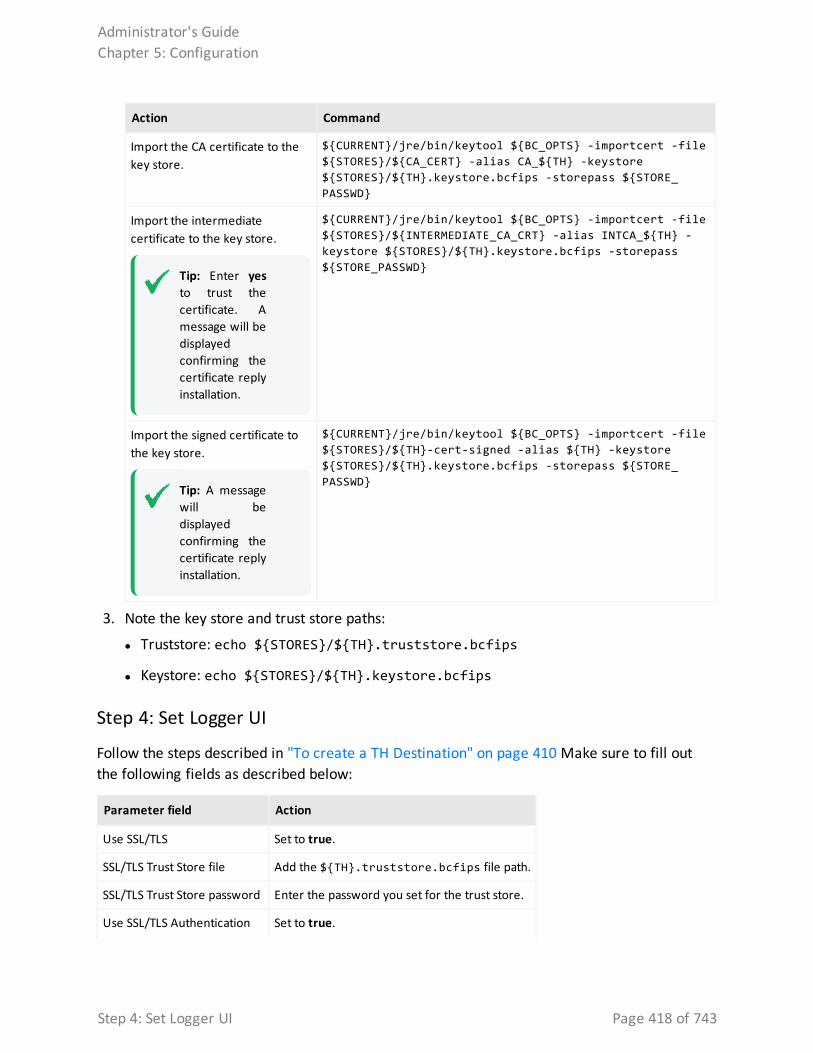
Action Command
Import the CA certificate to the key store.
${CURRENT}/jre/bin/keytool ${BC_OPTS} -importcert -file ${STORES}/${CA_CERT} -alias CA_${TH} -keystore ${STORES}/${TH}.keystore.bcfips -storepass ${STORE_PASSWD}
Import the intermediate certificate to the key store.
Tip: Enter yes to trust the certificate. A message will be displayed confirming the certificate reply installation.
${CURRENT}/jre/bin/keytool ${BC_OPTS} -importcert -file ${STORES}/${INTERMEDIATE_CA_CRT} -alias INTCA_${TH} -keystore ${STORES}/${TH}.keystore.bcfips -storepass ${STORE_PASSWD}
Import the signed certificate to the key store.
Tip: A message will be displayed confirming the certificate reply installation.
${CURRENT}/jre/bin/keytool ${BC_OPTS} -importcert -file ${STORES}/${TH}-cert-signed -alias ${TH} -keystore ${STORES}/${TH}.keystore.bcfips -storepass ${STORE_PASSWD}
3. Note the key store and trust store paths:
l Truststore: echo ${STORES}/${TH}.truststore.bcfips
l Keystore: echo ${STORES}/${TH}.keystore.bcfips
Step 4: Set Logger UI
Follow the steps described in "To create a TH Destination" on page 410 Make sure to fill out the following fields as described below:
Parameter field Action
Use SSL/TLS Set to true.
SSL/TLS Trust Store file Add the ${TH}.truststore.bcfips file path.
SSL/TLS Trust Store password Enter the password you set for the trust store.
Use SSL/TLS Authentication Set to true.
Administrator's GuideChapter 5: Configuration
Step 4: Set Logger UI Page 418 of 743
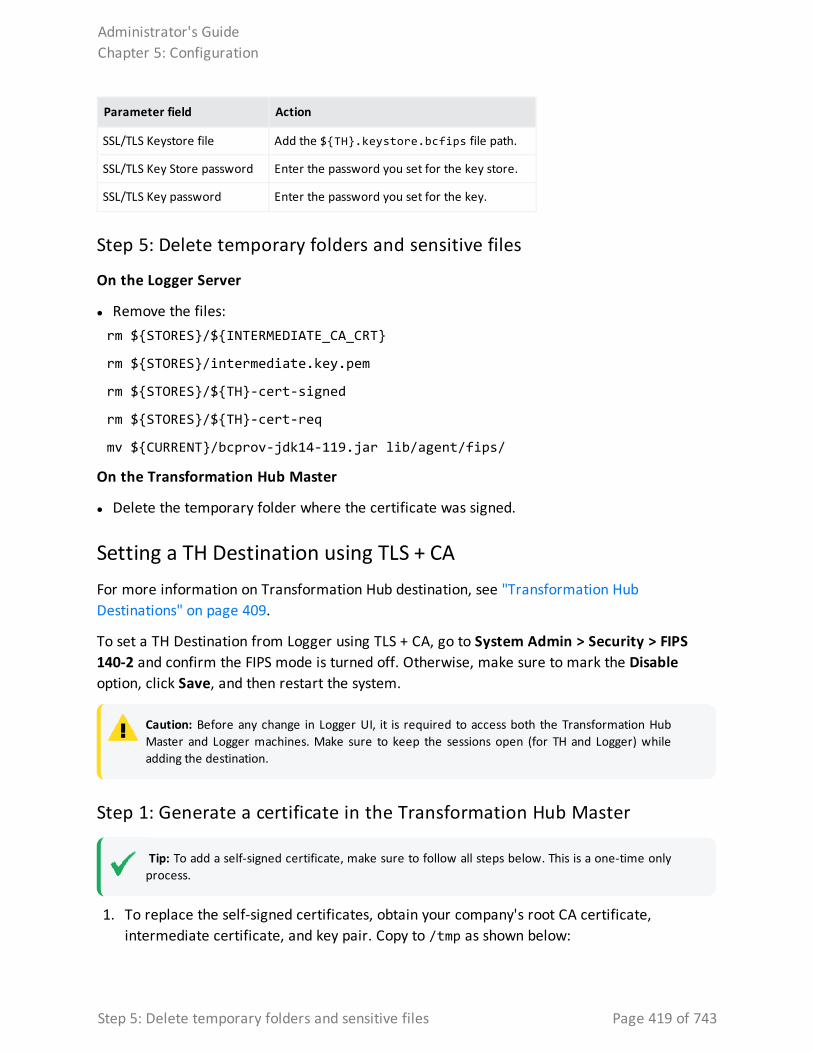
Parameter field Action
SSL/TLS Keystore file Add the ${TH}.keystore.bcfips file path.
SSL/TLS Key Store password Enter the password you set for the key store.
SSL/TLS Key password Enter the password you set for the key.
Step 5: Delete temporary folders and sensitive files
On the Logger Server
l Remove the files: rm ${STORES}/${INTERMEDIATE_CA_CRT}
rm ${STORES}/intermediate.key.pem
rm ${STORES}/${TH}-cert-signed
rm ${STORES}/${TH}-cert-req
mv ${CURRENT}/bcprov-jdk14-119.jar lib/agent/fips/
On the Transformation Hub Master
l Delete the temporary folder where the certificate was signed.
Setting a TH Destination using TLS + CA For more information on Transformation Hub destination, see "Transformation Hub Destinations" on page 409.
To set a TH Destination from Logger using TLS + CA, go to System Admin > Security > FIPS 140-2 and confirm the FIPS mode is turned off. Otherwise, make sure to mark the Disable option, click Save, and then restart the system.
Caution: Before any change in Logger UI, it is required to access both the Transformation Hub Master and Logger machines. Make sure to keep the sessions open (for TH and Logger) while adding the destination.
Step 1: Generate a certificate in the Transformation Hub Master
Tip: To add a self-signed certificate, make sure to follow all steps below. This is a one-time only process.
1. To replace the self-signed certificates, obtain your company's root CA certificate, intermediate certificate, and key pair. Copy to /tmp as shown below:
Administrator's GuideChapter 5: Configuration
Step 5: Delete temporary folders and sensitive files Page 419 of 743
/tmp/intermediate.cert.pem
/tmp/intermediate.key.pem
/tmp/ca.cert.pem
2. Add the certificate to Transformation Hub:/opt/arcsight/kubernetes/scripts/cdf-updateRE.sh write --re-key=/tmp/intermediate.key.pem --re-crt=/tmp/intermediate.cert.pem --re-ca=/tmp/ca.cert.pem
Note: After importing the certificate, uninstall and re-installed the Transformation Hub with Client Authentication enabled. For further details, see Transformation Hub Deployment Guide.
3. Set the variables and create the directory: export CA_CERT=/tmp/ca.cert.pem
export CERT_CA_TMP=/opt/cert_ca_tmp
export INTERMEDIATE_CA_CRT=/tmp/intermediate.cert.pem
export INTERMEDIATE_CA_KEY=/tmp/intermediate.key.pem
export TH=<Transformation Hub hostname>_<Transformation Hub port>
mkdir $CERT_CA_TMP
Administrator's GuideChapter 5: Configuration
Step 1: Generate a certificate in the Transformation Hub Master Page 420 of 743
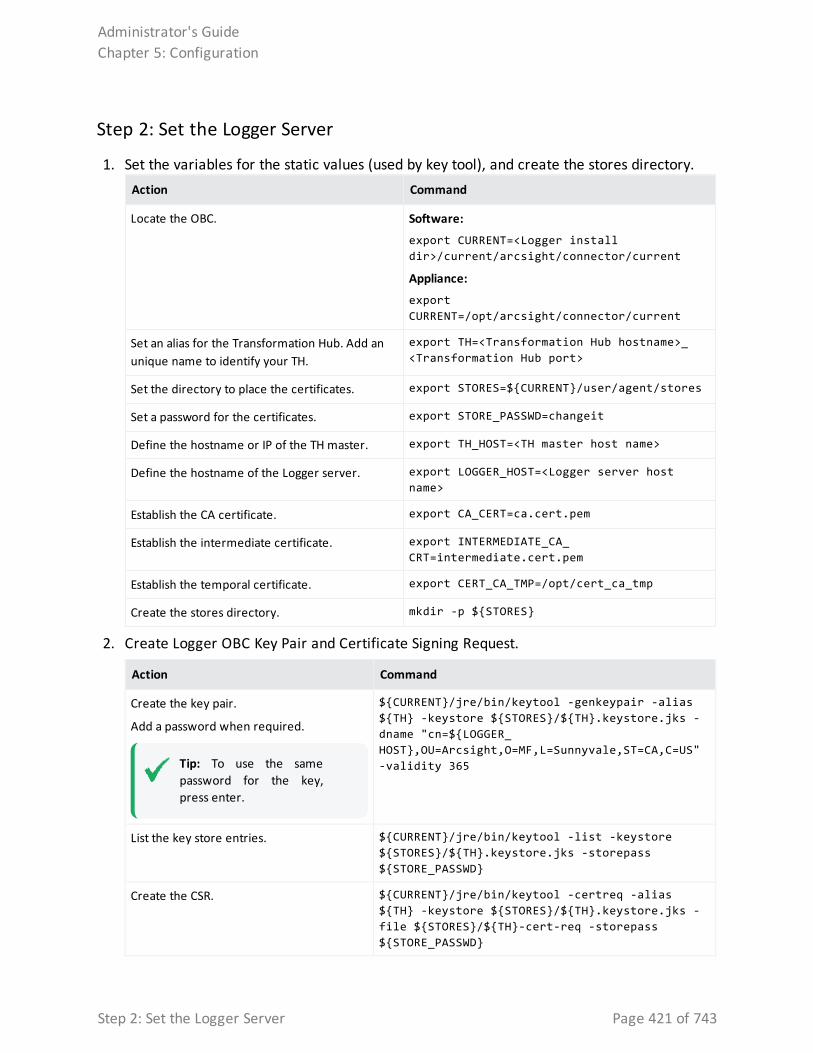
Step 2: Set the Logger Server
1. Set the variables for the static values (used by key tool), and create the stores directory. Action Command
Locate the OBC. Software:
export CURRENT=<Logger install dir>/current/arcsight/connector/current
Appliance:
export CURRENT=/opt/arcsight/connector/current
Set an alias for the Transformation Hub. Add an unique name to identify your TH.
export TH=<Transformation Hub hostname>_<Transformation Hub port>
Set the directory to place the certificates. export STORES=${CURRENT}/user/agent/stores
Set a password for the certificates. export STORE_PASSWD=changeit
Define the hostname or IP of the TH master. export TH_HOST=<TH master host name>
Define the hostname of the Logger server. export LOGGER_HOST=<Logger server host name>
Establish the CA certificate. export CA_CERT=ca.cert.pem
Establish the intermediate certificate. export INTERMEDIATE_CA_CRT=intermediate.cert.pem
Establish the temporal certificate. export CERT_CA_TMP=/opt/cert_ca_tmp
Create the stores directory. mkdir -p ${STORES}
2. Create Logger OBC Key Pair and Certificate Signing Request.
Action Command
Create the key pair.
Add a password when required.
Tip: To use the same password for the key, press enter.
${CURRENT}/jre/bin/keytool -genkeypair -alias ${TH} -keystore ${STORES}/${TH}.keystore.jks -dname "cn=${LOGGER_HOST},OU=Arcsight,O=MF,L=Sunnyvale,ST=CA,C=US" -validity 365
List the key store entries. ${CURRENT}/jre/bin/keytool -list -keystore ${STORES}/${TH}.keystore.jks -storepass ${STORE_PASSWD}
Create the CSR. ${CURRENT}/jre/bin/keytool -certreq -alias ${TH} -keystore ${STORES}/${TH}.keystore.jks -file ${STORES}/${TH}-cert-req -storepass ${STORE_PASSWD}
Administrator's GuideChapter 5: Configuration
Step 2: Set the Logger Server Page 421 of 743
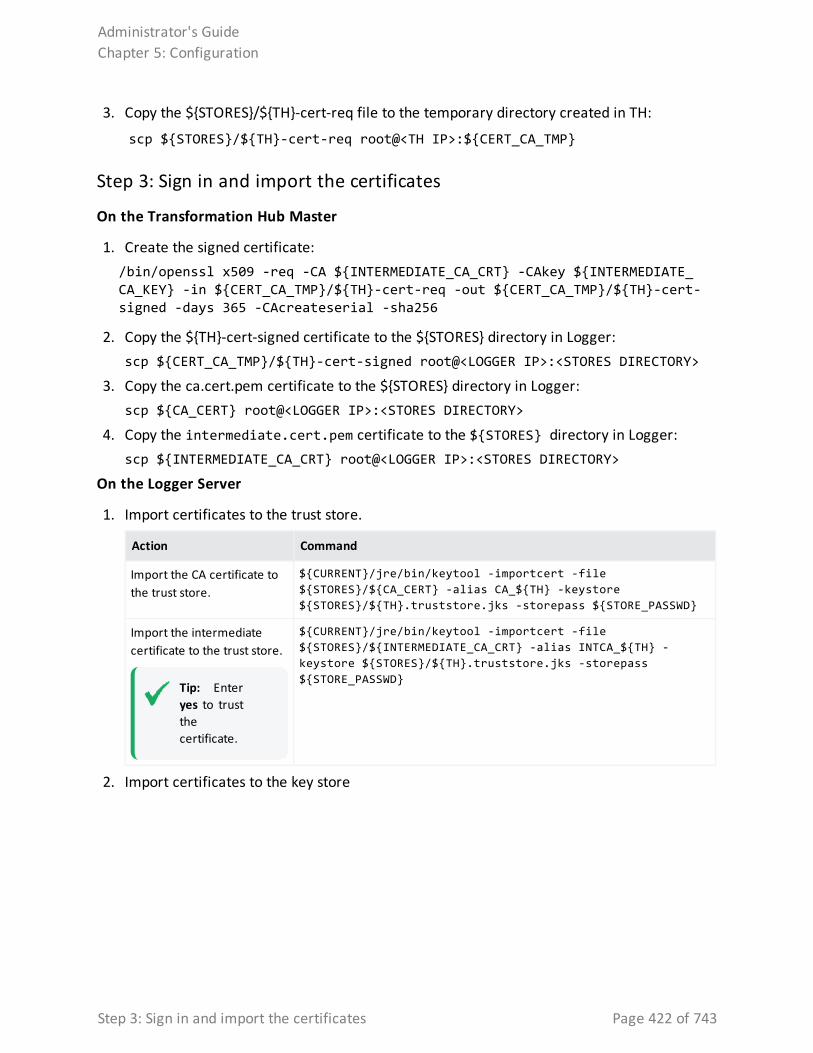
3. Copy the ${STORES}/${TH}-cert-req file to the temporary directory created in TH:
scp ${STORES}/${TH}-cert-req root@<TH IP>:${CERT_CA_TMP}
Step 3: Sign in and import the certificates
On the Transformation Hub Master
1. Create the signed certificate: /bin/openssl x509 -req -CA ${INTERMEDIATE_CA_CRT} -CAkey ${INTERMEDIATE_CA_KEY} -in ${CERT_CA_TMP}/${TH}-cert-req -out ${CERT_CA_TMP}/${TH}-cert-signed -days 365 -CAcreateserial -sha256
2. Copy the ${TH}-cert-signed certificate to the ${STORES} directory in Logger:scp ${CERT_CA_TMP}/${TH}-cert-signed root@<LOGGER IP>:<STORES DIRECTORY>
3. Copy the ca.cert.pem certificate to the ${STORES} directory in Logger:scp ${CA_CERT} root@<LOGGER IP>:<STORES DIRECTORY>
4. Copy the intermediate.cert.pem certificate to the ${STORES} directory in Logger:scp ${INTERMEDIATE_CA_CRT} root@<LOGGER IP>:<STORES DIRECTORY>
On the Logger Server
1. Import certificates to the trust store.
Action Command
Import the CA certificate to the trust store.
${CURRENT}/jre/bin/keytool -importcert -file ${STORES}/${CA_CERT} -alias CA_${TH} -keystore ${STORES}/${TH}.truststore.jks -storepass ${STORE_PASSWD}
Import the intermediate certificate to the trust store.
Tip: Enter yes to trust the certificate.
${CURRENT}/jre/bin/keytool -importcert -file ${STORES}/${INTERMEDIATE_CA_CRT} -alias INTCA_${TH} -keystore ${STORES}/${TH}.truststore.jks -storepass ${STORE_PASSWD}
2. Import certificates to the key store
Administrator's GuideChapter 5: Configuration
Step 3: Sign in and import the certificates Page 422 of 743
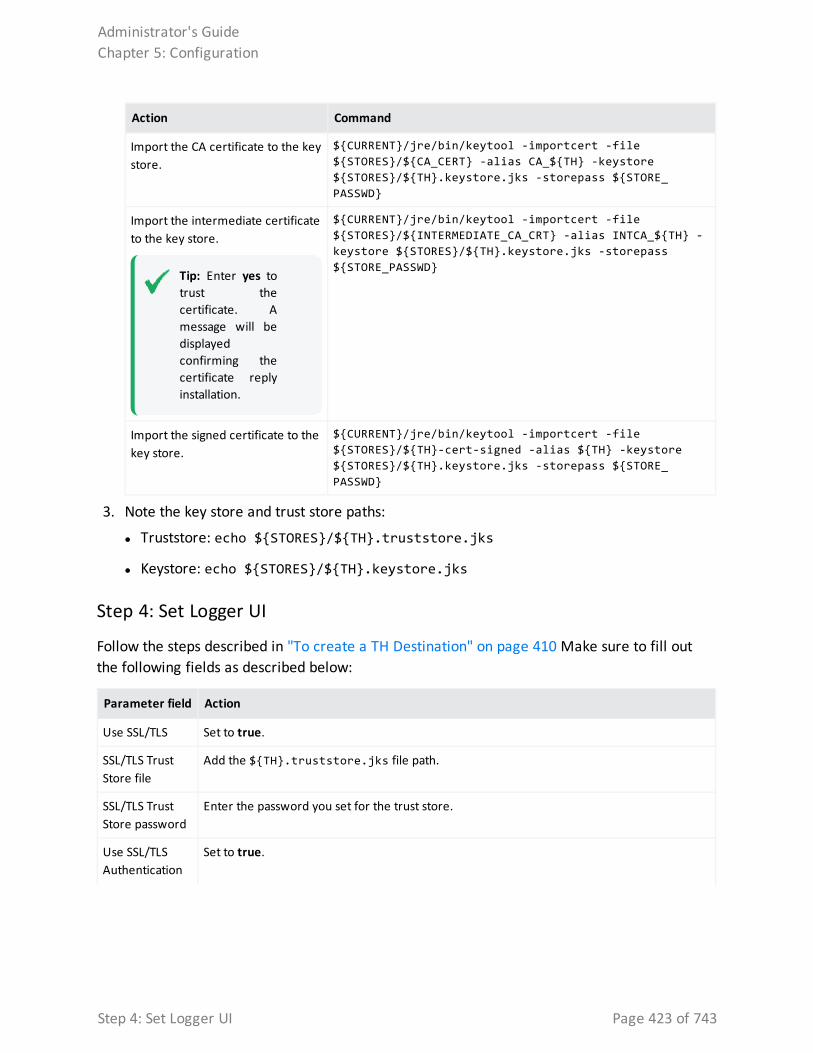
Action Command
Import the CA certificate to the key store.
${CURRENT}/jre/bin/keytool -importcert -file ${STORES}/${CA_CERT} -alias CA_${TH} -keystore ${STORES}/${TH}.keystore.jks -storepass ${STORE_PASSWD}
Import the intermediate certificate to the key store.
Tip: Enter yes to trust the certificate. A message will be displayed confirming the certificate reply installation.
${CURRENT}/jre/bin/keytool -importcert -file ${STORES}/${INTERMEDIATE_CA_CRT} -alias INTCA_${TH} -keystore ${STORES}/${TH}.keystore.jks -storepass ${STORE_PASSWD}
Import the signed certificate to the key store.
${CURRENT}/jre/bin/keytool -importcert -file ${STORES}/${TH}-cert-signed -alias ${TH} -keystore ${STORES}/${TH}.keystore.jks -storepass ${STORE_PASSWD}
3. Note the key store and trust store paths:
l Truststore: echo ${STORES}/${TH}.truststore.jks
l Keystore: echo ${STORES}/${TH}.keystore.jks
Step 4: Set Logger UI
Follow the steps described in "To create a TH Destination" on page 410 Make sure to fill out the following fields as described below:
Parameter field Action
Use SSL/TLS Set to true.
SSL/TLS Trust Store file
Add the ${TH}.truststore.jks file path.
SSL/TLS Trust Store password
Enter the password you set for the trust store.
Use SSL/TLS Authentication
Set to true.
Administrator's GuideChapter 5: Configuration
Step 4: Set Logger UI Page 423 of 743
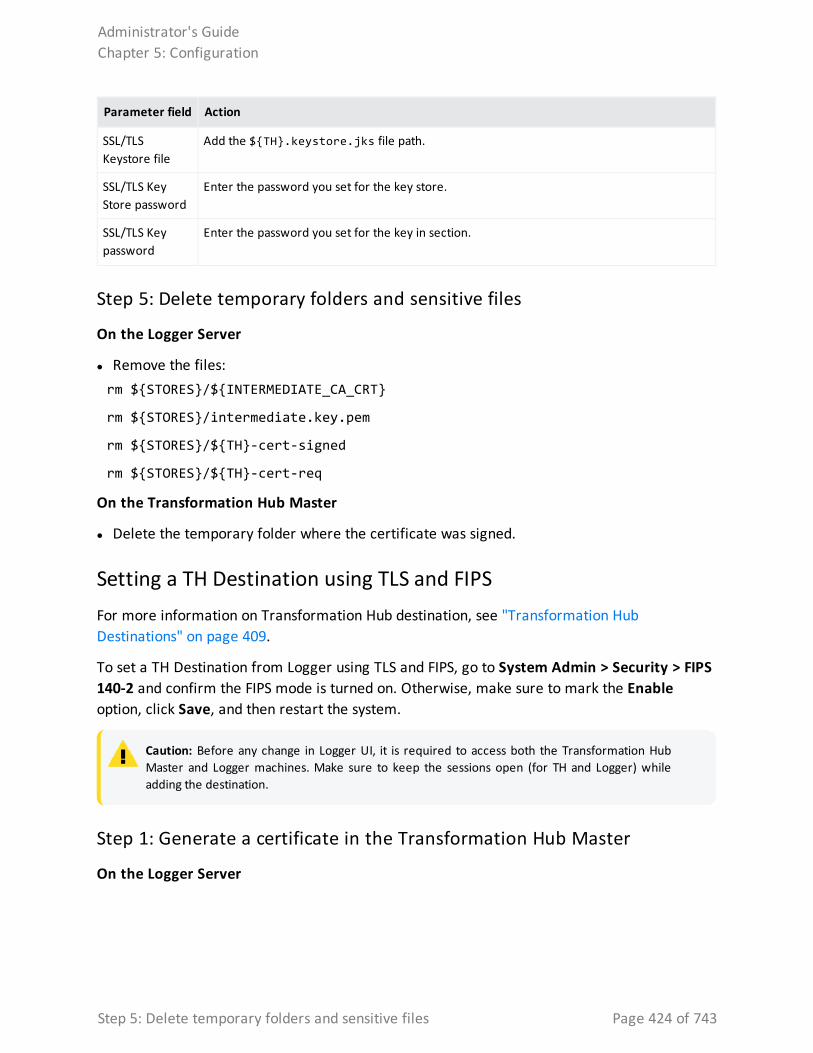
Parameter field Action
SSL/TLS Keystore file
Add the ${TH}.keystore.jks file path.
SSL/TLS Key Store password
Enter the password you set for the key store.
SSL/TLS Key password
Enter the password you set for the key in section.
Step 5: Delete temporary folders and sensitive files
On the Logger Server
l Remove the files: rm ${STORES}/${INTERMEDIATE_CA_CRT}
rm ${STORES}/intermediate.key.pem
rm ${STORES}/${TH}-cert-signed
rm ${STORES}/${TH}-cert-req
On the Transformation Hub Master
l Delete the temporary folder where the certificate was signed.
Setting a TH Destination using TLS and FIPSFor more information on Transformation Hub destination, see "Transformation Hub Destinations" on page 409.
To set a TH Destination from Logger using TLS and FIPS, go to System Admin > Security > FIPS 140-2 and confirm the FIPS mode is turned on. Otherwise, make sure to mark the Enable option, click Save, and then restart the system.
Caution: Before any change in Logger UI, it is required to access both the Transformation Hub Master and Logger machines. Make sure to keep the sessions open (for TH and Logger) while adding the destination.
Step 1: Generate a certificate in the Transformation Hub Master
On the Logger Server
Administrator's GuideChapter 5: Configuration
Step 5: Delete temporary folders and sensitive files Page 424 of 743
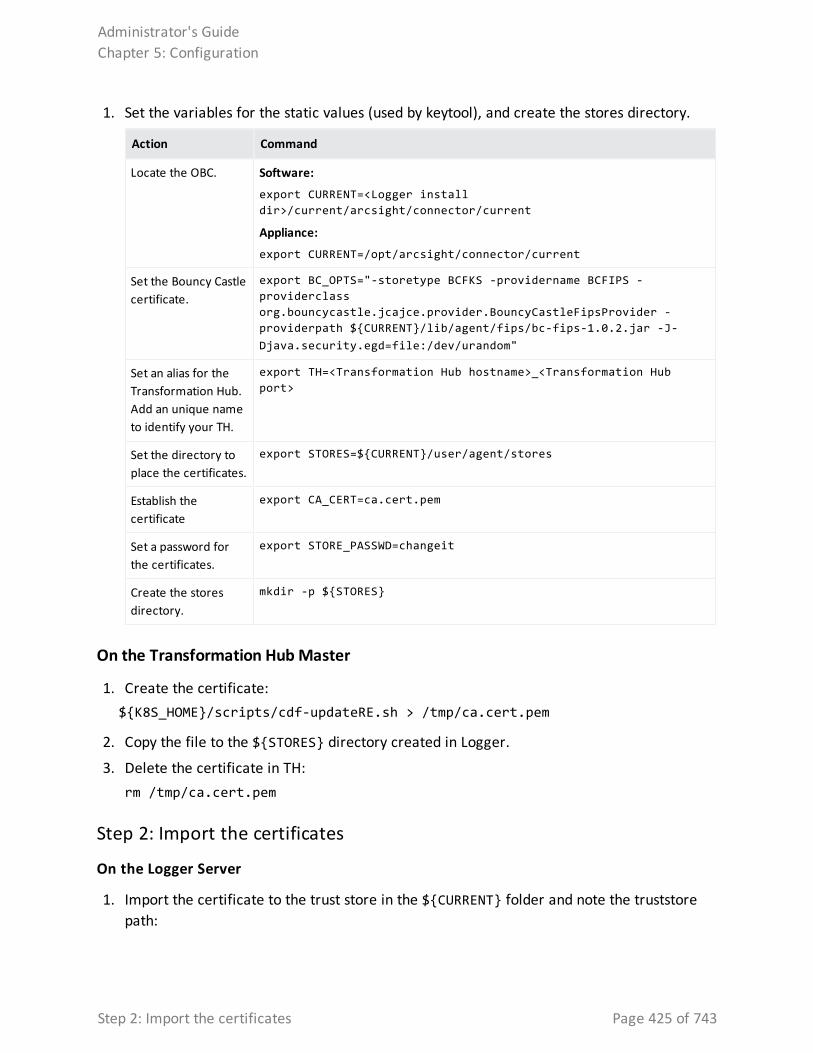
1. Set the variables for the static values (used by keytool), and create the stores directory.
Action Command
Locate the OBC. Software:
export CURRENT=<Logger install dir>/current/arcsight/connector/current
Appliance:
export CURRENT=/opt/arcsight/connector/current
Set the Bouncy Castle certificate.
export BC_OPTS="-storetype BCFKS -providername BCFIPS -providerclass org.bouncycastle.jcajce.provider.BouncyCastleFipsProvider -providerpath ${CURRENT}/lib/agent/fips/bc-fips-1.0.2.jar -J-Djava.security.egd=file:/dev/urandom"
Set an alias for the Transformation Hub. Add an unique name to identify your TH.
export TH=<Transformation Hub hostname>_<Transformation Hub port>
Set the directory to place the certificates.
export STORES=${CURRENT}/user/agent/stores
Establish the certificate
export CA_CERT=ca.cert.pem
Set a password for the certificates.
export STORE_PASSWD=changeit
Create the stores directory.
mkdir -p ${STORES}
On the Transformation Hub Master
1. Create the certificate:${K8S_HOME}/scripts/cdf-updateRE.sh > /tmp/ca.cert.pem
2. Copy the file to the ${STORES} directory created in Logger.
3. Delete the certificate in TH:rm /tmp/ca.cert.pem
Step 2: Import the certificates
On the Logger Server
1. Import the certificate to the trust store in the ${CURRENT} folder and note the truststore path:
Administrator's GuideChapter 5: Configuration
Step 2: Import the certificates Page 425 of 743
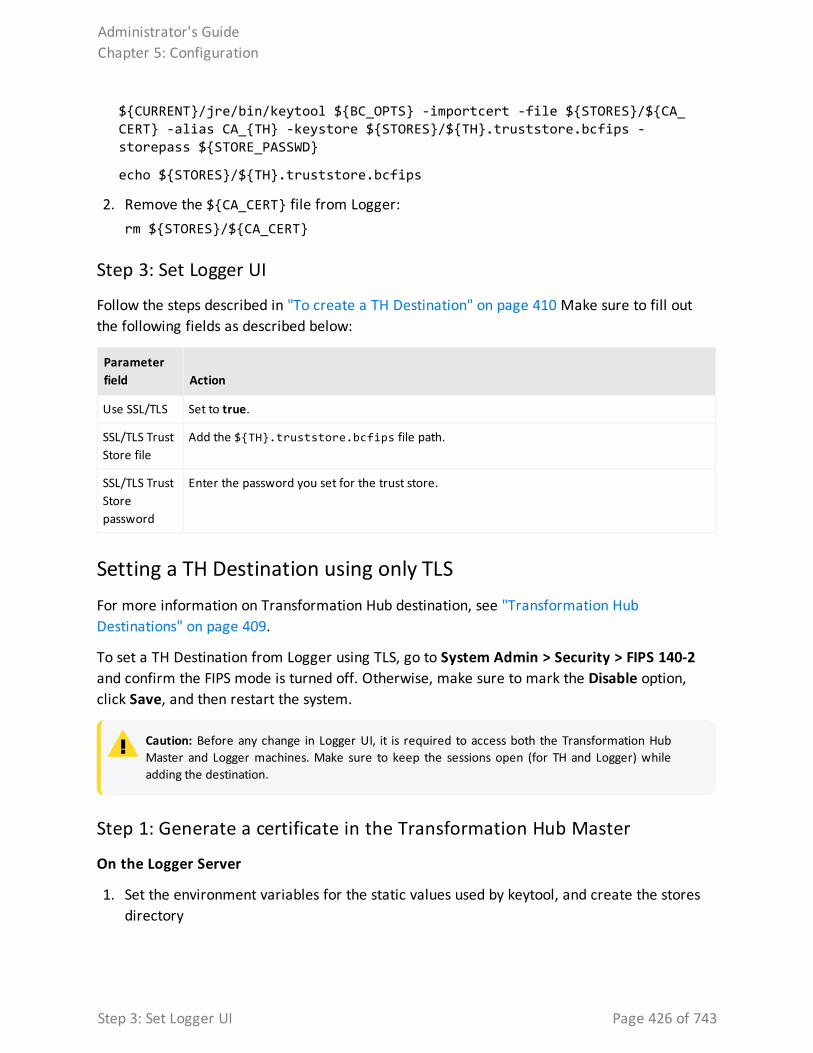
${CURRENT}/jre/bin/keytool ${BC_OPTS} -importcert -file ${STORES}/${CA_CERT} -alias CA_{TH} -keystore ${STORES}/${TH}.truststore.bcfips -storepass ${STORE_PASSWD}
echo ${STORES}/${TH}.truststore.bcfips
2. Remove the ${CA_CERT} file from Logger:rm ${STORES}/${CA_CERT}
Step 3: Set Logger UI
Follow the steps described in "To create a TH Destination" on page 410 Make sure to fill out the following fields as described below:
Parameter field Action
Use SSL/TLS Set to true.
SSL/TLS Trust Store file
Add the ${TH}.truststore.bcfips file path.
SSL/TLS Trust Store password
Enter the password you set for the trust store.
Setting a TH Destination using only TLS For more information on Transformation Hub destination, see "Transformation Hub Destinations" on page 409.
To set a TH Destination from Logger using TLS, go to System Admin > Security > FIPS 140-2 and confirm the FIPS mode is turned off. Otherwise, make sure to mark the Disable option, click Save, and then restart the system.
Caution: Before any change in Logger UI, it is required to access both the Transformation Hub Master and Logger machines. Make sure to keep the sessions open (for TH and Logger) while adding the destination.
Step 1: Generate a certificate in the Transformation Hub Master
On the Logger Server
1. Set the environment variables for the static values used by keytool, and create the stores directory
Administrator's GuideChapter 5: Configuration
Step 3: Set Logger UI Page 426 of 743
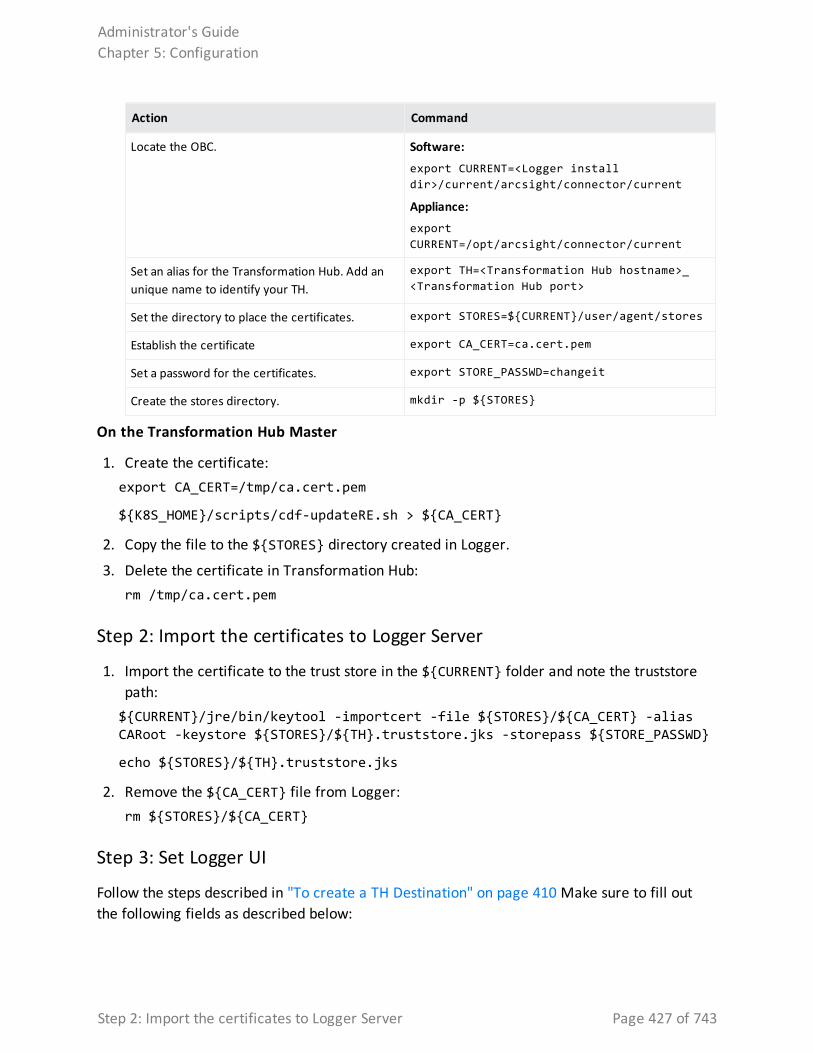
Action Command
Locate the OBC. Software:
export CURRENT=<Logger install dir>/current/arcsight/connector/current
Appliance:
export CURRENT=/opt/arcsight/connector/current
Set an alias for the Transformation Hub. Add an unique name to identify your TH.
export TH=<Transformation Hub hostname>_<Transformation Hub port>
Set the directory to place the certificates. export STORES=${CURRENT}/user/agent/stores
Establish the certificate export CA_CERT=ca.cert.pem
Set a password for the certificates. export STORE_PASSWD=changeit
Create the stores directory. mkdir -p ${STORES}
On the Transformation Hub Master
1. Create the certificate:export CA_CERT=/tmp/ca.cert.pem
${K8S_HOME}/scripts/cdf-updateRE.sh > ${CA_CERT}
2. Copy the file to the ${STORES} directory created in Logger.
3. Delete the certificate in Transformation Hub:rm /tmp/ca.cert.pem
Step 2: Import the certificates to Logger Server
1. Import the certificate to the trust store in the ${CURRENT} folder and note the truststore path:${CURRENT}/jre/bin/keytool -importcert -file ${STORES}/${CA_CERT} -alias CARoot -keystore ${STORES}/${TH}.truststore.jks -storepass ${STORE_PASSWD}
echo ${STORES}/${TH}.truststore.jks
2. Remove the ${CA_CERT} file from Logger:rm ${STORES}/${CA_CERT}
Step 3: Set Logger UI
Follow the steps described in "To create a TH Destination" on page 410 Make sure to fill out the following fields as described below:
Administrator's GuideChapter 5: Configuration
Step 2: Import the certificates to Logger Server Page 427 of 743
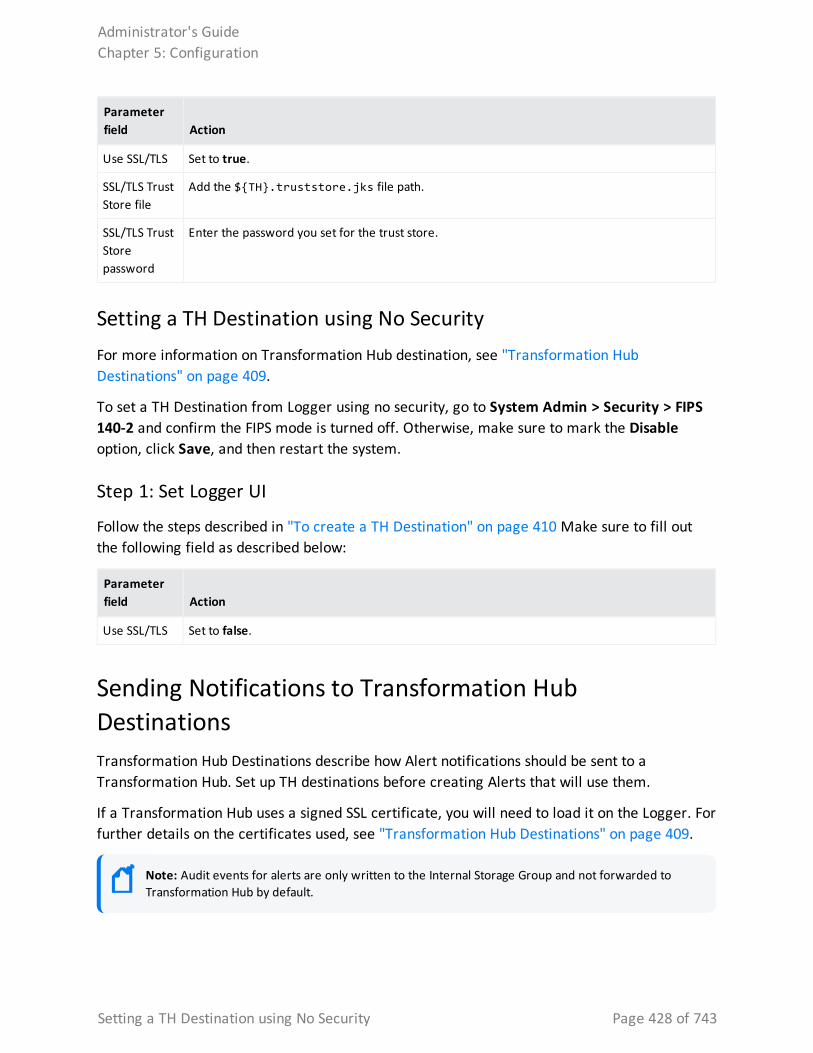
Parameter field Action
Use SSL/TLS Set to true.
SSL/TLS Trust Store file
Add the ${TH}.truststore.jks file path.
SSL/TLS Trust Store password
Enter the password you set for the trust store.
Setting a TH Destination using No SecurityFor more information on Transformation Hub destination, see "Transformation Hub Destinations" on page 409.
To set a TH Destination from Logger using no security, go to System Admin > Security > FIPS 140-2 and confirm the FIPS mode is turned off. Otherwise, make sure to mark the Disable option, click Save, and then restart the system.
Step 1: Set Logger UI
Follow the steps described in "To create a TH Destination" on page 410 Make sure to fill out the following field as described below:
Parameter field Action
Use SSL/TLS Set to false.
Sending Notifications to Transformation Hub DestinationsTransformation Hub Destinations describe how Alert notifications should be sent to a Transformation Hub. Set up TH destinations before creating Alerts that will use them.
If a Transformation Hub uses a signed SSL certificate, you will need to load it on the Logger. For further details on the certificates used, see "Transformation Hub Destinations" on page 409.
Note: Audit events for alerts are only written to the Internal Storage Group and not forwarded to Transformation Hub by default.
Administrator's GuideChapter 5: Configuration
Setting a TH Destination using No Security Page 428 of 743
To setup Logger to send alerts to a Transformation Hub, create a TH destination and then create an alert as described in "Transformation Hub Destinations" on page 409 and "Real Time Alerts" on page 394.
Sending Notifications to ESM DestinationsESM Destinations describe how Alert notifications should be sent to an ArcSight Manager. Set up ESM destinations before creating Alerts that will use them.
If an ArcSight Manager uses a signed SSL certificate, you will need to load it on the Logger.
Note: Audit events for alerts are only written to the Internal Storage Group and not forwarded to ESM by default. If you need to forward the audit events generated for alerts to ESM, please contact customer support for assistance.
To setup Logger to send alerts to an ArcSight Manager:
1. If the ArcSight Manager uses a certificate, copy the server SSL certificate file from an ArcSight Console or other component that is already communicating with the target Manager, and upload the certificate file to Logger, as described "Uploading a Certificate to the Logger:" below.
Note: You cannot import the cacerts file, which is a repository of trusted certificates, to the Logger. Instead, you need to import specific SSL certificate files.
2. Create an ESM Destination, as described in "To create an ESM Destination:" on page 407.
Certificates for ESM Destinations
Uploading a Certificate to the Logger:
Upload a valid server SSL (Secure Sockets Layer ) certificate file for the ArcSight Manager that you are establishing as a Logger destination for forwarding events and alerts.
Note: Certificate names might include "JDK" after upgrading to Logger 6.5 .
If your Manager does not have FIPS 140-2 mode enabled, you can obtain a certificate file for your Manager in these ways:
l From the Manager’s keystore
l From the ArcSight Console’s truststore
l From the truststore of one of the SmartConnectors that communicates with the Manager
Administrator's GuideChapter 5: Configuration
Sending Notifications to ESM Destinations Page 429 of 743
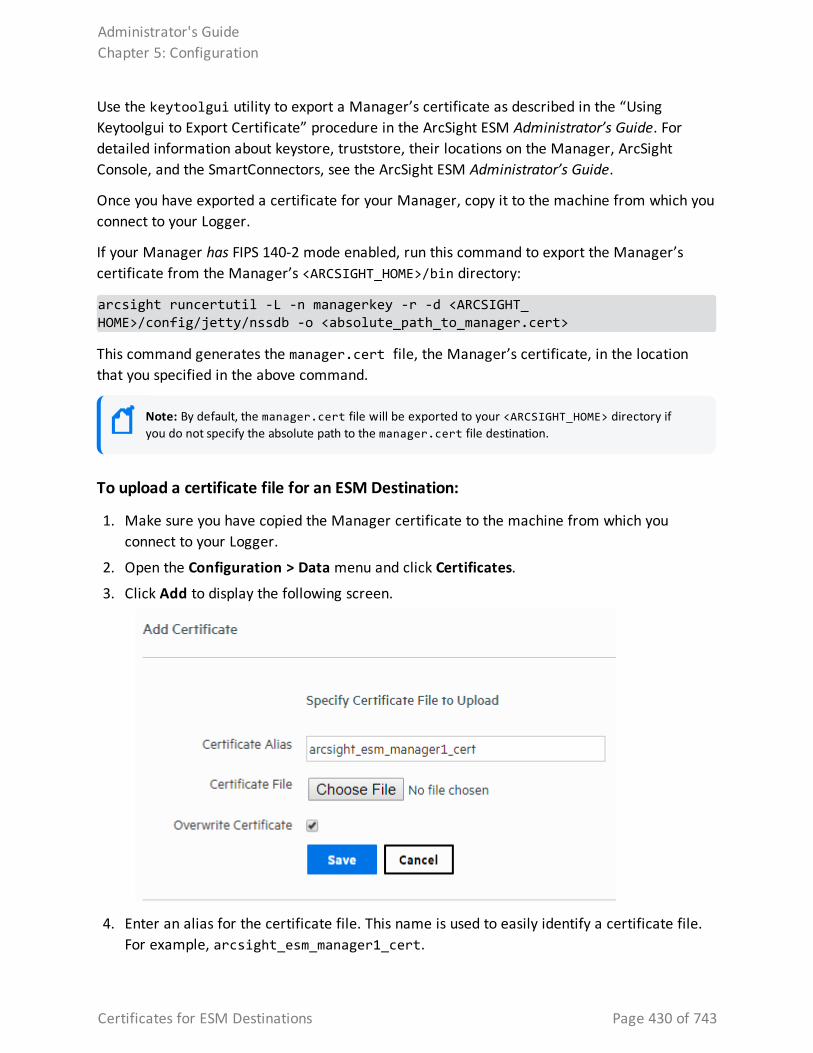
Use the keytoolgui utility to export a Manager’s certificate as described in the “Using Keytoolgui to Export Certificate” procedure in the ArcSight ESM Administrator’s Guide. For detailed information about keystore, truststore, their locations on the Manager, ArcSight Console, and the SmartConnectors, see the ArcSight ESM Administrator’s Guide.
Once you have exported a certificate for your Manager, copy it to the machine from which you connect to your Logger.
If your Manager has FIPS 140-2 mode enabled, run this command to export the Manager’s certificate from the Manager’s <ARCSIGHT_HOME>/bin directory:
arcsight runcertutil -L -n managerkey -r -d <ARCSIGHT_HOME>/config/jetty/nssdb -o <absolute_path_to_manager.cert>
This command generates the manager.cert file, the Manager’s certificate, in the location that you specified in the above command.
Note: By default, the manager.cert file will be exported to your <ARCSIGHT_HOME> directory if you do not specify the absolute path to the manager.cert file destination.
To upload a certificate file for an ESM Destination:
1. Make sure you have copied the Manager certificate to the machine from which you connect to your Logger.
2. Open the Configuration > Data menu and click Certificates.
3. Click Add to display the following screen.
4. Enter an alias for the certificate file. This name is used to easily identify a certificate file. For example, arcsight_esm_manager1_cert.
Administrator's GuideChapter 5: Configuration
Certificates for ESM Destinations Page 430 of 743
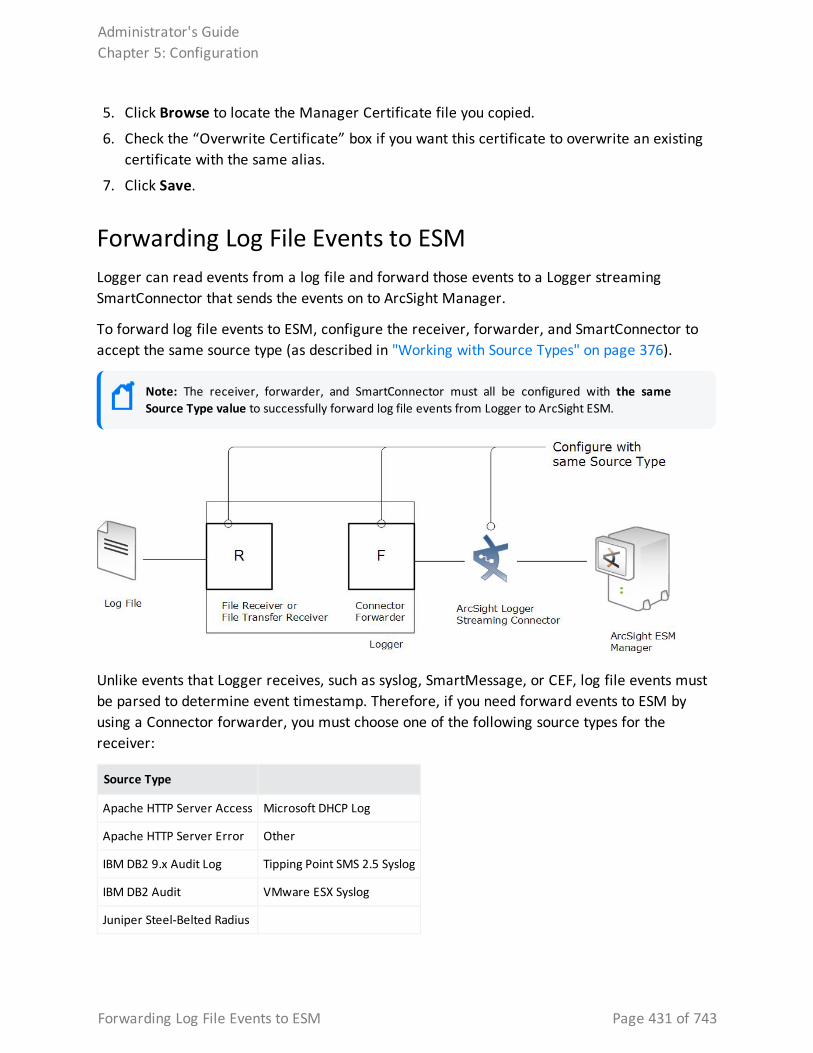
5. Click Browse to locate the Manager Certificate file you copied.
6. Check the “Overwrite Certificate” box if you want this certificate to overwrite an existing certificate with the same alias.
7. Click Save.
Forwarding Log File Events to ESMLogger can read events from a log file and forward those events to a Logger streaming SmartConnector that sends the events on to ArcSight Manager.
To forward log file events to ESM, configure the receiver, forwarder, and SmartConnector to accept the same source type (as described in "Working with Source Types" on page 376).
Note: The receiver, forwarder, and SmartConnector must all be configured with the same Source Type value to successfully forward log file events from Logger to ArcSight ESM.
Unlike events that Logger receives, such as syslog, SmartMessage, or CEF, log file events must be parsed to determine event timestamp. Therefore, if you need forward events to ESM by using a Connector forwarder, you must choose one of the following source types for the receiver:
Source Type
Apache HTTP Server Access Microsoft DHCP Log
Apache HTTP Server Error Other
IBM DB2 9.x Audit Log Tipping Point SMS 2.5 Syslog
IBM DB2 Audit VMware ESX Syslog
Juniper Steel-Belted Radius
Administrator's GuideChapter 5: Configuration
Forwarding Log File Events to ESM Page 431 of 743
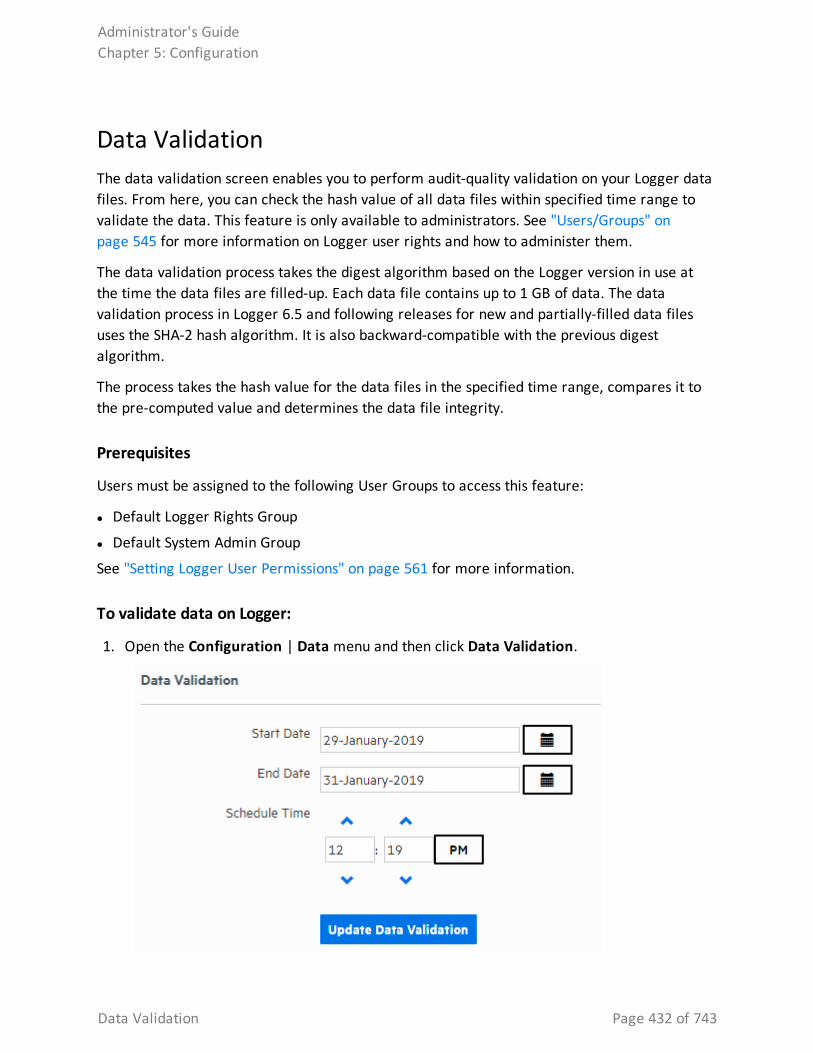
Data ValidationThe data validation screen enables you to perform audit-quality validation on your Logger data files. From here, you can check the hash value of all data files within specified time range to validate the data. This feature is only available to administrators. See "Users/Groups" on page 545 for more information on Logger user rights and how to administer them.
The data validation process takes the digest algorithm based on the Logger version in use at the time the data files are filled-up. Each data file contains up to 1 GB of data. The data validation process in Logger 6.5 and following releases for new and partially-filled data files uses the SHA-2 hash algorithm. It is also backward-compatible with the previous digest algorithm.
The process takes the hash value for the data files in the specified time range, compares it to the pre-computed value and determines the data file integrity.
Prerequisites
Users must be assigned to the following User Groups to access this feature:
l Default Logger Rights Group
l Default System Admin Group
See "Setting Logger User Permissions" on page 561 for more information.
To validate data on Logger:
1. Open the Configuration | Data menu and then click Data Validation.
Administrator's GuideChapter 5: Configuration
Data Validation Page 432 of 743
2. Specify the range of data you want to validate in the Start Date and End Date fields.
3. Specify the time you want to run the validation by using the up and down-arrows on the Schedule Time fields.
4. Check the Email Me Validation Results checkbox to have Logger send an email letting you know the validation result as soon as the validation process is complete. Logger sends this to the email address stored for the logged-in user.
Note: If the Email Me option is not available, Logger's SMTP server has not been configured. Logger's system administrator may be able to enable this feature. For more information, see "SMTP" on page 510.
5. Click Schedule Data Validation.
Note: You cannot cancel a Data Validation in progress. The data validation process can take a long time for large amounts of data. Therefore you should schedule the process to run during off-peak hours, and narrow down the time range to include only the data you are interested in.
Once the data validation process is complete, each data file in the specified time range is displayed along with its Validation Result. If the emailme checkbox was selected, an email with the subject, "Data Validation results from Logger <logger host name>" is sent to the email address stored for the logged-in user.
To view the validation results:
l Click the down-arrow in the Validation Result dropdown to select the type of result that you want to see. You can select All, Corrupt, Intact, or Hash Unavailable.
OR
l Click Export to download a spreadsheet containing the validation data.
The following table describes the possible validation results:
Displayed Value
Value in Exported File Description
Intact True The hashes match; the data is intact.
Corrupt False The hashes do not match; the data has been changed or become corrupt.
Hash unavailable
N/A The file has no hash; the data could not be validated. This is most likely because the data file is not yet full or the data file was created by an older version of Logger.
Administrator's GuideChapter 5: Configuration
Data Validation Page 433 of 743
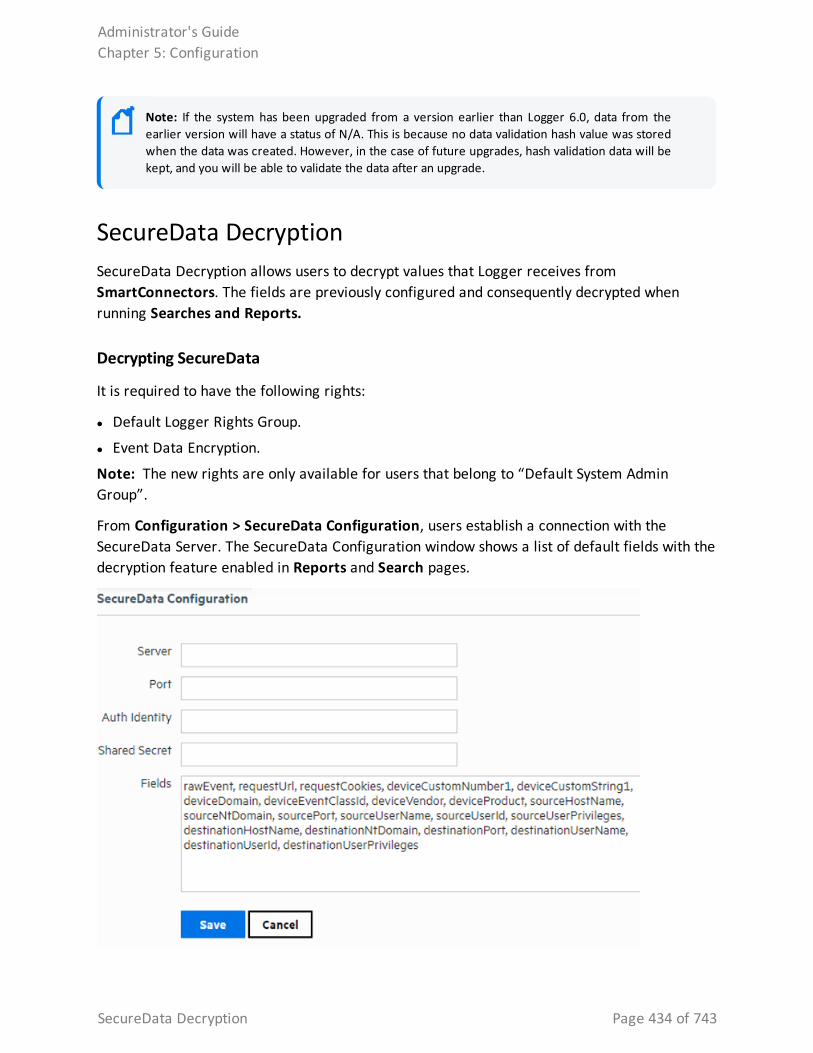
Note: If the system has been upgraded from a version earlier than Logger 6.0, data from the earlier version will have a status of N/A. This is because no data validation hash value was stored when the data was created. However, in the case of future upgrades, hash validation data will be kept, and you will be able to validate the data after an upgrade.
SecureData DecryptionSecureData Decryption allows users to decrypt values that Logger receives from SmartConnectors. The fields are previously configured and consequently decrypted when running Searches and Reports.
Decrypting SecureData
It is required to have the following rights:
l Default Logger Rights Group.
l Event Data Encryption.
Note: The new rights are only available for users that belong to “Default System Admin Group”.
From Configuration > SecureData Configuration, users establish a connection with the SecureData Server. The SecureData Configuration window shows a list of default fields with the decryption feature enabled in Reports and Search pages.
Administrator's GuideChapter 5: Configuration
SecureData Decryption Page 434 of 743
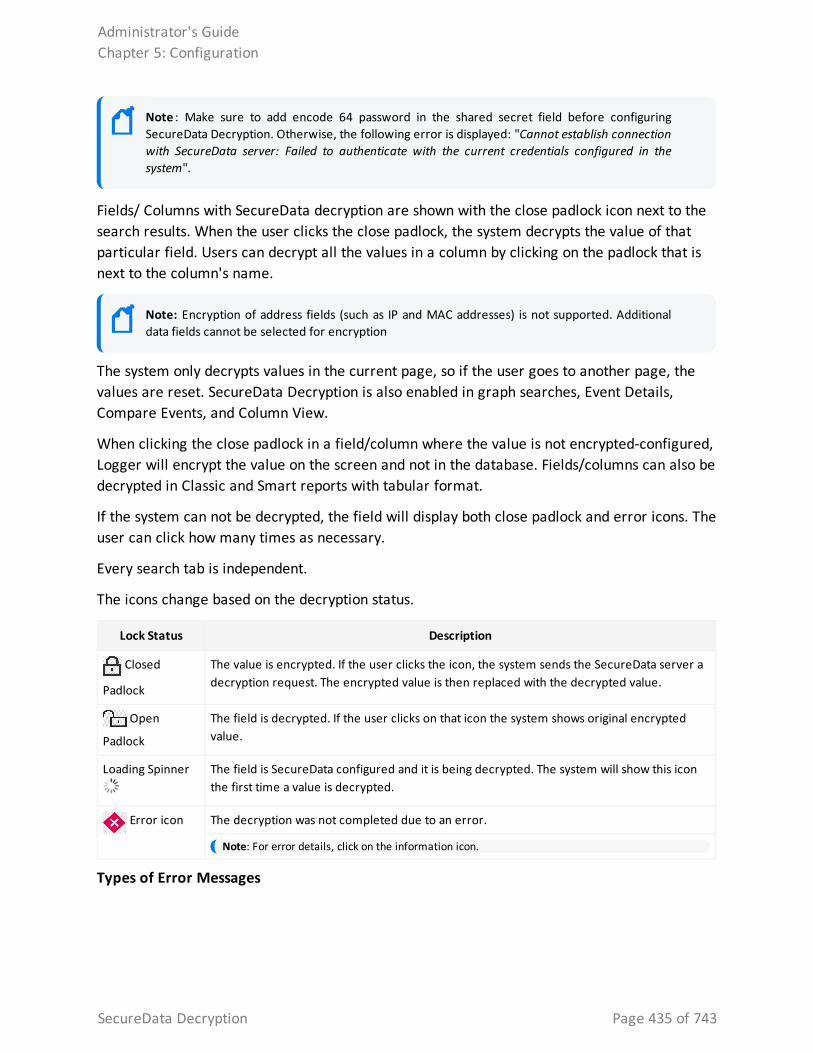
Note : Make sure to add encode 64 password in the shared secret field before configuring SecureData Decryption. Otherwise, the following error is displayed: "Cannot establish connection with SecureData server: Failed to authenticate with the current credentials configured in the system".
Fields/ Columns with SecureData decryption are shown with the close padlock icon next to the search results. When the user clicks the close padlock, the system decrypts the value of that particular field. Users can decrypt all the values in a column by clicking on the padlock that is next to the column's name.
Note: Encryption of address fields (such as IP and MAC addresses) is not supported. Additional data fields cannot be selected for encryption
The system only decrypts values in the current page, so if the user goes to another page, the values are reset. SecureData Decryption is also enabled in graph searches, Event Details, Compare Events, and Column View.
When clicking the close padlock in a field/column where the value is not encrypted-configured, Logger will encrypt the value on the screen and not in the database. Fields/columns can also be decrypted in Classic and Smart reports with tabular format.
If the system can not be decrypted, the field will display both close padlock and error icons. The user can click how many times as necessary.
Every search tab is independent.
The icons change based on the decryption status.
Lock Status Description
Closed
Padlock
The value is encrypted. If the user clicks the icon, the system sends the SecureData server a decryption request. The encrypted value is then replaced with the decrypted value.
Open
Padlock
The field is decrypted. If the user clicks on that icon the system shows original encrypted value.
Loading Spinner The field is SecureData configured and it is being decrypted. The system will show this icon the first time a value is decrypted.
Error icon The decryption was not completed due to an error.
Note: For error details, click on the information icon.
Types of Error Messages
Administrator's GuideChapter 5: Configuration
SecureData Decryption Page 435 of 743
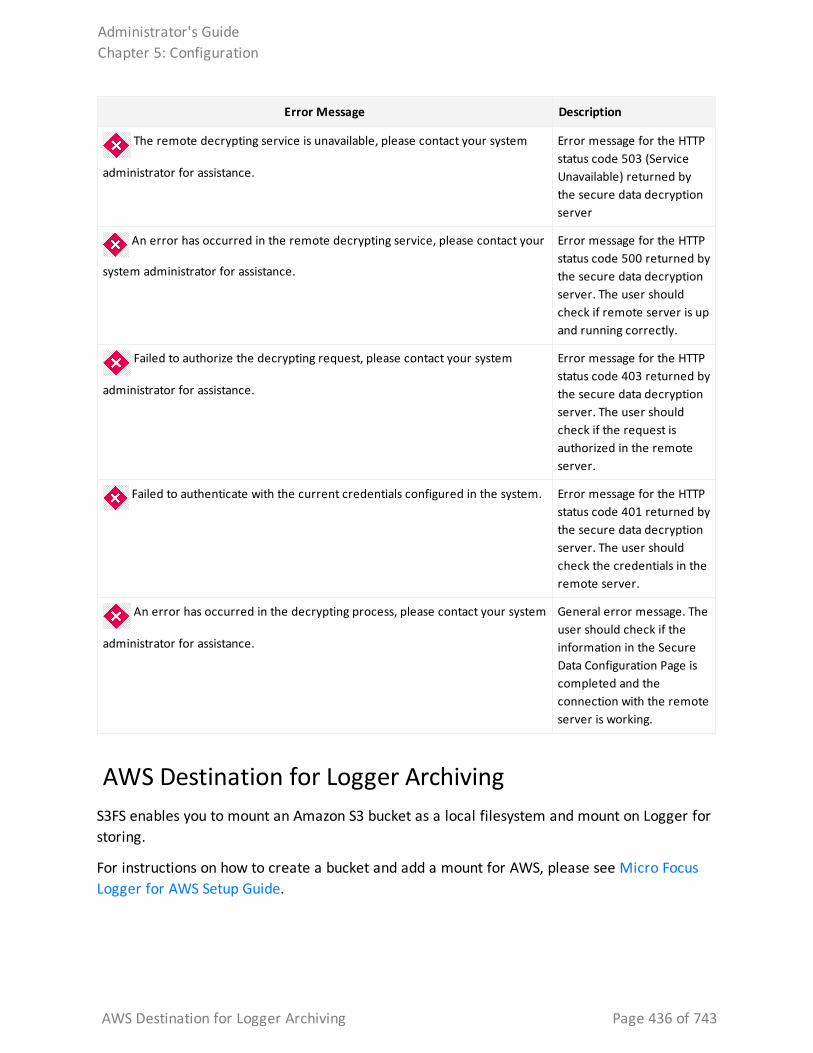
Error Message Description
The remote decrypting service is unavailable, please contact your system
administrator for assistance.
Error message for the HTTP status code 503 (Service Unavailable) returned by the secure data decryption server
An error has occurred in the remote decrypting service, please contact your
system administrator for assistance.
Error message for the HTTP status code 500 returned by the secure data decryption server. The user should check if remote server is up and running correctly.
Failed to authorize the decrypting request, please contact your system
administrator for assistance.
Error message for the HTTP status code 403 returned by the secure data decryption server. The user should check if the request is authorized in the remote server.
Failed to authenticate with the current credentials configured in the system. Error message for the HTTP status code 401 returned by the secure data decryption server. The user should check the credentials in the remote server.
An error has occurred in the decrypting process, please contact your system
administrator for assistance.
General error message. The user should check if the information in the Secure Data Configuration Page is completed and the connection with the remote server is working.
AWS Destination for Logger Archiving S3FS enables you to mount an Amazon S3 bucket as a local filesystem and mount on Logger for storing.
For instructions on how to create a bucket and add a mount for AWS, please see Micro Focus Logger for AWS Setup Guide.
Administrator's GuideChapter 5: Configuration
AWS Destination for Logger Archiving Page 436 of 743
For Logger Appliance, it is required to add a NFS mount based on the S3FS mount. For further details on how to add a remote file system, see " Managing a Remote File System" on page 526.
On Logger Software, see "Archive Storage Settings" on page 455 for instructions on how to set up an archive storage.
StorageThe options in the Configuration | Storage category enable you to manage how data is stored in Logger. Different storage groups support the implementation of multiple retention policies. Each group can have a different policy, and storage rules determine which storage group is used for events from specific device groups. For more information, refer to the Logger Installation Guide. A storage group’s size can be increased or decreased and the retention policy defined for it can be changed. Events are stored compressed. You cannot configure the compression level.
Storage GroupsStorage Groups support multiple retention policies by defining a maximum size (Allocated (GB) and number of days (Maximum Age) to retain events. Once events are older than the specified Maximum Age or there are more events than the storage group will hold (as specified by Allocated size), the oldest events are deleted at the next retention cycle. The retention process triggers periodically on Logger, therefore, events might not be deleted immediately when events get older than maximum age or the storage group size exceeds the allocated size.
Logger allows users to add up to 48 custom storage groups if there is enough storage volume available. Adding more storage groups in Logger is determined by the partition size and the storage volume available.
Micro Focus recommends that you create four additional storage groups in addition to the two that pre-exist, so that you have five storage groups available for event storage and one for Logger’s internal events.
To add additional storage groups, see "Adding Storage Groups" on page 469
These are the minimum requirements for Storage Groups:
Once a storage group is created, it cannot be deleted; however its size can be increased or decreased any time. If you are decreasing the size of the storage group and the new size is
Administrator's GuideChapter 5: Configuration
Storage Page 437 of 743
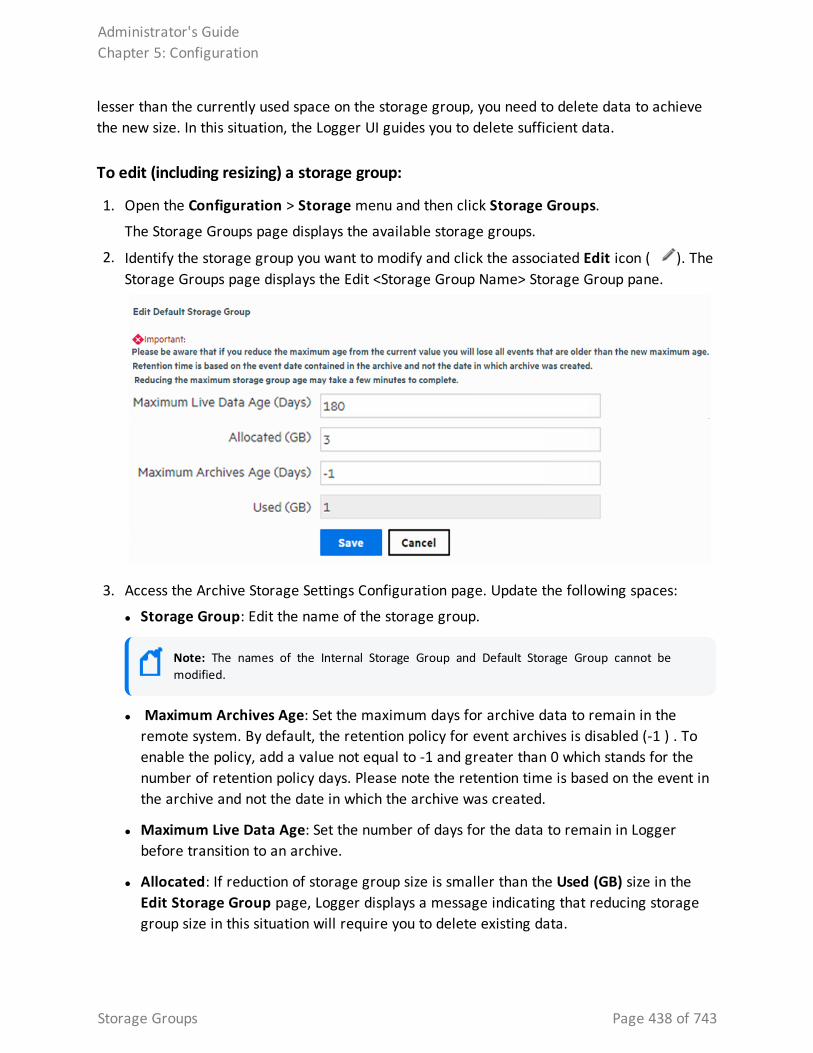
lesser than the currently used space on the storage group, you need to delete data to achieve the new size. In this situation, the Logger UI guides you to delete sufficient data.
To edit (including resizing) a storage group:
1. Open the Configuration > Storage menu and then click Storage Groups.
The Storage Groups page displays the available storage groups.
2. Identify the storage group you want to modify and click the associated Edit icon ( ). The Storage Groups page displays the Edit <Storage Group Name> Storage Group pane.
3. Access the Archive Storage Settings Configuration page. Update the following spaces:
l Storage Group: Edit the name of the storage group.
Note: The names of the Internal Storage Group and Default Storage Group cannot be modified.
l Maximum Archives Age: Set the maximum days for archive data to remain in the remote system. By default, the retention policy for event archives is disabled (-1 ) . To enable the policy, add a value not equal to -1 and greater than 0 which stands for the number of retention policy days. Please note the retention time is based on the event in the archive and not the date in which the archive was created.
l Maximum Live Data Age: Set the number of days for the data to remain in Logger before transition to an archive.
l Allocated: If reduction of storage group size is smaller than the Used (GB) size in the Edit Storage Group page, Logger displays a message indicating that reducing storage group size in this situation will require you to delete existing data.
Administrator's GuideChapter 5: Configuration
Storage Groups Page 438 of 743
If you choose to delete data to reduce the storage group size, follow these steps:
a. Set the Maximum Age value to the number indicated in the message. Doing so triggers the deletion of events.
b. Refresh the Edit Storage Group screen. When the Used (GB) value is less than or equal to the storage group size you want to set, go to the next step. Otherwise, keep refreshing the screen periodically.
c. Set the Allocated (GB) value to suit your needs.
d. If you wish, restore the Maximum Age setting (that you changed in Step a) to the original value.
If you choose not to delete data, go to the next step to exit the procedure.
Note: If there is sufficient space to reduce the storage group size, you can change it without modifying the Maximum Age value (to modify the retention policy to delete data).
4. Click Save to store the changes, or Cancel to quit.
Note: The used (GB) value, changes as data are deleted. This process can take some time, wait before proceeding to the next step.
Storage RulesStorage rules create a mapping between device groups and storage groups. Doing so enables you to store events from specific sources to a specific storage group. You can configure these storage groups with different retention policies, and thus retain event data based on the source of incoming events. For example, all events from firewall devices can be subject to a short retention period. To accomplish this, manually assign the firewall devices to a device group and then create a storage rule that maps the device group to a storage group with the desired short retention period.
Tip: Events that are not subject to any storage rule are sent to the Default Storage Group.
Before you add a storage rule, make sure that the storage group to which you want to store the events and the device group that contains the devices whose events you want to store exist. For information on how to create device groups, see "Device Groups" on page 352.
Logger allows you to create up to 40 storage rules. If you create additional rules, an error might be generated.
Administrator's GuideChapter 5: Configuration
Storage Rules Page 439 of 743
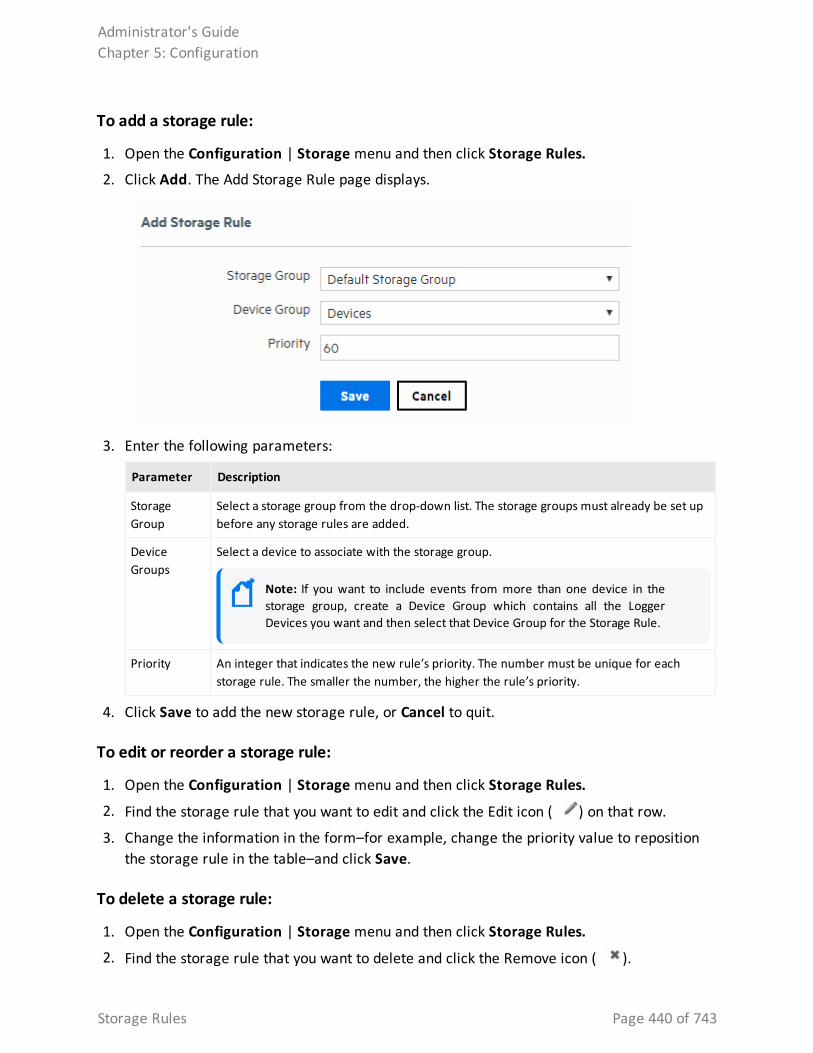
To add a storage rule:
1. Open the Configuration | Storage menu and then click Storage Rules.
2. Click Add. The Add Storage Rule page displays.
3. Enter the following parameters:
Parameter Description
Storage Group
Select a storage group from the drop-down list. The storage groups must already be set up before any storage rules are added.
Device Groups
Select a device to associate with the storage group.
Note: If you want to include events from more than one device in the storage group, create a Device Group which contains all the Logger Devices you want and then select that Device Group for the Storage Rule.
Priority An integer that indicates the new rule’s priority. The number must be unique for each storage rule. The smaller the number, the higher the rule’s priority.
4. Click Save to add the new storage rule, or Cancel to quit.
To edit or reorder a storage rule:
1. Open the Configuration | Storage menu and then click Storage Rules.
2. Find the storage rule that you want to edit and click the Edit icon ( ) on that row.
3. Change the information in the form–for example, change the priority value to reposition the storage rule in the table–and click Save.
To delete a storage rule:
1. Open the Configuration | Storage menu and then click Storage Rules.
2. Find the storage rule that you want to delete and click the Remove icon ( ).
Administrator's GuideChapter 5: Configuration
Storage Rules Page 440 of 743
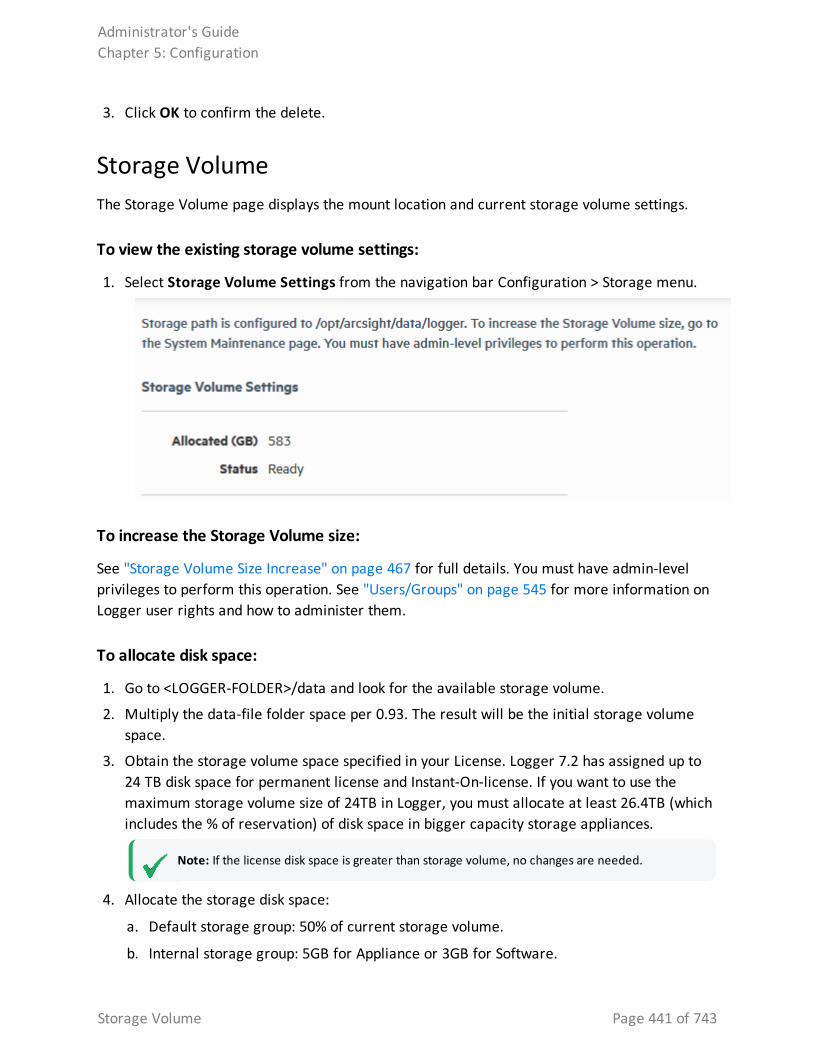
3. Click OK to confirm the delete.
Storage VolumeThe Storage Volume page displays the mount location and current storage volume settings.
To view the existing storage volume settings:
1. Select Storage Volume Settings from the navigation bar Configuration > Storage menu.
To increase the Storage Volume size:
See "Storage Volume Size Increase" on page 467 for full details. You must have admin-level privileges to perform this operation. See "Users/Groups" on page 545 for more information on Logger user rights and how to administer them.
To allocate disk space:
1. Go to <LOGGER-FOLDER>/data and look for the available storage volume.
2. Multiply the data-file folder space per 0.93. The result will be the initial storage volume space.
3. Obtain the storage volume space specified in your License. Logger 7.2 has assigned up to 24 TB disk space for permanent license and Instant-On-license. If you want to use the maximum storage volume size of 24TB in Logger, you must allocate at least 26.4TB (which includes the % of reservation) of disk space in bigger capacity storage appliances.
Note: If the license disk space is greater than storage volume, no changes are needed.
4. Allocate the storage disk space:
a. Default storage group: 50% of current storage volume.
b. Internal storage group: 5GB for Appliance or 3GB for Software.
Administrator's GuideChapter 5: Configuration
Storage Volume Page 441 of 743
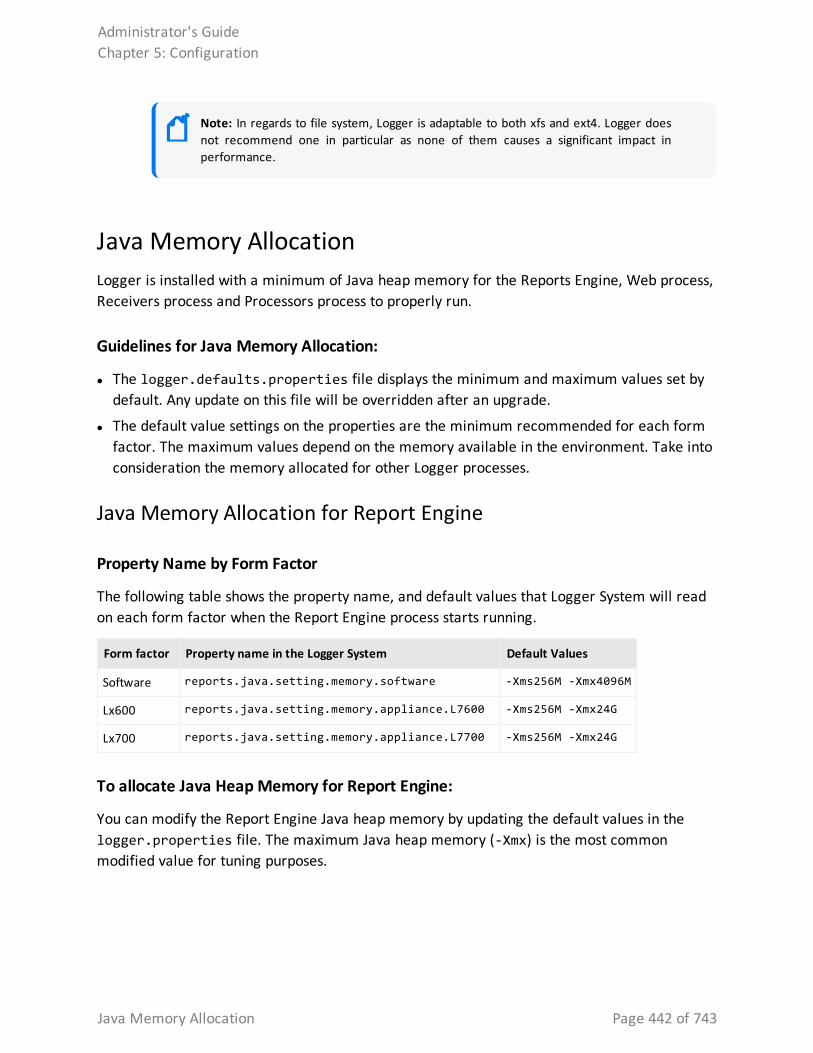
Note: In regards to file system, Logger is adaptable to both xfs and ext4. Logger does not recommend one in particular as none of them causes a significant impact in performance.
Java Memory Allocation Logger is installed with a minimum of Java heap memory for the Reports Engine, Web process, Receivers process and Processors process to properly run.
Guidelines for Java Memory Allocation:
l The logger.defaults.properties file displays the minimum and maximum values set by default. Any update on this file will be overridden after an upgrade.
l The default value settings on the properties are the minimum recommended for each form factor. The maximum values depend on the memory available in the environment. Take into consideration the memory allocated for other Logger processes.
Java Memory Allocation for Report Engine
Property Name by Form Factor
The following table shows the property name, and default values that Logger System will read on each form factor when the Report Engine process starts running.
Form factor Property name in the Logger System Default Values
Software reports.java.setting.memory.software -Xms256M -Xmx4096M
Lx600 reports.java.setting.memory.appliance.L7600 -Xms256M -Xmx24G
Lx700 reports.java.setting.memory.appliance.L7700 -Xms256M -Xmx24G
To allocate Java Heap Memory for Report Engine:
You can modify the Report Engine Java heap memory by updating the default values in the logger.properties file. The maximum Java heap memory (-Xmx) is the most common modified value for tuning purposes.
Administrator's GuideChapter 5: Configuration
Java Memory Allocation Page 442 of 743
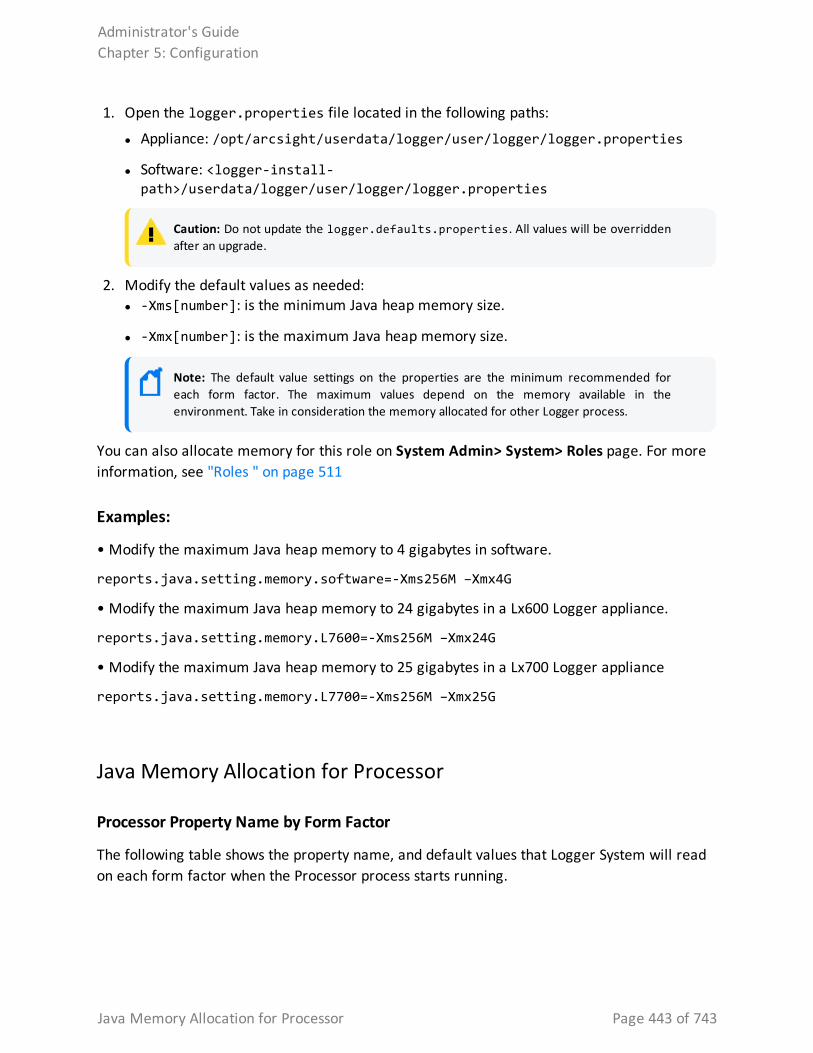
1. Open the logger.properties file located in the following paths:
l Appliance: /opt/arcsight/userdata/logger/user/logger/logger.properties
l Software: <logger-install-path>/userdata/logger/user/logger/logger.properties
Caution: Do not update the logger.defaults.properties. All values will be overridden after an upgrade.
2. Modify the default values as needed: l -Xms[number]: is the minimum Java heap memory size.
l -Xmx[number]: is the maximum Java heap memory size.
Note: The default value settings on the properties are the minimum recommended for each form factor. The maximum values depend on the memory available in the environment. Take in consideration the memory allocated for other Logger process.
You can also allocate memory for this role on System Admin> System> Roles page. For more information, see "Roles " on page 511
Examples:
• Modify the maximum Java heap memory to 4 gigabytes in software.
reports.java.setting.memory.software=-Xms256M –Xmx4G
• Modify the maximum Java heap memory to 24 gigabytes in a Lx600 Logger appliance.
reports.java.setting.memory.L7600=-Xms256M –Xmx24G
• Modify the maximum Java heap memory to 25 gigabytes in a Lx700 Logger appliance
reports.java.setting.memory.L7700=-Xms256M –Xmx25G
Java Memory Allocation for Processor
Processor Property Name by Form Factor
The following table shows the property name, and default values that Logger System will read on each form factor when the Processor process starts running.
Administrator's GuideChapter 5: Configuration
Java Memory Allocation for Processor Page 443 of 743
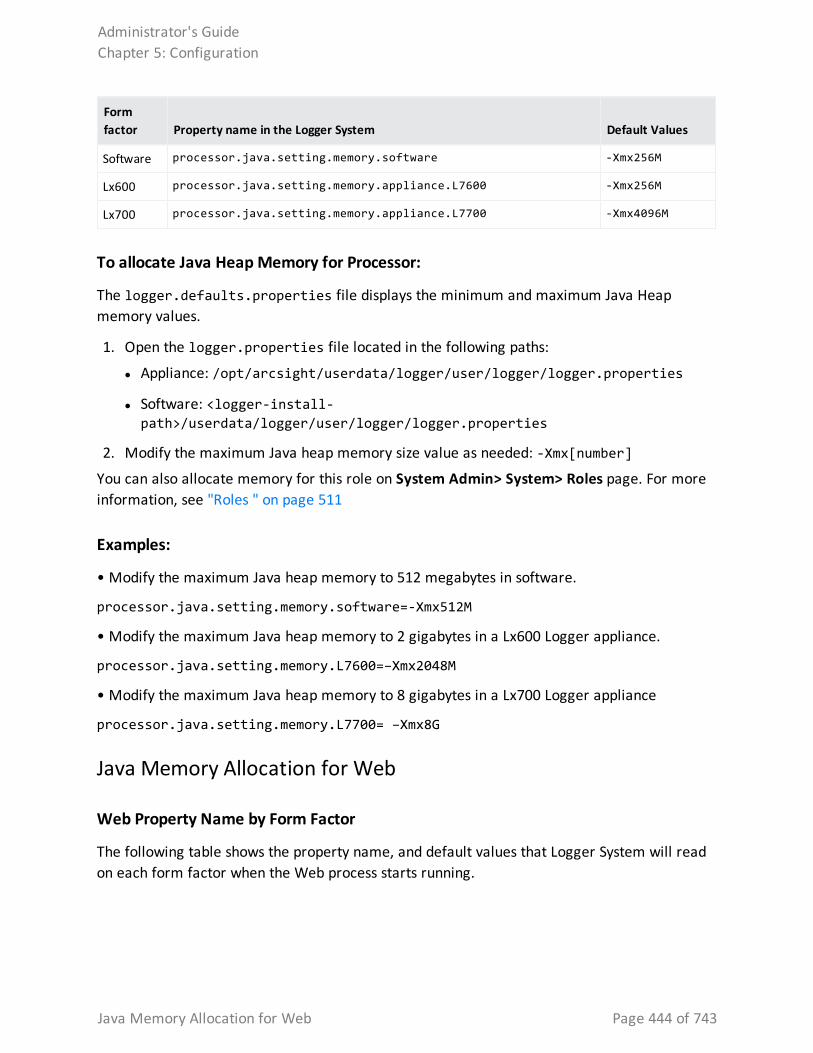
Form factor Property name in the Logger System Default Values
Software processor.java.setting.memory.software -Xmx256M
Lx600 processor.java.setting.memory.appliance.L7600 -Xmx256M
Lx700 processor.java.setting.memory.appliance.L7700 -Xmx4096M
To allocate Java Heap Memory for Processor:
The logger.defaults.properties file displays the minimum and maximum Java Heap memory values.
1. Open the logger.properties file located in the following paths:
l Appliance: /opt/arcsight/userdata/logger/user/logger/logger.properties
l Software: <logger-install-path>/userdata/logger/user/logger/logger.properties
2. Modify the maximum Java heap memory size value as needed: -Xmx[number]
You can also allocate memory for this role on System Admin> System> Roles page. For more information, see "Roles " on page 511
Examples:
• Modify the maximum Java heap memory to 512 megabytes in software.
processor.java.setting.memory.software=-Xmx512M
• Modify the maximum Java heap memory to 2 gigabytes in a Lx600 Logger appliance.
processor.java.setting.memory.L7600=–Xmx2048M
• Modify the maximum Java heap memory to 8 gigabytes in a Lx700 Logger appliance
processor.java.setting.memory.L7700= –Xmx8G
Java Memory Allocation for Web
Web Property Name by Form Factor
The following table shows the property name, and default values that Logger System will read on each form factor when the Web process starts running.
Administrator's GuideChapter 5: Configuration
Java Memory Allocation for Web Page 444 of 743
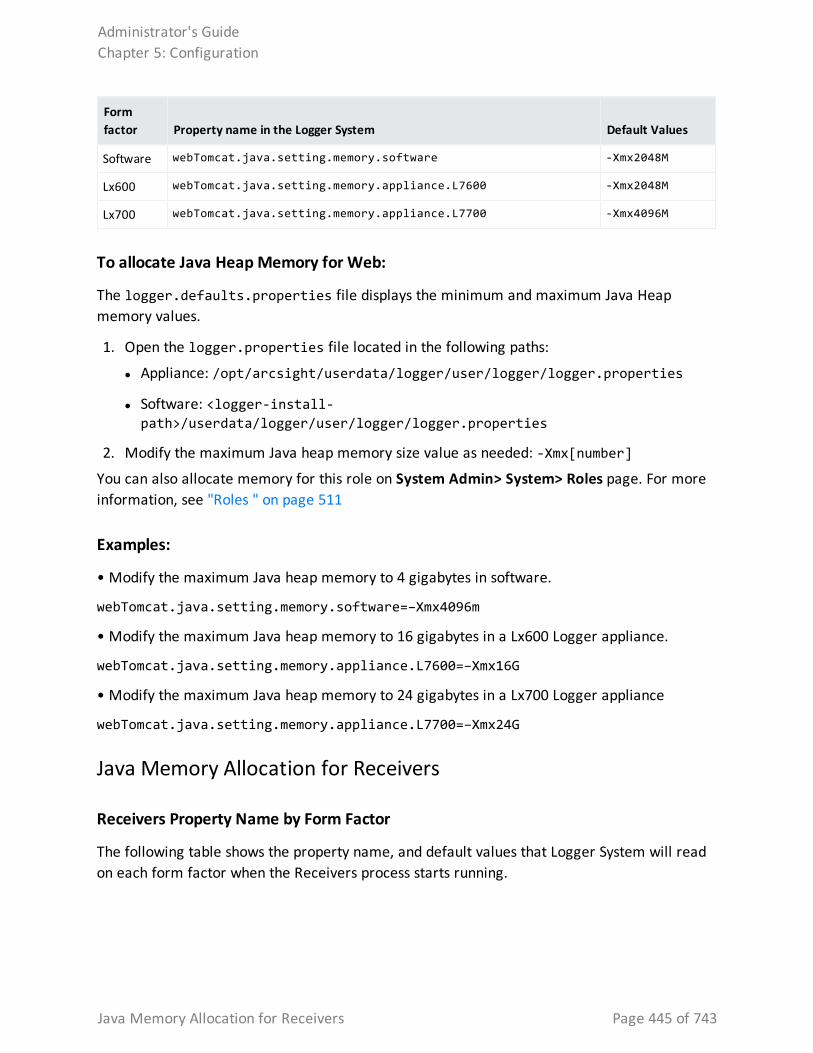
Form factor Property name in the Logger System Default Values
Software webTomcat.java.setting.memory.software -Xmx2048M
Lx600 webTomcat.java.setting.memory.appliance.L7600 -Xmx2048M
Lx700 webTomcat.java.setting.memory.appliance.L7700 -Xmx4096M
To allocate Java Heap Memory for Web:
The logger.defaults.properties file displays the minimum and maximum Java Heap memory values.
1. Open the logger.properties file located in the following paths:
l Appliance: /opt/arcsight/userdata/logger/user/logger/logger.properties
l Software: <logger-install-path>/userdata/logger/user/logger/logger.properties
2. Modify the maximum Java heap memory size value as needed: -Xmx[number]
You can also allocate memory for this role on System Admin> System> Roles page. For more information, see "Roles " on page 511
Examples:
• Modify the maximum Java heap memory to 4 gigabytes in software.
webTomcat.java.setting.memory.software=–Xmx4096m
• Modify the maximum Java heap memory to 16 gigabytes in a Lx600 Logger appliance.
webTomcat.java.setting.memory.appliance.L7600=–Xmx16G
• Modify the maximum Java heap memory to 24 gigabytes in a Lx700 Logger appliance
webTomcat.java.setting.memory.appliance.L7700=–Xmx24G
Java Memory Allocation for Receivers
Receivers Property Name by Form Factor
The following table shows the property name, and default values that Logger System will read on each form factor when the Receivers process starts running.
Administrator's GuideChapter 5: Configuration
Java Memory Allocation for Receivers Page 445 of 743
Form factor Property name in the Logger System Default Values
Software receiver.java.setting.memory.software -Xmx2048M
Lx600 receiver.java.setting.memory.appliance.L7600 -Xmx2048M
Lx700 receiver.java.setting.memory.appliance.L7700 -Xmx4096M
To allocate Java Heap Memory for Receivers:
The logger.defaults.properties file displays the minimum and maximum Java Heap memory values.
1. Open the logger.properties file located in the following paths:
l Appliance: /opt/arcsight/userdata/logger/user/logger/logger.properties
l Software: <logger-install-path>/userdata/logger/user/logger/logger.properties
2. Modify the maximum Java heap memory size value as needed: -Xmx[number]
You can also allocate memory for this role on System Admin> System> Roles page. For more information, see "Roles " on page 511
Examples:
• Modify the maximum Java heap memory to 512 megabytes in software.
receiver.java.setting.memory.software=–Xmx512m
• Modify the maximum Java heap memory to 5 gigabytes in a Lx600 Logger appliance.
receiver.java.setting.memory.appliance.L7600=–Xmx5G
• Modify the maximum Java heap memory to 8 gigabytes in a Lx700 Logger appliance
receiver.java.setting.memory.appliance.L7700=–Xmx8192m
Java Memory Allocation for Connector
Connector Property Name by Form Factor
The following table shows the property name, and default values that Logger System will read on each form factor when the Connector process starts running.
Administrator's GuideChapter 5: Configuration
Java Memory Allocation for Connector Page 446 of 743
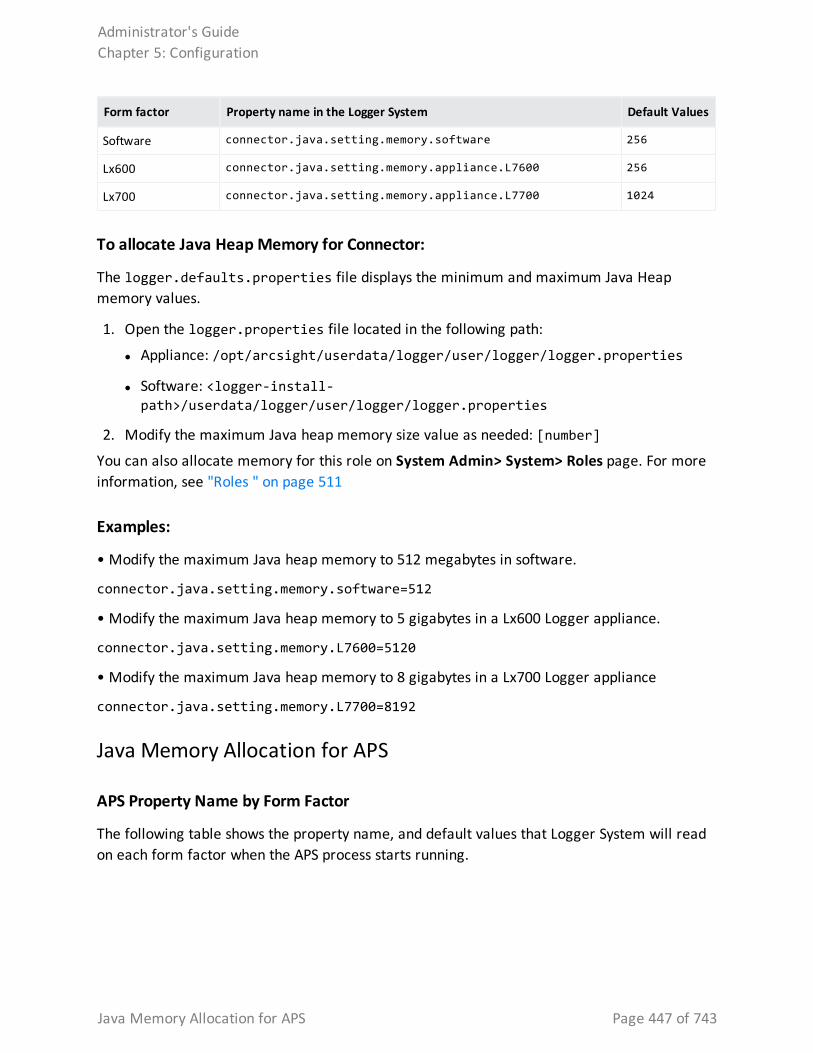
Form factor Property name in the Logger System Default Values
Software connector.java.setting.memory.software 256
Lx600 connector.java.setting.memory.appliance.L7600 256
Lx700 connector.java.setting.memory.appliance.L7700 1024
To allocate Java Heap Memory for Connector:
The logger.defaults.properties file displays the minimum and maximum Java Heap memory values.
1. Open the logger.properties file located in the following path:
l Appliance: /opt/arcsight/userdata/logger/user/logger/logger.properties
l Software: <logger-install-path>/userdata/logger/user/logger/logger.properties
2. Modify the maximum Java heap memory size value as needed: [number]
You can also allocate memory for this role on System Admin> System> Roles page. For more information, see "Roles " on page 511
Examples:
• Modify the maximum Java heap memory to 512 megabytes in software.
connector.java.setting.memory.software=512
• Modify the maximum Java heap memory to 5 gigabytes in a Lx600 Logger appliance.
connector.java.setting.memory.L7600=5120
• Modify the maximum Java heap memory to 8 gigabytes in a Lx700 Logger appliance
connector.java.setting.memory.L7700=8192
Java Memory Allocation for APS
APS Property Name by Form Factor
The following table shows the property name, and default values that Logger System will read on each form factor when the APS process starts running.
Administrator's GuideChapter 5: Configuration
Java Memory Allocation for APS Page 447 of 743
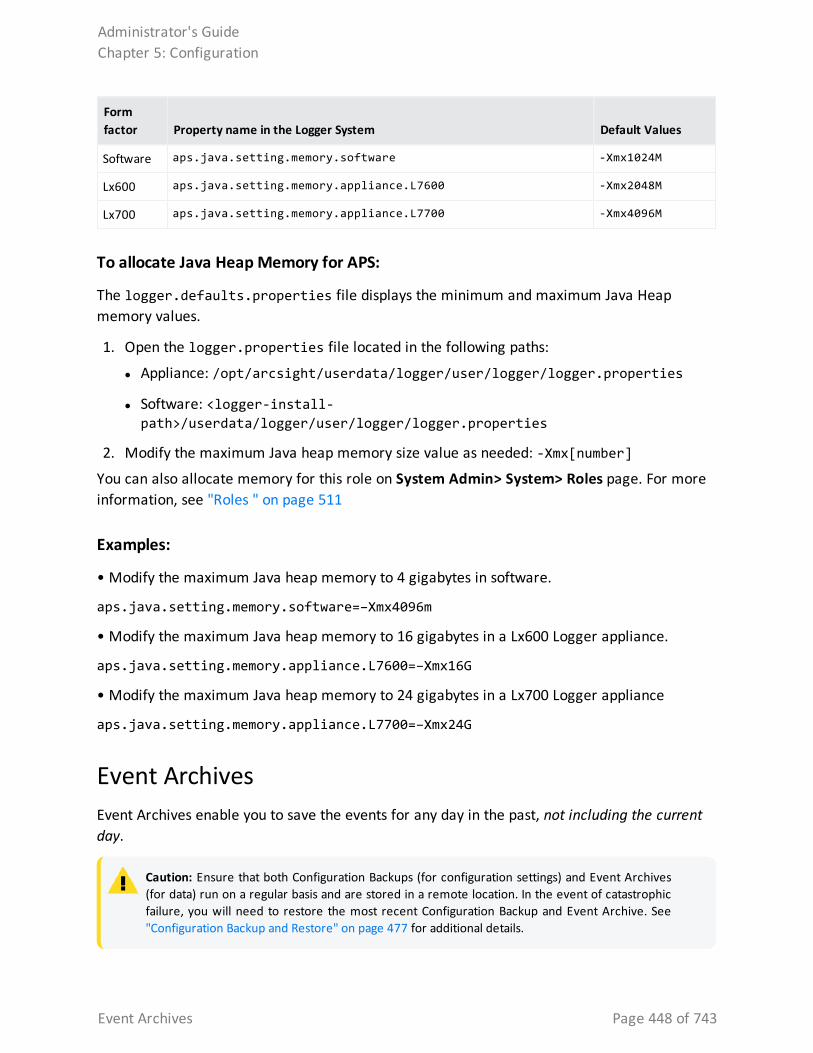
Form factor Property name in the Logger System Default Values
Software aps.java.setting.memory.software -Xmx1024M
Lx600 aps.java.setting.memory.appliance.L7600 -Xmx2048M
Lx700 aps.java.setting.memory.appliance.L7700 -Xmx4096M
To allocate Java Heap Memory for APS:
The logger.defaults.properties file displays the minimum and maximum Java Heap memory values.
1. Open the logger.properties file located in the following paths:
l Appliance: /opt/arcsight/userdata/logger/user/logger/logger.properties
l Software: <logger-install-path>/userdata/logger/user/logger/logger.properties
2. Modify the maximum Java heap memory size value as needed: -Xmx[number]
You can also allocate memory for this role on System Admin> System> Roles page. For more information, see "Roles " on page 511
Examples:
• Modify the maximum Java heap memory to 4 gigabytes in software.
aps.java.setting.memory.software=–Xmx4096m
• Modify the maximum Java heap memory to 16 gigabytes in a Lx600 Logger appliance.
aps.java.setting.memory.appliance.L7600=–Xmx16G
• Modify the maximum Java heap memory to 24 gigabytes in a Lx700 Logger appliance
aps.java.setting.memory.appliance.L7700=–Xmx24G
Event ArchivesEvent Archives enable you to save the events for any day in the past, not including the current day.
Caution: Ensure that both Configuration Backups (for configuration settings) and Event Archives (for data) run on a regular basis and are stored in a remote location. In the event of catastrophic failure, you will need to restore the most recent Configuration Backup and Event Archive. See "Configuration Backup and Restore" on page 477 for additional details.
Administrator's GuideChapter 5: Configuration
Event Archives Page 448 of 743
Logger uses the receipt time of an event to determine its archival day. For example, an event with a time stamp of 11:55:00 PM on December 7 is received at 12:01:00 AM on December 8 on the Logger. This event is archived in the archive file created for December 8th and not December 7th. When an archive operation occurs, one archive file per storage group is created at the location specified in Archive Storage Settings. Each archive file contains events from 12:00:00 AM to 11:59:59 PM for a single storage group of any given day. When you specify a range of dates, one archive file per storage group, for each specified day is created.
You can archive events in two ways: manually and scheduled. When archiving events manually, you specify the start and end dates of the event archive, and the storage groups that should be archived. This operation occurs once for the specified date range. When scheduling event archives, you specify the time at which the archive operation should occur every day and select the storage groups that should be included.
Note: You cannot set event archives to start at 1 AM for scheduled archives. This restriction is by design to account for the Daylight Savings Time (DST) changes.
When Logger starts archiving, it proceeds sequentially through the various storage groups, as listed on the Daily Task Settings page (for scheduled archives) or the Add Event Archives page (for manual archives).
Once the events have been archived, they are not deleted from the local storage until the events (and their related indexing information) age out due to the Maximum Live Data. These events continue to be included in search operations until they age out.
Once events that have been archived are deleted from Logger's local storage, they are not included in search operations. To include such events in search operations, you must load the archive in which those events exist back to the Logger. When an Event Archive is loaded, its events are included in searches, but the archive itself remains on the remote storage.
Nevertheless, archived events on a remote storage can also have a retention period. By editing the correspondent storage group, the user can determine a maximum age parameter. Maximum Archives Age (Days) prevents the user from taking additional steps to periodically clean the remote system space. Once the retention policy is triggered, the non compliant archives are removed from the database and filesystem with no option for rollback or backup. For information about setting archived events retention policy, see "Storage Groups" on page 437
The source type information (if associated with an event) is preserved when the event is archived. For information on creating and using source types, see "Source Types" on page 375
Administrator's GuideChapter 5: Configuration
Event Archives Page 449 of 743
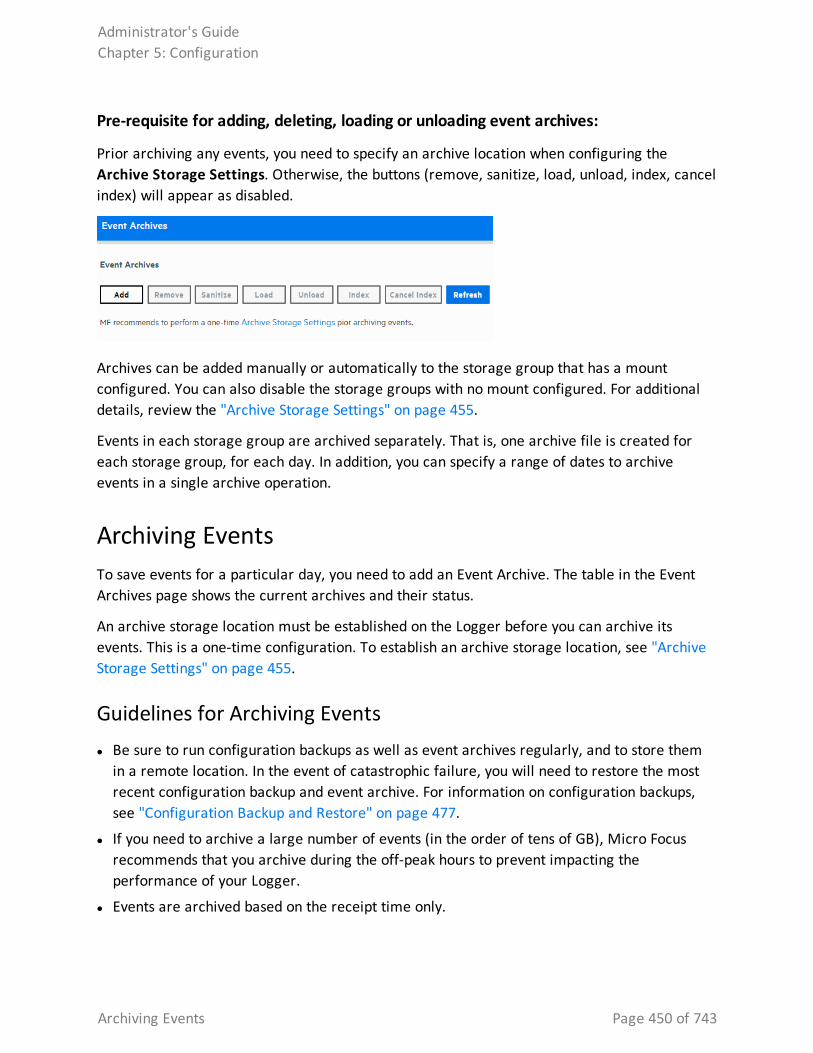
Pre-requisite for adding, deleting, loading or unloading event archives:
Prior archiving any events, you need to specify an archive location when configuring the Archive Storage Settings. Otherwise, the buttons (remove, sanitize, load, unload, index, cancel index) will appear as disabled.
Archives can be added manually or automatically to the storage group that has a mount configured. You can also disable the storage groups with no mount configured. For additional details, review the "Archive Storage Settings" on page 455.
Events in each storage group are archived separately. That is, one archive file is created for each storage group, for each day. In addition, you can specify a range of dates to archive events in a single archive operation.
Archiving EventsTo save events for a particular day, you need to add an Event Archive. The table in the Event Archives page shows the current archives and their status.
An archive storage location must be established on the Logger before you can archive its events. This is a one-time configuration. To establish an archive storage location, see "Archive Storage Settings" on page 455.
Guidelines for Archiving Events l Be sure to run configuration backups as well as event archives regularly, and to store them
in a remote location. In the event of catastrophic failure, you will need to restore the most recent configuration backup and event archive. For information on configuration backups, see "Configuration Backup and Restore" on page 477.
l If you need to archive a large number of events (in the order of tens of GB), Micro Focus recommends that you archive during the off-peak hours to prevent impacting the performance of your Logger.
l Events are archived based on the receipt time only.
Administrator's GuideChapter 5: Configuration
Archiving Events Page 450 of 743
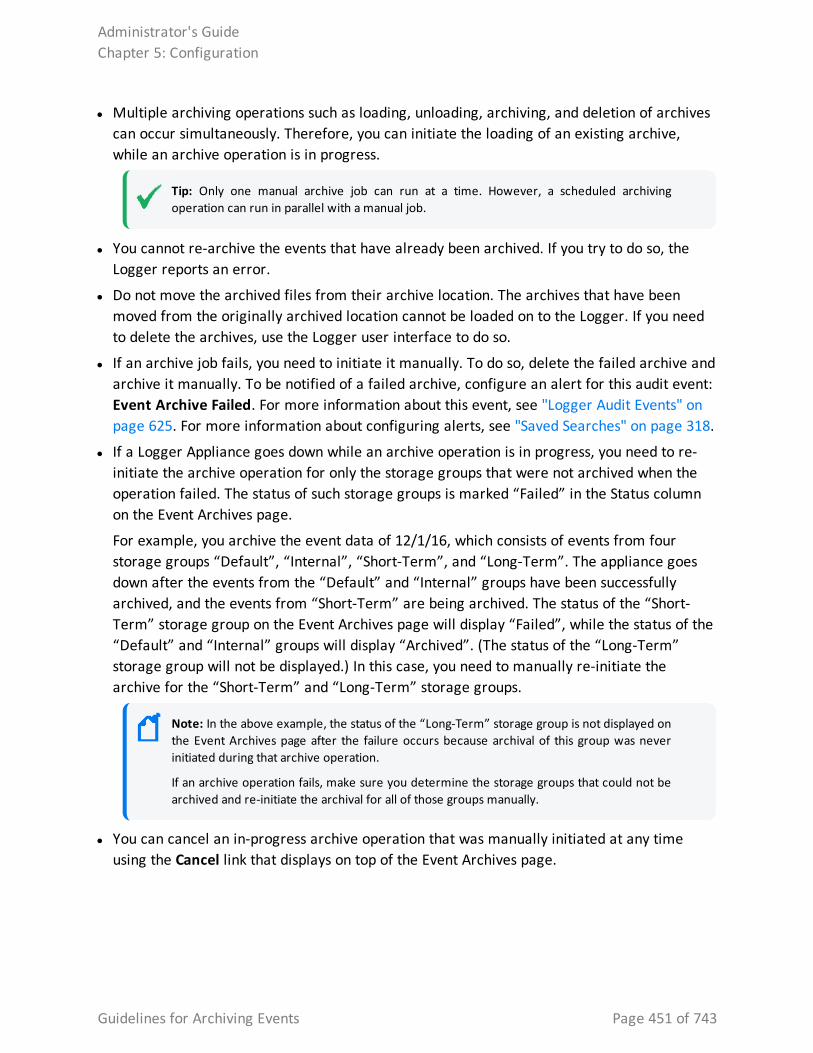
l Multiple archiving operations such as loading, unloading, archiving, and deletion of archives can occur simultaneously. Therefore, you can initiate the loading of an existing archive, while an archive operation is in progress.
Tip: Only one manual archive job can run at a time. However, a scheduled archiving operation can run in parallel with a manual job.
l You cannot re-archive the events that have already been archived. If you try to do so, the Logger reports an error.
l Do not move the archived files from their archive location. The archives that have been moved from the originally archived location cannot be loaded on to the Logger. If you need to delete the archives, use the Logger user interface to do so.
l If an archive job fails, you need to initiate it manually. To do so, delete the failed archive and archive it manually. To be notified of a failed archive, configure an alert for this audit event: Event Archive Failed. For more information about this event, see "Logger Audit Events" on page 625. For more information about configuring alerts, see "Saved Searches" on page 318.
l If a Logger Appliance goes down while an archive operation is in progress, you need to re-initiate the archive operation for only the storage groups that were not archived when the operation failed. The status of such storage groups is marked “Failed” in the Status column on the Event Archives page.
For example, you archive the event data of 12/1/16, which consists of events from four storage groups “Default”, “Internal”, “Short-Term”, and “Long-Term”. The appliance goes down after the events from the “Default” and “Internal” groups have been successfully archived, and the events from “Short-Term” are being archived. The status of the “Short-Term” storage group on the Event Archives page will display “Failed”, while the status of the “Default” and “Internal” groups will display “Archived”. (The status of the “Long-Term” storage group will not be displayed.) In this case, you need to manually re-initiate the archive for the “Short-Term” and “Long-Term” storage groups.
Note: In the above example, the status of the “Long-Term” storage group is not displayed on the Event Archives page after the failure occurs because archival of this group was never initiated during that archive operation.
If an archive operation fails, make sure you determine the storage groups that could not be archived and re-initiate the archival for all of those groups manually.
l You can cancel an in-progress archive operation that was manually initiated at any time using the Cancel link that displays on top of the Event Archives page.
Administrator's GuideChapter 5: Configuration
Guidelines for Archiving Events Page 451 of 743
To add an Event Archive:
1. Open the Configuration > Storage menu and then click Event Archives.
2. Click Add in the Event Archives page.
3. Enter a meaningful name in the Name field for the new Event Archive and specify the Start and End dates in the format m/dd/yy, where m is month number, dd is the day of the month (with a leading zero if necessary), and yy is the two-digit year number.
When the Start and End dates are different, one archive file per storage group, for each specified day is created. For example, if you specify the following Start and End dates:
Start Date: 8/12/19End Date: 8/13/19
Note: If a day's events have already been archived, you will not be able to archive them again. If you try to archive the same day's events twice, Logger will display a message with the already archived day or dates. If you are archiving a range of dates and some of them have been archived, the archive process will complete, skipping any days already archived, and a message will display the already archived dates.
And, if you configure both storage groups—Internal Event Storage Group and Default Storage Group, four archive files will be created as a result of this archive operation—two files per storage group for the specified two days.
The Event Archives table (under the Event Archives page) lists the archives by an alias in this format: <archive_name> [<yyyy-m-dd>] [<storage_group_name>].
4. Select the names of storage groups that need to be included in the archive.
5. Click Save to start archiving events, or Cancel to quit.
Note: You can cancel an in-progress archive operation at any time using the Cancel link that displays on top of the Event Archives page.
To remove an Event Archive:
1. Open the Configuration > Storage menu and then click Event Archives.
2. Select the event archives that you want to delete by clicking the checkbox in the left side.
3. Click Remove from the top of the screen to delete the selected archives.
4. Confirm the deletion by clicking OK, or click Cancel to retain the Event Archive.
To sanitize an Event Archive:
Logger performs a sanitize process to find and fix inconsistencies in your stored data.
Administrator's GuideChapter 5: Configuration
Guidelines for Archiving Events Page 452 of 743

1. From the Configuration > Storage menu, click Event Archives.
2. Select the event archives that you want to sanitize by clicking the checkbox on the left side of each row.
3. Click sanitize from the top of the screen. This button will be enabled only when the archive is unloaded.
4. Confirm the action by clicking OK, or click Cancel to dismiss the request.
The sanitize process can take several minutes depending on the size of the archive. For instance, a 26 GB archive with 2 non-consistent metadata can take up to 10 minutes to sanitize. Check the sanitize status for more information:
l None: This is the default value for new archives created or during upgrades.
l Pending: Process has been interrupted or not started.
l Done: Process is successfully completed.
l Failed: Process has failed.
Once the process is completed, Logger displays the logger_archive_sanitization.log which allows you to review the deleted chunks, CSV generated, data files and metadata analyzed, and beginning and end time of execution.
Loading and Unloading ArchivesArchived events must be loaded back on Logger before they can be included in a search operation. When an Event Archive is loaded, its events are included in searches, but the archive itself remains on the remote storage. When an event archive is unloaded, it is available for loading, but its events are not included in searches. You can unload a loaded archive if you no longer need to include it in your search operations.
Note: Even though an archive has been created, you cannot load an archive for data that is still in current storage. That is, loading the archive will fail if that data has not already passed it's retention date and been aged out of current storage.
To load or unload an Event Archive:
1. Open the Configuration > Storage menu and then click Event Archives.
2. Click the checkboxes in the left-most column to select the event archives that you want to load or unload.
3. Click Load or Unload from the top of the screen to load or unload the selected archives.
Administrator's GuideChapter 5: Configuration
Loading and Unloading Archives Page 453 of 743
Note: If you index an archive while the archive is loaded, the archive will be automatically reloaded after the index is created.
Indexing Archived EventsArchived events created since Logger 6.5 are automatically indexed. Although Index data is not stored when the events are archived in Logger 6.41 or older versions, you can build an index for existing archives. After creation, the index will be located in the same root of current archive and in the newly created subdirectory name with “Index” postfix.
When indexing archives that are already loaded, users must unload the archive and load it again.
Tip: The tmp directory and the archive directory must both be writable and have enough space for the index to be created.
To index an Event Archive in Logger 6.41 or older versions
1. Open the Configuration > Storage menu and then click Event Archives.
2. Click the checkboxes in the left-most column to select the event archives that you want to index.
Caution: Archives take a long time to index and searches may be slower while indexing is taking place. Only index the archives you need.
3. Click Index from the top of the screen to index the selected archives.
Tip: You cannot cancel the indexing once it is in progress, but you can cancel indexing of archives in the pending queue. To cancel indexing, click the checkboxes in the left-most column and select event archives with the Indexing Status of Pending. Then click Cancel Index.
Note: If indexing fails, check the log for the cause of failure. After you fix the problem, try indexing again.
Daily Archive SettingsYou can schedule a daily event archive and specify what hour of the day it should run. Scheduled event archives that have finished running appear on the archive list on the Event Archives page. Only one scheduled event archive can run at a time; however, it can run in parallel with a manually scheduled archive.
Administrator's GuideChapter 5: Configuration
Indexing Archived Events Page 454 of 743
Make sure you are familiar with the information in "Time/NTP" on page 508 before you schedule an event archive.
To schedule a daily event archive:
1. Open the Configuration | Storage menu and then click Daily Archive Settings.
2. Select a time from the Time For Daily Archive to Start list.
Tip: Scheduled archives must start on the hour. Midnight and 1:00 AM are not on the list to allow your Logger to receive all of the previous day’s events.
3. Select the storage groups whose events should be included in the scheduled archive.
4. Click Save to schedule daily event archive, or click on another page to cancel.
Archive Storage SettingsOn the Logger Appliance, Event Archives are saved to a specific NFS or CIFS mount point. For the Software Logger, event archives are saved to the specified directory, which can be a path to a local directory or to a mount point on the machine on which the Software Logger is installed. To establish a mount point, see the specific operating system documentation.
To perform Archive Storage Setting setup:
If you are using the Logger Appliance, create the NFS or CIFS mount point. (See "Storage" on page 525 and "Remote File Systems" on page 526.) If you are using Software Logger and intend to use an NFS or CIFS mount point, ensure that the external storage point is mounted on the machine on which Logger is installed. See your system’s operating system documentation for more information.
1. Go to the Configuration > Storage > Archive Storage Settings
2. Specify a mount location and an archive path for each storage group. You can specify a different path for each storage group, thus enabling the Logger to archive events to a different location for each storage group.
You can configure settings for all storage groups on the Archive Storage Settings page even if you do not intend to archive all of them. Logger enables you to only save the storage group paths that have a mount configured and ignore the empty fields.
l On Logger Appliances: Select (from the drop-down list) a path in the Archive Path field appended to the path specified in the mount location. This location can be an NFS mount, CIFS mount, which is configured using the Logger user interface.
Administrator's GuideChapter 5: Configuration
Archive Storage Settings Page 455 of 743
For example, if the mount location you selected refers to the path /opt/ARCHIVES, and the archive directory in that location is archivedir, then specify archivedir in the Archive Path field.
l On Logger Software: Enter a complete path where the archive file will be written in the Archive Path field. This path could be a local directory or a mount point already established on the Logger host.
Tip: On Software Loggers, the Mount Location field does not exist.
3. Click Save.
If all fields are blank or without any changes, Logger will display a "No changes have been made" message. Otherwise, Logger will acknowledge the configuration showing "Archive Storage Settings saved successfully" message.
Scheduled TasksScheduled tasks are jobs that are programmed to happen automatically. Job types include Configuration Backup, File Transfer, Event Archive, and Saved Search. The options in the Configuration | Scheduled Tasks category enable you to manage the scheduled tasks.
Make sure you are familiar with the information in "Time/NTP" on page 508 that can impact a scheduled task.
Scheduled TasksScheduled Tasks can be created for the following activities:
l Saved Searches (See " Scheduled Searches/Alerts" on page 320.)
l File Receivers and File Transfer Receivers (See "Receivers" on page 353.)
l Event Archives (See "Archiving Events" on page 450.)
l Configuration Backups (See "Configuration Backup and Restore" on page 477.)
l Lookup File Updates (See "Lookup Files" on page 343.)
The Scheduled Tasks page displays the list of scheduled jobs. Some tasks can be managed from this screen. The available management options, which may include edit, enable, disable and delete, are displayed at the right end of the column.
A drop-down list at the top of the page lets you display all scheduled tasks (All), or only tasks of a specific type.
Administrator's GuideChapter 5: Configuration
Scheduled Tasks Page 456 of 743
To view Scheduled Tasks:
1. From the Configuration menu under Scheduled Tasks, click Scheduled Tasks.
2. Filter the list by selecting a specific type of Scheduled Task from the drop-down list, or select All.
3. Click Refresh to update the list of tasks.
To delete a Scheduled Task:
1. From the Configuration menu under Scheduled Tasks, click Scheduled Tasks.
2. Locate the Scheduled Task that you want to delete and click the Remove icon ( ) on that row.
3. Confirm the deletion by clicking OK, or click Cancel to retain the Scheduled Task.
Currently Running TasksThe Currently Running Tasks page displays the Scheduled Tasks that are running right now. The table shows task name, type, and the date and time that the task started.
Prerequisites
Users must be assigned to the following User Groups to access this feature:
l Default Logger Rights Group
l Default System Admin Group
See "Setting Logger User Permissions" on page 561 for more information.
To view tasks that are running now:
1. From the Configuration menu under Scheduled Tasks, click Currently Running Tasks.
2. Click Refresh to update the list of tasks.
3. Filter the list by selecting a specific type of Scheduled Task from the drop-down list, or select All.
Finished TasksThe Finished Tasks page displays the Scheduled Tasks that have finished running. The Finished Tasks page acts like a log of all Scheduled Task runs, with the most recently finished tasks on top.
Administrator's GuideChapter 5: Configuration
Currently Running Tasks Page 457 of 743
To View Finished Tasks:
From the Configuration menu under Scheduled Tasks, click Finished Tasks.
Filtering the Task ListYou can filter the task list by time or duration, job type, task result, or by text search. By default, the task list displays the finished tasks for the last 24 hours, displaying 20 entries per page.
Tip: Click Filter at any time to update the Finished Tasks list.
Filtering finished tasks by time
1. From the first filter menu, select one of the following options, or leave the default:
l Last 24 hours (the default) — Returns completed tasks for the previous 24 hours.
l Last 7 Days — Returns completed tasks for the previous seven days.
l 30 days — Returns completed tasks for the previous 30 days.
l Custom Time Range — Returns completed tasks for a custom date and time range. See "Filtering finished tasks by a specific date and time" below.
2. Optionally, click Filter to see your results, or add more filtering criteria.
Filtering finished tasks by a specific date and time
When you select Custom Time Range, the Date and Time fields display.
1. Enter a date in the Start Date field. You can enter the dates in mm/dd/yyyy format, or click the calendar icon ( ) to select a date. Do the same for the End Date field.
2. Optionally, enter a start and end time from the Time menus. You can enter the times in hh:mm:ss format, or accept the default start time of 00:00:00 and end time of 23:59:59.
3. Optionally, click Filter to see your results, or add more filtering criteria.
Filtering finished tasks by job type or task result
Optionally, select from the list of job types and job results to further narrow your search criteria. Click Filter to see your results, or add more filtering criteria.
Administrator's GuideChapter 5: Configuration
Filtering the Task List Page 458 of 743
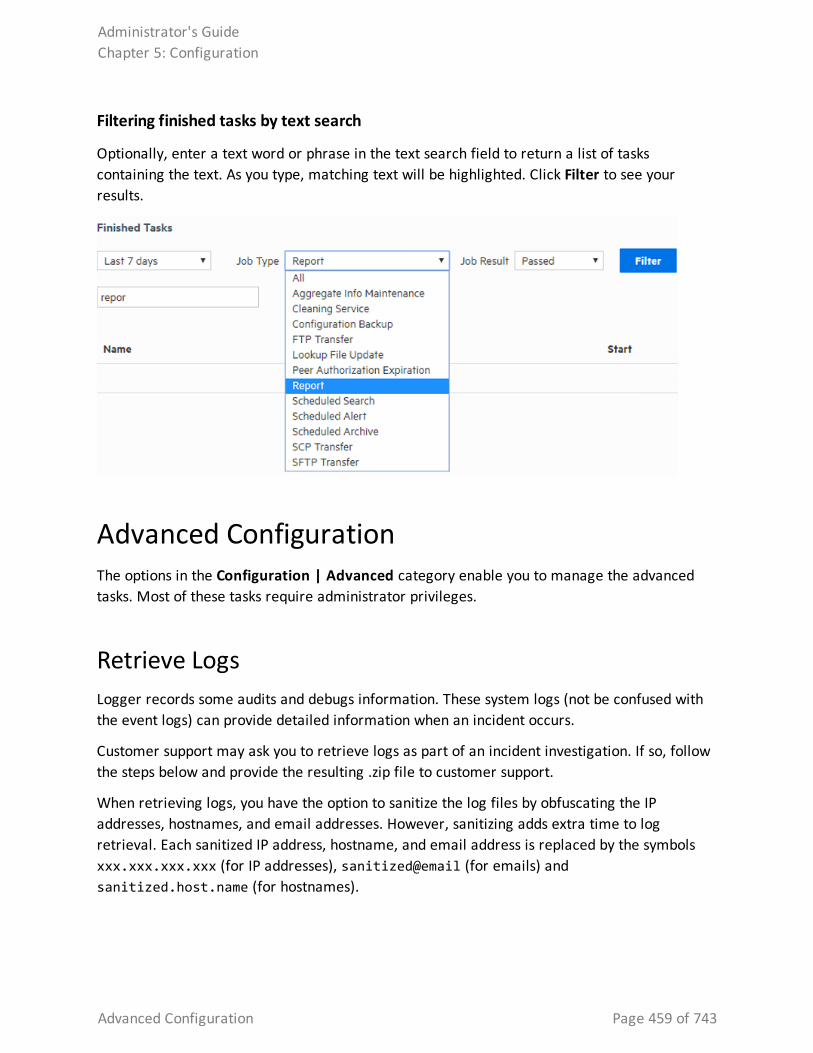
Filtering finished tasks by text search
Optionally, enter a text word or phrase in the text search field to return a list of tasks containing the text. As you type, matching text will be highlighted. Click Filter to see your results.
Advanced ConfigurationThe options in the Configuration | Advanced category enable you to manage the advanced tasks. Most of these tasks require administrator privileges.
Retrieve LogsLogger records some audits and debugs information. These system logs (not be confused with the event logs) can provide detailed information when an incident occurs.
Customer support may ask you to retrieve logs as part of an incident investigation. If so, follow the steps below and provide the resulting .zip file to customer support.
When retrieving logs, you have the option to sanitize the log files by obfuscating the IP addresses, hostnames, and email addresses. However, sanitizing adds extra time to log retrieval. Each sanitized IP address, hostname, and email address is replaced by the symbols xxx.xxx.xxx.xxx (for IP addresses), sanitized@email (for emails) and sanitized.host.name (for hostnames).
Administrator's GuideChapter 5: Configuration
Advanced Configuration Page 459 of 743
To retrieve Logger system logs:
1. Open the Configuration > Advanced menu and then click Retrieve Logs.
2. Select the Log Retrieval options to use when creating the Log file.
l If you select Do not sanitize logs (fastest), then all IP addresses, hostnames and email addresses will be kept in the log file.
l If you select Remove IP addresses, all IP addresses in the log will be obfuscated. You cannot specify individual IP addresses.
l If you select Remove IP addresses, hostnames, email addresses, session IDs, and passwords (slowest), the password string will be obfuscated .You must specify the suffixes of the hostnames and email addresses in the text box.
Separate multiple suffixes with comma, space, or line-break. For example, to obfuscate all hostnames and email addresses that end with microfocus.com and gmail.com, you could specify the following: microfocus.com, gmail.com
All IP addresses, hostnames, and email addresses with the specified suffixes will obfuscate. Individual email addresses like [email protected] can no longer be specified, and their suffixes ignored.
For security purposes, the information from sessions table is excluded in this report. In that same regard, passwords will be hashed when rendering report that includes .dat and .SQL files.
3. Click Retrieve Logs. The page will display a progress bar while the logs are being retrieved.
4. When the collection is complete, the system log files have been compressed into a single zip file. A link to this file is displayed on the Log Retrieval page. Click the link to download the file.
Collecting Logger deployment environment information
Collecting Logger deployment environment information compiles the basic details in one single file allowing a more direct interaction with the Support Team. The retrieve package will usually be available (but can vary based on Logger type) at [LOGGER_HOME] /tmp. The include deployment info/stats box (checked by default) includes a json file attachment in the logs.zip. To get only the json file, click Download Environment info button.
loggerdeploymentinformation.json contains the following information:
l current time
l Logger information : installation type (SW/Appliance), Product version, Model, ESP.
Administrator's GuideChapter 5: Configuration
Retrieve Logs Page 460 of 743
l OS information
l Processor information
l Memory information
l Average EPS, current EPS
l Receivers
l Forwarders
l Peers
l Alerts
l Storage Group
l Storage volume
l Failed Archive
Maintenance OperationsCertain operations on Logger, such as database defragmentation, extending the storage volume size, adding storage groups, and adding additional schema fields, require that Logger be in a maintenance state—a state in which operations related to data on the Logger are not running. Maintenance mode enables you to place the Logger in such a state. When a Logger is in maintenance mode:
l Events are not processed
l Reports are not generated
l Search cannot run
l Scheduled jobs do not run
Tip: You cannot place a Logger in maintenance mode directly. A Logger can enter maintenance mode only to perform an operation that requires it to be in that mode.
Caution: Do not restart/reboot a Logger in Maintenance Mode from the command line. Use the restart link on the Maintenance page.
Required Permissions for Maintenance Mode Logger users who will be performing operations that require it to be in maintenance mode must have the “Enable Maintenance Mode” privilege checked (System Admin > User
Administrator's GuideChapter 5: Configuration
Maintenance Operations Page 461 of 743
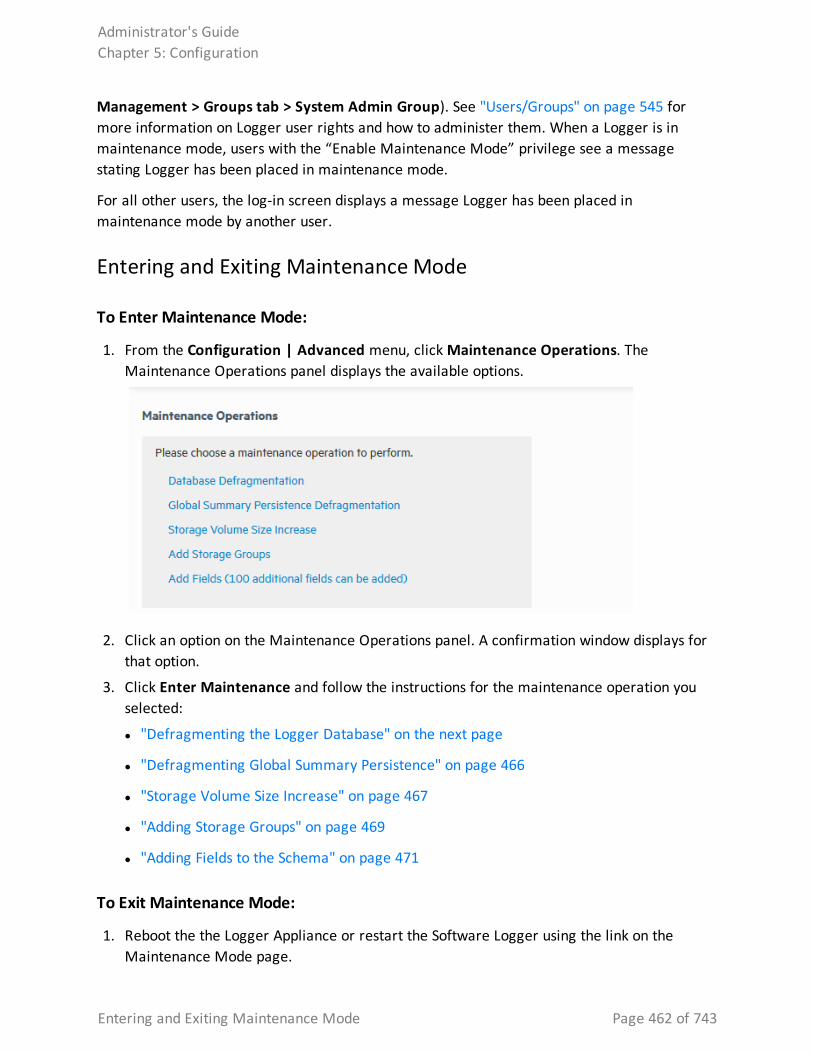
Management > Groups tab > System Admin Group). See "Users/Groups" on page 545 for more information on Logger user rights and how to administer them. When a Logger is in maintenance mode, users with the “Enable Maintenance Mode” privilege see a message stating Logger has been placed in maintenance mode.
For all other users, the log-in screen displays a message Logger has been placed in maintenance mode by another user.
Entering and Exiting Maintenance Mode
To Enter Maintenance Mode:
1. From the Configuration | Advanced menu, click Maintenance Operations. The Maintenance Operations panel displays the available options.
2. Click an option on the Maintenance Operations panel. A confirmation window displays for that option.
3. Click Enter Maintenance and follow the instructions for the maintenance operation you selected:
l "Defragmenting the Logger Database" on the next page
l "Defragmenting Global Summary Persistence" on page 466
l "Storage Volume Size Increase" on page 467
l "Adding Storage Groups" on page 469
l "Adding Fields to the Schema" on page 471
To Exit Maintenance Mode:
1. Reboot the the Logger Appliance or restart the Software Logger using the link on the Maintenance Mode page.
Administrator's GuideChapter 5: Configuration
Entering and Exiting Maintenance Mode Page 462 of 743
Caution: Do not restart/reboot a Logger in Maintenance Mode from the command line. Use the restart link on the Maintenance page.
Defragmenting the Logger DatabaseLogger’s database can become fragmented over time. Frequent retention tasks can exacerbate this issue. The following symptoms appear on a Logger when the database should be defragmented:
l Slow search and reporting
For example, even a search operation over the last two minutes of data is slow.
l Long pauses in the receiver and forwarder operations
You can defragment a Logger that exhibits these symptoms. Make sure that you have read the following guidelines before starting the defragmentation process.
Guidelines for Database Defragmentation
Ascertain that the Logger symptoms are not due to issues related to network infrastructure, such as network latency or unexpected load on the Logger.
The Logger system needs to be placed in maintenance mode before defragmentation can begin. As a result, most processes on the Logger are stopped—no events are processed or scheduled jobs run, and most user interface operations are unavailable. For more information about maintenance mode, see "Maintenance Operations" on page 461.
A minimum amount of free disk space is required on your system to run database defragmentation. The utility automatically checks for the required free space and displays a message if it doesn't have sufficient disk space.
Tip: Although you can defragment as needed, if you are using this utility too often (such as on a system that was defragmented over the last few days), contact customer support for guidance.
If the defragmentation process fails at any point, the Logger returns to the same state that it was in before you started defragmentation:
You can safely reboot the Logger Appliance and restart the process from the beginning. For the Software Logger, restart the Logger process as described in "Process Status" on page 518.
Required Permissions
You can perform this process only if you have the “Enable Maintenance Mode” privilege set to Yes in the System Admin Rights list for the System Admin Group to which you are assigned.
Administrator's GuideChapter 5: Configuration
Defragmenting the Logger Database Page 463 of 743
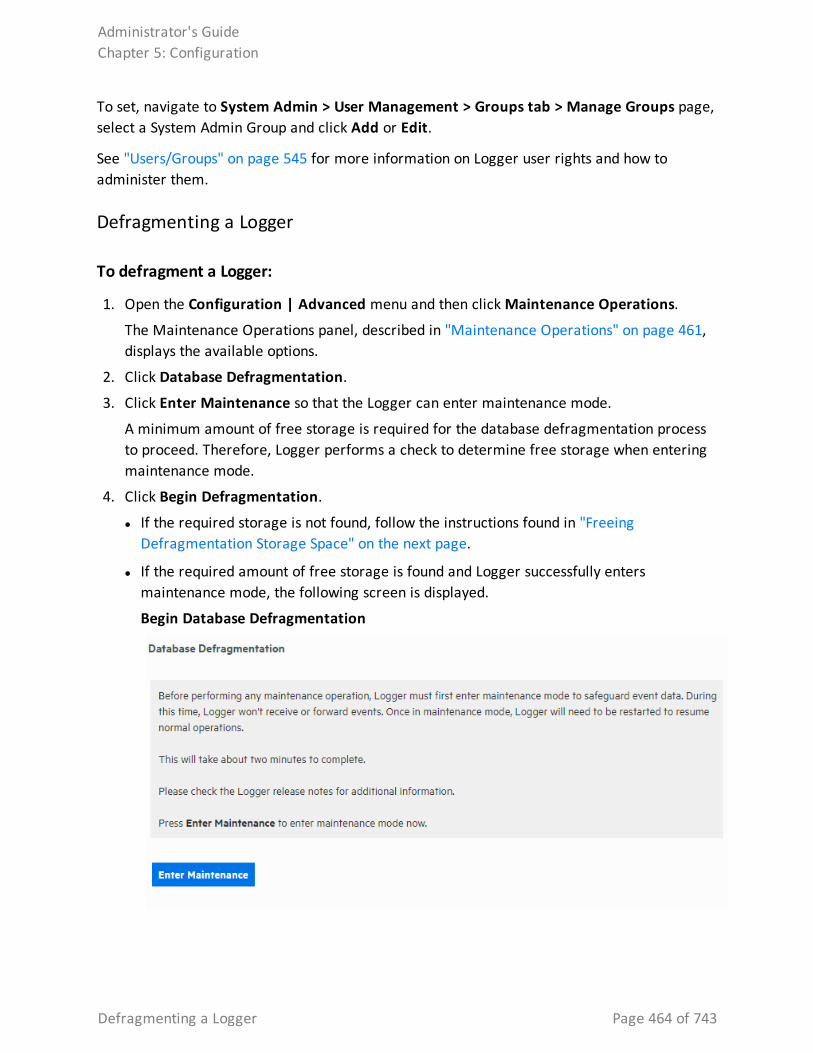
To set, navigate to System Admin > User Management > Groups tab > Manage Groups page, select a System Admin Group and click Add or Edit.
See "Users/Groups" on page 545 for more information on Logger user rights and how to administer them.
Defragmenting a Logger
To defragment a Logger:
1. Open the Configuration | Advanced menu and then click Maintenance Operations.
The Maintenance Operations panel, described in "Maintenance Operations" on page 461, displays the available options.
2. Click Database Defragmentation.
3. Click Enter Maintenance so that the Logger can enter maintenance mode.
A minimum amount of free storage is required for the database defragmentation process to proceed. Therefore, Logger performs a check to determine free storage when entering maintenance mode.
4. Click Begin Defragmentation.
l If the required storage is not found, follow the instructions found in "Freeing Defragmentation Storage Space" on the next page.
l If the required amount of free storage is found and Logger successfully enters maintenance mode, the following screen is displayed.
Begin Database Defragmentation
Administrator's GuideChapter 5: Configuration
Defragmenting a Logger Page 464 of 743
Note: On the Software Logger, the following Database Defragmentation screens instruct you to click Restart to resume normal operation when Logger is in maintenance mode. When you click restart, only the Logger service and its related processes are started on the machine on which the Software Logger is installed.
5. The defragmentation process starts. A progress indicator shows the status of defragmentation, as shown in the example below. Micro Focus recommends that you do not attempt any operation on the Logger until defragmentation has completed.
Once defragmentation is complete, the Logger reboots automatically. This exits maintenance mode.
Freeing Defragmentation Storage Space
If the required storage is not found, Logger prompts you to free sufficient space:
You can choose from one of the following options:
l Manual Deletion
Note: The Manual Deletion option is not available on L7x00 Loggers.
A text file is automatically created on your Logger that lists the files you can safely delete. On the Logger appliance, this file is located in /opt/arcsight/logger/user/logger/defragmentation/filelist.txt
On Software Loggers, this file is located in <install_dir>/current/arcsight/logger/user/logger/defragmentation/filelist.txt.
The files are listed in descending order of size in the text file. You can delete sufficient number of files to free up storage. However, do not delete the files before contacting customer support for instructions and guidance.
Follow these steps to proceed:
a. Leave the message screen without taking any action.
b. Contact customer support for instructions on deleting files listed in the text file.
c. After deleting sufficient number of files, resume the Database Defragmentation process from the message screen. To resume, click Recheck to check whether sufficient storage is now available for defragmentation to proceed.
If sufficient storage is found, the "Begin Database Defragmentation" on the previous page is displayed. Click Begin Defragmentation to proceed further.
If sufficient storage is still not found, a message displayed. Choose from the listed options to create additional space.
Administrator's GuideChapter 5: Configuration
Freeing Defragmentation Storage Space Page 465 of 743
Note: If you need to exit the defragmentation process without creating sufficient storage, click Reboot.
l Delete Database Indices
Logger automatically deletes a sufficient number of database indices, starting with the largest index, to free up the required amount of storage. If sufficient space becomes available after deleting database indices, defragmentation proceeds further automatically.
However, if sufficient storage is not available even after dropping database indices, follow these steps to proceed:
a. Click Manual Deletion.
Note: The Manual Deletion option is not available on L7x00 Loggers.
A text file is created on your Logger that lists the files you can safely delete. The files are listed in descending order of size in a text file.
b. Click Reboot.
Logger exits the maintenance mode.
c. Contact customer support for instructions on manually deleting the files.
You can delete sufficient number of files to free up storage.
d. After deleting the files, restart the defragmentation process as described in "To defragment a Logger:" on page 464.
Note: If the defragmentation process fails or is aborted at any time, Logger must recover those indices. Although the recovery process is automatic, it can take at least a few hours to complete. You will not lose any data during this process.
l Reboot
The database defragmentation process is aborted and Logger returns to the state it was in before you started the defragmentation utility.
Defragmenting Global Summary PersistenceMicro Focus Logger recommends to defragment the Global Summary. Make sure that you have read the following guidelines before proceeding.
Guidelines for Defragmenting Global Summary Persistence
l Before global summary persistence defragmentation starts, the Logger system needs to be placed in maintenance mode stopping the majority of the processes. For more information, see "Maintenance Operations" on page 461.
Administrator's GuideChapter 5: Configuration
Defragmenting Global Summary Persistence Page 466 of 743
l A minimum amount of free disk space is required to run the defragmentation. The utility automatically checks the space in your system and displays a message if free space is insufficient.
l If the defragmentation process fails at any point, Logger returns to the same state before this process. You can safely reboot the appliance or restart the Software Logger process and try again.
a. Reboot the Logger Appliance as described in "System Reboot" on page 501.
b. For Software Logger, restart the Logger process as described in "Process Status" on page 518.
Required Permissions
You can perform this process only if you have the “Enable Maintenance Mode” privilege set to Yes (System Admin > User/Groups > Manage Groups > System Admin Group). See "Users/Groups" on page 545 for more information on Logger user rights and how to administer them.
To defragment for the Global Summary Persistence issue:
1. Open the Configuration > Advanced > Maintenance Operations.
2. Click Global Summary Persistence Defragmentation.
3. Click Enter Maintenance for Logger enter in maintenance mode.
4. Click Begin Global Summary Persistence Defragmentation to start the defragmentation process. A progress indicator shows this status.
Micro Focus recommends to not perform any operation in Logger during defragmentation. Once this process is completed, the Logger reboots or restarts and automatically exiting the maintenance mode.
Note: On Software Loggers, only the Logger service and its related processes are restarted.
Storage Volume Size IncreaseYou can extend the storage volume size you established during initialization at any time. Once extended, the volume size cannot be reduced. The Logger interface guides you about current and the maximum value to which you can increase the size.
Administrator's GuideChapter 5: Configuration
Storage Volume Size Increase Page 467 of 743
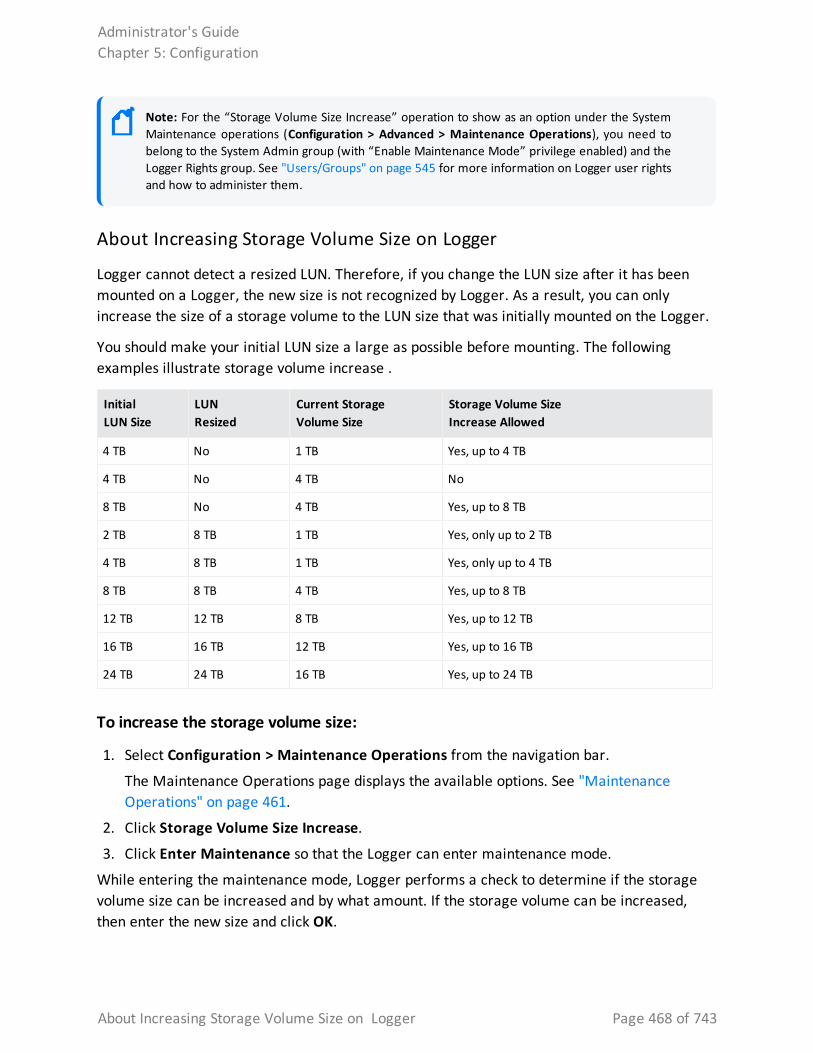
Note: For the “Storage Volume Size Increase” operation to show as an option under the System Maintenance operations (Configuration > Advanced > Maintenance Operations), you need to belong to the System Admin group (with “Enable Maintenance Mode” privilege enabled) and the Logger Rights group. See "Users/Groups" on page 545 for more information on Logger user rights and how to administer them.
About Increasing Storage Volume Size on Logger
Logger cannot detect a resized LUN. Therefore, if you change the LUN size after it has been mounted on a Logger, the new size is not recognized by Logger. As a result, you can only increase the size of a storage volume to the LUN size that was initially mounted on the Logger.
You should make your initial LUN size a large as possible before mounting. The following examples illustrate storage volume increase .
Initial LUN Size
LUN Resized
Current Storage Volume Size
Storage Volume Size Increase Allowed
4 TB No 1 TB Yes, up to 4 TB
4 TB No 4 TB No
8 TB No 4 TB Yes, up to 8 TB
2 TB 8 TB 1 TB Yes, only up to 2 TB
4 TB 8 TB 1 TB Yes, only up to 4 TB
8 TB 8 TB 4 TB Yes, up to 8 TB
12 TB 12 TB 8 TB Yes, up to 12 TB
16 TB 16 TB 12 TB Yes, up to 16 TB
24 TB 24 TB 16 TB Yes, up to 24 TB
To increase the storage volume size:
1. Select Configuration > Maintenance Operations from the navigation bar.
The Maintenance Operations page displays the available options. See "Maintenance Operations" on page 461.
2. Click Storage Volume Size Increase.
3. Click Enter Maintenance so that the Logger can enter maintenance mode.
While entering the maintenance mode, Logger performs a check to determine if the storage volume size can be increased and by what amount. If the storage volume can be increased, then enter the new size and click OK.
Administrator's GuideChapter 5: Configuration
About Increasing Storage Volume Size on Logger Page 468 of 743
Note: On the Software Logger, the Storage Volume Size Increase screen instructs you to click restart to resume normal operation when Logger is in maintenance mode. When you click restart, only the Logger service and its related processes are restarted.
If sufficient space is not found to increase the storage volume, a message is displayed. Click Reboot to restart Logger and exit maintenance mode.
Adding Storage GroupsIn addition to the two storage groups that exist on your Logger by default, you can add up to 48 additional storage groups. You can add storage groups at any time if the following conditions are met:
l The maximum allowed 48 storage groups do not exist on your Logger already.
l The storage volume contains spare storage space that can be allocated to the storage groups you will add.
Tip: If you do not have sufficient space in the storage volume to add another storage group and the existing groups have free space, consider reducing the size of existing storage groups to make space available for the storage groups you want to add. Alternatively, increase the size of your existing storage volume, as described in "Storage Volume Size Increase" on page 467.
The Logger must be in maintenance mode when adding storage groups. When you add a storage group, Logger automatically checks to ensure that the storage group size you specified is greater than the minimum size required (5 GB) and less than the amount of space available in the storage volume.
Once you have added storage groups and rebooted your Logger to exit the maintenance mode, remember to configure the Archive Storage Settings for the groups you just added so that event archives are created for them.
To add a storage group:
1. Open the Configuration | Advanced menu and then click Maintenance Operations.
The Maintenance Operations panel, described in "Maintenance Operations" on page 461 displays the available options.
2. Click Add Storage Groups.
A maximum of 48 storage groups can exist on Logger. Therefore, you can add up to 48 storage groups in addition to the 2 that exist by default on Logger.
Administrator's GuideChapter 5: Configuration
Adding Storage Groups Page 469 of 743
If the maximum number of allowed storage groups do not exist on Logger, a screen prompts you to enter maintenance mode, as described in the next step.
If all 48 storage groups exist on Logger or sufficient space does not exist in the storage volume to add additional group, a message is displayed on your screen and the Logger cannot enter maintenance mode.
3. Click Enter Maintenance so that the Logger can enter maintenance mode.
For more information about maintenance mode, see "Maintenance Operations" on page 461.
4. Once Logger enters maintenance mode, the following Add Storage Groups page is displayed.
This screen also lists information about the existing storage groups and the amount of space remaining in the storage volume.
5. Enter the following information.
Parameter Description
Name Choose a name for the storage group.
Maximum Age (Days)
Specify the number of days to retain events. Events older than this number of days are deleted.
Maximum Size (GB)
Enter a maximum event data size, in GB.
6. Click Add.
The storage group is added to your Logger. If your Logger has not reached the maximum allowed 48 storage groups, you can click Add to add more storage groups. However, if the maximum number has been reached, the Add button is not displayed. If you do not want to add more storage group, go to the next step.
7. To apply your changes and exit maintenance mode, reboot your Logger Appliance or restart Software Logger.
Changing MySQL Password My SQL password allows the user to have a different password than the logger host. This will be a security measure for weak credentials. Make sure that you have read the following guidelines before proceeding.
Guidelines for Changing MySQL password
l Before this process starts, the Logger system needs to be placed in maintenance mode stopping the majority of the processes. For more information, see "Maintenance Operations"
Administrator's GuideChapter 5: Configuration
Changing MySQL Password Page 470 of 743
on page 461.
l Your current password is required.
l The password will be updated for both root and non- root users.
l MySQL process will be restarted.
a. Reboot the Logger Appliance as described in "System Reboot" on page 501.
b. For Software Logger, restart the Logger process as described in "Process Status" on page 518.
Required Permissions
You can perform this process only if you have the “Enable Maintenance Mode” privilege set to Yes (System Admin > User/Groups > Manage Groups > System Admin Group). See "Users/Groups" on page 545 for more information on Logger user rights and how to administer them.
To change MySQL password:
1. Open the Configuration > Advanced > Maintenance Operations.
2. Click Change MySQL Password.
3. Click Enter Maintenance for Logger enter in maintenance mode.
4. Add your current and new password. Retype
Caution: Make sure to securely store a copy of your password. Support will not be able to retrieve or restore the password for you.
5. Save the changes. This may take a few minutes.
Micro Focus recommends to not perform any operation in Logger while changing the password. Once this process is completed, the Logger reboots or restarts and automatically exiting the maintenance mode. To check if the password has been changed, go to Configuration > Maintenance Results or System Admin > Logs > Audit Logs.
Note: On Software Loggers, only the Logger service and its related processes are restarted.
Adding Fields to the SchemaThe Logger schema contains a predefined set of fields. A field-based query can contain only these fields. Additionally, you can index only these fields for faster search operations. For instructions on how to view the default Logger schema fields, see "Default Fields" on page 340.
Administrator's GuideChapter 5: Configuration
Adding Fields to the Schema Page 471 of 743

Prior to Logger 5.2, if your log analysis needs required you to search on a field that is currently not present in the Logger schema, you did not have a way of adding it to the schema yourself. Starting with Logger 5.2, you can add additional fields to the Logger schema. That is, you can insert fields in your Logger schema that are relevant to the events you collect on your Logger, thus enabling you to search and report using these fields. Additionally, you can index the fields you add so that the search and report queries that use these fields run faster. For example, a financial institution might want to add credit card numbers or social security numbers to the schema.
You can add up to 100 custom schema fields on Logger. You can also import custom fields from a peer Logger. However, the total number of added and imported fields cannot exceed the maximum allowed 100 fields.
You can index up to 123 fields on Logger. Therefore, the number of custom schema fields you can index will depend on the number of default fields you currently have indexed on your Logger.
Note: Logger cannot process the additional fields data received in CEF version 0 from a FlexConnector, and assumes a NULL value for such fields when they are present in a CEF version 0 event. As a result, you cannot search on these fields or index them. However, these fields are displayed in the UI display when you select “*” in the field set because the interface displays information contained in the raw event. Therefore, if Logger receives “ad.callnumber=5678”, the Logger UI will display a column, ad.callnumber, with value 5678. However, a search on “5678” will not return this event in the search results.
You need to be in maintenance mode to add or import custom schema fields. The process of adding or importing schema fields involves an add or import operation followed by a save operation. The add or import operation adds the specified fields but does not write them to the Logger schema. You can edit or delete the added or imported fields at this point. Once you save these fields, the fields are written to the schema. From this point on, these fields cannot be edited or deleted. Therefore, carefully review the fields you are adding to the schema before saving them.
Note: For the “Add Fields” operation to show as an option under the System Maintenance operations (Configuration | Advance > Maintenance Operations), you need to belong to the System Admin group (with “Enable Maintenance Mode” privilege enabled) and the Logger Rights group. See "Users/Groups" on page 545 for more information on Logger user rights and how to administer them.
You need to specify the following information to add a custom schema field
l Additional data field - If the Add prefix ad. and suffix box is not checked, the actual field name stored in Logger schema and the field name entered by the user will be the same. If the Add prefix ad. and suffix box is checked, field name stored in Logger schema as actual field name will be added automatically with prefix and suffix information. CEF events
Administrator's GuideChapter 5: Configuration
Adding Fields to the Schema Page 472 of 743
received by Logger must have the corresponding prefix and suffix in the field name, so the event field can be properly indexed and used in field-based search query.
l Display name — A meaningful name for the field. This name is displayed as the column header name for the field and is the one you specify in a search query. For example, SocialSecurityNumber. On the other hand , If you are adding a predefined CEF name, an auto suggestion list is displayed in this field.
l Type — The type of data this field will contain. The available options are Double, BigInt, DateTime, Text.
The following table describes each data type.
Type Description
Double Use to store decimal numbers or fractions.
Numbers from -1.79769313486231570E+308 through -4.94065645841246544E-324 for negative values, and
4.94065645841246544E-324 through 1.79769313486231570E+308 for positive values.
BigInt Use to store whole numbers.
Numbers from -2^63 through 2^63-1, or
-9,223,372,036,854,775,808 through 9,223,372,036,854,775,807.
DateTime Use to store both dates and time or only dates.
Text Use to store any characters. You can store a maximum of 255 characters per field.
l Length — This field is only relevant when the Type specified is Text. This field specifies the maximum number of characters allowed in the value of the field when the data type is Text.This field is only relevant when the Type specified is Text. This field specifies the maximum number of characters allowed in the value of the field when the data type is Text.
l Field name — The field name that you want to add to the Logger schema. Typically, this is an abbreviated version of the Display name. For example, SSN.
Importing Schema Fields from Peers
If your Logger is a peer of another Logger, you can import the custom fields added to the peer’s schema. You specify the peer from which you want to import fields in the user interface screen. Fields can be imported if the following conditions are met:
l A field of the same Display name and Field name does not exist on the Logger to which you are importing schema fields. If conflicting fields exist, they are still imported but are flagged in the user interface screen. You cannot save the imported fields to schema until you resolve
Administrator's GuideChapter 5: Configuration
Importing Schema Fields from Peers Page 473 of 743
the conflicts.
l A maximum of 100 custom fields has not been reached on the importing Logger. If there are more fields than can be imported, only the first N until the allowed maximum is reached will be imported.
The custom schema fields contained in a search query must exist on all peers on which the query is run. Otherwise, the query will not run and return an error.
To add or import custom schema fields:
1. Open the Configuration | Advanced menu and then click Maintenance Operations.
The Maintenance Operations panel, described in "Maintenance Operations" on page 461 displays the available options.
2. Click Add Fields (100 additional fields can be added).
You can add a maximum of 100 custom fields to Logger schema. The number in the “Add Fields” link reflects the number of custom fields you can add. This number decreases as you add fields to Logger schema.
3. Click Enter Maintenance so that the Logger can enter maintenance mode.
4. Once Logger enters maintenance mode, the Add Fields page is displayed.
You can add fields manually or import them from a peer Logger.
To manually add fields:
1. After entering Maintenance Mode, click Add a New Field, if it is not selected.
2. With Add prefix ad. and suffix box checked, enter a meaningful name in the Display Name field.
The display name is the one you specify in a search query and is the column header for the field in search results. For example, SocialSecurityNumber. It is not added to the Logger schema. The majority of the display names are auto populated. If there is text while you hover over the field, it is not necessary to add a prefix (.ad) and a suffix (.i, .d, .r). If no text is displayed while you hover the field , add the prefix and its correspondent suffix type.
Follow these guidelines when specifying a display name:
l The display name must be unique; that is, another field (custom or Logger schema) of the same display name must not already exist on the Logger.
l Only ASCII characters are allowed. That is, no native Chinese or Japanese characters are accepted in this field.
l The display name can contain up to 100 alphanumeric and underscore characters. If you are adding a predefined CEF name, an auto suggestion list is displayed in this
Administrator's GuideChapter 5: Configuration
Importing Schema Fields from Peers Page 474 of 743

field.
Note: To be valid, the display name must not start with "arc_" or an underscore.
3. Select a data type for the field from the Type pull-down menu. The available options are Double, BigInt, DateTime, Text. See "Adding Fields to the Schema" on page 471 for more information.
4. In the Length field, enter the maximum number of characters allowed in the value of the field when the data type is Text. This field is only available when the Type specified is Text. You can specify from 1 to 255 characters in this field.
5. Enter a name in the Field name field.
This is the name that will be added to the Logger schema. Typically, this is an abbreviated version of the Display name. For example, SSN.
Follow these guidelines when specifying a Field name:
l This is a required field.
l The field name must be unique; that is, a custom field of the same Field name must not already exist on the Logger.
l Only ASCII characters are allowed. That is, no native Chinese or Japanese characters are accepted in this field.
l The field name can contain up to 40 characters and can contain alphanumeric, hyphen, and underscore characters. The underscore (_) is used as an escape character for the actual field name. Therefore, if you include an underscore in the field name, the actual field name will contain a double underscore (__).
6. Click OK.
The field you added is displayed in the upper section of the Add Fields form, as shown in the following figure. This field is not saved yet (in “Ready to Save” state) and you can edit or delete it. Once you click Save, the field is added to the schema and cannot be changed or deleted.
Administrator's GuideChapter 5: Configuration
Importing Schema Fields from Peers Page 475 of 743
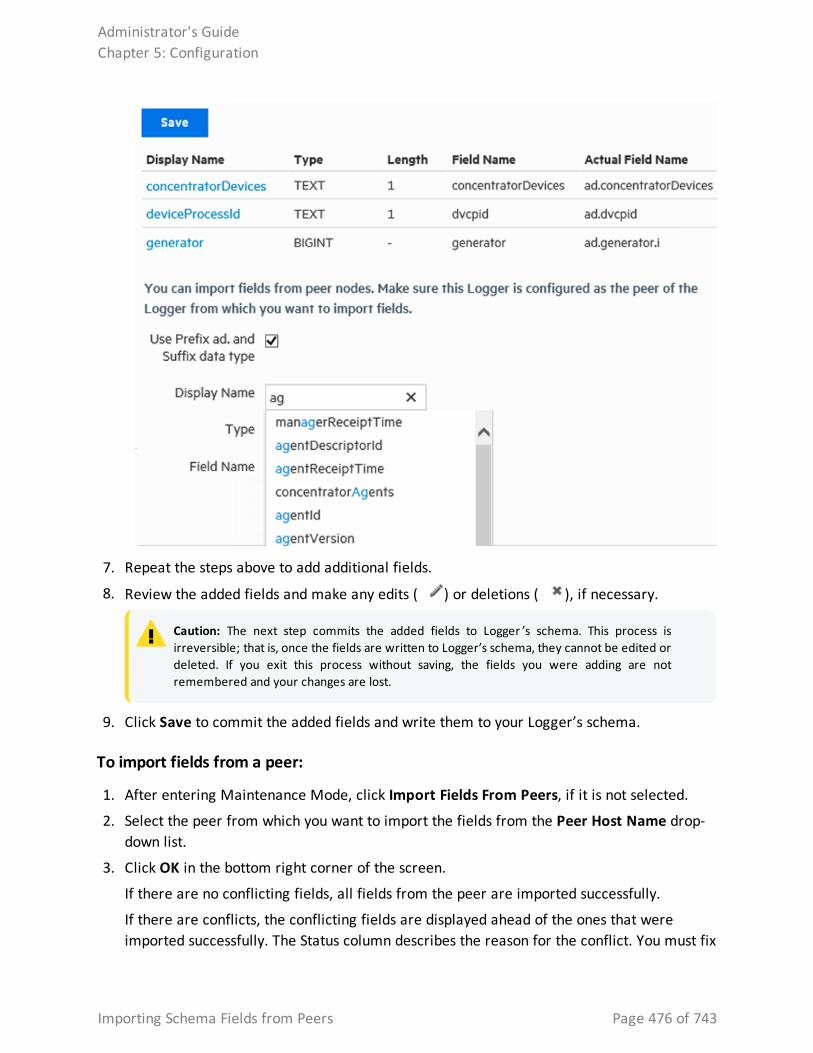
7. Repeat the steps above to add additional fields.
8. Review the added fields and make any edits ( ) or deletions ( ), if necessary.
Caution: The next step commits the added fields to Logger ’s schema. This process is irreversible; that is, once the fields are written to Logger’s schema, they cannot be edited or deleted. If you exit this process without saving, the fields you were adding are not remembered and your changes are lost.
9. Click Save to commit the added fields and write them to your Logger’s schema.
To import fields from a peer:
1. After entering Maintenance Mode, click Import Fields From Peers, if it is not selected.
2. Select the peer from which you want to import the fields from the Peer Host Name drop-down list.
3. Click OK in the bottom right corner of the screen.
If there are no conflicting fields, all fields from the peer are imported successfully.
If there are conflicts, the conflicting fields are displayed ahead of the ones that were imported successfully. The Status column describes the reason for the conflict. You must fix
Administrator's GuideChapter 5: Configuration
Importing Schema Fields from Peers Page 476 of 743
the listed issues before you can save these fields to the schema. Use the edit ( ) or delete ( ) icons at the end of the row to make changes or delete the added fields.
If there are more fields than can be imported, only the first N until the allowed maximum (100) is reached will be imported.
Caution: The imported fields are not committed to Logger ’s schema yet. The next step commits them. This process is irreversible; that is, once the fields are written to Logger’s schema, they cannot be edited or deleted.
If you exit this process without saving, the fields you were adding are not remembered and your changes are lost.
4. Click Save to commit the added fields and write them to your Logger’s schema. Restart Logger to put the changes into effect.
If you added fields from a peer Logger, be sure to add the same fields to any other peers.
To view the custom schema fields, see "Custom Fields" on page 341.
Maintenance ResultsYou can check the status of a maintenance operation on the Maintenance Results page.
To access the Maintenance Results page (as shown in the example below), open the Configuration | Advanced menu and then click Maintenance Results.
Configuration Backup and RestoreBy default, Logger does not back up any content. However, you can configure it to back up the following content to a remote system:
l All non-event data (Except Lookup files)
l Reports content only
You can back up this content on ad-hoc basis or schedule it to run periodically. The content is saved to the backup location in a single .tar.gz format file.
Caution: Ensure that Configuration Backups (for configuration settings) and Event Archives (for data) run on a regular basis and are stored in a remote location. You should also store a copy of your license. In the event of catastrophic failure, you will need to restore the most recent Configuration Backup, Event Archives, and license. For information on Event Archives, see "Event Archives" on page 448.
You can use the backed-up content to:
Administrator's GuideChapter 5: Configuration
Maintenance Results Page 477 of 743
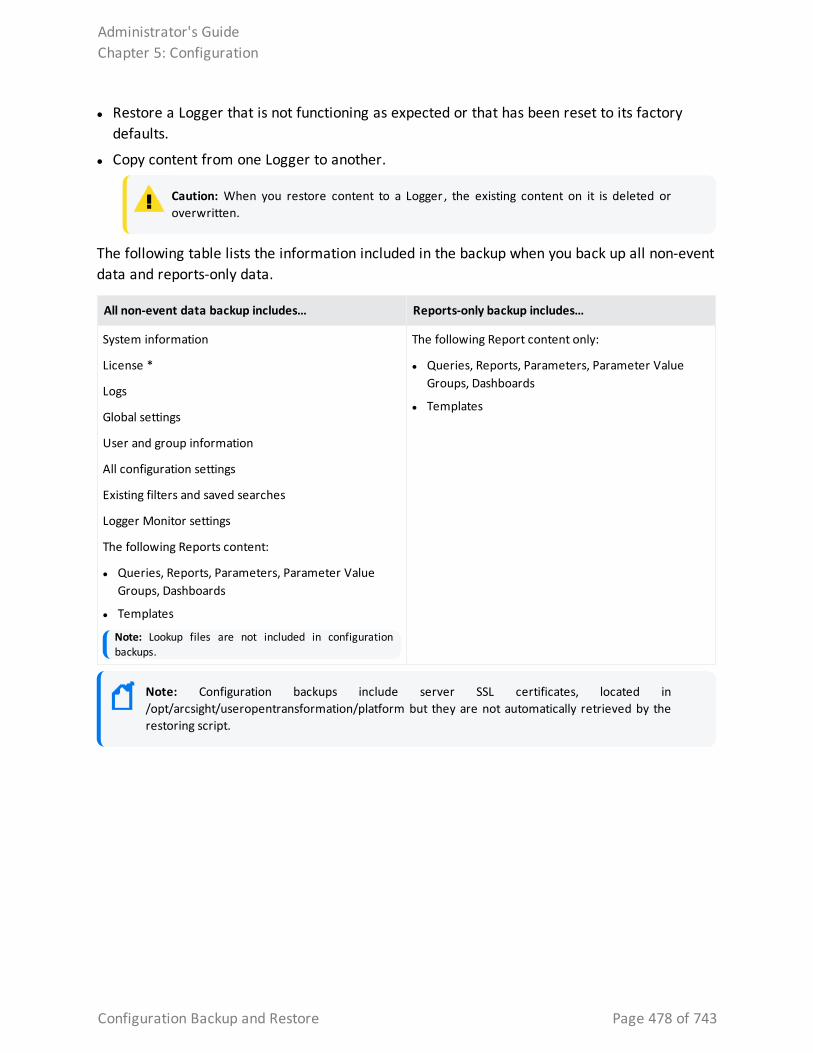
l Restore a Logger that is not functioning as expected or that has been reset to its factory defaults.
l Copy content from one Logger to another.
Caution: When you restore content to a Logger , the existing content on it is deleted or overwritten.
The following table lists the information included in the backup when you back up all non-event data and reports-only data.
All non-event data backup includes… Reports-only backup includes…
System information
License *
Logs
Global settings
User and group information
All configuration settings
Existing filters and saved searches
Logger Monitor settings
The following Reports content:
l Queries, Reports, Parameters, Parameter Value Groups, Dashboards
l Templates
Note: Lookup files are not included in configuration backups.
The following Report content only:
l Queries, Reports, Parameters, Parameter Value Groups, Dashboards
l Templates
Note: Configuration backups include server SSL certificates, located in /opt/arcsight/useropentransformation/platform but they are not automatically retrieved by the restoring script.
Administrator's GuideChapter 5: Configuration
Configuration Backup and Restore Page 478 of 743
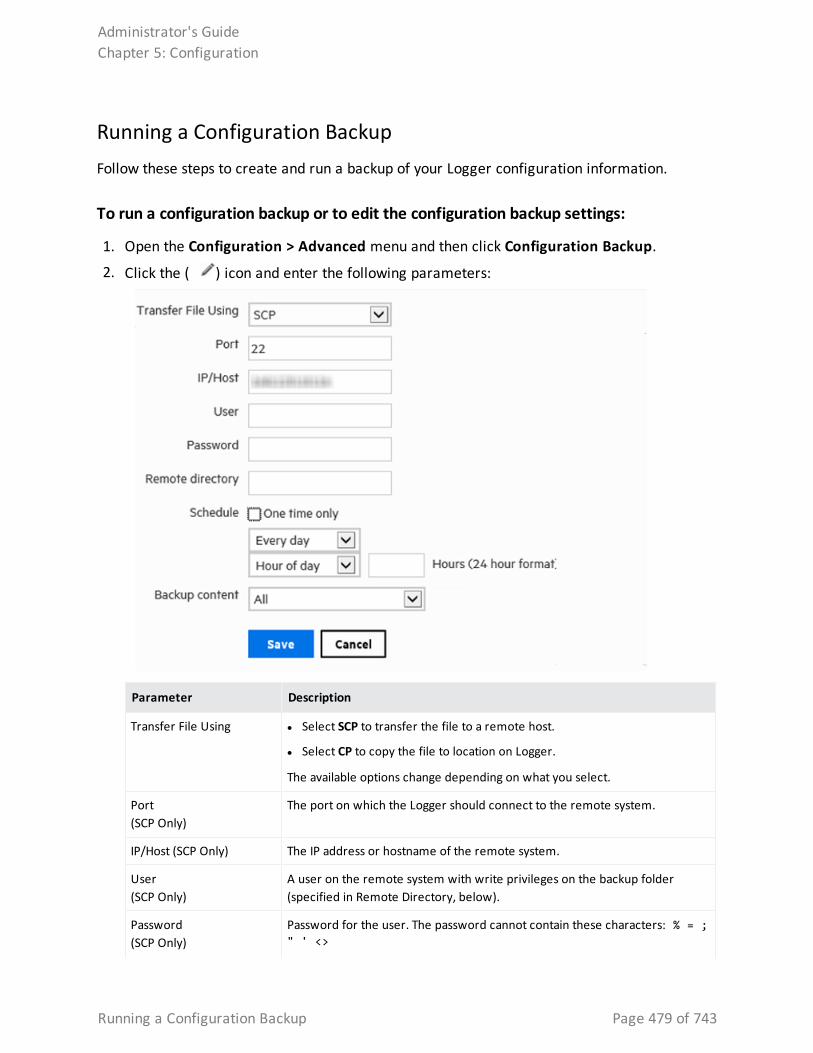
Running a Configuration BackupFollow these steps to create and run a backup of your Logger configuration information.
To run a configuration backup or to edit the configuration backup settings:
1. Open the Configuration > Advanced menu and then click Configuration Backup.
2. Click the ( ) icon and enter the following parameters:
Parameter Description
Transfer File Using l Select SCP to transfer the file to a remote host.
l Select CP to copy the file to location on Logger.
The available options change depending on what you select.
Port(SCP Only)
The port on which the Logger should connect to the remote system.
IP/Host (SCP Only) The IP address or hostname of the remote system.
User(SCP Only)
A user on the remote system with write privileges on the backup folder (specified in Remote Directory, below).
Password(SCP Only)
Password for the user. The password cannot contain these characters: % = ; " ' <>
Administrator's GuideChapter 5: Configuration
Running a Configuration Backup Page 479 of 743
Parameter Description
Mount location (appliance only)
Select a mount location on the appliance.
Note: The mount location must be added prior to running a configuration backup.
Remote Directory The location in which to save the configuration backup files. The remote directory name cannot contain spaces.
Note: The Logger Appliance supports mounting through the user interface. Software Logger uses its file system, which can contain remote folders mounted through the operating system.
Schedule Schedule when and how often the Backup is run.
l If you leave the default One Time Only checkbox enabled, other fields are hidden and the configuration backup occurs just once (ad-hoc), when you click Save.
l If you disable the One Time Only checkbox, you can use the schedule options to specify how frequently the configuration backup should run. See "Scheduling Reoccurring Backups" on the next page.
Backup Content Whether to backup all non-event data or only the report content.
l Select All for all non-event data
l Select Report Content Only for only the report content.
3. Click Save. The configuration backup you set up is displayed on the Configuration Backup page.
Note: If you chose to run the backup One Time Only , the configuration backup is run immediately. Otherwise, it is scheduled to run at the specified time.
4. Once you have created one or more configuration backups, you can take the following optional actions from the Configuration Backup page:
a. Click Restore to begin restoring your configuration backup. See "Restoring from a Configuration Backup" on page 482.
b. Click the associated edit icon ( ) or the name of the backup file to change your configuration backup parameters.
c. If the backup file you want is disabled, click the icon to enable it ( ) .
d. If a backup file you want is enabled , click the icon to disable it ( ).
Administrator's GuideChapter 5: Configuration
Running a Configuration Backup Page 480 of 743
Scheduling Reoccurring Backups
When scheduling reoccurring backups, set the scheduling options as described in "Scheduling Date and Time Options" on page 157.
Running a Configuration Backup with SSH KeyFollow these steps to create and run a backup using an SSH key of your Logger configuration information.
Step 1: Create a valid SSH-key
1. From the {User home directory}/.ssh/ location, create the SSH key. Make sure is the same user during installation.
l Add a name for the key. If no name is provided, the key will be named id_rsa.
l Add a password (optional). If no password is provided, it will remain as no passphrase.
2. Generate the SSH key: ssh-keygen.
3. Run the command: ssh-copy-id -i ~/.ssh/mykey user@host to copy the SSH key.
Step 2: Configure the backup -SCP Transfer
1. Go to Configuration > Advanced Configuration > Configuration Backup.
2. Click the configuration backup hyperlink and edit the following parameters based on the 4 types of SCP transfer file configuration:
l Default key name (no password required)
l Custom key name (password)
l Multiple methods (custom key name and user/ password)
l Standard (user/ password)
Parameter SCP transfer file configuration
Transfer File Using All SCP transfer files.
Port All SCP transfer files (22).
IP/Host All SCP transfer files.
User All SCP transfer files.
Administrator's GuideChapter 5: Configuration
Scheduling Reoccurring Backups Page 481 of 743
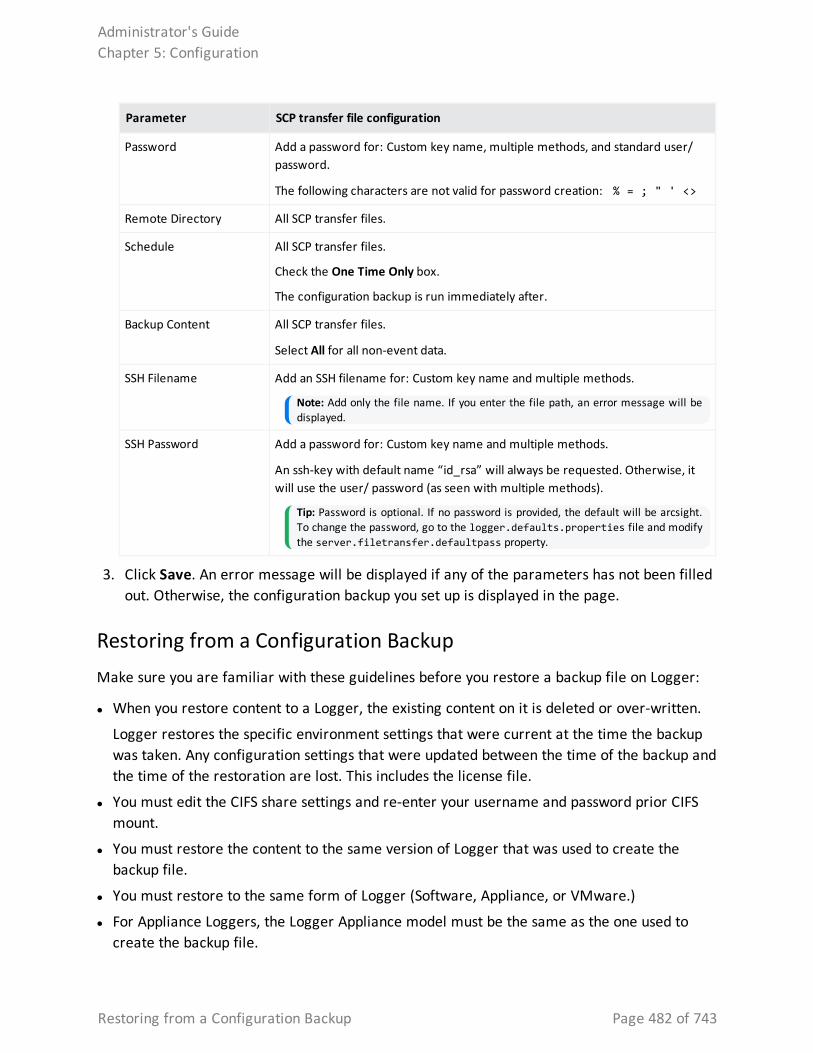
Parameter SCP transfer file configuration
Password Add a password for: Custom key name, multiple methods, and standard user/ password.
The following characters are not valid for password creation: % = ; " ' <>
Remote Directory All SCP transfer files.
Schedule All SCP transfer files.
Check the One Time Only box.
The configuration backup is run immediately after.
Backup Content All SCP transfer files.
Select All for all non-event data.
SSH Filename Add an SSH filename for: Custom key name and multiple methods.
Note: Add only the file name. If you enter the file path, an error message will be displayed.
SSH Password Add a password for: Custom key name and multiple methods.
An ssh-key with default name “id_rsa” will always be requested. Otherwise, it will use the user/ password (as seen with multiple methods).
Tip: Password is optional. If no password is provided, the default will be arcsight. To change the password, go to the logger.defaults.properties file and modify the server.filetransfer.defaultpass property.
3. Click Save. An error message will be displayed if any of the parameters has not been filled out. Otherwise, the configuration backup you set up is displayed in the page.
Restoring from a Configuration BackupMake sure you are familiar with these guidelines before you restore a backup file on Logger:
l When you restore content to a Logger, the existing content on it is deleted or over-written.
Logger restores the specific environment settings that were current at the time the backup was taken. Any configuration settings that were updated between the time of the backup and the time of the restoration are lost. This includes the license file.
l You must edit the CIFS share settings and re-enter your username and password prior CIFS mount.
l You must restore the content to the same version of Logger that was used to create the backup file.
l You must restore to the same form of Logger (Software, Appliance, or VMware.)
l For Appliance Loggers, the Logger Appliance model must be the same as the one used to create the backup file.
Administrator's GuideChapter 5: Configuration
Restoring from a Configuration Backup Page 482 of 743
l For Software Loggers and Loggers on VMware, the operating system that Logger is running must be the same as the one used to create the backup file.
l Since the current license will be over-written by the backup, retain a copy of the existing license to re-apply after the Restore is complete, if appropriate.
To restore from a configuration backup:
1. Open the Configuration | Advanced menu and then click Configuration Backup.
2. Click Restore.
The Upload Configuration Backup option displays on the Configuration Backup page. You will see a message that after restoring the configuration, Logger will need to be restarted.
3. Click Browse to locate the backup file.
4. Click Submit to start the restore process.
5. When the restore process is complete, you will be prompted to reboot your Logger:
a. Logger Appliance—When the restore process is complete, you will be redirected to the System Admin > System > System Reboot page. Select Reboot and click Reboot. See "System Reboot" on page 501.
b. Software Logger—When the restore process is complete, you will be prompted to reboot your system. See "Software Logger Command Line Options" on page 571.
Tip: You may need to upload a new license or re-apply a copy of the license in place before the backup.
Content ManagementDepending on their rights, users can export Alerts, Dashboards, Fieldsets, Filters, Parsers, Saved Searches, and Source Types from a Logger to a file, and then import that content onto another Logger or re-import it onto that same Logger, as a backup. For information on the user rights necessary to import or export a particular type of content, instructions, and guidelines for importing and exporting Logger content, see "User Rights for Exporting Content" on page 485 and "User Rights for Importing Content" on the next page.
Content import and export is useful in these situations:
l When you want to make a backup of Logger content. If your Logger becomes unavailable or is reset to its factory defaults, you can quickly restore its content by importing the saved content.
l When multiple Loggers with the same content need to be installed in your network, you need to configure only one Logger. Subsequent Loggers can be deployed by importing the first
Administrator's GuideChapter 5: Configuration
Content Management Page 483 of 743
Logger’s content on them, thus reducing deployment time.
l When you want to add content from one Logger to the content on another.
The Export function saves the content from a Logger to a storage location on your network or to the local disk of the computer from which you connect to the Logger. When you need to use that content for any of the situations described previously, simply import the saved content.
User Rights for Importing ContentThe content you are able to import depends on your user rights. If you have any of the following rights, the Import Content dialog box is available:
l Logger Rights > Filters: Edit, save, and remove shared filters.
l Logger Rights > Forwarders and Alerts: Edit, save, and remove forwarders and alerts.
Note: While this Logger right enables you to edit, save, and remove both forwarders and alerts, you can only import alerts, but not forwarders.
l Logger Rights > Dashboards: Edit, save, and remove dashboards.
If the user has the dashboard save right but does not have the saved search save right, then the dashboards using search results panels will not be imported (A warning message will indicate which dashboards are skipped).
l Logger Rights > Saved Search: Edit, save, and remove saved search.
l System Admin: For parsers and source types, the user can be assigned to any System Admin group. If the user is not an admin, then Parsers and Source Types are not importable.
See "Users/Groups" on page 545 for more information on Logger user rights and how to administer them.
Even if you see the Import page, you may not be able to import all of the content types. If you do not have the associated user rights, then you cannot import that type of content, and will get a warning message instead.
Importing ContentMake sure you are familiar with these guidelines before importing Logger content:
l If an object with the same name exists on the importing system, the object being imported is named <ObjectName> [import]. For example, an imported alert is named AlertName [import] and an imported filter is named FilterName [import].
If an object with the name <ObjectName> [import] already exists on the importing Logger (from a previous import procedure), the object being imported is named <ObjectName> [import] [import].
Administrator's GuideChapter 5: Configuration
User Rights for Importing Content Page 484 of 743
l Be sure to set the alert destinations (SNMP, Syslog, Transformation Hub, ESM Destination, and SMTP servers) for alerts you import, because this information is not included in the exported content.
l Content Export and Import assumes that the importing Logger has the same configuration setup as the exporting Logger. The Logger your are importing your content to must have the same configuration setup, such as devices, device groups, storage groups as the exporting Logger. If it does not imported content that relies on that configuration cannot be used.
To import content from another Logger:
1. Open the Configuration | Advanced menu and then click Import Content.
2. Click Browse to locate the file
The file must reside on a local or remote drive accessible to the system whose browser you are using to access Logger’s user interface.
3. Click Import.
User Rights for Exporting ContentThe content you are able to export depends on your user rights. If you have any of the following rights, the Export page discussed in "Exporting Content" on the next page is available:
l Logger Rights > Filters: Use and view shared filters.
l Logger Rights > Forwarders and Alerts: View forwarders and alerts.
Note: While this Logger right enables you to view both forwarders and alerts, you can only export alerts, but not forwarders.
l Logger Rights > Dashboards: Use and view dashboards.
If the user has the dashboard read right but does not have the saved search read right, then dashboards having search results panels are not available for selection from the Content to Export dialog box.
l Logger Rights > Fieldsets: View fieldsets.
l Logger Rights > Saved Search: View saved search.
l System Admin: For parsers and source types, the user can be assigned to any System Admin Group. If the user is not an admin, then Parsers and Source Types are not exportable.
See "Users/Groups" on page 545 for more information on Logger user rights and how to administer them.
Even if you see the Export page, you may not be able to export all of the content types. If you do not have one of the above user rights, then the corresponding content type is not available in the Content to Export dialog box.
Administrator's GuideChapter 5: Configuration
User Rights for Exporting Content Page 485 of 743
Exporting ContentMake sure you are familiar with these guidelines before exporting Logger content:
l The exported content is in XML format in a gzip file. For example, allfilters.xml.gz.
l The folder on the remote file system to which you are exporting Logger content needs to exist before you can export content to it.
l When exporting alerts, the query associated with the alert, match count, threshold, and status are included in the export. The export does not include e-mail, SNMP, ESM Destination information, or syslog destination information. Since alert destination (SNMP, Syslog, ESM Destination, Transformation Hub Destination, and SMTP servers) information is not exported, you will need to set this information for alerts you import.
l When exporting dashboards, the content of any saved searches used in the exported dashboards is also exported.
l When exporting source types, the content of the parsers used in the exported source types is also exported.
To export Logger content:
1. Open the Configuration > Advanced menu and then click Export Content.
2. Select the radio button for the type of content that you want to export. The available objects menu changes with the type of content you select.
3. Select the objects to export from the menu.
To select one object, click its name. To select multiple objects, hold the Ctrl key down and click the names.
4. For Software Loggers, click Export. The content will be saved according to your browser settings. If you are using a Logger Appliance, continue to the next step.
5. For Appliance Loggers, choose where to save the exported content. Save to local disk is the default option.
To save on the local disk of the computer from which you connect to the Logger, leave Save to local disk checked.
Administrator's GuideChapter 5: Configuration
Exporting Content Page 486 of 743
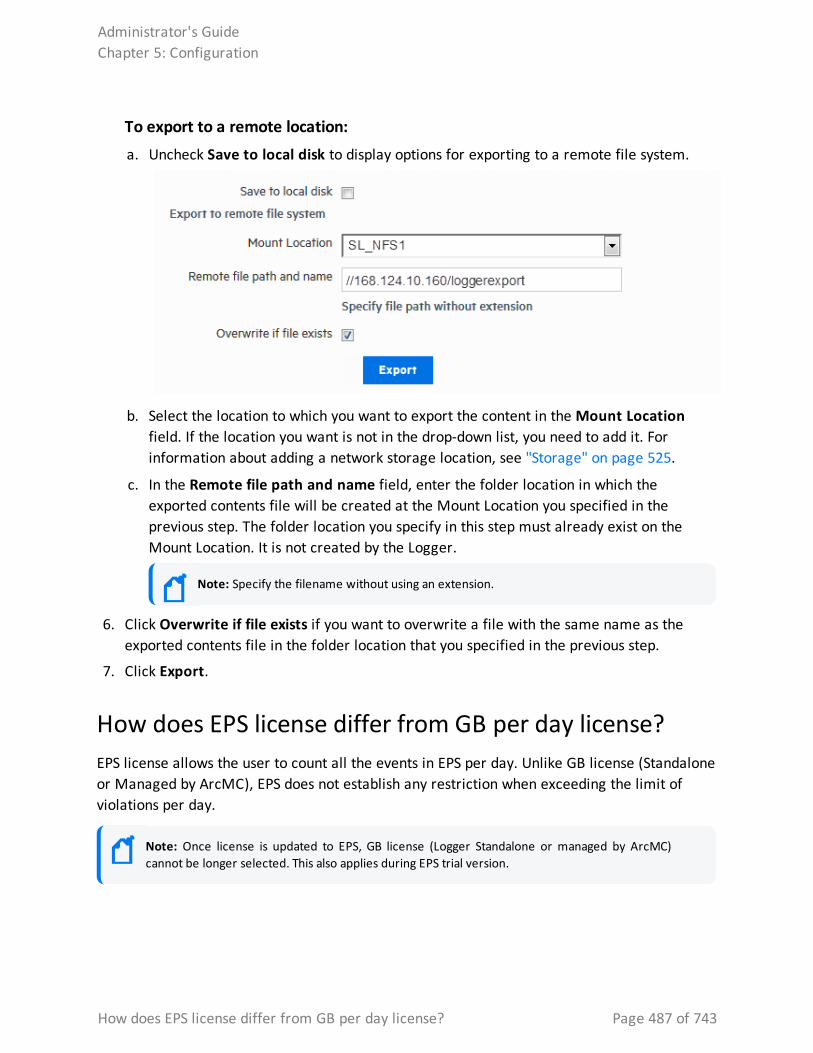
To export to a remote location: a. Uncheck Save to local disk to display options for exporting to a remote file system.
b. Select the location to which you want to export the content in the Mount Location field. If the location you want is not in the drop-down list, you need to add it. For information about adding a network storage location, see "Storage" on page 525.
c. In the Remote file path and name field, enter the folder location in which the exported contents file will be created at the Mount Location you specified in the previous step. The folder location you specify in this step must already exist on the Mount Location. It is not created by the Logger.
Note: Specify the filename without using an extension.
6. Click Overwrite if file exists if you want to overwrite a file with the same name as the exported contents file in the folder location that you specified in the previous step.
7. Click Export.
How does EPS license differ from GB per day license? EPS license allows the user to count all the events in EPS per day. Unlike GB license (Standalone or Managed by ArcMC), EPS does not establish any restriction when exceeding the limit of violations per day.
Note: Once license is updated to EPS, GB license (Logger Standalone or managed by ArcMC) cannot be longer selected. This also applies during EPS trial version.
Administrator's GuideChapter 5: Configuration
How does EPS license differ from GB per day license? Page 487 of 743
Characteristics GB EPS
Trial version Not available from ArcSight. Available as default option in version 7.2
Over limit restrictions After 5 violations over the last 30 days.
No Logger enforcement.
License Usage Page It shows the date and GB/day It shows date, events received, MMEPS, and license capacity
Chart limit description Blue: under the limit
Yellow: warning
Red: over the limit
Green: under the limit
Yellow: warning
Red: over the limit
Days displayed 30 days 45 days
Banner Existent Not existent
Report Not available Available in PDF format only
Standalone License InformationThis topic applies to standalone ArcSight Loggers, newly upgraded Loggers, and Trial Loggers.
Information regarding all licenses is available at Configuration> License Information. Based on the license supported, tables and columns display different information. The license screen shows information about the type of model, daily data or EPS as well as their correspondent limits.
GB licenses are continued to be supported with no significant changes in behavior. However, Logger recommends the user to transition to EPS license before GB Standalone is not longer supported. For more information, contact your sales representative.
Logger Standalone EPS License EPS license does have a maximum limit of violations; however it does not issue a warning banner of X violations over Y days. The customer is considered to be in compliance with the license agreement as long as the MMEPS value indicators remain at the limit or below the purchased licensed capacity. If 3 or more consecutive MMEPS value indicators exceed their capacity based on the purchased license, they are considered to be out of compliance.
Graphic and table under Configuration> License Usage display the last 45 days of usage. The graphic shows the label violations, maximum EPS permitted per day, and the number of violations that Logger has in 45 days. You can download the last 45 days license report in PDF format. Export button is available in the License Usage page.
Administrator's GuideChapter 5: Configuration
Standalone License Information Page 488 of 743
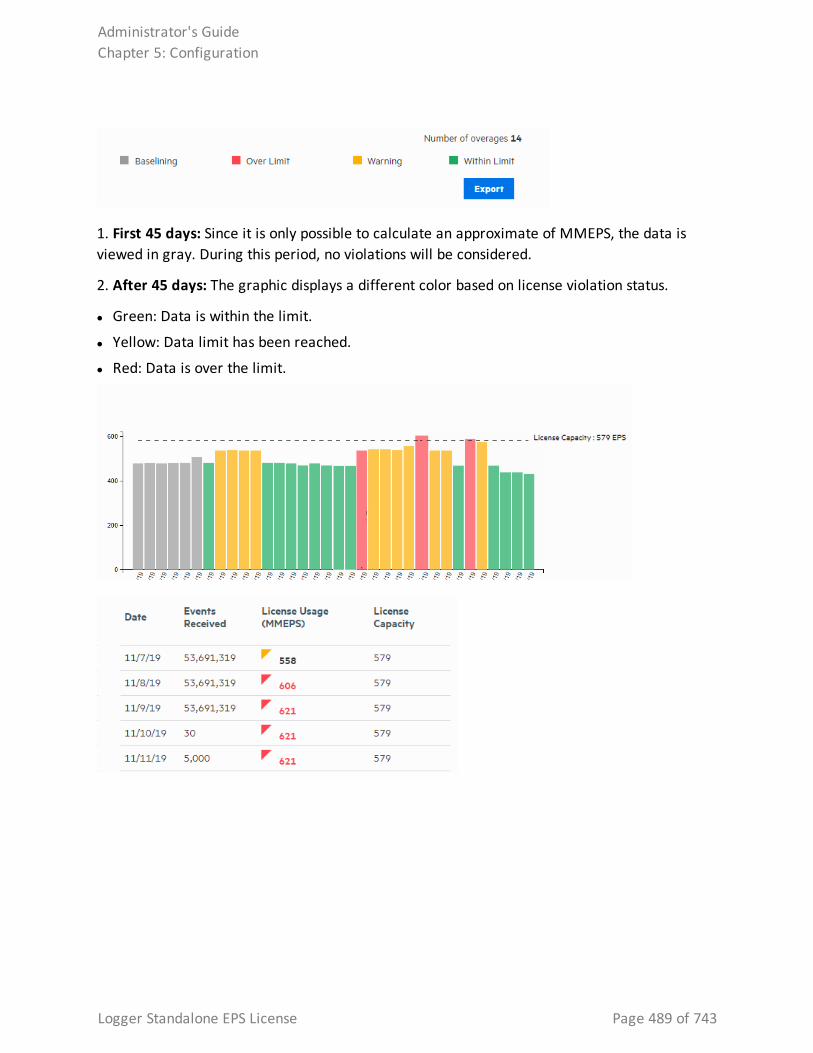
1. First 45 days: Since it is only possible to calculate an approximate of MMEPS, the data is viewed in gray. During this period, no violations will be considered.
2. After 45 days: The graphic displays a different color based on license violation status.
l Green: Data is within the limit.
l Yellow: Data limit has been reached.
l Red: Data is over the limit.
Administrator's GuideChapter 5: Configuration
Logger Standalone EPS License Page 489 of 743
Value Indicators Description
Events per Day (EPD)
Provides the total number of events generated in a 24 hour clock period.
The clock is calculated based on UTC time starting at 00:00:00 and ending at 23:59:59, regardless of the local times used.
Sustained EPS (SEPS)
Stabilizes peaks and valleys and gives a better indication of use. This is an event “constant” per second supported by the system within the 24 hour clock period.
To calculate SEPS, divide EPD by 60 (seconds) by 60 (minutes) by 24 (hours).
Moving Median EPS (MMEPS)
(Also known as license usage).
Uses the 45 day period SEPS data shifting the calculation window 1 day every 24 hours after the first 45 days. The clock is calculated based on UTC time starting at 00:00:00 and ending at 23:59:59, regardless of the local times used.
To calculate MMEPS, calculate SEPS median average for the window period (current day – 1).
o Before 45 days: The median SEPS for the days available calculates an approximate value. Select the median value from the sorted array of an odd number of SEPS. If it contains an even number, compute an average of the 2 median values. If required, round value to the approximate integer.
o After 45 days: Select the median SEPS value from the window period.
License Usage Corresponds to the amount of EPS acquired in the license.
Logger Standalone GB per day License On GB standalone Logger, the License Usage page (Configuration | Advanced > License Usage) displays the daily ingested data volume, the licensed GB per day, and the number of license violations that have occurred using the size of raw events received by Logger. There is a limit of five data volume license violations in a 30 day period. Logger displays a "Licensed Data Volume Limit Exceeded" warning banner when your incoming data volume is greater than this limit.
In the data volume chart, a vertical line indicates your licensed daily data volume, a blue bar indicates you are below 90% of your license limit for that day, a yellow bar indicates that you have reached 90% of your license limit for that day, and a red bar indicates that you have exceeded your license limit for that day. Below the chart, the number of violations, maximum allowed violations, and licensed GB per day are listed and the table displays the data ingested for each of the past 30 days.
Caution: If the data-limit has been exceeded six times in 30 days, you cannot use any search-related features until the listed 30 days have five or fewer violations. The disabled search-related features include forwarders as well as all searching and reporting functionality.
Administrator's GuideChapter 5: Configuration
Logger Standalone GB per day License Page 490 of 743
You can view your license usage limit and other license information on Logger under Configuration > License Usage.
The data volume restriction function measures the daily data for the previous 24 hours at 00:00:00 UTC and posts that information on the license usage page. The time this functions uses is independent of the Logger's local time. The License Usage page (Configuration | Advanced > License Usage) shows the amount of data stored on your Software Logger for each of the last 30 days.
Caution: The disabled search features include forwarders as well as all searching and reporting functionality.
Managed by ArcMC License Information This topic applies to SODP Logger licensed only.
Refer to ArcSight Management Center Administrator’s Guide for further information on Licenses managed by ArcMC.
GB managed by ArcMC License UsageThere are no license usage restrictions in GB Software License managed by ArcMC as license usage information is calculated by the connectors managed by ArcMC. In the License Usage chart, a blue bar indicates that the Logger was managed by ArcSight Management Center for that day and an orange bar indicates the Logger was non managed for that day.
In Configuration > Advanced > License Usage, thanks to the tracking information in the agent.log , the user can view the daily ingested license usage and the management status of the Logger. Below the chart you can see the number of days non managed, maximum allowed non managed days, and last managed days as well as a table containing the data ingested for each during the last 30 days.
For more information regarding GB license managed by ArcMC, see ArcSight Management Center Administrator’s Guide.
EPS managed by ArcMC License Usage Just like GB License, EPS can be managed by ArcMC. This option is set as default in the Logger. To disable this functionality, uncheck the box located at: System Admin > Options.
In the License Usage page, the graphic does not display the license violation status. Only first 45 days (gray) and after 45 days (green) are displayed in the chart.
Administrator's GuideChapter 5: Configuration
Managed by ArcMC License Information Page 491 of 743
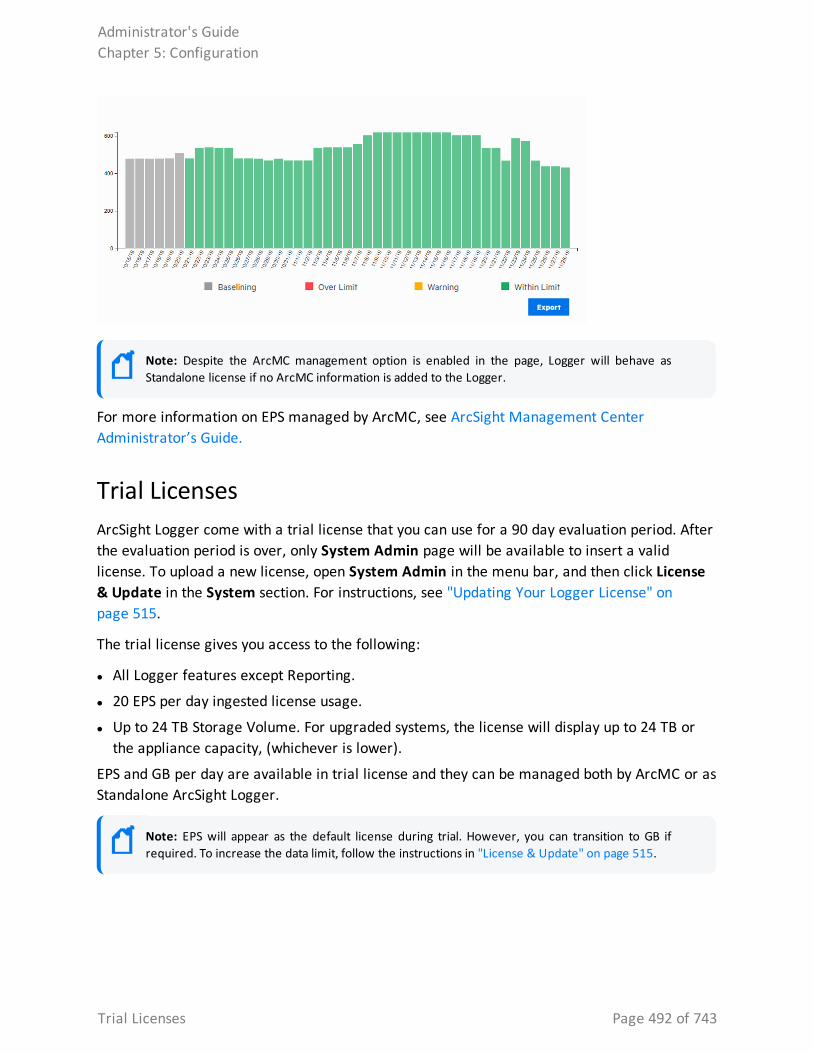
Note: Despite the ArcMC management option is enabled in the page, Logger will behave as Standalone license if no ArcMC information is added to the Logger.
For more information on EPS managed by ArcMC, see ArcSight Management Center Administrator’s Guide.
Trial LicensesArcSight Logger come with a trial license that you can use for a 90 day evaluation period. After the evaluation period is over, only System Admin page will be available to insert a valid license. To upload a new license, open System Admin in the menu bar, and then click License & Update in the System section. For instructions, see "Updating Your Logger License" on page 515.
The trial license gives you access to the following:
l All Logger features except Reporting.
l 20 EPS per day ingested license usage.
l Up to 24 TB Storage Volume. For upgraded systems, the license will display up to 24 TB or the appliance capacity, (whichever is lower).
EPS and GB per day are available in trial license and they can be managed both by ArcMC or as Standalone ArcSight Logger.
Note: EPS will appear as the default license during trial. However, you can transition to GB if required. To increase the data limit, follow the instructions in "License & Update" on page 515.
Administrator's GuideChapter 5: Configuration
Trial Licenses Page 492 of 743
Logger Software Installations and LicensesIn an effort to distant from GB / day based license, you can opt for a new license model named EPS. This license will count the events per second instead of GB/day and EPS. This license will be available in trial version. For more information, see "How does EPS license differ from GB per day license? " on page 487
Guidelines for Software Installations and licenses
l On Fresh Install, Both GB and EPS can be selected as license options.
l On Factory Restore for L7700 appliances, EPS license will appear as the only valid license.
l When upgrading from Logger 6.7x to 7.2, both GB and EPS appear as license options. If the user selects EPS license, Logger cannot longer display GB data. Only EPS data is displayed under License Usage page.
l If a license is installed, make sure to restart your Logger after the license update.
Peer NodesLogger establishes peer relationships with one or more Loggers or ArcSight Managers to enable distributed searches. To search for other Loggers or Managers, you must define one or more peers.
When two systems peer with each other, the initiator (System A) sends credentials to authenticate itself to the target (System B). If the authentication succeeds, a peer relationship is generated.
Overview Steps for Configuring Peers
The following steps are required to set up peer relationships:
1. Determine which Manager or Logger will initiate the peer relationship. Manager or Logger A is the initiator, and Logger B is the target.
2. Choose the peer authentication. See "Selecting a Peer Authentication Method" on page 496 for further details.
l Username and Password authentication:Determine the user name and password the initiator (Manager or Logger A) used to authenticate itself when peering with the target (Logger B). You can also set up a user, as described in "Users/Groups" on page 545.
Administrator's GuideChapter 5: Configuration
Logger Software Installations and Licenses Page 493 of 743
l Authorization ID and Code authentication:On the target (Manager or Logger B), generate an Authorization ID and Code for the initiator (Logger A) to authenticate itself when peering. For instructions, see "Authorizing a Peer" on page 497.
3. On the initiator, add the authentication information from the target, as described in "Adding a Peer" on page 497.
l For Username and Password authentication, use the user name and password that you determined.
l For Authorization ID and Code authentication, use the Authorization ID and Code that you generated.
Guidelines for Configuring PeersConsider these guidelines when configuring peers:
l Running a high quantity of searches (including peers) may impact the performance. It is recommended to use search head strictly for searching. For further details, see the Best Practices Guide.
l Logger 7.2 can peer with ESM 6.11, 6.9, 6.8c, 6.5c, and Logger 5.3 and above.
l Before adding a peer older than Logger 6.5.0, you need to enable the TLS protocol by adding the TLSv1.2 value to the fips.ssl.enabledprotocols property located in the logger.defaults.properties file.
l A maximum of 100 peers can be configured for a Logger.
l The system time and date on each Manager or Logger must be set correctly for its time zone. Micro Focus recommends to synchronize your system time with an NTP server regularly.
l If the remote Logger is configured for SSL Client authentication (SSL/CAC Authentication), you must configure an authorization ID and code on the initiator Logger.
l FIPS-enabled Loggers can use any of the allowed authentication methods. There are no special authentication requirements.
l Peers cannot be edited, however you can delete and re-add a peer.
l If you are running distributed searches (searches across peers), follow these additional guidelines:
a. A user must belong to the Logger Search User Group and Logger Rights Group. Make sure to set to Yes the following privileges: “Search for events on remote peers” and “View registered peers”. See "Searching Peers (Distributed Search)" on page 121.
b. Users performing search operations have the same peer privileges as those on the Logger they are logged into. For example, User A is restricted by a search group filter to
Administrator's GuideChapter 5: Configuration
Guidelines for Configuring Peers Page 494 of 743
only search for events in which deviceVendor is set to “Cisco.” When User A performs a search operation across Logger A's peers, the same constraint (to search events where deviceVendor = “Cisco”) is applied on all peers.
For additional information, see "Selecting Groups, Devices, and Peers" on page 196.
l Peer search communications have a predetermined timeout limit. To update this time frame due to a slow response from the peer nodes, modify the following timeout properties in the logger.defaults.properties file:
Tip: Make sure to always restart the Logger services after updating any of the following properties.
a. To remove the 500 HTTP error from the peer, modify the default value in the property in the head: peer.retryRequest (=2 by default)
b. To kill the current search in case of a communication failure, decrement the session ID by modifying the default value: peer.inactivity.from.head.timeout (by default =10)
c. By default, peer internal events are disabled. To enable this, make sure the following value is set to true: peer_stats.interval.events.on=true
Caution: Enabling the peer stats internal events will affect the peer search performance in both Classic and Search UIs.
d. To save the intermediate internal events, set to true the following value: peer_stats.interval.events.intermediate_events=true
e. To customize the frequency of storing the intermediate value, update the 2 property values below.
peer.stats.unit.interval (defines the unit value: seconds, minutes, or hours)
peer.stats.period.interval (defines the number)
f. To avoid a slow peer to become a failed search, contact Support to update the peer.search.slow.timeout and peer.search.number.of.retry properties.
g. For environments with several peers in 7.0.1 or prior and the head restarted multiple times, add the following property in the peer: server.search.maxseqsession (by default =160)
l Any update on username and password (used for remote peer authentication) after establishing the peer relationship will not impact the connection. However, if the peer relationship is deleted or broken, make sure to provide the new credentials to re-establish the relationship.
Administrator's GuideChapter 5: Configuration
Guidelines for Configuring Peers Page 495 of 743
l You cannot reestablish a peer relationship with an improper tear-down, like deleting the peer relationship on one Logger while the other is unavailable (powered down). Make sure to delete the existing peer information from the peer Loggers before re-establishing the relationship.
l Restarting the head peer before sending signal to the peers will not decrement the sequential searches.
l Restarting reduces the sequential searches in peer nodes.
l The following circumstances do not decrement the sequential search:
o Logger installation port blocked in peer.
o The Apache stopped in peer.
o A communication error between peer and master.
o A peer with a Logger version prior to 7.1.0.
Authenticating PeersAuthentication happens only once, at the time the peer relationship is created. The authorization to use peer services is implicit each time a remote system receives peer requests from a system that previously authenticated as a peer.
You can authenticate a peer in one of two ways:
l Peer Authorization ID and Code: These credentials are generated on one Manager or Logger and used on another to configure peering between the two. When generating the Authorization ID and Code, enter the IP address of the Manager or Logger you will use to initiate peering in the Peer Authorization page of the one you want to peer with. The IP address is used to generate a unique ID and code that can be used only for peering from that address. Therefore, this method is more secure than using a user name and password.
Note: Micro Focus ArcSight recommends using Peer Authorization ID and Code for authentication.
l User name and password: A user name and password already configured on the target system is used for authentication.
Selecting a Peer Authentication Method
l When using a user name and password to configure peering, you must use the user password for local authentication, even if your system is configured to use LDAP or RADIUS authentication.
Administrator's GuideChapter 5: Configuration
Authenticating Peers Page 496 of 743
l If the peer Manager or Logger is configured for SSL Client authentication (CAC), you must configure an Authorization ID and Code on the target Manager or Logger. You cannot use a user name and password.
l FIPS-enabled systems are not limited to a specific authentication method.
Authorizing a Peer
Use the following procedure to generate the Authorization ID and Code on the target Manager or Logger with which you want to establish a peer relationship. (Manager or Logger B in the example in "Peer Nodes" on page 493.) After that, use the ID and Code on the initiating Manager or Logger when configuring the peer relationship (Manager Logger A in that example) .
To generate the Authorization ID and Code to use when configuring a peer relationship:
1. Open the Configuration | Advanced menu and click Peer Authorizations.
2. Click Add.
3. Enter the hostname or IP address and port for the Manager or Logger you want to peer with this system.
4. Click Save.
The authorization ID and authorization code display. Copy this information and use it on the other Manager or Logger when adding this system as a peer.
5. Click Done to return to the Peer Authorization list.
Adding and Deleting Peer RelationshipsThe Peer Nodes page displays the current peer relationships. From here, you can add and delete peers.
Adding a Peer
Adding a peer creates a peer relationship between two Loggers, two ArcSight Managers, or a Logger and a Manager. Once added, you can delete a peer, but you cannot edit it. See "Guidelines for Configuring Peers" on page 494 for more information.
Adding a peer on a Logger is a bi-directional process. That is, when Logger A adds peer access for Logger B, Logger B automatically adds peer access for Logger A. Similarly, if you delete the peer access for B on A, the peer access for A is automatically deleted on B.
Administrator's GuideChapter 5: Configuration
Authorizing a Peer Page 497 of 743
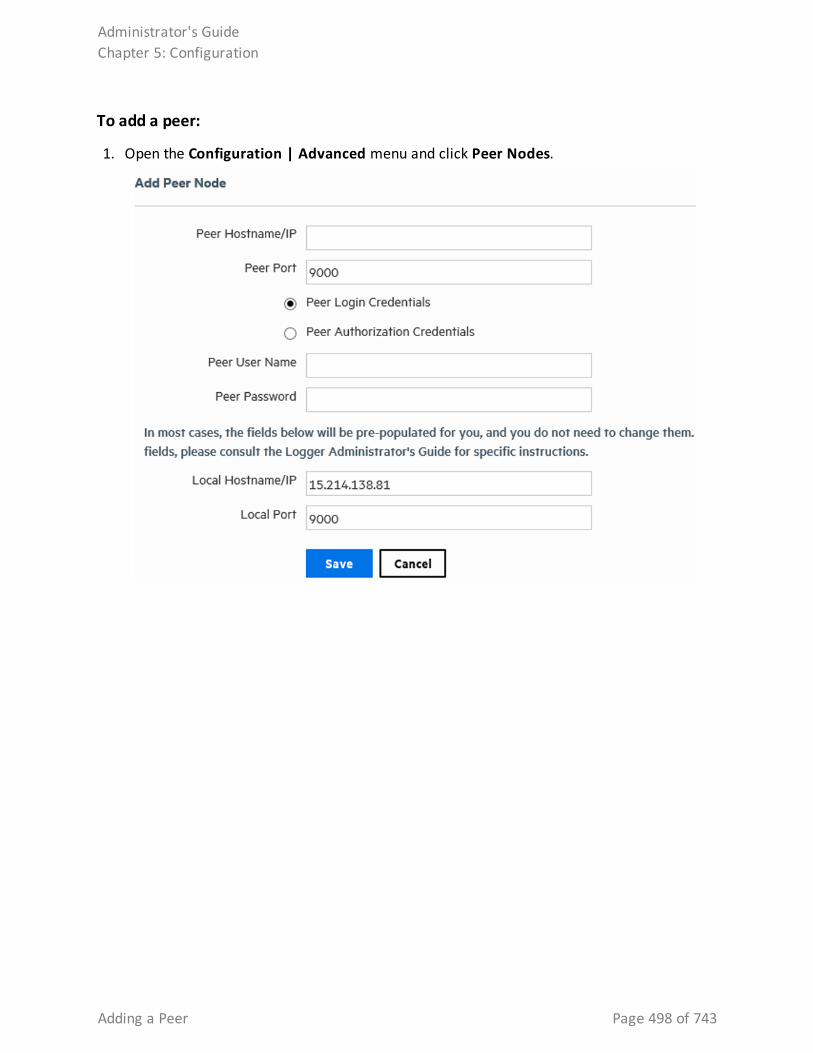
To add a peer:
1. Open the Configuration | Advanced menu and click Peer Nodes.
Administrator's GuideChapter 5: Configuration
Adding a Peer Page 498 of 743
2. Click Add and enter the following parameters.
Parameter Description
Peer Hostname/IP
Enter the target Manager or Logger’s hostname or IP address.
Peer Port Use the port configured when installing or initially configuring the target system. See "Guidelines for Configuring Peers" on page 494.
By default, this is Port 443 for the Logger Appliances.
Peer Login Credentials
Peer Authorization Credentials
Select Peer Login Credentials for password-based authentication.
OR
Select Peer Authorization Credentials to use an Authorization ID and Code.
l On systems using local or RADIUS authentication, you can use either authentication method, although peer Authorization ID and Code are recommended.
l On systems using SSL Client Authentication (CAC), Authorization ID and Code is the only way to authenticate a peer. You cannot use a user name and password. (See "SSL Client Authentication" on page 538.)
l FIPS-enabled systems are not limited to a specific authentication method.
If you selected Peer Login Credentials…
Peer User Name
Enter a user name already configured on the target system.
Peer Password Enter the password for the user specified in the Peer User Name field.
If you selected Peer Authorization Credentials…
Peer Authorization ID
Enter the authorization ID generated on the target Manager or Logger. (See "To generate the Authorization ID and Code to use when configuring a peer relationship:" on page 497 for more information.)
Peer Authorization Code
Enter the authorization code generated on the target Manager or Logger. (See "To generate the Authorization ID and Code to use when configuring a peer relationship:" on page 497 for more information.)
Administrator's GuideChapter 5: Configuration
Adding a Peer Page 499 of 743
Parameter Description
Other Fields These fields need to be updated in rare circumstances.
Local Hostname/IP
In most cases, the value in this field matches the IP address or host name you use to connect to this Logger from your browser, and you do not need to do anything.
However, if the IP address does not match (for example, when the Logger is behind a VPN concentrator), change the value to match the IP address or host name with which you connect to this Logger.
Local Port In most cases, the value in this field matches the port in your browser when you logged into this system (the initiating Manager or Logger), and you do not need to do anything.
However, if the port here does not match the port in the IP address, (for example, when the Manager or Logger is behind a VPN concentrator), change the value to match the port in the IP address in your browser.
3. Click Save to add the new Logger, or Cancel to quit.
Deleting a Peer
Deleting a peer removes the peer relationship between two Loggers or two ArcSight Managers, or a Manager and a Logger. You can perform this process from either peer.
To delete a peer:
1. Open the Configuration | Advanced menu and click Peer Nodes.
2. Locate the peer you want to delete the peer relationship to and click the Delete icon ( ) on that row.
3. Confirm the deletion by clicking OK, or click Cancel to retain the Peer.
Administrator's GuideChapter 5: Configuration
Deleting a Peer Page 500 of 743
Chapter 6: System AdminSystem Administration tools enable you to create and manage users and user groups, and to configure security settings, SMTP, and other system settings.
Note: Some System Administration topics apply to Software Loggers, some to Logger appliances, and some to both types of Logger. The type of Logger to which the topic applies is noted at the top of each System Administration topic.
The following subjects are covered in this section:
SystemFrom the System tab, you can configure system-specific settings.
System LocaleThis topic applies to both Software Logger and the Logger Appliance.
The System Locale setting ensures that the user interface displays information such as date, time, numbers, and messages in the format and language appropriate for the selected country.
The System Locale is configured during the Logger installation process. Once configured it cannot be changed.
To view the System Locale:
1. Click System Admin from the top-level menu bar.
2. Click System Locale in the System section. The System Locale Setting dialog box displays the Locale.
System RebootThis topic applies to Logger Appliances only.
You can reboot or shutdown your appliance. For related information for Software Logger, see "Software Logger Command Line Options" on page 571
To reboot or shutdown your system:
1. Click System Admin from the top-level menu bar.
2. Click System Reboot in the System section.
Chapter 6: System Admin Page 501 of 743
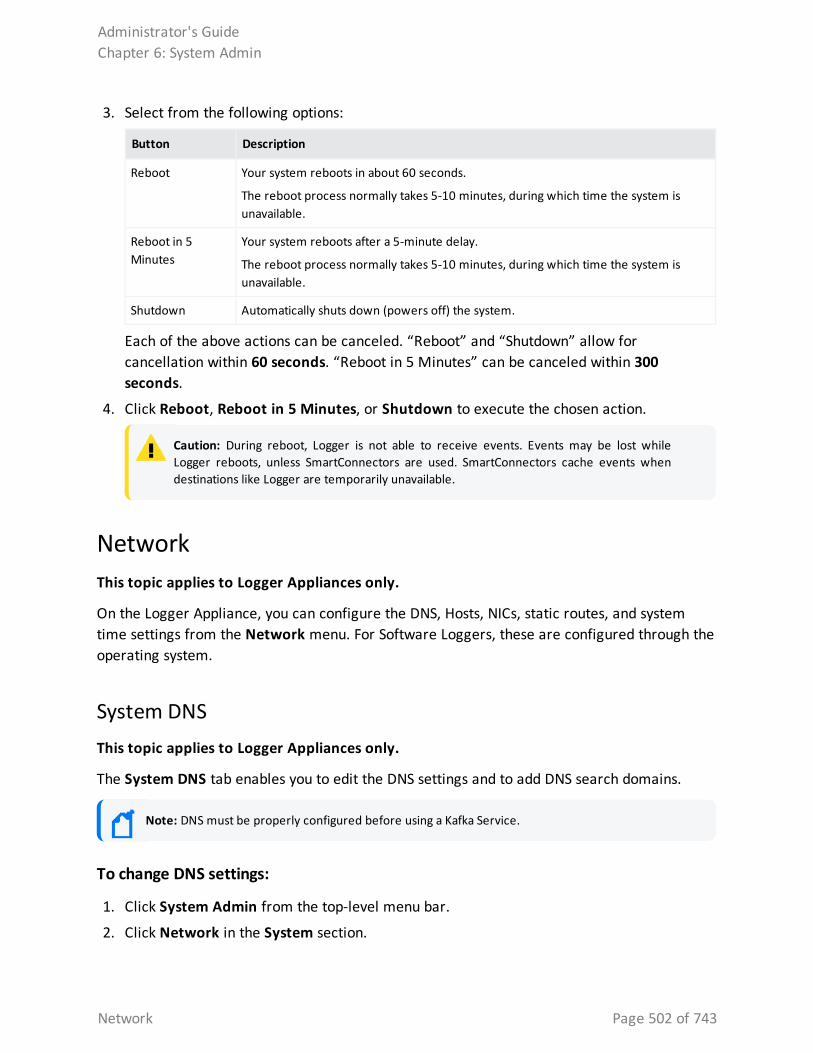
3. Select from the following options:
Button Description
Reboot Your system reboots in about 60 seconds.
The reboot process normally takes 5-10 minutes, during which time the system is unavailable.
Reboot in 5 Minutes
Your system reboots after a 5-minute delay.
The reboot process normally takes 5-10 minutes, during which time the system is unavailable.
Shutdown Automatically shuts down (powers off) the system.
Each of the above actions can be canceled. “Reboot” and “Shutdown” allow for cancellation within 60 seconds. “Reboot in 5 Minutes” can be canceled within 300 seconds.
4. Click Reboot, Reboot in 5 Minutes, or Shutdown to execute the chosen action.
Caution: During reboot, Logger is not able to receive events. Events may be lost while Logger reboots, unless SmartConnectors are used. SmartConnectors cache events when destinations like Logger are temporarily unavailable.
NetworkThis topic applies to Logger Appliances only.
On the Logger Appliance, you can configure the DNS, Hosts, NICs, static routes, and system time settings from the Network menu. For Software Loggers, these are configured through the operating system.
System DNSThis topic applies to Logger Appliances only.
The System DNS tab enables you to edit the DNS settings and to add DNS search domains.
Note: DNS must be properly configured before using a Kafka Service.
To change DNS settings:
1. Click System Admin from the top-level menu bar.
2. Click Network in the System section.
Administrator's GuideChapter 6: System Admin
Network Page 502 of 743
3. In the System DNS tab, enter new values for the IP address of the primary and secondary DNS servers, or edit the list of search domains.
To add a new domain, click the icon. To remove a domain, click the icon. To change the search order of domains, select a domain name, and click the up or down arrow until the domain is in the desired position.
4. Click Save.
5. Click Restart Network Service to put the changes into effect.
HostsThis topic applies to Logger Appliances only.
The Hosts tab enables direct editing of your system’s /etc/hosts file. You can enter data in the System Hosts text box or import it from a local file.
To change the Hosts information:
1. Click System Admin from the top-level menu bar.
2. Click Network in the System section, and then click the Hosts tab.
3. In the System Hosts text box, enter hosts information (one host per line) in this format:
<IP Address> <hostname1> <hostname2> <hostname3>
To import information from a file, click Import from Local File, and locate the text file on the computer from which you are accessing your system.
4. Click Save.
NICsThis topic applies to Logger Appliances only.
The NICs tab enables you to set the IP addresses for the network interface cards (NICs) on your system. Additionally, you can configure the hostname and default gateway for your system.
To set or change the NICs settings:
1. Click System Admin from the top-level menu bar.
2. Click Network in the System section.
3. In the NICs tab, enter the following settings. To edit the IP address, subnet mask, or speed/duplex of an NIC, select the NIC and click Edit above the NIC Name list.
Administrator's GuideChapter 6: System Admin
Hosts Page 503 of 743
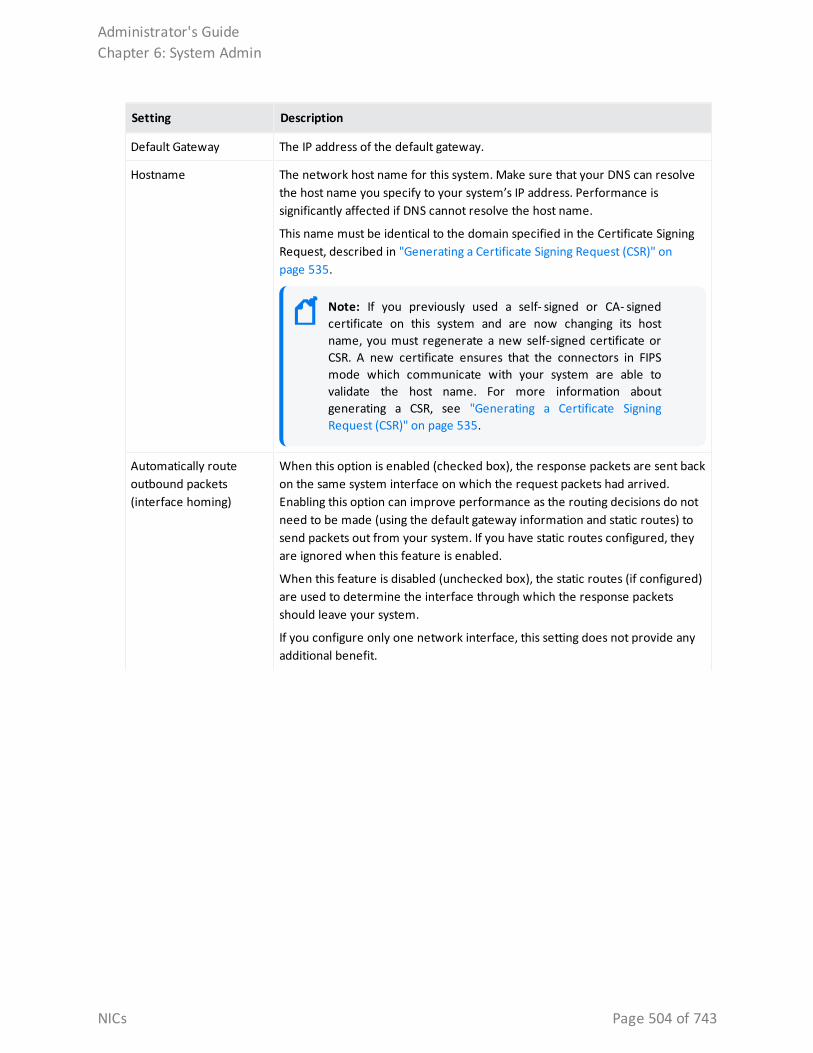
Setting Description
Default Gateway The IP address of the default gateway.
Hostname The network host name for this system. Make sure that your DNS can resolve the host name you specify to your system’s IP address. Performance is significantly affected if DNS cannot resolve the host name.
This name must be identical to the domain specified in the Certificate Signing Request, described in "Generating a Certificate Signing Request (CSR)" on page 535.
Note: If you previously used a self- signed or CA- signed certificate on this system and are now changing its host name, you must regenerate a new self-signed certificate or CSR. A new certificate ensures that the connectors in FIPS mode which communicate with your system are able to validate the host name. For more information about generating a CSR, see "Generating a Certificate Signing Request (CSR)" on page 535.
Automatically route outbound packets (interface homing)
When this option is enabled (checked box), the response packets are sent back on the same system interface on which the request packets had arrived. Enabling this option can improve performance as the routing decisions do not need to be made (using the default gateway information and static routes) to send packets out from your system. If you have static routes configured, they are ignored when this feature is enabled.
When this feature is disabled (unchecked box), the static routes (if configured) are used to determine the interface through which the response packets should leave your system.
If you configure only one network interface, this setting does not provide any additional benefit.
Administrator's GuideChapter 6: System Admin
NICs Page 504 of 743
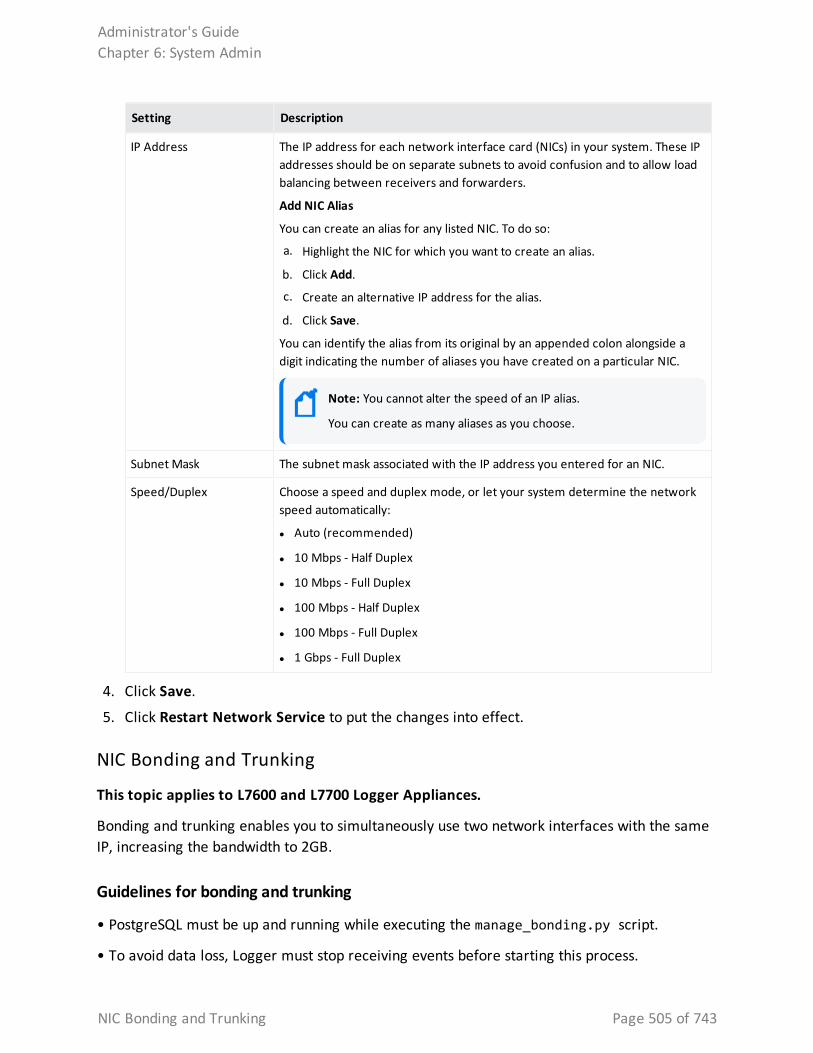
Setting Description
IP Address The IP address for each network interface card (NICs) in your system. These IP addresses should be on separate subnets to avoid confusion and to allow load balancing between receivers and forwarders.
Add NIC Alias
You can create an alias for any listed NIC. To do so:
a. Highlight the NIC for which you want to create an alias.
b. Click Add.
c. Create an alternative IP address for the alias.
d. Click Save.
You can identify the alias from its original by an appended colon alongside a digit indicating the number of aliases you have created on a particular NIC.
Note: You cannot alter the speed of an IP alias.
You can create as many aliases as you choose.
Subnet Mask The subnet mask associated with the IP address you entered for an NIC.
Speed/Duplex Choose a speed and duplex mode, or let your system determine the network speed automatically:
l Auto (recommended)
l 10 Mbps - Half Duplex
l 10 Mbps - Full Duplex
l 100 Mbps - Half Duplex
l 100 Mbps - Full Duplex
l 1 Gbps - Full Duplex
4. Click Save.
5. Click Restart Network Service to put the changes into effect.
NIC Bonding and Trunking
This topic applies to L7600 and L7700 Logger Appliances.
Bonding and trunking enables you to simultaneously use two network interfaces with the same IP, increasing the bandwidth to 2GB.
Guidelines for bonding and trunking
• PostgreSQL must be up and running while executing the manage_bonding.py script.
• To avoid data loss, Logger must stop receiving events before starting this process.
Administrator's GuideChapter 6: System Admin
NIC Bonding and Trunking Page 505 of 743
• Connect the Ethernet cable to the 2 eno /ens interfaces.
• Do not use a configuration other than the ones described below. Otherwise, you will experience appliance instability or network configuration damages. This will require to redeploy the appliance or perform a system restore.
To execute the bonding:
1. From /opt/arcsight/aps/bin location, run the following script bonding_setup.py to prepare the environment for the process.
For example: [root@logger bin] # python3 setup.py
2. Select the main and secondary interface.
3. Allow up to 2 minutes for Logger to execute the bonding script. After this process is complete, verify the following:
• Logger has created a backup for the old configuration at /opt/updates/backup_int/
• The bonding interface is created at /etc/sysconfig/network-scripts/
To change the bonding mode:
1. Go to /opt/arcsight/aps/bin and execute the manage bonding script: python3 manage_bonding.py
2. Select option 1 and click enter.
3. Add the configuration number you want to apply (0, 1, 4, or 5) and press enter. Make sure the network and physical requirements for the selected configuration are met.
l Mode 0 (balance-rr): Logger recommends to use this option (default configuration). Packets are sent in a round robin algorithm allowing load balancing and fault tolerance.
l Mode 1 (active-backup): This configuration is based on active-backup policy. As a limitation, only one interface works at a time. The MAC address of this bond is only available on the network adapter to avoid confusing the switch. This configuration also provides fault tolerance.
Requirement: Connect the Ethernet cable to the interfaces.
l Mode 4 (802.3ad): Also known as a dynamic link aggregation mode, this configuration creates aggregation groups with equal speed. Outgoing traffic on slaves is distributed based on transmit hashing method. You can update to XOR method via the xmit hash policy option.
Requirement: It requires a switch that supports IEEE 802.3ad dynamic link. Make sure to connect the Ethernet cable to the interfaces.
Administrator's GuideChapter 6: System Admin
NIC Bonding and Trunking Page 506 of 743
l Mode 5 (balance-tlb): It is also known as adaptive transmit load balancing. The outgoing traffic is distributed based on the current load on each slave; the incoming traffic is received by the current slave. If the incoming traffic fails, the failed receiving slave is replaced by the MAC address of another slave.
Requirement: Connect the Ethernet cable to the interfaces.
4. Allow up to 5 minutes for the new mode to be implemented, and restart the Logger.
To restore the system
1. From the /opt/arcsight/aps/bin select option 2 and click enter.
2. Allow some time for the process to be completed accordingly. The appliance will display the normal network configuration.
3. Restart the Logger.
Static RoutesThis topic applies to Logger Appliances only.
You can specify static routes for the NICs on your system.
To add, edit, or delete a static route:
1. Click System Admin from the top-level menu bar.
2. Click Network in the System section.
3. In the Static Routes tab:
l To add a new static route, click Add.
l To edit or delete an existing route, select the route first, then click Edit or Delete.
When adding or editing a static route, you need to configure these settings.
Setting Description
Type Whether the static route is to a Network or a Host
Destination The IP address for the static route destination
Subnet Mask The subnet mask if you specify a network as the destination
Gateway The IP address of the gateway for the route
4. Click Save.
Administrator's GuideChapter 6: System Admin
Static Routes Page 507 of 743
Time/NTPThis topic applies to Logger Appliances only.
You do not need to configure the time, date, or time zone for a Software Logger. Software Loggers use the operating system’s settings for the time and time zone.
The Time/NTP tab enables you to configure system time, date, local timezone, and NTP servers. Micro Focus strongly recommends using an NTP server instead of manually configuring the time and date on your system.
Precise timestamping of events is also critical for accurate and reliable log management. The times displayed for Logger operations such as searches, reports, and scheduled jobs are in the Logger’s local time zone.
To set or change the system time, date, or time zone manually:
1. Click System Admin from the top-level menu bar.
2. Click Network in the System section.
3. In the Time/NTP tab, configure these settings.
Setting Description
Current Time Zone The time zones appropriate to your system’s location. To change this setting, click Change Time Zone…
Local times zones follow the Daylight Savings Time (DST) rules for that area. Greenwich Mean Time (GMT) + and - time zones are DST-agnostic.
For example, the America/Los Angeles time zone varies by an hour compared with GMT when DST goes into and out of effect.
l Pacific Standard Time (PST) = GMT-8
l Pacific Daylight Time (PDT) = GMT-7
Current Time The current date and time at the system’s location. To change this setting, click Change Date/Time…
4. The Time Zone change requires that you reboot the appliance. However, the Current Time change takes effect immediately.
Caution: If you manually set the date and time settings and are also using an NTP service, the date and time entered manually cannot be more than 16 minutes ahead of or behind the time that the NTP server is providing. If the manually entered time is more than 16 minutes different from the NTP server time, then the NTP service will fail to start.
Administrator's GuideChapter 6: System Admin
Time/NTP Page 508 of 743
To configure your system as an NTP server or for using an NTP server for your system:
1. Click System Admin from the top-level menu bar.
2. Click Network in the System section.
3. Click the Time/NTP tab.
4. Under NTP Servers, configure these settings.
To add a new NTP server, click the icon. To remove a server, click the icon. To change the order in which the NTP servers should be used, select a server and click the up or down arrow until the NTP server is in the desired position.
Setting Description
Enable as an NTP server
Check this setting if this system should be used as an NTP server.
NTP Servers Enter the host name of an NTP server. For example, time.nist.gov.
Micro Focus recommends using at least two NTP servers to ensure precise time on your system. To enter multiple NTP servers, type one server name per line.
Once you add servers to this list, you can click the “Click to Test” link to verify if the servers that you added are reachable from your system.
l An ArcSight system can serve as an NTP server for any other ArcSight system.
l If System A serves as an NTP server for System B, System B needs to list System A in its NTP Servers list.
l Use the Test Servers button to verify the status of the servers entered into the NTP Servers box.
5. Click Save.
Tip: You may need to scroll down to view the Save button and Restart NTP Service.
6. Click Restart NTP Service to put the changes into effect.
Impact of Daylight Savings Time Change on Logger Operations
This topic applies to both Software Logger and the Logger Appliance.
To search for events that occur between 1 a.m. to 2 a.m. when the time change due to the end of Daylight Savings Time (DST) takes place in the fall, (time is set back one hour), specify a start time of 12:59:59 or earlier and end time of 2:00:01 or later to ensure that all events are returned.
To search for events that occur between 1 a.m. to 2 a.m. when the time change due to the start of Daylight Savings Time (DST) takes place in the spring (time is set ahead one hour), specify an end time of 2:00:01 or later to ensure that all events are returned.
Administrator's GuideChapter 6: System Admin
Impact of Daylight Savings Time Change on Logger Operations Page 509 of 743
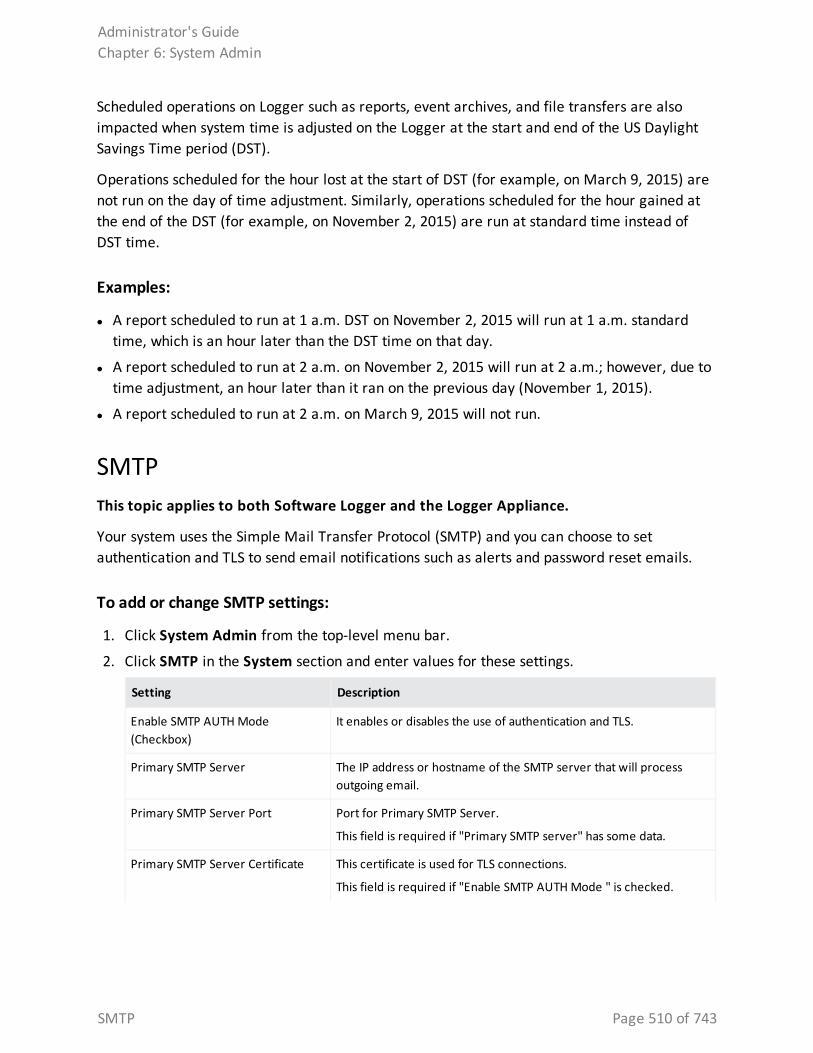
Scheduled operations on Logger such as reports, event archives, and file transfers are also impacted when system time is adjusted on the Logger at the start and end of the US Daylight Savings Time period (DST).
Operations scheduled for the hour lost at the start of DST (for example, on March 9, 2015) are not run on the day of time adjustment. Similarly, operations scheduled for the hour gained at the end of the DST (for example, on November 2, 2015) are run at standard time instead of DST time.
Examples:
l A report scheduled to run at 1 a.m. DST on November 2, 2015 will run at 1 a.m. standard time, which is an hour later than the DST time on that day.
l A report scheduled to run at 2 a.m. on November 2, 2015 will run at 2 a.m.; however, due to time adjustment, an hour later than it ran on the previous day (November 1, 2015).
l A report scheduled to run at 2 a.m. on March 9, 2015 will not run.
SMTPThis topic applies to both Software Logger and the Logger Appliance.
Your system uses the Simple Mail Transfer Protocol (SMTP) and you can choose to set authentication and TLS to send email notifications such as alerts and password reset emails.
To add or change SMTP settings:
1. Click System Admin from the top-level menu bar.
2. Click SMTP in the System section and enter values for these settings.
Setting Description
Enable SMTP AUTH Mode (Checkbox)
It enables or disables the use of authentication and TLS.
Primary SMTP Server The IP address or hostname of the SMTP server that will process outgoing email.
Primary SMTP Server Port Port for Primary SMTP Server.
This field is required if "Primary SMTP server" has some data.
Primary SMTP Server Certificate This certificate is used for TLS connections.
This field is required if "Enable SMTP AUTH Mode " is checked.
Administrator's GuideChapter 6: System Admin
SMTP Page 510 of 743
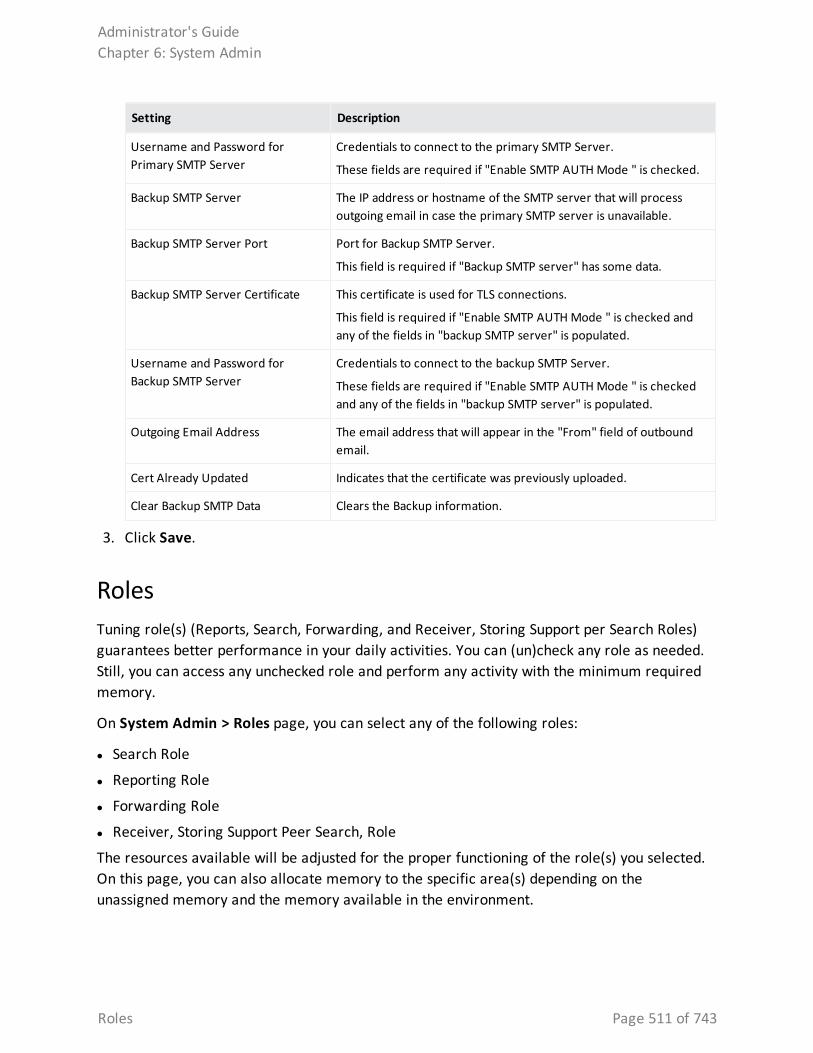
Setting Description
Username and Password for Primary SMTP Server
Credentials to connect to the primary SMTP Server.
These fields are required if "Enable SMTP AUTH Mode " is checked.
Backup SMTP Server The IP address or hostname of the SMTP server that will process outgoing email in case the primary SMTP server is unavailable.
Backup SMTP Server Port Port for Backup SMTP Server.
This field is required if "Backup SMTP server" has some data.
Backup SMTP Server Certificate This certificate is used for TLS connections.
This field is required if "Enable SMTP AUTH Mode " is checked and any of the fields in "backup SMTP server" is populated.
Username and Password for Backup SMTP Server
Credentials to connect to the backup SMTP Server.
These fields are required if "Enable SMTP AUTH Mode " is checked and any of the fields in "backup SMTP server" is populated.
Outgoing Email Address The email address that will appear in the "From" field of outbound email.
Cert Already Updated Indicates that the certificate was previously uploaded.
Clear Backup SMTP Data Clears the Backup information.
3. Click Save.
Roles Tuning role(s) (Reports, Search, Forwarding, and Receiver, Storing Support per Search Roles) guarantees better performance in your daily activities. You can (un)check any role as needed. Still, you can access any unchecked role and perform any activity with the minimum required memory.
On System Admin > Roles page, you can select any of the following roles:
l Search Role
l Reporting Role
l Forwarding Role
l Receiver, Storing Support Peer Search, Role
The resources available will be adjusted for the proper functioning of the role(s) you selected. On this page, you can also allocate memory to the specific area(s) depending on the unassigned memory and the memory available in the environment.
Administrator's GuideChapter 6: System Admin
Roles Page 511 of 743
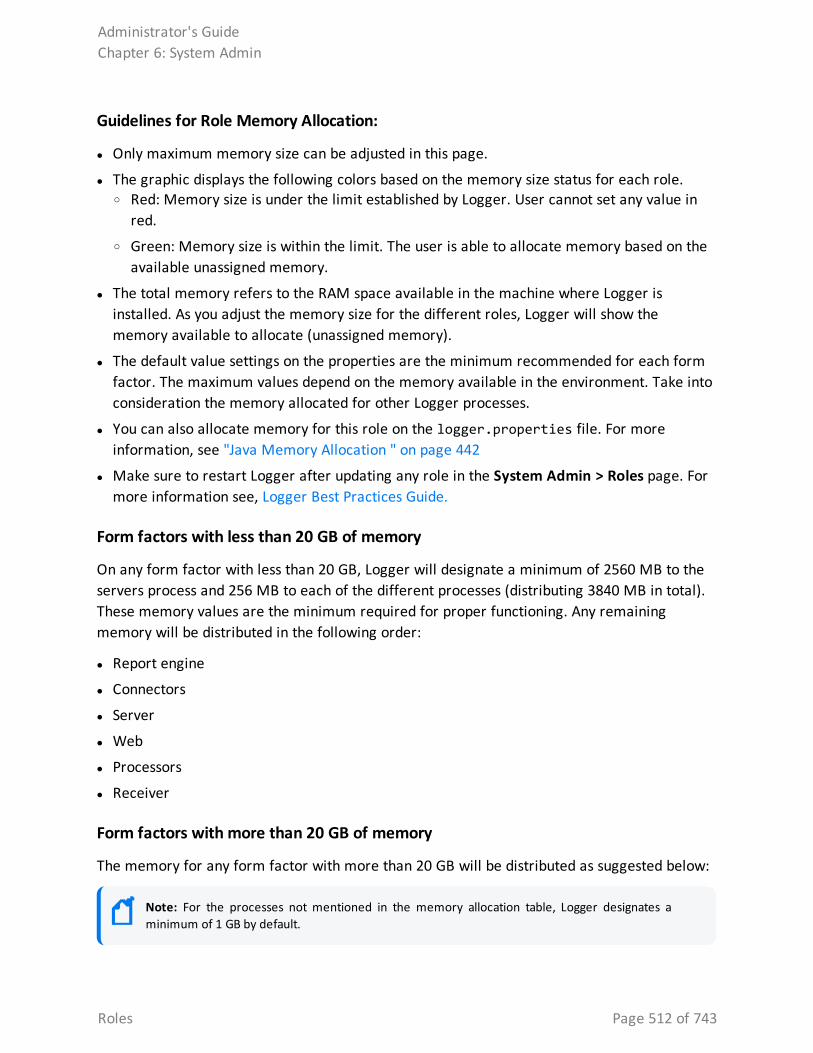
Guidelines for Role Memory Allocation:
l Only maximum memory size can be adjusted in this page.
l The graphic displays the following colors based on the memory size status for each role. o Red: Memory size is under the limit established by Logger. User cannot set any value in
red.
o Green: Memory size is within the limit. The user is able to allocate memory based on the available unassigned memory.
l The total memory refers to the RAM space available in the machine where Logger is installed. As you adjust the memory size for the different roles, Logger will show the memory available to allocate (unassigned memory).
l The default value settings on the properties are the minimum recommended for each form factor. The maximum values depend on the memory available in the environment. Take into consideration the memory allocated for other Logger processes.
l You can also allocate memory for this role on the logger.properties file. For more information, see "Java Memory Allocation " on page 442
l Make sure to restart Logger after updating any role in the System Admin > Roles page. For more information see, Logger Best Practices Guide.
Form factors with less than 20 GB of memory
On any form factor with less than 20 GB, Logger will designate a minimum of 2560 MB to the servers process and 256 MB to each of the different processes (distributing 3840 MB in total). These memory values are the minimum required for proper functioning. Any remaining memory will be distributed in the following order:
l Report engine
l Connectors
l Server
l Web
l Processors
l Receiver
Form factors with more than 20 GB of memory
The memory for any form factor with more than 20 GB will be distributed as suggested below:
Note: For the processes not mentioned in the memory allocation table, Logger designates a minimum of 1 GB by default.
Administrator's GuideChapter 6: System Admin
Roles Page 512 of 743
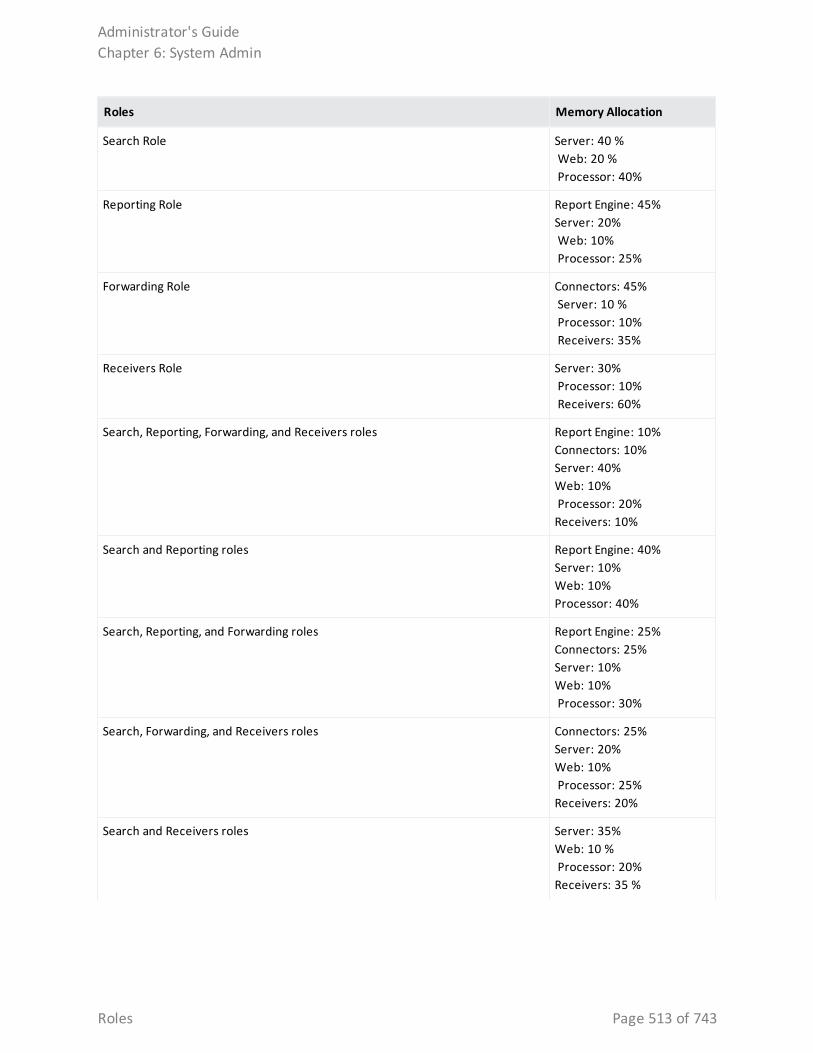
Roles Memory Allocation
Search Role Server: 40 % Web: 20 % Processor: 40%
Reporting Role Report Engine: 45%Server: 20% Web: 10% Processor: 25%
Forwarding Role Connectors: 45% Server: 10 % Processor: 10% Receivers: 35%
Receivers Role Server: 30% Processor: 10% Receivers: 60%
Search, Reporting, Forwarding, and Receivers roles Report Engine: 10%Connectors: 10%Server: 40%Web: 10% Processor: 20%Receivers: 10%
Search and Reporting roles Report Engine: 40%Server: 10%Web: 10%Processor: 40%
Search, Reporting, and Forwarding roles Report Engine: 25%Connectors: 25%Server: 10%Web: 10% Processor: 30%
Search, Forwarding, and Receivers roles Connectors: 25%Server: 20%Web: 10% Processor: 25%Receivers: 20%
Search and Receivers roles Server: 35%Web: 10 % Processor: 20%Receivers: 35 %
Administrator's GuideChapter 6: System Admin
Roles Page 513 of 743
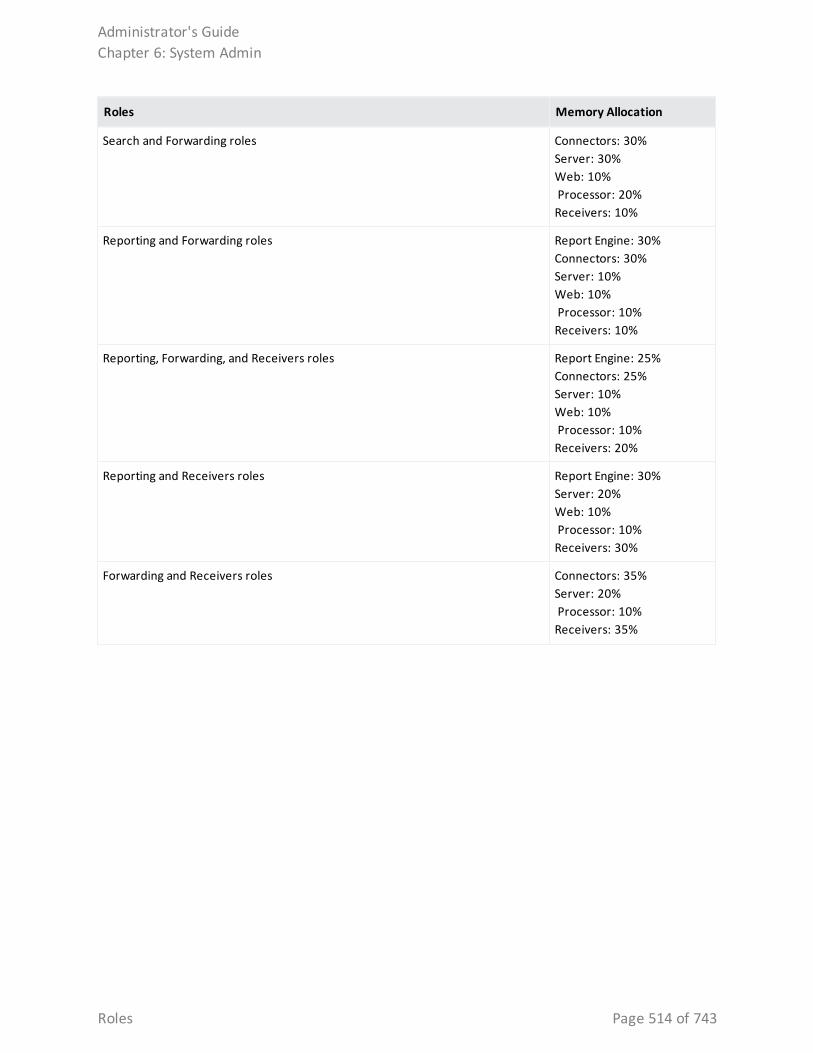
Roles Memory Allocation
Search and Forwarding roles Connectors: 30%Server: 30%Web: 10% Processor: 20%Receivers: 10%
Reporting and Forwarding roles Report Engine: 30%Connectors: 30%Server: 10%Web: 10% Processor: 10%Receivers: 10%
Reporting, Forwarding, and Receivers roles Report Engine: 25%Connectors: 25%Server: 10%Web: 10% Processor: 10%Receivers: 20%
Reporting and Receivers roles Report Engine: 30%Server: 20%Web: 10% Processor: 10%Receivers: 30%
Forwarding and Receivers roles Connectors: 35%Server: 20% Processor: 10%Receivers: 35%
Administrator's GuideChapter 6: System Admin
Roles Page 514 of 743
License & UpdateThis topic applies to both Software Logger and the Logger Appliance.
This page displays license information, the version of the components, and the elapsed time since Logger was last rebooted (Logger Appliance) or restarted (Software Logger).
You can apply a new license to your Logger or update a Logger Appliance. To view details of your current license, open Configuration > License Information. For details, see " Standalone License Information" on page 488.
Note: Make sure to restart Logger if you encounter any of the following scenarios:
l The license is installed.
l The License information page shows no available data. This may occur a few days after performing an upgrade or fresh install.
l There is a license error while executing reports with peers searches. Additionally, the License information page displays no data.
Updating Your Logger License
Note: Logger continually stores incoming events even after the license expiration.
To update your Logger license:
1. Redeem your license on the Software Entitlements Portal, then download the license file to a computer from which you can connect to Logger. For more information, refer to the software delivery confirmation email you received from Micro Focus.
Note: Even though users can now choose between EPS and GB per day licenses, EPS is the only license offered by ArcSight. For more information, see "How does EPS license differ from GB per day license? " on page 487
2. From the computer to which you downloaded the update file, log in to Logger using an account with administrator (upgrade) privileges.
3. Click System Admin from the top-level menu bar.
4. Click License & Update in the System section.
5. Browse to the license file you downloaded earlier, and click Upload Update. The Update in progress page displays the update progress.
Once the update has been completed, the Update Results page displays the update result (success/failure).
Administrator's GuideChapter 6: System Admin
License & Update Page 515 of 743
Note: After upgrade or when converting a trial Logger to the full version, be sure to increase the Storage Volume to take advantage of your full licensed capacity. See "Storage Volume Size Increase" on page 467 for instructions.
Upgrading a Logger Appliance
To upgrade Logger appliance:
1. Download the update file from the Software Entitlements Portal, to a computer from which you can connect to Logger. For more information, refer to the software delivery confirmation email you received from Micro Focus.
2. From the computer to which you downloaded the update file, log in to Logger using an account with administrator (upgrade) privileges.
3. Click System Admin from the top-level menu bar.
4. Click License & Update in the System section.
5. Click Browse to locate the file.
6. Click Upload Update. The Update in Progress page displays the update progress.
7. Once the update has completed, the page displays the update result (success/failure). If update is successful, the Logger reboots/restarts automatically.
After you upload a valid license, the Reporting feature is enabled, and the licensed daily license usage and storage volume are increased based on the license capacity.
Standalone Logger with a License Managed by ArcMCThis topic applies both to EPS and GB per Day license
About
Users can disable the ArcSight Management Center License Management option when they apply a Managed by License to a Logger that, eventually, will not be managed by ArcSight Management Center.
Procedure
1. From Admin > Options unselect the ArcSight Management Center License Management checkbox.
The default preference is set as true.
Administrator's GuideChapter 6: System Admin
Upgrading a Logger Appliance Page 516 of 743
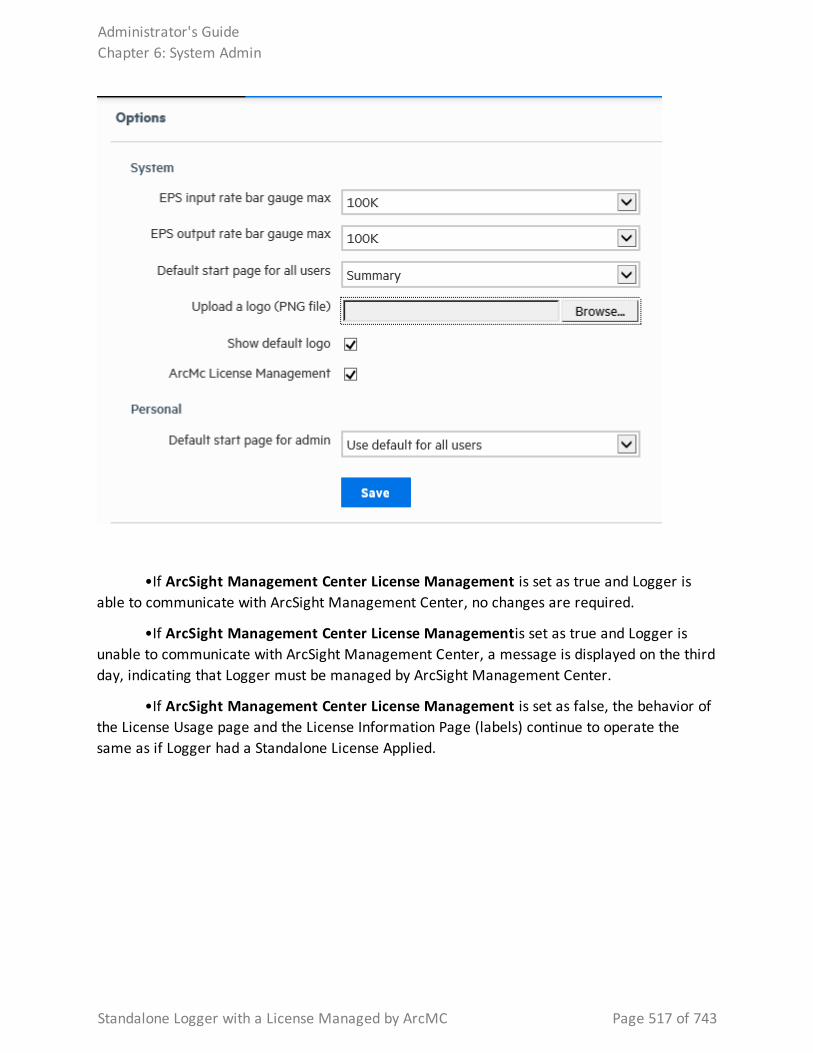
•If ArcSight Management Center License Management is set as true and Logger is able to communicate with ArcSight Management Center, no changes are required.
•If ArcSight Management Center License Managementis set as true and Logger is unable to communicate with ArcSight Management Center, a message is displayed on the third day, indicating that Logger must be managed by ArcSight Management Center.
•If ArcSight Management Center License Management is set as false, the behavior of the License Usage page and the License Information Page (labels) continue to operate the same as if Logger had a Standalone License Applied.
Administrator's GuideChapter 6: System Admin
Standalone Logger with a License Managed by ArcMC Page 517 of 743
Process StatusThis topic applies to both Software Logger and the Logger Appliance.
The Process Status page lists all processes related to your system and enables you to view the details of those processes and start, stop, or restart them.
Important: Micro Focus recommends that you do not stop the servers process.
l To shut down Software Logger s, use the loggerd stop or quit commands. For more information, see "Software Logger Command Line Options" on page 571.
l To shut down Logger Appliances, perform a Shutdown from the UI. For more information, see "System Reboot" on page 501.
Never stop the Logger servers process while events are still coming in, this can cause data loss. If you must stop the servers process, be sure to stop the receivers process first, then stop the servers process.
To view the Process Status page:
1. Click System Admin from the top-level menu bar.
2. In the System section, click Process Status. A list of Logger processes display.
Tip: In this context, the "processors" listed in the Processes table refers to forwarders.
3. On the Process Status dialog, to toggle the view of the details of a process, click the icon to the left of the process name.
To start, stop, or restart a process, select the process and click Start, Stop, or Restart at the top of the process list.
Tip: To avoid loading the main Apache server and reducing the response time from the UI or a remote logger peer, there will be another Apache instance named APACHE_IPM. The default port is 8443 will served all the /ipm/post requests. On Software root installation, if user install in port 8443, the port for second apache will increase in 1, therefore 8444 will be the port.
System SettingsThis topic applies to Software Loggers only.
If you did not select Logger to start as service during the installation process, you can do so using the System Settings page. When you select this option Logger will use a service called arcsight_logger, enabled to run at levels 2, 3, 4, and 5.
Administrator's GuideChapter 6: System Admin
Process Status Page 518 of 743
To configure Logger to start as a service:
1. Click System Admin from the top-level menu bar.
2. Click System Settings in the left panel.
3. From under Service Settings, choose the appropriate option:
l Start as a Service
l Do not start as a Service
4. Click Save.
SNMPThis topic applies to Logger Appliances only.
You can use SNMP (Simple Network Management Protocol) to monitor the health of your appliance. Logger appliance supports SNMP v2c and SNMP v3.
You can configure SNMP polling and notifications (traps):
l If you configure SNMP polling, a manager station can query the SNMP agent residing on Logger. The information retrieved provides detailed information at the hardware and Operating System level.
l If you configure an SNMP destination, Logger can send notifications for the events below. These notifications differ from the ones sent by Alerts. (For more information on using Alerts to send event information as SNMP notifications, see "Real Time Alerts" on page 394 and "SNMP Destinations" on page 403.) Instead of a notification being for a generic event, the new notifications are specific to a single event, making more easily understood by a Network Management System (NMS) such as Micro Focus NMMi.
SNMP Metrics Supported
Hardware
Logger supports polling and notifications for the following hardware parameters.
l CPU Usage
l Memory Usage
l Disk Almost Full
l Fan Failure
l Power Supply Failure
Administrator's GuideChapter 6: System Admin
SNMP Page 519 of 743
l Temperature Out of Range
l Ethernet Link Down
Logger application
The following notifications are defined in the ARCSIGHT-EVENT-MIB.
l Login attempt failed
l Password change attempt failed
l User account locked
l Reboot command launched
l Manual backup failed
l Scheduled backup failed
l Enable FIPS mode successful
l Disable FIPS mode successful
l Enable FIPS mode failed
l Disable FIPS mode failed
Configuration on the Logger Appliance
To configure SNMP polling:
1. In the main menu bar, click System Admin.
2. In the navigation tree, under System, click SNMP. The SNMP Poll Configuration tab displays.
3. Status: Select Enabled or Disabled.
4. Port: Enter a port number. The default is 161 (UDP) but can be any available port.
5. SNMP Version: Select V2c or V3. The default is V2c.
l V2c — Enter the following value:
Community String: 6–128 alphanumeric, underscore (_), and dash (-) characters.
l V3 — Enter values for the following fields:
Username: 4–16 alphanumeric, lower-case characters. The user name must begin with an alphabetic character and may include underscores.
Authentication Protocol: Select MD5 or SHA.
Authentication Passphrase: Enter a password consisting of 8–256 characters.
Privacy Protocol: Select DES or AES128.
Administrator's GuideChapter 6: System Admin
Configuration on the Logger Appliance Page 520 of 743
Privacy Passphrase: Enter a password consisting of 8–256 characters.
Note: To be valid, the values for Poll Configuration and Trap Configuration must match.
6. System Name: Enter a name for the system you want to poll.
7. Point of Contact: Enter a valid notification contact.
8. Location: Enter a location for the system you want to poll.
9. Click Save.
10. Configure the firewall to open the SNMP port, see "Firewall Rules" on page 573.
If an SNMP destination is configured, Logger can send notifications for a limited set of events (see "SNMP Metrics Supported" on page 519.
SNMP notifications differ from those sent by SmartConnectors, which are for a generic ArcSight event. The notifications listed here are specific to a single event, making them easier for understanding by a network management system like Micro Focus NMMi.
To configure the destination for SNMP notifications:
1. In the main menu bar, click System Admin.
2. In the navigation tree, under System, click SNMP. The SNMP Poll Configuration tab displays.
3. Select the SNMP Destination tab to open the SNMP Trap Configuration menu.
4. Status: Select Enabled or Disabled.
5. NMS IP Address: Enter the IP address of the Network Management System (NMS) host.
6. Port: Enter a port number. The default is 162 (UDP) but can be any available port.
7. SNMP Version: Select V2c or V3. The default is V2c.
l V2c — Enter the following value:
Community String: 6–128 alphanumeric, underscore (_), and dash (-) characters.
l V3 — Enter values for the following fields:
Username: 4–16 alphanumeric, lower-case characters. The user name must begin with an alphabetic character and may include underscores.
Authentication Protocol: Select MD5 or SHA.
Authentication Passphrase: Enter a password consisting of 8–256 characters.
Privacy Protocol: Select DES or AES128.
Administrator's GuideChapter 6: System Admin
Configuration on the Logger Appliance Page 521 of 743
Privacy Passphrase: Enter a password consisting of 8–256 characters.
Note: To be valid, the values for Poll Configuration and Trap Configuration must match.
8. Click Save.
Configuration on the NMS 1. Download ArcSight MIB file and other standard Net-SNMP MIB files using following URLs:
l https://<system_name_or_ip>/platform-service/ARCSIGHT-EVENT-MIB.txt
l https://<system_name_or_ip>/platform-service/DISMAN-EVENT-MIB.txt
l https://<system_name_or_ip>/platform-service/HOST-RESOURCES-MIB.txt
l https://<system_name_or_ip>/platform-service/IF-MIB.txt
l https://<system_name_or_ip>/platform-service/UCD-SNMP-MIB.txt
2. Load the MIB.
3. Configure the node (appliance) in the NMS (or MIB browser) according to the protocol used, either v2c or v3.
MIB ContentsThe standard MIB files contain the following types of notifications:
Module Notification Types
DISMAN-EVENT-MIB Event triggers and actions for standard network management.
IF-MIB Objects for network interfaces.
IP-MIB IP and ICMP implementations.
HOST-RESOURCES-MIB Standard hardware parameters.
SSH Access to the ApplianceThis topic applies to Logger Appliances only.
Note: SSH access to Software Logger is controlled through the operating system.
When you report an issue to customer support that requires them to access your appliance for troubleshooting and diagnostics in situations such as an upgrade failure, unresponsive appliance, and so on, they will direct you to enable SSH access on it.
Administrator's GuideChapter 6: System Admin
Configuration on the NMS Page 522 of 743
By default, SSH access (known as Support Login in previous releases) to your appliance is disabled. (This also includes Loggers upgraded to version 6.0 from previous versions.) However, you can select one of these options in the appliance’s user interface to enable SSH:
l Enabled: SSH access is always enabled.
l Enabled, only for 8 hours: SSH access is disabled automatically eight hours after it was enabled.
l Enabled, only during startup/reboot: SSH access is enabled during the time the appliance reboots and is starting up. It is disabled once all processes on the appliance are up and running. This option provides a minimal period of SSH access for situations such as when the appliance does not start successfully after a reboot.
For optimal security, you should set a strong password for the root account. In addition, leave SSH access disabled and enable it only when necessary, such as for troubleshooting purposes.
Note: If SSH is disabled on your appliance, you can still access its console if you have it setup for remote access using the ProLiant Integrated Lights- Out (iLO) Advanced remote management card. For more information, refer to the Logger Installation Guide.
Enabling or Disabling SSH access:
1. Click System Admin from the top-level menu bar.
2. Click SSH in the System section.
3. On the SSH Configuration dialog, select an SSH configuration.
4. Confirm the new SSH configuration for it to take effect.
Once you have enabled SSH access on your appliance, follow these steps to connect to it using SSH.
Connecting to your appliance using SSH:
1. Connect to the appliance as “root” using an SSH client.
2. At the password prompt, type the root password and press Enter.
Note: For security purposes, SSH sessions time out after a 15 minute period of inactivity. To extend SSH connection, configure sending keepalive packets in the SSH client.
Administrator's GuideChapter 6: System Admin
SSH Access to the Appliance Page 523 of 743
Supporting Jumbo FramesThis topic applies to Logger Appliances only.
To enable the jumbo frame support:
1. Log in via SSH as a root user.
2. Select the interface to modify increasing the Maximum Transfer Unit.
3. Go to the /etc/sysconfig/network-scripts/ and edit the configuration file of the interface you want to modify:vi /etc/sysconfig/network-scripts/<interface name>
4. Add the following line in the file. You can set it up to 9000:MTU=<higher value than 1500>
5. Restart the network. service network restart
To confirm changes were applied, execute the command:ip link show | grep mtu
LogsThis topic applies to both Software Logger and the Logger Appliance.
Your system can generate audit logs at the application and platform levels. Use the Logs sub-menu to search audit logs.
Audit LogsYour system’s audit logs are available for viewing. Audit logs, as Common Event Format (CEF) audit events, can be sent to ArcSight ESM directly for analysis and correlation. For information about forwarding audit events, see "Audit Forwarding" on the next page.
To view audit logs:
1. Click System Admin from the top-level menu bar.
2. Click Audit Logs in the Logs section.
3. Select the date and time range for which you want to obtain the log.
Administrator's GuideChapter 6: System Admin
Supporting Jumbo Frames Page 524 of 743
4. (Optional) To refine the audit log search, specify a string in the Description field and a user name in the User field. When a description string is specified, only logs whose Description field contains the string are displayed. Similarly, when a user is specified, only logs whose User field contains the username are displayed.
5. Click Search.
Note: Logger will display the following users to describe the following activity: System: No user interaction tasks. Unknown: System tasks like updates and startups.
Audit ForwardingYou can forward audit events to a TH or ArcSight ESM for correlation and analysis. For a list of audit events that you can forward, see "Application Events" on page 636.
When you create a TH Destination, the Connector Name value is the name of the agent that OBC creates to point the destination. The Connector Names associated with your TH and ESM Destinations will appear in the audit forwarding list with no distinction from each other.
To forward audit events to specific ESM or TH destinations:
1. Click System Admin from the top-level menu bar.
2. Click Audit Forwarding in the Logs section.
3. Select destinations from the Available Destinations list and click the right arrow icon () to move the selected destination to the Selected Destinations list.
You can select multiple destinations at the same time and move them, or you can move all available destinations by clicking the ( ) icon.
4. Click Save Settings.
StorageThis topic applies to Logger Appliances only.
Use the Storage sub-menu to add an NFS mount or a CIFS mount and to view the status of the hard disk array (RAID) controller and specific system processes.
Administrator's GuideChapter 6: System Admin
Audit Forwarding Page 525 of 743
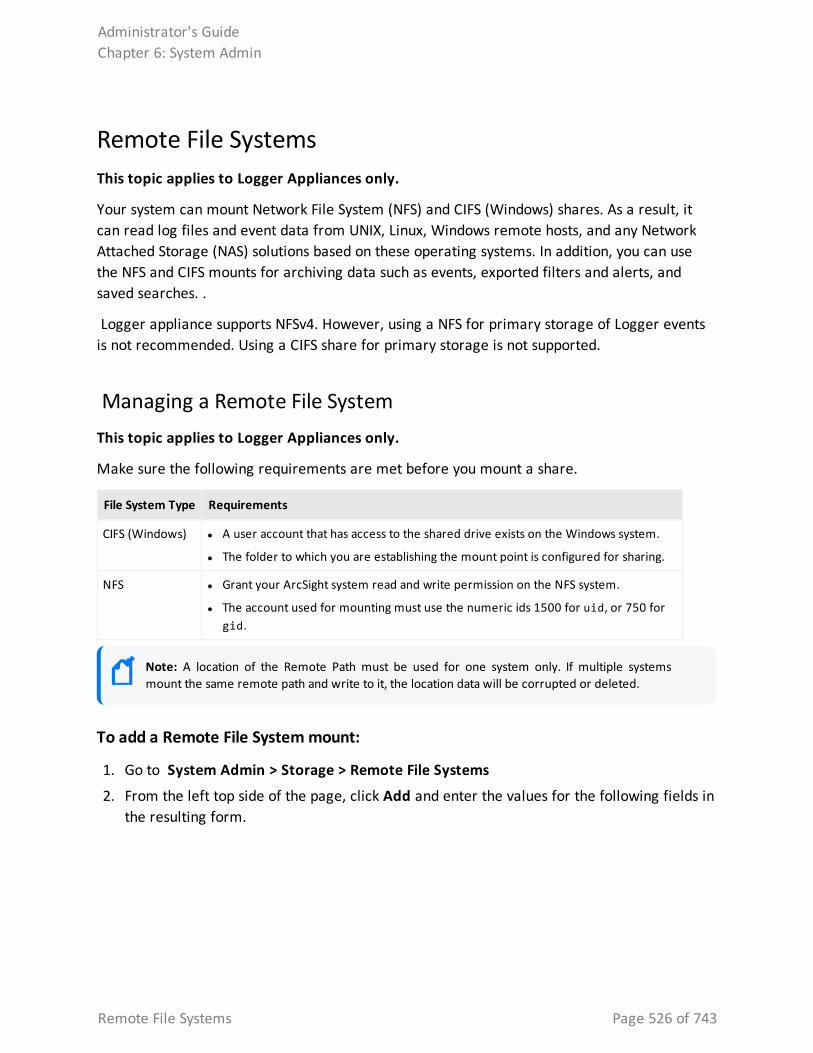
Remote File SystemsThis topic applies to Logger Appliances only.
Your system can mount Network File System (NFS) and CIFS (Windows) shares. As a result, it can read log files and event data from UNIX, Linux, Windows remote hosts, and any Network Attached Storage (NAS) solutions based on these operating systems. In addition, you can use the NFS and CIFS mounts for archiving data such as events, exported filters and alerts, and saved searches. .
Logger appliance supports NFSv4. However, using a NFS for primary storage of Logger events is not recommended. Using a CIFS share for primary storage is not supported.
Managing a Remote File SystemThis topic applies to Logger Appliances only.
Make sure the following requirements are met before you mount a share.
File System Type Requirements
CIFS (Windows) l A user account that has access to the shared drive exists on the Windows system.
l The folder to which you are establishing the mount point is configured for sharing.
NFS l Grant your ArcSight system read and write permission on the NFS system.
l The account used for mounting must use the numeric ids 1500 for uid, or 750 for gid.
Note: A location of the Remote Path must be used for one system only. If multiple systems mount the same remote path and write to it, the location data will be corrupted or deleted.
To add a Remote File System mount:
1. Go to System Admin > Storage > Remote File Systems
2. From the left top side of the page, click Add and enter the values for the following fields in the resulting form.
Administrator's GuideChapter 6: System Admin
Remote File Systems Page 526 of 743
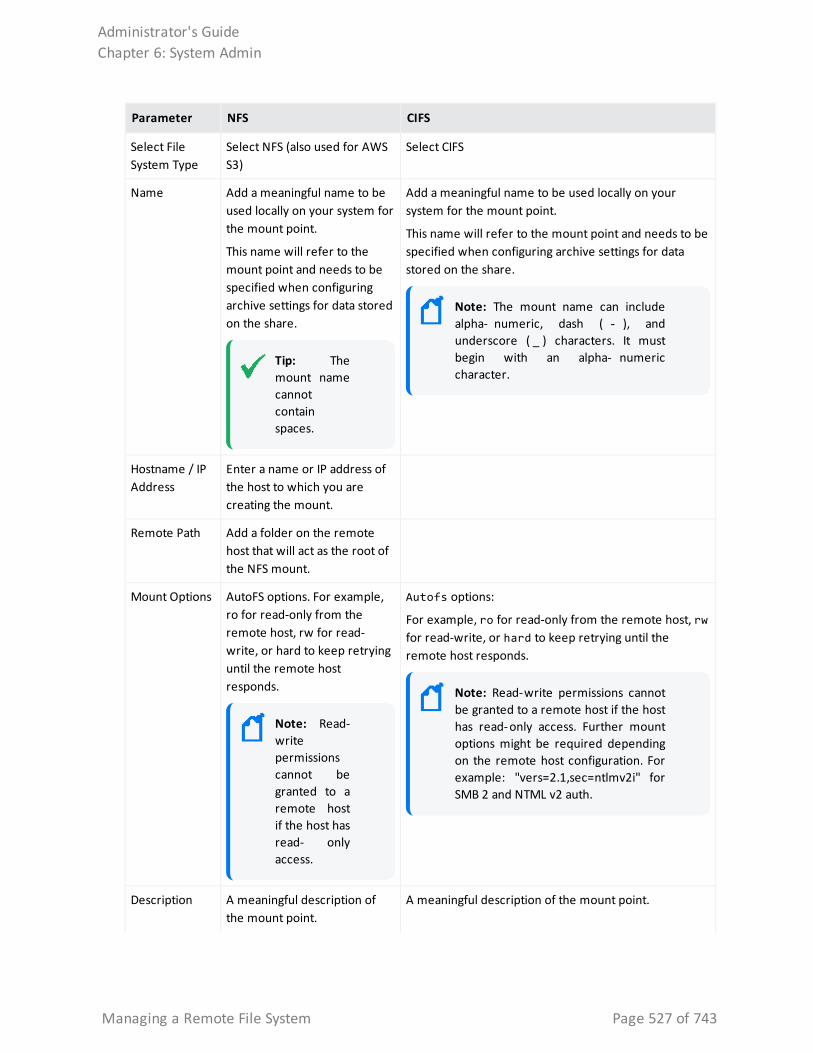
Parameter NFS CIFS
Select File System Type
Select NFS (also used for AWS S3)
Select CIFS
Name Add a meaningful name to be used locally on your system for the mount point.
This name will refer to the mount point and needs to be specified when configuring archive settings for data stored on the share.
Tip: The mount name cannot contain spaces.
Add a meaningful name to be used locally on your system for the mount point.
This name will refer to the mount point and needs to be specified when configuring archive settings for data stored on the share.
Note: The mount name can include alpha- numeric, dash ( - ), and underscore ( _ ) characters. It must begin with an alpha- numeric character.
Hostname / IP Address
Enter a name or IP address of the host to which you are creating the mount.
Remote Path Add a folder on the remote host that will act as the root of the NFS mount.
Mount Options AutoFS options. For example, ro for read-only from the remote host, rw for read-write, or hard to keep retrying until the remote host responds.
Note: Read-write permissions cannot be granted to a remote host if the host has read- only access.
Autofs options:
For example, ro for read-only from the remote host, rw for read-write, or hard to keep retrying until the remote host responds.
Note: Read-write permissions cannot be granted to a remote host if the host has read-only access. Further mount options might be required depending on the remote host configuration. For example: "vers=2.1,sec=ntlmv2i" for SMB 2 and NTML v2 auth.
Description A meaningful description of the mount point.
A meaningful description of the mount point.
Administrator's GuideChapter 6: System Admin
Managing a Remote File System Page 527 of 743
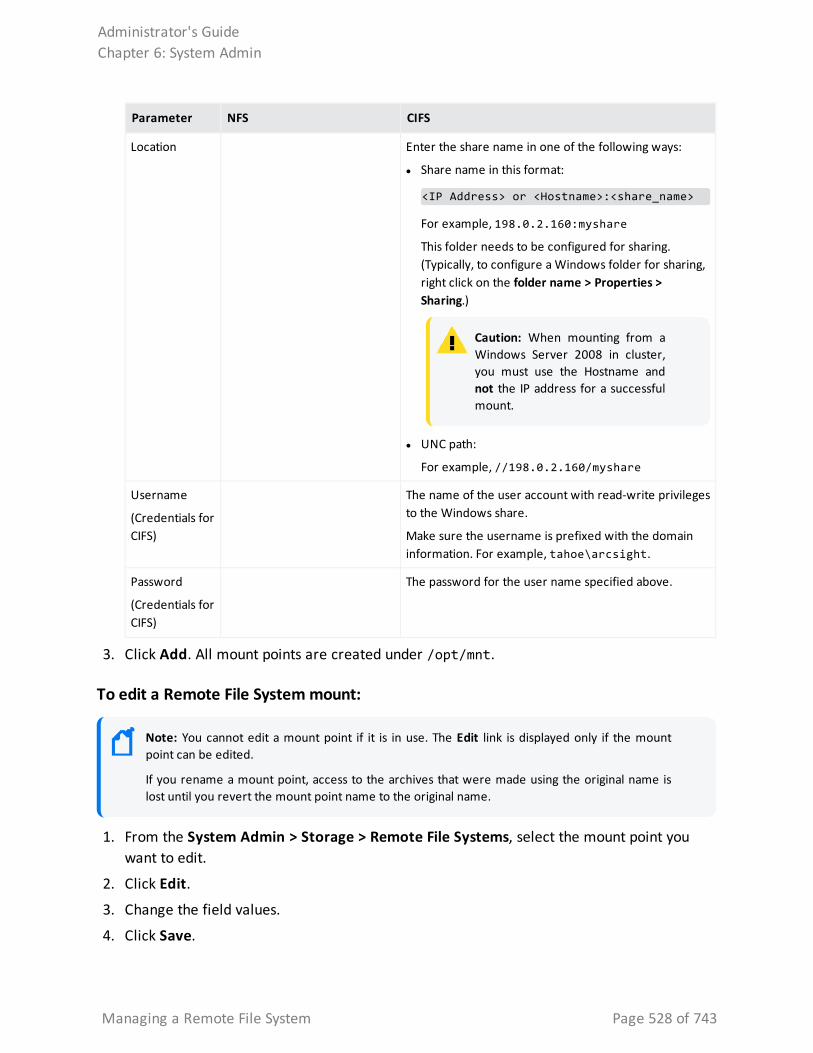
Parameter NFS CIFS
Location Enter the share name in one of the following ways:
l Share name in this format:
<IP Address> or <Hostname>:<share_name>
For example, 198.0.2.160:myshare
This folder needs to be configured for sharing. (Typically, to configure a Windows folder for sharing, right click on the folder name > Properties > Sharing.)
Caution: When mounting from a Windows Server 2008 in cluster, you must use the Hostname and not the IP address for a successful mount.
l UNC path:
For example, //198.0.2.160/myshare
Username
(Credentials for CIFS)
The name of the user account with read-write privileges to the Windows share.
Make sure the username is prefixed with the domain information. For example, tahoe\arcsight.
Password
(Credentials for CIFS)
The password for the user name specified above.
3. Click Add. All mount points are created under /opt/mnt.
To edit a Remote File System mount:
Note: You cannot edit a mount point if it is in use. The Edit link is displayed only if the mount point can be edited.
If you rename a mount point, access to the archives that were made using the original name is lost until you revert the mount point name to the original name.
1. From the System Admin > Storage > Remote File Systems, select the mount point you want to edit.
2. Click Edit.
3. Change the field values.
4. Click Save.
Administrator's GuideChapter 6: System Admin
Managing a Remote File System Page 528 of 743
To delete a Remote File System mount:
Note: You cannot delete a mount point that is in use. The Delete link is displayed only if the mount point can be deleted.
1. From the System Admin > Storage > Remote File Systems, select the mount point you want to delete.
2. Click Delete.
Creating Multiple Paths to a LUNThis topic applies to Logger Appliances only.
The HBA card on your Logger has two ports. You can connect both of those ports to the same LUN. Using those ports to create two different paths between the Logger and the LUN (multipathing) reduces the possibility of a single point of failure causing the LUN to become unavailable.
You must connect the LUN to both HBA ports and configure multipath configuration in the UI for it to function. Once enabled, multipath cannot be disabled on Logger.
To enable multipath for a new Logger installation, configure multipathing before attaching the LUN.
To enable multipath:
1. Ensure that a LUN is not attached to the Logger.
2. Click System Admin from the top-level menu bar.
3. Click Multipath in the Storage section in the left panel.
4. If you chose Custom, or if the displayed configuration does not meet your needs, customize the parameters.
5. Click Test to ensure that the configuration you chose or the changes you made are valid.
If the test fails, make additional changes, or click Reset to start over.
6. Click Save.
To verify that the multipathd service is configured to start on boot:
1. Run chkconfig --list multipathd
Make sure '#:on' is shown for your run level. The current run level can be displayed with the 'runlevel' command.
Administrator's GuideChapter 6: System Admin
Creating Multiple Paths to a LUN Page 529 of 743
2. If the service is not enabled, do so with: chkconfig multipathd on
3. Reboot the appliance or start the multipath daemon with: /sbin/service multipathd start
Note: Be sure to also configure any vendor-specific multipath configuration accordingly in the /etc/multipath.conf file.
To convert a single path LUN to multipath:
1. Connect to your Logger using SSH, as described in "SSH Access to the Appliance" on page 522.
2. Run these commands:
cd /opt/arcsight/aps/mpath
./mpath_prepare.sh
3. Connect the second fiber cable to the second port on the HBA card.
4. Run this test command:
./mpath_test.sh <path_to_your_multipath.conf >
Review the output of the test command to ensure that multipath devices that will be created are listed at the bottom of the output.
5. If test output is not correct, repeat the steps and "Run this test command:" above until the multipath devices are correctly listed.
6. Run this command:
./mpath_enable.sh <path_to_your_multipath.conf >
7. Reboot your appliance.
Managing a LUNThis topic applies to Logger Appliances only.
A LUN can be in "available," "attached," or "detached" state, which determines what actions are available within Logger.
Administrator's GuideChapter 6: System Admin
Managing a LUN Page 530 of 743
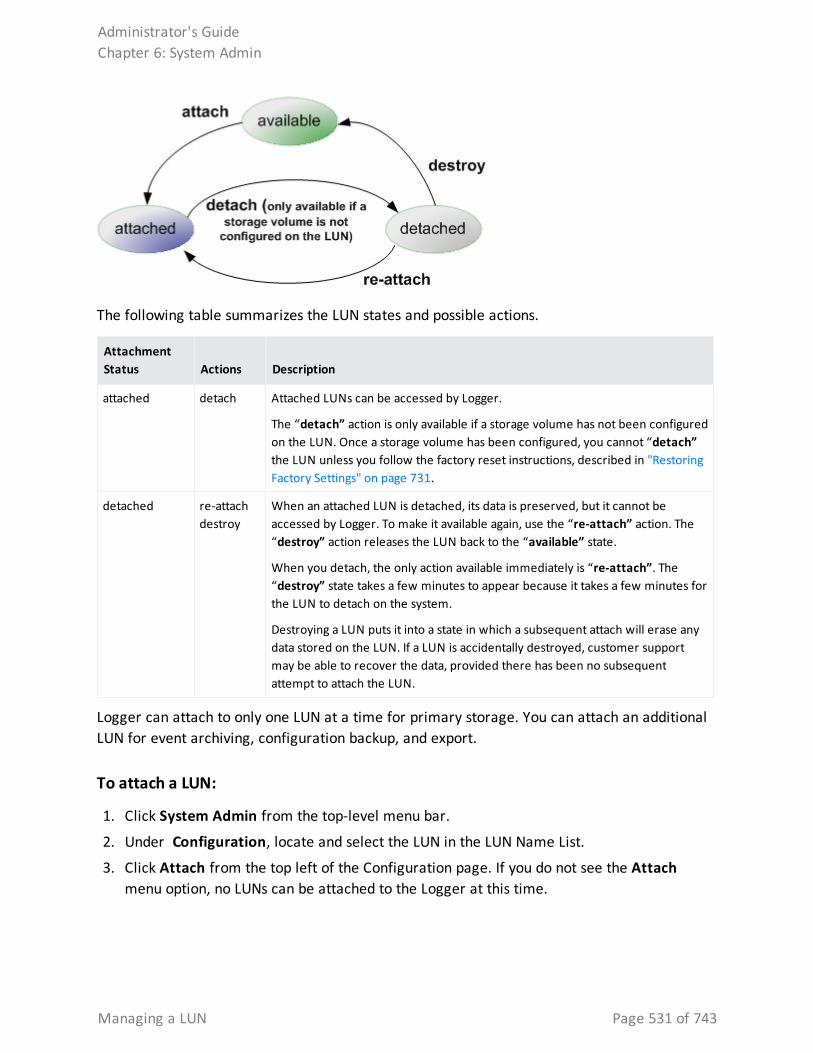
The following table summarizes the LUN states and possible actions.
Attachment Status Actions Description
attached detach Attached LUNs can be accessed by Logger.
The “detach” action is only available if a storage volume has not been configured on the LUN. Once a storage volume has been configured, you cannot “detach” the LUN unless you follow the factory reset instructions, described in "Restoring Factory Settings" on page 731.
detached re-attachdestroy
When an attached LUN is detached, its data is preserved, but it cannot be accessed by Logger. To make it available again, use the “re-attach” action. The “destroy” action releases the LUN back to the “available” state.
When you detach, the only action available immediately is “re-attach”. The “destroy” state takes a few minutes to appear because it takes a few minutes for the LUN to detach on the system.
Destroying a LUN puts it into a state in which a subsequent attach will erase any data stored on the LUN. If a LUN is accidentally destroyed, customer support may be able to recover the data, provided there has been no subsequent attempt to attach the LUN.
Logger can attach to only one LUN at a time for primary storage. You can attach an additional LUN for event archiving, configuration backup, and export.
To attach a LUN:
1. Click System Admin from the top-level menu bar.
2. Under Configuration, locate and select the LUN in the LUN Name List.
3. Click Attach from the top left of the Configuration page. If you do not see the Attach menu option, no LUNs can be attached to the Logger at this time.
Administrator's GuideChapter 6: System Admin
Managing a LUN Page 531 of 743
Note: You can attach a LUN only if the LUN is in the "Available" status.
The LUN’s Attachment Status will change to “Attached” when the LUN is ready for use.
To detach a LUN:
1. Click System Admin from the top-level menu bar.
2. In the LUN Name List, locate the LUN to be detached.
3. Click Detach from the top left of the Configuration page. If you do not see the Detach menu option, no LUNs can be detached from the Logger at this time.
Note: You cannot detach a LUN if a storage volume is configured on it.
To re-attach a LUN:
1. Click System Admin from the top-level menu bar.
2. In the LUN Name List, locate the LUN to be re-attached. The LUN must be in the Detached state.
3. Click Re-attach from the top left of the Configuration page.
If you do not see the Re-attach menu option, no LUNs can be re-attached from the Logger at this time.
To destroy a LUN:
1. Click System Admin from the top-level menu bar.
2. In the LUN Name List, locate the LUN to be destroyed. The LUN must be in the ‘detached’ state.
3. Click Destroy in the top left corner Configuration page.
Caution: Destroying a Logical Unit (LUN) that has been detached, puts that LUN into a state in which a subsequent attach will erase any data stored on the LUN. If a LUN is accidentally destroyed, customer support may be able to recover the data, provided there has been no subsequent attempt to attach the LUN.
RAID ControllerThis topic applies to Logger Appliances only.
You can view information about the RAID controller in the General Controller Information screen. This information is not needed during normal system operations, but it can be helpful
Administrator's GuideChapter 6: System Admin
RAID Controller Page 532 of 743
for diagnosing specific hardware issues. Due to the redundant nature of RAID storage, a single drive failure will not disable your system. Instead, performance degrades. Use this report to determine whether a performance issue is caused by a disk failure. Customer support can also use this information to diagnose problems.
To view the General Controller Information screen:
1. Click System Admin from the top-level menu bar.
2. Click RAID Controller in the Storage section in the left panel.
3. The information displayed depends on the hardware model of your system. Click the arrows to toggle the information displays.
SecurityThis topic applies to both Software Logger and the Logger Appliance.
Security settings enable you to configure SSL server certificates, enable and disable FIPS (Federal Information Processing Standards) mode on your system, and configure SSL client authentication for client certificate and Common Access Card (CAC) support.
Tip: For steps on how to create a user DN, see "Creating and Activating Users" on page 558, and refer to the section “Use Client DN” in the parameters table.
SSL Server CertificateThis topic applies to both Software Logger and the Logger Appliance.
Your system uses Secure Sockets Layer (SSL) technology to communicate securely over an encrypted channel with its clients, such as SmartConnectors, when using the SmartMessaging technology and other ArcSight systems. Your system ships with a self-signed certificate so that an SSL session can be established the first time you use the appliance. For more information on this option, see "Generating a Self-Signed Certificate" on the next page.
Although a self-signed certificate is provided for your use, Micro Focus strongly recommends using a certificate authority (CA) signed certificate. Additionally, ensure that the root certificate of the CA that signed your system’s certificate is trusted on the SmartConnector. If the CA’s root certificate is not trusted on the SmartConnector, follow instructions in "Installing or Updating a SmartConnector to be FIPS-Compliant" on page 543.
To facilitate obtaining a CA-signed certificate, your system can generate a Certificate Signing Request. Once a signed certificate file is available from the CA, it can be uploaded to your
Administrator's GuideChapter 6: System Admin
Security Page 533 of 743
system for use in a subsequent authentication. For detailed instructions, see "Generating a Certificate Signing Request (CSR)" on the next page.
Your system generates an audit event when the installed SSL certificate is going to expire in less than 30 days or has already expired. The event with Device Event Class ID “platform:407” is generated periodically until you replace the certificate with one that is not due to expire within 30 days.
Generating a Self-Signed CertificateThis topic applies to both Software Logger and the Logger Appliance.
Your appliance ships with a self-signed certificate so that an SSL session can be established the first time you connect. This type of certificate does not require signing from another entity and can be used immediately.
To generate a self-signed certificate:
1. Click System Admin from the top-level menu bar.
2. Click SSL Server Certificate from the Security section in the left panel to display the Generate Certificate/Certificate Signing Request page.
3. Click the Generate Certificate tab.
4. From the Enter Certificate Settings field, enter new values for the following fields:
Parameter Description
Country A two-letter country code, such as ‘US’ for the United States.
State/Province State or province name, such as ‘California.’
City/Locality City name, such as ‘Sunnyvale’.
Organization Name Company name, governmental entity, or similar overall organization.
Organizational Unit Division or department within the organization.
Administrator's GuideChapter 6: System Admin
Generating a Self-Signed Certificate Page 534 of 743
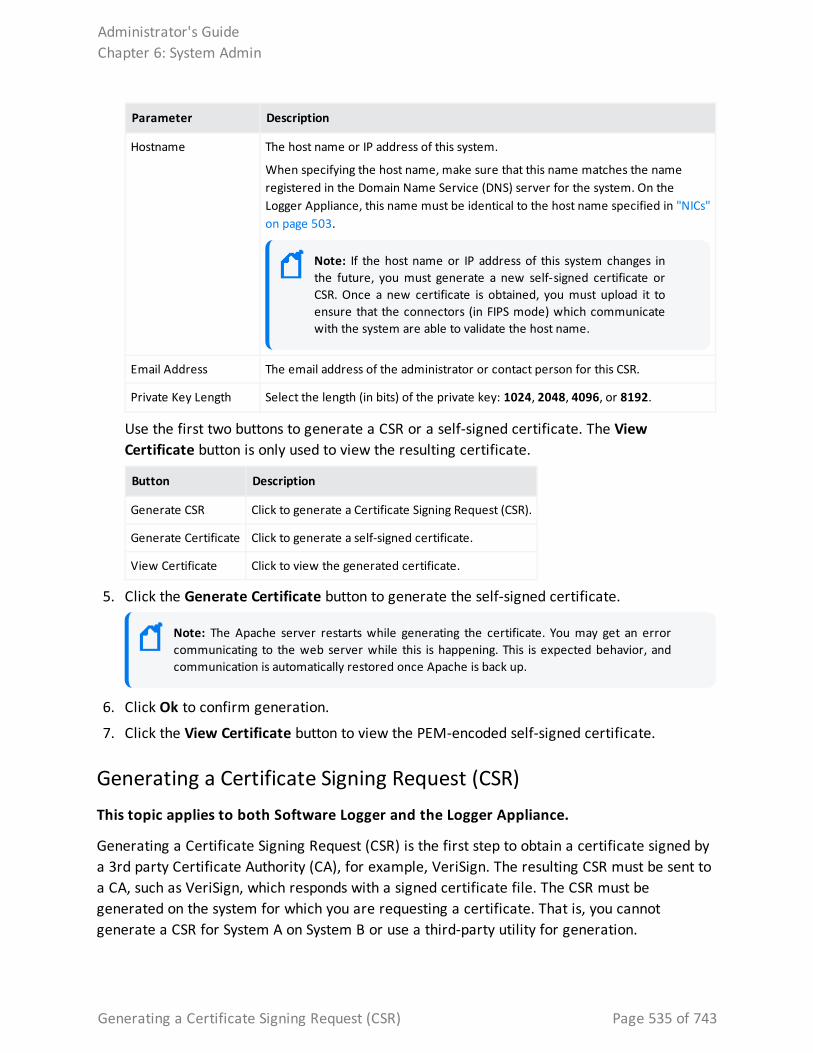
Parameter Description
Hostname The host name or IP address of this system.
When specifying the host name, make sure that this name matches the name registered in the Domain Name Service (DNS) server for the system. On the Logger Appliance, this name must be identical to the host name specified in "NICs" on page 503.
Note: If the host name or IP address of this system changes in the future, you must generate a new self-signed certificate or CSR. Once a new certificate is obtained, you must upload it to ensure that the connectors (in FIPS mode) which communicate with the system are able to validate the host name.
Email Address The email address of the administrator or contact person for this CSR.
Private Key Length Select the length (in bits) of the private key: 1024, 2048, 4096, or 8192.
Use the first two buttons to generate a CSR or a self-signed certificate. The View Certificate button is only used to view the resulting certificate.
Button Description
Generate CSR Click to generate a Certificate Signing Request (CSR).
Generate Certificate Click to generate a self-signed certificate.
View Certificate Click to view the generated certificate.
5. Click the Generate Certificate button to generate the self-signed certificate.
Note: The Apache server restarts while generating the certificate. You may get an error communicating to the web server while this is happening. This is expected behavior, and communication is automatically restored once Apache is back up.
6. Click Ok to confirm generation.
7. Click the View Certificate button to view the PEM-encoded self-signed certificate.
Generating a Certificate Signing Request (CSR)This topic applies to both Software Logger and the Logger Appliance.
Generating a Certificate Signing Request (CSR) is the first step to obtain a certificate signed by a 3rd party Certificate Authority (CA), for example, VeriSign. The resulting CSR must be sent to a CA, such as VeriSign, which responds with a signed certificate file. The CSR must be generated on the system for which you are requesting a certificate. That is, you cannot generate a CSR for System A on System B or use a third-party utility for generation.
Administrator's GuideChapter 6: System Admin
Generating a Certificate Signing Request (CSR) Page 535 of 743
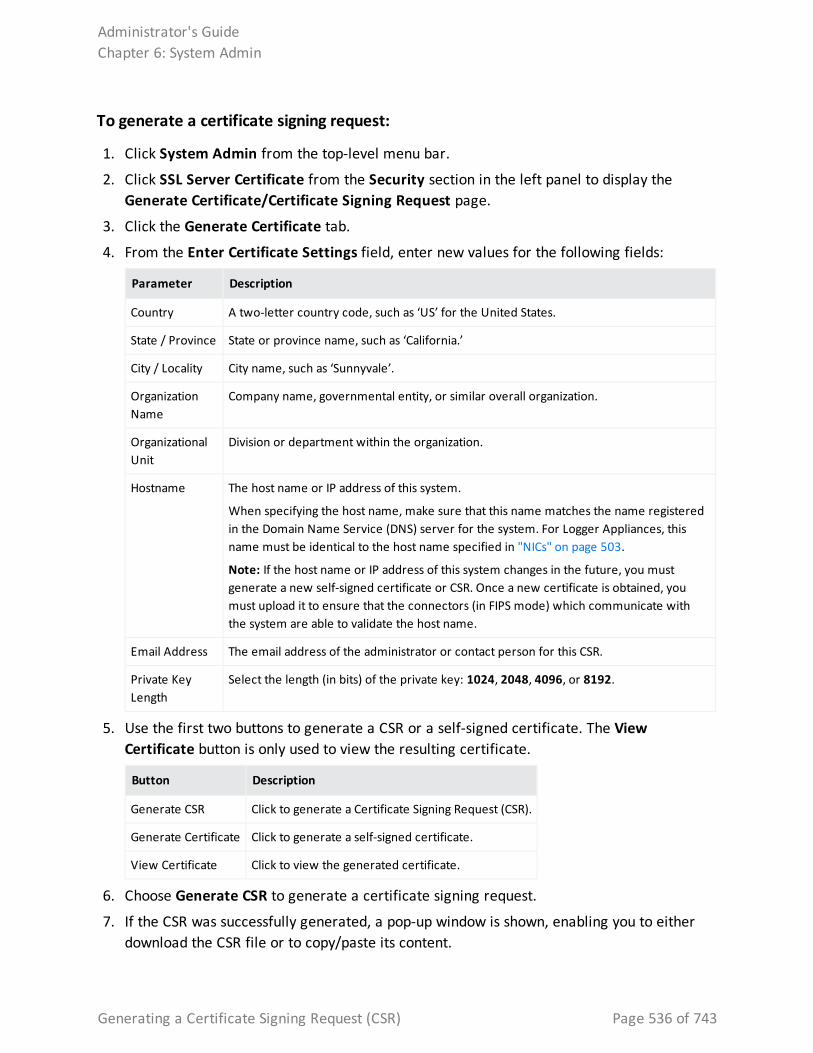
To generate a certificate signing request:
1. Click System Admin from the top-level menu bar.
2. Click SSL Server Certificate from the Security section in the left panel to display the Generate Certificate/Certificate Signing Request page.
3. Click the Generate Certificate tab.
4. From the Enter Certificate Settings field, enter new values for the following fields:
Parameter Description
Country A two-letter country code, such as ‘US’ for the United States.
State / Province State or province name, such as ‘California.’
City / Locality City name, such as ‘Sunnyvale’.
Organization Name
Company name, governmental entity, or similar overall organization.
Organizational Unit
Division or department within the organization.
Hostname The host name or IP address of this system.
When specifying the host name, make sure that this name matches the name registered in the Domain Name Service (DNS) server for the system. For Logger Appliances, this name must be identical to the host name specified in "NICs" on page 503.
Note: If the host name or IP address of this system changes in the future, you must generate a new self-signed certificate or CSR. Once a new certificate is obtained, you must upload it to ensure that the connectors (in FIPS mode) which communicate with the system are able to validate the host name.
Email Address The email address of the administrator or contact person for this CSR.
Private Key Length
Select the length (in bits) of the private key: 1024, 2048, 4096, or 8192.
5. Use the first two buttons to generate a CSR or a self-signed certificate. The View Certificate button is only used to view the resulting certificate.
Button Description
Generate CSR Click to generate a Certificate Signing Request (CSR).
Generate Certificate Click to generate a self-signed certificate.
View Certificate Click to view the generated certificate.
6. Choose Generate CSR to generate a certificate signing request.
7. If the CSR was successfully generated, a pop-up window is shown, enabling you to either download the CSR file or to copy/paste its content.
Administrator's GuideChapter 6: System Admin
Generating a Certificate Signing Request (CSR) Page 536 of 743
To copy/paste, copy all the lines (inclusive) from -----BEGIN CERTIFICATE REQUEST----- to -----END CERTIFICATE REQUEST-----.
8. Send the CSR file to your certificate authority to obtain the CA-signed certificate.
9. Once the CA-signed certificate file is obtained, continue on to "Importing a Certificate" below below.
Importing a CertificateThis topic applies to both Software Logger and the Logger Appliance.
After you have obtained a certificate from your certificate authority (CA), you can follow the steps below to import it onto your system.
To import a certificate:
1. Click System Admin from the top-level menu bar.
2. Click SSL Server Certificate under the Security section in the left panel.
3. Click the Import Certificate tab.
4. Click the Browse button to locate the signed certificate file on your local file system.
Note: The imported certificate must be in Privacy Enhanced Mail (PEM) format.
5. Click Import and Install to import the specified certificate.
6. If using HTTPS and depending on your browser, you may need to close and restart the browser for the new certificate to take effect. If you are unsure of your browser's requirements, close and restart it.
Enabling HTTP Strict Transport SecurityHTTP Strict Transport Security (HSTS) is a simple and widely supported standard to ensure that browsers always connect to a website over HTTPS. Using it, you can remove the need for the insecure practice of redirecting users from http:// to https:/// URLs.
Connecting to the Logger Web UI requires an HTTPS URL:
l https://<hostname or IP address> for Logger Appliances.
l https://<hostname or IP address>:<configured_port> for Software Loggers.
However, you may accidentally try to connect to Logger over HTTP instead of HTTPS, leaving you vulnerable to a man-in-the-middle attack. You can leverage Logger's support for HSTS to ensure that your browser always connects to Logger over HTTPS.
Administrator's GuideChapter 6: System Admin
Importing a Certificate Page 537 of 743
To enable HSTS:
1. On Logger, generate a Certificate Signing Request (CSR). See "Generating a Certificate Signing Request (CSR)" on page 535 for the steps to generate the CSR.
l Do not use a self-signed certificate.
l Do use the fully-qualified domain name (FQDN) when creating the certificate, for example, n192-0-2-h24.server.yourco.com.
2. Have the CSR signed by a Certificate Authority(CA), such as Verisign, who will return the CA-signed certificate back to you.
3. Import the CA-signed certificate into Logger. See "Importing a Certificate" on the previous page for the steps to import the certificate.
4. In the browser, import the CA-signed certificate in your browser's trust store. Refer to your browser’s help for instructions on importing a trusted certificate.
For example, in Firefox 47.x, you would select Options from the menu, click Advanced, click the Certificates tab, click View Certificate, click the Authorities tab, and click the Import button.
5. Close and restart the browser. You should now be able to connect to Logger using the following HTTP addresses:
l http://<Logger FQDN> for Logger Appliances.
l http://<Logger FQDN>:<configured_port> for Software Loggers.
Note: Be sure to use the Logger FQDN and not an IP address or hostname in the URL.
SSL Client AuthenticationThis topic applies to both Software Logger and the Logger Appliance.
Your system supports client authentication using SSL certificates. SSL client authentication is a form of two-factor authentication that can be used as an alternate or in addition to local password authentication. As a result, your system can be configured for SmartCards, such as Common Access Card (CAC) based authentication. CAC is a standard identification card for active duty members of the Uniformed Services, Selected Reserve, DOD civilian employees, and eligible contractor personnel.
Note: CAC is a form of client certificate authentication. Information on client certificate authentication applies to CAC.
Administrator's GuideChapter 6: System Admin
SSL Client Authentication Page 538 of 743
Your system also supports LDAPS authentication. The SSL certificate for the LDAPS server must be uploaded into the trusted store. After uploading the SSL certificate, the aps process must be restarted (System Admin > Process Status > aps > Restart).
Configuring Logger to Support SSL Client AuthenticationThis topic applies to both Software Logger and the Logger Appliance.
Perform the following steps to configure Logger to support SSL client authentication.
To configure Logger to support SSL client:
On the Logger:
1. If the Logger uses the default signed certificate it shipped with from ArcSight, replace it with a FIPS-compliant, signed SSL server certificate. Follow instructions at "Uploading Trusted Certificates" on the next page to load the certificate.
Caution: All SSL client certificates used for authentication must be FIPS-compliant (that is, hashed with FIPS-compliant algorithms) even if FIPS is not enabled on your Logger.
2. Enable client certificate authentication, as described in "Client Certificate Authentication" on page 552.
3. Choose one of the following:
l If the client certificates are CA-signed, upload the root certificate of the authority who signed the certificates that will be used for authenticating clients, as described in "Uploading Trusted Certificates" on the next page.
l If the client certificates used to authenticate with Logger are signed by different CAs, make sure you upload root certificates of all CAs.
l If the client certificates are self-signed, upload the public portion of the client certificate.
4. Configure a user name for each user who will be connecting to the Logger using a client certificate, as described in "User Management" on page 558.
5. (Optional) Upload a certificate revocation list (CRL), as described in "Uploading a Certificate Revocation List" on the next page.
6. (Optional) If this Logger is configured to use only SSL Client Authentication, make sure this Logger’s Authorization ID and Code are appropriately configured on other Loggers that with it. For more information, see "Peer Nodes" on page 493.
On the Client (Web browser):
Configure your browser to provide the SSL client certificate when accessing Logger. (Upload the private key in PKCS 12 format in your browser.)
Administrator's GuideChapter 6: System Admin
Configuring Logger to Support SSL Client Authentication Page 539 of 743
Uploading Trusted CertificatesThis topic applies to both Software Logger and the Logger Appliance.
A trusted certificate is used to authenticate users that log in to your system. Uploading a trusted certificate is required if you are using LDAPS authentication. The trusted certificate is used to authenticate the remote LDAPS server. The certificate needs to be in Privacy Enhanced Mail (PEM) format.
To upload a trusted certificate:
1. Click System Admin from the top-level menu bar.
2. Click SSL Client Authentication in the Security section in the left panel.
3. On the Trusted Certificates tab, click Browse to find the trusted certificate on your local file system.
4. Click Upload. The trusted certificate is uploaded and listed in the Certificates in Repository list.
To view details about a trusted certificate, click the link displayed in the Certificate Name column.
To delete a trusted certificate, select the certificate and click Delete.
Uploading a Certificate Revocation ListThis topic applies to both Software Logger and the Logger Appliance.
A certificate revocation list (CRL) is a computer-generated record that identifies certificates that have been revoked or suspended before their expiration dates. To support CAC, you need to upload a CRL file to your ArcSight system. The CRL file needs to be in PEM format.
To upload a CRL file:
1. Click System Admin from the top-level menu bar.
2. Click SSL Client Authentication in the Security section in the left panel.
3. In the Certificate Revocation List tab, click Browse to find the CRL file on your local file system.
4. Click Upload. The CRL is uploaded and listed in the Certificate Revocation list.
To view details about a CRL, click the link displayed in the Issuer Name column.
To delete a CRL file, select it and click the Delete button.
Administrator's GuideChapter 6: System Admin
Uploading Trusted Certificates Page 540 of 743
Note: To enable client certificate authentication, see "Client Certificate Authentication" on page 552.
FIPS 140-2This topic applies to both Software Logger and the Logger Appliance.
Your system supports the Federal Information Processing Standard 140-2 (FIPS 140-2). FIPS 140-2 is a standard published by the National Institute of Standards and Technology (NIST) and is used to accredit cryptographic modules in software components. The US Federal government requires that all IT products dealing with Sensitive, but Unclassified (SBU) information meet these standards.
FIPS ComplianceIf your system needs to be FIPS 140-2 compliant, you can enable FIPS. Once you do so, the system uses the cryptographic algorithms defined by the NIST for FIPS 140-2 for all encrypted communication between its internal and external components.
Note: To be fully FIPS 140-2 compliant, all components of your Logger deployment need to be in FIPS 140-2 mode. For example, if you enable FIPS 140-2 on your Logger but the SmartConnectors that send events to it are not running in FIPS 140-2 mode, your deployment is not fully FIPS 140-2 compliant.
In a typical deployment, your Logger will communicate with the following components. To be fully FIPS-compliant, all of these components should be FIPS-enabled:
l SmartConnectors that send events to the Logger: Follow instructions in "Installing or Updating a SmartConnector to be FIPS-Compliant" on page 543 to ensure that your connector is FIPS-compliant.
l Logger forwarders, such as ArcSight Managers to which Logger forwards events and alerts: The system to which your FIPS-compliant Logger forwards events should be FIPS-compliant as well. Additionally, you need to import that system’s SSL server certificate on the Logger so that Logger can communicate with it.
If you forward events and alerts to an ArcSight Manager, it needs to run ESM 4.0 SP2 or later to enable FIPS 140-2 on it. For more information, see the ArcSight ESM Installation and Configuration Guide for the ESM version you are running. Additionally, follow instructions in "ESM Destinations" on page 406 to complete configuration of this setup.
l Loggers: Logger automatically uses FIPS 140-2 compliant algorithms. Therefore, no action is required on Logger, except enabling FIPS as described in this section. When enabling FIPS on a Software Logger, make sure that the machine on which Logger is installed is used
Administrator's GuideChapter 6: System Admin
FIPS 140-2 Page 541 of 743
exclusively for Logger.
Note: Enabling FIPS 140-2 on Software Logger does not make the system on which it is installed FIPS 140- 2 compliant. Consult your system’s documentation to determine the requirements for making the entire system FIPS 140-2 compliant.
l A Logger must use a CA-signed certificate if it is a destination of a software-based SmartConnector. Additionally, ensure that the root certificate of the CA that signed Logger's certificate is trusted on the SmartConnector. If the CA’s root certificate is not trusted on the SmartConnector, follow instructions in "Installing or Updating a SmartConnector to be FIPS-Compliant" on the next page.
Enabling and Disabling FIPS Mode on LoggerThis topic applies to both Software Logger and the Logger Appliance.
You can enable or disable FIPS mode on Logger to suit your needs; however, you will need to reboot (Logger Appliance) or restart (Software Logger) before the new mode will be effective.
Things to be Aware of When Enabling FIPS Mode on Logger:
l Your Logger must be set up with a CA-signed SSL certificate. For more information, see "SSL Server Certificate" on page 533.
l A Logger, even when in non-FIPS mode, must use a CA-signed certificate if it is software-based SmartConnector. Additionally, ensure that the root certificate of the CA that signed Logger's certificate is trusted on the SmartConnector. If the CA’s root certificate is not trusted on the SmartConnector, follow instructions in "Installing or Updating a SmartConnector to be FIPS-Compliant" on the next page.
To enable or disable FIPS mode:
Note: Make sure you are familiar with the configuration requirements on your Logger as described in "Things to be Aware of When Enabling FIPS Mode on Logger:" above.
1. Click System Admin from the top-level menu bar.
2. Click FIPS 140-2 in the Security section in the left panel.
3. Click Enable or Disable for the Select FIPS Mode option.
4. Click Save.
5. Do one of the following:
l Use the following command to restart Software Logger: <install_dir>/current/arcsight/logger/bin/loggerd restart
l Reboot your Logger Appliance.
Administrator's GuideChapter 6: System Admin
Enabling and Disabling FIPS Mode on Logger Page 542 of 743
The FIPS Status Table shows which processes and components of the Logger are FIPS-enabled.
Installing or Updating a SmartConnector to be FIPS-CompliantThis topic applies to both Software Logger and the Logger Appliance.
The information in this section is same as that in the ArcSight Installing FIPS-Compliant SmartConnectors document except that the information in that document is generally applicable, while information in this section is in the context of Logger.
FIPS mode is supported on SmartConnectors running version 4.7.5.5372 or later.
If you are… Then…
Installing a new SmartConnector to send events to a Logger in FIPS-compliant mode
Follow the installation prompts. No additional steps are necessary.
Updating a SmartConnector to be FIPS-compliant and the SmartConnector is not running version 4.7.5.5372 or later.
1. Upgrade the SmartConnector to a FIPS-supported version. Follow instructions in the SmartConnector User’s Guide to upgrade the SmartConnector.
2. Create an agent.properties file (see Step 2a, below). No additional steps are necessary.
Updating a SmartConnector to be FIPS-compliant and the SmartConnector is running version 4.7.5.5372 or later.
Create an agent.properties file (see Step 2a, below). No additional steps are necessary.
To make a SmartConnector FIPS-compliant:
1. Follow device configuration steps provided in the Smart Connector Configuration Guide, then follow the installation procedure through installation of the core Connector software (SmartConnector Installation Step 2).
At Step 3 of the Connector setup, click Cancel to exit the setup. You must then configure the NSS DB, which is necessary for installing the connector in FIPS-compliant mode.
Once the NSS DB is configured, continue to the next step.
2. To enable FIPS Mode on the SmartConnector:
a. Create an agent.properties file at the following location if it does not exist already:
$ARCSIGHT_HOME/current/user/agent
b. Enter the following property, then save and close the file.
fips.enabled=true
3. Import Logger’s certificate on the SmartConnector:
Administrator's GuideChapter 6: System Admin
Installing or Updating a SmartConnector to be FIPS-Compliant Page 543 of 743
a. In a command window on your SmartConnector machine, from $ARCSIGHT_HOME/current/bin, enter the following command to turn off FIPS mode: ./arcsight runmodutil -fips false -dbdir $ARCSIGHT_HOME/current/user/agent/nssdb.client
b. Export the Logger certificate file and import it to the SmartConnector’s NSS DB as follows:
l Export Logger’s certificate file from the browser you use to connect to it. Refer to your browser’s Help for instructions. For example, to export a Logger’s certificate file on Firefox v.44, click to open the Options menu, then select Advanced > Certificates > View Certificates > Servers > your Logger Appliance and click Export…. Save the certificate file with a .crt or .cer extension.
l Copy the certificate file you exported in the previous step (in this example, loggercert.crt) to the $ARCSIGHT_HOME/current/bin directory on the SmartConnector. From $ARCSIGHT_HOME/current/bin, enter the following:
./arcsight runcertutil -A -n mykey -t “CT,C,C” -d $ARCSIGHT_HOME/current/user/agent/nssdb.client -i bin/loggercert.crt
c. Enter the following command to re-enable FIPS mode that you turned off in Step 1:
./arcsight runmodutil -fips true -dbdir $ARCSIGHT_HOME/current/user/agent/nssdb.client
d. Ensure that the SmartConnector can resolve the name specified in the CN value of the Logger certificate’s Subject: field. If the name is not resolvable, add it to the SmartConnector system’s Hosts file.
e. If you are installing a new SmartConnector, continue to the next step.
If you are updating your SmartConnector to be FIPS-compliant, ensure that the Connector’s Logger destination host name is same as the CN value in the certificate’s Subject field, and exit this procedure.
4. To return to the SmartConnector configuration wizard, enter the following from $ARCSIGHT_HOME/current/bin:
./arcsight connectorsetup
5. When prompted whether you want to start in Wizard Mode, click Yes.
The Destination selection window is again displayed. Return to Installation Step 4 of your SmartConnector Configuration Guide to continue the Connector configuration.
Note: When configuring the connector, ensure that the connector’s Logger destination host name is same as the CN value in the certificate’s Subject: field.
Administrator's GuideChapter 6: System Admin
Installing or Updating a SmartConnector to be FIPS-Compliant Page 544 of 743
For the remainder of the configuration process, see the Configuration Guide for the SmartConnector you are installing. The specific configuration guide provides information about how to configure the device for event collection, specific installation parameters required during the configuration process, and a table of vendor-specific field mappings to ArcSight events.
Users/GroupsThis topic applies to both Software Logger and the Logger Appliance.
Use the Users/Groups sub-menu to configure users and user groups, and to set authentication options.
AuthenticationThis topic applies to both Software Logger and the Logger Appliance.
Authentication Settings enable you to specify the settings and policies for user log in sessions, password rules and lockouts, and external authentication options.
SessionsThis topic applies to both Software Logger and the Logger Appliance.
The Session tab lets you specify the maximum number of simultaneous sessions for a single user account, and the length of time after which a user session is automatically logged out or a user account disabled. By default, a single user account can have up to 15 simultaneous active sessions, and a user account is logged out after 15 minutes of inactivity.
To change session settings:
1. Click System Admin from the top-level menu bar.
2. Click Authentication in the Users/Groups section.
Administrator's GuideChapter 6: System Admin
Users/Groups Page 545 of 743
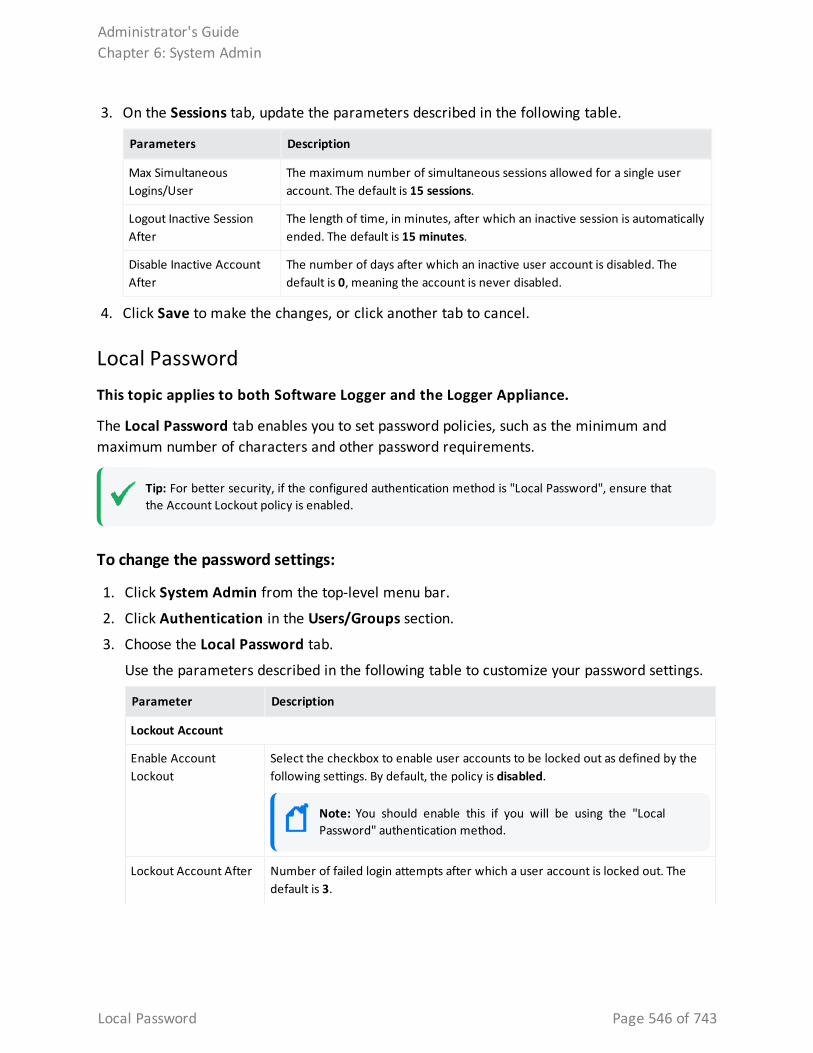
3. On the Sessions tab, update the parameters described in the following table.
Parameters Description
Max Simultaneous Logins/User
The maximum number of simultaneous sessions allowed for a single user account. The default is 15 sessions.
Logout Inactive Session After
The length of time, in minutes, after which an inactive session is automatically ended. The default is 15 minutes.
Disable Inactive Account After
The number of days after which an inactive user account is disabled. The default is 0, meaning the account is never disabled.
4. Click Save to make the changes, or click another tab to cancel.
Local PasswordThis topic applies to both Software Logger and the Logger Appliance.
The Local Password tab enables you to set password policies, such as the minimum and maximum number of characters and other password requirements.
Tip: For better security, if the configured authentication method is "Local Password", ensure that the Account Lockout policy is enabled.
To change the password settings:
1. Click System Admin from the top-level menu bar.
2. Click Authentication in the Users/Groups section.
3. Choose the Local Password tab.
Use the parameters described in the following table to customize your password settings.
Parameter Description
Lockout Account
Enable Account Lockout
Select the checkbox to enable user accounts to be locked out as defined by the following settings. By default, the policy is disabled.
Note: You should enable this if you will be using the "Local Password" authentication method.
Lockout Account After Number of failed login attempts after which a user account is locked out. The default is 3.
Administrator's GuideChapter 6: System Admin
Local Password Page 546 of 743
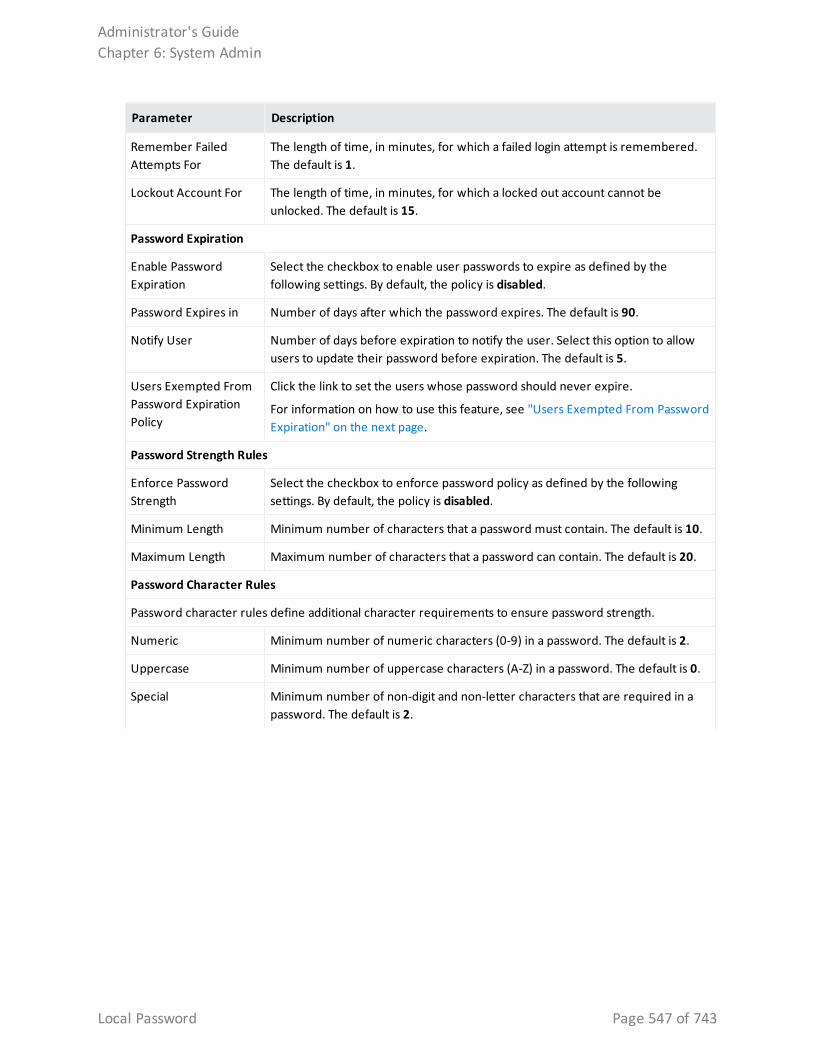
Parameter Description
Remember Failed Attempts For
The length of time, in minutes, for which a failed login attempt is remembered. The default is 1.
Lockout Account For The length of time, in minutes, for which a locked out account cannot be unlocked. The default is 15.
Password Expiration
Enable Password Expiration
Select the checkbox to enable user passwords to expire as defined by the following settings. By default, the policy is disabled.
Password Expires in Number of days after which the password expires. The default is 90.
Notify User Number of days before expiration to notify the user. Select this option to allow users to update their password before expiration. The default is 5.
Users Exempted From Password Expiration Policy
Click the link to set the users whose password should never expire.
For information on how to use this feature, see "Users Exempted From Password Expiration" on the next page.
Password Strength Rules
Enforce Password Strength
Select the checkbox to enforce password policy as defined by the following settings. By default, the policy is disabled.
Minimum Length Minimum number of characters that a password must contain. The default is 10.
Maximum Length Maximum number of characters that a password can contain. The default is 20.
Password Character Rules
Password character rules define additional character requirements to ensure password strength.
Numeric Minimum number of numeric characters (0-9) in a password. The default is 2.
Uppercase Minimum number of uppercase characters (A-Z) in a password. The default is 0.
Special Minimum number of non-digit and non-letter characters that are required in a password. The default is 2.
Administrator's GuideChapter 6: System Admin
Local Password Page 547 of 743
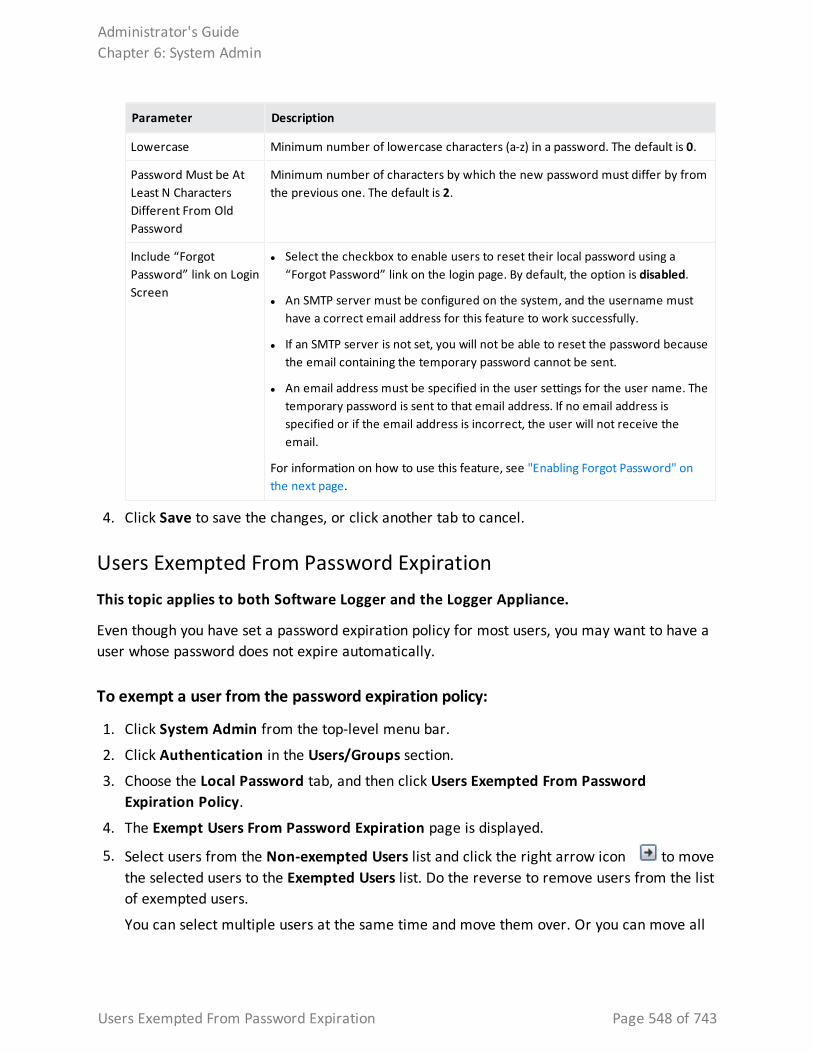
Parameter Description
Lowercase Minimum number of lowercase characters (a-z) in a password. The default is 0.
Password Must be At Least N Characters Different From Old Password
Minimum number of characters by which the new password must differ by from the previous one. The default is 2.
Include “Forgot Password” link on Login Screen
l Select the checkbox to enable users to reset their local password using a “Forgot Password” link on the login page. By default, the option is disabled.
l An SMTP server must be configured on the system, and the username must have a correct email address for this feature to work successfully.
l If an SMTP server is not set, you will not be able to reset the password because the email containing the temporary password cannot be sent.
l An email address must be specified in the user settings for the user name. The temporary password is sent to that email address. If no email address is specified or if the email address is incorrect, the user will not receive the email.
For information on how to use this feature, see "Enabling Forgot Password" on the next page.
4. Click Save to save the changes, or click another tab to cancel.
Users Exempted From Password ExpirationThis topic applies to both Software Logger and the Logger Appliance.
Even though you have set a password expiration policy for most users, you may want to have a user whose password does not expire automatically.
To exempt a user from the password expiration policy:
1. Click System Admin from the top-level menu bar.
2. Click Authentication in the Users/Groups section.
3. Choose the Local Password tab, and then click Users Exempted From Password Expiration Policy.
4. The Exempt Users From Password Expiration page is displayed.
5. Select users from the Non-exempted Users list and click the right arrow icon to move the selected users to the Exempted Users list. Do the reverse to remove users from the list of exempted users.
You can select multiple users at the same time and move them over. Or you can move all
Administrator's GuideChapter 6: System Admin
Users Exempted From Password Expiration Page 548 of 743
users by clicking the icon.
6. Click Save to save the policy or Cancel to exit.
Enabling Forgot Password
About
This topic applies to both Software Logger and the Logger Appliance.
This feature is disabled by default, to enable it:
l All servers must be SMTP configured. For more information on Simple Mail Transfer Protocol, see "Local Password" on page 546.
l A SSL certificate must be uploaded by the user. For more information on SSL certificates, see "SSL Server Certificate" on page 533
Users can reset their own password from a Forgot Password? link accessible from the login screen. Logger sends the user a temporary password to the email address on file.
Procedure
1. From System Admin > Authentication > Local Password tab, scroll down to the bottom of the page,
2. Check Include "Forgot Password" link on Login Screen
3. Click Save.
Administrator's GuideChapter 6: System Admin
Enabling Forgot Password Page 549 of 743
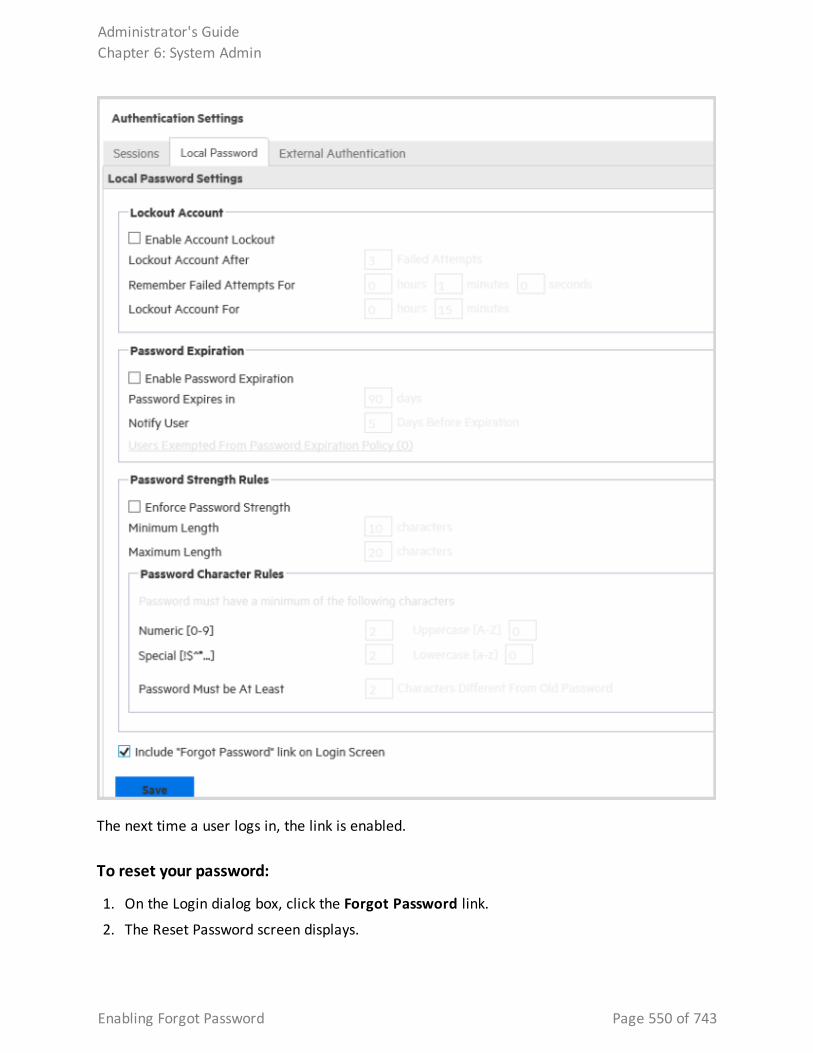
The next time a user logs in, the link is enabled.
To reset your password:
1. On the Login dialog box, click the Forgot Password link.
2. The Reset Password screen displays.
Administrator's GuideChapter 6: System Admin
Enabling Forgot Password Page 550 of 743
3. Enter a user name on the Reset Password screen. Use only alphanumeric characters, spaces and ._-@ for the username. Otherwise, the operation fails.
4. Click Reset Password.
An automated email with a temporary password is sent to the email address specified for that user. After logging in with the temporary password, Logger redirects you to the Change Password page, where you can reset your password.
Tip: The temporary password is valid until the time specified in the email. The default is five hours. If you do not log in within the specified time, only an administrator can reset the password to generate another temporary password.
Note: Admin password cannot be reset. If an attempt is made, a message displays indicating the action has been successfully completed even though it is not.
See also
l "Authentication" on page 545
External AuthenticationThis topic applies to both Software Logger and the Logger Appliance.
Besides providing a local password authentication method, your system supports Client Certificate/CAC, LDAP, and RADIUS authentication. It is not possible to enable all authentication methods simultaneously.
To enable external authentication:
1. Click System Admin from the top-level menu bar.
2. Click Authentication in the Users/Groups section.
3. Click the External Authentication tab.
4. Select an authentication method from the menu.
5. Click Save.
Note: CAC is a form of client certificate authentication. Information on client certificate authentication applies to CAC.
Administrator's GuideChapter 6: System Admin
External Authentication Page 551 of 743
Local Password Authentication
This topic applies to both Software Logger and the Logger Appliance.
Local Password Authentication is the default authentication method. It implements the local password policies set in the Local Password tab. For more information, see "Local Password" on page 546.
To configure local password authentication:
1. Click System Admin from the top-level menu bar.
2. Click Authentication in the Users/Groups section.
3. Choose the ExternalAuthentication tab.
4. From the pull-down menu, choose Local Password Authentication
5. Click Save.
Client Certificate Authentication
This topic applies to both Software Logger and the Logger Appliance.
This authentication method requires that users authenticate using a client certificate. For each client certificate, a user account with a Distinguished Name (DN) matching the one in the client certificate must exist on your system.
Caution: All SSL client certificates used for authentication must be FIPS-compliant (hashed with FIPS-compliant algorithms) even if FIPS is not enabled on your system.
To configure client certificate authentication:
1. Click System Admin from the top-level menu bar.
2. Click Authentication in the Users/Groups section.
3. Choose the External Authentication tab.
4. From the pull-down menu, choose Client Certificate.
5. Allow Local Password Fallback provides two options:
l Allow Local Password Fallback for Default Admin Only
Select this option to allow the default admin user to log in using only a username and password if the client certificate is not available or invalid. This privilege is restricted to the default admin user only—other users must have a valid client certificate to gain access to the system. This option is enabled by default.
Administrator's GuideChapter 6: System Admin
Local Password Authentication Page 552 of 743
l Allow Local Password Fallback for All Users
Select this option to allow all users to log in using their local user name and password if their client certificate is invalid or unavailable.
For more information, see "Local Password Fallback" on page 557.
6. Click Save.
Client Certificate and Local Password Authentication
This topic applies to both Software Logger and the Logger Appliance.
This authentication method requires that users authenticate using an SSL client certificate and a valid local password. Local Password refers to the password associated with the user credentials created in User Management in the Users/Groups section. See "Creating and Activating Users" on page 558 for details.
A user account on your system must be defined with a Distinguished Name (DN) that matches the one in the client certificate.
For instructions on how to create a user DN, see "Creating and Activating Users" on page 558 and refer to the section called “Use Client DN” in the parameters table.
Caution: All SSL client certificates used for authentication must be FIPS-compliant (hashed with FIPS-compliant algorithms) even if FIPS is not enabled on your system.
To configure client certificate and password authentication:
1. Click System Admin from the top-level menu bar.
2. Click Authentication in the Users/Groups section.
3. Choose the External Authentication tab.
4. From the pull-down menu, choose Client Certificate AND Local Password.
5. Allow Local Password Fallback provides two options:
l Allow Local Password Fallback for Default Admin Only
This option, always enabled, enables the default admin user to log in using only a username and password.
l Allow Local Password Fallback for All Users
This option is always disabled. You cannot enable it when using the Client Certificate AND Local Password authentication method.
For more information, see "Local Password Fallback" on page 557.
6. Click Save.
Administrator's GuideChapter 6: System Admin
Client Certificate and Local Password Authentication Page 553 of 743
RADIUS Authentication
This topic applies to both Software Logger and the Logger Appliance.
This authentication method enables users to authenticate against a RADIUS server. Even when RADIUS authentication is enabled, each user account must exist locally on your system. The username must match the one in the RADIUS server, although the password can be different. A user must present a valid username and (RADIUS) password to be successfully authenticated.
To configure RADIUS authentication settings:
1. Click System Admin from the top-level menu bar.
2. Click Authentication in the Users/Groups section.
3. Choose the External Authentication tab.
4. From the pull-down menu, choose RADIUS.
5. Allow Local Password Fallback provides two options:
l Allow Local Password Fallback for Default Admin Only
Select this option to allow the default admin user to log in using only a username and password if RADIUS authentication fails. This privilege is restricted to the admin user only—all others must be authenticated by RADIUS. This option is enabled by default.
l Allow Local Password Fallback for All Users
Select this option to allow all users to log in using their local user name and password, if RADIUS authentication fails. For more information, see "Local Password Fallback" on page 557.
Administrator's GuideChapter 6: System Admin
RADIUS Authentication Page 554 of 743
6. Update the RADIUS Server parameters as necessary:
Parameter Description
Server Hostname[:port] Enter the host name and port of the RADIUS server.
Backup Server hostname[:port] (optional)
(Optional) Enter the backup RADIUS server to use if the primary server does not respond. If the server returns an authentication failure (bad password, unknown username, etc), then the backup server is not tried. The backup server is tried only when the primary server has a communication failure.
Use the same format as the primary server to specify the host name and port.
Shared Authentication Secret
Enter a RADIUS passphrase.
NAS IP Address The IP address of the Network Access Server (NAS).
Request Timeout The length of time, in seconds, to wait for a response from the RADIUS server (in seconds). The default is 10.
Retry Request Number of times to retry a RADIUS request. The default is 1.
RADIUS Protocol Use the pull-down menu to choose a protocol option. The default is None.
7. Click Save.
LDAP/AD and LDAPS Authentication
This topic applies to both Software Logger and the Logger Appliance.
This authentication method authenticates users against an LDAP server. Even when LDAP is enabled, each user account must exist locally on your system. Although the user name specified locally can be different from the one specified on the LDAP server, the Distinguished Name (DN) specified for each user account must match the one in the LDAP server.
Tip: For steps on how to create a user DN, see "Creating and Activating Users" on page 558, and the parameter "Use Client DN" on page 559.”
To set up LDAP authentication:
1. Click System Admin from the top-level menu bar.
2. Click Authentication in the Users/Groups section.
3. Choose the ExternalAuthentication tab.
4. From the pull-down menu, choose LDAP.
5. Allow Local Password Fallback provides two options:
Administrator's GuideChapter 6: System Admin
LDAP/AD and LDAPS Authentication Page 555 of 743
l Allow Local Password Fallback for Default Admin Only
Select this option to allow the default admin user to log in using only a username and password if LDAP authentication fails. This privilege is restricted to the default admin user only—all others must be authenticated by LDAP. This option is enabled by default.
l Allow Local Password Fallback for All Users
Select this option to allow all users to log in using their local user name and password if LDAP authentication fails. For more information, see "Local Password Fallback" on the next page.
LDAP Server has the following parameters:
Parameter Description
Server Hostname[:port] (optional)
(Optional) Enter the host name or IP address and port of the LDAP server in the following format:
ldap://<hostname or IP address>:<port>
ldaps://<hostname or IP address>:<port>
Additional steps are required for the use of LDAPS. See .
Backup Server Hostname[:Port] (optional)
(Optional) Enter the backup LDAP server to use if the primary server does not respond. If the server returns an authentication failure (bad password, unknown username, etc), then the backup server is not tried. The backup server is tried only when the primary server has a communication failure.
Use the same format as the primary server to specify the host name and port.
Request Timeout The length of time, in seconds, to wait for a response from the LDAP server. The default is 10.
6. When finished, click Save.
To set up LDAP Over SSL authentication:
1. Verify that an SSL certificate for the LDAPS server has been uploaded into the trusted store. See "Uploading Trusted Certificates" on page 540.
2. Follow the steps for "To set up LDAP authentication:" on the previous page.
3. Enter the URL for the LDAPS server(s), starting with ldaps://.
4. From the System Admin System menu, click Process Status.
5. From the Processes table, select aps.
6. Click Restart.
Caution: You must restart the aps process, or attempts to authenticate through LDAPS will fail.
Administrator's GuideChapter 6: System Admin
LDAP/AD and LDAPS Authentication Page 556 of 743
Local Password Fallback
This topic applies to both Software Logger and the Logger Appliance.
You can use this feature to log in using your local user name and password if the external authentication (Certificate, LDAP, or RADIUS) fails, if you forgot your password to the authentication server, or if the authentication server is not available.
The Use Local Authentication feature enables the default admin to log in even when the remote authentication server is not available, by adding a Use Local Authentication checkbox to the login screen. Out-of-box, this option is enabled only for the default administrator. However, it is possible to allow local password fallback for all users. For example, you could configure the RADIUS authentication method to allow users to log in using local authentication instead of RADIUS should they fail to authenticate to any configured external RADIUS servers.
For information on how to allow local password fallback for all users for all users, see "Client Certificate Authentication" on page 552, "LDAP/AD and LDAPS Authentication" on page 555, or "RADIUS Authentication" on page 554.
To log in when authentication fails:
1. On the ArcSight Logger Login dialog, select the Use Local Authentication checkbox.
Note: This option is only available to the default admin unless it has been enabled for other users.
2. Enter your user name and password and click Login.
Login BannerThis topic applies to both Software Logger and the Logger Appliance.
You can customize the message on the login screen to suit your needs. The text you enter in the Content and confirmation fields are displayed in a first page. After the user acknowledges the message, a second page with Username and Password fields will appear. You must have the “Configure Login Settings” permission enabled for your user account to edit the login banner.
To customize the login banner:
1. Click System Admin from the top-level menu bar.
2. Click Login Banner in the Users/Groups section.
3. Enter the text you want to display as the login banner in the Content field
Administrator's GuideChapter 6: System Admin
Local Password Fallback Page 557 of 743
You can enter only unformatted text in this field; however, you can apply standard HTML tags to display formatted text. Loading images in this field is not allowed.
4. (Optional) Enter text in the confirmation field.
If you enter text in this field, it will be converted to a link that the user must acknowledge to transition to the Username and Password page. For example, if you enter "Are you sure?", "Do you want to proceed?" or "I agree" in this field, the user must click on the text in order to continue. Otherwise, if no text was added, the user must click ok to enable the next page.
5. Click Save.
User ManagementThis topic applies to both Software Logger and the Logger Appliance.
The Users and Groups tabs enable you to manage users and user groups on your system. User groups are a way to enforce access control to various sections of your system.
Creating and Activating UsersThis topic applies to both Software Logger and the Logger Appliance.
Open the Users tab to manage the users that can log in to your system. You can add a new user, edit user information, or delete a user at any time. You must have the appropriate System Admin group rights to perform these functions.
Adding a User
To add a new user:
1. Click System Admin from the top-level menu bar.
2. Click User Management in the Users/Groups section in the left panel.
3. In the Users tab, click Add.
4. Enter the following parameters.
Parameter Description
Credentials
Login The user's login name.
Administrator's GuideChapter 6: System Admin
User Management Page 558 of 743
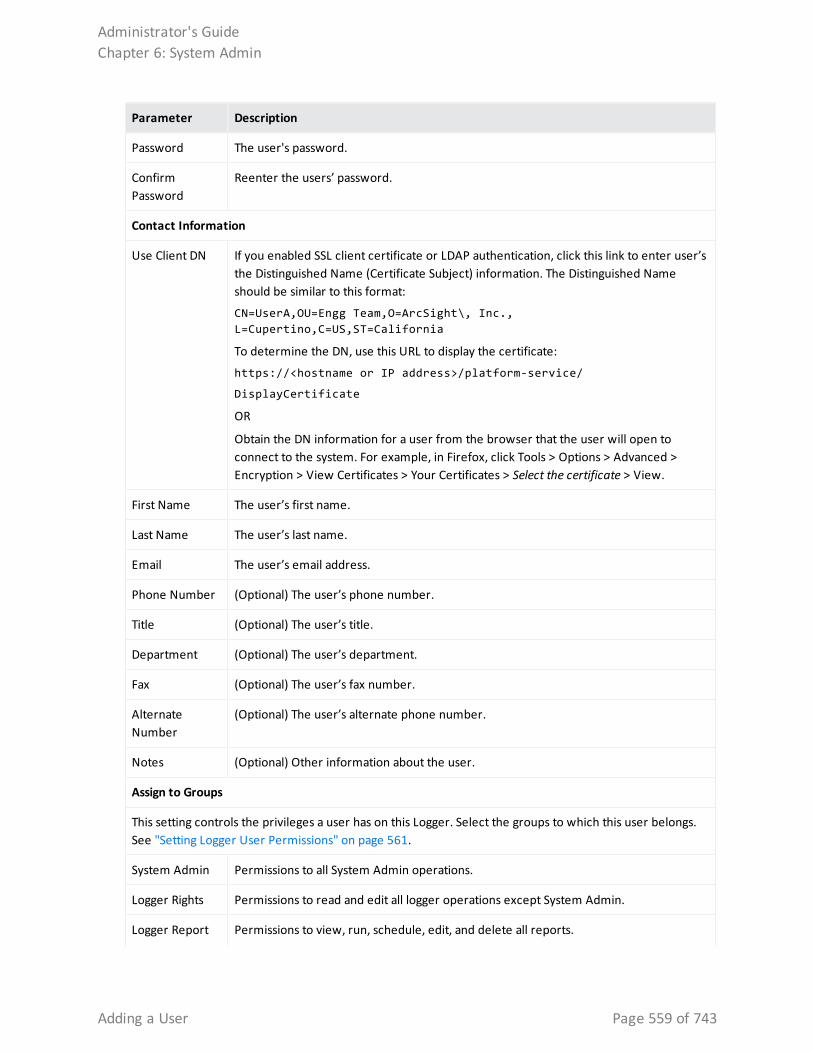
Parameter Description
Password The user's password.
Confirm Password
Reenter the users’ password.
Contact Information
Use Client DN If you enabled SSL client certificate or LDAP authentication, click this link to enter user’s the Distinguished Name (Certificate Subject) information. The Distinguished Name should be similar to this format:
CN=UserA,OU=Engg Team,O=ArcSight\, Inc., L=Cupertino,C=US,ST=California
To determine the DN, use this URL to display the certificate:
https://<hostname or IP address>/platform-service/
DisplayCertificate
OR
Obtain the DN information for a user from the browser that the user will open to connect to the system. For example, in Firefox, click Tools > Options > Advanced > Encryption > View Certificates > Your Certificates > Select the certificate > View.
First Name The user’s first name.
Last Name The user’s last name.
Email The user’s email address.
Phone Number (Optional) The user’s phone number.
Title (Optional) The user’s title.
Department (Optional) The user’s department.
Fax (Optional) The user’s fax number.
Alternate Number
(Optional) The user’s alternate phone number.
Notes (Optional) Other information about the user.
Assign to Groups
This setting controls the privileges a user has on this Logger. Select the groups to which this user belongs. See "Setting Logger User Permissions" on page 561.
System Admin Permissions to all System Admin operations.
Logger Rights Permissions to read and edit all logger operations except System Admin.
Logger Report Permissions to view, run, schedule, edit, and delete all reports.
Administrator's GuideChapter 6: System Admin
Adding a User Page 559 of 743
Parameter Description
Logger Search Permissions to run both local and distributed searches.
5. Click Save and Close.
Editing and Deleting Users
To edit a user:
1. Click System Admin from the top-level menu bar.
2. Click User Management in the Users/Groups section in the left panel.
3. In the Users tab, select the user (or users) you want to edit.
4. Click Edit.
5. Update the user information as necessary.
6. Click Save User.
To delete a user:
1. Click System Admin from the top-level menu bar.
2. Click User Management in the Users/Groups section in the left panel.
3. In the Users tab, select the user (or users) you want to delete.
4. Click Delete from the top left side of the page.
Note: Deleting a user does not delete their reports. See "Managing Reports of Deleted Users" on page 289.
Activating Users
To activate a user:
1. Click System Admin from the top-level menu bar.
2. Click User Management in the Users/Groups section in the left panel.
3. In the Users tab, select the user (or users) that you want to activate.
4. Choose Edit.
5. Check the Active box.
6. Save the changes.
Administrator's GuideChapter 6: System Admin
Editing and Deleting Users Page 560 of 743
Setting Logger User PermissionsLogger installs with a default Administrator user, who has full permissions to create other users and assign them access permissions. When users require a specific set of permissions, you can create a custom User Group with those permissions. To do this, see "Creating a New User Group" on page 563.
To assign Logger permissions to a user:
1. Click System Admin from the Logger navigation bar.
2. From the User/Groups menu, click User Management. The Manage Users page opens.
3. Select the check box for the user to whom you want to assign privileges.
4. Click Edit. The Edit User page opens.
5. From the Assign to Groups section, select one option from each group type. For new users, the default selection is "Unassigned." A user must be a member of at least one User Group to use Logger.
6. Click Save and Close.
Reset a User's PasswordThis topic applies to both Software Logger and the Logger Appliance.
The Reset Password feature enables you to reset a user's password without knowing their password. If you are using an SMTP-configured server and have permissions to create and update users, you can reset a user’s password by clicking the Reset Password button. An automated email is sent to the user with the new password string.
To reset a user’s password:
1. Click System Admin from the top-level menu bar.
2. Click User Management in the Users/Groups section in the left panel.
3. In the Users tab, select the user (or users) whose passwords you want to reset.
4. Click Reset Password from the top left side of the page.
The user must use the temporary string to log in within the time specified in the email. If the user does not log in within the specified time, the account becomes deactivated. If the account has been deactivated, the admin must re-activate it before resetting the password.
Administrator's GuideChapter 6: System Admin
Setting Logger User Permissions Page 561 of 743
User GroupsThis topic applies to both Software Logger and the Logger Appliance.
User groups define privileges to specific functions on your system and serve to enforce access control to these functions. For example, if you want User A to be able to run searches but not reports, assign that user to the Search group but not to the Reports group.
User groups are organized by the following types: System Admin, Read Only System Admin, Logger Rights, Logger Search, and Logger Reports. Each type has a pre-defined, default user group in which all privileges for the type are enabled. To authorize a subset of the privileges for a specific group type, create a new user group and enable only the privileges you want to provide for that group. Then, assign restricted users to the newly created group.
System Admin Group
The System Admin Group controls the system administration operations for your system, such as configuring network information, setting storage mounts, installing SSL certificates, and user management.
Read Only System Admin Group
In addition to the default System Admin Group that enables all system administration rights (privileges), a Read Only System Admin Group is available on your system. Users assigned to this group can view System Admin settings, but cannot change them.
Logger Rights Group
This applies to both Classic Search and Search page
The Logger Rights Group controls the Logger application operations for your system, such as viewing the Logger dashboards and configuring all the settings in the Configuration menu (including event archives, storage groups, alerts, filters, saved searches, and scheduling tasks.)
Refer to your system’s user interface for a complete list of privileges available to this group.
Logger Search Group
The Logger Search Group controls local and peer searches through the following privileges:
l Search for events
l Search for events on remote peers
If the group is configured to allow users to run local and peer searches, users assigned to this group can perform those operations. Conversely, if the group is configured to prevent users
Administrator's GuideChapter 6: System Admin
User Groups Page 562 of 743
from running local and peer searches, users assigned to this group cannot perform those operations.
Note: These users have access to the lookup page, the navigation bar displays this option.
Logger Reports Group
The Logger Reports group controls all report operations on Logger such as run, edit, delete, schedule, and view published reports.
Note: Once a Report Category is deleted, click the Reports tab and check if the changes in the Admin module are reflected.
Refer to your system’s user interface for a complete list of privileges available to this group.
Managing User GroupsThis topic applies to both Software Logger and the Logger Appliance.
Creating a New User Group
To create a new user group:
1. Click System Admin from the top-level menu bar.
2. Click User Management in the Users/Groups section in the left panel.
3. Click the Groups tab.
4. Click Add.
5. Define the new group:
a. In the Group Name field, provide a name for the group.
b. In the Description field, provide a description for the group.
c. From the Group Type drop-down box, select the group type.
d. Click the down arrow icon ( ) next to the group type name to view and select privileges that you want to assign to the users in this group.
6. Click Save and Close to save the settings of the group, or click Save and Edit Membership to add users to this group.
Administrator's GuideChapter 6: System Admin
Managing User Groups Page 563 of 743
Editing and Deleting User Groups
To edit a user group:
1. Click System Admin from the top-level menu bar.
2. Click User Management in the Users/Groups section in the left panel.
3. Click the Groups tab.
4. Select the group that you want to edit, and click Edit.
5. Update the user group information.
If you need to edit the group’s membership:
a. Click Save and Edit Membership to display the Edit Group Membership page.
b. Click Add from the top left of the Edit Group Membership page.
c. Select users you want to add. By default, you can add only users who do not belong to other groups of the type that you are editing. To add such users, click Show users that belong to other <group_type> groups.
When you add a user who belongs to another group of the same group type as the one you are updating, that user is automatically removed from the previous group.
d. Click OK.
e. Click Back to Group List.
6. Click Save and Close.
To delete a user group:
1. Click System Admin from the top-level menu bar.
2. Click User Management in the Users/Groups section in the left panel.
3. Click the Groups tab.
4. Select the group (or groups) that you want to delete.
5. Click Delete at the top left side of the page.
Change My PasswordThis topic applies to both Software Logger and the Logger Appliance.
You can use the Change Password menu to change your password. This feature is available to all users for changing their passwords, unlike the Reset Password feature that enables a system administrator to reset the password of users without knowing the password. Passwords are subject to the password policy specified by the Admin user.
Administrator's GuideChapter 6: System Admin
Editing and Deleting User Groups Page 564 of 743
To change your password:
1. Click System Admin from the top-level menu bar.
2. Click Change Password in the Users/Groups section in the left panel to display the Change Password for <User Name> page.
3. Enter the Old Password, the New Password, and enter the New Password a second time to confirm.
4. Click Change Password.
Other System Administration InformationThis topic applies to both Software Logger and the Logger Appliance.
This section contains information related to system administration that you will need to fully administer your Logger, including starting and stopping Software Logger, system health events, and SNMP polling.
Monitoring System HealthThis topic applies to both Software Logger and the Logger Appliance.
You can monitor your Logger’s health in these ways:
l By using a pre-defined system filter, as listed in "System Filters/Predefined Filters" on page 152. The pre-defined system health filters are based on the system health events listed in "System Health Events" on the next page.
l By searching for system health events in Logger’s Internal Storage Group, as listed in "System Health Events" on the next page. If a pre-defined system health filter does not suit your needs, you can create alerts based on the system health events.
l By polling system health events (Logger Appliance only), as explained in "SNMP" on page 519. You can poll system health information from your system by using SNMP version 2c or 3 from any standard network management system.
To set up notification of system health events:
1. Configure the Logger’s SMTP settings (see "SMTP" on page 510) or create an SNMP Destination (see "SNMP Destinations" on page 403) or Syslog Destination (see "Syslog Destinations" on page 404).
Administrator's GuideChapter 6: System Admin
Other System Administration Information Page 565 of 743
2. Create an Alert that uses one or more System Alert Filters or define a query that searches for the system health events in Logger’s Internal Storage Group, and specify match count and threshold (see "Logger Alert Types" on page 399).
3. Enable the new Alert.
System Health EventsThis topic applies to both Software Logger and Logger Appliance.
The following table lists the system health events that Logger generates. These events are also referred as Logger Internal Events. For additonal details, see "System Health Events" on page 662.
The pre-defined System Filters that provide system health status are based on some of these events. If a pre-defined filter does not suit your needs, create an alert using one of these events.
The system health events generate meaningful information:
l Addition of new events (for example, Current and SecureData).
l Instead of referring to all system health events as Logger Internal Event in the name field, meaningful names are used (for example, Fan OK, Temperature OK).
l Three severity levels for each event have been added to the agentSeverity field—1 (OK), 5 (Degraded), and 8 (Severe).
l The deviceCustomString and deviceCustomStringLabel field mappings have changed. Refer to a specific event to see the changes.
l Device Event Class ID (deviceEventClassId) and Device Event Category (deviceEventCategory) of the events have changed. An updated list is available in "System Health Events for Both Types of Logger" on the next page.
l All hardware-related events are classified as hardware:nnn events, where nnn is a three-digit number that identifies the hardware component (for example, hardware:13x identifies the fan events.)
General considerations when working with System Health Events:
l The sensor names in each event are hardware specific; therefore, they are not consistent across various Logger platforms. Use the event name (Name) and status (CustomString3) fields to determine the status of a sensor. The raw status (CustomString4), location (CustomString5), and sensor name (CustomString6) fields are for informational use when diagnosing a hardware problem and are not consistent across appliance types.
Administrator's GuideChapter 6: System Admin
System Health Events Page 566 of 743
l Micro Focus recommends that you develop custom alerts for certain System Health Events to prevent users from being alerted too often. Some of the received alerts may be self-clearing or warnings that you do not want to be alerted about until a specific number of warnings have been generated.
System Health Events for Both Types of Logger
Group Device Event Category Device Event Class ID
CPU /Monitor/CPU/Usage cpu:100
Disk /Monitor/Disk/Read disk:102
/Monitor/Disk/Write disk:103
EPS /Monitor/Receiver/EPS/All eps:100
/Monitor/Receiver/EPS/Individual eps:102
/Monitor/Forwarder/EPS/All eps:101
/Monitor/Forwarder/EPS/Individual eps:103
Memory /Monitor/Memory/Usage/Platform memory:100
Network /Monitor/Network/Usage/In network:100
/Monitor/Network/Usage/Out network:101
Search /Monitor/Search/Performed search:100
Storage Group /Monitor/StorageGroup/Space/Used
Note: The size of the storage group, indicated by the “fsize” field is in GB.
storagegroup:100
System Health Events for Logger Appliances Only
Group Device Event Category Device Event Class ID
Battery /Monitor/Sensor/Battery/OK hardware:121**
/Monitor/Sensor/Battery/Degraded hardware:122**
/Monitor/Sensor/Battery/Failed hardware:123**
Current (Electrical) /Monitor/Sensor/Current/OK hardware:101**
/Monitor/Sensor/Current/Degraded hardware:102**
/Monitor/Sensor/Current/Failed hardware:103**
Disk /Monitor/Disk/Space/Remaining/Root disk:101
Administrator's GuideChapter 6: System Admin
System Health Events Page 567 of 743
Group Device Event Category Device Event Class ID
Fan /Monitor/Sensor/Fan/OK hardware:131
/Monitor/Sensor/Fan/Degraded hardware:132
/Monitor/Sensor/Fan/Failed hardware:133
Power Supply /Monitor/Sensor/PowerSupply/OK hardware:141
/Monitor/Sensor/PowerSupply/Degraded hardware:142
/Monitor/Sensor/PowerSupply/Failed hardware:143
RAID /Monitor/RAID/Controller/OK raid:101
/Monitor/RAID/Controller/Degraded raid:102
/Monitor/RAID/Controller/Failed raid:103
/Monitor/RAID/BBU/OK raid:111
/Monitor/RAID/BBU/Degraded raid:112
/Monitor/RAID/BBU/Failed raid:113
/Monitor/RAID/Disk/OK raid:121
/Monitor/RAID/Disk/Rebuilding raid:122
/Monitor/RAID/Disk/Failed raid:123
Temperature /Monitor/Temperature/OK hardware:151
/Monitor/Temperature/Degraded hardware:152
/Monitor/Temperature/Failed hardware:153
Voltage /Monitor/Sensor/Voltage/OK hardware:111**
/Monitor/Sensor/Voltage/Degraded hardware:112**
/Monitor/Sensor/Voltage/Failed hardware:113**
Note: ** indicates an event generated only on older non-Micro Focus model appliances.
Using the Appliance Command Line InterfaceThis topic applies to Logger Appliances only.
The Logger appliance CLI enables you to start and stop the appliance as well as issue commands for the Logger application.
Use one of the following methods to connect to the appliance Command Line Interface (CLI):
Administrator's GuideChapter 6: System Admin
Using the Appliance Command Line Interface Page 568 of 743
l Log into Micro Focus ProLiant Integrated Lights-Out (iLO) and launch the remote console feature. For more information, refer to the Logger Installation Guide.
l Connect a keyboard and monitor to the ports on the rear panel of the appliance.
l Connect a terminal to the serial port on the appliance using a null modem cable with DB-9 connector. The serial port expects a standard VT100-compatible terminal: 9600 bps, 8-bits, no parity, 1 stop bit (8N1), no flow control.
Once you are connected to the CLI, a Login prompt displays.
The following commands are available at the CLI prompt:
Category Command Description
System Commands
exit Logout
halt Stop and power down the Logger Appliance
help Opens the command line interface help
reboot Reboot the Logger Appliance
Admin Commands
show admin Show the default administrator user’s name
Authentication Commands
reset authentication Reset to local authentication
Config Commands
show config Show host name, IP address, DNS, and default gateway for the Logger
Date Commands
show date Show the date and time currently configured on the Logger
set date Set the date and time on Logger. The date/time format is yyyyMMddhhmmss. Example date: 20101219081533
Default Gateway Commands
set defaultgw <IP> [nic] Set the default gateway for one or all network interfaces
show defaultgw [nic] Display the default gateway for all or the specified network interface
DNS Commands
Administrator's GuideChapter 6: System Admin
Using the Appliance Command Line Interface Page 569 of 743
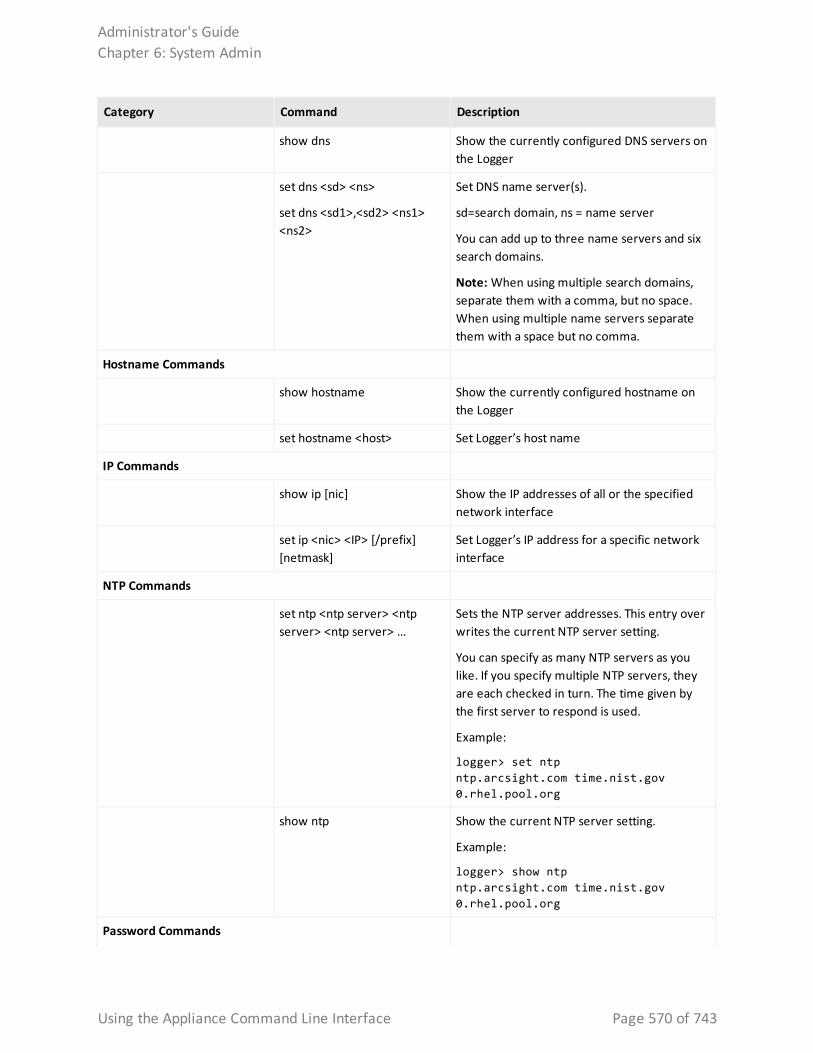
Category Command Description
show dns Show the currently configured DNS servers on the Logger
set dns <sd> <ns>
set dns <sd1>,<sd2> <ns1> <ns2>
Set DNS name server(s).
sd=search domain, ns = name server
You can add up to three name servers and six search domains.
Note: When using multiple search domains, separate them with a comma, but no space. When using multiple name servers separate them with a space but no comma.
Hostname Commands
show hostname Show the currently configured hostname on the Logger
set hostname <host> Set Logger’s host name
IP Commands
show ip [nic] Show the IP addresses of all or the specified network interface
set ip <nic> <IP> [/prefix] [netmask]
Set Logger’s IP address for a specific network interface
NTP Commands
set ntp <ntp server> <ntp server> <ntp server> ...
Sets the NTP server addresses. This entry over writes the current NTP server setting.
You can specify as many NTP servers as you like. If you specify multiple NTP servers, they are each checked in turn. The time given by the first server to respond is used.
Example:
logger> set ntp ntp.arcsight.com time.nist.gov 0.rhel.pool.org
show ntp Show the current NTP server setting.
Example:
logger> show ntp ntp.arcsight.com time.nist.gov 0.rhel.pool.org
Password Commands
Administrator's GuideChapter 6: System Admin
Using the Appliance Command Line Interface Page 570 of 743
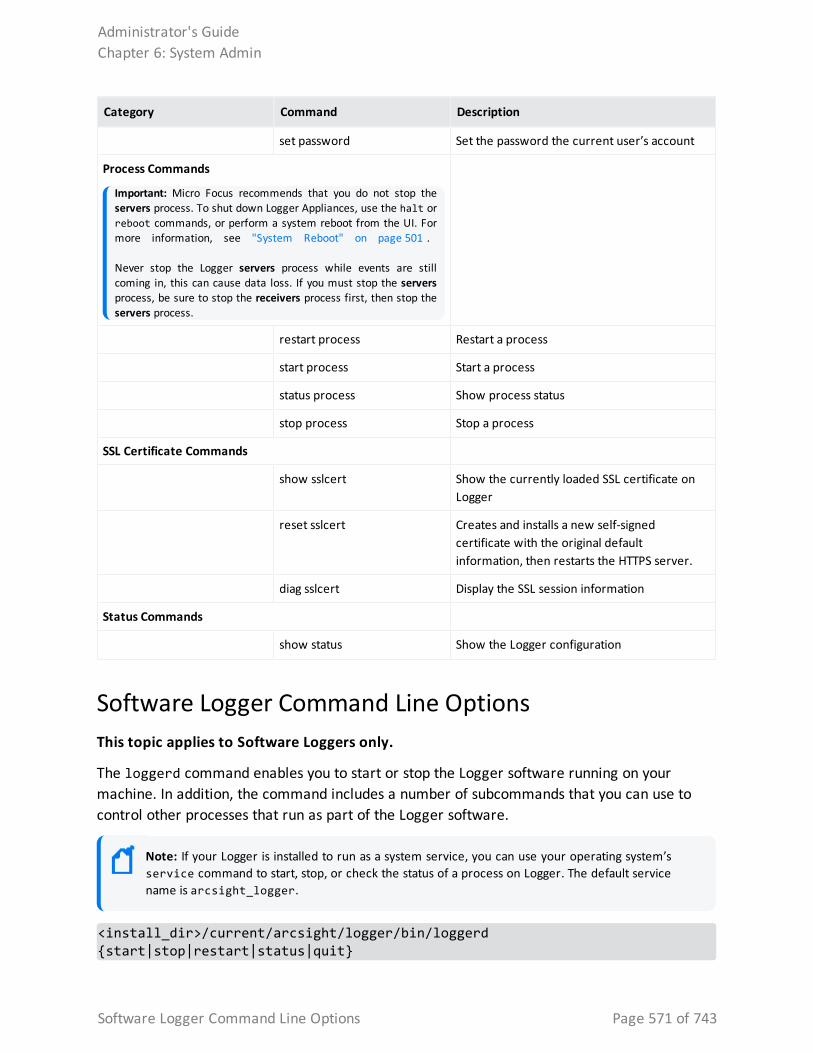
Category Command Description
set password Set the password the current user’s account
Process Commands
Important: Micro Focus recommends that you do not stop the servers process. To shut down Logger Appliances, use the halt or reboot commands, or perform a system reboot from the UI. For more information, see "System Reboot" on page 501 .
Never stop the Logger servers process while events are still coming in, this can cause data loss. If you must stop the servers process, be sure to stop the receivers process first, then stop the servers process.
restart process Restart a process
start process Start a process
status process Show process status
stop process Stop a process
SSL Certificate Commands
show sslcert Show the currently loaded SSL certificate on Logger
reset sslcert Creates and installs a new self-signed certificate with the original default information, then restarts the HTTPS server.
diag sslcert Display the SSL session information
Status Commands
show status Show the Logger configuration
Software Logger Command Line OptionsThis topic applies to Software Loggers only.
The loggerd command enables you to start or stop the Logger software running on your machine. In addition, the command includes a number of subcommands that you can use to control other processes that run as part of the Logger software.
Note: If your Logger is installed to run as a system service, you can use your operating system’s service command to start, stop, or check the status of a process on Logger. The default service name is arcsight_logger.
<install_dir>/current/arcsight/logger/bin/loggerd {start|stop|restart|status|quit}
Administrator's GuideChapter 6: System Admin
Software Logger Command Line Options Page 571 of 743
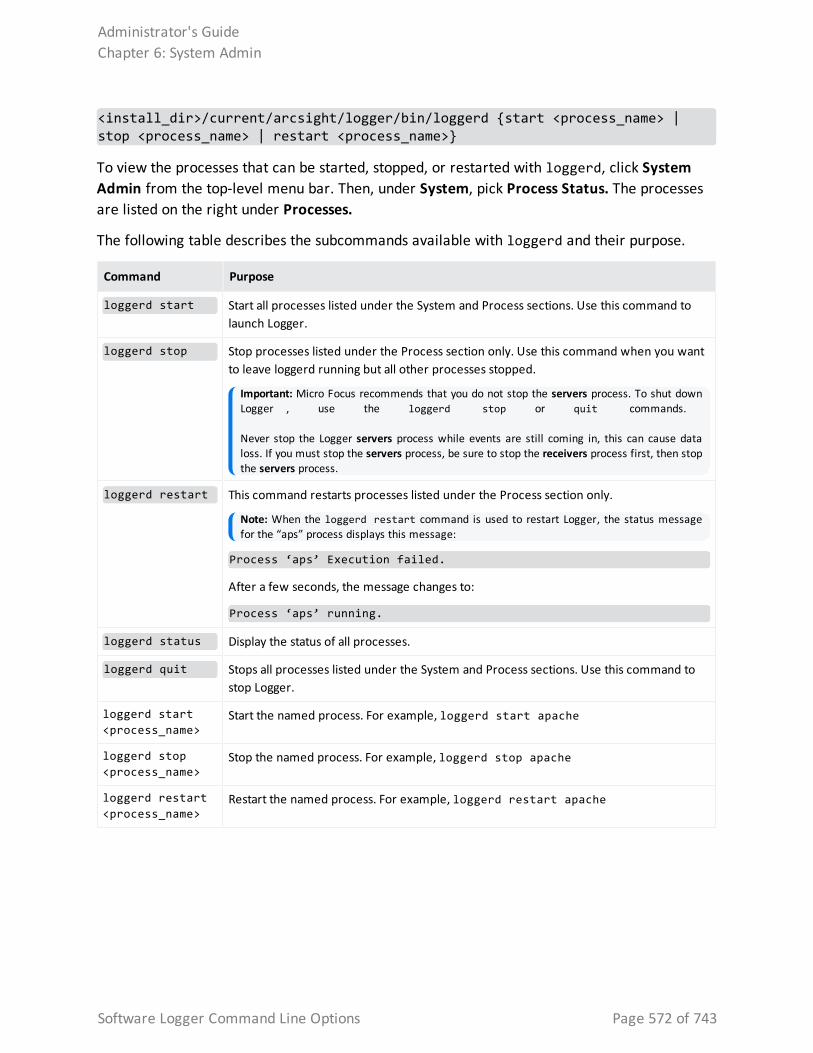
<install_dir>/current/arcsight/logger/bin/loggerd {start <process_name> | stop <process_name> | restart <process_name>}
To view the processes that can be started, stopped, or restarted with loggerd, click System Admin from the top-level menu bar. Then, under System, pick Process Status. The processes are listed on the right under Processes.
The following table describes the subcommands available with loggerd and their purpose.
Command Purpose
loggerd start Start all processes listed under the System and Process sections. Use this command to launch Logger.
loggerd stop Stop processes listed under the Process section only. Use this command when you want to leave loggerd running but all other processes stopped.
Important: Micro Focus recommends that you do not stop the servers process. To shut down Logger , use the loggerd stop or quit commands.
Never stop the Logger servers process while events are still coming in, this can cause data loss. If you must stop the servers process, be sure to stop the receivers process first, then stop the servers process.
loggerd restart This command restarts processes listed under the Process section only.
Note: When the loggerd restart command is used to restart Logger, the status message for the “aps” process displays this message:
Process ‘aps’ Execution failed.
After a few seconds, the message changes to:
Process ‘aps’ running.
loggerd status Display the status of all processes.
loggerd quit Stops all processes listed under the System and Process sections. Use this command to stop Logger.
loggerd start <process_name>
Start the named process. For example, loggerd start apache
loggerd stop <process_name>
Stop the named process. For example, loggerd stop apache
loggerd restart <process_name>
Restart the named process. For example, loggerd restart apache
Administrator's GuideChapter 6: System Admin
Software Logger Command Line Options Page 572 of 743
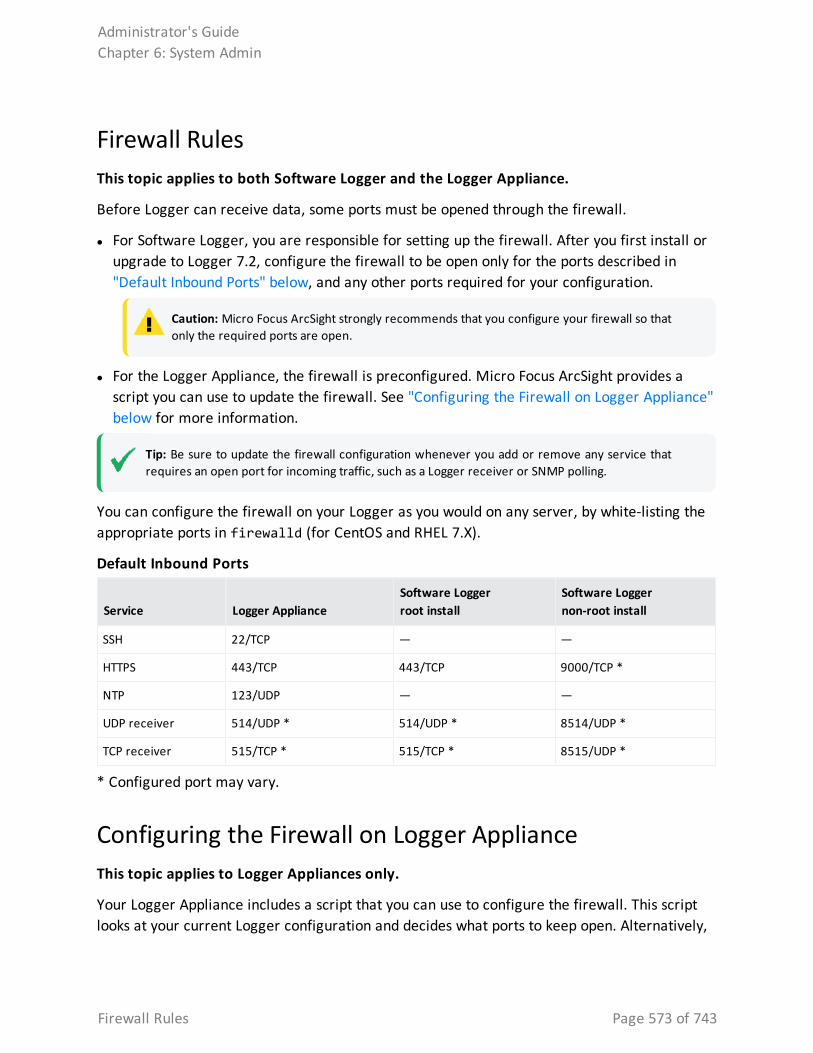
Firewall RulesThis topic applies to both Software Logger and the Logger Appliance.
Before Logger can receive data, some ports must be opened through the firewall.
l For Software Logger, you are responsible for setting up the firewall. After you first install or upgrade to Logger 7.2, configure the firewall to be open only for the ports described in "Default Inbound Ports" below, and any other ports required for your configuration.
Caution: Micro Focus ArcSight strongly recommends that you configure your firewall so that only the required ports are open.
l For the Logger Appliance, the firewall is preconfigured. Micro Focus ArcSight provides a script you can use to update the firewall. See "Configuring the Firewall on Logger Appliance" below for more information.
Tip: Be sure to update the firewall configuration whenever you add or remove any service that requires an open port for incoming traffic, such as a Logger receiver or SNMP polling.
You can configure the firewall on your Logger as you would on any server, by white-listing the appropriate ports in firewalld (for CentOS and RHEL 7.X).
Service Logger ApplianceSoftware Loggerroot install
Software Loggernon-root install
SSH 22/TCP — —
HTTPS 443/TCP 443/TCP 9000/TCP *
NTP 123/UDP — —
UDP receiver 514/UDP * 514/UDP * 8514/UDP *
TCP receiver 515/TCP * 515/TCP * 8515/UDP *
Default Inbound Ports
* Configured port may vary.
Configuring the Firewall on Logger ApplianceThis topic applies to Logger Appliances only.
Your Logger Appliance includes a script that you can use to configure the firewall. This script looks at your current Logger configuration and decides what ports to keep open. Alternatively,
Administrator's GuideChapter 6: System Admin
Firewall Rules Page 573 of 743
you can configure the firewall on your Logger as you would on any server, by white-listing the appropriate ports in firewalld (for CentOS and RHEL 7.X).
When called without arguments, the /usr/sbin/arcfirewall script displays the ports that it will keep open, but takes no action to alter the firewall configuration. To alter firewall configuration, use the --set option.
To preview the list of ports the script would open:
1. Log into the appliance as root.
2. Run the following command:
/usr/sbin/arcfirewall.
The script displays the ports that it would open if run with the --set option.
To configure the firewall:
1. Log into the appliance as root.
2. Run the following command:
[root@myserver ~]# /usr/sbin/arcfirewall --set.
The script configures the firewall leaving only the necessary ports open.
To display the firewall current status and configuration:
1. Run the following command to list all active firewall rules: iptables -S
2. Run the following command: firewall-cmd --list-all-zones
3. To check the firewall current running status, use the command: systemctl status firewalld
Administrator's GuideChapter 6: System Admin
Configuring the Firewall on Logger Appliance Page 574 of 743
Appendix A: Search OperatorsThe following topics describe the operators you can specify in the Search box (Analyze >Classic Search) and give examples of their use. Logger supports queries using top, tails, sort or head operator combined with a lookup operator.
Note: Aggregation operators return the combined results of more than one field, and include " chart" on the next page, "head" on page 590, "keys" on page 590, "rare" on page 597, "sort" on page 604 , "tail" on page 605 , "top" on page 606 . For more information, see "Aggregation Functions" on page 577.
CEF (Deprecated)Prior to Logger 5.2, you needed to use the cef operator to extract CEF fields from CEF events that matched the indexed search filter (the query portion before the first pipeline in the query expression) before you could use other search operators to act upon those fields. However, starting with Logger 5.2, you do not need to explicitly extract the CEF fields and then apply other search operators to those fields. You can specify the event fields directly in queries.
Extracts values for specified fields from matching CEF events. If an event is non-CEF, the field value is set to NULL.
Synopsis
...| cef <field1> <field2> <field3> ...
Usage Notes
If multiple fields are specified, separate each field name with a white space or a comma.
To identify the name of a CEF field, use the Search Builder tool (click Advanced Search under the Search text box), which lists the names of all fields alphabetically.
The extracted fields are displayed as additional columns in the All Fields view (of the System Fieldsets). To view only the extracted columns, select User Defined Fieldsets from the System Fieldsets list.
Examples
...| cef categorySignificance agentType
...| cef deviceEventCategory name
Appendix A: Search Operators Page 575 of 743
chartDisplays search results in a chart form of the specified fields.
Synopsis
...| chart count by <field1> <field2> <field3> ... [span [<time_field>]=<time_bucket>]
...| chart {{sum | avg | min | max | stdev | perc<N>} (<field>)}+ by <field1>, <field2>, <field3> ...[span [<time_field>]= <time_bucket>]
...| chart {<function> (<field>)} as <new_column_name> by <field> [span [<time_field>]=<time_bucket>]
where <field>, <field1>, <field2> are the names of the field that you want to chart. The fields can be either event fields available in the Logger schema or a user-defined fields created using the rex or eval operator prior in the query.
<time> is the bucket size for grouping events. Use d for day, h for hour, m for minute, s for seconds. For example, 2h, 5d, 1m. (See Usage Notes for details.)
<function> is one of these: count, sum, avg (or mean), min, max, stdev, percN
<new_column_name> is the name you want to assign to the column in which the function’s results are displayed. For example, Total.
<N> is the percentile, and so can be a number between 0 and 100, inclusive.
Deprecated: The following deprecated usage contains “_count”. The recommended usage, as shown above, is “count”.
...| chart _count by <field1> <field2> <field3> ...
Usage Notes
By default, a column chart is displayed. Other chart types you can select from: bar chart, line chart, donut chart, area chart, stacked column, or stacked bar.
To change the chart settings (including its type), click in the upper right corner of the Result Chart frame of the screen. You can change these settings:
l Title: Enter a meaningful title for the chart.
Administrator's GuideAppendix A: Search Operators
chart Page 576 of 743

l Type: Column, Bar, Donut, Area, Line, Stacked column, Stacked Bar. The last two types create stacked charts in which multiple values are plotted in a stack form. These charts are an alternate way of representing multi-series charts, which are described below.
l Display Limit: Number of unique values to plot. Default: 10
If the configured Display Limit is less than the number of unique values for a query, the top values equal to the specified Display Limit are plotted. That is, if the Display Limit is 5, and seven unique values are found, only the top five values will be plotted.
All chart commands except “count by” accept only one field in the input. The specified field must contain numeric values.
If multiple fields are specified, separate the field names with a white space or a comma.
You can click on a charted value to quickly filter down to events with specific field values. For more information, see "Chart Drill Down" on page 131.
Percentile Function
The perc<N> function returns the <N> percentile. <N> can be a number between 0 and 100, inclusive.
...| chart perc by field list" (with no specified <N>) returns all results generated by ...| chart count by field list.
...| chart perc50 by field list returns the median value of all the results generated by ...| chart count by field list.
...| chart perc90 by field list returns the 90 percentile value of all the results generated by ...| chart count by field list.
The percentile value is derived based on the increasing order of the field values. The derived value of string fields rely on alphabetical order (ASCII value).
Aggregation Functions
Note: Aggregation functions only work on numeric fields. The specified fields must contain numeric values. If a field you specify is of the wrong data type, you will receive an error message like the following: "java.lang.NumberFormatException".
If an aggregation function such as count, sum, or avg is specified, a chart of the aggregated results is displayed along with the tabular results of the aggregation operation in a Results Table. For example, for the aggregation function sum(deviceCustomNumber1), the sum_deviceCustomNumber1 column in the Results Table displays the sum of unique values of the deviceCustomNumber1 field.
Administrator's GuideAppendix A: Search Operators
chart Page 577 of 743
If this field had two unique values 1 and 20, occurring 2 times each, the sum_deviceCustomNumber1 column displays sum of those two values.
Note: When a chart displays too many events, it can be difficult to read. Therefore, the number of events returned is limited to 500 by default. If you need to change that default number, please contact Customer Support.
The mathematical operators avg and mean are equivalent.
You can include multiple functions in the same chart command. When doing so, separate each function with a comma, as shown in this example:
...| chart count, sum(deviceCustomNumber3) by deviceEventClassId
When you include multiple functions, one column per function is displayed in the search Results Table. The Results Chart, however, plots the chart for the field specified in the “by” clause.
You can use the “as new_column_name” clause to name any column resulting from the aggregation functions, as shown in this example:
...| chart sum(deviceCustomNumber3) as TotalStorage, avg(deviceCustomNumber3) as AverageStorage by deviceCustomNumber3
Once defined, the newly defined column can be used in the pipeline as any other field. For example,
...| chart sum(deviceCustomNumber3) as TotalStorage, avg(deviceCustomNumber3) as AverageStorage by deviceCustomNumber3 | eval UpdatedStorage = TotalStorage + 100
When you export the search results of a chart operator, the newly defined column name (using the chart function as new_column_name command) is preserved.
Multi-Series Charts
A multi-series chart can plot the values of multiple aggregation functions in a single chart. If you include multiple aggregation functions in a chart command, Logger generates a multi-series chart that plots the values of the specified aggregation functions along the Y-axis, as illustrated in "Example Two" on page 580. Multi-series charts can be any of the chart types except Donuts. For example, you can choose to plot a multi-series chart as a stacked chart—Stacked column or Stacked Bar—in which multiple values are plotted in a stack form.
Administrator's GuideAppendix A: Search Operators
chart Page 578 of 743
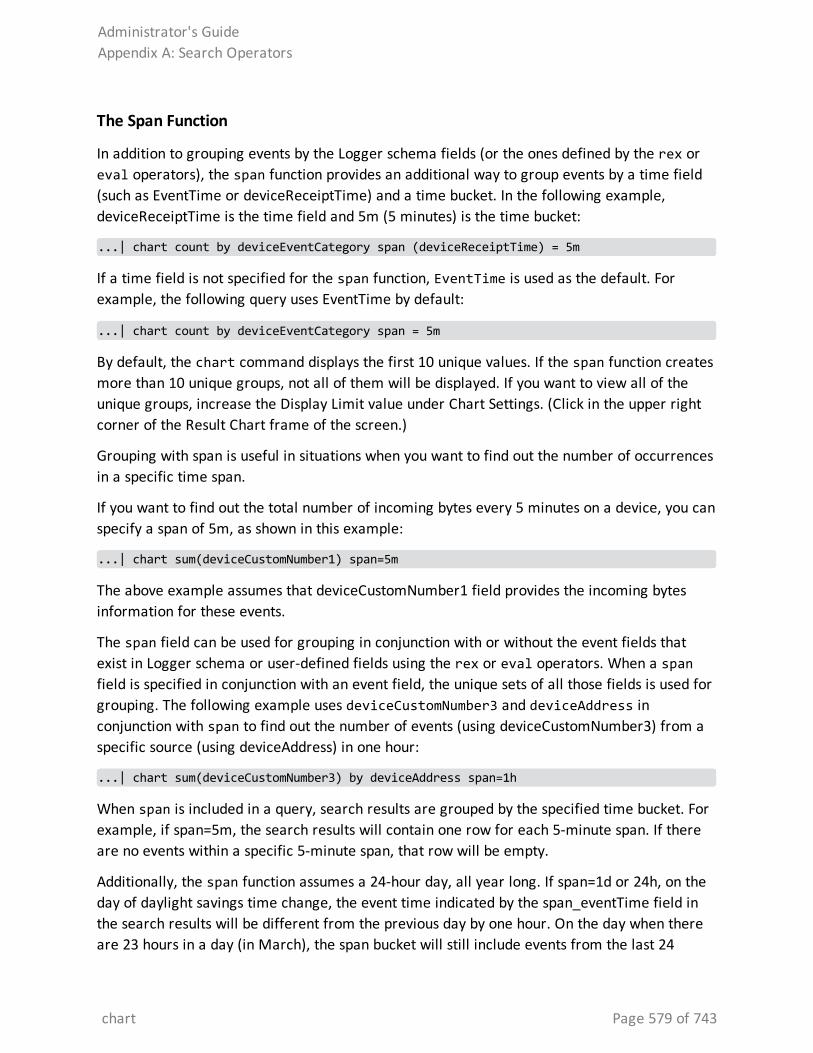
The Span Function
In addition to grouping events by the Logger schema fields (or the ones defined by the rex or eval operators), the span function provides an additional way to group events by a time field (such as EventTime or deviceReceiptTime) and a time bucket. In the following example, deviceReceiptTime is the time field and 5m (5 minutes) is the time bucket:
...| chart count by deviceEventCategory span (deviceReceiptTime) = 5m
If a time field is not specified for the span function, EventTime is used as the default. For example, the following query uses EventTime by default:
...| chart count by deviceEventCategory span = 5m
By default, the chart command displays the first 10 unique values. If the span function creates more than 10 unique groups, not all of them will be displayed. If you want to view all of the unique groups, increase the Display Limit value under Chart Settings. (Click in the upper right corner of the Result Chart frame of the screen.)
Grouping with span is useful in situations when you want to find out the number of occurrences in a specific time span.
If you want to find out the total number of incoming bytes every 5 minutes on a device, you can specify a span of 5m, as shown in this example:
...| chart sum(deviceCustomNumber1) span=5m
The above example assumes that deviceCustomNumber1 field provides the incoming bytes information for these events.
The span field can be used for grouping in conjunction with or without the event fields that exist in Logger schema or user-defined fields using the rex or eval operators. When a span field is specified in conjunction with an event field, the unique sets of all those fields is used for grouping. The following example uses deviceCustomNumber3 and deviceAddress in conjunction with span to find out the number of events (using deviceCustomNumber3) from a specific source (using deviceAddress) in one hour:
...| chart sum(deviceCustomNumber3) by deviceAddress span=1h
When span is included in a query, search results are grouped by the specified time bucket. For example, if span=5m, the search results will contain one row for each 5-minute span. If there are no events within a specific 5-minute span, that row will be empty.
Additionally, the span function assumes a 24-hour day, all year long. If span=1d or 24h, on the day of daylight savings time change, the event time indicated by the span_eventTime field in the search results will be different from the previous day by one hour. On the day when there are 23 hours in a day (in March), the span bucket will still include events from the last 24
Administrator's GuideAppendix A: Search Operators
chart Page 579 of 743
hours. Similarly, on the day when there are 25 hours in the day (in November), the span bucket will include events from the last 24 hours.
Example One
Use the default chart setting (Column Chart) to specify multiple fields. In this example, a count of unique groups of deviceEventCategory and name fields is displayed and plotted.
... | chart count by deviceEventCategory name
Example Two
Include average and sum in a chart command, to generate a multi-series chart that plots the values of these functions along the Y-axis in a single chart. You can display a multi-series chart as a stacked chart—Stacked column or Stacked Bar—in which multiple values are plotted in a stack, by changing the Chart Settings.
dedupRemoves duplicate events from search results. That is, events that contain the same value in the specified field. The first matching event is kept, and the subsequent events with the same value in the specified field are removed.
Synopsis
... | dedup [N] <field1>,<field2>, ... [keepevents=(true|false)] [keepempty=(true|false)]
N is an optional number that specifies the number of duplicate events to keep. For example, “dedup 5 deviceEventClassId” will keep the first five events containing the same deviceEventClassId values for each deviceEventClassId, and remove the events that match after the first five have been kept. Default: 1.
field1, field2 is a field or a comma-separated field list whose values are compared to determine duplicate events. If a field list is specified, the values of the unique sets of all those fields are used to remove events. For example, if name and deviceCustomNumber1 are specified, and two events contain “Network Usage - Outbound” and “2347896”, only the first event is kept in the search results.
keepevents specifies whether to set the fields specified in the field list to NULL or not. When this option is set to True, the values are set to NULL and events are not removed from search results. However, when this option is set to False, duplicate events are removed from the search results. Default: False.
Administrator's GuideAppendix A: Search Operators
dedup Page 580 of 743
keepempty specifies whether to keep events in the search results whose specified fields contain NULL values. When this option is set to True, events with NULL values are kept, however if this option is set to False, events with NULL values are removed. Default: False.
Example OneTo view events from unique devices:
... | dedup deviceAddress
Example TwoTo view unique deviceEventClassId events from unique devices:
... | dedup deviceEventClassId deviceAddress
Example ThreeTo view the className in events with Java exceptions in the message field:
exception | <rex_expression> | dedup 5 className
In the example above, <rex_expression> is not shown in detail; however this expression extracts the class name in a field called className, which the dedup operator acts upon.
evalDisplays events after evaluating the result of the specified expression. The expression can be a mathematical, string, or Boolean operation and is evaluated when the query is run. The resulting value of the expression is assigned to a field name (specified in the expression). Once a new field has been defined by the eval operator in a query, this field can be used in the query for further refining the search results (see "Example Three" on page 586 below, in which a new field “Plus” is defined by the eval operator; this field is then used by the sort operator.)
Synopsis
...|eval <type> <newField>=function([<field>|<value>]*)
Where:
<newField> is a derived field displayed in the search results.
<type> is the datatype of the new field and can be int, bigint, long, float or double. If you do not include a data type, the default is string. Including a <type> is optional; include when you need some data type other than string. For example, if you do not include a type, the sort will be alphabetical. If you want to sort numerically, make <type> one of the number data
Administrator's GuideAppendix A: Search Operators
eval Page 581 of 743
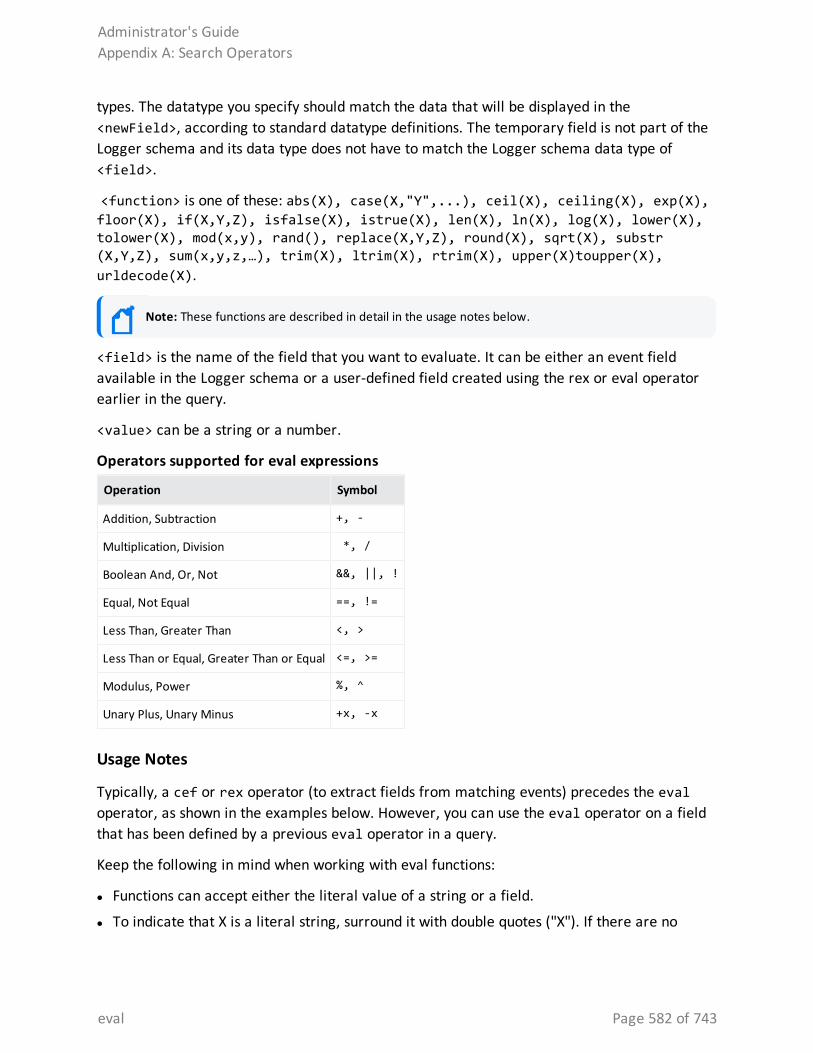
types. The datatype you specify should match the data that will be displayed in the <newField>, according to standard datatype definitions. The temporary field is not part of the Logger schema and its data type does not have to match the Logger schema data type of <field>.
<function> is one of these: abs(X), case(X,"Y",...), ceil(X), ceiling(X), exp(X), floor(X), if(X,Y,Z), isfalse(X), istrue(X), len(X), ln(X), log(X), lower(X), tolower(X), mod(x,y), rand(), replace(X,Y,Z), round(X), sqrt(X), substr(X,Y,Z), sum(x,y,z,…), trim(X), ltrim(X), rtrim(X), upper(X)toupper(X), urldecode(X).
Note: These functions are described in detail in the usage notes below.
<field> is the name of the field that you want to evaluate. It can be either an event field available in the Logger schema or a user-defined field created using the rex or eval operator earlier in the query.
<value> can be a string or a number.
Operation Symbol
Addition, Subtraction +, -
Multiplication, Division *, /
Boolean And, Or, Not &&, ||, !
Equal, Not Equal ==, !=
Less Than, Greater Than <, >
Less Than or Equal, Greater Than or Equal <=, >=
Modulus, Power %, ^
Unary Plus, Unary Minus +x, -x
Operators supported for eval expressions
Usage Notes
Typically, a cef or rex operator (to extract fields from matching events) precedes the eval operator, as shown in the examples below. However, you can use the eval operator on a field that has been defined by a previous eval operator in a query.
Keep the following in mind when working with eval functions:
l Functions can accept either the literal value of a string or a field.
l To indicate that X is a literal string, surround it with double quotes ("X"). If there are no
Administrator's GuideAppendix A: Search Operators
eval Page 582 of 743
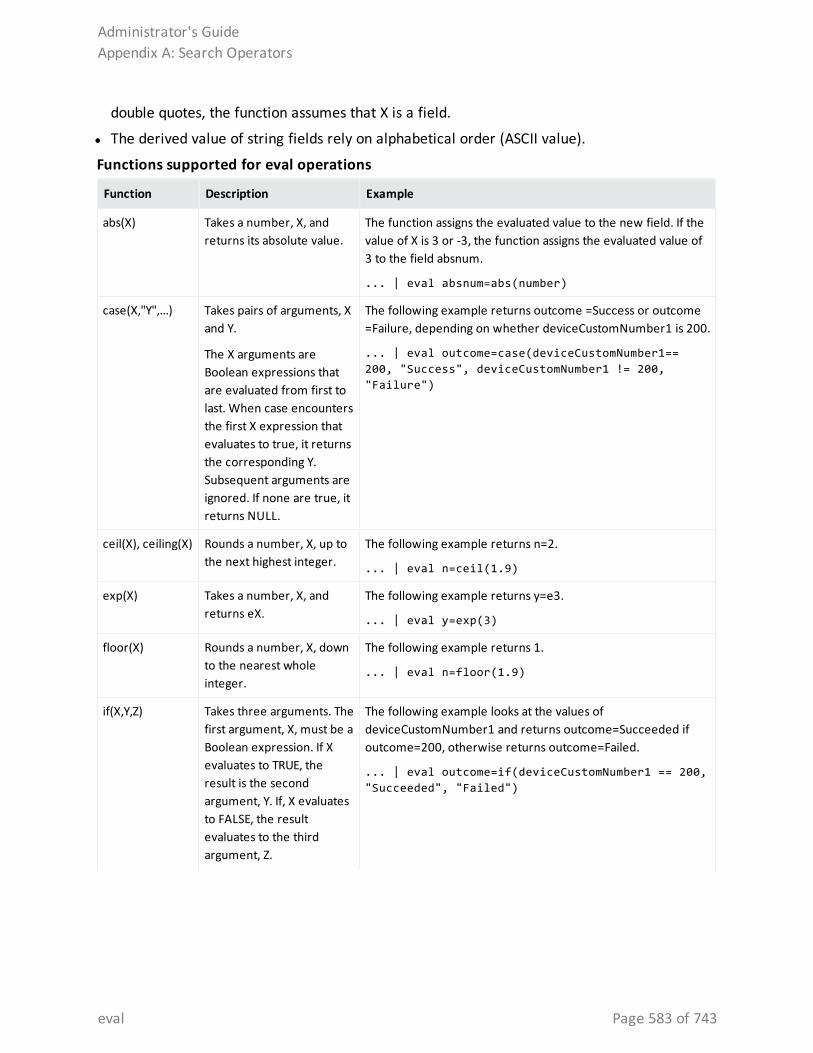
double quotes, the function assumes that X is a field.
l The derived value of string fields rely on alphabetical order (ASCII value).
Function Description Example
abs(X) Takes a number, X, and returns its absolute value.
The function assigns the evaluated value to the new field. If the value of X is 3 or -3, the function assigns the evaluated value of 3 to the field absnum.
... | eval absnum=abs(number)
case(X,"Y",...) Takes pairs of arguments, X and Y.
The X arguments are Boolean expressions that are evaluated from first to last. When case encounters the first X expression that evaluates to true, it returns the corresponding Y. Subsequent arguments are ignored. If none are true, it returns NULL.
The following example returns outcome =Success or outcome =Failure, depending on whether deviceCustomNumber1 is 200.
... | eval outcome=case(deviceCustomNumber1== 200, "Success", deviceCustomNumber1 != 200, "Failure")
ceil(X), ceiling(X) Rounds a number, X, up to the next highest integer.
The following example returns n=2.
... | eval n=ceil(1.9)
exp(X) Takes a number, X, and returns eX.
The following example returns y=e3.
... | eval y=exp(3)
floor(X) Rounds a number, X, down to the nearest whole integer.
The following example returns 1.
... | eval n=floor(1.9)
if(X,Y,Z) Takes three arguments. The first argument, X, must be a Boolean expression. If X evaluates to TRUE, the result is the second argument, Y. If, X evaluates to FALSE, the result evaluates to the third argument, Z.
The following example looks at the values of deviceCustomNumber1 and returns outcome=Succeeded if outcome=200, otherwise returns outcome=Failed.
... | eval outcome=if(deviceCustomNumber1 == 200, "Succeeded", "Failed")
Functions supported for eval operations
Administrator's GuideAppendix A: Search Operators
eval Page 583 of 743
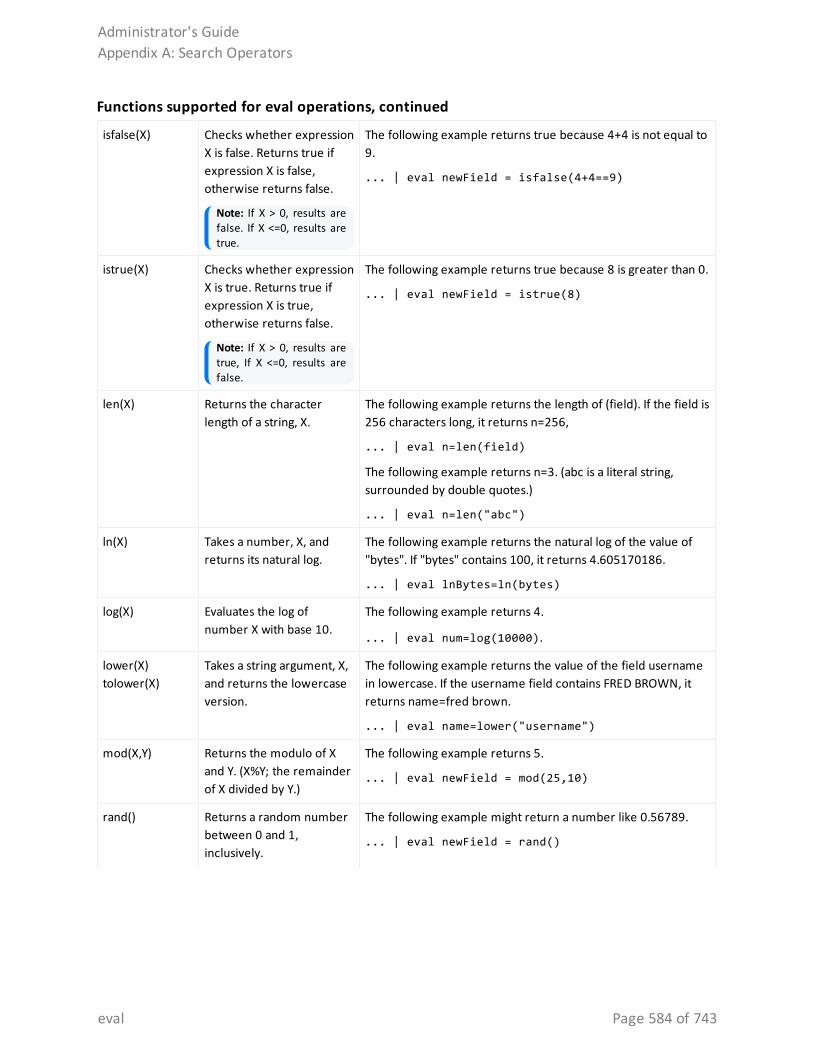
isfalse(X) Checks whether expression X is false. Returns true if expression X is false, otherwise returns false.
Note: If X > 0, results are false. If X <=0, results are true.
The following example returns true because 4+4 is not equal to 9.
... | eval newField = isfalse(4+4==9)
istrue(X) Checks whether expression X is true. Returns true if expression X is true, otherwise returns false.
Note: If X > 0, results are true, If X <=0, results are false.
The following example returns true because 8 is greater than 0.
... | eval newField = istrue(8)
len(X) Returns the character length of a string, X.
The following example returns the length of (field). If the field is 256 characters long, it returns n=256,
... | eval n=len(field)
The following example returns n=3. (abc is a literal string, surrounded by double quotes.)
... | eval n=len("abc")
ln(X) Takes a number, X, and returns its natural log.
The following example returns the natural log of the value of "bytes". If "bytes" contains 100, it returns 4.605170186.
... | eval lnBytes=ln(bytes)
log(X) Evaluates the log of number X with base 10.
The following example returns 4.
... | eval num=log(10000).
lower(X)tolower(X)
Takes a string argument, X, and returns the lowercase version.
The following example returns the value of the field username in lowercase. If the username field contains FRED BROWN, it returns name=fred brown.
... | eval name=lower("username")
mod(X,Y) Returns the modulo of X and Y. (X%Y; the remainder of X divided by Y.)
The following example returns 5.
... | eval newField = mod(25,10)
rand() Returns a random number between 0 and 1, inclusively.
The following example might return a number like 0.56789.
... | eval newField = rand()
Functions supported for eval operations, continued
Administrator's GuideAppendix A: Search Operators
eval Page 584 of 743
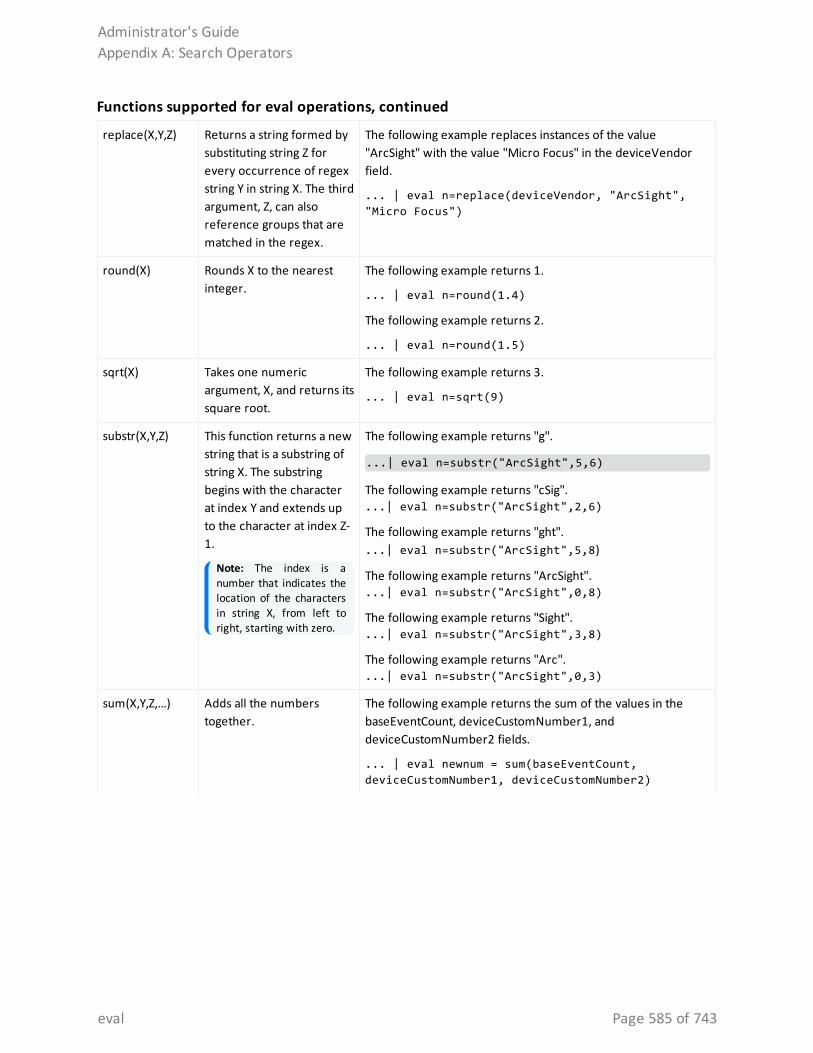
replace(X,Y,Z) Returns a string formed by substituting string Z for every occurrence of regex string Y in string X. The third argument, Z, can also reference groups that are matched in the regex.
The following example replaces instances of the value "ArcSight" with the value "Micro Focus" in the deviceVendor field.
... | eval n=replace(deviceVendor, "ArcSight", "Micro Focus")
round(X) Rounds X to the nearest integer.
The following example returns 1.
... | eval n=round(1.4)
The following example returns 2.
... | eval n=round(1.5)
sqrt(X) Takes one numeric argument, X, and returns its square root.
The following example returns 3.
... | eval n=sqrt(9)
substr(X,Y,Z) This function returns a new string that is a substring of string X. The substring begins with the character at index Y and extends up to the character at index Z-1.
Note: The index is a number that indicates the location of the characters in string X, from left to right, starting with zero.
The following example returns "g".
...| eval n=substr("ArcSight",5,6)
The following example returns "cSig"....| eval n=substr("ArcSight",2,6)
The following example returns "ght"....| eval n=substr("ArcSight",5,8)
The following example returns "ArcSight"....| eval n=substr("ArcSight",0,8)
The following example returns "Sight"....| eval n=substr("ArcSight",3,8)
The following example returns "Arc"....| eval n=substr("ArcSight",0,3)
sum(X,Y,Z,…) Adds all the numbers together.
The following example returns the sum of the values in the baseEventCount, deviceCustomNumber1, and deviceCustomNumber2 fields.
... | eval newnum = sum(baseEventCount, deviceCustomNumber1, deviceCustomNumber2)
Functions supported for eval operations, continued
Administrator's GuideAppendix A: Search Operators
eval Page 585 of 743
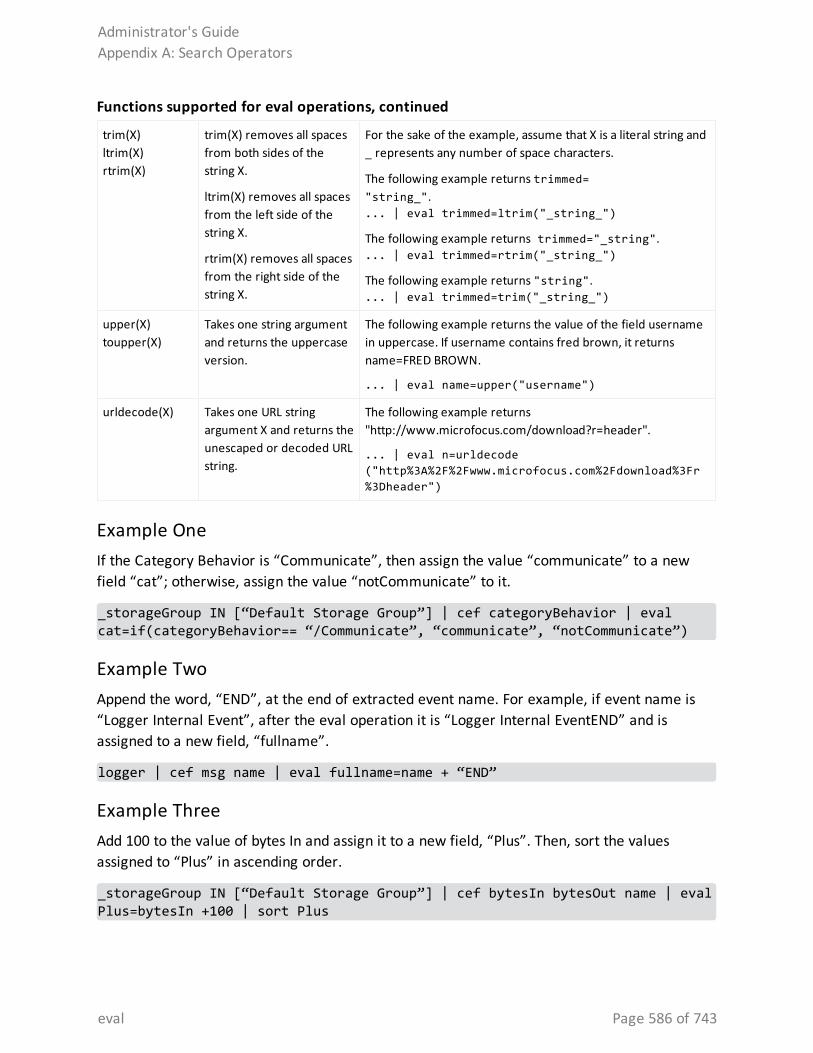
trim(X)ltrim(X)rtrim(X)
trim(X) removes all spaces from both sides of the string X.
ltrim(X) removes all spaces from the left side of the string X.
rtrim(X) removes all spaces from the right side of the string X.
For the sake of the example, assume that X is a literal string and _ represents any number of space characters.
The following example returns trimmed="string_".... | eval trimmed=ltrim("_string_")
The following example returns trimmed="_string".... | eval trimmed=rtrim("_string_")
The following example returns "string".... | eval trimmed=trim("_string_")
upper(X)toupper(X)
Takes one string argument and returns the uppercase version.
The following example returns the value of the field username in uppercase. If username contains fred brown, it returns name=FRED BROWN.
... | eval name=upper("username")
urldecode(X) Takes one URL string argument X and returns the unescaped or decoded URL string.
The following example returns "http://www.microfocus.com/download?r=header".
... | eval n=urldecode("http%3A%2F%2Fwww.microfocus.com%2Fdownload%3Fr%3Dheader")
Functions supported for eval operations, continued
Example OneIf the Category Behavior is “Communicate”, then assign the value “communicate” to a new field “cat”; otherwise, assign the value “notCommunicate” to it.
_storageGroup IN [“Default Storage Group”] | cef categoryBehavior | eval cat=if(categoryBehavior== “/Communicate”, “communicate”, “notCommunicate”)
Example TwoAppend the word, “END”, at the end of extracted event name. For example, if event name is “Logger Internal Event”, after the eval operation it is “Logger Internal EventEND” and is assigned to a new field, “fullname”.
logger | cef msg name | eval fullname=name + “END”
Example ThreeAdd 100 to the value of bytes In and assign it to a new field, “Plus”. Then, sort the values assigned to “Plus” in ascending order.
_storageGroup IN [“Default Storage Group”] | cef bytesIn bytesOut name | eval Plus=bytesIn +100 | sort Plus
Administrator's GuideAppendix A: Search Operators
eval Page 586 of 743
Example FourFind the longest URLs from the vendor ArcSight.
deviceVendor = ArcSight |eval (int)urllength=len(requestUrl) |sort urllength
extractExtracts key value pairs from raw events.
Synopsis
...| extract [pairdelim=“<delimiters>”] [kvdelim=“<delimiters>”] [maxchars=<n>] fields=“key1,key2,key3...”
Where:
l pairdelim is a delimiter (or a list of delimiters) that separates one key-value pair from another key-value pair in an event. By default, semi colon, pipe, and comma (; | ,) are used.
l kvdelim is a delimiter (or a list of delimiters) that separates a key from its value. By default, “=".
l maxchars is the maximum number of characters in an event that would be scanned for extracting key value pairs. By default, 10240.
l fields is a key (or a list of comma-separated keys) whose values you want to display in the search results.
For example, if you want to display the Name Age, and Location values from this event:
Name:Jane | Age:30 | Location:LA
extract the “Name”, “Age”, and “Location” keys and list them in the fields list.
Understanding How the Extract Operator Works
The key represents a field in the raw event and its value consists of the characters that appear after the key until the next key in the event. The following raw event is used to illustrate the concept:
[Thu Jul 30 01:20:06 2009] [error] [client 69.63.180.245] PHP Warning: memcache_pconnect() [<a href='function.memcache-pconnect'>function.memcache-pconnect</a>]: Can't connect to 10.4.31.4:11211
To extract the URL from the above event, you can define these key-pair delimiters, which separate the key-value pairs in the event:
Administrator's GuideAppendix A: Search Operators
extract Page 587 of 743
l Greater than sign (>)
l Square bracket ([)
And, define this key delimiter, which separates the key from its value:
l Equal to sign (=)
Thus, the following command will extract the URL:
... | extract pairdelim= “>\[” kvdelim= “=" fields=“<a href”
The key value pairs in the event will be: [<a href='function.memcache-pconnect'>
The key in the event will be: <a href
The extracted URL will be: 'function.memcache-pconnect'
Usage Notes
This operator only works on raw events. That is, you cannot extract key value pairs from CEF events or the fields defined by the rex operator.
You can specify the pairdelim and kvdelim delimiters in the extract operator command to extract keys and their values. However, if you want to determine the key names that these delimiters will generate, use the keys operator as described in "keys" on page 590. The keys operator can only be used to determine keys; you cannot pipe those keys in the extract operator. That is, ...| keys | extract fields=field1 is incorrect.
The keys specified in the fields list can be used further in the pipeline operations. For example, ...| extract pairdelim= “|” kvdelim= “:” fields= “count” | top count
If none of the specified pairdelim characters exists in an event, the event is not parsed into key value pairs. The whole event is skipped. Similarly, if the specified kvdelim does not exist, values are not separated from the keys.
To specify double quotes (“) as the delimiter, enter it within the pair of double quotes with backslash(\) as the escape character. For example, “=\”|”. Similarly, use two backslashes to treat a backslash character literally. For example, “\\”.
Example... | extract pairdelim= “|” kvdelim= “:” fields= “Name,Age,Location”
Extracts values from events in this format:
Name:Jane | Age:30 | Location:LA
Administrator's GuideAppendix A: Search Operators
extract Page 588 of 743
fieldsIncludes or excludes specified fields from search results.
Synopsis
... | fields ([(+ | -)] <field>)+
Where:
+ includes only the specified field or fields in the search results. This is the default.
- excludes only the specified field or fields from the search results.
Usage Notes
Typically, the <field> list contains event fields available in the Logger schema or user-defined fields created using the rex operator prior in the query, as shown in the examples below. However, fields might also be defined by other operators such as the eval operator.
The + and - can be used in the same expression when multiple fields are specified. For example:| fields + name - agentType
Tip: A complete field name must be specified for this operator; wildcard characters in a field name are not supported.
When this operator is included in a query, select User Defined Fieldsets from the System Fieldsets list to view the search results.
Example One
... | fields - agentType + categorySignificance
Example Two
... | fields - name
Administrator's GuideAppendix A: Search Operators
fields Page 589 of 743
headDisplays the first <N> lines of the search results.
Synopsis
... | head [<N>]
<N> is the number of lines to display. Default: 10, if <N> is not specified.
Usage Notes
When this operator is included in a query, the search results cannot be previewed. That is, the query must finish running before search results are displayed.
Example
... | head
keysIdentifies keys in raw events based on the specified delimiters.
Synopsis
... | keys [pairdelim= “<delimiters>”] [kvdelim= “<delimiters>”] [limit=<n>]
Where:
l pairdelim is a delimiter (or a list of delimiters) that separates one key-value pair from another key-value pair in an event. By default, semi colon, pipe, and comma (; | ,) are used.
l kvdelim is a delimiter (or a list of delimiters) that separates a key from its value. By default, “=”.
l limit is the maximum number of key value pairs to find. There is no default or maximum number for this parameter.
Usage Notes
This operator only works on raw events. That is, you cannot identify key value pairs from CEF events or fields defined by the rex operator.
Administrator's GuideAppendix A: Search Operators
head Page 590 of 743
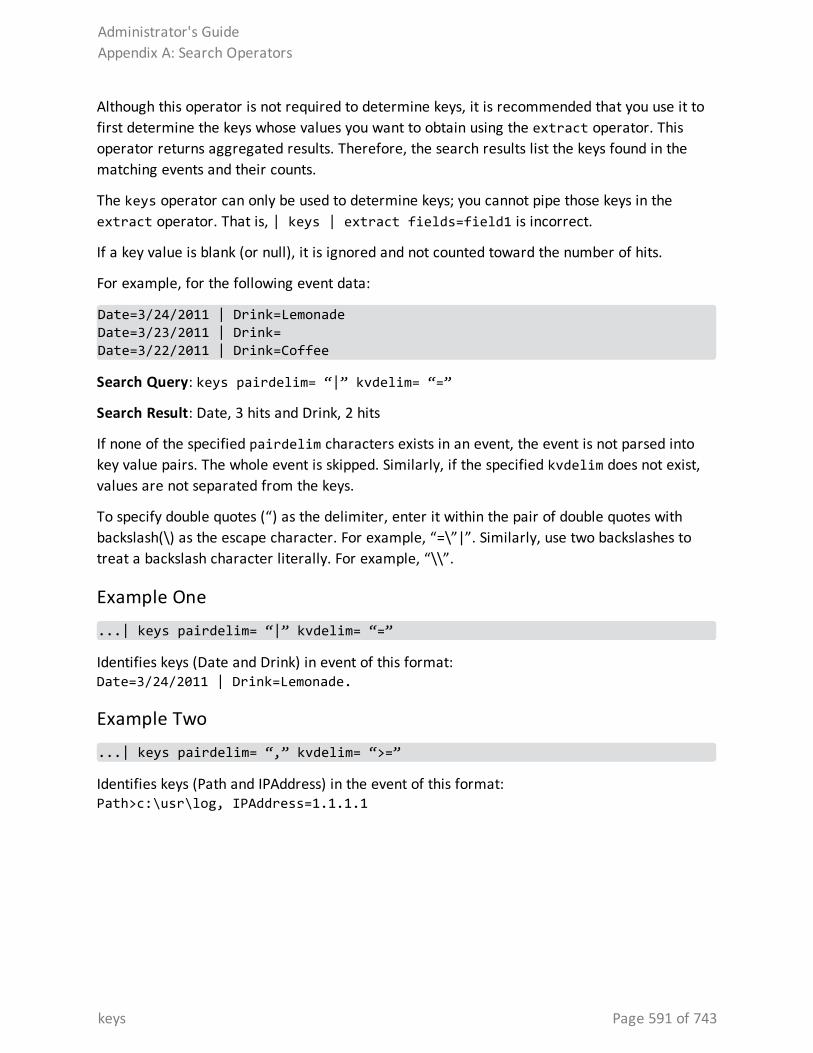
Although this operator is not required to determine keys, it is recommended that you use it to first determine the keys whose values you want to obtain using the extract operator. This operator returns aggregated results. Therefore, the search results list the keys found in the matching events and their counts.
The keys operator can only be used to determine keys; you cannot pipe those keys in the extract operator. That is, | keys | extract fields=field1 is incorrect.
If a key value is blank (or null), it is ignored and not counted toward the number of hits.
For example, for the following event data:
Date=3/24/2011 | Drink=LemonadeDate=3/23/2011 | Drink=Date=3/22/2011 | Drink=Coffee
Search Query: keys pairdelim= “|” kvdelim= “=”
Search Result: Date, 3 hits and Drink, 2 hits
If none of the specified pairdelim characters exists in an event, the event is not parsed into key value pairs. The whole event is skipped. Similarly, if the specified kvdelim does not exist, values are not separated from the keys.
To specify double quotes (“) as the delimiter, enter it within the pair of double quotes with backslash(\) as the escape character. For example, “=\”|”. Similarly, use two backslashes to treat a backslash character literally. For example, “\\”.
Example One
...| keys pairdelim= “|” kvdelim= “=”
Identifies keys (Date and Drink) in event of this format: Date=3/24/2011 | Drink=Lemonade.
Example Two
...| keys pairdelim= “,” kvdelim= “>=”
Identifies keys (Path and IPAddress) in the event of this format: Path>c:\usr\log, IPAddress=1.1.1.1
Administrator's GuideAppendix A: Search Operators
keys Page 591 of 743
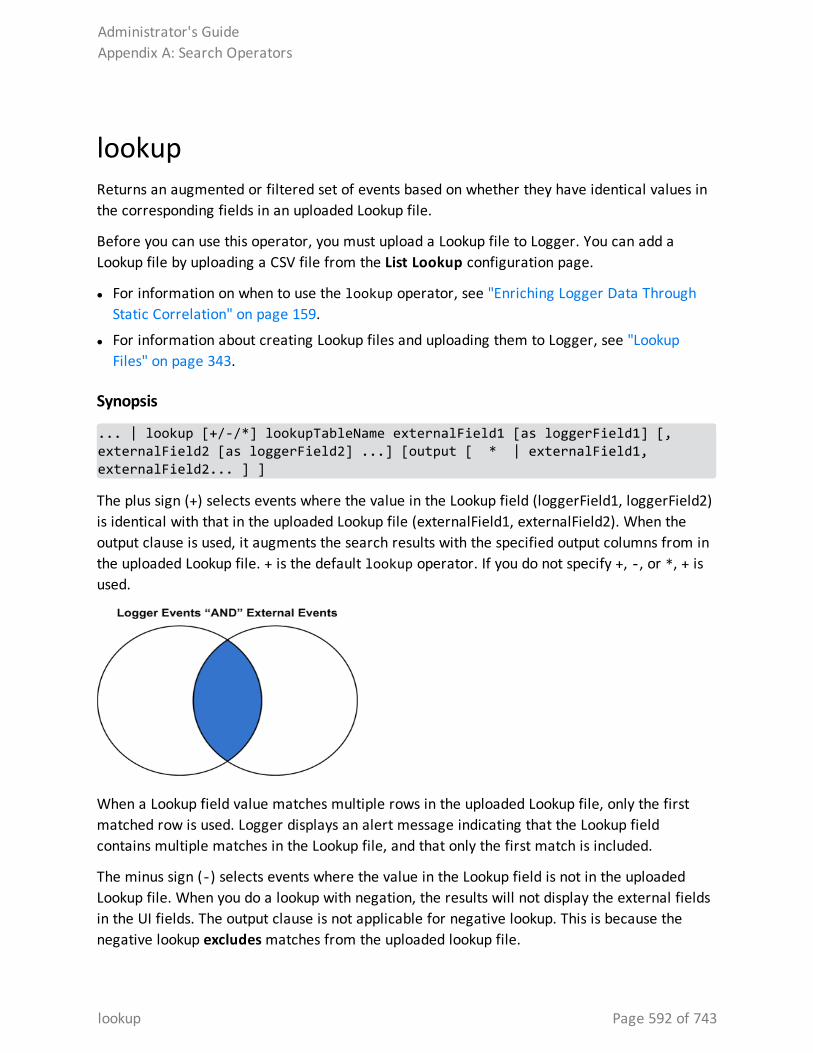
lookupReturns an augmented or filtered set of events based on whether they have identical values in the corresponding fields in an uploaded Lookup file.
Before you can use this operator, you must upload a Lookup file to Logger. You can add a Lookup file by uploading a CSV file from the List Lookup configuration page.
l For information on when to use the lookup operator, see "Enriching Logger Data Through Static Correlation" on page 159.
l For information about creating Lookup files and uploading them to Logger, see "Lookup Files" on page 343.
Synopsis
... | lookup [+/-/*] lookupTableName externalField1 [as loggerField1] [, externalField2 [as loggerField2] ...] [output [ * | externalField1, externalField2... ] ]
The plus sign (+) selects events where the value in the Lookup field (loggerField1, loggerField2) is identical with that in the uploaded Lookup file (externalField1, externalField2). When the output clause is used, it augments the search results with the specified output columns from in the uploaded Lookup file. + is the default lookup operator. If you do not specify +, -, or *, + is used.
When a Lookup field value matches multiple rows in the uploaded Lookup file, only the first matched row is used. Logger displays an alert message indicating that the Lookup field contains multiple matches in the Lookup file, and that only the first match is included.
The minus sign (-) selects events where the value in the Lookup field is not in the uploaded Lookup file. When you do a lookup with negation, the results will not display the external fields in the UI fields. The output clause is not applicable for negative lookup. This is because the negative lookup excludes matches from the uploaded lookup file.
Administrator's GuideAppendix A: Search Operators
lookup Page 592 of 743
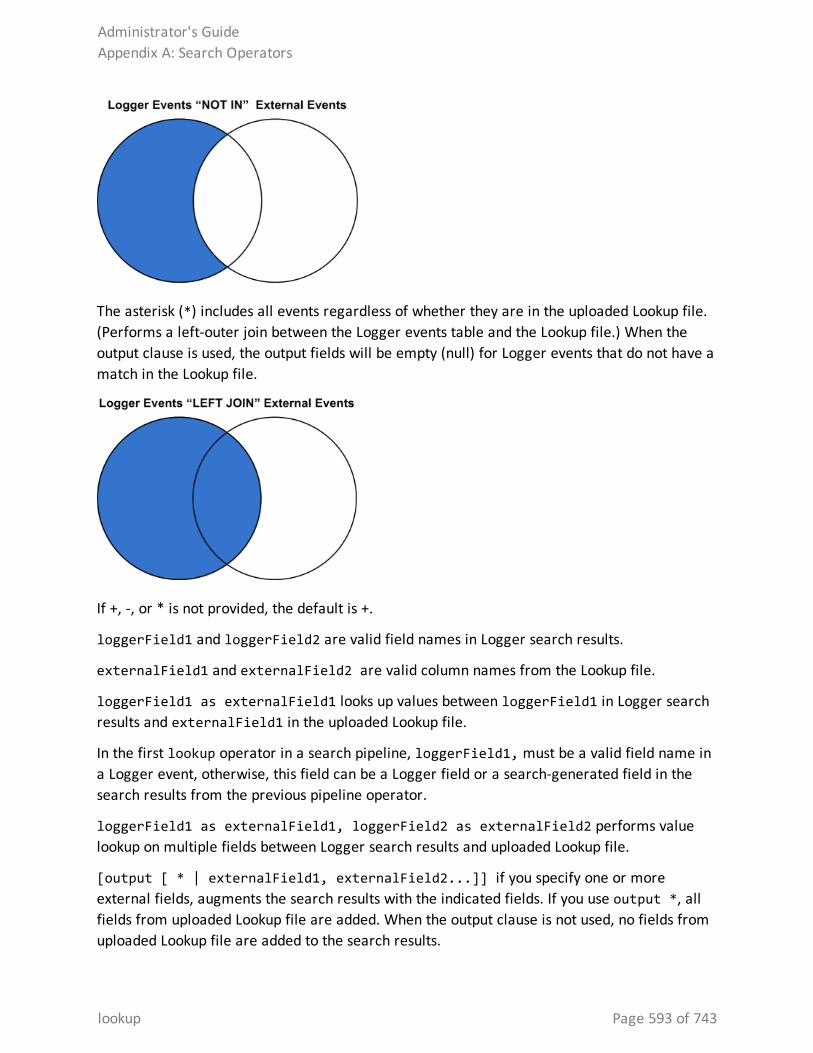
The asterisk (*) includes all events regardless of whether they are in the uploaded Lookup file. (Performs a left-outer join between the Logger events table and the Lookup file.) When the output clause is used, the output fields will be empty (null) for Logger events that do not have a match in the Lookup file.
If +, -, or * is not provided, the default is +.
loggerField1 and loggerField2 are valid field names in Logger search results.
externalField1 and externalField2 are valid column names from the Lookup file.
loggerField1 as externalField1 looks up values between loggerField1 in Logger search results and externalField1 in the uploaded Lookup file.
In the first lookup operator in a search pipeline, loggerField1, must be a valid field name in a Logger event, otherwise, this field can be a Logger field or a search-generated field in the search results from the previous pipeline operator.
loggerField1 as externalField1, loggerField2 as externalField2 performs value lookup on multiple fields between Logger search results and uploaded Lookup file.
[output [ * | externalField1, externalField2...]] if you specify one or more external fields, augments the search results with the indicated fields. If you use output *, all fields from uploaded Lookup file are added. When the output clause is not used, no fields from uploaded Lookup file are added to the search results.
Administrator's GuideAppendix A: Search Operators
lookup Page 593 of 743
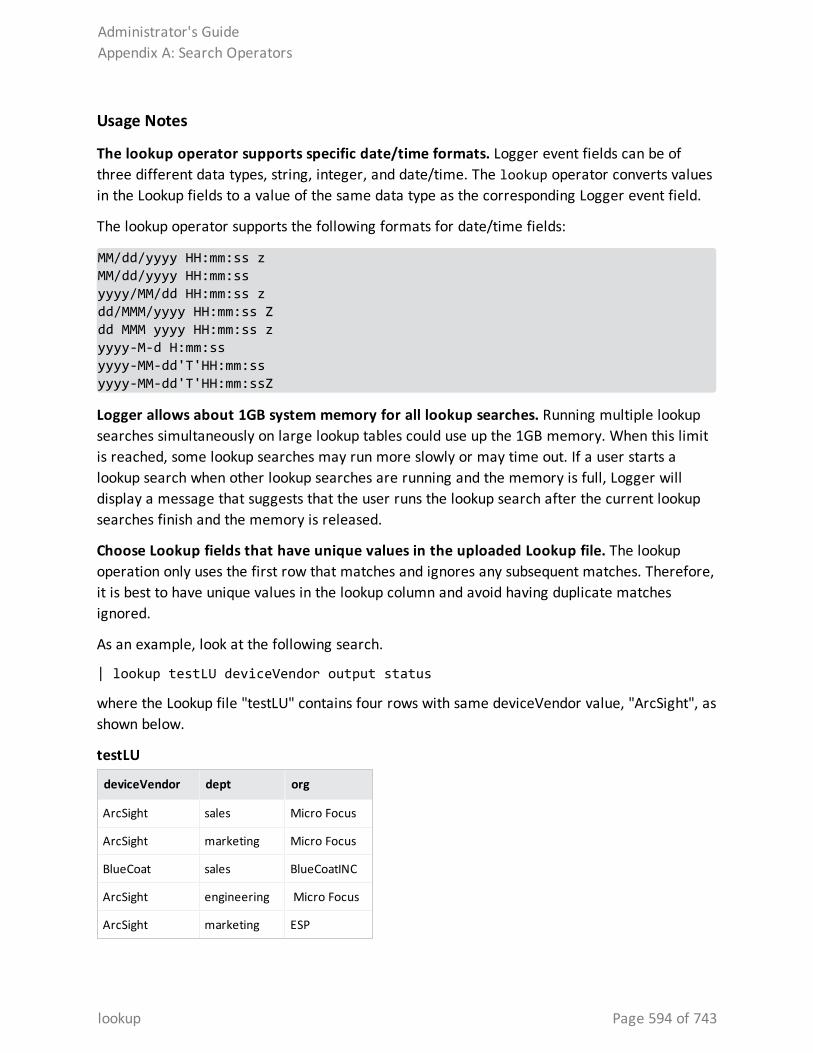
Usage Notes
The lookup operator supports specific date/time formats. Logger event fields can be of three different data types, string, integer, and date/time. The lookup operator converts values in the Lookup fields to a value of the same data type as the corresponding Logger event field.
The lookup operator supports the following formats for date/time fields:
MM/dd/yyyy HH:mm:ss zMM/dd/yyyy HH:mm:ssyyyy/MM/dd HH:mm:ss zdd/MMM/yyyy HH:mm:ss Zdd MMM yyyy HH:mm:ss zyyyy-M-d H:mm:ssyyyy-MM-dd'T'HH:mm:ssyyyy-MM-dd'T'HH:mm:ssZ
Logger allows about 1GB system memory for all lookup searches. Running multiple lookup searches simultaneously on large lookup tables could use up the 1GB memory. When this limit is reached, some lookup searches may run more slowly or may time out. If a user starts a lookup search when other lookup searches are running and the memory is full, Logger will display a message that suggests that the user runs the lookup search after the current lookup searches finish and the memory is released.
Choose Lookup fields that have unique values in the uploaded Lookup file. The lookup operation only uses the first row that matches and ignores any subsequent matches. Therefore, it is best to have unique values in the lookup column and avoid having duplicate matches ignored.
As an example, look at the following search.
| lookup testLU deviceVendor output status
where the Lookup file "testLU" contains four rows with same deviceVendor value, "ArcSight", as shown below.
deviceVendor dept org
ArcSight sales Micro Focus
ArcSight marketing Micro Focus
BlueCoat sales BlueCoatINC
ArcSight engineering Micro Focus
ArcSight marketing ESP
testLU
Administrator's GuideAppendix A: Search Operators
lookup Page 594 of 743
When the lookup operation finds duplicates in the Lookup field, ("deviceVendor=ArcSight" in testLU and "deviceVendor=ArcSight" in the Logger events table), the search results use only the first entry, "status_testLU=ok" to augment the matching Logger event, while subsequent matches, such as "status_testLU=alert", are NOT used.
Tip: In some rare situations, a blank page may be returned after you upload a Lookup File from the Add Lookup File page. If this happens, refresh the page manually. After the refresh, you are returned to the loading page and the process tries to load the Lookup File again. Since the file was already uploaded, you get an error message. You can safely ignore the error.
Using IP Addresses in Lookup Files
The Lookup process automatically determines whether the Lookup file consists of IP addresses, and if so treats them as IP addresses rather than strings. When performing a search using a Lookup file, Logger checks the first ten rows of each Lookup column to determine whether it contains only IP addresses.
l If a Lookup column contains only IP addresses in the first ten rows, Logger assumes that the rest of rows in that column contain IP addresses.
Note: Including non-IP address data later in the same column may cause an exception.
l If the first ten rows contain strings that are not IP addresses, Logger uses the field type of the corresponding Logger event column to determine the data type.
l If the Lookup process determines that it's an IP address lookup based on the above rule, the search will find matching IP addresses in any equivalent IP address format.
For example, if your Lookup column has some things that are not IP addresses in the first ten rows:
l Searching for the string “2001:db8:250:0:0:fefe:0:1” would find only events where the target field is the exact string “2001:db8:250:0:0:fefe:0:1”
l Searching for the string “192.168.10.100” would find only events where the target field is the exact string “192.168.10.100”.
Whereas, if your Lookup file has only IP addresses in the first ten rows:
l Searching for the address “192.0.2.010” could find events with addresses such as: “192.0.2.010” and “192.0.2.10”.
l Searching for the address “2001:db8:250:0:0:fefe:0:1” could find events with addresses such as: “2001:db8:250:0:0:fefe:0:1” and “2001:db8:250::fefe:0000:1”.
Note: For more information about including IPv6 address data in Logger and searching for it, see "Sending IPv6 Data to Logger" on page 33 and "Searching for IPv6 Addresses" on page 124.
Administrator's GuideAppendix A: Search Operators
lookup Page 595 of 743
Example OneThe following example looks up events where the sourceAddress comes from the IP address listed in a lookup file named “maliciousIP” under the column named “ip”.
lookup maliciousIP ip as sourceAddress
Example TwoThe following example looks up access events with a sourcePort different from the sourcePort in day_x, where day_x is the lookup file generated from the exported Logger events on a day before.
access | lookup - day_x sourcePort
parseApplies the named parser to the matching events of a search query.
Synopsis
...| parse <parser_name>
Where <parser_name> is the name of the parser to use. For information on how to create a parser, see "Working with Parsers" on page 382.
Tip: The parser must exist before it can be used in a query.
The parse operator is useful in parsing the non-CEF (unstructured textual) data stored on Logger and parsing it into specific fields according to the parser’s definition.
Once parsed into fields, this data can be used further in search operations. For example, the following parse operator parses the events using a user-defined parser “Web Server Access Logs” such that “username”, “login_status”, “num_attempts” fields are created.
You can use these created fields further in a pipeline query to display the top 10 user names that resulted in the maximum failed login attempts and the number of attempts they made.
...| parse Web Server Access Log | where login_status = “failed” | top username num_attempts
Because the parser definitions are rex or extract expressions, they create additional fields to contain values that match the specified expression. These fields are displayed in the Search Results just like the results of any rex or extract expression. Therefore, in the above example,
Administrator's GuideAppendix A: Search Operators
parse Page 596 of 743
three additional fields will be added to the Search Result: username, login_status, num_attempts.
An additional field called “parser” is also added to the Search Results when the parse operator is used in a search query.
This field contains the name of the parser when the parser is able to parse one or more fields specified in the definition for the matching events. If the event was not parsed successfully, if no parser is defined for the source type, or if there is no source type, this field displays, this field contains “Not parsed”. Similarly, the field contains the value “not parsed” when the parser definition is not able to parse any fields of the matching event.
ExampleYou can also use this field to find out events that were successfully parsed or did not parse:
... | parse Web Server Access Log | where parser = “not parsed”
Usage Notes
When to use the parse operator: When non-CEF events are received through TCP or UDP receivers on Logger, they are not associated with a source type and thus a parser definition. Therefore, such events not parsed automatically. Similarly, non-CEF events stored on If you need such events parsed when they match a query, use the parse operator.
When an event for which a defined source type exists on Logger is parsed through the parse operator, it can result in the creation of multiple user-defined fields—through the parser associated with the source type and through the parser you specified in the parser pipeline command. If both parsers create unique field names, all those fields are created when a query that matches the event is run. If the parsers specify one or more same name fields, the field names specified in the parse operator parser take precedence as this parser is applied last.
Example
...| parse Web Server Access Log | where url CONTAINS “.org” | top url
rareLists the search results in a tabular form of the least common values for the specified field. That is, the values are listed from the lowest count value to the highest.
When multiple fields are specified, the count of unique sets of all those fields is listed from the lowest to highest count.
Administrator's GuideAppendix A: Search Operators
rare Page 597 of 743
Synopsis
...| rare <field1> <field2> <field3> ...
Sorts the matching results from least to most common for the specified fields.
Usage Notes
Typically, the <field> list contains event fields available in the Logger schema or user-defined fields created using the rex or eval operators prior in the query, as shown in the examples below. However, fields might also be defined by other operators such as the eval operator.
A chart of the search results is automatically generated when this operator is included in a query. You can click on a charted value to quickly filter down to events with specific field values. For more information, see "Chart Drill Down" on page 131.
If multiple fields are specified, separate the field names with a white space or a comma.
Example
... | rare deviceEventCategory
regexSelects events that match the specified regular expression.
Synopsis
...| regex <regular_expression>
OR
...| regex <field> (=|!=) <regular_expression>
Usage Notes
Regular expression pattern matching is case insensitive.
The first usage (without a field name) is applied to the raw event. While the second usage (with a field name), is applied to a specific field.
If you use the second usage (as shown above and in the second example, below), either specify an event field that is available in the Logger schema or a user-defined field created using the rex or eval operators.
Administrator's GuideAppendix A: Search Operators
regex Page 598 of 743
Examples
... | regex “failure”
... | regex deviceEventCategory != “fan”
renameRenames the specified field name.
Synopsis
...| rename <field> as <new_name>
Where:
l <field> is the name of an event field that is available in the Logger schema or a user-defined field created using the rex or eval operator.
l <new_name> is the new name you want to assign to the field.
Caution (Search Page): Micro Focus recommends to rename the operators differently. Otherwise, columns with duplicate names will appear which can cause confusion when analyzing the search results.
Usage Notes
An additional column is added to the search results for each renamed field. The field with the original name continues to be displayed in the search results in addition to the renamed field. For example, if you rename deviceEventCategory to Category, two columns are displayed in the search results: deviceEventCategory and Category.
You can include the wildcard character, *, in a field name. However, you must enclose the field that contains a wildcard character in double quotes (“ ”). For example:
...| rename “*IPAddress” as “*Address”
OR
...| rename “*IPAddress” as Address
If a field name includes a special character (such as _, a space, #, and so on), it should be included in double quotes (“ ”) in the rename operator expression. For example:
...| rename src_ip as “Source IP Address”
Administrator's GuideAppendix A: Search Operators
rename Page 599 of 743
If the resulting field of a rename operation includes a special character, it must be enclosed in double quotes (“ ”) whenever you use it in the pipeline operator expression. For example,
...| rename src_ip as “Source IP Address” | top “Source IP Address”
The internal field names (that start with “_raw”) cannot be renamed.
The renamed fields are valid only for the duration of the query.
The resulting field of a rename operation is case sensitive. When using such a field in a search operation, make sure that you the same case that was used to define the field.
When you export the search results of a search query that contains the rename expression, the resulting file contains the renamed fields.
Example
...| rename src_ip as IPAddress
...| rename src_ip as “Source IP Address”
replaceReplaces the specified string in the specified fields with the specified new string.
Synopsis
<orig_str> with <new_str> [in <field_list>]
Where:
l <orig_str> is the original string you want to replace.
l <new_str> is the new string you want to replace with.
l <field_list> is the optional, however highly recommended.
Usage Notes
Tip: Even though the field list is optional for this command, Micro Focus strongly recommends that you specify the fields on which the replace operator should act in this command.
If you skip the field list, the replace operator acts on the fields that have been either explicitly defined using the cef, rex, and eval operators preceding the replace command, or any fields that were used in other operator commands that preceded the replace operator command.
Administrator's GuideAppendix A: Search Operators
replace Page 600 of 743
For example, the replace command acts on deviceEventCategory in all of the following cases and replaces one instance of “EPS” with “Events”:
...| replace *EPS* with *Events* in deviceEventCategory
...| cef deviceEventCategory | replace *EPS* with *Events*
...| top deviceEventCategory | replace *EPS* with *Events*
To replace the entire string, specify it in full (as it appears in the event). For example, “192.168.35.3”. To replace part of the string, include wildcard character (*) for the part that is not going to change. For example, if the original string (the string you want to replace) is “192.168*”, only the 192.168 part in an event is replaced. The remaining string is preserved. As a result, if an event contains 192.168.35.3, only the first two bytes are replaced. The rest (35.3) will be preserved. Similarly, if the event contains 192.168.DestIP, DestIP will be preserved. However, if the event contains the string 192.168, it will not be replaced.
If both, the original and the new strings contain wildcard characters, the number of wildcard characters in the original string must match the number of wildcard characters in the new string.
...| replace “*.168.*” with “*.XXX.*
If the original or the new string includes a special character such as / or ?, enclose the string in double quotes (“”):
...| replace “/Monitor” with Error
You can replace multiple values for multiple fields in a single operation by separating each expression with a comma (,). Note that you must specify the field list after specifying the “with” expression for all values that you want to replace, as shown in the following example:
...| replace "Arc*" with Micro Focus, "cpu:100" with EPS in deviceVendor, deviceEventClassId
The original string is case-insensitive. Therefore, the string “err” will replace an event that contains “Err”.
Example OneReplace any occurrence of “a” with “b” but the characters preceding “a” and succeeding it are preserved.
...| replace *a* with *b*
Administrator's GuideAppendix A: Search Operators
replace Page 601 of 743
Example TwoReplace any occurrence of “a” with “b” without retaining any characters preceding or succeeding “a”.
...| replace *a* with b in name
rexExtracts (or capture) a value based on the specified regular expression or extract and substitute a value based on the specified “sed” expression. The value can be from a previously specified field in the query or a raw event message.
Synopsis
... | rex <regular_expression containing a field name>
Or
... | rex field = <field> mode=sed “s/<string to be substituted>/<substitution value>”
Understanding How Extraction Works
When the value is extracted based on a regular expression, the extracted value is assigned to a field name, which is specified as part of the regular expression. The syntax for defining the field name is ?<fieldname>, where fieldname is a string of alphanumeric characters. Using an underscore (“_”) is not recommended.
For example, use the following event to illustrate the power of rex.
[Thu Jul 30 01:20:06 2009] [error] [client 69.63.180.245] PHP Warning: Can't connect to 10.4.31.4:11211
If you want to extract any IP address from the above event and assign it to a field called IP_Address, specify the following rex expression:
| rex “(?<IPAddress>\d{1,3}\.\d{1,3}\.\d{1,3}\.\d{1,3})”
However, if you wanted to extract the IP address after the word “client” from the following event and assign it to a field called SourceIP, you will need to specify a start and end point for IP address extraction, so that the second IP address in the event is not captured. The starting point in this event can be [client and the end point can be ]. Thus, the rex expression will be:
| rex “\[client (?<SourceIP>[^\]]*)”
Administrator's GuideAppendix A: Search Operators
rex Page 602 of 743
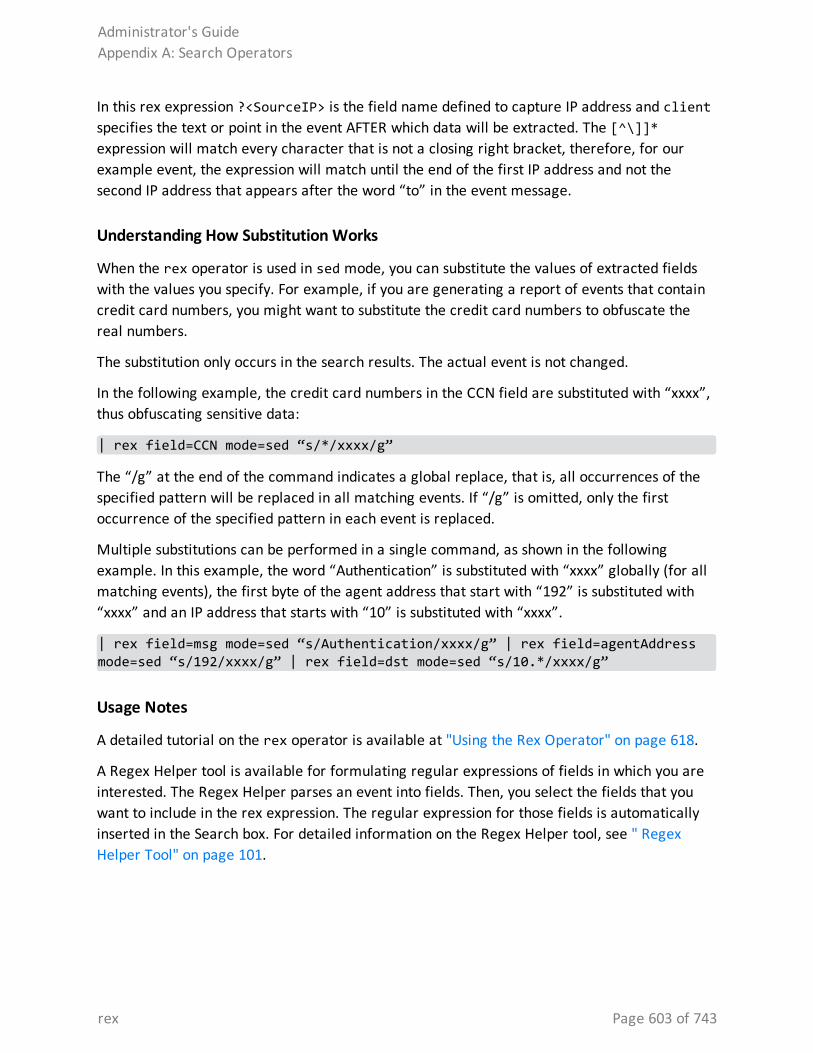
In this rex expression ?<SourceIP> is the field name defined to capture IP address and client specifies the text or point in the event AFTER which data will be extracted. The [^\]]* expression will match every character that is not a closing right bracket, therefore, for our example event, the expression will match until the end of the first IP address and not the second IP address that appears after the word “to” in the event message.
Understanding How Substitution Works
When the rex operator is used in sed mode, you can substitute the values of extracted fields with the values you specify. For example, if you are generating a report of events that contain credit card numbers, you might want to substitute the credit card numbers to obfuscate the real numbers.
The substitution only occurs in the search results. The actual event is not changed.
In the following example, the credit card numbers in the CCN field are substituted with “xxxx”, thus obfuscating sensitive data:
| rex field=CCN mode=sed “s/*/xxxx/g”
The “/g” at the end of the command indicates a global replace, that is, all occurrences of the specified pattern will be replaced in all matching events. If “/g” is omitted, only the first occurrence of the specified pattern in each event is replaced.
Multiple substitutions can be performed in a single command, as shown in the following example. In this example, the word “Authentication” is substituted with “xxxx” globally (for all matching events), the first byte of the agent address that start with “192” is substituted with “xxxx” and an IP address that starts with “10” is substituted with “xxxx”.
| rex field=msg mode=sed “s/Authentication/xxxx/g” | rex field=agentAddress mode=sed “s/192/xxxx/g” | rex field=dst mode=sed “s/10.*/xxxx/g”
Usage Notes
A detailed tutorial on the rex operator is available at "Using the Rex Operator" on page 618.
A Regex Helper tool is available for formulating regular expressions of fields in which you are interested. The Regex Helper parses an event into fields. Then, you select the fields that you want to include in the rex expression. The regular expression for those fields is automatically inserted in the Search box. For detailed information on the Regex Helper tool, see " Regex Helper Tool" on page 101.
Administrator's GuideAppendix A: Search Operators
rex Page 603 of 743
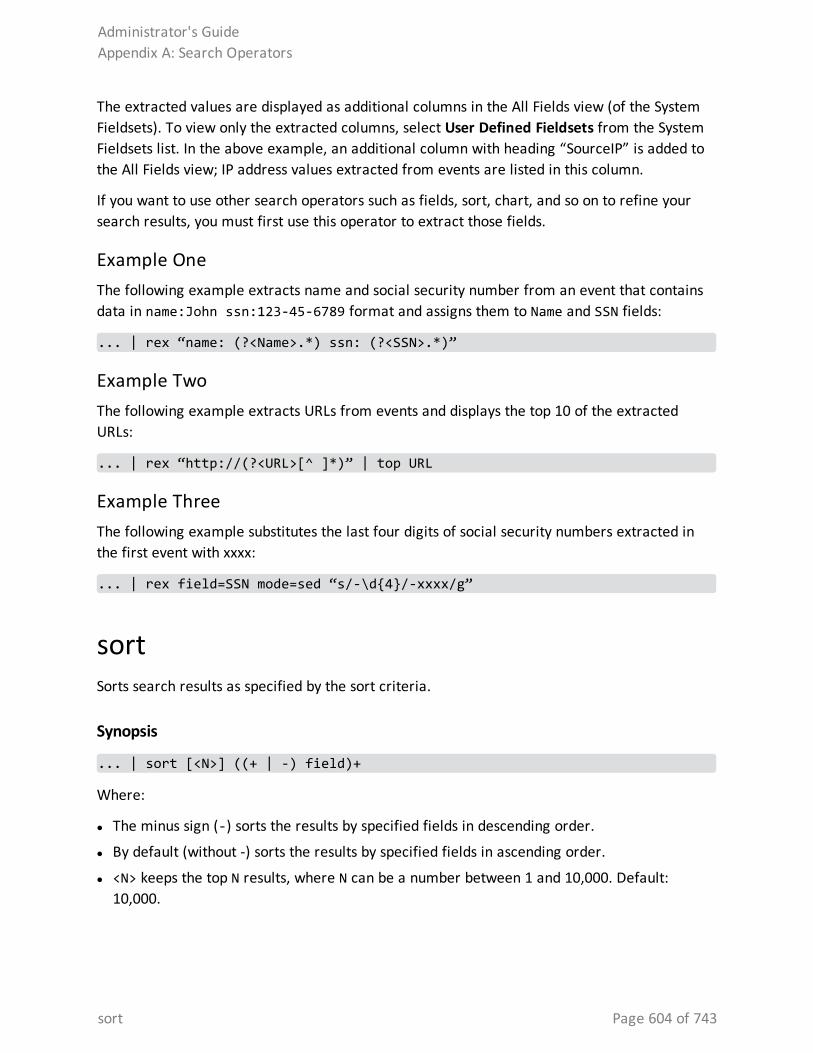
The extracted values are displayed as additional columns in the All Fields view (of the System Fieldsets). To view only the extracted columns, select User Defined Fieldsets from the System Fieldsets list. In the above example, an additional column with heading “SourceIP” is added to the All Fields view; IP address values extracted from events are listed in this column.
If you want to use other search operators such as fields, sort, chart, and so on to refine your search results, you must first use this operator to extract those fields.
Example OneThe following example extracts name and social security number from an event that contains data in name:John ssn:123-45-6789 format and assigns them to Name and SSN fields:
... | rex “name: (?<Name>.*) ssn: (?<SSN>.*)”
Example TwoThe following example extracts URLs from events and displays the top 10 of the extracted URLs:
... | rex “http://(?<URL>[^ ]*)” | top URL
Example ThreeThe following example substitutes the last four digits of social security numbers extracted in the first event with xxxx:
... | rex field=SSN mode=sed “s/-\d{4}/-xxxx/g”
sortSorts search results as specified by the sort criteria.
Synopsis
... | sort [<N>] ((+ | -) field)+
Where:
l The minus sign (-) sorts the results by specified fields in descending order.
l By default (without -) sorts the results by specified fields in ascending order.
l <N> keeps the top N results, where N can be a number between 1 and 10,000. Default: 10,000.
Administrator's GuideAppendix A: Search Operators
sort Page 604 of 743
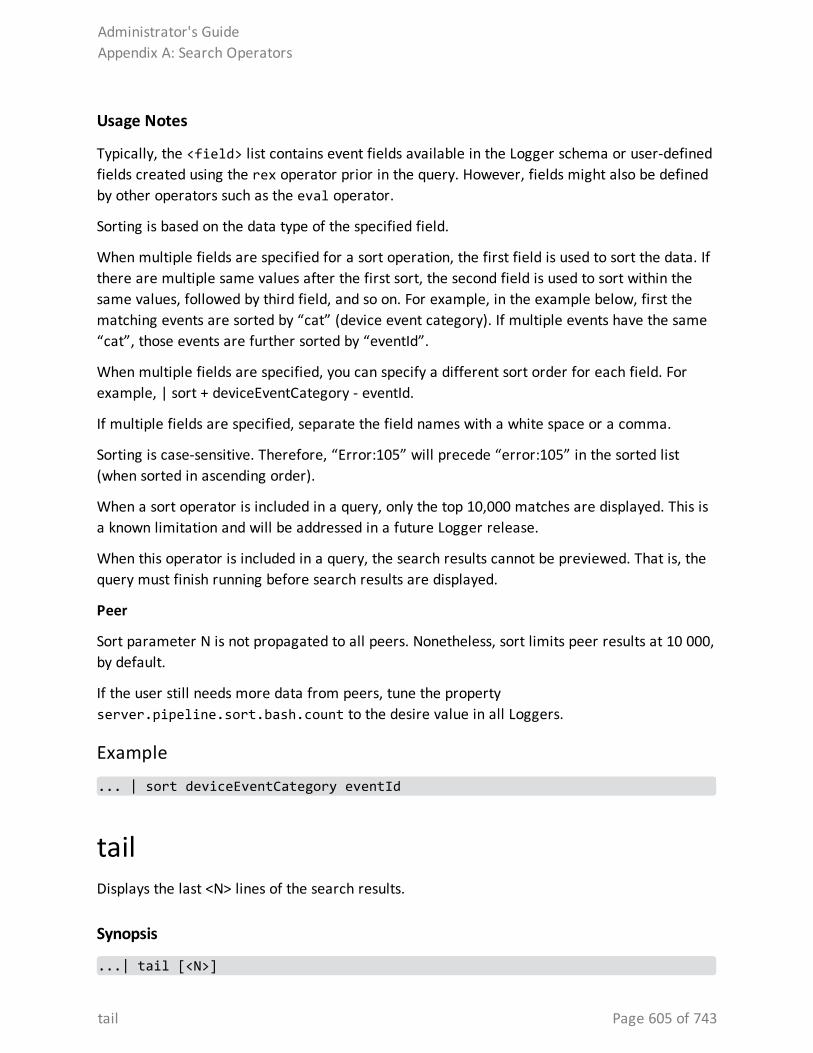
Usage Notes
Typically, the <field> list contains event fields available in the Logger schema or user-defined fields created using the rex operator prior in the query. However, fields might also be defined by other operators such as the eval operator.
Sorting is based on the data type of the specified field.
When multiple fields are specified for a sort operation, the first field is used to sort the data. If there are multiple same values after the first sort, the second field is used to sort within the same values, followed by third field, and so on. For example, in the example below, first the matching events are sorted by “cat” (device event category). If multiple events have the same “cat”, those events are further sorted by “eventId”.
When multiple fields are specified, you can specify a different sort order for each field. For example, | sort + deviceEventCategory - eventId.
If multiple fields are specified, separate the field names with a white space or a comma.
Sorting is case-sensitive. Therefore, “Error:105” will precede “error:105” in the sorted list (when sorted in ascending order).
When a sort operator is included in a query, only the top 10,000 matches are displayed. This is a known limitation and will be addressed in a future Logger release.
When this operator is included in a query, the search results cannot be previewed. That is, the query must finish running before search results are displayed.
Peer
Sort parameter N is not propagated to all peers. Nonetheless, sort limits peer results at 10 000, by default.
If the user still needs more data from peers, tune the property server.pipeline.sort.bash.count to the desire value in all Loggers.
Example
... | sort deviceEventCategory eventId
tailDisplays the last <N> lines of the search results.
Synopsis
...| tail [<N>]
Administrator's GuideAppendix A: Search Operators
tail Page 605 of 743
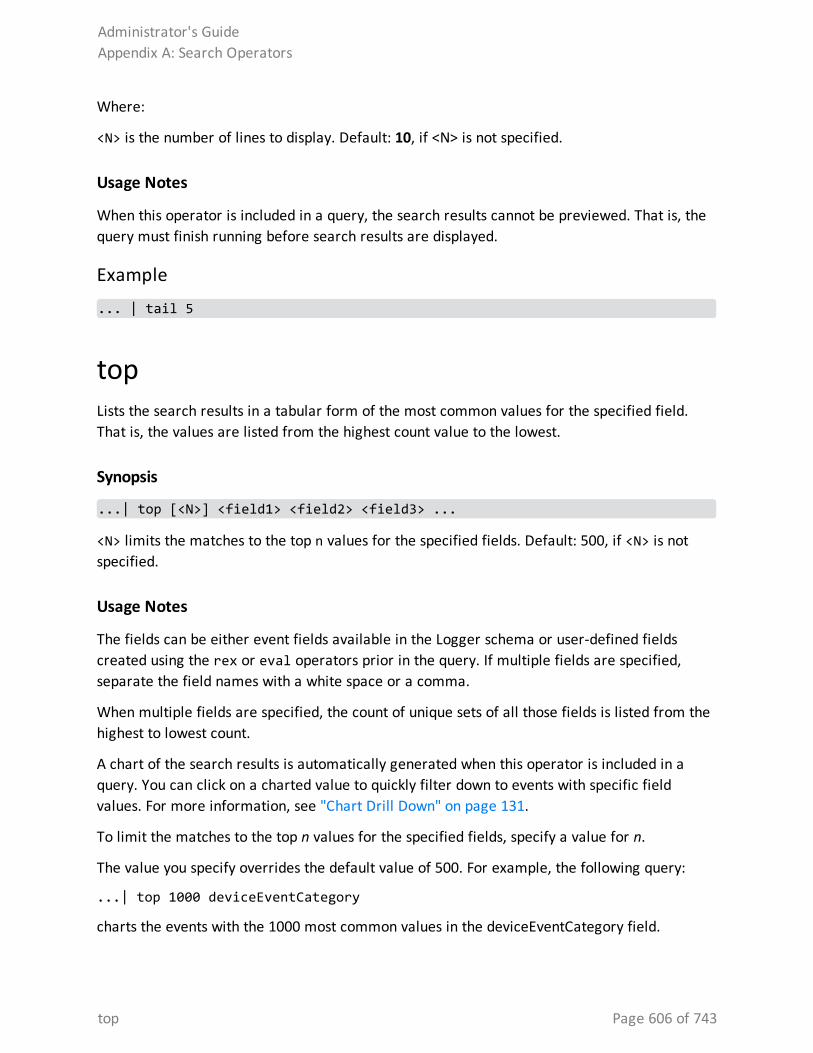
Where:
<N> is the number of lines to display. Default: 10, if <N> is not specified.
Usage Notes
When this operator is included in a query, the search results cannot be previewed. That is, the query must finish running before search results are displayed.
Example
... | tail 5
topLists the search results in a tabular form of the most common values for the specified field. That is, the values are listed from the highest count value to the lowest.
Synopsis
...| top [<N>] <field1> <field2> <field3> ...
<N> limits the matches to the top n values for the specified fields. Default: 500, if <N> is not specified.
Usage Notes
The fields can be either event fields available in the Logger schema or user-defined fields created using the rex or eval operators prior in the query. If multiple fields are specified, separate the field names with a white space or a comma.
When multiple fields are specified, the count of unique sets of all those fields is listed from the highest to lowest count.
A chart of the search results is automatically generated when this operator is included in a query. You can click on a charted value to quickly filter down to events with specific field values. For more information, see "Chart Drill Down" on page 131.
To limit the matches to the top n values for the specified fields, specify a value for n.
The value you specify overrides the default value of 500. For example, the following query:
...| top 1000 deviceEventCategory
charts the events with the 1000 most common values in the deviceEventCategory field.
Administrator's GuideAppendix A: Search Operators
top Page 606 of 743
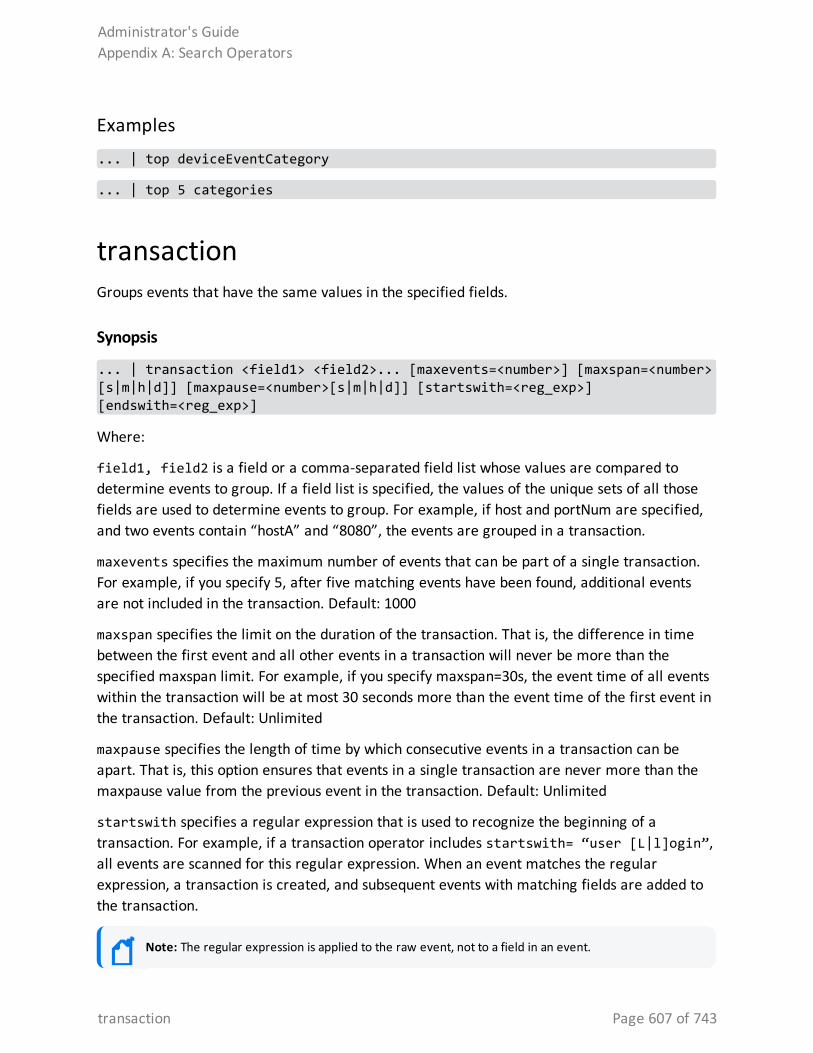
Examples
... | top deviceEventCategory
... | top 5 categories
transactionGroups events that have the same values in the specified fields.
Synopsis
... | transaction <field1> <field2>... [maxevents=<number>] [maxspan=<number>[s|m|h|d]] [maxpause=<number>[s|m|h|d]] [startswith=<reg_exp>] [endswith=<reg_exp>]
Where:
field1, field2 is a field or a comma-separated field list whose values are compared to determine events to group. If a field list is specified, the values of the unique sets of all those fields are used to determine events to group. For example, if host and portNum are specified, and two events contain “hostA” and “8080”, the events are grouped in a transaction.
maxevents specifies the maximum number of events that can be part of a single transaction. For example, if you specify 5, after five matching events have been found, additional events are not included in the transaction. Default: 1000
maxspan specifies the limit on the duration of the transaction. That is, the difference in time between the first event and all other events in a transaction will never be more than the specified maxspan limit. For example, if you specify maxspan=30s, the event time of all events within the transaction will be at most 30 seconds more than the event time of the first event in the transaction. Default: Unlimited
maxpause specifies the length of time by which consecutive events in a transaction can be apart. That is, this option ensures that events in a single transaction are never more than the maxpause value from the previous event in the transaction. Default: Unlimited
startswith specifies a regular expression that is used to recognize the beginning of a transaction. For example, if a transaction operator includes startswith= “user [L|l]ogin”, all events are scanned for this regular expression. When an event matches the regular expression, a transaction is created, and subsequent events with matching fields are added to the transaction.
Note: The regular expression is applied to the raw event, not to a field in an event.
Administrator's GuideAppendix A: Search Operators
transaction Page 607 of 743
endswith specifies a regular expression that is used to recognize the end of an existing transaction. That is, an existing transaction is completed when an event matches the specified “endswith” regular expression. For example, if a transaction operator includes endswith= “[L|l]ogout”, any event being added to a transaction is checked, and if the regular expression matches the event, the transaction is completed.
Note: The regular expression is applied to the raw event, not to a field in an event.
Usage Notes
Several of the above options specify conditions to end a transaction. Therefore, when multiple end conditions are specified in a transaction operator, the first end condition that occurs will end the transaction even if the other conditions have not been satisfied yet. For example, if maxspan is reached but maxevents has not been reached, or if the endswith regular expression is matched but maxevents has not been reached.
Understanding How the Transaction Operator Works
A transaction is a set of events that contain the same values in the specified fields. The events may be further filtered based on the options described above, such as maxspan, maxpause, and so on. In addition to grouping events, the transaction operator adds these fields to each event: transactionid, duration, and eventcount. These fields are displayed in the Search Results as separate columns.
A transactionid is assigned to each transaction when the transaction completes. Transaction IDs are integers, assigned starting from 1 for the transactions (set of events) found in the current query. All events in the same transaction will have the same transaction ID.
If an event does not belong to any transaction found in the current query, it is assigned the transaction ID 0. For example, in a transaction operator with a startswith regular expression, if the first event in the pipeline does not match the regular expression, that event is not part of the transaction, and is assigned transaction ID 0.
The duration is the time in milliseconds of the duration of a transaction, which is the difference between the event time of the last event in the transaction and the first event in the transaction. The duration field for all events in a transaction is set to the duration value of the transaction.
The eventcount displays the number of events in a transaction.
Administrator's GuideAppendix A: Search Operators
transaction Page 608 of 743
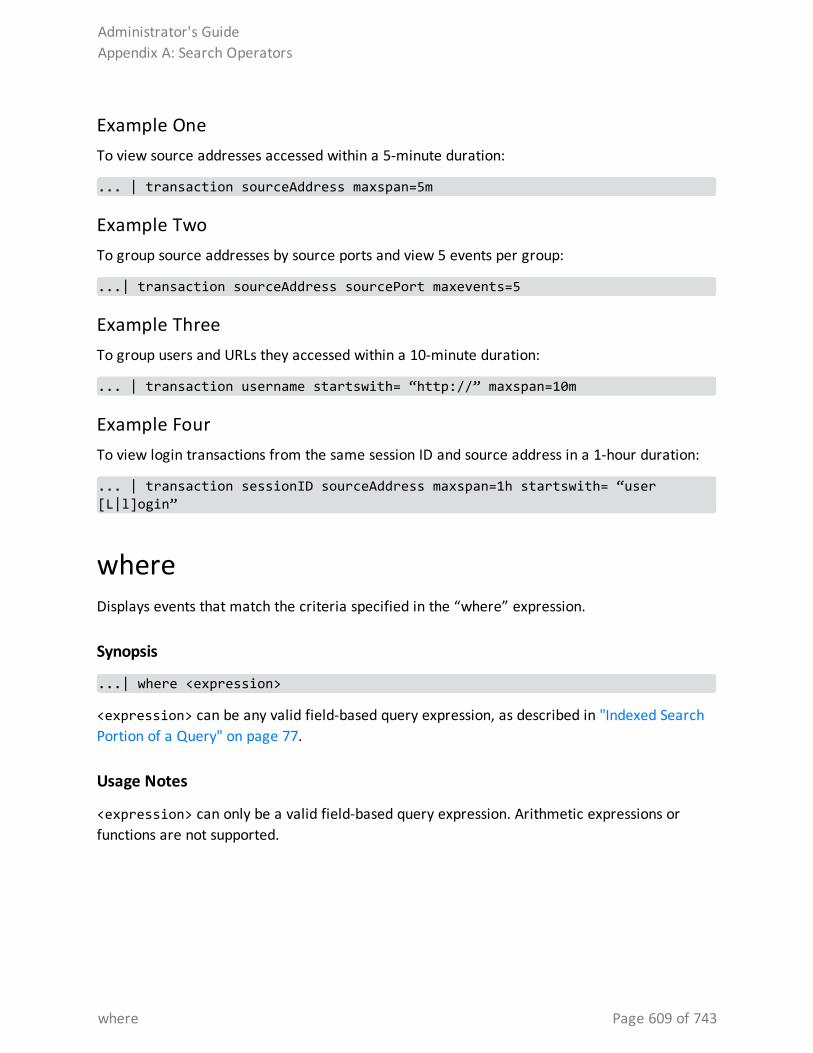
Example OneTo view source addresses accessed within a 5-minute duration:
... | transaction sourceAddress maxspan=5m
Example TwoTo group source addresses by source ports and view 5 events per group:
...| transaction sourceAddress sourcePort maxevents=5
Example ThreeTo group users and URLs they accessed within a 10-minute duration:
... | transaction username startswith= “http://” maxspan=10m
Example FourTo view login transactions from the same session ID and source address in a 1-hour duration:
... | transaction sessionID sourceAddress maxspan=1h startswith= “user [L|l]ogin”
whereDisplays events that match the criteria specified in the “where” expression.
Synopsis
...| where <expression>
<expression> can be any valid field-based query expression, as described in "Indexed Search Portion of a Query" on page 77.
Usage Notes
<expression> can only be a valid field-based query expression. Arithmetic expressions or functions are not supported.
Administrator's GuideAppendix A: Search Operators
where Page 609 of 743

Examples
... | where eventId is NULL
... | where eventId=10006093313 OR deviceVersion CONTAINS “4.0.6.4924.1”
... | where eventId >=10005985569 OR categories= “/Agent/Started”
Administrator's GuideAppendix A: Search Operators
where Page 610 of 743
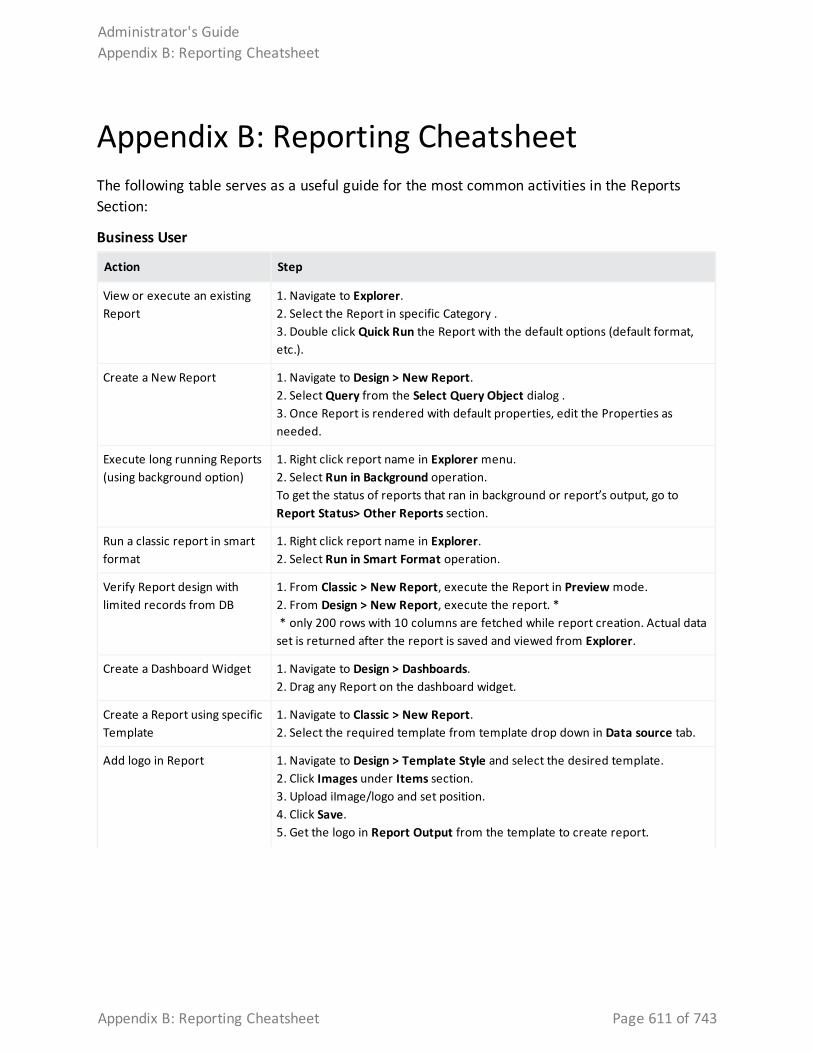
Appendix B: Reporting CheatsheetThe following table serves as a useful guide for the most common activities in the Reports Section:
Action Step
View or execute an existing Report
1. Navigate to Explorer. 2. Select the Report in specific Category .3. Double click Quick Run the Report with the default options (default format, etc.).
Create a New Report 1. Navigate to Design > New Report. 2. Select Query from the Select Query Object dialog .3. Once Report is rendered with default properties, edit the Properties as needed.
Execute long running Reports (using background option)
1. Right click report name in Explorer menu.2. Select Run in Background operation. To get the status of reports that ran in background or report’s output, go to Report Status> Other Reports section.
Run a classic report in smart format
1. Right click report name in Explorer.2. Select Run in Smart Format operation.
Verify Report design with limited records from DB
1. From Classic > New Report, execute the Report in Preview mode. 2. From Design > New Report, execute the report. * * only 200 rows with 10 columns are fetched while report creation. Actual data set is returned after the report is saved and viewed from Explorer.
Create a Dashboard Widget 1. Navigate to Design > Dashboards.2. Drag any Report on the dashboard widget.
Create a Report using specific Template
1. Navigate to Classic > New Report. 2. Select the required template from template drop down in Data source tab.
Add logo in Report 1. Navigate to Design > Template Style and select the desired template. 2. Click Images under Items section.3. Upload iImage/logo and set position.4. Click Save. 5. Get the logo in Report Output from the template to create report.
Business User
Administrator's GuideAppendix B: Reporting Cheatsheet
Appendix B: Reporting Cheatsheet Page 611 of 743
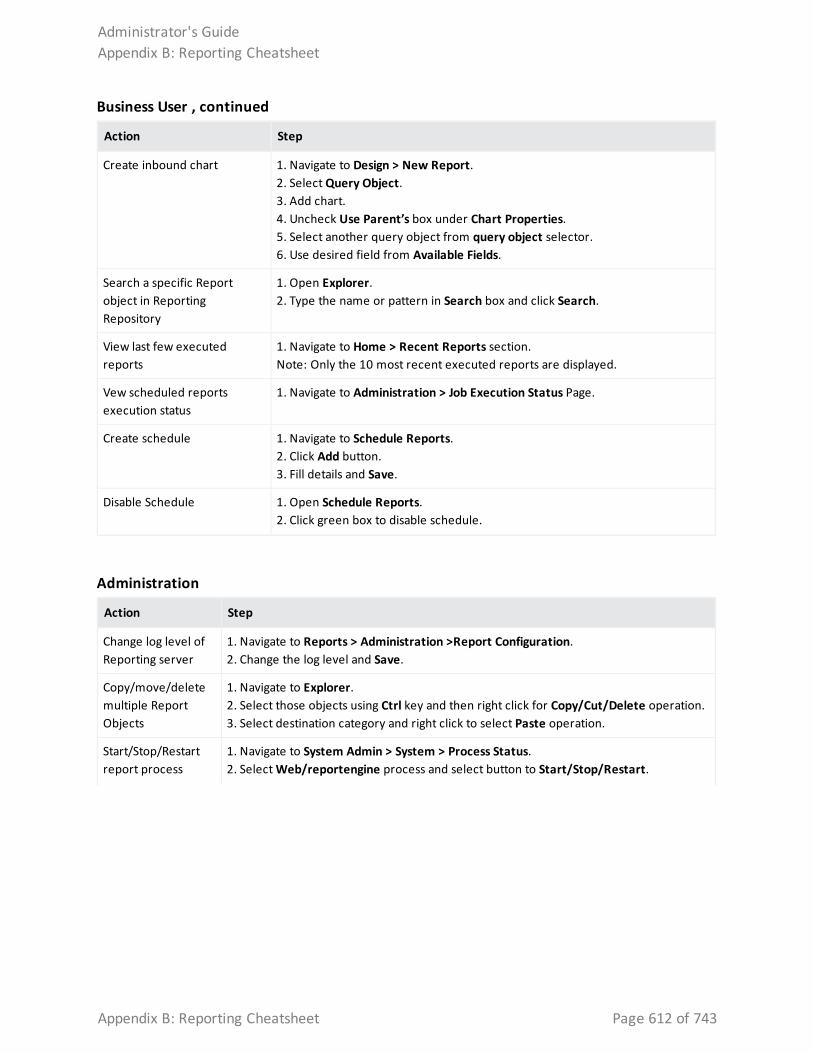
Action Step
Create inbound chart 1. Navigate to Design > New Report.2. Select Query Object. 3. Add chart. 4. Uncheck Use Parent’s box under Chart Properties. 5. Select another query object from query object selector. 6. Use desired field from Available Fields.
Search a specific Report object in Reporting Repository
1. Open Explorer. 2. Type the name or pattern in Search box and click Search.
View last few executed reports
1. Navigate to Home > Recent Reports section.Note: Only the 10 most recent executed reports are displayed.
Vew scheduled reports execution status
1. Navigate to Administration > Job Execution Status Page.
Create schedule 1. Navigate to Schedule Reports. 2. Click Add button. 3. Fill details and Save.
Disable Schedule 1. Open Schedule Reports. 2. Click green box to disable schedule.
Business User , continued
Action Step
Change log level of Reporting server
1. Navigate to Reports > Administration >Report Configuration. 2. Change the log level and Save.
Copy/move/delete multiple Report Objects
1. Navigate to Explorer. 2. Select those objects using Ctrl key and then right click for Copy/Cut/Delete operation. 3. Select destination category and right click to select Paste operation.
Start/Stop/Restart report process
1. Navigate to System Admin > System > Process Status. 2. Select Web/reportengine process and select button to Start/Stop/Restart.
Administration
Administrator's GuideAppendix B: Reporting Cheatsheet
Appendix B: Reporting Cheatsheet Page 612 of 743
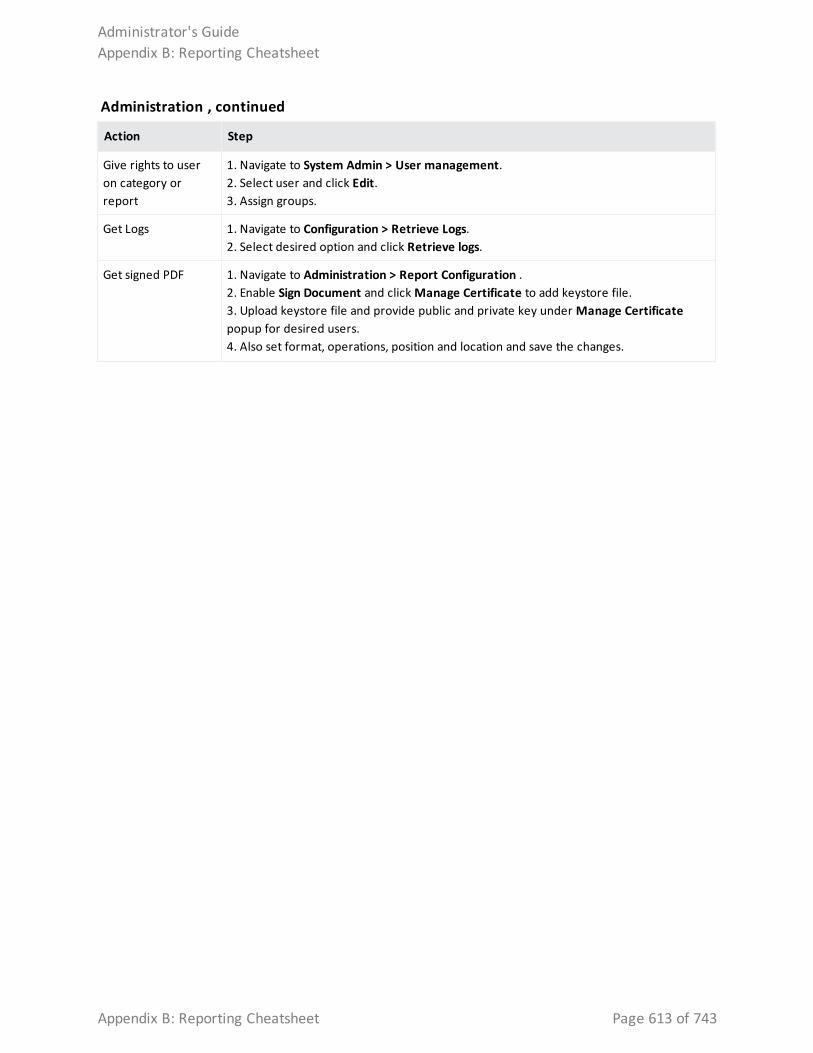
Action Step
Give rights to user on category or report
1. Navigate to System Admin > User management. 2. Select user and click Edit. 3. Assign groups.
Get Logs 1. Navigate to Configuration > Retrieve Logs. 2. Select desired option and click Retrieve logs.
Get signed PDF 1. Navigate to Administration > Report Configuration .2. Enable Sign Document and click Manage Certificate to add keystore file. 3. Upload keystore file and provide public and private key under Manage Certificate popup for desired users. 4. Also set format, operations, position and location and save the changes.
Administration , continued
Administrator's GuideAppendix B: Reporting Cheatsheet
Appendix B: Reporting Cheatsheet Page 613 of 743
Appendix C: Using SmartConnectors to Collect EventsSimilar to ArcSight Manager, Logger uses the ArcSight SmartConnectors to collect events. SmartConnectors can read security events from many different types of devices on a network (such as firewalls and servers) and filter events of interest (and optionally aggregate them) and send them to a Logger receiver. Logger can receive structured data in the form of normalized Common Event Format (CEF) events from the SmartConnectors.
Note: To receive events containing IPv6 data, you must use SmartConnector version 7.5.0 or later.
The following topics give basic information. For details on a specific connector, refer to the configuration guide for that connector.
SmartMessageSmartMessage is an ArcSight technology that provides an efficient secure channel for Common Event Format (CEF) events between ArcSight SmartConnectors and Logger.
SmartMessage provides an end-to-end encrypted secure channel using secure sockets layer (SSL). One end is an ArcSight SmartConnector, receiving events from the many supported devices. The other end is a SmartMessage receiver on Logger.
Note: The SmartMessage secure channel uses SSL protocol to send encrypted events to Logger. This is similar to, but different from, the encrypted binary protocol used between SmartConnectors and ArcSight Manager.
Configuring a SmartConnector to Send Events to LoggerLogger comes pre-configured with a SmartMessage receiver. To use it to receive events from a SmartConnector, you must configure the SmartConnector as described below. You can also create new SmartMessage receivers and configure the SmartConnectors with these newly created receivers. When configuring a SmartConnector, be sure to specify the correct receiver name.
Appendix C: Using SmartConnectors to Collect Events Page 614 of 743
To configure a SmartConnector to send events to Logger:
1. Install the SmartConnector component using the SmartConnector Configuration Guide for the supported device as a reference. Specify Logger as the destination instead of ArcSight Manager or a CEF file.
2. Specify the required destination parameters. Enter the Logger hostname or IP address and the name of the SmartMessage receiver. These settings must match the receiver in Logger that listen for events from this connector.
l To use the preconfigured receiver, specify SmartMessage Receiver as the Receiver Name.
l To use SmartMessage to communicate between an ArcSight SmartConnector and a Logger Appliance, configure the SmartConnector to use port 443.
l To communicate between an ArcSight SmartConnector and Software Logger, configure the SmartConnector to use the port configured for the Software Logger.
l For unencrypted CEF syslog, enter the Logger hostname or IP address, the desired port, and choose UDP or TCP output.
Configuring SmartConnectors to Send Events to Both Logger and an ArcSight ManagerYou can configure a SmartConnector to send CEF syslog output to Logger and send events to an ArcSight Manager at the same time.
1. Install the SmartConnector normally. Register the SmartConnector with a running ArcSight Manager and test that the SmartConnector is up and running.
2. Start the SmartConnector configuration program again using the $ARCSIGHT_HOME/current/bin/runagentsetup script, where $ARCSIGHT_HOME refers to the SmartConnector installation directory.
3. Select Modify Connector, click Next, then select Add, modify, or remove destinations. Click Next. Select Add destination.
4. Choose Logger and specify the requested parameters. Restart the SmartConnector for changes to take effect.
Administrator's GuideAppendix C: Using SmartConnectors to Collect Events
Configuring SmartConnectors to Send Events to Both Logger and an ArcSight Page 615 of 743
Configuring SmartConnectors for Failover DestinationsSmartConnectors can be configured to send events to a secondary, failover, destination when a primary connection fails.
To configure a failover destination, follow these steps:
1. Configure the SmartConnector for the primary Logger as described above. The transport must be raw TCP in order to detect the transmission errors that trigger failover.
2. Edit the agent.properties file in the directory $ARCSIGHT_HOME/current/user/agent, where $ARCSIGHT_HOME is the root directory where the SmartConnector component was installed.
Add this property: transport.types=http,file,cefsyslog
Delete this property: transport.default.type.
3. Start the SmartConnector configuration program again using the $ARCSIGHT_HOME/current/bin/runagentsetup script.
4. Select Modify Connector, click Next, then select Add, modify, or remove destinations. Make sure the Logger destination is selected and click Next.
5. Enter information for the secondary Logger.
6. Restart the SmartConnector for the changes to take effect.
7. For more information about installing and configuring ArcSight SmartConnectors, refer to the ArcSight SmartConnector User's Guide, or specific SmartConnector Configuration Guides, available from the Micro Focus Security Community.
Sending Events from ArcSight ESM to LoggerThe ArcSight Forwarding Connector can read events from an ArcSight Manager and forward them to Logger as CEF-formatted syslog messages.
Note: The Forwarding Connector is a separate installable file, named similar to this:
ArcSight-4.x.x.<build>.x-SuperConnector-<platform>.exe
Use build 4810 or later for compatibility with Logger.
Administrator's GuideAppendix C: Using SmartConnectors to Collect Events
Configuring SmartConnectors for Failover Destinations Page 616 of 743
To configure the ArcSight Forwarding Connector to send events to Logger:
1. Install the SmartConnector component normally, through “Install Core Software” as described in the Forwarding Connector configuration guide. Exit the wizard at this point.
2. Create a file called agent.properties in the directory $ARCSIGHT_HOME/current/user/agent, where $ARCSIGHT_HOME is the root directory where the SmartConnector component was installed. This file should contain a single line:
transport.default.type=cefsyslog
3. Start the SmartConnector configuration program again using the $ARCSIGHT_HOME/current/bin/runagentsetup script.
4. Specify the required parameters for CEF output. Enter the desired port for UDP or TCP output.
Tip: These settings will need to match the receiver you create in Logger to listen for events from ArcSight ESM.
Parameter Description
Ip/Host IP or host name of the Logger
Port 514 or another port that matches the receiver
Protocol UDP or Raw TCP
ArcSight Source Manager Host Name
IP or host name of the source ArcSight Manager
ArcSight Source Manager Port 8443 (default)
ArcSight Source Manager User Name
A user account on the source Manager with sufficient privileges to read events
ArcSight Source Manager Password
Password for the specified Manager user account
SmartConnector Name A name for the ESM to Logger connector (visible in the Manager)
SmartConnector Location Notation of where this connector is installed
Device Location Notation of where the source Manager is installed
Comment Optional comments
To configure the Forwarding Connector to send CEF output to Logger and send events to another ArcSight Manager at the same time, see "Configuring SmartConnectors to Send Events to Both Logger and an ArcSight Manager" on page 615.
Administrator's GuideAppendix C: Using SmartConnectors to Collect Events
Sending Events from ArcSight ESM to Logger Page 617 of 743
Appendix D: Using the Rex OperatorThe rex operator is a powerful operator that enables you to extract information that matches a specified regular expression and assigns it to a field, whose field name you specify. You can also specify an optional start point and an end point in the rex expression between which the information matching the regular expression is searched.
When a rex expression is included in a search query, it must be preceded by a basic search query that finds events from which the rex expression will extract information. For example: failed | rex “(?<srcip>[^ ]\d{1,3}\.\d{1,3}\.\d{1,3}\.\d{1,3})”
The following topics describe the rex search operator in detail.
Syntax of the rex Operator| rex “text1(?<field1>text2regex)”
Where:
l text1: The text or point in the event AFTER which information extraction begins. The default is the beginning of the event.
l text2: The text or point in the event at which information extraction ends.
l field1: The name of the field to which the extracted information is assigned.
l regex: The pattern (regular expression) used for matching information to be extracted between text1 and text2.
Tip: If you are an experienced regular expression user, see the Note in the next section for a quick understanding of how rex enables you to capture named input and reference it for further processing.
Understanding the rex Operator SyntaxExtract all information after text1 and until text2 that matches the specified regex (regular expression) and assign to field1.
l text1 and [text2] can be any points in an event—start and end of an event, specific string in an event (even if the string is in the middle of a word in the event), a specific number of characters from the start or end of an event, or a pattern.
l To specify the next space in the event as text2, enter [^ ].
This is interpreted as “not space.” Therefore, entering a “not” results in the capture to stop at the point where the specified character, in this case, a space, is found in the event.
Appendix D: Using the Rex Operator Page 618 of 743
l To specify [text2] to be the end of the line, enter [^$].
This is interpreted as "not end of line." Therefore, when an end-of-line in an event is encountered, the capture will stop at that point. The [^$] usage only captures one character if it is not an end-of-line character. However, by specifying [^$]* in a rex expression, the usage captures all characters until end-of-line.
You can also specify .* to capture all characters in an event instead of [^$]. Examples in this document, however, use [^$].
l Any extra spaces within the double quotes of the rex expression are treated literally.
l The characters that need to be escaped for rex expressions are the same as the ones for regular expressions. Refer to a regular expressions document of your choice to obtain a complete list of such characters.
l Information captured by a rex expression can be used for further processing in a subsequent rex expression as illustrated in the following example in which an IP address is captured by the first rex expression and the network ID (assuming the first three bytes of the IP address represent it) to which the IP address belongs is extracted from the captured IP address:
logger | rex "(?<srcip>[^ ]\d{1,3}\.\d{1,3}\.\d{1,3}\.\d{1,3})" | rex field=srcip "(?<netid>\d{1,3}\.\d{1,3}\.\d{1,3})"
Note: If you are an experienced regular expression user, you can interpret the rex expression syntax as follows:
rex "(?<field1>regex)"
where the entire expression in the parentheses specifies a named capture. That is, the captured group is assigned a name, which can be referenced later for further processing. For example, in the following expression “srcip” is the name assigned to the capture.
failed | rex "(?<srcip>[^ ]\d{1,3}\.\d{1,3}\.\d{1,3}\.\d{1,3})"
Once named, use “srcip” for further processing as follows:
failed | rex "(?<srcip>[^ ]\d{1,3}\.\d{1,3}\.\d{1,3}\.\d{1,3})" | top srcip
Ways to Create a rex ExpressionYou can create a rex expression in two ways:
l Manually: Follow the syntax and guidelines described in this appendix to create a rex expression to suit your needs.
l Regex Helper: Use the Regex Helper tool, as described in " Regex Helper Tool" on page 101. This tool not only simplifies the process, it also makes it less error prone and more efficient.
Administrator's GuideAppendix D: Using the Rex Operator
Ways to Create a rex Expression Page 619 of 743
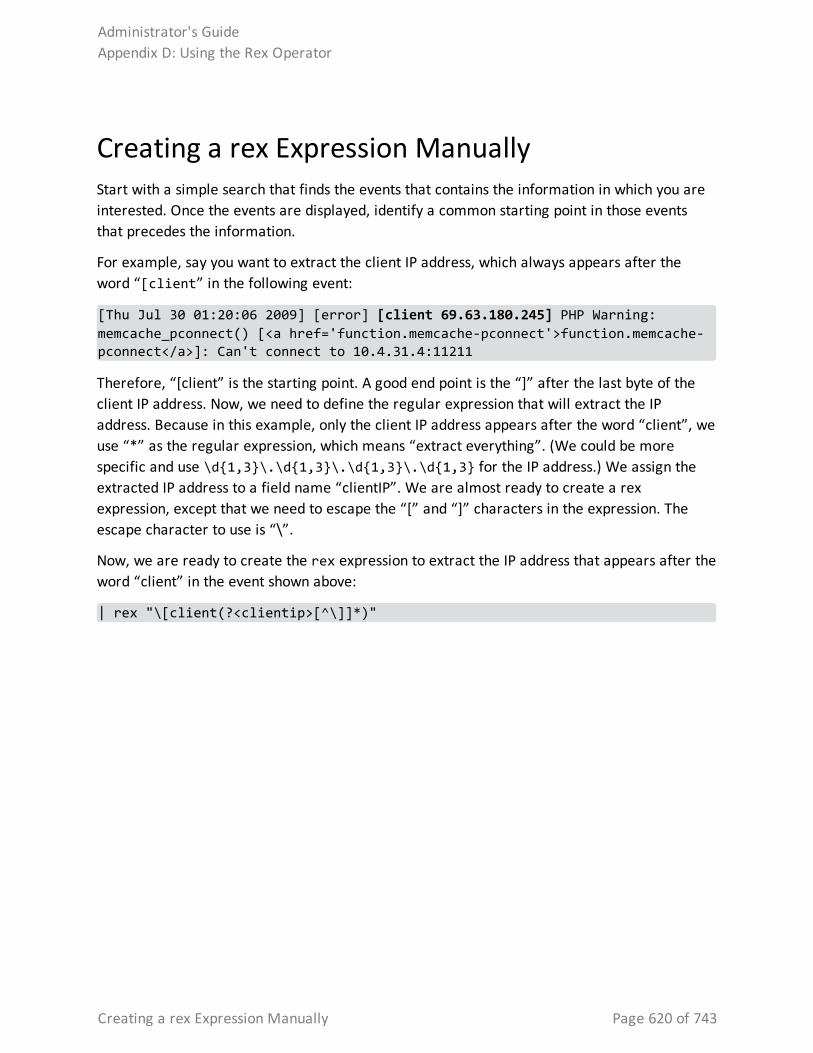
Creating a rex Expression ManuallyStart with a simple search that finds the events that contains the information in which you are interested. Once the events are displayed, identify a common starting point in those events that precedes the information.
For example, say you want to extract the client IP address, which always appears after the word “[client” in the following event:
[Thu Jul 30 01:20:06 2009] [error] [client 69.63.180.245] PHP Warning: memcache_pconnect() [<a href='function.memcache-pconnect'>function.memcache-pconnect</a>]: Can't connect to 10.4.31.4:11211
Therefore, “[client” is the starting point. A good end point is the “]” after the last byte of the client IP address. Now, we need to define the regular expression that will extract the IP address. Because in this example, only the client IP address appears after the word “client”, we use “*” as the regular expression, which means “extract everything”. (We could be more specific and use \d{1,3}\.\d{1,3}\.\d{1,3}\.\d{1,3} for the IP address.) We assign the extracted IP address to a field name “clientIP”. We are almost ready to create a rex expression, except that we need to escape the “[” and “]” characters in the expression. The escape character to use is “\”.
Now, we are ready to create the rex expression to extract the IP address that appears after the word “client” in the event shown above:
| rex "\[client(?<clientip>[^\]]*)"
Administrator's GuideAppendix D: Using the Rex Operator
Creating a rex Expression Manually Page 620 of 743
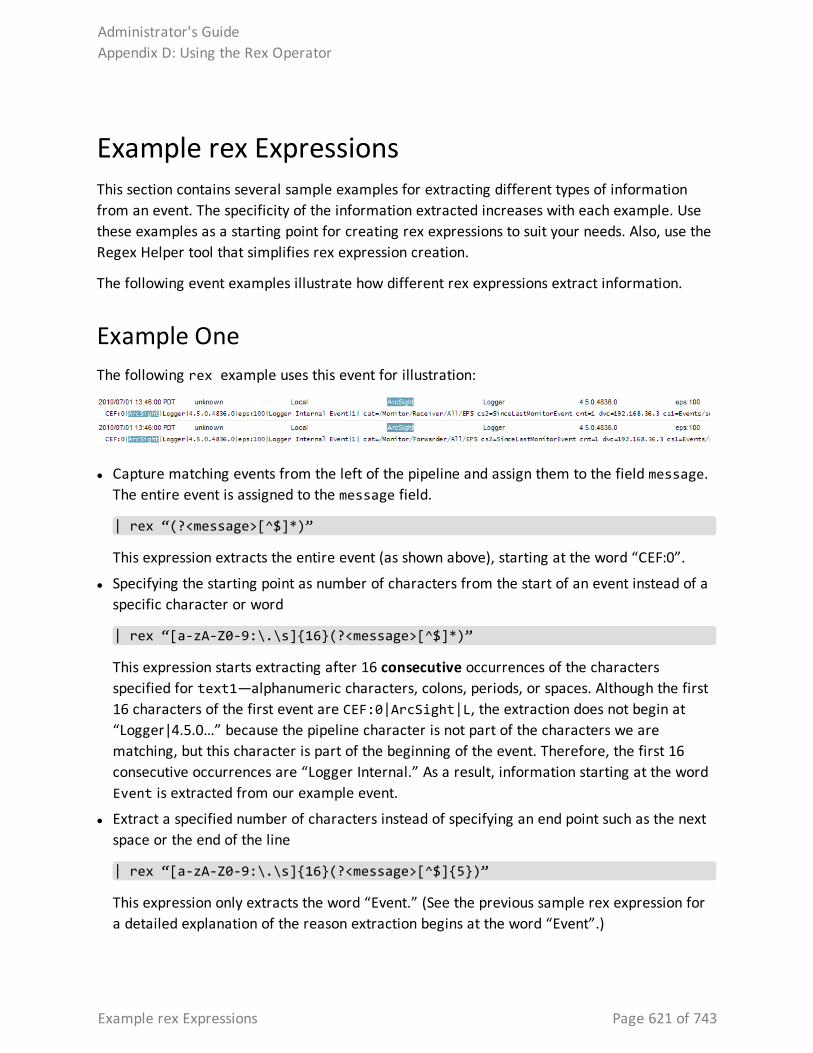
Example rex ExpressionsThis section contains several sample examples for extracting different types of information from an event. The specificity of the information extracted increases with each example. Use these examples as a starting point for creating rex expressions to suit your needs. Also, use the Regex Helper tool that simplifies rex expression creation.
The following event examples illustrate how different rex expressions extract information.
Example OneThe following rex example uses this event for illustration:
l Capture matching events from the left of the pipeline and assign them to the field message. The entire event is assigned to the message field.
| rex “(?<message>[^$]*)”
This expression extracts the entire event (as shown above), starting at the word “CEF:0”.
l Specifying the starting point as number of characters from the start of an event instead of a specific character or word
| rex “[a-zA-Z0-9:\.\s]{16}(?<message>[^$]*)”
This expression starts extracting after 16 consecutive occurrences of the characters specified for text1—alphanumeric characters, colons, periods, or spaces. Although the first 16 characters of the first event are CEF:0|ArcSight|L, the extraction does not begin at “Logger|4.5.0…” because the pipeline character is not part of the characters we are matching, but this character is part of the beginning of the event. Therefore, the first 16 consecutive occurrences are “Logger Internal.” As a result, information starting at the word Event is extracted from our example event.
l Extract a specified number of characters instead of specifying an end point such as the next space or the end of the line
| rex “[a-zA-Z0-9:\.\s]{16}(?<message>[^$]{5})”
This expression only extracts the word “Event.” (See the previous sample rex expression for a detailed explanation of the reason extraction begins at the word “Event”.)
Administrator's GuideAppendix D: Using the Rex Operator
Example rex Expressions Page 621 of 743
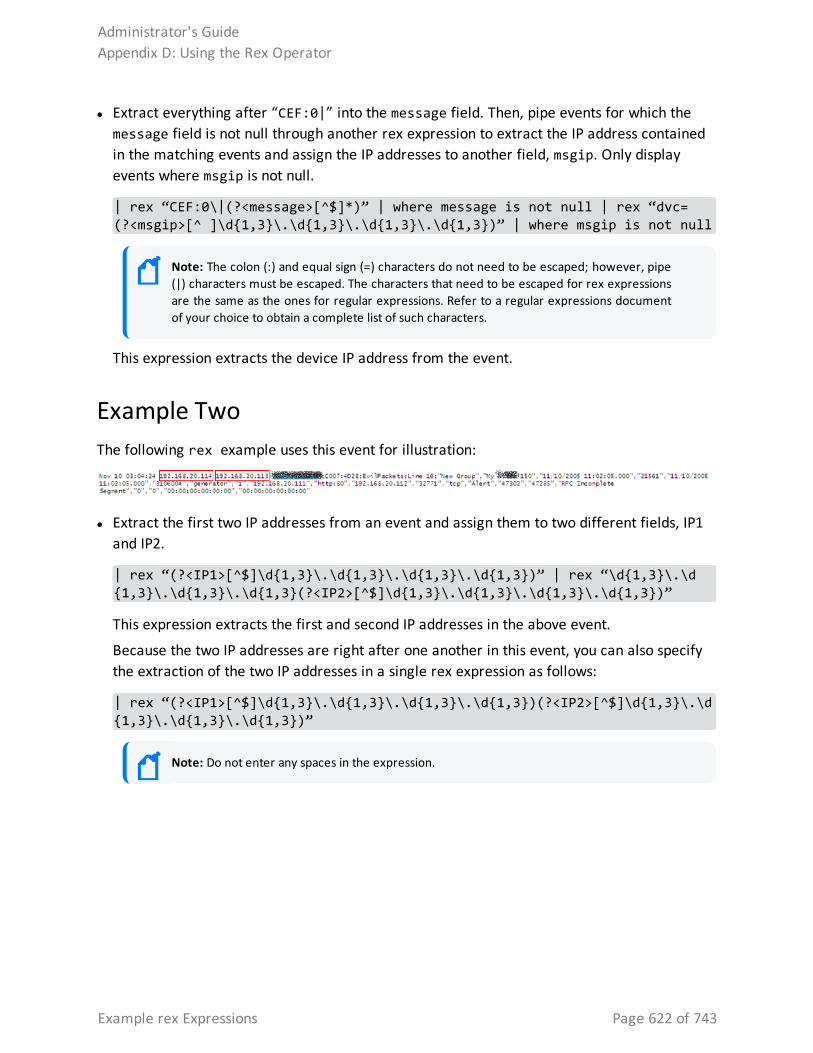
l Extract everything after “CEF:0|” into the message field. Then, pipe events for which the message field is not null through another rex expression to extract the IP address contained in the matching events and assign the IP addresses to another field, msgip. Only display events where msgip is not null.
| rex “CEF:0\|(?<message>[^$]*)” | where message is not null | rex “dvc=(?<msgip>[^ ]\d{1,3}\.\d{1,3}\.\d{1,3}\.\d{1,3})” | where msgip is not null
Note: The colon (:) and equal sign (=) characters do not need to be escaped; however, pipe (|) characters must be escaped. The characters that need to be escaped for rex expressions are the same as the ones for regular expressions. Refer to a regular expressions document of your choice to obtain a complete list of such characters.
This expression extracts the device IP address from the event.
Example TwoThe following rex example uses this event for illustration:
l Extract the first two IP addresses from an event and assign them to two different fields, IP1 and IP2.
| rex “(?<IP1>[^$]\d{1,3}\.\d{1,3}\.\d{1,3}\.\d{1,3})” | rex “\d{1,3}\.\d{1,3}\.\d{1,3}\.\d{1,3}(?<IP2>[^$]\d{1,3}\.\d{1,3}\.\d{1,3}\.\d{1,3})”
This expression extracts the first and second IP addresses in the above event.
Because the two IP addresses are right after one another in this event, you can also specify the extraction of the two IP addresses in a single rex expression as follows:
| rex “(?<IP1>[^$]\d{1,3}\.\d{1,3}\.\d{1,3}\.\d{1,3})(?<IP2>[^$]\d{1,3}\.\d{1,3}\.\d{1,3}\.\d{1,3})”
Note: Do not enter any spaces in the expression.
Administrator's GuideAppendix D: Using the Rex Operator
Example rex Expressions Page 622 of 743
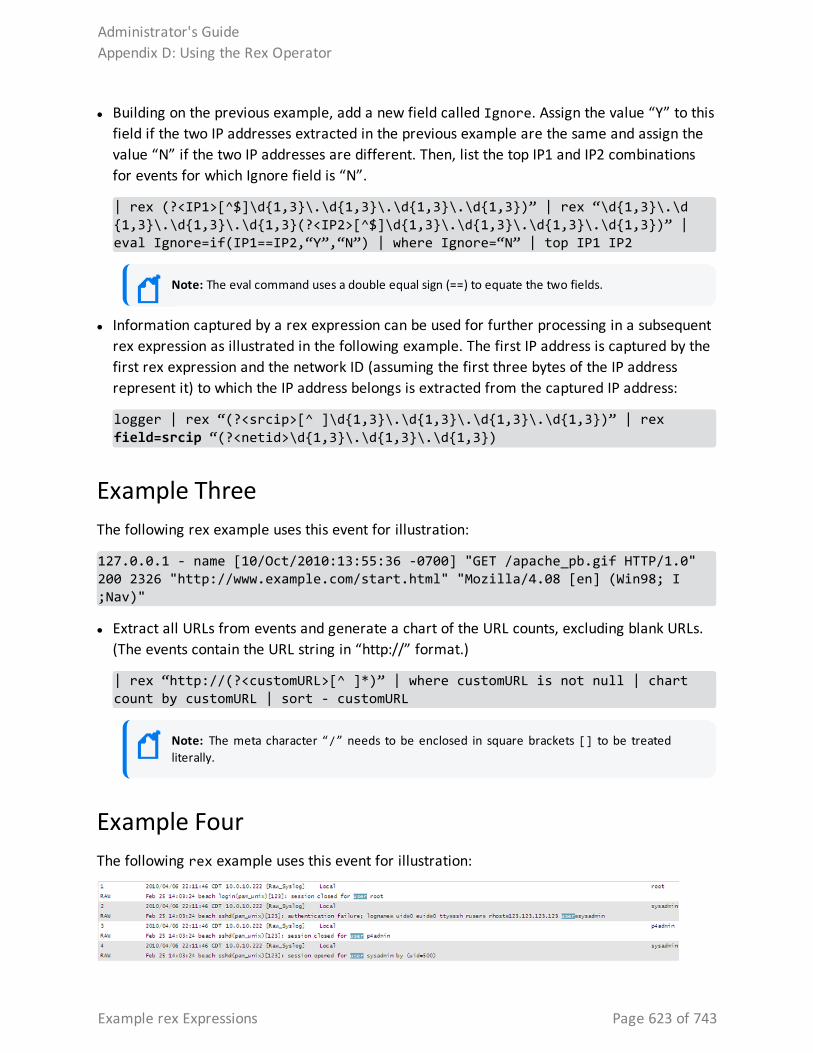
l Building on the previous example, add a new field called Ignore. Assign the value “Y” to this field if the two IP addresses extracted in the previous example are the same and assign the value “N” if the two IP addresses are different. Then, list the top IP1 and IP2 combinations for events for which Ignore field is “N”.
| rex (?<IP1>[^$]\d{1,3}\.\d{1,3}\.\d{1,3}\.\d{1,3})” | rex “\d{1,3}\.\d{1,3}\.\d{1,3}\.\d{1,3}(?<IP2>[^$]\d{1,3}\.\d{1,3}\.\d{1,3}\.\d{1,3})” | eval Ignore=if(IP1==IP2,“Y”,“N”) | where Ignore=“N” | top IP1 IP2
Note: The eval command uses a double equal sign (==) to equate the two fields.
l Information captured by a rex expression can be used for further processing in a subsequent rex expression as illustrated in the following example. The first IP address is captured by the first rex expression and the network ID (assuming the first three bytes of the IP address represent it) to which the IP address belongs is extracted from the captured IP address:
logger | rex “(?<srcip>[^ ]\d{1,3}\.\d{1,3}\.\d{1,3}\.\d{1,3})” | rex field=srcip “(?<netid>\d{1,3}\.\d{1,3}\.\d{1,3})
Example ThreeThe following rex example uses this event for illustration:
127.0.0.1 - name [10/Oct/2010:13:55:36 -0700] "GET /apache_pb.gif HTTP/1.0" 200 2326 "http://www.example.com/start.html" "Mozilla/4.08 [en] (Win98; I ;Nav)"
l Extract all URLs from events and generate a chart of the URL counts, excluding blank URLs. (The events contain the URL string in “http://” format.)
| rex “http://(?<customURL>[^ ]*)” | where customURL is not null | chart count by customURL | sort - customURL
Note: The meta character “/” needs to be enclosed in square brackets [] to be treated literally.
Example FourThe following rex example uses this event for illustration:
Administrator's GuideAppendix D: Using the Rex Operator
Example rex Expressions Page 623 of 743
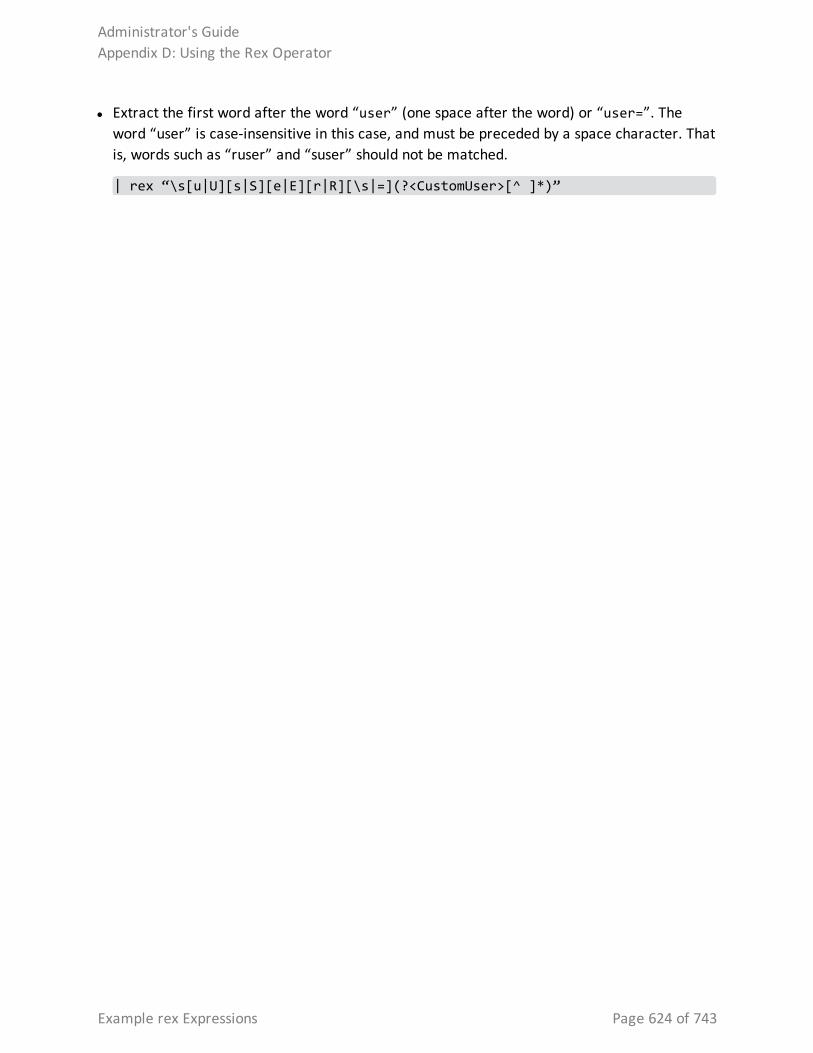
l Extract the first word after the word “user” (one space after the word) or “user=”. The word “user” is case-insensitive in this case, and must be preceded by a space character. That is, words such as “ruser” and “suser” should not be matched.
| rex “\s[u|U][s|S][e|E][r|R][\s|=](?<CustomUser>[^ ]*)”
Administrator's GuideAppendix D: Using the Rex Operator
Example rex Expressions Page 624 of 743
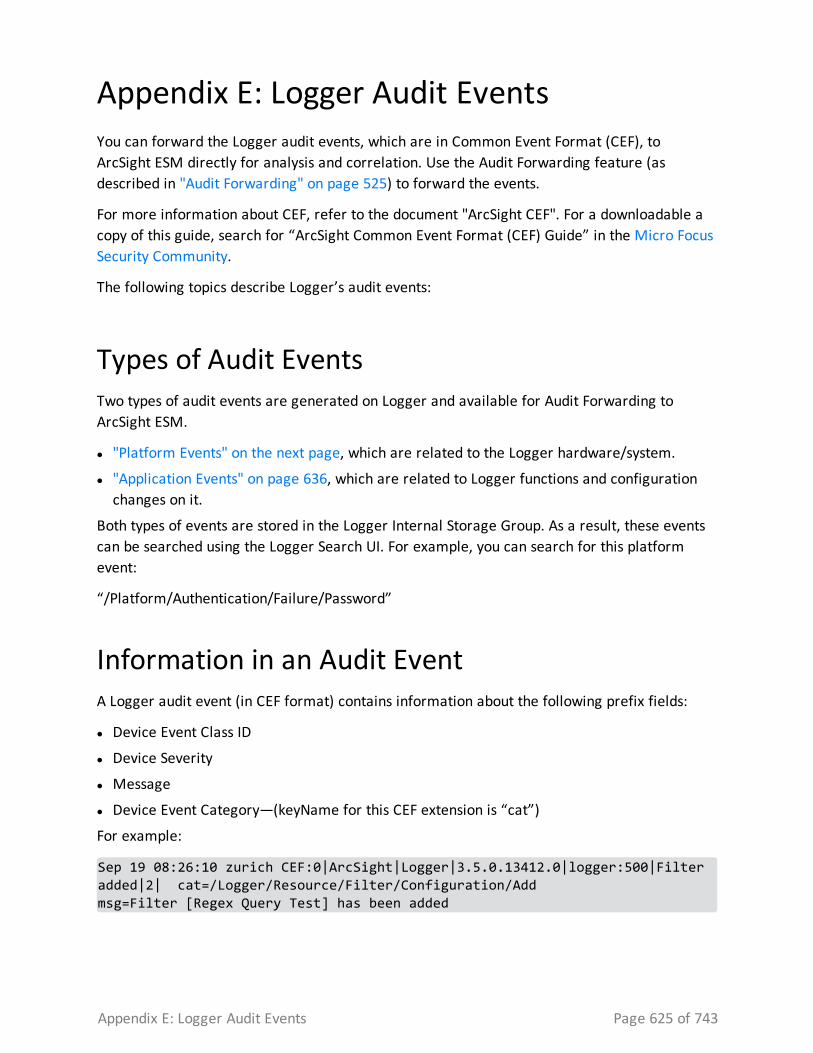
Appendix E: Logger Audit EventsYou can forward the Logger audit events, which are in Common Event Format (CEF), to ArcSight ESM directly for analysis and correlation. Use the Audit Forwarding feature (as described in "Audit Forwarding" on page 525) to forward the events.
For more information about CEF, refer to the document "ArcSight CEF". For a downloadable a copy of this guide, search for “ArcSight Common Event Format (CEF) Guide” in the Micro Focus Security Community.
The following topics describe Logger’s audit events:
Types of Audit EventsTwo types of audit events are generated on Logger and available for Audit Forwarding to ArcSight ESM.
l "Platform Events" on the next page, which are related to the Logger hardware/system.
l "Application Events" on page 636, which are related to Logger functions and configuration changes on it.
Both types of events are stored in the Logger Internal Storage Group. As a result, these events can be searched using the Logger Search UI. For example, you can search for this platform event:
“/Platform/Authentication/Failure/Password”
Information in an Audit EventA Logger audit event (in CEF format) contains information about the following prefix fields:
l Device Event Class ID
l Device Severity
l Message
l Device Event Category—(keyName for this CEF extension is “cat”)
For example:
Sep 19 08:26:10 zurich CEF:0|ArcSight|Logger|3.5.0.13412.0|logger:500|Filter added|2| cat=/Logger/Resource/Filter/Configuration/Addmsg=Filter [Regex Query Test] has been added
Appendix E: Logger Audit Events Page 625 of 743
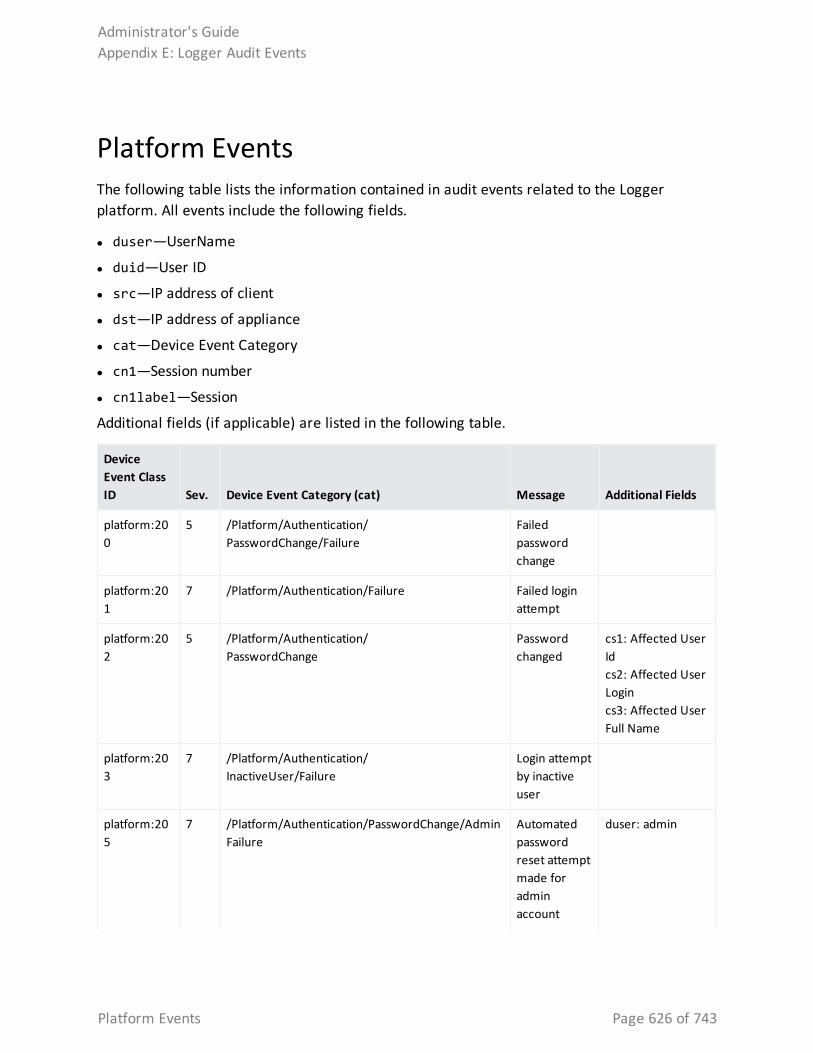
Platform EventsThe following table lists the information contained in audit events related to the Logger platform. All events include the following fields.
l duser—UserName
l duid—User ID
l src—IP address of client
l dst—IP address of appliance
l cat—Device Event Category
l cn1—Session number
l cn1label—Session
Additional fields (if applicable) are listed in the following table.
Device Event Class ID Sev. Device Event Category (cat) Message Additional Fields
platform:200
5 /Platform/Authentication/PasswordChange/Failure
Failed password change
platform:201
7 /Platform/Authentication/Failure Failed login attempt
platform:202
5 /Platform/Authentication/PasswordChange
Password changed
cs1: Affected User Idcs2: Affected User Logincs3: Affected User Full Name
platform:203
7 /Platform/Authentication/InactiveUser/Failure
Login attempt by inactive user
platform:205
7 /Platform/Authentication/PasswordChange/AdminFailure
Automated password reset attempt made for admin account
duser: admin
Administrator's GuideAppendix E: Logger Audit Events
Platform Events Page 626 of 743
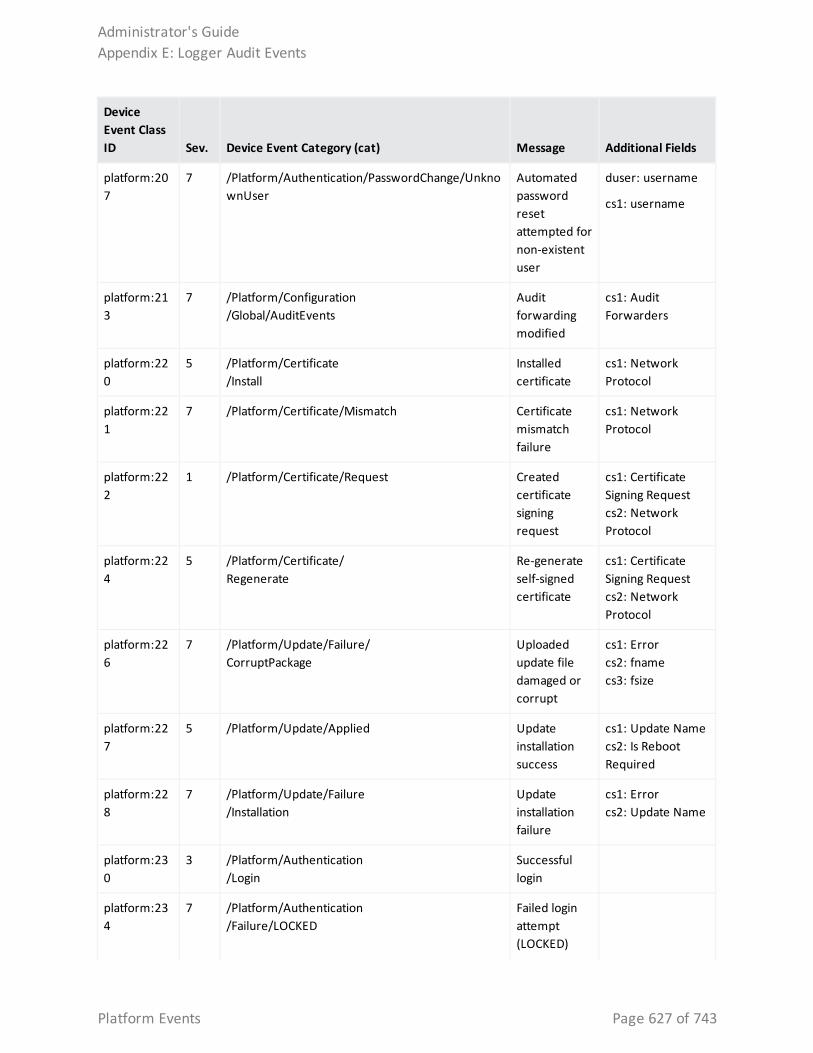
Device Event Class ID Sev. Device Event Category (cat) Message Additional Fields
platform:207
7 /Platform/Authentication/PasswordChange/UnknownUser
Automated password reset attempted for non-existent user
duser: username
cs1: username
platform:213
7 /Platform/Configuration/Global/AuditEvents
Audit forwarding modified
cs1: Audit Forwarders
platform:220
5 /Platform/Certificate/Install
Installed certificate
cs1: Network Protocol
platform:221
7 /Platform/Certificate/Mismatch Certificate mismatch failure
cs1: Network Protocol
platform:222
1 /Platform/Certificate/Request Created certificate signing request
cs1: Certificate Signing Requestcs2: Network Protocol
platform:224
5 /Platform/Certificate/Regenerate
Re-generate self-signed certificate
cs1: Certificate Signing Requestcs2: Network Protocol
platform:226
7 /Platform/Update/Failure/CorruptPackage
Uploaded update file damaged or corrupt
cs1: Errorcs2: fnamecs3: fsize
platform:227
5 /Platform/Update/Applied Update installation success
cs1: Update Namecs2: Is Reboot Required
platform:228
7 /Platform/Update/Failure/Installation
Update installation failure
cs1: Errorcs2: Update Name
platform:230
3 /Platform/Authentication/Login
Successful login
platform:234
7 /Platform/Authentication/Failure/LOCKED
Failed login attempt (LOCKED)
Administrator's GuideAppendix E: Logger Audit Events
Platform Events Page 627 of 743
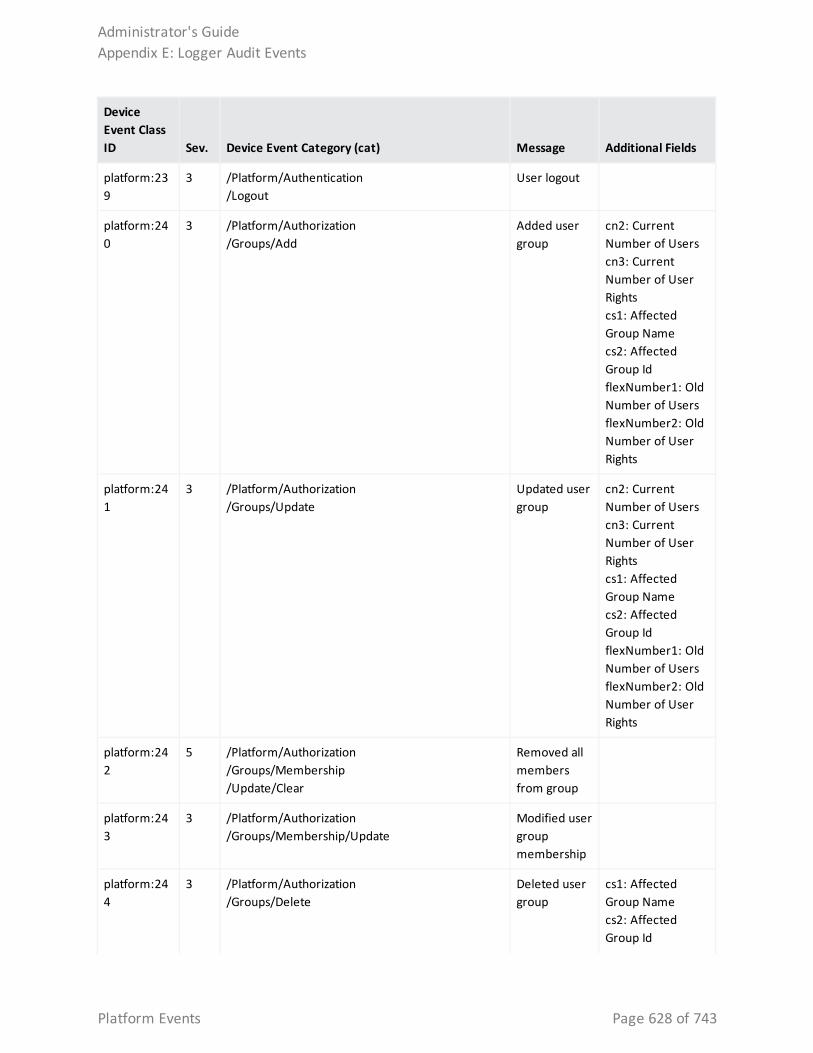
Device Event Class ID Sev. Device Event Category (cat) Message Additional Fields
platform:239
3 /Platform/Authentication/Logout
User logout
platform:240
3 /Platform/Authorization/Groups/Add
Added user group
cn2: Current Number of Userscn3: Current Number of User Rightscs1: Affected Group Namecs2: Affected Group IdflexNumber1: Old Number of UsersflexNumber2: Old Number of User Rights
platform:241
3 /Platform/Authorization/Groups/Update
Updated user group
cn2: Current Number of Userscn3: Current Number of User Rightscs1: Affected Group Namecs2: Affected Group IdflexNumber1: Old Number of UsersflexNumber2: Old Number of User Rights
platform:242
5 /Platform/Authorization/Groups/Membership/Update/Clear
Removed all members from group
platform:243
3 /Platform/Authorization/Groups/Membership/Update
Modified user group membership
platform:244
3 /Platform/Authorization/Groups/Delete
Deleted user group
cs1: Affected Group Namecs2: Affected Group Id
Administrator's GuideAppendix E: Logger Audit Events
Platform Events Page 628 of 743
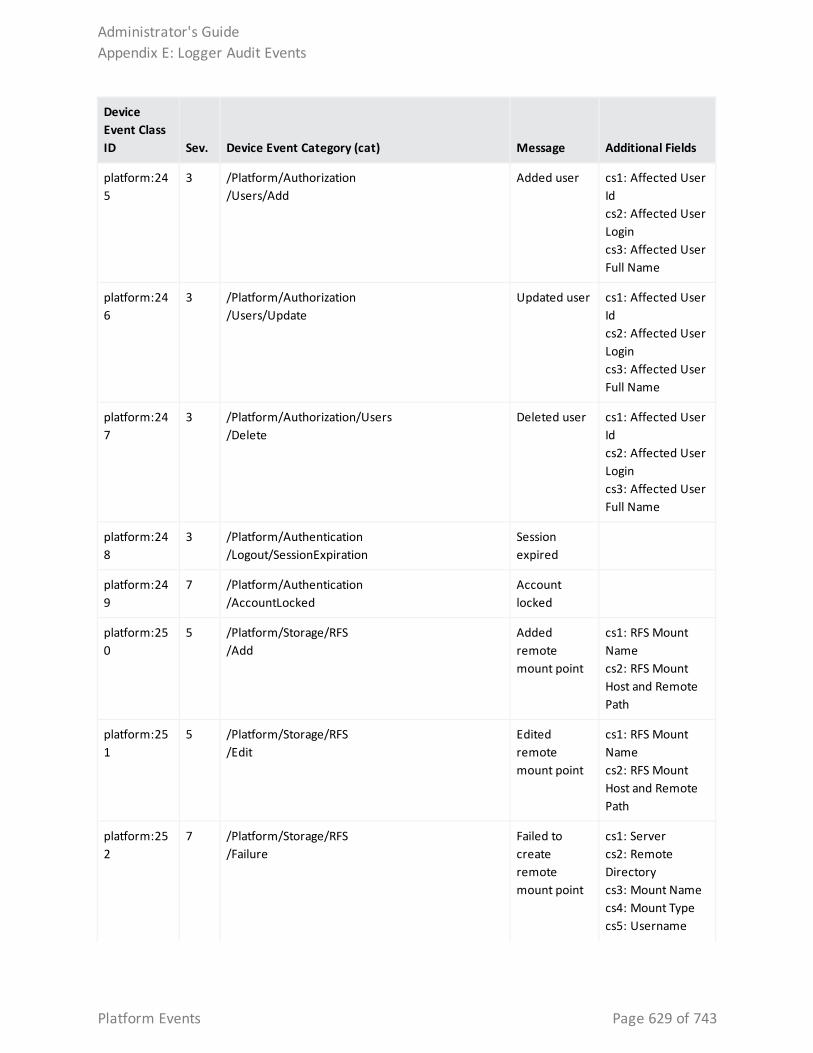
Device Event Class ID Sev. Device Event Category (cat) Message Additional Fields
platform:245
3 /Platform/Authorization/Users/Add
Added user cs1: Affected User Idcs2: Affected User Logincs3: Affected User Full Name
platform:246
3 /Platform/Authorization/Users/Update
Updated user cs1: Affected User Idcs2: Affected User Logincs3: Affected User Full Name
platform:247
3 /Platform/Authorization/Users/Delete
Deleted user cs1: Affected User Idcs2: Affected User Logincs3: Affected User Full Name
platform:248
3 /Platform/Authentication/Logout/SessionExpiration
Session expired
platform:249
7 /Platform/Authentication/AccountLocked
Account locked
platform:250
5 /Platform/Storage/RFS/Add
Added remote mount point
cs1: RFS Mount Namecs2: RFS Mount Host and Remote Path
platform:251
5 /Platform/Storage/RFS/Edit
Edited remote mount point
cs1: RFS Mount Namecs2: RFS Mount Host and Remote Path
platform:252
7 /Platform/Storage/RFS/Failure
Failed to create remote mount point
cs1: Servercs2: Remote Directorycs3: Mount Namecs4: Mount Typecs5: Username
Administrator's GuideAppendix E: Logger Audit Events
Platform Events Page 629 of 743
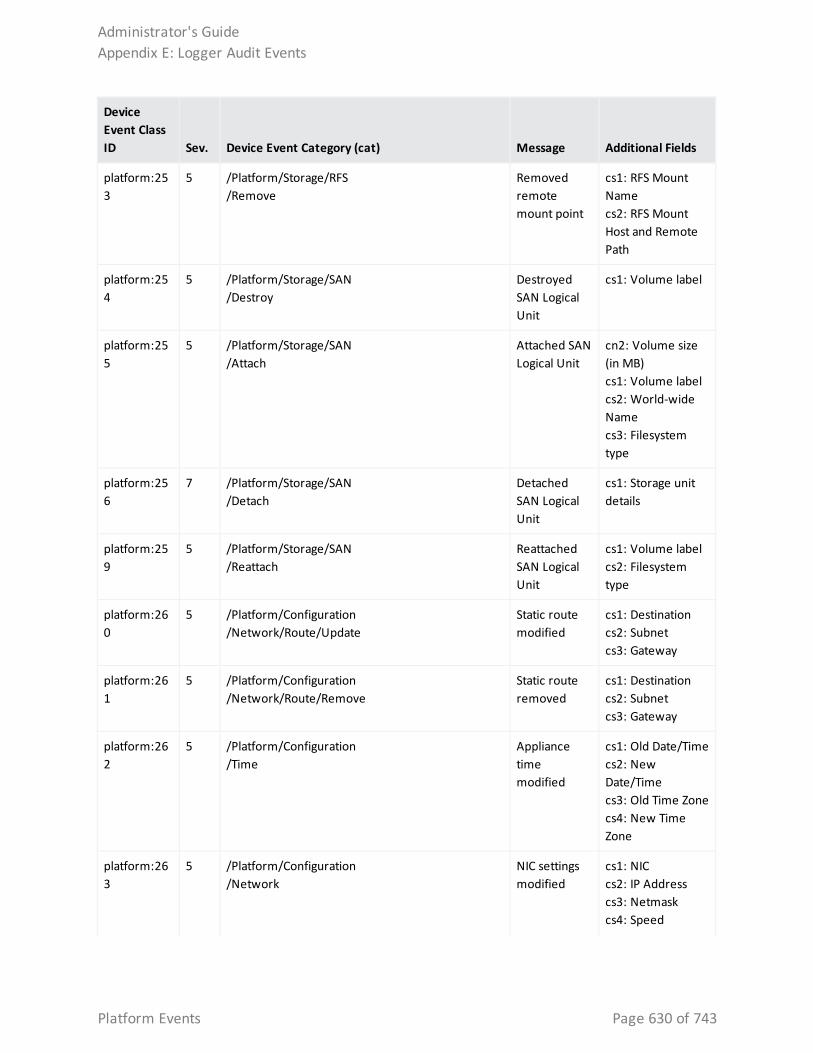
Device Event Class ID Sev. Device Event Category (cat) Message Additional Fields
platform:253
5 /Platform/Storage/RFS/Remove
Removed remote mount point
cs1: RFS Mount Namecs2: RFS Mount Host and Remote Path
platform:254
5 /Platform/Storage/SAN/Destroy
Destroyed SAN Logical Unit
cs1: Volume label
platform:255
5 /Platform/Storage/SAN/Attach
Attached SAN Logical Unit
cn2: Volume size (in MB)cs1: Volume labelcs2: World-wide Namecs3: Filesystem type
platform:256
7 /Platform/Storage/SAN/Detach
Detached SAN Logical Unit
cs1: Storage unit details
platform:259
5 /Platform/Storage/SAN/Reattach
Reattached SAN Logical Unit
cs1: Volume labelcs2: Filesystem type
platform:260
5 /Platform/Configuration/Network/Route/Update
Static route modified
cs1: Destinationcs2: Subnetcs3: Gateway
platform:261
5 /Platform/Configuration/Network/Route/Remove
Static route removed
cs1: Destinationcs2: Subnetcs3: Gateway
platform:262
5 /Platform/Configuration/Time
Appliance time modified
cs1: Old Date/Timecs2: New Date/Timecs3: Old Time Zonecs4: New Time Zone
platform:263
5 /Platform/Configuration/Network
NIC settings modified
cs1: NICcs2: IP Addresscs3: Netmaskcs4: Speed
Administrator's GuideAppendix E: Logger Audit Events
Platform Events Page 630 of 743
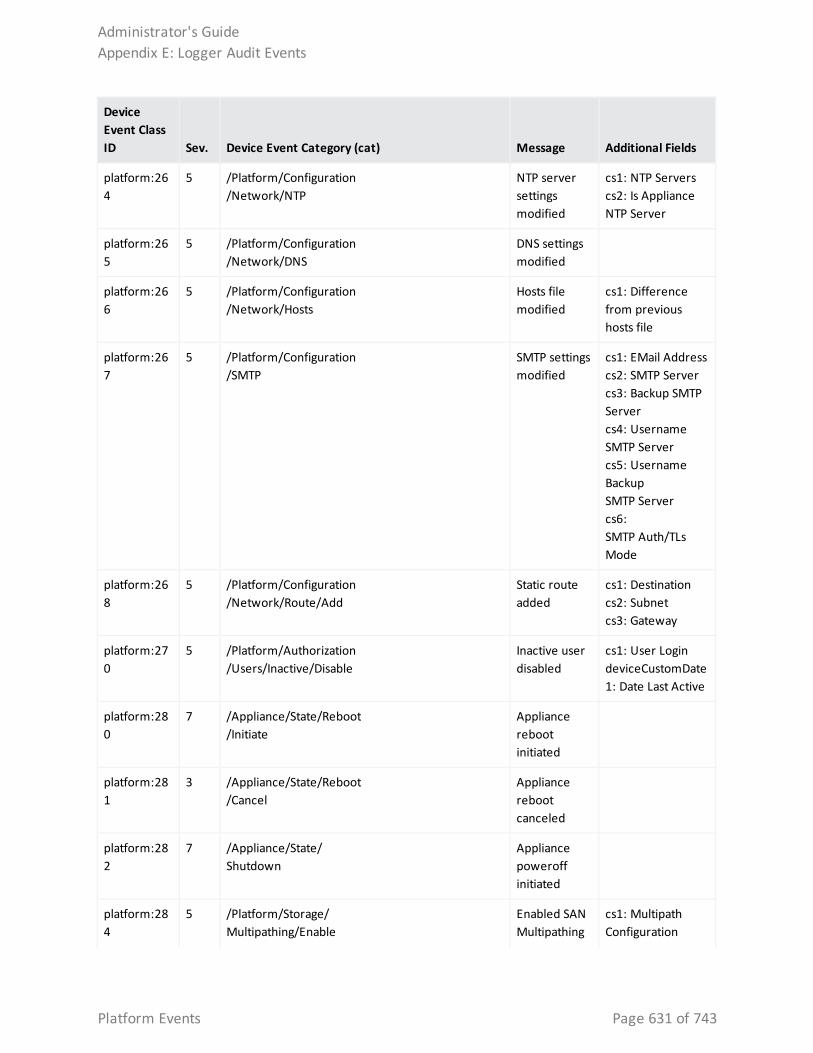
Device Event Class ID Sev. Device Event Category (cat) Message Additional Fields
platform:264
5 /Platform/Configuration/Network/NTP
NTP server settings modified
cs1: NTP Serverscs2: Is Appliance NTP Server
platform:265
5 /Platform/Configuration/Network/DNS
DNS settings modified
platform:266
5 /Platform/Configuration/Network/Hosts
Hosts file modified
cs1: Difference from previous hosts file
platform:267
5 /Platform/Configuration/SMTP
SMTP settings modified
cs1: EMail Addresscs2: SMTP Servercs3: Backup SMTP Server cs4: Username SMTP Servercs5: Username Backup SMTP Servercs6: SMTP Auth/TLs Mode
platform:268
5 /Platform/Configuration/Network/Route/Add
Static route added
cs1: Destinationcs2: Subnetcs3: Gateway
platform:270
5 /Platform/Authorization/Users/Inactive/Disable
Inactive user disabled
cs1: User LogindeviceCustomDate1: Date Last Active
platform:280
7 /Appliance/State/Reboot/Initiate
Appliance reboot initiated
platform:281
3 /Appliance/State/Reboot/Cancel
Appliance reboot canceled
platform:282
7 /Appliance/State/Shutdown
Appliance poweroff initiated
platform:284
5 /Platform/Storage/Multipathing/Enable
Enabled SAN Multipathing
cs1: Multipath Configuration
Administrator's GuideAppendix E: Logger Audit Events
Platform Events Page 631 of 743
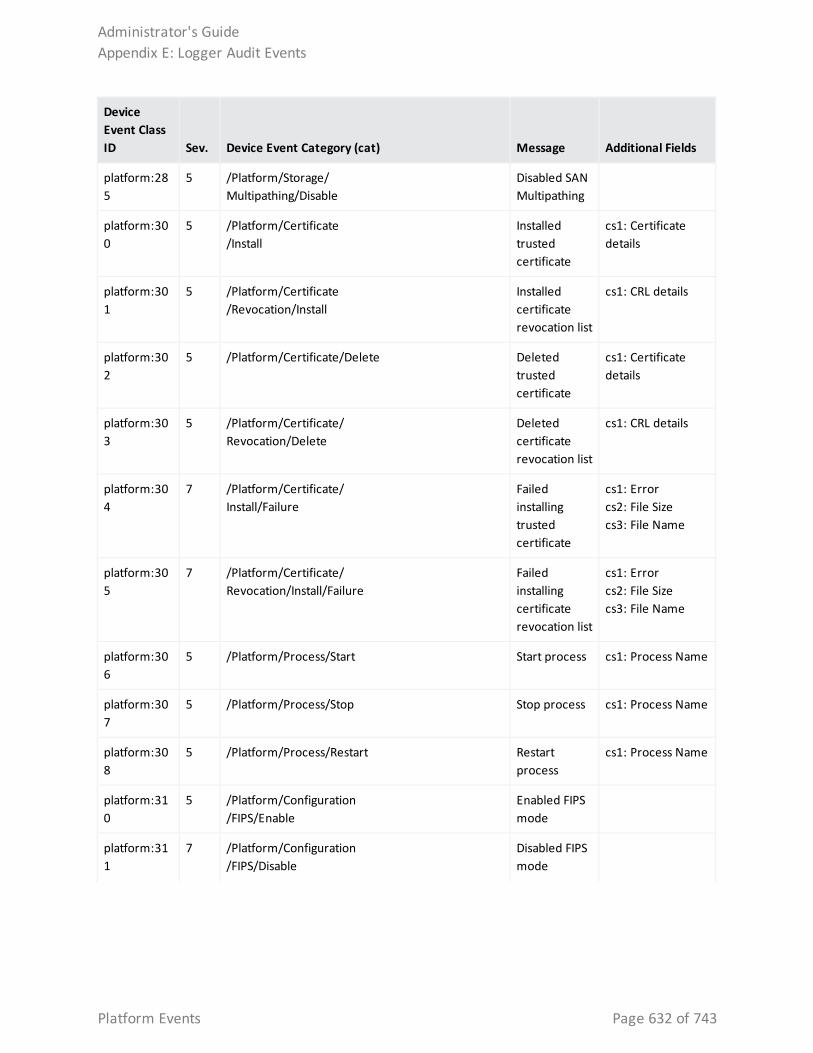
Device Event Class ID Sev. Device Event Category (cat) Message Additional Fields
platform:285
5 /Platform/Storage/Multipathing/Disable
Disabled SAN Multipathing
platform:300
5 /Platform/Certificate/Install
Installed trusted certificate
cs1: Certificate details
platform:301
5 /Platform/Certificate/Revocation/Install
Installed certificate revocation list
cs1: CRL details
platform:302
5 /Platform/Certificate/Delete Deleted trusted certificate
cs1: Certificate details
platform:303
5 /Platform/Certificate/Revocation/Delete
Deleted certificate revocation list
cs1: CRL details
platform:304
7 /Platform/Certificate/Install/Failure
Failed installing trusted certificate
cs1: Errorcs2: File Sizecs3: File Name
platform:305
7 /Platform/Certificate/Revocation/Install/Failure
Failed installing certificate revocation list
cs1: Errorcs2: File Sizecs3: File Name
platform:306
5 /Platform/Process/Start Start process cs1: Process Name
platform:307
5 /Platform/Process/Stop Stop process cs1: Process Name
platform:308
5 /Platform/Process/Restart Restart process
cs1: Process Name
platform:310
5 /Platform/Configuration/FIPS/Enable
Enabled FIPS mode
platform:311
7 /Platform/Configuration/FIPS/Disable
Disabled FIPS mode
Administrator's GuideAppendix E: Logger Audit Events
Platform Events Page 632 of 743
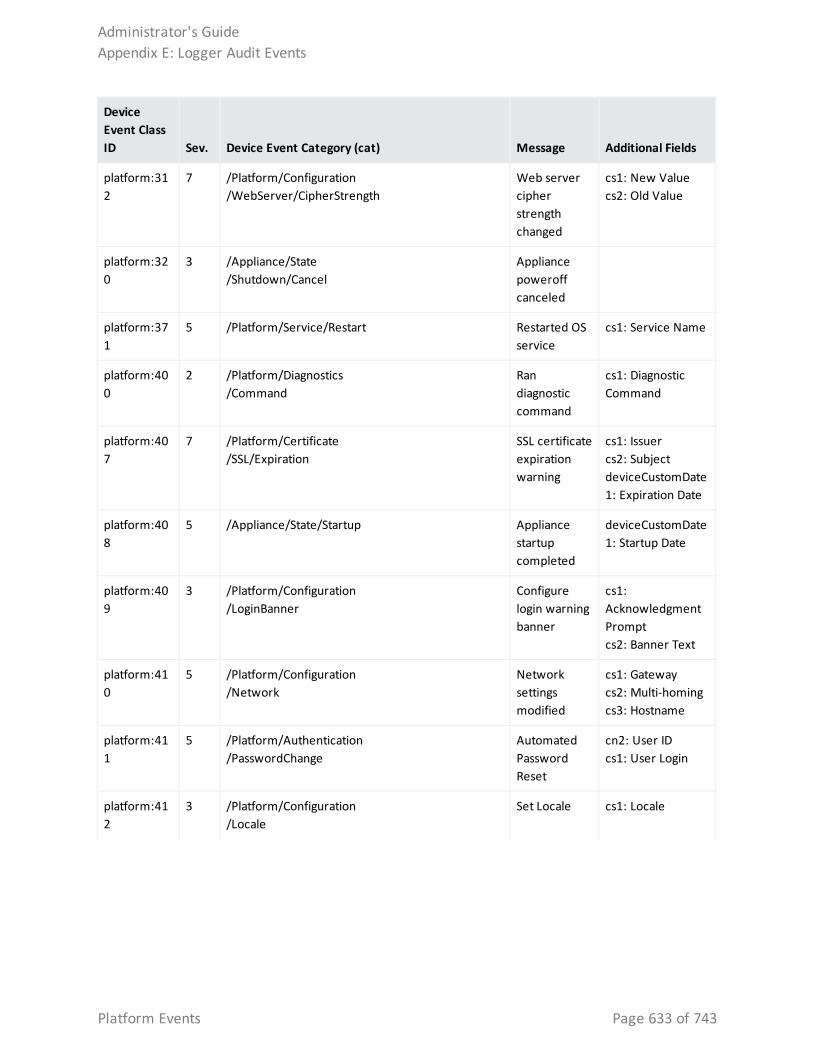
Device Event Class ID Sev. Device Event Category (cat) Message Additional Fields
platform:312
7 /Platform/Configuration/WebServer/CipherStrength
Web server cipher strength changed
cs1: New Valuecs2: Old Value
platform:320
3 /Appliance/State/Shutdown/Cancel
Appliance poweroff canceled
platform:371
5 /Platform/Service/Restart Restarted OS service
cs1: Service Name
platform:400
2 /Platform/Diagnostics/Command
Ran diagnostic command
cs1: Diagnostic Command
platform:407
7 /Platform/Certificate/SSL/Expiration
SSL certificate expiration warning
cs1: Issuercs2: SubjectdeviceCustomDate1: Expiration Date
platform:408
5 /Appliance/State/Startup Appliance startup completed
deviceCustomDate1: Startup Date
platform:409
3 /Platform/Configuration/LoginBanner
Configure login warning banner
cs1: Acknowledgment Promptcs2: Banner Text
platform:410
5 /Platform/Configuration/Network
Network settings modified
cs1: Gatewaycs2: Multi-homingcs3: Hostname
platform:411
5 /Platform/Authentication/PasswordChange
Automated Password Reset
cn2: User IDcs1: User Login
platform:412
3 /Platform/Configuration/Locale
Set Locale cs1: Locale
Administrator's GuideAppendix E: Logger Audit Events
Platform Events Page 633 of 743
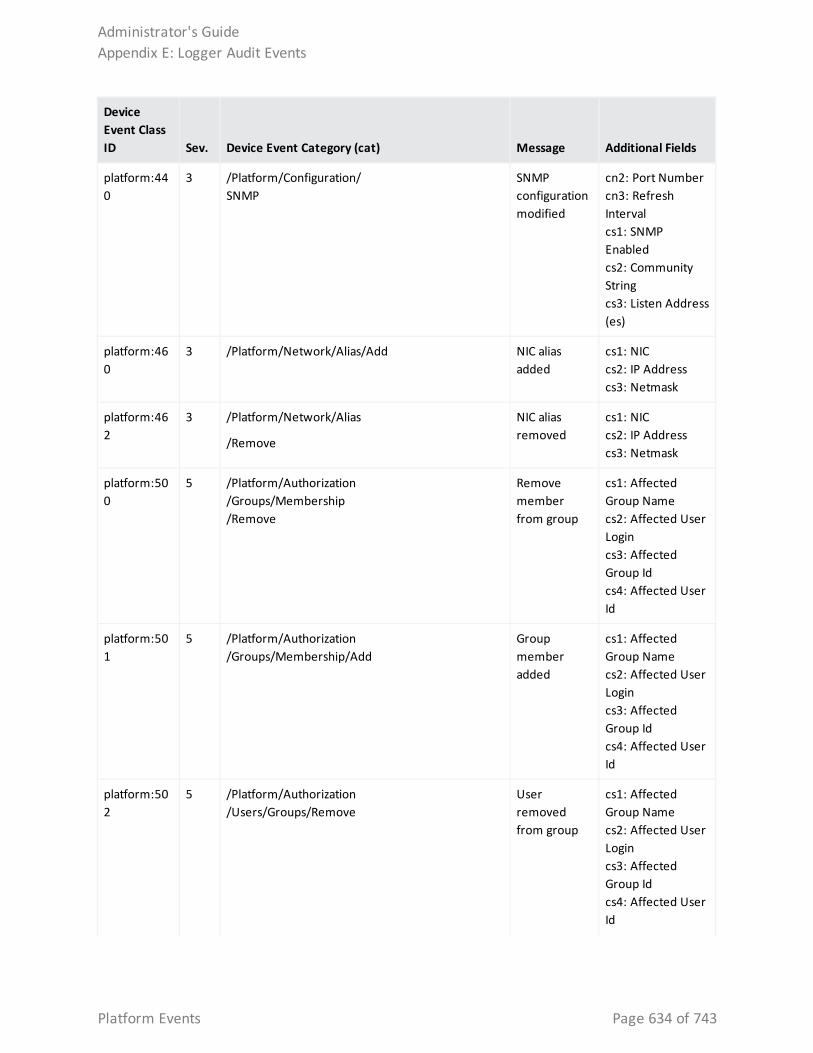
Device Event Class ID Sev. Device Event Category (cat) Message Additional Fields
platform:440
3 /Platform/Configuration/SNMP
SNMP configuration modified
cn2: Port Numbercn3: Refresh Intervalcs1: SNMP Enabledcs2: Community Stringcs3: Listen Address(es)
platform:460
3 /Platform/Network/Alias/Add NIC alias added
cs1: NICcs2: IP Addresscs3: Netmask
platform:462
3 /Platform/Network/Alias
/Remove
NIC alias removed
cs1: NICcs2: IP Addresscs3: Netmask
platform:500
5 /Platform/Authorization/Groups/Membership/Remove
Remove member from group
cs1: Affected Group Namecs2: Affected User Logincs3: Affected Group Idcs4: Affected User Id
platform:501
5 /Platform/Authorization/Groups/Membership/Add
Group member added
cs1: Affected Group Namecs2: Affected User Logincs3: Affected Group Idcs4: Affected User Id
platform:502
5 /Platform/Authorization/Users/Groups/Remove
User removed from group
cs1: Affected Group Namecs2: Affected User Logincs3: Affected Group Idcs4: Affected User Id
Administrator's GuideAppendix E: Logger Audit Events
Platform Events Page 634 of 743
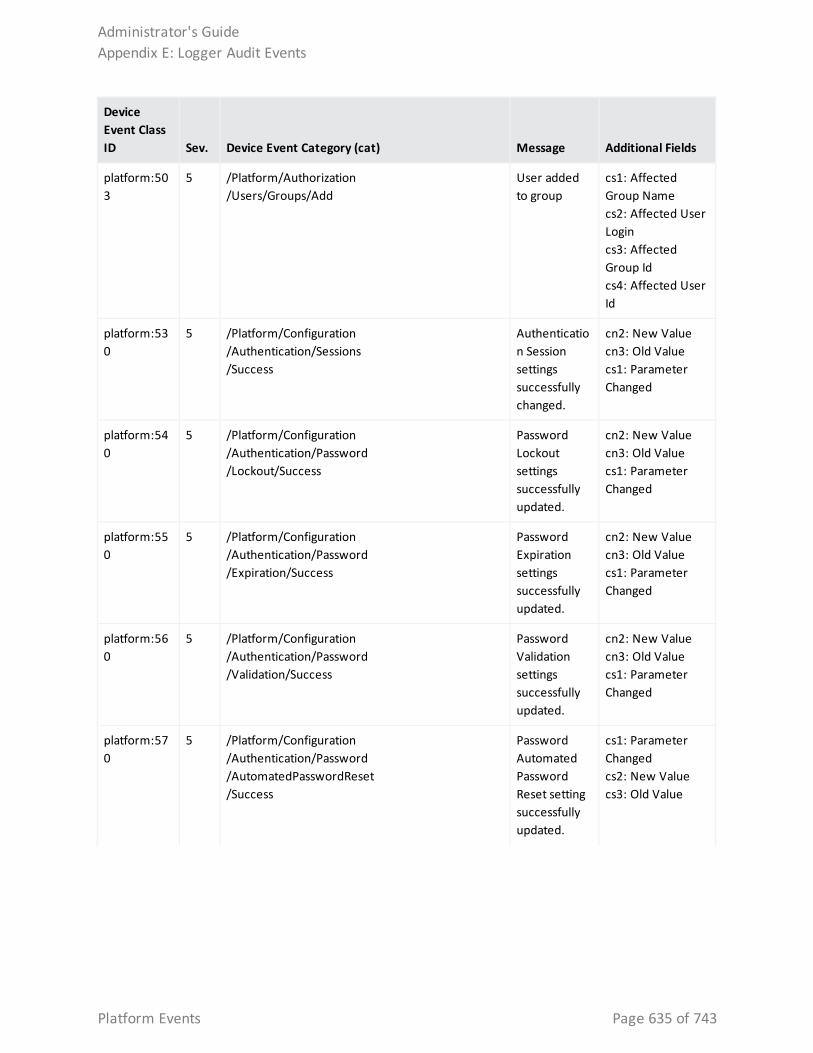
Device Event Class ID Sev. Device Event Category (cat) Message Additional Fields
platform:503
5 /Platform/Authorization/Users/Groups/Add
User added to group
cs1: Affected Group Namecs2: Affected User Logincs3: Affected Group Idcs4: Affected User Id
platform:530
5 /Platform/Configuration/Authentication/Sessions/Success
Authentication Session settings successfully changed.
cn2: New Valuecn3: Old Valuecs1: Parameter Changed
platform:540
5 /Platform/Configuration/Authentication/Password/Lockout/Success
Password Lockout settings successfully updated.
cn2: New Valuecn3: Old Valuecs1: Parameter Changed
platform:550
5 /Platform/Configuration/Authentication/Password/Expiration/Success
Password Expiration settings successfully updated.
cn2: New Valuecn3: Old Valuecs1: Parameter Changed
platform:560
5 /Platform/Configuration/Authentication/Password/Validation/Success
Password Validation settings successfully updated.
cn2: New Valuecn3: Old Valuecs1: Parameter Changed
platform:570
5 /Platform/Configuration/Authentication/Password/AutomatedPasswordReset/Success
Password Automated Password Reset setting successfully updated.
cs1: Parameter Changedcs2: New Valuecs3: Old Value
Administrator's GuideAppendix E: Logger Audit Events
Platform Events Page 635 of 743
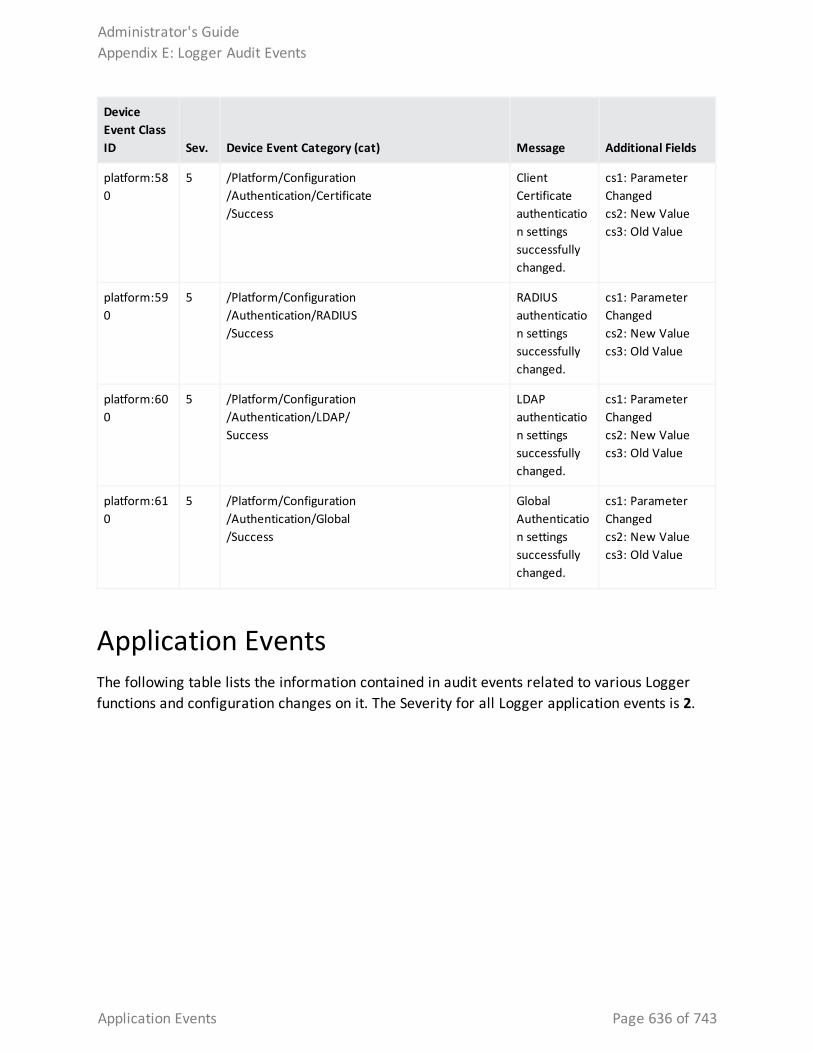
Device Event Class ID Sev. Device Event Category (cat) Message Additional Fields
platform:580
5 /Platform/Configuration/Authentication/Certificate/Success
Client Certificate authentication settings successfully changed.
cs1: Parameter Changedcs2: New Valuecs3: Old Value
platform:590
5 /Platform/Configuration/Authentication/RADIUS/Success
RADIUS authentication settings successfully changed.
cs1: Parameter Changedcs2: New Valuecs3: Old Value
platform:600
5 /Platform/Configuration/Authentication/LDAP/Success
LDAP authentication settings successfully changed.
cs1: Parameter Changedcs2: New Valuecs3: Old Value
platform:610
5 /Platform/Configuration/Authentication/Global/Success
Global Authentication settings successfully changed.
cs1: Parameter Changedcs2: New Valuecs3: Old Value
Application EventsThe following table lists the information contained in audit events related to various Logger functions and configuration changes on it. The Severity for all Logger application events is 2.
Administrator's GuideAppendix E: Logger Audit Events
Application Events Page 636 of 743
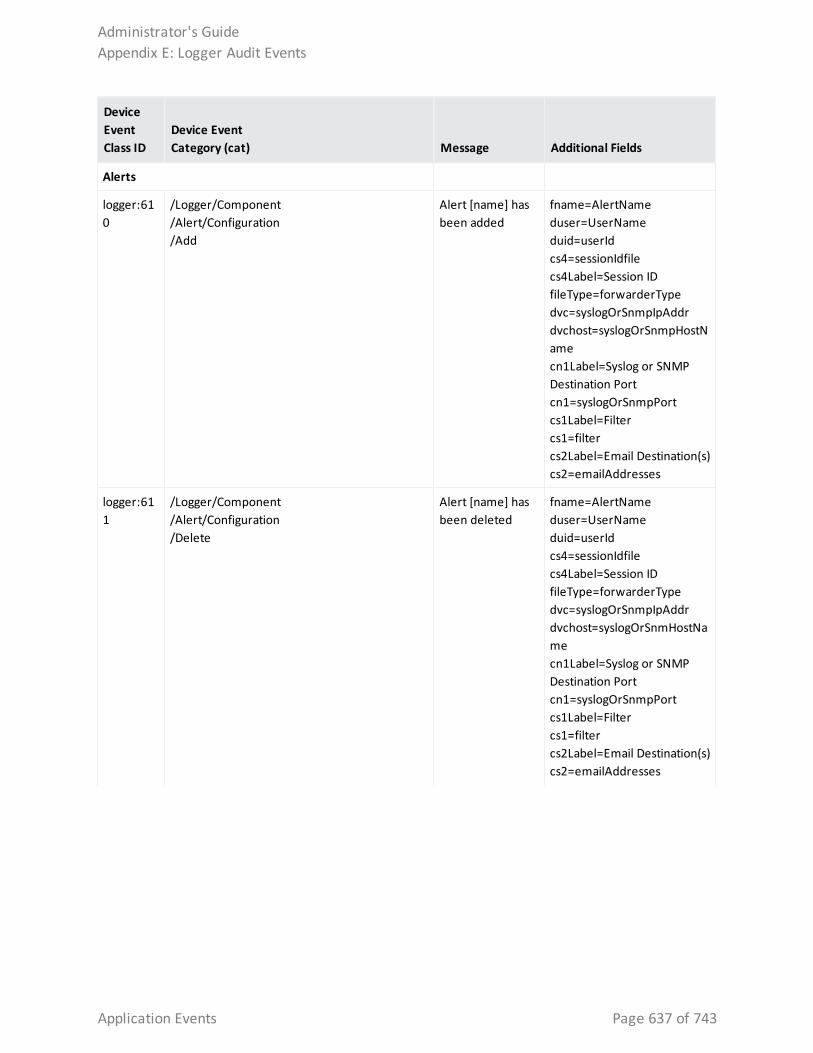
Device EventClass ID
Device Event Category (cat) Message Additional Fields
Alerts
logger:610
/Logger/Component/Alert/Configuration/Add
Alert [name] has been added
fname=AlertNameduser=UserNameduid=userIdcs4=sessionIdfilecs4Label=Session IDfileType=forwarderTypedvc=syslogOrSnmpIpAddrdvchost=syslogOrSnmpHostNamecn1Label=Syslog or SNMP Destination Portcn1=syslogOrSnmpPortcs1Label=Filtercs1=filtercs2Label=Email Destination(s)cs2=emailAddresses
logger:611
/Logger/Component/Alert/Configuration/Delete
Alert [name] has been deleted
fname=AlertNameduser=UserNameduid=userIdcs4=sessionIdfilecs4Label=Session IDfileType=forwarderTypedvc=syslogOrSnmpIpAddrdvchost=syslogOrSnmHostNamecn1Label=Syslog or SNMP Destination Portcn1=syslogOrSnmpPortcs1Label=Filtercs1=filtercs2Label=Email Destination(s)cs2=emailAddresses
Administrator's GuideAppendix E: Logger Audit Events
Application Events Page 637 of 743

Device EventClass ID
Device Event Category (cat) Message Additional Fields
logger:612
/Logger/Component/Alert/Configuration/Update
Alert [name] has been updated
fname=AlertNameduser=UserNameduid=userIdcs4=sessionIdfilecs4Label=Session IDfileType=forwarderTypedvc=syslogOrSnmpIpAddrdvchost=syslogOrSnmpHostNamecn1Label=Syslog or SNMP Destination Portcn1=syslogOrSnmpPortcs1Label=Filtercs1=filtercs2Label=Email Destination(s)cs2=emailAddresses
logger:613
/Logger/Component/Alert/Configuration/Enable
Alert [name] hasbeen enabled
fname=AlertNameduser=UserNameduid=userIdcs4=sessionIdfilecs4Label=Session IDfileType=forwarderTypedvc=syslogOrSnmpIpAddrdvchost=syslogOrSnmpHostNamecn1Label=Syslog or SNMP Destination Portcn1=syslogOrSnmpPortcs1Label=Filtercs1=filtercs2Label=Email Destination(s)cs2=emailAddresses
Administrator's GuideAppendix E: Logger Audit Events
Application Events Page 638 of 743
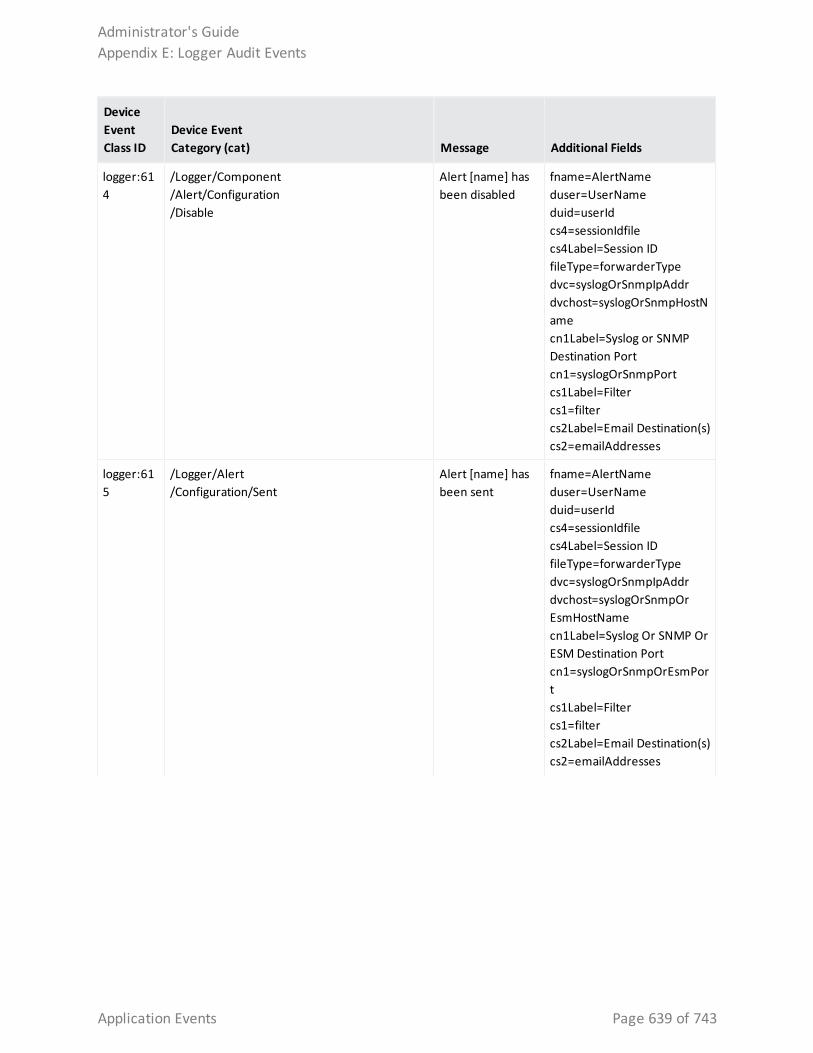
Device EventClass ID
Device Event Category (cat) Message Additional Fields
logger:614
/Logger/Component/Alert/Configuration/Disable
Alert [name] has been disabled
fname=AlertNameduser=UserNameduid=userIdcs4=sessionIdfilecs4Label=Session IDfileType=forwarderTypedvc=syslogOrSnmpIpAddrdvchost=syslogOrSnmpHostNamecn1Label=Syslog or SNMP Destination Portcn1=syslogOrSnmpPortcs1Label=Filtercs1=filtercs2Label=Email Destination(s)cs2=emailAddresses
logger:615
/Logger/Alert/Configuration/Sent
Alert [name] has been sent
fname=AlertNameduser=UserNameduid=userIdcs4=sessionIdfilecs4Label=Session IDfileType=forwarderTypedvc=syslogOrSnmpIpAddrdvchost=syslogOrSnmpOrEsmHostNamecn1Label=Syslog Or SNMP Or ESM Destination Portcn1=syslogOrSnmpOrEsmPortcs1Label=Filtercs1=filtercs2Label=Email Destination(s)cs2=emailAddresses
Administrator's GuideAppendix E: Logger Audit Events
Application Events Page 639 of 743
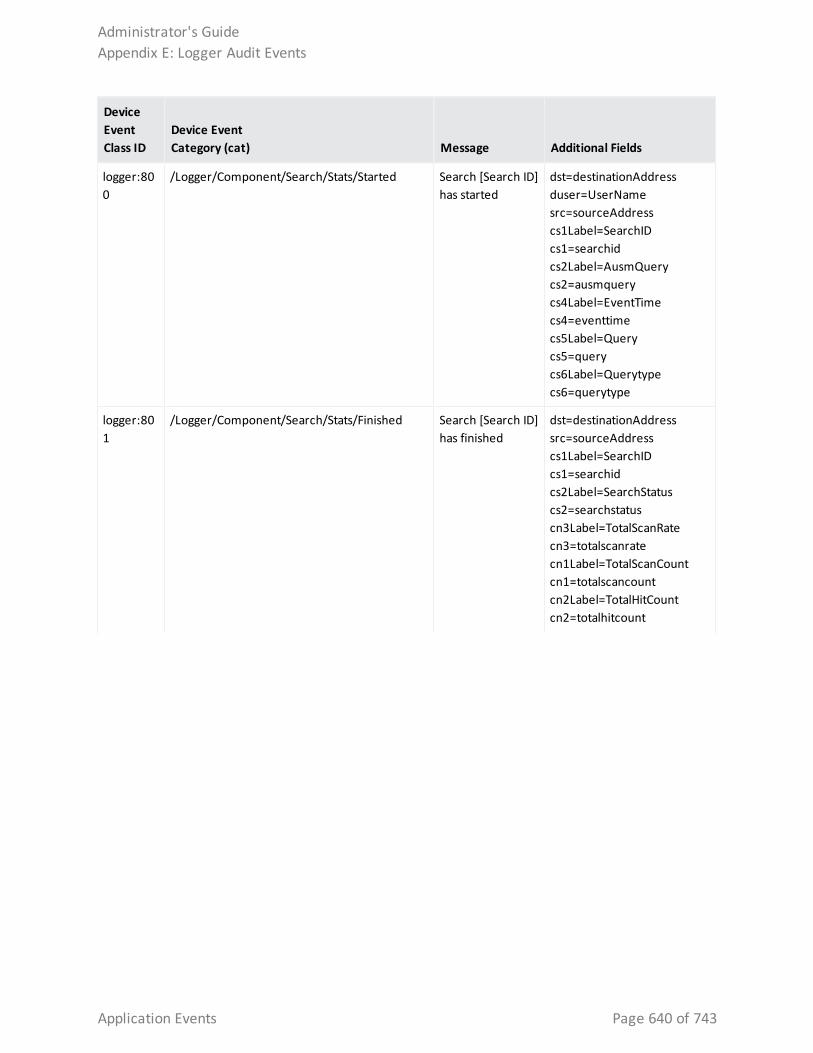
Device EventClass ID
Device Event Category (cat) Message Additional Fields
logger:800
/Logger/Component/Search/Stats/Started Search [Search ID] has started
dst=destinationAddressduser=UserNamesrc=sourceAddress cs1Label=SearchID cs1=searchid cs2Label=AusmQuery cs2=ausmquery cs4Label=EventTime cs4=eventtime cs5Label=Query cs5=query cs6Label=Querytype cs6=querytype
logger:801
/Logger/Component/Search/Stats/Finished Search [Search ID] has finished
dst=destinationAddress src=sourceAddress cs1Label=SearchID cs1=searchid cs2Label=SearchStatus cs2=searchstatus cn3Label=TotalScanRate cn3=totalscanrate cn1Label=TotalScanCount cn1=totalscancount cn2Label=TotalHitCount cn2=totalhitcount
Administrator's GuideAppendix E: Logger Audit Events
Application Events Page 640 of 743
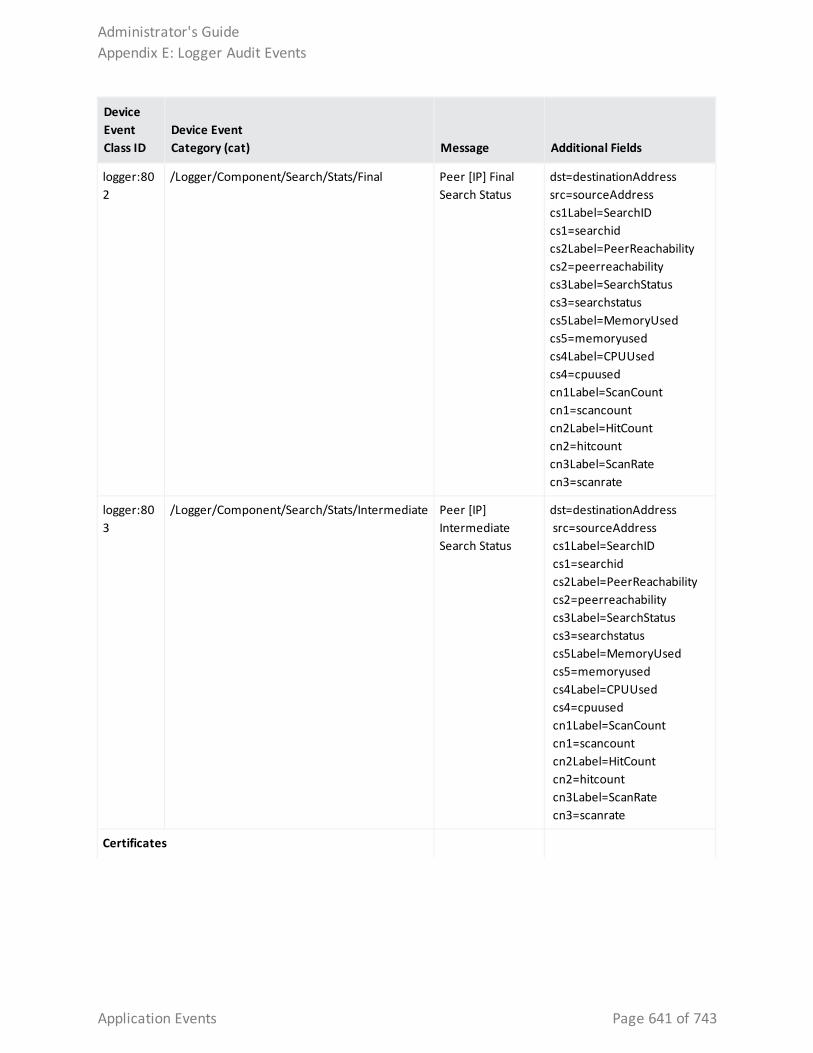
Device EventClass ID
Device Event Category (cat) Message Additional Fields
logger:802
/Logger/Component/Search/Stats/Final Peer [IP] Final Search Status
dst=destinationAddress src=sourceAddress cs1Label=SearchID cs1=searchid cs2Label=PeerReachability cs2=peerreachability cs3Label=SearchStatus cs3=searchstatus cs5Label=MemoryUsed cs5=memoryused cs4Label=CPUUsed cs4=cpuused cn1Label=ScanCount cn1=scancount cn2Label=HitCount cn2=hitcount cn3Label=ScanRate cn3=scanrate
logger:803
/Logger/Component/Search/Stats/Intermediate Peer [IP] Intermediate Search Status
dst=destinationAddress src=sourceAddress cs1Label=SearchID cs1=searchid cs2Label=PeerReachability cs2=peerreachability cs3Label=SearchStatus cs3=searchstatus cs5Label=MemoryUsed cs5=memoryused cs4Label=CPUUsed cs4=cpuused cn1Label=ScanCount cn1=scancount cn2Label=HitCount cn2=hitcount cn3Label=ScanRate cn3=scanrate
Certificates
Administrator's GuideAppendix E: Logger Audit Events
Application Events Page 641 of 743
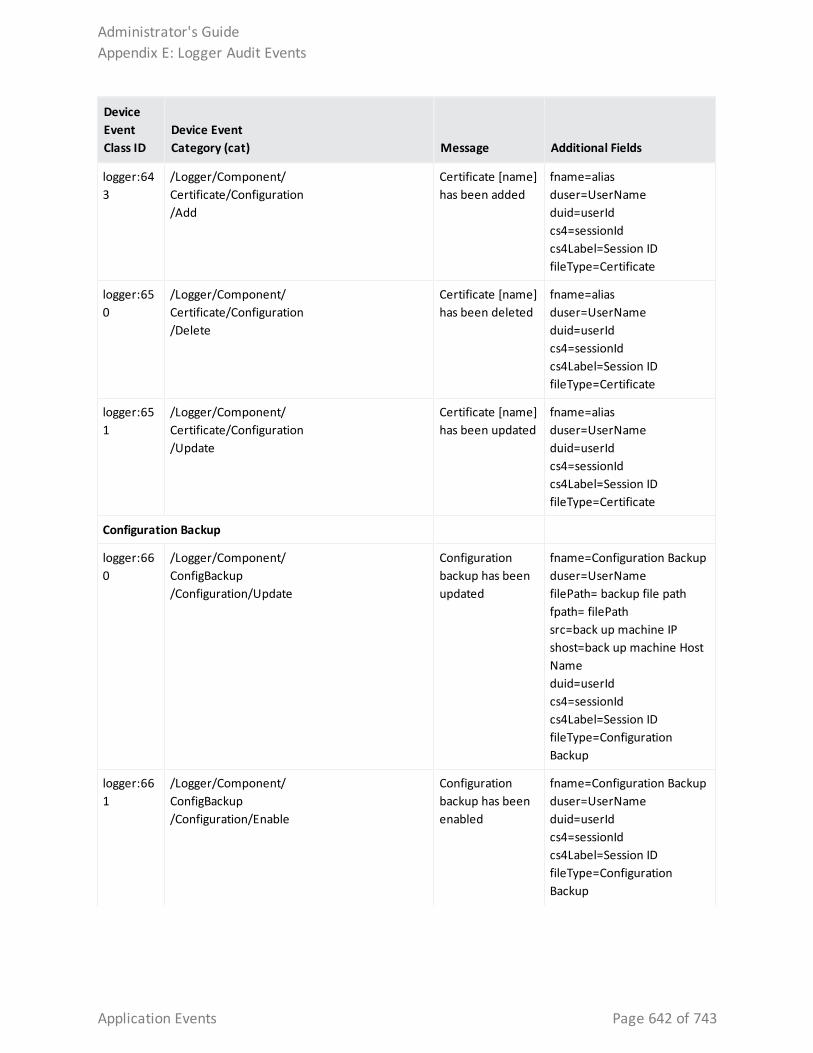
Device EventClass ID
Device Event Category (cat) Message Additional Fields
logger:643
/Logger/Component/Certificate/Configuration/Add
Certificate [name] has been added
fname=aliasduser=UserNameduid=userIdcs4=sessionIdcs4Label=Session IDfileType=Certificate
logger:650
/Logger/Component/Certificate/Configuration/Delete
Certificate [name] has been deleted
fname=aliasduser=UserNameduid=userIdcs4=sessionIdcs4Label=Session IDfileType=Certificate
logger:651
/Logger/Component/Certificate/Configuration/Update
Certificate [name] has been updated
fname=aliasduser=UserNameduid=userIdcs4=sessionIdcs4Label=Session IDfileType=Certificate
Configuration Backup
logger:660
/Logger/Component/ConfigBackup/Configuration/Update
Configuration backup has been updated
fname=Configuration Backupduser=UserNamefilePath= backup file pathfpath= filePathsrc=back up machine IPshost=back up machine Host Nameduid=userIdcs4=sessionIdcs4Label=Session IDfileType=Configuration Backup
logger:661
/Logger/Component/ConfigBackup/Configuration/Enable
Configuration backup has been enabled
fname=Configuration Backupduser=UserNameduid=userIdcs4=sessionIdcs4Label=Session IDfileType=Configuration Backup
Administrator's GuideAppendix E: Logger Audit Events
Application Events Page 642 of 743
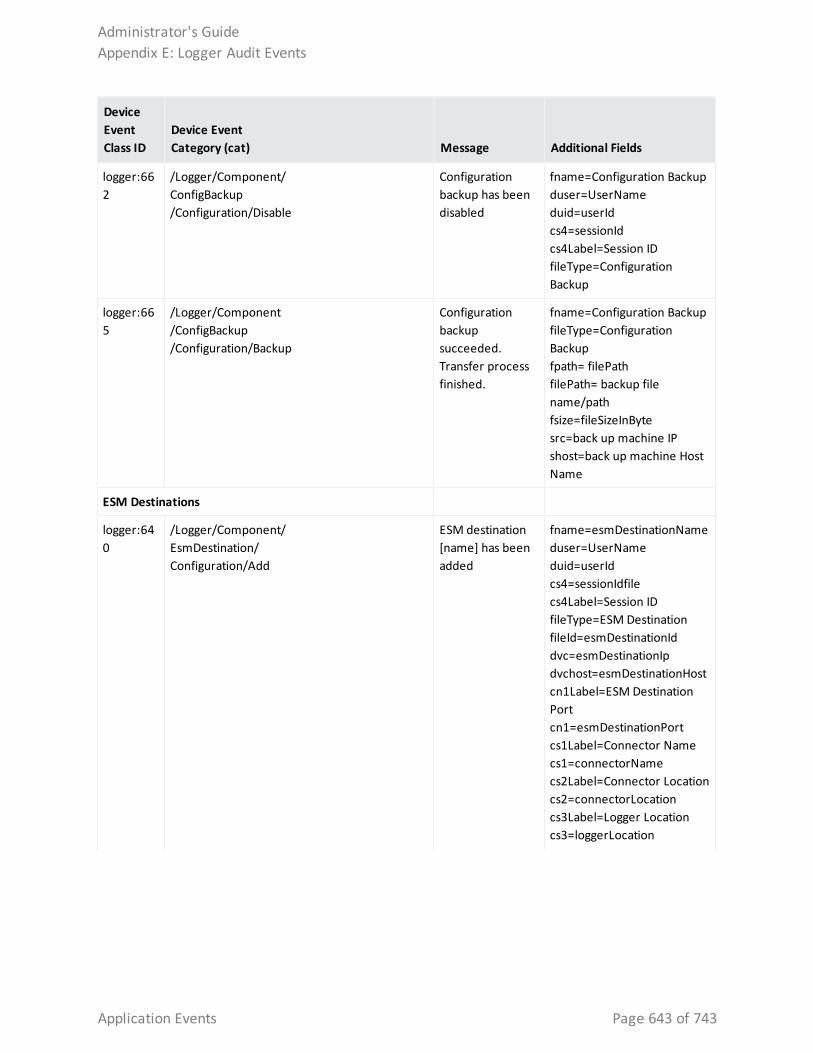
Device EventClass ID
Device Event Category (cat) Message Additional Fields
logger:662
/Logger/Component/ConfigBackup/Configuration/Disable
Configuration backup has been disabled
fname=Configuration Backupduser=UserNameduid=userIdcs4=sessionIdcs4Label=Session IDfileType=Configuration Backup
logger:665
/Logger/Component/ConfigBackup/Configuration/Backup
Configuration backup succeeded. Transfer process finished.
fname=Configuration BackupfileType=Configuration Backupfpath= filePathfilePath= backup file name/pathfsize=fileSizeInByte src=back up machine IP shost=back up machine Host Name
ESM Destinations
logger:640
/Logger/Component/EsmDestination/Configuration/Add
ESM destination [name] has been added
fname=esmDestinationNameduser=UserNameduid=userIdcs4=sessionIdfilecs4Label=Session IDfileType=ESM DestinationfileId=esmDestinationIddvc=esmDestinationIpdvchost=esmDestinationHostcn1Label=ESM Destination Portcn1=esmDestinationPortcs1Label=Connector Namecs1=connectorNamecs2Label=Connector Locationcs2=connectorLocationcs3Label=Logger Locationcs3=loggerLocation
Administrator's GuideAppendix E: Logger Audit Events
Application Events Page 643 of 743
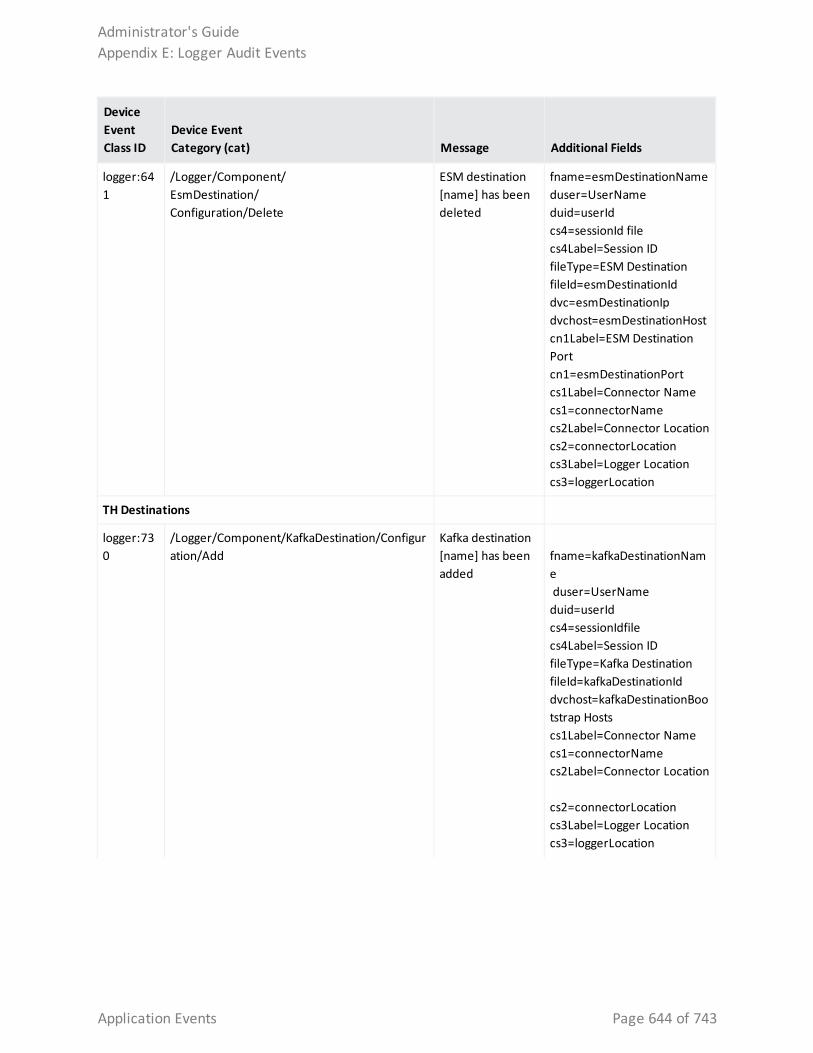
Device EventClass ID
Device Event Category (cat) Message Additional Fields
logger:641
/Logger/Component/EsmDestination/Configuration/Delete
ESM destination [name] has been deleted
fname=esmDestinationNameduser=UserNameduid=userIdcs4=sessionId filecs4Label=Session IDfileType=ESM DestinationfileId=esmDestinationIddvc=esmDestinationIpdvchost=esmDestinationHostcn1Label=ESM Destination Portcn1=esmDestinationPortcs1Label=Connector Namecs1=connectorNamecs2Label=Connector Locationcs2=connectorLocationcs3Label=Logger Locationcs3=loggerLocation
TH Destinations
logger:730
/Logger/Component/KafkaDestination/Configuration/Add
Kafka destination [name] has been added
fname=kafkaDestinationName duser=UserName duid=userId cs4=sessionIdfile cs4Label=Session ID fileType=Kafka Destination fileId=kafkaDestinationId dvchost=kafkaDestinationBootstrap Hosts cs1Label=Connector Name cs1=connectorName cs2Label=Connector Location cs2=connectorLocation cs3Label=Logger Location cs3=loggerLocation
Administrator's GuideAppendix E: Logger Audit Events
Application Events Page 644 of 743
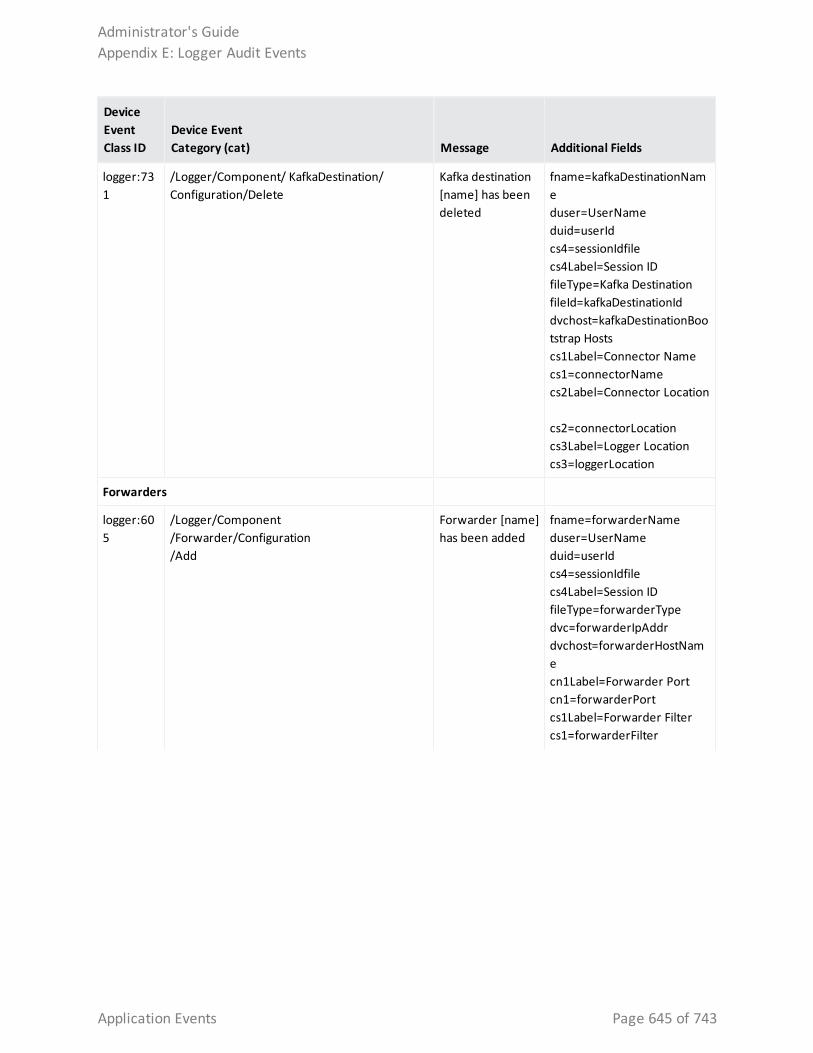
Device EventClass ID
Device Event Category (cat) Message Additional Fields
logger:731
/Logger/Component/ KafkaDestination/ Configuration/Delete
Kafka destination [name] has been deleted
fname=kafkaDestinationName duser=UserName duid=userId cs4=sessionIdfile cs4Label=Session ID fileType=Kafka Destination fileId=kafkaDestinationId dvchost=kafkaDestinationBootstrap Hosts cs1Label=Connector Name cs1=connectorName cs2Label=Connector Location cs2=connectorLocation cs3Label=Logger Location cs3=loggerLocation
Forwarders
logger:605
/Logger/Component/Forwarder/Configuration/Add
Forwarder [name] has been added
fname=forwarderNameduser=UserNameduid=userIdcs4=sessionIdfilecs4Label=Session IDfileType=forwarderTypedvc=forwarderIpAddrdvchost=forwarderHostNamecn1Label=Forwarder Portcn1=forwarderPortcs1Label=Forwarder Filtercs1=forwarderFilter
Administrator's GuideAppendix E: Logger Audit Events
Application Events Page 645 of 743
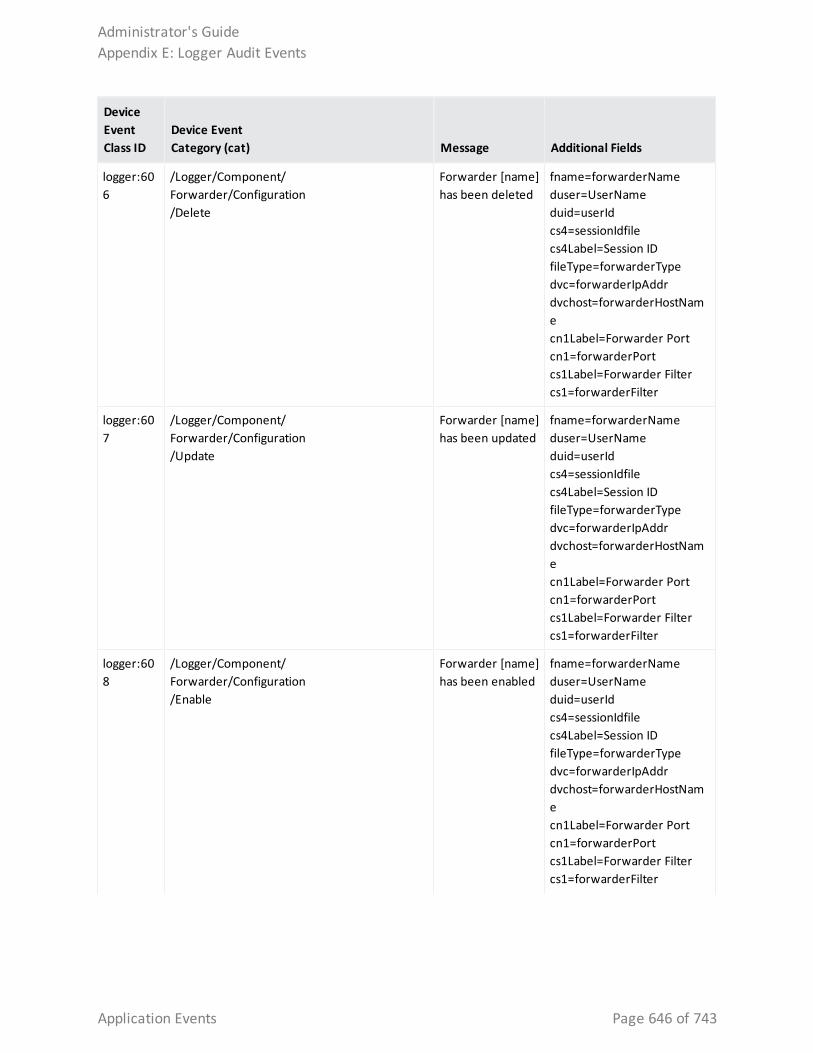
Device EventClass ID
Device Event Category (cat) Message Additional Fields
logger:606
/Logger/Component/Forwarder/Configuration/Delete
Forwarder [name] has been deleted
fname=forwarderNameduser=UserNameduid=userIdcs4=sessionIdfilecs4Label=Session IDfileType=forwarderTypedvc=forwarderIpAddrdvchost=forwarderHostNamecn1Label=Forwarder Portcn1=forwarderPortcs1Label=Forwarder Filtercs1=forwarderFilter
logger:607
/Logger/Component/Forwarder/Configuration/Update
Forwarder [name] has been updated
fname=forwarderNameduser=UserNameduid=userIdcs4=sessionIdfilecs4Label=Session IDfileType=forwarderTypedvc=forwarderIpAddrdvchost=forwarderHostNamecn1Label=Forwarder Portcn1=forwarderPortcs1Label=Forwarder Filtercs1=forwarderFilter
logger:608
/Logger/Component/Forwarder/Configuration/Enable
Forwarder [name] has been enabled
fname=forwarderNameduser=UserNameduid=userIdcs4=sessionIdfilecs4Label=Session IDfileType=forwarderTypedvc=forwarderIpAddrdvchost=forwarderHostNamecn1Label=Forwarder Portcn1=forwarderPortcs1Label=Forwarder Filtercs1=forwarderFilter
Administrator's GuideAppendix E: Logger Audit Events
Application Events Page 646 of 743
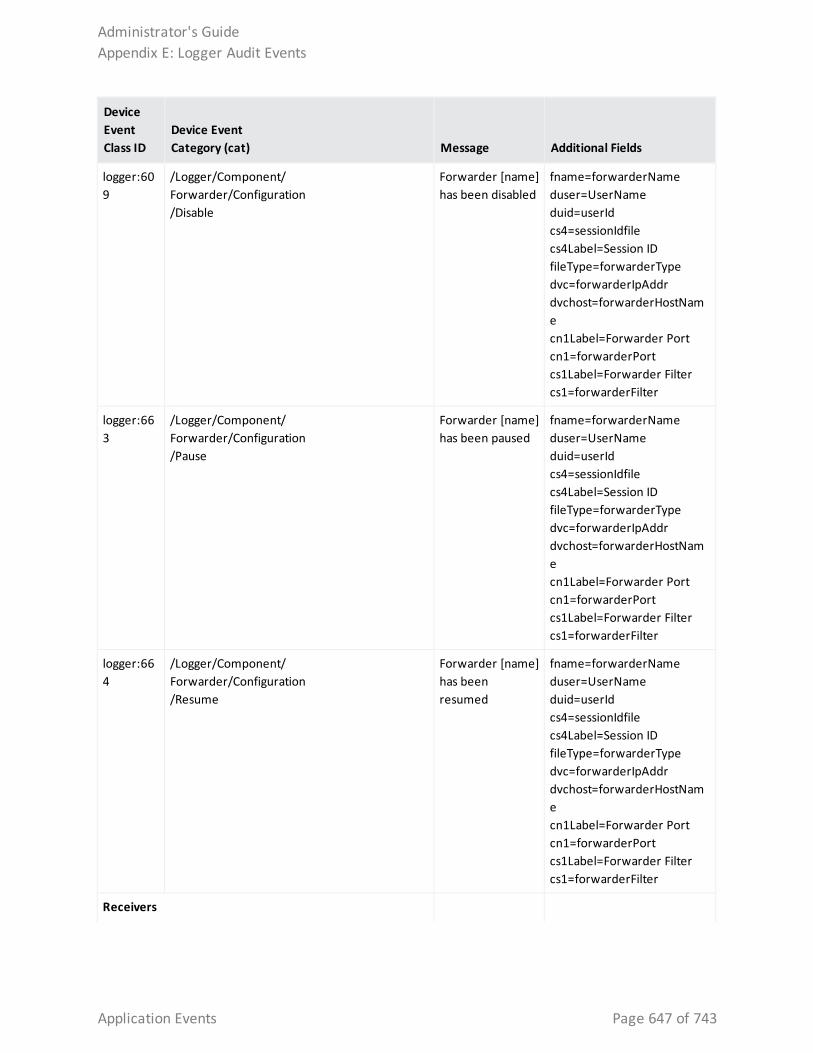
Device EventClass ID
Device Event Category (cat) Message Additional Fields
logger:609
/Logger/Component/Forwarder/Configuration/Disable
Forwarder [name] has been disabled
fname=forwarderNameduser=UserNameduid=userIdcs4=sessionIdfilecs4Label=Session IDfileType=forwarderTypedvc=forwarderIpAddrdvchost=forwarderHostNamecn1Label=Forwarder Portcn1=forwarderPortcs1Label=Forwarder Filtercs1=forwarderFilter
logger:663
/Logger/Component/Forwarder/Configuration/Pause
Forwarder [name] has been paused
fname=forwarderNameduser=UserNameduid=userIdcs4=sessionIdfilecs4Label=Session IDfileType=forwarderTypedvc=forwarderIpAddrdvchost=forwarderHostNamecn1Label=Forwarder Portcn1=forwarderPortcs1Label=Forwarder Filtercs1=forwarderFilter
logger:664
/Logger/Component/Forwarder/Configuration/Resume
Forwarder [name] has been resumed
fname=forwarderNameduser=UserNameduid=userIdcs4=sessionIdfilecs4Label=Session IDfileType=forwarderTypedvc=forwarderIpAddrdvchost=forwarderHostNamecn1Label=Forwarder Portcn1=forwarderPortcs1Label=Forwarder Filtercs1=forwarderFilter
Receivers
Administrator's GuideAppendix E: Logger Audit Events
Application Events Page 647 of 743
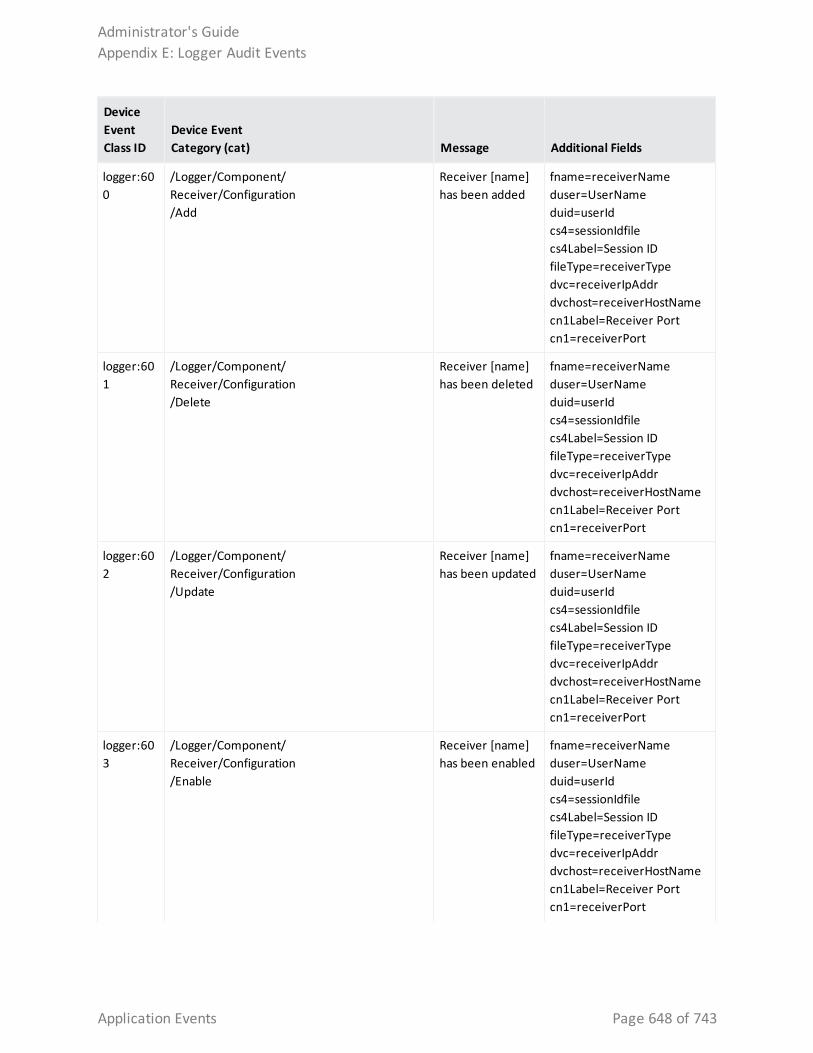
Device EventClass ID
Device Event Category (cat) Message Additional Fields
logger:600
/Logger/Component/Receiver/Configuration/Add
Receiver [name] has been added
fname=receiverNameduser=UserNameduid=userIdcs4=sessionIdfilecs4Label=Session IDfileType=receiverTypedvc=receiverIpAddrdvchost=receiverHostNamecn1Label=Receiver Portcn1=receiverPort
logger:601
/Logger/Component/Receiver/Configuration/Delete
Receiver [name] has been deleted
fname=receiverNameduser=UserNameduid=userIdcs4=sessionIdfilecs4Label=Session IDfileType=receiverTypedvc=receiverIpAddrdvchost=receiverHostNamecn1Label=Receiver Portcn1=receiverPort
logger:602
/Logger/Component/Receiver/Configuration/Update
Receiver [name] has been updated
fname=receiverNameduser=UserNameduid=userIdcs4=sessionIdfilecs4Label=Session IDfileType=receiverTypedvc=receiverIpAddrdvchost=receiverHostNamecn1Label=Receiver Portcn1=receiverPort
logger:603
/Logger/Component/Receiver/Configuration/Enable
Receiver [name] has been enabled
fname=receiverNameduser=UserNameduid=userIdcs4=sessionIdfilecs4Label=Session IDfileType=receiverTypedvc=receiverIpAddrdvchost=receiverHostNamecn1Label=Receiver Portcn1=receiverPort
Administrator's GuideAppendix E: Logger Audit Events
Application Events Page 648 of 743
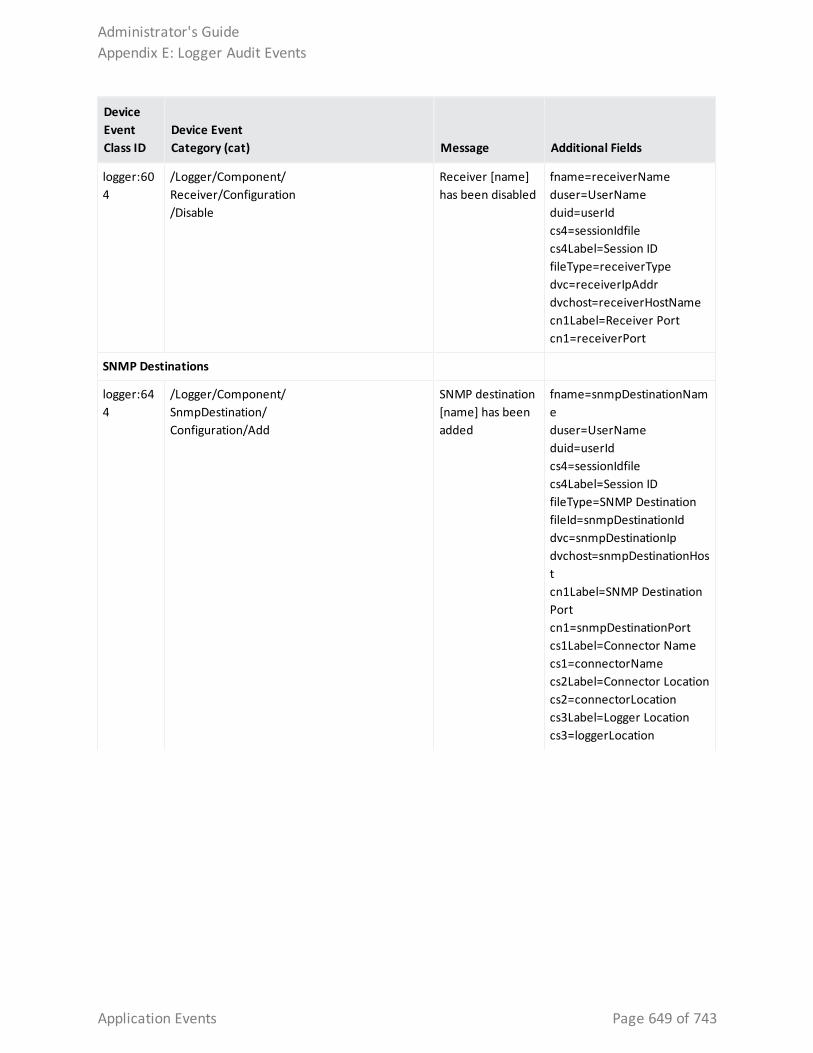
Device EventClass ID
Device Event Category (cat) Message Additional Fields
logger:604
/Logger/Component/Receiver/Configuration/Disable
Receiver [name] has been disabled
fname=receiverNameduser=UserNameduid=userIdcs4=sessionIdfilecs4Label=Session IDfileType=receiverTypedvc=receiverIpAddrdvchost=receiverHostNamecn1Label=Receiver Portcn1=receiverPort
SNMP Destinations
logger:644
/Logger/Component/SnmpDestination/Configuration/Add
SNMP destination [name] has been added
fname=snmpDestinationNameduser=UserNameduid=userIdcs4=sessionIdfilecs4Label=Session IDfileType=SNMP DestinationfileId=snmpDestinationIddvc=snmpDestinationIpdvchost=snmpDestinationHostcn1Label=SNMP Destination Portcn1=snmpDestinationPortcs1Label=Connector Namecs1=connectorNamecs2Label=Connector Locationcs2=connectorLocationcs3Label=Logger Locationcs3=loggerLocation
Administrator's GuideAppendix E: Logger Audit Events
Application Events Page 649 of 743
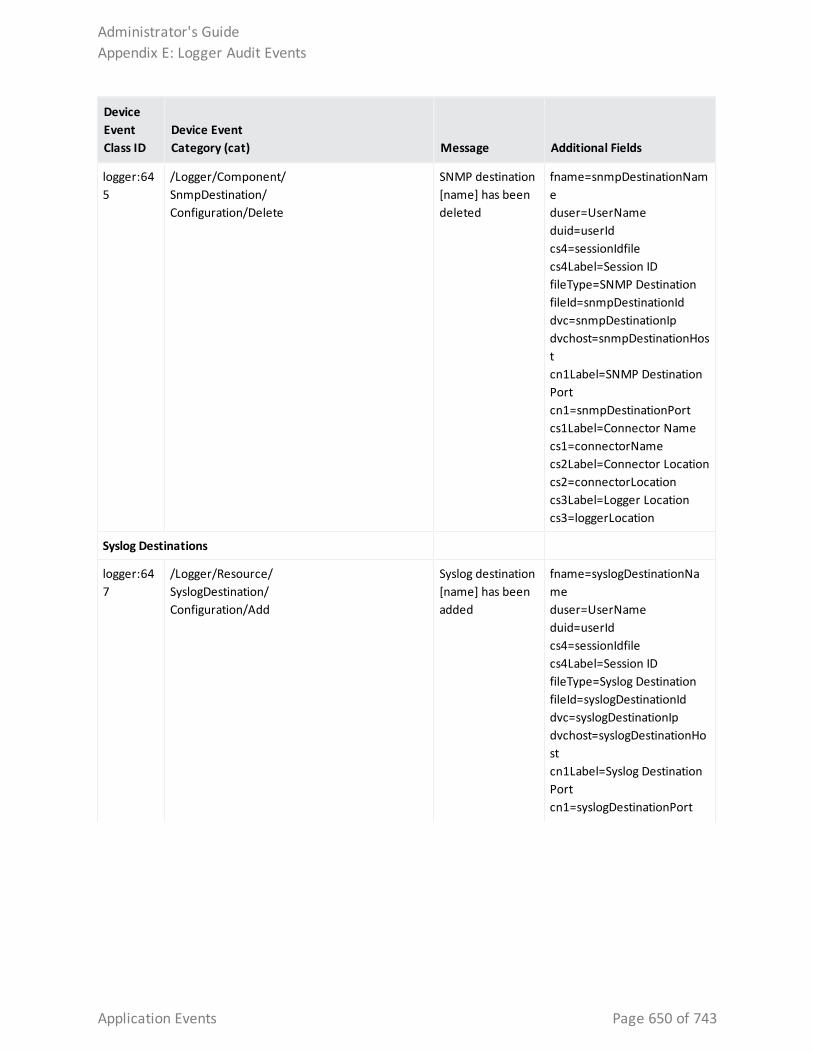
Device EventClass ID
Device Event Category (cat) Message Additional Fields
logger:645
/Logger/Component/SnmpDestination/Configuration/Delete
SNMP destination [name] has been deleted
fname=snmpDestinationNameduser=UserNameduid=userIdcs4=sessionIdfilecs4Label=Session IDfileType=SNMP DestinationfileId=snmpDestinationIddvc=snmpDestinationIpdvchost=snmpDestinationHostcn1Label=SNMP Destination Portcn1=snmpDestinationPortcs1Label=Connector Namecs1=connectorNamecs2Label=Connector Locationcs2=connectorLocationcs3Label=Logger Locationcs3=loggerLocation
Syslog Destinations
logger:647
/Logger/Resource/SyslogDestination/Configuration/Add
Syslog destination [name] has been added
fname=syslogDestinationNameduser=UserNameduid=userIdcs4=sessionIdfilecs4Label=Session IDfileType=Syslog DestinationfileId=syslogDestinationIddvc=syslogDestinationIpdvchost=syslogDestinationHostcn1Label=Syslog Destination Portcn1=syslogDestinationPort
Administrator's GuideAppendix E: Logger Audit Events
Application Events Page 650 of 743
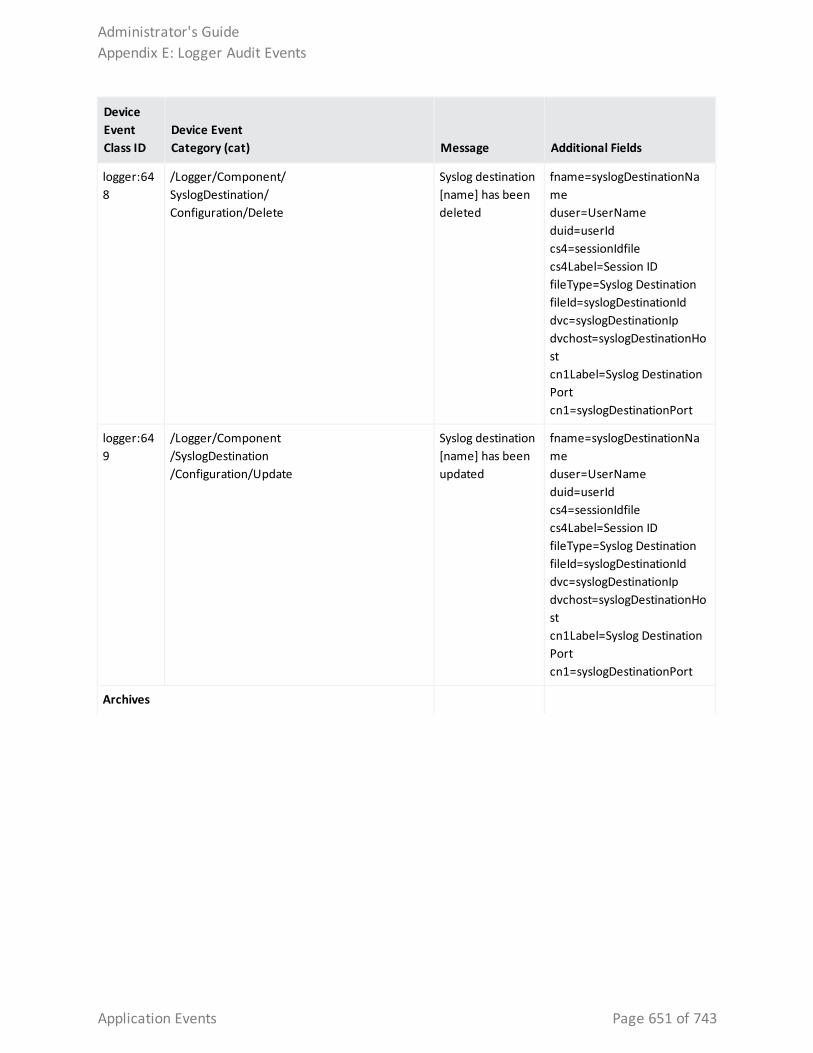
Device EventClass ID
Device Event Category (cat) Message Additional Fields
logger:648
/Logger/Component/SyslogDestination/Configuration/Delete
Syslog destination [name] has been deleted
fname=syslogDestinationNameduser=UserNameduid=userIdcs4=sessionIdfilecs4Label=Session IDfileType=Syslog DestinationfileId=syslogDestinationIddvc=syslogDestinationIpdvchost=syslogDestinationHostcn1Label=Syslog Destination Portcn1=syslogDestinationPort
logger:649
/Logger/Component/SyslogDestination/Configuration/Update
Syslog destination [name] has been updated
fname=syslogDestinationNameduser=UserNameduid=userIdcs4=sessionIdfilecs4Label=Session IDfileType=Syslog DestinationfileId=syslogDestinationIddvc=syslogDestinationIpdvchost=syslogDestinationHostcn1Label=Syslog Destination Portcn1=syslogDestinationPort
Archives
Administrator's GuideAppendix E: Logger Audit Events
Application Events Page 651 of 743
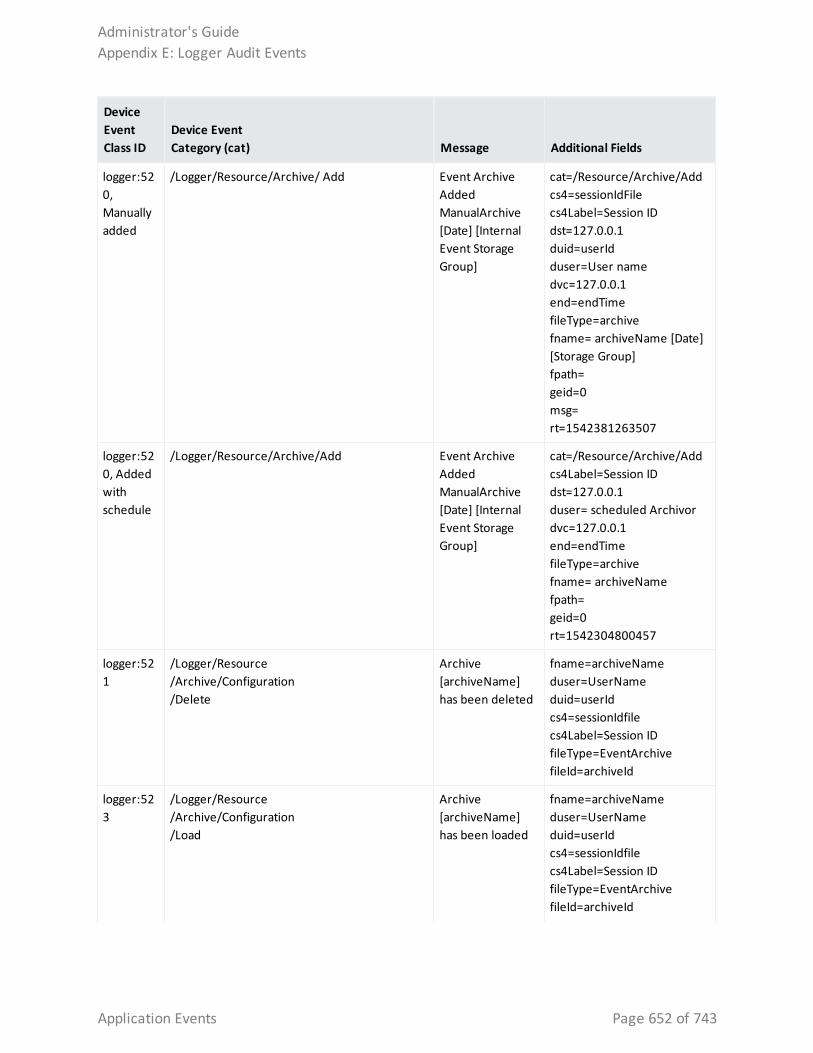
Device EventClass ID
Device Event Category (cat) Message Additional Fields
logger:520, Manually added
/Logger/Resource/Archive/ Add Event Archive Added ManualArchive [Date] [Internal Event Storage Group]
cat=/Resource/Archive/Add cs4=sessionIdFile cs4Label=Session ID dst=127.0.0.1 duid=userId duser=User name dvc=127.0.0.1 end=endTime fileType=archive fname= archiveName [Date] [Storage Group] fpath= geid=0 msg= rt=1542381263507
logger:520, Added with schedule
/Logger/Resource/Archive/Add Event Archive Added ManualArchive [Date] [Internal Event Storage Group]
cat=/Resource/Archive/Add cs4Label=Session ID dst=127.0.0.1 duser= scheduled Archivor dvc=127.0.0.1 end=endTime fileType=archive fname= archiveName fpath= geid=0 rt=1542304800457
logger:521
/Logger/Resource/Archive/Configuration/Delete
Archive [archiveName] has been deleted
fname=archiveNameduser=UserNameduid=userIdcs4=sessionIdfilecs4Label=Session IDfileType=EventArchivefileId=archiveId
logger:523
/Logger/Resource/Archive/Configuration/Load
Archive [archiveName] has been loaded
fname=archiveNameduser=UserNameduid=userIdcs4=sessionIdfilecs4Label=Session IDfileType=EventArchivefileId=archiveId
Administrator's GuideAppendix E: Logger Audit Events
Application Events Page 652 of 743
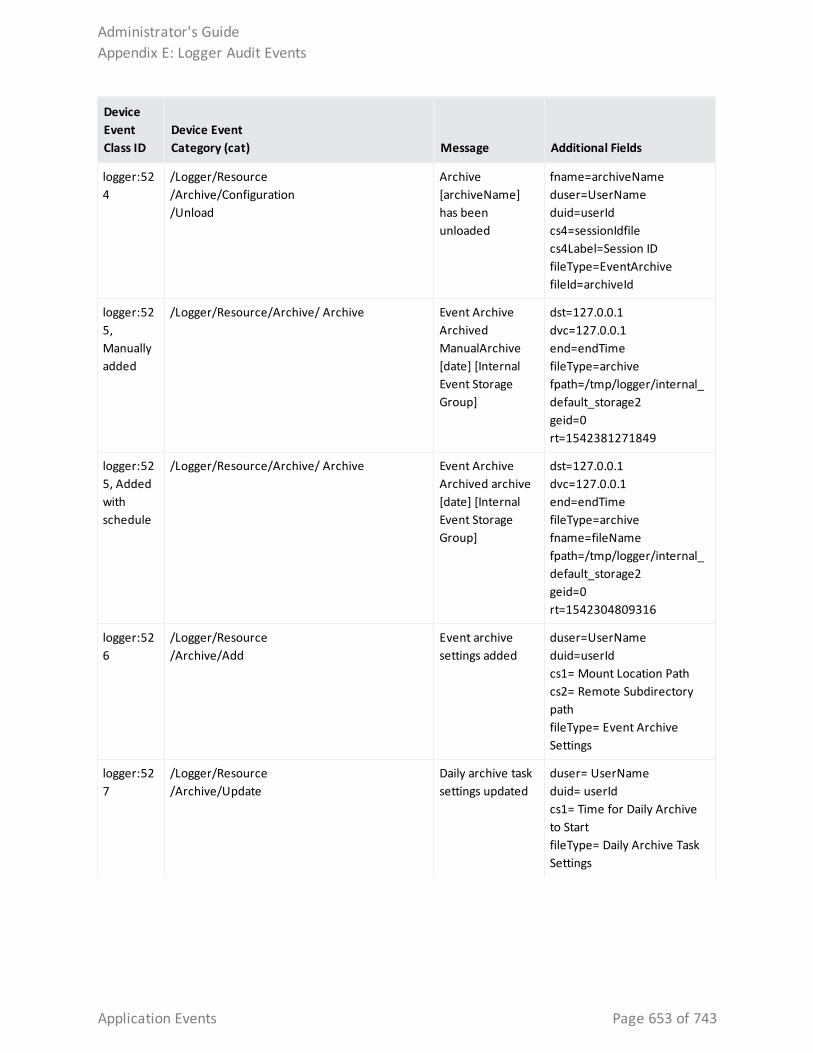
Device EventClass ID
Device Event Category (cat) Message Additional Fields
logger:524
/Logger/Resource/Archive/Configuration/Unload
Archive [archiveName] has been unloaded
fname=archiveNameduser=UserNameduid=userIdcs4=sessionIdfilecs4Label=Session IDfileType=EventArchivefileId=archiveId
logger:525, Manually added
/Logger/Resource/Archive/ Archive Event Archive Archived ManualArchive [date] [Internal Event Storage Group]
dst=127.0.0.1dvc=127.0.0.1 end=endTime fileType=archivefpath=/tmp/logger/internal_default_storage2geid=0rt=1542381271849
logger:525, Added with schedule
/Logger/Resource/Archive/ Archive Event Archive Archived archive [date] [Internal Event Storage Group]
dst=127.0.0.1 dvc=127.0.0.1 end=endTime fileType=archivefname=fileName fpath=/tmp/logger/internal_default_storage2 geid=0 rt=1542304809316
logger:526
/Logger/Resource/Archive/Add
Event archive settings added
duser=UserNameduid=userIdcs1= Mount Location Pathcs2= Remote Subdirectory pathfileType= Event Archive Settings
logger:527
/Logger/Resource/Archive/Update
Daily archive task settings updated
duser= UserNameduid= userIdcs1= Time for Daily Archive to StartfileType= Daily Archive Task Settings
Administrator's GuideAppendix E: Logger Audit Events
Application Events Page 653 of 743
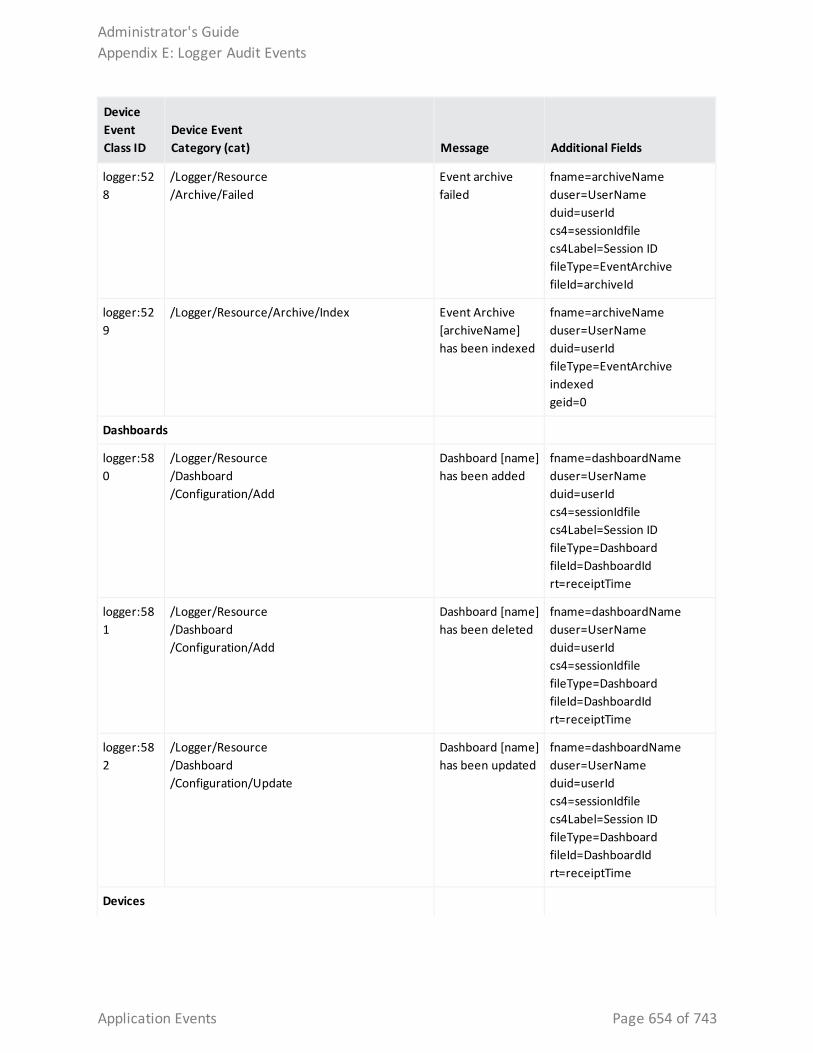
Device EventClass ID
Device Event Category (cat) Message Additional Fields
logger:528
/Logger/Resource/Archive/Failed
Event archive failed
fname=archiveNameduser=UserNameduid=userIdcs4=sessionIdfilecs4Label=Session IDfileType=EventArchivefileId=archiveId
logger:529
/Logger/Resource/Archive/Index Event Archive [archiveName] has been indexed
fname=archiveName duser=UserName duid=userId fileType=EventArchive indexed geid=0
Dashboards
logger:580
/Logger/Resource/Dashboard/Configuration/Add
Dashboard [name] has been added
fname=dashboardNameduser=UserNameduid=userIdcs4=sessionIdfilecs4Label=Session IDfileType=DashboardfileId=DashboardIdrt=receiptTime
logger:581
/Logger/Resource/Dashboard/Configuration/Add
Dashboard [name] has been deleted
fname=dashboardNameduser=UserNameduid=userIdcs4=sessionIdfilefileType=DashboardfileId=DashboardIdrt=receiptTime
logger:582
/Logger/Resource/Dashboard/Configuration/Update
Dashboard [name] has been updated
fname=dashboardNameduser=UserNameduid=userIdcs4=sessionIdfilecs4Label=Session IDfileType=DashboardfileId=DashboardIdrt=receiptTime
Devices
Administrator's GuideAppendix E: Logger Audit Events
Application Events Page 654 of 743
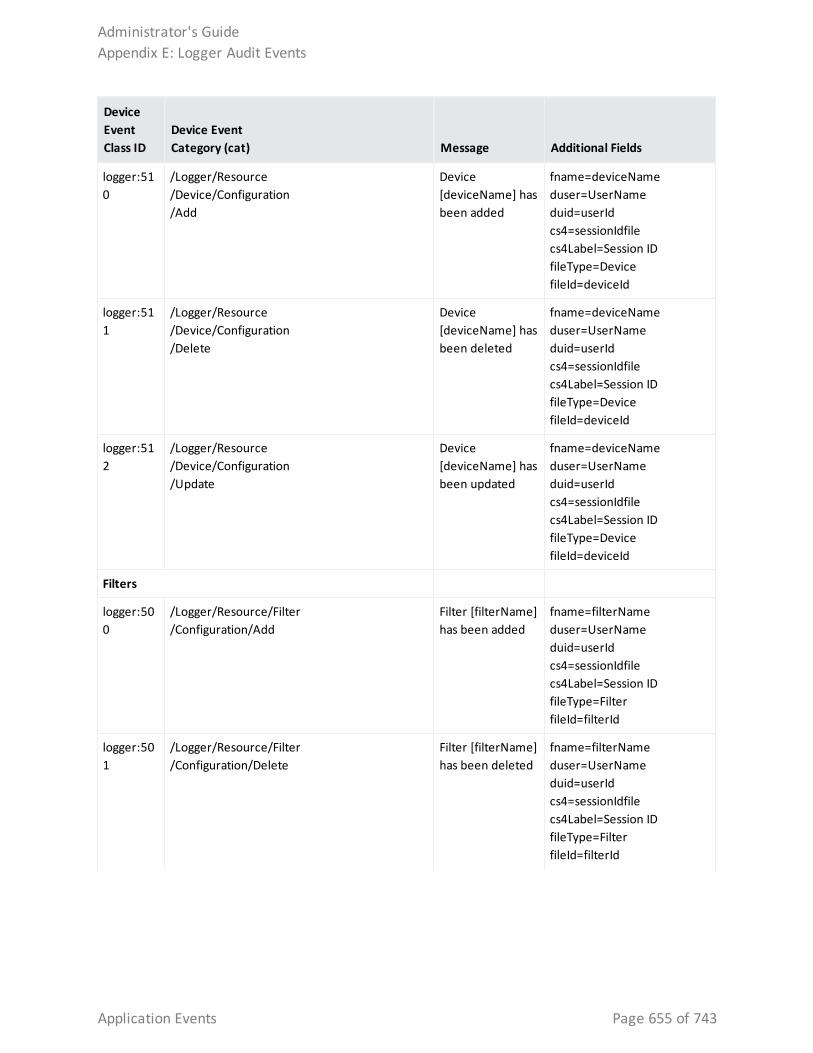
Device EventClass ID
Device Event Category (cat) Message Additional Fields
logger:510
/Logger/Resource/Device/Configuration/Add
Device [deviceName] has been added
fname=deviceNameduser=UserNameduid=userIdcs4=sessionIdfilecs4Label=Session IDfileType=DevicefileId=deviceId
logger:511
/Logger/Resource/Device/Configuration/Delete
Device [deviceName] has been deleted
fname=deviceNameduser=UserNameduid=userIdcs4=sessionIdfilecs4Label=Session IDfileType=DevicefileId=deviceId
logger:512
/Logger/Resource/Device/Configuration/Update
Device [deviceName] has been updated
fname=deviceNameduser=UserNameduid=userIdcs4=sessionIdfilecs4Label=Session IDfileType=DevicefileId=deviceId
Filters
logger:500
/Logger/Resource/Filter/Configuration/Add
Filter [filterName] has been added
fname=filterNameduser=UserNameduid=userIdcs4=sessionIdfilecs4Label=Session IDfileType=FilterfileId=filterId
logger:501
/Logger/Resource/Filter/Configuration/Delete
Filter [filterName] has been deleted
fname=filterNameduser=UserNameduid=userIdcs4=sessionIdfilecs4Label=Session IDfileType=FilterfileId=filterId
Administrator's GuideAppendix E: Logger Audit Events
Application Events Page 655 of 743
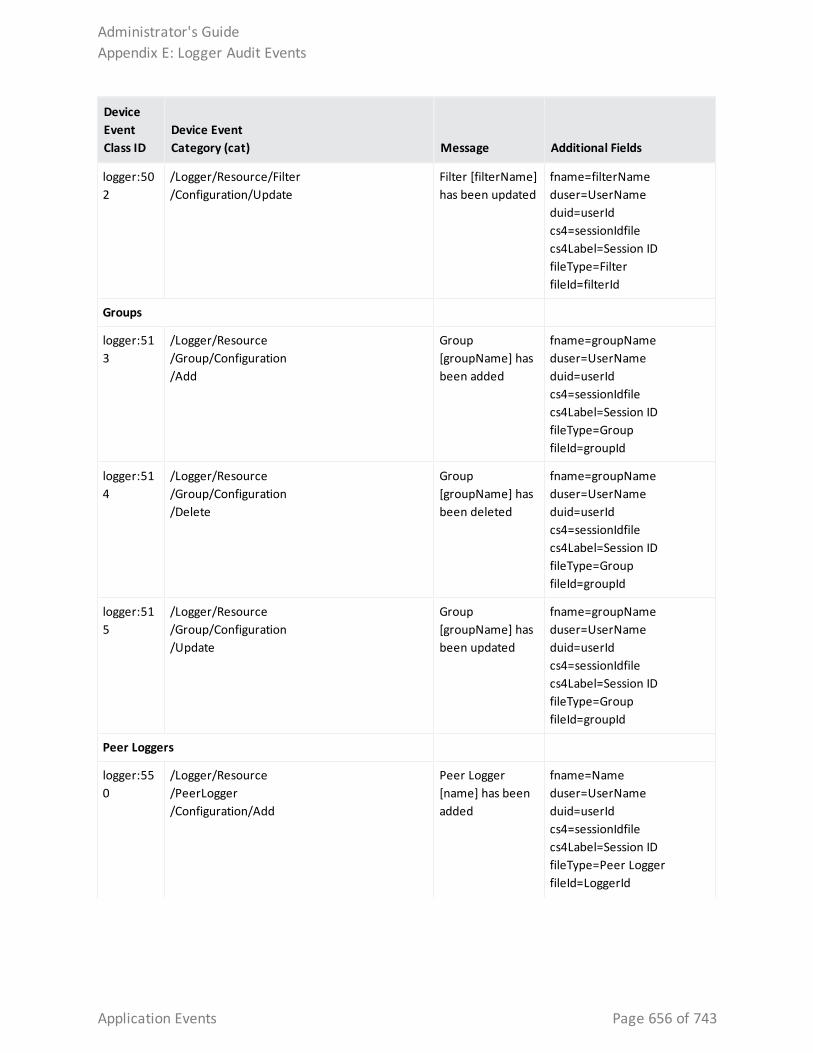
Device EventClass ID
Device Event Category (cat) Message Additional Fields
logger:502
/Logger/Resource/Filter/Configuration/Update
Filter [filterName] has been updated
fname=filterNameduser=UserNameduid=userIdcs4=sessionIdfilecs4Label=Session IDfileType=FilterfileId=filterId
Groups
logger:513
/Logger/Resource/Group/Configuration/Add
Group [groupName] has been added
fname=groupNameduser=UserNameduid=userIdcs4=sessionIdfilecs4Label=Session IDfileType=GroupfileId=groupId
logger:514
/Logger/Resource/Group/Configuration/Delete
Group [groupName] has been deleted
fname=groupNameduser=UserNameduid=userIdcs4=sessionIdfilecs4Label=Session IDfileType=GroupfileId=groupId
logger:515
/Logger/Resource/Group/Configuration/Update
Group [groupName] has been updated
fname=groupNameduser=UserNameduid=userIdcs4=sessionIdfilecs4Label=Session IDfileType=GroupfileId=groupId
Peer Loggers
logger:550
/Logger/Resource/PeerLogger/Configuration/Add
Peer Logger [name] has been added
fname=Nameduser=UserNameduid=userIdcs4=sessionIdfilecs4Label=Session IDfileType=Peer LoggerfileId=LoggerId
Administrator's GuideAppendix E: Logger Audit Events
Application Events Page 656 of 743
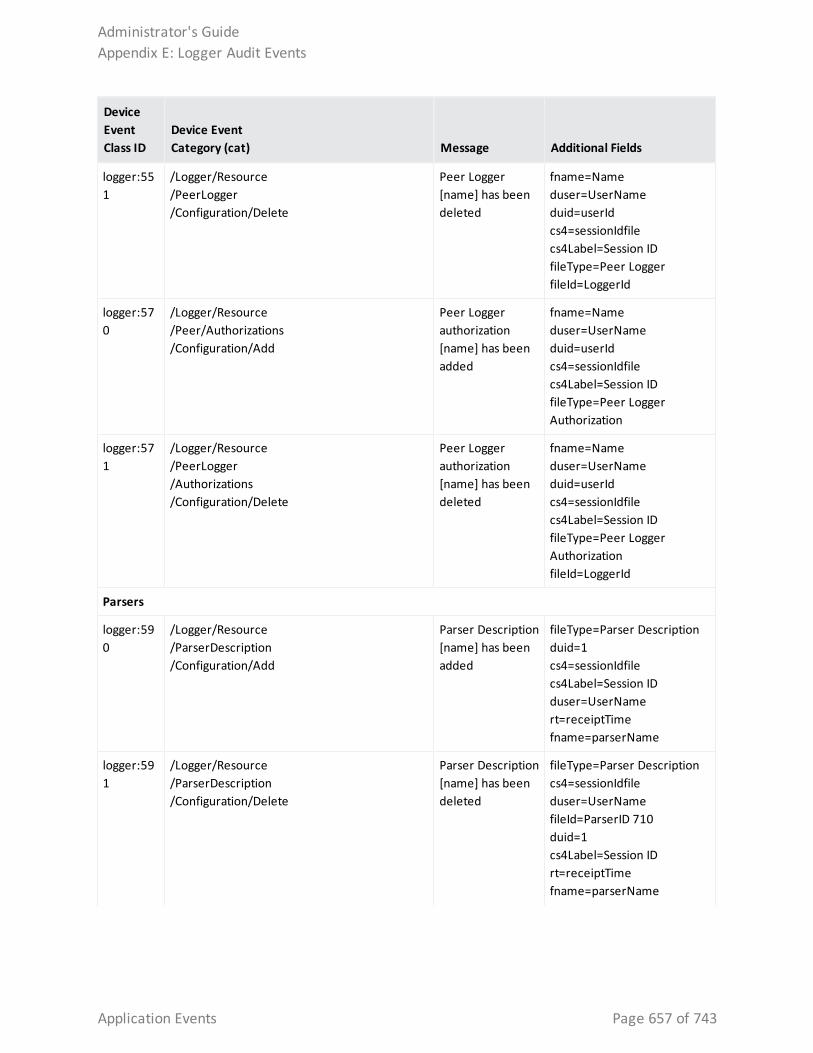
Device EventClass ID
Device Event Category (cat) Message Additional Fields
logger:551
/Logger/Resource/PeerLogger/Configuration/Delete
Peer Logger [name] has been deleted
fname=Nameduser=UserNameduid=userIdcs4=sessionIdfilecs4Label=Session IDfileType=Peer LoggerfileId=LoggerId
logger:570
/Logger/Resource/Peer/Authorizations/Configuration/Add
Peer Logger authorization [name] has been added
fname=Nameduser=UserNameduid=userIdcs4=sessionIdfilecs4Label=Session IDfileType=Peer Logger Authorization
logger:571
/Logger/Resource/PeerLogger/Authorizations/Configuration/Delete
Peer Logger authorization [name] has been deleted
fname=Nameduser=UserNameduid=userIdcs4=sessionIdfilecs4Label=Session IDfileType=Peer Logger AuthorizationfileId=LoggerId
Parsers
logger:590
/Logger/Resource/ParserDescription/Configuration/Add
Parser Description [name] has been added
fileType=Parser Descriptionduid=1cs4=sessionIdfilecs4Label=Session IDduser=UserNamert=receiptTimefname=parserName
logger:591
/Logger/Resource/ParserDescription/Configuration/Delete
Parser Description [name] has been deleted
fileType=Parser Descriptioncs4=sessionIdfileduser=UserNamefileId=ParserID 710duid=1cs4Label=Session IDrt=receiptTimefname=parserName
Administrator's GuideAppendix E: Logger Audit Events
Application Events Page 657 of 743
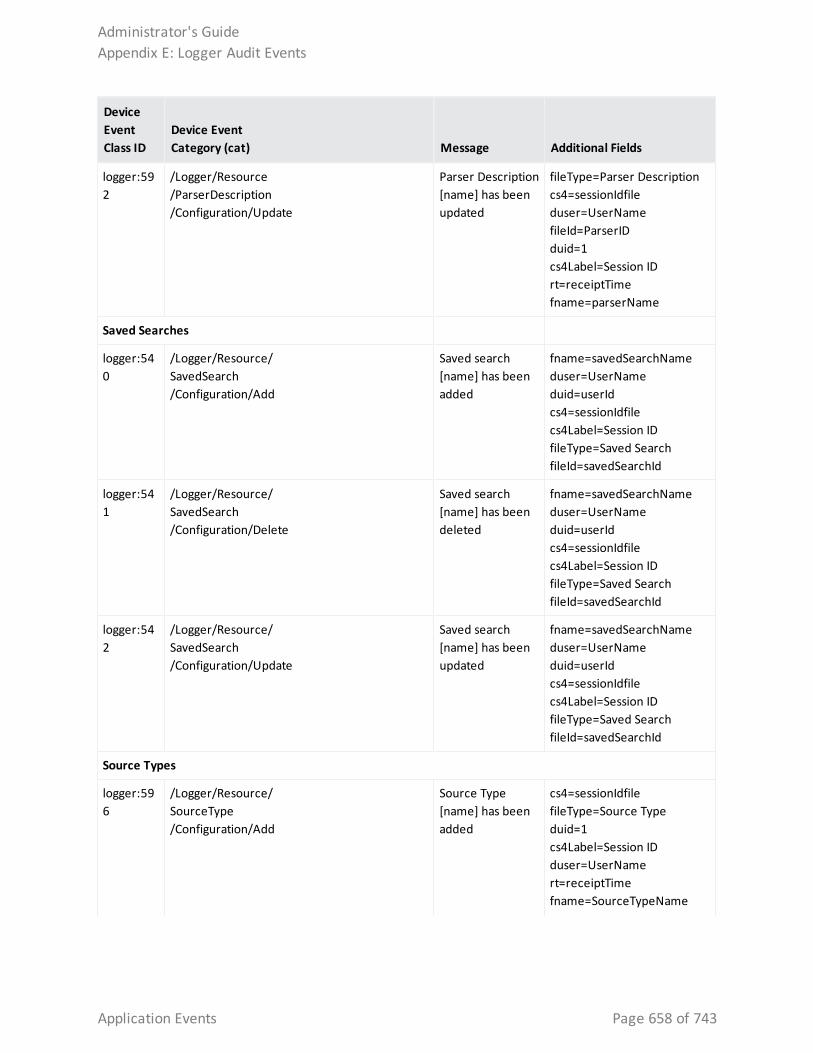
Device EventClass ID
Device Event Category (cat) Message Additional Fields
logger:592
/Logger/Resource/ParserDescription/Configuration/Update
Parser Description [name] has been updated
fileType=Parser Descriptioncs4=sessionIdfileduser=UserNamefileId=ParserIDduid=1cs4Label=Session IDrt=receiptTimefname=parserName
Saved Searches
logger:540
/Logger/Resource/SavedSearch/Configuration/Add
Saved search [name] has been added
fname=savedSearchNameduser=UserNameduid=userIdcs4=sessionIdfilecs4Label=Session IDfileType=Saved SearchfileId=savedSearchId
logger:541
/Logger/Resource/SavedSearch/Configuration/Delete
Saved search [name] has been deleted
fname=savedSearchNameduser=UserNameduid=userIdcs4=sessionIdfilecs4Label=Session IDfileType=Saved SearchfileId=savedSearchId
logger:542
/Logger/Resource/SavedSearch/Configuration/Update
Saved search [name] has been updated
fname=savedSearchNameduser=UserNameduid=userIdcs4=sessionIdfilecs4Label=Session IDfileType=Saved SearchfileId=savedSearchId
Source Types
logger:596
/Logger/Resource/SourceType/Configuration/Add
Source Type [name] has been added
cs4=sessionIdfilefileType=Source Typeduid=1cs4Label=Session IDduser=UserNamert=receiptTimefname=SourceTypeName
Administrator's GuideAppendix E: Logger Audit Events
Application Events Page 658 of 743
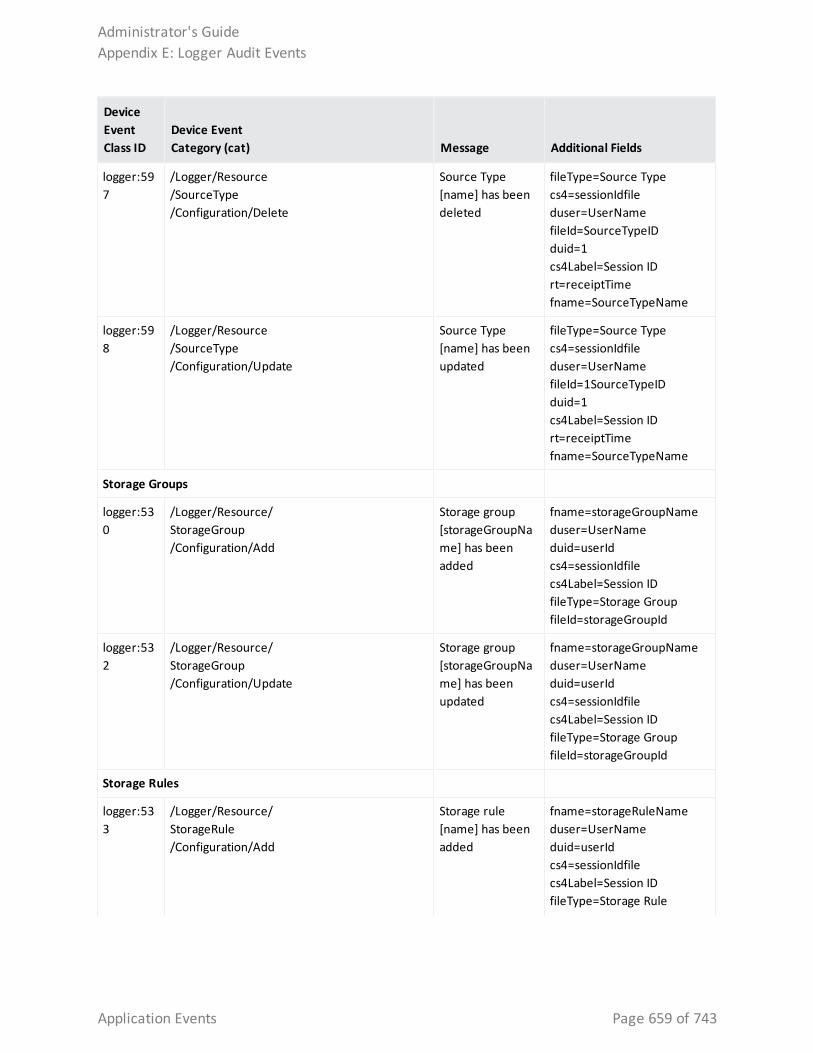
Device EventClass ID
Device Event Category (cat) Message Additional Fields
logger:597
/Logger/Resource/SourceType/Configuration/Delete
Source Type [name] has been deleted
fileType=Source Typecs4=sessionIdfileduser=UserNamefileId=SourceTypeIDduid=1cs4Label=Session IDrt=receiptTimefname=SourceTypeName
logger:598
/Logger/Resource/SourceType/Configuration/Update
Source Type [name] has been updated
fileType=Source Typecs4=sessionIdfileduser=UserNamefileId=1SourceTypeIDduid=1cs4Label=Session IDrt=receiptTimefname=SourceTypeName
Storage Groups
logger:530
/Logger/Resource/StorageGroup/Configuration/Add
Storage group [storageGroupName] has been added
fname=storageGroupNameduser=UserNameduid=userIdcs4=sessionIdfilecs4Label=Session IDfileType=Storage GroupfileId=storageGroupId
logger:532
/Logger/Resource/StorageGroup/Configuration/Update
Storage group [storageGroupName] has been updated
fname=storageGroupNameduser=UserNameduid=userIdcs4=sessionIdfilecs4Label=Session IDfileType=Storage GroupfileId=storageGroupId
Storage Rules
logger:533
/Logger/Resource/StorageRule/Configuration/Add
Storage rule [name] has been added
fname=storageRuleNameduser=UserNameduid=userIdcs4=sessionIdfilecs4Label=Session IDfileType=Storage Rule
Administrator's GuideAppendix E: Logger Audit Events
Application Events Page 659 of 743
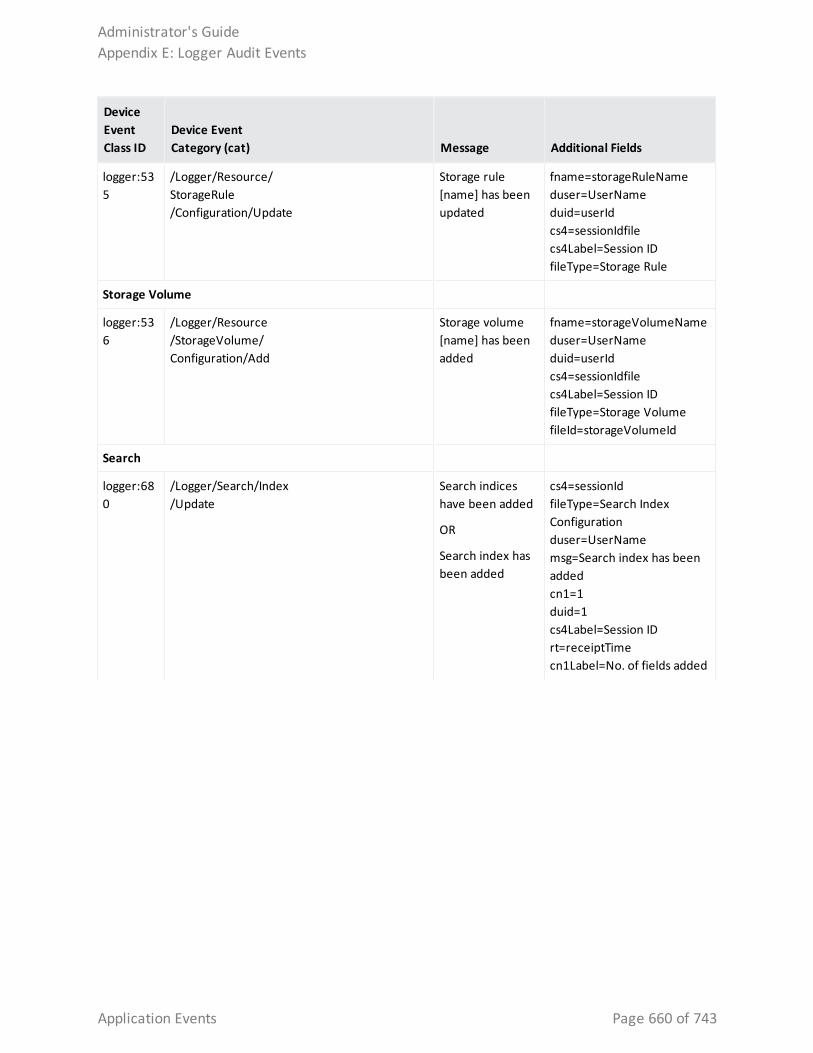
Device EventClass ID
Device Event Category (cat) Message Additional Fields
logger:535
/Logger/Resource/StorageRule/Configuration/Update
Storage rule [name] has been updated
fname=storageRuleNameduser=UserNameduid=userIdcs4=sessionIdfilecs4Label=Session IDfileType=Storage Rule
Storage Volume
logger:536
/Logger/Resource/StorageVolume/Configuration/Add
Storage volume [name] has been added
fname=storageVolumeNameduser=UserNameduid=userIdcs4=sessionIdfilecs4Label=Session IDfileType=Storage VolumefileId=storageVolumeId
Search
logger:680
/Logger/Search/Index/Update
Search indices have been added
OR
Search index has been added
cs4=sessionIdfileType=Search Index Configurationduser=UserNamemsg=Search index has been addedcn1=1duid=1cs4Label=Session IDrt=receiptTimecn1Label=No. of fields added
Administrator's GuideAppendix E: Logger Audit Events
Application Events Page 660 of 743
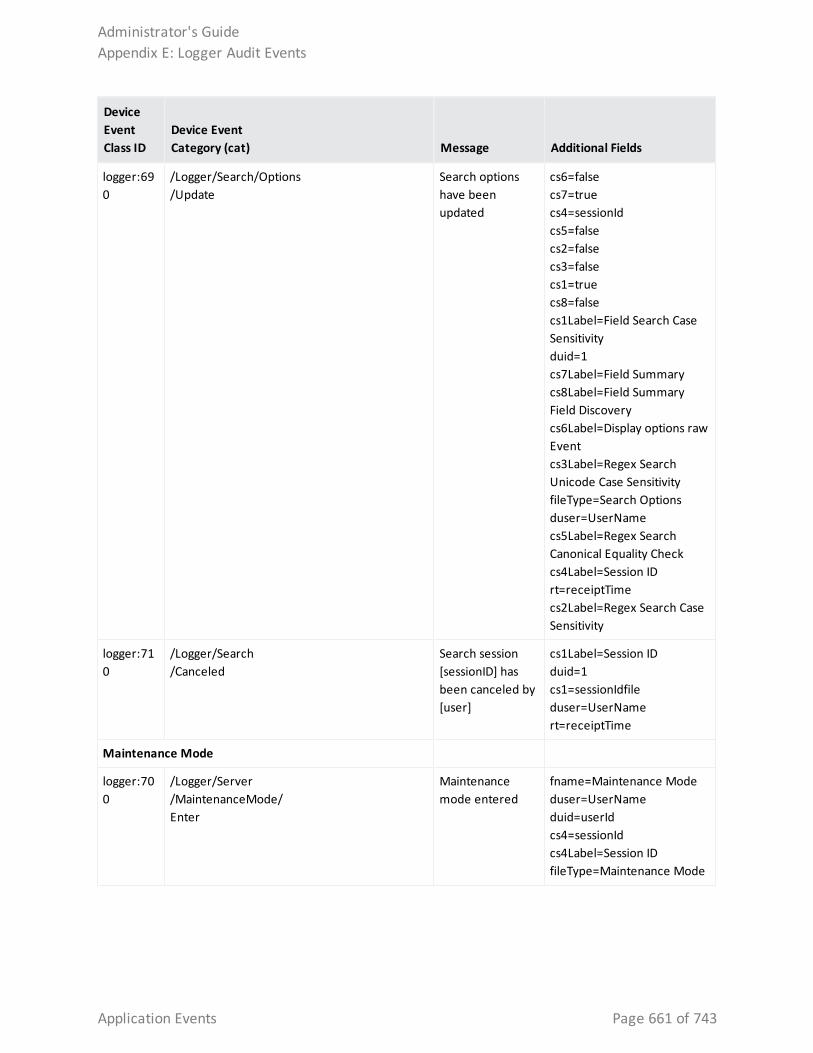
Device EventClass ID
Device Event Category (cat) Message Additional Fields
logger:690
/Logger/Search/Options/Update
Search options have been updated
cs6=falsecs7=truecs4=sessionIdcs5=falsecs2=falsecs3=falsecs1=truecs8=falsecs1Label=Field Search CaseSensitivityduid=1cs7Label=Field Summarycs8Label=Field Summary Field Discoverycs6Label=Display options raw Eventcs3Label=Regex SearchUnicode Case SensitivityfileType=Search Optionsduser=UserNamecs5Label=Regex Search Canonical Equality Checkcs4Label=Session IDrt=receiptTimecs2Label=Regex Search Case Sensitivity
logger:710
/Logger/Search/Canceled
Search session [sessionID] has been canceled by [user]
cs1Label=Session IDduid=1cs1=sessionIdfileduser=UserNamert=receiptTime
Maintenance Mode
logger:700
/Logger/Server/MaintenanceMode/Enter
Maintenance mode entered
fname=Maintenance Modeduser=UserNameduid=userIdcs4=sessionIdcs4Label=Session IDfileType=Maintenance Mode
Administrator's GuideAppendix E: Logger Audit Events
Application Events Page 661 of 743
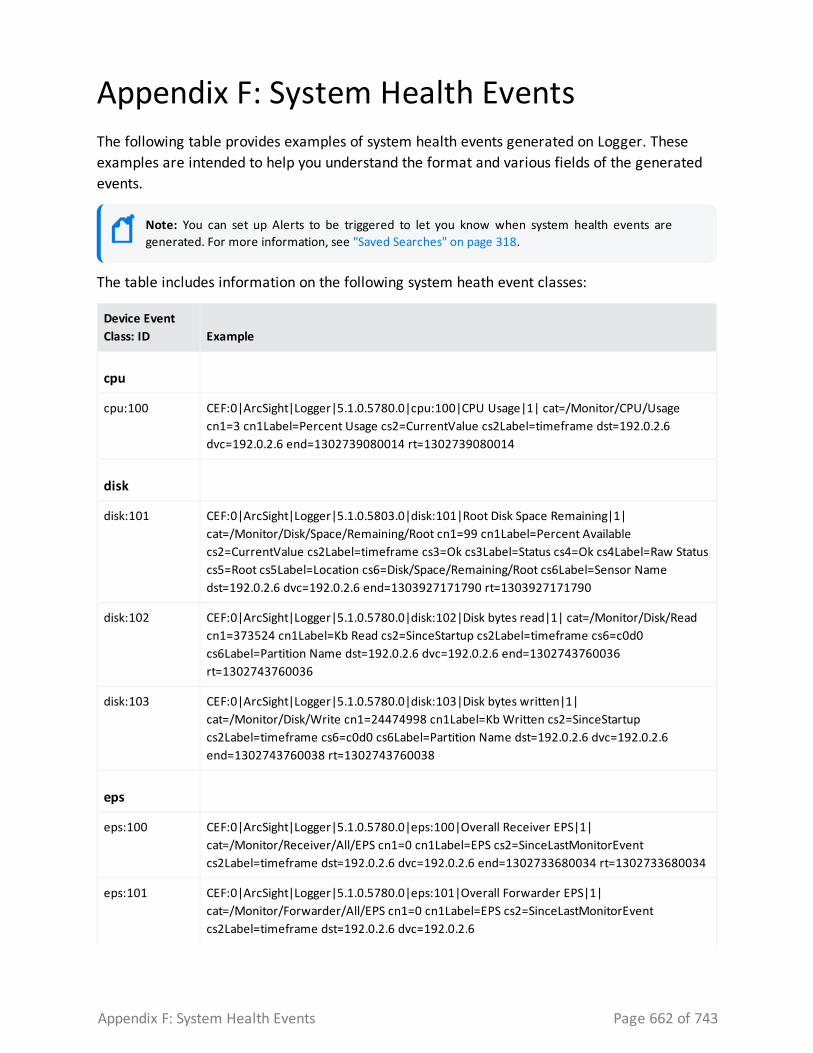
Appendix F: System Health EventsThe following table provides examples of system health events generated on Logger. These examples are intended to help you understand the format and various fields of the generated events.
Note: You can set up Alerts to be triggered to let you know when system health events are generated. For more information, see "Saved Searches" on page 318.
The table includes information on the following system heath event classes:
Device Event Class: ID Example
cpu
cpu:100 CEF:0|ArcSight|Logger|5.1.0.5780.0|cpu:100|CPU Usage|1| cat=/Monitor/CPU/Usage cn1=3 cn1Label=Percent Usage cs2=CurrentValue cs2Label=timeframe dst=192.0.2.6 dvc=192.0.2.6 end=1302739080014 rt=1302739080014
disk
disk:101 CEF:0|ArcSight|Logger|5.1.0.5803.0|disk:101|Root Disk Space Remaining|1| cat=/Monitor/Disk/Space/Remaining/Root cn1=99 cn1Label=Percent Available cs2=CurrentValue cs2Label=timeframe cs3=Ok cs3Label=Status cs4=Ok cs4Label=Raw Status cs5=Root cs5Label=Location cs6=Disk/Space/Remaining/Root cs6Label=Sensor Name dst=192.0.2.6 dvc=192.0.2.6 end=1303927171790 rt=1303927171790
disk:102 CEF:0|ArcSight|Logger|5.1.0.5780.0|disk:102|Disk bytes read|1| cat=/Monitor/Disk/Read cn1=373524 cn1Label=Kb Read cs2=SinceStartup cs2Label=timeframe cs6=c0d0 cs6Label=Partition Name dst=192.0.2.6 dvc=192.0.2.6 end=1302743760036 rt=1302743760036
disk:103 CEF:0|ArcSight|Logger|5.1.0.5780.0|disk:103|Disk bytes written|1| cat=/Monitor/Disk/Write cn1=24474998 cn1Label=Kb Written cs2=SinceStartup cs2Label=timeframe cs6=c0d0 cs6Label=Partition Name dst=192.0.2.6 dvc=192.0.2.6 end=1302743760038 rt=1302743760038
eps
eps:100 CEF:0|ArcSight|Logger|5.1.0.5780.0|eps:100|Overall Receiver EPS|1| cat=/Monitor/Receiver/All/EPS cn1=0 cn1Label=EPS cs2=SinceLastMonitorEvent cs2Label=timeframe dst=192.0.2.6 dvc=192.0.2.6 end=1302733680034 rt=1302733680034
eps:101 CEF:0|ArcSight|Logger|5.1.0.5780.0|eps:101|Overall Forwarder EPS|1| cat=/Monitor/Forwarder/All/EPS cn1=0 cn1Label=EPS cs2=SinceLastMonitorEvent cs2Label=timeframe dst=192.0.2.6 dvc=192.0.2.6
Appendix F: System Health Events Page 662 of 743
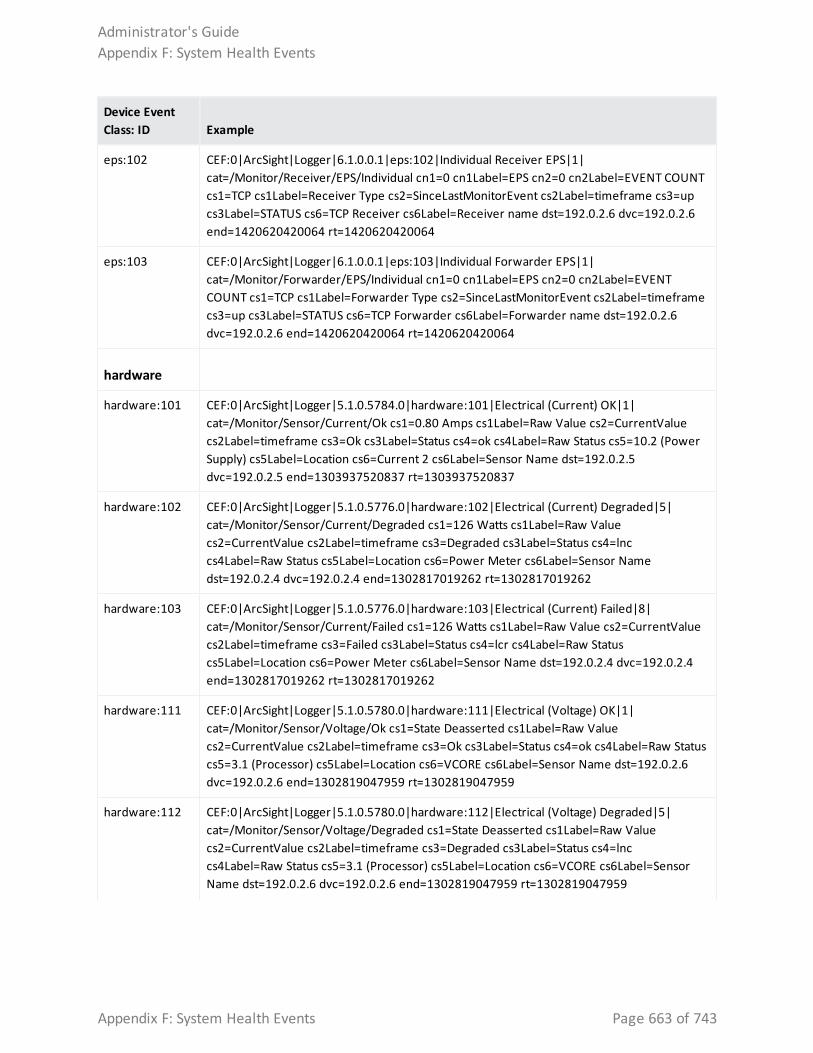
Device Event Class: ID Example
eps:102 CEF:0|ArcSight|Logger|6.1.0.0.1|eps:102|Individual Receiver EPS|1| cat=/Monitor/Receiver/EPS/Individual cn1=0 cn1Label=EPS cn2=0 cn2Label=EVENT COUNT cs1=TCP cs1Label=Receiver Type cs2=SinceLastMonitorEvent cs2Label=timeframe cs3=up cs3Label=STATUS cs6=TCP Receiver cs6Label=Receiver name dst=192.0.2.6 dvc=192.0.2.6 end=1420620420064 rt=1420620420064
eps:103 CEF:0|ArcSight|Logger|6.1.0.0.1|eps:103|Individual Forwarder EPS|1| cat=/Monitor/Forwarder/EPS/Individual cn1=0 cn1Label=EPS cn2=0 cn2Label=EVENT COUNT cs1=TCP cs1Label=Forwarder Type cs2=SinceLastMonitorEvent cs2Label=timeframe cs3=up cs3Label=STATUS cs6=TCP Forwarder cs6Label=Forwarder name dst=192.0.2.6 dvc=192.0.2.6 end=1420620420064 rt=1420620420064
hardware
hardware:101 CEF:0|ArcSight|Logger|5.1.0.5784.0|hardware:101|Electrical (Current) OK|1| cat=/Monitor/Sensor/Current/Ok cs1=0.80 Amps cs1Label=Raw Value cs2=CurrentValue cs2Label=timeframe cs3=Ok cs3Label=Status cs4=ok cs4Label=Raw Status cs5=10.2 (Power Supply) cs5Label=Location cs6=Current 2 cs6Label=Sensor Name dst=192.0.2.5 dvc=192.0.2.5 end=1303937520837 rt=1303937520837
hardware:102 CEF:0|ArcSight|Logger|5.1.0.5776.0|hardware:102|Electrical (Current) Degraded|5| cat=/Monitor/Sensor/Current/Degraded cs1=126 Watts cs1Label=Raw Value cs2=CurrentValue cs2Label=timeframe cs3=Degraded cs3Label=Status cs4=lnc cs4Label=Raw Status cs5Label=Location cs6=Power Meter cs6Label=Sensor Name dst=192.0.2.4 dvc=192.0.2.4 end=1302817019262 rt=1302817019262
hardware:103 CEF:0|ArcSight|Logger|5.1.0.5776.0|hardware:103|Electrical (Current) Failed|8| cat=/Monitor/Sensor/Current/Failed cs1=126 Watts cs1Label=Raw Value cs2=CurrentValue cs2Label=timeframe cs3=Failed cs3Label=Status cs4=lcr cs4Label=Raw Status cs5Label=Location cs6=Power Meter cs6Label=Sensor Name dst=192.0.2.4 dvc=192.0.2.4 end=1302817019262 rt=1302817019262
hardware:111 CEF:0|ArcSight|Logger|5.1.0.5780.0|hardware:111|Electrical (Voltage) OK|1| cat=/Monitor/Sensor/Voltage/Ok cs1=State Deasserted cs1Label=Raw Value cs2=CurrentValue cs2Label=timeframe cs3=Ok cs3Label=Status cs4=ok cs4Label=Raw Status cs5=3.1 (Processor) cs5Label=Location cs6=VCORE cs6Label=Sensor Name dst=192.0.2.6 dvc=192.0.2.6 end=1302819047959 rt=1302819047959
hardware:112 CEF:0|ArcSight|Logger|5.1.0.5780.0|hardware:112|Electrical (Voltage) Degraded|5| cat=/Monitor/Sensor/Voltage/Degraded cs1=State Deasserted cs1Label=Raw Value cs2=CurrentValue cs2Label=timeframe cs3=Degraded cs3Label=Status cs4=lnc cs4Label=Raw Status cs5=3.1 (Processor) cs5Label=Location cs6=VCORE cs6Label=Sensor Name dst=192.0.2.6 dvc=192.0.2.6 end=1302819047959 rt=1302819047959
Administrator's GuideAppendix F: System Health Events
Appendix F: System Health Events Page 663 of 743
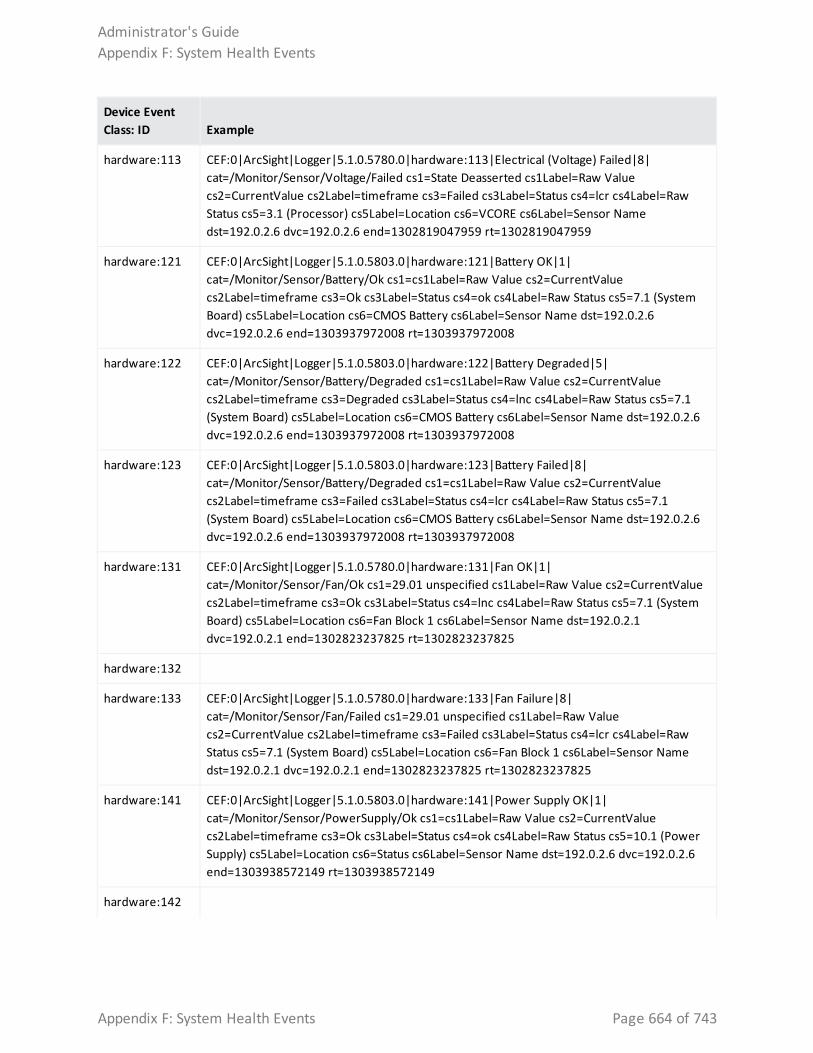
Device Event Class: ID Example
hardware:113 CEF:0|ArcSight|Logger|5.1.0.5780.0|hardware:113|Electrical (Voltage) Failed|8| cat=/Monitor/Sensor/Voltage/Failed cs1=State Deasserted cs1Label=Raw Value cs2=CurrentValue cs2Label=timeframe cs3=Failed cs3Label=Status cs4=lcr cs4Label=Raw Status cs5=3.1 (Processor) cs5Label=Location cs6=VCORE cs6Label=Sensor Name dst=192.0.2.6 dvc=192.0.2.6 end=1302819047959 rt=1302819047959
hardware:121 CEF:0|ArcSight|Logger|5.1.0.5803.0|hardware:121|Battery OK|1| cat=/Monitor/Sensor/Battery/Ok cs1=cs1Label=Raw Value cs2=CurrentValue cs2Label=timeframe cs3=Ok cs3Label=Status cs4=ok cs4Label=Raw Status cs5=7.1 (System Board) cs5Label=Location cs6=CMOS Battery cs6Label=Sensor Name dst=192.0.2.6 dvc=192.0.2.6 end=1303937972008 rt=1303937972008
hardware:122 CEF:0|ArcSight|Logger|5.1.0.5803.0|hardware:122|Battery Degraded|5| cat=/Monitor/Sensor/Battery/Degraded cs1=cs1Label=Raw Value cs2=CurrentValue cs2Label=timeframe cs3=Degraded cs3Label=Status cs4=lnc cs4Label=Raw Status cs5=7.1 (System Board) cs5Label=Location cs6=CMOS Battery cs6Label=Sensor Name dst=192.0.2.6 dvc=192.0.2.6 end=1303937972008 rt=1303937972008
hardware:123 CEF:0|ArcSight|Logger|5.1.0.5803.0|hardware:123|Battery Failed|8| cat=/Monitor/Sensor/Battery/Degraded cs1=cs1Label=Raw Value cs2=CurrentValue cs2Label=timeframe cs3=Failed cs3Label=Status cs4=lcr cs4Label=Raw Status cs5=7.1 (System Board) cs5Label=Location cs6=CMOS Battery cs6Label=Sensor Name dst=192.0.2.6 dvc=192.0.2.6 end=1303937972008 rt=1303937972008
hardware:131 CEF:0|ArcSight|Logger|5.1.0.5780.0|hardware:131|Fan OK|1| cat=/Monitor/Sensor/Fan/Ok cs1=29.01 unspecified cs1Label=Raw Value cs2=CurrentValue cs2Label=timeframe cs3=Ok cs3Label=Status cs4=lnc cs4Label=Raw Status cs5=7.1 (System Board) cs5Label=Location cs6=Fan Block 1 cs6Label=Sensor Name dst=192.0.2.1 dvc=192.0.2.1 end=1302823237825 rt=1302823237825
hardware:132
hardware:133 CEF:0|ArcSight|Logger|5.1.0.5780.0|hardware:133|Fan Failure|8| cat=/Monitor/Sensor/Fan/Failed cs1=29.01 unspecified cs1Label=Raw Value cs2=CurrentValue cs2Label=timeframe cs3=Failed cs3Label=Status cs4=lcr cs4Label=Raw Status cs5=7.1 (System Board) cs5Label=Location cs6=Fan Block 1 cs6Label=Sensor Name dst=192.0.2.1 dvc=192.0.2.1 end=1302823237825 rt=1302823237825
hardware:141 CEF:0|ArcSight|Logger|5.1.0.5803.0|hardware:141|Power Supply OK|1| cat=/Monitor/Sensor/PowerSupply/Ok cs1=cs1Label=Raw Value cs2=CurrentValue cs2Label=timeframe cs3=Ok cs3Label=Status cs4=ok cs4Label=Raw Status cs5=10.1 (Power Supply) cs5Label=Location cs6=Status cs6Label=Sensor Name dst=192.0.2.6 dvc=192.0.2.6 end=1303938572149 rt=1303938572149
hardware:142
Administrator's GuideAppendix F: System Health Events
Appendix F: System Health Events Page 664 of 743
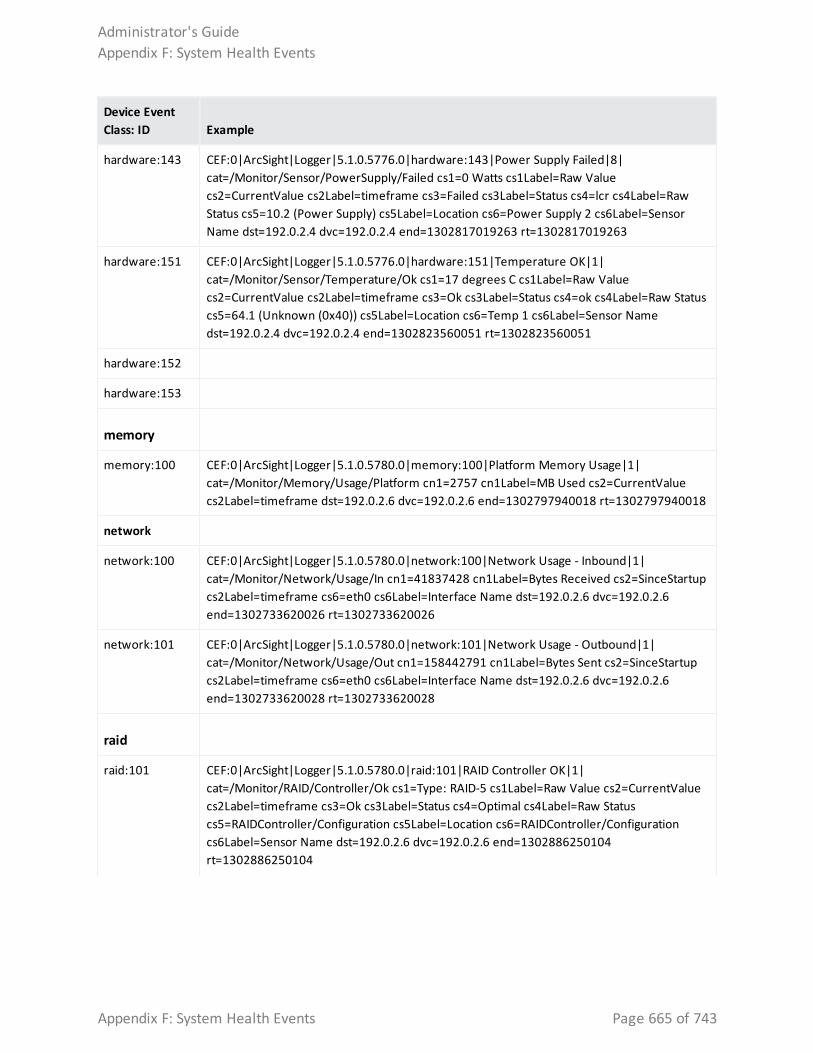
Device Event Class: ID Example
hardware:143 CEF:0|ArcSight|Logger|5.1.0.5776.0|hardware:143|Power Supply Failed|8| cat=/Monitor/Sensor/PowerSupply/Failed cs1=0 Watts cs1Label=Raw Value cs2=CurrentValue cs2Label=timeframe cs3=Failed cs3Label=Status cs4=lcr cs4Label=Raw Status cs5=10.2 (Power Supply) cs5Label=Location cs6=Power Supply 2 cs6Label=Sensor Name dst=192.0.2.4 dvc=192.0.2.4 end=1302817019263 rt=1302817019263
hardware:151 CEF:0|ArcSight|Logger|5.1.0.5776.0|hardware:151|Temperature OK|1| cat=/Monitor/Sensor/Temperature/Ok cs1=17 degrees C cs1Label=Raw Value cs2=CurrentValue cs2Label=timeframe cs3=Ok cs3Label=Status cs4=ok cs4Label=Raw Status cs5=64.1 (Unknown (0x40)) cs5Label=Location cs6=Temp 1 cs6Label=Sensor Name dst=192.0.2.4 dvc=192.0.2.4 end=1302823560051 rt=1302823560051
hardware:152
hardware:153
memory
memory:100 CEF:0|ArcSight|Logger|5.1.0.5780.0|memory:100|Platform Memory Usage|1| cat=/Monitor/Memory/Usage/Platform cn1=2757 cn1Label=MB Used cs2=CurrentValue cs2Label=timeframe dst=192.0.2.6 dvc=192.0.2.6 end=1302797940018 rt=1302797940018
network
network:100 CEF:0|ArcSight|Logger|5.1.0.5780.0|network:100|Network Usage - Inbound|1| cat=/Monitor/Network/Usage/In cn1=41837428 cn1Label=Bytes Received cs2=SinceStartup cs2Label=timeframe cs6=eth0 cs6Label=Interface Name dst=192.0.2.6 dvc=192.0.2.6 end=1302733620026 rt=1302733620026
network:101 CEF:0|ArcSight|Logger|5.1.0.5780.0|network:101|Network Usage - Outbound|1| cat=/Monitor/Network/Usage/Out cn1=158442791 cn1Label=Bytes Sent cs2=SinceStartup cs2Label=timeframe cs6=eth0 cs6Label=Interface Name dst=192.0.2.6 dvc=192.0.2.6 end=1302733620028 rt=1302733620028
raid
raid:101 CEF:0|ArcSight|Logger|5.1.0.5780.0|raid:101|RAID Controller OK|1| cat=/Monitor/RAID/Controller/Ok cs1=Type: RAID-5 cs1Label=Raw Value cs2=CurrentValue cs2Label=timeframe cs3=Ok cs3Label=Status cs4=Optimal cs4Label=Raw Status cs5=RAIDController/Configuration cs5Label=Location cs6=RAIDController/Configuration cs6Label=Sensor Name dst=192.0.2.6 dvc=192.0.2.6 end=1302886250104 rt=1302886250104
Administrator's GuideAppendix F: System Health Events
Appendix F: System Health Events Page 665 of 743
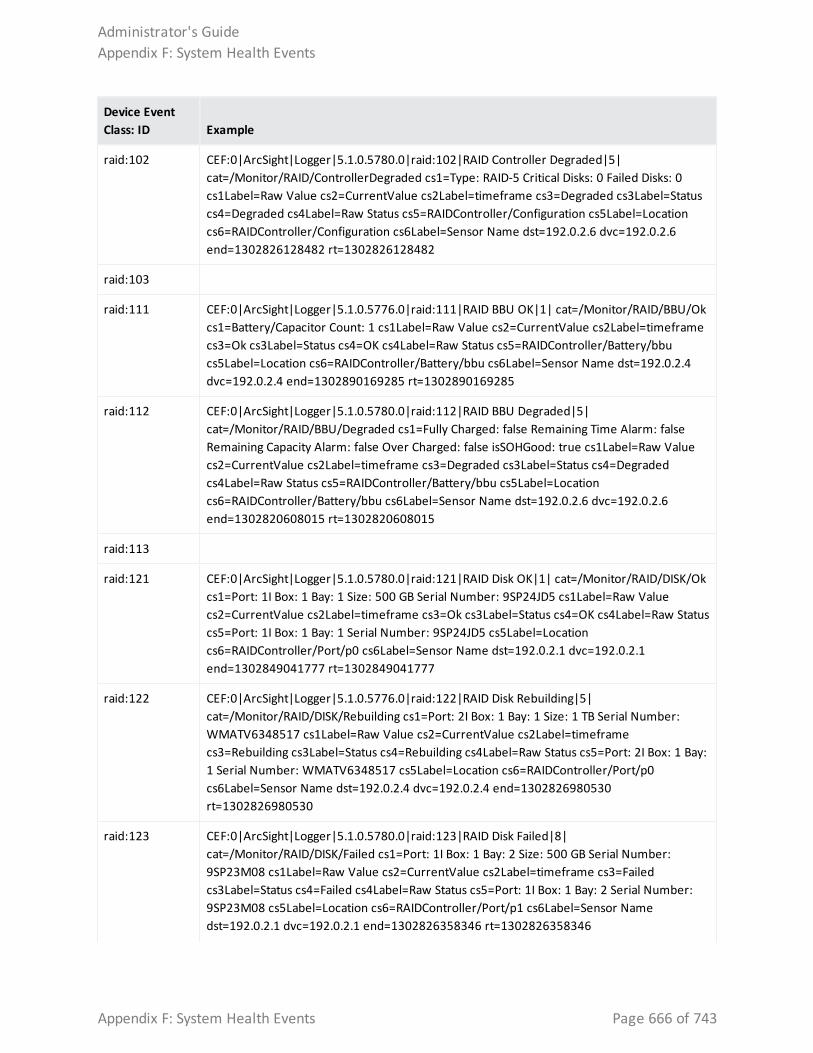
Device Event Class: ID Example
raid:102 CEF:0|ArcSight|Logger|5.1.0.5780.0|raid:102|RAID Controller Degraded|5| cat=/Monitor/RAID/ControllerDegraded cs1=Type: RAID-5 Critical Disks: 0 Failed Disks: 0 cs1Label=Raw Value cs2=CurrentValue cs2Label=timeframe cs3=Degraded cs3Label=Status cs4=Degraded cs4Label=Raw Status cs5=RAIDController/Configuration cs5Label=Location cs6=RAIDController/Configuration cs6Label=Sensor Name dst=192.0.2.6 dvc=192.0.2.6 end=1302826128482 rt=1302826128482
raid:103
raid:111 CEF:0|ArcSight|Logger|5.1.0.5776.0|raid:111|RAID BBU OK|1| cat=/Monitor/RAID/BBU/Ok cs1=Battery/Capacitor Count: 1 cs1Label=Raw Value cs2=CurrentValue cs2Label=timeframe cs3=Ok cs3Label=Status cs4=OK cs4Label=Raw Status cs5=RAIDController/Battery/bbu cs5Label=Location cs6=RAIDController/Battery/bbu cs6Label=Sensor Name dst=192.0.2.4 dvc=192.0.2.4 end=1302890169285 rt=1302890169285
raid:112 CEF:0|ArcSight|Logger|5.1.0.5780.0|raid:112|RAID BBU Degraded|5| cat=/Monitor/RAID/BBU/Degraded cs1=Fully Charged: false Remaining Time Alarm: false Remaining Capacity Alarm: false Over Charged: false isSOHGood: true cs1Label=Raw Value cs2=CurrentValue cs2Label=timeframe cs3=Degraded cs3Label=Status cs4=Degraded cs4Label=Raw Status cs5=RAIDController/Battery/bbu cs5Label=Location cs6=RAIDController/Battery/bbu cs6Label=Sensor Name dst=192.0.2.6 dvc=192.0.2.6 end=1302820608015 rt=1302820608015
raid:113
raid:121 CEF:0|ArcSight|Logger|5.1.0.5780.0|raid:121|RAID Disk OK|1| cat=/Monitor/RAID/DISK/Ok cs1=Port: 1I Box: 1 Bay: 1 Size: 500 GB Serial Number: 9SP24JD5 cs1Label=Raw Value cs2=CurrentValue cs2Label=timeframe cs3=Ok cs3Label=Status cs4=OK cs4Label=Raw Status cs5=Port: 1I Box: 1 Bay: 1 Serial Number: 9SP24JD5 cs5Label=Location cs6=RAIDController/Port/p0 cs6Label=Sensor Name dst=192.0.2.1 dvc=192.0.2.1 end=1302849041777 rt=1302849041777
raid:122 CEF:0|ArcSight|Logger|5.1.0.5776.0|raid:122|RAID Disk Rebuilding|5| cat=/Monitor/RAID/DISK/Rebuilding cs1=Port: 2I Box: 1 Bay: 1 Size: 1 TB Serial Number: WMATV6348517 cs1Label=Raw Value cs2=CurrentValue cs2Label=timeframe cs3=Rebuilding cs3Label=Status cs4=Rebuilding cs4Label=Raw Status cs5=Port: 2I Box: 1 Bay: 1 Serial Number: WMATV6348517 cs5Label=Location cs6=RAIDController/Port/p0 cs6Label=Sensor Name dst=192.0.2.4 dvc=192.0.2.4 end=1302826980530 rt=1302826980530
raid:123 CEF:0|ArcSight|Logger|5.1.0.5780.0|raid:123|RAID Disk Failed|8| cat=/Monitor/RAID/DISK/Failed cs1=Port: 1I Box: 1 Bay: 2 Size: 500 GB Serial Number: 9SP23M08 cs1Label=Raw Value cs2=CurrentValue cs2Label=timeframe cs3=Failed cs3Label=Status cs4=Failed cs4Label=Raw Status cs5=Port: 1I Box: 1 Bay: 2 Serial Number: 9SP23M08 cs5Label=Location cs6=RAIDController/Port/p1 cs6Label=Sensor Name dst=192.0.2.1 dvc=192.0.2.1 end=1302826358346 rt=1302826358346
Administrator's GuideAppendix F: System Health Events
Appendix F: System Health Events Page 666 of 743
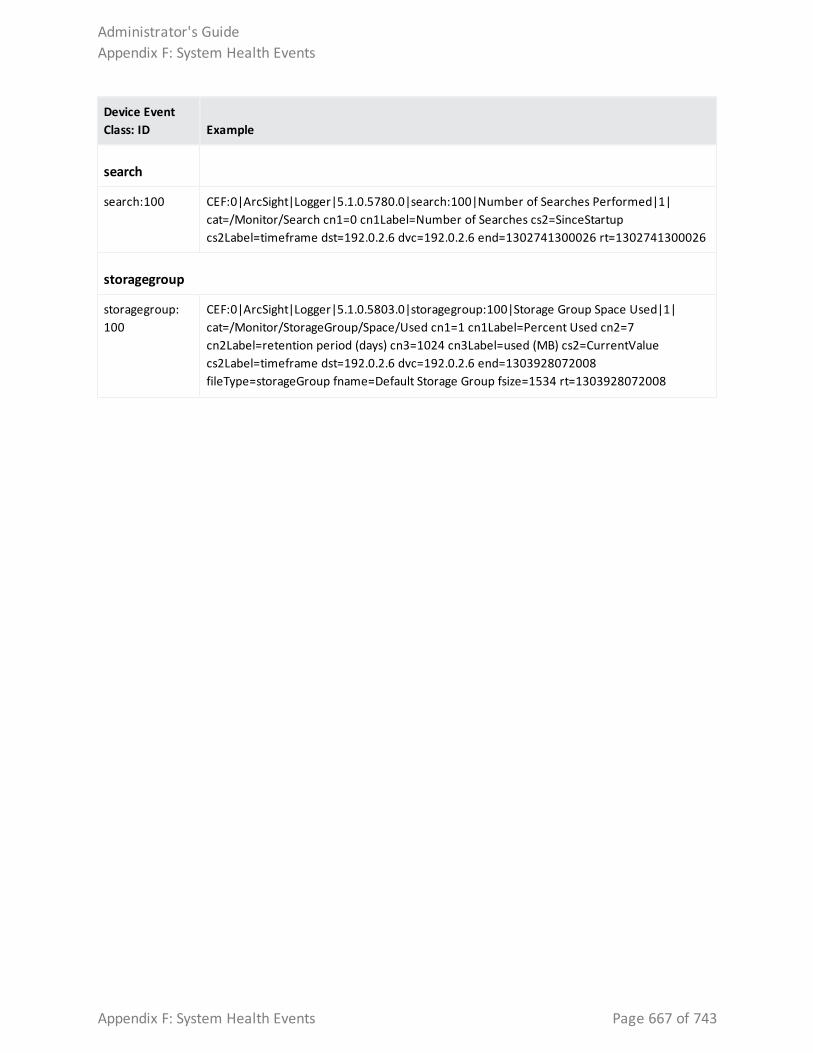
Device Event Class: ID Example
search
search:100 CEF:0|ArcSight|Logger|5.1.0.5780.0|search:100|Number of Searches Performed|1| cat=/Monitor/Search cn1=0 cn1Label=Number of Searches cs2=SinceStartup cs2Label=timeframe dst=192.0.2.6 dvc=192.0.2.6 end=1302741300026 rt=1302741300026
storagegroup
storagegroup:100
CEF:0|ArcSight|Logger|5.1.0.5803.0|storagegroup:100|Storage Group Space Used|1| cat=/Monitor/StorageGroup/Space/Used cn1=1 cn1Label=Percent Used cn2=7 cn2Label=retention period (days) cn3=1024 cn3Label=used (MB) cs2=CurrentValue cs2Label=timeframe dst=192.0.2.6 dvc=192.0.2.6 end=1303928072008 fileType=storageGroup fname=Default Storage Group fsize=1534 rt=1303928072008
Administrator's GuideAppendix F: System Health Events
Appendix F: System Health Events Page 667 of 743
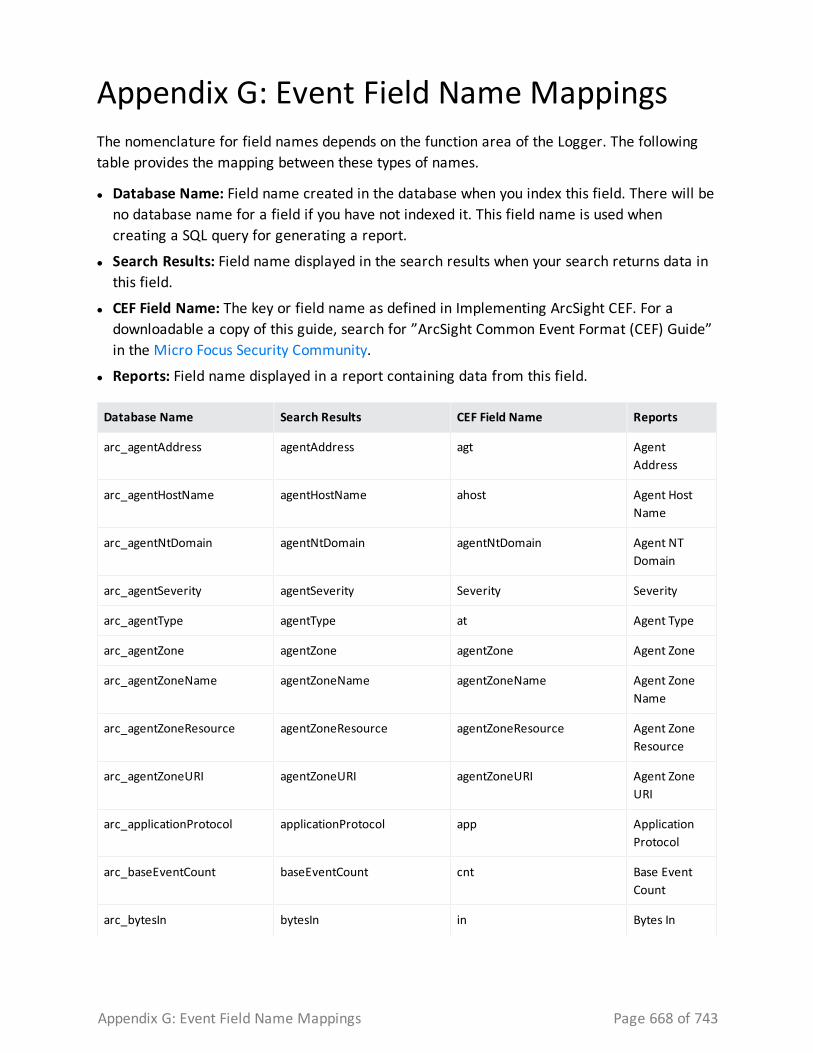
Appendix G: Event Field Name MappingsThe nomenclature for field names depends on the function area of the Logger. The following table provides the mapping between these types of names.
l Database Name: Field name created in the database when you index this field. There will be no database name for a field if you have not indexed it. This field name is used when creating a SQL query for generating a report.
l Search Results: Field name displayed in the search results when your search returns data in this field.
l CEF Field Name: The key or field name as defined in Implementing ArcSight CEF. For a downloadable a copy of this guide, search for ”ArcSight Common Event Format (CEF) Guide” in the Micro Focus Security Community.
l Reports: Field name displayed in a report containing data from this field.
Database Name Search Results CEF Field Name Reports
arc_agentAddress agentAddress agt Agent Address
arc_agentHostName agentHostName ahost Agent Host Name
arc_agentNtDomain agentNtDomain agentNtDomain Agent NT Domain
arc_agentSeverity agentSeverity Severity Severity
arc_agentType agentType at Agent Type
arc_agentZone agentZone agentZone Agent Zone
arc_agentZoneName agentZoneName agentZoneName Agent Zone Name
arc_agentZoneResource agentZoneResource agentZoneResource Agent Zone Resource
arc_agentZoneURI agentZoneURI agentZoneURI Agent Zone URI
arc_applicationProtocol applicationProtocol app Application Protocol
arc_baseEventCount baseEventCount cnt Base Event Count
arc_bytesIn bytesIn in Bytes In
Appendix G: Event Field Name Mappings Page 668 of 743
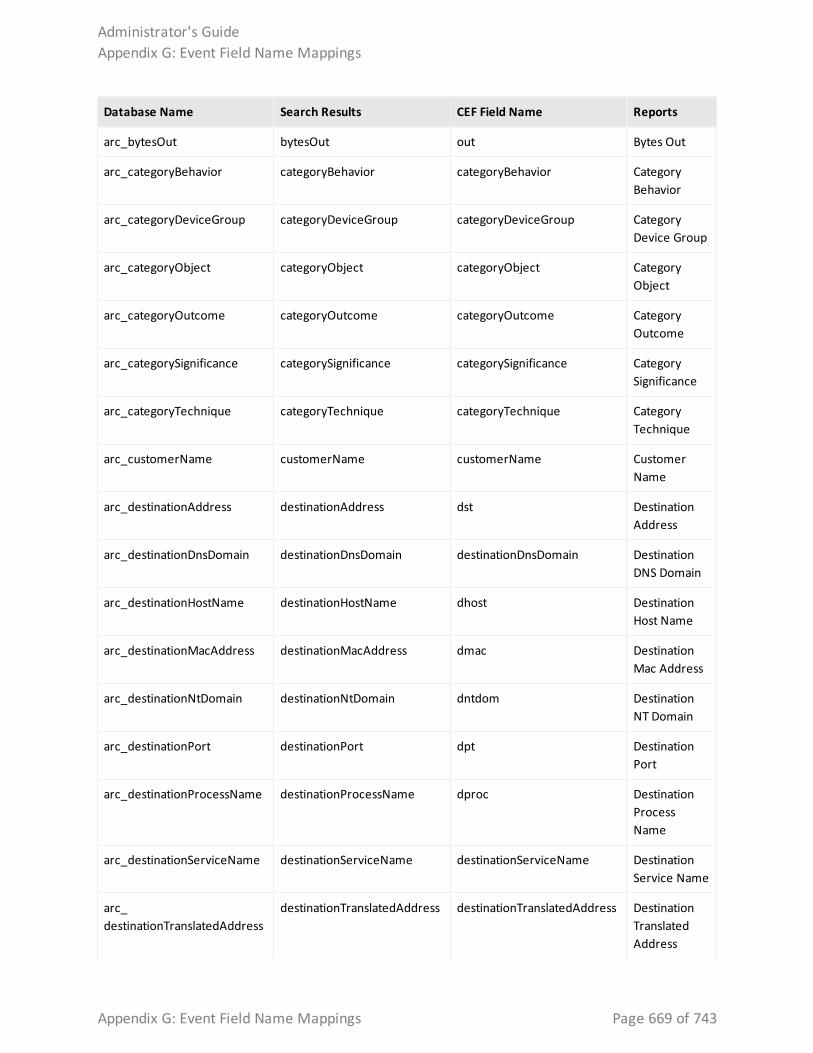
Database Name Search Results CEF Field Name Reports
arc_bytesOut bytesOut out Bytes Out
arc_categoryBehavior categoryBehavior categoryBehavior Category Behavior
arc_categoryDeviceGroup categoryDeviceGroup categoryDeviceGroup Category Device Group
arc_categoryObject categoryObject categoryObject Category Object
arc_categoryOutcome categoryOutcome categoryOutcome Category Outcome
arc_categorySignificance categorySignificance categorySignificance Category Significance
arc_categoryTechnique categoryTechnique categoryTechnique Category Technique
arc_customerName customerName customerName Customer Name
arc_destinationAddress destinationAddress dst Destination Address
arc_destinationDnsDomain destinationDnsDomain destinationDnsDomain Destination DNS Domain
arc_destinationHostName destinationHostName dhost Destination Host Name
arc_destinationMacAddress destinationMacAddress dmac Destination Mac Address
arc_destinationNtDomain destinationNtDomain dntdom Destination NT Domain
arc_destinationPort destinationPort dpt Destination Port
arc_destinationProcessName destinationProcessName dproc Destination Process Name
arc_destinationServiceName destinationServiceName destinationServiceName Destination Service Name
arc_destinationTranslatedAddress
destinationTranslatedAddress destinationTranslatedAddress Destination Translated Address
Administrator's GuideAppendix G: Event Field Name Mappings
Appendix G: Event Field Name Mappings Page 669 of 743
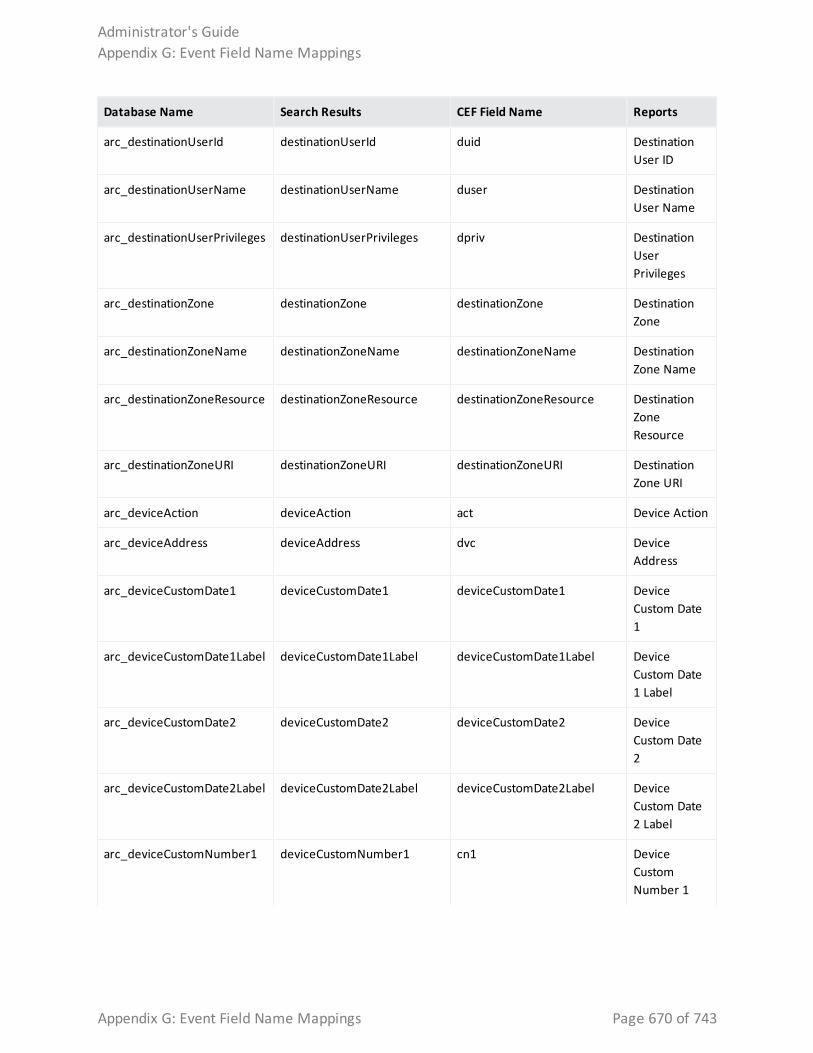
Database Name Search Results CEF Field Name Reports
arc_destinationUserId destinationUserId duid Destination User ID
arc_destinationUserName destinationUserName duser Destination User Name
arc_destinationUserPrivileges destinationUserPrivileges dpriv Destination User Privileges
arc_destinationZone destinationZone destinationZone Destination Zone
arc_destinationZoneName destinationZoneName destinationZoneName Destination Zone Name
arc_destinationZoneResource destinationZoneResource destinationZoneResource Destination Zone Resource
arc_destinationZoneURI destinationZoneURI destinationZoneURI Destination Zone URI
arc_deviceAction deviceAction act Device Action
arc_deviceAddress deviceAddress dvc Device Address
arc_deviceCustomDate1 deviceCustomDate1 deviceCustomDate1 Device Custom Date 1
arc_deviceCustomDate1Label deviceCustomDate1Label deviceCustomDate1Label Device Custom Date 1 Label
arc_deviceCustomDate2 deviceCustomDate2 deviceCustomDate2 Device Custom Date 2
arc_deviceCustomDate2Label deviceCustomDate2Label deviceCustomDate2Label Device Custom Date 2 Label
arc_deviceCustomNumber1 deviceCustomNumber1 cn1 Device Custom Number 1
Administrator's GuideAppendix G: Event Field Name Mappings
Appendix G: Event Field Name Mappings Page 670 of 743
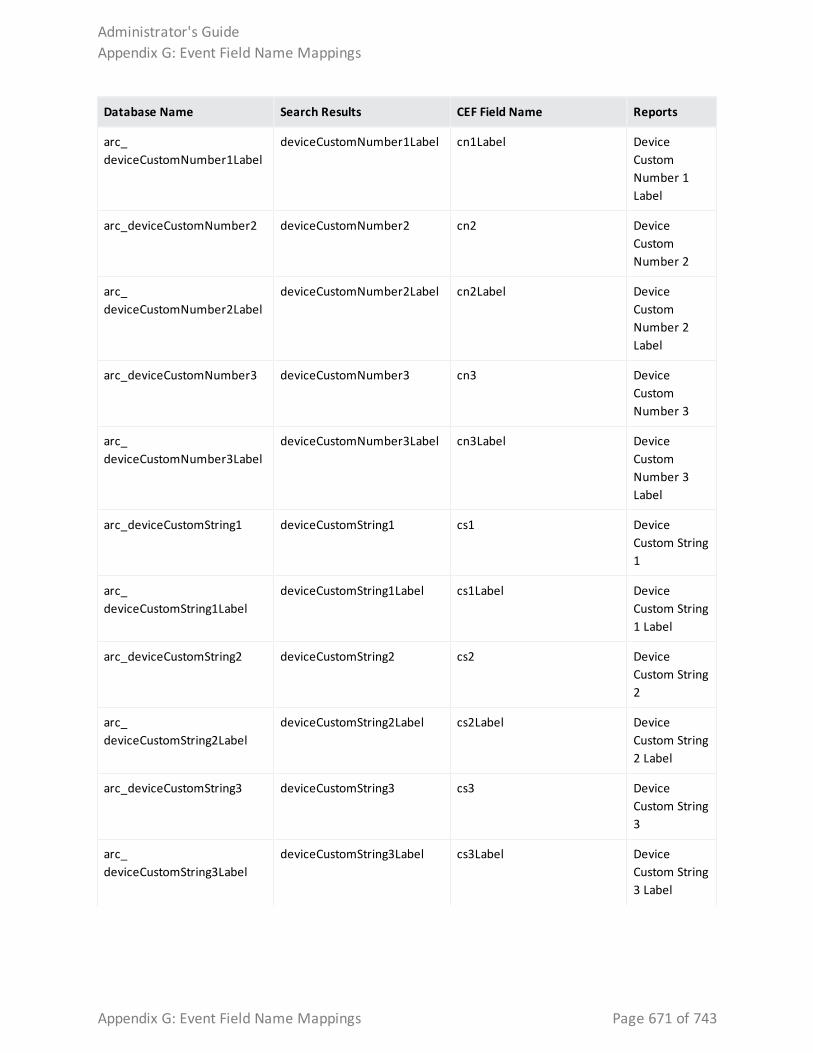
Database Name Search Results CEF Field Name Reports
arc_deviceCustomNumber1Label
deviceCustomNumber1Label cn1Label Device Custom Number 1 Label
arc_deviceCustomNumber2 deviceCustomNumber2 cn2 Device Custom Number 2
arc_deviceCustomNumber2Label
deviceCustomNumber2Label cn2Label Device Custom Number 2 Label
arc_deviceCustomNumber3 deviceCustomNumber3 cn3 Device Custom Number 3
arc_deviceCustomNumber3Label
deviceCustomNumber3Label cn3Label Device Custom Number 3 Label
arc_deviceCustomString1 deviceCustomString1 cs1 Device Custom String 1
arc_deviceCustomString1Label
deviceCustomString1Label cs1Label Device Custom String 1 Label
arc_deviceCustomString2 deviceCustomString2 cs2 Device Custom String 2
arc_deviceCustomString2Label
deviceCustomString2Label cs2Label Device Custom String 2 Label
arc_deviceCustomString3 deviceCustomString3 cs3 Device Custom String 3
arc_deviceCustomString3Label
deviceCustomString3Label cs3Label Device Custom String 3 Label
Administrator's GuideAppendix G: Event Field Name Mappings
Appendix G: Event Field Name Mappings Page 671 of 743
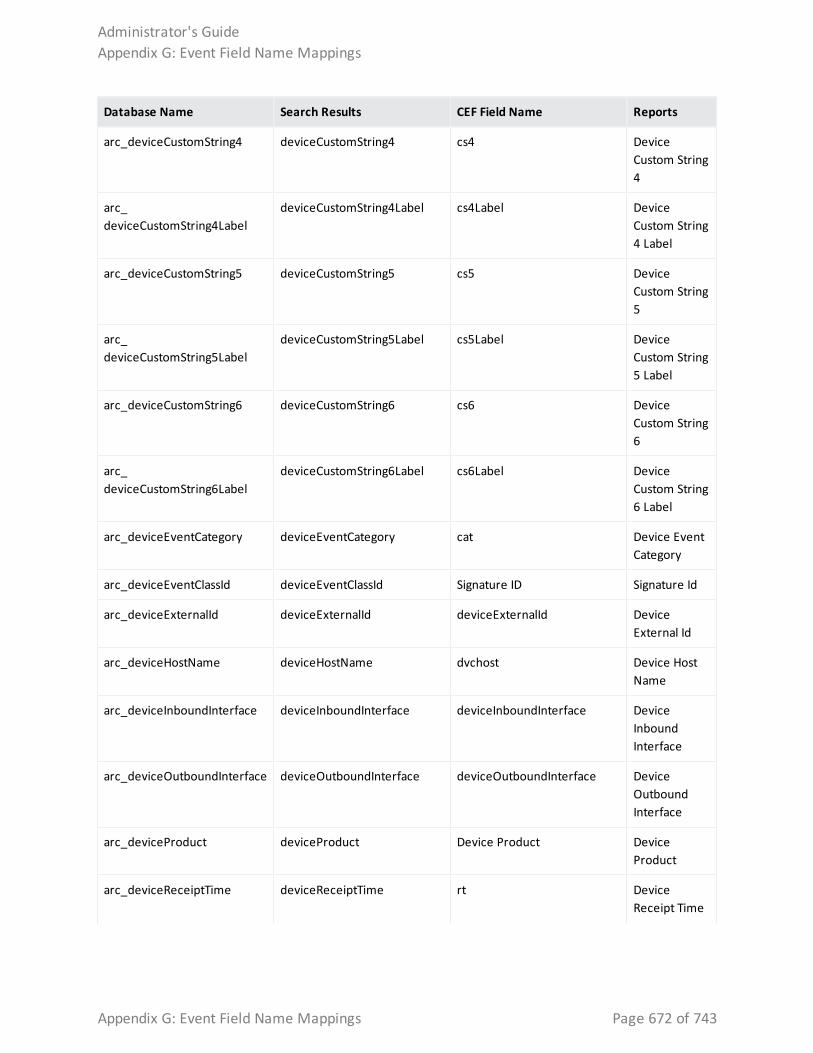
Database Name Search Results CEF Field Name Reports
arc_deviceCustomString4 deviceCustomString4 cs4 Device Custom String 4
arc_deviceCustomString4Label
deviceCustomString4Label cs4Label Device Custom String 4 Label
arc_deviceCustomString5 deviceCustomString5 cs5 Device Custom String 5
arc_deviceCustomString5Label
deviceCustomString5Label cs5Label Device Custom String 5 Label
arc_deviceCustomString6 deviceCustomString6 cs6 Device Custom String 6
arc_deviceCustomString6Label
deviceCustomString6Label cs6Label Device Custom String 6 Label
arc_deviceEventCategory deviceEventCategory cat Device Event Category
arc_deviceEventClassId deviceEventClassId Signature ID Signature Id
arc_deviceExternalId deviceExternalId deviceExternalId Device External Id
arc_deviceHostName deviceHostName dvchost Device Host Name
arc_deviceInboundInterface deviceInboundInterface deviceInboundInterface Device Inbound Interface
arc_deviceOutboundInterface deviceOutboundInterface deviceOutboundInterface Device Outbound Interface
arc_deviceProduct deviceProduct Device Product Device Product
arc_deviceReceiptTime deviceReceiptTime rt Device Receipt Time
Administrator's GuideAppendix G: Event Field Name Mappings
Appendix G: Event Field Name Mappings Page 672 of 743
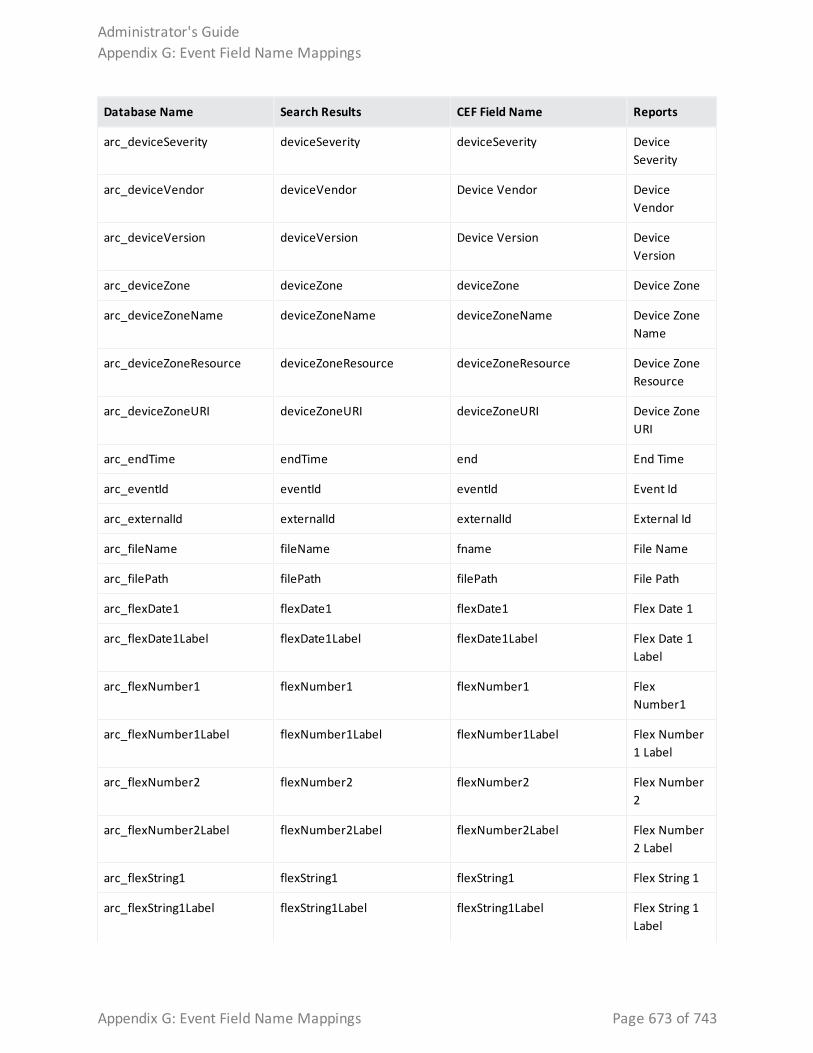
Database Name Search Results CEF Field Name Reports
arc_deviceSeverity deviceSeverity deviceSeverity Device Severity
arc_deviceVendor deviceVendor Device Vendor Device Vendor
arc_deviceVersion deviceVersion Device Version Device Version
arc_deviceZone deviceZone deviceZone Device Zone
arc_deviceZoneName deviceZoneName deviceZoneName Device Zone Name
arc_deviceZoneResource deviceZoneResource deviceZoneResource Device Zone Resource
arc_deviceZoneURI deviceZoneURI deviceZoneURI Device Zone URI
arc_endTime endTime end End Time
arc_eventId eventId eventId Event Id
arc_externalId externalId externalId External Id
arc_fileName fileName fname File Name
arc_filePath filePath filePath File Path
arc_flexDate1 flexDate1 flexDate1 Flex Date 1
arc_flexDate1Label flexDate1Label flexDate1Label Flex Date 1 Label
arc_flexNumber1 flexNumber1 flexNumber1 Flex Number1
arc_flexNumber1Label flexNumber1Label flexNumber1Label Flex Number 1 Label
arc_flexNumber2 flexNumber2 flexNumber2 Flex Number 2
arc_flexNumber2Label flexNumber2Label flexNumber2Label Flex Number 2 Label
arc_flexString1 flexString1 flexString1 Flex String 1
arc_flexString1Label flexString1Label flexString1Label Flex String 1 Label
Administrator's GuideAppendix G: Event Field Name Mappings
Appendix G: Event Field Name Mappings Page 673 of 743
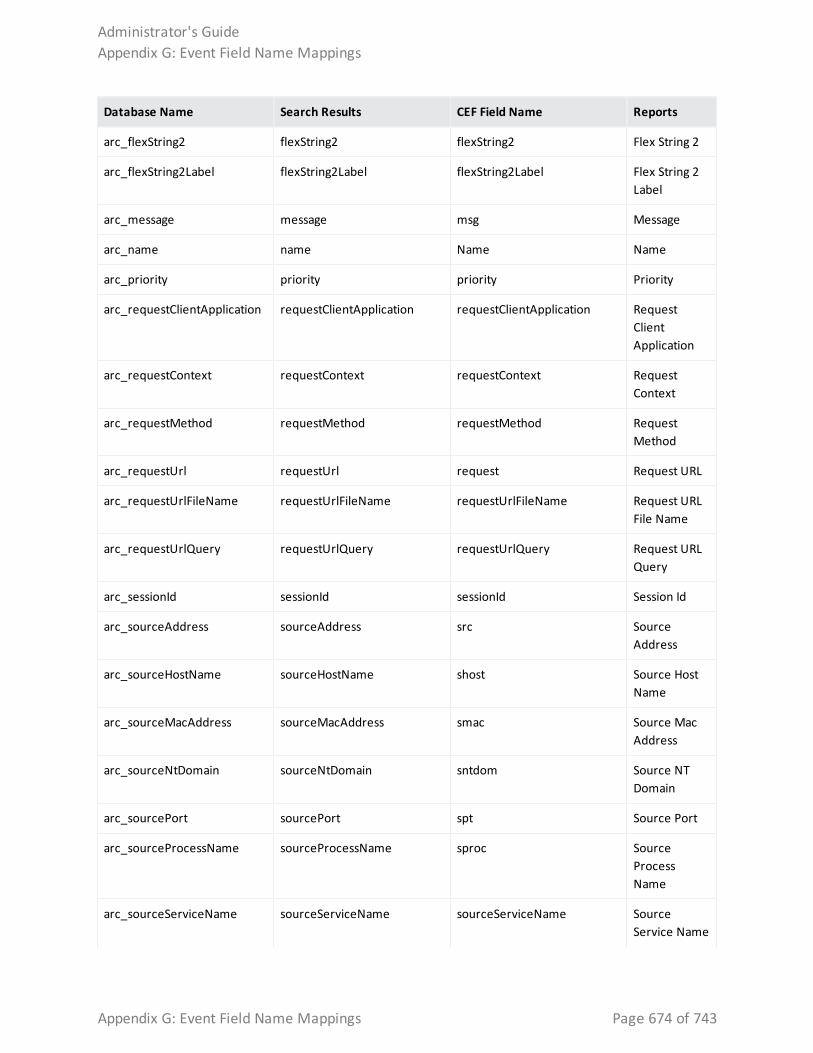
Database Name Search Results CEF Field Name Reports
arc_flexString2 flexString2 flexString2 Flex String 2
arc_flexString2Label flexString2Label flexString2Label Flex String 2 Label
arc_message message msg Message
arc_name name Name Name
arc_priority priority priority Priority
arc_requestClientApplication requestClientApplication requestClientApplication Request Client Application
arc_requestContext requestContext requestContext Request Context
arc_requestMethod requestMethod requestMethod Request Method
arc_requestUrl requestUrl request Request URL
arc_requestUrlFileName requestUrlFileName requestUrlFileName Request URL File Name
arc_requestUrlQuery requestUrlQuery requestUrlQuery Request URL Query
arc_sessionId sessionId sessionId Session Id
arc_sourceAddress sourceAddress src Source Address
arc_sourceHostName sourceHostName shost Source Host Name
arc_sourceMacAddress sourceMacAddress smac Source Mac Address
arc_sourceNtDomain sourceNtDomain sntdom Source NT Domain
arc_sourcePort sourcePort spt Source Port
arc_sourceProcessName sourceProcessName sproc Source Process Name
arc_sourceServiceName sourceServiceName sourceServiceName Source Service Name
Administrator's GuideAppendix G: Event Field Name Mappings
Appendix G: Event Field Name Mappings Page 674 of 743
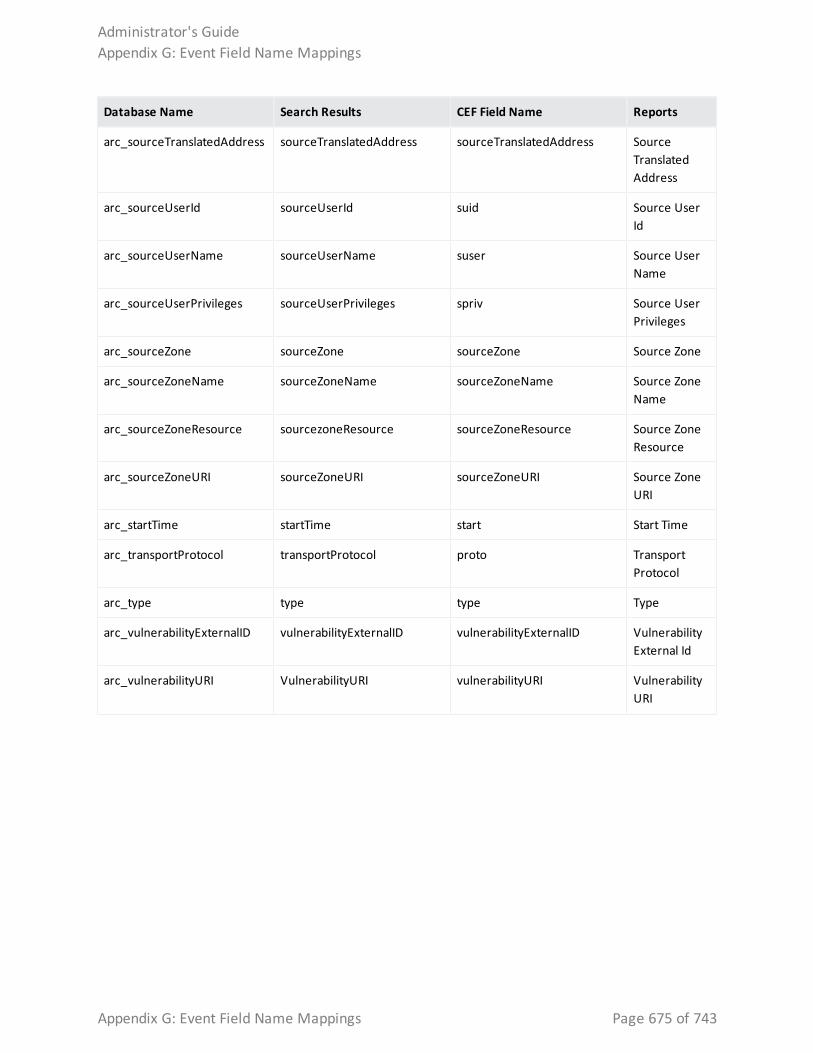
Database Name Search Results CEF Field Name Reports
arc_sourceTranslatedAddress sourceTranslatedAddress sourceTranslatedAddress Source Translated Address
arc_sourceUserId sourceUserId suid Source User Id
arc_sourceUserName sourceUserName suser Source User Name
arc_sourceUserPrivileges sourceUserPrivileges spriv Source User Privileges
arc_sourceZone sourceZone sourceZone Source Zone
arc_sourceZoneName sourceZoneName sourceZoneName Source Zone Name
arc_sourceZoneResource sourcezoneResource sourceZoneResource Source Zone Resource
arc_sourceZoneURI sourceZoneURI sourceZoneURI Source Zone URI
arc_startTime startTime start Start Time
arc_transportProtocol transportProtocol proto Transport Protocol
arc_type type type Type
arc_vulnerabilityExternalID vulnerabilityExternalID vulnerabilityExternalID Vulnerability External Id
arc_vulnerabilityURI VulnerabilityURI vulnerabilityURI Vulnerability URI
Administrator's GuideAppendix G: Event Field Name Mappings
Appendix G: Event Field Name Mappings Page 675 of 743
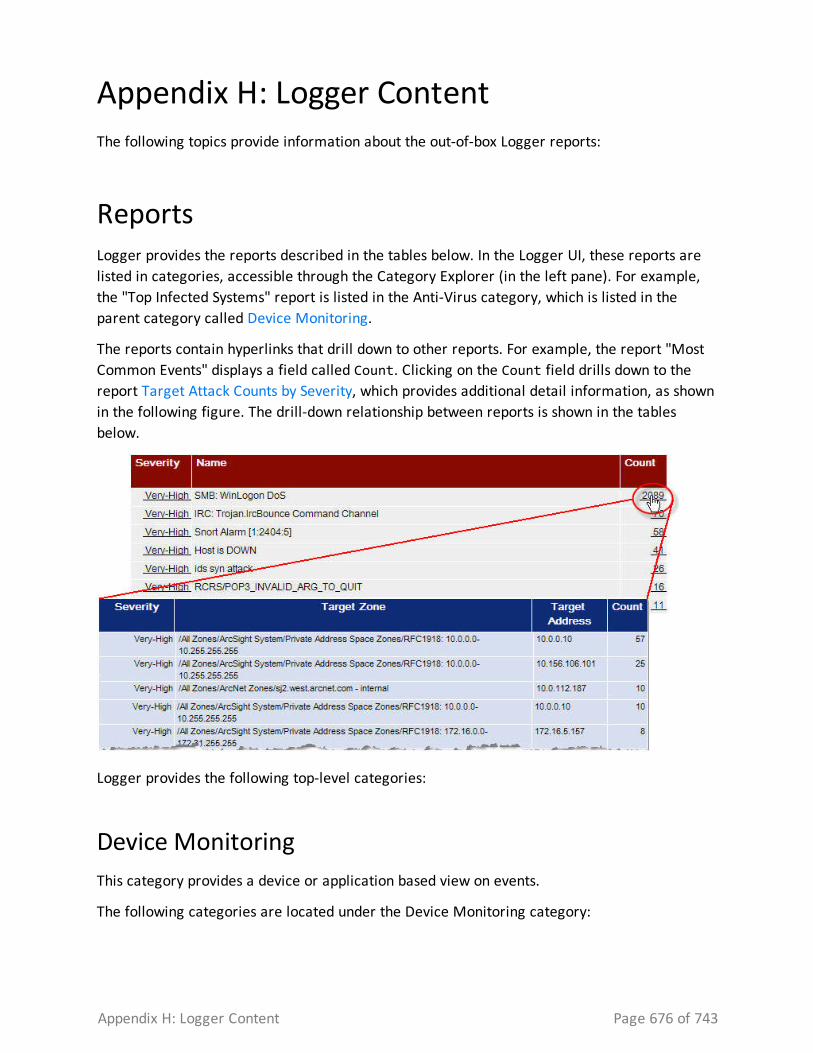
Appendix H: Logger ContentThe following topics provide information about the out-of-box Logger reports:
ReportsLogger provides the reports described in the tables below. In the Logger UI, these reports are listed in categories, accessible through the Category Explorer (in the left pane). For example, the "Top Infected Systems" report is listed in the Anti-Virus category, which is listed in the parent category called Device Monitoring.
The reports contain hyperlinks that drill down to other reports. For example, the report "Most Common Events" displays a field called Count. Clicking on the Count field drills down to the report Target Attack Counts by Severity, which provides additional detail information, as shown in the following figure. The drill-down relationship between reports is shown in the tables below.
Logger provides the following top-level categories:
Device MonitoringThis category provides a device or application based view on events.
The following categories are located under the Device Monitoring category:
Appendix H: Logger Content Page 676 of 743
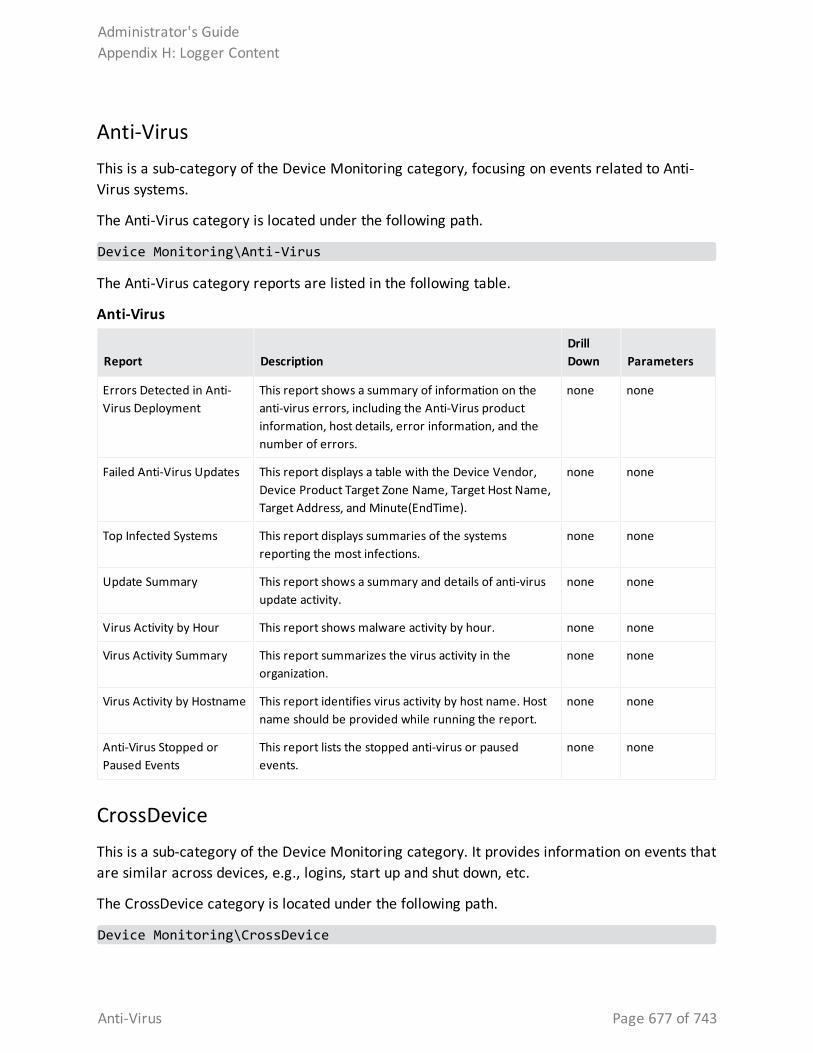
Anti-VirusThis is a sub-category of the Device Monitoring category, focusing on events related to Anti-Virus systems.
The Anti-Virus category is located under the following path.
Device Monitoring\Anti-Virus
The Anti-Virus category reports are listed in the following table.
Report DescriptionDrill Down Parameters
Errors Detected in Anti-Virus Deployment
This report shows a summary of information on the anti-virus errors, including the Anti-Virus product information, host details, error information, and the number of errors.
none none
Failed Anti-Virus Updates This report displays a table with the Device Vendor, Device Product Target Zone Name, Target Host Name, Target Address, and Minute(EndTime).
none none
Top Infected Systems This report displays summaries of the systems reporting the most infections.
none none
Update Summary This report shows a summary and details of anti-virus update activity.
none none
Virus Activity by Hour This report shows malware activity by hour. none none
Virus Activity Summary This report summarizes the virus activity in the organization.
none none
Virus Activity by Hostname This report identifies virus activity by host name. Host name should be provided while running the report.
none none
Anti-Virus Stopped or Paused Events
This report lists the stopped anti-virus or paused events.
none none
Anti-Virus
CrossDeviceThis is a sub-category of the Device Monitoring category. It provides information on events that are similar across devices, e.g., logins, start up and shut down, etc.
The CrossDevice category is located under the following path.
Device Monitoring\CrossDevice
Administrator's GuideAppendix H: Logger Content
Anti-Virus Page 677 of 743
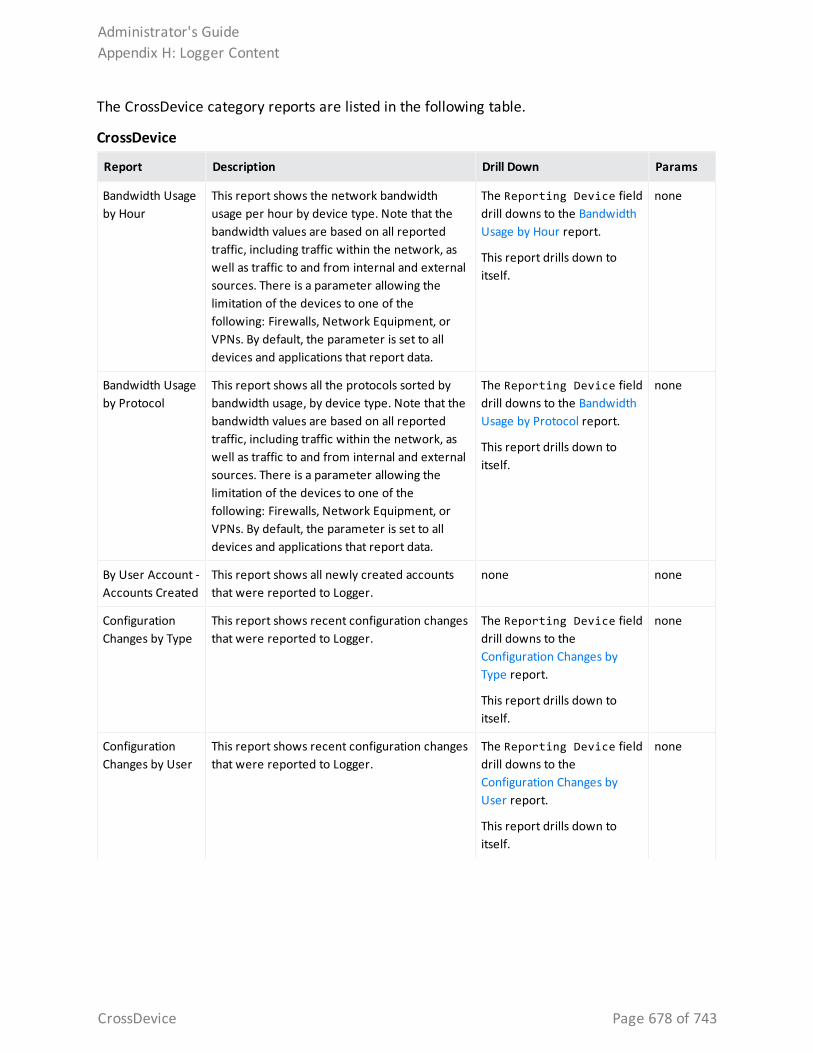
The CrossDevice category reports are listed in the following table.
Report Description Drill Down Params
Bandwidth Usage by Hour
This report shows the network bandwidth usage per hour by device type. Note that the bandwidth values are based on all reported traffic, including traffic within the network, as well as traffic to and from internal and external sources. There is a parameter allowing the limitation of the devices to one of the following: Firewalls, Network Equipment, or VPNs. By default, the parameter is set to all devices and applications that report data.
The Reporting Device field drill downs to the Bandwidth Usage by Hour report.
This report drills down to itself.
none
Bandwidth Usage by Protocol
This report shows all the protocols sorted by bandwidth usage, by device type. Note that the bandwidth values are based on all reported traffic, including traffic within the network, as well as traffic to and from internal and external sources. There is a parameter allowing the limitation of the devices to one of the following: Firewalls, Network Equipment, or VPNs. By default, the parameter is set to all devices and applications that report data.
The Reporting Device field drill downs to the Bandwidth Usage by Protocol report.
This report drills down to itself.
none
By User Account - Accounts Created
This report shows all newly created accounts that were reported to Logger.
none none
Configuration Changes by Type
This report shows recent configuration changes that were reported to Logger.
The Reporting Device field drill downs to the Configuration Changes by Type report.
This report drills down to itself.
none
Configuration Changes by User
This report shows recent configuration changes that were reported to Logger.
The Reporting Device field drill downs to the Configuration Changes by User report.
This report drills down to itself.
none
CrossDevice
Administrator's GuideAppendix H: Logger Content
CrossDevice Page 678 of 743
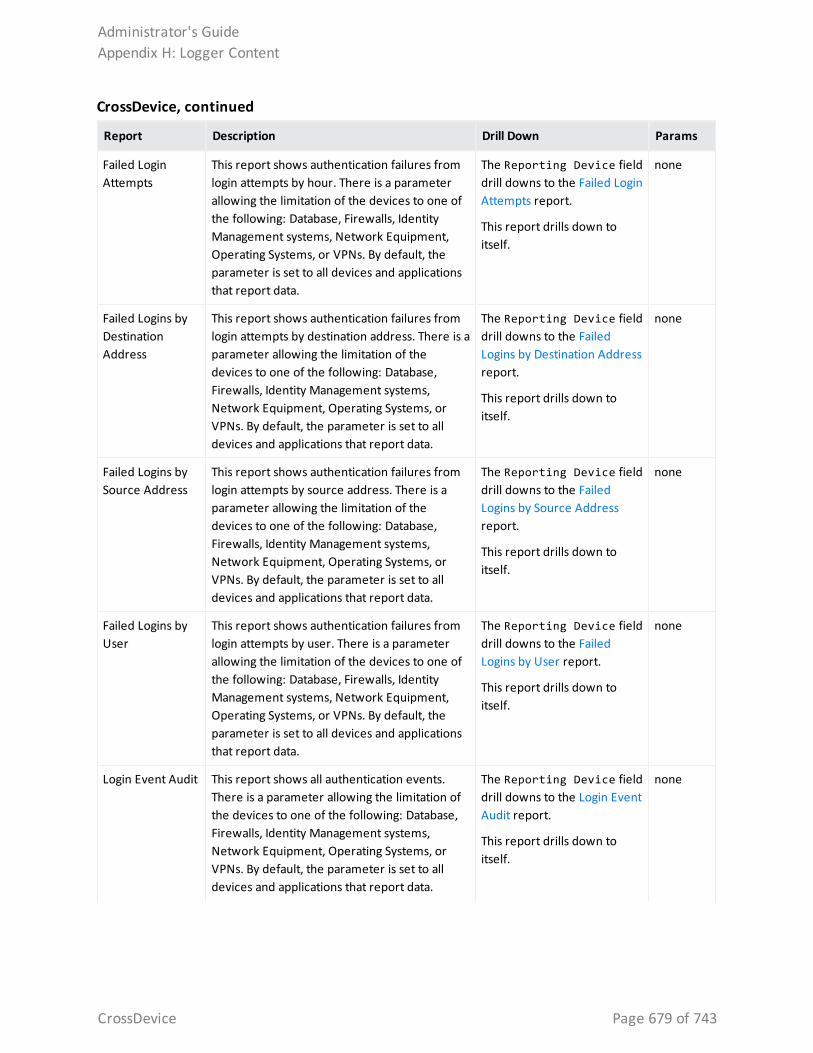
Report Description Drill Down Params
Failed Login Attempts
This report shows authentication failures from login attempts by hour. There is a parameter allowing the limitation of the devices to one of the following: Database, Firewalls, Identity Management systems, Network Equipment, Operating Systems, or VPNs. By default, the parameter is set to all devices and applications that report data.
The Reporting Device field drill downs to the Failed Login Attempts report.
This report drills down to itself.
none
Failed Logins by Destination Address
This report shows authentication failures from login attempts by destination address. There is a parameter allowing the limitation of the devices to one of the following: Database, Firewalls, Identity Management systems, Network Equipment, Operating Systems, or VPNs. By default, the parameter is set to all devices and applications that report data.
The Reporting Device field drill downs to the Failed Logins by Destination Address report.
This report drills down to itself.
none
Failed Logins by Source Address
This report shows authentication failures from login attempts by source address. There is a parameter allowing the limitation of the devices to one of the following: Database, Firewalls, Identity Management systems, Network Equipment, Operating Systems, or VPNs. By default, the parameter is set to all devices and applications that report data.
The Reporting Device field drill downs to the Failed Logins by Source Address report.
This report drills down to itself.
none
Failed Logins by User
This report shows authentication failures from login attempts by user. There is a parameter allowing the limitation of the devices to one of the following: Database, Firewalls, Identity Management systems, Network Equipment, Operating Systems, or VPNs. By default, the parameter is set to all devices and applications that report data.
The Reporting Device field drill downs to the Failed Logins by User report.
This report drills down to itself.
none
Login Event Audit This report shows all authentication events. There is a parameter allowing the limitation of the devices to one of the following: Database, Firewalls, Identity Management systems, Network Equipment, Operating Systems, or VPNs. By default, the parameter is set to all devices and applications that report data.
The Reporting Device field drill downs to the Login Event Audit report.
This report drills down to itself.
none
CrossDevice, continued
Administrator's GuideAppendix H: Logger Content
CrossDevice Page 679 of 743
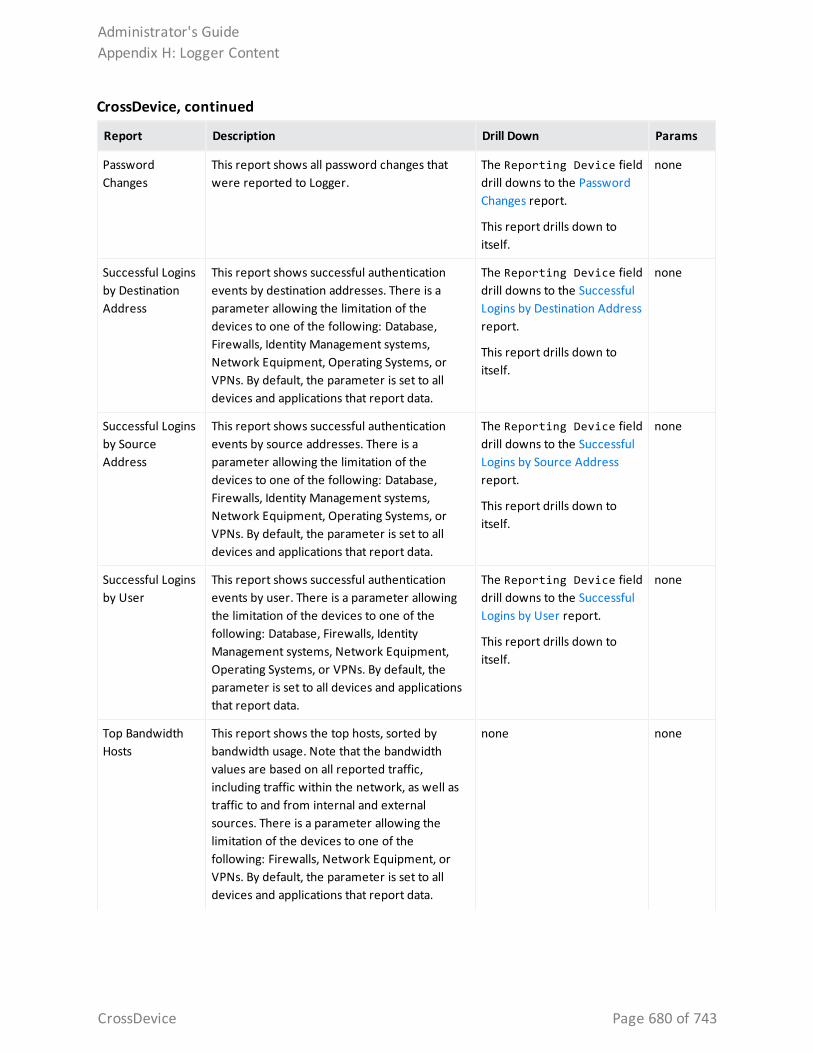
Report Description Drill Down Params
Password Changes
This report shows all password changes that were reported to Logger.
The Reporting Device field drill downs to the Password Changes report.
This report drills down to itself.
none
Successful Logins by Destination Address
This report shows successful authentication events by destination addresses. There is a parameter allowing the limitation of the devices to one of the following: Database, Firewalls, Identity Management systems, Network Equipment, Operating Systems, or VPNs. By default, the parameter is set to all devices and applications that report data.
The Reporting Device field drill downs to the Successful Logins by Destination Address report.
This report drills down to itself.
none
Successful Logins by Source Address
This report shows successful authentication events by source addresses. There is a parameter allowing the limitation of the devices to one of the following: Database, Firewalls, Identity Management systems, Network Equipment, Operating Systems, or VPNs. By default, the parameter is set to all devices and applications that report data.
The Reporting Device field drill downs to the Successful Logins by Source Address report.
This report drills down to itself.
none
Successful Logins by User
This report shows successful authentication events by user. There is a parameter allowing the limitation of the devices to one of the following: Database, Firewalls, Identity Management systems, Network Equipment, Operating Systems, or VPNs. By default, the parameter is set to all devices and applications that report data.
The Reporting Device field drill downs to the Successful Logins by User report.
This report drills down to itself.
none
Top Bandwidth Hosts
This report shows the top hosts, sorted by bandwidth usage. Note that the bandwidth values are based on all reported traffic, including traffic within the network, as well as traffic to and from internal and external sources. There is a parameter allowing the limitation of the devices to one of the following: Firewalls, Network Equipment, or VPNs. By default, the parameter is set to all devices and applications that report data.
none none
CrossDevice, continued
Administrator's GuideAppendix H: Logger Content
CrossDevice Page 680 of 743
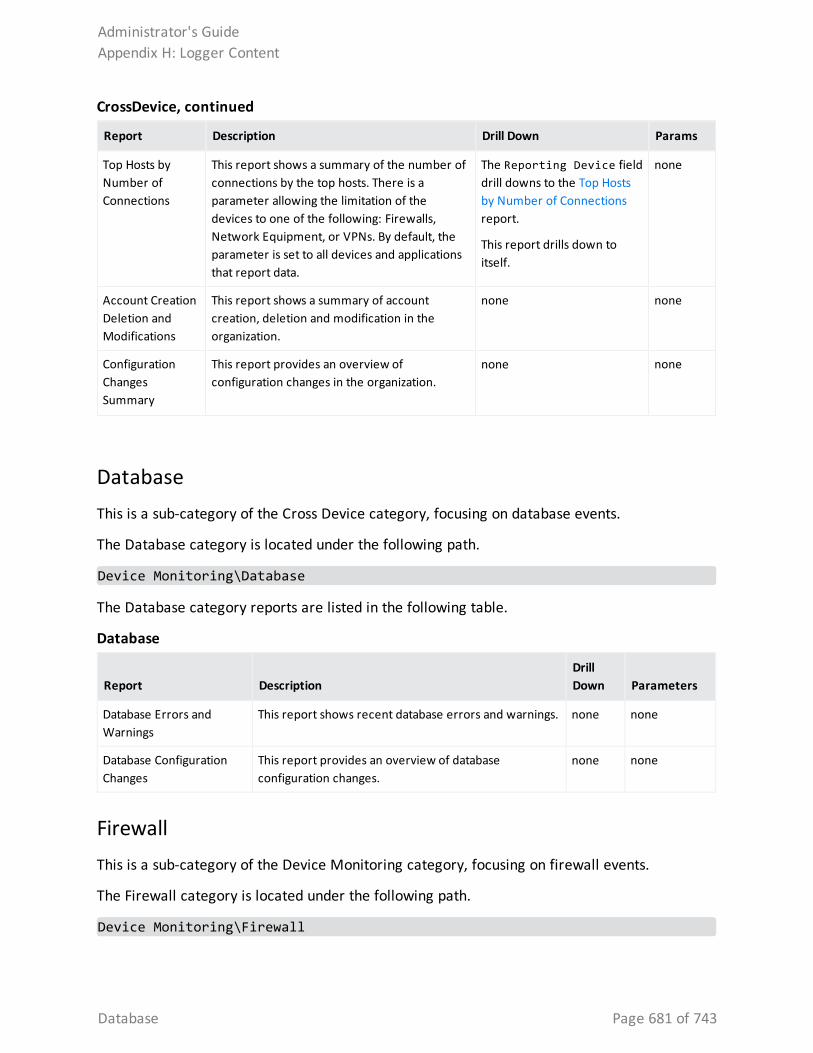
Report Description Drill Down Params
Top Hosts by Number of Connections
This report shows a summary of the number of connections by the top hosts. There is a parameter allowing the limitation of the devices to one of the following: Firewalls, Network Equipment, or VPNs. By default, the parameter is set to all devices and applications that report data.
The Reporting Device field drill downs to the Top Hosts by Number of Connections report.
This report drills down to itself.
none
Account Creation Deletion and Modifications
This report shows a summary of account creation, deletion and modification in the organization.
none none
Configuration Changes Summary
This report provides an overview of configuration changes in the organization.
none none
CrossDevice, continued
DatabaseThis is a sub-category of the Cross Device category, focusing on database events.
The Database category is located under the following path.
Device Monitoring\Database
The Database category reports are listed in the following table.
Report DescriptionDrill Down Parameters
Database Errors and Warnings
This report shows recent database errors and warnings. none none
Database Configuration Changes
This report provides an overview of database configuration changes.
none none
Database
FirewallThis is a sub-category of the Device Monitoring category, focusing on firewall events.
The Firewall category is located under the following path.
Device Monitoring\Firewall
Administrator's GuideAppendix H: Logger Content
Database Page 681 of 743
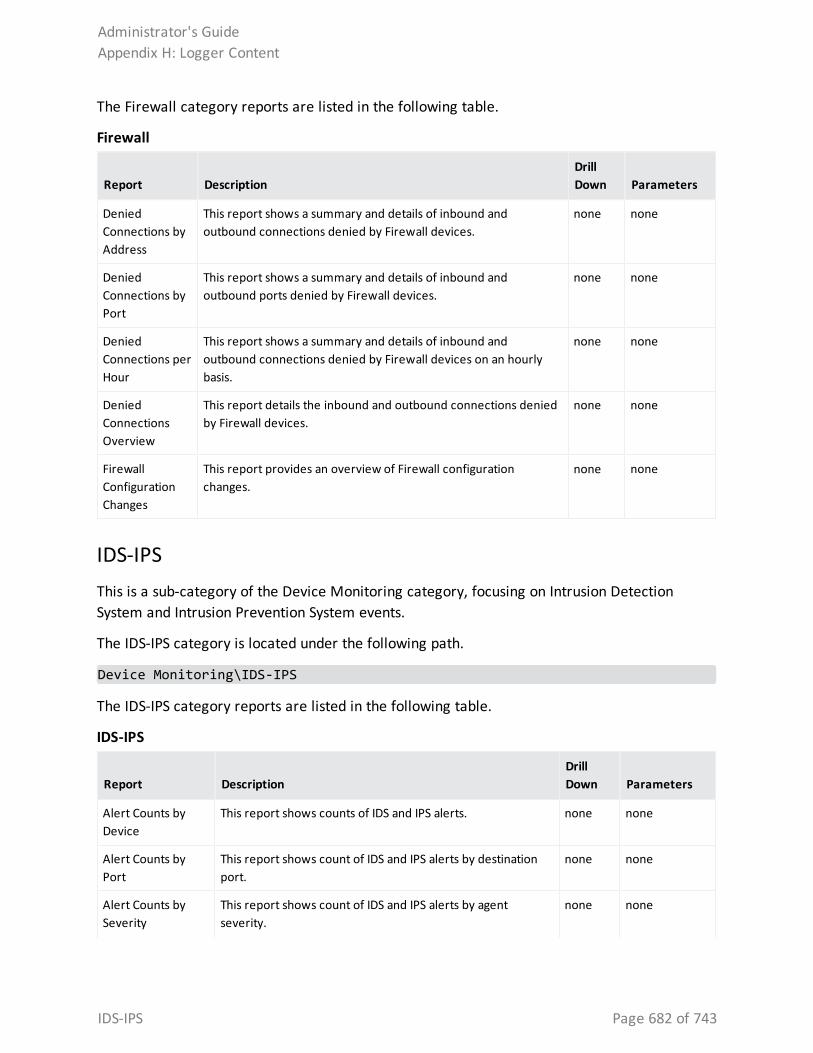
The Firewall category reports are listed in the following table.
Report DescriptionDrill Down Parameters
Denied Connections by Address
This report shows a summary and details of inbound and outbound connections denied by Firewall devices.
none none
Denied Connections by Port
This report shows a summary and details of inbound and outbound ports denied by Firewall devices.
none none
Denied Connections per Hour
This report shows a summary and details of inbound and outbound connections denied by Firewall devices on an hourly basis.
none none
Denied Connections Overview
This report details the inbound and outbound connections denied by Firewall devices.
none none
Firewall Configuration Changes
This report provides an overview of Firewall configuration changes.
none none
Firewall
IDS-IPSThis is a sub-category of the Device Monitoring category, focusing on Intrusion Detection System and Intrusion Prevention System events.
The IDS-IPS category is located under the following path.
Device Monitoring\IDS-IPS
The IDS-IPS category reports are listed in the following table.
Report DescriptionDrill Down Parameters
Alert Counts by Device
This report shows counts of IDS and IPS alerts. none none
Alert Counts by Port
This report shows count of IDS and IPS alerts by destination port.
none none
Alert Counts by Severity
This report shows count of IDS and IPS alerts by agent severity.
none none
IDS-IPS
Administrator's GuideAppendix H: Logger Content
IDS-IPS Page 682 of 743
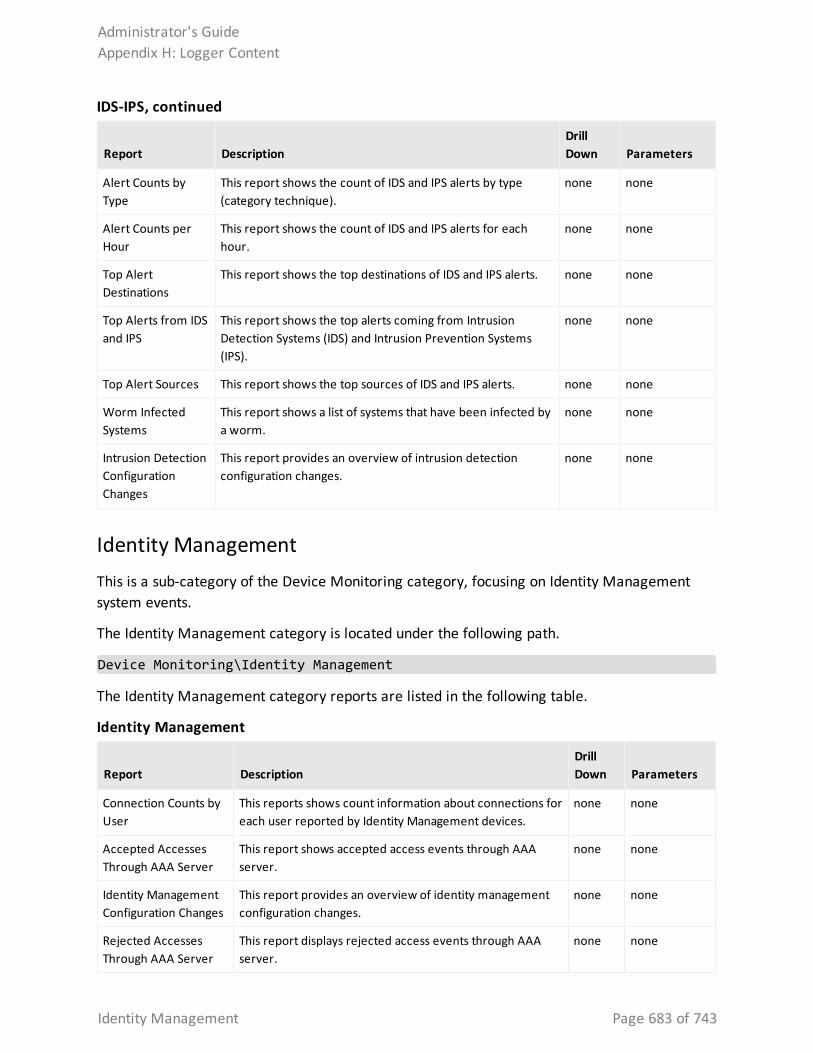
Report DescriptionDrill Down Parameters
Alert Counts by Type
This report shows the count of IDS and IPS alerts by type (category technique).
none none
Alert Counts per Hour
This report shows the count of IDS and IPS alerts for each hour.
none none
Top Alert Destinations
This report shows the top destinations of IDS and IPS alerts. none none
Top Alerts from IDS and IPS
This report shows the top alerts coming from Intrusion Detection Systems (IDS) and Intrusion Prevention Systems (IPS).
none none
Top Alert Sources This report shows the top sources of IDS and IPS alerts. none none
Worm Infected Systems
This report shows a list of systems that have been infected by a worm.
none none
Intrusion Detection Configuration Changes
This report provides an overview of intrusion detection configuration changes.
none none
IDS-IPS, continued
Identity ManagementThis is a sub-category of the Device Monitoring category, focusing on Identity Management system events.
The Identity Management category is located under the following path.
Device Monitoring\Identity Management
The Identity Management category reports are listed in the following table.
Report DescriptionDrill Down Parameters
Connection Counts by User
This reports shows count information about connections for each user reported by Identity Management devices.
none none
Accepted Accesses Through AAA Server
This report shows accepted access events through AAA server.
none none
Identity Management Configuration Changes
This report provides an overview of identity management configuration changes.
none none
Rejected Accesses Through AAA Server
This report displays rejected access events through AAA server.
none none
Identity Management
Administrator's GuideAppendix H: Logger Content
Identity Management Page 683 of 743
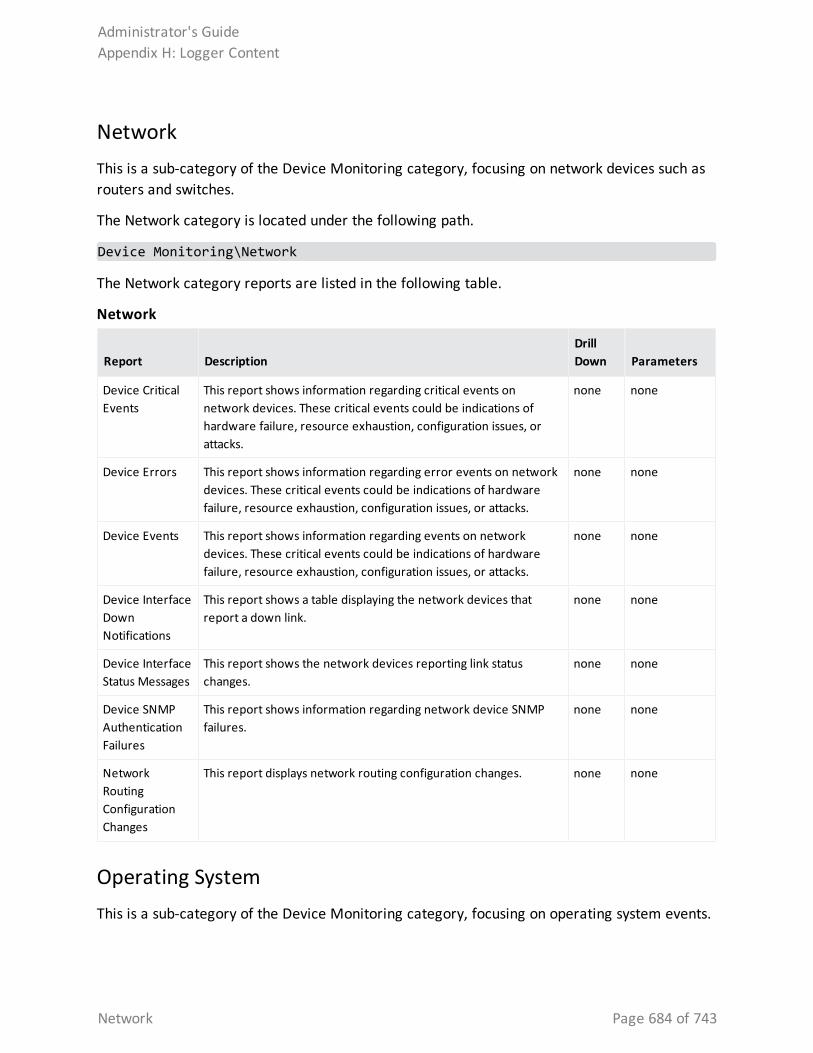
NetworkThis is a sub-category of the Device Monitoring category, focusing on network devices such as routers and switches.
The Network category is located under the following path.
Device Monitoring\Network
The Network category reports are listed in the following table.
Report DescriptionDrill Down Parameters
Device Critical Events
This report shows information regarding critical events on network devices. These critical events could be indications of hardware failure, resource exhaustion, configuration issues, or attacks.
none none
Device Errors This report shows information regarding error events on network devices. These critical events could be indications of hardware failure, resource exhaustion, configuration issues, or attacks.
none none
Device Events This report shows information regarding events on network devices. These critical events could be indications of hardware failure, resource exhaustion, configuration issues, or attacks.
none none
Device Interface Down Notifications
This report shows a table displaying the network devices that report a down link.
none none
Device Interface Status Messages
This report shows the network devices reporting link status changes.
none none
Device SNMP Authentication Failures
This report shows information regarding network device SNMP failures.
none none
Network Routing Configuration Changes
This report displays network routing configuration changes. none none
Network
Operating SystemThis is a sub-category of the Device Monitoring category, focusing on operating system events.
Administrator's GuideAppendix H: Logger Content
Network Page 684 of 743
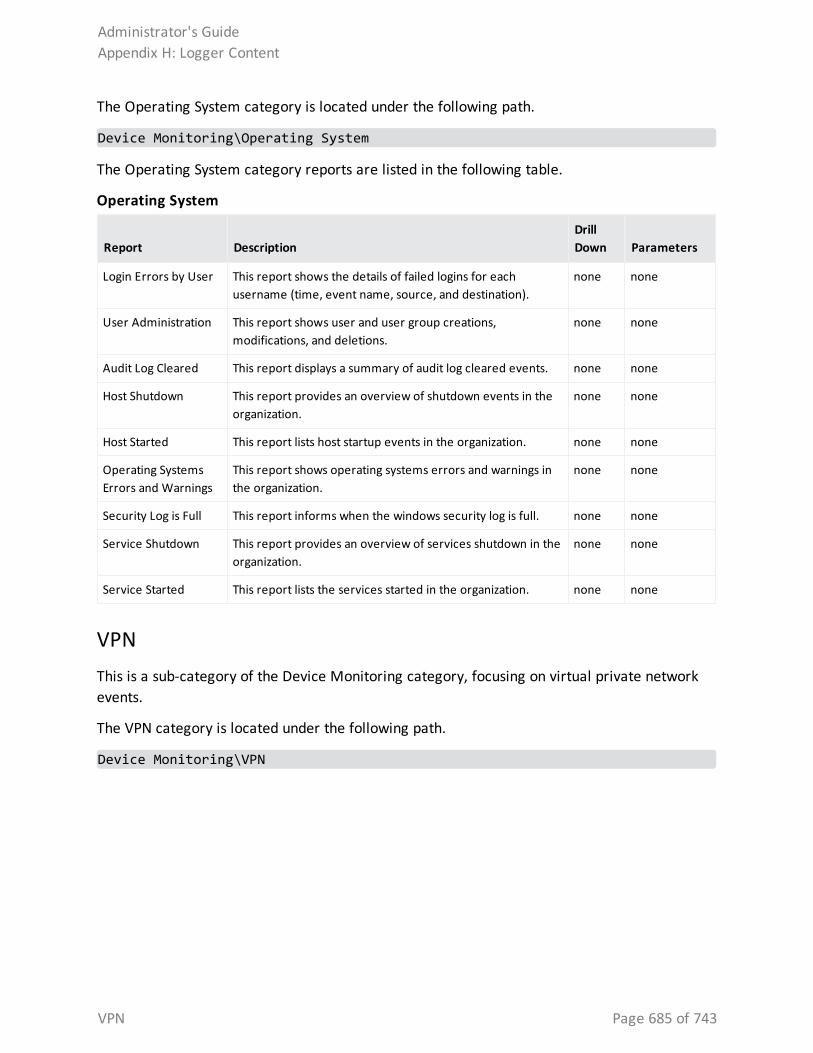
The Operating System category is located under the following path.
Device Monitoring\Operating System
The Operating System category reports are listed in the following table.
Report DescriptionDrill Down Parameters
Login Errors by User This report shows the details of failed logins for each username (time, event name, source, and destination).
none none
User Administration This report shows user and user group creations, modifications, and deletions.
none none
Audit Log Cleared This report displays a summary of audit log cleared events. none none
Host Shutdown This report provides an overview of shutdown events in the organization.
none none
Host Started This report lists host startup events in the organization. none none
Operating Systems Errors and Warnings
This report shows operating systems errors and warnings in the organization.
none none
Security Log is Full This report informs when the windows security log is full. none none
Service Shutdown This report provides an overview of services shutdown in the organization.
none none
Service Started This report lists the services started in the organization. none none
Operating System
VPNThis is a sub-category of the Device Monitoring category, focusing on virtual private network events.
The VPN category is located under the following path.
Device Monitoring\VPN
Administrator's GuideAppendix H: Logger Content
VPN Page 685 of 743
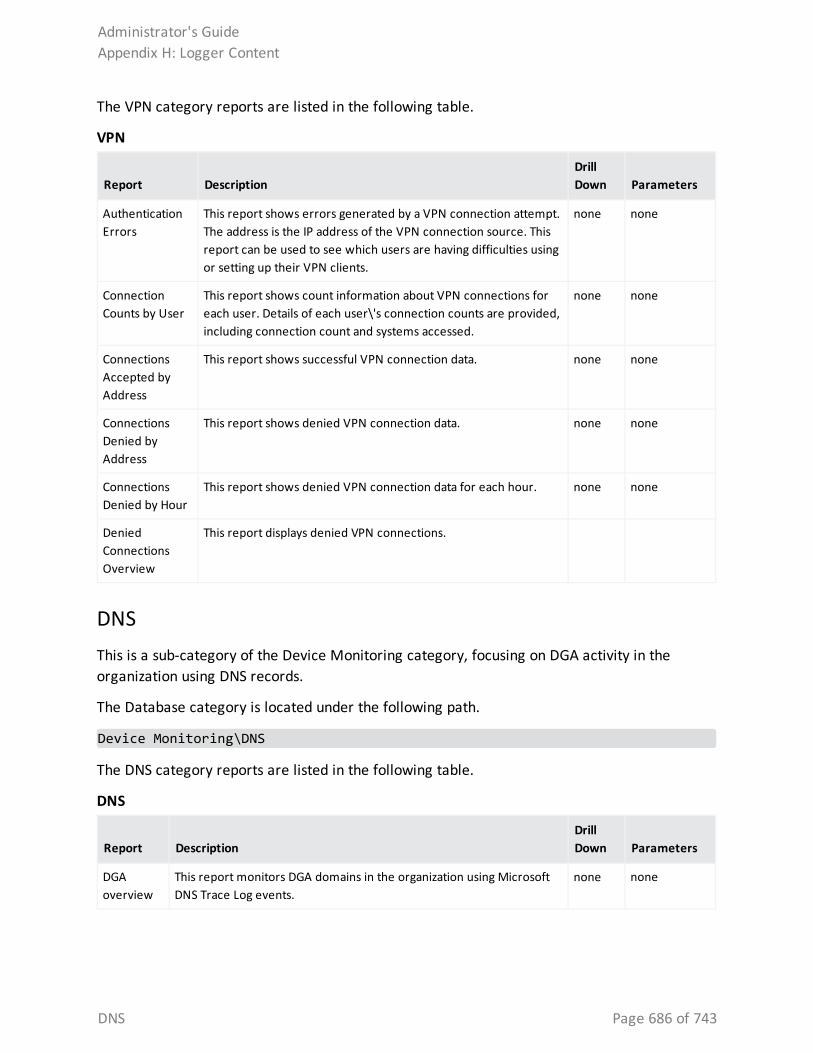
The VPN category reports are listed in the following table.
Report DescriptionDrill Down Parameters
Authentication Errors
This report shows errors generated by a VPN connection attempt. The address is the IP address of the VPN connection source. This report can be used to see which users are having difficulties using or setting up their VPN clients.
none none
Connection Counts by User
This report shows count information about VPN connections for each user. Details of each user\'s connection counts are provided, including connection count and systems accessed.
none none
Connections Accepted by Address
This report shows successful VPN connection data. none none
Connections Denied by Address
This report shows denied VPN connection data. none none
Connections Denied by Hour
This report shows denied VPN connection data for each hour. none none
Denied Connections Overview
This report displays denied VPN connections.
VPN
DNS This is a sub-category of the Device Monitoring category, focusing on DGA activity in the organization using DNS records.
The Database category is located under the following path.
Device Monitoring\DNS
The DNS category reports are listed in the following table.
Report DescriptionDrill Down Parameters
DGA overview
This report monitors DGA domains in the organization using Microsoft DNS Trace Log events.
none none
DNS
Administrator's GuideAppendix H: Logger Content
DNS Page 686 of 743
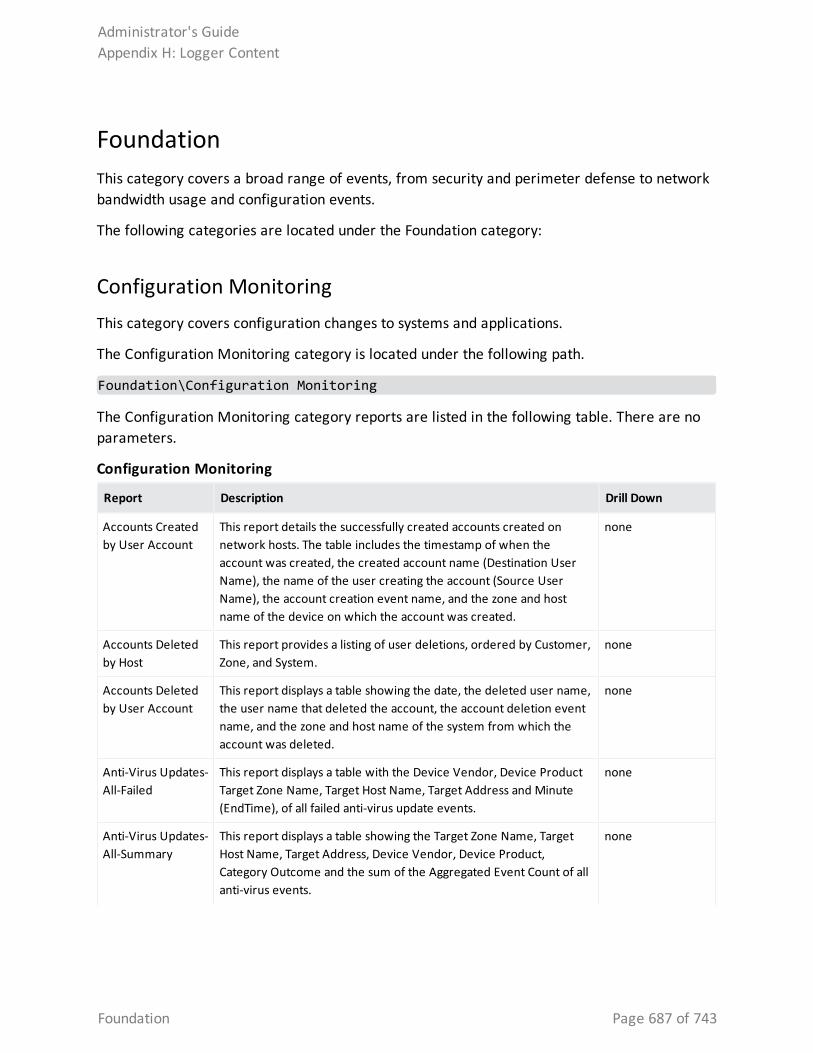
FoundationThis category covers a broad range of events, from security and perimeter defense to network bandwidth usage and configuration events.
The following categories are located under the Foundation category:
Configuration MonitoringThis category covers configuration changes to systems and applications.
The Configuration Monitoring category is located under the following path.
Foundation\Configuration Monitoring
The Configuration Monitoring category reports are listed in the following table. There are no parameters.
Report Description Drill Down
Accounts Created by User Account
This report details the successfully created accounts created on network hosts. The table includes the timestamp of when the account was created, the created account name (Destination User Name), the name of the user creating the account (Source User Name), the account creation event name, and the zone and host name of the device on which the account was created.
none
Accounts Deleted by Host
This report provides a listing of user deletions, ordered by Customer, Zone, and System.
none
Accounts Deleted by User Account
This report displays a table showing the date, the deleted user name, the user name that deleted the account, the account deletion event name, and the zone and host name of the system from which the account was deleted.
none
Anti-Virus Updates-All-Failed
This report displays a table with the Device Vendor, Device Product Target Zone Name, Target Host Name, Target Address and Minute(EndTime), of all failed anti-virus update events.
none
Anti-Virus Updates-All-Summary
This report displays a table showing the Target Zone Name, Target Host Name, Target Address, Device Vendor, Device Product, Category Outcome and the sum of the Aggregated Event Count of all anti-virus events.
none
Configuration Monitoring
Administrator's GuideAppendix H: Logger Content
Foundation Page 687 of 743
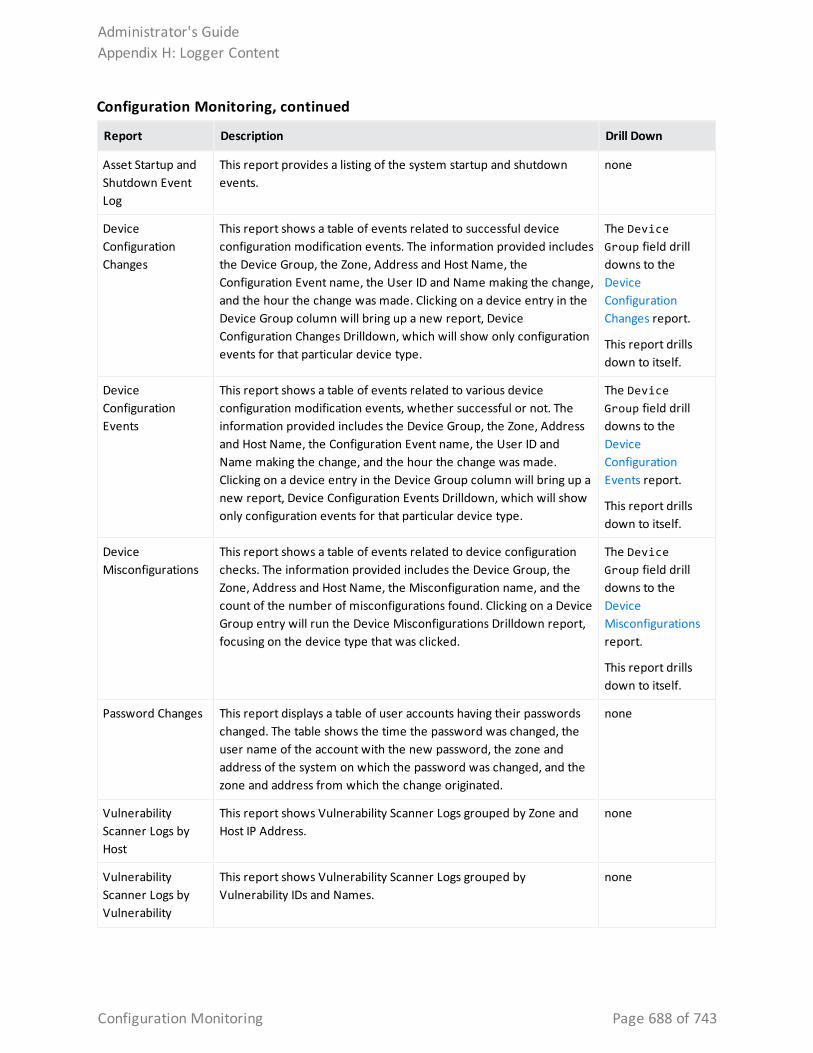
Report Description Drill Down
Asset Startup and Shutdown Event Log
This report provides a listing of the system startup and shutdown events.
none
Device Configuration Changes
This report shows a table of events related to successful device configuration modification events. The information provided includes the Device Group, the Zone, Address and Host Name, the Configuration Event name, the User ID and Name making the change, and the hour the change was made. Clicking on a device entry in the Device Group column will bring up a new report, Device Configuration Changes Drilldown, which will show only configuration events for that particular device type.
The Device Group field drill downs to the Device Configuration Changes report.
This report drills down to itself.
Device Configuration Events
This report shows a table of events related to various device configuration modification events, whether successful or not. The information provided includes the Device Group, the Zone, Address and Host Name, the Configuration Event name, the User ID and Name making the change, and the hour the change was made. Clicking on a device entry in the Device Group column will bring up a new report, Device Configuration Events Drilldown, which will show only configuration events for that particular device type.
The Device Group field drill downs to the Device Configuration Events report.
This report drills down to itself.
Device Misconfigurations
This report shows a table of events related to device configuration checks. The information provided includes the Device Group, the Zone, Address and Host Name, the Misconfiguration name, and the count of the number of misconfigurations found. Clicking on a Device Group entry will run the Device Misconfigurations Drilldown report, focusing on the device type that was clicked.
The Device Group field drill downs to the Device Misconfigurations report.
This report drills down to itself.
Password Changes This report displays a table of user accounts having their passwords changed. The table shows the time the password was changed, the user name of the account with the new password, the zone and address of the system on which the password was changed, and the zone and address from which the change originated.
none
Vulnerability Scanner Logs by Host
This report shows Vulnerability Scanner Logs grouped by Zone and Host IP Address.
none
Vulnerability Scanner Logs by Vulnerability
This report shows Vulnerability Scanner Logs grouped by Vulnerability IDs and Names.
none
Configuration Monitoring, continued
Administrator's GuideAppendix H: Logger Content
Configuration Monitoring Page 688 of 743
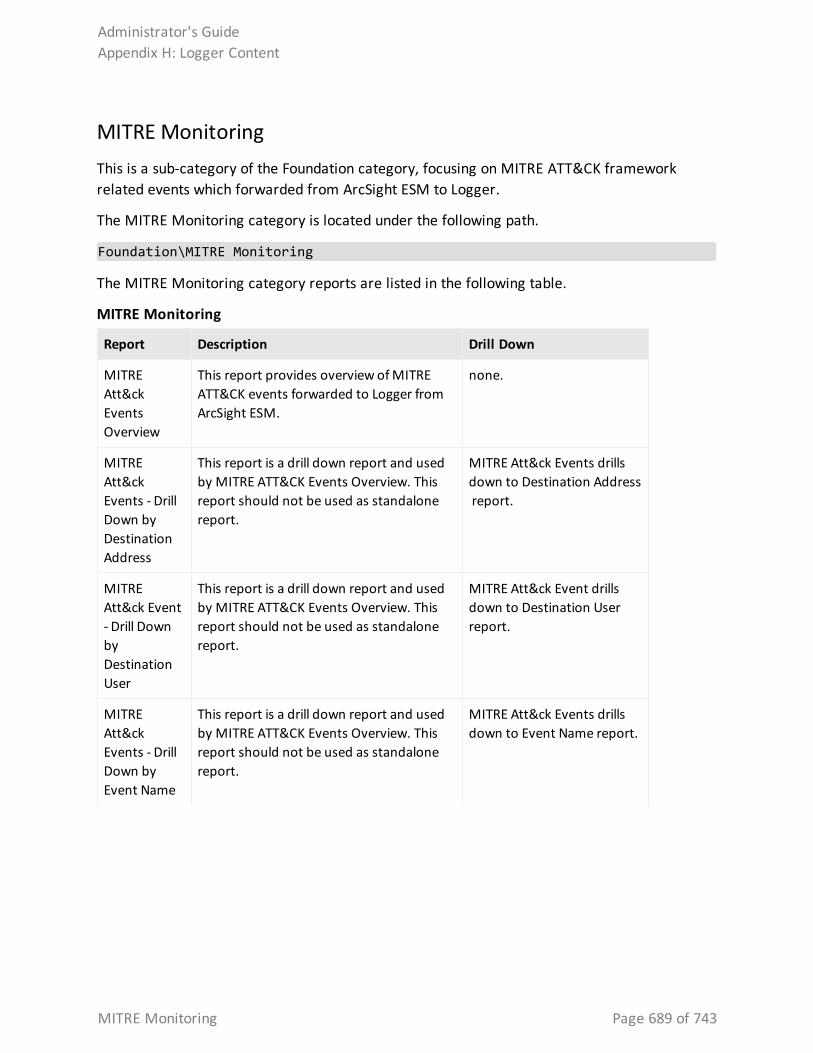
MITRE MonitoringThis is a sub-category of the Foundation category, focusing on MITRE ATT&CK framework related events which forwarded from ArcSight ESM to Logger.
The MITRE Monitoring category is located under the following path.
Foundation\MITRE Monitoring
The MITRE Monitoring category reports are listed in the following table.
Report Description Drill Down
MITRE Att&ck Events Overview
This report provides overview of MITRE ATT&CK events forwarded to Logger from ArcSight ESM.
none.
MITRE Att&ck Events - Drill Down by Destination Address
This report is a drill down report and used by MITRE ATT&CK Events Overview. This report should not be used as standalone report.
MITRE Att&ck Events drills down to Destination Address report.
MITRE Att&ck Event - Drill Down by Destination User
This report is a drill down report and used by MITRE ATT&CK Events Overview. This report should not be used as standalone report.
MITRE Att&ck Event drills down to Destination User report.
MITRE Att&ck Events - Drill Down by Event Name
This report is a drill down report and used by MITRE ATT&CK Events Overview. This report should not be used as standalone report.
MITRE Att&ck Events drills down to Event Name report.
MITRE Monitoring
Administrator's GuideAppendix H: Logger Content
MITRE Monitoring Page 689 of 743
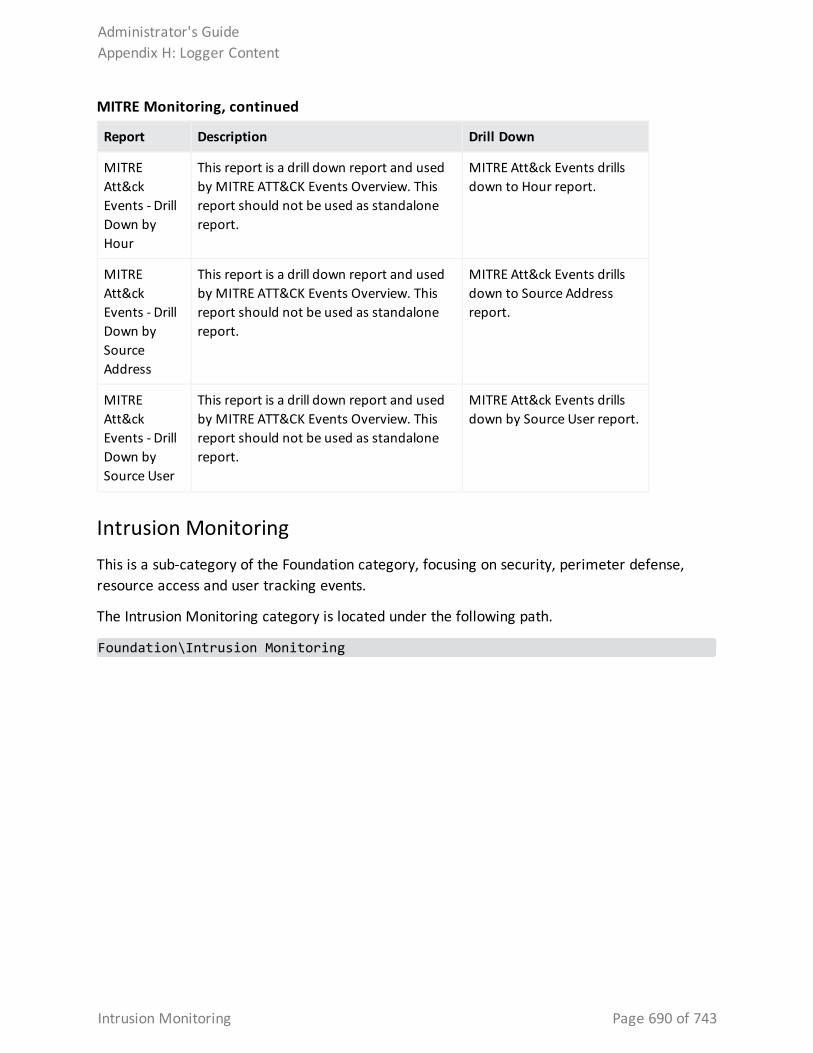
Report Description Drill Down
MITRE Att&ck Events - Drill Down by Hour
This report is a drill down report and used by MITRE ATT&CK Events Overview. This report should not be used as standalone report.
MITRE Att&ck Events drills down to Hour report.
MITRE Att&ck Events - Drill Down by Source Address
This report is a drill down report and used by MITRE ATT&CK Events Overview. This report should not be used as standalone report.
MITRE Att&ck Events drills down to Source Address report.
MITRE Att&ck Events - Drill Down by Source User
This report is a drill down report and used by MITRE ATT&CK Events Overview. This report should not be used as standalone report.
MITRE Att&ck Events drills down by Source User report.
MITRE Monitoring, continued
Intrusion MonitoringThis is a sub-category of the Foundation category, focusing on security, perimeter defense, resource access and user tracking events.
The Intrusion Monitoring category is located under the following path.
Foundation\Intrusion Monitoring
Administrator's GuideAppendix H: Logger Content
Intrusion Monitoring Page 690 of 743
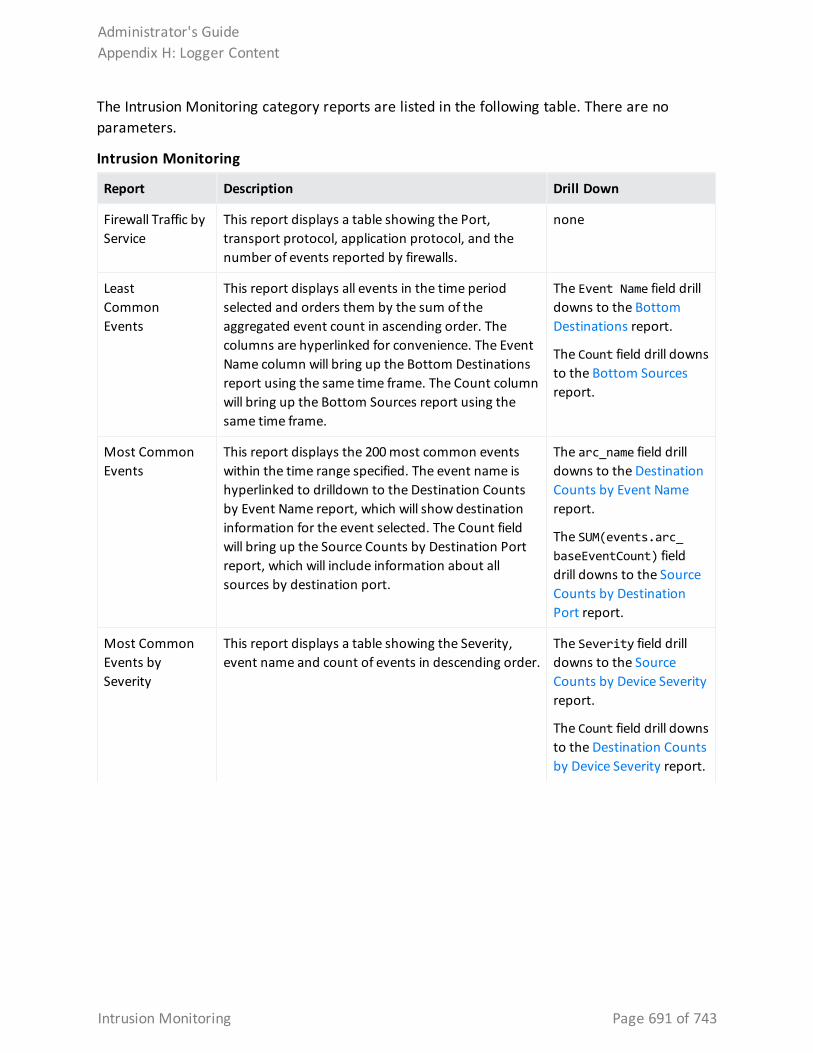
The Intrusion Monitoring category reports are listed in the following table. There are no parameters.
Report Description Drill Down
Firewall Traffic by Service
This report displays a table showing the Port, transport protocol, application protocol, and the number of events reported by firewalls.
none
Least Common Events
This report displays all events in the time period selected and orders them by the sum of the aggregated event count in ascending order. The columns are hyperlinked for convenience. The Event Name column will bring up the Bottom Destinations report using the same time frame. The Count column will bring up the Bottom Sources report using the same time frame.
The Event Name field drill downs to the Bottom Destinations report.
The Count field drill downs to the Bottom Sources report.
Most Common Events
This report displays the 200 most common events within the time range specified. The event name is hyperlinked to drilldown to the Destination Counts by Event Name report, which will show destination information for the event selected. The Count field will bring up the Source Counts by Destination Port report, which will include information about all sources by destination port.
The arc_name field drill downs to the Destination Counts by Event Name report.
The SUM(events.arc_baseEventCount) field drill downs to the Source Counts by Destination Port report.
Most Common Events by Severity
This report displays a table showing the Severity, event name and count of events in descending order.
The Severity field drill downs to the Source Counts by Device Severity report.
The Count field drill downs to the Destination Counts by Device Severity report.
Intrusion Monitoring
Administrator's GuideAppendix H: Logger Content
Intrusion Monitoring Page 691 of 743
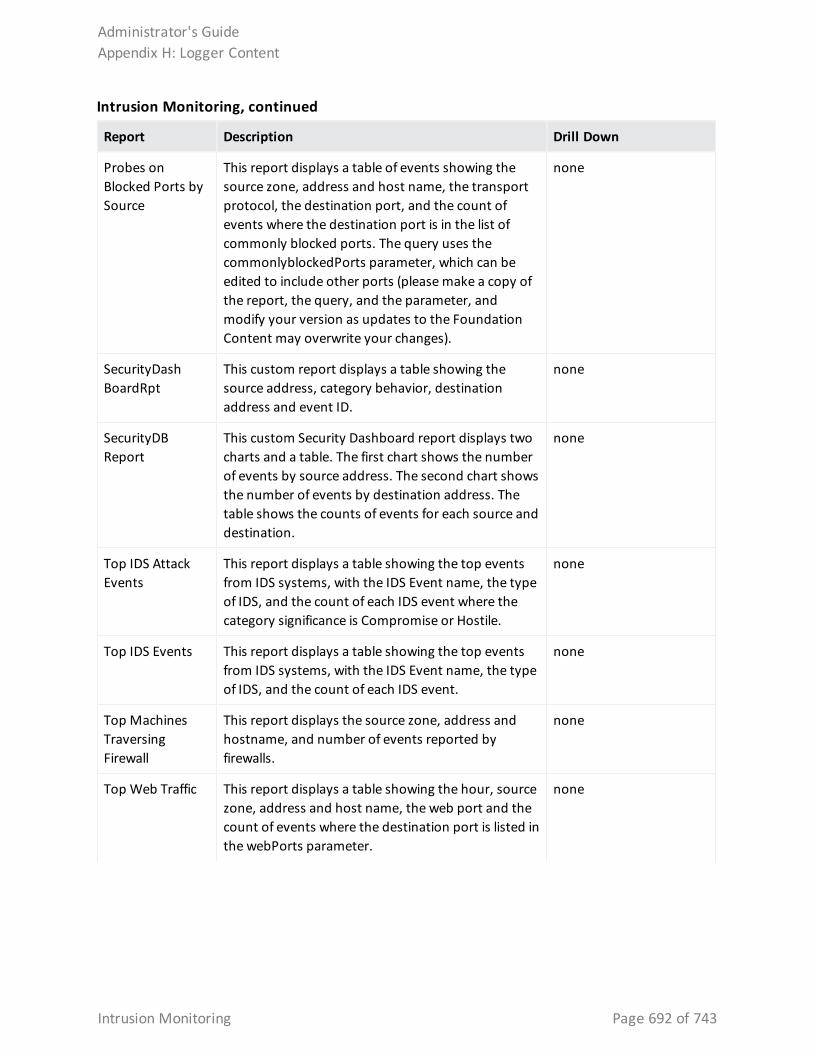
Report Description Drill Down
Probes on Blocked Ports by Source
This report displays a table of events showing the source zone, address and host name, the transport protocol, the destination port, and the count of events where the destination port is in the list of commonly blocked ports. The query uses the commonlyblockedPorts parameter, which can be edited to include other ports (please make a copy of the report, the query, and the parameter, and modify your version as updates to the Foundation Content may overwrite your changes).
none
SecurityDashBoardRpt
This custom report displays a table showing the source address, category behavior, destination address and event ID.
none
SecurityDBReport
This custom Security Dashboard report displays two charts and a table. The first chart shows the number of events by source address. The second chart shows the number of events by destination address. The table shows the counts of events for each source and destination.
none
Top IDS Attack Events
This report displays a table showing the top events from IDS systems, with the IDS Event name, the type of IDS, and the count of each IDS event where the category significance is Compromise or Hostile.
none
Top IDS Events This report displays a table showing the top events from IDS systems, with the IDS Event name, the type of IDS, and the count of each IDS event.
none
Top Machines Traversing Firewall
This report displays the source zone, address and hostname, and number of events reported by firewalls.
none
Top Web Traffic This report displays a table showing the hour, source zone, address and host name, the web port and the count of events where the destination port is listed in the webPorts parameter.
none
Intrusion Monitoring, continued
Administrator's GuideAppendix H: Logger Content
Intrusion Monitoring Page 692 of 743
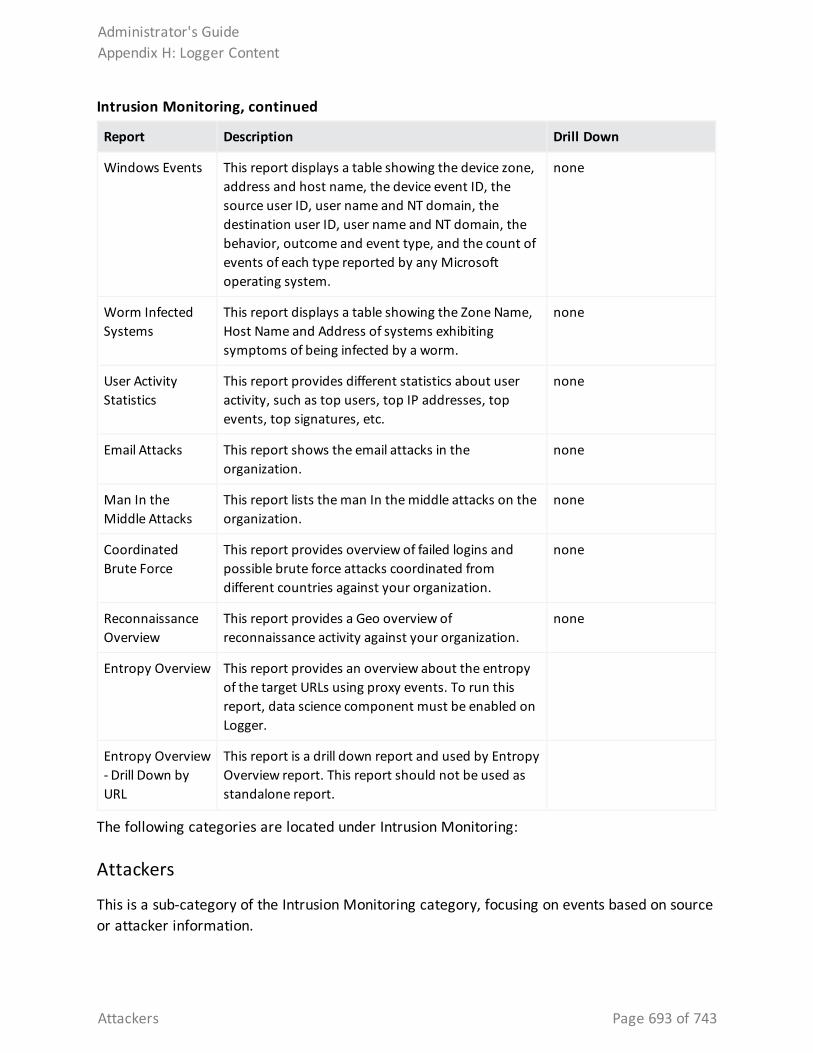
Report Description Drill Down
Windows Events This report displays a table showing the device zone, address and host name, the device event ID, the source user ID, user name and NT domain, the destination user ID, user name and NT domain, the behavior, outcome and event type, and the count of events of each type reported by any Microsoft operating system.
none
Worm Infected Systems
This report displays a table showing the Zone Name, Host Name and Address of systems exhibiting symptoms of being infected by a worm.
none
User Activity Statistics
This report provides different statistics about user activity, such as top users, top IP addresses, top events, top signatures, etc.
none
Email Attacks This report shows the email attacks in the organization.
none
Man In the Middle Attacks
This report lists the man In the middle attacks on the organization.
none
Coordinated Brute Force
This report provides overview of failed logins and possible brute force attacks coordinated from different countries against your organization.
none
Reconnaissance Overview
This report provides a Geo overview of reconnaissance activity against your organization.
none
Entropy Overview This report provides an overview about the entropy of the target URLs using proxy events. To run this report, data science component must be enabled on Logger.
Entropy Overview - Drill Down by URL
This report is a drill down report and used by Entropy Overview report. This report should not be used as standalone report.
Intrusion Monitoring, continued
The following categories are located under Intrusion Monitoring:
Attackers
This is a sub-category of the Intrusion Monitoring category, focusing on events based on source or attacker information.
Administrator's GuideAppendix H: Logger Content
Attackers Page 693 of 743
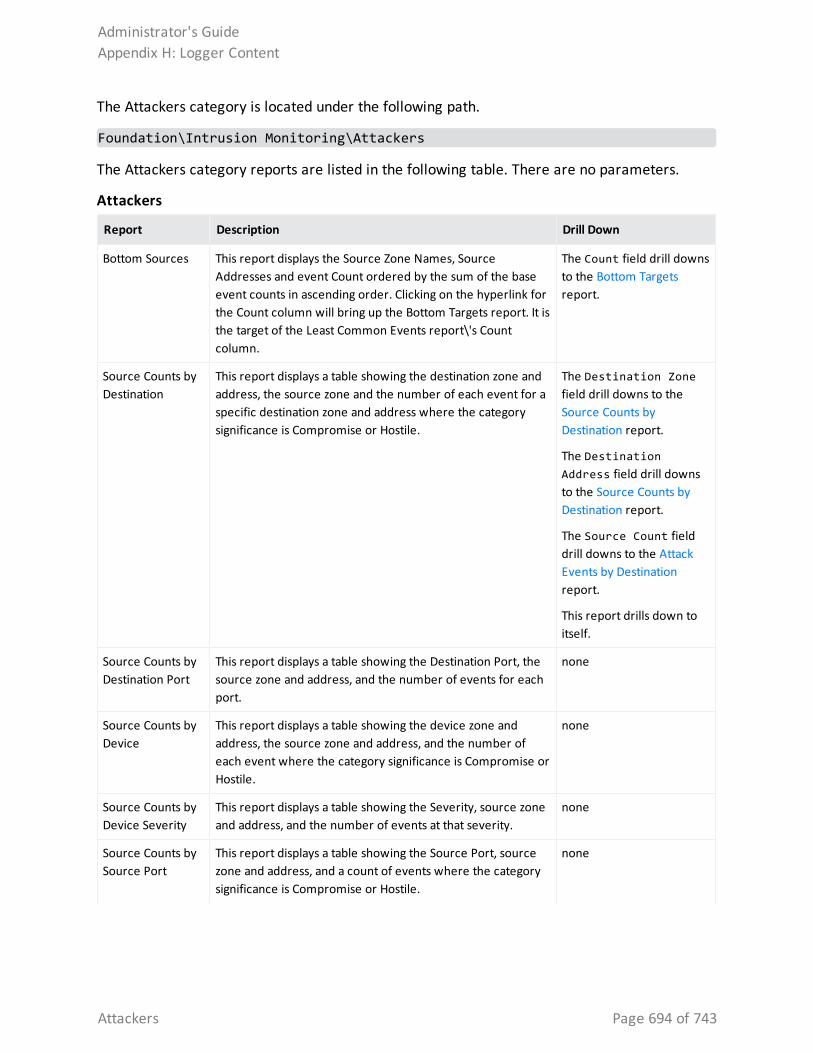
The Attackers category is located under the following path.
Foundation\Intrusion Monitoring\Attackers
The Attackers category reports are listed in the following table. There are no parameters.
Report Description Drill Down
Bottom Sources This report displays the Source Zone Names, Source Addresses and event Count ordered by the sum of the base event counts in ascending order. Clicking on the hyperlink for the Count column will bring up the Bottom Targets report. It is the target of the Least Common Events report\'s Count column.
The Count field drill downs to the Bottom Targets report.
Source Counts by Destination
This report displays a table showing the destination zone and address, the source zone and the number of each event for a specific destination zone and address where the category significance is Compromise or Hostile.
The Destination Zone field drill downs to the Source Counts by Destination report.
The Destination Address field drill downs to the Source Counts by Destination report.
The Source Count field drill downs to the Attack Events by Destination report.
This report drills down to itself.
Source Counts by Destination Port
This report displays a table showing the Destination Port, the source zone and address, and the number of events for each port.
none
Source Counts by Device
This report displays a table showing the device zone and address, the source zone and address, and the number of each event where the category significance is Compromise or Hostile.
none
Source Counts by Device Severity
This report displays a table showing the Severity, source zone and address, and the number of events at that severity.
none
Source Counts by Source Port
This report displays a table showing the Source Port, source zone and address, and a count of events where the category significance is Compromise or Hostile.
none
Attackers
Administrator's GuideAppendix H: Logger Content
Attackers Page 694 of 743
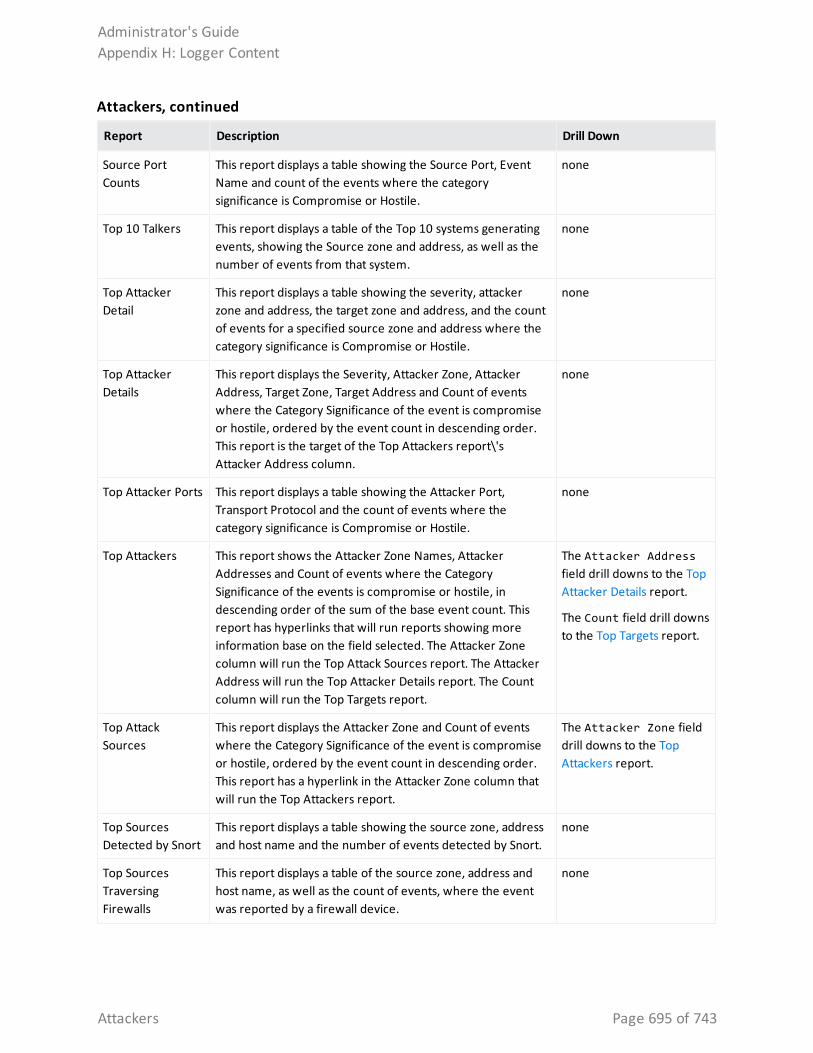
Report Description Drill Down
Source Port Counts
This report displays a table showing the Source Port, Event Name and count of the events where the category significance is Compromise or Hostile.
none
Top 10 Talkers This report displays a table of the Top 10 systems generating events, showing the Source zone and address, as well as the number of events from that system.
none
Top Attacker Detail
This report displays a table showing the severity, attacker zone and address, the target zone and address, and the count of events for a specified source zone and address where the category significance is Compromise or Hostile.
none
Top Attacker Details
This report displays the Severity, Attacker Zone, Attacker Address, Target Zone, Target Address and Count of events where the Category Significance of the event is compromise or hostile, ordered by the event count in descending order. This report is the target of the Top Attackers report\'s Attacker Address column.
none
Top Attacker Ports This report displays a table showing the Attacker Port, Transport Protocol and the count of events where the category significance is Compromise or Hostile.
none
Top Attackers This report shows the Attacker Zone Names, Attacker Addresses and Count of events where the Category Significance of the events is compromise or hostile, in descending order of the sum of the base event count. This report has hyperlinks that will run reports showing more information base on the field selected. The Attacker Zone column will run the Top Attack Sources report. The Attacker Address will run the Top Attacker Details report. The Count column will run the Top Targets report.
The Attacker Address field drill downs to the Top Attacker Details report.
The Count field drill downs to the Top Targets report.
Top Attack Sources
This report displays the Attacker Zone and Count of events where the Category Significance of the event is compromise or hostile, ordered by the event count in descending order. This report has a hyperlink in the Attacker Zone column that will run the Top Attackers report.
The Attacker Zone field drill downs to the Top Attackers report.
Top Sources Detected by Snort
This report displays a table showing the source zone, address and host name and the number of events detected by Snort.
none
Top Sources Traversing Firewalls
This report displays a table of the source zone, address and host name, as well as the count of events, where the event was reported by a firewall device.
none
Attackers, continued
Administrator's GuideAppendix H: Logger Content
Attackers Page 695 of 743
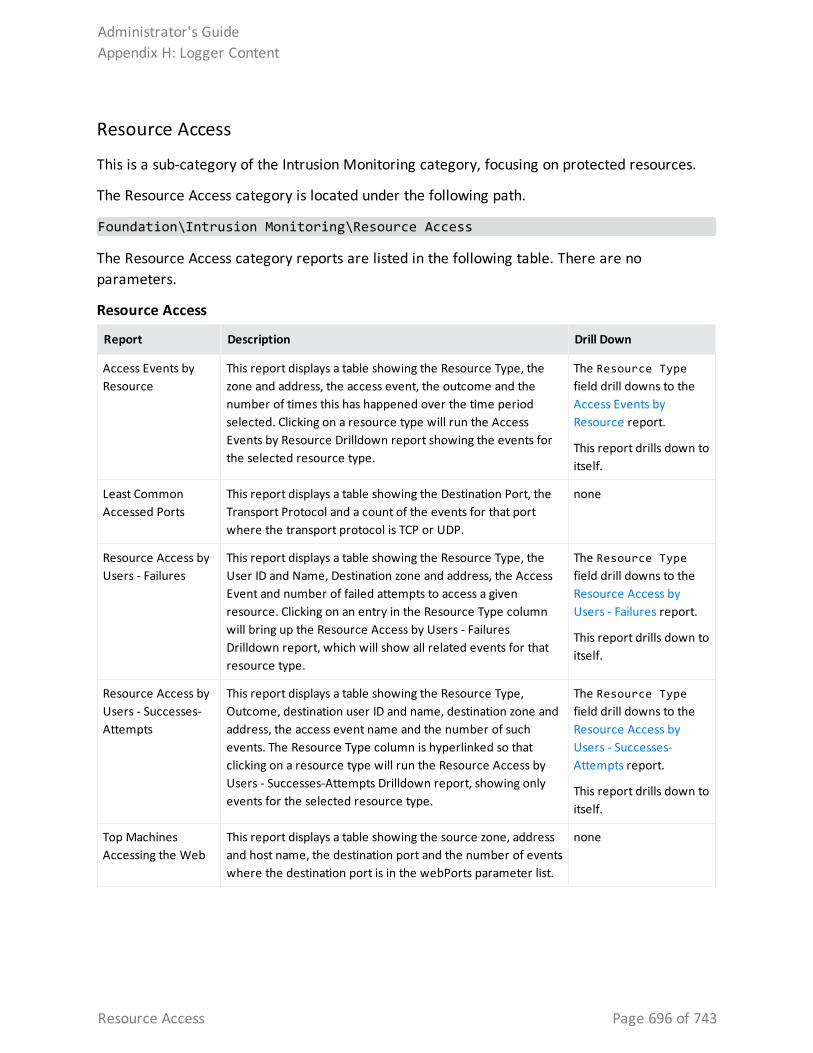
Resource Access
This is a sub-category of the Intrusion Monitoring category, focusing on protected resources.
The Resource Access category is located under the following path.
Foundation\Intrusion Monitoring\Resource Access
The Resource Access category reports are listed in the following table. There are no parameters.
Report Description Drill Down
Access Events by Resource
This report displays a table showing the Resource Type, the zone and address, the access event, the outcome and the number of times this has happened over the time period selected. Clicking on a resource type will run the Access Events by Resource Drilldown report showing the events for the selected resource type.
The Resource Type field drill downs to the Access Events by Resource report.
This report drills down to itself.
Least Common Accessed Ports
This report displays a table showing the Destination Port, the Transport Protocol and a count of the events for that port where the transport protocol is TCP or UDP.
none
Resource Access by Users - Failures
This report displays a table showing the Resource Type, the User ID and Name, Destination zone and address, the Access Event and number of failed attempts to access a given resource. Clicking on an entry in the Resource Type column will bring up the Resource Access by Users - Failures Drilldown report, which will show all related events for that resource type.
The Resource Type field drill downs to the Resource Access by Users - Failures report.
This report drills down to itself.
Resource Access by Users - Successes-Attempts
This report displays a table showing the Resource Type, Outcome, destination user ID and name, destination zone and address, the access event name and the number of such events. The Resource Type column is hyperlinked so that clicking on a resource type will run the Resource Access by Users - Successes-Attempts Drilldown report, showing only events for the selected resource type.
The Resource Type field drill downs to the Resource Access by Users - Successes-Attempts report.
This report drills down to itself.
Top Machines Accessing the Web
This report displays a table showing the source zone, address and host name, the destination port and the number of events where the destination port is in the webPorts parameter list.
none
Resource Access
Administrator's GuideAppendix H: Logger Content
Resource Access Page 696 of 743
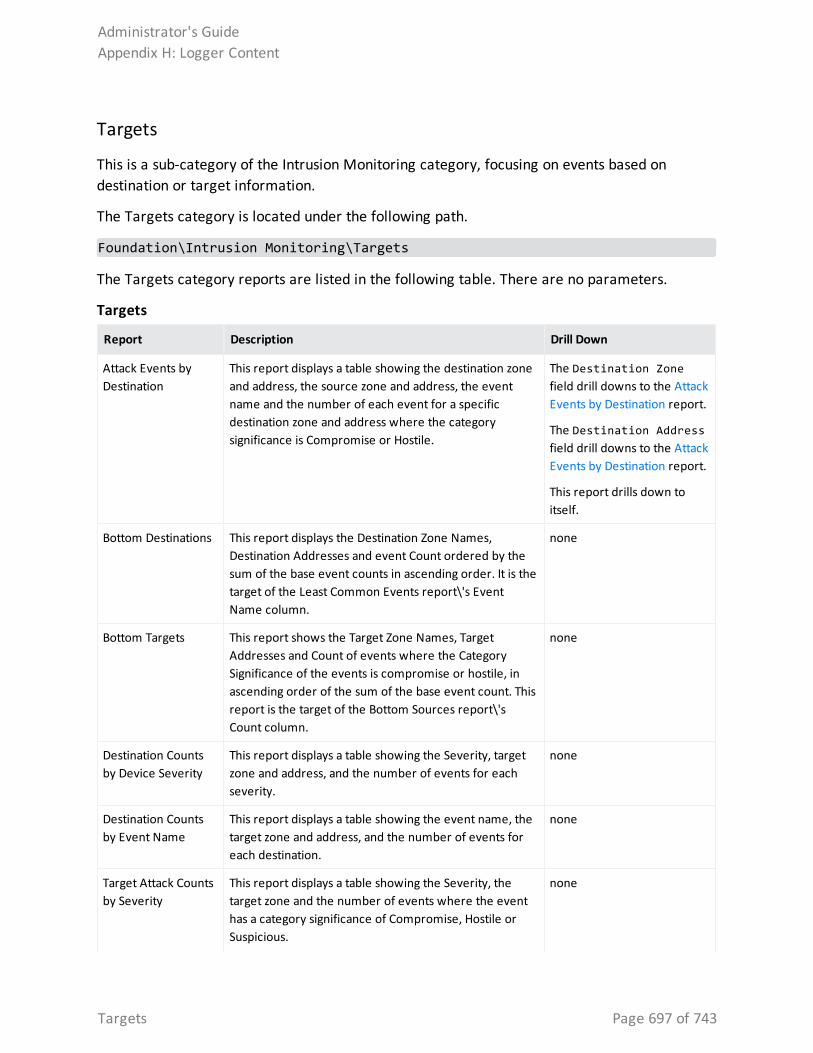
Targets
This is a sub-category of the Intrusion Monitoring category, focusing on events based on destination or target information.
The Targets category is located under the following path.
Foundation\Intrusion Monitoring\Targets
The Targets category reports are listed in the following table. There are no parameters.
Report Description Drill Down
Attack Events by Destination
This report displays a table showing the destination zone and address, the source zone and address, the event name and the number of each event for a specific destination zone and address where the category significance is Compromise or Hostile.
The Destination Zone field drill downs to the Attack Events by Destination report.
The Destination Address field drill downs to the Attack Events by Destination report.
This report drills down to itself.
Bottom Destinations This report displays the Destination Zone Names, Destination Addresses and event Count ordered by the sum of the base event counts in ascending order. It is the target of the Least Common Events report\'s Event Name column.
none
Bottom Targets This report shows the Target Zone Names, Target Addresses and Count of events where the Category Significance of the events is compromise or hostile, in ascending order of the sum of the base event count. This report is the target of the Bottom Sources report\'s Count column.
none
Destination Counts by Device Severity
This report displays a table showing the Severity, target zone and address, and the number of events for each severity.
none
Destination Counts by Event Name
This report displays a table showing the event name, the target zone and address, and the number of events for each destination.
none
Target Attack Counts by Severity
This report displays a table showing the Severity, the target zone and the number of events where the event has a category significance of Compromise, Hostile or Suspicious.
none
Targets
Administrator's GuideAppendix H: Logger Content
Targets Page 697 of 743
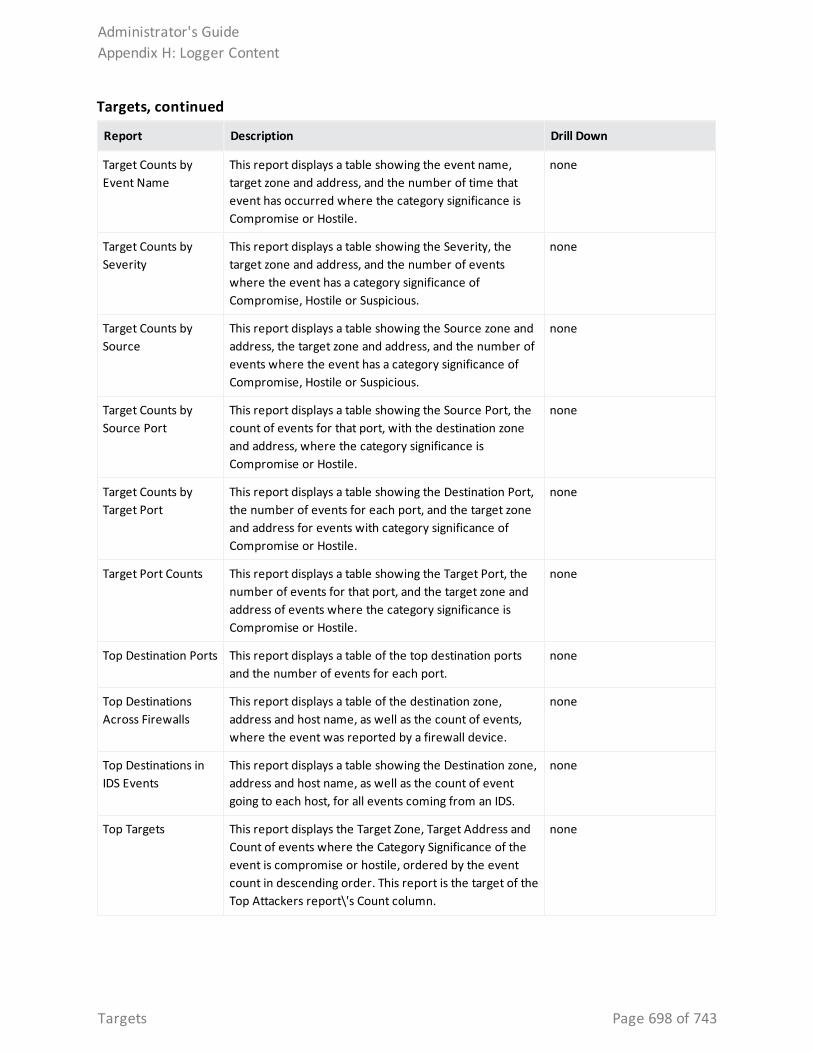
Report Description Drill Down
Target Counts by Event Name
This report displays a table showing the event name, target zone and address, and the number of time that event has occurred where the category significance is Compromise or Hostile.
none
Target Counts by Severity
This report displays a table showing the Severity, the target zone and address, and the number of events where the event has a category significance of Compromise, Hostile or Suspicious.
none
Target Counts by Source
This report displays a table showing the Source zone and address, the target zone and address, and the number of events where the event has a category significance of Compromise, Hostile or Suspicious.
none
Target Counts by Source Port
This report displays a table showing the Source Port, the count of events for that port, with the destination zone and address, where the category significance is Compromise or Hostile.
none
Target Counts by Target Port
This report displays a table showing the Destination Port, the number of events for each port, and the target zone and address for events with category significance of Compromise or Hostile.
none
Target Port Counts This report displays a table showing the Target Port, the number of events for that port, and the target zone and address of events where the category significance is Compromise or Hostile.
none
Top Destination Ports This report displays a table of the top destination ports and the number of events for each port.
none
Top Destinations Across Firewalls
This report displays a table of the destination zone, address and host name, as well as the count of events, where the event was reported by a firewall device.
none
Top Destinations in IDS Events
This report displays a table showing the Destination zone, address and host name, as well as the count of event going to each host, for all events coming from an IDS.
none
Top Targets This report displays the Target Zone, Target Address and Count of events where the Category Significance of the event is compromise or hostile, ordered by the event count in descending order. This report is the target of the Top Attackers report\'s Count column.
none
Targets, continued
Administrator's GuideAppendix H: Logger Content
Targets Page 698 of 743
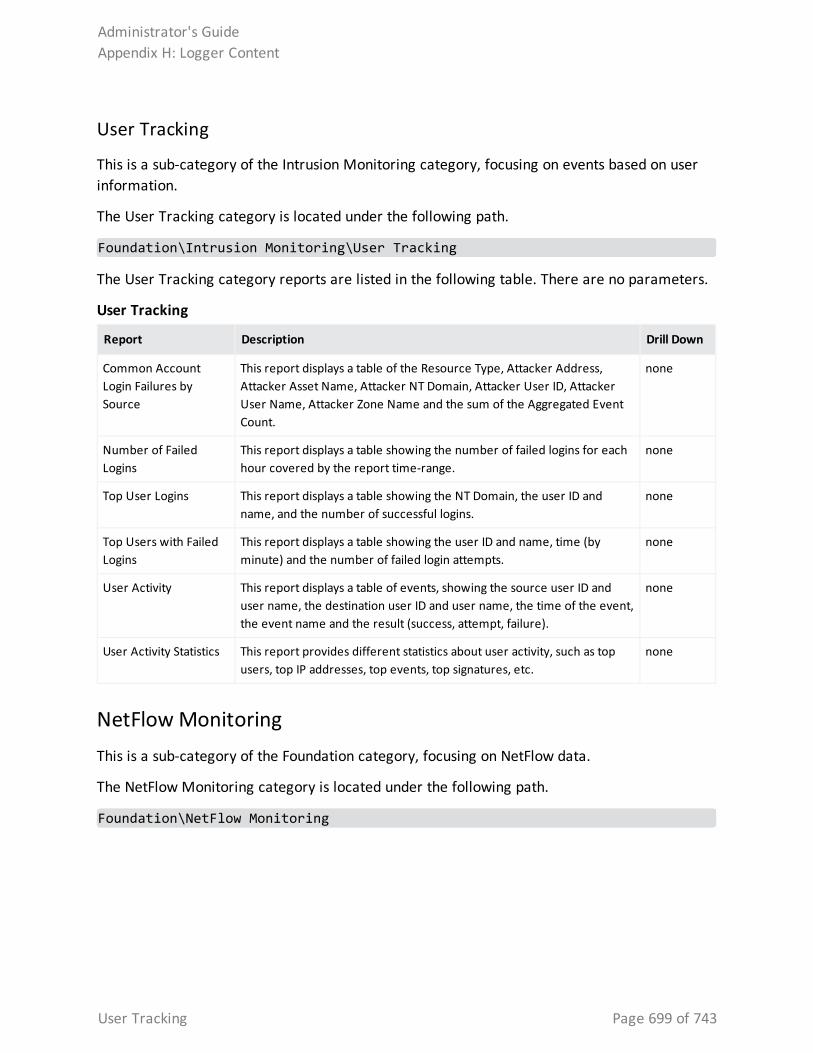
User Tracking
This is a sub-category of the Intrusion Monitoring category, focusing on events based on user information.
The User Tracking category is located under the following path.
Foundation\Intrusion Monitoring\User Tracking
The User Tracking category reports are listed in the following table. There are no parameters.
Report Description Drill Down
Common Account Login Failures by Source
This report displays a table of the Resource Type, Attacker Address, Attacker Asset Name, Attacker NT Domain, Attacker User ID, Attacker User Name, Attacker Zone Name and the sum of the Aggregated Event Count.
none
Number of Failed Logins
This report displays a table showing the number of failed logins for each hour covered by the report time-range.
none
Top User Logins This report displays a table showing the NT Domain, the user ID and name, and the number of successful logins.
none
Top Users with Failed Logins
This report displays a table showing the user ID and name, time (by minute) and the number of failed login attempts.
none
User Activity This report displays a table of events, showing the source user ID and user name, the destination user ID and user name, the time of the event, the event name and the result (success, attempt, failure).
none
User Activity Statistics This report provides different statistics about user activity, such as top users, top IP addresses, top events, top signatures, etc.
none
User Tracking
NetFlow MonitoringThis is a sub-category of the Foundation category, focusing on NetFlow data.
The NetFlow Monitoring category is located under the following path.
Foundation\NetFlow Monitoring
Administrator's GuideAppendix H: Logger Content
User Tracking Page 699 of 743
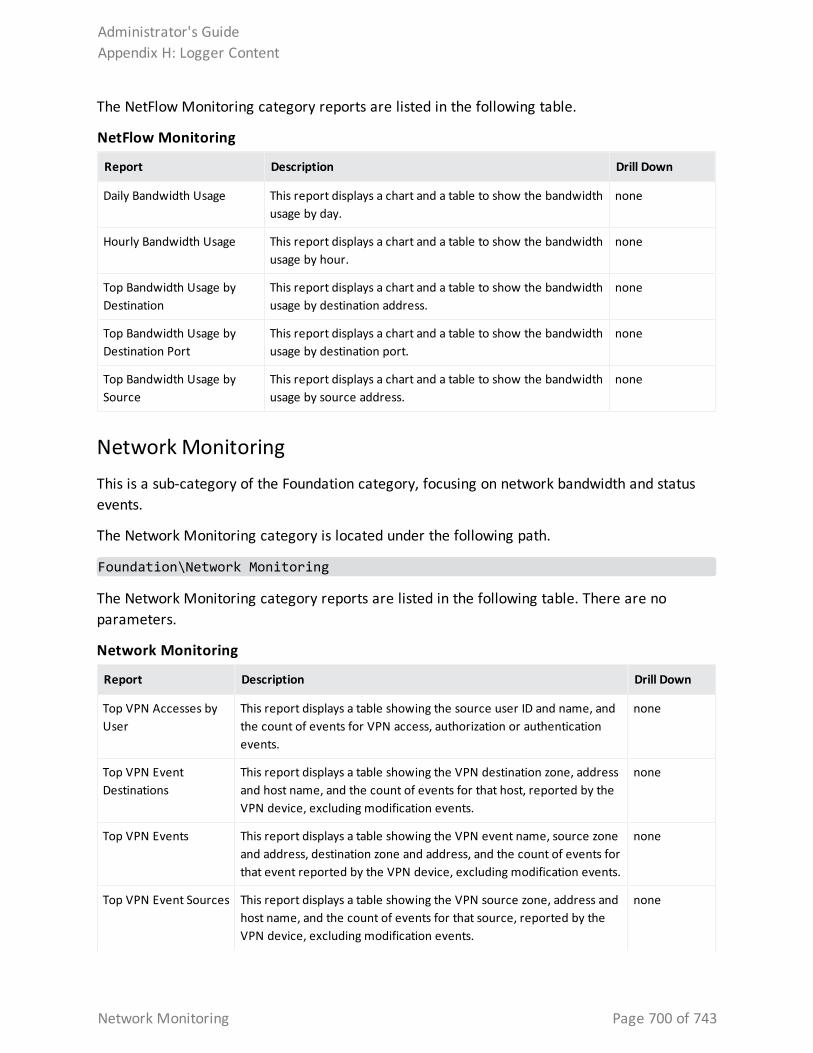
The NetFlow Monitoring category reports are listed in the following table.
Report Description Drill Down
Daily Bandwidth Usage This report displays a chart and a table to show the bandwidth usage by day.
none
Hourly Bandwidth Usage This report displays a chart and a table to show the bandwidth usage by hour.
none
Top Bandwidth Usage by Destination
This report displays a chart and a table to show the bandwidth usage by destination address.
none
Top Bandwidth Usage by Destination Port
This report displays a chart and a table to show the bandwidth usage by destination port.
none
Top Bandwidth Usage by Source
This report displays a chart and a table to show the bandwidth usage by source address.
none
NetFlow Monitoring
Network MonitoringThis is a sub-category of the Foundation category, focusing on network bandwidth and status events.
The Network Monitoring category is located under the following path.
Foundation\Network Monitoring
The Network Monitoring category reports are listed in the following table. There are no parameters.
Report Description Drill Down
Top VPN Accesses by User
This report displays a table showing the source user ID and name, and the count of events for VPN access, authorization or authentication events.
none
Top VPN Event Destinations
This report displays a table showing the VPN destination zone, address and host name, and the count of events for that host, reported by the VPN device, excluding modification events.
none
Top VPN Events This report displays a table showing the VPN event name, source zone and address, destination zone and address, and the count of events for that event reported by the VPN device, excluding modification events.
none
Top VPN Event Sources This report displays a table showing the VPN source zone, address and host name, and the count of events for that source, reported by the VPN device, excluding modification events.
none
Network Monitoring
Administrator's GuideAppendix H: Logger Content
Network Monitoring Page 700 of 743
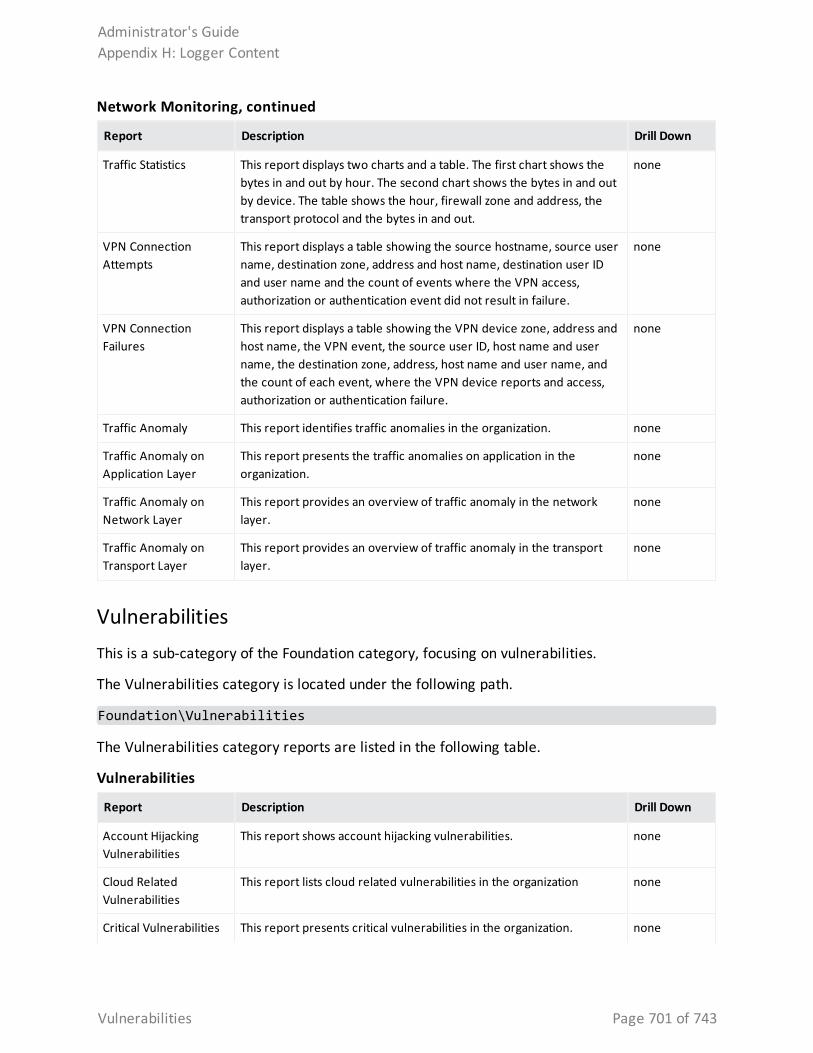
Report Description Drill Down
Traffic Statistics This report displays two charts and a table. The first chart shows the bytes in and out by hour. The second chart shows the bytes in and out by device. The table shows the hour, firewall zone and address, the transport protocol and the bytes in and out.
none
VPN Connection Attempts
This report displays a table showing the source hostname, source user name, destination zone, address and host name, destination user ID and user name and the count of events where the VPN access, authorization or authentication event did not result in failure.
none
VPN Connection Failures
This report displays a table showing the VPN device zone, address and host name, the VPN event, the source user ID, host name and user name, the destination zone, address, host name and user name, and the count of each event, where the VPN device reports and access, authorization or authentication failure.
none
Traffic Anomaly This report identifies traffic anomalies in the organization. none
Traffic Anomaly on Application Layer
This report presents the traffic anomalies on application in the organization.
none
Traffic Anomaly on Network Layer
This report provides an overview of traffic anomaly in the network layer.
none
Traffic Anomaly on Transport Layer
This report provides an overview of traffic anomaly in the transport layer.
none
Network Monitoring, continued
VulnerabilitiesThis is a sub-category of the Foundation category, focusing on vulnerabilities.
The Vulnerabilities category is located under the following path.
Foundation\Vulnerabilities
The Vulnerabilities category reports are listed in the following table.
Report Description Drill Down
Account Hijacking Vulnerabilities
This report shows account hijacking vulnerabilities. none
Cloud Related Vulnerabilities
This report lists cloud related vulnerabilities in the organization none
Critical Vulnerabilities This report presents critical vulnerabilities in the organization. none
Vulnerabilities
Administrator's GuideAppendix H: Logger Content
Vulnerabilities Page 701 of 743
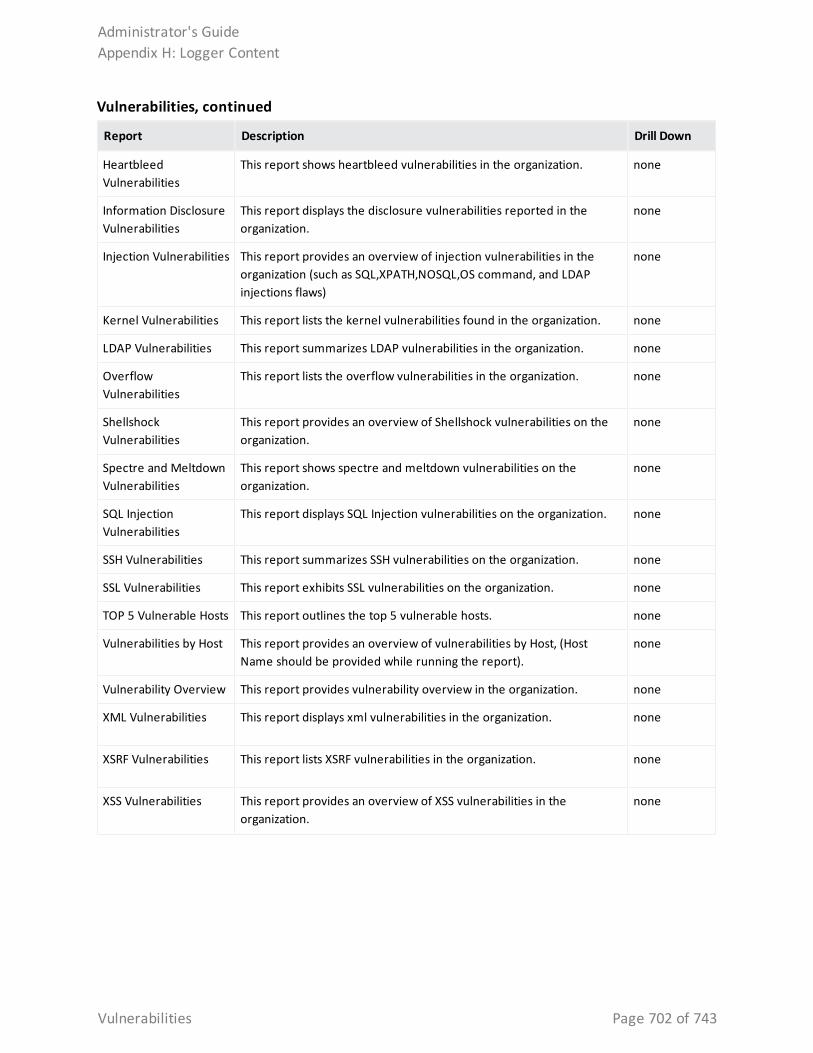
Report Description Drill Down
Heartbleed Vulnerabilities
This report shows heartbleed vulnerabilities in the organization. none
Information Disclosure Vulnerabilities
This report displays the disclosure vulnerabilities reported in the organization.
none
Injection Vulnerabilities This report provides an overview of injection vulnerabilities in the organization (such as SQL,XPATH,NOSQL,OS command, and LDAP injections flaws)
none
Kernel Vulnerabilities This report lists the kernel vulnerabilities found in the organization. none
LDAP Vulnerabilities This report summarizes LDAP vulnerabilities in the organization. none
Overflow Vulnerabilities
This report lists the overflow vulnerabilities in the organization. none
Shellshock Vulnerabilities
This report provides an overview of Shellshock vulnerabilities on the organization.
none
Spectre and Meltdown Vulnerabilities
This report shows spectre and meltdown vulnerabilities on the organization.
none
SQL Injection Vulnerabilities
This report displays SQL Injection vulnerabilities on the organization. none
SSH Vulnerabilities This report summarizes SSH vulnerabilities on the organization. none
SSL Vulnerabilities This report exhibits SSL vulnerabilities on the organization. none
TOP 5 Vulnerable Hosts This report outlines the top 5 vulnerable hosts. none
Vulnerabilities by Host This report provides an overview of vulnerabilities by Host, (Host Name should be provided while running the report).
none
Vulnerability Overview This report provides vulnerability overview in the organization. none
XML Vulnerabilities This report displays xml vulnerabilities in the organization. none
XSRF Vulnerabilities This report lists XSRF vulnerabilities in the organization. none
XSS Vulnerabilities This report provides an overview of XSS vulnerabilities in the organization.
none
Vulnerabilities, continued
Administrator's GuideAppendix H: Logger Content
Vulnerabilities Page 702 of 743
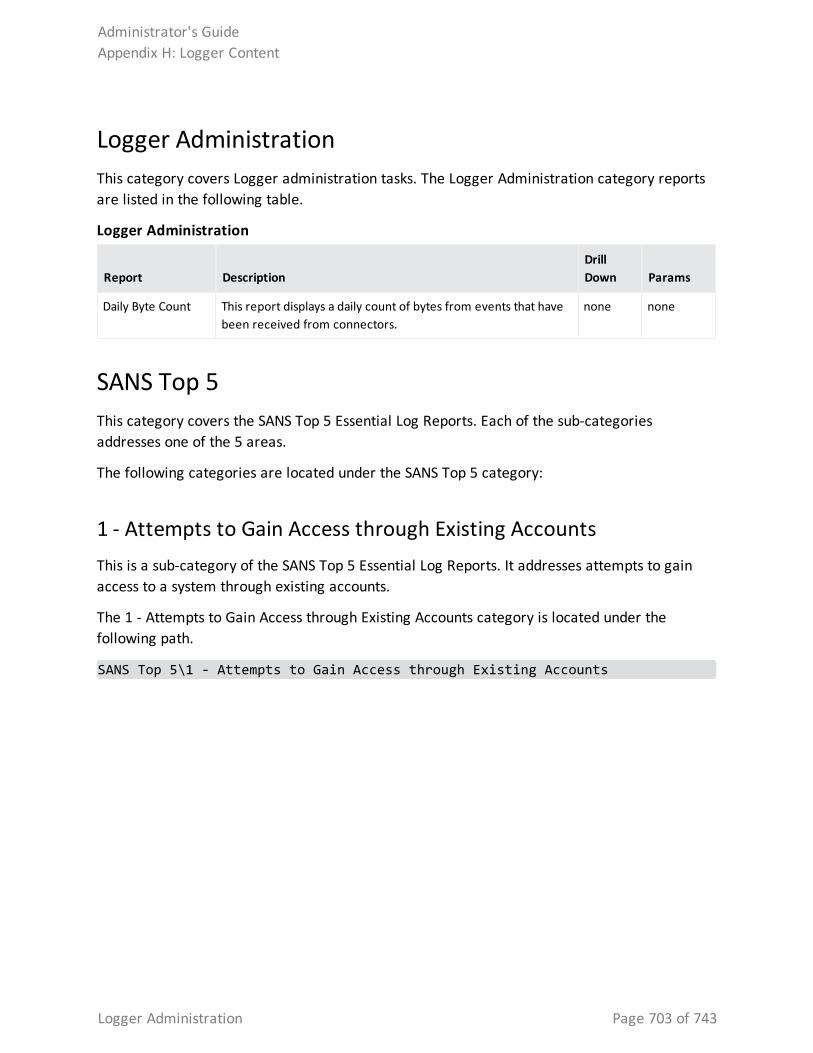
Logger AdministrationThis category covers Logger administration tasks. The Logger Administration category reports are listed in the following table.
Report DescriptionDrill Down Params
Daily Byte Count This report displays a daily count of bytes from events that have been received from connectors.
none none
Logger Administration
SANS Top 5This category covers the SANS Top 5 Essential Log Reports. Each of the sub-categories addresses one of the 5 areas.
The following categories are located under the SANS Top 5 category:
1 - Attempts to Gain Access through Existing AccountsThis is a sub-category of the SANS Top 5 Essential Log Reports. It addresses attempts to gain access to a system through existing accounts.
The 1 - Attempts to Gain Access through Existing Accounts category is located under the following path.
SANS Top 5\1 - Attempts to Gain Access through Existing Accounts
Administrator's GuideAppendix H: Logger Content
Logger Administration Page 703 of 743
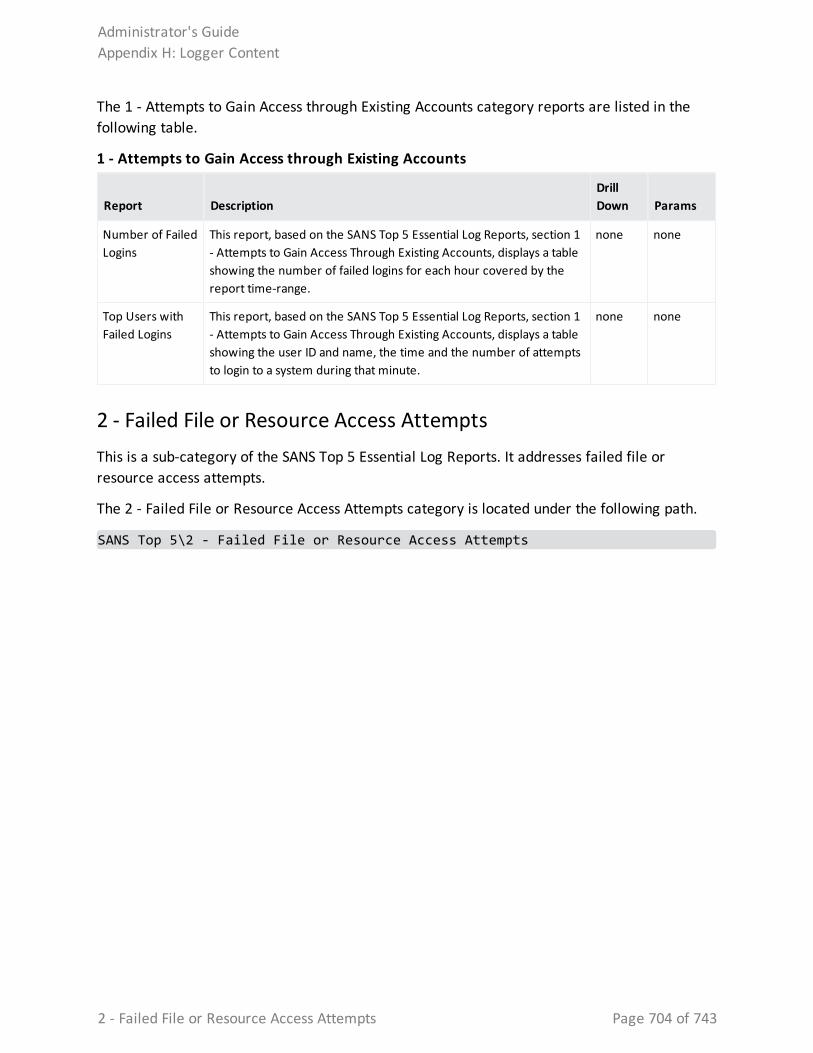
The 1 - Attempts to Gain Access through Existing Accounts category reports are listed in the following table.
Report DescriptionDrill Down Params
Number of Failed Logins
This report, based on the SANS Top 5 Essential Log Reports, section 1 - Attempts to Gain Access Through Existing Accounts, displays a table showing the number of failed logins for each hour covered by the report time-range.
none none
Top Users with Failed Logins
This report, based on the SANS Top 5 Essential Log Reports, section 1 - Attempts to Gain Access Through Existing Accounts, displays a table showing the user ID and name, the time and the number of attempts to login to a system during that minute.
none none
1 - Attempts to Gain Access through Existing Accounts
2 - Failed File or Resource Access AttemptsThis is a sub-category of the SANS Top 5 Essential Log Reports. It addresses failed file or resource access attempts.
The 2 - Failed File or Resource Access Attempts category is located under the following path.
SANS Top 5\2 - Failed File or Resource Access Attempts
Administrator's GuideAppendix H: Logger Content
2 - Failed File or Resource Access Attempts Page 704 of 743
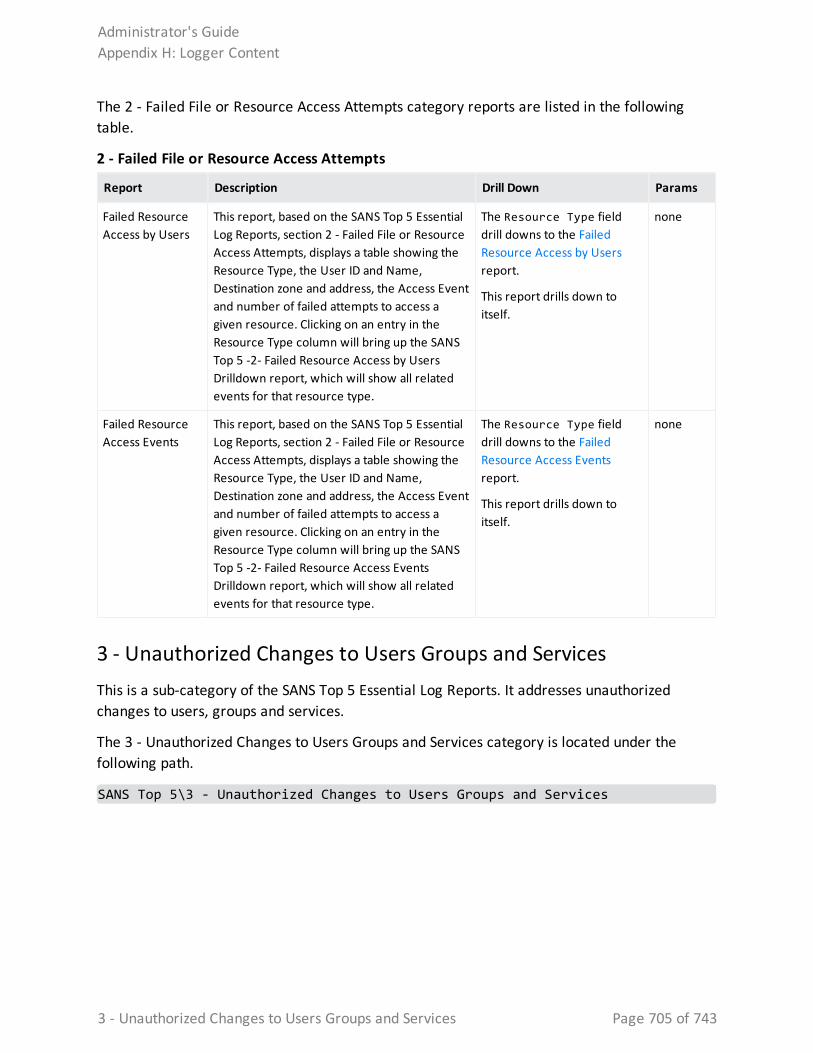
The 2 - Failed File or Resource Access Attempts category reports are listed in the following table.
Report Description Drill Down Params
Failed Resource Access by Users
This report, based on the SANS Top 5 Essential Log Reports, section 2 - Failed File or Resource Access Attempts, displays a table showing the Resource Type, the User ID and Name, Destination zone and address, the Access Event and number of failed attempts to access a given resource. Clicking on an entry in the Resource Type column will bring up the SANS Top 5 -2- Failed Resource Access by Users Drilldown report, which will show all related events for that resource type.
The Resource Type field drill downs to the Failed Resource Access by Users report.
This report drills down to itself.
none
Failed Resource Access Events
This report, based on the SANS Top 5 Essential Log Reports, section 2 - Failed File or Resource Access Attempts, displays a table showing the Resource Type, the User ID and Name, Destination zone and address, the Access Event and number of failed attempts to access a given resource. Clicking on an entry in the Resource Type column will bring up the SANS Top 5 -2- Failed Resource Access Events Drilldown report, which will show all related events for that resource type.
The Resource Type field drill downs to the Failed Resource Access Events report.
This report drills down to itself.
none
2 - Failed File or Resource Access Attempts
3 - Unauthorized Changes to Users Groups and ServicesThis is a sub-category of the SANS Top 5 Essential Log Reports. It addresses unauthorized changes to users, groups and services.
The 3 - Unauthorized Changes to Users Groups and Services category is located under the following path.
SANS Top 5\3 - Unauthorized Changes to Users Groups and Services
Administrator's GuideAppendix H: Logger Content
3 - Unauthorized Changes to Users Groups and Services Page 705 of 743
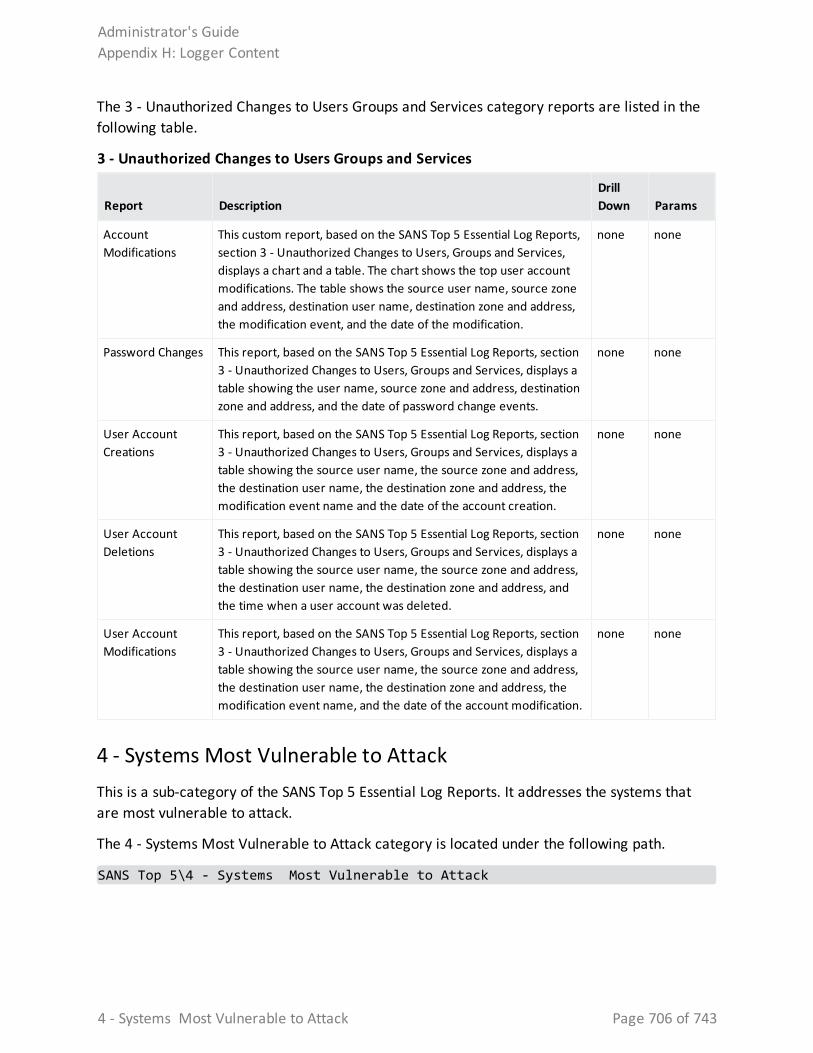
The 3 - Unauthorized Changes to Users Groups and Services category reports are listed in the following table.
Report DescriptionDrill Down Params
Account Modifications
This custom report, based on the SANS Top 5 Essential Log Reports, section 3 - Unauthorized Changes to Users, Groups and Services, displays a chart and a table. The chart shows the top user account modifications. The table shows the source user name, source zone and address, destination user name, destination zone and address, the modification event, and the date of the modification.
none none
Password Changes This report, based on the SANS Top 5 Essential Log Reports, section 3 - Unauthorized Changes to Users, Groups and Services, displays a table showing the user name, source zone and address, destination zone and address, and the date of password change events.
none none
User Account Creations
This report, based on the SANS Top 5 Essential Log Reports, section 3 - Unauthorized Changes to Users, Groups and Services, displays a table showing the source user name, the source zone and address, the destination user name, the destination zone and address, the modification event name and the date of the account creation.
none none
User Account Deletions
This report, based on the SANS Top 5 Essential Log Reports, section 3 - Unauthorized Changes to Users, Groups and Services, displays a table showing the source user name, the source zone and address, the destination user name, the destination zone and address, and the time when a user account was deleted.
none none
User Account Modifications
This report, based on the SANS Top 5 Essential Log Reports, section 3 - Unauthorized Changes to Users, Groups and Services, displays a table showing the source user name, the source zone and address, the destination user name, the destination zone and address, the modification event name, and the date of the account modification.
none none
3 - Unauthorized Changes to Users Groups and Services
4 - Systems Most Vulnerable to AttackThis is a sub-category of the SANS Top 5 Essential Log Reports. It addresses the systems that are most vulnerable to attack.
The 4 - Systems Most Vulnerable to Attack category is located under the following path.
SANS Top 5\4 - Systems Most Vulnerable to Attack
Administrator's GuideAppendix H: Logger Content
4 - Systems Most Vulnerable to Attack Page 706 of 743
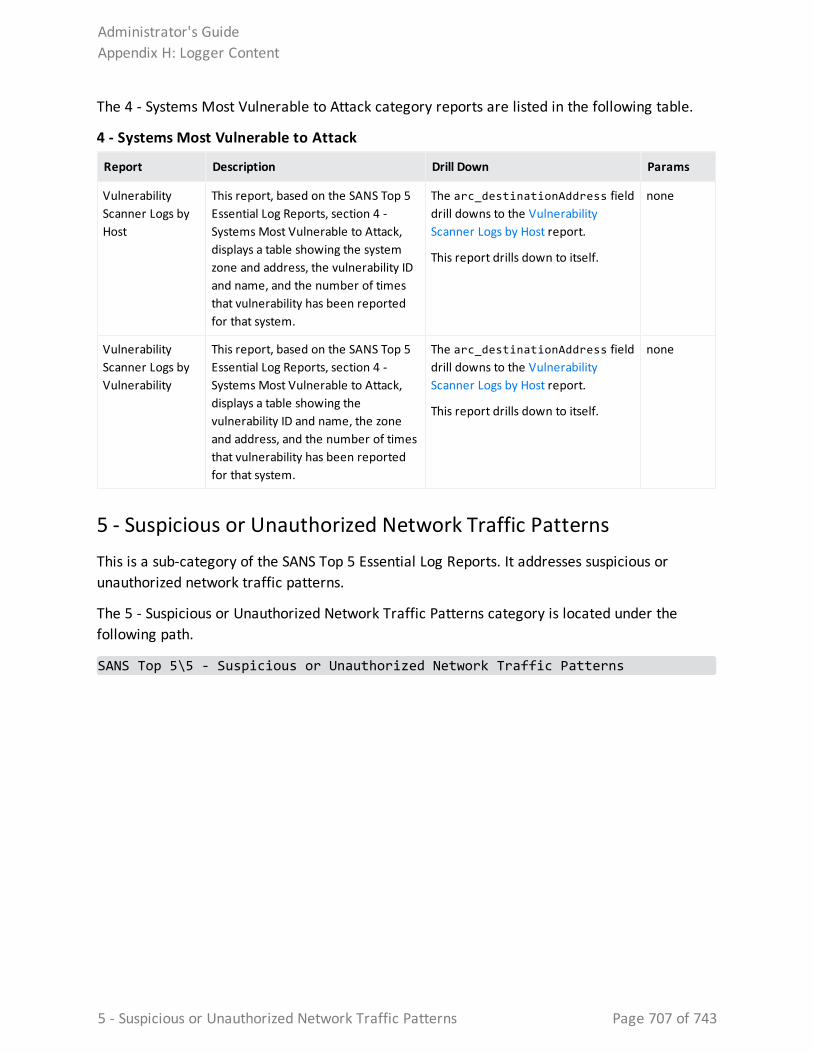
The 4 - Systems Most Vulnerable to Attack category reports are listed in the following table.
Report Description Drill Down Params
Vulnerability Scanner Logs by Host
This report, based on the SANS Top 5 Essential Log Reports, section 4 - Systems Most Vulnerable to Attack, displays a table showing the system zone and address, the vulnerability ID and name, and the number of times that vulnerability has been reported for that system.
The arc_destinationAddress field drill downs to the Vulnerability Scanner Logs by Host report.
This report drills down to itself.
none
Vulnerability Scanner Logs by Vulnerability
This report, based on the SANS Top 5 Essential Log Reports, section 4 - Systems Most Vulnerable to Attack, displays a table showing the vulnerability ID and name, the zone and address, and the number of times that vulnerability has been reported for that system.
The arc_destinationAddress field drill downs to the Vulnerability Scanner Logs by Host report.
This report drills down to itself.
none
4 - Systems Most Vulnerable to Attack
5 - Suspicious or Unauthorized Network Traffic PatternsThis is a sub-category of the SANS Top 5 Essential Log Reports. It addresses suspicious or unauthorized network traffic patterns.
The 5 - Suspicious or Unauthorized Network Traffic Patterns category is located under the following path.
SANS Top 5\5 - Suspicious or Unauthorized Network Traffic Patterns
Administrator's GuideAppendix H: Logger Content
5 - Suspicious or Unauthorized Network Traffic Patterns Page 707 of 743
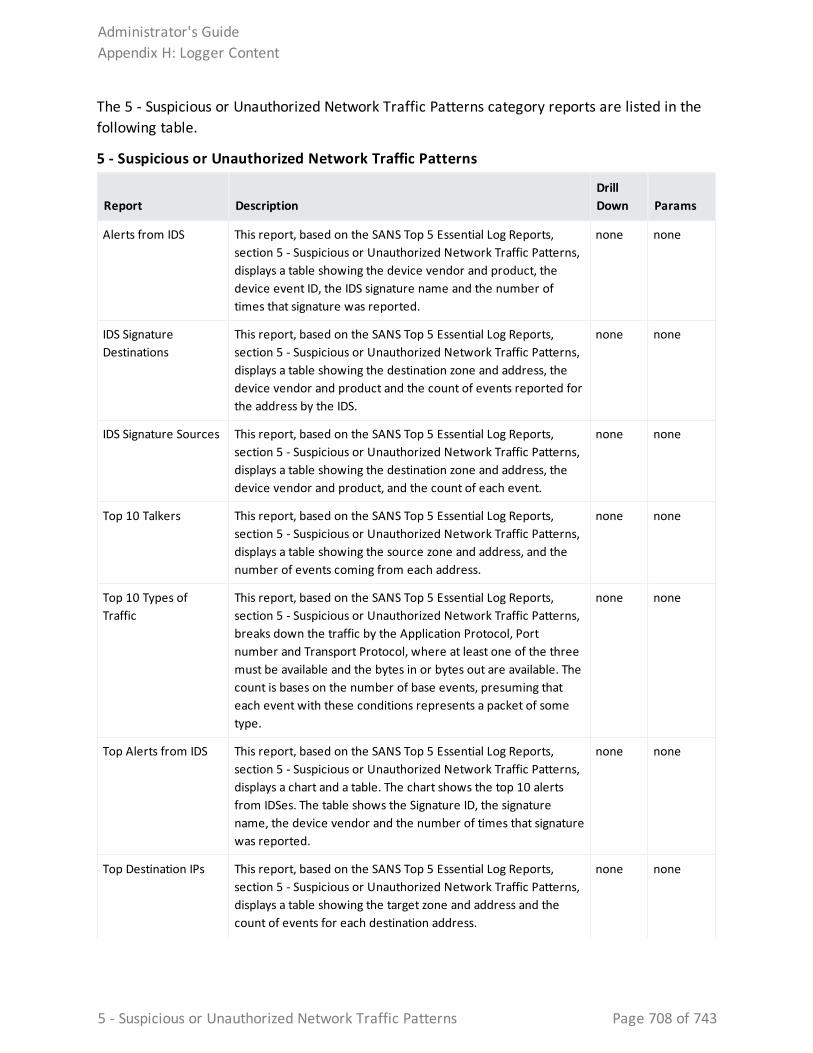
The 5 - Suspicious or Unauthorized Network Traffic Patterns category reports are listed in the following table.
Report DescriptionDrill Down Params
Alerts from IDS This report, based on the SANS Top 5 Essential Log Reports, section 5 - Suspicious or Unauthorized Network Traffic Patterns, displays a table showing the device vendor and product, the device event ID, the IDS signature name and the number of times that signature was reported.
none none
IDS Signature Destinations
This report, based on the SANS Top 5 Essential Log Reports, section 5 - Suspicious or Unauthorized Network Traffic Patterns, displays a table showing the destination zone and address, the device vendor and product and the count of events reported for the address by the IDS.
none none
IDS Signature Sources This report, based on the SANS Top 5 Essential Log Reports, section 5 - Suspicious or Unauthorized Network Traffic Patterns, displays a table showing the destination zone and address, the device vendor and product, and the count of each event.
none none
Top 10 Talkers This report, based on the SANS Top 5 Essential Log Reports, section 5 - Suspicious or Unauthorized Network Traffic Patterns, displays a table showing the source zone and address, and the number of events coming from each address.
none none
Top 10 Types of Traffic
This report, based on the SANS Top 5 Essential Log Reports, section 5 - Suspicious or Unauthorized Network Traffic Patterns, breaks down the traffic by the Application Protocol, Port number and Transport Protocol, where at least one of the three must be available and the bytes in or bytes out are available. The count is bases on the number of base events, presuming that each event with these conditions represents a packet of some type.
none none
Top Alerts from IDS This report, based on the SANS Top 5 Essential Log Reports, section 5 - Suspicious or Unauthorized Network Traffic Patterns, displays a chart and a table. The chart shows the top 10 alerts from IDSes. The table shows the Signature ID, the signature name, the device vendor and the number of times that signature was reported.
none none
Top Destination IPs This report, based on the SANS Top 5 Essential Log Reports, section 5 - Suspicious or Unauthorized Network Traffic Patterns, displays a table showing the target zone and address and the count of events for each destination address.
none none
5 - Suspicious or Unauthorized Network Traffic Patterns
Administrator's GuideAppendix H: Logger Content
5 - Suspicious or Unauthorized Network Traffic Patterns Page 708 of 743
Report DescriptionDrill Down Params
Top IDS Signature Destinations
This report, based on the SANS Top 5 Essential Log Reports, section 5 - Suspicious or Unauthorized Network Traffic Patterns, displays a chart and a table. The chart shows the top signature destinations by address. The table shows the destination zone and address, the device vendor and product, and the count of events to that host.
none none
Top IDS Signature Sources
This report, based on the SANS Top 5 Essential Log Reports, section 5 - Suspicious or Unauthorized Network Traffic Patterns, displays a chart and a table. The chart shows the top signature sources by address. The table shows the source zone and address, the device vendor and product, and the count of events by that host.
none none
Top Target IPs This report, based on the SANS Top 5 Essential Log Reports, section 5 - Suspicious or Unauthorized Network Traffic Patterns, displays a table showing the target zone and address, and the number of IDS event reported for that address where the category significance is Compromise or Hostile.
none none
5 - Suspicious or Unauthorized Network Traffic Patterns, continued
OWASPThis category covers the OWASP Top 10 Security Risks. Each of the sub-categories addresses one of those security risks.
The following categories are located under the OWASP category:
A1 - InjectionsThis is a sub-category of OWASP category, focusing on injections.
The A-1 injections category is located under the following path.
OWASP\A-1 Injections
The A-1 Injections category reports are listed in the following table.
Report Description Drill Down Parameters
Command Injections on HTTP Request
This report shows command injections on HTTP Requests.
none none
A-1 Injections
Administrator's GuideAppendix H: Logger Content
OWASP Page 709 of 743
A2- Broken AuthenticationThis is a sub-category of OWASP category, focusing on broken authentications.
The A-2 Broken Authentication category is located under the following path.
OWASP\A-2 Broken Authentication
The A-2 Broken Authentication category reports are listed in the following table.
Report Description Drill Down Parameters
Broken Authentication Events
This report provides an overview of broken authentication events.
none none
A-2 Broken Authentication
A3- Sensitive Data ExposureThis is a sub-category of OWASP category, focusing on sensitive data exposure.
The A-3 Sensitive Data Exposure category is located under the following path.
OWASP\A-3 Sensitive Data Exposure
The A-3 Sensitive Data Exposure category reports are listed in the following table.
Report DescriptionDrill Down Parameters
All Information Leakage events
This report lists the leakage events in the organization.
none none
Organizational Information Leakage
This report outlines the organizational information leakage events.
none none
Personal Information Leakage
This report shows the personal information leakage events on the organization.
none none
A-3 Sensitive Data Exposure
A4- XML External EntitiesThis is a sub-category of OWASP category, focusing on sensitive XML external entities vulnerabilities.
The A-4 XML External Entities category is located under the following path.
OWASP\A-4 XML External Entities
Administrator's GuideAppendix H: Logger Content
A2- Broken Authentication Page 710 of 743
A5- Broken Access ControlThis is a sub-category of OWASP category, focusing on broken access control.
The A-5 Broken Access Control category is located under the following path.
OWASP\A-5 Broken Access Control
The A-5 Broken Access Control category reports are listed in the following table.
Report Description Drill Down Parameters
Broken Access Control This report displays information of broken access control events
none none
A-5 Broken Access Control
A6- Security MisconfigurationThis is a sub-category of OWASP category, focusing on security misconfiguration.
The A-6 Security Misconfiguration category is located under the following path.
OWASP\A-6 Security Misconfiguration
The A-6 Security Misconfiguration category reports are listed in the following table.
Report DescriptionDrill Down Parameters
Misconfiguration Events This report shows the misconfiguration events found in the organization.
none none
Security Patch Missing This report provides information about security patches missing.
none none
A-6 Security Misconfiguration
A7- Cross-Site ScriptingThis is a sub-category of OWASP category, focusing on cross-site scripting.
The A-7 Cross-Site Scripting category is located under the following path.
OWASP\A-7 Cross-Site Scripting
A8- Insecure DeserializationThis is a sub-category of OWASP category, focusing on insecure deserialization.
Administrator's GuideAppendix H: Logger Content
A5- Broken Access Control Page 711 of 743
The A-8 Insecure Deserialization category is located under the following path.
OWASP\A-8 Insecure Deserialization
The A-8 Insecure Deserialization category reports are listed in the following table.
Report DescriptionDrill Down Parameters
Deserialization Flaws This report displays the serializations and deserialization flaws found on different products in the organization.
none none
A-8 Insecure Deserialization
A9 - Using Components with Known VulnerabilitiesThis is a sub-category of OWASP category, focusing on vulnerabilities on known components.
The A-9 - Using Components with Known Vulnerabilities category is located under the following path.
OWASP\A-9 - Using Components with Known Vulnerabilities
A10 - Insufficient Logging AND MonitoringThis is a sub-category of OWASP category, focusing on insufficient logging and monitoring.
The A-10 - Insufficient Logging AND Monitoring category is located under the following path.
OWASP\A-10 - Insufficient Logging AND Monitoring
The A-10 - Insufficient Logging AND Monitoring category reports are listed in the following table.
Report DescriptionDrill Down Parameters
All Failed Logins This report provides an overview of failed logins in the organization.
none none
All Logins by Host This report provides all login information of an specific host, (host name should be provided while report is running).
none none
Attacks And Suspicious Activity
This report lists the attacks and suspicious activity in the organization.
none none
A-10 - Insufficient Logging AND Monitoring
Administrator's GuideAppendix H: Logger Content
A9 - Using Components with Known Vulnerabilities Page 712 of 743
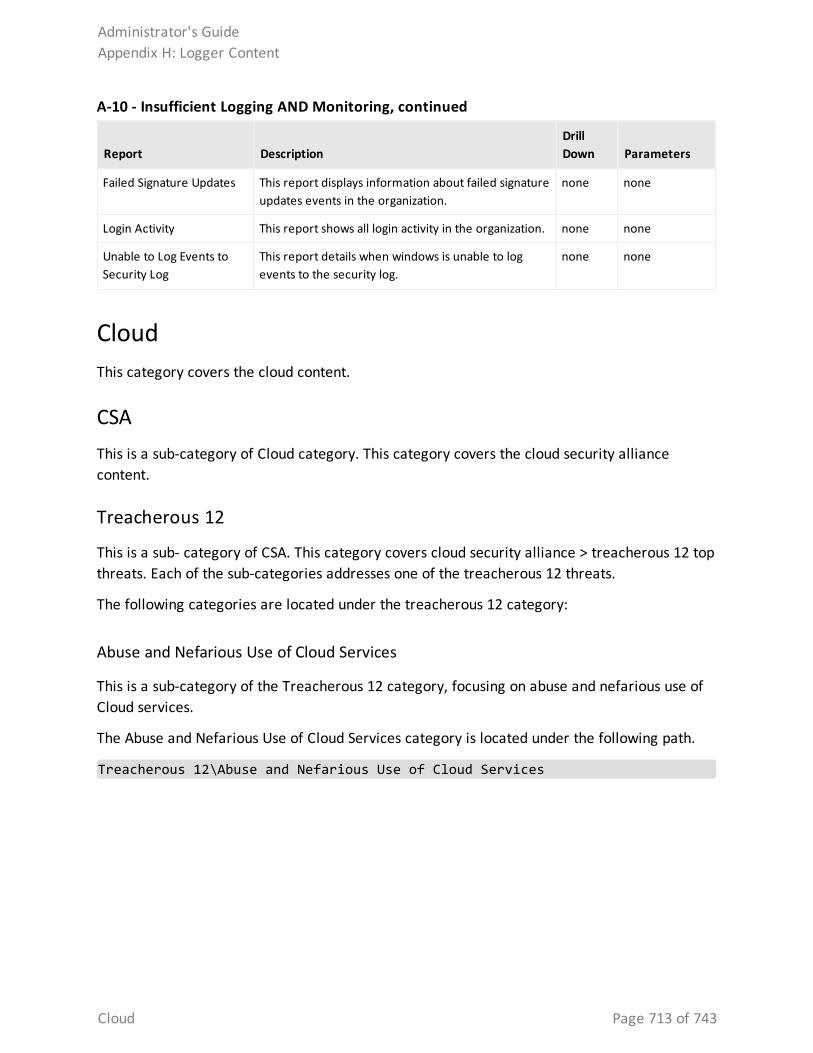
Report DescriptionDrill Down Parameters
Failed Signature Updates This report displays information about failed signature updates events in the organization.
none none
Login Activity This report shows all login activity in the organization. none none
Unable to Log Events to Security Log
This report details when windows is unable to log events to the security log.
none none
A-10 - Insufficient Logging AND Monitoring, continued
Cloud This category covers the cloud content.
CSA This is a sub-category of Cloud category. This category covers the cloud security alliance content.
Treacherous 12
This is a sub- category of CSA. This category covers cloud security alliance > treacherous 12 top threats. Each of the sub-categories addresses one of the treacherous 12 threats.
The following categories are located under the treacherous 12 category:
Abuse and Nefarious Use of Cloud Services
This is a sub-category of the Treacherous 12 category, focusing on abuse and nefarious use of Cloud services.
The Abuse and Nefarious Use of Cloud Services category is located under the following path.
Treacherous 12\Abuse and Nefarious Use of Cloud Services
Administrator's GuideAppendix H: Logger Content
Cloud Page 713 of 743
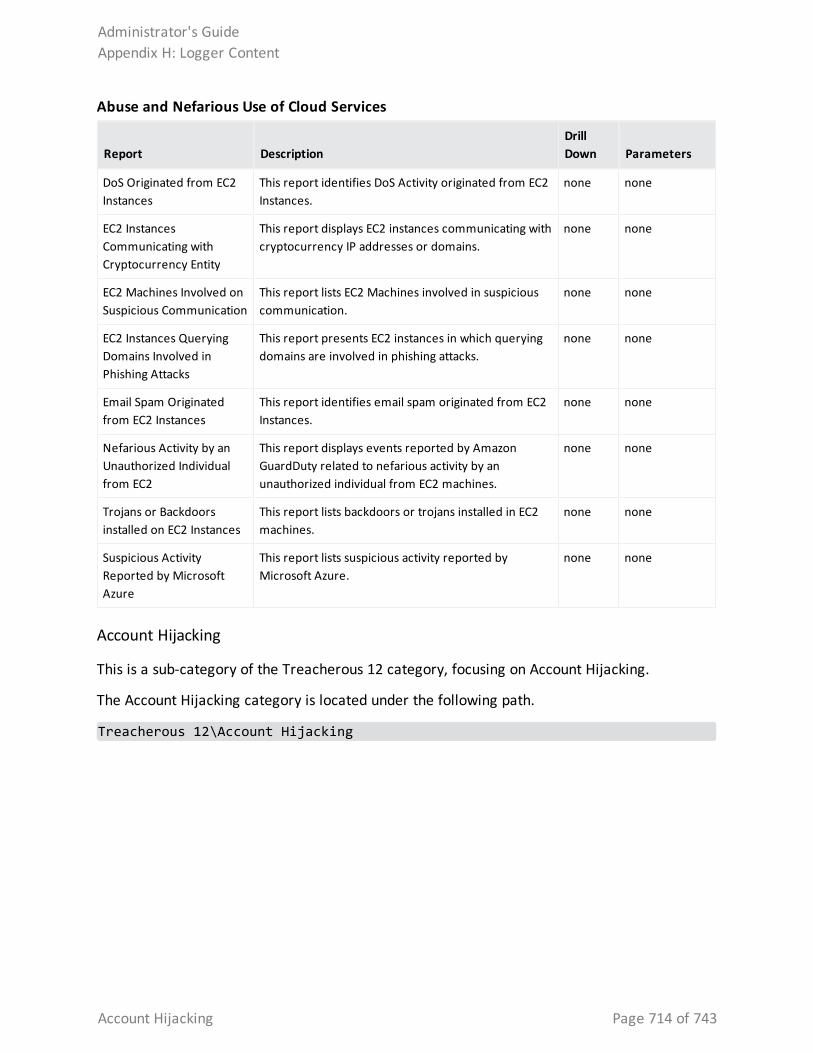
Report DescriptionDrill Down Parameters
DoS Originated from EC2 Instances
This report identifies DoS Activity originated from EC2 Instances.
none none
EC2 Instances Communicating with Cryptocurrency Entity
This report displays EC2 instances communicating with cryptocurrency IP addresses or domains.
none none
EC2 Machines Involved on Suspicious Communication
This report lists EC2 Machines involved in suspicious communication.
none none
EC2 Instances Querying Domains Involved in Phishing Attacks
This report presents EC2 instances in which querying domains are involved in phishing attacks.
none none
Email Spam Originated from EC2 Instances
This report identifies email spam originated from EC2 Instances.
none none
Nefarious Activity by an Unauthorized Individual from EC2
This report displays events reported by Amazon GuardDuty related to nefarious activity by an unauthorized individual from EC2 machines.
none none
Trojans or Backdoors installed on EC2 Instances
This report lists backdoors or trojans installed in EC2 machines.
none none
Suspicious Activity Reported by Microsoft Azure
This report lists suspicious activity reported by Microsoft Azure.
none none
Abuse and Nefarious Use of Cloud Services
Account Hijacking
This is a sub-category of the Treacherous 12 category, focusing on Account Hijacking.
The Account Hijacking category is located under the following path.
Treacherous 12\Account Hijacking
Administrator's GuideAppendix H: Logger Content
Account Hijacking Page 714 of 743
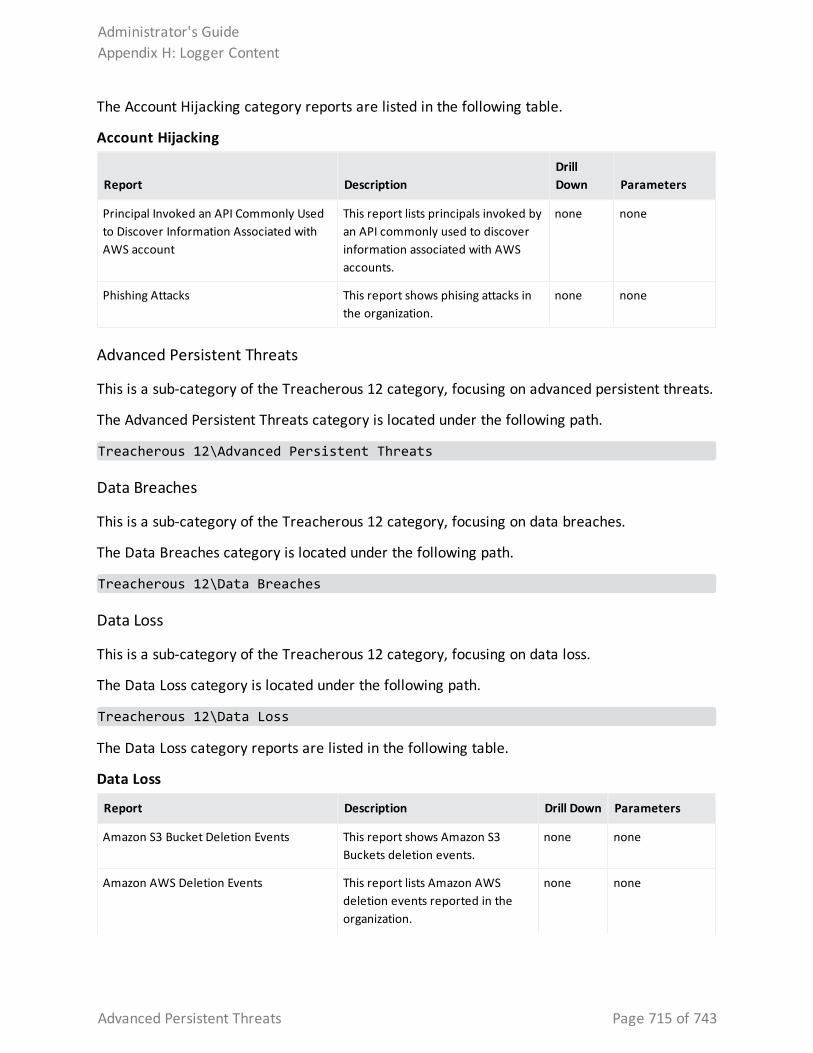
The Account Hijacking category reports are listed in the following table.
Report DescriptionDrill Down Parameters
Principal Invoked an API Commonly Used to Discover Information Associated with AWS account
This report lists principals invoked by an API commonly used to discover information associated with AWS accounts.
none none
Phishing Attacks This report shows phising attacks in the organization.
none none
Account Hijacking
Advanced Persistent Threats
This is a sub-category of the Treacherous 12 category, focusing on advanced persistent threats.
The Advanced Persistent Threats category is located under the following path.
Treacherous 12\Advanced Persistent Threats
Data Breaches
This is a sub-category of the Treacherous 12 category, focusing on data breaches.
The Data Breaches category is located under the following path.
Treacherous 12\Data Breaches
Data Loss
This is a sub-category of the Treacherous 12 category, focusing on data loss.
The Data Loss category is located under the following path.
Treacherous 12\Data Loss
The Data Loss category reports are listed in the following table.
Report Description Drill Down Parameters
Amazon S3 Bucket Deletion Events This report shows Amazon S3 Buckets deletion events.
none none
Amazon AWS Deletion Events This report lists Amazon AWS deletion events reported in the organization.
none none
Data Loss
Administrator's GuideAppendix H: Logger Content
Advanced Persistent Threats Page 715 of 743
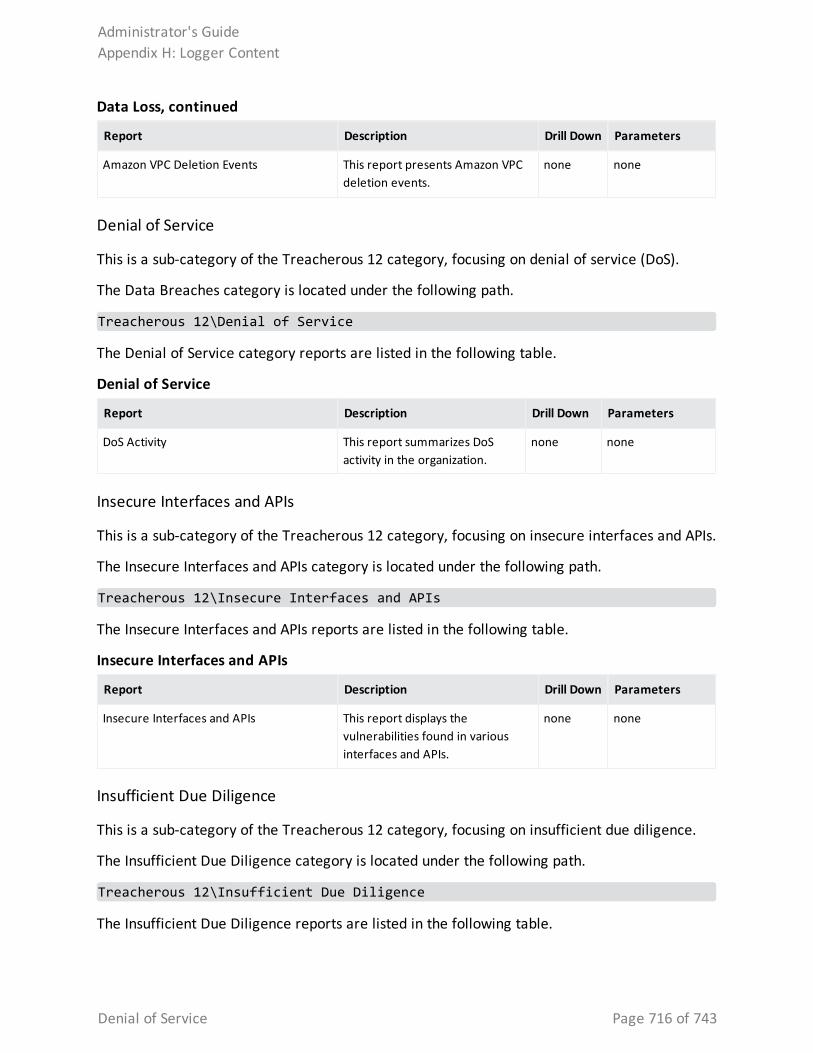
Report Description Drill Down Parameters
Amazon VPC Deletion Events This report presents Amazon VPC deletion events.
none none
Data Loss, continued
Denial of Service
This is a sub-category of the Treacherous 12 category, focusing on denial of service (DoS).
The Data Breaches category is located under the following path.
Treacherous 12\Denial of Service
The Denial of Service category reports are listed in the following table.
Report Description Drill Down Parameters
DoS Activity This report summarizes DoS activity in the organization.
none none
Denial of Service
Insecure Interfaces and APIs
This is a sub-category of the Treacherous 12 category, focusing on insecure interfaces and APIs.
The Insecure Interfaces and APIs category is located under the following path.
Treacherous 12\Insecure Interfaces and APIs
The Insecure Interfaces and APIs reports are listed in the following table.
Report Description Drill Down Parameters
Insecure Interfaces and APIs This report displays the vulnerabilities found in various interfaces and APIs.
none none
Insecure Interfaces and APIs
Insufficient Due Diligence
This is a sub-category of the Treacherous 12 category, focusing on insufficient due diligence.
The Insufficient Due Diligence category is located under the following path.
Treacherous 12\Insufficient Due Diligence
The Insufficient Due Diligence reports are listed in the following table.
Administrator's GuideAppendix H: Logger Content
Denial of Service Page 716 of 743
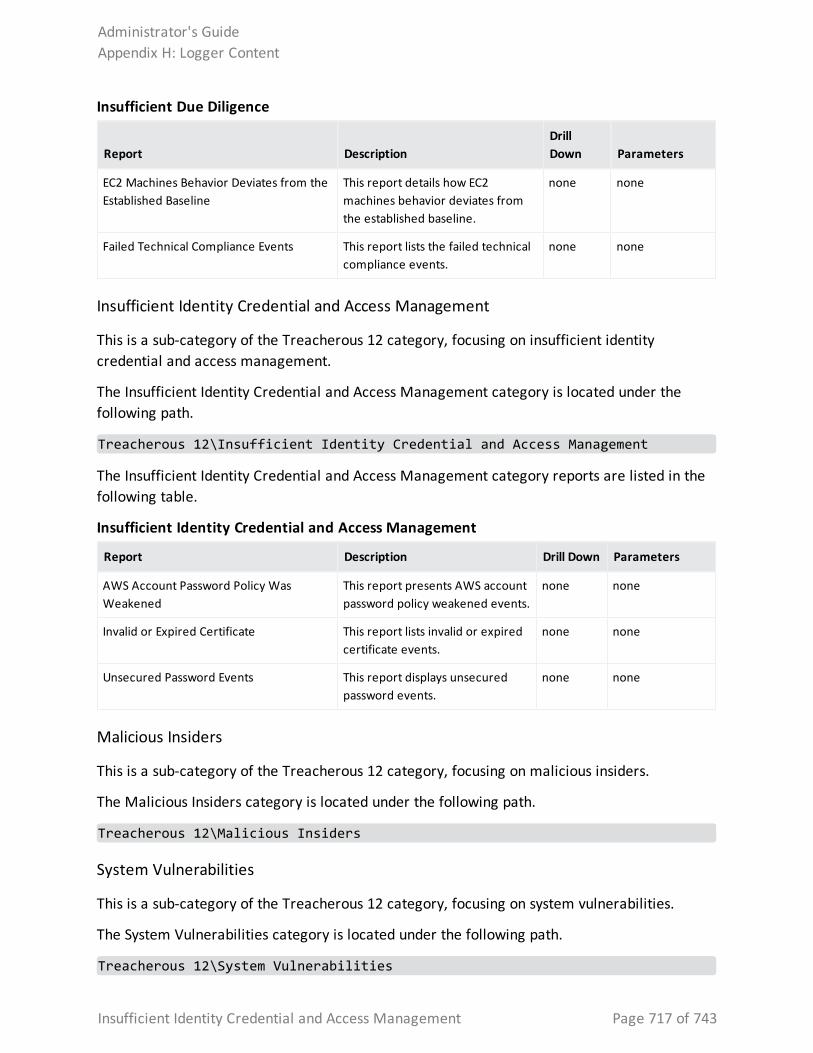
Report DescriptionDrill Down Parameters
EC2 Machines Behavior Deviates from the Established Baseline
This report details how EC2 machines behavior deviates from the established baseline.
none none
Failed Technical Compliance Events This report lists the failed technical compliance events.
none none
Insufficient Due Diligence
Insufficient Identity Credential and Access Management
This is a sub-category of the Treacherous 12 category, focusing on insufficient identity credential and access management.
The Insufficient Identity Credential and Access Management category is located under the following path.
Treacherous 12\Insufficient Identity Credential and Access Management
The Insufficient Identity Credential and Access Management category reports are listed in the following table.
Report Description Drill Down Parameters
AWS Account Password Policy Was Weakened
This report presents AWS account password policy weakened events.
none none
Invalid or Expired Certificate This report lists invalid or expired certificate events.
none none
Unsecured Password Events This report displays unsecured password events.
none none
Insufficient Identity Credential and Access Management
Malicious Insiders
This is a sub-category of the Treacherous 12 category, focusing on malicious insiders.
The Malicious Insiders category is located under the following path.
Treacherous 12\Malicious Insiders
System Vulnerabilities
This is a sub-category of the Treacherous 12 category, focusing on system vulnerabilities.
The System Vulnerabilities category is located under the following path.
Treacherous 12\System Vulnerabilities
Administrator's GuideAppendix H: Logger Content
Insufficient Identity Credential and Access Management Page 717 of 743
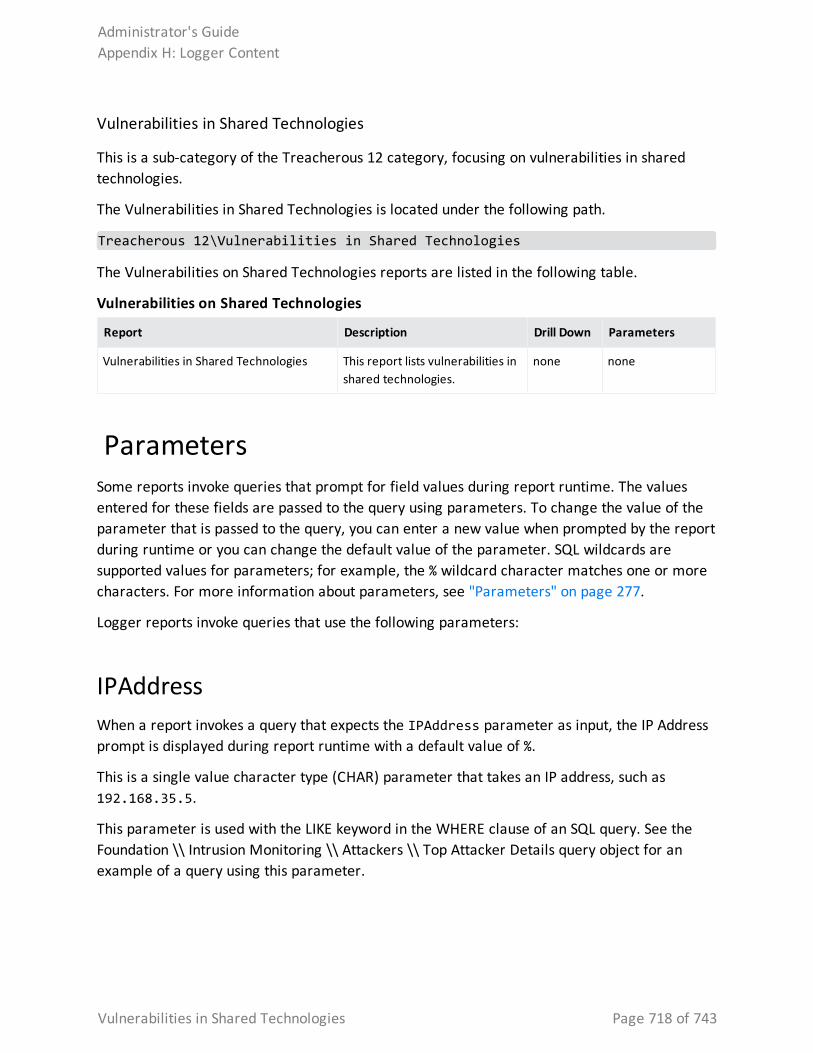
Vulnerabilities in Shared Technologies
This is a sub-category of the Treacherous 12 category, focusing on vulnerabilities in shared technologies.
The Vulnerabilities in Shared Technologies is located under the following path.
Treacherous 12\Vulnerabilities in Shared Technologies
The Vulnerabilities on Shared Technologies reports are listed in the following table.
Report Description Drill Down Parameters
Vulnerabilities in Shared Technologies This report lists vulnerabilities in shared technologies.
none none
Vulnerabilities on Shared Technologies
ParametersSome reports invoke queries that prompt for field values during report runtime. The values entered for these fields are passed to the query using parameters. To change the value of the parameter that is passed to the query, you can enter a new value when prompted by the report during runtime or you can change the default value of the parameter. SQL wildcards are supported values for parameters; for example, the % wildcard character matches one or more characters. For more information about parameters, see "Parameters" on page 277.
Logger reports invoke queries that use the following parameters:
IPAddressWhen a report invokes a query that expects the IPAddress parameter as input, the IP Address prompt is displayed during report runtime with a default value of %.
This is a single value character type (CHAR) parameter that takes an IP address, such as 192.168.35.5.
This parameter is used with the LIKE keyword in the WHERE clause of an SQL query. See the Foundation \\ Intrusion Monitoring \\ Attackers \\ Top Attacker Details query object for an example of a query using this parameter.
Administrator's GuideAppendix H: Logger Content
Vulnerabilities in Shared Technologies Page 718 of 743
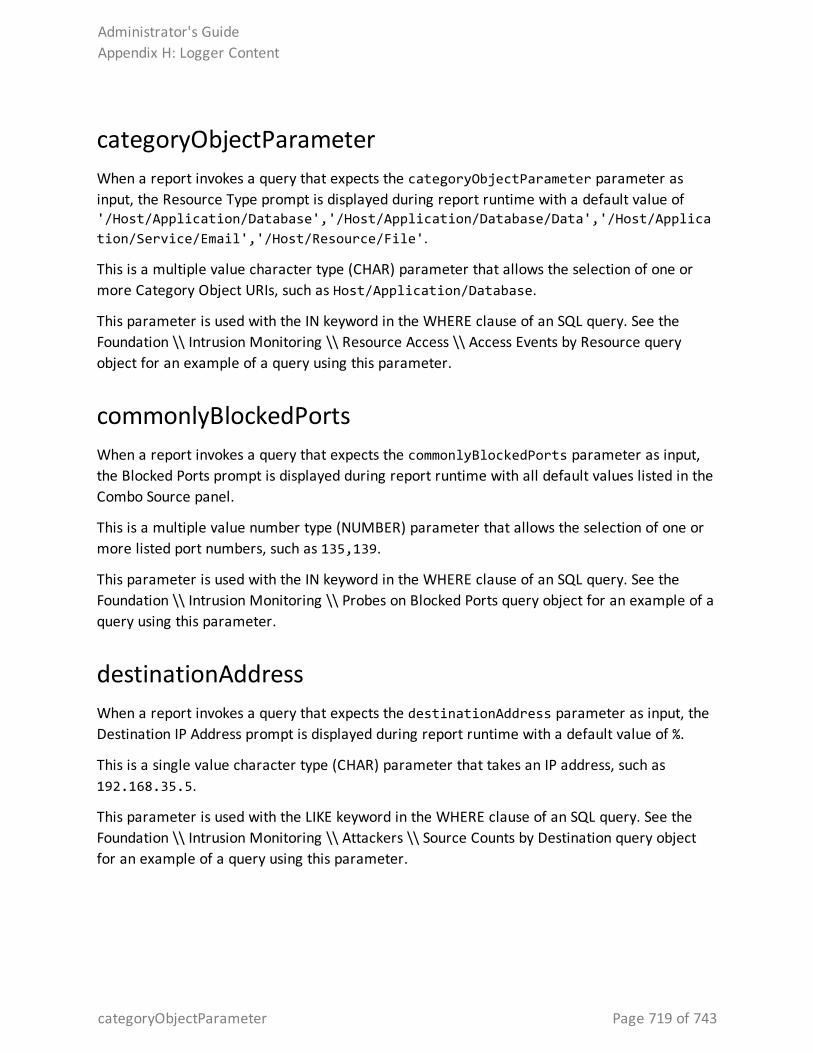
categoryObjectParameterWhen a report invokes a query that expects the categoryObjectParameter parameter as input, the Resource Type prompt is displayed during report runtime with a default value of '/Host/Application/Database','/Host/Application/Database/Data','/Host/Application/Service/Email','/Host/Resource/File'.
This is a multiple value character type (CHAR) parameter that allows the selection of one or more Category Object URIs, such as Host/Application/Database.
This parameter is used with the IN keyword in the WHERE clause of an SQL query. See the Foundation \\ Intrusion Monitoring \\ Resource Access \\ Access Events by Resource query object for an example of a query using this parameter.
commonlyBlockedPortsWhen a report invokes a query that expects the commonlyBlockedPorts parameter as input, the Blocked Ports prompt is displayed during report runtime with all default values listed in the Combo Source panel.
This is a multiple value number type (NUMBER) parameter that allows the selection of one or more listed port numbers, such as 135,139.
This parameter is used with the IN keyword in the WHERE clause of an SQL query. See the Foundation \\ Intrusion Monitoring \\ Probes on Blocked Ports query object for an example of a query using this parameter.
destinationAddressWhen a report invokes a query that expects the destinationAddress parameter as input, the Destination IP Address prompt is displayed during report runtime with a default value of %.
This is a single value character type (CHAR) parameter that takes an IP address, such as 192.168.35.5.
This parameter is used with the LIKE keyword in the WHERE clause of an SQL query. See the Foundation \\ Intrusion Monitoring \\ Attackers \\ Source Counts by Destination query object for an example of a query using this parameter.
Administrator's GuideAppendix H: Logger Content
categoryObjectParameter Page 719 of 743
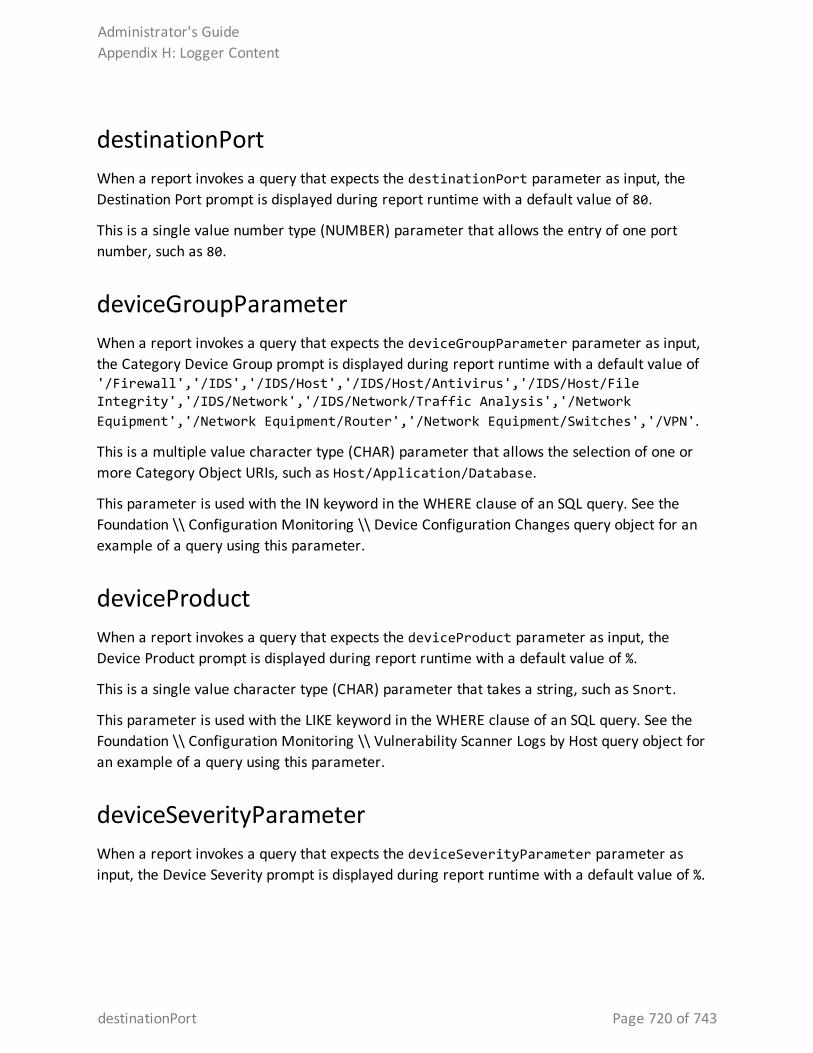
destinationPortWhen a report invokes a query that expects the destinationPort parameter as input, the Destination Port prompt is displayed during report runtime with a default value of 80.
This is a single value number type (NUMBER) parameter that allows the entry of one port number, such as 80.
deviceGroupParameterWhen a report invokes a query that expects the deviceGroupParameter parameter as input, the Category Device Group prompt is displayed during report runtime with a default value of '/Firewall','/IDS','/IDS/Host','/IDS/Host/Antivirus','/IDS/Host/File Integrity','/IDS/Network','/IDS/Network/Traffic Analysis','/Network Equipment','/Network Equipment/Router','/Network Equipment/Switches','/VPN'.
This is a multiple value character type (CHAR) parameter that allows the selection of one or more Category Object URIs, such as Host/Application/Database.
This parameter is used with the IN keyword in the WHERE clause of an SQL query. See the Foundation \\ Configuration Monitoring \\ Device Configuration Changes query object for an example of a query using this parameter.
deviceProductWhen a report invokes a query that expects the deviceProduct parameter as input, the Device Product prompt is displayed during report runtime with a default value of %.
This is a single value character type (CHAR) parameter that takes a string, such as Snort.
This parameter is used with the LIKE keyword in the WHERE clause of an SQL query. See the Foundation \\ Configuration Monitoring \\ Vulnerability Scanner Logs by Host query object for an example of a query using this parameter.
deviceSeverityParameterWhen a report invokes a query that expects the deviceSeverityParameter parameter as input, the Device Severity prompt is displayed during report runtime with a default value of %.
Administrator's GuideAppendix H: Logger Content
destinationPort Page 720 of 743
This is a single value character type (CHAR) parameter that takes a string, such as High.
This parameter is used with the LIKE keyword in the WHERE clause of an SQL query. See the Foundation \\ Intrusion Monitoring \\ Attackers \\ Source Counts by Device Severity query object for an example of a query using this parameter.
deviceVendorWhen a report invokes a query that expects the deviceVendor parameter as input, the Device Vendor prompt is displayed during report runtime with a default value of %.
This is a single value character type (CHAR) parameter that takes a string, such as Snort.
This parameter is used with the LIKE keyword in the WHERE clause of an SQL query. See the Foundation \\ Configuration Monitoring \\ Vulnerability Scanner Logs by Host query object for an example of a query using this parameter.
dmBandwidthParameterWhen a report invokes a query that expects the dmBandwidthParameter parameter as input, the Device Type prompt is displayed during report runtime with a default value of all.
This is a single value character type (CHAR) parameter that allows the selection of predefined value, such as Firewall.
This parameter is used with the LIKE keyword in the WHERE clause of an SQL query. See the Foundation \\ Configuration Monitoring \\ Vulnerability Scanner Logs by Host query object for an example of a query using this parameter.
dmConfigurationParameterWhen a report invokes a query that expects the dmConfigurationParameter parameter as input, the Device Type prompt is displayed during report runtime with a default value of all.
This is a single value character type (CHAR) parameter that allows the selection of predefined value, such as Firewall.
This parameter is used with the LIKE keyword in the WHERE clause of an SQL query.
dmLoginParameterWhen a report invokes a query that expects the dmLoginParameter parameter as input, the Device Type prompt is displayed during report runtime with a default value of all.
Administrator's GuideAppendix H: Logger Content
deviceVendor Page 721 of 743
This is a single value character type (CHAR) parameter that allows the selection of predefined value, such as Firewall.
This parameter is used with the LIKE keyword in the WHERE clause of an SQL query. See the Device Monitoring \\ CrossDevice \\ Failed Login Attempts query object for an example of a query using this parameter.
eventNameParameterWhen a report invokes a query that expects the eventNameParameter parameter as input, the Event Name prompt is displayed during report runtime with a default value of %.
This is a single value character type (CHAR) parameter that takes a string, such as Connector Raw Event Statistics.
This parameter is used with the LIKE keyword in the WHERE clause of an SQL query. See the Foundation \\ Intrusion Monitoring \\ Targets \\ Destination Counts by Event Name query object for an example of a query using this parameter.
resourceTypeParameterWhen a report invokes a query that expects the resourceTypeParameter parameter as input, the Resource Type prompt is displayed during report runtime with a default value of /Host/Application/Database.
This is a single value character type (CHAR) parameter that takes a string, such as /Host/Application/Database.
This parameter is used with the LIKE keyword in the WHERE clause of an SQL query.
webPortsWhen a report invokes a query that expects the webPorts parameter as input, the Web Ports prompt is displayed during report runtime with all default values listed in the Combo Source panel.
This is a multiple value number type (NUMBER) parameter that allows the selection of one or more listed port numbers, such as 80,443.
This parameter is used with the IN keyword in the WHERE clause of an SQL query. See the Foundation \\ Intrusion Monitoring \\ Top Web Traffic query object for an example of a query using this parameter.
Administrator's GuideAppendix H: Logger Content
eventNameParameter Page 722 of 743
zoneParameterWhen a report invokes a query that expects the zoneParameter parameter as input, the Zone prompt is displayed during report runtime with a default value of %.
This is a single value character type (CHAR) parameter that takes an IP address, such as /All Zones/ArcSight System/Private Address Space Zones/RFC1918: 10.0.0.0-10.255.255.255.
This parameter is used with the LIKE keyword in the WHERE clause of an SQL query. See the Foundation \\ Intrusion Monitoring \\ Attackers \\ Top Attacker Details query object for an example of a query using this parameter.
zonesWhen a report invokes a query that expects the zones parameter as input, the Zone prompt is displayed during report runtime with a default value of %.
This is a multiple value character type (CHAR) parameter that allows the selection of one or more Category Object URIs, such as /All Zones/ArcSight System/Private Address Space Zones/RFC1918: 10.0.0.0-10.255.255.255,/All Zones/ArcSight System/Private Address Space Zones/RFC1918: 192.168.0.0-192.168.255.255.
This parameter is used with the IN keyword in the WHERE clause of an SQL query. See the Foundation \\ Intrusion Monitoring \\ Attackers \\ Source Counts by Destination query object for an example of a query using this parameter.
userName ParameterWhen a report invokes a query that expects the userNameParmeter parameter as input, the userNameParamter prompt is displayed during report runtime and the user name should be provided in order to run the report.
This parameter is used with the = keyword in the WHERE clause of an SQL query. See the Foundation \\ MITRE Monitoring \\ MITRE Attacks Events - Drill Down by Destination User and Foundation \\ MITRE Monitoring \\ MITRE Attacks Events - Drill Down by Source User query objects for an example of a queries using this parameter.
Administrator's GuideAppendix H: Logger Content
zoneParameter Page 723 of 743
hostName Parameter When a report invokes a query that expects the hostNameParmeter parameter as input, the hostNameParamter prompt is displayed during report runtime and the host name should be provided in order to run the report.
This parameter is used with the = keyword in the WHERE clause of an SQL query. See the Device Monitoring \\ Anti-Virus \\ Virus Activity by Host Name query object for an example of a query using this parameter.
.
System FiltersLogger provides the system filters listed in the following table.
Filter Type Description
Configuration - Configuration Changes (Unified)
Unified Query
This filter looks for events categorized as configuration changes events.
Configuration - System Configuration Changes (CEF format)
Regular Expression
This filter looks for events categorized as configuration changes events. It is a Regular Expression filter and can be used to create alerts.
Events - CEF Regular Expression
This filter looks for all CEF formatted events. It is a Regular Expression filter and can be used to create alerts.
Events - Event Counts by Destination
Unified Query
This filter looks for all CEF events that have a destination address and shows a chart.
Events - Event Counts by Source
Unified Query
This filter looks for all CEF events that have a source address and shows a chart.
Events - High and Very High Severity CEF Events
Regular Expression
This filter looks for CEF events with a high or very high severity. It is a Regular Expression filter and can be used to create alerts.
Events - High and Very High Severity Events (Unified)
Unified Query
This filter looks for CEF events with a high or very high severity.
Firewall - Deny Unified Query
This filter looks for events with deny or shun.
Firewall - Drop Unified Query
This filter looks for drop events that are not database related.
Filters
Administrator's GuideAppendix H: Logger Content
hostName Parameter Page 724 of 743
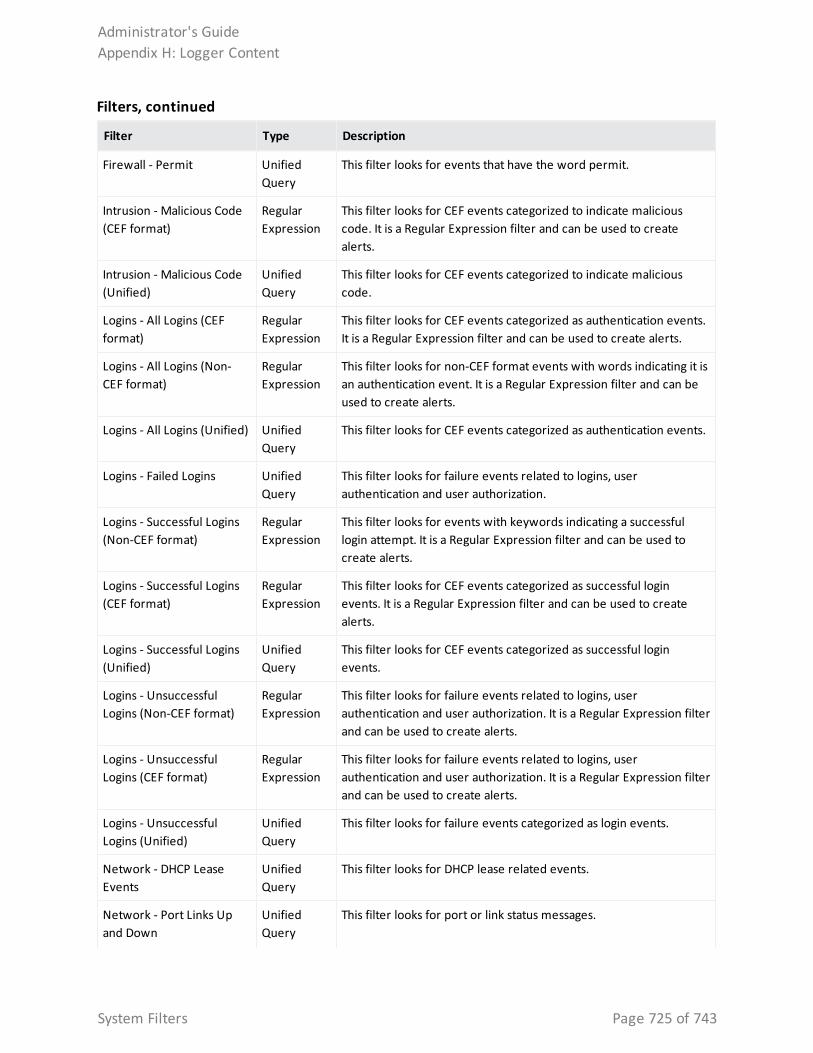
Filter Type Description
Firewall - Permit Unified Query
This filter looks for events that have the word permit.
Intrusion - Malicious Code (CEF format)
Regular Expression
This filter looks for CEF events categorized to indicate malicious code. It is a Regular Expression filter and can be used to create alerts.
Intrusion - Malicious Code (Unified)
Unified Query
This filter looks for CEF events categorized to indicate malicious code.
Logins - All Logins (CEF format)
Regular Expression
This filter looks for CEF events categorized as authentication events. It is a Regular Expression filter and can be used to create alerts.
Logins - All Logins (Non-CEF format)
Regular Expression
This filter looks for non-CEF format events with words indicating it is an authentication event. It is a Regular Expression filter and can be used to create alerts.
Logins - All Logins (Unified) Unified Query
This filter looks for CEF events categorized as authentication events.
Logins - Failed Logins Unified Query
This filter looks for failure events related to logins, user authentication and user authorization.
Logins - Successful Logins (Non-CEF format)
Regular Expression
This filter looks for events with keywords indicating a successful login attempt. It is a Regular Expression filter and can be used to create alerts.
Logins - Successful Logins (CEF format)
Regular Expression
This filter looks for CEF events categorized as successful login events. It is a Regular Expression filter and can be used to create alerts.
Logins - Successful Logins (Unified)
Unified Query
This filter looks for CEF events categorized as successful login events.
Logins - Unsuccessful Logins (Non-CEF format)
Regular Expression
This filter looks for failure events related to logins, user authentication and user authorization. It is a Regular Expression filter and can be used to create alerts.
Logins - Unsuccessful Logins (CEF format)
Regular Expression
This filter looks for failure events related to logins, user authentication and user authorization. It is a Regular Expression filter and can be used to create alerts.
Logins - Unsuccessful Logins (Unified)
Unified Query
This filter looks for failure events categorized as login events.
Network - DHCP Lease Events
Unified Query
This filter looks for DHCP lease related events.
Network - Port Links Up and Down
Unified Query
This filter looks for port or link status messages.
Filters, continued
Administrator's GuideAppendix H: Logger Content
System Filters Page 725 of 743
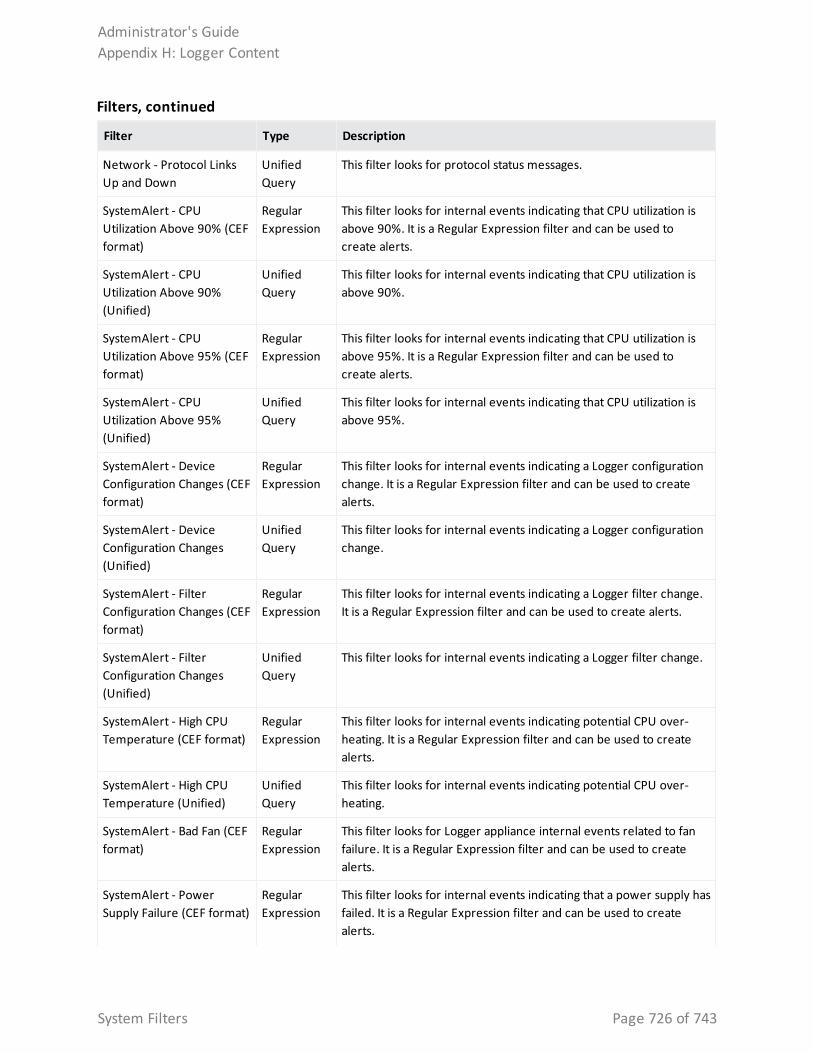
Filter Type Description
Network - Protocol Links Up and Down
Unified Query
This filter looks for protocol status messages.
SystemAlert - CPU Utilization Above 90% (CEF format)
Regular Expression
This filter looks for internal events indicating that CPU utilization is above 90%. It is a Regular Expression filter and can be used to create alerts.
SystemAlert - CPU Utilization Above 90% (Unified)
Unified Query
This filter looks for internal events indicating that CPU utilization is above 90%.
SystemAlert - CPU Utilization Above 95% (CEF format)
Regular Expression
This filter looks for internal events indicating that CPU utilization is above 95%. It is a Regular Expression filter and can be used to create alerts.
SystemAlert - CPU Utilization Above 95% (Unified)
Unified Query
This filter looks for internal events indicating that CPU utilization is above 95%.
SystemAlert - Device Configuration Changes (CEF format)
Regular Expression
This filter looks for internal events indicating a Logger configuration change. It is a Regular Expression filter and can be used to create alerts.
SystemAlert - Device Configuration Changes (Unified)
Unified Query
This filter looks for internal events indicating a Logger configuration change.
SystemAlert - Filter Configuration Changes (CEF format)
Regular Expression
This filter looks for internal events indicating a Logger filter change. It is a Regular Expression filter and can be used to create alerts.
SystemAlert - Filter Configuration Changes (Unified)
Unified Query
This filter looks for internal events indicating a Logger filter change.
SystemAlert - High CPU Temperature (CEF format)
Regular Expression
This filter looks for internal events indicating potential CPU over-heating. It is a Regular Expression filter and can be used to create alerts.
SystemAlert - High CPU Temperature (Unified)
Unified Query
This filter looks for internal events indicating potential CPU over-heating.
SystemAlert - Bad Fan (CEF format)
Regular Expression
This filter looks for Logger appliance internal events related to fan failure. It is a Regular Expression filter and can be used to create alerts.
SystemAlert - Power Supply Failure (CEF format)
Regular Expression
This filter looks for internal events indicating that a power supply has failed. It is a Regular Expression filter and can be used to create alerts.
Filters, continued
Administrator's GuideAppendix H: Logger Content
System Filters Page 726 of 743
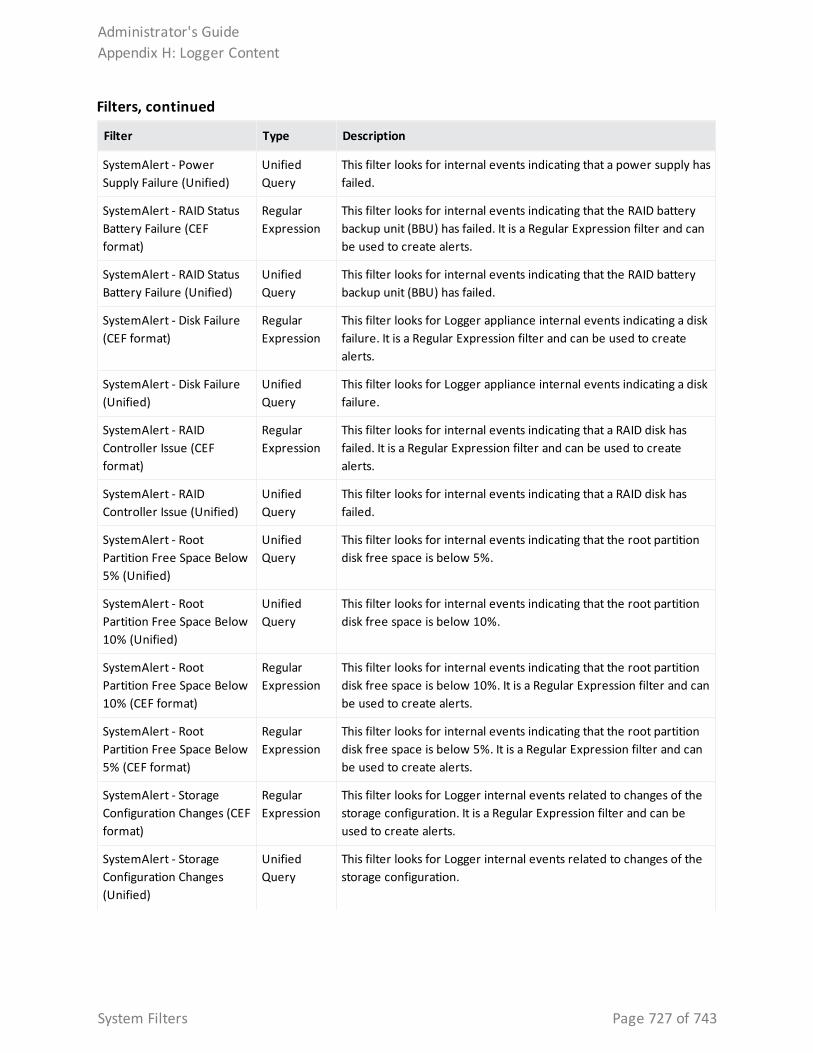
Filter Type Description
SystemAlert - Power Supply Failure (Unified)
Unified Query
This filter looks for internal events indicating that a power supply has failed.
SystemAlert - RAID Status Battery Failure (CEF format)
Regular Expression
This filter looks for internal events indicating that the RAID battery backup unit (BBU) has failed. It is a Regular Expression filter and can be used to create alerts.
SystemAlert - RAID Status Battery Failure (Unified)
Unified Query
This filter looks for internal events indicating that the RAID battery backup unit (BBU) has failed.
SystemAlert - Disk Failure (CEF format)
Regular Expression
This filter looks for Logger appliance internal events indicating a disk failure. It is a Regular Expression filter and can be used to create alerts.
SystemAlert - Disk Failure (Unified)
Unified Query
This filter looks for Logger appliance internal events indicating a disk failure.
SystemAlert - RAID Controller Issue (CEF format)
Regular Expression
This filter looks for internal events indicating that a RAID disk has failed. It is a Regular Expression filter and can be used to create alerts.
SystemAlert - RAID Controller Issue (Unified)
Unified Query
This filter looks for internal events indicating that a RAID disk has failed.
SystemAlert - Root Partition Free Space Below 5% (Unified)
Unified Query
This filter looks for internal events indicating that the root partition disk free space is below 5%.
SystemAlert - Root Partition Free Space Below 10% (Unified)
Unified Query
This filter looks for internal events indicating that the root partition disk free space is below 10%.
SystemAlert - Root Partition Free Space Below 10% (CEF format)
Regular Expression
This filter looks for internal events indicating that the root partition disk free space is below 10%. It is a Regular Expression filter and can be used to create alerts.
SystemAlert - Root Partition Free Space Below 5% (CEF format)
Regular Expression
This filter looks for internal events indicating that the root partition disk free space is below 5%. It is a Regular Expression filter and can be used to create alerts.
SystemAlert - Storage Configuration Changes (CEF format)
Regular Expression
This filter looks for Logger internal events related to changes of the storage configuration. It is a Regular Expression filter and can be used to create alerts.
SystemAlert - Storage Configuration Changes (Unified)
Unified Query
This filter looks for Logger internal events related to changes of the storage configuration.
Filters, continued
Administrator's GuideAppendix H: Logger Content
System Filters Page 727 of 743
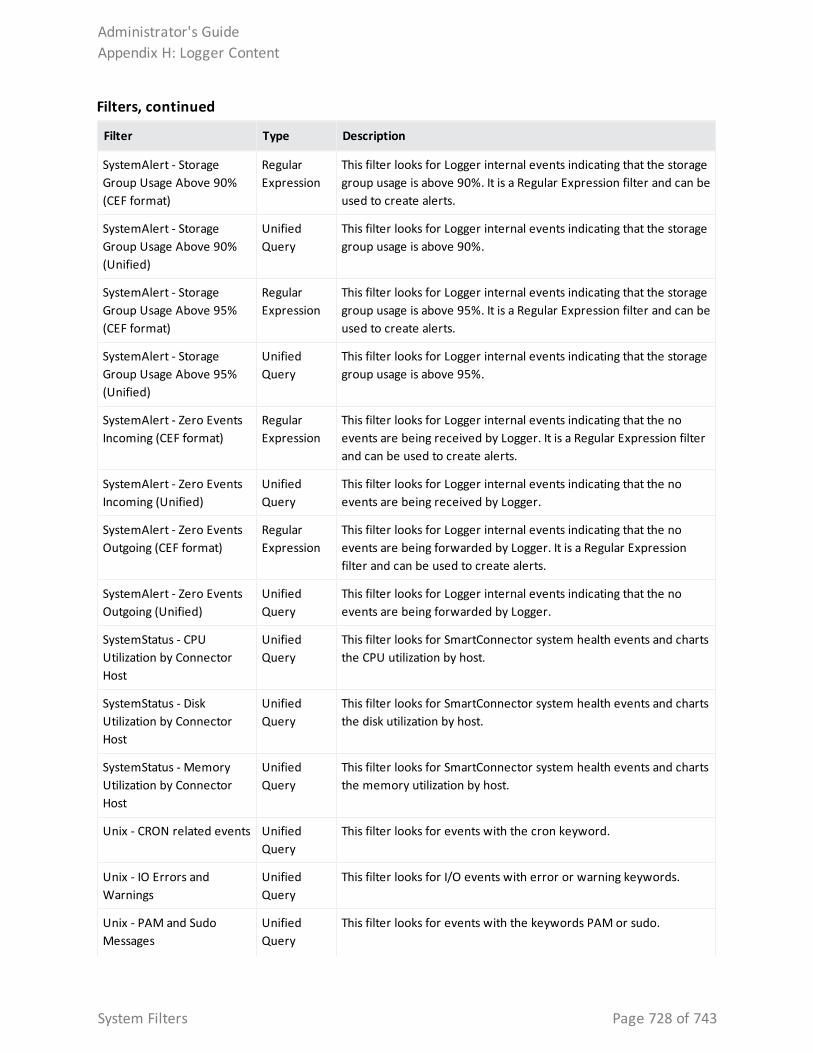
Filter Type Description
SystemAlert - Storage Group Usage Above 90% (CEF format)
Regular Expression
This filter looks for Logger internal events indicating that the storage group usage is above 90%. It is a Regular Expression filter and can be used to create alerts.
SystemAlert - Storage Group Usage Above 90% (Unified)
Unified Query
This filter looks for Logger internal events indicating that the storage group usage is above 90%.
SystemAlert - Storage Group Usage Above 95% (CEF format)
Regular Expression
This filter looks for Logger internal events indicating that the storage group usage is above 95%. It is a Regular Expression filter and can be used to create alerts.
SystemAlert - Storage Group Usage Above 95% (Unified)
Unified Query
This filter looks for Logger internal events indicating that the storage group usage is above 95%.
SystemAlert - Zero Events Incoming (CEF format)
Regular Expression
This filter looks for Logger internal events indicating that the no events are being received by Logger. It is a Regular Expression filter and can be used to create alerts.
SystemAlert - Zero Events Incoming (Unified)
Unified Query
This filter looks for Logger internal events indicating that the no events are being received by Logger.
SystemAlert - Zero Events Outgoing (CEF format)
Regular Expression
This filter looks for Logger internal events indicating that the no events are being forwarded by Logger. It is a Regular Expression filter and can be used to create alerts.
SystemAlert - Zero Events Outgoing (Unified)
Unified Query
This filter looks for Logger internal events indicating that the no events are being forwarded by Logger.
SystemStatus - CPU Utilization by Connector Host
Unified Query
This filter looks for SmartConnector system health events and charts the CPU utilization by host.
SystemStatus - Disk Utilization by Connector Host
Unified Query
This filter looks for SmartConnector system health events and charts the disk utilization by host.
SystemStatus - Memory Utilization by Connector Host
Unified Query
This filter looks for SmartConnector system health events and charts the memory utilization by host.
Unix - CRON related events Unified Query
This filter looks for events with the cron keyword.
Unix - IO Errors and Warnings
Unified Query
This filter looks for I/O events with error or warning keywords.
Unix - PAM and Sudo Messages
Unified Query
This filter looks for events with the keywords PAM or sudo.
Filters, continued
Administrator's GuideAppendix H: Logger Content
System Filters Page 728 of 743
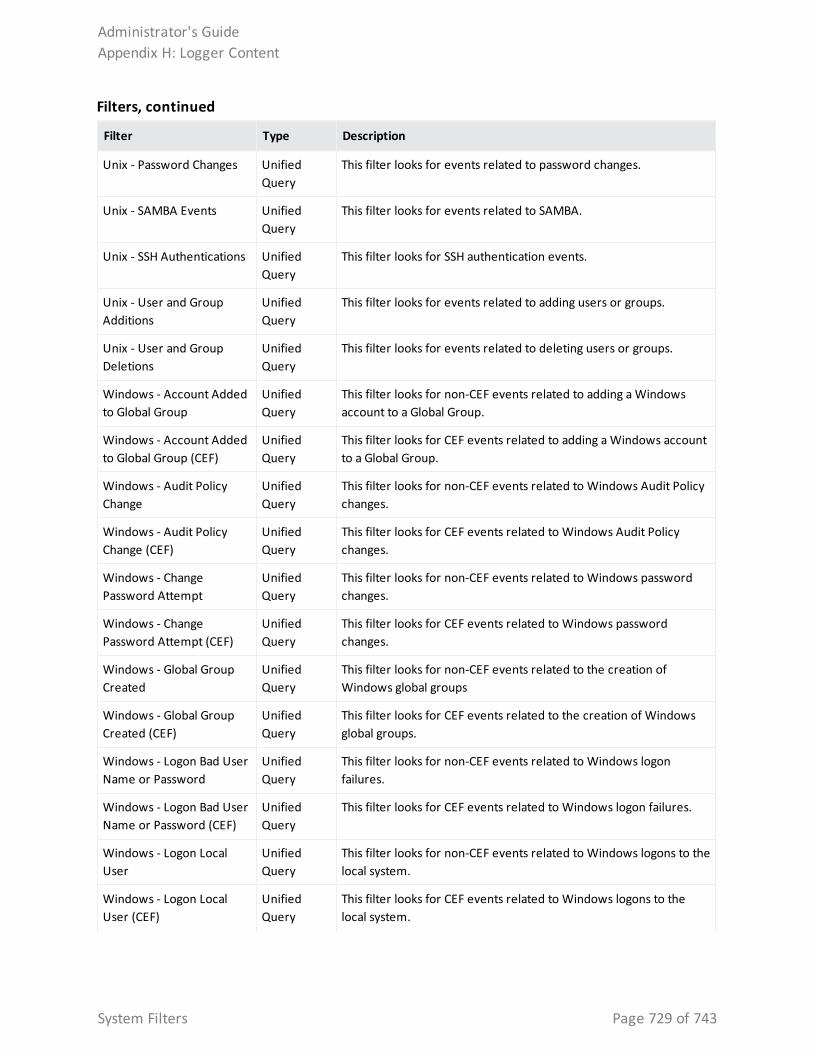
Filter Type Description
Unix - Password Changes Unified Query
This filter looks for events related to password changes.
Unix - SAMBA Events Unified Query
This filter looks for events related to SAMBA.
Unix - SSH Authentications Unified Query
This filter looks for SSH authentication events.
Unix - User and Group Additions
Unified Query
This filter looks for events related to adding users or groups.
Unix - User and Group Deletions
Unified Query
This filter looks for events related to deleting users or groups.
Windows - Account Added to Global Group
Unified Query
This filter looks for non-CEF events related to adding a Windows account to a Global Group.
Windows - Account Added to Global Group (CEF)
Unified Query
This filter looks for CEF events related to adding a Windows account to a Global Group.
Windows - Audit Policy Change
Unified Query
This filter looks for non-CEF events related to Windows Audit Policy changes.
Windows - Audit Policy Change (CEF)
Unified Query
This filter looks for CEF events related to Windows Audit Policy changes.
Windows - Change Password Attempt
Unified Query
This filter looks for non-CEF events related to Windows password changes.
Windows - Change Password Attempt (CEF)
Unified Query
This filter looks for CEF events related to Windows password changes.
Windows - Global Group Created
Unified Query
This filter looks for non-CEF events related to the creation of Windows global groups
Windows - Global Group Created (CEF)
Unified Query
This filter looks for CEF events related to the creation of Windows global groups.
Windows - Logon Bad User Name or Password
Unified Query
This filter looks for non-CEF events related to Windows logon failures.
Windows - Logon Bad User Name or Password (CEF)
Unified Query
This filter looks for CEF events related to Windows logon failures.
Windows - Logon Local User
Unified Query
This filter looks for non-CEF events related to Windows logons to the local system.
Windows - Logon Local User (CEF)
Unified Query
This filter looks for CEF events related to Windows logons to the local system.
Filters, continued
Administrator's GuideAppendix H: Logger Content
System Filters Page 729 of 743
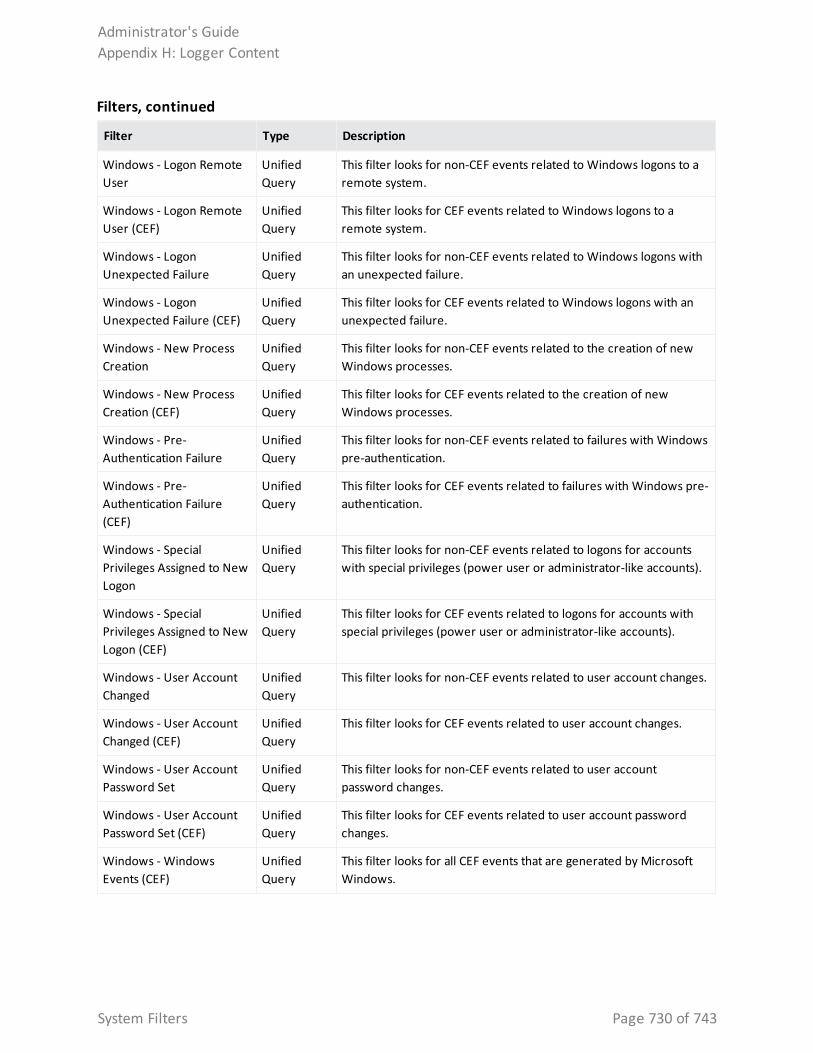
Filter Type Description
Windows - Logon Remote User
Unified Query
This filter looks for non-CEF events related to Windows logons to a remote system.
Windows - Logon Remote User (CEF)
Unified Query
This filter looks for CEF events related to Windows logons to a remote system.
Windows - Logon Unexpected Failure
Unified Query
This filter looks for non-CEF events related to Windows logons with an unexpected failure.
Windows - Logon Unexpected Failure (CEF)
Unified Query
This filter looks for CEF events related to Windows logons with an unexpected failure.
Windows - New Process Creation
Unified Query
This filter looks for non-CEF events related to the creation of new Windows processes.
Windows - New Process Creation (CEF)
Unified Query
This filter looks for CEF events related to the creation of new Windows processes.
Windows - Pre-Authentication Failure
Unified Query
This filter looks for non-CEF events related to failures with Windows pre-authentication.
Windows - Pre-Authentication Failure (CEF)
Unified Query
This filter looks for CEF events related to failures with Windows pre-authentication.
Windows - Special Privileges Assigned to New Logon
Unified Query
This filter looks for non-CEF events related to logons for accounts with special privileges (power user or administrator-like accounts).
Windows - Special Privileges Assigned to New Logon (CEF)
Unified Query
This filter looks for CEF events related to logons for accounts with special privileges (power user or administrator-like accounts).
Windows - User Account Changed
Unified Query
This filter looks for non-CEF events related to user account changes.
Windows - User Account Changed (CEF)
Unified Query
This filter looks for CEF events related to user account changes.
Windows - User Account Password Set
Unified Query
This filter looks for non-CEF events related to user account password changes.
Windows - User Account Password Set (CEF)
Unified Query
This filter looks for CEF events related to user account password changes.
Windows - Windows Events (CEF)
Unified Query
This filter looks for all CEF events that are generated by Microsoft Windows.
Filters, continued
Administrator's GuideAppendix H: Logger Content
System Filters Page 730 of 743
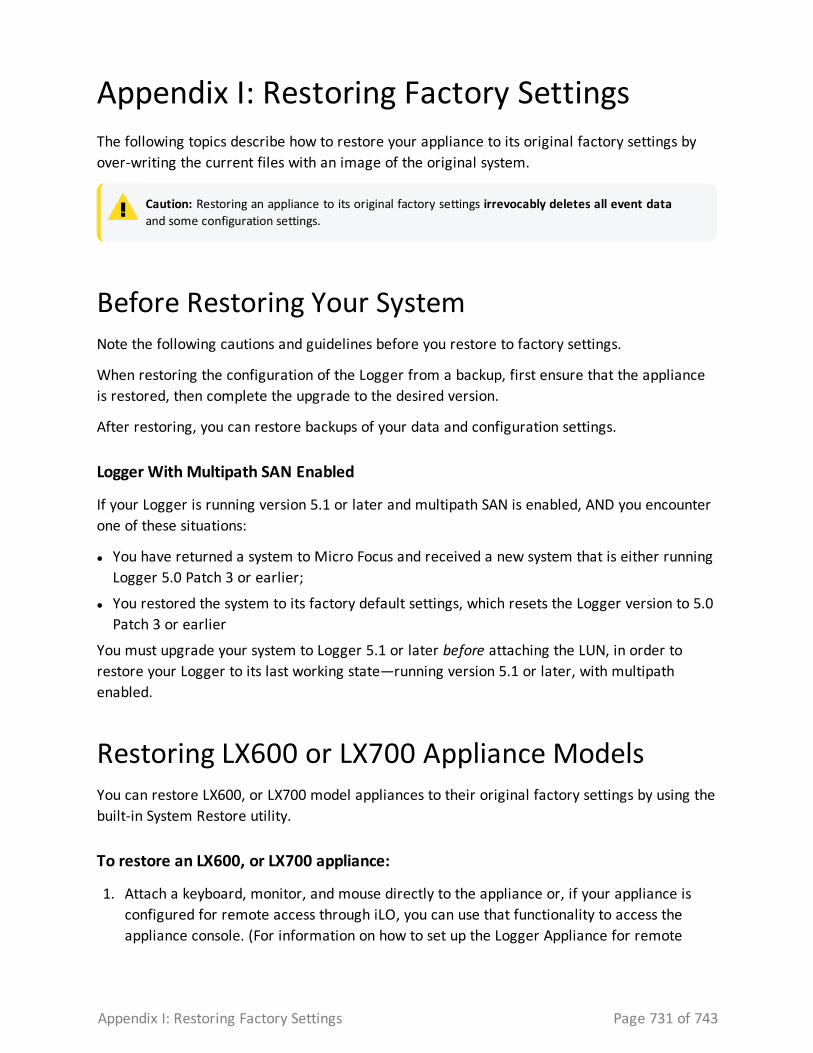
Appendix I: Restoring Factory SettingsThe following topics describe how to restore your appliance to its original factory settings by over-writing the current files with an image of the original system.
Caution: Restoring an appliance to its original factory settings irrevocably deletes all event data and some configuration settings.
Before Restoring Your SystemNote the following cautions and guidelines before you restore to factory settings.
When restoring the configuration of the Logger from a backup, first ensure that the appliance is restored, then complete the upgrade to the desired version.
After restoring, you can restore backups of your data and configuration settings.
Logger With Multipath SAN Enabled
If your Logger is running version 5.1 or later and multipath SAN is enabled, AND you encounter one of these situations:
l You have returned a system to Micro Focus and received a new system that is either running Logger 5.0 Patch 3 or earlier;
l You restored the system to its factory default settings, which resets the Logger version to 5.0 Patch 3 or earlier
You must upgrade your system to Logger 5.1 or later before attaching the LUN, in order to restore your Logger to its last working state—running version 5.1 or later, with multipath enabled.
Restoring LX600 or LX700 Appliance ModelsYou can restore LX600, or LX700 model appliances to their original factory settings by using the built-in System Restore utility.
To restore an LX600, or LX700 appliance:
1. Attach a keyboard, monitor, and mouse directly to the appliance or, if your appliance is configured for remote access through iLO, you can use that functionality to access the appliance console. (For information on how to set up the Logger Appliance for remote
Appendix I: Restoring Factory Settings Page 731 of 743
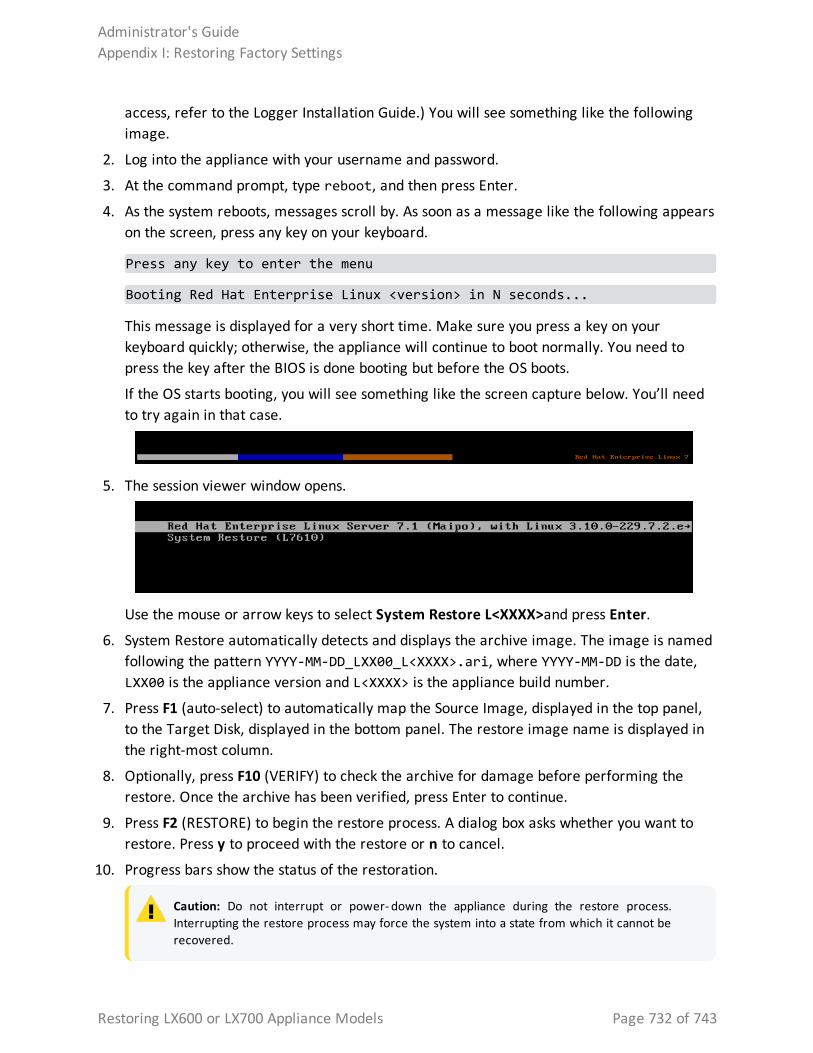
access, refer to the Logger Installation Guide.) You will see something like the following image.
2. Log into the appliance with your username and password.
3. At the command prompt, type reboot, and then press Enter.
4. As the system reboots, messages scroll by. As soon as a message like the following appears on the screen, press any key on your keyboard.
Press any key to enter the menu
Booting Red Hat Enterprise Linux <version> in N seconds...
This message is displayed for a very short time. Make sure you press a key on your keyboard quickly; otherwise, the appliance will continue to boot normally. You need to press the key after the BIOS is done booting but before the OS boots.
If the OS starts booting, you will see something like the screen capture below. You’ll need to try again in that case.
5. The session viewer window opens.
Use the mouse or arrow keys to select System Restore L<XXXX>and press Enter.
6. System Restore automatically detects and displays the archive image. The image is named following the pattern YYYY-MM-DD_LXX00_L<XXXX>.ari, where YYYY-MM-DD is the date, LXX00 is the appliance version and L<XXXX> is the appliance build number.
7. Press F1 (auto-select) to automatically map the Source Image, displayed in the top panel, to the Target Disk, displayed in the bottom panel. The restore image name is displayed in the right-most column.
8. Optionally, press F10 (VERIFY) to check the archive for damage before performing the restore. Once the archive has been verified, press Enter to continue.
9. Press F2 (RESTORE) to begin the restore process. A dialog box asks whether you want to restore. Press y to proceed with the restore or n to cancel.
10. Progress bars show the status of the restoration.
Caution: Do not interrupt or power- down the appliance during the restore process. Interrupting the restore process may force the system into a state from which it cannot be recovered.
Administrator's GuideAppendix I: Restoring Factory Settings
Restoring LX600 or LX700 Appliance Models Page 732 of 743
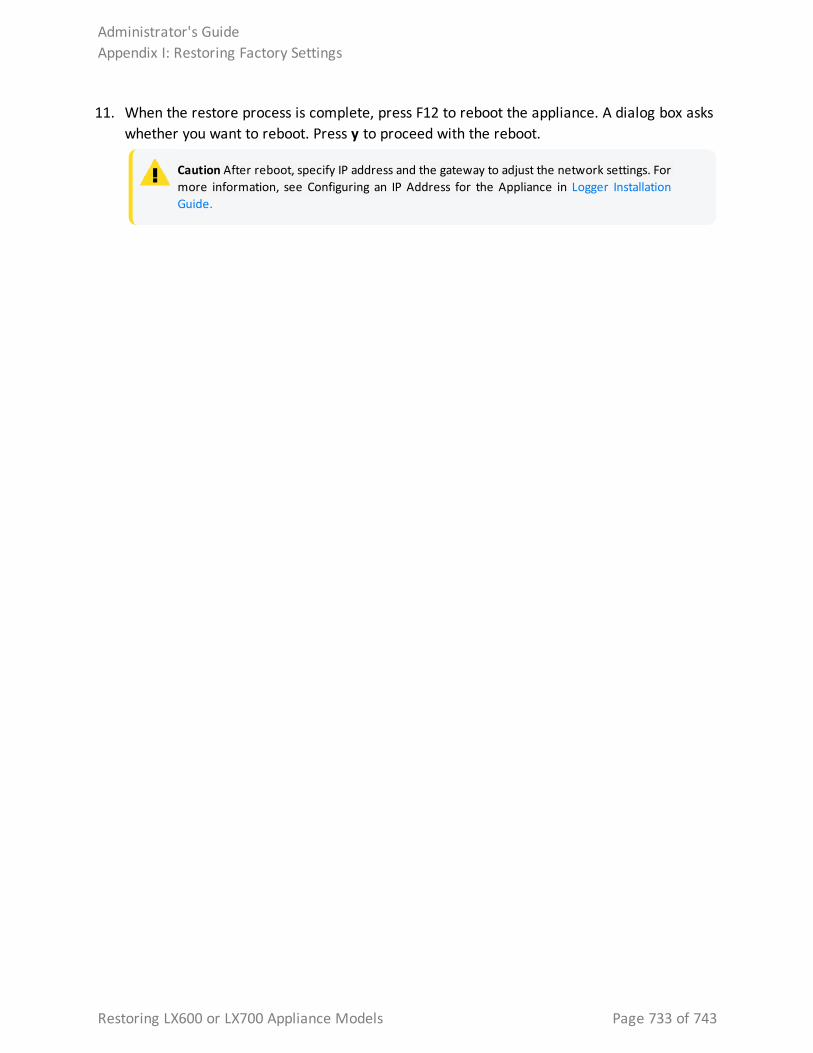
11. When the restore process is complete, press F12 to reboot the appliance. A dialog box asks whether you want to reboot. Press y to proceed with the reboot.
Caution After reboot, specify IP address and the gateway to adjust the network settings. For more information, see Configuring an IP Address for the Appliance in Logger Installation Guide.
Administrator's GuideAppendix I: Restoring Factory Settings
Restoring LX600 or LX700 Appliance Models Page 733 of 743
Appendix J: Logger Search From ArcSight ESMIf you have ArcSight Logger and ArcSight ESM deployed in your network infrastructure, you can perform Logger search operations from ArcSight Command Center or the ArcSight Console.
If you are running ESM 6.5c or later, you can use the search functionality provided by the ArcSight Command Center. For information on this feature, refer to the ArcSight Command Center User’s Guide. For ESM 6.0c and earlier versions, you can perform a Logger search from your ArcSight Console.
The following topics discuss how use the integrated search functionality from the ArcSight Console.
Understanding the Integrated Search Functionality
Tip: If you are using ESM 6.5c and above, you can search from ArcSight Command Center in addition to the ArcSight Console described here. Refer to the ArcSight Command Center User's Guide for details.
There are several ways to perform a search operation on Logger from an ArcSight Console:
l Search: a regular search operation in which you can specify search options.
l Quick search: a search operation based on field and value you select in an ArcSight Console active channel; you are not prompted for any search options.
To run a Logger search, right click on an event in an active channel of the ArcSight Console to display a menu to select a search method—Logger Search or Logger Quick Search.
If you select Logger Search, you need to select search options such as Event Name, Destination, Source, and so on, and the Logger Appliances on which the search should be run (if there are multiple Logger Appliances). If you select Logger Quick Search, you are not prompted to specify any search options because the search is run on the field you had clicked on.
The search results are displayed in the ArcSight Console, as shown in the following figure:
Before you can run a search operation on Logger from ArcSight Console, you need to set up parameters in the ArcSight Console that are used to authenticate the user who performs the search. Authentication can be done via Basic Authentication (user name and password) or a One Time Password (OTP). This option makes the user authentication between Logger and ArcSight Console highly secure.
Appendix J: Logger Search From ArcSight ESM Page 734 of 743
By default, a Logger search from the ArcSight Console uses the OTP method to authenticate. However, if Logger or ArcSight Console is not running a release that supports the OTP option, an error message is displayed and basic authentication is used.
Setup and ConfigurationThe following table lists the minimum and recommended versions that Logger and ArcSight Console must be running.
Option Requirement
Recommended Logger 6.6x and later.
ESM 6.8 and later.
Tip: To verify the latest supported ESM release, refer to the ArcSight Product Documentation on the Micro Focus Security Community.
Minimum Logger 6.6x.
ESM 5.0 SP1 Patch 2
Configuring on ESM Follow these instructions to set up and configure ArcSight Manager to run integrated search operations:
1. Ensure that the ArcSight Manager is running one of the recommended versions.
2. Follow instructions in the ArcSight ESM User’s Guide to set up ArcSight Console for integrated searches on Logger. When setting up a user for Logger access (as described in the “Set Up Users for Logger Access” section of the User’s Guide), specify the following integration parameters.
Parameter Description
For Appliance Logger Target
LoggerHost The IP address of the Logger host.
LoggerPort 443
For Software Logger Target
LoggerHost The IP address of the Logger host.
LoggerPort The Logger port number you assigned it during installation.
Administrator's GuideAppendix J: Logger Search From ArcSight ESM
Setup and Configuration Page 735 of 743
Configuring on LoggerFollow these instructions to set up and configure Logger:
1. Your Logger is one of the recommended versions.
2. The Logger user name is the one you specified while creating an integration parameter (in) on the ArcSight Console.
3. Once you execute an integration command , the user must be authenticated in Logger target. Otherwise, the browser will redirect you to the Login page first.
Supported Search OptionsYou can select from the following search options when running a Logger search (not Quick Search) from the ArcSight Console:
l By Destination
l By Event Name
l By Source
l By Source and Destination
l By User
l By Vendor and Product
Additionally, if multiple Loggers are configured on your ArcSight Console, you can select the one on which the integrated search should be run.
GuidelinesMake sure you are aware of the following guidelines about Logger Search when it is run from ArcSight Console:
l A field-based search query is used to perform search on the Logger.
l Only searches from an active channel of an ArcSight Console is supported; searches from other ESM resources are not supported.
l Only one search option per search operation is supported. That is, you cannot select by both Event Name and By Destination for one search operation. For multiple search options, see "Supported Search Options" above.
Administrator's GuideAppendix J: Logger Search From ArcSight ESM
Configuring on Logger Page 736 of 743
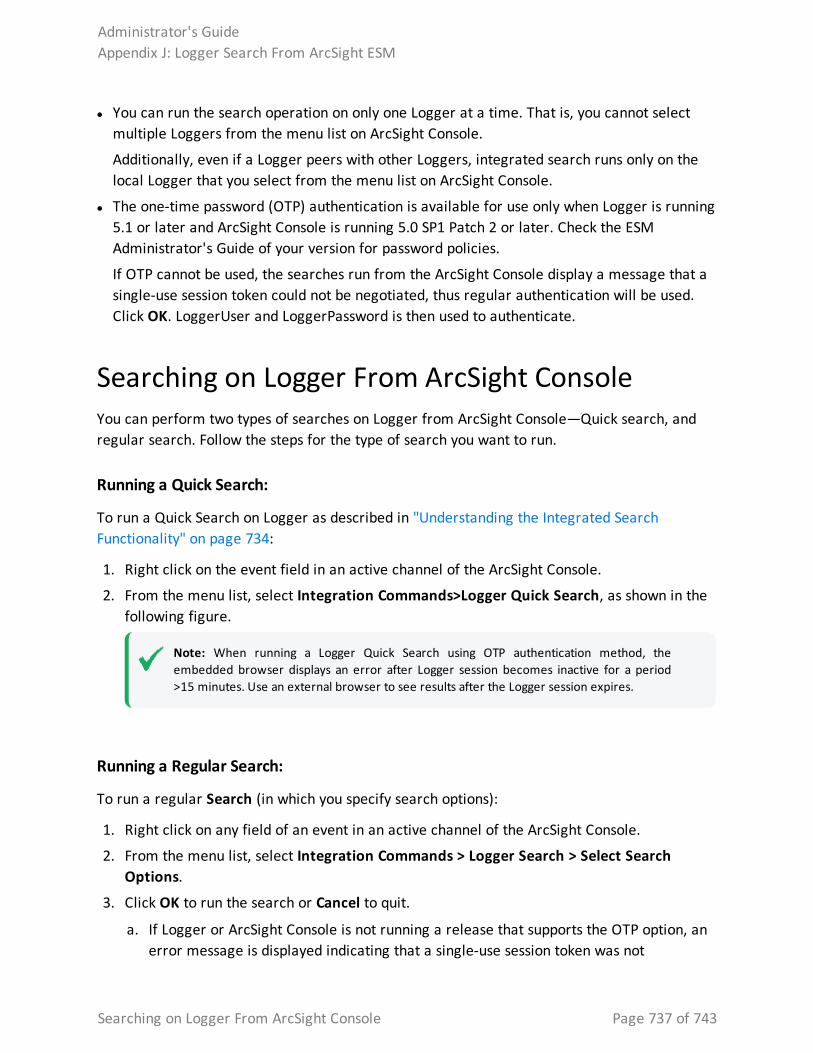
l You can run the search operation on only one Logger at a time. That is, you cannot select multiple Loggers from the menu list on ArcSight Console.
Additionally, even if a Logger peers with other Loggers, integrated search runs only on the local Logger that you select from the menu list on ArcSight Console.
l The one-time password (OTP) authentication is available for use only when Logger is running 5.1 or later and ArcSight Console is running 5.0 SP1 Patch 2 or later. Check the ESM Administrator's Guide of your version for password policies.
If OTP cannot be used, the searches run from the ArcSight Console display a message that a single-use session token could not be negotiated, thus regular authentication will be used. Click OK. LoggerUser and LoggerPassword is then used to authenticate.
Searching on Logger From ArcSight ConsoleYou can perform two types of searches on Logger from ArcSight Console—Quick search, and regular search. Follow the steps for the type of search you want to run.
Running a Quick Search:
To run a Quick Search on Logger as described in "Understanding the Integrated Search Functionality" on page 734:
1. Right click on the event field in an active channel of the ArcSight Console.
2. From the menu list, select Integration Commands>Logger Quick Search, as shown in the following figure.
Note: When running a Logger Quick Search using OTP authentication method, the embedded browser displays an error after Logger session becomes inactive for a period >15 minutes. Use an external browser to see results after the Logger session expires.
Running a Regular Search:
To run a regular Search (in which you specify search options):
1. Right click on any field of an event in an active channel of the ArcSight Console.
2. From the menu list, select Integration Commands > Logger Search > Select Search Options.
3. Click OK to run the search or Cancel to quit.
a. If Logger or ArcSight Console is not running a release that supports the OTP option, an error message is displayed indicating that a single-use session token was not
Administrator's GuideAppendix J: Logger Search From ArcSight ESM
Searching on Logger From ArcSight Console Page 737 of 743

negotiated and basic authentication will be used instead.
b. If that option is acceptable, click OK to proceed.
The search results are displayed in the ArcSight Console Web Viewer.
Administrator's GuideAppendix J: Logger Search From ArcSight ESM
Searching on Logger From ArcSight Console Page 738 of 743
Appendix K: Searching Logger's Event Data from Recon Logger and Recon data can now be accessed from one single product. Logger event data collected throughout this time can be viewed from Recon, a modern log search and hunt solution powered by a high-performance column-oriented, clustered database. If you have ArcSight Logger and ArcSight Recon in your network infrastructure and want to search your logger data using recon capabilities, you can easily migrate the Logger archive and live events by using a Logger to Recon Migration Tool (LRM tool).
The following topics discuss how to use migrate and search the data collected by ArcSight Logger from ArcSight Recon.
PrerequisitesMake sure you comply with these requirements before executing the LRM tool:
Product Requirements
Logger l Logger(s) in 7.2 version with event data collected.
l Admin user with SSH credentials.
l The system directory must have enough space before executing the LRM tool. Logger requires 20 GB of free space for temporal files of 15 k EPS with an average event size of 1800 bytes.
l Recon and Logger can be in different machines but make sure to have VSQL Client driver on the Logger server. For more information, see "Install VSQL Client Driver" on the next page.
Recon l Recon in 1.2 version.
l Admin user with ArcSight Unified Database credentials.
l The system directory must have enough space before executing the LRM tool. ArcSight Unified Database requires 50 GB of free space for temporal files of 15 k EPS with an average event size of 1800 bytes. At the end of the migration, ArcSight Unified Database will require an approximate of 230 MB per million of events migrated.
l Recon instance should be reachable from Logger instance <on port 5433>.
Appendix K: Searching Logger's Event Data from Recon Page 739 of 743
Guidelines
Make sure you are aware of the following information during and after the LRM tool execution:
l Logger event ingestion can continue during this procedure.
l Logger will still maintain your data for long term storage.
l If you plan to run migrations from different Loggers, run the migrations sequentially rather than concurrently.
l Only live and archive events from the current Logger instance are migrated to Recon. Content, configuration, and logger peers data will not be migrated.
Install VSQL Client DriverIf ArcSight Unified Database and Logger are installed in different machines, follow the steps below to install the VSQL Client driver.
1. From the this page, download the TAR version.
Tip: Micro Focus recommends to use the same version for database server and TAR driver. Refer to the Technical Requirements for Arcsight Platform for details on the supported version.
You can also copy that driver from the ArcSight Unified Database following these steps:
a. Log in to the ArcSight Unified Database machine using SSH.
b. Copy the <VERTICA_INSTALL_PATH>/bin/vsql file to the logger machine using the following command: $ scp /opt/vertica/bin/vsql arcsight@<LOGGER_IP>:/opt/vertica/bin/
c. Confirm the VSQL file is placed in the following path in the logger machine /opt/vertica/bin/
2. Extract the TAR from the directory by running the command:tar xvfz vertica-client-[version] [OS].tar.gz -C /
3. From your home directory, add the PATH: cd ~
4. Open the file: vi .bashrc
5. On the PATH variable located at the /opt/vertica/bin file, add the vsql path: export PATH-$ANT_HOME/bin:$JAVA_HOME/bin:$PATH:$P4_HOME/bin:/opt/vertica/bin
Administrator's GuideAppendix K: Searching Logger's Event Data from Recon
Install VSQL Client Driver Page 740 of 743
If the PATH variable is not found, create it: PATH=$PATH:/opt/vertica/bin
6. Save the changes:
:wq and press ENTER.
7. Refresh the .bashrc file: source .bashrc
8. To verify VSQL has been installed, run the following command: vsql --version
Migrate Logger data to Recon Use the steps below to migrate live and / or archive events from your local searches.
For events generated with a GlobalEventId with an invalid value (or value of 0), generate a global event id from the ArcMC (containerized). For more details on how to access the generator ID, see the Unified Admin Guide. Take note of the GEID and later add it on the LRM tool.
1. Access Logger SSH console.
2. Run the LRM tool script to generate CSV files:loggerToReconMigration.sh –s<start time> -e <end time> -g <global id generator> -h<hostname or IP> - U<db admin user> [-w <password>] [-d database]
l On the Logger appliance, the script is located in: /opt/arcsight/logger/bin/scripts/recon/loggerToReconMigration.sh
l On Software Logger, the script is located in: <logger install dir>/current/arcsight/logger/bin/scripts/recon/loggerToReconMigration.sh
For example:
./loggerToReconMigration.sh -s "2021-02-01T00:00:00.000Z" -e "2021-03-01T00:00:00.000Z" -g2 1xxxx -h 15.214.xxx.xxx -U dbadmin
Note: Overlapping dates will cause an error message. If this is not the first migration of this Logger instance, make sure to select a data time range different than the one already migrated. You can also delete the old data first. For additional details, see "Delete Logger Data in Recon " on the next page.
Administrator's GuideAppendix K: Searching Logger's Event Data from Recon
Migrate Logger data to Recon Page 741 of 743
3. The LRM tool will be executed. Migration time can depend on the data size and quantity. For example, it could take up to 2.5 hours to migrate 50 million events from a Logger Appliance G10 to a ArcSight Unified Database installed in another G10 machine with low latency between the machines.
To check the status (Progress, Events migrated, and loaded) and the number of events migrated, check the LRM tool output. You can also check the log under the /userdata/logger/logs file <start time>_<end time>_to_<vertica host>_migration.log file.
4. To confirm any possible discrepancy between the numbers of events migrated and sent, access the logger_events_rejected table from the ArcSight Unified Database to check failures.
Once all events were moved to the ArcSight Unified Database and available in Recon, you can start searching your data. For more information on how to Search Logger data in Recon, see User's Guide for ArcSight Recon.
Delete Logger Data in Recon When necessary, you can delete the migrated data from the ArcSight Unified Database. The time required to delete the data depend on the size and quantity of the Logger data. To avoid performance issues, truncate the Logger table of events in Recon when removing all the files. By doing this, the Recon will remove all the data from all the different loggers.
Use the steps below to selectively remove small data size and quantity.
1. Access Logger SSH console.
2. Run the loggerToReconDeletion.sh to generate CSV files:loggerToReconDeletion.sh –s<start time> -e <end time> -h<hostname or IP> - U<db admin user> [-w <password>] [-d database]
l On the Logger appliance, the script is located in: /opt/arcsight/logger/bin/scripts/recon/loggerToReconDeletion.sh
l On Software Logger, the script is located in: <logger install dir>/current/arcsight/logger/bin/scripts/recon/loggerToReconDeletion.sh
For example:
./loggerToReconDeletion.sh -s "2021-02-01T00:00:00.000Z" -e "2021-03-01T00:00:00.000Z" -h 15.214.xxx.xxx -U dbadmin
A message indicating process has been successfully completed.
Administrator's GuideAppendix K: Searching Logger's Event Data from Recon
Delete Logger Data in Recon Page 742 of 743
Send Documentation FeedbackIf you have comments about this document, you can contact the documentation team by email. If an email client is configured on this computer, click the link above and an email window opens with the following information in the subject line:
Feedback on Administrator's Guide (Logger 7.2)
Just add your feedback to the email and click send.
If no email client is available, copy the information above to a new message in a web mail client, and send your feedback to [email protected].
We appreciate your feedback!
Send Documentation Feedback Page 743 of 743


