Embed Size (px)
Citation preview
BioMed Central
ss
BMC Genomics
Open AcceMethodology articleMicrobial comparative pan-genomics using binomial mixture modelsLars Snipen*1, Trygve Almøy1 and David W Ussery2
Address: 1Biostatistics, Department of Chemistry, Biotechnology and Food Sciences, Norwegian University of Life Sciences, Ås, Norway and 2Centre for Biological Sequence Analysis, Technical University of Denmark, Lyngby, Denmark
Email: Lars Snipen* - [email protected]; Trygve Almøy - [email protected]; David W Ussery - [email protected]
* Corresponding author
AbstractBackground: The size of the core- and pan-genome of bacterial species is a topic of increasinginterest due to the growing number of sequenced prokaryote genomes, many from the samespecies. Attempts to estimate these quantities have been made, using regression methods ormixture models. We extend the latter approach by using statistical ideas developed for capture-recapture problems in ecology and epidemiology.
Results: We estimate core- and pan-genome sizes for 16 different bacterial species. The resultsreveal a complex dependency structure for most species, manifested as heterogeneous detectionprobabilities. Estimated pan-genome sizes range from small (around 2600 gene families) in Buchneraaphidicola to large (around 43000 gene families) in Escherichia coli. Results for Echerichia coli showthat as more data become available, a larger diversity is estimated, indicating an extensive pool ofrarely occurring genes in the population.
Conclusion: Analyzing pan-genomics data with binomial mixture models is a way to handledependencies between genomes, which we find is always present. A bottleneck in the estimationprocedure is the annotation of rarely occurring genes.
BackgroundOne of the consequences of the explosion in numbers offully sequenced and annotated microbial genomes is thatwe are now facing the challenges of comparative pan-genomics [1]. The microbial pan-genome, as defined by[2], is the number of essentially different genes foundwithin a population at a specified taxonomic level, usu-ally within a species, though this can be extended tohigher levels, such as genus. As multiple genomes of thesame species are sequenced, one can construct the pan-genome, and begin to compare pan-genomes from differ-ent species.
Having a set of fully sequenced and annotated genomesfrom several strains within a species, one is interested intwo sets of genes. The first is the set of core genes, i.e. thegenes found in every strain within a species. The size andcontent of the core genome is interesting for characteriz-ing the genomic essence of the species. The other set is thepan-genome, which is the total number of different genesfound in all strains within the species. The size of this pan-genome, relative to the number of genes found in a typicalstrain, is an indicator of the plasticity of the species, andcould be reflective of its potential for adaptation in adiverse environment.
Published: 19 August 2009
BMC Genomics 2009, 10:385 doi:10.1186/1471-2164-10-385
Received: 24 April 2009Accepted: 19 August 2009
This article is available from: http://www.biomedcentral.com/1471-2164/10/385
© 2009 Snipen et al; licensee BioMed Central Ltd. This is an Open Access article distributed under the terms of the Creative Commons Attribution License (http://creativecommons.org/licenses/by/2.0), which permits unrestricted use, distribution, and reproduction in any medium, provided the original work is properly cited.
Page 1 of 8(page number not for citation purposes)
BMC Genomics 2009, 10:385 http://www.biomedcentral.com/1471-2164/10/385
The true core- and pan-genome sizes, here denoted γ andη respectively, will most likely remain unknown for anyspecies, since it is impossible to sequence and annotate allexisting strains. Thus, we have to rely on estimates basedon existing data. The problem of estimating the size of thecore- and pan-genome was first approached by [2]. Theyused an exponential function to explain the number ofnew genes introduced by each new sequenced genome,and by extrapolating this they came up with some esti-mates of the pan-genome size. The core-genome size wasalso estimated in a similar way. Modified versions of thisapproach have later been used by others. For example thenumber of new Escherichia coli genes contributed by eachadditional genome sequenced was first estimated to berather large – 440 genes by [3]. More recent estimates,based on 17 different isolates from a wide variety ofstrains, brought the number of expected novel genes pernew genome to be around 300, with approximately13,000 genes estimated to be in the total E. coli pan-genome [4]. Based on comparison of 32 E. coli genomesequences, we have previously estimated the number tobe around 80 novel genes per genome, with a pan-genome size of just under 10,000 genes [5].
One of the implications of early pan-genome estimates isthat some bacterial species might have an "infinite" pan-genome [2,6]. This is a dramatic statement, especiallysince it can be largely due to a bias from their use of anexponential model, which inherently assumes the pan-genome can be divided into two groups: The core-genesalways present in all genomes, and the dispensable genes,equally likely to occur in any genome. The latter part ofthis assumption is often far from reality, which we willshow in this paper. This was also recognized by [7], whowas the first to introduce a mixture model to estimate thecore- and pan-genome size. Unfortunately, they alsoimposed some rather heavy restrictions in their model,making their pan-genome estimates biased towards largervalues.
We will, however, extend the good idea of [7] in thispaper, and by avoiding their heavy restrictions hopefullycome up with more realistic estimates of core- and pan-genome sizes.
ResultsAlgorithmGene familiesFor a given species G different genomes have beensequenced and annotated. The first step in any pan-genome analysis is to come up with a list of gene familiesin the current sample. A deeper analysis of this problem isnot the focus of this paper, and we have at this stage takenthe approach used by [7] and [5]. First an all-against-allBLASTing (blastp) is performed, and only alignmentswith at least 50% identity along at least 50% of both
sequences are considered. Two sequences belong to thesame gene family if both their reciprocal alignments fulfillthe 50-50-cutoff rule. The results of this procedure is typi-cally stored in a pan-matrix M = {mij} where each row cor-responds to a gene family and each column to a genome.If gene family i has at least one member in genome j thenmij = 1, else mij = 0.
Mixture model
The pan-genome size, η, is the number of gene familiesfound in all strains, also including the gene families notyet observed in the G genomes sequenced so far. Sum-ming row i in M we get the number of genomes in whichgene family i has been observed. Tabulating all these row-sums gives us the number of gene-families observed in1,..., G genomes, which we denote y1,...yG. The sample
pan-genome size is , while yG is usually listed
as the sample core-genome size. The true pan-genome sizealso includes y0, the number of gene families observed in
zero genomes so far. Hence η = n + y0 and estimating η is
equivalent to predicting y0.
In order to predict y0 we need a model that relates y0 toy1,..., yG. Consider y = (y0, y1,..., yG). Since the total sum ofgene families, η, is constant y is a multiniomial vector ifwe assume independence between gene families, i.e. y ~Mult(θ, η). The multinomial probabilities θ = (θ0,..., θG)are the probabilities of a gene family to be detected in 0,...,G genomes, respectively. The expected value of y0 is E(y0)= ηθ0 due to the multinomial model. Also, a similar argu-ment leads to E(n) = η(1 - θ0). Combined they lead to
Using n as an estimate of E(n) we can predict y0 if we canestimate θ0. This estimate can be found by assuming somedegree of smoothness across the multinomial probabili-ties. One way of obtaining this is by using a binomial mix-ture model. This means we assume
where πk is the mixing proportion and
is a binomial probability mass function with detectionprobability ρk. Thus, the multinomial probabilities areexpressed as a combination of K binomial probability
n y gg
G= =∑ 1
E y E n( ) ( )00
1 0=
−q
q(1)
q p rg k k
k
K
f g g G= ==
∑ ( ; ), , ,1
0 K (2)
f gG
gk Kk k
gk
G g( ; ) ( ) , , ,r r r=⎛
⎝⎜
⎞
⎠⎟ − =−1 1 K (3)
Page 2 of 8(page number not for citation purposes)
BMC Genomics 2009, 10:385 http://www.biomedcentral.com/1471-2164/10/385
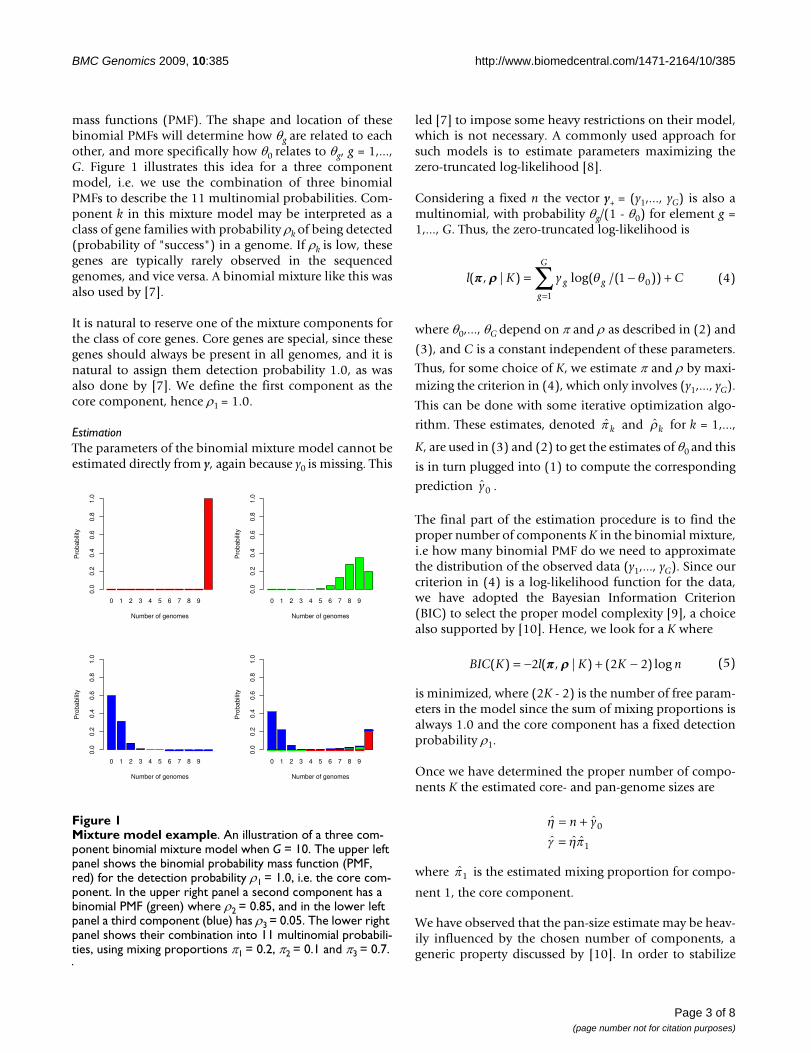
mass functions (PMF). The shape and location of thesebinomial PMFs will determine how θg are related to eachother, and more specifically how θ0 relates to θg, g = 1,...,G. Figure 1 illustrates this idea for a three componentmodel, i.e. we use the combination of three binomialPMFs to describe the 11 multinomial probabilities. Com-ponent k in this mixture model may be interpreted as aclass of gene families with probability ρk of being detected(probability of "success") in a genome. If ρk is low, thesegenes are typically rarely observed in the sequencedgenomes, and vice versa. A binomial mixture like this wasalso used by [7].
It is natural to reserve one of the mixture components forthe class of core genes. Core genes are special, since thesegenes should always be present in all genomes, and it isnatural to assign them detection probability 1.0, as wasalso done by [7]. We define the first component as thecore component, hence ρ1 = 1.0.
EstimationThe parameters of the binomial mixture model cannot beestimated directly from y, again because y0 is missing. This
led [7] to impose some heavy restrictions on their model,which is not necessary. A commonly used approach forsuch models is to estimate parameters maximizing thezero-truncated log-likelihood [8].
Considering a fixed n the vector y+ = (y1,..., yG) is also amultinomial, with probability θg/(1 - θ0) for element g =1,..., G. Thus, the zero-truncated log-likelihood is
where θ0,..., θG depend on π and ρ as described in (2) and
(3), and C is a constant independent of these parameters.
Thus, for some choice of K, we estimate π and ρ by maxi-mizing the criterion in (4), which only involves (y1,..., yG).
This can be done with some iterative optimization algo-
rithm. These estimates, denoted and for k = 1,...,
K, are used in (3) and (2) to get the estimates of θ0 and this
is in turn plugged into (1) to compute the corresponding
prediction .
The final part of the estimation procedure is to find theproper number of components K in the binomial mixture,i.e how many binomial PMF do we need to approximatethe distribution of the observed data (y1,..., yG). Since ourcriterion in (4) is a log-likelihood function for the data,we have adopted the Bayesian Information Criterion(BIC) to select the proper model complexity [9], a choicealso supported by [10]. Hence, we look for a K where
is minimized, where (2K - 2) is the number of free param-eters in the model since the sum of mixing proportions isalways 1.0 and the core component has a fixed detectionprobability ρ1.
Once we have determined the proper number of compo-nents K the estimated core- and pan-genome sizes are
where is the estimated mixing proportion for compo-
nent 1, the core component.
We have observed that the pan-size estimate may be heav-ily influenced by the chosen number of components, ageneric property discussed by [10]. In order to stabilize
l K y Cg g
g
G
( , | ) log( /( ))pp rr = − +=
∑ q q1 0
1
(4)
p k r k
y0
BIC K l K K n( ) ( , | ) ( ) log= − + −2 2 2pp rr (5)
ˆ ˆ
ˆ ˆ ˆ
hg hp
= +=
n y0
1
p1
Mixture model exampleFigure 1Mixture model example. An illustration of a three com-ponent binomial mixture model when G = 10. The upper left panel shows the binomial probability mass function (PMF, red) for the detection probability ρ1 = 1.0, i.e. the core com-ponent. In the upper right panel a second component has a binomial PMF (green) where ρ2 = 0.85, and in the lower left panel a third component (blue) has ρ3 = 0.05. The lower right panel shows their combination into 11 multinomial probabili-ties, using mixing proportions π1 = 0.2, π2 = 0.1 and π3 = 0.7.
0 1 2 3 4 5 6 7 8 9
Number of genomes
Pro
babi
lity
0.0
0.2
0.4
0.6
0.8
1.0
0 1 2 3 4 5 6 7 8 9
Number of genomes
Pro
babi
lity
0.0
0.2
0.4
0.6
0.8
1.0
0 1 2 3 4 5 6 7 8 9
Number of genomes
Pro
babi
lity
0.0
0.2
0.4
0.6
0.8
1.0
0 1 2 3 4 5 6 7 8 9
Number of genomes
Pro
babi
lity
0.0
0.2
0.4
0.6
0.8
1.0
Page 3 of 8(page number not for citation purposes)
BMC Genomics 2009, 10:385 http://www.biomedcentral.com/1471-2164/10/385
the estimates, [10] propose a bagging-based estimator,which we have adopted. This is a bootstrap procedure thatwill smooth the estimate over various choices of compo-nents, and making the final estimate more stable.
As an alternative to the binomial mixture model estimate,we have also included the Chao lower-bound estimate[11] when fitting to real data. This is a very simple proce-dure, where the pan-genome size is estimated by
Notice that this corresponds to y0 being predicted from y1and y2 only.
ImplementationAll computations, including the parsing of BLAST results,setting up the pan-matrix and performing all estimationshave been implemented in R [12] and is freely availablefrom the corresponding author. An R-package for micro-bial pan-genomics is under construction and will be madeavailable as soon as it is operational.
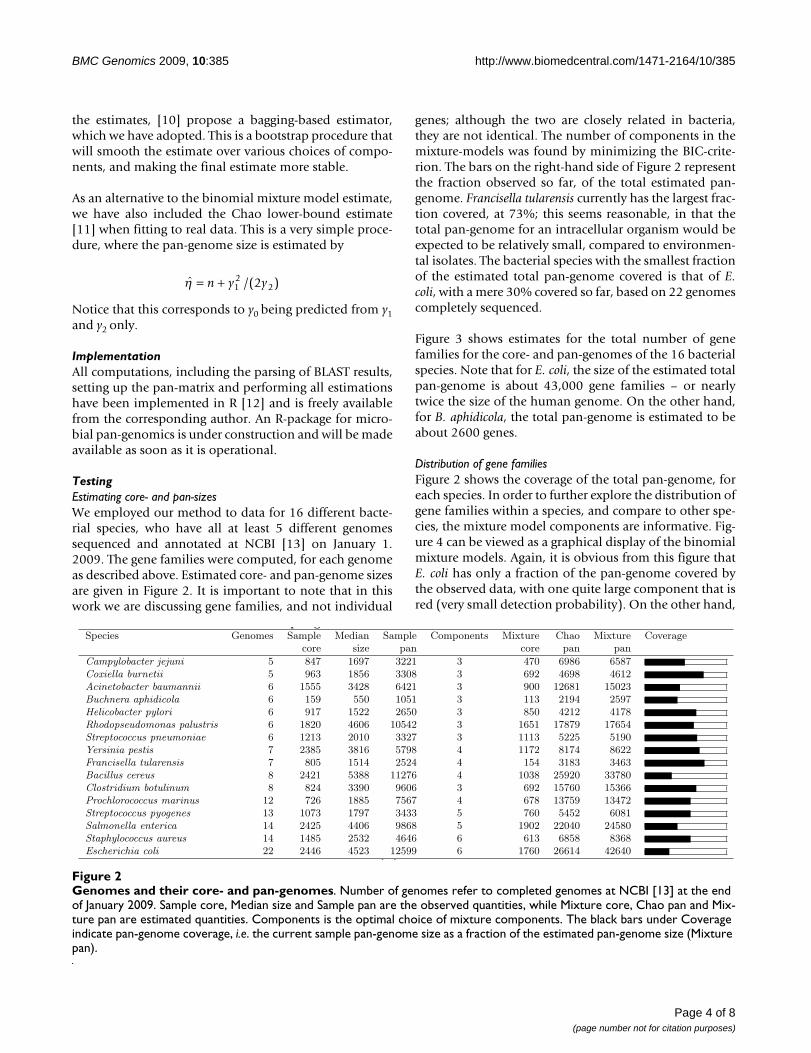
TestingEstimating core- and pan-sizesWe employed our method to data for 16 different bacte-rial species, who have all at least 5 different genomessequenced and annotated at NCBI [13] on January 1.2009. The gene families were computed, for each genomeas described above. Estimated core- and pan-genome sizesare given in Figure 2. It is important to note that in thiswork we are discussing gene families, and not individual
genes; although the two are closely related in bacteria,they are not identical. The number of components in themixture-models was found by minimizing the BIC-crite-rion. The bars on the right-hand side of Figure 2 representthe fraction observed so far, of the total estimated pan-genome. Francisella tularensis currently has the largest frac-tion covered, at 73%; this seems reasonable, in that thetotal pan-genome for an intracellular organism would beexpected to be relatively small, compared to environmen-tal isolates. The bacterial species with the smallest fractionof the estimated total pan-genome covered is that of E.coli, with a mere 30% covered so far, based on 22 genomescompletely sequenced.
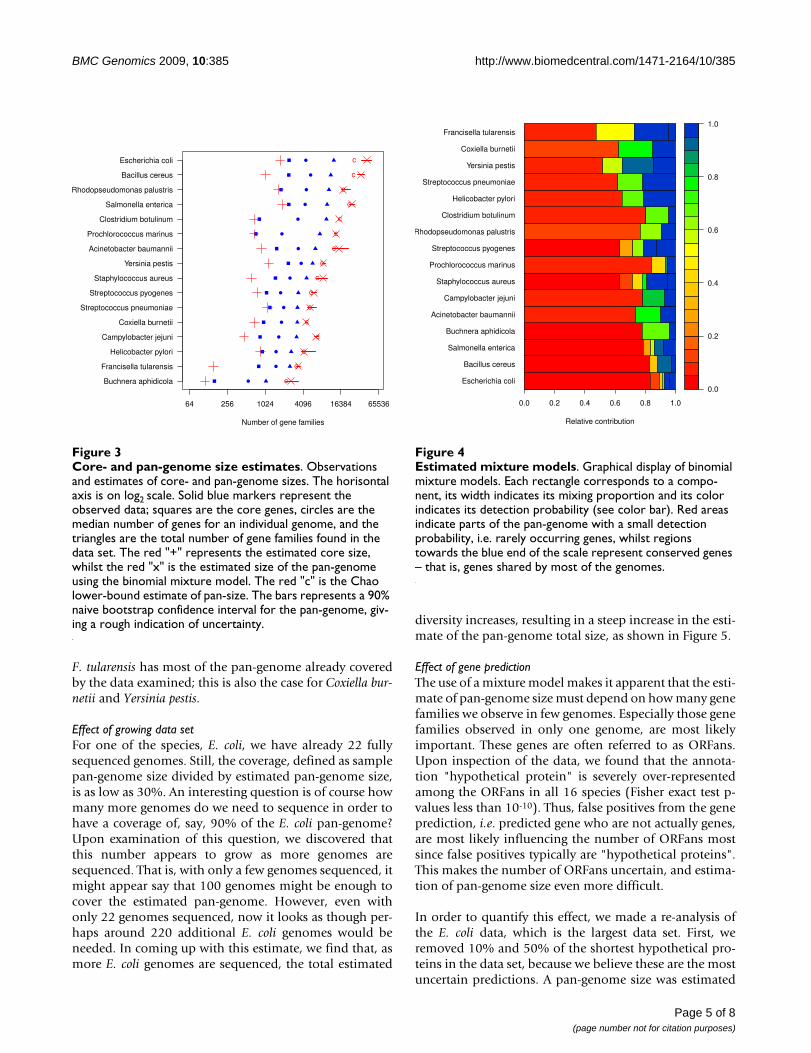
Figure 3 shows estimates for the total number of genefamilies for the core- and pan-genomes of the 16 bacterialspecies. Note that for E. coli, the size of the estimated totalpan-genome is about 43,000 gene families – or nearlytwice the size of the human genome. On the other hand,for B. aphidicola, the total pan-genome is estimated to beabout 2600 genes.
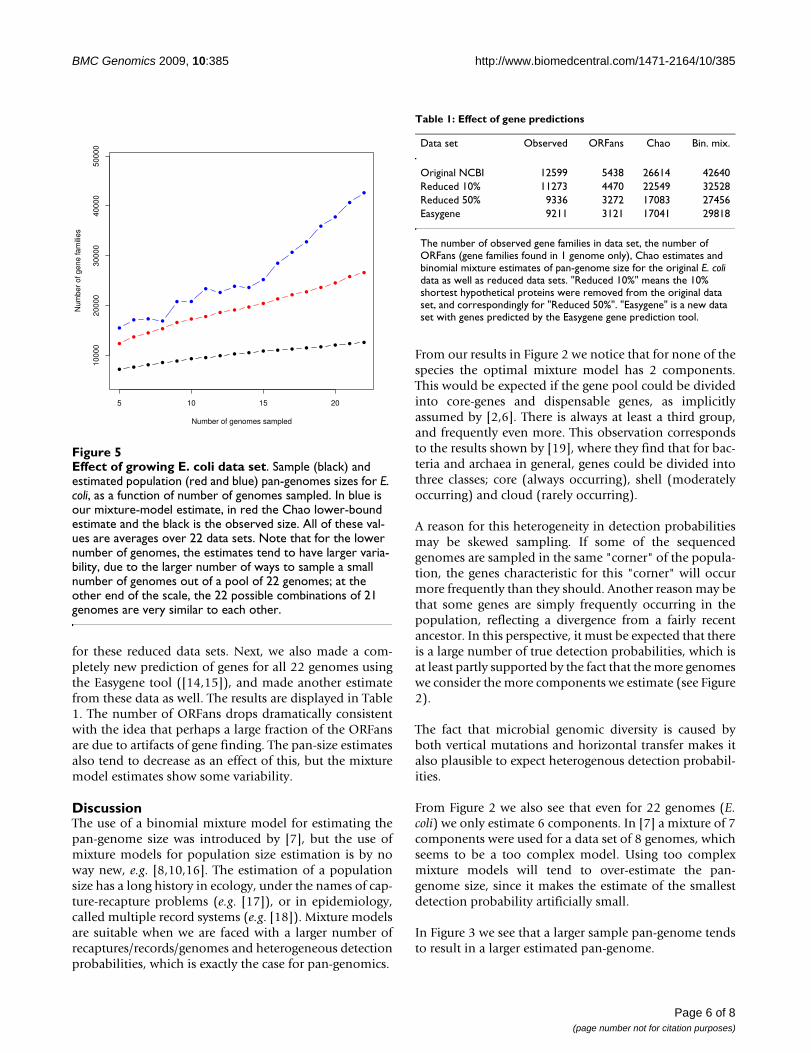
Distribution of gene familiesFigure 2 shows the coverage of the total pan-genome, foreach species. In order to further explore the distribution ofgene families within a species, and compare to other spe-cies, the mixture model components are informative. Fig-ure 4 can be viewed as a graphical display of the binomialmixture models. Again, it is obvious from this figure thatE. coli has only a fraction of the pan-genome covered bythe observed data, with one quite large component that isred (very small detection probability). On the other hand,
ˆ /( )h = +n y y12
22
Genomes and their core- and pan-genomesFigure 2Genomes and their core- and pan-genomes. Number of genomes refer to completed genomes at NCBI [13] at the end of January 2009. Sample core, Median size and Sample pan are the observed quantities, while Mixture core, Chao pan and Mix-ture pan are estimated quantities. Components is the optimal choice of mixture components. The black bars under Coverage indicate pan-genome coverage, i.e. the current sample pan-genome size as a fraction of the estimated pan-genome size (Mixture pan).
p g
Species Genomes Sample Median Sample Components Mixture Chao Mixture Coveragecore size pan core pan pan
Campylobacter jejuni 5 847 1697 3221 3 470 6986 6587Coxiella burnetii 5 963 1856 3308 3 692 4698 4612Acinetobacter baumannii 6 1555 3428 6421 3 900 12681 15023Buchnera aphidicola 6 159 550 1051 3 113 2194 2597Helicobacter pylori 6 917 1522 2650 3 850 4212 4178Rhodopseudomonas palustris 6 1820 4606 10542 3 1651 17879 17654Streptococcus pneumoniae 6 1213 2010 3327 3 1113 5225 5190Yersinia pestis 7 2385 3816 5798 4 1172 8174 8622Francisella tularensis 7 805 1514 2524 4 154 3183 3463Bacillus cereus 8 2421 5388 11276 4 1038 25920 33780Clostridium botulinum 8 824 3390 9606 3 692 15760 15366Prochlorococcus marinus 12 726 1885 7567 4 678 13759 13472Streptococcus pyogenes 13 1073 1797 3433 5 760 5452 6081Salmonella enterica 14 2425 4406 9868 5 1902 22040 24580Staphylococcus aureus 14 1485 2532 4646 6 613 6858 8368Escherichia coli 22 2446 4523 12599 6 1760 26614 42640
[ ]
Page 4 of 8(page number not for citation purposes)
BMC Genomics 2009, 10:385 http://www.biomedcentral.com/1471-2164/10/385
F. tularensis has most of the pan-genome already coveredby the data examined; this is also the case for Coxiella bur-netii and Yersinia pestis.
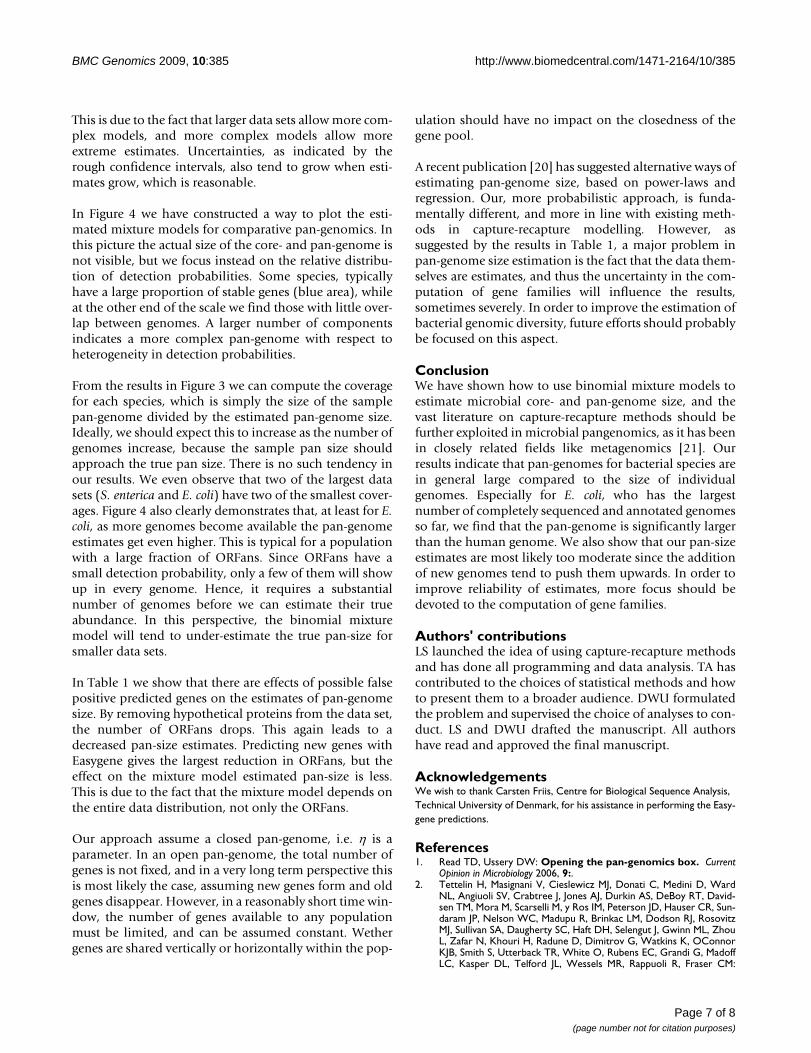
Effect of growing data setFor one of the species, E. coli, we have already 22 fullysequenced genomes. Still, the coverage, defined as samplepan-genome size divided by estimated pan-genome size,is as low as 30%. An interesting question is of course howmany more genomes do we need to sequence in order tohave a coverage of, say, 90% of the E. coli pan-genome?Upon examination of this question, we discovered thatthis number appears to grow as more genomes aresequenced. That is, with only a few genomes sequenced, itmight appear say that 100 genomes might be enough tocover the estimated pan-genome. However, even withonly 22 genomes sequenced, now it looks as though per-haps around 220 additional E. coli genomes would beneeded. In coming up with this estimate, we find that, asmore E. coli genomes are sequenced, the total estimated
diversity increases, resulting in a steep increase in the esti-mate of the pan-genome total size, as shown in Figure 5.
Effect of gene predictionThe use of a mixture model makes it apparent that the esti-mate of pan-genome size must depend on how many genefamilies we observe in few genomes. Especially those genefamilies observed in only one genome, are most likelyimportant. These genes are often referred to as ORFans.Upon inspection of the data, we found that the annota-tion "hypothetical protein" is severely over-representedamong the ORFans in all 16 species (Fisher exact test p-values less than 10-10). Thus, false positives from the geneprediction, i.e. predicted gene who are not actually genes,are most likely influencing the number of ORFans mostsince false positives typically are "hypothetical proteins".This makes the number of ORFans uncertain, and estima-tion of pan-genome size even more difficult.
In order to quantify this effect, we made a re-analysis ofthe E. coli data, which is the largest data set. First, weremoved 10% and 50% of the shortest hypothetical pro-teins in the data set, because we believe these are the mostuncertain predictions. A pan-genome size was estimated
Core- and pan-genome size estimatesFigure 3Core- and pan-genome size estimates. Observations and estimates of core- and pan-genome sizes. The horisontal axis is on log2 scale. Solid blue markers represent the observed data; squares are the core genes, circles are the median number of genes for an individual genome, and the triangles are the total number of gene families found in the data set. The red "+" represents the estimated core size, whilst the red "x" is the estimated size of the pan-genome using the binomial mixture model. The red "c" is the Chao lower-bound estimate of pan-size. The bars represents a 90% naive bootstrap confidence interval for the pan-genome, giv-ing a rough indication of uncertainty.
Number of gene families
64 256 1024 4096 16384 65536
Buchnera aphidicola
Francisella tularensis
Helicobacter pylori
Campylobacter jejuni
Coxiella burnetii
Streptococcus pneumoniae
Streptococcus pyogenes
Staphylococcus aureus
Yersinia pestis
Acinetobacter baumannii
Prochlorococcus marinus
Clostridium botulinum
Salmonella enterica
Rhodopseudomonas palustris
Bacillus cereus
Escherichia coli
● c
● c
● c
● c
● c
● c
● c
● c
● c
● c
● c
● c
● c
● c
● c
● c
Estimated mixture modelsFigure 4Estimated mixture models. Graphical display of binomial mixture models. Each rectangle corresponds to a compo-nent, its width indicates its mixing proportion and its color indicates its detection probability (see color bar). Red areas indicate parts of the pan-genome with a small detection probability, i.e. rarely occurring genes, whilst regions towards the blue end of the scale represent conserved genes – that is, genes shared by most of the genomes.
●
●
0.0 0.2 0.4 0.6 0.8 1.0
Relative contribution
Escherichia coli
Bacillus cereus
Salmonella enterica
Buchnera aphidicola
Acinetobacter baumannii
Campylobacter jejuni
Staphylococcus aureus
Prochlorococcus marinus
Streptococcus pyogenes
Rhodopseudomonas palustris
Clostridium botulinum
Helicobacter pylori
Streptococcus pneumoniae
Yersinia pestis
Coxiella burnetii
Francisella tularensis
0.0
0.2
0.4
0.6
0.8
1.0
Page 5 of 8(page number not for citation purposes)
BMC Genomics 2009, 10:385 http://www.biomedcentral.com/1471-2164/10/385
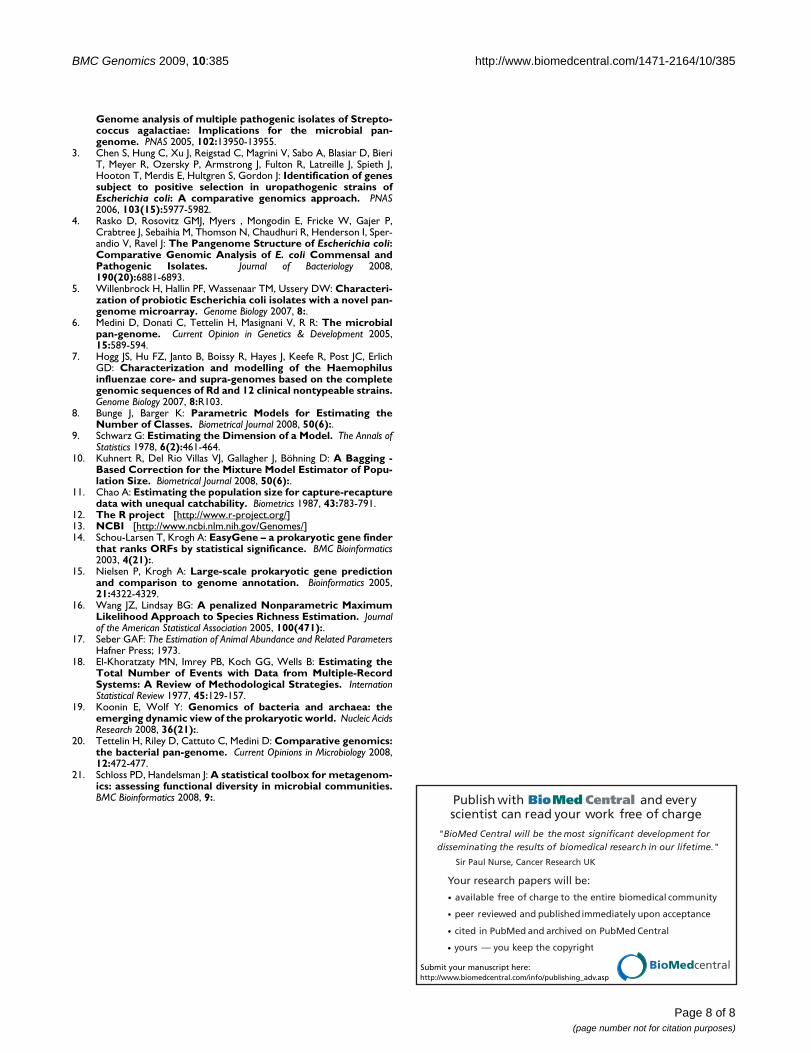
for these reduced data sets. Next, we also made a com-pletely new prediction of genes for all 22 genomes usingthe Easygene tool ([14,15]), and made another estimatefrom these data as well. The results are displayed in Table1. The number of ORFans drops dramatically consistentwith the idea that perhaps a large fraction of the ORFansare due to artifacts of gene finding. The pan-size estimatesalso tend to decrease as an effect of this, but the mixturemodel estimates show some variability.
DiscussionThe use of a binomial mixture model for estimating thepan-genome size was introduced by [7], but the use ofmixture models for population size estimation is by noway new, e.g. [8,10,16]. The estimation of a populationsize has a long history in ecology, under the names of cap-ture-recapture problems (e.g. [17]), or in epidemiology,called multiple record systems (e.g. [18]). Mixture modelsare suitable when we are faced with a larger number ofrecaptures/records/genomes and heterogeneous detectionprobabilities, which is exactly the case for pan-genomics.
From our results in Figure 2 we notice that for none of thespecies the optimal mixture model has 2 components.This would be expected if the gene pool could be dividedinto core-genes and dispensable genes, as implicitlyassumed by [2,6]. There is always at least a third group,and frequently even more. This observation correspondsto the results shown by [19], where they find that for bac-teria and archaea in general, genes could be divided intothree classes; core (always occurring), shell (moderatelyoccurring) and cloud (rarely occurring).
A reason for this heterogeneity in detection probabilitiesmay be skewed sampling. If some of the sequencedgenomes are sampled in the same "corner" of the popula-tion, the genes characteristic for this "corner" will occurmore frequently than they should. Another reason may bethat some genes are simply frequently occurring in thepopulation, reflecting a divergence from a fairly recentancestor. In this perspective, it must be expected that thereis a large number of true detection probabilities, which isat least partly supported by the fact that the more genomeswe consider the more components we estimate (see Figure2).
The fact that microbial genomic diversity is caused byboth vertical mutations and horizontal transfer makes italso plausible to expect heterogenous detection probabil-ities.
From Figure 2 we also see that even for 22 genomes (E.coli) we only estimate 6 components. In [7] a mixture of 7components were used for a data set of 8 genomes, whichseems to be a too complex model. Using too complexmixture models will tend to over-estimate the pan-genome size, since it makes the estimate of the smallestdetection probability artificially small.
In Figure 3 we see that a larger sample pan-genome tendsto result in a larger estimated pan-genome.
Effect of growing E. coli data setFigure 5Effect of growing E. coli data set. Sample (black) and estimated population (red and blue) pan-genomes sizes for E. coli, as a function of number of genomes sampled. In blue is our mixture-model estimate, in red the Chao lower-bound estimate and the black is the observed size. All of these val-ues are averages over 22 data sets. Note that for the lower number of genomes, the estimates tend to have larger varia-bility, due to the larger number of ways to sample a small number of genomes out of a pool of 22 genomes; at the other end of the scale, the 22 possible combinations of 21 genomes are very similar to each other.
●
● ●●
● ●
●●
● ●
●
●
●
●
●
●
●
●
5 10 15 20
1000
020
000
3000
040
000
5000
0
Number of genomes sampled
Num
ber
of g
ene
fam
ilies
●
●●
●
●●
●●
●●
●
●●
●
●
●
●●
●●
●● ●
● ●●
● ● ● ● ● ● ●● ● ●
Table 1: Effect of gene predictions
Data set Observed ORFans Chao Bin. mix.
Original NCBI 12599 5438 26614 42640Reduced 10% 11273 4470 22549 32528Reduced 50% 9336 3272 17083 27456Easygene 9211 3121 17041 29818
The number of observed gene families in data set, the number of ORFans (gene families found in 1 genome only), Chao estimates and binomial mixture estimates of pan-genome size for the original E. coli data as well as reduced data sets. "Reduced 10%" means the 10% shortest hypothetical proteins were removed from the original data set, and correspondingly for "Reduced 50%". "Easygene" is a new data set with genes predicted by the Easygene gene prediction tool.
Page 6 of 8(page number not for citation purposes)
BMC Genomics 2009, 10:385 http://www.biomedcentral.com/1471-2164/10/385
This is due to the fact that larger data sets allow more com-plex models, and more complex models allow moreextreme estimates. Uncertainties, as indicated by therough confidence intervals, also tend to grow when esti-mates grow, which is reasonable.
In Figure 4 we have constructed a way to plot the esti-mated mixture models for comparative pan-genomics. Inthis picture the actual size of the core- and pan-genome isnot visible, but we focus instead on the relative distribu-tion of detection probabilities. Some species, typicallyhave a large proportion of stable genes (blue area), whileat the other end of the scale we find those with little over-lap between genomes. A larger number of componentsindicates a more complex pan-genome with respect toheterogeneity in detection probabilities.
From the results in Figure 3 we can compute the coveragefor each species, which is simply the size of the samplepan-genome divided by the estimated pan-genome size.Ideally, we should expect this to increase as the number ofgenomes increase, because the sample pan size shouldapproach the true pan size. There is no such tendency inour results. We even observe that two of the largest datasets (S. enterica and E. coli) have two of the smallest cover-ages. Figure 4 also clearly demonstrates that, at least for E.coli, as more genomes become available the pan-genomeestimates get even higher. This is typical for a populationwith a large fraction of ORFans. Since ORFans have asmall detection probability, only a few of them will showup in every genome. Hence, it requires a substantialnumber of genomes before we can estimate their trueabundance. In this perspective, the binomial mixturemodel will tend to under-estimate the true pan-size forsmaller data sets.
In Table 1 we show that there are effects of possible falsepositive predicted genes on the estimates of pan-genomesize. By removing hypothetical proteins from the data set,the number of ORFans drops. This again leads to adecreased pan-size estimates. Predicting new genes withEasygene gives the largest reduction in ORFans, but theeffect on the mixture model estimated pan-size is less.This is due to the fact that the mixture model depends onthe entire data distribution, not only the ORFans.
Our approach assume a closed pan-genome, i.e. η is aparameter. In an open pan-genome, the total number ofgenes is not fixed, and in a very long term perspective thisis most likely the case, assuming new genes form and oldgenes disappear. However, in a reasonably short time win-dow, the number of genes available to any populationmust be limited, and can be assumed constant. Wethergenes are shared vertically or horizontally within the pop-
ulation should have no impact on the closedness of thegene pool.
A recent publication [20] has suggested alternative ways ofestimating pan-genome size, based on power-laws andregression. Our, more probabilistic approach, is funda-mentally different, and more in line with existing meth-ods in capture-recapture modelling. However, assuggested by the results in Table 1, a major problem inpan-genome size estimation is the fact that the data them-selves are estimates, and thus the uncertainty in the com-putation of gene families will influence the results,sometimes severely. In order to improve the estimation ofbacterial genomic diversity, future efforts should probablybe focused on this aspect.
ConclusionWe have shown how to use binomial mixture models toestimate microbial core- and pan-genome size, and thevast literature on capture-recapture methods should befurther exploited in microbial pangenomics, as it has beenin closely related fields like metagenomics [21]. Ourresults indicate that pan-genomes for bacterial species arein general large compared to the size of individualgenomes. Especially for E. coli, who has the largestnumber of completely sequenced and annotated genomesso far, we find that the pan-genome is significantly largerthan the human genome. We also show that our pan-sizeestimates are most likely too moderate since the additionof new genomes tend to push them upwards. In order toimprove reliability of estimates, more focus should bedevoted to the computation of gene families.
Authors' contributionsLS launched the idea of using capture-recapture methodsand has done all programming and data analysis. TA hascontributed to the choices of statistical methods and howto present them to a broader audience. DWU formulatedthe problem and supervised the choice of analyses to con-duct. LS and DWU drafted the manuscript. All authorshave read and approved the final manuscript.
AcknowledgementsWe wish to thank Carsten Friis, Centre for Biological Sequence Analysis, Technical University of Denmark, for his assistance in performing the Easy-gene predictions.
References1. Read TD, Ussery DW: Opening the pan-genomics box. Current
Opinion in Microbiology 2006, 9:.2. Tettelin H, Masignani V, Cieslewicz MJ, Donati C, Medini D, Ward
NL, Angiuoli SV, Crabtree J, Jones AJ, Durkin AS, DeBoy RT, David-sen TM, Mora M, Scarselli M, y Ros IM, Peterson JD, Hauser CR, Sun-daram JP, Nelson WC, Madupu R, Brinkac LM, Dodson RJ, RosovitzMJ, Sullivan SA, Daugherty SC, Haft DH, Selengut J, Gwinn ML, ZhouL, Zafar N, Khouri H, Radune D, Dimitrov G, Watkins K, OConnorKJB, Smith S, Utterback TR, White O, Rubens EC, Grandi G, MadoffLC, Kasper DL, Telford JL, Wessels MR, Rappuoli R, Fraser CM:
Page 7 of 8(page number not for citation purposes)
BMC Genomics 2009, 10:385 http://www.biomedcentral.com/1471-2164/10/385
Publish with BioMed Central and every scientist can read your work free of charge
"BioMed Central will be the most significant development for disseminating the results of biomedical research in our lifetime."
Sir Paul Nurse, Cancer Research UK
Your research papers will be:
available free of charge to the entire biomedical community
peer reviewed and published immediately upon acceptance
cited in PubMed and archived on PubMed Central
yours — you keep the copyright
Submit your manuscript here:http://www.biomedcentral.com/info/publishing_adv.asp
BioMedcentral
Genome analysis of multiple pathogenic isolates of Strepto-coccus agalactiae: Implications for the microbial pan-genome. PNAS 2005, 102:13950-13955.
3. Chen S, Hung C, Xu J, Reigstad C, Magrini V, Sabo A, Blasiar D, BieriT, Meyer R, Ozersky P, Armstrong J, Fulton R, Latreille J, Spieth J,Hooton T, Merdis E, Hultgren S, Gordon J: Identification of genessubject to positive selection in uropathogenic strains ofEscherichia coli: A comparative genomics approach. PNAS2006, 103(15):5977-5982.
4. Rasko D, Rosovitz GMJ, Myers , Mongodin E, Fricke W, Gajer P,Crabtree J, Sebaihia M, Thomson N, Chaudhuri R, Henderson I, Sper-andio V, Ravel J: The Pangenome Structure of Escherichia coli:Comparative Genomic Analysis of E. coli Commensal andPathogenic Isolates. Journal of Bacteriology 2008,190(20):6881-6893.
5. Willenbrock H, Hallin PF, Wassenaar TM, Ussery DW: Characteri-zation of probiotic Escherichia coli isolates with a novel pan-genome microarray. Genome Biology 2007, 8:.
6. Medini D, Donati C, Tettelin H, Masignani V, R R: The microbialpan-genome. Current Opinion in Genetics & Development 2005,15:589-594.
7. Hogg JS, Hu FZ, Janto B, Boissy R, Hayes J, Keefe R, Post JC, ErlichGD: Characterization and modelling of the Haemophilusinfluenzae core- and supra-genomes based on the completegenomic sequences of Rd and 12 clinical nontypeable strains.Genome Biology 2007, 8:R103.
8. Bunge J, Barger K: Parametric Models for Estimating theNumber of Classes. Biometrical Journal 2008, 50(6):.
9. Schwarz G: Estimating the Dimension of a Model. The Annals ofStatistics 1978, 6(2):461-464.
10. Kuhnert R, Del Rio Villas VJ, Gallagher J, Böhning D: A Bagging -Based Correction for the Mixture Model Estimator of Popu-lation Size. Biometrical Journal 2008, 50(6):.
11. Chao A: Estimating the population size for capture-recapturedata with unequal catchability. Biometrics 1987, 43:783-791.
12. The R project [http://www.r-project.org/]13. NCBI [http://www.ncbi.nlm.nih.gov/Genomes/]14. Schou-Larsen T, Krogh A: EasyGene – a prokaryotic gene finder
that ranks ORFs by statistical significance. BMC Bioinformatics2003, 4(21):.
15. Nielsen P, Krogh A: Large-scale prokaryotic gene predictionand comparison to genome annotation. Bioinformatics 2005,21:4322-4329.
16. Wang JZ, Lindsay BG: A penalized Nonparametric MaximumLikelihood Approach to Species Richness Estimation. Journalof the American Statistical Association 2005, 100(471):.
17. Seber GAF: The Estimation of Animal Abundance and Related ParametersHafner Press; 1973.
18. El-Khoratzaty MN, Imrey PB, Koch GG, Wells B: Estimating theTotal Number of Events with Data from Multiple-RecordSystems: A Review of Methodological Strategies. InternationStatistical Review 1977, 45:129-157.
19. Koonin E, Wolf Y: Genomics of bacteria and archaea: theemerging dynamic view of the prokaryotic world. Nucleic AcidsResearch 2008, 36(21):.
20. Tettelin H, Riley D, Cattuto C, Medini D: Comparative genomics:the bacterial pan-genome. Current Opinions in Microbiology 2008,12:472-477.
21. Schloss PD, Handelsman J: A statistical toolbox for metagenom-ics: assessing functional diversity in microbial communities.BMC Bioinformatics 2008, 9:.
Page 8 of 8(page number not for citation purposes)


