Embed Size (px)
Citation preview
MicroRNA Expression Profiles Associated withMutational Status and Survival in MalignantMelanomaStefano Caramuta1, Suzanne Egyhazi2, Monica Rodolfo3, Daniela Witten4, Johan Hansson2,Catharina Larsson1 and Weng-Onn Lui1
Malignant cutaneous melanoma is a highly aggressive form of skin cancer. Despite improvements in earlymelanoma diagnosis, the 5-year survival rate remains low in advanced disease. Therefore, novel biomarkers areurgently needed to devise new means of detection and treatment. In this study, we aimed to improve ourunderstanding of microRNA (miRNA) deregulation in melanoma development and their impact on patientsurvival. Global miRNA expression profiles of a set of melanoma lymph node metastases, melanoma cell lines,and melanocyte cultures were determined using Agilent array. Deregulated miRNAs were evaluated in relationwith clinical characteristics, patient survival, and mutational status for BRAF and NRAS. Several miRNAs weredifferentially expressed between melanocytes and melanomas as well as melanoma cell lines. In melanomas,miR-193a, miR-338, and miR-565 were underexpressed in cases with a BRAF mutation. Furthermore, lowexpression of miR-191 and high expression of miR-193b were associated with poor melanoma-specific survival.In conclusion, our findings show miRNA dysregulation in malignant melanoma and its relation to establishedmolecular backgrounds of BRAF and NRAS oncogenic mutations. The identification of an miRNA classifier forpoor survival may lead to the development of miRNA detection as a complementary prognostic tool in clinicalpractice.
Journal of Investigative Dermatology (2010) 130, 2062–2070; doi:10.1038/jid.2010.63; published online 1 April 2010
INTRODUCTIONCutaneous malignant melanoma is a highly aggressivedisease accounting for the majority of skin tumor-relateddeaths worldwide. The tumors originate from melanocytes,and are associated with risk factors such as ultravioletradiation exposure, fair skin type, and predisposing genemutations. Despite improvements in early melanoma diag-nosis, the 5-year survival rate for patients with advanceddisease is only 15% (Garbe and Eigentler, 2007; Villanuevaand Herlyn, 2008). Currently, the most powerful prognosticfactors for cutaneous melanoma at early stage are Breslow’s
tumor thickness, ulceration of the primary tumor, andsentinel lymph node status.
Activating BRAF mutations, which affect the mitogen-activated protein kinase (MAPK) pathway, are detected in50–70% of melanomas (Davies et al., 2002). NRAS mutationsare present in 15–30% of melanoma tumors (Chin et al.,1999), and cause constitutive activation of the MAPKpathway independent of BRAF. NRAS and BRAFmutations rarely co-exist, suggesting that they have biologi-cally equivalent effects in melanoma development(Omholt et al., 2003; Curtin et al., 2005). Inhibition of BRAFor NRAS appears to be a promising route for development ofnovel therapeutic tools in the treatment of metastaticmelanoma.
MicroRNAs (miRNAs) are short non-coding RNAs regula-ting gene expression in many biological processes, includingproliferation, apoptosis, and differentiation (Ambros, 2001;Bartel, 2004; He and Hannon, 2004; Kim, 2005). Expressionand functional studies indicate that altered miRNA expre-ssion is critical for disease development. Global miRNAexpression studies in cutaneous melanoma have providedevidence that miRNAs are deregulated during melanomaprogression (Gaur et al., 2007; Mueller et al., 2009). Whilethese studies have been limited to cell lines, virtually nothingis known about the miRNA expression in clinical melanomamaterials.
ORIGINAL ARTICLE
2062 Journal of Investigative Dermatology (2010), Volume 130 & 2010 The Society for Investigative Dermatology
Received 22 October 2009; revised 8 February 2010; accepted 16 February2010; published online 1 April 2010
1Department of Molecular Medicine and Surgery, Karolinska Institutet,Stockholm, Sweden; 2Department of Oncology–Pathology, KarolinskaInstitutet, Stockholm, Sweden; 3Department of Experimental Oncology,Istituto Nazionale Tumori, Milan, Italy and 4Department of Statistics, StanfordUniversity, Stanford, California, USA
Correspondence: Stefano Caramuta or Weng-Onn Lui, Department ofMolecular Medicine and Surgery, CMM L8:01, Karolinska UniversityHospital, SE-171 76 Stockholm, Sweden. E-mail: [email protected] [email protected]
Abbreviations: M, melanomas; MAPK, mitogen-activated protein kinase;MCc, cell lines derived from cutaneous metastases; MCn, cell lines derivedfrom lymph node metastases; MCp, cell lines derived from primarymelanomas; miRNA, microRNA; NM, melanocytes; PAM, prediction analysisof microarrays; SAM, significance analysis of microarrays; wt, wild type
In this study, we carried out genome-wide miRNAexpression profiling in melanoma lymph node metastasesand melanoma cell lines in comparison with melanocytes.Subgroups of deregulated miRNAs were found to beassociated with BRAF mutational status. In addition, weidentified a subset of miRNAs associated with significantlyshorter melanoma-specific survival.
RESULTSThe miRNA profiles of 16 clinical samples of melanomalymph node metastases (M-1 to 16), 21 melanoma cell linesfrom 19 patients and three reference melanocyte cultures(Table 1 and see online Supplementary Table S1) wereevaluated using microarray. After normalization and filtra-tion, 167 miRNAs with X80% present calls across thesamples remained for further analysis.
miRNA expression patterns in melanomas, melanoma cell lines,and melanocytes
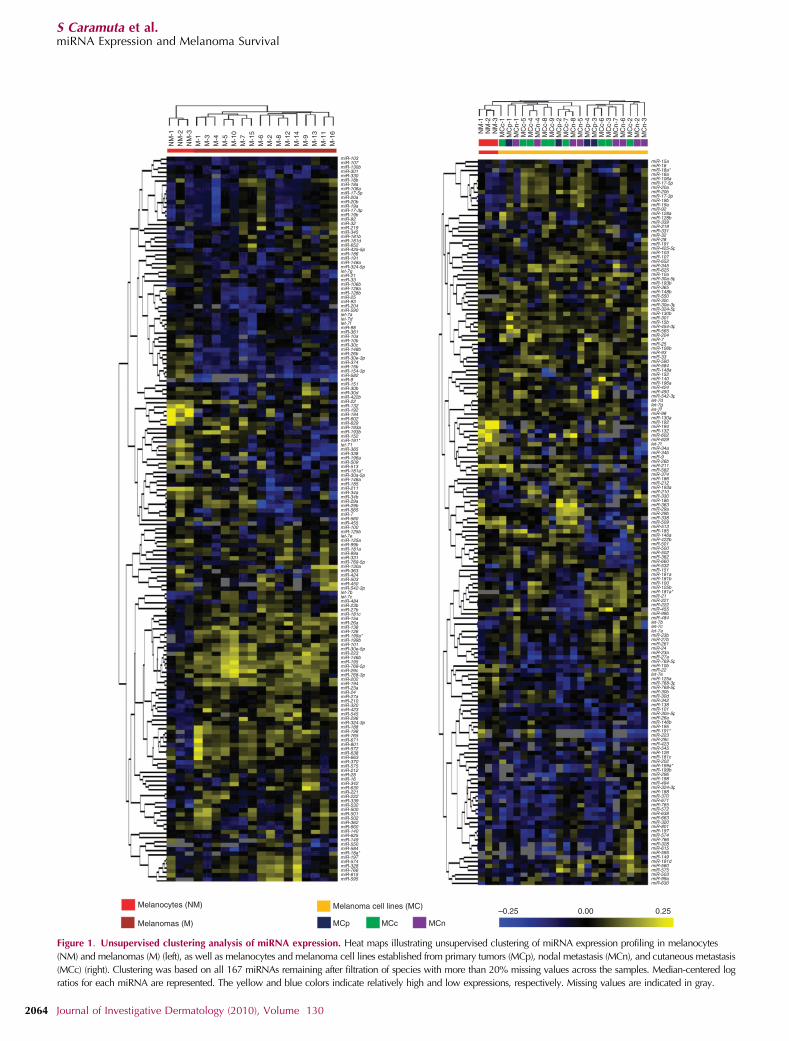
We performed unsupervised hierarchical clustering of the167 filtered miRNAs among the melanomas, melanoma celllines, and melanocytes. The analysis grouped the samplesinto subgroups based on similar miRNA expression patternswithout previous knowledge of sample identity. Bothmelanomas and melanoma cell lines were clearly groupedinto separate clusters from melanocytes (Figure 1). We alsonoted several distinct subgroups among the melanomas andmelanoma cell lines, suggesting distinct clinical or biologicalcharacteristics of these samples. By hierarchical clustering ofthe same set of filtered miRNAs among all the samples, wefound that the cell lines were grouped separately from themelanomas (see online Supplementary Figure S1). Althoughthe melanoma cell lines displayed substantial differences inmiRNA expression, some similarities were found between themelanomas and melanoma cell lines.
Deregulated miRNAs in melanomas versus melanocytes
To identify the most significant differentially expressedmiRNAs between melanomas and normal melanocytes, weperformed SAM (Significance Analysis of Microarray) analy-sis, which resulted in 32 differentially expressed miRNAswith a q-value (a measure of the false discovery rate (FDR)) of0% (see online Supplementary Table S2). Thirteen of theselected miRNAs were overexpressed, and 19 were under-expressed in melanomas (see online Supplementary TableS2). Many of these differentially expressed miRNAs wereco-expressed, as illustrated by their close location betweeneach other in the hierarchical clustering (Figure 1).
To further determine the minimal number of miRNAs thatcan distinguish melanomas from melanocytes, we applied thePrediction Analysis of Microarray (PAM) method on the 167filtered miRNAs, instead of the SAM-selected miRNAs, toavoid an over-fitting bias induced after selection, aspreviously described (Simon et al., 2003). The analysisrevealed that the expression signature of a minimal numberof 10 miRNAs could best distinguish the two groups, resultingin a prediction accuracy of 100% as determined by 10-foldcross validation (see online Supplementary Table S3). All
miRNAs in the PAM classifier were also detected by SAM,including underexpression of miR-192, let-7i, miR-194, miR-211, miR-602, miR-582, miR-454-3p, and miR-132, andoverexpression of miR-126 and miR-801.
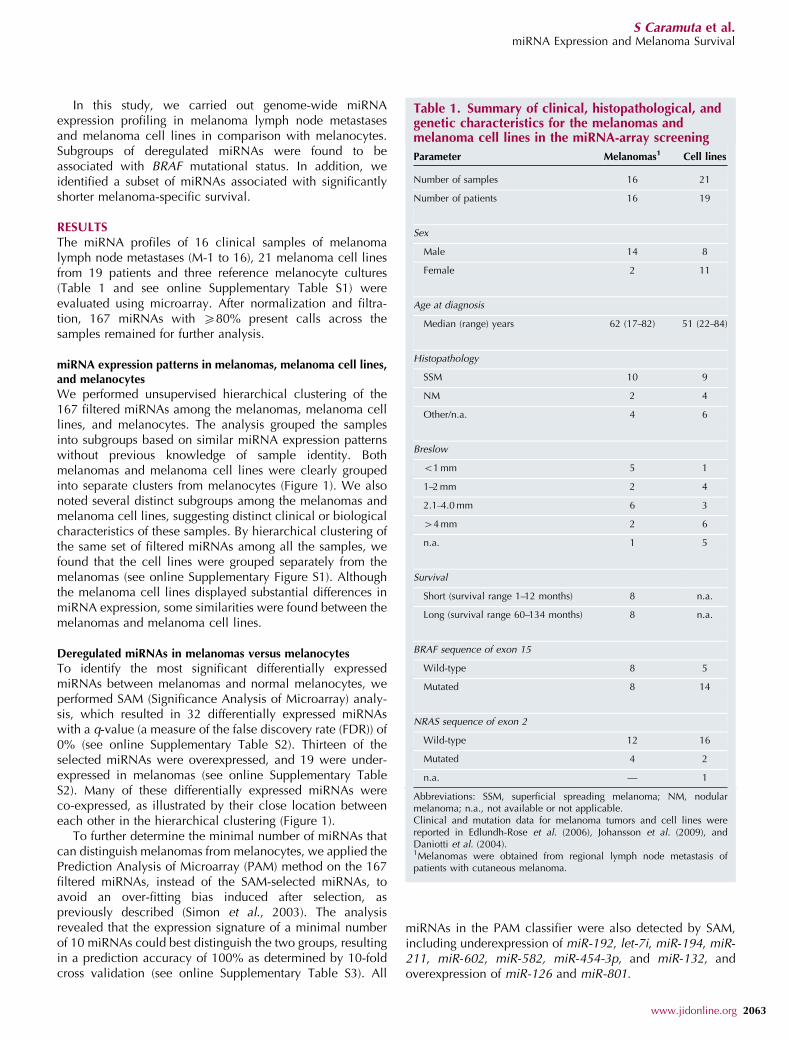
Table 1. Summary of clinical, histopathological, andgenetic characteristics for the melanomas andmelanoma cell lines in the miRNA-array screening
Parameter Melanomas1 Cell lines
Number of samples 16 21
Number of patients 16 19
Sex
Male 14 8
Female 2 11
Age at diagnosis
Median (range) years 62 (17–82) 51 (22–84)
Histopathology
SSM 10 9
NM 2 4
Other/n.a. 4 6
Breslow
o1 mm 5 1
1–2 mm 2 4
2.1–4.0 mm 6 3
44 mm 2 6
n.a. 1 5
Survival
Short (survival range 1–12 months) 8 n.a.
Long (survival range 60–134 months) 8 n.a.
BRAF sequence of exon 15
Wild-type 8 5
Mutated 8 14
NRAS sequence of exon 2
Wild-type 12 16
Mutated 4 2
n.a. — 1
Abbreviations: SSM, superficial spreading melanoma; NM, nodularmelanoma; n.a., not available or not applicable.Clinical and mutation data for melanoma tumors and cell lines werereported in Edlundh-Rose et al. (2006), Johansson et al. (2009), andDaniotti et al. (2004).1Melanomas were obtained from regional lymph node metastasis ofpatients with cutaneous melanoma.
www.jidonline.org 2063
S Caramuta et al.miRNA Expression and Melanoma Survival
NM
-1N
M-2
NM
-3M
Cc-
1M
Cp-
1M
Cn-
1M
Cc-
5M
Cc-
4M
Cn-
4M
Cc-
8M
Cc-
9M
Cp-
2M
Cc-
7M
Cn-
8M
Cn-
5M
Cp-
4M
Cp-
3M
Cc-
6M
Cc-
3M
Cn-
7M
Cn-
6M
Cc-
2M
Cn-
2M
Cn-
3
NM
-1N
M-2
NM
-3M
-1M
-3M
-4
M-2
M-8
M-9
M-1
2M
-14
M-1
3M
-11
M-1
6
M-5
M-7
M-6
M-1
0
M-1
5
Melanocytes (NM) Melanoma cell lines (MC)
MCp MCc MCn
–0.25 0.00 0.25
Melanomas (M)
Figure 1. Unsupervised clustering analysis of miRNA expression. Heat maps illustrating unsupervised clustering of miRNA expression profiling in melanocytes
(NM) and melanomas (M) (left), as well as melanocytes and melanoma cell lines established from primary tumors (MCp), nodal metastasis (MCn), and cutaneous metastasis
(MCc) (right). Clustering was based on all 167 miRNAs remaining after filtration of species with more than 20% missing values across the samples. Median-centered log
ratios for each miRNA are represented. The yellow and blue colors indicate relatively high and low expressions, respectively. Missing values are indicated in gray.
2064 Journal of Investigative Dermatology (2010), Volume 130
S Caramuta et al.miRNA Expression and Melanoma Survival
Association between miRNA profiles and clinicalcharacteristics of melanoma cases
Using SAM, we analyzed miRNA expression data in relationto clinical characteristics of melanoma cases. We did notobserve any differentially expressed miRNAs to be signifi-cantly associated with age at diagnosis, gender, or Breslowtumor thickness of the primary tumors (data not shown).
miRNA profiles in relation to BRAF and NRAS mutations inmelanomas
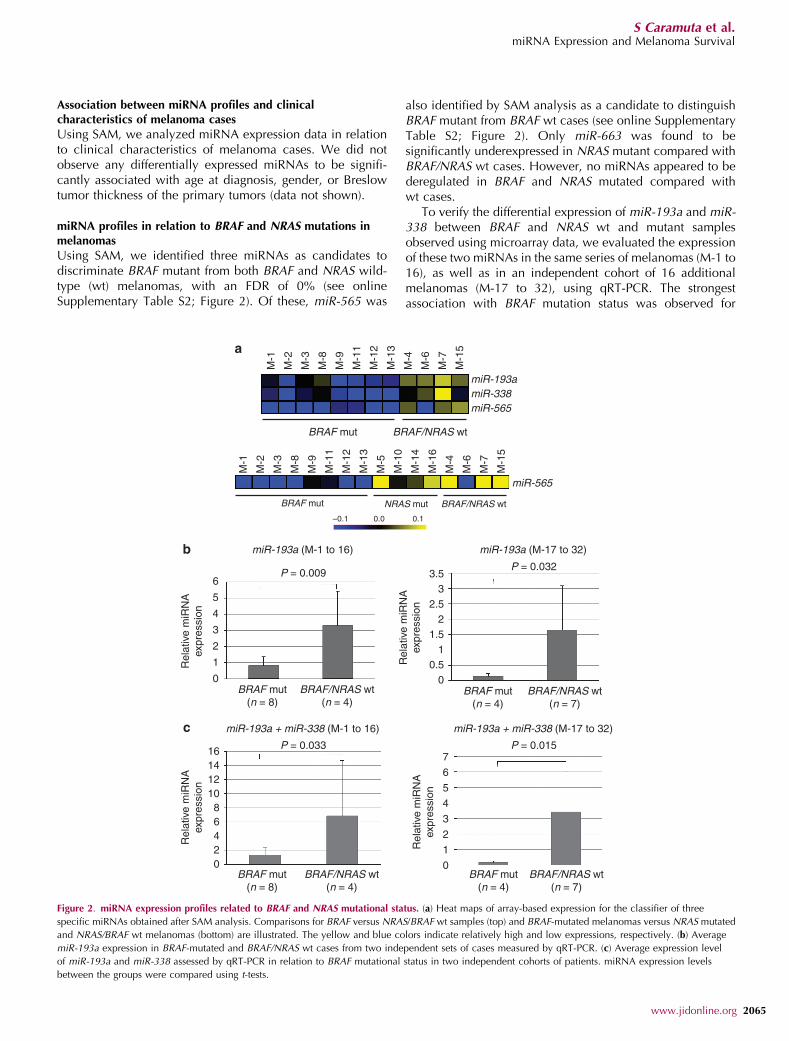
Using SAM, we identified three miRNAs as candidates todiscriminate BRAF mutant from both BRAF and NRAS wild-type (wt) melanomas, with an FDR of 0% (see onlineSupplementary Table S2; Figure 2). Of these, miR-565 was
also identified by SAM analysis as a candidate to distinguishBRAF mutant from BRAF wt cases (see online SupplementaryTable S2; Figure 2). Only miR-663 was found to besignificantly underexpressed in NRAS mutant compared withBRAF/NRAS wt cases. However, no miRNAs appeared to bederegulated in BRAF and NRAS mutated compared withwt cases.
To verify the differential expression of miR-193a and miR-338 between BRAF and NRAS wt and mutant samplesobserved using microarray data, we evaluated the expressionof these two miRNAs in the same series of melanomas (M-1 to16), as well as in an independent cohort of 16 additionalmelanomas (M-17 to 32), using qRT-PCR. The strongestassociation with BRAF mutation status was observed for
–0.1 0.0 0.1
M-1
M-2
M-3
M-8
M-9
M-1
1
M-1
2
M-1
3
M-5
M-1
0
M-1
4
M-1
6
M-4
M-6
M-7
M-1
5
miR-193amiR-338miR-565
miR-565
miR-193a (M-1 to 16)
miR-193a + miR-338 (M-1 to 16) miR-193a + miR-338 (M-17 to 32)
miR-193a (M-17 to 32)
P = 0.009
P = 0.033 P = 0.015
Rel
ativ
e m
iRN
Aex
pres
sion
Rel
ativ
e m
iRN
Aex
pres
sion
Rel
ativ
e m
iRN
Aex
pres
sion
Rel
ativ
e m
iRN
Aex
pres
sion
6
5
4
3
2
1
0
6
7
5
4
3
2
1
0
1416
121086420
3.53
2.52
1.51
0.50
BRAF/NRAS wt
BRAF/NRAS wt(n = 4)
BRAF/NRAS wt(n = 7)
BRAF/NRAS wt
BRAF mut
NRAS mutBRAF mut
BRAF mut(n = 8)
BRAF/NRAS wt(n = 4)
BRAF mut(n = 8)
BRAF mut(n = 4)
BRAF/NRAS wt(n = 7)
BRAF mut(n = 4)
M-1
M-2
M-3
M-8
M-9
M-1
1
M-1
2
M-1
3
M-4
M-6
M-7
M-1
5
P = 0.032
Figure 2. miRNA expression profiles related to BRAF and NRAS mutational status. (a) Heat maps of array-based expression for the classifier of three
specific miRNAs obtained after SAM analysis. Comparisons for BRAF versus NRAS/BRAF wt samples (top) and BRAF-mutated melanomas versus NRAS mutated
and NRAS/BRAF wt melanomas (bottom) are illustrated. The yellow and blue colors indicate relatively high and low expressions, respectively. (b) Average
miR-193a expression in BRAF-mutated and BRAF/NRAS wt cases from two independent sets of cases measured by qRT-PCR. (c) Average expression level
of miR-193a and miR-338 assessed by qRT-PCR in relation to BRAF mutational status in two independent cohorts of patients. miRNA expression levels
between the groups were compared using t-tests.
www.jidonline.org 2065
S Caramuta et al.miRNA Expression and Melanoma Survival
miR-193a, which showed significantly reduced levels in bothmelanoma series (M-1 to -16, P¼0.009; M-17 to 32,P¼0.032; t-test) (Figure 2). miR-338 alone was not sufficientto distinguish BRAF mutant from BRAF/NRAS wt cases (M-1to 16, P¼ 0.376; M-17 to 32, P¼ 0.169; t-test), but could incombination with miR-193a accurately discriminate betweenthe two classes of melanomas (Po0.05 for both series;Figure 2).
miRNA signature of survival in melanomas
We then determined whether the miRNA expressionsignature could be used to predict melanoma-specificsurvival. Among the 16 melanomas analyzed in the micro-array experiments, eight patients had a short survivalmeasured from diagnosis of regional lymph node metastases(range 1–12 months) and the remaining had a good prognosisand long survival (range 60–134 months) after diagnosis.For survival analysis, we considered patient M-4 as‘‘censored’’ because of disease-unrelated death 7 monthsafter diagnosis.
Performing SAM analysis, we identified six candidatemiRNAs that could predict disease outcome with an FDR of0% and a SAM survival score 41.5 (a modified score statisticfor a univariate Cox proportional hazards model). Melanomasfrom patients with short survival showed underexpression ofmiR-191, whereas miR-193b, miR-365, miR-338, let-7i, andmiR-193a were overexpressed (see online SupplementaryTable S4). This association was further assessed by Kaplan–-Meier survival curves and log-rank analysis. Low expressionof miR-191 was associated with short survival (Po0.001, log-rank test) as well as high expression of miR-193b (P¼0.026),let-7i (P¼ 0.004), and miR-365 (P¼0.043). On the otherhand, miR-193a (P¼0.109) and miR-338 (P¼0.06) did notreach statistical significance (see online SupplementaryFigure S2).
To verify microarray data, we measured the expression offour miRNAs using qRT-PCR. Three of these showed asignificant correlation between microarray and qRT-PCR-based expression values as assessed by Pearson correlationanalysis, that is, miR-193b (Cor ¼ 0.8625; Po0.0001), let-7i(Cor ¼ 0.4822, P¼ 0.0252), and miR-365 (Cor ¼0.4353,P¼0.041), whereas miR-191 (Cor ¼ 0.2896, P¼ 0.1612) didnot show significant correlation. However, Kaplan–Meiersurvival curves and log-rank analysis showed a significantassociation with survival for miR-191, in concordance witharray-based results, whereas let-7i and miR-365 are notstatistically significant.
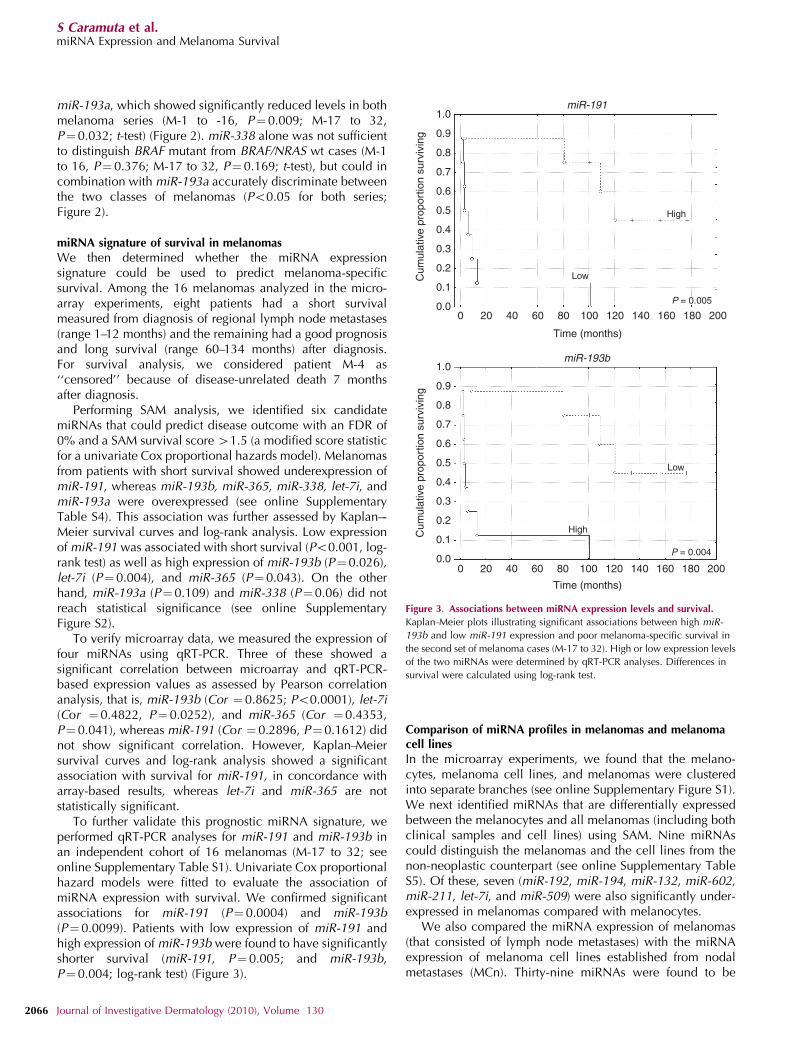
To further validate this prognostic miRNA signature, weperformed qRT-PCR analyses for miR-191 and miR-193b inan independent cohort of 16 melanomas (M-17 to 32; seeonline Supplementary Table S1). Univariate Cox proportionalhazard models were fitted to evaluate the association ofmiRNA expression with survival. We confirmed significantassociations for miR-191 (P¼0.0004) and miR-193b(P¼0.0099). Patients with low expression of miR-191 andhigh expression of miR-193b were found to have significantlyshorter survival (miR-191, P¼ 0.005; and miR-193b,P¼0.004; log-rank test) (Figure 3).
Comparison of miRNA profiles in melanomas and melanomacell linesIn the microarray experiments, we found that the melano-cytes, melanoma cell lines, and melanomas were clusteredinto separate branches (see online Supplementary Figure S1).We next identified miRNAs that are differentially expressedbetween the melanocytes and all melanomas (including bothclinical samples and cell lines) using SAM. Nine miRNAscould distinguish the melanomas and the cell lines from thenon-neoplastic counterpart (see online Supplementary TableS5). Of these, seven (miR-192, miR-194, miR-132, miR-602,miR-211, let-7i, and miR-509) were also significantly under-expressed in melanomas compared with melanocytes.
We also compared the miRNA expression of melanomas(that consisted of lymph node metastases) with the miRNAexpression of melanoma cell lines established from nodalmetastases (MCn). Thirty-nine miRNAs were found to be
miR-191
miR-193b
Cum
ulat
ive
prop
ortio
n su
rviv
ing
Cum
ulat
ive
prop
ortio
n su
rviv
ing
1.0
0.9
0.8
0.7
0.6
0.5
0.4
0.3
0.2
0.1
0.0
1.0
0.9
0.8
0.7
0.6
0.5
0.4
0.3
0.2
0.1
0.0
Time (months)
Low
Low
High
High
P = 0.005
P = 0.004
0 20 40 60 80 100 120 140 160 180 200
Time (months)
0 20 40 60 80 100 120 140 160 180 200
Figure 3. Associations between miRNA expression levels and survival.
Kaplan–Meier plots illustrating significant associations between high miR-
193b and low miR-191 expression and poor melanoma-specific survival in
the second set of melanoma cases (M-17 to 32). High or low expression levels
of the two miRNAs were determined by qRT-PCR analyses. Differences in
survival were calculated using log-rank test.
2066 Journal of Investigative Dermatology (2010), Volume 130
S Caramuta et al.miRNA Expression and Melanoma Survival
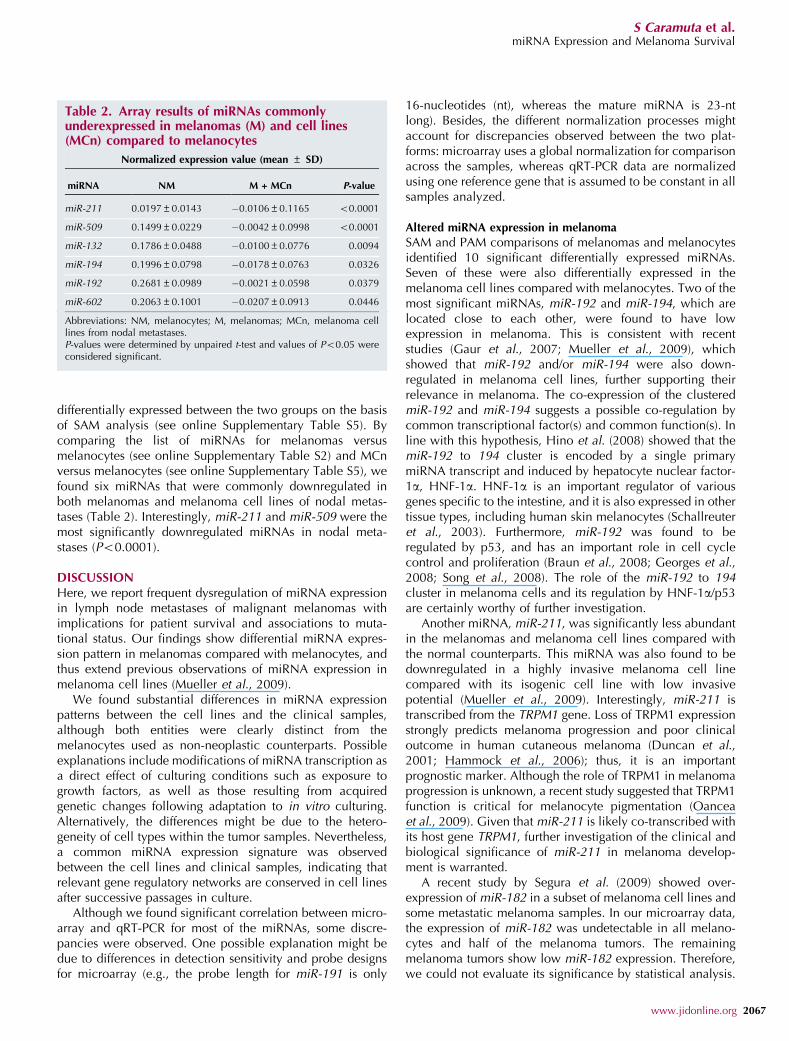
differentially expressed between the two groups on the basisof SAM analysis (see online Supplementary Table S5). Bycomparing the list of miRNAs for melanomas versusmelanocytes (see online Supplementary Table S2) and MCnversus melanocytes (see online Supplementary Table S5), wefound six miRNAs that were commonly downregulated inboth melanomas and melanoma cell lines of nodal metas-tases (Table 2). Interestingly, miR-211 and miR-509 were themost significantly downregulated miRNAs in nodal meta-stases (Po0.0001).
DISCUSSIONHere, we report frequent dysregulation of miRNA expressionin lymph node metastases of malignant melanomas withimplications for patient survival and associations to muta-tional status. Our findings show differential miRNA expres-sion pattern in melanomas compared with melanocytes, andthus extend previous observations of miRNA expression inmelanoma cell lines (Mueller et al., 2009).
We found substantial differences in miRNA expressionpatterns between the cell lines and the clinical samples,although both entities were clearly distinct from themelanocytes used as non-neoplastic counterparts. Possibleexplanations include modifications of miRNA transcription asa direct effect of culturing conditions such as exposure togrowth factors, as well as those resulting from acquiredgenetic changes following adaptation to in vitro culturing.Alternatively, the differences might be due to the hetero-geneity of cell types within the tumor samples. Nevertheless,a common miRNA expression signature was observedbetween the cell lines and clinical samples, indicating thatrelevant gene regulatory networks are conserved in cell linesafter successive passages in culture.
Although we found significant correlation between micro-array and qRT-PCR for most of the miRNAs, some discre-pancies were observed. One possible explanation might bedue to differences in detection sensitivity and probe designsfor microarray (e.g., the probe length for miR-191 is only
16-nucleotides (nt), whereas the mature miRNA is 23-ntlong). Besides, the different normalization processes mightaccount for discrepancies observed between the two plat-forms: microarray uses a global normalization for comparisonacross the samples, whereas qRT-PCR data are normalizedusing one reference gene that is assumed to be constant in allsamples analyzed.
Altered miRNA expression in melanoma
SAM and PAM comparisons of melanomas and melanocytesidentified 10 significant differentially expressed miRNAs.Seven of these were also differentially expressed in themelanoma cell lines compared with melanocytes. Two of themost significant miRNAs, miR-192 and miR-194, which arelocated close to each other, were found to have lowexpression in melanoma. This is consistent with recentstudies (Gaur et al., 2007; Mueller et al., 2009), whichshowed that miR-192 and/or miR-194 were also down-regulated in melanoma cell lines, further supporting theirrelevance in melanoma. The co-expression of the clusteredmiR-192 and miR-194 suggests a possible co-regulation bycommon transcriptional factor(s) and common function(s). Inline with this hypothesis, Hino et al. (2008) showed that themiR-192 to 194 cluster is encoded by a single primarymiRNA transcript and induced by hepatocyte nuclear factor-1a, HNF-1a. HNF-1a is an important regulator of variousgenes specific to the intestine, and it is also expressed in othertissue types, including human skin melanocytes (Schallreuteret al., 2003). Furthermore, miR-192 was found to beregulated by p53, and has an important role in cell cyclecontrol and proliferation (Braun et al., 2008; Georges et al.,2008; Song et al., 2008). The role of the miR-192 to 194cluster in melanoma cells and its regulation by HNF-1a/p53are certainly worthy of further investigation.
Another miRNA, miR-211, was significantly less abundantin the melanomas and melanoma cell lines compared withthe normal counterparts. This miRNA was also found to bedownregulated in a highly invasive melanoma cell linecompared with its isogenic cell line with low invasivepotential (Mueller et al., 2009). Interestingly, miR-211 istranscribed from the TRPM1 gene. Loss of TRPM1 expressionstrongly predicts melanoma progression and poor clinicaloutcome in human cutaneous melanoma (Duncan et al.,2001; Hammock et al., 2006); thus, it is an importantprognostic marker. Although the role of TRPM1 in melanomaprogression is unknown, a recent study suggested that TRPM1function is critical for melanocyte pigmentation (Oanceaet al., 2009). Given that miR-211 is likely co-transcribed withits host gene TRPM1, further investigation of the clinical andbiological significance of miR-211 in melanoma develop-ment is warranted.
A recent study by Segura et al. (2009) showed over-expression of miR-182 in a subset of melanoma cell lines andsome metastatic melanoma samples. In our microarray data,the expression of miR-182 was undetectable in all melano-cytes and half of the melanoma tumors. The remainingmelanoma tumors show low miR-182 expression. Therefore,we could not evaluate its significance by statistical analysis.
Table 2. Array results of miRNAs commonlyunderexpressed in melanomas (M) and cell lines(MCn) compared to melanocytes
Normalized expression value (mean ± SD)
miRNA NM M + MCn P-value
miR-211 0.0197±0.0143 �0.0106±0.1165 o0.0001
miR-509 0.1499±0.0229 �0.0042±0.0998 o0.0001
miR-132 0.1786±0.0488 �0.0100±0.0776 0.0094
miR-194 0.1996±0.0798 �0.0178±0.0763 0.0326
miR-192 0.2681±0.0989 �0.0021±0.0598 0.0379
miR-602 0.2063±0.1001 �0.0207±0.0913 0.0446
Abbreviations: NM, melanocytes; M, melanomas; MCn, melanoma celllines from nodal metastases.P-values were determined by unpaired t-test and values of Po0.05 wereconsidered significant.
www.jidonline.org 2067
S Caramuta et al.miRNA Expression and Melanoma Survival
The authors also showed that ectopic expression of miR-182promotes lung metastasis in a mouse model, suggesting apossible role for miR-182 in distant metastasis (e.g., in lung),which may not have a significant role in regional lymph nodemetastasis.
miRNA signature of poor survival in melanoma
We showed that high expression of miR-193b and lowexpression of miR-191 in melanomas were significantlyassociated with poor survival. miR-193b is also highlyexpressed in head and neck squamous cell carcinoma(Avissar et al., 2009), and has been shown to be associatedwith high risk of metastatic disease in uveal melanoma(Worley et al., 2008). Besides its expression association,virtually nothing is known about the function of miR-193b.Computational methods (miRanda, TargetScan 5.1, andPicTar_vertebrate) predict hundreds of miR-193b targetmRNAs (Supplementary Table S6). Among the predictedtargets, PTEN, an important tumor suppressor that negativelyregulates the Akt-signaling pathway, has been implicatedin melanoma tumorigenesis and progression. Importantly,altered PTEN expression is common in primary melanomaand associated with metastatic disease (Stahl et al., 2003;Mikhail et al., 2005; Dankort et al., 2009). However, thefunctional roles of miR-193b and its target(s) remain to befurther investigated.
We found reduced levels of miR-191 to be associated withshort survival in melanoma, which is in contrast to a previousreport showing that high expression of miR-191 wasassociated with poor survival in acute myeloid leukemiapatients (Garzon et al., 2008). Although high miR-191expression is found in several cancer types, including thecolon, lung, pancreas, prostate, and stomach (Volinia et al.,2006; Yanaihara et al., 2006), it remains possible that theactivity of specific miRNA varies in different tissues or celltypes. For example, inhibition of miR-191 caused increasedcell proliferation in HeLa cervical cancer cells, but decreasedproliferation in A549 lung cancer cells (Cheng et al., 2005).Furthermore, Mueller et al. (2009) found high expression ofmiR-191 in a melanoma cell line stably transfected withantisense targeting of SNAIL compared with its parental cellline. Snail, a member of the Snail family of transcriptionfactors, has been shown to be involved in epithelial–me-senchymal transition (a hallmark of invasiveness) (Batlleet al., 2000; Cano et al., 2000). The Snail knockdown mutantlost its invasive propensity because of loss of repression of E-cadherin expression by Snail (Kuphal et al., 2005). The highexpression of miR-191 in the non-invasive melanoma cellline (i.e., Snail knockdown) corresponds well with a goodprognosis and long survival in melanoma patients. Computa-tional analysis revealed a number of predicted targets formiR-191 (Supplementary Table S6), which have been shownto be involved in melanoma progression, e.g., FZD5(Bachmann et al., 2005) and BDNF (Innominato et al., 2001).
miRNA expression associated with BRAF/NRAS mutation
We found two significant associations when comparingNRAS/BRAF mutant tumors with those that were wild type
for both genes: (i) low expression of miR-193a, miR-338, andmiR-565 was associated with cases carrying a BRAF missensemutation at the commonly involved residue V600; and (ii)reduced expression of miR-663 was associated with NRAS-mutated cases. In contrast, there were no significantdifferentially expressed miRNAs between BRAF versus NRASmutated melanomas. Furthermore, we did not find anymiRNAs that were commonly deregulated in BRAF/NRAS-mutated melanomas compared with BRAF/NRAS wild-typecases. This observation suggests that BRAF and NRAS mightregulate distinct signaling pathways, in addition to thecommon MAPK-signaling pathway. The finding is consistentwith global mRNA expression array studies (Daniotti et al.,2004; Pavey et al., 2004; Giordano et al., 2005). Together,the data would be in agreement with a model where BRAFand NRAS contribute to melanoma development throughpartly overlapping and partly distinct pathways (Dumaz et al.,2006; Eskandarpour et al., 2009; Huang and Marais, 2009;Jaiswal et al., 2009; Old et al., 2009).
miR-193a was observed as the strongest discriminatorbetween BRAF-mutated and wild-type melanomas. Interest-ingly, this miRNA was also reported as downregulated inBRAFV600E-mutated thyroid cancer cell lines compared withnormal thyroid tissue (Cahill et al., 2007). miR-193a is theonly common deregulated miRNA associated withBRAF mutation in both papillary thyroid cancer (Cahillet al., 2007) and our melanoma series, suggesting that miR-193a may have an important and common role in BRAF-associated events in MAPK and/or other signaling pathways.It is noted that some of the predicted targets by computationalanalysis are associated with MAPK pathway (SupplementaryTable S7). Elucidation of the targets of miR-193a maylead to a further understanding of the pathological role ofBRAF mutation, and development of novel therapeutictargets.
Prospect for clinical utility of miRNAs as biomarkers
Our study shows frequent dysregulation of miRNAs inmelanomas with identification of a classifier for poorsurvival. On confirmation of the prognostic value inindependent melanoma series, miRNA detection could bedeveloped into complementary diagnostic tools in clinicalpathology. In this context, detection of miRNA expressionwould have several advantages compared with e.g., detec-tion of coding gene transcripts. Mature miRNA species arecomparatively stable and preserved in paraffin-embeddedsamples commonly used in clinical routine. In addition,analyses of miRNA species in individual cells may beapplied on paraffin-embedded melanoma tissues that arefrequently heterogeneous with related problems of tumor cellrepresentation.
MATERIALS AND METHODSMelanoma cell lines and melanocytesGeneration, characterization, and culturing conditions for the 21
melanoma cell lines included in the study have been previously
reported in detail (Daniotti et al., 2004). The cell lines were derived
from primary melanomas (MCp-1 to 4), lymph node metastases
2068 Journal of Investigative Dermatology (2010), Volume 130
S Caramuta et al.miRNA Expression and Melanoma Survival
(MCn-1 to 8), or cutaneous metastases (MCc-1 to 9) of 19 patients
with cutaneous malignant melanoma. Three lines (MCp-2, MCn-8,
and MCc-7) originated from the same patient. Melanoma cell lines
had been propagated for 5–51 passages (median ¼ 18). Information
of originating tumor phenotypes and genetic status for BRAF and
NRAS, as previously determined (Daniotti et al., 2004), is given in
Supplementary Table S1. Human melanocyte cultures (NM-1 to 3)
(PromoCell, Heidelberg, Germany) from three different individuals
were included as non-neoplastic provenience. Ethics approval was
obtained for the use of all samples.
MelanomasA total of 32 samples from fresh frozen regional lymph node
metastases of patients with cutaneous melanoma were studied (M-1
to 32; Supplementary Table S1). The study was approved by the
ethics committee of Karolinska University Hospital and conducted in
adherence to the Declaration of Helsinki protocols. All tumors were
obtained with informed consent of the patients and were all present
and collected at the time of initial diagnosis. All patients had
regional lymph node metastases (AJCC stage III disease) and
represented cases with poor or good prognosis in terms of
melanoma-specific survival, and all tumors have been characterized
for genetic status of BRAF exon 15 and NRAS exon 2 as previously
reported for the majority of cases (Edlundh-Rose et al., 2006;
Johansson et al., 2009).
RNA extraction
Total RNA was extracted using mirVana miRNA Isolation Kit
(Applied Biosystems/Ambion, Austin, TX), and RNA concentrations
were determined with a NanoDrop ND-1000 spectrophotometer
(NanoDrop Technologies, Wilmington, DE).
miRNA microarray experimentation and analyses
miRNA expression profiling was performed using Human Agilent’s
miRNA Microarray system (Agilent, Santa Clara, CA) with probe sets
for 470 human miRNAs (miRBase release 9.1). In brief, 120 ng of
total RNA were fluorescence-labeled with Cyanine 3-pCp, and
hybridized onto the arrays for 18–20 h at 55 1C. Slides were scanned
in an Agilent microarray scanner G2565BA and the images obtained
were processed with Feature Extraction Software 9.5.3.1 (Agilent).
Intensity values were processed using Cluster 3.0 software whereby
data were normalized, log transformed, and median centered. Only
normalized miRNAs with less than 20% missing values across the
samples were included in the further analysis. The microarray data
have been deposited at NCBI Gene Expression Omnibus (GEO
accession number, GSE19387).
Hierarchical clustering (average linkage with uncentered correla-
tion) of the samples and miRNAs was performed using Cluster 3.0
software and visualized with Treeview v1.60. Significance Analysis of
Microarrays (SAM) (http://www-stat.stanford.edu/Btibs/SAM/) was
applied to determine the association of each miRNA with sample
groups, melanoma-specific survival, as well as clinical and genetic
parameters including age at diagnosis, gender, Breslow tumor
thickness, and BRAF/NRAS mutational status. A total of 1000
permutations were performed to estimate false discovery rates for
the resulting score statistics. Prediction Analysis of Microarrays (PAM)
(http://www-stat.stanford.edu/Btibs/PAM/) was used to construct a
classifier to predict sample groups based on miRNA expression.
Quantitative Reverse Transcription-PCR (qRT-PCR)Expression of selected mature miRNAs was assessed by
qRT-PCR. cDNA was prepared from total RNA using Taqman
MicroRNA Reverse Transcription Kit (Applied Biosystems,
Foster City, CA). Predesigned TaqMan MicroRNA Assays for miR-
191 (ID 002299), miR-193b (ID 002367), let-7i (ID 002221), miR-
338-3p (ID 002252), miR-365 (ID 001020), and miR-193a-3p (ID
002250) were purchased from Applied Biosystems and
qRT-PCR was performed using an Applied Biosystems 7500 Fast
Real-Time PCR System. All reactions were run in triplicate
and normalized to the expression of RNU6B (ID 001093).
Relative expressions were determined with the DCT method and
reported as 2�DCT.
Statistical analysis of individual miRNAsMicroarray and qRT-PCR results were compared using Pearson’s
correlation: the microarray and qRT-PCR measurements were
computed, and P-values were estimated by permuting the samples.
Unpaired t-test was used to compare miRNA expression in different
groups of samples. SAM survival analysis was used to determine
association of miRNAs with survival. P-values were obtained for the
Cox score statistics using the w2 distribution. At retrospective follow-
up, survival information was collected for the 32 cases of melanoma
tumors (see online Supplementary Table S1). Survival was defined as
the time from the first diagnosis of regional lymph node metastasis
until the date of death or last follow-up; melanoma-specific survival
was the outcome of interest, and therefore cases that died of a cause
other than disease were treated as censored. Fourteen cases died of
the disease within 1–13 months (poor prognosis), two cases died of
unknown or melanoma-unrelated cause of death, and 16 cases
survived for 60 months or more (good prognosis). Tumor samples
were classified into different groups with high or low expression of
each miRNA, according to the median level of expression.
Kaplan–Meier plots were used to graphically display the association
of miRNAs with the outcome. Survival curves for each group were
compared using the log-rank test. Univariate Cox proportional
hazards models were used to evaluate the association of miRNA
expression with survival. All P-values obtained in this study
were 2-tailed. P-values o0.05 were considered significant.
Statistical calculations were performed using Statistica 8.0
(StatSoft, Tulsa).
CONFLICT OF INTERESTThe authors state no conflict of interest.
ACKNOWLEDGMENTSThis work was supported in part by the Swedish Research Council, AkeWiberg Foundation, Ake Olsson’s Foundation for Haematological Research(W-O. Lui), Goran Gustafsson Foundation for Research in Natural Sciencesand Medicine (C. Larsson), Swedish Cancer Society, Cancer Research Fundsof Radiumhemmet, and Stockholm County Council. S. Caramuta is a recipientof KID funds from Karolinska Institutet. We thank the members of the MedicalGenetics research group for their help and suggestions; Davide Valentini,Stefano Calza, and Yudi Pawitan for statistical advice; and Diana Linden forvaluable assistance in collecting clinical information.
SUPPLEMENTARY MATERIAL
Supplementary material is linked to the online version of the paper at http://www.nature.com/jid
www.jidonline.org 2069
S Caramuta et al.miRNA Expression and Melanoma Survival
REFERENCES
Ambros V (2001) microRNAs: tiny regulators with great potential. Cell107:823–6
Avissar M, Christensen BC, Kelsey KT et al. (2009) MicroRNA expression ratiois predictive of head and neck squamous cell carcinoma. Clin CancerRes 15:2850–5
Bachmann IM, Straume O, Puntervoll HE et al. (2005) Importance ofP-cadherin, beta-catenin, and Wnt5a/frizzled for progression of mela-nocytic tumors and prognosis in cutaneous melanoma. Clin Cancer Res11:8606–14
Bartel DP (2004) MicroRNAs: genomics, biogenesis, mechanism, andfunction. Cell 116:281–97
Batlle E, Sancho E, Franci C et al. (2000) The transcription factor snail is arepressor of E-cadherin gene expression in epithelial tumour cells. NatCell Biol 2:84–9
Braun CJ, Zhang X, Savelyeva I et al. (2008) p53-Responsive micrornas 192and 215 are capable of inducing cell cycle arrest. Cancer Res68:10094–104
Cahill S, Smyth P, Denning K et al. (2007) Effect of BRAFV600E mutation ontranscription and post-transcriptional regulation in a papillary thyroidcarcinoma model. Mol Cancer 6:21
Cano A, Perez-Moreno MA, Rodrigo I et al. (2000) The transcription factorsnail controls epithelial-mesenchymal transitions by repressing E-cadherin expression. Nat Cell Biol 2:76–83
Cheng AM, Byrom MW, Shelton J et al. (2005) Antisense inhibition of humanmiRNAs and indications for an involvement of miRNA in cell growth andapoptosis. Nucleic Acids Res 33:1290–7
Chin L, Tam A, Pomerantz J et al. (1999) Essential role for oncogenic Ras intumour maintenance. Nature 400:468–72
Curtin JA, Fridlyand J, Kageshita T et al. (2005) Distinct sets of geneticalterations in melanoma. N Engl J Med 353:2135–47
Daniotti M, Oggionni M, Ranzani T et al. (2004) BRAF alterations areassociated with complex mutational profiles in malignant melanoma.Oncogene 23:5968–77
Dankort D, Curley DP, Cartlidge RA et al. (2009) Braf(V600E) cooperates withPten loss to induce metastatic melanoma. Nat Genet 41:544–52
Davies H, Bignell GR, Cox C et al. (2002) Mutations of the BRAF gene inhuman cancer. Nature 417:949–54
Dumaz N, Hayward R, Martin J et al. (2006) In melanoma, RAS mutations areaccompanied by switching signaling from BRAF to CRAF and disruptedcyclic AMP signaling. Cancer Res 66:9483–91
Duncan LM, Deeds J, Cronin FE et al. (2001) Melastatin expression andprognosis in cutaneous malignant melanoma. J Clin Oncol 19:568–76
Edlundh-Rose E, Egyhazi S, Omholt K et al. (2006) NRAS and BRAF mutationsin melanoma tumours in relation to clinical characteristics: a study basedon mutation screening by pyrosequencing. Melanoma Res 16:471–8
Eskandarpour M, Huang F, Reeves KA et al. (2009) Oncogenic NRAS hasmultiple effects on the malignant phenotype of human melanoma cellscultured in vitro. Int J Cancer 124:16–26
Garbe C, Eigentler TK (2007) Diagnosis and treatment of cutaneousmelanoma: state of the art 2006. Melanoma Res 17:117–27
Garzon R, Volinia S, Liu CG et al. (2008) MicroRNA signatures associatedwith cytogenetics and prognosis in acute myeloid leukemia. Blood111:3183–9
Gaur A, Jewell DA, Liang Y et al. (2007) Characterization of microRNAexpression levels and their biological correlates in human cancer celllines. Cancer Res 67:2456–68
Georges SA, Biery MC, Kim SY et al. (2008) Coordinated regulation of cellcycle transcripts by p53-Inducible microRNAs, miR-192 and miR-215.Cancer Res 68:10105–12
Giordano TJ, Kuick R, Thomas DG et al. (2005) Molecular classification ofpapillary thyroid carcinoma: distinct BRAF, RAS, and RET/PTC mutation-specific gene expression profiles discovered by DNA microarrayanalysis. Oncogene 24:6646–56
Hammock L, Cohen C, Carlson G et al. (2006) Chromogenic in situhybridization analysis of melastatin mRNA expression in melanomasfrom American Joint Committee on Cancer stage I and II patients withrecurrent melanoma. J Cutan Pathol 33:599–607
He L, Hannon GJ (2004) MicroRNAs: small RNAs with a big role in generegulation. Nat Rev Genet 5:522–31
Hino K, Tsuchiya K, Fukao T et al. (2008) Inducible expression of microRNA-194 is regulated by HNF-1alpha during intestinal epithelial celldifferentiation. RNA 14:1433–42
Huang PH, Marais R (2009) Cancer: melanoma troops massed. Nature 459:336–7
Innominato PF, Libbrecht L, van den Oord JJ (2001) Expression ofneurotrophins and their receptors in pigment cell lesions of the skin.J Pathol 194:95–100
Jaiswal BS, Janakiraman V, Kljavin NM et al. (2009) Combined targeting ofBRAF and CRAF or BRAF and PI3K effector pathways is required forefficacy in NRAS mutant tumors. PLoS One 4:e5717
Johansson CC, Egyhazi S, Masucci G et al. (2009) Prognostic significance oftumor iNOS and COX-2 in stage III malignant cutaneous melanoma.Cancer Immunol Immunother 58:1085–94
Kim VN (2005) Small RNAs: classification, biogenesis, and function. MolCells 19:1–15
Kuphal S, Palm HG, Poser I et al. (2005) Snail-regulated genes in malignantmelanoma. Melanoma Res 15:305–13
Mikhail M, Velazquez E, Shapiro R et al. (2005) PTEN expression inmelanoma: relationship with patient survival, Bcl-2 expression, andproliferation. Clin Cancer Res 11:5153–7
Mueller DW, Rehli M, Bosserhoff AK (2009) miRNA expression profiling inmelanocytes and melanoma cell lines reveals miRNAs associated withformation and progression of malignant melanoma. J Invest Dermatol129:1740–51
Oancea E, Vriens J, Brauchi S et al. (2009) TRPM1 forms ion channelsassociated with melanin content in melanocytes. Sci Signal 2:ra21
Old WM, Shabb JB, Houel S et al. (2009) Functional proteomics identifiestargets of phosphorylation by B-Raf signaling in melanoma. Mol Cell34:115–31
Omholt K, Platz A, Kanter L et al. (2003) NRAS and BRAF mutations ariseearly during melanoma pathogenesis and are preserved throughouttumor progression. Clin Cancer Res 9:6483–8
Pavey S, Johansson P, Packer L et al. (2004) Microarray expression profiling inmelanoma reveals a BRAF mutation signature. Oncogene 23:4060–7
Schallreuter KU, Kothari S, Hasse S et al. (2003) In situ and in vitro evidencefor DCoH/HNF-1 alpha transcription of tyrosinase in human skinmelanocytes. Biochem Biophys Res Commun 301:610–6
Segura MF, Hanniford D, Menendez S et al. (2009) Aberrant miR-182 expressionpromotes melanoma metastasis by repressing FOXO3 and microphthalmia-associated transcription factor. Proc Natl Acad Sci USA 106:1814–9
Simon R, Radmacher MD, Dobbin K et al. (2003) Pitfalls in the use of DNAmicroarray data for diagnostic and prognostic classification. J NatlCancer Inst 95:14–8
Song B, Wang Y, Kudo K et al. (2008) miR-192 Regulates dihydrofolatereductase and cellular proliferation through the p53-microRNA circuit.Clin Cancer Res 14:8080–6
Stahl JM, Cheung M, Sharma A et al. (2003) Loss of PTEN promotes tumordevelopment in malignant melanoma. Cancer Res 63:2881–90
Villanueva J, Herlyn M (2008) Melanoma and the tumor microenvironment.Curr Oncol Rep 10:439–46
Volinia S, Calin GA, Liu CG et al. (2006) A microRNA expression signature ofhuman solid tumors defines cancer gene targets. Proc Natl Acad Sci USA103:2257–61
Worley LA, Long MD, Onken MD et al. (2008) Micro-RNAs associated withmetastasis in uveal melanoma identified by multiplexed microarrayprofiling. Melanoma Res 18:184–90
Yanaihara N, Caplen N, Bowman E et al. (2006) Unique microRNA molecularprofiles in lung cancer diagnosis and prognosis. Cancer Cell 9:189–98
2070 Journal of Investigative Dermatology (2010), Volume 130
S Caramuta et al.miRNA Expression and Melanoma Survival


