Embed Size (px)
Citation preview
NRC Publications Archive (NPArC)Archives des publications du CNRC (NPArC)
Publisher’s version / la version de l'éditeur: International Journal of Hydrogen Energy, 35, 22, pp. 12182-12190, 2010-09-20
Microstructure changes induced by capillary condensation in catalyst layers of PEM fuel cellsMa, Liang; Liu, Zhong-Sheng; Huang, Cheng; Chen, Su-Huan; Meng, Guang-Wei
Contact us / Contactez nous: [email protected].
http://nparc.cisti-icist.nrc-cnrc.gc.ca/npsi/jsp/nparc_cp.jsp?lang=frL’accès à ce site Web et l’utilisation de son contenu sont assujettis aux conditions présentées dans le site
Web page / page Webhttp://dx.doi.org/10.1016/j.ijhydene.2010.08.072http://nparc.cisti-icist.nrc-cnrc.gc.ca/npsi/ctrl?action=rtdoc&an=16910701&lang=enhttp://nparc.cisti-icist.nrc-cnrc.gc.ca/npsi/ctrl?action=rtdoc&an=16910701&lang=fr
LISEZ CES CONDITIONS ATTENTIVEMENT AVANT D’UTILISER CE SITE WEB.
READ THESE TERMS AND CONDITIONS CAREFULLY BEFORE USING THIS WEBSITE.
Access and use of this website and the material on it are subject to the Terms and Conditions set forth athttp://nparc.cisti-icist.nrc-cnrc.gc.ca/npsi/jsp/nparc_cp.jsp?lang=en

Microstructure changes induced by capillary condensation in
catalyst layers of PEM fuel cells
Liang Ma a,b, Zhong-Sheng Liu a,*, Cheng Huang a, Su-Huan Chen b, Guang-Wei Meng b
a Institute for Fuel Cell Innovation, National Research Council Canada, 4250 Wesbrook Mall, Vancouver, BC, Canada V6T 1W5bDepartment of Mechanics, Nanling Campus, Jilin University, Changchun, 130025, PR China
a r t i c l e i n f o
Article history:
Received 6 July 2010
Received in revised form
14 August 2010
Accepted 18 August 2010
Available online 20 September 2010
Keywords:
PEM fuel cell
Catalyst layer
Microstructure change
Capillary condensation
Pt/C particles
a b s t r a c t
This paper proposes a hypothesis for explaining Pt/C particles’ coarsening inside the
catalyst layers of a PEM fuel cell. The hypothesis includes the two parts: (1) due to capillary
condensation a water-bridge could be formed between two neighboring nano-scale Pt/C
particles at relative humidity under 100% when the surfaces of the Pt/C particles are
hydrophilic; (2) the capillary force of the water-bridge tends to pull together the Pt/C
particles. The relation is derived in this paper between the capillary force and the factors
including the diameter of Pt/C particles, relative humidity, temperature, distance between
the two neighboring Pt/C particles and water contact angle. A parametric study is per-
formed showing some details about water-bridge formation. Finally, the stress level
induced by the capillary force inside the Nafion thin-film connecting with the Pt/C particles
is calculated. The result shows that the capillary force could be large enough to break apart
the Nafion thin-film, facilitating the movement of Pt/C particles towards each other.
Crown Copyright ª 2010 Published by Elsevier Ltd on behalf of Professor T. Nejat Veziroglu.
All rights reserved.
1. Introduction
Proton exchange membrane (PEM) fuel cells are electro-
chemical devices oxidizing hydrogen and generating elec-
tricity with high efficiency and zero green house gas
emissions on site. Over the past two decades PEM fuel cells
have been being developed for powering hydrogen fuel cell
cars, which are currently available in demonstration models
and are not yet ready for general public use. In order to
commercialize hydrogen fuel cell cars, the lifetime and the
cost of PEM fuel cells have to be tremendously improved. The
minimum requirement on the lifetime of PEM fuel cells for
automotive applications is 5000 h, 1.5 times higher than the
actual lifetime 2000 h of the state-of-art PEM fuel cells under
automotive (dynamic) operating conditions. However, the
lifetime has already reached up to 15,000 h under stationary
operating conditions [1,2]. The huge gap in terms of lifetime
between dynamic operating conditions and stationary oper-
ating conditions is an interesting phenomenon, but there is
little literature available about the failure mechanisms under
dynamic operating conditions.
References [1e10] addressed different failuremodes of PEM
fuel cells. References [3e5] compared fresh catalyst layers
with aged ones in terms of microstructure evolutions using
transmission electron microscopy (TEM) and scanning elec-
tron microscopy (SEM). The TEM and SEM images show that
the microstructure in catalyst layers goes through significant
changes, suggesting that the microstructure change leads to
performance degradation. The different microstructure
changes that have been observed include: cracking, delami-
nation, carbon corrosion, dissolution of the electrolyte, cata-
lyst particle migration, catalyst ripening, carbon coarsening,
* Corresponding author. Tel.: þ1 604 221 3068; fax: þ1 604 221 3001.E-mail address: [email protected] (Z.-S. Liu).
Avai lab le at www.sc iencedi rect .com
journa l homepage : www.e lsev ie r . com/ loca te /he
i n t e rn a t i o n a l j o u r n a l o f h y d r o g e n en e r g y 3 5 ( 2 0 1 0 ) 1 2 1 8 2e1 2 1 9 0
0360-3199/$ e see front matter Crown Copyrightª 2010 Published by Elsevier Ltd on behalf of Professor T. Nejat Veziroglu. All rights reserved.doi:10.1016/j.ijhydene.2010.08.072
and catalyst-layer thinning. Basically there are two types of
typical failure models in catalyst layers of PEM fuel cells:
chemical degradation of the ionic conducting parts or
mechanical failure. References [6,7] suggested that mechan-
ical damage plays an important part in catalyst layers.
Mechanical analysis at the MEA level has been performed by
reference [8], which concludes that critical residual stresses
accumulate and lead to mechanical fatigue in MEA after
hydrothermal cycles. However the evolution in the micro-
structures of catalyst layers is still unclear.
Over the past several years, we have been putting efforts to
understand the mechanisms of microstructure changes,
especially, under dynamic operating conditions. In references
[9,10] we proposed a mechanics model to explain the
phenomenon of macro-scale delamination and cracks
induced by thermal expansion and swelling. In this work, we
focus on a different mechanism of microstructure changes of
catalyst layers. Capillary condensation is of importance in
porous materials [11e13] such as the catalyst layers of PEM
fuel cells. Here we try to suggest a hypothesis about how
awater-bridge, formed by water-vapor condensation between
or among adjacent Pt/C particles, drives the displacements of
Pt/C particles and eventually causes cracking, delamination
and Pt/C coarsening.
In Section 2, we propose the hypothesis and its back-
ground. In Section 3, we try to relate the capillary force of
a water-bridge inside a pair of identical sphere Pt/C solid
particles, with the parameters such as relative humidity and
temperature. This is done based on the Kelvin equation and
the toroidal approximation theory. Then we present the
results of the parametric studies in Section 4, showing how
the capillary force changes with different parameters. Section
5 discusses the mechanical properties of the microstructures
in the catalyst layers. In Section 6, we establish a mechanical
model of a simplified microstructure that contains two Pt/C
particles linked with Nafion thin-film, then apply the capillary
force obtained in Section 4 to one of the Pt/C particles and
calculate the stress inside the Nafion thin-film by finite
element method (FEM) [14]. The calculation results indicate
that the stress level is in the same order as the strength limit
of Nafion material.
2. Hypothesis description
The space between adjacent Pt/C particles in a catalyst layer is
usually in the order of several nanometers, which can be seen
from TEM/SEM images of catalyst layers. In such a confined
tiny space with hydrophilic surfaces, as shown in Fig. 1, liquid
water can be formed through capillary condensation [11],
especially, in cathode catalyst layers where water is produced
from oxygen reduction reaction (O2 þ 4Hþ þ 4e� ¼ 2H2O). This
phenomenon can be explained by the Kelvin Equation. A
concave meniscus at liquid-vapor interface results in tensile
stress inside the water-bridge, which tends to pull the Pt/C
particles in contact with the water-bridge. When the Pt/C
particles are restrained by a Nafion thin-film, which is con-
nected with the other part of the catalyst layer, a certain level
of stress inside the Nafion thin-film will be developed. When
PEM fuel cells work under dynamic loads, relative humidity
and temperature inside catalyst layers fluctuate and the size
of water-bridges fluctuates accordingly. Thus the Pt/C parti-
cles in contact with the water-bridge are subject to a dynamic
(periodic) capillary force, which will cause dynamic (periodic)
stress inside the Nafion thin-film. Since dynamic stress
accelerates materials failure in the form of micro-scale frac-
ture, crack propagation and delamination. We tend to believe
that the capillary force in the water-bridge can pull together
the Pt/C particles in contact with the water-bridge through
deforming or breaking the Nafion thin-film. In this way, the Pt/
C particles will tend to adhere together forming large
agglomerates. With a large agglomerate, the active electro-
chemical surface area of Pt catalysts drops. Moreover, oxygen
diffusion through a large agglomerate becomes more difficult
than through a small agglomerate, especially, when Knudsen
diffusion [15] becomes dominant because of the small pore
size (several nanometers) and the condensed liquid water fills
smaller hydrophilic pores causingmore difficulties for oxygen
to diffuse into reaction sites. The combination of reduced
active surface area and poor gas diffusion explains why
agglomerate coarsening causes performance degradation.
Although this microstructure evolution-process, as stated
above, has not been physically observed and thus should be
considered as a hypothesis, the following detailed analysis
provides a certain level of confidence in this hypothesis. Note
that short-range intermolecular forces (a solid particle to its
adjacent solid particle) can become significant within the
range of several nanometers, and should be taken into
account when dealing with the coarsening phenomenon, but
we leave it to another paper’s focus and intentionally do not
address it in this paper.
3. Calculation of capillary force
Consider a pair of identical Pt/C particles, as shown in Fig. 2,
whose surfaces are hydrophilic. Inside the space between the
Pt/C particles, capillary condensation can occur at the equi-
librium vapor pressure p below the saturation vapor pressure
p0 [13]. The relation between pand p0 can be described by the
Kelvin equation,
lnp
p0¼ 2DgLVVm
kT(1)
where Vm is the molar volume of water, gLV is the surface
tension as a function of temperature given in Table 1, k is the
Boltzmann constant and T is the absolute temperature, D
denotes the mean curvature defined as
2D ¼�
1r1
þ 1r2
�
(2)
where r1 and r2 are the two principle radii of the water-vapor
interface. The radius sign is positive if the surface is convex to
the liquid and negative if concave to the liquid.
Substituting Eq. (2) into Eq. (1) yields
kTV�1m g�1
LV lnp
p0¼�
1r1
þ 1r2
�
(3)
Consider a pair of identical solid Pt/C spheres, as shown in
i n t e r n a t i o n a l j o u r n a l o f h y d r o g e n en e r g y 3 5 ( 2 0 1 0 ) 1 2 1 8 2e1 2 1 9 0 12183

Fig. 2, with a water-bridge in between the two spheres. The
radius of the two identical solid spheres is expressed by R and
the distance between them is denoted by H. The radii of the
liquid bridge are r1 in plane and r2 through plane. The water
contact angle is q and the apparent contact angle is a. Using
the geometry relationship called toroidal approximation
[16,17], we can have
r1 ¼H=2þ Rð1� cosaÞ
cosðaþ qÞ (4)
r2 ¼ Rsina� ½1� sinðaþ qÞ�r1 (5)
Substituting Eqs. (4) and (5) into Eq. (3) yields
kTV�1m g�1
LV lnp
p0¼ 1
Rsina� ½1� sinðaþ qÞ��
H=2þ Rð1� cosaÞcosðaþ qÞ
�
� cosðaþ qÞH=2þ Rð1� cosaÞ
(6)
Eq. (6) says that a is a function of T and p/p0 when water
contact angle and geometry parameters are given,
a ¼ a
�
T;p
p0
�
(7)
Eq. (6) is a transcendental equation and thus needs to be
solved by numerical methods (such as the NewtoneRaphson
scheme) to get an approximate solution.
After substituting Eq. (7) into Eqs. (4) and (5), one can see
that r1 and r2 can be expressed by T and p/p0,
r1 ¼ r1
�
T;p
p0
�
(8)
r2 ¼ r2
�
T;p
p0
�
(9)
Eqs. (7)e(9) says that the water-bridge’s geometry is
completely determined by T and p/p0.
Given the water-bridge’s geometry, we can calculate the
capillary force F, a force that the water-bridge exerts on the
solid Pt/C spheres. There are twomethods available [18,19] for
Fig. 1 e A water-bridge in the microstructures of a catalyst layer.
Fig. 2 e Geometrical description of the water-bridge formed
between two spheres.
Table 1 e Water surface tension under differenttemperatures.
Temperature Surface tension in contact with air 10�2Nm�1
0 7.56
10 7.42
20 7.28
30 7.12
40 6.96
50 6.79
60 6.62
70 6.44
80 6.26
90 6.08
100 5.89
i n t e rn a t i o n a l j o u r n a l o f h y d r o g e n en e r g y 3 5 ( 2 0 1 0 ) 1 2 1 8 2e1 2 1 9 012184
calculating the force. In this paper, we use the gorge method
provided by [19] which is believed to have a better estimate of
the total force,
F ¼ �pr22Dpþ 2pr2gLV (10)
where the capillary pressureDp is given by the YoungeLaplace
equation
Dp ¼ gLV
�
1r1
þ 1r2
�
(11)
Substituting Eq. (11) to Eq. (3), yields
Dp ¼ kTV�1m ln
p
p0(12)
Furthermore, substituting Eqs. (8), (9) and (12) to Eq. (10), we
can relate the capillary force F, with T and p/p0, as shown
below,
F ¼ �p
�
r2
�
T;p
p0
��2
kTV�1m ln
p
p0þ 2pr2
�
T;p
p0
�
gLV (13)
Replacing p/p0with the relative humidity value (RH ) according
to its definition, Eq. (13) can be rewritten as,
F ¼ �p½r2ðT;RHÞ�2kTV�1m lnRHþ 2pr2ðT;RHÞgLV (14)
4. Parametric studies
The above equations show that the capillary force is
a complex function of the variables including the relative
humidity, the temperature, the water contact angle, the size
of Pt/C particles and the distance between them. We
purposely selected a group of values for the variables and
calculated the capillary force associated with the group of
values. The values for temperature are selected as 20 �C, 50 �C,
and 80 �C adopted in our previous work [9]. The values for the
radius of Pt/C particles are 10 nm, 15 nm and 20 nm. It was
observed that the surface of the catalyst layer is hydrophobic
and will become hydrophilic due to contaminations [20].
However, the water contact angle on the surface of Pt/C
particles in catalyst layers is experimentally unavailable.
Since platinum particle is hydrophilic, the wetability of the
surface may vary from the sites with Pt particles, the sites
without Pt, and different carbon supports such as, Vulcan,
Ketjen-Black and graphitized Ketjen-Black etc. Different
function groups on the carbon support resulted from opera-
tions also change the wetability of the surface of Pt/C parti-
cles. The wetability also depends on the Pt loading, the
distribution of Pt particles and possible contaminations. Thus
we use the water contact angle values as low as 20�, 40� and
60� for performing the parametric study and investigate how
the values influence the capillary condensation.
As to the distances between Pt/C particles, references
[21,22] conclude that in the microstructures of the catalyst
layers the pore size between carbon agglomerates ranges
around dozens of nanometers and the pore size between Pt/C
particles inside the agglomerates ranges around several
nanometers. According to the solving equations in Section 3,
the capillary condensation starts from smaller hydrophilic
pores and expands to larger hydrophilic pores with the accu-
mulation of liquid water. Therefore we select the distances as
1 nm and 2 nm that represent those domains with small pores
in themicrostructureswhere thecondensationmayoccurfirst.
4.1. Relative humidity and temperature
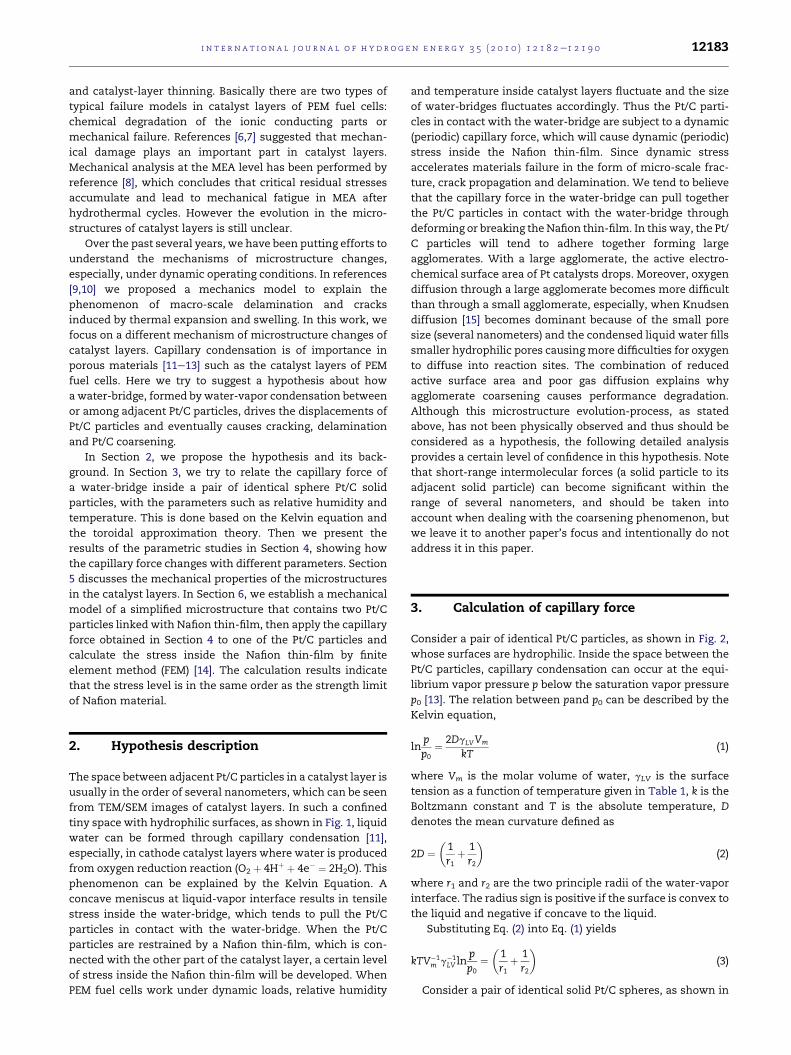
The dependence of the capillary force upon relative humidity
and temperature is shown in Fig. 3. There are three curves
showing the relation between capillary force and relative
humidity. The yellow, pink and blue curves are associated
with temperature 20 �C, 50 �C and 80 �C, respectively. The
radius of the pair of Pt/C particles is 20 nm and their water
contact angle is 20�. The distance between the two particles is
taken as H ¼ 1 nm. It can be seen from Fig. 3 that the capillary
force does not exist when RH is lower than a certain value,
implying that no water-bridge is formed. It can also be seen
that the capillary force becomes larger when RH value is
getting higher, indicating that the size of water-bridge gets
larger when RH value becomes higher. In addition, the figure
shows that it takes higher RH value to form a water-bridge at
high temperature than at low temperature. This is mainly due
to the decrease of water surface tension when temperature
goes up.
4.2. Water contact angle and geometry parameter
Fig. 4 lists the three curves about the relation between capil-
lary force and relative humility RH at different water contact
Fig. 3 e Capillary forces under different relative humidity when the temperature is 80 �C, 50 �C and 20 �C.
i n t e r n a t i o n a l j o u r n a l o f h y d r o g e n en e r g y 3 5 ( 2 0 1 0 ) 1 2 1 8 2e1 2 1 9 0 12185

angles (20�, 40� and 60�). As can be seen from Fig. 4, the curve
associated with a high value of water contact angle is below
that associated with a low water-contact angle, which
suggests that a large water contact angle leads to a small
water-bridge and thus a small capillary force. Here we assume
the radius of the pair of Pt/C particles is R ¼ 20 nm and
temperature T ¼ 80 �C.
Fig. 5 shows the relation between capillary force and RH
with respect to three different size of Pt/C particles (R¼ 10 nm,
R ¼ 15 nm and 20 nm). The three curves indicate that the
capillary force gets weaker when the radius of Pt/C particle
gets smaller. The curves also indicate that it ismore difficult to
form a water-bridge between a pair of smaller particles than
a pair of larger ones. The larger the radius of the Pt/C particles
is, the larger the capillary force. But the rate of the increase of
capillary force is not as high as the rate of increase of the
surface area of Pt/C particles, which can be seen from Fig. 5.
The surface area of the Pt/C particle with radius 20 nm is 4
times as large as that of the Pt/C particle with radius 10 nm,
but the capillary force associated with the 20 nm Pt/C particle
is only two times as large as that of the Pt/C particle with
10 nm radius. The reason for comparing the rate of the
increase of capillary force induced by an increase of Pt/C
particle’s radius with the rate of the Pt/C particle’s surface
area is for figuring out how the Pt/C particle’s size could affect
the adhesion strength at the interface between the Pt/C
particle’s surface and Nafion ionomer. If we can assume that
the adhesion strength at the interface between the Pt/C
particle’s surface and Nafion ionomer is proportional to the
surface area of the Pt/C particle, we can conclude that the
larger the size of the Pt/C particles is, the less likely that
delamination and cracks at the interface happen.
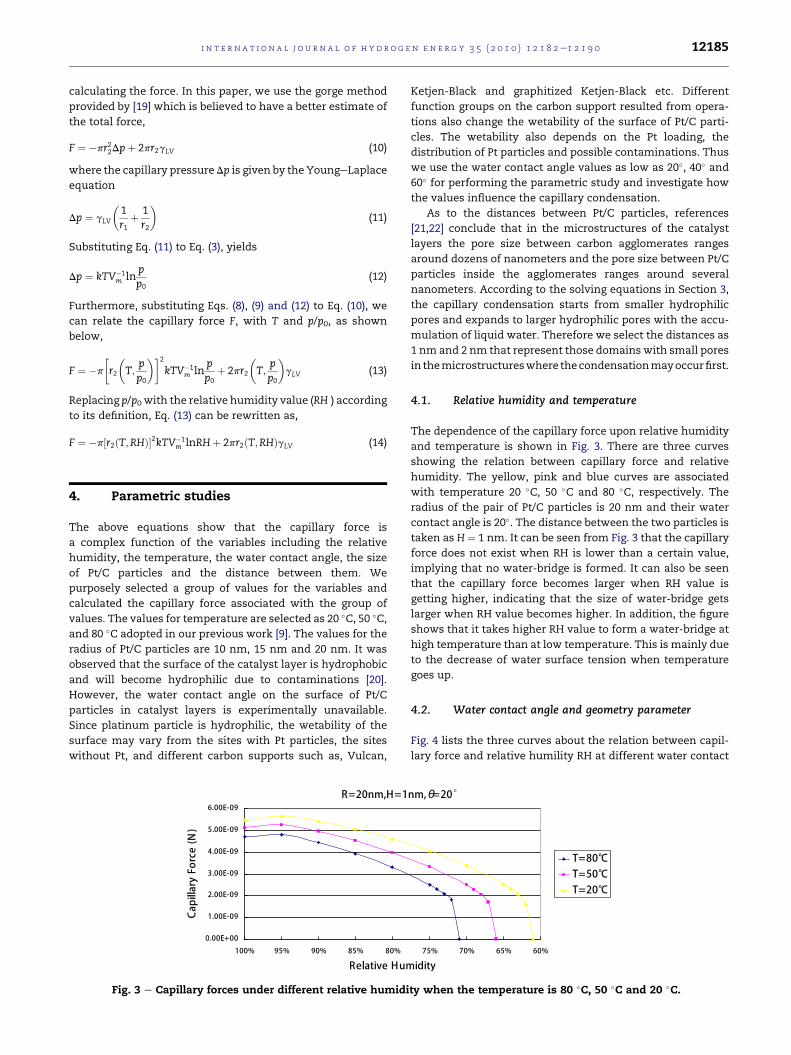
In Fig. 6, we compared the effect of the distance between
the pair of Pt/C particles upon capillary force. The pink curve
corresponds to H ¼ 2 nm and the blue curve to H ¼ 1 nm. The
two curves show clearly that it takes a higher value of RH to
form a water-bridge when the distance of the pair of Pt/C
particles is longer than the RH value needed to form a water-
bridge when the distance is shorter. Given the same RH value,
the capillary force associated with a longer distance H is
smaller than with a shorter distance H.
5. Mechanical properties of Nafion, Pt/Cparticles and their interfaces
In catalyst layers Pt/C particles and Nafion form random
porous structure in nano-scale, so it is difficult to determine
the material parameters at this stage. More experiments or
molecular simulations need to be done to determine their
characteristics. In this section, we use bulkmaterial models to
describe the stress-versus-strain relationship of Nafion and
Pt/C particles and also the mechanical properties of the
interface between Nafion and Pt/C particles.
Fig. 4 e Capillary forces under different relative humidity when water contact angle is 20�, 40� and 60�.
Fig. 5 e Capillary forces under different relative humidity when the sphere radii are 20 nm, 15 nm and 10 nm.
i n t e rn a t i o n a l j o u r n a l o f h y d r o g e n en e r g y 3 5 ( 2 0 1 0 ) 1 2 1 8 2e1 2 1 9 012186
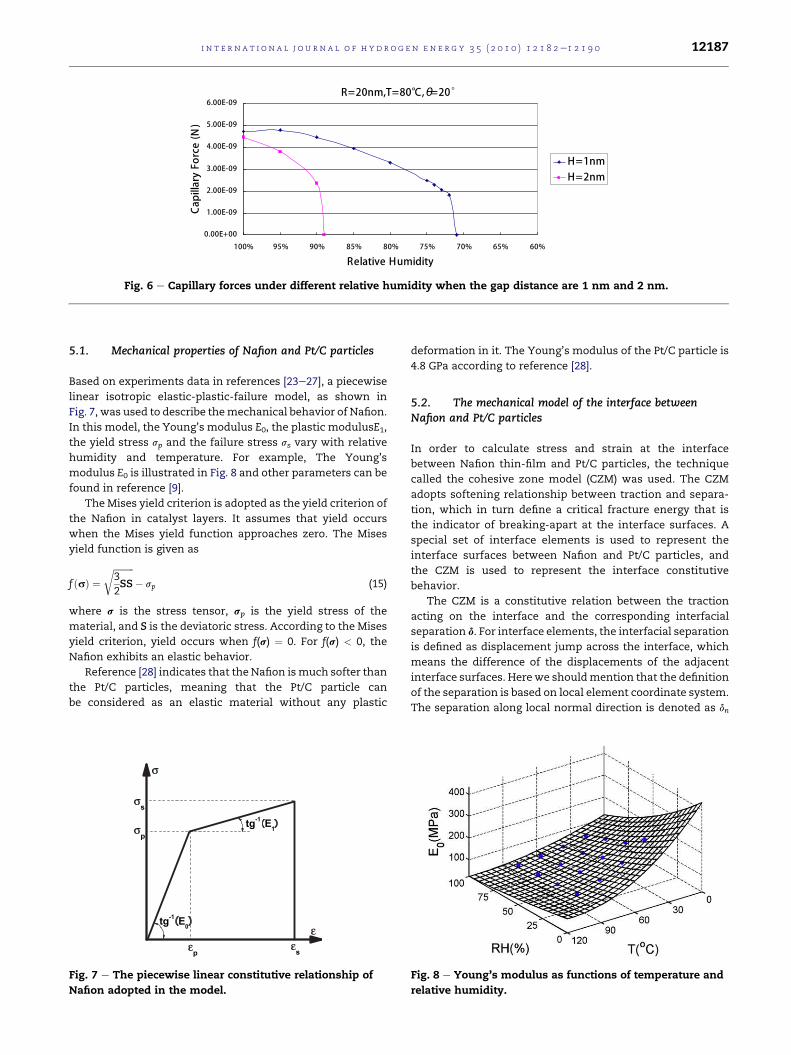
5.1. Mechanical properties of Nafion and Pt/C particles
Based on experiments data in references [23e27], a piecewise
linear isotropic elastic-plastic-failure model, as shown in
Fig. 7, was used to describe themechanical behavior of Nafion.
In this model, the Young’s modulus E0, the plastic modulusE1,
the yield stress sp and the failure stress ss vary with relative
humidity and temperature. For example, The Young’s
modulus E0 is illustrated in Fig. 8 and other parameters can be
found in reference [9].
The Mises yield criterion is adopted as the yield criterion of
the Nafion in catalyst layers. It assumes that yield occurs
when the Mises yield function approaches zero. The Mises
yield function is given as
fðsÞ ¼ffiffiffiffiffiffiffiffiffi
32SS
r
� sp (15)
where s is the stress tensor, sp is the yield stress of the
material, and S is the deviatoric stress. According to the Mises
yield criterion, yield occurs when f(s) ¼ 0. For f(s) < 0, the
Nafion exhibits an elastic behavior.
Reference [28] indicates that the Nafion ismuch softer than
the Pt/C particles, meaning that the Pt/C particle can
be considered as an elastic material without any plastic
deformation in it. The Young’s modulus of the Pt/C particle is
4.8 GPa according to reference [28].
5.2. The mechanical model of the interface between
Nafion and Pt/C particles
In order to calculate stress and strain at the interface
between Nafion thin-film and Pt/C particles, the technique
called the cohesive zone model (CZM) was used. The CZM
adopts softening relationship between traction and separa-
tion, which in turn define a critical fracture energy that is
the indicator of breaking-apart at the interface surfaces. A
special set of interface elements is used to represent the
interface surfaces between Nafion and Pt/C particles, and
the CZM is used to represent the interface constitutive
behavior.
The CZM is a constitutive relation between the traction
acting on the interface and the corresponding interfacial
separation d. For interface elements, the interfacial separation
is defined as displacement jump across the interface, which
means the difference of the displacements of the adjacent
interface surfaces. Herewe shouldmention that the definition
of the separation is based on local element coordinate system.
The separation along local normal direction is denoted as dn
Fig. 6 e Capillary forces under different relative humidity when the gap distance are 1 nm and 2 nm.
εε
σ
σs
εs
tg-1E0
tg-1E1
εp
σp
Fig. 7 e The piecewise linear constitutive relationship of
Nafion adopted in the model.
Fig. 8 e Young’s modulus as functions of temperature and
relative humidity.
i n t e r n a t i o n a l j o u r n a l o f h y d r o g e n en e r g y 3 5 ( 2 0 1 0 ) 1 2 1 8 2e1 2 1 9 0 12187

and separation along local tangent direction is denoted as dt.
An exponential form of the CZM, originally proposed by Xu
and Needleman, uses a surface potential,
FðdÞ ¼ esmaxdn
"
1��
1þ dn
dn
�
exp
�
� dn
dn
�
exp
� d2t
d2
t
!#
(16)
where F(d) is the surface potential, e is Euler’s number
(2.7182.), smax is the maximum normal traction at the
interface. dn is the normal separation across the interface, dt is
the shear separation along the interface, dn is the normal
separation where the maximum normal traction is attained
with dt¼ 0, and dt is the shear separationwhere themaximum
shear traction is attained at dt ¼ dt=ffiffiffi
2p
. So the traction (on
both the normal direction and the shear direction) can be
defined as
Tn ¼ vF
vdnand Tt ¼
vF
vdt: (17)
From Eqs. (16) and (17), the normal traction of the interface
is
Tn ¼ esmaxdn
dnexp
�
� dn
dn
�
exp
� d2t
d2
t
!
(18)
and the shear traction is
Tt ¼ 2esmaxdndt
d2
t
�
1þ dn
dn
�
exp
�
� dn
dn
�
exp
� d2t
d2
t
!
(19)
From the publication on the interface of polymer (such as
epoxy or PTFE) and the carbon nanotube [29], the maximum
normal traction smax is close to E0/10, where E0 is the Young’s
modulus of Nafion. The normal characteristic separation dn is
taken to be the same as the shear characteristic separation dt
[30]. The maximum shear stress is close to sp=ffiffiffi
3p
, where sp is
the yield stress of Nafion.
6. Stress induced by periodic capillary force
In this section, we use the finite element method to calculate
the stress and strain inside the Nafion thin-film, which
connects with one of the pair of Pt/C particles. Between the
pair of the Pt/C particles there is a water-bridge exerting
a capillary force on the Pt/C particles. The objective is to find
whether or how it affects the failure of Nafion domain and the
interface delamination.
First of all, we shouldmention that this numerical example
is simulated to analyze qualitatively the mechanism of the
microstructure evolution in the catalyst layers. We cannot
give the results of quantitative analysis at this stage because
the actual conditions in catalyst layers are highly random and
complicated and the geometry and material parameters are
difficult to be determined.
It is assumed that two Pt/C particles are linked by Nafion
thin-film, which partly covers on the Pt/C particle surface. The
model details are listed in Table 2. Utilizing the axisymmetric
microstructure, we need only to mesh a quarter of the whole
geometry, as shown in Fig. 9. The left side of the left particle is
fixed and the capillary force is applied on the exposed outside
surface of the right side particle. The dynamic load in the form
of dynamic relative humidity is shown in Fig. 10 ranging from
35% to 95%, which leads to the fluctuation of capillary force.
The capillary force was calculated using the equations in
Section 3. Here the thermal and swelling expansion of Nafion
is not considered. CZM elements are defined on the interface
between Nafion thin-film and the two Pt/C particles.
The FEM software package ANSYS 12 was used for the
simulations. The results of the simulations show that the
mechanical status in this microstructure tends to be steady
after first several cycles of relative humidity. The contours of
von Mises stress in the Nafion thin-film under different load
steps are illustrated in Fig. 11(a) and (b). The figures show that
the vonMises stress inside Nafion reaches as high as 3.61 MPa
at relative humidity 95%. This stress level exceeds the yield
stress of Nafion sp ¼ 2:98 MPa, leading to plastic deformation.
The results also indicate that the von Mises stress fluctuates
under different load steps. Although the maximum of stress
does not exceed the breaking-apart stress of Nafion ss, cracks
could happen in the form ofmaterial fatigue after a number of
dynamic load cycles. Thiswill eventually cause themovement
of Pt/C particles, furthering Pt/C-particle-agglomeration.
Finally, mechanical change in the microstructure leads to the
degradation of catalyst layers.
Fig. 12(a) and (b) show the normal stress contours on the
interface of the Nafion thin-film and the two Pt/C particles
under different load steps after first several cycles of relative
humidity. The figures show that the maximum value of the
normal stress on the interface achieves 13.8 MPa at relative
humidity of 95%, which is very close to the Nafion material
strength limit smax 14.8 MPa. At the load step of relative
humidity RH ¼ 35%, the maximum value of the normal stress
decreases to 0.743 MPa and the level of the normal stress is
generally much lower than that when RH ¼ 95%. Although
Table 2 e Geometry and operational parameters in stresssimulation.
Radius of each particle (nm) 20
Distance between two particles connected by Nafion
film (nm)
2
Thickness of the Nafion film (nm) 5
Distance between two particles between which water-
bridge generates (nm)
2
Constant temperature in simulation (�C) 80
Relative humidity (%) Fig. 10
Water contact angle on the surface of Pt/C particle
(degree)
40
Fig. 9 e A quarter of 3-D microstructure contains Pt/C
particles and Nafion.
i n t e rn a t i o n a l j o u r n a l o f h y d r o g e n en e r g y 3 5 ( 2 0 1 0 ) 1 2 1 8 2e1 2 1 9 012188

there is no normal stress exceeding the maximum normal
traction smax, it is reasonable to anticipate that mechanical
fatigue could happen under such a high stress level after
a certain number of load cycles. All the results above show
that the capillary force is in the same order of magnitude as
the force that causes the rupture of the Nafion thin-film and/
or delamination between the Nafion thin-film and Pt/C
particles.
Some idealizations in the way we model it perhaps
underestimate the stress and strain. We didn’t consider the
effect of carbon’s or Nafion’s deformation on the capillary
force. The real capillary force should be larger than those
calculated in these simulations. When the gap between two
spheres gets narrower under external loads, the capillary
force will become larger according to the results of parametric
study obtained in Section 4. Furthermore, when the rupture of
the Nafion thin-film and/or delamination along interfaces
occur, the Pt/C particles will not be fixed anymore and free to
move. The water-bridge between the two free solid particles
will adjust its shape and tend to drag the solid phases together
to keep total surface energy minimum [31], which is what we
suggest as an explanation of the phenomena of agglomerate
coarsening in the catalyst layers.
7. Concluding remarks
This paper investigates the capillary condensation and its
effect on the microstructure changes of the catalyst layers of
PEM fuel cells. The hypothesis is proposed for explaining the
effect of dynamic operating conditions on microstructure
changes. The relation between capillary force and the factors
such as temperature and relative humidity is derived based
the Kelvin equation, and the effect of water contact angle and
geometry parameters of the Pt/C particles on the capillary
force is analyzed. Furthermore the finite element method is
used to model a specific microstructure with Pt/C particles
and Nafion thin-film. Because the microstructures in catalyst
layers are random and heterogeneous, also the parameters of
the materials are difficult to determine, the simulations only
give the qualitative analysis on the evolutional mechanism.
The numerical results show that the vonMises stress level can
as high as the breaking stress level, meaning that the failure of
Fig. 11 e Contours of von Mises stress in Nafion domain
after first several load cycles (a) Von Mises stress in Nafion
when RH [ 95% (b) Von Mises stress in Nafion when
RH [ 35%.
Fig. 12 e Contours of normal stress on the interfaces after
first several load cycles (a) Normal stress on the interfaces
when RH [ 95% (b) Normal stress on the interfaces when
RH [ 35%.
0
20
40
60
80
100
0 1 2 3 4 5 6 7 8 9
Time step
Re
lative
Hu
mid
ity (
%)
Fig. 10 e Dynamic load cycles of relative humidity.
i n t e r n a t i o n a l j o u r n a l o f h y d r o g e n en e r g y 3 5 ( 2 0 1 0 ) 1 2 1 8 2e1 2 1 9 0 12189

Nafion thin-film and the delamination along the interfaces
could happen. This supports the hypothesis that capillary
condensation can cause the movement of Pt/C particles
towards to each other.
Acknowledgments
Liang Ma thanks the China Scholarship Council and the
National Research Council Canada (NRC) for the financial
support through the NRC-MOE Research and Post-doctoral
Fellowship Program, which allows Liang Ma to spend his one-
year research-stay at NRC.
r e f e r e n c e s
[1] Wilkinson DP, St-Pierre J. Durability. In: Vielstich W,Gasteiger HA, Lamm A, editors. Handbook of fuel cells-fundamental, technology and applications. Chichester: JohnWiley & Sons; 2003. p. 612e26.
[2] Knights SD, Colbow KM, St-Pierre J, Wilkinson DP. Agingmechanisms and lifetime, PEFC and DMFC. J Power Sources2004;127:127e34.
[3] Xie J, Wood DL, More KL, Atanassov P, Borup RL.Microstructural changes of membrane electrode assembliesduring PEFC durability testing at high humidity conditions.J Electrochem Soc 2005;152:A1011e20.
[4] Xie J, Wood DL, Wayne DM, Zawodzinski TA, Atanassov P,Borup RL. Durability of PEFCs at high humidity conditions.J Electrochem Soc 2005;152:A104e13.
[5] Kundu S, Fowler MW, Simon LC, Grot S. Morphologicalfeatures (defects) in fuel cell membrane electrodeassemblies. J Power Sources 2006;157:650e6.
[6] McDonald RC, Mittelsteadt CK, Thompson EL. Effects of deeptemperature cycling on Nafion� 112 membranes andmembrane electrode assemblies. Fuel Cells 2004;4:208e13.
[7] KusogluA,KarlssonAM,SantareMH,CleghornS, JohnsonWB.Mechanical response of fuel cell membranes subjected toa hygro-thermal cycle. J Power Sources 2006;161:987e96.
[8] Tang Y, Santare MH, Karlsson AM, Cleghorn S, Johnson WB.Stresses in proton exchange membranes due to hydro-thermal loading. J Fuel Cell Sci Technol 2006;3:119e24.
[9] Rong F, Huang C, Liu ZS, Song DT, Wang QP. Microstructurechanges in the catalyst layers of PEM fuel cells induced byload cycling. Part I. Mechanical model. J Power Sources 2008;175:699e711.
[10] Rong F, Huang C, Liu ZS, Song DT, Wang QP. Microstructurechanges in the catalyst layers of PEM fuel cells induced byload cycling. Part II. Simulation and understanding. J PowerSources 2008;175:712e23.
[11] Rowlinson JS, Widom B. Molecular theory of capillarity.Oxford: Oxford University Press; 1989.
[12] Dobbs HT, Yeomans JM. Capillary condensation andprewetting between spheres. J Phys. Condens Matter 1992;4:10133e8.
[13] Nowak D, Christenson HK. Capillary condensation of waterbetween mica surfaces above and below zero-effect ofsurface ions. Langmuir 2009;25:9908e12.
[14] Zienkiewicz OC, Taylor RL. The finite element method. 4thed. New York: McGraw-Hill; 1988.
[15] Mu D, Liu ZS, Huang C, Djilali N. Determination of theeffective diffusion coefficient in porous media includingKnudsen effects. Microfluid Nanofluid 2008;4:257e60.
[16] Pepin X, Rossetti D, Simons SJR. Modeling pendular liquidbridges with a reducing solid-liquid interface. J ColloidInterface Sci 2000;232:298e302.
[17] Mu F, Su X. Analysis of liquid bridge between sphericalparticles. China Particuology 2007;5:420e4.
[18] Iverson SM, Litster JD, Hapgood K, Ennis BJ. Nucleation,growth and breakage phenomena in agitated wetgranulation processes: a review. Powder Technol 2001;117:3e39.
[19] Lian G, Thornton C, Adams MJ. A theoretical study of theliquid bridge forces between two rigid spherical bodies.J Colloid Interface Sci 1993;161:138e47.
[20] Yu HM, Ziegler C, Oszcipok M, Zobel M, Hebling C.Hydrophilicity and hydrophobicity study of catalyst layers inproton exchange membrane fuel cells. Electrochim Acta2006;51:1199e207.
[21] Mizuhata H, Nakao SI, Yamaguchi T. Morphological controlof PEMFC electrode by graft polymerization of polymerelectrolyte onto platinum-supported carbon black. J PowerSources 2004;138:25e30.
[22] Xie Z, Navession T, Shi K, Chow R, Wang Q, Song D, et al.Functionally graded cathode catalyst layers for polymerelectrolyte fuel cells. J Electrochem Soc 2005;152:1171e9.
[23] Satterfield MB, Majsztrik PW, Ota H, Benziger JB, Bocarsly AB.Mechanical properties of Nafion and titania/Nafioncomposite membranes for polymer electrolyte membranefuel cells. J Polym Sci. Part B Polym Phys 2006;44:2327e45.
[24] Chen X, Hui S. Ratcheting behavior of PTFE under cycliccompression. Polym Test 2005;24:829e33.
[25] Kundu S, Simon LC, Fowler M, Grot S. Mechanical propertiesof Nafion� electrolyte membranes under hydratedconditions. Polymer 2005;46:11707e15.
[26] Morris DR, Sun X. Water-sorption and transport properties ofNafion 117 H. J Appl Polym Sci 1993;50:1445e52.
[27] Gebel G, Aldebert P, Pineri M. Swelling study ofperfluorosulphonated ionomer membranes. Polymer 1993;34:333e9.
[28] Matweb. Available from, http://www.matweb.com.[29] Liljedahl CDM, Crocombe AD, Wahab MA, Ashcroft IA.
Damage modelling of adhesively bonded joints. Int J Fract2006;141:147e61.
[30] Xu XP, Needleman A. Numerical simulations of fast crackgrowth in brittle solids. J Mech Phys Solids 1994;42:1397e434.
[31] Zheng J, Streator JL. A generalized formulation for thecontact between elastic spheres: applicability to both wetand dry conditions. J Tribol 2007;129:274e82.
i n t e rn a t i o n a l j o u r n a l o f h y d r o g e n en e r g y 3 5 ( 2 0 1 0 ) 1 2 1 8 2e1 2 1 9 012190