Embed Size (px)
Citation preview
Microstructure dynamics in orthorhombic perovskites
Zhiying Zhang,1 Johannes Koppensteiner,2 Wilfried Schranz,2 Jonathan B. Betts,3 Albert Migliori,3 and Michael A. Carpenter1
1Department of Earth Sciences, University of Cambridge, Downing Street, Cambridge CB2 3EQ, United Kingdom2Physics of Functional Materials, Faculty of Physics, University of Vienna, Strudlhofgasse 4, A-1090 Wien, Austria
3National High Magnetic Field Laboratory, Los Alamos National Laboratory, Los Alamos, New Mexico 87545, USA�Received 9 March 2010; revised manuscript received 30 June 2010; published 28 July 2010�
Anelastic loss mechanisms associated with phase transitions in BaCeO3 have been investigated at relativelyhigh frequency �1 MHz and low stress by resonant ultrasound spectroscopy �RUS�, and at relatively lowfrequency �1 Hz and high stress by dynamic mechanical analysis �DMA�. Changes in the elastic moduli and
dissipation behavior clearly indicate phase transitions due to octahedral tilting: Pnma↔ Imma↔R3c↔Pm3mstructures at 551 K, 670 K, and 1168 K, and strain analysis shows that they are tricritical, first-order, and
second-order phase transitions, respectively. Structures with intermediate tilt states �R3c and Imma structures�show substantial anelastic softening and dissipation associated with the mobility of twin walls under appliedstress. The Pnma structure shows elastic stiffening which may be due to the simultaneous operation of twodiscrete order parameters with different symmetries. In contrast with studies of other perovskites, BaCeO3
shows strong dissipation at both DMA and RUS frequencies in the stability field of the Pnma structure. Thisis evidence that ferroelastic twin walls might become mobile in Pnma perovskites and suggests that shearingof the octahedra may be a significant factor.
DOI: 10.1103/PhysRevB.82.014113 PACS number�s�: 62.40.�i, 64.70.�p, 61.50.�f, 62.20.�x
I. INTRODUCTION
The properties and dynamics of twin walls in perovskiteshave been the focus of intense interest because of theirunique and quite specific character as defects in otherwisehomogeneous materials and because of their central role inferroelectric, ferromagnetic, and ferroelastic switching. Forexample, twin walls in tungsten oxide can be induced tobecome superconducting while the matrix material is not,1
and twin walls in CaTiO3 might be ferrielectric in a matrixwhich contains no electric dipoles.2 For the particular case offerroelastic twin walls, the local structural changes are domi-nated by large strain gradients. In a perfect crystal their mo-bility might be expected to be unconstrained but in real crys-tals they experience viscous drag due to strong interactionwith strain fields around defects. At low temperatures thepinning effect of defects can become sufficiently strong sothat the walls become immobile. Dynamics and structure arethus closely related and can give rise to substantial variationsin elastic and anelastic behaviors under the influence of anexternally applied stress. Against this broader background ithas been found that mechanical spectroscopy is an ideal toolfor investigating twin wall properties in materials as dispar-ate as piezoelectrics �e.g., lead-zirconate-titanate�3–7 and ana-log phases for silicate perovskites CaSiO3 and �Mg,Fe�SiO3in the deep earth �e.g., LaAlO3 and �Ca,Sr�TiO3�.8–13
The work presented here arose from a particular conun-drum in relation to the anelastic properties of perovskites
with the Pnma structure, as apposed to R3c or I4 /mcm struc-tures. All three are improper ferroelastics containing transfor-mation twins but the twin walls appear to be mobile only inthe rhombohedral and tetragonal phases of LaAlO3,�Ca,Sr�TiO3, and Sr�Zr,Ti�O3.8–16 In Ca1−xSrxTiO3 with x=0.4, 0.45, and 0.5, and in SrZrO3, transitions to the Pnmastructure are marked by a steep decrease in anelastic soften-ing and dissipation as if twin wall motion is abruptly
curtailed.9,14,15 Two different explanations have been offered.Daraktchiev et al.14 suggested that the sign of the volumestrain accompanying the transition from the parent cubicphase is important in influencing the twin wall thicknessesand hence in the extent to which they interact with defects.Alternatively, the small total spontaneous strain of Pnmaphases is important such that even if the walls are mobile,the strain released is small.9,17 A more general explanationcould be that the properties of twin walls in materials whichhave undergone structural phase transitions involving twoorder parameters with quite different symmetries are funda-mentally different from the properties of twin walls depend-ing on relaxations of only a single order parameter. In thecase of octahedral tilting transitions, the Pnma structure hasnonzero order parameters belonging to irreps M3
+ and R4+
while the order parameter for R3c and I4 /mcm belongs to R4+
alone. In order to distinguish between these different possi-bilities the mechanical behavior of other perovskites havebeen investigated and, quite unexpectedly, it was found thatthe Pnma phase of BaCeO3 shows strong anelastic dissipa-tion down to �200 K. This has all the characteristics ofbeing related to twin wall motion and provides evidence thattwin walls associated with multiple order parameters inPnma perovskites might become mobile under mechanicalstress.
Phase transitions in BaCeO3 at ambient pressure andchanging temperature follow the sequence Pnma
↔ Imma↔R3c↔Pm3m and have previously been studiedby Raman spectroscopy, neutron diffraction, x-ray diffraction�XRD�, and thermal analysis.18–23 Transition temperaturesfrom the literature are summarized in Table I. In this study,anelastic loss mechanisms associated with the transitionswere investigated at relatively high frequency �1 MHz andlow stress by resonant ultrasound spectroscopy �RUS� and atrelatively low frequency �1 Hz and high stress by dynamicmechanical analysis �DMA�. The specific objectives were,
PHYSICAL REVIEW B 82, 014113 �2010�
1098-0121/2010/82�1�/014113�10� ©2010 The American Physical Society014113-1
first, to compare the Pnma↔ Imma↔R3c↔Pm3m se-quence of BaCeO3 with the comparable but subtly different
Pnma↔ Imma↔ I4 /mcm↔Pm3m sequence of SrZrO3,second, to examine the anelastic behavior of the Imma struc-ture which appears as an intermediate phase in some perovs-kites but not in others, third, to characterize the anelastic lossbehavior of the Pnma structure and, finally, to correlate theoverall elastic behavior with details of the spontaneous strainevolution extracted from high-resolution lattice-parameterdata.
II. STRAIN ANALYSIS OF SUCCESSIVEPHASE TRANSITIONS
Lattice parameters obtained by Knight19 from high-resolution powder neutron diffraction have been used to fol-low the evolution of individual order parameters, in terms of
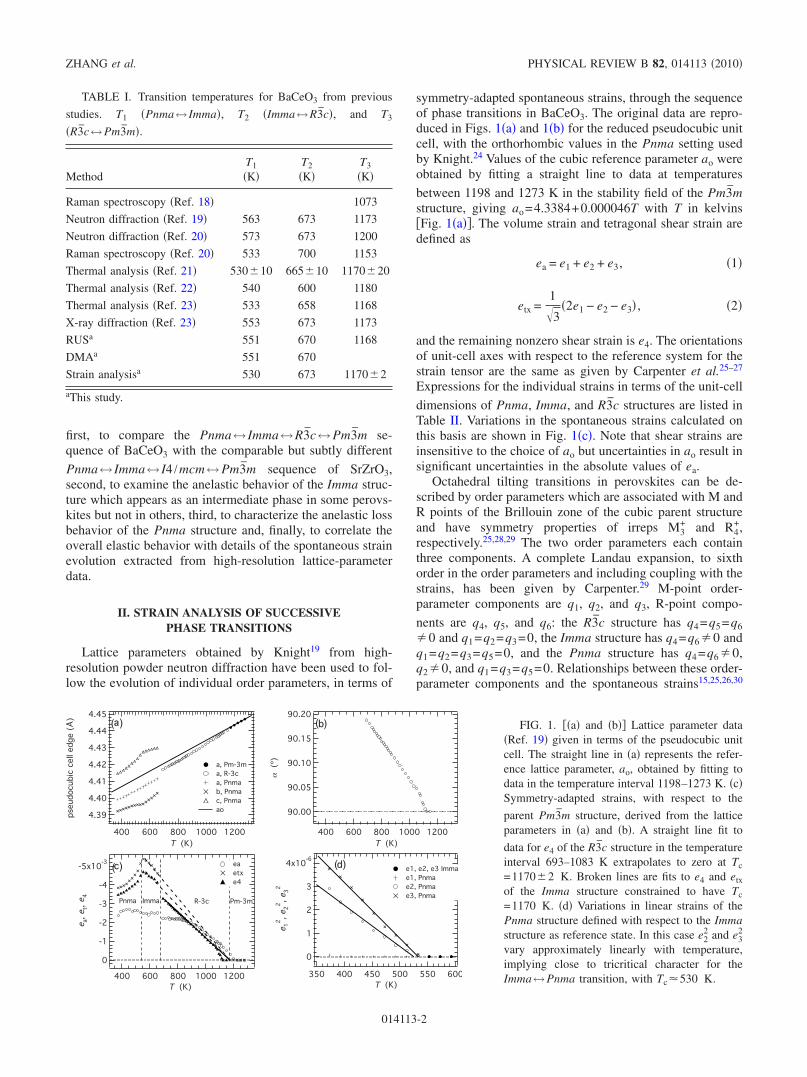
symmetry-adapted spontaneous strains, through the sequenceof phase transitions in BaCeO3. The original data are repro-duced in Figs. 1�a� and 1�b� for the reduced pseudocubic unitcell, with the orthorhombic values in the Pnma setting usedby Knight.24 Values of the cubic reference parameter ao wereobtained by fitting a straight line to data at temperatures
between 1198 and 1273 K in the stability field of the Pm3mstructure, giving ao=4.3384+0.000046T with T in kelvins�Fig. 1�a��. The volume strain and tetragonal shear strain aredefined as
ea = e1 + e2 + e3, �1�
etx =1�3
�2e1 − e2 − e3� , �2�
and the remaining nonzero shear strain is e4. The orientationsof unit-cell axes with respect to the reference system for thestrain tensor are the same as given by Carpenter et al.25–27
Expressions for the individual strains in terms of the unit-cell
dimensions of Pnma, Imma, and R3c structures are listed inTable II. Variations in the spontaneous strains calculated onthis basis are shown in Fig. 1�c�. Note that shear strains areinsensitive to the choice of ao but uncertainties in ao result insignificant uncertainties in the absolute values of ea.
Octahedral tilting transitions in perovskites can be de-scribed by order parameters which are associated with M andR points of the Brillouin zone of the cubic parent structureand have symmetry properties of irreps M3
+ and R4+,
respectively.25,28,29 The two order parameters each containthree components. A complete Landau expansion, to sixthorder in the order parameters and including coupling with thestrains, has been given by Carpenter.29 M-point order-parameter components are q1, q2, and q3, R-point compo-
nents are q4, q5, and q6: the R3c structure has q4=q5=q6�0 and q1=q2=q3=0, the Imma structure has q4=q6�0 andq1=q2=q3=q5=0, and the Pnma structure has q4=q6�0,q2�0, and q1=q3=q5=0. Relationships between these order-parameter components and the spontaneous strains15,25,26,30
TABLE I. Transition temperatures for BaCeO3 from previous
studies. T1 �Pnma↔ Imma�, T2 �Imma↔R3c�, and T3
�R3c↔Pm3m�.
MethodT1
�K�T2
�K�T3
�K�
Raman spectroscopy �Ref. 18� 1073
Neutron diffraction �Ref. 19� 563 673 1173
Neutron diffraction �Ref. 20� 573 673 1200
Raman spectroscopy �Ref. 20� 533 700 1153
Thermal analysis �Ref. 21� 530�10 665�10 1170�20
Thermal analysis �Ref. 22� 540 600 1180
Thermal analysis �Ref. 23� 533 658 1168
X-ray diffraction �Ref. 23� 553 673 1173
RUSa 551 670 1168
DMAa 551 670
Strain analysisa 530 673 1170�2
aThis study.
4.45
4.44
4.43
4.42
4.41
4.40
4.39pse
udocu
bic
celledge(Å
)
12001000800600400T (K)
a, Pm-3ma, R-3ca, Pnmab, Pnmac, Pnmaao
90.20
90.15
90.10
90.05
90.00
α(º)
12001000800600400T (K)
-5x10⁻³
-4
-3
-2
-1
0
e a,e t,e 4
12001000800600400T (K)
eaetxe4
Pm-3mR-3cImmaPnma
4x10⁻⁶
3
2
1
0
e 12,e 2
2,e 3
2
600550500450400350T (K)
e1, e2, e3 Immae1, Pnmae2, Pnmae3, Pnma
a b
c d(
((
(
)
)
)
)
FIG. 1. ��a� and �b�� Lattice parameter data�Ref. 19� given in terms of the pseudocubic unitcell. The straight line in �a� represents the refer-ence lattice parameter, ao, obtained by fitting todata in the temperature interval 1198–1273 K. �c�Symmetry-adapted strains, with respect to the
parent Pm3m structure, derived from the latticeparameters in �a� and �b�. A straight line fit to
data for e4 of the R3c structure in the temperatureinterval 693–1083 K extrapolates to zero at Tc
=1170�2 K. Broken lines are fits to e4 and etx
of the Imma structure constrained to have Tc
=1170 K. �d� Variations in linear strains of thePnma structure defined with respect to the Immastructure as reference state. In this case e2
2 and e32
vary approximately linearly with temperature,implying close to tricritical character for theImma↔Pnma transition, with Tc�530 K.
ZHANG et al. PHYSICAL REVIEW B 82, 014113 �2010�
014113-2
are listed in Table II, with Ciko representing elastic constants
of the Pm3m reference structure in the usual way. In the R3cstructure, e4 is expected to scale with q4
2 and the data are
consistent with e4�q42�T �Fig. 1�c��.24 The Pm3m↔R3c
transition is therefore second order in character and thestraight line fit to data for the temperature interval 693–1083K gave Tc=1170�2 K. Data for the temperature interval1093–1148 K fall below the linear trend but at such smallvalues the deviations from cubic geometry are at or belowthe limits of resolution of the primary diffraction data.
The R3c↔ Imma transition is marked by small disconti-nuities in ea and e4 �Fig. 1�c�� and is first order incharacter.19,24 In principle, there is a metastable
Pm3m↔ Imma transition with the same critical temperature
as for the Pm3m↔R3c transition. Limited data for etx and e4of the Imma phase �both �q4
2� can at least be interpreted onthis basis �Fig. 1�c��. As in the case of the
Pm3m↔ I4 /mcm↔ Imma↔Pnma sequence in SrZrO3
�Ref. 15� and the Pm3m↔ I4 /mcm↔Pnma sequence inCaTiO3,25 ea does not scale linearly with the shear strains,suggesting higher order coupling effects or a temperature-dependent order-parameter coupling coefficient for the vol-ume strain.
Lattice parameter data show continuous variationsthrough the Imma↔Pnma transition �Fig. 1�a�� and theseconvert to continuous variations in the magnitudes of both e4
and etx �Fig. 1�c��, though with nonlinear dependences ontemperature. If the reference state for this transition is takenas the Imma structure, the transition will have a single orderparameter, Q, and the linear strains are expected to scale ase1�e2�e3�Q2. Using straight line fits to the data for a, b,and c of the Imma structure to obtain ao, bo, and co, thelinear strains e1= �a−ao� /ao, e2= �b−bo� /bo, ande3= �c−co� /co �reference axes X �a, Y �b, and Z �c� have beendetermined and these scale with temperature approximatelyas e1
2�e22�e3
2�Q4�T �Fig. 1�d��. The transition is thus closeto tricritical, with Tc�530 K.
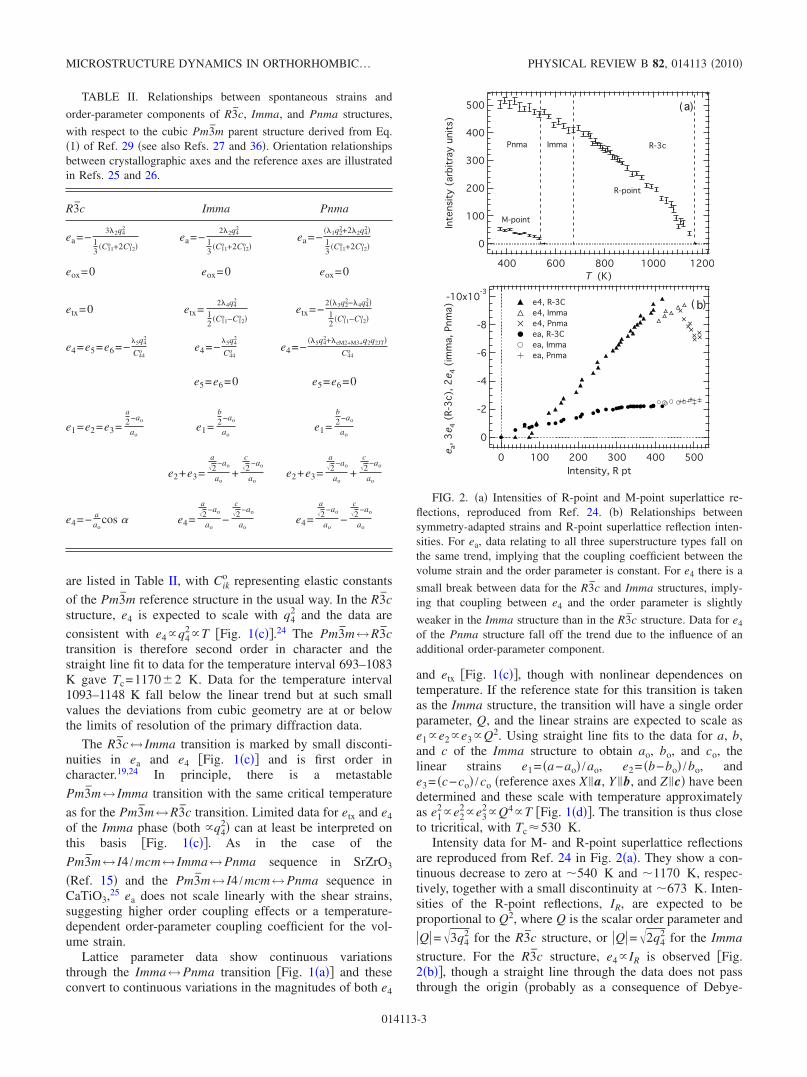
Intensity data for M- and R-point superlattice reflectionsare reproduced from Ref. 24 in Fig. 2�a�. They show a con-tinuous decrease to zero at �540 K and �1170 K, respec-tively, together with a small discontinuity at �673 K. Inten-sities of the R-point reflections, IR, are expected to beproportional to Q2, where Q is the scalar order parameter and
Q=�3q42 for the R3c structure, or Q=�2q4
2 for the Imma
structure. For the R3c structure, e4� IR is observed �Fig.2�b��, though a straight line through the data does not passthrough the origin �probably as a consequence of Debye-
TABLE II. Relationships between spontaneous strains and
order-parameter components of R3c, Imma, and Pnma structures,
with respect to the cubic Pm3m parent structure derived from Eq.�1� of Ref. 29 �see also Refs. 27 and 36�. Orientation relationshipsbetween crystallographic axes and the reference axes are illustratedin Refs. 25 and 26.
R3c Imma Pnma
ea=−3�2q4
2
13
�C11o +2C12
o �ea=−
2�2q42
13
�C11o +2C12
o �ea=−
��1q22+2�2q4
2�13
�C11o +2C12
o �
eox=0 eox=0 eox=0
etx=0 etx=2�4q4
2
12
�C11o −C12
o �etx=−
2��3q22−�4q4
2�12
�C11o −C12
o �
e4=e5=e6=−�5q4
2
C44o e4=−
�5q42
C44o e4=−
��5q42+�eM2+M3+q2q2JT�
C44o
e5=e6=0 e5=e6=0
e1=e2=e3=a2 −ao
aoe1=
b2 −ao
aoe1=
b2 −ao
ao
e2+e3=
a�2
−ao
ao+
c�2
−ao
aoe2+e3=
a�2
−ao
ao+
c�2
−ao
ao
e4=− aao
cos � e4=
a�2
−ao
ao−
c�2
−ao
aoe4=
a�2
−ao
ao−
c�2
−ao
ao
500
400
300
200
100
0
Inte
nsity
(arbitrayunits)
12001000800600400T (K)
R-point
M-point
Pnma Imma R-3c
-10x10-3
-8
-6
-4
-2
0e a,3e 4
(R-3
c),2e 4
(imma,
Pnma)
5004003002001000Intensity, R pt
e4, R-3Ce4, Immae4, Pnmaea, R-3Cea, Immaea, Pnma
a
b(
( )
)
FIG. 2. �a� Intensities of R-point and M-point superlattice re-flections, reproduced from Ref. 24. �b� Relationships betweensymmetry-adapted strains and R-point superlattice reflection inten-sities. For ea, data relating to all three superstructure types fall onthe same trend, implying that the coupling coefficient between thevolume strain and the order parameter is constant. For e4 there is a
small break between data for the R3c and Imma structures, imply-ing that coupling between e4 and the order parameter is slightly
weaker in the Imma structure than in the R3c structure. Data for e4
of the Pnma structure fall off the trend due to the influence of anadditional order-parameter component.
MICROSTRUCTURE DYNAMICS IN ORTHORHOMBIC… PHYSICAL REVIEW B 82, 014113 �2010�
014113-3
Waller contributions or because the background intensitywas not accounted for quite correctly�. The e4 data have been
plotted in Fig. 2�b� as 3e4 and 2e4, respectively, for the R3cand Imma structures �since e4=−�5q4
2 /C44o in each case� to
test whether the discontinuity is due entirely to the disconti-nuity in Q or whether there is also a change in the strength ofthe coupling coefficient, �5. The fact that the Imma values
plot slightly below the R3c values implies that �5 reducesslightly in the Imma structure. On the other hand, data for eafollow the same trend for both structures, implying that �2
remains the same. Thus the R3c↔ Imma transition is markedby a small reduction in both the R-point order parameter andin the strength of coupling with e4.
The tetragonal shear strain etx decreases at theImma↔Pnma transition due to the influence of M-point tilt-ing �Table II�. On the other hand, e4 couples with theM-point order parameter only as ��6+�7�e4
2q22 and this cou-
pling influences the strain evolution as �from Refs. 15 and29�
e4 = −�5q4
2
C44o + 2��6 + �7�q2
2 . �3�
It is generally assumed that C44o is much greater than ��6
+�7�q42 so that the additional term in the denominator can be
dropped. In this case, e4 should continue to increase with IRin the stability field of the Pnma structure but it actuallydecreases �Figs. 1�c� and 2�b��. This can be explained by theoperation of an additional, secondary, order parameter of thePnma structure. From a symmetry analysis of cooperativeJahn-Teller transitions in perovskites two types of orderingof distorted octahedra were identified by Carpenter andHoward.27 These are associated with irreps �3
+ and M2+ of the
parent cubic space group and correspond to ordering of theunique axis of uniaxially distorted octahedra parallel to thecrystallographic b axis or ordered in a staggered arrangementwithin planes parallel to �010�. The �3
+ order parametercouples biquadratically with e4 and therefore would be ex-pected to contribute to e4 only in the same manner as q2 inEq. �3�. On the other hand, the M2
+ order parameter �compo-nents q1JT=q3JT=0 and q2JT�0 under Pnma symmetry� hasa coupling term of the form �eM2+M3+e4q2q2JT so that thevariation in e4 becomes �from Ref. 27�
e4 =− �5q4
2 − �eM2+M3+q2q2JT
C44o . �4�
If q2JT varies approximately linearly with q2, the observedpattern of nonlinear variation in e4 for a tricritical transitionwould result. In other words, the strain evolution can beunderstood in terms of the normal effects of octahedral tilt-ing together with a significant contribution from deformationof individual octahedra which mimics the larger distortionsthat occur at cooperative Jahn-Teller transitions in perovs-kites with the Pnma structure, as described by Carpenter andHoward.27,31
In summary, the magnitudes of the strains are generallytypical of those accompanying octahedral tilting transitionsin perovskites. Formal strain analysis confirms second-order
character for the Pm3m↔R3c transition, first-order charac-
ter for the R3c↔ Imma transition, and approximately tricriti-cal character for the Imma↔Pnma transition. The
R3c↔ Imma transition is accompanied by a small reductionin the amount of R-point tilting and a small reduction in thestrength of coupling with the shear strain e4. The data do notprovide evidence of whether the strength of coupling be-tween R-point order-parameter components and etx �coupling
coefficient �4� differs between the R3c, Imma, and Pnmastructures. The Imma↔Pnma transition gives rise to a re-duction in the magnitude of both etx and e4, indicating thatstrain-mediated coupling between the M-point and R-pointtilts is unfavorable. Evidence of the nonlinear dependence ofthe volume strain ea and the contribution of an M2
+ compo-nent to e4 implies that the overall transition mechanism in-volves some degree of deformation of the CeO6 octahedra.As well as having opposite sign, the pattern of variation in e4in the Pnma structure of BaCeO3 differs from that shown byCaTiO3 �Ref. 25� and SrZrO3.15 Finally, ea is negative inCaTiO3 �Ref. 25� and BaCeO3 �this analysis� and positive atmost temperatures in SrZrO3.15
III. ELASTICITY: EXPERIMENTAL DETAILS
BaCeO3 powder, used by Knight19,24 for neutron-diffraction experiments, was ground in acetone using an ag-ate ball mill at 600 rpm for 1 h with PULVERISETTE 7from FRITSCH. The milled powder, �5 g, was pressed intoa cylindrical pellet of diameter 13 mm and height �6 mmusing a pellet die under �1800 psi for 5 min with an OmegaBench Press from SHINN FU. The pellet was sintered in airat 1450 °C for 48 h and the detailed procedure is as follows.�1� Heated from 20 to 1400 °C at 10 °C /min. �2� Held at1400 °C for 2 h. �3� Heated from 1400 to 1450 °C at5 °C /min. �4� Held at 1450 °C for 48 h. �5� Cooled from1450 to 20 °C at 3 °C /min.
Rectangular parallelepiped samples were cut from the sin-tered pellet using an annular diamond saw, lubricated withparaffin. The parallelepiped used for RUS measurements haddimensions 1.66�2.11�2.64 mm3 and mass 0.053 g. Thedensity determined from these parameters is 5.73 g /cm3,which is �91% of the theoretical density, 6.29 g /cm3.32 ForDMA tests, a sample was polished to the dimensions�0.22�2.00�7.20 mm3. An offcut of the sample was alsocrushed and investigated by XRD, using a Bruker D8 diffrac-tometer with Cu K� radiation at 40 kV and 40 mA. Thediffraction angle 2 was scanned from 5° to 95°. Steps werein increments of 0.02° and the counts were collected for 3 sat each step. The diffraction pattern was entirely consistentwith the known orthorhombic structure of BaCeO3.
RUS data were collected at low temperatures �10–300 K�using dynamic resonance system modulus II electronics, andan orange helium flow cryostat, as described by McKnight etal.33 Frequency was scanned from 100 to 1200 kHz. High-temperature data �300–1300 K� for the same frequency rangewere collected using alumina buffer rods protruding into ahorizontal Netzsch furnace34 and Stanford electronics de-scribed by Migliori and Maynard.35 The elastic moduli were
ZHANG et al. PHYSICAL REVIEW B 82, 014113 �2010�
014113-4
determined from fitting 27 resonance peaks with an overallroot-mean-square error of �0.3%. In addition, internal fric-tion, i.e., inverse of quality factor Q was obtained fromasymmetric Lorentz fitting of the resonance peak, Q−1
=f / f0. f is full width at half maximum of the resonancepeak, and f0 is the resonance frequency. Temperature mea-sured by a thermocouple close to the sample was calibratedusing Eq. �5�, determined from known transition tempera-tures of single-crystal quartz �846 K�, LaAlO3 �817 K�, andCa0.7Sr0.3TiO3 �1204 K�, as described by McKnight et al.�Ref. 15�,
Tcal. = 4.3766 + 0.98604 � Tread. �5�
DMA tests were performed using a diamond DMA fromPerkinElmer within the temperature range 150–800 K. Thesample was mounted on knife edges in three-point bendinggeometry. Static and dynamic forces Fs+Fd exp�i�t� are ap-plied in the frequency range of 0.1–100 Hz using a steel rod.There is a phase lag � between the applied force and thesample’s deflection response, which is read out via the dis-placement of the rod ud. Attenuation tan �, storage modulusE� �real component of complex Young’s modulus�, and lossmodulus E� �imaginary component of complex Young’smodulus� were determined,
tan � = E�/E�, �6�
E = E� + iE� =l3
4t3w
FD
uDexp�i�� . �7�
l is the spacing between the two bottom knife edges, 5.00mm; t is the thickness of the sample, �0.22 mm; and w isthe width of the sample, �2.00 mm. Fs=60 mN, FD=50 mN, gain 1, amplitude 5 m, and maximum deforma-tion 100 m were used for all measurements. The samplewas heated from room temperature to 800 K and then cooledback to room temperature. Next, the sample was cooled to150 K and then heated back to room temperature. The heat-ing and cooling rates were all at 3 °C /min.
IV. ELASTICITY RESULTS
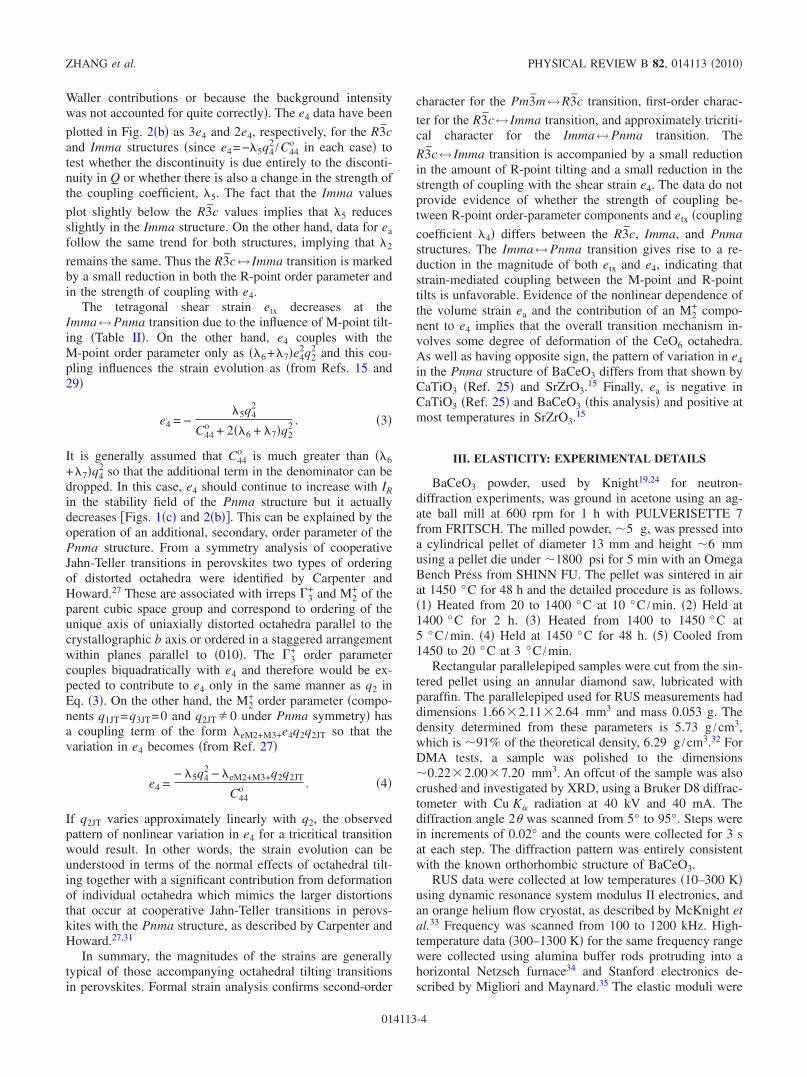
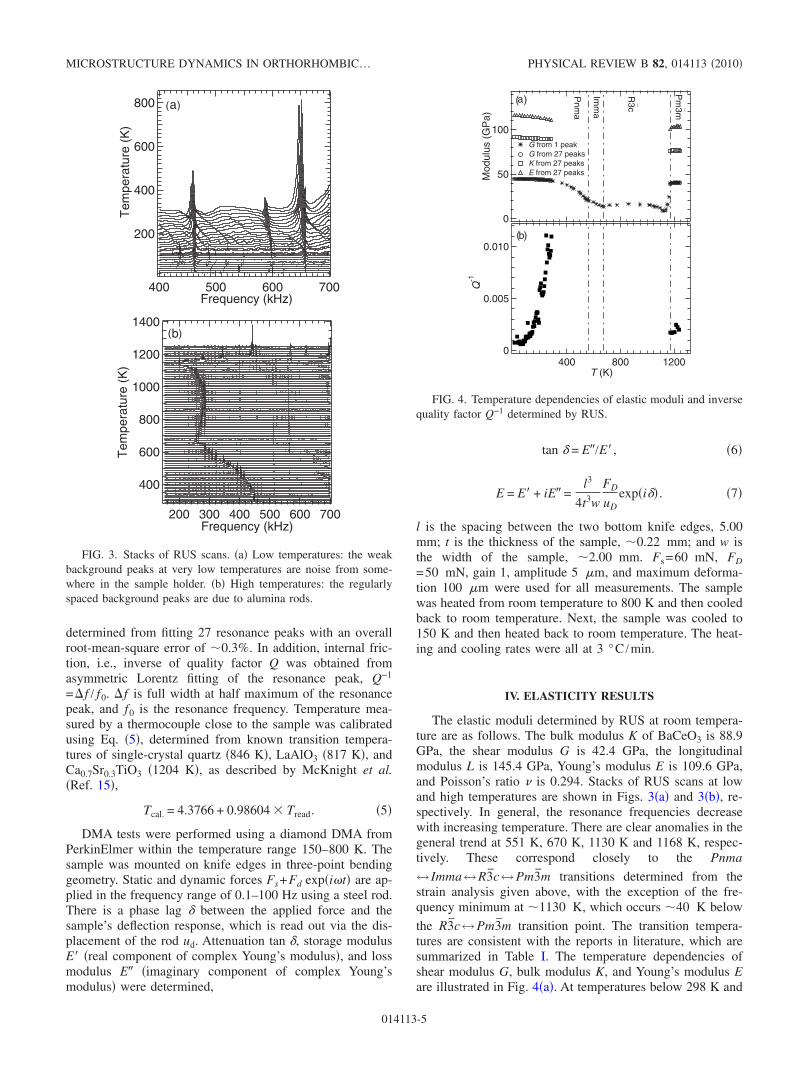
The elastic moduli determined by RUS at room tempera-ture are as follows. The bulk modulus K of BaCeO3 is 88.9GPa, the shear modulus G is 42.4 GPa, the longitudinalmodulus L is 145.4 GPa, Young’s modulus E is 109.6 GPa,and Poisson’s ratio � is 0.294. Stacks of RUS scans at lowand high temperatures are shown in Figs. 3�a� and 3�b�, re-spectively. In general, the resonance frequencies decreasewith increasing temperature. There are clear anomalies in thegeneral trend at 551 K, 670 K, 1130 K and 1168 K, respec-tively. These correspond closely to the Pnma
↔ Imma↔R3c↔Pm3m transitions determined from thestrain analysis given above, with the exception of the fre-quency minimum at �1130 K, which occurs �40 K below
the R3c↔Pm3m transition point. The transition tempera-tures are consistent with the reports in literature, which aresummarized in Table I. The temperature dependencies ofshear modulus G, bulk modulus K, and Young’s modulus Eare illustrated in Fig. 4�a�. At temperatures below 298 K and
800
600
400
200
Tem
pera
ture
(K)
700600500400Frequency (kHz)
a
1400
1200
1000
800
600
400
Tem
pera
ture
(K)
700600500400300200Frequency (kHz)
b(
(
)
)
FIG. 3. Stacks of RUS scans. �a� Low temperatures: the weakbackground peaks at very low temperatures are noise from some-where in the sample holder. �b� High temperatures: the regularlyspaced background peaks are due to alumina rods.
0.010
0.005
0
Q-1
1200800400T (K)
b
100
50
0
Mod
ulus
(GP
a)
Pnm
a
Imm
a
_
R3c _
Pm
3m
G from 1 peakG from 27 peaksK from 27 peaksE from 27 peaks
a
(
(
)
)
FIG. 4. Temperature dependencies of elastic moduli and inversequality factor Q−1 determined by RUS.
MICROSTRUCTURE DYNAMICS IN ORTHORHOMBIC… PHYSICAL REVIEW B 82, 014113 �2010�
014113-5
above 1180 K, the resonance peaks were strong and values ofthe elastic parameters are from fitting. Between 298 and1180 K, most of the resonance peaks were too weak to bedetected but the variation in shear modulus over the entiretemperature range could still be determined from the fre-quencies of the first resonance peak. This is essentially dueto a pure shear mode and its frequency was calibrated using
GT =fT
2G298
f2982 , �8�
where f298 and G298 are, respectively, the frequency of thefirst peak and the fitted value of G at 298 K. Good agreementis obtained with data obtained from peak fitting at lowertemperatures. In general, the elastic moduli decrease withincreasing temperature up to the cubic↔ rhombohedral tran-sition. Stability limits for the different phases from diffrac-tion data have been added to Fig. 4 to show that anomaliescorrespond to the known transition temperatures. Figure 4�b�shows the temperature dependence of Q−1 determined byRUS at temperatures where individual resonance peaks werewell resolved and distinct from regularly spaced backgroundpeaks due to the alumina rods. Dissipation in the Pnmaphase increases with increasing temperature and is not mea-sureable above �0.011 at �290 K. Dissipation is then rela-
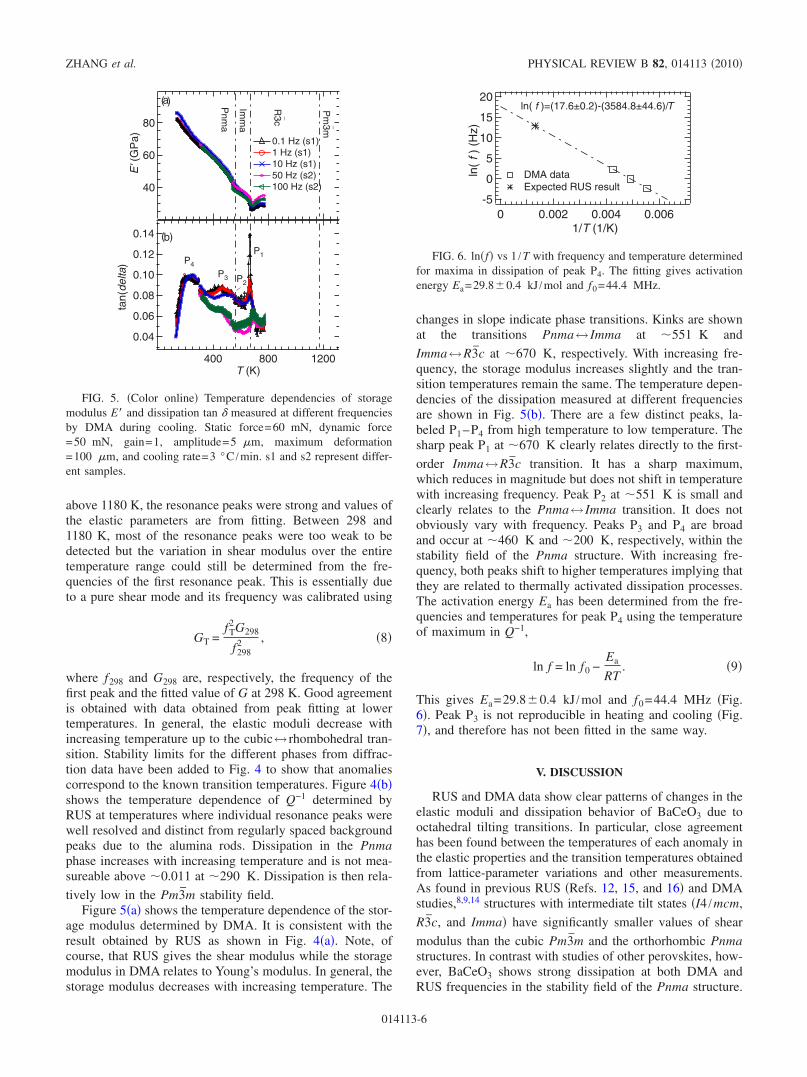
tively low in the Pm3m stability field.Figure 5�a� shows the temperature dependence of the stor-
age modulus determined by DMA. It is consistent with theresult obtained by RUS as shown in Fig. 4�a�. Note, ofcourse, that RUS gives the shear modulus while the storagemodulus in DMA relates to Young’s modulus. In general, thestorage modulus decreases with increasing temperature. The
changes in slope indicate phase transitions. Kinks are shownat the transitions Pnma↔ Imma at �551 K and
Imma↔R3c at �670 K, respectively. With increasing fre-quency, the storage modulus increases slightly and the tran-sition temperatures remain the same. The temperature depen-dencies of the dissipation measured at different frequenciesare shown in Fig. 5�b�. There are a few distinct peaks, la-beled P1–P4 from high temperature to low temperature. Thesharp peak P1 at �670 K clearly relates directly to the first-
order Imma↔R3c transition. It has a sharp maximum,which reduces in magnitude but does not shift in temperaturewith increasing frequency. Peak P2 at �551 K is small andclearly relates to the Pnma↔ Imma transition. It does notobviously vary with frequency. Peaks P3 and P4 are broadand occur at �460 K and �200 K, respectively, within thestability field of the Pnma structure. With increasing fre-quency, both peaks shift to higher temperatures implying thatthey are related to thermally activated dissipation processes.The activation energy Ea has been determined from the fre-quencies and temperatures for peak P4 using the temperatureof maximum in Q−1,
ln f = ln f0 −Ea
RT. �9�
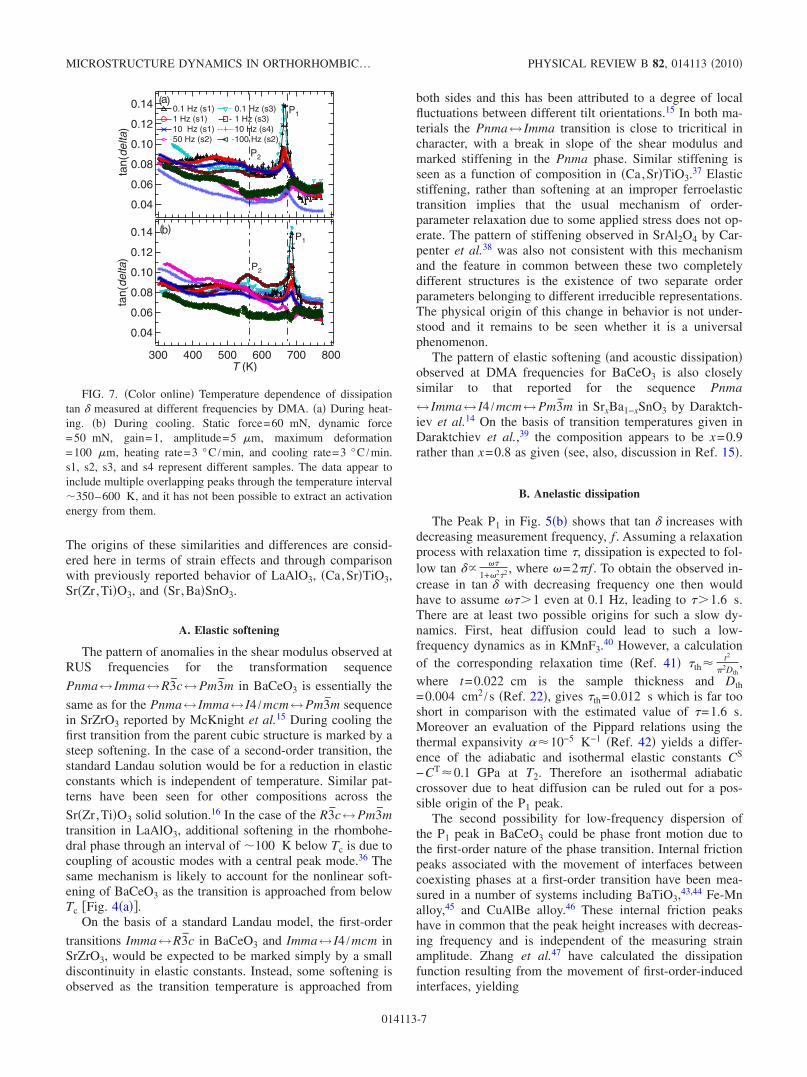
This gives Ea=29.8�0.4 kJ /mol and f0=44.4 MHz �Fig.6�. Peak P3 is not reproducible in heating and cooling �Fig.7�, and therefore has not been fitted in the same way.
V. DISCUSSION
RUS and DMA data show clear patterns of changes in theelastic moduli and dissipation behavior of BaCeO3 due tooctahedral tilting transitions. In particular, close agreementhas been found between the temperatures of each anomaly inthe elastic properties and the transition temperatures obtainedfrom lattice-parameter variations and other measurements.As found in previous RUS �Refs. 12, 15, and 16� and DMAstudies,8,9,14 structures with intermediate tilt states �I4 /mcm,
R3c, and Imma� have significantly smaller values of shear
modulus than the cubic Pm3m and the orthorhombic Pnmastructures. In contrast with studies of other perovskites, how-ever, BaCeO3 shows strong dissipation at both DMA andRUS frequencies in the stability field of the Pnma structure.
0.14
0.12
0.10
0.08
0.06
0.04
tan(
delta
)
1200800400T (K)
bP1
P2P3
P4
80
60
40
E'(
GP
a) 0.1 Hz (s1)1 Hz (s1)10 Hz (s1)50 Hz (s2)100 Hz (s2)
Pnm
a
Imm
a
_
R3c
_
Pm
3m
a
(
(
)
)
FIG. 5. �Color online� Temperature dependencies of storagemodulus E� and dissipation tan � measured at different frequenciesby DMA during cooling. Static force=60 mN, dynamic force=50 mN, gain=1, amplitude=5 m, maximum deformation=100 m, and cooling rate=3 °C /min. s1 and s2 represent differ-ent samples.
20
15
10
5
0
-5
ln(
f)(H
z)
0.0060.0040.00201/T (1/K)
DMA dataExpected RUS result
ln( f )=(17.6±0.2)-(3584.8±44.6)/T
FIG. 6. ln�f� vs 1 /T with frequency and temperature determinedfor maxima in dissipation of peak P4. The fitting gives activationenergy Ea=29.8�0.4 kJ /mol and f0=44.4 MHz.
ZHANG et al. PHYSICAL REVIEW B 82, 014113 �2010�
014113-6
The origins of these similarities and differences are consid-ered here in terms of strain effects and through comparisonwith previously reported behavior of LaAlO3, �Ca,Sr�TiO3,Sr�Zr,Ti�O3, and �Sr,Ba�SnO3.
A. Elastic softening
The pattern of anomalies in the shear modulus observed atRUS frequencies for the transformation sequence
Pnma↔ Imma↔R3c↔Pm3m in BaCeO3 is essentially the
same as for the Pnma↔ Imma↔ I4 /mcm↔Pm3m sequencein SrZrO3 reported by McKnight et al.15 During cooling thefirst transition from the parent cubic structure is marked by asteep softening. In the case of a second-order transition, thestandard Landau solution would be for a reduction in elasticconstants which is independent of temperature. Similar pat-terns have been seen for other compositions across the
Sr�Zr,Ti�O3 solid solution.16 In the case of the R3c↔Pm3mtransition in LaAlO3, additional softening in the rhombohe-dral phase through an interval of �100 K below Tc is due tocoupling of acoustic modes with a central peak mode.36 Thesame mechanism is likely to account for the nonlinear soft-ening of BaCeO3 as the transition is approached from belowTc �Fig. 4�a��.
On the basis of a standard Landau model, the first-order
transitions Imma↔R3c in BaCeO3 and Imma↔ I4 /mcm inSrZrO3, would be expected to be marked simply by a smalldiscontinuity in elastic constants. Instead, some softening isobserved as the transition temperature is approached from
both sides and this has been attributed to a degree of localfluctuations between different tilt orientations.15 In both ma-terials the Pnma↔ Imma transition is close to tricritical incharacter, with a break in slope of the shear modulus andmarked stiffening in the Pnma phase. Similar stiffening isseen as a function of composition in �Ca,Sr�TiO3.37 Elasticstiffening, rather than softening at an improper ferroelastictransition implies that the usual mechanism of order-parameter relaxation due to some applied stress does not op-erate. The pattern of stiffening observed in SrAl2O4 by Car-penter et al.38 was also not consistent with this mechanismand the feature in common between these two completelydifferent structures is the existence of two separate orderparameters belonging to different irreducible representations.The physical origin of this change in behavior is not under-stood and it remains to be seen whether it is a universalphenomenon.
The pattern of elastic softening �and acoustic dissipation�observed at DMA frequencies for BaCeO3 is also closelysimilar to that reported for the sequence Pnma
↔ Imma↔ I4 /mcm↔Pm3m in SrxBa1−xSnO3 by Daraktch-iev et al.14 On the basis of transition temperatures given inDaraktchiev et al.,39 the composition appears to be x=0.9rather than x=0.8 as given �see, also, discussion in Ref. 15�.
B. Anelastic dissipation
The Peak P1 in Fig. 5�b� shows that tan � increases withdecreasing measurement frequency, f . Assuming a relaxationprocess with relaxation time �, dissipation is expected to fol-low tan ��
��
1+�2�2 , where �=2�f . To obtain the observed in-crease in tan � with decreasing frequency one then wouldhave to assume ���1 even at 0.1 Hz, leading to ��1.6 s.There are at least two possible origins for such a slow dy-namics. First, heat diffusion could lead to such a low-frequency dynamics as in KMnF3.40 However, a calculationof the corresponding relaxation time �Ref. 41� �th� t2
�2Dth,
where t=0.022 cm is the sample thickness and Dth=0.004 cm2 /s �Ref. 22�, gives �th=0.012 s which is far tooshort in comparison with the estimated value of �=1.6 s.Moreover an evaluation of the Pippard relations using thethermal expansivity ��10−5 K−1 �Ref. 42� yields a differ-ence of the adiabatic and isothermal elastic constants CS
−CT�0.1 GPa at T2. Therefore an isothermal adiabaticcrossover due to heat diffusion can be ruled out for a pos-sible origin of the P1 peak.
The second possibility for low-frequency dispersion ofthe P1 peak in BaCeO3 could be phase front motion due tothe first-order nature of the phase transition. Internal frictionpeaks associated with the movement of interfaces betweencoexisting phases at a first-order transition have been mea-sured in a number of systems including BaTiO3,43,44 Fe-Mnalloy,45 and CuAlBe alloy.46 These internal friction peakshave in common that the peak height increases with decreas-ing frequency and is independent of the measuring strainamplitude. Zhang et al.47 have calculated the dissipationfunction resulting from the movement of first-order-inducedinterfaces, yielding
0.14
0.12
0.10
0.08
0.06
0.04
tan(
delta
)0.1 Hz (s1) 0.1 Hz (s3)1 Hz (s1) 1 Hz (s3)10 Hz (s1) 10 Hz (s4)50 Hz (s2) 100 Hz (s2)
aP1
P2
0.14
0.12
0.10
0.08
0.06
0.04
tan(
delta
)
800700600500400300T (K)
bP1
P2
(
(
)
)
FIG. 7. �Color online� Temperature dependence of dissipationtan � measured at different frequencies by DMA. �a� During heat-ing. �b� During cooling. Static force=60 mN, dynamic force=50 mN, gain=1, amplitude=5 m, maximum deformation=100 m, heating rate=3 °C /min, and cooling rate=3 °C /min.s1, s2, s3, and s4 represent different samples. The data appear toinclude multiple overlapping peaks through the temperature interval�350–600 K, and it has not been possible to extract an activationenergy from them.
MICROSTRUCTURE DYNAMICS IN ORTHORHOMBIC… PHYSICAL REVIEW B 82, 014113 �2010�
014113-7
Q−1 = A�T� T
��n1
+ B�T��−n2, �10�
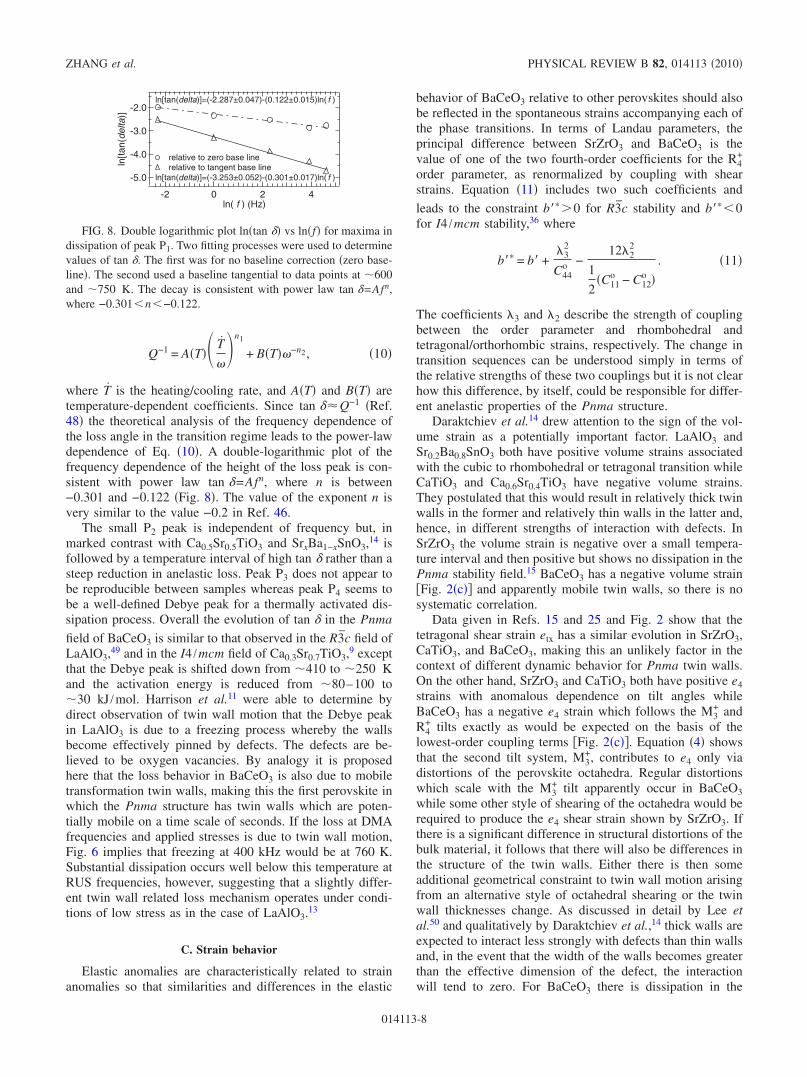
where T is the heating/cooling rate, and A�T� and B�T� aretemperature-dependent coefficients. Since tan ��Q−1 �Ref.48� the theoretical analysis of the frequency dependence ofthe loss angle in the transition regime leads to the power-lawdependence of Eq. �10�. A double-logarithmic plot of thefrequency dependence of the height of the loss peak is con-sistent with power law tan �=Afn, where n is between−0.301 and −0.122 �Fig. 8�. The value of the exponent n isvery similar to the value −0.2 in Ref. 46.
The small P2 peak is independent of frequency but, inmarked contrast with Ca0.5Sr0.5TiO3 and SrxBa1−xSnO3,14 isfollowed by a temperature interval of high tan � rather than asteep reduction in anelastic loss. Peak P3 does not appear tobe reproducible between samples whereas peak P4 seems tobe a well-defined Debye peak for a thermally activated dis-sipation process. Overall the evolution of tan � in the Pnma
field of BaCeO3 is similar to that observed in the R3c field ofLaAlO3,49 and in the I4 /mcm field of Ca0.3Sr0.7TiO3,9 exceptthat the Debye peak is shifted down from �410 to �250 Kand the activation energy is reduced from �80–100 to�30 kJ /mol. Harrison et al.11 were able to determine bydirect observation of twin wall motion that the Debye peakin LaAlO3 is due to a freezing process whereby the wallsbecome effectively pinned by defects. The defects are be-lieved to be oxygen vacancies. By analogy it is proposedhere that the loss behavior in BaCeO3 is also due to mobiletransformation twin walls, making this the first perovskite inwhich the Pnma structure has twin walls which are poten-tially mobile on a time scale of seconds. If the loss at DMAfrequencies and applied stresses is due to twin wall motion,Fig. 6 implies that freezing at 400 kHz would be at 760 K.Substantial dissipation occurs well below this temperature atRUS frequencies, however, suggesting that a slightly differ-ent twin wall related loss mechanism operates under condi-tions of low stress as in the case of LaAlO3.13
C. Strain behavior
Elastic anomalies are characteristically related to strainanomalies so that similarities and differences in the elastic
behavior of BaCeO3 relative to other perovskites should alsobe reflected in the spontaneous strains accompanying each ofthe phase transitions. In terms of Landau parameters, theprincipal difference between SrZrO3 and BaCeO3 is thevalue of one of the two fourth-order coefficients for the R4
+
order parameter, as renormalized by coupling with shearstrains. Equation �11� includes two such coefficients and
leads to the constraint b���0 for R3c stability and b���0for I4 /mcm stability,36 where
b�� = b� +�3
2
C44o −
12�22
1
2�C11
o − C12o �
. �11�
The coefficients �3 and �2 describe the strength of couplingbetween the order parameter and rhombohedral andtetragonal/orthorhombic strains, respectively. The change intransition sequences can be understood simply in terms ofthe relative strengths of these two couplings but it is not clearhow this difference, by itself, could be responsible for differ-ent anelastic properties of the Pnma structure.
Daraktchiev et al.14 drew attention to the sign of the vol-ume strain as a potentially important factor. LaAlO3 andSr0.2Ba0.8SnO3 both have positive volume strains associatedwith the cubic to rhombohedral or tetragonal transition whileCaTiO3 and Ca0.6Sr0.4TiO3 have negative volume strains.They postulated that this would result in relatively thick twinwalls in the former and relatively thin walls in the latter and,hence, in different strengths of interaction with defects. InSrZrO3 the volume strain is negative over a small tempera-ture interval and then positive but shows no dissipation in thePnma stability field.15 BaCeO3 has a negative volume strain�Fig. 2�c�� and apparently mobile twin walls, so there is nosystematic correlation.
Data given in Refs. 15 and 25 and Fig. 2 show that thetetragonal shear strain etx has a similar evolution in SrZrO3,CaTiO3, and BaCeO3, making this an unlikely factor in thecontext of different dynamic behavior for Pnma twin walls.On the other hand, SrZrO3 and CaTiO3 both have positive e4strains with anomalous dependence on tilt angles whileBaCeO3 has a negative e4 strain which follows the M3
+ andR4
+ tilts exactly as would be expected on the basis of thelowest-order coupling terms �Fig. 2�c��. Equation �4� showsthat the second tilt system, M3
+, contributes to e4 only viadistortions of the perovskite octahedra. Regular distortionswhich scale with the M3
+ tilt apparently occur in BaCeO3while some other style of shearing of the octahedra would berequired to produce the e4 shear strain shown by SrZrO3. Ifthere is a significant difference in structural distortions of thebulk material, it follows that there will also be differences inthe structure of the twin walls. Either there is then someadditional geometrical constraint to twin wall motion arisingfrom an alternative style of octahedral shearing or the twinwall thicknesses change. As discussed in detail by Lee etal.50 and qualitatively by Daraktchiev et al.,14 thick walls areexpected to interact less strongly with defects than thin wallsand, in the event that the width of the walls becomes greaterthan the effective dimension of the defect, the interactionwill tend to zero. For BaCeO3 there is dissipation in the
-5.0
-4.0
-3.0
-2.0ln
[tan(
delta
)]
420-2ln( f ) (Hz)
relative to zero base linerelative to tangent base line
ln[tan(delta)]=(-2.287±0.047)-(0.122±0.015)ln( f )
ln[tan(delta)]=(-3.253±0.052)-(0.301±0.017)ln( f )
FIG. 8. Double logarithmic plot ln�tan �� vs ln�f� for maxima indissipation of peak P1. Two fitting processes were used to determinevalues of tan �. The first was for no baseline correction �zero base-line�. The second used a baseline tangential to data points at �600and �750 K. The decay is consistent with power law tan �=Afn,where −0.301�n�−0.122.
ZHANG et al. PHYSICAL REVIEW B 82, 014113 �2010�
014113-8
Pnma structure which also extends to lower temperatures
than the similar dissipation in other R3c and I4 /mcm perovs-kites and the activation energy for freezing is lower. Bothgeometrical constraints and different interaction with defectstherefore seem to be implicated if the loss behavior is relateddirectly to twin walls.
VI. CONCLUSIONS
Perovskites with only one tilt system operating show sub-stantial anelastic softening and dissipation associated withthe mobility of twin walls under applied stress. The Immaphase of BaCeO3, at least, shows slightly higher dissipation
than the R3c phase but the overall pattern of softening isconsistent with that expected on the basis of strain/order pa-rameter relaxations. All Pnma phases so far examined showelastic stiffening which is counter to the expectation fromstandard Landau coupling models, and the simultaneous op-eration of two discrete order parameters with different sym-metries appears to be the common factor in this behavior.Distinctive anelastic behavior of the Pnma structure ofBaCeO3 correlates with a difference in the shear strain e4,and this appears to implicate shearing of the octahedra as animportant factor in either providing some additional geo-metrical constraints on wall mobility or in causing weaker
interaction with defects �or both�. This provides an additionalvariable which can be manipulated by choice of perovskitecomposition in the wider context of tailoring the structureand properties of twin walls in materials used for switchingor other device applications. For example, it will be interest-ing to find whether the twin walls in Pnma BaCeO3 areferrielectric, as appears to be case for the same twin walls inCaTiO3.2 Finally, the prospect is now raised that the Pnmastructure of �Mg,Fe�SiO3 perovskite in the deep earth mightcontain mobile twin walls and, hence, cause attenuation ofseismic waves. The key factor for analysis of this possibilitywill be the nature of any octahedral shearing which accom-panies tilting at extreme pressure and temperature.
ACKNOWLEDGMENTS
The authors would like to thank Andy Buckley and PaulA. Taylor at University of Cambridge for the help with ex-perimental setup and to thank Nikos Bonanos at TechnicalUniversity of Denmark for preparing BaCeO3 powder. Thiswork is financially supported by Natural Environment Re-search Council �NERC� under Grant No. NE/F017081/1.Support by the Austrian FWF �Grant No. P19284-N20� andby the University of Vienna within the IC “ExperimentalMaterials Science—Bulk Nanostructured Materials” is alsogratefully acknowledged.
1 A. Aird and E. K. H. Salje, J. Phys.: Condens. Matter 10, L377�1998�.
2 L. Goncalves-Ferreira, S. A. T. Redfern, E. Artacho, and E. K. H.Salje, Phys. Rev. Lett. 101, 097602 �2008�.
3 V. S. Postnikov, V. S. Pavlov, and S. K. Turkov, J. Phys. Chem.Solids 31, 1785 �1970�.
4 C. Wang, Q. F. Fang, Y. Shi, and Z. G. Zhu, Mater. Res. Bull.36, 2657 �2001�.
5 C. Wang, Q. F. Fang, and Z. G. Zhu, Appl. Phys. Lett. 80, 3578�2002�.
6 C. Wang, S. A. T. Redfern, M. Daraktchiev, and R. J. Harrison,Appl. Phys. Lett. 89, 152906 �2006�.
7 E. M. Bourim, H. Tanaka, M. Gabbay, G. Fantozzi, and B. L.Cheng, J. Appl. Phys. 91, 6662 �2002�.
8 R. J. Harrison and S. A. T. Redfern, Phys. Earth Planet. Inter.134, 253 �2002�.
9 R. J. Harrison, S. A. T. Redfern, and J. Street, Am. Mineral. 88,574 �2003�.
10 R. J. Harrison, S. A. T. Redfern, and U. Bismayer, Miner. Mag.68, 839 �2004�.
11 R. J. Harrison, S. A. T. Redfern, and E. K. H. Salje, Phys. Rev. B69, 144101 �2004�.
12 J. N. Walsh, P. A. Taylor, A. Buckley, T. W. Darling, J. Schreuer,and M. A. Carpenter, Phys. Earth Planet. Inter. 167, 110 �2008�.
13 M. A. Carpenter, A. Buckley, P. A. Taylor, and T. W. Darling, J.Phys.: Condens. Matter 22, 035405 �2010�.
14 M. Daraktchiev, R. J. Harrison, E. H. Mountstevens, and S. A. T.Redfern, Mater. Sci. Eng., A 442, 199 �2006�.
15 R. E. A. McKnight, C. J. Howard, and M. A. Carpenter, J. Phys.:
Condens. Matter 21, 015901 �2009�.16 R. E. A. McKnight, B. J. Kennedy, Q. Zhou, and M. A. Carpen-
ter, J. Phys.: Condens. Matter 21, 015902 �2009�.17 M. A. Carpenter, Am. Mineral. 92, 328 �2007�.18 T. Scherban, R. Villeneuve, L. Abello, and G. Lucazeau, Solid
State Commun. 84, 341 �1992�.19 K. S. Knight, Solid State Ionics 74, 109 �1994�.20 F. Genet, S. Loridant, C. Ritter, and G. Lucazeau, J. Phys. Chem.
Solids 60, 2009 �1999�.21 A. V. Kuzmin, V. P. Gorelov, B. T. Melekh, M. Glerup, and F. W.
Poulsen, Solid State Ionics 162-163, 13 �2003�.22 S. Yamanaka, T. Hamaguchi, T. Oyama, T. Matsuda, S. Koba-
yashi, and K. Kurosaki, J. Alloys Compd. 359, 1 �2003�.23 T. Ohzeki, S. Hasegawa, M. Shimizu, and T. Hashimoto, Solid
State Ionics 180, 1034 �2009�.24 K. S. Knight, Solid State Ionics 145, 275 �2001�.25 M. A. Carpenter, A. I. Becerro, and F. Seifert, Am. Mineral. 86,
348 �2001�.26 M. A. Carpenter, C. J. Howard, B. J. Kennedy, and K. S. Knight,
Phys. Rev. B 72, 024118 �2005�.27 M. A. Carpenter and C. J. Howard, Acta Crystallogr., Sect. B:
Struct. Sci. 65, 134 �2009�.28 C. J. Howard and H. T. Stokes, Acta Crystallogr., Sect. B: Struct.
Sci. 54, 782 �1998�.29 M. A. Carpenter, Am. Mineral. 92, 309 �2007�.30 M. A. Carpenter, C. J. Howard, K. S. Knight, and Z. Zhang, J.
Phys.: Condens. Matter 18, 10725 �2006�.31 M. A. Carpenter and C. J. Howard, Acta Crystallogr., Sect. B:
Struct. Sci. 65, 147 �2009�.
MICROSTRUCTURE DYNAMICS IN ORTHORHOMBIC… PHYSICAL REVIEW B 82, 014113 �2010�
014113-9
32 S. Loridant, L. Abello, E. Siebert, and G. Lucazeau, Solid StateIonics 78, 249 �1995�.
33 R. E. A. McKnight, M. A. Carpenter, T. M. Darling, A. Buckley,and P. A. Taylor, Am. Mineral. 92, 1665 �2007�.
34 R. E. A. McKnight, T. Moxon, A. Buckley, P. A. Taylor, T. W.Darling, and M. A. Carpenter, J. Phys.: Condens. Matter 20,075229 �2008�.
35 A. Migliori and J. D. Maynard, Rev. Sci. Instrum. 76, 121301�2005�.
36 M. A. Carpenter, S. V. Sinogeikin, and J. D. Bass, J. Phys.:Condens. Matter 22, 035404 �2010�.
37 M. A. Carpenter, B. Li, and R. C. Liebermann, Am. Mineral. 92,344 �2007�.
38 M. A. Carpenter, A. Buckley, P. A. Taylor, R. E. A. McKnight,and T. W. Darling, J. Phys.: Condens. Matter 22, 035406 �2010�.
39 M. Daraktchiev, E. K. H. Salje, W. T. Lee, and S. A. T. Redfern,Phys. Rev. B 75, 134102 �2007�.
40 W. Schranz, A. Tröster, A. V. Kityk, P. Sondergeld, and E. K. H.Salje, Europhys. Lett. 62, 512 �2003�.
41 A. Tröster and W. Schranz, Phys. Rev. B 66, 184110 �2002�.
42 S. Yamaguchi and N. Yamada, Solid State Ionics 162-163, 23�2003�.
43 B. L. Cheng, M. Gabbay, G. Fantozzi, and W. Duffy, Jr., J.Alloys Compd. 211-212, 352 �1994�.
44 J. X. Zhang, W. Zheng, P. C. W. Fung, and K. F. Liang, J. AlloysCompd. 211-212, 378 �1994�.
45 P. C. W. Fung, J. X. Zhang, Y. Lin, K. F. Liang, and Z. C. Lin,Phys. Rev. B 54, 7074 �1996�.
46 E. K. H. Salje, H. Zhang, H. Idrissi, D. Schryvers, M. A. Car-penter, X. Moya, and A. Planes, Phys. Rev. B 80, 134114�2009�.
47 J. X. Zhang, P. C. W. Fung, and W. G. Zeng, Phys. Rev. B 52,268 �1995�.
48 T. Lee, R. S. Lakes, and A. Lal, Rev. Sci. Instrum. 71, 2855�2000�.
49 R. J. Harrison, S. A. T. Redfern, A. Buckley, and E. K. H. Salje,J. Appl. Phys. 95, 1706 �2004�.
50 W. T. Lee, E. K. H. Salje, L. Goncalves-Ferreira, M. Daraktch-iev, and U. Bismayer, Phys. Rev. B 73, 214110 �2006�.
ZHANG et al. PHYSICAL REVIEW B 82, 014113 �2010�
014113-10


