Embed Size (px)
Citation preview

Ž .Global and Planetary Change 31 2001 347–366www.elsevier.comrlocatergloplacha
Mikulino and Valdai palaeoenvironments in the Vologda area,NW Russia
Valery Gey a, Matti Saarnisto b,), Juha Pekka Lunkka b, Igor Demidov c
a Geological Expedition, 24r1 OdoeÕsky Street, 199155 St. Petersburg, Russiab Geological SurÕey of Finland, P.O. Box 96 FIN-02151, Espoo, Finland
c Institute of Geology, Karelian Research Centre, Pushkinskaya, 11, 185610 PetrozaÕodsk, Russia
Received 23 January 2000; accepted 23 May 2001
Abstract
Nine representative sediment sequences and pollen diagrams obtained during the Quaternary mapping programme carriedŽ .out by the Geological Expedition St. Petersburg, Russia between 1960s and 1980s are presented from the Vologda area,
Ž . Ž .NW Russian Plain, covering the time span from the Moscow cold Saale stage into the Late Valdai Weichsel substage.This work was done in order to shed light on the evolution of palaeoenvironments, vegetation and climate in the area. Theresults suggest that two major depressions in the Vologda area, namely the Mologa–Sheksnian and Prisukhonian basins,witnessed lake level fluctuations that were most likely closely linked to climatic fluctuations. It is suggested that during the
Ž .Mikulino Eem thermal optimum most of the lowland areas were dry land. However, during the Early and Middle Valdai,the large depressions started to flood as a result of wet and cold climate. This caused the accumulation of lacustrine and alsolacustrine–alluvial and lacustrine–bog sediments into the basins. The Valdai forest composition varied between closedspruce–birch forests and treeless tundra. Lakes persisted throughout the Valdai stage including the extremely dry last glacial
Ž .maximum LGM -time when the Scandinavian Ice Sheet dammed the northbound rivers in the Vologda area. q 2001Elsevier Science B.V. All rights reserved.
Keywords: Mikulino palaeoenvironment; Valdai palaeoenvironment; Vologda area
1. Introduction
The Scandinavian Ice Sheet extended close to theSukhona river valley and Mologa–Sheksnian low-
Žland in the Vologda district of northern Russia Fig.. Ž .1 at the last glacial maximum LGM . Its extent and
timing has been addressed elsewhere in this volume
) Corresponding author. Fax: q358-205-5012.Ž .E-mail addresses: [email protected] M. Saarnisto ,
Ž [email protected] J.P. Lunkka .
Ž .Lunkka et al., in press with appropriate references.In the present article, extensive stratigraphical datacollected from boreholes drilled in connection with aQuaternary mapping programme carried out since
Ž1960s and undertaken by the Leningrad currently St..Petersburg Geological Expedition will be dealt with.
This article contains pollen diagrams which form thebiostratigraphical basis for reconstruction of pa-laeoenvironments, especially the history of Miku-
Ž . Ž .lino Eem and Early to Middle Valdai Weichselwater bodies, the sediments of which form the major-
0921-8181r01r$ - see front matter q 2001 Elsevier Science B.V. All rights reserved.Ž .PII: S0921-8181 01 00129-1
( )V. Gey et al.rGlobal and Planetary Change 31 2001 347–366348
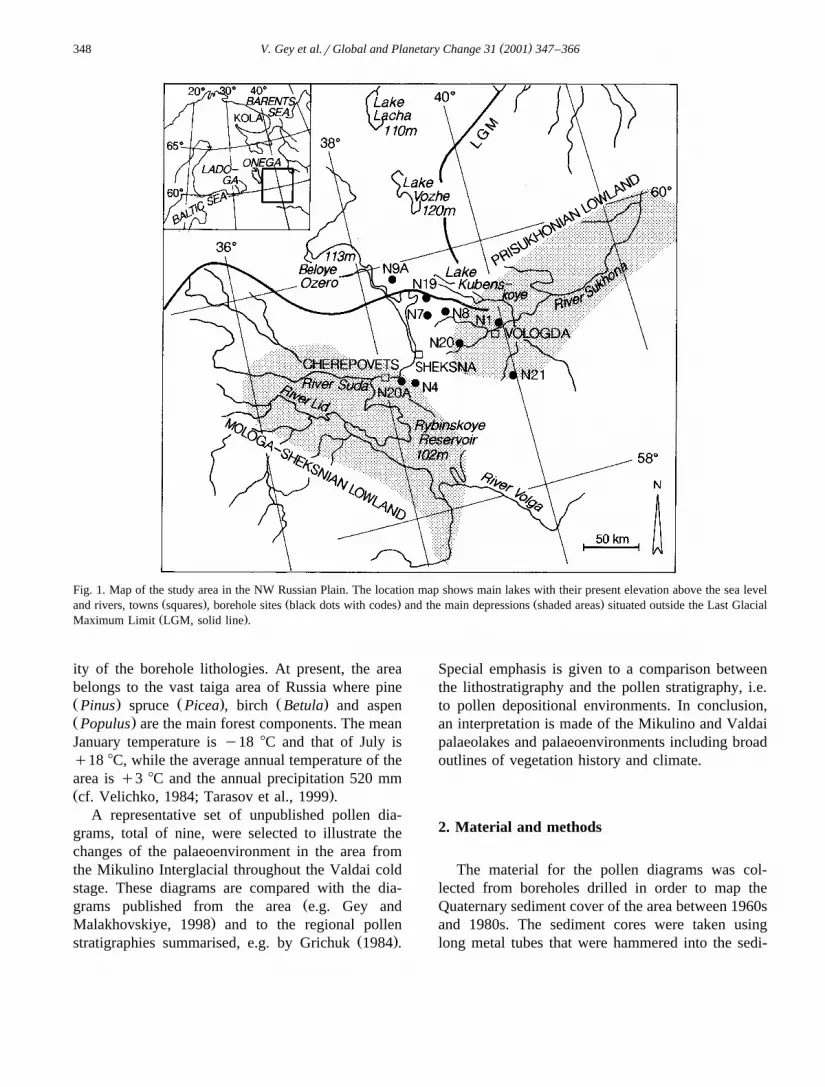
Fig. 1. Map of the study area in the NW Russian Plain. The location map shows main lakes with their present elevation above the sea levelŽ . Ž . Ž .and rivers, towns squares , borehole sites black dots with codes and the main depressions shaded areas situated outside the Last GlacialŽ .Maximum Limit LGM, solid line .
ity of the borehole lithologies. At present, the areabelongs to the vast taiga area of Russia where pineŽ . Ž . Ž .Pinus spruce Picea , birch Betula and aspenŽ .Populus are the main forest components. The meanJanuary temperature is y18 8C and that of July isq18 8C, while the average annual temperature of thearea is q3 8C and the annual precipitation 520 mmŽ .cf. Velichko, 1984; Tarasov et al., 1999 .
A representative set of unpublished pollen dia-grams, total of nine, were selected to illustrate thechanges of the palaeoenvironment in the area fromthe Mikulino Interglacial throughout the Valdai coldstage. These diagrams are compared with the dia-
Žgrams published from the area e.g. Gey and.Malakhovskiye, 1998 and to the regional pollen
Ž .stratigraphies summarised, e.g. by Grichuk 1984 .
Special emphasis is given to a comparison betweenthe lithostratigraphy and the pollen stratigraphy, i.e.to pollen depositional environments. In conclusion,an interpretation is made of the Mikulino and Valdaipalaeolakes and palaeoenvironments including broadoutlines of vegetation history and climate.
2. Material and methods
The material for the pollen diagrams was col-lected from boreholes drilled in order to map theQuaternary sediment cover of the area between 1960sand 1980s. The sediment cores were taken usinglong metal tubes that were hammered into the sedi-

( )V. Gey et al.rGlobal and Planetary Change 31 2001 347–366 349
ment by a heavy geotechnical motor-driven deviceinstalled on a lorry. The coring itself and extrusionof the core tubes caused disturbances and uncon-formities in the sediment record. Furthermore, thesampling interval was relatively poor and varied
Ž . Žfrom 20 cm sites N4, N7, N8 to ca. 50 cm sites. ŽN9A, N19, N20A and even to ca. 100 cm sites N1,
.N20, N21 . These facts have been considered wheninterpreting pollen stratigraphies. However, the gen-eral picture that emerges from the pollen work ap-pears to be reliable.
The original pollen work presented in this articlewas carried out by palynologists G.S. Abakumenko,L.A. Gaigerova, E.S. Maljasova, V.I. Semitseva, andV.V. Nuksarova of the Geological Expedition, St.Petersburg, Russia. The original diagrams are storedin the archives of the Geological Expedition andpartially published in an excursion guide of the
Ž .Vologda area in Russian language Gey et al., 2000 .The original diagrams were constructed in such away that they were not suitable for the present work.Therefore, the original pollen diagrams were redrawnusing recalculated pollen percentages. The new dia-grams include an APrNAP ratio column togetherwith columns for major tree, shrub and NAP taxacalculated from the total pollen sum P. The dia-grams do not contain zoning of the pollen stratigra-phy into local pollen zones. This is because theheterogeneity of the core material and different sam-pling intervals of the individual cores. The generalschematic Quaternary stratigraphy accepted for
Žnorthern Russia see e.g. Velichko and Faustova,.1986 is also presented in diagrams in which the
Moscow cold stage is followed by the MikulinoŽ .warm stage. The Mikulino warm stage Eem is in
Ž .turn followed by the Valdai Weichsel cold stagethat is divided into the Early, Middle and LateValdai substages, V1, V2 and V3, respectively. Allthese stages are represented in the current data fromthe Vologda area that has remained ice-free since theMoscow cold stage. During the Late Valdai substageŽ .V3 , the Scandinavian Ice Sheet is extended to itsmaximum in the northern part of the present studyarea, but only overriding site 9A discussed in this
Ž .paper see also Lunkka et al., in press . Attempts aremade to correlate pollen results with the regional
ŽMikulino pollen stratigraphy of Grichuk 1961, 1984,.see below , when possible.
3. Vologda district pollen data
In the following section, the data is describedstarting from the diagrams containing Mikulinoandror Mikulino and Valdai stratigraphy within thesame sequence. This is followed by diagrams that areinterpreted to contain Middle Valdai andror full
Ž .glacial V3 strata. The chronostratigraphical inter-pretation that is presented in pollen diagrams isbased on pollen stratigraphy and its position inlithostratigraphy. The regional pollen stratigraphy for
Žthe Mikulino Interglacial described in Grichuk 1961,.1984 is summarised below, and it forms the basis of
the present interpretation.Eight pollen zones M to M , starting from the1 8
base, characterise the biostratigraphy of the Mikulinowarm stage of NW Russia. The main features ofdifferent pollen zones can be listed as follows:
M : Picea dominated pollen zone. Beginning of1
the Mikulino Interglacial.M : Pinus–Betula pollen zone. Low Picea pollen.2
M : Pinus–Betula dominated pollen zone with3
Quercus, Ulmus and Corylus pollen.M : Quercus–Ulmus pollen zone. M : maximum4 4a
of Quercus and Ulmus pollen together with Cory-lus pollen; M : maximum of Quercus and Ulmus4b
together with Tilia pollen, first Corylus pollenmaximum.M : Tilia pollen zone with abundant Quercus and5
Ulmus pollen, second Corylus pollen maximum.M : Carpinus pollen zone with Tilia and Quercus6
pollen, occasionally Ulmus, Corylus and Picea.ŽM : Picea pollen zone upper Picea pollen maxi-7
.mum together with QM pollen.M : Pinus–Picea–Betula pollen zone. M : Picea8 8a
pollen dominate; M : Pinus pollen dominate, end8b
of the Mikulino Interglacial.
These regional features are present throughout north-ern European Russia but there are, however, localdifferences especially in the abundance of deciduoustree pollen, namely Carpinus and Tilia that are moreabundant in western regions.
The diagrams presented here are compared topollen diagrams published previously from the areaŽ .Gey and Malakhovskiye, 1998 and to Mikulino–Valdai sequences published from elsewhere in NW

( )V. Gey et al.rGlobal and Planetary Change 31 2001 347–366350
ŽRussia e.g. Grichuk, 1961, 1972, 1984; Semenenko.et al., 1981 .
4. Mikulino pollen stratigraphy
( )4.1. KirilloÕ, site 9A Fig. 2a
Site 9A is situated inside the LGM-limit at anŽ .absolute altitude of ca. 150 m Fig. 1 . The sequence
Ž .is 48 m long Fig. 2a . The basal 6 m is composedmainly of silt and clay with two interbeds of sandŽ . Ž .46.2–46.5 m and peat 44.4–44.7 m . The major
Žportion of the sequence top 42.0 m not shown in.Fig. 2a is composed of till that was laid down
during the Late Valdai by the Scandinavian IceSheet.
It is suggested that sediments beneath the tillrepresent a lacustrine and alluvial facies with fluctu-ating water level. Minor hiatuses must occur betweenthe basal silt and clay unit and the sand unit aboveŽ .the 46.5-m level . Furthermore, pollen evidencesuggests that a gap occurs between the upper bound-ary of peat and the overlying silty clay unit asdescribed below.
The pollen sequence is 6.0 m thick and its top issome 108 m a.s.l. The pollen stratigraphy com-mences with a Betula–Pinus-dominated pollen zone
Ž .correlative with M of Grichuk 1961, 1984 .1 – 2
Picea varies between 6% and 18% and NAP be-tween ca. 10% and 30% except in the upper zonewhere Artemisia, Chenopodiaceae and Cyperaceaeaccount for 50% at one level.
Ž .The following pollen zones M –M are charac-3 4
terised by increasing Alnus, Ulmus and Quercuspollen values together with a distinct decline in NAPand Picea pollen, followed by zones M –M , the5 6
beginning of the Carpinus pollen curve and a peakof Corylus pollen together with low values, less than10%, of Pinus and Picea pollen and a minimum of
Ž .Betula less than 20% .Ž .In the following pollen zone M , Carpinus,7 – 8
Quercus, Ulmus and Corylus decline and becomenearly absent as Picea increases together with Pinusand NAP.
The uppermost pollen zone in the sequence isŽ .dominated by Betula 30% , with low Pinus and
Picea. Artemisia, Chenopodiaceae and Cyperaceae
dominate the composition of NAP that accounts for30% of total pollen.
The pollen sequence can be interpreted as repre-senting the Mikulino Interglacial because of highabundances of thermophilous deciduous trees. Thesequence begins from the Late MoscowrEarlyMikulino time and continues up to Late Mikulinor
Ž .Early Valdai time Ms, M1–M8, EV . The upper-most Betula dominated pollen zone is correlatedwith the Early Valdai. The lithology suggests anearly continuous sedimentation except for the depo-sition of the peat layer between 44.7 and 44.4 m,where the pollen curves of deciduous trees are trun-cated and the Picea-dominated pollen zone above isentirely missing. It seems that there was a break insedimentation between peat deposition and the be-ginning of silt and clay deposition after the Mikulinothermal optimum. There must also be some reworkedmaterial at the boundary between Mikulino and EarlyValdai where Tilia pollen was recorded.
( )4.2. DomozeroÕo, site 20A Fig. 2b
The total thickness of sediment is over 20 m andthe site is situated at an absolute altitude of 100 ma.s.l. in the Mologa–Sheksnian basin. The sedimentsequence is composed of alternating layers of sandand gravel, silt and clay and a peat layer. The basal
Ž .sand and gravel unit 20.3–19.7 m passes into siltand clay, the top part of which is a ca. 20-cm-thickpeat layer. Upon this peat silt, gravel and silty clayunits alternate. It is assumed that the basal silt andclay unit represents a sediment bed that was de-posited in a lacustrine basin. Peat upon silty clayindicates that this lake subsequently dried out. Ac-cording to pollen evidence, there are several hiatusesin the sequence, particularly at the 13.5- and 5.0-mlevel as discussed below. Silt, gravel and silty clayunits above the peat are most likely related to fluvialactivity where unit boundaries represent breaks insedimentation.
The pollen diagram spans an 18-m-long sedi-ment sequence that commences with a Pinus–Be-tula-dominated pollen zone with low Picea. NAPaccounts for ca. 20% of total pollen. Alnus andCorylus pollen together with Quercus and Ulmusdominate the following pollen zones, whereas Be-tula, Pinus are below 10% and NAP and Piceagenerally below 5%.

()
V.G
eyet
al.rG
lobalandP
lanetaryC
hange31
2001347
–366
351
Ž .Fig. 2. Mikulino pollen diagrams a–e from the Vologda area. In the interpretation column Ms represents the Moscow stage. Pollen zones M –M indicate a suggested1 8Ž .correlation of the present pollen spectra to the regional pollen stratigraphy for the Mikulino Interglacial by Grichuk 1984, see text , EVsEarly Valdai substage. When the
pollen amount of individual taxa is less than 5% the pollen abundance is in per mil and shown as a shaded area in the diagram. Black dots in the diagrams indicate the presencepollen less than 1‰.

( )V. Gey et al.rGlobal and Planetary Change 31 2001 347–366352
Ž.
Fig.
2co
ntin
ued
.

( )V. Gey et al.rGlobal and Planetary Change 31 2001 347–366 353
Ž.
Fig.
2co
ntin
ued
.

( )V. Gey et al.rGlobal and Planetary Change 31 2001 347–366354
Ž.
Fig.
2co
ntin
ued
.

( )V. Gey et al.rGlobal and Planetary Change 31 2001 347–366 355
Ž.
Fig.
2co
ntin
ued
.

( )V. Gey et al.rGlobal and Planetary Change 31 2001 347–366356
A distinct rise in spruce pollen is accompanied bythe beginning of Carpinus and Tilia pollen curvesand a decline of other deciduous tree pollen. The
Ž .Picea pollen maximum up to 65% terminatesabruptly, as do Carpinus and Tilia pollen. In the
Župpermost pollen zone, Betula dominates up to. Ž .50% together with increasing NAP up to 30%
with xerophilic elements like Artemisia and Cheno-podiaceae.
The abundance and stratigraphical position ofthermophilous, deciduous trees in the middle part ofthe pollen diagram indicate that the sequence begins
Žfrom the early part of the Mikulino Interglacial zone.M and continues to the later part and perhaps to1
the Early Valdai time. Two abrupt boundaries in thepollen stratigraphy coincide with lithostratigraphicalboundaries that suggest breaks in sedimentation. Thelower break at a depth of 13.5 m where a peat layerseparates a silt and clay unit from a silt unit abovetook place prior to the thermal optimum of theMikulino. The upper break at a depth of 5.0 m at aboundary between sand, and gravel and silt and clayabove can be dated to the latter part of the inter-glacial. A tentative comparison of this site with the
Ž .Mikulino zones of Grichuk 1961, 1984 is presentedin Fig. 2b.
( )4.3. KipeloÕo, site N20 Fig. 2c
Site N20 is a 43-m-deep borehole at 130 m a.s.l.in the Prisukhonian lowland outside the LGM-limit.
Ž .The basal part of the core 43.0–23.5 m is com-posed of two till beds interbedded with a 2-m-thickunit of sand, silt and clay. Upon the till, a thicksequence of silt and clay dominates between 23.5and 9.0 m. The top part of the core is composed ofsilt and sand. Till is interpreted here as being laiddown during the penultimate Moscow Glaciation,while silt and clay above most likely represent lacus-trine facies post-dating this glaciation. The top 9.0 mare composed of silt and sand whose lower contactsare most likely erosional with possible hiatuses. Thetop part is interpreted here as infilling of near-shoreareas of a lake basin.
ŽFollowing the interpretation above i.e. Kirillov,.site N9A , the pollen stratigraphy for the lower part
of the silt and clay deposits that rests on till abovethe 23.0-m level represents the latter part of theMoscow Glaciation. Pollen zones M –M of the1 8
Mikulino Interglacial can be identified in silt andclay sediment between 18.0 and 9.0 m. The upperpart of the diagram most likely represents the Early
Ž .Valdai substage with high percentages up to 60%of Betula pollen and insignificant amount of coniferpollen. In the lower part, above a Betula peak, NAPvalues up to 45% are composed of xerophytes likeArtemisia and Chenopodiaceae together with sedgesand grasses. This assemblage can be interpreted asrepresenting the first Valdai cooling, pollen zoneV1a according to the terminology of Semenenko et
Ž .al. 1981 , whereas the uppermost increase of Betulaand Alnus and distinct increase of NAP may repre-sent the second Early Valdai stage V1b, when cli-mate was more humid than earlier. Above the 9.0-mlevel, sediment becomes coarser and there was per-haps a break in sedimentation, i.e. part of the LateMikulino–Early Valdai sequence may be missing.
( )4.4. Kolkach, site N19 Fig. 2d
The depth of the core is 12 m and the site liesimmediately outside the LGM, west of Lake Kuben-skoye at an absolute altitude of ca. 120 m a.s.l. Siltand clay dominate the sequence, which is interbed-ded with a 0.7-m-thick peat layer. It is assumed thatsilt and clay were deposited in a shallow lacustrinebasin probably connected to the Mologa–Sheksnianlowland. This small basin must have dried out duringthe time when peat started to accumulate. Silt andclay above the peat layer suggest that subsequentlylacustrine conditions were re-established in the area.The top 5.5 m of the core, not shown in Fig. 2e, iscomposed of glaciofluvial gravel, and sand that waslaid down during the LGM time when an ice front
Žstood in the lake Kubenskoye Basin e.g. Gey and.Malakhovskiye, 1998 .
The pollen stratigraphy covers part of the MikulinoInterglacial and continues into the Early Valdai sub-stage. It begins prior to the thermal maximum of theMikulino Interglacial from pollen zone M . Pollen3
zones M –M are clearly represented and deposition4 6
of peat took place during the Carpinus pollen maxi-Ž .mum M . The change at 8.0-m level from the6
Pinus–Picea–Betula pollen zone, representing thelast Mikulino pollen zone M into the first Betula-8
dominated Early Valdai pollen zone with high, up to30% NAP, is gradual and suggests a gradual changetowards cool climate. This is comparable with the

( )V. Gey et al.rGlobal and Planetary Change 31 2001 347–366 357
results from the ‘First of May Factory Lake’ south ofŽ .the Vologda area see Semenenko et al., 1981 .
( )4.5. VasyukoÕo, site N21 Fig. 2e
The total thickness of core N21 was 30 m and thesite is located in the Prisukhonian lowland, 20 kmsouth of Vologda at an absolute altitude of 103 ma.s.l. Sediment in the core consists of silt and clayrepresenting lacustrine facies with no major breaksin sedimentation. The pollen stratigraphy can beinterpreted as representing continuous pollen accu-mulation.
The pollen diagram starts in pollen zone M and3
the pollen succession of high QM–Picea–Pinus–Picea–Betula pollen zones covers the Mikulinopollen zones M –M . At a depth of 12 m, a distinct4 8
Ž .increase of NAP pollen up to 60% takes placefollowing a decline of the Pinus pollen and anaccompanying increase of Betula. NAP is composedof xerophytic Artemisia and Chenopodiaceae to-gether with high Cyperaceae and grasses. The pollenstratigraphy remains largely unchanged to the 2-mlevel where NAP pollen declines and Betula, Pinusand Alnus increase. This can be interpreted as repre-senting the Early Valdai pollen stratigraphy, similarto the pollen stratigraphy of site N20, although thehigh NAP pollen proportion in N21 suggests a moresevere palaeoclimate than in the previous Early Val-dai pollen diagrams.
In terms of vegetation, the Early Valdai pollen inSite N21 reflects dry tundra vegetation with lightbirch stands and perhaps some spruce and alder. Pinemost probably represents long-distance transport ex-cept possibly in the upper part where birch-forest aremore closed.
5. Lake level estimates in the Vologda area duringthe Mikulino stage
Sediment cores for pollen analyses representingMikulino deposits presented in this work were mostlytaken from a general area of Mologa–Sheksnian and
Ž .Prisukhonian depressions Fig. 1 . Based on sedi-ments observed in drill cores, some general conclu-sions can be made on lake level history of thesedepressions in the Mikulino warm stage. Borehole
Žmaterial boreholes N9A, N19, and N20A, see litho-.logical columns in Fig. 2 indicate that Mikulino peat
horizons occur at levels between ca. 85 and 110 ma.sl. From these sites, N20A and N19 are situated inthe general area of the Mologa–Sheksnian basin,although site N19 could have been isolated from themain basin in addition to site N9A. Pre-Late Valdaisediments at site N9A could have also been movedinto a higher position as a result of glacitectonism.Peat horizons in Mikulino sediments suggest that atsome time during the Mikulino warm stage, waterlevels in the basin dropped down to 80–90 m in theMologa–Sheksnian basin. Site N19 and also site
ŽN24 see Lunkka et al., in press for location and.sediment log of site N24 indicate that lacustrine
conditions were re-established later on during theMikulino Interglacial, since lacustrine sediments oc-
Ž .cur even at the 115-m level as at site N19 .There are two sites in this work that are located in
the Prisukhonian depression where lithological andpollen evidences from borehole material indicateMikulian lacustrine facies. The best example ofMikulino lake sediments is represented at site N21,which at present is situated at 103 m a.s.l., where siltand clay dominate the sedimentary sequence andMikulino lake sediments occur up to the 91-m levelŽ .Fig. 2e . Although this sequence may have someminor erosional gaps, lacustrine conditions must haveexisted in this sink hole for most of the Mikulinowarm stage and well into the Early Valdai. Otherexamples of lacustrine Mikulian sediments occur atsite N20, where Mikulino sediments can be found upto ca. the 120-m level.
6. Valdai pollen stratigraphy
( )6.1. Maega, site N1 Fig. 3a
A sequence exceeding 41 m in length was ob-tained at site N1 that lies some 115 m a.s.l. This siteis located at the village of Maega only a few kilome-tres to the north of Vologda. Core material comprisesseveral upward fining sequences of sand, silt andsilty clay with one peat horizon at 35.8–36.2 m. A14C age of this peat gave an infinite radiocarbon date
.of more than 42,600 BP LU-1162 . The top part ofŽ .the sequence 14 m is composed of silt and clay.
The lower part up to the 14-m level is thought torepresent deposits that were laid down by fluvialactivity in an alluvial plain. The sediment succession

( )V. Gey et al.rGlobal and Planetary Change 31 2001 347–366358
does contain minor hiatuses. It is suggested here thatthe upper 14 m may represent a lacustrine sequencedeposited during the Late Valdai. The pollen stratig-raphy begins with Betula dominance together withhigh Artemisia and Chenopodiaceae pollen values. Itis followed by Picea–Pinus pollen zones wherePicea percentage is up to 50% of total pollen andNAP values are insignificant. Alnus pollen fre-quently remains between 10% and 20%. There aretwo Picea pollen peaks above the initial maximum.These peaks are accompanied by the increase ofPinus pollen values and separated by the near ab-sence of Picea pollen in sequences where Betulaincreases together with an increase of NAP. NAP
Ž .values are highest more than 50% at depths of 31and 21 m. NAP and Alnus start to rise again at the25-m level, Alnus pollen values are high, 10–30%near to the top of the sequence, and NAP is com-monly more than 30%, excluding a minimum at the16 m-level and near to the top of the sequence. Thethird Picea maximum terminates abruptly at a depthof 14 m where Betula pollen starts to rise togetherwith abundant, 10–25%, Artemisia pollen. The up-permost 3 m are characterised by increasing Pinusand Picea pollen values. Betula and Alnus are lowand NAP insignificant.
The near absence of rare deciduous trees exceptCorylus and variation in Betula, Pinus and Piceapollen curves together with high NAP, especiallyArtemisia pollen values for most of the sequencesuggest that site N1 can be correlated with varioussubstages of the Valdai cold stage. The relativelyhigh percentage of Corylus is thought to representreworked pollen, commonly met in the fluvial andnear-shore lacustrine environments. This correlationis supported by other Valdai sequences in the north-
Žern Russian plain e.g. Semenenko et al., 1981; Gey.and Malakhovskiye, 1998 . However, it should be
emphasized that there is no basis for detailed sta-dial–interstadial correlations commonly encounteredin the Weichselian biostratigraphy of Western Eu-
Ž .rope e.g. Behre, 1989 . This is because of the lackof independent dating and because of breaks ofunknown duration in sedimentation as well as rede-position, e.g. at depths of 29.5 and 14.0 m wheresharp changes in Picea and Betula pollen curvescoincide with changes in lithostratigraphy. Neverthe-less, the lowest Betula–Artemisia pollen zone below
39.0 m is correlative with the Early Valdai, whereasthe interval 39.0–14.0 m represents the Middle Val-dai time. The lower part between 39.0 and 22.0 mwith two distinct Picea pollen maxima can be cor-
Ž .relative with the Middle Valdai Bryansk Intersta-dial when the spruce dominated forest were closed asshown by low NAP. The latter part of the MiddleValdai shows increasing NAP, i.e. more open forestand cooler climate accordingly. The upper sedimentsequence above 14.0 m is correlative with the LateValdai when the landscape was nearly open tundrawith some patches of Betula up to a depth of 3.0 m,when Pinus and Picea start to increase indicatingLate Valdai amelioration of climate.
6.2. Prokino, site N4; DaÕydkoÕo, site N7, VysokoÕo,( )site N8 Fig. 3b,c,d
Site N4 is located ca. 140 m a.s.l near the villageof Prokino. The sediment core is 5.2 m long butpollen was counted only between 4.2 and 1.7 m. The
Ž .basal part is composed of till 5.2 m–4.2 m that wasdeposited during the Moscow Glaciation. Between4.2 and 1.7 m, three separate peat layers are in-terbedded with sand and silty clay while the topŽ .2.0–1.7 m is composed of sandy gravel that passesinto alternating layers of sand and silt between 1.7 mand the ground surface. Sediment succession com-posed of alternating layers of silty sand, sand andsandy gravel and peat is interpreted here as fluvial inorigin representing overbank deposits.
Site N7 is located near the village of Davydkovoat an altitude of ca. 160 m a.s.l. A 4.3-m-long coreconsists of two sedimentary units. The basal unit iscomposed of silt and clay with peat fragments andlenses while the upper 2.6 m consists of silty clay.
Site N8 at Vysokovo is situated at an altitude ofca. 150 m in a small basin that at present is occupiedby a small lake and associated peatland. A 2.85-m-long core displays basically two units similar tothose at Site N7. The basal unit is silt and clay thatcontains fragments and clasts of peat while the upper2.4 m is silt and clay that is poor in pollen. Althoughit is difficult to put these two short sections intosedimentological context, it is suggested that sedi-ments at both sites were deposited in small, isolatedlake basins, while the organic material representingreworked material from higher ground.

()
V.G
eyet
al.rG
lobalandP
lanetaryC
hange31
2001347
–366
359
Ž .Fig. 3. Valdai pollen diagrams a–d from the Vologda area. In the interpretation column, EVsEarly Valdai, MVsMiddle Valdai and LVsLate Valdai. Shaded areas in thediagrams indicate pollen abundance in per mil. Black dots in the diagrams indicate the presence of pollen less than 1‰.

( )V. Gey et al.rGlobal and Planetary Change 31 2001 347–366360
Ž.
Fig.
3co
ntin
ued
.

( )V. Gey et al.rGlobal and Planetary Change 31 2001 347–366 361
Ž.
Fig.
3co
ntin
ued
.

( )V. Gey et al.rGlobal and Planetary Change 31 2001 347–366362
Ž .Fig. 3 continued .
Ž .Sites N4 and N7 Figs. 3b–c can be correlatedwith the Middle Valdai. Two 14C dates obtainedfrom the peat layers at Sites 1 and 7 gave minimum
Ž .ages )42,600 BP LU-1162 and )43,560 BPŽ .LU-2064 , respectively. The lower part of Site N4most likely represents the major Middle Valdai Inter-stadial, the Bryansk Interstadial, because Picea andPinus were dominant together with Alnus and NAPis low. Climate was favourable for accumulation ofpeat. Site N7 represents the latter part of the MiddleValdai compared to site N4, as NAP was higher. Theupper part of N7 may already represent the LateValdai, as the abundance of trees declines sharply.
The pollen diagram from site N8 is dominated bymore than 60% of NAP and the Betula pollen ismostly Betula nana. This indicates that the vegeta-tion was treeless tundra in periglacial climate. A
Ž .radiocarbon date of 29,380"370 BP LU-2446suggests a late Middle Valdai age for the pollensequence, although the dated material may be re-worked, and thus, too old. The upper fine silt andclay sequence was devoid of pollen and most proba-
bly represents severe climate at the time of the LastGlacial Maximum.
7. Lake level estimates in the Vologda area duringthe Early and Middle Valdai
In the present examples, the Early Valdai lacus-trine sediments in the Prisukhonian basin occur onlyat site N21 beneath ca. 100 m a.s.l. and perhaps
Žat site N1 beneath ca. 75 m a.s.l. see Figs. 2e and.3a . At higher altitudes, for example at site N20,
Early Valdai sediments are mainly fluvial. In theMologa–Sheksnian depression, Early Valdai sedi-ments are fluvial in origin above the 95-m level,although site N19 might represent an isolated basinsince the Early Valdai lacustrine sediments thereoccur up to ca. 120-m level.
The best example of the Middle Valdai floodplain deposits in the Prisukhonian basin can be seen
Ž .at site N1 Fig. 3a where the fluvial sediments startat about the 75-m level upwards, while lacustrine

( )V. Gey et al.rGlobal and Planetary Change 31 2001 347–366 363
conditions were established later on during the LateValdai. Site N4 that is situated at a higher altitude atca. 140.0 m, as well as other sites adjacent to it at120 m, suggests that fluvial sediments are present atleast down to 115 m in the Mologa–Sheksnian basinin the Middle Valdai. In other areas, lacustrine con-ditions could have existed in small, shallow andisolated basins such as at sites N7 and N8.
8. Discussion and conclusions
Although the exact origin of sediments obtainedfrom the boreholes are in some cases difficult tointerpret, some general features that appear from thepalaeoenvironmental data justify discussion onbasin-, vegetation- and climate history of the areafrom the Mikulino through the Valdai stages.
8.1. Basin history
It appears that almost all extensive lowland areasin the Vologda area dried out during the Mikulinothermal optimum or even prior to that. This interpre-tation is indicated by present observations and sup-
Žported by drillhole observations of Auslender per-.sonal communication indicating that Mikulino peat
rests directly on the Moscow Till in the middle partof the Prisukhonian depression some 30 m beneaththe present surface that lies at about 105–115 m
Ža.s.l. Sediment succession sites N19, and N20A,.see lithological columns in Fig. 2 indicates that
Mikulinian peat horizons occur at levels between ca.85 and 110 m a.sl. as stated above, the lowest levelof which is in accordance with previous observations
Ž .by Auslender personal communication from thecentral part of the Prisukhonian basin. However,some lakes could have existed as isolated basins in
Ž .the Prisukhonian e.g. site N21 and also in theMologa–Sheksnian lowland areas as well as else-where outside these major depressions. There areindeed several sites where lithological and pollenevidences from borehole material indicate Mikulinolacustrine facies.
Based on the data of the drilling programmecarried out in the Vologda area, part of which ispresented here, it seems that the inundation of largedepressions started at the end of the Mikulino stage
and continued with breaks through the Early andMiddle Valdai. As a result of this, thick deposits oflacustrine and also lacustrine–alluvial and lacus-trine–bog sediments accumulated in the basins. Pre-
Žvious investigations e.g. Auslender and Gey, 1967;.Kvasov, 1979 and observations during a mapping
programme in the Vologda area show that at somesites, ca. 40-m-thick sequences of lacustrine, fluvialand peat deposits occur in the Prisukhonian basin.Observations on thick peat layers in lacustrine sedi-ment successions and the absence of pollen spectra,indicating interglacial conditions, suggest that regres-sive and transgressive phases alternate in the ancientLake Sukhona that occupied the Prisukhonian basinduring the Early and Middle Valdai. These lake levelfluctuations were most probably related to climaticfactors, and the absolute altitude of the lake levelwas probably not more than 120 m a.s.l. It can alsobe noted that the Early Valdai sediments in thePrisukhonian basin are commonly clay-rich while the
ŽMiddle Valdai sediments are coarser mainly silt and.silty sand , which include plant remains such as peat
lenses and scattered detritus. This suggests that dur-ing the Early Valdai climate was more humid com-pared to the Middle Valdai. In the Mologa–Sheksniandepression, a terrace level with associated lake sedi-
Žments of the Middle Valdai Auslender and Gey,.1967 has been recognised and is lying at 117–118
m, indicating that the water depth in the central partof the basin was ca. 20 m.
Very little is known about discharge routes of thelakes in the Vologda area during the Mikulino or theEarly and Middle Valdai. However, during the post-Moscow time, water could theoretically flow in twodirections from the Prisukhonian basin, either east-wards along the Sukhona river valley or towards thenorthwest where at present the Severnaja Dvina Canalis located. The latter alternative was probably thecase since there is an old, abandoned threshold nearthe village of Nyuksenitsa, at a low elevation, sug-gesting that the flow direction in the Sukhona riverwas opposite to the present one during post-Moscow
Ž .time—as also assumed by Kvasov 1975 . There-fore, it is most likely that discharge of water wastowards the NW, through the present watershed be-tween Lake Kubenskoye and the River Sheksna intothe Mologa–Sheksnian depression and into the Volgadrainage system.

( )V. Gey et al.rGlobal and Planetary Change 31 2001 347–366364
8.2. Vegetation and climate history
The nine pollen diagrams presented above havebeen correlated in Fig. 4 and the vegetation andclimate history they show can be interpreted asfollows.
The abundance of pollen of thermophilous decid-uous trees at sites N9A, N20 and N20A confirms thecorrelation with the thermal optimum of the last, i.e.Mikulino Interglacial when the climate was warmerthan during the Holocene climatic optimum. In theVologda area, the Mikulino thermal optimum is of-ten recorded in peat horizons, which indicates ageneral lowering of the water table and accordinglyrelatively drier climate. The Early Mikulino substagewas dominated by open conifer–birch forest withrather high precipitation. This was also the trendtowards the end of the Mikulino Stage that followedthe thermal maximum. Relative humidity increasedas indicated by intensified fluvial activity and forma-tion of lakes. The subsequent increase of xerophyticArtemisia and Chenopodiaceae together with sedges
and other grasses shows the trend towards colderclimate.
Open birch forest dominated the Early Valdaisubstage with a high percentage of NAP. However,the landscape was not treeless tundra. The climateshift from the Mikulino to the Valdai appears to begradual, which is also the case in the ‘First of MayFactory’ pollen diagram 250 km southeast of VologdaŽ .Semenenko et al., 1981 . The Early Valdai substageterminated with a warmer interval where birch andalder rose and NAP declined.
During the long Middle Valdai substage, greatvariations between spruce–birch dominated forestsand nearly treeless tundra occurred. The tundra vege-tation is represented by NAP values more than 50%of the total pollen, which corresponds to the 10 8C
ŽJuly isotherm as suggested by Zagwijn 1989; see.also Aario, 1940 . The lower part of the Middle
Valdai substage appears milder than the upper partbecause of lower Artemisia and Chenopodiaceaepollen. This may represent the major Bryansk Inter-
Žstadial of North Russia Velichko and Faustova,
Fig. 4. Suggested correlation of the pollen sequences in the Vologda area.

( )V. Gey et al.rGlobal and Planetary Change 31 2001 347–366 365
.1986 . Otherwise, the correlation between the estab-lished western European stadials and interstadials isnot possible because of unconformities in the sedi-ment record that show repeated cycles between flu-vial activity and the presence of lakes in the Vologdaarea. Pollen of deciduous trees, especially Quercusand Corylus, are present throughout the Valdai Stage.As they are nearly absent during the highest abun-dance of conifers, it is most probable that they arereworked from Mikulino sediments, as also sug-
Ž .gested by Semenenko et al. 1981 .Lakes persisted in the area also during the Late
Valdai substage, although it is evident that the cli-mate then was extremely dry. The margin of theScandinavian Ice Sheet at the LGM dammed thenorthbound rivers, thus supporting lakes in theMologa–Sheksnian and Prisukhonian lowland areas
Ž .next to the ice-margin see Lunkka et al., in press .The extreme dryness of the climate at the LGM isindicated by aeolian activity and drying up of the‘First of May Factory’ lake between 19 and 13 kaŽ .Semenenko et al., 1981 . Fossil ice wedges that arecommon everywhere outside the LGM-limit indicatethat the climate was cold and suggest an annual
Ž .temperature below y6 8C cf. Pewe et al., 1969 .´ ´This value is in accordance with calculations made
Ž .by Tarasov et al. 1999 , based on modern analogytechniques. It should be stressed, however, that thedata used in the paleoclimate reconstructions by
Ž .Tarasov et al. 1999 for the LGM in the study areaŽ .is rather poor, one single site Puchka section repre-
senting a huge area of the NW Russian Plain.
Acknowledgements
This research was supported by the EC Environ-ment and Climate Research Programme under Con-tract ENV4-CT97-0563. Financial support from the
Ž .Academy of Finland Projects 41934 and 44263 toProf. M. Saarnisto is also acknowledged.
References
Aario, L., 1940. Waldgrenzen und subrezente Pollenspektren inPetsamo Lappland. Ann. Acad. Sci. Fenn., Ser. A 54, 1–120.
Auslender, V.G., Gey, V.P., 1967. Mater po istoriya ozer Severo-Zapada SSSR. Documents of the Second Symposium on theLake History of the Northwestern USSR. Nauka, Minsk, 10
Ž .pp. in Russian .Behre, K.-E., 1989. Biostratigraphy of the last glacial period in
Europe. Quat. Sci. Rev. 8, 25–44.Gey, V., Malakhovskiye, D., 1998. On the age and extension of
the maximum upper Pleistocene glaciation in western VologdaŽ .area. Izv. Russ. Geogr. O-va. 1, 43–53 in Russian .
Gey, V.P., Auslender, V.G., Demidov, I.N., Kiseleva, V.B.,Lunkka, J.P., Pleshivtseva, E.S., Saarnisto, M., 2000. Problemistratigrafii chetvertichnyh otlozheni i kraevye lednikovye
Ž .obratzovanija Vologodskogo regiona Severo–Zapada Rossii .wOn the Problems of the Quaternary Stratigraphy and End
xMorraines in the Vologda Region, NW Russia. GEOS 2000,Ž .Moskva, 99 pp. in Russian .
Grichuk, V.P., 1961. Fossil floras as a paleontological basis of theŽ .stratigraphy of Quaternary deposits. In: Markov, K.K. Ed. ,
Relief and Stratigraphy of Quaternary Deposits of the North-western Russian Plain. USSR Academy of Sciences Press,
Ž .Moscow, pp. 25–71 in Russian .Grichuk, V.P., 1972. Principal stages of the history of vegetation
in southwest of the Russian plain in the late Pleistocene. In:Ž .Grichuk, V.P. Ed. , Palynology of the Pleistocene. USSR
Academy of Sciences, Institute of Geography, Moscow, pp.9–53.
Grichuk, V.P., 1984. Late Pleistocene vegetation history. In:Ž .Velichko, A.A. Ed. , Late Quaternary Environments of the
Soviet Union. Longman, London, pp. 155–178.Kvasov, D.D., 1975. Pozdnechetvertichnaya istoriya krupnykh
wozer i vnutrennikh morey Vostochnoy Evropy. The Late-Quaternary History of Large Lakes and Inland Seas of Eastern
x Ž .Europe . Nauka, Leningrad, 278 pp. in Russian .Kvasov, D.D., 1979. The Late-Quaternary history of large lakes
and inland seas of Eastern Europe. Ann. Acad. Sci. Fenn., Ser.Ž .A III 127 , 71 pp.
Lunkka, J.P., Saarnisto, M., Gey, V., Demidov, I., Kiselova, V.,2001. Extent and age of the Last Glacial Maximum in thesouth-eastern sector of the Scandinavian Ice Sheet. GlobalPlanet. Change 31, 407–425.
Pewe, T.L., Church, R.E., Andersen, M.J., 1969. Origin and´ ´paleoclimatic significance of large-scale patterned ground inthe Donnelly Dome Area, Alaska. Geol. Soc. Am., Spec. Pap.103, 87 pp.
Semenenko, L.T., Aleshinskaya, Z.V., Arslanov, Kh.A., Val-uyeva, M.N., Krasnovskaya, F.I., 1981. Oppornyi razrezverkhnego pleistotsena u fabriki ‘Pervoe Maya’ Dmitrovskogo
Žraiona Moskovskoi oblasti otlozheniya drevnego Tatishchev-. wskogo ozera . Upper Pleistocene Section near ‘First of May’
ŽFactory in Dmitrov District, Moscow Region Sediments of.the Former Tatischevskoe Lake XI INQUA Congress,
x Ž .Moscow 1982 . Nauka, Moscow, pp. 121–135 in Russian .Tarasov, P.E., Peyron, O., Guiot, J., Brewer, S., Volokova, V.S.,
Bezusko, L.G., Dorofeyuk, N.I., Kvavadze, E.V., Osipova,I.M., Panova, N.K., 1999. Last glacial maximum climate of

( )V. Gey et al.rGlobal and Planetary Change 31 2001 347–366366
the former Soviet Union and Mongolia reconstructed frompollen and plant macrofossil data. Clim. Dyn. 15, 227–240.
Velichko, A.A., 1984. Late Pleistocene spatial paleoclimatic re-Ž .constructions. In: Velichko, A.A. Ed. , Late Quaternary Envi-
ronments of the Soviet Union. Longman, London, pp. 261–285.
Velichko, A.A., Faustova, M.A., 1986. Glaciations in the EastEuropean Region of the USSR. Quat. Sci. Rev. 5, 447–461.
Zagwijn, W.H., 1989. Vegetation and climate during warmerintervals of the Late Pleistocene of Western and CentralEurope. Quat. Int. 3r4, 57–67.


