Embed Size (px)
Citation preview
Indian Journal Of Natural Sciences www.tnsroindia.org. © IJONS
Vol.5 / Issue 28/ February 2015 International Bimonthly ISSN: 0976 – 0997
2475
Milk Constituents of Non Descript and Graded Murrah Buffaloes in TamilNadu, India. Balusami.C Department of Livestock Production Management, College of Veterinary Science and Animal Science, Pookode,Wayanad District-673 576, Kerala, India. Received: 22 Oct 2014 Revised: 21 Nov 2014 Accepted: 8 Dec 2014 *Address for correspondence Balusami.C Assistant Professor, Department of Livestock Production Management, College of Veterinary Science and Animal Science, Pookode, Wayanad District-673 576, Kerala, India. E.mail: [email protected],Mobile : 09446510821
This is an Open Access Journal / article distributed under the terms of the Creative Commons Attribution License (CC BY-NC-ND 3.0) which permits unrestricted use, distribution, and reproduction in any medium, provided the original work is properly cited. All rights reserved. A study was undertaken to assess the variation in milk quality traits at different stages of lactation in non-descript and Murrah buffaloes in five districts of North East zone of Tamil Nadu. A total of 300 milk samples collected at different stages of lactations from 130 non-descript and 170 graded Murrah buffaloes were analyzed for fat, solids not fat and protein and total solids percentages.Significant variation was observed between the genetic groups in fat, solids not fat, proteinand total solids per centof non-descript buffaloes (8.03±0.60, 9.85±0.07,4.23±0.08 and 17.88 ±0.57, respectively) and graded Murrah buffaloes(7.33±0.57,9.47±0.07,4.14±0.08 and 16.80±0.50,respectively). Stage of lactation showed significant effect on fat, protein and total solids per cent in both non-descript and graded Murrah buffaloes. Milk samples of the third stage of lactation had significantly higher mean fat (9.18±0.06 and 8.43±0.03) and total solids (18.93±0.02 in 17.82±0.03) innon-descript and graded Murrah buffaloes, respectively. Key words: Non-descript buffaloes, Graded Murrah buffaloes, Stage of lactation, milkconstituents
INTRODUCTION India is fortunate to have a very rich buffalo genetic resource with about 20 well-defined breeds and a very sizeable population of 108.7million (Livestock census, 2012). Around 56 per cent of the total milk produced in the country comes from buffaloes, which constitute nearly 34.59 per cent of the bovine population. Increasing the milk production is the ultimate objective in order to make the dairy production system remunerative.Since quality of milk
ABSTRACT
RESEARCH ARTICLE
Indian Journal Of Natural Sciences www.tnsroindia.org. © IJONS
Vol.5 / Issue 28/ February 2015 International Bimonthly ISSN: 0976 – 0997
2476
is essential for consumption as well as production of good quality dairy product and the pricing of milk is done based on its quality, its essential for the milk producers as well as the consumers to know about the various chemical constitutes of the milk they use.
MATERIALS AND METHODS A total of 300 milk samples from individual buffaloes were collected randomly in sterile bottles. They were collected more or less uniformly among all parties. Milk samples were obtained from animals maintained under semi intensive systems of management located in five districts of North east zone of Tamil Nadu, viz., Chennai, Kancheepuram, Thiruvallur, and Thiruvannamalai and Villupuram. In the present study 130 non-descript and 170 graded Murrah buffalo milk samples were collected from animals maintained by farmers under village conditions. The milk quality traits, fat, solids not fat, protein and total solids were estimatedfrom the samples immediately aftercollection. Analysis of milk samples The milk fat was determined by the Gerber’s method (ISI: 1977) using special butyrometrer and pipettes. Milk samples having fat percent above 10 were diluted with equal volumes of diluted water and tested for fat content and the values obtained were multiplied by two.SNF and total solids were estimated as per ISI: 1976 procedure.The solid not fat (SNF=0.25 G+0.2 F+0.14) and totalsolid (0.25G+1.2F) were calculated by using Richmond’s formula, Where G is the corrected lactometer reading and F is fat percentage. Protein content in milk was determined by aldehyde method as given by Ling(1963) and this was cross checked with 14 samples by gravimetric method (AOAC, 1990). Classification of data The data on various chemical traits of milk samples were classified according to stage of lactation where, P1 (early stage) - 5- 90 days, P2 (mid stage) - 91-180 days P3 (late stage) > 181 days. Statistical methods The least-squares analysis of variance (Harvey, 1987) was used in order to study the effect of lactation order and stage of lactation. Duncan's Multiple Range Test (DMRT) as modified by Kramer (1957) was used to make all pair wise comparisons among the means wherever significant differences between different levels of effect were obtained. The mean and standard errors of all production traits were estimated statistical procedures (Snedecor and Cochran, 1994).
RESULTS The least squares means ± SE of milk constituents in non-descript and graded Murrah buffaloes is presented in Table-1. The least squares means ±SE of fat, solids not fat and protein andtotal solids were estimated as 8.03±0.60,9.85±0.07,4.23±0.08 and 17.88 ±0.57 and 7.33±0.57,9.47±0.07,4.14±0.08 and 16.80±0.50 per cent, respectively in non-descript graded Murrah buffalo milk. The least squares means were significantly different between breeds (P<0.05). The least squares means ±SE of milk constituents in non-descript buffaloes according to stage of lactation is presented in Table 2.The respective levels of fat,solids not fat, protein and total solids in early, mid and late stage of lactation were 7.16±0.04, 7.75±0.02 and 9.18+0.06 per cent, 9.95±0.02, 9.84±0.02 and 9.75±0.03 per cent, 4.09±0.02, 4.26±0.03 and 4.35±0.02 per cent and 17.11±0.02, 17.59±0.03 and 18.93±0.02 per cent in non-descript buffaloes. The least squares means were significantly different between stages of lactation for fat, protein and total solids (P<0.05).
Balusami
Indian Journal Of Natural Sciences www.tnsroindia.org. © IJONS
Vol.5 / Issue 28/ February 2015 International Bimonthly ISSN: 0976 – 0997
2477
The least squares means ± SE of milk constituents in graded Murrah buffaloes according to stage of lactation is presented in Table 3and analysis of variance of milk fat, solid not fat, protein and total solids in non-descript and graded Murrah buffaloes are presented in tables- 4,5,6 and 7, respectively. The respective levels fat, solids not fat, protein and total solids in early, mid and late stage of lactation were 6.47±0.02, 7.09±0.05 and 8.43±0.02 per cent, 9.57±0.02, 9.45±0.02 and 9.39±0.03 per cent, 3.99±0.02, 4.16±0.03 and 4.27±0.03 per cent and 16.04±0.02, 16.54±0.03 and 17.82±0.03 per cent in graded Murrah buffalo milk. The least squares means were significantly different between stages of lactation for fat, protein and total solids (P<0.05).There was an increasing trend in fat, protein ant total solids content in the lactation advanced.
DISCUSSION The least squares mean±S.E of milk constituents (per cent) in non-descript and graded Murrah buffaloes were found to be significantly different between breed (P>0.01) (Table. 1) and stage of lactation (P>0.01) (Table.2). The overall mean fat per cent was 8.08±0.60 and 7.33±0.57 in non-descript and graded Murrah buffaloes respectively (Table-1) which was in close agreement with the findings of Ramanaet al. (2000).It was comparable to that of Swamp buffaloes(Zamanet.at.2007);but higher values were also found for Surti(Anon,1979) and Murrah buffaloes(Singh et al., 1979).The average protein content was 4.23±0.08 and 4.14 ±0.08 per cent in non-descript and graded Murrah buffaloes, respectively which was in agreement with those observed by Ernest and Venkataswami(1980) for graded buffaloes.There was increasing trend in fat, protein and total solids content as the lactation advanced and decreasing trend in SNF per cent(Table- ).The general trend of milk yield and constituents percentages during lactation was also corroborated by the negative correlations between these traits (Sodhiet al.2003).
CONCLUSION Based on the present study it can be concluded the milk fat and solid not fat percentage of non-descript buffaloes are more than graded buffaloes and stage of lactation showed significant effect on fat and total solids percentage in non-descript and graded Murrah buffaloes. Milk samples of the third stage of showed significantly higher mean fat and solids not fat in non-descript and graded Murrah buffaloes.
REFERENCES 1. ISI, 1976.Determination of fat by the Gerber methods: Part I milk. ISI: 1224(Part I).Indain Standards Institutions. New Delhi. 2. ISI, 1976.Determination of SNF and total solids. Part I milk. ISI: 1183(Part I).Indain Standards Institutions. New Delhi. 3. AOAC, 1990.Official methods of Analysis, (15thed.).Association of Official Analytical Chemists. Washington, D.C. 4. Harvey, V.R. 1975. Least squares analysis of data with unequal sub class numbers.ARS, USDA, Beltsville, Maryland. p. 8. 5. Kramer, C.Y. 1957. Extension of multiple range tests to group correlated adjusted means. Biometries, 13: 13-17. 6. Snedecor, G.W and Cochran, W.G.1994.Staitical methods.8thEd.,IOWA, State University Press,Ames,USA. 7.Ramana,D.B.V.,Munna Ram,Anil Kumar,Dwivedi,R.P.,Rui.Pand K.R.Solanki.2000.Small holder dairy production: A Village Study. Proceeding of the International conference held in Thrissur, Kerala, India. pp.: 617-623. 8. Zaman.G., R.N.Goswami and A.Aziz2007.Milk constituent of swamp buffalo of Assam. Buffalo Bulletin.26 No.I. 9. Anon.1979.Characterictics of cattle and buffalo breeds in India (3rded).Indian Council of Agricultural Research, New Delhi. 10. Singh.A., Basu, S.B and K.L.Bhatia, 1979.Milk fat and SNF percentages of Murrahbuffaloes.Indian.J.Dairy Sci.32:446-449.
Balusami
Indian Journal Of Natural Sciences www.tnsroindia.org. © IJONS
Vol.5 / Issue 28/ February 2015 International Bimonthly ISSN: 0976 – 0997
2478
11. Ernest, J.and V.Venkataswami, 1980.Total solids of milk in relation to other constituents.Cheiron.9:148-152. 12. Sodhi, S.S., Mehra, M.L. and A.K.Jain.2003.Inheritance of milk constituents in graded Murrah buffaloes. Strategies for genetic and reproductive improvement of bovine held on 13 &14 November .2003.Madras Veterinary College, Chennai -6-7.pp.229
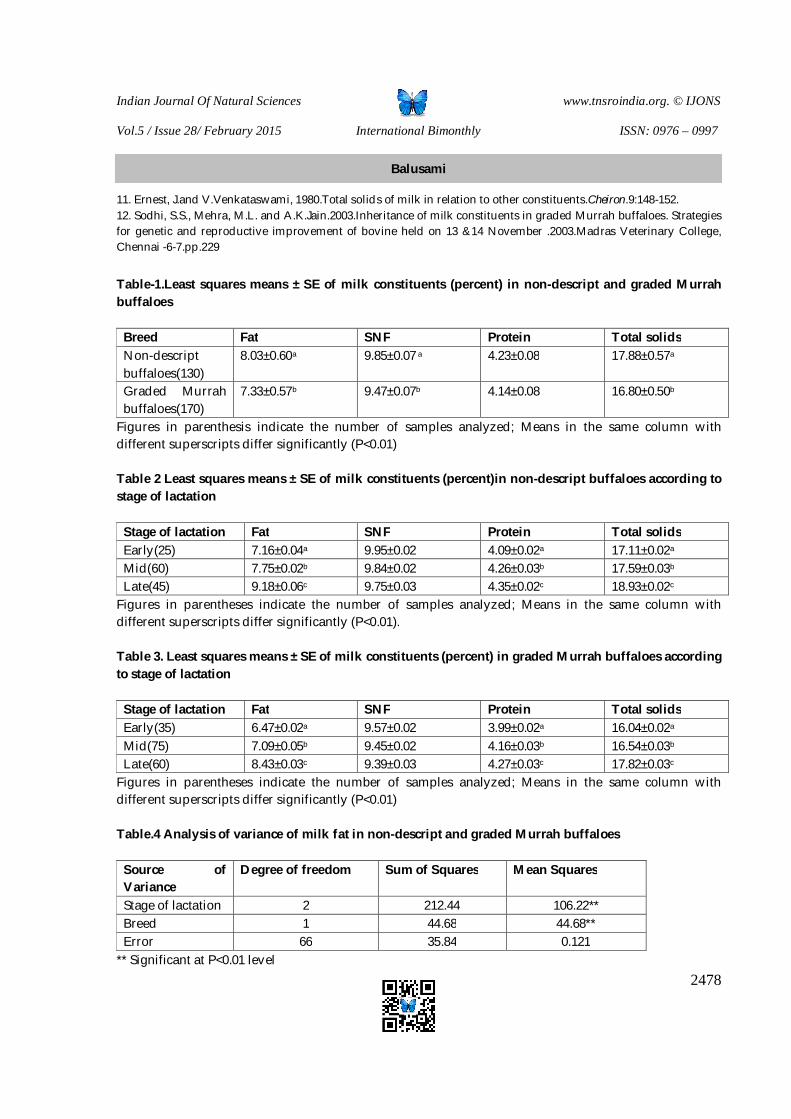
Table-1.Least squares means ± SE of milk constituents (percent) in non-descript and graded Murrah buffaloes
Breed Fat SNF Protein Total solids Non-descript buffaloes(130)
8.03±0.60a 9.85±0.07 a 4.23±0.08 17.88±0.57a
Graded Murrah buffaloes(170)
7.33±0.57b 9.47±0.07b 4.14±0.08 16.80±0.50b
Figures in parenthesis indicate the number of samples analyzed; Means in the same column with different superscripts differ significantly (P<0.01) Table 2 Least squares means ± SE of milk constituents (percent)in non-descript buffaloes according to stage of lactation
Stage of lactation Fat SNF Protein Total solids Early(25) 7.16±0.04a 9.95±0.02 4.09±0.02a 17.11±0.02a Mid(60) 7.75±0.02b 9.84±0.02 4.26±0.03b 17.59±0.03b Late(45) 9.18±0.06c 9.75±0.03 4.35±0.02c 18.93±0.02c
Figures in parentheses indicate the number of samples analyzed; Means in the same column with different superscripts differ significantly (P<0.01). Table 3. Least squares means ± SE of milk constituents (percent) in graded Murrah buffaloes according to stage of lactation
Stage of lactation Fat SNF Protein Total solids Early(35) 6.47±0.02a 9.57±0.02 3.99±0.02a 16.04±0.02a Mid(75) 7.09±0.05b 9.45±0.02 4.16±0.03b 16.54±0.03b Late(60) 8.43±0.03c 9.39±0.03 4.27±0.03c 17.82±0.03c
Figures in parentheses indicate the number of samples analyzed; Means in the same column with different superscripts differ significantly (P<0.01) Table.4 Analysis of variance of milk fat in non-descript and graded Murrah buffaloes
Source of Variance
Degree of freedom Sum of Squares Mean Squares
Stage of lactation 2 212.44 106.22** Breed 1 44.68 44.68** Error 66 35.84 0.121
** Significant at P<0.01 level
Balusami
Indian Journal Of Natural Sciences www.tnsroindia.org. © IJONS
Vol.5 / Issue 28/ February 2015 International Bimonthly ISSN: 0976 – 0997
2479
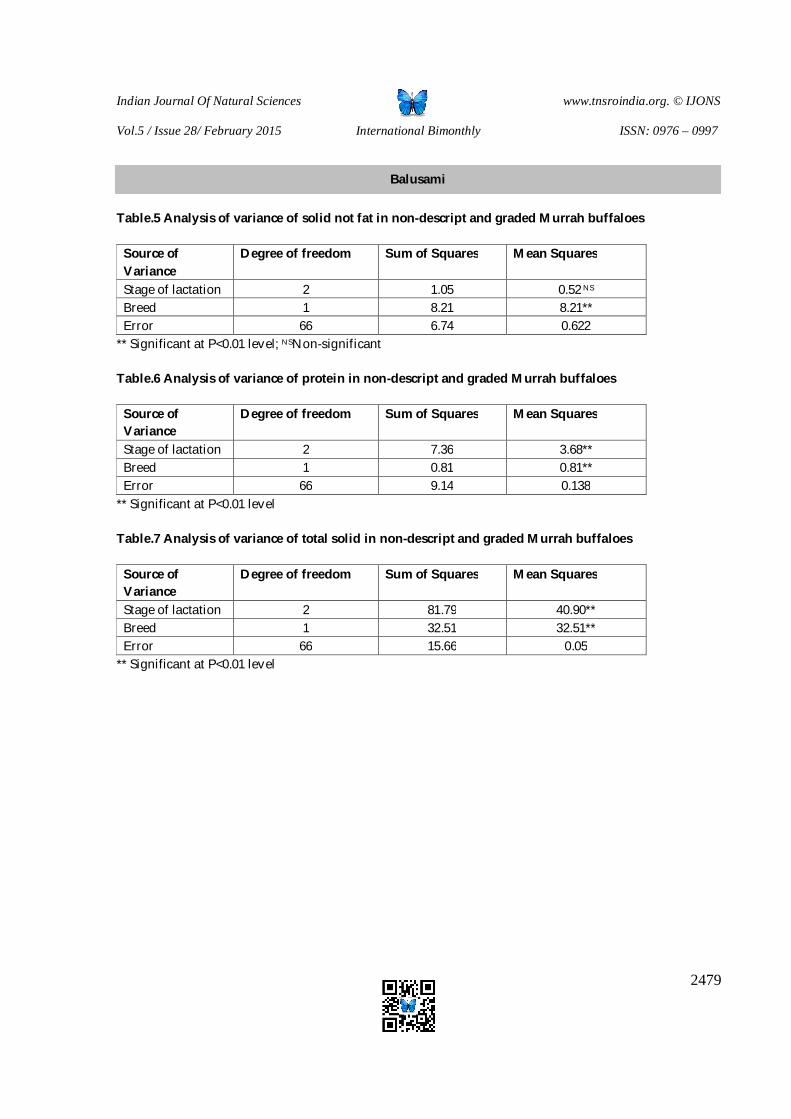
Table.5 Analysis of variance of solid not fat in non-descript and graded Murrah buffaloes
Source of Variance
Degree of freedom Sum of Squares Mean Squares
Stage of lactation 2 1.05 0.52 NS Breed 1 8.21 8.21** Error 66 6.74 0.622
** Significant at P<0.01 level; NSNon-significant Table.6 Analysis of variance of protein in non-descript and graded Murrah buffaloes
Source of Variance
Degree of freedom Sum of Squares Mean Squares
Stage of lactation 2 7.36 3.68** Breed 1 0.81 0.81** Error 66 9.14 0.138
** Significant at P<0.01 level Table.7 Analysis of variance of total solid in non-descript and graded Murrah buffaloes
Source of Variance
Degree of freedom Sum of Squares Mean Squares
Stage of lactation 2 81.79 40.90** Breed 1 32.51 32.51** Error 66 15.66 0.05
** Significant at P<0.01 level
Balusami
Indian Journal Of Natural Sciences www.tnsroindia.org. © IJONS
Vol.5 / Issue 28/ February 2015 International Bimonthly ISSN: 0976 – 0997
2480
Identify the Physical Environment around Shirvan, Northeast Iran Nona Ghazanfarinia1* and Hadi Saeidi 2
Master of Environmental Science, Pune University, India. Young Researchers and Elite Club, Quchan Branch, Islamic Azad University, Quchan, Iran.
Received: 20 Sep 2014 Revised: 28 Sep 2014 Accepted: 3 Oct 2014 *Address for correspondence Nona Ghazanfarinia
Master of Environmental Science, Pune University, India. E.mail : [email protected]
This is an Open Access Journal / article distributed under the terms of the Creative Commons Attribution License (CC BY-NC-ND 3.0) which permits unrestricted use, distribution, and reproduction in any medium, provided the original work is properly cited. All rights reserved. The area around Shirvan, North Khorasan province in Iran contains different landuse–landcover patterns with diverse hydrogeological facies. Geomorphologically, the area is bordered by a rugged mountainous terrain (Fold Mountains) receiving meager rainfall. The area around Shirvan provides a unique opportunity for studying soil-water interaction vis-à-vis agricultural and industrial landuse. The area is significantly developed in terms of industry and agriculture. Cotton and grapes are the major crops grown in the area. Keywords: hydrogeological, Geomorphologically, landuse – landcover.
INTRODUCTION The use of water for agriculture has changed the production of crops dramatically in the 20th century. Throughout the World, agriculture accounts for nearly 70% of the water used, and the majority of this water is used for irrigation. During the 1970s, the construction of irrigation systems dramatically increased water use for irrigation. An increase in irrigation development guarantees an increase in crop production in many countries and thereby ushers in economic growth. Irrigation allows the land that does not receive enough precipitation annually to become land that can be used for productive agriculture.Conversely, excessive irrigation of land causes salinization, especially in arid and semi-arid regions. Irrigation of cropland over a prolonged period may decrease soil fertility thereby increasing the possible use of fertilizers and pesticides that infiltrate into the groundwater or flow as runoff into nearby streams. Along with the irrigation of crops, farmers have livestock and these must be provided by potable water to drink. With a growing world population, expected to increase by 2 billion people by the year 2030, agriculture needs to find a way to use less water or to use the water more efficiently.
ABSTRACT
RESEARCH ARTICLE
Indian Journal Of Natural Sciences www.tnsroindia.org. © IJONS
Vol.5 / Issue 28/ February 2015 International Bimonthly ISSN: 0976 – 0997
2481
Climate change adds an additional element of uncertainty to the availability of water resources. With prospects of changing precipitation patterns, some parts of the Developed and Developing world are expected to have more and others less fresh water available in the future. Faced with increasing demand and climate change, many users including nature (flora, fauna) will struggle to meet their water needs. In case of water scarcity, industry and households can develop ways of using less water, but our water -dependent ecosystems risk being irreversibly damaged. This would affect much more than life around a particular water body. It would affect us, too. With the application of the right agricultural practices and supporting policy solutions, we can achieve significant water efficiency gains in agriculture, which would mean more water available for other uses, nature in particular. Through the use of waste water in agriculture, more fresh water resources can be made available for other needs, including for nature and households. If the quality of the reclaimed water is properly managed, treated waste water can provide an effective alternative for meeting agricultural demand for water.The use of treated waste water for agriculture is already providing significant water management benefits worldwide. In Cyprus, for example, the recycled water targets for 2014 correspond to approximately 28% of the 2008 agricultural water demand. In Gran Canarias, 20% of water used across all sectors is supplied from treated waste water, including the irrigation of 5,000 hectares of tomatoes and 2,500 hectares of banana plantations.A more efficient use of our water resources in agriculture is only one of the steps we need to take in order to reduce our impact on the environment. Without that step, we cannot achieve a resource-efficient economy or build a sustainable future. Agriculture – potentially dependent on soil fertility Since soil management is vital, assessing soil management systems is necessary to meet respective goals considering their long term effects on soil. Soil fertility, soil formation, erosion, pollution, pest prevalence, diseases and weeds and frequency and variety of natural enemies are among properties of different regimes of soil management however tillage is the most important elements of soil management but soil management isn't limited to tillage.Plant response to tillage system can vary depending on soil type, plant species, precipitation and region so it is difficult to determine general procedure of tillage system effects on plant performance. In some rainy regions, plant performance subjected to tillage systems for different plants in temperate regions indicated that there wasn’t significant difference in plant performance among tillage systems and plant species and demonstrated that annual climate model plays more important role in performance than tillage system. Agriculture-surface and groundwater dependent Water is a precious natural resource. It is also one of the most manageable of the natural resources as it is capable of diversion, transport, storage, and recycling (Kumar et.al 2005). All these properties impart to water its great utility for human beings. In India, there are over 20 million private wells, in addition to the government tube wells (Datta, 2005). Through them the overexploitation of groundwater is leading to reduction of low flows in the rivers, declining of the groundwater resources. Lands irrigated by imported waters in arid regions have high salinity and low productivity (Duraiswami et al., 2012). Groundwater accounts for about 80% of domestic water requirement and more than 45% of the total irrigation in the country (Kumar et.al, 2005).The subsurface conditions vary greatly in their lithology, texture and structure, which in turn influence their hydrological characteristics. Therefore, most of hydrogeological regimes are anisotropic and heterogeneous in terms of quantity and quality. Evaluation of aquifer hydraulic properties is an important aspect of all groundwater resource assessment. Hydrogeological surveys that include well inventory and pumping test are therefore crucial in groundwater development and management program (Thigale, 1996).
Nona Ghazanfarinia and Hadi Saeidi
Indian Journal Of Natural Sciences www.tnsroindia.org. © IJONS
Vol.5 / Issue 28/ February 2015 International Bimonthly ISSN: 0976 – 0997
2482
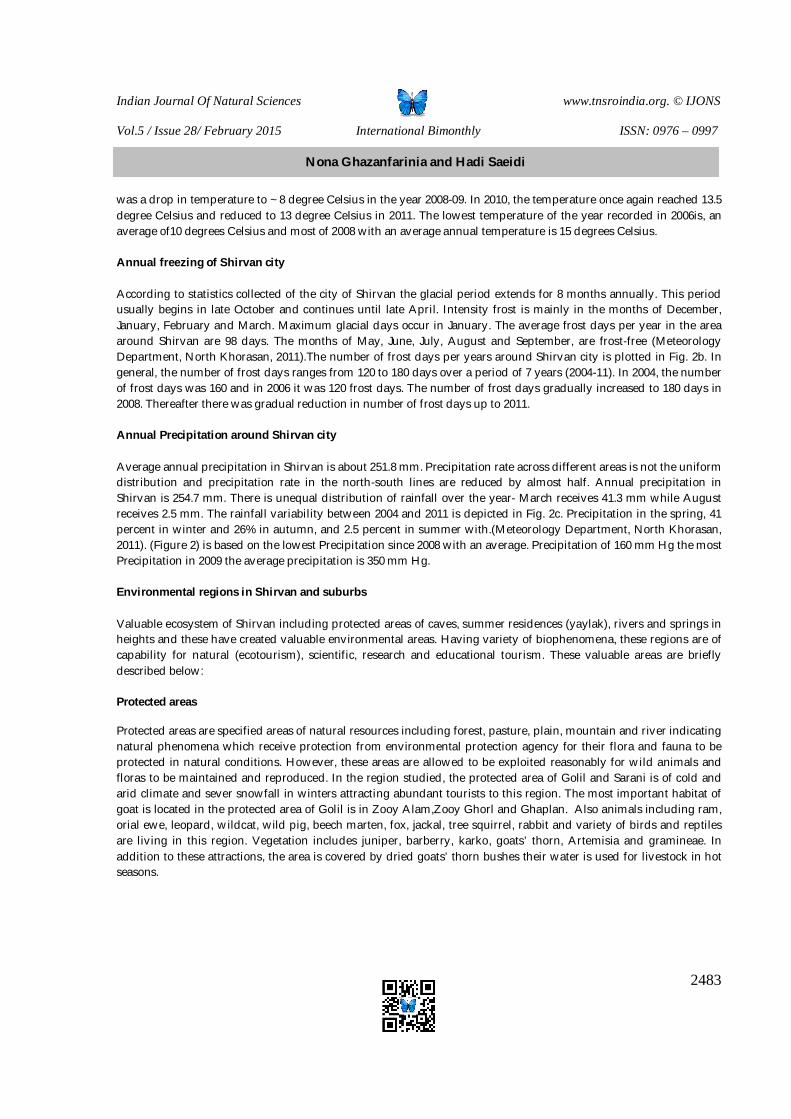
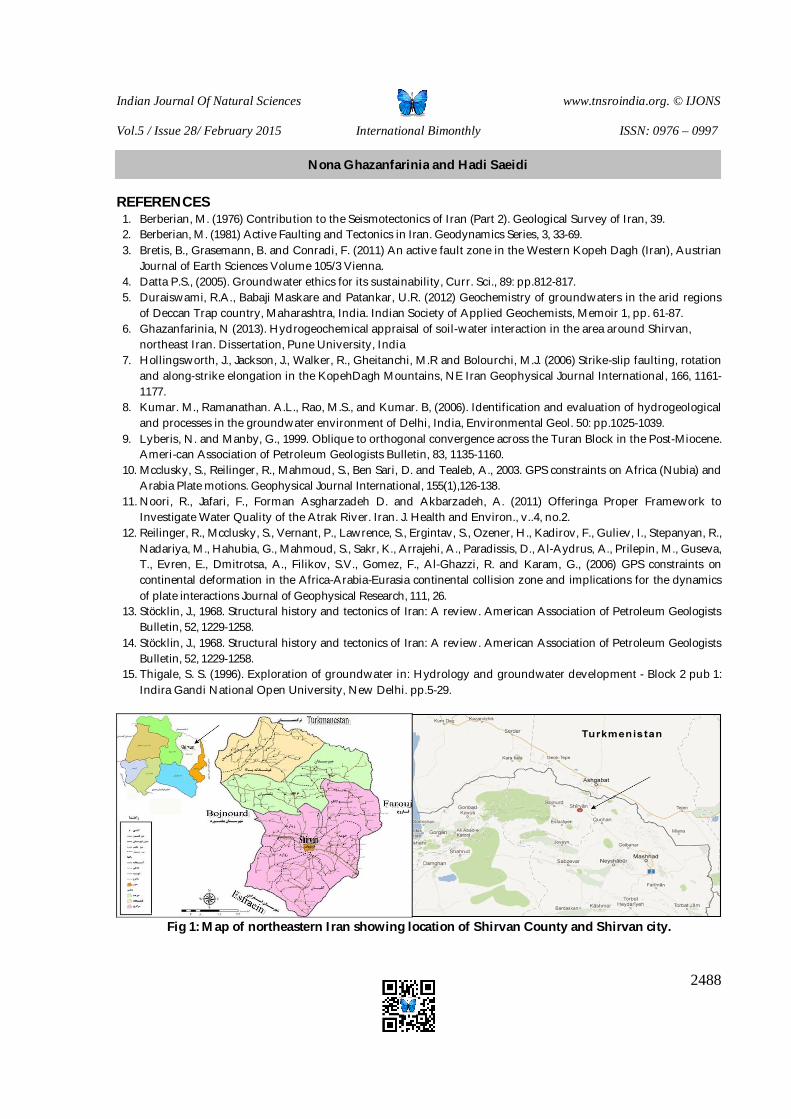
The study area The area around Shirvan, North Khorasan province in Iran contains different landuse – landcover patterns with diverse hydrogeological facies. Geomorphologically, the area is bordered by a rugged mountainous terrain (Fold Mountains) receiving scanty rainfall. The area is significantly developed in terms of industry and agriculture. Cotton and grapes are the major crops grown in the area.Shirvan County is one of largest town of Northern Khorasan Province, Iran (Fig.1) with an area of 3789 km2. It borders with Turkmenistan to the north, Esfraein County to the south, Farouj County to the east and Bojnourd city to the west. The capital of the county is Shirvan city. Shirvan is located in 57.27’ to 58.18’ east longitude and 37.5’ to 37.54’ north latitude. It accounts for about 14% of the province area and 19% of its total population. Shirvan is among the most elevated towns in Northern Khorasan Province and is located in the Valley of Atrak River between Kope Dogh and Ala Dogh mountains. The climate around Shirvan Climate is an important index in this study. The climate around Shirvan is generally like that of mountainous regions with relative cool winters and temperate summers. In winters it is affected by Siberian anti-cyclon under whose influence the weather becomes arid and cold. Low pressure fronts originated in eastern Mediterranean often reach this area where their severity is diminished however; rainfalls are associated with these fronts. These conditions are resulted from two reasons.
a. Fronts affecting this area including western fronts and high pressure eastern fronts b. Local conditions especially heights and their directions
The air masses affecting the climate around Shirvan city (Azarakhsh, 2007) is as follows: 1. Mass of cold weather of Siberia (anti-cyclone Siberia), typically enter north of Shirvan and Zolfaghar Mountain
and is the cause of extreme cold in late winter. Shirvan record severe cold; 26 - degrees Celsius below zero. 2. Air masses formed from northern Europe. After crossing the Black Sea to the Caspian Sea and carry high
humidity. The area north of Shirvan receives heavy snowfall in the winter under this influence. 3. Form centers of low pressure during summers e.g. from dry deserts of Pakistan and plains of southern
Afghanistan. This leads to the displacement of air from the north-eastern Khorasan 4. Caspian air masses from Atrac River Valley influence Shirvan as the air mass causes rainfall and change in wind
directions (northeast – southeast). 5. Air masses from the Mediterranean, though its intensity is reduced in the region of Shirvan but is one of the
front rainfall in this area. This flow is the main of air masses in the winter throughout the country are affected by snow is perhaps the cause of the most precipitation city
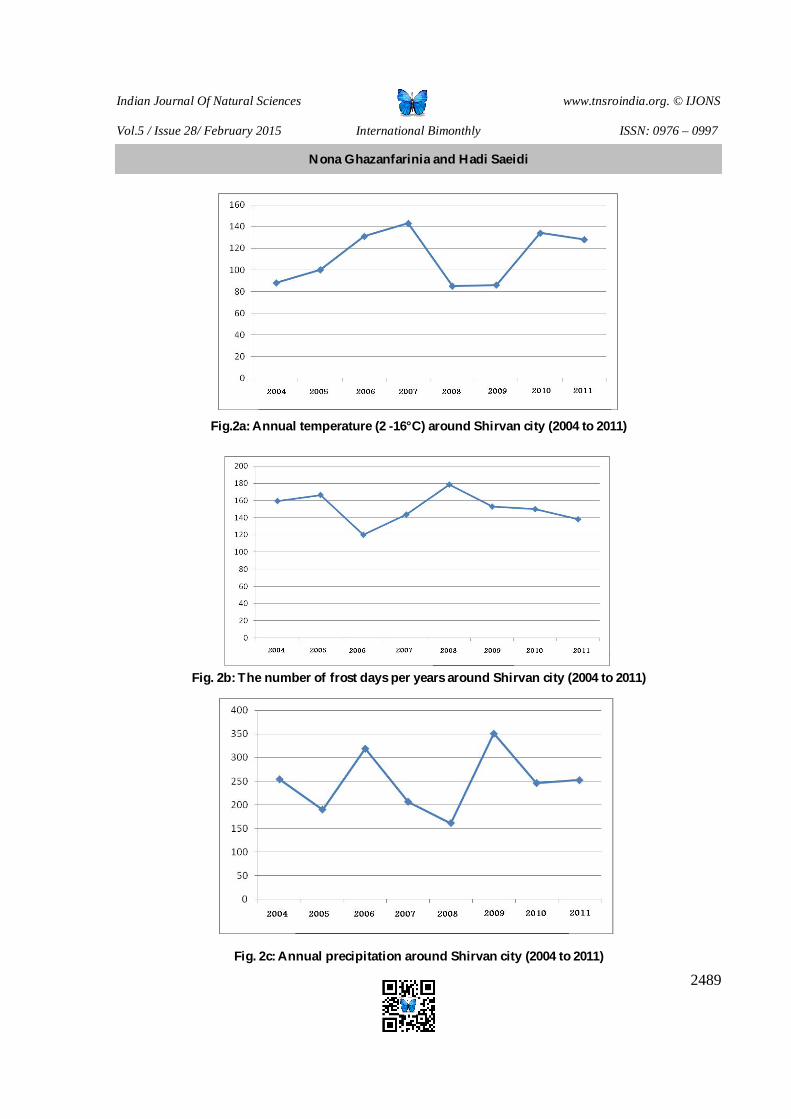
Shirvan city has a temperate and cool mountain climate. The average temperature in January is -2°C and is the coldest month of the year. Minimum temperature in February is rarely -20°C or more (Office of Meteorology Northern Khorasan province, 2011).Warm weather in the spring is slower to advance in Shirvan than other northern cities because in April the temperature is 10°C the monthly average temperature and in July, the warmest month of the year, it reaches monthly average temperature of 6/20 + degrees Celsius. The highest temperature in the area does not exceed 38 + degrees. The average annual rainfall is 235 mm. Annual temperature around Shirvan city
Information obtained from the Bureau of Meteorology Northern Khorasan the average annual temperature in the city is 12.5 °C or more. Warm weather in the spring in this area has been slower than other regions of Khorasan. So, in April mean monthly temperature is about 11.7°C is and the cold weather in autumn is higher than other areas in late October temperatures of 13.6°C do not exceed (Meteorology Department, North Khorasan, 2011).In the year 2010 temperatures reached peak in July and came to 35 degrees above zero and in January the -6degrees below zero. Based on Fig. 2a annual changes in temperature (2004-2011) is between 10 and 15 degrees C oscillator. In 2004, the temperature was around 9 degrees Celsius and gradually increased to 14.5 degree Celsius in 2007. Thereafter there
Nona Ghazanfarinia and Hadi Saeidi
Indian Journal Of Natural Sciences www.tnsroindia.org. © IJONS
Vol.5 / Issue 28/ February 2015 International Bimonthly ISSN: 0976 – 0997
2483
was a drop in temperature to ~ 8 degree Celsius in the year 2008-09. In 2010, the temperature once again reached 13.5 degree Celsius and reduced to 13 degree Celsius in 2011. The lowest temperature of the year recorded in 2006is, an average of10 degrees Celsius and most of 2008 with an average annual temperature is 15 degrees Celsius. Annual freezing of Shirvan city According to statistics collected of the city of Shirvan the glacial period extends for 8 months annually. This period usually begins in late October and continues until late April. Intensity frost is mainly in the months of December, January, February and March. Maximum glacial days occur in January. The average frost days per year in the area around Shirvan are 98 days. The months of May, June, July, August and September, are frost-free (Meteorology Department, North Khorasan, 2011).The number of frost days per years around Shirvan city is plotted in Fig. 2b. In general, the number of frost days ranges from 120 to 180 days over a period of 7 years (2004-11). In 2004, the number of frost days was 160 and in 2006 it was 120 frost days. The number of frost days gradually increased to 180 days in 2008. Thereafter there was gradual reduction in number of frost days up to 2011. Annual Precipitation around Shirvan city Average annual precipitation in Shirvan is about 251.8 mm. Precipitation rate across different areas is not the uniform distribution and precipitation rate in the north-south lines are reduced by almost half. Annual precipitation in Shirvan is 254.7 mm. There is unequal distribution of rainfall over the year- March receives 41.3 mm while August receives 2.5 mm. The rainfall variability between 2004 and 2011 is depicted in Fig. 2c. Precipitation in the spring, 41 percent in winter and 26% in autumn, and 2.5 percent in summer with.(Meteorology Department, North Khorasan, 2011). (Figure 2) is based on the lowest Precipitation since 2008 with an average. Precipitation of 160 mm Hg the most Precipitation in 2009 the average precipitation is 350 mm Hg. Environmental regions in Shirvan and suburbs Valuable ecosystem of Shirvan including protected areas of caves, summer residences (yaylak), rivers and springs in heights and these have created valuable environmental areas. Having variety of biophenomena, these regions are of capability for natural (ecotourism), scientific, research and educational tourism. These valuable areas are briefly described below: Protected areas
Protected areas are specified areas of natural resources including forest, pasture, plain, mountain and river indicating natural phenomena which receive protection from environmental protection agency for their flora and fauna to be protected in natural conditions. However, these areas are allowed to be exploited reasonably for wild animals and floras to be maintained and reproduced. In the region studied, the protected area of Golil and Sarani is of cold and arid climate and sever snowfall in winters attracting abundant tourists to this region. The most important habitat of goat is located in the protected area of Golil is in Zooy Alam,Zooy Ghorl and Ghaplan. Also animals including ram, orial ewe, leopard, wildcat, wild pig, beech marten, fox, jackal, tree squirrel, rabbit and variety of birds and reptiles are living in this region. Vegetation includes juniper, barberry, karko, goats’ thorn, Artemisia and gramineae. In addition to these attractions, the area is covered by dried goats’ thorn bushes their water is used for livestock in hot seasons.
Nona Ghazanfarinia and Hadi Saeidi
Indian Journal Of Natural Sciences www.tnsroindia.org. © IJONS
Vol.5 / Issue 28/ February 2015 International Bimonthly ISSN: 0976 – 0997
2484
Summer residences
Considering unique geographical features, mountains and effluent valleys, Shirvan has worth seeing summer residences with good climate the most important of which are Gelyan, Oghaz, Golil Namanlo, Zavarem and Stakhri. Of them, Zavarem and Gelyan are located in the region studied. Important plains
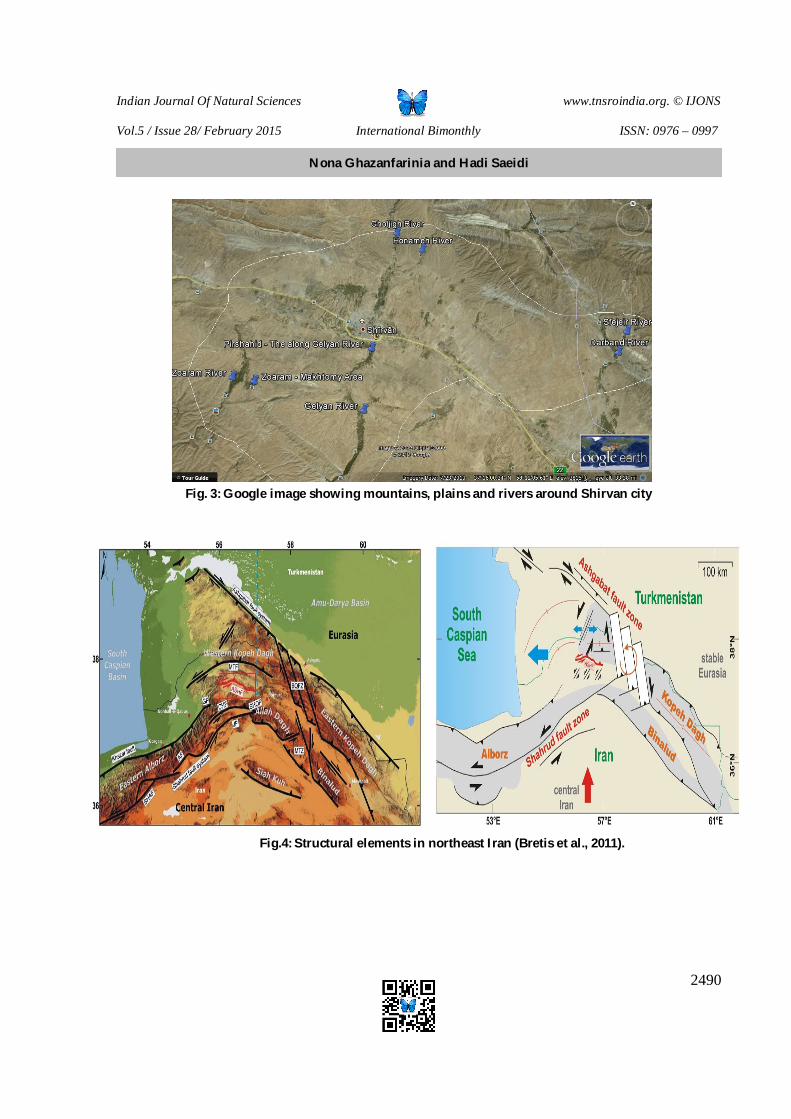
The most important plains are Shirvan-Ziarat, Seke, Baghan and Takmaran plains growing flowers and Tulips at places. Their main crop is wheat and barley. Shirvan plain has evolved as parallel north-south trending Mountains and accommodates the main populated centers.This is the lowest area in Shirvan region with the 1000m from sea level and its direction is from western north to eastern south. Highlands and plain are in a good situation so that west-east connection is conducted easily. Elaborate structure of these mountains has made penetration difficult and tectonic events are attributed to interference of mountainous systems making this part of northern Khorasan unstable and frequent earthquakes in Shirvan-Ghochan are resulted from this natural phenomenon. Water resources The main resource feeding underground waters of the area studied is Barzoo River. The county is of five drainage basins and seven rivers. Atrac River: This famous river its drainage basin is in the eastern Ghochan reaches Shirvan after flowing in Ghochan plain and Farouj and drains into Hussein Gholi Khan bay travelling 530km through Gorgan and forming some common border with Turkmenistan. Barzoo River: This River begins in the northern heights flowing in Shirvan and drains into the Atrac River (Fig. 3). Barzoo River is the most effluent tributary of Atrac River in the higher part and more than 90% of it is in 2000m higher than sea level in Shirvan drainage basin cutting across the bedded limestone’s. Because the water is used totally for irrigation of the plain lands in 7 months per year, so it is very important for feeding ground water of Shirvan plain. It drains a basin of 1014.3 km2 to the junction point with Atrac River. Total volume of water flowed in the humid half of the year from December to June is 19.56 milionm3 and total volume of the water flowing in the arid half of the year from June to December is 10.4milion. Gholjogh River: Its main basin is in Golil, Alkhas Mountains and southern foot hills of Sarani and Sardab mountains. This flows from north to the south and joins Atrac River near Shirvan city (Fig. 3).The river becomes sluggish near here and lot of sedimentation is also seen . Zavarem River:It rises in the Jahan Arghia Mountains well known as Takht Mirza and flows from south to the north (Fig. 3)and joins to the Atrac River near Shirvan sugar factory. At places the river is almost dried and exposes sedimentation along the flood plains while at some places it flows with good velocity. Being in limestone terrain spring waters emerging out of the cavern can also be observed. Zavaram River cuts across the horizontally bedded limestone, also deposits transported pebbles. Gelyan River: This is flowing in the south of the city and rises in the Shah Jahan Mountains. The water of this river is sluggish, used for irrigation. Honame River:Its basin is located in the Amortley, Oghaz, Petle Gah and Sanjar Beig Mountains. It drains into Gholjogh River in the north of Shirvan after watering farms and gardens in the course and leaves the city as Chailagh. This is also a gently flowing river. Sfejeir River: Sfejeir River in North Khorasan province is located in the geographic location 58° 17E, 37° 23N.It is a wide river and good vegetation is seen along the banks. The adjacent mountain exposes gently dipping limestone beds.
Nona Ghazanfarinia and Hadi Saeidi
Indian Journal Of Natural Sciences www.tnsroindia.org. © IJONS
Vol.5 / Issue 28/ February 2015 International Bimonthly ISSN: 0976 – 0997
2485
Geology of the Area The collision between the Eurasian and the Afro-Arabian plates and its influence on the geologic and tectonic settings in Iran has been discussed by a large number of geologists from different points of views (e.g. Stöcklin, 1968; Berberian, 1976; Jackson et al., 1995; Allen et al., 2004; Reilinger et al., 2006; Vernant and Cherý, 2006; Kaviani et al., 2009; Karga-Ranbafghi et al., 2011). Recently, according to Bretis et al (2012)the Kopeh Dagh (Dagh = Mountains) and its transition towards the South Caspian Basin and the easternAlborz started to become the target of more detailed investigations (e.g. Jackson et al., 2002; Hollingsworth et al., 2006; Hollingsworth et al., 2008; Hollingsworth et al., 2009;Shaba-nian et al., 2009a; Shabanian et al., 2009b; Hollingsworth et al., 2010; Javidfakhr, 2010; Shabanian et al., 2010; Javidfakhr et al., 2011a; Javidfakhr et al., 2011b). Most of these publications investigated the neo-tectonic geodynamics in this region and use tectonic geomorphology as an integral part in order to quantify recent fault activity. Structurally, range of Shirvan Plates belongs to two regions of Kopeh Dagh and Binalud, except for a small part in south-east, the Plate would locate in range of central Iran. Most of the geology and structural aspects have in this chapter have been dealt with by Bretis et al (2011) and forms the basis of the following paragraphs. The Kopeh Dagh (Fig.4), which extends along the border area between Iran and Turkmenistan, forms a linear fold-and-thrust belt between the stable Turan Block in the North and Central Iran in the South (Berberian, 1981; Lyberis and Manby, 1999).It is located within the Alpine-Himalayan orogenic belt and is defined as the N limit of the Cenozoic deformation in Iran (Hollingsworth et al., 2006). Recent GPS measurements (McClusky et al., 2003; Vernant et al., 2004a) indicate a northward movement of Arabia, with respect to Eurasia of about 23 mm/a, and therefore the deformation within the mountain belts around Iran is considered to be active.The Kopeh Dagh Basin, together with the Amu-Darya Basin to the S in Turkmenistan, form a large intercontinental basin filled by a thick post-Triassic sequence of mostly marine sediments that mainly consist of limestone’s, marls and sandstones (Stöcklin 1968; Berberian, 1976). These sedimentary sequences record an almost complete succession from Lower Jurassic to Pliocene rocks (Lyberis and Manby, 1999). Less is known about the deformation history of the pre-Jurassic successions in the Kopeh Dagh, although it has been interpreted resulting from the closure of the Paleo-Tethys (AfsharHarb, 1979). The successions are partly eroded by and unconformably overlain by Jurassic and younger sediments (AfsharHarb, 1979). From the early Jurassic onwards, the opening of the Kopeh Dagh-Amu-Darya Basin started. Subsidence was mostly bound to major E-W trending normal faults. This continuous subsidence led to the deposition of the thick post-Triassic sequence of mostly marine sedimentary rocks. Onset of the convergence between the Iran and Turan blocks started in the Paleocene and gave rise to the inversion of the basin. Structurally, the Kopeh Dagh can be divided in two subareas, which are characterized by differently oriented structures: (i) the eastern Kopeh Dagh is characterized by fold trains with uniform NW-SE trend. (ii) and the Western KopehDagh, where the general trend of structures appears to bend into a W-E direction (Fig. 4).In the study area, The Golian Anticlines, Shur, Zujhan, Shurak and Golian synclines, Denj, Ghezel Hesar are of most important folds of region. The Noshirvan thrusting faults, Zoeram, Chaharkharvar, Toodeh, Kari, Gerehzoo, Golian normal fault and Hossein Abad fault (with weak thrust and strike-slip movements) are of important faults of this region. The most important minerals of this region are limestone, marl, plaster, ashlar and sand. Erosion and sediment in Atrac River Atrac basin has high quality agricultural lands and pastures subjected to erosion and demolition annually leading to great losses resulted from erosion. The specific demolition is 145 tonne per km2and the specific erosion is 1750 tonne per km2.The area of erodible land in Atrac basin: 1272495 hectares. Sever side erosion: 211km.
Nona Ghazanfarinia and Hadi Saeidi

Indian Journal Of Natural Sciences www.tnsroindia.org. © IJONS
Vol.5 / Issue 28/ February 2015 International Bimonthly ISSN: 0976 – 0997
2486
Flood ability in Atrac Atrac basin having high floodability and erosion indices has been always at risk of flooding and is susceptible to flooding and destructions reflected by statistics of destructive flooding occurred in this area. Interventions of people resided in drainage basins in ecosystem, lack of drainage residence culture regarding natural resources and soil usage, livestock overgrazing, bush removing, creating farms in steep regions can disturb hydrologic equilibrium of drainages and aggravate flooding. Uncontrolled exploitation of pastures also leads to decreased soil maintenance capacity and thereby increased surface runoffs. Landslide in Atrac Landslide occurs in many regions of Atrac basin leading to many losses. This phenomenon has been observed in a wide range and different sizes. To date maximum slide depth in Atrac basin has been 400m in Doortanloo landslide and minimum is 12m in Hassan soo. Maximum landslide area in Bojnourd has been 490000 m2. The slide area in the landslide STOR1 in the village Starkhi in the Shirvan Plain was 875000m2. Landslides in Atrac basin occurred mostly in bare vegetation, dry farming and pastures without plants.Factors affecting landslides in Atrac basin are alternative permeable and impermeable layers, chemical and mineralogical composition, clay minerals hydration, accumulation of landslides, rain, snow and hail burden, farming and irrigation on footages, faults and doping of minerals and stones. Erosion in slide surface is mostly planar, groove, river bank, rainy and aqueous vein. Landuse-Landcover The following landuse-land cover classes are seen in the study area. Hilly topography
Shirvan County is located in a mountainous region between two mountains of Kope Dagh in the north and Ala Dagh in the south. The most famous mountains in Shirvan are Tanbal, Dalanche, Golil, Kanjokhor, Sanjar Beig, Imam Hazer, Petle Gah, Shir Gah and Ghanbar in the north and Bigan, Ghale Zoo, Gharavol Change, Reza Abad, Glian, Shookheri, Takhte Mirza, Bolghan and Shah Jahan in the south. Pasture
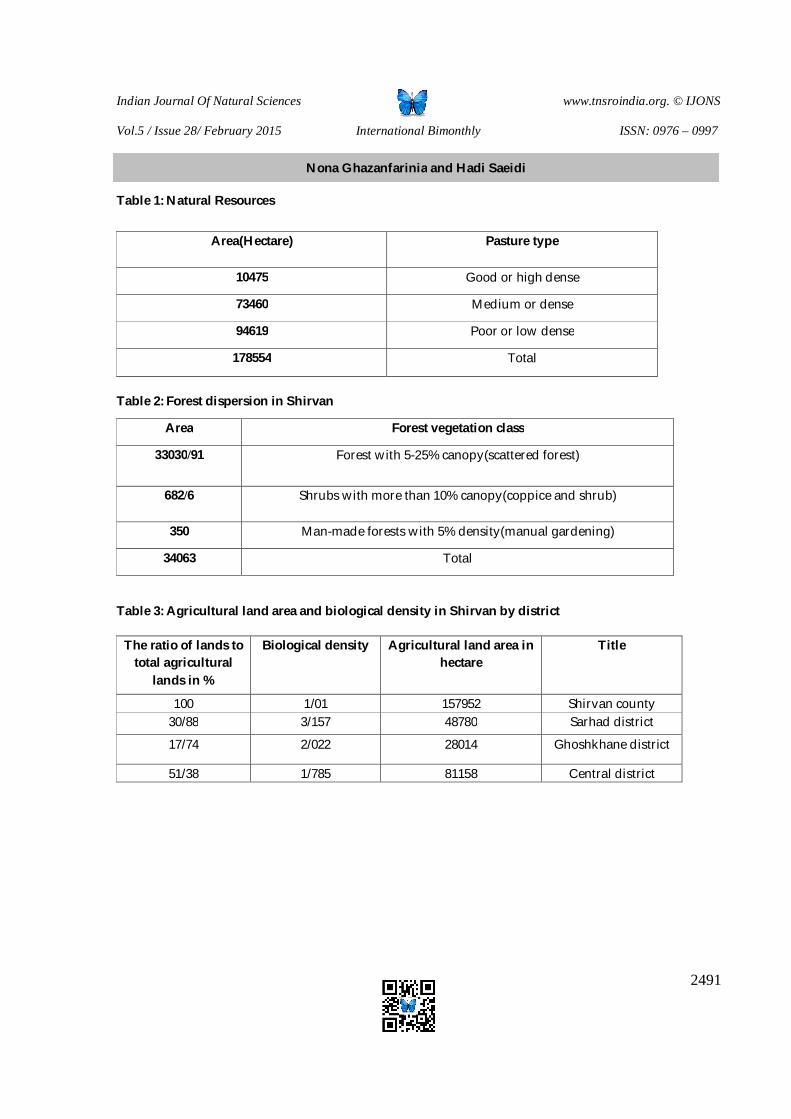
Renewable natural resources cover 290000 Hectares accounting for about 72.5% of total natural resources area of the county. Given to weather conditions and vegetation, this county is often of summer and few winter and middle pastures. Shirvan Pasture Department has audited more than 160000 Hectares of forest and pasture areas covering about 60% of total pasture. Shirvan has 88 audited pastures of which 2 are winter, 2 middle and the remainders are summer pastures (Table 1). Forest and vegetation
Forest resources and habitats in the county covering the area of 33713 Hectares, are considered as valuable resources accounting for about 7.93% of the province forests and 15.3% of the county natural areas.(Table2). Forests in the county are in the vegetative region of Iran and Tooran their dominant type is juniprus as well as maple, kooker, barberry and garland thorn.Vegetation can be considered as one of determinants of tourism attraction. There is a close relationship between vegetation and wildlife so that they can't be distinguished by tourists. Vegetation in Shirvan is often as mountainous steppe. There can be observed some remains of past forests only in Sardab Sarani Mountain on the north and southern mountains which are protected today. There is also protected area of Glil covering 27,000 Hectares which is in 70km north of Shirvan and border of Iran-Turkmenistan. The respective area has been protected since 1971 as Sardab Sarani international Park. This area is of scattered forests of juniper and
Nona Ghazanfarinia and Hadi Saeidi

Indian Journal Of Natural Sciences www.tnsroindia.org. © IJONS
Vol.5 / Issue 28/ February 2015 International Bimonthly ISSN: 0976 – 0997
2487
prosperous pastures. Other plants includes kooker, barberry, haw berry, garland thorn, wild apricot; as well as industrial and medical plants including galbanum, goat’ thorn, gum tragacanth, liquor ice, alhagi. Good pastures are located on the north and eastern north, middle pastures are on the south and poor pastures are around villages and the plain. Agriculture
Total agricultural lands in Shirvan county is 100000 Hectares of which 27000 Hectares (27.4%) are irrigated lands and 73000 Hectares (72.6%) are dry lands. Overall, 21% of total agricultural lands of Northern Khorasan are in this county. Gardening
The area in Shirvan in which gardening crops are cultivated is 7000H of which 5774 H are irrigated cultivation. The main gardening crops are: Apple, Grape, Pear, Almond, Walnut, Apricot, Black cherry, Cherry and Peach. Agricultural land space Totally, agricultural lands of Shirvan are 51.38% in the central section, 30.88% in Sarhad and 17.74% in Ghoshkhane. Biological density Biological density indicates the ratio of agricultural lands to population. The figure indicates that how much agricultural lands exist for each person. According to table 3, biological density throughout Shirvan is 1.01. Sarhad section has the highest with 3.157 and for central district of no population is 1.785 which is the lowest. The area around Shirvan therefore provides a unique opportunity for studying soil-water interaction vis-à-vis agricultural and industrial landuse. Keeping this aspect in mind, it is envisaged to undertake the field work and sampling of soils and sediments leading to a dissertation soil and groundwater as a proxy to understand the geochemical changes under natural environment vis-à-vis anthropogenic activities such as urbanization, agriculture and industries.
DISCUSSION Sources of salts in Shirvan surface waters and soils The Atrak River is an important water supply resource in the Razavi Khorasan, Northern Khorasan and Golestan provinces. This river is the line border of Iran and Turkmenistan countries. According to Noori et al (2011), lack of water quality and quantity data due to nonexistence of a proper surface water quality monitoring station network was one of the main problems for water quality evaluation in the Atrak River. However by developing the water quality index model they showed that most of their stations were in the moderate salinity class. The result also showed that most parts of the Atrak River had trophic condition and based on findings of O’Conor model it was demonstrated that the salinity status observed in their four stations originated from the base flow and therefore, salinity is affected by the natural sources. According to this study the natural source for salinity in the Shirvan plain could be due to:
1. Geological composition of the parent material of the rock (limestone/marl) and soils. The Shirvan area is rich in naturally occurring mineral e.g. halite (NaCl) and gypsum (CaSO4) that were deposited with the carbonate sediments.
2. Low rainfall and high potential evapotranspiration as a consequence of extreme climate.
Nona Ghazanfarinia and Hadi Saeidi
Indian Journal Of Natural Sciences www.tnsroindia.org. © IJONS
Vol.5 / Issue 28/ February 2015 International Bimonthly ISSN: 0976 – 0997
2488
REFERENCES 1. Berberian, M. (1976) Contribution to the Seismotectonics of Iran (Part 2). Geological Survey of Iran, 39. 2. Berberian, M. (1981) Active Faulting and Tectonics in Iran. Geodynamics Series, 3, 33-69. 3. Bretis, B., Grasemann, B. and Conradi, F. (2011) An active fault zone in the Western Kopeh Dagh (Iran), Austrian
Journal of Earth Sciences Volume 105/3 Vienna. 4. Datta P.S., (2005). Groundwater ethics for its sustainability, Curr. Sci., 89: pp.812-817. 5. Duraiswami, R.A., Babaji Maskare and Patankar, U.R. (2012) Geochemistry of groundwaters in the arid regions
of Deccan Trap country, Maharashtra, India. Indian Society of Applied Geochemists, Memoir 1, pp. 61-87. 6. Ghazanfarinia, N (2013). Hydrogeochemical appraisal of soil-water interaction in the area around Shirvan,
northeast Iran. Dissertation, Pune University, India 7. Hollingsworth, J., Jackson, J., Walker, R., Gheitanchi, M.R and Bolourchi, M.J. (2006) Strike-slip faulting, rotation
and along-strike elongation in the KopehDagh Mountains, NE Iran Geophysical Journal International, 166, 1161-1177.
8. Kumar. M., Ramanathan. A.L., Rao, M.S., and Kumar. B, (2006). Identification and evaluation of hydrogeological and processes in the groundwater environment of Delhi, India, Environmental Geol. 50: pp.1025-1039.
9. Lyberis, N. and Manby, G., 1999. Oblique to orthogonal convergence across the Turan Block in the Post-Miocene. Ameri-can Association of Petroleum Geologists Bulletin, 83, 1135-1160.
10. Mcclusky, S., Reilinger, R., Mahmoud, S., Ben Sari, D. and Tealeb, A., 2003. GPS constraints on Africa (Nubia) and Arabia Plate motions. Geophysical Journal International, 155(1),126-138.
11. Noori, R., Jafari, F., Forman Asgharzadeh D. and Akbarzadeh, A. (2011) Offeringa Proper Framework to Investigate Water Quality of the Atrak River. Iran. J. Health and Environ., v..4, no.2.
12. Reilinger, R., Mcclusky, S., Vernant, P., Lawrence, S., Ergintav, S., Ozener, H., Kadirov, F., Guliev, I., Stepanyan, R., Nadariya, M., Hahubia, G., Mahmoud, S., Sakr, K., Arrajehi, A., Paradissis, D., Al-Aydrus, A., Prilepin, M., Guseva, T., Evren, E., Dmitrotsa, A., Filikov, S.V., Gomez, F., Al-Ghazzi, R. and Karam, G., (2006) GPS constraints on continental deformation in the Africa-Arabia-Eurasia continental collision zone and implications for the dynamics of plate interactions Journal of Geophysical Research, 111, 26.
13. Stöcklin, J., 1968. Structural history and tectonics of Iran: A review. American Association of Petroleum Geologists Bulletin, 52, 1229-1258.
14. Stöcklin, J., 1968. Structural history and tectonics of Iran: A review. American Association of Petroleum Geologists Bulletin, 52, 1229-1258.
15. Thigale, S. S. (1996). Exploration of groundwater in: Hydrology and groundwater development - Block 2 pub 1: Indira Gandi National Open University, New Delhi. pp.5-29.
Fig 1: Map of northeastern Iran showing location of Shirvan County and Shirvan city.
Nona Ghazanfarinia and Hadi Saeidi
Indian Journal Of Natural Sciences www.tnsroindia.org. © IJONS
Vol.5 / Issue 28/ February 2015 International Bimonthly ISSN: 0976 – 0997
2489
Fig.2a: Annual temperature (2 -16°C) around Shirvan city (2004 to 2011)
Fig. 2b: The number of frost days per years around Shirvan city (2004 to 2011)
Fig. 2c: Annual precipitation around Shirvan city (2004 to 2011)
Nona Ghazanfarinia and Hadi Saeidi
Indian Journal Of Natural Sciences www.tnsroindia.org. © IJONS
Vol.5 / Issue 28/ February 2015 International Bimonthly ISSN: 0976 – 0997
2490
Fig. 3: Google image showing mountains, plains and rivers around Shirvan city
Fig.4: Structural elements in northeast Iran (Bretis et al., 2011).
Nona Ghazanfarinia and Hadi Saeidi
Indian Journal Of Natural Sciences www.tnsroindia.org. © IJONS
Vol.5 / Issue 28/ February 2015 International Bimonthly ISSN: 0976 – 0997
2491
Table 1: Natural Resources
Table 2: Forest dispersion in Shirvan
Forest vegetation class Area
Forest with 5-25% canopy(scattered forest) 91/33030
Shrubs with more than 10% canopy(coppice and shrub) 6/682
Man-made forests with 5% density(manual gardening) 350
Total 34063
Table 3: Agricultural land area and biological density in Shirvan by district
Pasture type Area(Hectare)
Good or high dense 10475
Medium or dense 73460
Poor or low dense 94619
Total 178554
Title Agricultural land area in hectare
Biological density The ratio of lands to total agricultural
lands in %
Shirvan county 157952 1/01 100 Sarhad district 48780 3/157 30/88
Ghoshkhane district 28014 2/022 17/74
Central district 81158 1/785 51/38
Nona Ghazanfarinia and Hadi Saeidi
Indian Journal Of Natural Sciences www.tnsroindia.org. © IJONS
Vol.5 / Issue 28/ February 2015 International Bimonthly ISSN: 0976 – 0997
2492
Information Behaviour of the Orange Growers
Anita Deshmukh1 ,D.M.Mankar2,N.R.Koshti3* and Syed Shakir Ali4 1Department of Extension Education, Krishi Vigyan Kendra, Bhopal Road, MP- 470002,India. 2Department of Extension Education, Dr. Panjabrao Deshmukh Krishi Vidyapeeth,P.O.Krishi Nagar,Akola-444104 (MS) India. 3Dr. Panjabrao Deshmukh Krishi Vidyapeeth,P.O.Krishi Nagar,Akola-444104 (MS) India. 4 Krishi Vigyan Kendra, Malegaon Khurd (PO). - 413115, Tal: Baramati, Pune, Maharashtra, India. Received: 10 Dec 2014 Revised: 25 Dec 2014 Accepted: 9 Jan 2015 *Address for correspondence N.R.Koshti Associate Professor, Dr. Panjabrao Deshmukh Krishi Vidyapeeth, P.O.Krishi Nagar,Akola-444104 (MS) India. E.mail: [email protected],Mobile : 09921511299
This is an Open Access Journal / article distributed under the terms of the Creative Commons Attribution License
(CC BY-NC-ND 3.0) which permits unrestricted use, distribution, and reproduction in any medium, provided the original work is properly cited.All rights reserved.
The oranges created in Amravati district possessed the biggest share of oranges within the Vidarbha orange market. The orange crop plays a vital role within the economy of the region. Among the fruit crops, orange crop covers about 45,226 ha area in Vidarbha. There is still a good potential toward bringing a lot of area below orange in Vidarbha region. The present paper analyses the information behaviour of orange growers concerning production of the oranges. The study was conducted in purposively selected Amravati district of the Vidarbha region of Maharashtra state. Five Panchayat samities from Amravati district were hand-picked purposively covering ten villages from every Panchayat samiti. Thus, total 50 villages and five orange growers from each selected village were selected .250 orange growers constituted the sample size for the present investigation. Study findings indicated that radio was the important source of information as expressed by 86.00 per cent of the orange growers. They evaluate the information about production and marketing of orange crop in discussion with neighbors’ and friends (84.00%). Majority of the orange growers (64.00%) reported that they always maintain newspapers cutting for storage information. An overwhelming majority of the orange growers utilized the information pertaining to water stress in Mrig bahar (91.20%) and Ambia bahar (86.40%) and it’s harvesting by 81.60 per cent and 89.60 per cent of them, respectively. Most of the orange growers, by and large, had high level of information seeking, information evaluation, information preservation and information utilization behaviour. Thereby, it gives a clear indication that there is a wide scope for exploiting the information behaviour of the orange growers to speed up and enhance the rate of use of recommended production and marketing technology of orange.
Key words: Information behaviour, Orange growers.
ABSTRACT
RESEARCH ARTICLE
Indian Journal Of Natural Sciences www.tnsroindia.org. © IJONS
Vol.5 / Issue 28/ February 2015 International Bimonthly ISSN: 0976 – 0997
2493
INTRODUCTION Nagpur mandarin is grown in Vidarbha region of Maharashtra over 1, 46,040 ha area with the production of 5, 97,758 million tons. The cultivation of orange in Maharashtra is mostly confined to Vidarbha region. The orange crop plays a vital role within the economy of the region. Among the fruit crops, orange crop covers about 45,226 ha area in Vidarbha. The Amravati & Nagpur districts contribute concerning 80%of the overall area below orange orchards Maharashtra State sharing 48.55% and 31.45% respectively. just in case of production of Oranges in Vidarbha, larger production is in Amravati districts i.e. 37.36% whereas that in Nagpur district is 23.87%., thus, it is, seen that the oranges created in Amravati district possessed the biggest share of oranges within the Vidarbha orange market [1] .The biggest orange cultivation and production is in Warud, Morshi, Chandu Bazar, Achalpur and Anjangaon talukas of Amravati district. Orange from these centers has major contribution in Nagpur orange market. The efforts to increase orange production have been made by central and state government by starting horticulture development programmes. The subsidy on purchase of fertilizers and plant protection chemicals has also made available to the orchards. Despite this, the production of orange per hectare in attributed as non suitability of technology, lack of knowledge, and characteristics of orange growers, price policy and the situational factors. The present study is therefore confined to this region to assess the information behaviour of orange growing especially in production and marketing of oranges.
MATERIALS AND METHODS
The study was conducted in purposively selected Amravati district of the Vidarbha region of Maharashtra state was hand-picked purposively attributable to larger area below mandarin orange cultivation within the state. The exploratory research design was used. On the basis of maximum area below mandarin orange cultivation five panchayat samities from Amravati district were hand-picked purposively. Considering the said knowledge Chandur Bazar, Warud, Morshi, Achalpur and Anjangaon from Amravati district were hand-picked and ten villages from every taluka were purposively selected. Taluka Agriculture Officer of the chosen} talukas was contacted and list of 10 villages having a lot of area below orange Mandarin fruits was selected. Thus, total 50 villages were selected from five talukas and five orange growers having more area under orange cultivation was selected thus, total 250 orange growers constituted the sample size for the present study. Construction of interview schedule for assortment of knowledge was the foremost necessary aspects, and therefore the basis for the social analysis. Data were collected by pre-tested structured interview schedule through face to face interviews.
RESULT AND DISCUSSION Information behaviour of orange growers
The information behaviour of the orange growers was studied on four behavioral dimension namely, information seeking, evaluation, preservation and utilization behaviour. The findings pertaining to these dimension and overall information have been presented in the subheads as below.
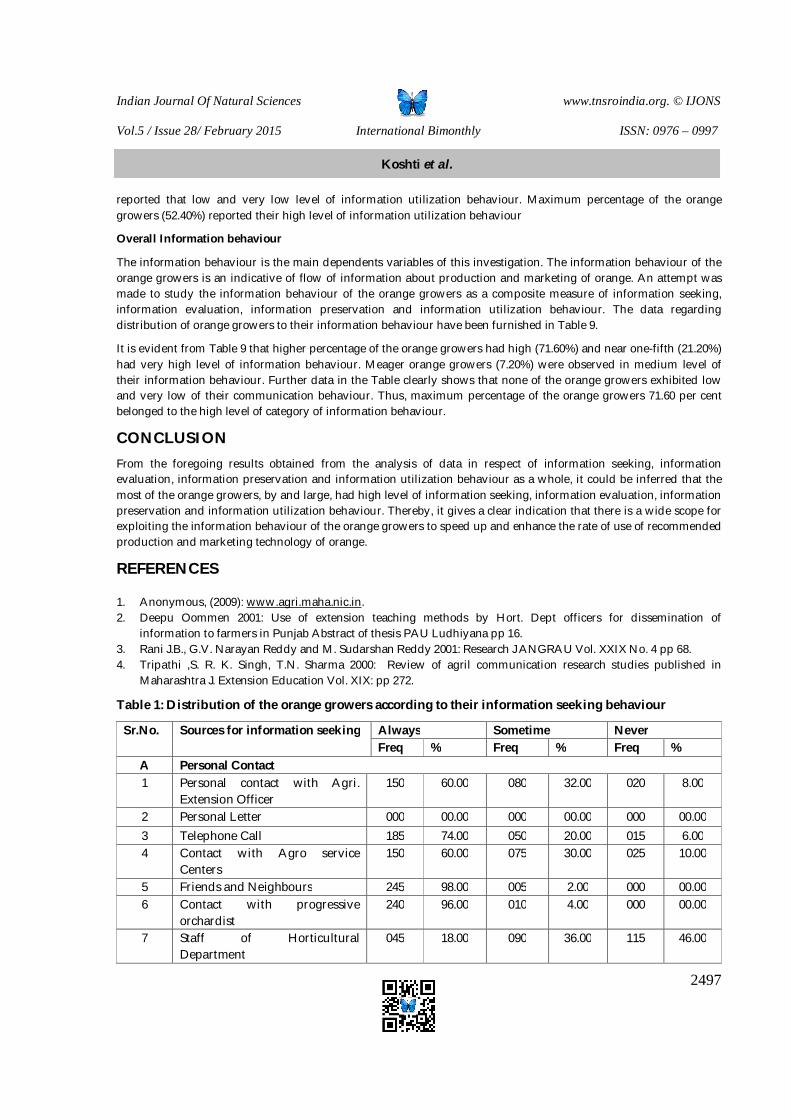
Information seeking behaviour
As stated earlier, information seeking behaviour of orange growers refers to the various acts performed by an individual for seeking scientific farm information from different sources and channels. In this context, the orange growers utilized a number of sources and channels against which the data were collected which have been presented in Table 1.
A perusal Table 1 reviewed all the sources channel were used by the orange growers for seeking the relevant information with regards to the personal contact method. It was observed that nearly cent per cent of the orange growers always receive the information from friends and neighbor (98.00%) and progressive orchards (96.00%).The discussion with the orange growers was the third major personal contact methods adopted by 90% of the orange growers for seeking the information. The orange growers had economically sound condition and used 74.00 per cent
Koshti et al.
Indian Journal Of Natural Sciences www.tnsroindia.org. © IJONS
Vol.5 / Issue 28/ February 2015 International Bimonthly ISSN: 0976 – 0997
2494
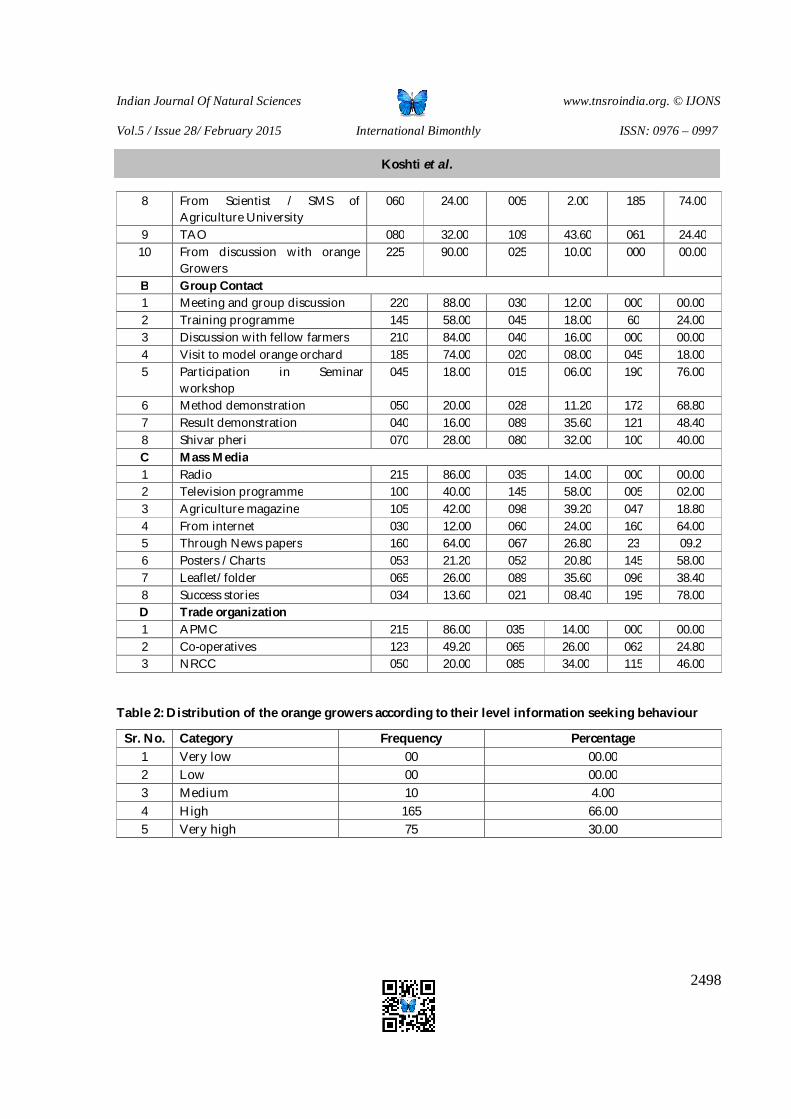
of them always used the telephone call whereas, 60.00 per cent of the orange growers contacted regularly with the agricultural extension officers. One third of the orange growers sort the information regularly by contacting taluka agriculture officers. Whereas, one fourth (24.00%) of the orange growers contacted with the university scientists and subject matter specialists of the agricultural university. Majority of the orange growers (74.00%) never contacted with the university and subject matter specialties followed by staff of horticultural department for the information production and marketing of the orange growers. By observing the personal contact method used by the orange growers for seeking information, the orange growers’ believed more on the progressive orchardists and neighbours of cultivating orange crops as their practical knowledge. Regarding group contact method, it was observed that 88 per cent of the orange participated in meeting and group discussion to sort the information about the orange cultivation. Discussion with the fellow farmers (84.00%) was another group contact to visit the model orange orchard (74.00%). Nearly one third of the orange growers (32.00%) always participated in shivar pheri. The above result showed that the orange growers relying more on the participating farmers and sharing their experience and discussion and visit to their orange orchards. Mass media is used by the farmers for seeking the information. Among the mass media radio was the important source of information expressed by 86.00 per cent of the orange growers. The orange cultivators were seemed to be progressive farmers and nearly two third of the orange growers 64.00 per cent used the newspapers for seeking information followed by agriculture magazine (42.00%). Internet, the advance mass media was never used by the orange growers. Trade organization were on also available in study area and it was observed that the 86.00 per cent of the orange growers were always contacted with the APMC followed by co operative (49.20%) for seeking the information regarding to quality orange fruits and its marketing. The Table 1 reveals that growers realize more on parenting farmers rather than the personal having theoretical information.
Among the group sources consulted, observing conducted that Meeting and group discussion (88.00%), Discussion with fellow farmers (84.00%) and Visit to model orange orchard (74.00%) were used sources by cent per cent of the orange growers whereas, majority (88.00%) always observed the meeting and group discussion. Among the eight groups contact over three fourth of the orange growers result demonstration (35.00%) and Shivar pheri (32.00%) reported that they sometime used the sources like, result demonstration and shivar pheri respectively for obtaining information. Further, 35.00 per cent of the orange growers each reported that they sometime go in agril extension office and participated in shivar pheri as expressed by 32.00% of the orange growers. Majority of the orange growers training programme (58.00%), Participation in seminar workshop (76.00%), Method demonstration (68.80%) and half of the orange growers result demonstration (48.40%) had no opportunity to participate seminar workshop. In respect of the mass media sources, a maximum percentage of the orange growers always obtained the information about production and marketing of orange crop through radio (86.00%) and through news papers (64.00%) by the orange growers. A considerable percentage of the orange growers sometimes utilized the mass media like agril. magazine (42.00%) and news papers (64.00%) for getting the information about production and marketing of orange crop. Majority of the respondents acquired information through result demonstration, method demonstration, group discussion, visit to model orchard seminar, workshop this result were in conformity with the findings of [2], noticed that most of the respondents always preferred the result demonstration, group discussion and farm and home visits for individual contact method.
The above findings supported the findings of [3] reported that friends and neighbour’s, contact with progressive and less progressive orchardist were frequently used sources by majority of extension personnel. The findings in case of T.V., Radio and newspaper go to collaborate with the observations of [4] that the most of the respondents depend on T.V., radio and newspapers.The data presented in Table 2 pertaining to information seeking behaviour reveal that maximum percentage of the orange growers (66.00%) expressed their high level of information seeking behaviour. As much as 30.00 per cent and 4.00 per cent of the orange growers belonged to the very high and medium category of information seeking behaviour, respectively, as opinioned by the orange growers. Further, from this Table it may be seen that none of the respondents reported the low and very low level of information seeking behaviour. Probable reason behind reporting of high level of information seeking behaviour is that during season, discussion with orange growers, meeting and group discussion, radio, visit to model orange orchards, discussion with fellow farmers and also friends and neighbours always contact with progressive orchardist was very high. Information seeking activities
Koshti et al.
Indian Journal Of Natural Sciences www.tnsroindia.org. © IJONS
Vol.5 / Issue 28/ February 2015 International Bimonthly ISSN: 0976 – 0997
2495
like group discussion, result and method demonstration. Due to the orange as high value fruit crop orange growers wanted to seek the information from the farmers having practical knowledge. It was also observed that the orange growers were always in contact with other orange growers, progressive farmers, shetkari magazine and other agencies for getting the recent information about orange crops. In general, majority of the orange growers had high information seeking behaviour. Thus null hypothesis formulated in this case was rejected.
Information evaluation behavior
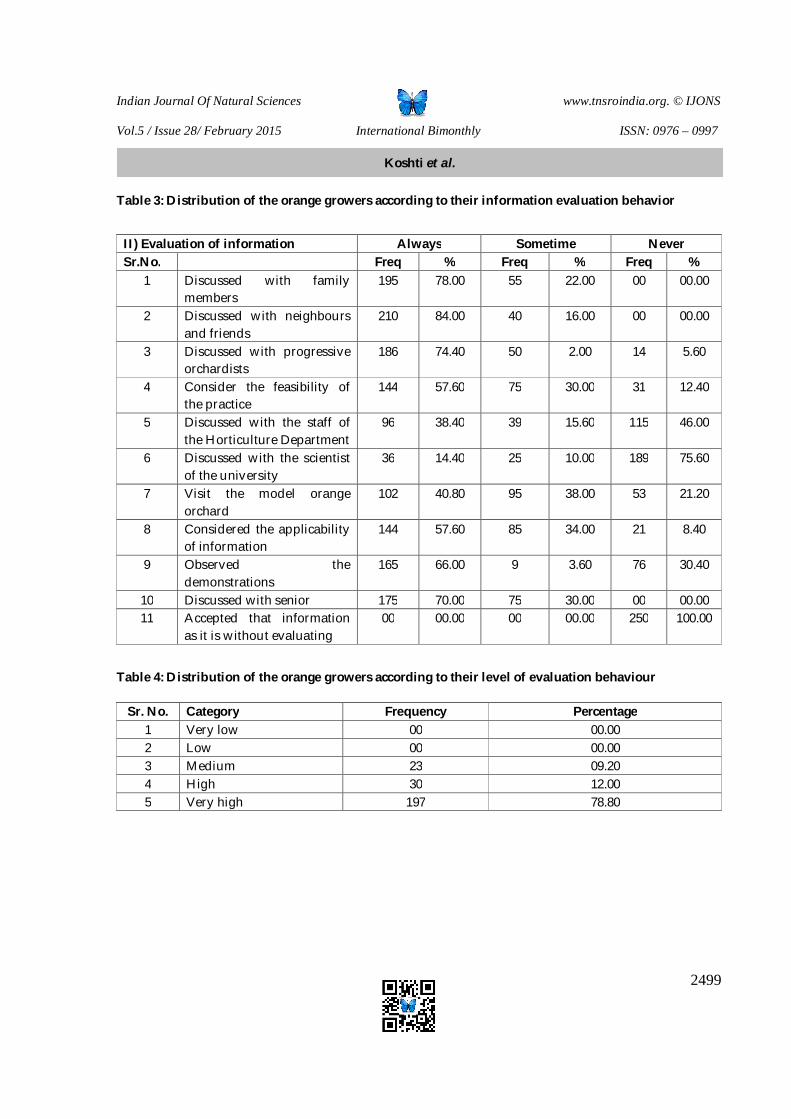
After the farm information sought by the individual, one may evaluate/ judge its worthiness in light of one’s past experience as well as its applicability in the context of one’s existing resources/situations. The orange growers processed on evaluating the farm information by resorting to 12 different acts by them as furnished in Table 3. It was very interesting to note from Table 3 that none of the orange growers accepted the information as such, whereas, they were found to perform different acts with varying degree. It is revealed that a cent per cent of the orange growers were always evaluating the information about production and marketing of orange crop on the basis of discussed with neighbours and friends (84.00%). This was followed by maximum percentage of the orange growers always apply the acts for evaluation such as discussion with the family member (78.00%), discussed with the progressive orchardists (74.40%) and discussion with the senior (70.00%) observed the demonstration (66.00%). A sizable percentage of the orange growers always utilized the acts like; consider the feasibility of the practice (57.00%) considered the applicability of information (57.60%) and discussed with university scientists and specialists (14.40%). A sizable percentage of the orange growers, discussed with the staff of the horticulture department (38.40%), and visit the model orange orchards growers (40.80%) of the orange growers. It was observed that none of the orange process accepted information as it is without evaluating.
The equal percentage of the orange growers (30.00%) were reported that they sometime used the acts namely, consider the feasibility of the practice and discussed with senior on the basis of feedback of the orange growers. Conclusively, it may evident that none of the orange growers ever discussed with the scientist of the university (75.60%). Nearly, one third of the orange growers observed the demonstrations (30.40%). Information evaluation is one of the key dimensions of information behaviour. After receiving any information, it is necessary that to analysis, synthesis and deciding its situation specific validity is important for acceptance or rejection of received information. This had might influence on trustworthiness and creditability of information while disseminating improved farm technology. From the above discussion, the orange growers adopted the information through discussion with family members, neighbours friends and progressive orchardists, who had knowledge about orange cultivation and its marketing. The farmers evaluate the information more than three to four channels for its practical applicability. Information evaluation is one of the key dimensions of information behaviour. After receiving any information, it is necessary that to analysis, synthesis and deciding its situation specific validity is important for acceptance or rejection of received information. This had might influence on trustworthiness and creditability of communicator while disseminating improved farm technology. The distribution of respondents according to their level of information evaluation has been presented in Table 4.
It is obvious from the data depicted in Table 4 that the more two-third of the orange growers 78.80 per cent had very high level of information evaluation behaviour and remaining 12.00 per cent and 9.20 per cent of the orange growers evaluating the received information up to medium and high level respectively. It is surprising to note that none of the orange growers were belonged to the very low and low level of information evaluation behaviour. Thus, the orange growers not merely sough the information as such, however, the obtained information discussed thoroughly with the family members, neighbours, preferring farmers and those who practically involved in adoption technology in orange crop.
Koshti et al.
Indian Journal Of Natural Sciences www.tnsroindia.org. © IJONS
Vol.5 / Issue 28/ February 2015 International Bimonthly ISSN: 0976 – 0997
2496
Information preservation behavior
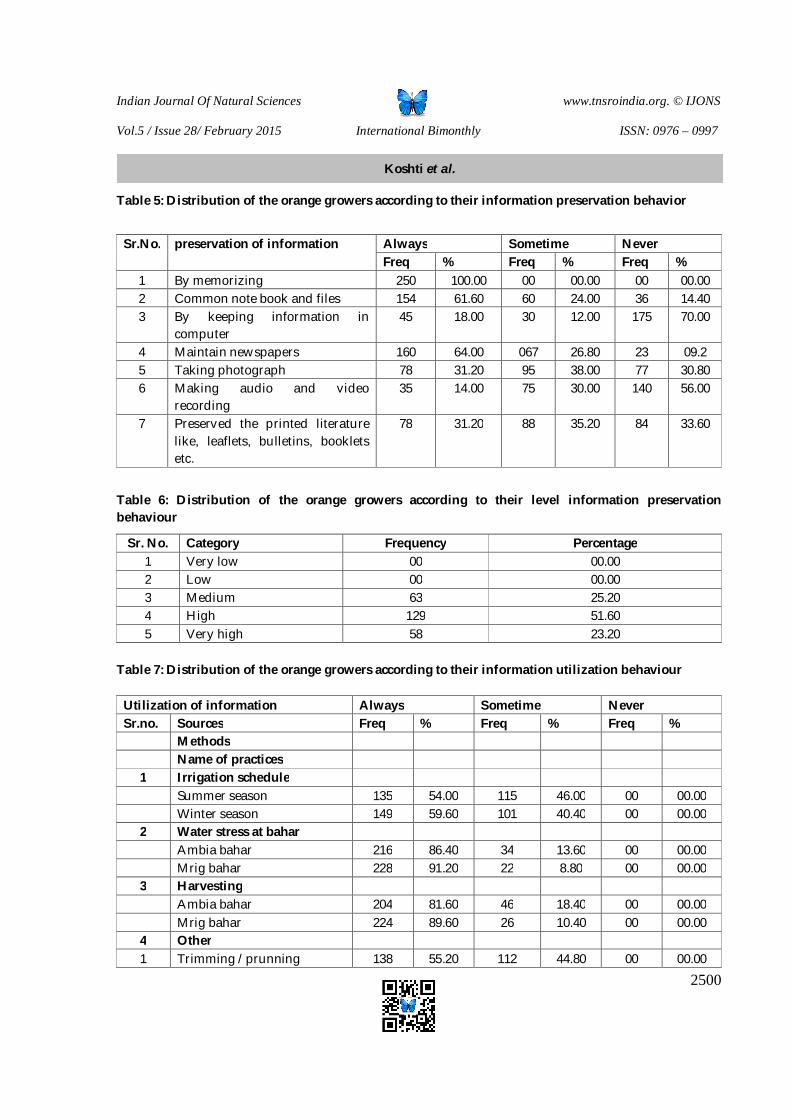
After the information is sought and evaluated, one is likely to preserve it for future use or reference. An attempt has been made to find out the various methods of information preservation / storage which are in vogue among the orange growers in the study area. Data collected in this behalf have been presented in table 5.
It is revealed from Table 5 that cent per cent of the orange growers always keeping the information in their memory. Majority of the orange growers (64.00%) reported that they always maintain newspapers cutting for storage information. Always maintain a common note book expressed by 61.60 per cent of the orange growers for storage of information about production and marketing of orange crop. However, a sizeable per cent of the orange growers sometime used the storage methods were keeping photograph (38.00%) and preserved the printed literature like, leaflets, bulletins; booklets (35.20%) were another some timely used methods for storage of information. The majority of the orange growers (70.00%) expressed that they never kept the information in computer and making audio and video recording (56.00%) of the orange growers. The reason behind that unavailability of such computer based system and no knowledge about its use. It is evident from data that 51.60 per cent of the orange growers reported their high information preservation behaviour, followed by medium and very high level of information evaluation behaviour by 25.20 per cent and 23.20 per cent of the orange growers, respectively. The important fact is that, no any orange growers’ falls into very low and low level of information preservation category.
Earlier formulated null hypothesis for the purpose of this study was also disproved in case of information preservation behaviour.
Information utilization behaviour
In the context of the present study, the information utilization behaviour, as stated earlier, operationalized as the activity performed by the orange growers for actual putting the information into use, resulting thereby in adoption of the scientific information with regards to the improved cultivation practices of orange crop, as depicted in Table 7. A critical look at the Table reveals an overwhelming majority of the orange growers utilized the information always resulting in adoption of improved cultivation practices, as recommended, pertaining to water stress in Mrig (91.20%) and Ambia bahar (86.40%) and its harvesting by 81.60 per cent and 89.60 per cent of them, respectively. Further, it could be seen that sizable proportion of the orange growers followed the improved practices, as recommended, such as supporting the fruit bearing tress 84.00 per cent, applying the Bordeaux paste to the trunk of trees to prevent the gummosis disease (68.80%) and irrigation schedule during winter and summer seasons (54.00%) and (59.60%) respectively, training and pruning the trees 55.20 per cent each.
As regards to the adoption of the improved cultivation practices by the orange growers sometimes, it was observed that overwhelming majority of them did not adhere to the recommendation and adopted the practices for production and marketing of orange, namely the dose of organic manure and its time of application 88.80 per cent and 74.80 per cent respectively, and the dose of fertilizers 70.40 per cent. It was observed that although, the respondents might have sought the information but due to some or other reasons, they could not follow the recommendation. The possible reasons might be the non-availability of organic manure and exorbitant prices of fertilizers due to withdrawal of subsidy by Government. Further with regards to the never adoption of recommended measure towards the control of fruit drop, it was disheartening to note that a overwhelming majority of the orange growers did not use the growth regulator for controlling the fruit drop 76.80 per cent in oranges. Probably the orange growers might lack the information in this behalf or might not have developed the insight to assess the losses caused due to fruit drop secondly, the practices of controlling fruit drops with the help of recommended measure seems to be rather difficult for the orange growers to understand and use, and therefore, might be limiting factor in this use by them.
A closer look at Table 8 shows that over half of the orange growers (52.40%) expressed their medium information utilization behaviour followed by 30.00 per cent and 17.60 per cent of the orange growers belonged to medium and high level of information utilization behaviour. Further, it is interesting to note that none of the orange growers were
Koshti et al.
Indian Journal Of Natural Sciences www.tnsroindia.org. © IJONS
Vol.5 / Issue 28/ February 2015 International Bimonthly ISSN: 0976 – 0997
2497
reported that low and very low level of information utilization behaviour. Maximum percentage of the orange growers (52.40%) reported their high level of information utilization behaviour
Overall Information behaviour
The information behaviour is the main dependents variables of this investigation. The information behaviour of the orange growers is an indicative of flow of information about production and marketing of orange. An attempt was made to study the information behaviour of the orange growers as a composite measure of information seeking, information evaluation, information preservation and information utilization behaviour. The data regarding distribution of orange growers to their information behaviour have been furnished in Table 9.
It is evident from Table 9 that higher percentage of the orange growers had high (71.60%) and near one-fifth (21.20%) had very high level of information behaviour. Meager orange growers (7.20%) were observed in medium level of their information behaviour. Further data in the Table clearly shows that none of the orange growers exhibited low and very low of their communication behaviour. Thus, maximum percentage of the orange growers 71.60 per cent belonged to the high level of category of information behaviour.
CONCLUSION From the foregoing results obtained from the analysis of data in respect of information seeking, information evaluation, information preservation and information utilization behaviour as a whole, it could be inferred that the most of the orange growers, by and large, had high level of information seeking, information evaluation, information preservation and information utilization behaviour. Thereby, it gives a clear indication that there is a wide scope for exploiting the information behaviour of the orange growers to speed up and enhance the rate of use of recommended production and marketing technology of orange.
REFERENCES
1. Anonymous, (2009): www.agri.maha.nic.in. 2. Deepu Oommen 2001: Use of extension teaching methods by Hort. Dept officers for dissemination of
information to farmers in Punjab Abstract of thesis PAU Ludhiyana pp 16. 3. Rani J.B., G.V. Narayan Reddy and M. Sudarshan Reddy 2001: Research J ANGRAU Vol. XXIX No. 4 pp 68. 4. Tripathi ,S. R. K. Singh, T.N. Sharma 2000: Review of agril communication research studies published in
Maharashtra J. Extension Education Vol. XIX: pp 272.
Table 1: Distribution of the orange growers according to their information seeking behaviour
Sr.No. Sources for information seeking Always Sometime Never Freq % Freq % Freq %
A Personal Contact 1 Personal contact with Agri.
Extension Officer 150 60.00 080 32.00 020 8.00
2 Personal Letter 000 00.00 000 00.00 000 00.00 3 Telephone Call 185 74.00 050 20.00 015 6.00 4 Contact with Agro service
Centers 150 60.00 075 30.00 025 10.00
5 Friends and Neighbours 245 98.00 005 2.00 000 00.00 6 Contact with progressive
orchardist 240 96.00 010 4.00 000 00.00
7 Staff of Horticultural
Department 045 18.00 090 36.00 115 46.00
Koshti et al.
Indian Journal Of Natural Sciences www.tnsroindia.org. © IJONS
Vol.5 / Issue 28/ February 2015 International Bimonthly ISSN: 0976 – 0997
2498
8 From Scientist / SMS of Agriculture University
060 24.00 005 2.00 185 74.00
9 TAO 080 32.00 109 43.60 061 24.40 10 From discussion with orange
Growers 225 90.00 025 10.00 000 00.00
B Group Contact 1 Meeting and group discussion 220 88.00 030 12.00 000 00.00 2 Training programme 145 58.00 045 18.00 60 24.00 3 Discussion with fellow farmers 210 84.00 040 16.00 000 00.00 4 Visit to model orange orchard 185 74.00 020 08.00 045 18.00 5 Participation in Seminar
workshop 045 18.00 015 06.00 190 76.00
6 Method demonstration 050 20.00 028 11.20 172 68.80 7 Result demonstration 040 16.00 089 35.60 121 48.40 8 Shivar pheri 070 28.00 080 32.00 100 40.00 C Mass Media 1 Radio 215 86.00 035 14.00 000 00.00 2 Television programme 100 40.00 145 58.00 005 02.00 3 Agriculture magazine 105 42.00 098 39.20 047 18.80 4 From internet 030 12.00 060 24.00 160 64.00 5 Through News papers 160 64.00 067 26.80 23 09.2 6 Posters / Charts 053 21.20 052 20.80 145 58.00 7 Leaflet/ folder 065 26.00 089 35.60 096 38.40 8 Success stories 034 13.60 021 08.40 195 78.00 D Trade organization 1 APMC 215 86.00 035 14.00 000 00.00 2 Co-operatives 123 49.20 065 26.00 062 24.80 3 NRCC 050 20.00 085 34.00 115 46.00
Table 2: Distribution of the orange growers according to their level information seeking behaviour
Sr. No. Category Frequency Percentage 1 Very low 00 00.00 2 Low 00 00.00 3 Medium 10 4.00 4 High 165 66.00 5 Very high 75 30.00
Koshti et al.
Indian Journal Of Natural Sciences www.tnsroindia.org. © IJONS
Vol.5 / Issue 28/ February 2015 International Bimonthly ISSN: 0976 – 0997
2499
Table 3: Distribution of the orange growers according to their information evaluation behavior
II) Evaluation of information Always Sometime Never Sr.No. Freq % Freq % Freq %
1 Discussed with family members
195 78.00 55 22.00 00 00.00
2 Discussed with neighbours and friends
210 84.00 40 16.00 00 00.00
3 Discussed with progressive orchardists
186 74.40 50 2.00 14 5.60
4 Consider the feasibility of the practice
144 57.60 75 30.00 31 12.40
5 Discussed with the staff of the Horticulture Department
96 38.40 39 15.60 115 46.00
6 Discussed with the scientist of the university
36 14.40 25 10.00 189 75.60
7 Visit the model orange orchard
102 40.80 95 38.00 53 21.20
8 Considered the applicability of information
144 57.60 85 34.00 21 8.40
9 Observed the demonstrations
165 66.00 9 3.60 76 30.40
10 Discussed with senior 175 70.00 75 30.00 00 00.00 11 Accepted that information
as it is without evaluating 00 00.00 00 00.00 250 100.00
Table 4: Distribution of the orange growers according to their level of evaluation behaviour
Sr. No. Category Frequency Percentage 1 Very low 00 00.00 2 Low 00 00.00 3 Medium 23 09.20 4 High 30 12.00 5 Very high 197 78.80
Koshti et al.
Indian Journal Of Natural Sciences www.tnsroindia.org. © IJONS
Vol.5 / Issue 28/ February 2015 International Bimonthly ISSN: 0976 – 0997
2500
Table 5: Distribution of the orange growers according to their information preservation behavior
Sr.No. preservation of information Always Sometime Never
Freq % Freq % Freq % 1 By memorizing 250 100.00 00 00.00 00 00.00 2 Common note book and files 154 61.60 60 24.00 36 14.40 3 By keeping information in
computer 45 18.00 30 12.00 175 70.00
4 Maintain newspapers 160 64.00 067 26.80 23 09.2 5 Taking photograph 78 31.20 95 38.00 77 30.80 6 Making audio and video
recording 35 14.00 75 30.00 140 56.00
7 Preserved the printed literature like, leaflets, bulletins, booklets etc.
78 31.20 88 35.20 84 33.60
Table 6: Distribution of the orange growers according to their level information preservation behaviour
Sr. No. Category Frequency Percentage 1 Very low 00 00.00 2 Low 00 00.00 3 Medium 63 25.20 4 High 129 51.60 5 Very high 58 23.20
Table 7: Distribution of the orange growers according to their information utilization behaviour
Utilization of information Always Sometime Never Sr.no. Sources Freq % Freq % Freq %
Methods Name of practices
1 Irrigation schedule Summer season 135 54.00 115 46.00 00 00.00 Winter season 149 59.60 101 40.40 00 00.00
2 Water stress at bahar Ambia bahar 216 86.40 34 13.60 00 00.00 Mrig bahar 228 91.20 22 8.80 00 00.00
3 Harvesting Ambia bahar 204 81.60 46 18.40 00 00.00 Mrig bahar 224 89.60 26 10.40 00 00.00
4 Other 1 Trimming / prunning 138 55.20 112 44.80 00 00.00
Koshti et al.
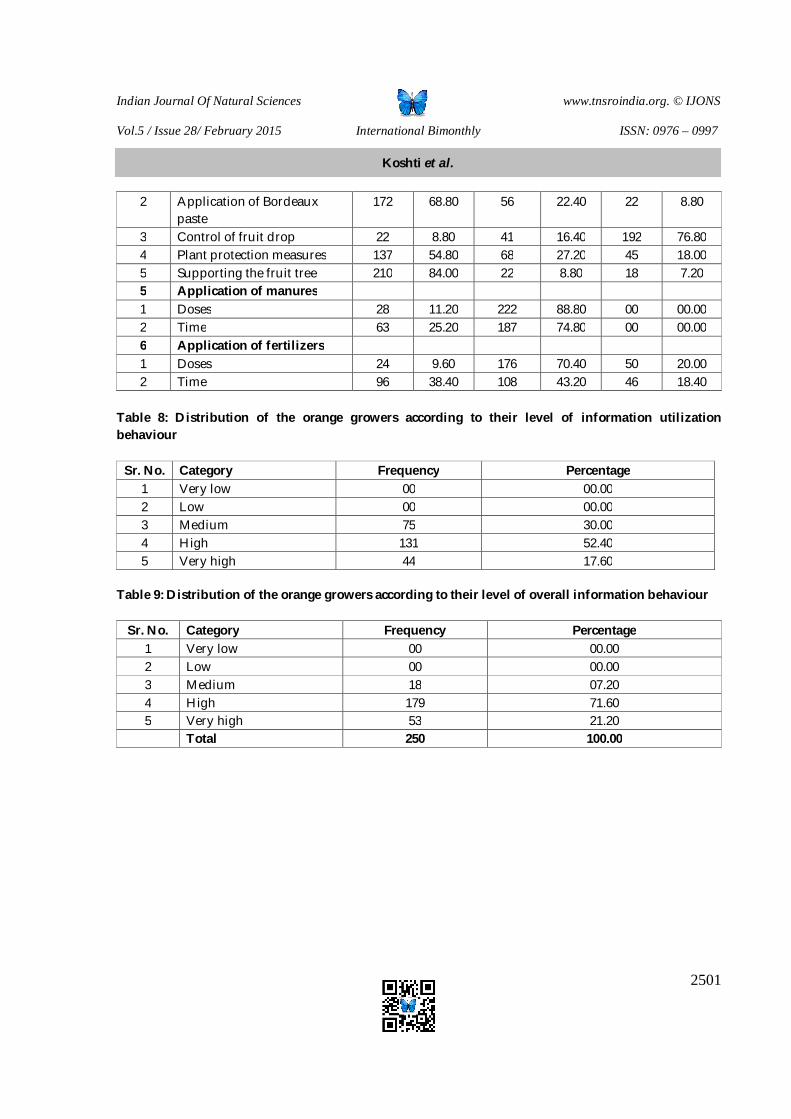
Indian Journal Of Natural Sciences www.tnsroindia.org. © IJONS
Vol.5 / Issue 28/ February 2015 International Bimonthly ISSN: 0976 – 0997
2501
2 Application of Bordeaux paste
172 68.80 56 22.40 22 8.80
3 Control of fruit drop 22 8.80 41 16.40 192 76.80 4 Plant protection measures 137 54.80 68 27.20 45 18.00 5 Supporting the fruit tree 210 84.00 22 8.80 18 7.20 5 Application of manures 1 Doses 28 11.20 222 88.80 00 00.00 2 Time 63 25.20 187 74.80 00 00.00 6 Application of fertilizers 1 Doses 24 9.60 176 70.40 50 20.00 2 Time 96 38.40 108 43.20 46 18.40
Table 8: Distribution of the orange growers according to their level of information utilization behaviour
Sr. No. Category Frequency Percentage 1 Very low 00 00.00 2 Low 00 00.00 3 Medium 75 30.00 4 High 131 52.40 5 Very high 44 17.60
Table 9: Distribution of the orange growers according to their level of overall information behaviour
Sr. No. Category Frequency Percentage 1 Very low 00 00.00 2 Low 00 00.00 3 Medium 18 07.20 4 High 179 71.60 5 Very high 53 21.20 Total 250 100.00
Koshti et al.
Indian Journal Of Natural Sciences www.tnsroindia.org. © IJONS
Vol.5 / Issue 28/ February 2015 International Bimonthly ISSN: 0976 – 0997
2502
A Study on Goat Farming in Kerala
Sakkariya Ibrahim NP1, Manju Sasidharan1, Biya Ann Joseph2 , Biju.S3*, Balusamy C2 and Joseph Mathew2
1Department of Livestock Production and Management, College of Veterinary and Animal sciences, Pookode, Wayanad, Kerala,India. 2Department of Livestock Production and Management, College of Veterinary and Animal Sciences, Mannuthy, Kerala,India. 3Veterinary Dispensary Aryad, Alappuzha, Kerala,India. Received: 12 Oct 2014 Revised: 26 Nov 2014 Accepted: 29 Dec 2014
*Address for correspondence Dr.Biju.S Veterinary Surgeon, Veterinary Dispensary Aryad, Alappuzha, Kerala,India E.mail: [email protected]
This is an Open Access Journal / article distributed under the terms of the Creative Commons Attribution License (CC BY-NC-ND 3.0) which permits unrestricted use, distribution, and reproduction in any medium, provided the
original work is properly cited.All rights reserved. Various parameters were combined to obtain a view about the socio economic status of goat farmers. It was revealed that the highest per cent (83.27%) of those who took up goat farming were those who were least qualified educationally. Christians (35.70%) tend to rear goats more than Muslims followed by Hindus. Financial status revealed that people who are below poverty line were slightly more interested in rearing goats than those above it. It was observed that most of the goat farmers had 10 cent land holding. Only 30.24 % considered animal husbandry as their main occupation. The mode of farm operation revealed that 97.11% of the farmers consider it as singly owned enterprise. The study also revealed that about 30% of the participants had more than ten years of experience in goat farming. Only 0.6% farmers reported that they employed people from other state for helping them in the farming practices. The motivation to venture into goat farming was low capital investment and more profit as pointed out by 20% farmers. The present study revealed that only 18% farmers received any formal training on goat farming. The local veterinarian is the most important resource person regarding the information on various aspects of the animal husbandry activities. It would be much in interest of the farmers to strengthen the extension activity of the Animal husbandry department. Constrains of the enterprise include the unavailability of the feed and the difficulty in the marketing of the goats as their main problem. So the farmers are generally reluctant to increase their flock size more than 20 and the preferred breed is malabari goat. Goat rearing was considered a profitable business by 72% farmers who reported that they never faced a loss in the enterprise.
Keywords: goat farmers, veterinarian, malabari goat, socio economic status.
ABSTRACT
RESEARCH ARTICLE
Indian Journal Of Natural Sciences www.tnsroindia.org. © IJONS
Vol.5 / Issue 28/ February 2015 International Bimonthly ISSN: 0976 – 0997
2503
INTRODUCTION Goat is the most widely reared animal in our country, after buffalo. It is an important livestock species that has immense potential to improve the socio-economic status of the rural poor and to contribute substantially to the country's Gross Domestic Product as well. Goats are popularly known as a poor man’s cow and are reared mainly for meat and milk production. The present study is an attempt to document the various aspectsof goat rearing practices in Kerala.
MATERIALS AND METHODS The survey was conducted through a stratified random sampling method. Sixout of fourteen districts of kerala were selected based on their geographical location. One hundred goat farmers were selected randomly from each district. The data was collected from these 600 farmers by the means of telephone interview. A structured questionnaire was utilized for this purpose.
RESULTS AND DISCUSSION Various parameters were combined to obtain a view about the socio economic status of goat farmers (Table.1). It was revealed that the highest per cent (83.27%) of those who took up goat farming were those who were least qualified educationally. Alex et al 2013 reported that majority (96%) of the goat farmers of northern Kerala have only school level education and only 1% have college level education. The trend observed is that, as the educational qualification increases people tend to keep away from the animal husbandry activities.They could have turned to this field as the job opportunities for those with class 10 or below are minimal. Christians (35.70%) tend to rear goats more than Muslims followed by Hindus. The farming tradition is prominent in the Christian communityand this may be the reason for them to engage in goat rearing.Financial status revealed that people who are below poverty line were slightly more interested in rearing goats than those above it. While only 12 % of the people of Kerala are below the official poverty line there is a disproportionate proportion of contribution by the BPL family (51.96%) towards the pool of goat farmers as it would help to provide an additional source of income to them.
It was observed that most of the goatfarmershad 10 cent land holding. About 28% of the goat farmers have land size less than 10 cents which is similar to the findings ofRaghavan and Raja(2012)who observed that 52% of the goat farmers possessed less than 10 cents of land. Present study showed thatonly 20 % of the goat farmers have land holding of one acre (100 cent) or more and 33.21% of the goat farmers owned land between 25 cents to one acre. These results when compared with the fact that the average land holding in Kerala is 0.27 hectares (108 cent) we can conclude that adisproportionately large proportion of farmers with below average land holding are present among goat farmers. Only 30.24 % considered animal husbandry as their main occupation which shows that in Kerala people considering animal husbandry as their main occupation is a small proportioneven among those who are engaged in animal husbandry activities.
The mode of farm operation revealed that 97.11% of the farmers consider it as singly owned enterprise. New experiments are being tried in the state with joint ownership of goat farm under the self-help group initiative.But the data indicate that still such mode of operation has not attained a considerable proportion.The study also revealed that about 30% of the participants had more than ten years of experience in goat farming. Majority of the farmers are having more than average duration of experience in the field of goat rearing. Sothere is a positive correlation between total duration of experience in the goat farming and proportion of farmers in the pool of total goat farmers. This may be due to the fact that as the experience increases the farmers become more competent in that field. It can be inferred that people new to this field should be given necessary support so that they can be retained in that enterprise for a sufficient duration after which chancesof flourishing in goat husbandry is more.Only 0.6% farmers reported that they
Biju et al. et al.
Indian Journal Of Natural Sciences www.tnsroindia.org. © IJONS
Vol.5 / Issue 28/ February 2015 International Bimonthly ISSN: 0976 – 0997
2504
employed people from other state for helping them in the farming practices. This shows that unlike in some other sector of agriculture,goat farming has not developed enough to employ the regular wage laborer.
When asked about the motivation to venture into goat farming, 20% farmers pointed the low capital investment and more profit when compared to other animal husbandry enterprises as the reason. 12 % farmers exclusively chose the low capital investment as the reason while 19% farmers reasoned that their likingfor the animalas the motivation for them to choose goat farming. 16% cited the ease of management and 8 % farmers revealed that their motivation was the fact that goat farming is more profitable than other animal husbandry activities.
An early study by Kavithaet al. reported that among the goat farmers of Thrissurdistrict 75 % had medium level of awareness on scientific goat farming while 16 % farmers fall under high knowledge category and only 8.6% came under low knowledge category. The present study revealed that only 18% farmers received any formal training on goat farming. This observation is not in accordance with the study ofRaghavan and Raja(2012) who observed that 69% of the farmers had the opportunity to attend some sort of training on scientific goat rearing. Among those farmers who attended the training 74% reported that the training they undergone were helpful in their enterprise.
Farmers (17%) reported that they consulted other farmers and books/magazines for clearing their doubts regarding the goat farming while 33% farmers reported that they depended exclusively on other farmers and 46% farmers reported that they got the information regarding the goat rearing from local veterinarian. Only 0.5% farmers depended exclusively on the publications for gathering information regarding the goat farming. This shows that the local veterinarian is the most important resource person regarding the information on various aspects of the animal husbandry activities. It would be much in interest of the farmers to strengthen the extension activity of the Animal husbandry department.The major constraint of the enterprise as cited by 40% of the farmers is the unavailability of the feed while 13% farmers cited the difficulty in the marketing of the goats and another 10% had diseases of goats as their main problem. Only 3% of the farmers perceived the unavailability of veterinary care as their main problem.
About 20% of the farmers have a flock size of 5-10 goats, followed by the flock size less than 5 goats (7.1%) and then 10-20 goats. Only 2% of the farmers have a flock size of more than 20 goats. The distribution of the flock size reveals that still the goat rearing is carried out in a small scale. The low prevalence of flock size less than five may be due to the fact that less than five goats will not offer a breakeven point of operation. Alexet al. (2013) has observed that as the flock size increase, the technical inefficiency and inturn the economic return in case of goat farming in Kerala. It may be also due to the fact that a person can manage a flock size of 5 without creating a situation of idle labor. Flock size of above 20 goats may require more investment in infrastructure. So the farmers are generally reluctant to increase their flock size more than 20. Marketing may also become difficult when more animals have to be sold. This situation demand more intervention from the experts so that farmer can be motivated and persuaded to grow into the business and increase the scale of operation. The factors which are dissuading the farmers to scale up the business should be identified and solutions to be offered.
The study showed that majority of the farmers preferred to rear local malabari goat. This observation validates the study by Alex and Raghavan (2012).This may be due to 3 reasons. First of all the malabari goat is more prolific than the other large north Indian breeds. The malabari goat is also very well adapted for the hot and humid climate of Kerala. When it comes to marketing of goat for meat purpose, the average sized malabari goat fetch more price than other large sized breeds.
Majority of the farmers (87%) prefer to fatten their kids and sell. It indicates that there is scope for more farmers to engage exclusively in the production of quality kids and specialize in that enterprise.Only 4% of the farmers market the goat milk. But only 63% of the farmers are feeding the entire goat milk to the kids. So rest 33% farmers are utilizing some portion of the goat milk in some other purpose like consumption by family members. Only 9% of the farmers market the manure of the goat while the rest 91% is not bothered about the marketing potential of the goat manure.Thirty one percent farmers reported that they are mainly selling the animal to the butchers while 27% farmers sell to the middle man. Only 20% farmers have sold their animal to other farmers. Buyers come to the farmer and buy the animals in the majority (81%)of the sale. Only 3% farmers reported as taking the animal to local market
Biju et al. et al.
Indian Journal Of Natural Sciences www.tnsroindia.org. © IJONS
Vol.5 / Issue 28/ February 2015 International Bimonthly ISSN: 0976 – 0997
2505
for the sale. 16% of the farmers reported as resorting to both methods. 95% of the farmers reported that they sell their goat in small numbers rather than as a bulk lot. 5% farmers reported that they sell in a bulk lot.Fourty five percent of the farmers felt like that their sale of the goat is seasonal. But 55% reported that there is no seasonality in the sale of goat. Among those farmers who said that the sale of goat is seasonal, 54% reported Bakhrid (a Muslim festival) as the main season of goat sale followed by Onam (10%) and Christmas (2%).Only 28% farmers reported thatsomewhere in course of their enterprise they suffered a loss in the goat rearing and 72% reported that they never faced a loss in the enterprise. Those farmers who reported the loss see two main reasons for their loss. The loss occurred due to the mortality of goat (40%) and when the farmers didn’t have the remunerative price for their goat when sold (40%). Only 8% farmers cited poor growth rate of goats as the reason for the loss.
Regarding the price of the goat, 60% of the farmers felt that the price quoted by the buyer was always non-remunerative while rest 40% didn’t felt like that. But only 38% farmers reported that they were often forced to sell the goats at such non-remunerative price.Regarding the raising of capital investment required for establishing their goat farm, 70% of the farmers had to find it from their own fund. 20% farmers managed to raise it through bank loan and 4% made it through some government scheme to encourage goat farming.68% of the farmers reported that the capital invested in the current enterprise have recovered, while 32% reported that still they have not recovered their investment cost. Among those farmers who reported that their cost of investment has recovered, 55% of the farmers took more than 1year for the capital recovery rest 45% took only less than 1 year for the capital recovery.
When it comes to the purchase of goats by the farmer, majority (66%) of them have procured it from other farmers. 20% of the farmers purchased it from the middle man.Majority of the farmers (69%) reported that they have not insured their goat. only 31% farmers has insured their goats. Even though many of the schemes implemented by the Animal husbandry Department of keralahas made it mandatory to insure the animals the insurance coverage of the goat remains poor. Only a small percentage of farmers (3%) reported that their claim was not settled promptly. By encouraging the farmers to insure their goats by promptly clearing the claim and rationalizing the rate of the premium can advantageous for both farmers and the insurance companies. Only 10% farmers were aware of any government schemes to encourage the goat rearing such schemes. Only 4% farmers reported that they got any help from such schemes intended to encourage the goat rearing.
Diarrhea /gastrointestinal disorders was considered the major disease by 34 % farmers,15% farmers identified the respiratory tract diseases as the major one, 12% farmers identified it as mastitis rest 17% farmers responded in non specific terms.Sixty four percent farmers did not have the practice of vaccinating their goat against any of the disease but 93% farmers have the practice of deworming their goats. But among those farmers who deworm their animals only 37% responded as that they do it regularly while rest of the farmers did it without any regularity. When asked whether they test the dung of goat for parasitic infestation 93 % responded that they never done it. Six percent responded that they occasionally do that and 1% responded that they do it regularly.
CONCLUSION Various parameters studied enable us to conclude that goat rearing is a profitable business which helps to increase the socio economic status of goat farmers. Financial status revealed that people who are below poverty line were slightly more interested in rearing goats than those above it. The motivation to venture into goat farming was low capital investment and more profit. Those who took up goat farming were least qualified educationally and had 10 cent land holding. Most of the participants were Christians and had more than ten years of experience in goat farming. The local veterinarian is the most important resource person regarding the information on various aspects of the animal husbandry activities. It would be much in interest of the farmers to strengthen the extension activity of the Animal husbandry department. Constrains of the enterprise include the unavailability of the feed and the difficulty in the marketing of the goats as their main problem. So the farmers are generally reluctant to increase their flock size more than 20 and the preferred breed is malabari goat.
Biju et al. et al.
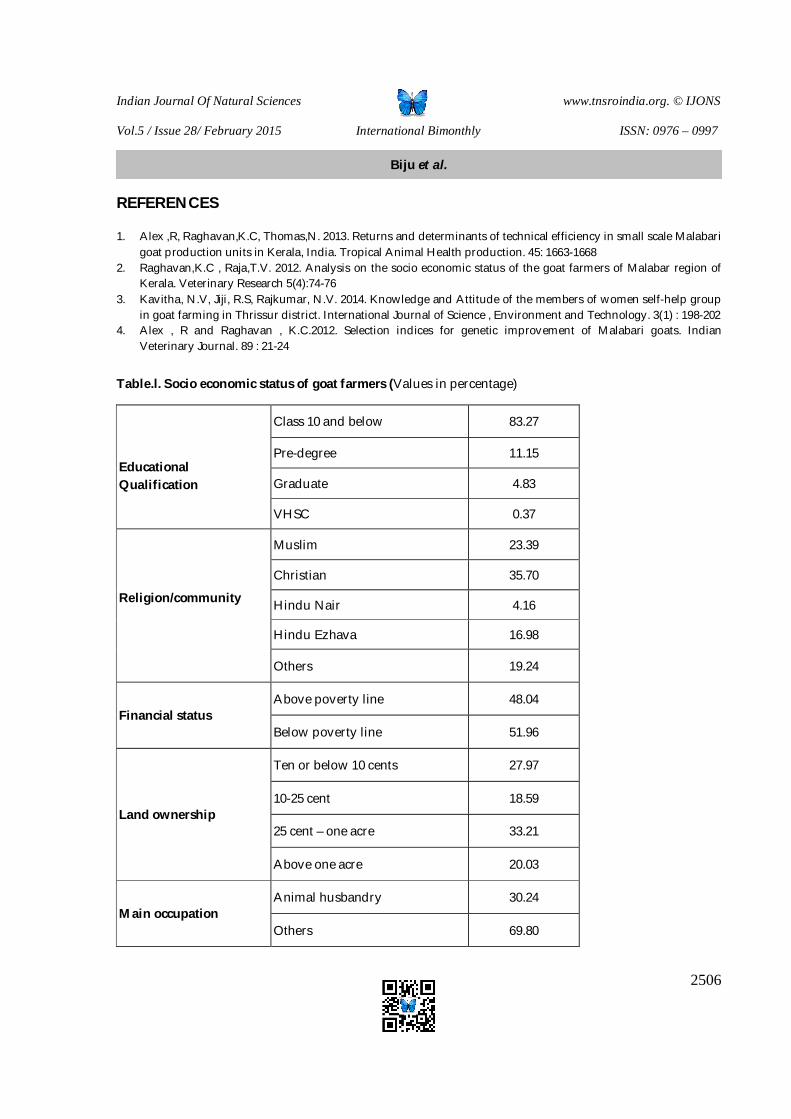
Indian Journal Of Natural Sciences www.tnsroindia.org. © IJONS
Vol.5 / Issue 28/ February 2015 International Bimonthly ISSN: 0976 – 0997
2506
REFERENCES 1. Alex ,R, Raghavan,K.C, Thomas,N. 2013. Returns and determinants of technical efficiency in small scale Malabari
goat production units in Kerala, India. Tropical Animal Health production. 45: 1663-1668 2. Raghavan,K.C , Raja,T.V. 2012. Analysis on the socio economic status of the goat farmers of Malabar region of
Kerala. Veterinary Research 5(4):74-76 3. Kavitha, N.V, Jiji, R.S, Rajkumar, N.V. 2014. Knowledge and Attitude of the members of women self-help group
in goat farming in Thrissur district. International Journal of Science , Environment and Technology. 3(1) : 198-202 4. Alex , R and Raghavan , K.C.2012. Selection indices for genetic improvement of Malabari goats. Indian
Veterinary Journal. 89 : 21-24
Table.l. Socio economic status of goat farmers (Values in percentage)
Educational Qualification
Class 10 and below 83.27
Pre-degree 11.15
Graduate 4.83
VHSC 0.37
Religion/community
Muslim 23.39
Christian 35.70
Hindu Nair 4.16
Hindu Ezhava 16.98
Others 19.24
Financial status Above poverty line 48.04
Below poverty line 51.96
Land ownership
Ten or below 10 cents 27.97
10-25 cent 18.59
25 cent – one acre 33.21
Above one acre 20.03
Main occupation Animal husbandry 30.24
Others 69.80
Biju et al. et al.
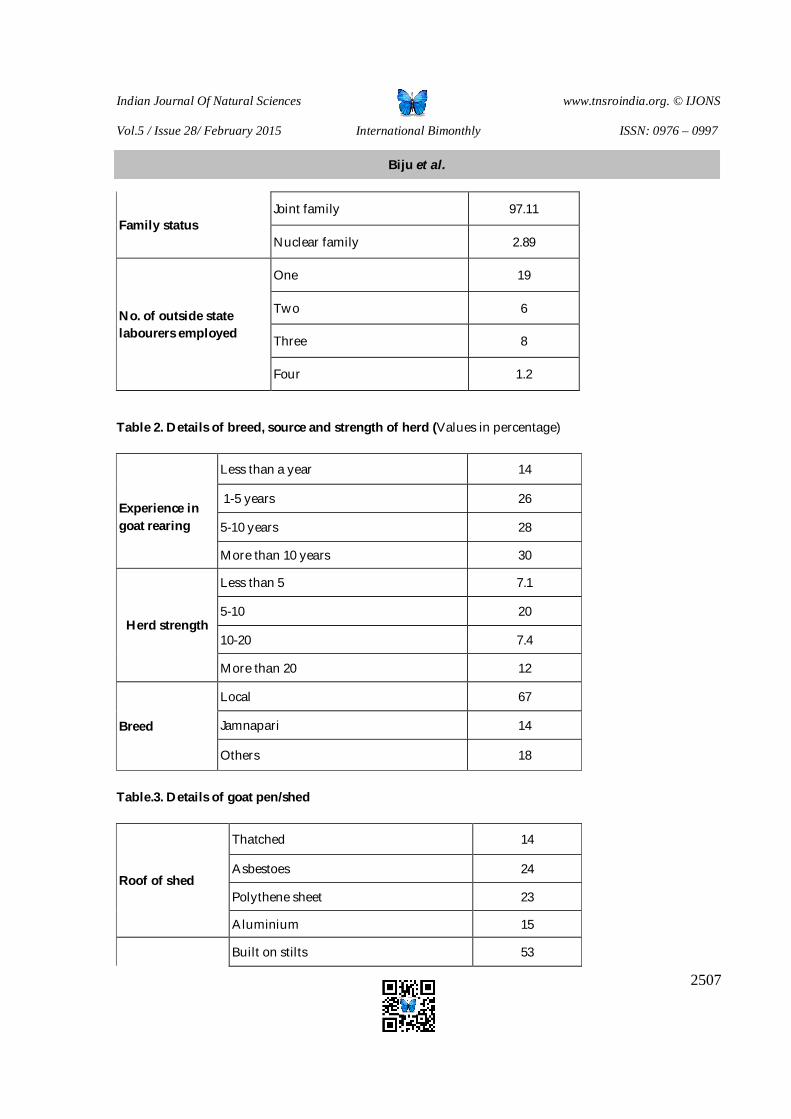
Indian Journal Of Natural Sciences www.tnsroindia.org. © IJONS
Vol.5 / Issue 28/ February 2015 International Bimonthly ISSN: 0976 – 0997
2507
Table 2. Details of breed, source and strength of herd (Values in percentage)
Experience in goat rearing
Less than a year 14
1-5 years 26
5-10 years 28
More than 10 years 30
Herd strength
Less than 5 7.1
5-10 20
10-20 7.4
More than 20 12
Breed
Local 67
Jamnapari 14
Others 18
Table.3. Details of goat pen/shed
Roof of shed
Thatched 14
Asbestoes 24
Polythene sheet 23
Aluminium 15
Built on stilts 53
Family status Joint family 97.11
Nuclear family 2.89
No. of outside state labourers employed
One 19
Two 6
Three 8
Four 1.2
Biju et al. et al.
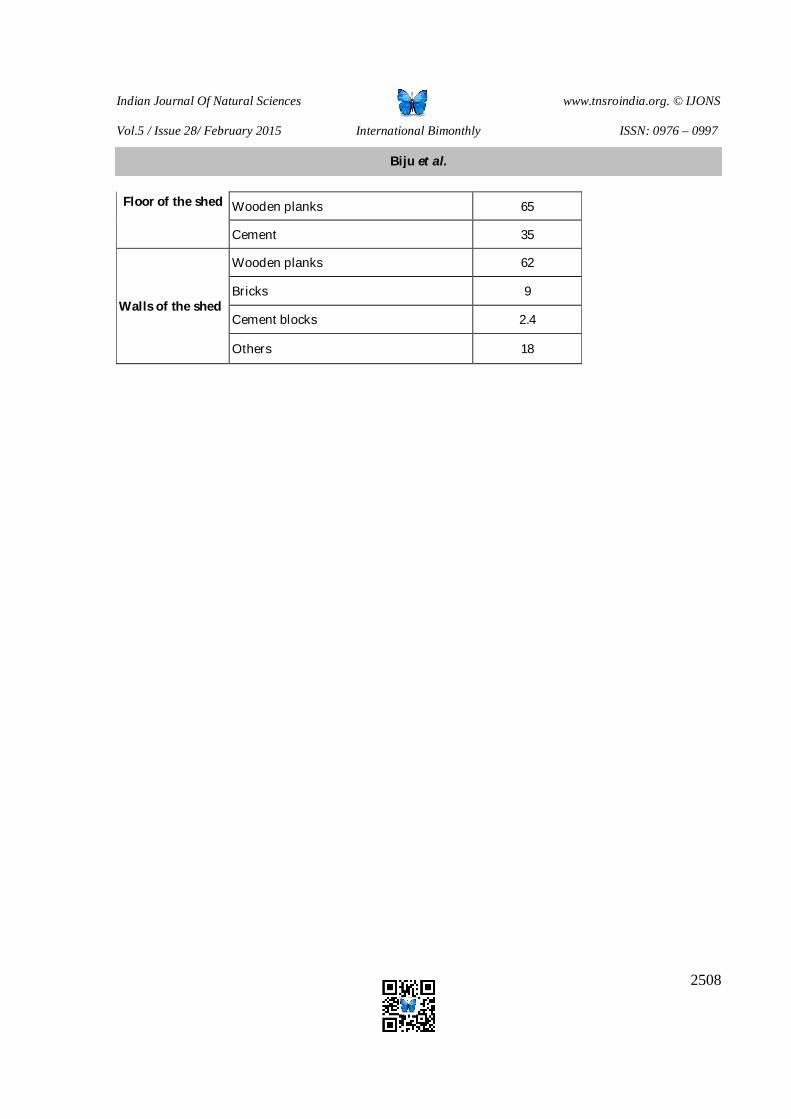
Indian Journal Of Natural Sciences www.tnsroindia.org. © IJONS
Vol.5 / Issue 28/ February 2015 International Bimonthly ISSN: 0976 – 0997
2508
Floor of the shed
Wooden planks 65
Cement 35
Walls of the shed
Wooden planks 62
Bricks 9
Cement blocks 2.4
Others 18
Biju et al. et al.
Indian Journal Of Natural Sciences www.tnsroindia.org. © IJONS
Vol.5 / Issue 28/ February 2015 International Bimonthly ISSN: 0976 – 0997
2509
A SWOT Analysis of Livestock Development for Livelihood Support Programme Implemented in Wayanad District Kerala State of India Chethan G.N, Senthilkumar R* and Chandramohan B Kerala Veterinary and Animal Sciences University, Pookode, Wayanad, Kerala,India. Received: 13 Oct 2014 Revised: 22 Oct 2014 Accepted: 3 Nov 2014
*Address for correspondence Senthilkumar R Kerala Veterinary and Animal Sciences University, Pookode,Wayanad, Kerala,India. E.mail: [email protected]
This is an Open Access Journal / article distributed under the terms of the Creative Commons Attribution License (CC BY-NC-ND 3.0) which permits unrestricted use, distribution, and reproduction in any medium, provided the
original work is properly cited.All rights reserved. Analysis of the strengths, weaknesses, opportunities and threats of the LDLS programme indicated that subsidies and animal insurance as a component of scheme were the important strengths of programme under category of Income and employment features. The farmer experience and knowledge possessed by farmers that helped to make this programme more effective was other important strength of the programme.Among various factor categories of perceived weaknesses of LDLS programme, the production system features was perceived as most important. More specifically livestock obtained under scheme acts as replacers of the earlier stock of the farm. The other important perceived weaknesses were infrastructure and animal features. Production system was perceived as the most important factor among the various factor categories of the opportunities in LDLS programme. Organic farming and integrated farming facilitated through the scheme were perceived as important opportunities of LDLS programme. The farmer influences was perceived as other important factor category, whereas marketing system was the least important factor category among others. The factor categorization of the various threats to LDLS programme indicated that among the various categories, topographic system represented the greatest threat to this programme.Specific factors in this category includes the problems such as outbreak of Ranikhet Disease and predation of backyard poultry. Policies and legislations were the second important threat to this programme. Keywords: Ranikhet Disease, backyard poultry, LDLS programme, topographic system.
ABSTRACT
RESEARCH ARTICLE
Indian Journal Of Natural Sciences www.tnsroindia.org. © IJONS
Vol.5 / Issue 28/ February 2015 International Bimonthly ISSN: 0976 – 0997
2510
INTRODUCTION India has made tremendous achievement in the dairy sector and it was possible through the white revolution called operation flood, which made dairy sector a sustainable vocation for millions of farmers by providing a structural set up to the Indian dairy trade.Through this the entire world realised that a livestock development programme can change the livelihood of rural poor. Livestock development programmes are meant not only for the development of livestock resources but also to support the livelihood of the poor livestock farmers and other stakeholders. Livestock development programmes play a significant role in income and employment generation and in the overall economic growth of a developing country. Livestock Development for Livelihood support programme (LDLS) was implemented during 2011-2012 by the Department of Animal Husbandry, Government of Kerala to uplift the socio-economic conditions of the livestock farmers. Under the programme one pregnant heifer, two adult female goats and ten layer chicks were distributed. Pregnancy ration of 50 Kg concentrate cattle feed per month for a three month period was also distributed to each beneficiary.
MATERIALS AND METHODS The study was conducted in the Wayanad district of Kerala among 150 beneficiaries of LDLS programme. Respondents of the study were selected by applying stratified multistage random sampling technique. There are a total of twenty five grama panchayats in Wayanad district of which five panchayats each were randomly selected from all three taluks (Vythiri, Sulthan batheri and Mananthavady). From each grama panchayat an equal number of 10 beneficiaries were selected randomly. SWOT (Strengths, Weaknesses, Opportunities and Threats) analysis is one of the most important tools to assess the strategic situation and identify strategic options for organizations or programmes. In the SWOT analysis, factors affecting a programme to achieve its objective are delineated into internal and external factors (Hiemstra et al. 2010). Internal factors refer to the components of the programme, resources of implementation area and its beneficiary that can be exploited (Strength) and limitation, fault or defect in the programme should be minimised (weaknesses) to achieve its objectives effectively. External factors are any favourable (Opportunities) or unfavourable (Threats) components of programme and attributes of implementation area and its beneficiaries that affect the strategy of the programme objective. The two groups of factors also differ by the extent of control we have on them. External factors are not amenable to control or modification whereas internal factors can be managed to alter the existing situation. Further, crucial decisions can be made on the analysis of the current and expected future situations by using the SWOT matrix (Weihrich, 1982). The matrix settings help to identify interactions between external and internal factors.
Phases of the SWOT analysis i. Identification of driving factors of the system: Strengths, Weaknesses, Opportunities and Threats by discussing with programme beneficiaries and other stake holders like implementation officers, presidents of gram Panchayats and milk co-operative society and bank personnel.
ii. All the identified statements prepared after discussion were pretested by conducting a pilot study in a non- sample area. Considering the pilot study, suitable modifications were made and these factors were listed and included in the final interview schedule. Separate list was prepared for strengths, weaknesses, opportunities, and threats. A total of 19 strengths, 22 weaknesses, 9 opportunities and 14 threats were identified. Responses to each statement were scored on a three point continuum namely agree, undecided and disagree. For each factor, the frequencies of various responses on three point continuum were multiplied with the respective weights and added up to get a cumulative value which was divided by the number of statements under each category to obtain a mean
Chethan et al. et al.
Indian Journal Of Natural Sciences www.tnsroindia.org. © IJONS
Vol.5 / Issue 28/ February 2015 International Bimonthly ISSN: 0976 – 0997
2511
score. Based on the mean score the items were ranked in the descending order and the highest value was assigned the first rank.
RESULTS AND DISCUSSION
i. Analysis of strengths of the LDLS programme Data in Table 1 depict the strengths of LDLS programme as perceived by the beneficiaries. The importance of the pervasive influence of economic characteristics as drivers of farmers’ intuition and decision making is evident in the findings of this study with regard to the perceived strengths of the LDLS. It was evident from the present study that the strength of the LDLS programme as perceived by the beneficiaries was the subsidies provided under the programme that served as economic assistance to the beneficiaries as well as the inclusion of insurance as a component of the programme with a view to reduce the risk associated with sudden death of animals. Fan et al. (2007) also observed that subsidies on credit helped farmers’ especially small holders to adopt new technology. Adoption of an innovation was facilitated by the fact that direct or indirect financial payments were instrumental in supporting individuals in a social system by further capitalizing on its inherent relative advantage (Sahin, 2006). Dorward and Chirwa (2009) also highlighted the objectives of subsidies in achieving food self-sufficiency and increasing the income of resource poor households through increased food and cash crop production. It was rather unique and uncharacteristic of farmers to recognize the advantage of the animal insurance component of the scheme. This is in view of the fact though preventive innovations have a lot of functions such as lowering the effects of some unwanted future event; they have a slow rate of adoption because their relative advantage is highly uncertain (Sahin, 2006). GOI (2013) had mentioned the importance of schemes with an insurance component and stated that for promotion of the livestock sector, it was important that along with providing more effective measures for disease control and improvement of genetic quality of animals, a mechanism for assured protection to farmers and cattle rearers was required against eventual losses of such animals. However, Gracia et al. (2006) observed that farmers who purchase livestock insurance at market and cooperative rates have lower expected household incomes when compared to the baseline and hence animal life insurance was unattractive to farmers. Other perceived strengths of the LDLS programme related to the farmer features i.e. experience and knowledge already possessed by the dairy farmers made the programme more effective. Experience and knowledge count much for deriving benefits from any enterprises. Moreki and Kopano (2014) observed failure to impart knowledge on animal husbandry practices to projects beneficiaries prior to obtaining the packages could be a contributory factor to their poor performance.Beneficiaries of this scheme also recognized the crucial role played by LDLS in providing livelihood options to daily wage labourers and this was perceived as strength of this programme. Swanepoel et al. (2010) also observed that livelihood-based approach would most likely have the greatest impact on reduction of rural poverty. And also, such programmes have a major role to play in ameliorating various constraints faced by small holder farmers. These views were endorsed by Moreki and Kopano (2014) who mentioned that 63 per cent of LIMID beneficiaries felt that the programme had a positive impact on their livelihoods. The multifocal ramifications of the programme in strengthening food security through enhanced access as well as availability of livestock products were strength of the programme. Economic security provided by the programme, to tide over the losses from crop failure was also observed by beneficiaries as a strength of LDLS scheme. This view was in agreement with that of Pica et al. (2010) who mentioned that development in the livestock sector contributed to better food security through increased supplies (and possibly lower prices) of animal-source food, thereby stimulating economic growth and development.Easy availability of loan under this programme was perceived as strength of the programme by beneficiaries. It was also viewed as a strength by policy makers in view of the responsibility creating function of loans which also encouraged the development of entrepreneurial traits among beneficiaries. Wanyoike and Baker (2011) also classified livestock development projects under the cluster of “best” the contributing reason being the financing of such programmes by loans. Swanepoel et al., (2010) also endorsed these
Chethan et al. et al.
Indian Journal Of Natural Sciences www.tnsroindia.org. © IJONS
Vol.5 / Issue 28/ February 2015 International Bimonthly ISSN: 0976 – 0997
2512
findings. However differing views were made by Ahmad (2014) who reported that access to credit was not an active part of a program, rather necessary linkages with banks and availability of credit without collateral would be useful, in marketing their services.Beneficiaries of LDLS also recognized that the income derived from additional livestock obtained under the scheme as programme strength. This findings concurred with the similar observations were made by Planning Commission (2000), that majority of the IRDP beneficiaries were found satisfied with their new assets on account of increased the flow of income to the family.
ii. Analysis of weaknesses of the LDLS programme Table 2 reveals that various perceived weaknesses of LDLS programme. Difficulty in predicting the production potential of cattle procured for LDLS in heifer stage was the most important perceived weakness of the programme, which contributed to failure of the farmers to reach production levels anticipated during animal purchase and resultant losses in the enterprise.This created additional economic burden for beneficiaries, as they were already under pressure to derive maximum output from programme in order to repay loan and interest availed, both of which could result in farmers’ loss of faith in the policy system. Planning Commission (2000) in the study on the impact of IRDP in Himachal Pradesh also reported that the practice of handing over unproductive assets had proved to be a burden to the poor and beneficiaries should have full freedom to select and purchase productive assets. The Commission also observed that the beneficiaries who had not been given with good productive animals was burden to them resulted in problems of repayment of loan taken from the financial institutions. Beneficiaries were also of the opinion that the quantity of feed supplied under the programme was insufficient and resultant decrease in production as the cost of production was mainly regulated by the cost of concentrate feed. Improperly planned feed subsidy was another important weakness perceived by the beneficiaries. The importance of the concentrate feed component in the livestock projects was stressed by Gracia (2006), who observed that the programs with most positive impact on dairy farm’s competitiveness in milk production were primarily the feeding programs followed by the breeding and herd-expansion programs. These problems could have been further exacerbated by Kerala’s excessive dependence on neighbour states for feed and feed ingredients of livestock and poultry and consequent high costs of production when compared to other states. Other important weaknesses with economic undertones centred on areas of concern affecting the procurement of good quality animals – the crux of the intention of the programme. Supply issues perceived as weaknesses included lack of accessibility and information about selection of good heifers and risks in transporting pregnant heifers. Insufficiency of fund allotted for purchase of heifer with high production potential was recognized as a weakness of the programme which was further exacerbated by the need to purchase heifers from neighbour states, the transportation costs involved and more importantly because of significance involvement of marketing intermediaries which further complicated the process of acquiring good potential animals. Overall, the flow of animals / procurement of animals are still dominated by traditional commodity chains in which trading functions are distributed among a number of complementary actors: traders, escorts, brokers to mention a few. The failure of appropriate agencies to intervene in the regulation of animal trade was reflected in this weakness of the programme. Kamuanga et al. (2008) also observed that transport appeared to be one of the determining factors in competitiveness of supply. The authors also observed that high official taxes, poor state of roads, high cost of transportation of animals and inadequate flow of market information for making good commercial decisions were important barriers to trade. Purchase of heifers from neighbour states was resorted with the objective of increasing the productive cattle population in the state. This objective was however defeated as beneficiaries chose to replace existing cattle with the newly procured heifers. This was perceived as one of the weakness of programme under the factor category production system. Lack of fodder, shelter and manpower were also reflected as various weakness of programme under factor categories infrastructure and farmer features. Constraints of land, fodder and feed in the livestock sector of Kerala were also reported by the Planning Commission (2009).
Chethan et al. et al.
Indian Journal Of Natural Sciences www.tnsroindia.org. © IJONS
Vol.5 / Issue 28/ February 2015 International Bimonthly ISSN: 0976 – 0997
2513
Other issues of concern included lack of experience in goat farming. This weakness was also reflected in other less important weaknesses viz., difficulty in managing multi-species enterprises due to lack of knowledge, experience and availability of time. Since this was a multi species programme, it was imperative that appropriate training needs of beneficiaries be addressed to achieve the programme objectives.Kamuanga et al. (2008) emphasized the importance of greater valorisation of animal products in ensuring a strong livestock industry. LDLS however failed to capitalize on this as increased milk production from single cow was insufficient to capitalize on value addition of milk; this was perceived as one of weaknesses to a lesser extent, the beneficiaries suggested that to overcome this policy makers could emphasize single species enterprises rather than diversified ones. In this context, beneficiaries also opined that it would be beneficial if they had received additional cattle rather than goats under the programme The item which was perceived as least important weakness was lack of man power or labour to manage the different livestock enterprises. In view of which a few of the beneficiaries had sold the cattle they had before their entry in to LDLS as well as goats obtained under the programme. Similar findings were made by Sandford and Ashley (2008) who reported that labour availability affected households’ preferences for a species of livestock and that overall labour shortages had a tendency to push households towards owning less livestock.
iii. Analysis of opportunities of the LDLS programme
The opportunities of LDLS programme as perceived by the beneficiaries was illustrated in Table 3. The opportunities of the LDLS programme perceived by the beneficiaries were centred on the production system. More specifically, the scheme offered beneficiaries an opening wedge into a hitherto unexplored territory of organic farming by ensuring an adequate supply of manure through the livestock obtained under the scheme. Opportunity to promote integrated farming further was also perceived as an important opportunity of LDLS programme. Organic farming and livestock rearing are intricately related and the growth of any one sector would definitely have concurrent implications on the other. Singh (2009) studied the interdependency between these sectors and mentioned size of the livestock herd as an important determinant of organic farming. Kamuanga et al. (2008) also reported that mixed farming had environmental advantages in the Sahel region of Africa where cattle dung helped to regenerate soil. They further stated that the ownership of cattle allowed the production of one to two tonnes of manure per year per animal depending on the time spent in stalls. The increase in availability of organic manure was thus perceived served as an important opportunity for LDLS beneficiaries to explore further in-roads in to promoting integrated farming system. Enhanced decision making ability among farm families which was inculcated by the programme was perceived as the next important opportunity. That was the result of assurance of a source of increased income derived through scheme. Alam et al. (1997) in an impact study of SLDP in Bangladesh also reported that the project ensured empowerment of women in the study areas and increased their participation in decision making. Though the purchase of animals under the programme had provided beneficiaries with opportunity to familiarize themselves with local and distant livestock markets, beneficiaries failed to capitalize on this through marketing of various livestock commodities and value added products. According to Wanyoike and Baker (2011) livestock development programmes which were classified under the category of best had often featured a market related objective, where as programmes which were classified as intermediate and poor were less emphatic in this regard. The advisory committee on animal husbandry and dairying had recognized that lack of marketing support was a serious issue faced by the dairy farmers of Kerala (Planning Commission, 2009). A few of the beneficiaries had undertaken goat farming through the LDLS programme. By the way, the scheme had also served to open up new vistas of information to offer farmers opportunity to explore newer areas in livestock rearing. Introduction of new species in livestock farming through the implementation of programme was an opportunity to those farmers who lagged behind in terms of innovative proneness and risk bearing. Despite many of the weaknesses that beneficiaries had encountered while purchasing heifers from neighbor states, they also
Chethan et al. et al.
Indian Journal Of Natural Sciences www.tnsroindia.org. © IJONS
Vol.5 / Issue 28/ February 2015 International Bimonthly ISSN: 0976 – 0997
2514
recognized –to a lesser extent- that this was an opportunity with the potential to increase the livestock population of the state. iv. Analysis of threats of the LDLS programme
Table 4 presents the threats of programme as perceived by the beneficiaries. It was evident from the study that the perceived threats of the programme centred mainly on four categories viz., topographic system, policies and legislations, marketing system and farmer influences. Item which perceived as the most important threat to the programme was system of regulation in vogue with respect to the pricing of milk, and the difficulties of beneficiaries faced in making ends meet. This may have been a barrier preventing beneficiaries from entering private marketing channels. The item which was perceived as the second most important threat to the programme was the massive death of poultry due to outbreak of diseases and the instances of poultry missing and attack of poultry by stray animals and other predators. This finding was endorsed by Moreki and Kopano (2014) who reported that diseases, predation and sales were the major causes for decline in stock numbers in LIMID implemented areas. Similar observations were made by Pan et al. (2009), Conroy et al. (2005) and Ebrahim and Hailemichael (2012). Ebrahim and Hailemichael (2012) also reported that attributes of small livestock mortality was due to access to veterinary services, this was also supported by Sidahmed and Ange (2002) who reported that livestock projects were successful when good technical backstopping was provided as well as functional monitoring and evaluation of systems. The drastic decline in poultry population of Kerala was also noticed by the Planning Commission (2009). The lack of market support for animals / products leading to a no gain and no loss situation was also perceived as an important threat under the category marketing system. The item was also reflected in the opportunities of programme as least important. Marketing system plays a key role in the success of livestock programmes. Hence policies should target project environments featuring functioning markets for products and inputs. This was reaffirmed by the observation of Wanyoike and Baker (2011), who reported that success of livestock projects was not significant in the model of sustainability of project benefits, where as it was significantly associated with measures of the projects’ contribution to households’ market utilization. The other item which perceived as threat was the high rate of interest on the loans availed; the same threat was also expressed by implementing officers who suggested changes in credit policy. The rate of interest officially documented by the Planning Commission (2009), for various loans under animal husbandry sector was higher than that of agriculture loans. The provisions of the loan under the scheme play a significant role in determining beneficiary contribution and the programme success. On the other hand it also acts as an additional burden eating into meagre farm profits .Under the farmer influences, the sale of goats and poultry to meet urgent family needs was the least important. This was supported by Sandford and Ashley (2008), who reported that increased health expenditure, or funeral expenses, can also directly lead to the sale of productive animals with subsequent impacts on livestock asset holdings and livestock related income. REFERENCES 1. Ahmad, S. 2011. Community empowerment through livestock development and credit project. Aid-for-trade case story:
Pakistan. Organization for economic cooperation and development. 5p. 2. Dorward, A. and Chirwa, E. 2009. The Agricultural Input Subsidy Programme 2005 to 2008: Achievements and
Challenges. London: School of Oriental and African Studies. [on line]. Available: http://http://eprints.soas.ac.uk/8897/1 /Issues%20 Paper%2010%20Jun%20Rev%20A.pdf. [12 May 2014].
3. Fan, S., Gulati, A. and Thorat, S. 2007. Investment, Subsidies, and Pro-Poor Growth in Rural India. IFPRI Discussion Paper 00716. International Food Policy Research Institute. Development Strategy and Governance Division, New Delhi Office.
Chethan et al. et al.
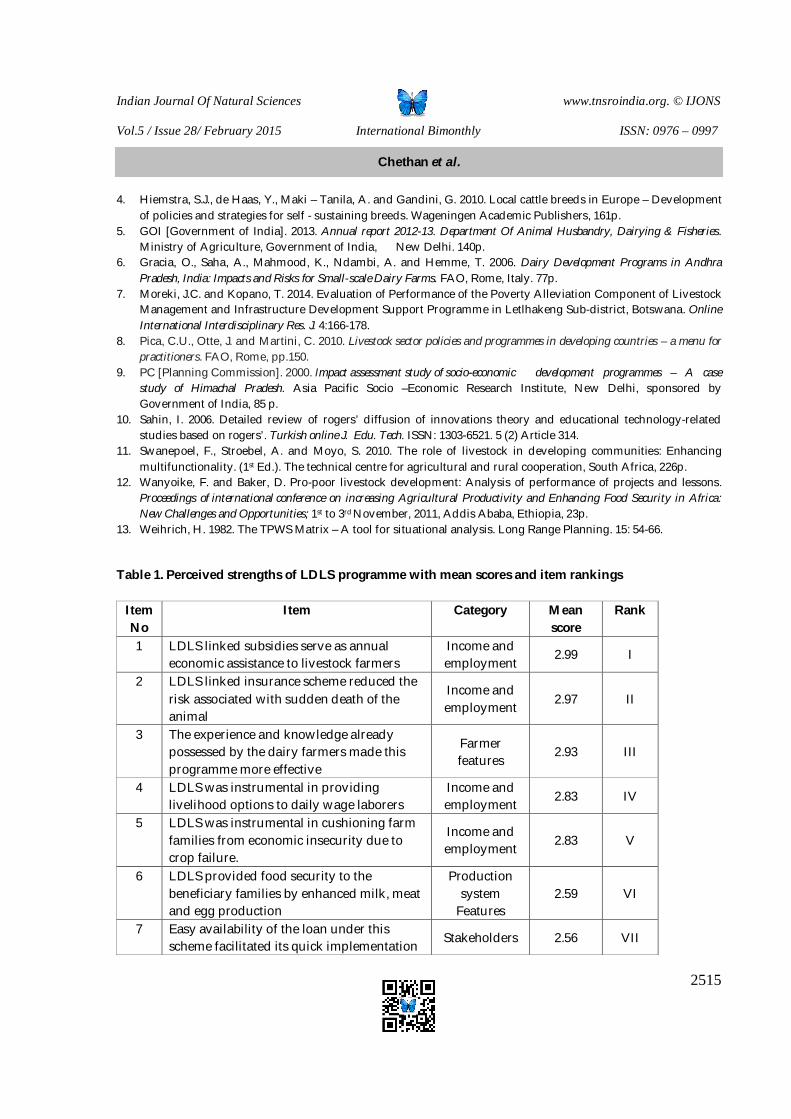
Indian Journal Of Natural Sciences www.tnsroindia.org. © IJONS
Vol.5 / Issue 28/ February 2015 International Bimonthly ISSN: 0976 – 0997
2515
4. Hiemstra, S.J., de Haas, Y., Maki – Tanila, A. and Gandini, G. 2010. Local cattle breeds in Europe – Development of policies and strategies for self - sustaining breeds. Wageningen Academic Publishers, 161p.
5. GOI [Government of India]. 2013. Annual report 2012-13. Department Of Animal Husbandry, Dairying & Fisheries. Ministry of Agriculture, Government of India, New Delhi. 140p.
6. Gracia, O., Saha, A., Mahmood, K., Ndambi, A. and Hemme, T. 2006. Dairy Development Programs in Andhra Pradesh, India: Impacts and Risks for Small- scale Dairy Farms. FAO, Rome, Italy. 77p.
7. Moreki, J.C. and Kopano, T. 2014. Evaluation of Performance of the Poverty Alleviation Component of Livestock Management and Infrastructure Development Support Programme in Letlhakeng Sub-district, Botswana. Online International Interdisciplinary Res. J. 4:166-178.
8. Pica, C.U., Otte, J. and Martini, C. 2010. Livestock sector policies and programmes in developing countries – a menu for practitioners. FAO, Rome, pp.150.
9. PC [Planning Commission]. 2000. Impact assessment study of socio-economic development programmes – A case study of Himachal Pradesh. Asia Pacific Socio –Economic Research Institute, New Delhi, sponsored by Government of India, 85 p.
10. Sahin, I. 2006. Detailed review of rogers’ diffusion of innovations theory and educational technology-related studies based on rogers’. Turkish online J. Edu. Tech. ISSN: 1303-6521. 5 (2) Article 314.
11. Swanepoel, F., Stroebel, A. and Moyo, S. 2010. The role of livestock in developing communities: Enhancing multifunctionality. (1st Ed.). The technical centre for agricultural and rural cooperation, South Africa, 226p.
12. Wanyoike, F. and Baker, D. Pro-poor livestock development: Analysis of performance of projects and lessons. Proceedings of international conference on increasing Agricultural Productivity and Enhancing Food Security in Africa: New Challenges and Opportunities; 1st to 3rd November, 2011, Addis Ababa, Ethiopia, 23p.
13. Weihrich, H. 1982. The TPWS Matrix – A tool for situational analysis. Long Range Planning. 15: 54-66.
Table 1. Perceived strengths of LDLS programme with mean scores and item rankings
Item No
Item Category Mean score
Rank
1 LDLS linked subsidies serve as annual economic assistance to livestock farmers
Income and employment
2.99 I
2 LDLS linked insurance scheme reduced the risk associated with sudden death of the animal
Income and employment 2.97 II
3 The experience and knowledge already possessed by the dairy farmers made this programme more effective
Farmer features
2.93 III
4 LDLS was instrumental in providing livelihood options to daily wage laborers
Income and employment 2.83 IV
5 LDLS was instrumental in cushioning farm families from economic insecurity due to crop failure.
Income and employment 2.83 V
6 LDLS provided food security to the beneficiary families by enhanced milk, meat and egg production
Production system
Features 2.59 VI
7 Easy availability of the loan under this scheme facilitated its quick implementation Stakeholders 2.56 VII
Chethan et al. et al.
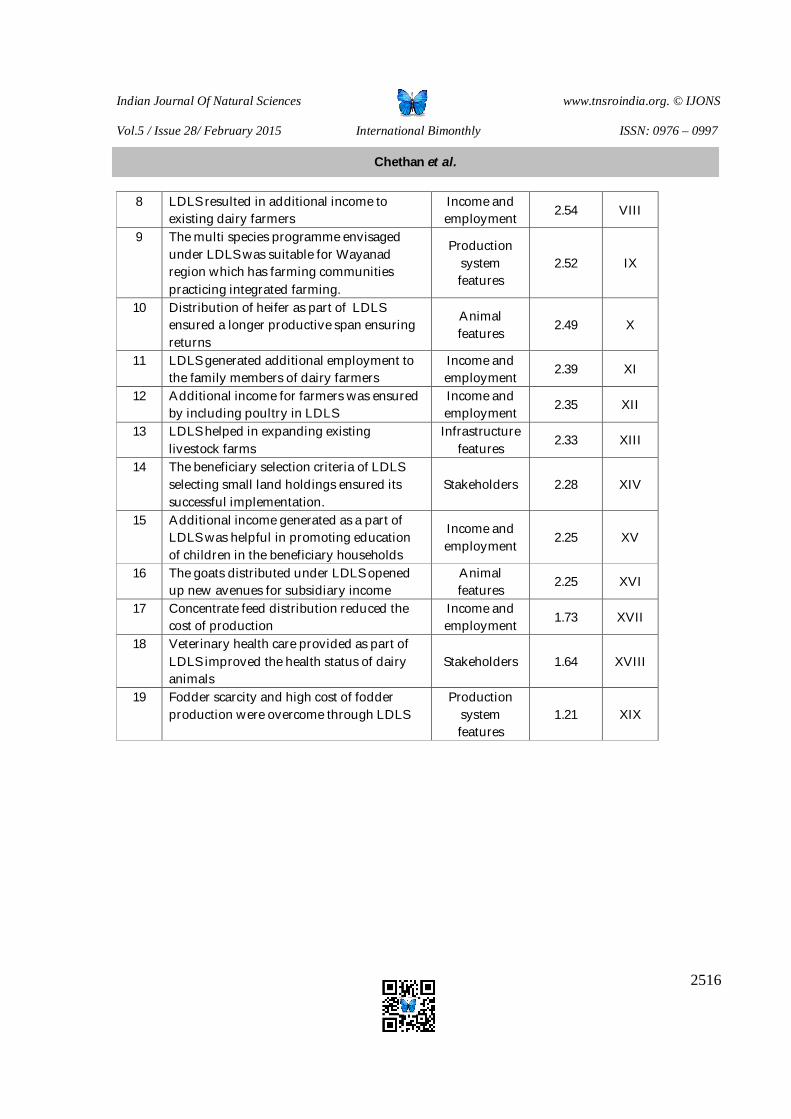
Indian Journal Of Natural Sciences www.tnsroindia.org. © IJONS
Vol.5 / Issue 28/ February 2015 International Bimonthly ISSN: 0976 – 0997
2516
8 LDLS resulted in additional income to existing dairy farmers
Income and employment 2.54 VIII
9 The multi species programme envisaged under LDLS was suitable for Wayanad region which has farming communities practicing integrated farming.
Production system features
2.52 IX
10 Distribution of heifer as part of LDLS ensured a longer productive span ensuring returns
Animal features
2.49 X
11 LDLS generated additional employment to the family members of dairy farmers
Income and employment
2.39 XI
12 Additional income for farmers was ensured by including poultry in LDLS
Income and employment 2.35 XII
13 LDLS helped in expanding existing livestock farms
Infrastructure features
2.33 XIII
14 The beneficiary selection criteria of LDLS selecting small land holdings ensured its successful implementation.
Stakeholders 2.28 XIV
15 Additional income generated as a part of LDLS was helpful in promoting education of children in the beneficiary households
Income and employment
2.25 XV
16 The goats distributed under LDLS opened up new avenues for subsidiary income
Animal features
2.25 XVI
17 Concentrate feed distribution reduced the cost of production
Income and employment 1.73 XVII
18 Veterinary health care provided as part of LDLS improved the health status of dairy animals
Stakeholders 1.64 XVIII
19 Fodder scarcity and high cost of fodder production were overcome through LDLS
Production system features
1.21 XIX
Chethan et al. et al.
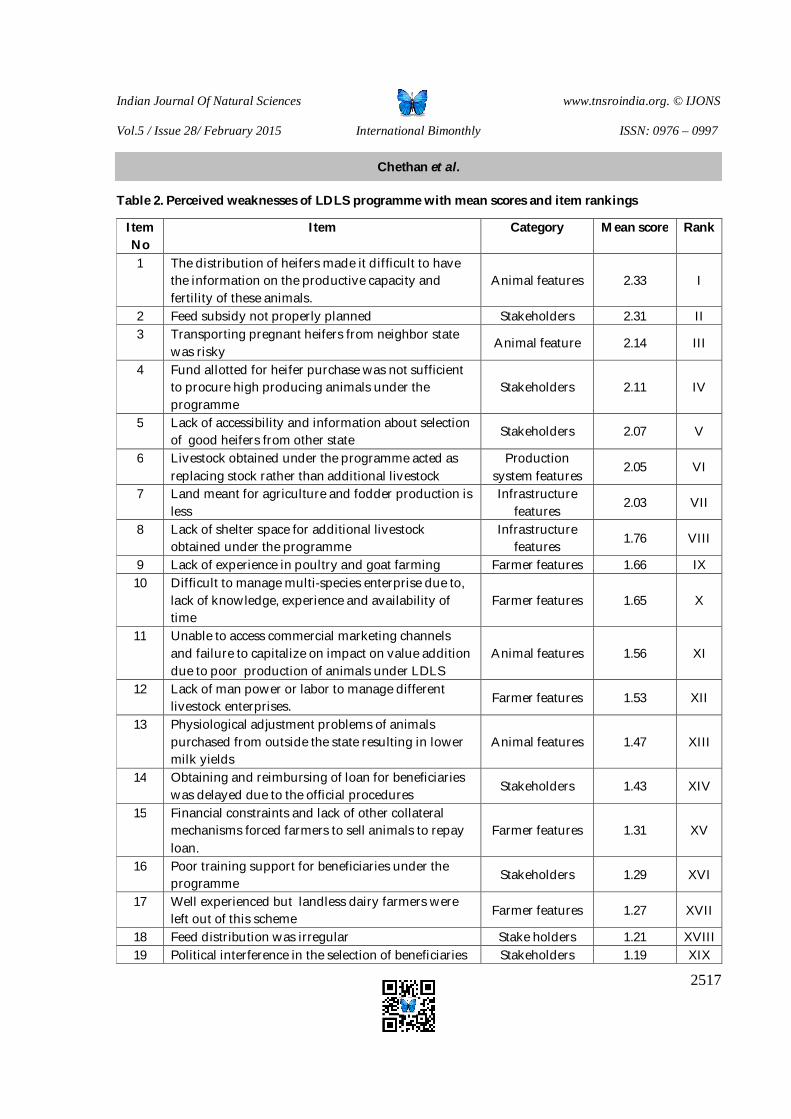
Indian Journal Of Natural Sciences www.tnsroindia.org. © IJONS
Vol.5 / Issue 28/ February 2015 International Bimonthly ISSN: 0976 – 0997
2517
Table 2. Perceived weaknesses of LDLS programme with mean scores and item rankings
Item No
Item Category Mean score Rank
1 The distribution of heifers made it difficult to have the information on the productive capacity and fertility of these animals.
Animal features 2.33 I
2 Feed subsidy not properly planned Stakeholders 2.31 II 3 Transporting pregnant heifers from neighbor state
was risky Animal feature 2.14 III
4 Fund allotted for heifer purchase was not sufficient to procure high producing animals under the programme
Stakeholders 2.11 IV
5 Lack of accessibility and information about selection of good heifers from other state
Stakeholders 2.07 V
6 Livestock obtained under the programme acted as replacing stock rather than additional livestock
Production system features
2.05 VI
7 Land meant for agriculture and fodder production is less
Infrastructure features
2.03 VII
8 Lack of shelter space for additional livestock obtained under the programme
Infrastructure features 1.76 VIII
9 Lack of experience in poultry and goat farming Farmer features 1.66 IX 10 Difficult to manage multi-species enterprise due to,
lack of knowledge, experience and availability of time
Farmer features 1.65 X
11 Unable to access commercial marketing channels and failure to capitalize on impact on value addition due to poor production of animals under LDLS
Animal features 1.56 XI
12 Lack of man power or labor to manage different livestock enterprises. Farmer features 1.53 XII
13 Physiological adjustment problems of animals purchased from outside the state resulting in lower milk yields
Animal features 1.47 XIII
14 Obtaining and reimbursing of loan for beneficiaries was delayed due to the official procedures
Stakeholders 1.43 XIV
15 Financial constraints and lack of other collateral mechanisms forced farmers to sell animals to repay loan.
Farmer features 1.31 XV
16 Poor training support for beneficiaries under the programme
Stakeholders 1.29 XVI
17 Well experienced but landless dairy farmers were left out of this scheme Farmer features 1.27 XVII
18 Feed distribution was irregular Stake holders 1.21 XVIII 19 Political interference in the selection of beneficiaries Stakeholders 1.19 XIX
Chethan et al. et al.
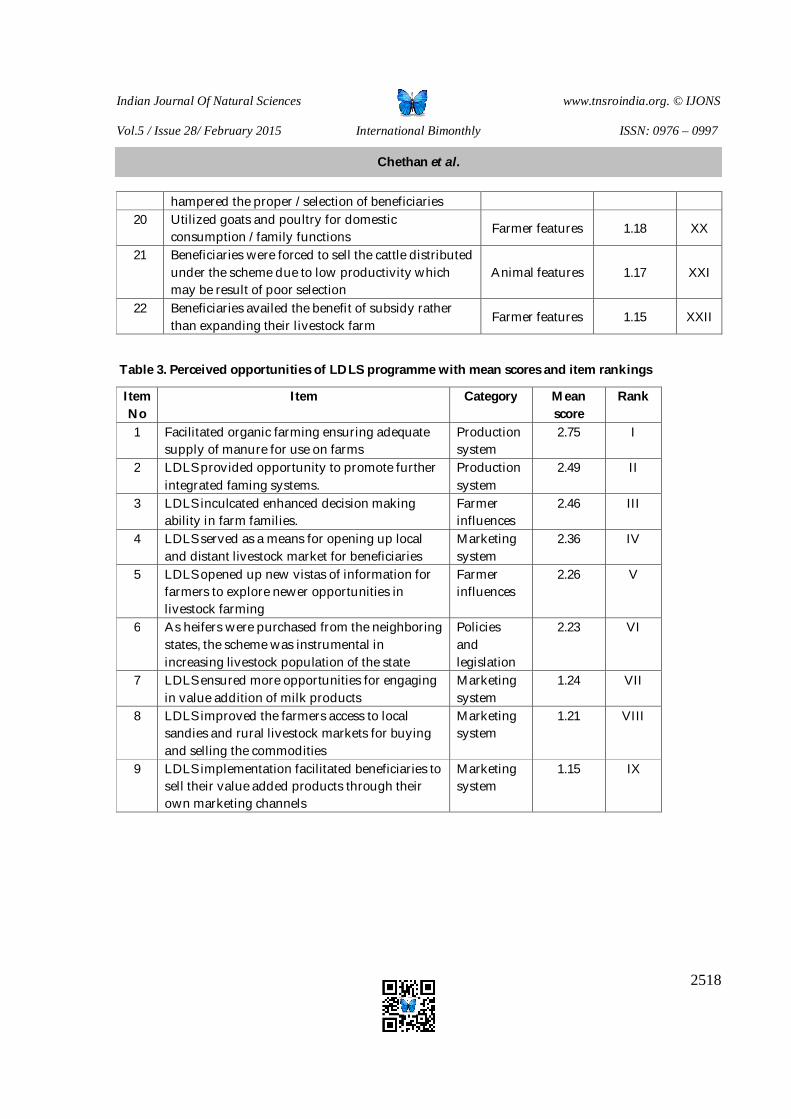
Indian Journal Of Natural Sciences www.tnsroindia.org. © IJONS
Vol.5 / Issue 28/ February 2015 International Bimonthly ISSN: 0976 – 0997
2518
hampered the proper / selection of beneficiaries 20 Utilized goats and poultry for domestic
consumption / family functions Farmer features 1.18 XX
21 Beneficiaries were forced to sell the cattle distributed under the scheme due to low productivity which may be result of poor selection
Animal features 1.17 XXI
22 Beneficiaries availed the benefit of subsidy rather than expanding their livestock farm
Farmer features 1.15 XXII
Table 3. Perceived opportunities of LDLS programme with mean scores and item rankings
Item No
Item Category Mean score
Rank
1 Facilitated organic farming ensuring adequate supply of manure for use on farms
Production system
2.75 I
2 LDLS provided opportunity to promote further integrated faming systems.
Production system
2.49 II
3 LDLS inculcated enhanced decision making ability in farm families.
Farmer influences
2.46 III
4 LDLS served as a means for opening up local and distant livestock market for beneficiaries
Marketing system
2.36 IV
5 LDLS opened up new vistas of information for farmers to explore newer opportunities in livestock farming
Farmer influences
2.26 V
6 As heifers were purchased from the neighboring states, the scheme was instrumental in increasing livestock population of the state
Policies and legislation
2.23 VI
7 LDLS ensured more opportunities for engaging in value addition of milk products
Marketing system
1.24 VII
8 LDLS improved the farmers access to local sandies and rural livestock markets for buying and selling the commodities
Marketing system
1.21 VIII
9 LDLS implementation facilitated beneficiaries to sell their value added products through their own marketing channels
Marketing system
1.15 IX
Chethan et al. et al.
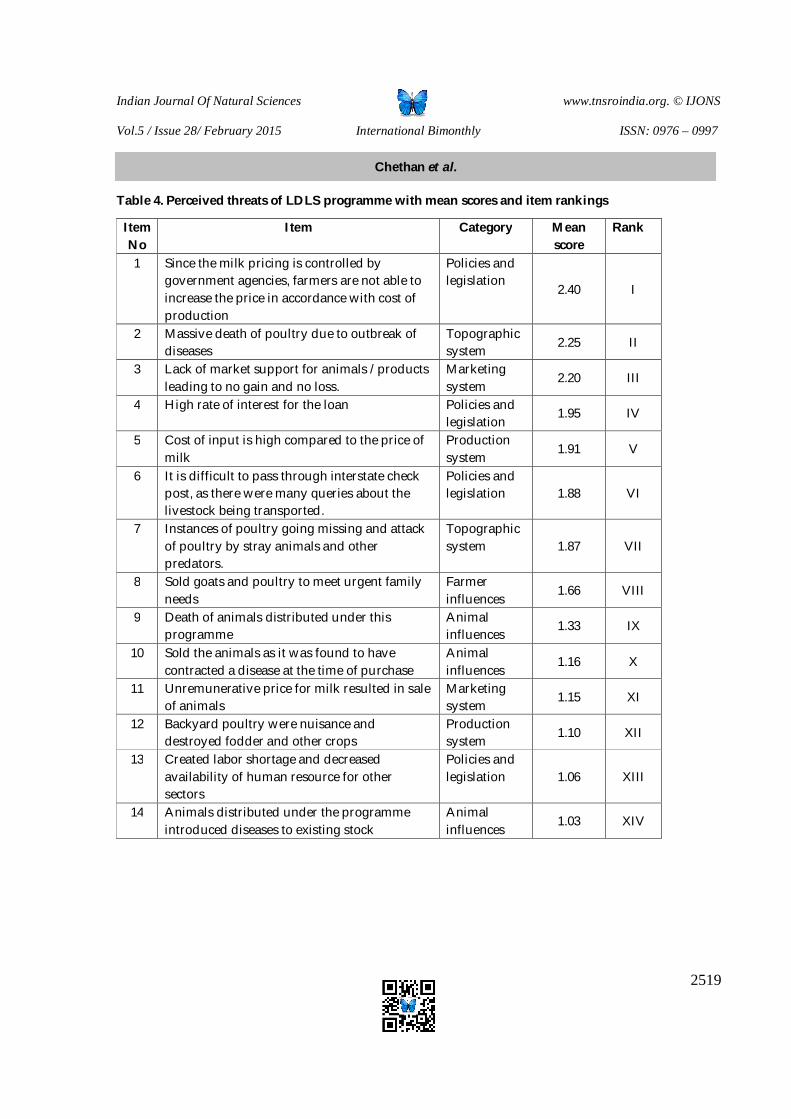
Indian Journal Of Natural Sciences www.tnsroindia.org. © IJONS
Vol.5 / Issue 28/ February 2015 International Bimonthly ISSN: 0976 – 0997
2519
Table 4. Perceived threats of LDLS programme with mean scores and item rankings
Item No
Item Category Mean score
Rank
1 Since the milk pricing is controlled by government agencies, farmers are not able to increase the price in accordance with cost of production
Policies and legislation
2.40 I
2 Massive death of poultry due to outbreak of diseases
Topographic system 2.25 II
3 Lack of market support for animals / products leading to no gain and no loss.
Marketing system
2.20 III
4 High rate of interest for the loan Policies and legislation
1.95 IV
5 Cost of input is high compared to the price of milk
Production system
1.91 V
6 It is difficult to pass through interstate check post, as there were many queries about the livestock being transported.
Policies and legislation 1.88 VI
7 Instances of poultry going missing and attack of poultry by stray animals and other predators.
Topographic system 1.87 VII
8 Sold goats and poultry to meet urgent family needs
Farmer influences
1.66 VIII
9 Death of animals distributed under this programme
Animal influences
1.33 IX
10 Sold the animals as it was found to have contracted a disease at the time of purchase
Animal influences
1.16 X
11 Unremunerative price for milk resulted in sale of animals
Marketing system
1.15 XI
12 Backyard poultry were nuisance and destroyed fodder and other crops
Production system 1.10 XII
13 Created labor shortage and decreased availability of human resource for other sectors
Policies and legislation 1.06 XIII
14 Animals distributed under the programme introduced diseases to existing stock
Animal influences
1.03 XIV
Chethan et al. et al.
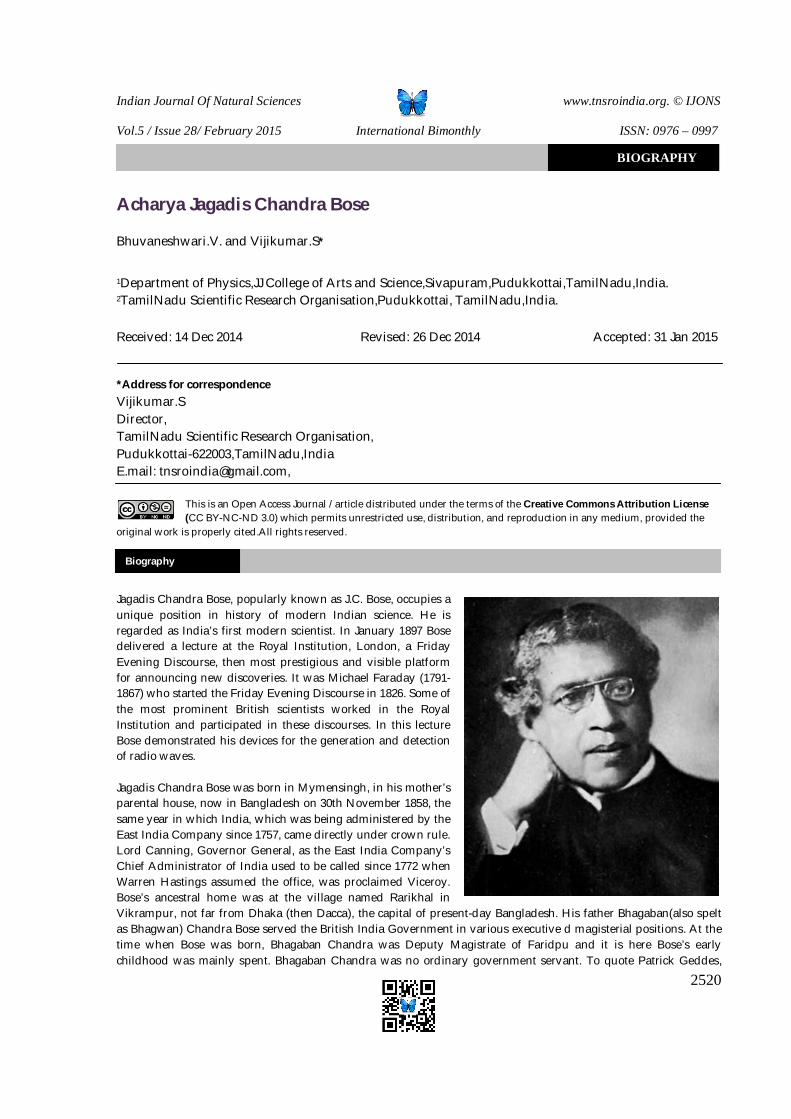
Indian Journal Of Natural Sciences www.tnsroindia.org. © IJONS
Vol.5 / Issue 28/ February 2015 International Bimonthly ISSN: 0976 – 0997
2520
Acharya Jagadis Chandra Bose Bhuvaneshwari.V. and Vijikumar.S*
1Department of Physics,JJ College of Arts and Science,Sivapuram,Pudukkottai,TamilNadu,India. 2TamilNadu Scientific Research Organisation,Pudukkottai, TamilNadu,India. Received: 14 Dec 2014 Revised: 26 Dec 2014 Accepted: 31 Jan 2015
*Address for correspondence Vijikumar.S Director, TamilNadu Scientific Research Organisation, Pudukkottai-622003,TamilNadu,India E.mail: [email protected],
This is an Open Access Journal / article distributed under the terms of the Creative Commons Attribution License (CC BY-NC-ND 3.0) which permits unrestricted use, distribution, and reproduction in any medium, provided the
original work is properly cited.All rights reserved. Jagadis Chandra Bose, popularly known as J.C. Bose, occupies a unique position in history of modern Indian science. He is regarded as India’s first modern scientist. In January 1897 Bose delivered a lecture at the Royal Institution, London, a Friday Evening Discourse, then most prestigious and visible platform for announcing new discoveries. It was Michael Faraday (1791-1867) who started the Friday Evening Discourse in 1826. Some of the most prominent British scientists worked in the Royal Institution and participated in these discourses. In this lecture Bose demonstrated his devices for the generation and detection of radio waves. Jagadis Chandra Bose was born in Mymensingh, in his mother’s parental house, now in Bangladesh on 30th November 1858, the same year in which India, which was being administered by the East India Company since 1757, came directly under crown rule. Lord Canning, Governor General, as the East India Company’s Chief Administrator of India used to be called since 1772 when Warren Hastings assumed the office, was proclaimed Viceroy. Bose’s ancestral home was at the village named Rarikhal in Vikrampur, not far from Dhaka (then Dacca), the capital of present-day Bangladesh. His father Bhagaban(also spelt as Bhagwan) Chandra Bose served the British India Government in various executive d magisterial positions. At the time when Bose was born, Bhagaban Chandra was Deputy Magistrate of Faridpu and it is here Bose’s early childhood was mainly spent. Bhagaban Chandra was no ordinary government servant. To quote Patrick Geddes,
Biography
BIOGRAPHY
Indian Journal Of Natural Sciences www.tnsroindia.org. © IJONS
Vol.5 / Issue 28/ February 2015 International Bimonthly ISSN: 0976 – 0997
2521
who was Professor of Botany at St. Andrews University, and the author of one of the most authentic biographies of Bose : “Bose’s father – Bhagaban Chunder Bose, Deputy Magistrate of Faridpur – was the active defender, not only of the townlet but of the scores of villages around as well. The modern magistrate is mainly settled between his courthouse and his home; but here in those days a man was needed, picked not only for judicial capacity, intelligence and local knowledge, but for active initiative and courage and thus prepared at any moment to assume command of his own police and his people as well, and be ready even to raid the raiders. Of this readiness various stories might be told. As a single example, hearing of a gang of dacoits in his neighourhood, Mr. Bose mounted an elephant and with the very few police available, rode straight into the very heart of the dacoits’ camp. Taken by surprise, they broke and scattered; the ready magistrate dropped down, captured the leader with his own hands, and took him back for trial.” Bhagaban Chandra had kept in his household a dreaded ex-dacoit, whom he had earlier sentenced to imprisonment, to look after young Jagadis Chandra. Though Bhagwan Chandra served the British Government he was a staunch nationalist and also a dreamer. He undertook, not always with success, many educational, agricultural and technical projects aiming to provide employment and promote opportunities to his less fortunate countrymen. In 1869 Bose’s father went to Burdwan as Assistant Commissioner. Here he opened workshops in carpentry, in metal turning in general metalwork and even a foundry. Bose was very much influenced by his father’s ideals. While speaking at the fiftieth anniversary of the Exhibition and Mela founded by his father at Faridpur Bose said : “A failure ! Yes, but not ignoble nor altogether futile. And through Michael Faraday Heinrich Rudolf Hertz witnessing this struggle, the son learned to look on success or failure as one, and to realize that some defeat may be greater than victory. To me his life has been one of blessing, and daily thanksgiving. Nevertheless everyone had said that he had wrecked his life, which was meant for greater things. Few realize that out of theskeletons of myriad lives have been built vast continents. And it is on the wreck of a life like his, and of many such lives, that will be built the the greater India yet to be. We do not know why it should be so; but we do know that the Earth-Mother is always calling for sacrifice.” Bose’s his theories about the relationship between living and non-living and plant’s response to stimuli were not taken seriously in his time and even today some of his ideas have remained esoteric. However, as D.M. Bose, who succeeded Bose as Director of the ,Bose Institute has pointed out “his model of an electric eye which records with electric signals message received from outside world, his physical model of memory as a mechanism for storing information justified his being considered a precursor of the modern discipline of cybernetics.” It is now recognised that Bose had made very significant contributions to the field of chronobiology and circadian rhythms even before these two technical terms were coined.Bose was the pioneer of experimental science in India. He was an inventor of the first order. He devised many sensitive instruments for his research both in physics and physiology.
In 1869 Bose was sent to Kolkata (then Calcutta), where after spending three months at the Hare School he was admitted in St. Xavier’s College, which was both a secondary school and a college. This institute was founded by Belgian Jesuits in 1860. Here Bose came in contact with Father Eugene Lafont (1837-1908), who played an important role in developing a tradition of modern science in Kolkata. With Lafont’s initiative St. Xavier’s College put a special emphasis on science teaching. In 1875 he established a small astronomical observatory in the College. He was one of those principals who persuaded the Calcutta University to offer an undergraduate course in science. Lafont also gave popular science lectures at the Indian Association for the Cultivation of Science, which was established by Mahendra Lal Sircar (1833-1904) in 1876. In fact, he was the first lecturer of the Association. Bose was very much influenced by Lafont. To quote Patrick Geddes: “All the pupils of Father Lafont, so long Professor of Physics in that College (St. Xavier’s College), recall his teaching and influence as truly educative. His wealth of experiments and vivid clearness of exposition of them, made is class most interesting in the hole college; and his patient skill, his subtlety, as well as brilliance of experimentation, were appreciated by this young student above all. Here was Bose’s first discipline towards that combination of intellectual lucidity with wealth of experimental devise and recourse by which he has all the more fully represented and honoured his old master by surpassing him.
Bhuvaneshwari and Vijikumar
Indian Journal Of Natural Sciences www.tnsroindia.org. © IJONS
Vol.5 / Issue 28/ February 2015 International Bimonthly ISSN: 0976 – 0997
2522
In 1879 Bose passed the BA examination in Physical Science Group of the Clacutta University. At the time of his graduation Bose did not have clear plan for his future career except that he wanted to go to England for higher training. However, his father’s economic situation was far from satisfactory for this venture. His father’sinnovative schemes and investment had mostly failed and as a result he was burdened with debts. There were some projects which were successful but then Bose’s father did not make profit out of them. For example the People’s Bank, the forerunner of the later co-operative societies, started by his father was highly successful. Had Bose’s father kept the shares that he had bought as its founder there would have been no financial difficulty. But he had given away his shares to his poorer friends. Bose decided that his first duty was to earn money and help his father in paying off the debts. Following his father’s example the natural choice was to join the coveted Indian Civil Service. However, his father did not want his son to become a civil servant, which he thought would take his son away from the common people. In fact, his father wanted that his sonshould be helpful to the common man and which could not be done by becoming a civil servant in British India. Finally it was decided that Bose would study medicine in some English University. In realizing this goal Bose faced two difficulties. First as stated above his father’s financial condition was totally inadequate to support such expensive educational stay in England. What is more at that time Bhagaban Chandra was on two years’ medical leave on reduced pay and he was not sure when his health would permit him to resume his duties with its full pay. His second difficulty was his mother’s worry in sending him to unknown western world. In those days the sea-voyage was considered extremely dangerous. And she had lost her second son,aged ten and so she had become highly possessive of her only remaining son. But when considering these factors Bose had decided to settle down in India, and see what he could do best, his mother Banasundari Davi, suddenly decided that his son should go to England as he had originally planned. However, after a year’s study he had to abandon his plan to study medicine because of the recurrence of a fever he had contracted earlier, and which exacerbated, by the odours of the dissecting rooms. In January 1882 Bose left London for Cambridge where he took admission in Christ’s College to study natural sciences. His decision to join the Christ’s College was influenced by the fact that his brother-in-law, Ananda Mohan Bose (1847-1906), had earlier studied there. Ananda Mohan, who took the Mathematics Tripos in 1874, was Cambridge’s first Indian wrangler. Among Bose’s teachers at Cambridge were: Lord Rayleigh, (1842-1919), Michael Foster (1836-1907), Sidney Vines (1849-1934) and Francis Darwin (1848-1925).
In 1884 Bose obtained a Bachelor of Arts with a second class in natural sciences tripos and in the same year he also obtained a Bachelor of Science from the University of London. After coming back to India he joined the Presidency College at Kolkata in 1885. He was the first Indian to be appointed Professor of Physics in the Presidency College. His appointment was strongly opposed by Sir Alfred Croft, then Director of Public Instruction of Bengal and Mr. Charles R. Tawney, Principal of the Presidency College. But Bose finally managed to get the appointment because of the intervention of Lord Ripon, then Viceroy of India. In getting his appointment Bose was helped by Professor Fawcett, the economist and then Postmaster-General of Britain. Fawcett was a friend of Bose’s brother-in-law Ananda Mohan Bose. With Fawcett’s letter of introduction Bose met Lord Ripon at Shimla. In those days, Simla used to be the summer capital of India. Ripon was very nice to Bose and he promised to nominate him for the Imperial Educational Service. But after coming to Kolkata when Bose met Croft he was not at all welcomed. Croft said : “I am usually approached from below, not from above. There is no higherclass appointment at presentavailable in the Imperial Educational Service, I can only offer you a place in the Provincial Service, from which you may be promoted.” Bose did not accept the offer. The Viceroy again wrote to the Government of Bengal asking explanation for the delay in appointing Bose. Finally Croft was forced to appoint Bose. In those days the Britishers thought that Indians were not capable of holding high post in educational service and thus Imperial Educational Service was out of their bound, howsoever qualified might they be. For example P.C. Ray, who returned from England with a PhD degree, could not make it to the Imperial Educational Service. He had to be content with the Provincial Service. Unlike in case of Indian Civil Service, which an Indian could join by passing the prescribed examination, the Imperial Educational Service was accessible only through nomination.
Though Bose, because of Lord Ripon’s personal intervention, was given an appointment in the higher service he was taken on temporary basis with one-half of the pay attached to such an appointment. Bose protested and he asked for
Bhuvaneshwari and Vijikumar
Indian Journal Of Natural Sciences www.tnsroindia.org. © IJONS
Vol.5 / Issue 28/ February 2015 International Bimonthly ISSN: 0976 – 0997
2523
the same salary as an European was entitled to get. When his protest was not entertained he refused to accept his salary. He continued his teaching assignment for three years without any salary. Finally both the Director of Public Instruction and the Principal of the Presidency College fully realised the value of Bose’s skill in teaching and also his lofty character. As a result his appointment was made permanent with retrospective effect. He was given the full salary for the last three years in lumpsum, which he used for paying off his father’s debt.
In 1894 on his thirty-fifth birthday Bose decided to pursue scientific research and not to be confined with teaching assignment alone. There was no laboratory or apparatus or peers. He conducted his researches in a small 24 square foot room, which he was given in the Presidency College. With the help of an untrained tinsmith he devised and constructed new apparatus for his first research on electric radiation. Bose was inspired to study the properties of electric waves after reading Oliver Lodge’s book Heinrich Hertz and His Successors. Bose devised and fabricated a new type of radiator for generating radio waves. He also built a unique and highly sensitive ‘Coherer’ or radio receiver for receiving radio waves. Bose’s coherer was far more compact, efficient and effective than the ones used in Europe. It was Oliver Lodge who had devised an improved version of coherer inveted in 1890 by Eduard Branly (1846-1940) of France. Though Branly invented the coherer but he did not conceive it as a detector, it was Lodge’s contribution. Even the term ‘coherer’ was coined by Lodge. Branly had shown that metal fillings enclosed in glass tubes with loose contacts form an insulator. Though the fillings themselves were good conductors, they would be highly resistant to small voltages. However, in the presence of Hertzian waves their resistance was enormously reduced or in other words they switched to a conducting state and they would remain in that state until shaken or tapped slightly. In the coherer developed by Lodge wires in contact with the fillings placed in a glass tube led out from the end of the tube and were connected in a series with a galvanometer. When there is a radiation, the fillings would switch to a conducting state and a current would be obtained and which will be detected by the galvanometer. Bose’s receiver was a great advance on that of Branly and Lodge. In earlier versions the sensitivity varied and at times they behaved in an erratic manner. Bose replaced the irregular fillings by fine wire spiral springs. They were fixed in ebonite and under control of a spring. Using his improved equipment Bose demonstrated various properties of radio waves like reflection, absorption, interference, double reflection and polarisaton. He also demonstrated a new type of radio waves as small as 1 centimeter to 5 millimeters. Such waves are now called microwaves, and are used in radars, ground telecommunication, satellite communication, remote sensing and microwave ovens. In May 1895, he read his first research paper before the Asiatic Society of Bengal ‘On the polarisation of Electric Rays by Double Reflecting Crystals”. In the same yearone of his papers titled “On the Determination of the Indices of Refraction of Sulphur for the Electric Ray” was communicated to the Royal Society of London by Lord Rayleigh. The paper was read before the RoyalSociety in December 1895 and it was accepted for publication in the Society’s proceedings in January 1896. Bose’s three articles were published in The Electrician of Friaday 27 December. These were probably the first papers to be published by an Indian in a western scientific periodical. It may be noted that in those days, The Electrician was amongst the most prominent periodicals devoted to electrical matters. In spite of the most adverse circumstances Bose succeeded just by his seer dedication and ingenuity. The Royal Society of London not only accepted his paper for publication, also offered him financial help from their Parliamentary grant so that Bose could continue his researches. The University of London awarded him Doctor of Science ( DSc) without any examination. Lord Kelvin congraturalted Bose by stating that he was “literally filled with wonder and admiration…for his success in the difficult and novel experimental problem”. Marie Alfred Cornu (1841-1902), the former President of the French Academy of Sciences, wrote : “the very first results of your researches testify to your power of furthering the progress of science. For my own part, I hope to take full advantage of the perfection to which you have brought your apparatus, for the benefit of the Ecole Polytechnique and for the sake of further researches I wish to complete.” Bose’s sudden success in his research and its appreciation by leading scientists in England and other western countries had their impact in India. The attention of the Lieutenant-Governor of Bengal, Sir William Mackenzie, was drawn to Bose’s work and he tried to improve the conditions under which Bose was working. A new post with higher emoluments, with more initiative and with reasonable leisure for research’ was created for Bose. However, this appointment was cancelled because of Bose’s refusal to support the official line in a meeting of the Calcutta University, of which he was a Fellow. After failing to overcome the opposition of the Education Department
Bhuvaneshwari and Vijikumar
Indian Journal Of Natural Sciences www.tnsroindia.org. © IJONS
Vol.5 / Issue 28/ February 2015 International Bimonthly ISSN: 0976 – 0997
2524
in giving sanction to the new appointment the Lieutenant Governor decided to reimburse the expenditure incurred by Bose in carrying out his researches. However, Bose refused to accept the grant for his past work. But he accepted the Government’s annual grant of Rs. 2500/ - (£166) for his future research work at the Presidency College. At the initiation taken by William Macknzie, the Education Department agreed to send Bose on deputation to England for six months. And he sailed for England on 24th July 1896. He gave a lecture-cumdemonstation on his new findings on radio waves at the meeting of the British Association for Advancement of Science at Liverpool. Among those present were Sir James Johnson Thomson (1856-1940), Oliver Lodge and Lord Kelvin. It was Bose’s first interaction with the English scientists after his success in research. The assembled scientists were highly impressed by Bose’s presentation. Lord Kelvin climbed upto the ladies’ gallery to congratulate Mrs. Abala Bose on her husband’s brilliant work. He was also invited by the Royal Institution to deliver a Friday Evening Discourse. It was a great honour. TheGovernment of Idia extended his deputation for another three months for the preparation of the lecture. He delivered his Friday Evening Discourse on 19th July 1897. The title of the lecture was ‘On the polarization of Electric Rays”. More than five hundred people including Oliver Lodge, James John Thomson and Lord Kelvin had assembled to hear Bose. The lecture was not only praised but it was considered valuable enough for publication in the Transactions of the Royal Society. Bose’s fame spread quickly to the neighbouring countries, France and Germany. He was invited by Physical Society of Paris and leading physicists of Berlin to explain his results.
Bose’s peers in England were highly impressed by his achievements and they wanted to help improve the conditions under which Bose was working. He had no proper laboratory for carrying out his research work. Lord Kelvin wrote to Lord George Hamilton, then Secretary of State: “It would be conducive to the credit of India and the scientific education in Calcutta, if a well-eqipped Physical Laboratory is added to the resources of the University of Calcutta in connection with the Professorship held by Dr. Bose.” Lord Kelvin’s letter was followed by a letter jointly signed by a number of eminent scientists including Lord Joseph Lister (1827-1912), then President of the Royal Society, Professor Fitzerland, Sir William Ramsay, Sir George Gabriel Stokes (1819-1902) and many others. This communiqué stated: “to the great importance which we attach to the establishment in the Indian Empire of a Central Laboratory for advanced teaching and research in connection with the Presidency College, Calcutta. We believe that it would be not only beneficial in respect of higher education, but also that it would largely promote the material interest of the country; and we venture to urge on you the desirability of establishing in India a Physical Laboratory worthy of that great Empire.” The Secretary of State not only sent the letter to the Government of India but he also endorsed the proposal by stating that `being of opinion that the question of establishing an institution of the kind mentioned is deserving of consideration by Your Excellency in Council.’ Though the then Viceroy Lord Elgin informed Bose that the government would beinterested in his project but the concerned government department finally decided that though the project was important but it might be postponed for future. The foundation of such a laboratory was laid in 1914, just one year before Bose’s retirement.
Bose was very much against in patenting his invention. He had resolved not to seek any personal advantage from his invention. He pursued science to only for itself but for its application to the benefit of mankind. In his Friday Evening Discourse at the Royal Institution, London, he made public his construction of the coherer. Thus The Electric Engineer expressed ‘surprise that no secret was at any time made as to its construction, so that it has been open to all the world to adopt it for practical and possibly moneymaking purposes.” In 1901, one of the great manufacturers of wireless apparatus, approached Bose for signing a remunerative agreement as to his new type of receiver. However, Bose declined the offer. One of his American friends, Sara Bull (also known as Mrs. Ole Bull), was able to persuade Bose to file a patent application for his galena receiver. The application was filed on 30 September 1901 and it was granted on 29 March 1904 (US patent No. 755,840). However, Bose refused to accept his rights and allowed to lapse the patent.
Fascinated by the peculiar behavior of his electric-wave receiver, which seemed to show signs of “fatigue” after prolonged use but could be `revived’ to its original sensitivity after some rest, Bose took up a systematic study to understand this phenomenon. He started believing that metals too had “feelings”. From metals he turned his
Bhuvaneshwari and Vijikumar
Indian Journal Of Natural Sciences www.tnsroindia.org. © IJONS
Vol.5 / Issue 28/ February 2015 International Bimonthly ISSN: 0976 – 0997
2525
attention to plants and he found the latter responding more favorably to his experiment than the former. Bose thought that he had hit upon the underlying unity in the natural world between living and non-living. And he fully devoted to this line of investigation. In 1900 Bose read his paper “On the Similarity Responses of Inorganic and Living Matter’ before the Paris International Congress of Physicists. It was for the first time in science one compared and parallelised the responses to the excitation of living tissues with those of inorganic matter. Bose’s paper was considered as one of the most important ones received by the Congress. The paper was published in the Proceedings of the Congress. Many in India thought that Bose had given a fresh scientific impetuous to the age-old wisdom of the East which believed in the basic unity of all life. Swami Vivekanada (1863- 1902), who was then in Paris, went to hear Bose at the Congress. While describing his impression of the Congress Swami Vivekanand wrote : “Here in Paris have assembled the great of every land, each to proclaim the glory of his country. Savants will be acclaimed here; and its reverberation will glorify their countries. Among these peerless men gathered from all parts of the world, where is thy representative, O thou the country of my birth ? Out of this vast assembly a young man stood for thee, one of thy heroic sons; whose words here electrified the audience, and will thrill all his countrymen.” Tagore sent his appreciation in the form of a poem.
At the Physical Section of the British Association’s meeting at Bradford, England in September 1900 Bose read a similar paper. Here also his ideas were widely appreciated by the physicists. After the Bradford meeting Bose fell ill and he was confined for two months. On recovery, he was invited by his old friends and teachers. Lord Rayleigh and Sir James, Dewar (1842-1923) to work at the Davy-Faraday Laboratory of the Royal Institution. Bose delivered his second Friday Evening Discourse at the Royal Institution on May 10, 1901. This time on his research on the responses to living and non-living. The lecture was highly appreciated. Bose’s ideas were first opposed by John Burdon Sanderson and Augustus Waller, the two eminent plant physiologists on June 6, 1901 when Bose read his paper at the Royal Society. Following their criticism the Royal Society did not publish this paper. Bose decided to prolong his stay at London to conduct experiments to prove his theory. Somehow he managed to get his deputation extended. After his two year stay Bose decided to come back India though he was offered a job at a British University.
After coming back to Kolkata Bose continued his work on the responses living and non-living and the physiological properties of plant tissues and the similarity of their behaviour with that of animal tissues. He presented the results of his investigation in the form of monographs.Bose demonstrated that plant tissues under different kinds of stimuli like mechanical, application of heat, electric shock, chemicals and drugs, produce electric response similar to that produced by animal tissues. He also tried to demonstrate that similar electric response to stimulation could be noticed in certain inorganic systems. For his investigations Bose invented several novel and highly sensitive instruments. Among these the most important one was the Crescograph -an instrument for measuring the growth ofa plant. It could record a growth as small as 1/100,000 inch per second. Bose’s experiments on plants were mostly performed on Minosa pudica and Desmondium gyrans (Indian Telegraph plant). In all his investigations Bose attempted to offer original interpretations. He attempted to devise models whichwere illustrative of physical basis of memory. His findings subsequently influenced subjects like physiology, chronobiology, cybernetics, medicine and agriculture .
Bose retired from educational service as Senior Professor of Physics in 1915. In fact he was to retire in 1913, on the completion of his fifty-fifth year, as per Government rules of those days. However, the Government of Bengal, in recognition of his service to the Presidency College and of his scientific achievements, extended his period of service for two years. After his retirement the Government also made him Professor Emeritus on full pay instead of pension. And this way he remained permanently connected to the Presidency College. Even after his retirement his researches were not interrupted. He continued his plant physiological investigation in a small laboratory set up in his own house. In the meantime he was also working towards the establishment of a research institute. The foundation ceremony of this institute took place on 23rd November 1917.
Bhuvaneshwari and Vijikumar
Indian Journal Of Natural Sciences www.tnsroindia.org. © IJONS
Vol.5 / Issue 28/ February 2015 International Bimonthly ISSN: 0976 – 0997
2526
The lectures given here will not be mere repetitions of second-hand knowledge. They will announce, to an audience of some fifteen hundred people, the discoveries made here, which will be demonstrated for the first time before the public. We shall thus maintain continuously the highest aim of a great seat of learning by taking active part in the advancement and diffusion of knowledge. Through the regular publication of the Transactions of the Institute, these Indian contributions will reach the whole world. The discoveries made will thus become public property. Besides the regular staff there will be selected number of scholars, who by their work have shown special aptitude, and who would devote their whole life to the pursuit of research.
General view of the Resonant Recorder
Bose’s inaugural speech produced a profound impression both in India and abroad. One of London’s leading newspapers, The Times wrote : “To bringing about the scientific renaissance (In India) Sir Jagadis had influentially contributed. Indians are justly proud of the possession of a few men who have gained world-wide reputation in their particular fields of activity, and this pride reacts strongly on public opinion. At the Research Institute a group Indian post-graduate students devote their lives to research. The published Transactions of the Institute show that under the leadership of this eminent Bengali, Indianresearch is making substantial contribution to scientific knowledge, that in this field there is no fundamental difference between the Western and the Eastern mind, as was assumed when Sir Jagadis began his work”. The Athenaeum wrote : “The foundation of an Institute for research in pure science is an event in the history of India. The publication of the Transactions, the first fruits of its activity, shows that it is an event also in the history of science.”
In 1903 Bose was honoured with Commander of the Order of the Indian Empire (CIE) at Delhi by the British Government. He received in 1912 the Commander of the Star of India (CSI) at the Coronation of the British Emperor. He was knighted by the British Government in 1916. Bose was elected a fellow of the Royal Society (FRS) of London in 1928. Bose died on 23 November 1937 at Giridih in Bihar. We would like to end this article by quoting Geddes : “The life-story of Jagadis Bose is worthy of close and ardent consideration by all young Indians whose purpose is shaping itself towards the service of science or other high cause of the intelligence or social spirit. It is possible that looking upon the triumph of the end and knowing nothing of the long uphill road, the slow costly attainment of ends, they may think that a fine laboratory or other material endowment the antecedent condition of successful achievement in intellectual creation. The truth indeed, is far otherwise. The countless obstacles which had to be surmounted only called forth in Bose all the endurance and all the effort which are latent in manly natures, welding them to the fullest strength of character and intensity of thought by which alone a great life-task can be accomplished. In contemplating the great career of his fellow countrymen, the young India will be stimulated to put brain and hand to fine tasks, nothing fearing. Thus will he be inspired not only to recover the noble intellectual tradition of the Indian past, but to restate these traditions in modern times and find the greatest challenge for mind and soul in achieving their vital relation with the coming age.”
REFERENCES 1. Salwi, Dilip M., Jagadish Chandra Bose, The First Modern Scientist, Rupa & Co. New Delhi –2002 2. Basu, S.N., Jagadish Chandra Bose, National Book Trust, New Delhi, 1970 3. Sen D. The Indian Science Pioneer Jagadish Chandra (in Bengali), Indo-GDR-Friendship Society, Calcutta 1984. 4. Bose, D.M., Jagadish Chandra Bose in Biographical Memoirs of Fellows of the National Institute of Sciences of
India, Vol. 1 National Institute of Science of India, New Delhi , 1966.
Source by : Vigyan prasar
Bhuvaneshwari and Vijikumar
Indian Journal Of Natural Sciences www.tnsroindia.org. © IJONS
Vol.5 / Issue 28/ February 2015 International Bimonthly ISSN: 0976 – 0997
2527
Comparative Study of the Main Interpretive Principles of Contracts in Civil and Commercial Cases Mohammad Hadi Mirzaei1* and Mehdi Niknafs2
1Department of Private Law, Science and Research Branch, Islamic Azad University, Bushehr, Iran. 2Department of Law, Bushehr Branch, Islamic Azad University, Bushehr, Iran. Received: 22 Oct 2014 Revised: 18 Nov 2014 Accepted: 18 Dec 2014 *Address for correspondence Mohammad Hadi Mirzaei Department of Private Law, Science and Research Branch, Islamic Azad University, Bushehr, Iran. E.mail: [email protected]
This is an Open Access Journal / article distributed under the terms of the Creative Commons Attribution License (CC BY-NC-ND 3.0) which permits unrestricted use, distribution, and reproduction in any medium, provided the original work is properly cited. All rights reserved. Nowadays, due to increased transactions and contracts that are signed for different purposes, ambiguous and contradictory points are arised that leave some difficulties for the implementation of the contract. Inevitably, one should take action to implement the contract and to prevent its suspension. In this regard, a rule should be interpreted; but there is not a certain agreement about the basic principles of interpretation. Some believe that the best way of interpretation is reference to the parties’ will because the most proper interpretation is available only for the writer of a text. Another criterion for interpretation of texts is custom, which is the source of many references by legislators in trial cases. Moreover, some legal principles, which are accepted and confirmed by legal systems, can be a key to solve problems of contracts. One of the common principles is the principle of good faith in contracts. Although the Iranian legislators have not accepted frankly this principle, it has been admitted and confirmed in different provisions. Sometimes, the legislators have imposed some sanctions for disregarding it. The principle of contract interpretation in the light of the whole contractual context is another is another criterion. In this manner, interpretation should be carried out in compliance with all sides, conditions and manner of its conclusion; all aspects of contract should be included to enable us to present a proper interpretation. This study seeks to examine each of these principles of contracts. This study is a library base research that employs books, periodicals, articles, databases, and internet networks to collect data. Key words: principles, interpretations, civil contracts, commercial contracts, contract.
ABSTRACT
RESEARCH ARTICLE
Indian Journal Of Natural Sciences www.tnsroindia.org. © IJONS
Vol.5 / Issue 28/ February 2015 International Bimonthly ISSN: 0976 – 0997
2528
INTRODUCTION Right of obligation, particularly contracts, is among the most important issues in private law. In order to remove barriers in the implementation of contracts, contract provisions m=should be clear and straightforward and the parties of contract should not have any conflict and disagreement about the credit conditions, contract terms, and procedures for implementing. Interpretation is one of the most important issues of all contracts. The prerequisite for a judicial contract is interpretation. Interpretation clarifies the aim and effects of a contract. Therefore, a contract should be interpreted to enable us to extract related issues and the arised contradictions. In general, two types of interpretive principles are outlined in the law. In the first category, the principles are based on the principle of the sovereignty of will. In this regard, a contract will be the product of consensus. What constitute the essence of a contract are the parties’ incentives and goals. Therefore, a contract should be interpreted in such a way to meet the parties’ incentives. Thus, the main purpose of contract interpretation is parties’ common intent and meaning of the common intention of the parties is intending their true intention. When the common intention is clear and discoverable, the main focus in the interpretation of the contract should be this common intention. Although the actual common intention of the parties is the most important point in interpreting a contract, it is not always possible to achieve the common intention. Sometimes, both sides, and one of them, misunderstood the words of other party. Here, it is not possible to recognize the true common mistake because either side of the contract intends an issue in contradiction with the intention of other part. On the other hand, sometimes, while all provisions are clear and all documents imply the consensus of parties, there is only apparently one intention. This arises where one party is in superior condition than the other party. One of the parties, in terms of economic status and power, imposed the conditions on the other side that might disturb the balance of the contract. In this case, that is not to say all provisions of the contract are the subject of common intention because the weak party has no opportunity to reject the contract. Obviously, sometimes we face a situation where the contract involves non-observance of common intention or presence of undetectable provisions. However, the contract cannot be easily nullified because no contract shall be considered correct in this case. Here, the necessity of ensuring principles for regularity of transactions is emerged. This new principles should consider both common intention and observance of economic current. These regulations try to lead contracts to a path to keep social order while it seems that they are questioning the principle of parties’ will in a contract. In present juridical situation, the principle of parties’ will is not an absolute condition, but it is limited to ensure the social order. One’s will is free as far as not to oppose public order, good morals, and mandatory rules. Rather than determining the means to determine the rights and duties of parties to a legal relationship, contract is a social creature influencing society through its effects. It is clear that each framework requires specific tools. One cannot employ the means of civil rights to regulate business relationships. Hence, we have witnessed the separation of civil law and commercial rules; commercial law has some rules beyond civil law. Consequently, researchers should try to establish new specific interpretive tools in commercial law to be used in the interpretation of commercial contracts. Historical Background A review of the available literature enables researchers to study and criticize other works and provide theoretical statements related to the research topic. It helps them to uncover deficiencies and flaws as well as scientific theories and presents defensible rationale for the development of research and conducting research. The studies that have been conducted on the principles of contract interpretation are as follows: - An article titled “Comparative study of the concept of good faith in the conclusion, interpretation and enforcement of contracts” by Yahya Ibrahimi in 2009. - An article titled “The concept of truth and its role in the interpretation of contracts” by Dr. Muhammad Jafari Fesharaki and Narges Khaleghi Pour in 2011.
Mohammad Hadi Mirzaei and Mehdi Niknafs
Indian Journal Of Natural Sciences www.tnsroindia.org. © IJONS
Vol.5 / Issue 28/ February 2015 International Bimonthly ISSN: 0976 – 0997
2529
- An article titled “Interpretation principles of Contracts in Civil Rights” by Muhammad Hashem Abadi in 2008. - A thesis titled “Principles of contract interpretation, in the Convention on the International Sale of Goods and comparing them with the rights of” by Hooman Yazdani in 2000 at Faculty of Law and Political Science at Tehran University. - A Proceedings titled “A Step towards Justice” by Dr. Katouzian in 2008. - An article titled “A comparative study of the accuracy principle in the interpretation of contracts” by Seyed Muhammad Sadeq Tabatabaee and Hamid Araee in 2011 printed in Mufid journal. These studies have studied some principles; in some cases, they have studied the principles in a specific field. Therefore, no study has still studied the principles in both civil and commercial rights together. The position of the interpretive principles is not clear in each of the fields. Aims This article seeks to examine the principles of interpretation in civil and commercial rights. In addition, it to evaluate the similarities and differences of the principles in each field. Moreover, it takes into account the application of these principles in these two fields.
RESEARCH METHOD This is a descriptive-analytical research. In terms of objectives, it is a theoretical study. Data and materials are gathered through a library base study with inductive approach build on previous knowledge and intellectual creativity. By taking advantages of logical analysis, new theoretical statements are produced and offered. Thus, data are documents, works and writings, etc that help researchers to present new logical theory after rational and logical analysis. The documents used in this method are: 1) Books: a valuable and centralized source of teachings and human knowledge. 2) Articles that contain research results, new investigations, and scientific achievements. 3) Official magazines including the official newspapers. This library base study has been conducted through note taking. The contents are stated as direct and indirect quotations and as a paraphrase of quotations. It is a qualitative research without any statistical aspects; thus, it is not possible to determine the statistical community. Since this is not a qualitative and statistical research, non-statistical criteria should be employed to analyze the data. In this regard, qualitative analysis should be used. In this manner, the documents, writings and works are proof, the truth is discovered, and the theory is presented by collecting, sorting, evaluating, and comparing them. Tools for data analysis in this case are sense, logic, thinking and reasoning. Concepts Literally, interpretation means uncovering and creating; interpreting a phrase means to elucidate the meaning of an ambiguous expression (Safaie, 2000). Interpretation of a contract refers to the recognition of a contract provisions aiming to clarify contents and terms (Katouzian, 2001). In this regard, contract interpretation means clarification of ambiguities and uncovering the content, terms, and objectives of contract parties. in other expression, contract interpretation is defined as “recognizing essence, provisions, parties of a contract according to the will of those who has made the conclusion of contract and regulations of law” (Shahidi, 2006). In a word, contract is applied to an agreement by two or more people in a treaty, a convention, a political treaty, and a political pact (Moein Persian Glossary). In contemporary Persian, contract is referred to agreements. In other literal sense, it includes bond contracts and owned contracts, financial and non-financial contracts, and gratuitous and non-gratuitous contracts (Jafari Langroodi, 2001). Iran civil code has not offered a specific definition for contract. It is
Mohammad Hadi Mirzaei and Mehdi Niknafs
Indian Journal Of Natural Sciences www.tnsroindia.org. © IJONS
Vol.5 / Issue 28/ February 2015 International Bimonthly ISSN: 0976 – 0997
2530
referred to the word in Article 10 to refer to its mandatory aspect. According to Article 138, one can say that it is Agreement between two or more wills agreed to perform an act. However, all contracts regulated by ordinary people can be included under the title of civil laws, which are adopted to form the relationships between individuals in a society. Based on different fields of study law, different meanings can be used for this word. In the logic of law, interpretation means finding the closest and best definition for a legal rule. The interpretation in this field is: an attempt to understand signified of legal entities (Qashqai, 2003). In legal dictionary, interpretation means the art or process of uncovering and recognizing definition of a rule, wills, contract, or other document. To say in other words, uncovering and presentation of proper meaning of a point or sign explaining an idea or concept. The concept of interpretation of contracts consists of two field; first, the concept of interpretation and its including area is involved in finding definition of words, second, parties’ intention, custom, and behaviors should be considered in the legal effects of the words. Contract amendment means adoption of new solutions in the course of implementing the contract due to changes of circumstances and external conditions with respect to the economic balance. Sometimes, circumstances of implementation of contracts change so that occurrence of these conditions has been ruled out in the conclusion of the contract. In this case, contract should be amended (Qashqai, 2003). Completion of a contract reduces its interpretative scope. Freedom of parties to choose the terms of the contract and determining appropriate solutions have no contradiction with determining details of contract. In fact, they have left secondary and detail issues for legal system to find proper solutions by disregarding details and minor points. For instance, they articulate selling contract, but they do not say anything about its details and subjects. Here, law is completing parties’ will and offers the proper solution. Some scholars have differentiated between interpretation of contracts and proving contracts. In this manner, they consider proving contract as verification of an occurrence and contract conditions that has external and material dimensions. They use interpretation for cases whose content and truth have been approved previously while magistrate is trying to investigate the situation with respect to parties’ will (Shahidi, 2006). Sometimes, an interpreter may expand the scope and extension exaggeratedly and he may enter his speculation. In this type of interpretation, new and unreal meanings are attributed to a word. The reason for this behavior is the presence of external unaccepted factors such as considering a role for custom when parties’ will imply another action, or when the interpretation of a contract has significant difference with the predominance of social interest over parties’ will and attempt to find a new relevant meaning in order to change the contract and its terms (Shahidi, Mahdi, 2006). Schools of Contract Interpretation With reference to the law schools, one finds that discussion about expedient schools results from the objectives of science of law. Attention to individual rights in this school causes a connection between personal authenticity school and natural legal school. In fact, natural legal school, which sees the science of law with an idealistic approach, has been established to oppose the oppression of rulers in history; it is a means of defense against the oppressions. Hence, the school that arises from the bases of rights is directly related to the school of individualism that results from the objectives of rights. According to the followers of the school of literal interpretation, law is the only legal source and the aim of interpretation is discovering and verifying legislators’ will from the appearance. It seeks to find general principles of law (Katouzian, 2004). For instance, in its historical interpretation, this school takes into account many situations like study historical background of adoption of a rule including both the foundations and arguments at time of approval
Mohammad Hadi Mirzaei and Mehdi Niknafs
Indian Journal Of Natural Sciences www.tnsroindia.org. © IJONS
Vol.5 / Issue 28/ February 2015 International Bimonthly ISSN: 0976 – 0997
2531
in assembly to clarify all aspects. In terms of interpreting contracts to solve problems, it utilizes the investigation of preparatory activities and the circumstances of the conclusion of the contract (Sahebi, 2010). In free scientific research school, the social needs and expectations are considered more than legal texts. Criticizing literal approach, the followers of this school argue that respect to the will of legislators and observance of legal texts is pretense and hypocrisy. They claim that no rule is able to determine a specific sentence for all social issues and predict all future happenings. We should agree that the legislators state no comment for many social relations. According to Zheni, “when an interpreter claims that he has used only text of law for his interpretation, the interpreter either deceives himself openly or is incapable to fulfill his requirements” (Katouzian, Naser, 2004). With concentrating on the supremacy of social interests, the followers of this method believe that social factors like custom, habit, fairness and its impact on contracts should not be neglected. Parties’ will should not limit people in contract interpretation; but social and economic interests and expediency should be considered in this regard. This approach interprets contracts a social phenomenon beyond the parties’ will according to social expediency. However, in this method of interpretation, contract may be regarded as a tool to maintain social expediency. It may find an identity beyond the parties’ will and continues its social life (Almasi, 1999). Interpretation Place and Scope On the one hand, interpretation is related to the phase of development and conclusion of a contract. On the other hand, it relates to the phase of enforcement and evaluation. The transactional relationship will be uncovered with the interpretation of the relationships between the various parties. In addition, if one decides to determine the scope of contract effects in enforcement phase and ascertain the obligations of contract parties, he should inevitably interpret and explain contract provisions because there is no contradiction between the accuracy of a legal activity and its feasibility. In many cases, a contract is concluded correctly, but the enforcement phase faces many problems due to presence of unclear expressions and contradictory points. It seems that these two theories can be integrated; contract interpretation seems helpful in both research and genesis phase and enforcement and evaluation phase. Interpretation scope should be determined in two scopes: firs, in terms of the interpreted wills, second, in terms of expression clarity and ambiguity. Rules Governing the Conclusion of Contracts According to Article 968 of Iran Civil Code, “Obligation arising out of contracts subject to the laws of the place of the performance of the transaction.” As it is seen, Iran Civil Cod has determined the rules governing contract obligations; but it is silent about rules governing contract conclusion and the developmental conditions of the contract. In this case, based on the principle contained in Article 5 of the Civil Code (law of the land), Iran law is competent unless other terms are stated in the contract. In other words, Iran law judge about a contract because Iran is the rule of contract conclusion (Sahebi, Mahdi, 2010). Another point in terms of governing rules in the place of conclusion relates to the legacy of transaction. Of course, it should be noted that Iran law (as the land of contract conclusion) is the source of a contract’s legacy. Contract Custom Rarely may one find a contract with all needed terms; for example, many contracts contains only contract foundations and do not talk about other conditions. The base of this behavior is presence of some customs in transactions. Therefore, it is necessary to identify a valid custom inspiring contract provisions and allows the parties to mention all conventional terms. On the other hand, ‘conventional’ understanding, which supports contracts and identifies their legal competency, requires the recognition of custom, its types, and its reference terms (Saljooqi, 1995). Common moral, religious, social, and material requirements of human beings are the source of emergence of some
Mohammad Hadi Mirzaei and Mehdi Niknafs
Indian Journal Of Natural Sciences www.tnsroindia.org. © IJONS
Vol.5 / Issue 28/ February 2015 International Bimonthly ISSN: 0976 – 0997
2532
activities (Afandi, 2002). Major characteristic of contractual customs is their prevalence, frequency, and voluntary aspects (Jafari Langroodi, 2003). Custom can be categorized according to many criteria; each custom is included in a specific social and geographical scope. According to the scope of its inclusion, it is divided to commonsense and certain customary. In terms of conceptual identification, custom follows two steps. First, it finds the literal meaning of a word; then, it finds the external instances. Contradiction of custom can be predicted as follows: A) Contradiction of common sense with certain customs. B) Contradiction of two common senses. C) Contradiction of two certain customs
Many scholars have argued the priority of customary interpretation and legal interpretation. Some claim that if the debate is about expository rules, custom is prior (Safaee, 2004) because according to civil laws, custom is considered as implicit condition. On the other hand, enforcement of expository rules in contracts is based on imaginary will, and implied will is prior to imaginary will. Terms of the transactions can be divided into two categories: magisterial rules and complementary rules or interpretation (Katouzian, 2005). Interpretive Contract Principles The principle of will sovereignty is one of the rules emerged in the science of law, and generally in all social and philosophical sciences, after the Renaissance. According to this principle that is in fact a resistance against convention rules of Rome about the limitation of contracts to some certain agreements like selling, rental, agency and some objective contracts such as deposit, loan, and donation. Parties can make any conclusion based on their own will (Katouzian, 2005).In general terms, the followers of free will, the libertarians, are categorized in two groups. Some of them believe in individualism; they steps in the ways far than the real meaning of the word and ascertains little limitations for it; they argue that limitations of free will should be stated in the text of the law otherwise it has no limitations. The proponents of individualism, in general sense, allow limitations of public order and good morality only by stipulation of law. In brief, barriers of free will are law, public order, and good morality (Almasi, 1999). Other limitations can be introduced to free will, which can be attributed to parties’ will; for instance, parties’ ideas at the phase of contract conclusion and free will limitations at the phase of evaluating effects and terms of contracts. As long as parties intention is not limited by one of the above barriers, or when the parties are not silent on the cases, interpretation of contract out of their intention is contrary to law (Qashqaee, 1999). Some jurists believe that will formulate a contract regulated at an exterior space (Katouzian, 1995).When a contract does not contain an explicit condition for selection of governing rule, it is accepted that the rules of the related country, which is most related to the contract, govern the provisions of contract. Nowadays, other factors such as the place of contract conclusion or the place of enforcement, has no influence in determination of law governing the contract. The discussions about free will and its contradictory aspects with laws have been emerged for the first time in sixteenth century by Charles Dumoulin. It has been criticized both practically and theoretically (Jafari Fesharaki and Khaleqi Pour, 2011). Although the written and compiled law is respectful in Iran and they the source of all rights, custom has significant roles in the structure of legal rules. ‘Reference to conventions’ has been suggested in many cases by Iran law. The legislators have stipulated ‘reference to conventions’ in many trials (Soltan Ahmadi, 2010). Literally, custom is a well-known and popular affair among the people, conventions (Moein Persian Glossary), recognition and identification of a favorable affair. It is defined by both jurisprudence and law.The word ‘habit’ has been used in the sense of tradition, continuity, and mood. In addition, it is derived in Persian from ‘return’ that implies repetition so that it is more achievable in the next times (Jabar Golbaghi Masoleh, 1999). The plural of habit is “habits” that implies custom. In a general definition, one can say that certain acquired susceptibility, movement issuance, and certain effects. Many debates have been raised in terms of relationship between custom and habits. Some believe that their relationships
Mohammad Hadi Mirzaei and Mehdi Niknafs
Indian Journal Of Natural Sciences www.tnsroindia.org. © IJONS
Vol.5 / Issue 28/ February 2015 International Bimonthly ISSN: 0976 – 0997
2533
are specific absolute and public absolute. They argue that all customs are habit; but not all habits are customs. One can say habit includes custom (Katouzian, 2002). Although there are disagreements about some terms like establishment and repetition. The existence of these two terms is not a sign of two contradictory opposite points. The quality of custom in a community depends on the progress of society and the knowledge of society and its members. Human society has always modified and changed this type of conventional behaviors in the process of its evolution; it has replaced old customs with new ones. Therefore, it takes step in the way of creating new and efficient types of social relationship. The same as other phenomena and social events, custom changes with the varieties of time and place; it is manifested in specific shapes and forms in different times and places (Afandi, 2002). Considering some imperfections for custom, some scholars try to ignore it or limit its usage to some specific cases. These imperfections have never stopped the application of custom in jurisprudence and law; all attempts to remove custom from sources of knowledge have failed. The most important reasons presented by the scholars are as follows (Soltan Ahmadi, 1987). In all legal fields, scholars of law and jurists have discussed legal topics from different aspects. They have analyzed strengths and weaknesses, and ambiguities of the topic. Their ideas can be used as a legal source. One principle that is considered as the base of parties’ will is good faith. In terms of imposition of compensation or toll, an important issue is the differences between persons in good faith and bad faith (Ansari, 2009). Although god faith has not been predicted explicitly in Iran Code as a rule, one should not regard as its contradiction with religious doctrines. In the same manner, some scholars attribute ‘option of fraud’ and ‘option of defect’ to implied condition of objects’ relative balance or they interpret the health of selling object as a manifestation of parties’ good faith. In this regard, good faith requires that the parties to the contract provide healthy products. Acquiring benefits are allowable to the extent that it would not b a fraud. Lack of attention to the requirements of being honest, and observance of honest in contracts is an element for sentencing the secondary effect of free will, the right of nullity and invalidation, and criminal or civil action against deceiver (Alizadeh, 2004). Fairness and justice are not only the base of good faith but also the base of all human behaviors and performances. On this basis, Shiite and Iran jurisprudence claim that insists on the necessity of fairness and justice to establish balance between to objects of sale and observance of trade justice. Good faith is applicable in all areas of law including marriage contracts, transactions, documents, and other evidences of debates. A wide range of different functions can be imagined for good faith. Another principle of interpretation is the unity of contract components principles. According to this principle, all elements and terms of a contract should be considered in the interpretation of contract. A correct interpretation does not analyze a specific condition or term of a contract separately and independent of other components of the contract. The interpreter clarifies the ambiguities with respect to all terms included in the contract, its background and instances, and based on this principle (Qashqaee, 1999).
CONCLUSION The first step in the interpretation of contracts is paying attention to contract expressions as a method to uncover parties’ will because one should presuppose that contract parties have stated their common sense and real intention in the forms of contract terms and expressions. If it turns out that parties’ real intention is something rather than contract terms, or it is proved that the contract is nominal, the terms should be disregarded and judgments should be carried out based on real intentions. When terms of the contract are ambiguous, (each party interprets the contract different from other party or the contract is imperfect), one should refers to custom to find the sentence of problem. This has been approved many times by legal texts. Iran law has not considered good faith as an independent source for contract interpretation; but manifestation of good faith are observed in supplementary rules and conventions because legislators has selected all instances of
Mohammad Hadi Mirzaei and Mehdi Niknafs
Indian Journal Of Natural Sciences www.tnsroindia.org. © IJONS
Vol.5 / Issue 28/ February 2015 International Bimonthly ISSN: 0976 – 0997
2534
fairness and justice as supplementary rules. A normal human being has fairness and good faith. Consequently, according to Iran law, a judge cannot decide about a contract based on good faith. Thus, he cannot impose his personal knowledge and ideas about justice to contract parties. Nevertheless, he can acquire the same conclusion indirectly by custom, habits, and conventions; in this regard, he observes requirements of justice.The next principle is interpretation in the light of the entire contract. It is accepted by all scholars because a judge interprets a term by taking into account the entire text, related conditions and circumstances. With all these lines, one can say that the will of the parties is a priority in applying all the principles and norms of interpretation of contracts.
REFERENCES 1.Afandi M.A. (2002). A collection of Ibn Abedin’s Treaties. Vol. 2. 2.Almasi N.A. (1999). The conflict of laws. Jungle Publications. 3.Alizadeh M. (2004). Principles of good faith and fair dealing, Journal of Theology and Law, No. 7-14. 4.Ansari A. (2009). Good faith in contracts. Jungle Publications, first edition. 5.Golbaghi J., and Masooleh S.A. (1999). An introduction to custom. Islamic Propagation Office of Qom Seminary, First Edition. 6.Hashem Abadi M. (2008). Principles of contract interpretation in civil rights. Journal of Razavi Publications. Ibrahimi M. (2009). Journal of International Law, No. 41. 7.Jafari Fesharaki., and Khaleqi Pour. (2011). Quarterly of research in Islamic law and jurisprudence. 8.Jafari Langroodi M.J. (2001). Law terminology. Amjad publications. 9.Jafari Langroodi M.J. (2003). Law glossary. 10.Katouzian N. (1995). Civil Rights Foundation course. Publishing press, third edition. 11.Katouzian N. (2001). General rules for contracts. Volume 3. Publishing press, third edition. Page 7. 12.Katouzian N. (2002). General rules for contracts. Volume 3. 13.Katouzian N. (2004).General rules for contracts. Volume 3. Third edition Mizan publications. 14.Katouzian N. (2005). Introduction to science of law. Thirty-second edition, Mizan publication. 15.Katouzian N. (2008). Articles Collection. Volume I, Dadgostar Publications, Moein Persian Glossary. 16.Qashqaee H. (2003). Methods of private contract interpretation in Iranian legal system and ontemporary legal systems. 17.Saljooqi M.(1975). The role of custom in Iranian civil rights. the National Bank's printing press, first edition. 18.Sahebi M. (2010). Interpretation of contracts in private law. 19.Safaee S.H. (2000). Civil Rights Foundation course. Volume 2, Mizan Publications, Third Edition, Page 161. 20.Shahidi M. (2006). Contract principles and commitments. Majd press, second edition. 21.Soltan Ahmadi J. (2010). The influence of custom on contracts. Javedaneh publications, first edition. 22.Soltan Ahmadi J. (1986). Islam and ownership. Page 130 onwards. 23.Tabatabaee S.M.S., and Araee H. (2011). A comparative study of accuracy principle in the interpretation of contracts, Mufid journal, No. 88.
Mohammad Hadi Mirzaei and Mehdi Niknafs
Indian Journal Of Natural Sciences www.tnsroindia.org. © IJONS
Vol.5 / Issue 28/ February 2015 International Bimonthly ISSN: 0976 – 0997
2535
Comparative Study of Children Drawings Aged 7-9 years old with Title of National Myths (A case study: Turkman and Fars Ethnicities of Golestan Province) Sedigheh Mohajer1* and Gholam Reza Hasani1
1Department of Art Research, Faculty of Art and Humanities, Aliabad Katoul Branch, Islamic Azad University, Golestan, Iran. Received: 5 Nov 2014 Revised: 28 Nov 2014 Accepted: 18 Dec 2014 *Address for correspondence Sedigheh Mohajer
Department of Art Research, Faculty of Art and Humanities, Aliabad Katoul Branch, Islamic Azad University,Golestan,Iran. E.Mail: [email protected]
This is an Open Access Journal / article distributed under the terms of the Creative Commons Attribution License (CC BY-NC-ND 3.0) which permits unrestricted use, distribution, and reproduction in any medium, provided the original work is properly cited. All rights reserved. Social affairs experts believe that story telling plays an important role in development of the creativity of children. Helping the development of speech, emotions and thoughts, strengthening innovation, creativity and imagination and interest to reason and exploration are the positive points of storytelling for children. Developing aesthetic feeling in a child, concentration of the child on surrounding, enhancing useful habits, encouraging the autonomy and creativity of children are the main goals of mythical story for children. The present study aimed to reflect this relationship; the relationship of story (myth) and drawing in children and it is analytical-comparative and applied method. In the comparative analysis, two populations are compared. One children aged 7-9 years old from Gorgan and another one children aged 7-9 years old of AghGhala. Also, this study is comparative but it doesn’t have either quality logic, or quantity logic and it is a combination of qualitative and quantitative logic. The present study evaluated the effect of legends and national myths in drawings of children aged 7-9 years old of Golestan pro vince (Gorgan and AghGhala). The findings of the study showed that children aged 7-9 years of Golestan province are not familiar with the myths of their country and in their drawings, they draw Arash the Archer personality based on their imagination and by being inspired from animations. Keywords:Mythical stories, Children drawing, Relationship between story and drawing of child, illustration of child book.
ABSTRACT
RESEARCH ARTICLE
Indian Journal Of Natural Sciences www.tnsroindia.org. © IJONS
Vol.5 / Issue 28/ February 2015 International Bimonthly ISSN: 0976 – 0997
2536
INTRODUCTION Ancient stories and legends of Iran are good themes for training Iranian culture to the children from the beginning. Although, it doesn’t mean that this issue was not considered like this before (Vaeznia, 2003). Strabo, Greek historian and Geography expert discussed about legend and training and said:” Iranian teachers integrated their lesions with legends”. Folk literature namely legends have considerable effect on children literature. This genre is the comprehensive theme for audiences and sometimes it is beyond the cultural scope of a society. This interesting point causes that the text seems amazing for the reader. The materialistic need and motivation to legend and mythology are rooted in the internal capabilities of legends and myths. Regarding materialistic life, the myths have training role for children. A person to continue life needs culture transfer from one generation to another. In the past, most people were illiterate and myths were the most suitable forms to transfer cultural experiences. They had valuable experiences about manufacturing relations, social relations, civil law, national and family traditions (Esmailpour, 2003). Since myths were created, the chiefs of tribe and clan applied them to teach the children. They were completely familiar with the myths language and narrated them well. Betlahilem believed in mythical world view of human being in childhood. He believed that a child believes in the legend of Jin and fairy and his world view about the world is consistent with his world view. At any age, the story attracts us that are consistent with the principles of our thoughts. Thus, the legends of Jin and fairy are the best stories for children (Hushyar,2004). Others as the central component of legends was great ethical and human values and childhood and adolescences are the years in which the values are transferred to children, telling writing the legends for children are necessary (Hushyar,2004). Illustration is one with the aim of giving objective imagination that the audience can connect well with the story. Sometimes illustration is done as no writing is under the image but the reader by following images can perceive the story and understand the meaning and enjoy it (Eliade, 2007). Illustration of children and teenagers books is done by various methods to depict the narration. These methods are based on drawing styles or combination of some methods with each other. Children art is not definite in art environment but it can not be denied. It is better that by believing in art and artist children enhance the artistic perception of the children of our country.The most important factor in children drawing is evolution of psychoanalysis that presented adequate information for analysis of children drawings and introduced drawing one of the ways of children recognition (Akbarloo, 2005). Psychoanalysts via drawing found about the problems (sensory, motion, affective, cognitive, etc) of children and their incompatibility and after the analysis of these problems cure them (Bidmeshki, 2006). Generally, if there is not good ground to enhance their imagination, their creativity is not developed considerably (e.g the children grown up in the orphanage and boarding schools without parents). The home is a good place to fulfill the primary needs of the child and development of his talents, creativity and imaginations and help the child to recognize himself with the first social and feeling experiences in terms of gender. The child displays his learning from environment and experiences via drawing (Ana Oliver Rioferar, 1997:27).The children of any society with their morale, culture and social dependency select drawing subjects and draw them. Living place has great effect on selection of drawing subject. Indeed, children express symbolically what they see with childish perception. Village is different from small cities and big cities and as the life style is different, besides the climate change and life style, the children morale is affected and when the morale is different, the drawings will be different (VahedDoost, 2002 and Krozer, 2005). Thus, as it was said, the main problem of the present study is the investigation and review of child illustration in relation to recognizing Iran national myths on children aged 7-9 years old of Turkmen and Fars tribes of Golestan province.
Sedigheh Mohajer and Gholam Reza Hasani

Indian Journal Of Natural Sciences www.tnsroindia.org. © IJONS
Vol.5 / Issue 28/ February 2015 International Bimonthly ISSN: 0976 – 0997
2537
METHODOLOGY This study was comparative-analytical in terms of aim and analytical-comparative methods are used in the study. Study population and sample The study population of the present study was students aged 7-9 years old of Turkman and Fars. The present study attempted to select small study population due to the precision of the study and 50 girls (25 turkmen and 25 Fars) and 50 boys (25 Turkmen and 25 Fars) were selected. Content unit In this study, content unit was Arash the Archer personality illustrating children aged 7-9 years based on reading story book. Data collection method In this study, first hand and second hand resources were applied and the data were field and library. In library method, by taking notes, the data were collected. By these data, the children drawings were analyzed and by table, the drawings of Fars and Turkmen children were compared. It is field as the researcher for raw data collection (children drawing) visited elementary schools. Data analysis method In the present study, for data analysis, content analysis was used. At first, the data (children drawings) should be turned into written text before analysis. The next stage is defining analysis unit and in this study was Arash the Archer and based on deductive method, the data were inference. Generally, the stages of content analysis process in the study are including: 1- Providing the data (children drawings) 2- Selecting the sample that should be analyzed 3- Planning the process and encoding 4- Analyzing the results of encoding
RESULTS Children aged 9 years from Gorgan in drawing Arash personality, attempted to show his strong arms and body and by drawing the belt and head band and serious face showed the heroic personality. In one of the drawings, the child showed the king before Arash. Another child drew earth angle giving the arch to Arash and he tried to make us perceive this issue. An example of this drawing is shown in Figure 1. Children aged 9 years old of Doganji village of AghGhala town Children aged 9 years old of AghGhala depicted Arash on top of mountain with strong body and mostly they drew Arashas serious, no smile , frowning with an arch in his hand and Arash is not small in the drawings. In one of the drawings, Arash is drown as a strong person at the middle of the page or on top of mountain and just in one example, Arash was small at the bottom of the page. These children draw Arash and they were inspired by cartoon and computer games and Iranian culture works are less observed. An example is shown in Figure 2.
Sedigheh Mohajer and Gholam Reza Hasani
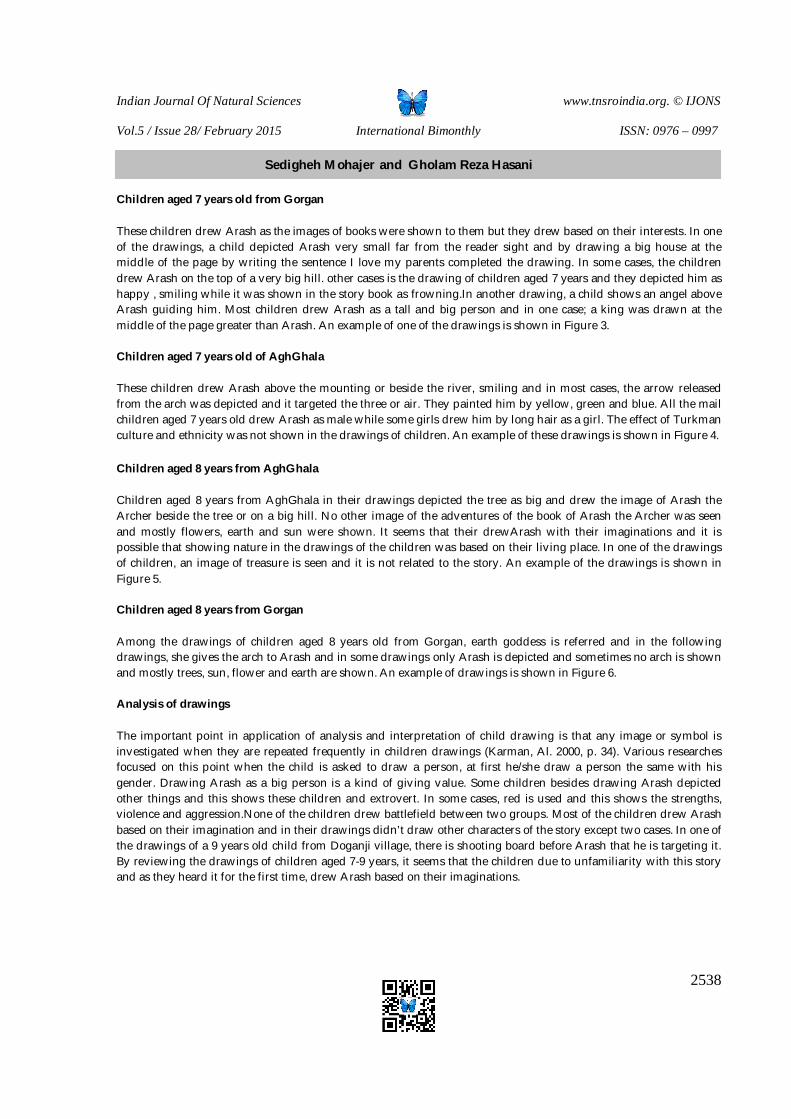
Indian Journal Of Natural Sciences www.tnsroindia.org. © IJONS
Vol.5 / Issue 28/ February 2015 International Bimonthly ISSN: 0976 – 0997
2538
Children aged 7 years old from Gorgan These children drew Arash as the images of books were shown to them but they drew based on their interests. In one of the drawings, a child depicted Arash very small far from the reader sight and by drawing a big house at the middle of the page by writing the sentence I love my parents completed the drawing. In some cases, the children drew Arash on the top of a very big hill. other cases is the drawing of children aged 7 years and they depicted him as happy , smiling while it was shown in the story book as frowning.In another drawing, a child shows an angel above Arash guiding him. Most children drew Arash as a tall and big person and in one case; a king was drawn at the middle of the page greater than Arash. An example of one of the drawings is shown in Figure 3. Children aged 7 years old of AghGhala These children drew Arash above the mounting or beside the river, smiling and in most cases, the arrow released from the arch was depicted and it targeted the three or air. They painted him by yellow, green and blue. All the mail children aged 7 years old drew Arash as male while some girls drew him by long hair as a girl. The effect of Turkman culture and ethnicity was not shown in the drawings of children. An example of these drawings is shown in Figure 4. Children aged 8 years from AghGhala Children aged 8 years from AghGhala in their drawings depicted the tree as big and drew the image of Arash the Archer beside the tree or on a big hill. No other image of the adventures of the book of Arash the Archer was seen and mostly flowers, earth and sun were shown. It seems that their drewArash with their imaginations and it is possible that showing nature in the drawings of the children was based on their living place. In one of the drawings of children, an image of treasure is seen and it is not related to the story. An example of the drawings is shown in Figure 5. Children aged 8 years from Gorgan Among the drawings of children aged 8 years old from Gorgan, earth goddess is referred and in the following drawings, she gives the arch to Arash and in some drawings only Arash is depicted and sometimes no arch is shown and mostly trees, sun, flower and earth are shown. An example of drawings is shown in Figure 6. Analysis of drawings The important point in application of analysis and interpretation of child drawing is that any image or symbol is investigated when they are repeated frequently in children drawings (Karman, Al. 2000, p. 34). Various researches focused on this point when the child is asked to draw a person, at first he/she draw a person the same with his gender. Drawing Arash as a big person is a kind of giving value. Some children besides drawing Arash depicted other things and this shows these children and extrovert. In some cases, red is used and this shows the strengths, violence and aggression.None of the children drew battlefield between two groups. Most of the children drew Arash based on their imagination and in their drawings didn’t draw other characters of the story except two cases. In one of the drawings of a 9 years old child from Doganji village, there is shooting board before Arash that he is targeting it. By reviewing the drawings of children aged 7-9 years, it seems that the children due to unfamiliarity with this story and as they heard it for the first time, drew Arash based on their imaginations.
Sedigheh Mohajer and Gholam Reza Hasani

Indian Journal Of Natural Sciences www.tnsroindia.org. © IJONS
Vol.5 / Issue 28/ February 2015 International Bimonthly ISSN: 0976 – 0997
2539
DISCUSSION AND CONCLUSION Legends and myths manifest the ideals, desires and thoughts of simple people of each era and showed advanced method and philosophy to their time, it is a type of thinking enhancing faith in hope and goodness and it is encompassing the wisdoms as true in the world. Children are assimilated with legend and myths personalities that don’t accept other solutions. Another role is the temptation of the reader and guiding him to the nature. Only those who don’t yield to the routine life claim that they filled the world. The children feel they can resist to what is unimaginable and make everything possible. Arash the Archer is one of the ancient Iranian myths and the name of the main personality of these myths. Arash story is one of the mythical stories of ancient Iran in Avesta. The story happens in Pishdadian era. After many conflicts between Iran and Turan, Iranians lose the war and the enemy advances and in peace negotiations, it is stated that the greatest archer, Arash the Archer defines Iran border with throwing his arrow. In the war between Iran and Turan, Ahuramazda by wind and earth goddess,Sepandarmaz help Iran and take Arash arrow far away and Arash gives his life to Iran and shows his love to his homeland. Tiregan festival is created based on this event. The present study “the comparative study of children drawings aged 7-9 years with the title of national myth” attempted to have a comparative and analytical view to the myths and legends in children drawings and the role of painter on it in age group 7-9 years old among the children of Golestan province. Reviewing the drawings of children aged 7-9 years old of Golestan province (Gorgan and Aghghala), we found that 9 years old children considered the story more and drew the image of Arash close to the personality in the story and used their imagination less. For example, they drew Arash as strong on top of mountain and arrow, arch, wind and Arash and god of wind who helped Arash. But children 7, 8 years old drew the space as tree, house and in some cases drew their mothers or fathers and show their kindness to them. Girls aged 7-8 years old didn’t consider the gender of Arash and show him as a girl, small and weak and depicted his face as happy but in the story, Arash frowned. In comparison of the drawings of children from Doganji of AghGhala village with children from Gorgan, Village children drew mostly nature (sun, cloud, mountain, tree, flower and etc). In some cases, there are no arrow or arch in Arash hands and they are beside him.One of the questions in this study is that what is the impact of organized illustration on improving the imagination of children to national myth? Illustration is done for the aim of giving objective imagination to the writing that the reader can perceive it better and communicate better with the story. Sometimes illustration is done as there is no writing under the image but the reader by following the images can perceive the story and understand the meaning and enjoy it. Illustration of children and teenagers books is done by various methods to depict narrations. These methods are inspired by drawing styles or combination of some methods is used. Illustration with writing should have special space for story alphabets to complete each other in layout. Illustration of children should be as they give better understanding of the surrounding as every child learns what he sees. The child should communicate with the images, figures and colors of illustration and this is not possible unless by using local and national symbols, images and figures. It is possible that cliché forms of heroes and characters of many stories or animated drawings mostly attract children but it can be said that their effect in the imagination of the children is temporary and they are only for fun and they give false emotions. The illustrator is more responsible and committed to children and this is not only used for temporary fun. If the illustrator creates his works with love, the book will have the same effect on the readers as the impact on the illustrator during creation of the work. We shouldn’t forget that creativity and imagination should be accompanied by suitable technique. If a work is of strong technique but without creativity, it has only temporary effect on reader. If an image is creative but it is not performed well, there will be no good relation between the world and reader.
Sedigheh Mohajer and Gholam Reza Hasani
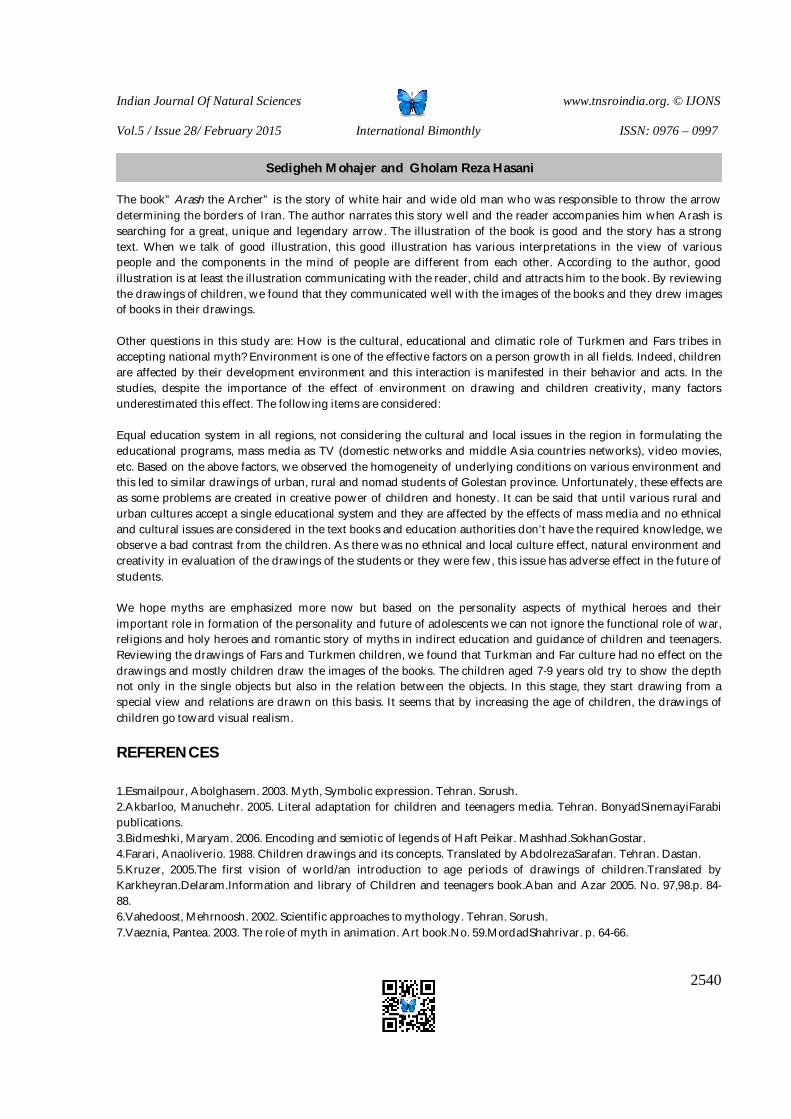
Indian Journal Of Natural Sciences www.tnsroindia.org. © IJONS
Vol.5 / Issue 28/ February 2015 International Bimonthly ISSN: 0976 – 0997
2540
The book” Arash the Archer” is the story of white hair and wide old man who was responsible to throw the arrow determining the borders of Iran. The author narrates this story well and the reader accompanies him when Arash is searching for a great, unique and legendary arrow. The illustration of the book is good and the story has a strong text. When we talk of good illustration, this good illustration has various interpretations in the view of various people and the components in the mind of people are different from each other. According to the author, good illustration is at least the illustration communicating with the reader, child and attracts him to the book. By reviewing the drawings of children, we found that they communicated well with the images of the books and they drew images of books in their drawings. Other questions in this study are: How is the cultural, educational and climatic role of Turkmen and Fars tribes in accepting national myth? Environment is one of the effective factors on a person growth in all fields. Indeed, children are affected by their development environment and this interaction is manifested in their behavior and acts. In the studies, despite the importance of the effect of environment on drawing and children creativity, many factors underestimated this effect. The following items are considered: Equal education system in all regions, not considering the cultural and local issues in the region in formulating the educational programs, mass media as TV (domestic networks and middle Asia countries networks), video movies, etc. Based on the above factors, we observed the homogeneity of underlying conditions on various environment and this led to similar drawings of urban, rural and nomad students of Golestan province. Unfortunately, these effects are as some problems are created in creative power of children and honesty. It can be said that until various rural and urban cultures accept a single educational system and they are affected by the effects of mass media and no ethnical and cultural issues are considered in the text books and education authorities don’t have the required knowledge, we observe a bad contrast from the children. As there was no ethnical and local culture effect, natural environment and creativity in evaluation of the drawings of the students or they were few, this issue has adverse effect in the future of students. We hope myths are emphasized more now but based on the personality aspects of mythical heroes and their important role in formation of the personality and future of adolescents we can not ignore the functional role of war, religions and holy heroes and romantic story of myths in indirect education and guidance of children and teenagers. Reviewing the drawings of Fars and Turkmen children, we found that Turkman and Far culture had no effect on the drawings and mostly children draw the images of the books. The children aged 7-9 years old try to show the depth not only in the single objects but also in the relation between the objects. In this stage, they start drawing from a special view and relations are drawn on this basis. It seems that by increasing the age of children, the drawings of children go toward visual realism.
REFERENCES 1.Esmailpour, Abolghasem. 2003. Myth, Symbolic expression. Tehran. Sorush. 2.Akbarloo, Manuchehr. 2005. Literal adaptation for children and teenagers media. Tehran. BonyadSinemayiFarabi publications. 3.Bidmeshki, Maryam. 2006. Encoding and semiotic of legends of Haft Peikar. Mashhad.SokhanGostar. 4.Farari, Anaoliverio. 1988. Children drawings and its concepts. Translated by AbdolrezaSarafan. Tehran. Dastan. 5.Kruzer, 2005.The first vision of world/an introduction to age periods of drawings of children.Translated by Karkheyran.Delaram.Information and library of Children and teenagers book.Aban and Azar 2005. No. 97,98.p. 84-88. 6.Vahedoost, Mehrnoosh. 2002. Scientific approaches to mythology. Tehran. Sorush. 7.Vaeznia, Pantea. 2003. The role of myth in animation. Art book.No. 59.MordadShahrivar. p. 64-66.
Sedigheh Mohajer and Gholam Reza Hasani

Indian Journal Of Natural Sciences www.tnsroindia.org. © IJONS
Vol.5 / Issue 28/ February 2015 International Bimonthly ISSN: 0976 – 0997
2541
8.Hushyar, Mohammad Bagher. 2004. Legend, a bridge to the imaginary and real world. Moalem and Khanevade.Peirod 5, No. 3. 9.Elyade, Mircha. 2007. Myth visions. Translated by Jalal Satari, Fifth edition.Tus. Tehran.
Figure 1- ParvaZarei, Third level, Figure2-MobinNuri, 9 years old, Arash the Archer image , From AghGhala, image of Arash the Archer
Figure 3- Mohammad Reza Naseri, 9 years old, Image of Arash the Archer
Sedigheh Mohajer and Gholam Reza Hasani
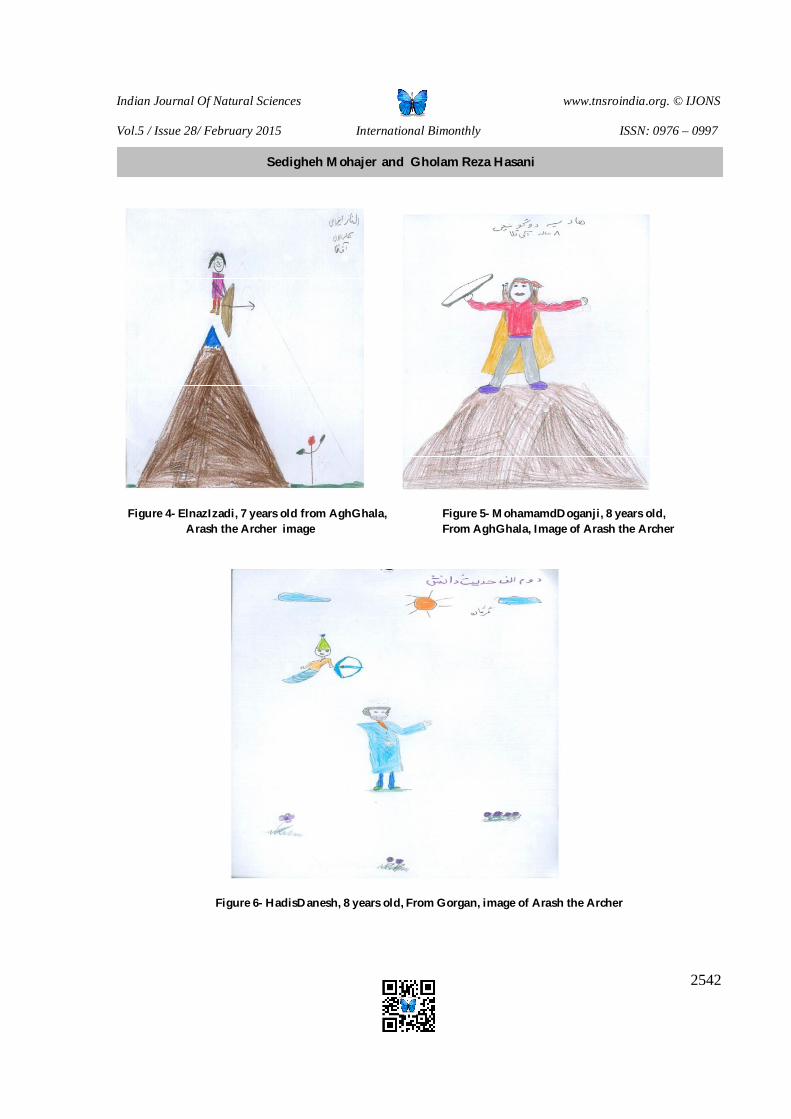
Indian Journal Of Natural Sciences www.tnsroindia.org. © IJONS
Vol.5 / Issue 28/ February 2015 International Bimonthly ISSN: 0976 – 0997
2542
Figure 4- ElnazIzadi, 7 years old from AghGhala, Figure 5- MohamamdDoganji, 8 years old, Arash the Archer image From AghGhala, Image of Arash the Archer
Figure 6- HadisDanesh, 8 years old, From Gorgan, image of Arash the Archer
Sedigheh Mohajer and Gholam Reza Hasani
Indian Journal Of Natural Sciences www.tnsroindia.org. © IJONS
Vol.5 / Issue 28/ February 2015 International Bimonthly ISSN: 0976 – 0997
2543
Special Surveillance on Dangerous Offenders after Release from Prison Zahra Zand1* and Mohammad Reza Rahmat2
1Department of Law, Taft Branch, Islamic Azad University, Taft, Iran. 2Department of Law, Yazd University, Yazd, Iran. Received: 27 Oct 2014 Revised: 17 Nov 2014 Accepted: 18 Dec 2014 *Address for correspondence Zahra Zand
Department of Law, Taft Branch, Islamic Azad University, Taft, Iran. E.Mail: [email protected]
This is an Open Access Journal / article distributed under the terms of the Creative Commons Attribution License (CC BY-NC-ND 3.0) which permits unrestricted use, distribution, and reproduction in any medium, provided the original work is properly cited. All rights reserved. Increases in deviant behaviors and crime by offenders have led the country’s prisons to be filled with people. Multitude of prisoners on the one hand and lack of regular and systematic programs training programs and personality rehabilitation and socialization of the prisoners on the other hand lead prisoners to enter again in the previous social context after leaving jail. In this manner, they will gradually come to the commission of the offenses and return to return to prison. In addition to the loss of mature and constructive forces in the community that take the path of crime and false direction, enormous costs of maintenance and custody of public funds lose to these people. They are apparent and considerable costs; many hidden costs are lost in this process. Thus, it is necessary to implement plans to change and adjust their behavior to make a healthy and socialized person. In this regard, they will be changed to productive and creative forces and useful in the course of country development. Therefore, the presence of a center for transforming released offenders to socialized, creator, innovative, and participatory forces is necessary. Statistical society in this research is Adel Abad prison in Shiraz. The questionnaires distributed in this jail have confirmed the impact of social and economic changes on the effectiveness of special surveillance after releasing from prison in dangerous prisoners. In addition, factors of immigration, family and addiction were rejected. Key words: criminal, freedom, law, offenders, prisoners. INTRODUCTION Nowadays traditional penalties, in terms of purpose and content, have changed and have have been coupled to securing policies. In fact, the purpose of traditional penalties was punishment and intimidation, but securing policies
RESEARCH ARTICLE
ABSTRACT
Indian Journal Of Natural Sciences www.tnsroindia.org. © IJONS
Vol.5 / Issue 28/ February 2015 International Bimonthly ISSN: 0976 – 0997
2544
were established due to the teachings of positivism in order to correct dangerous status offenders. Repetition crime is a subject of criminal law representing the inability of offenders to join community on the one hand and the failure of judicial system in the rehabilitation of offenders and the prevention of crime on the other hand. Thus, legislators have repeatedly amended the law in search of appropriate strategies to fight crime repetition (Gholami, 2003). In this regard, the most common approach is intensifying punishment of repeated offenders based on the idea of deterrence. This idea governs world criminal law systems for a long time untill the advent of criminological and penological studies developments draw attentions to emphasis on the rehabilitation of offenders. Iran penal policy has been influenced by retribution idea dealing with repeated crimes at different periods. In this case, the protection of society against dangerous criminals and the prevention of crime repetition were influenced and institutionalized by positivist teachings through approval of securing actions law in 1960. With the importance of the protection of society against crime and criminals and providing security to the victims, the legislator has recently predicted a “surveillance securing” outside the prison for dangerous criminals who are known as repeat offenders in form of incorporation of Article 48 of old Penal Code, strategies such as delaying the sentencing, and similar strategies in the new Islamic Penal Code. It aims to monitor criminals who are repeatedly committing crimes in order to prevent them from committing crimes and prove social security by controlling them after enduring criminal conviction. Resort to these surveillance policies meets only the supportive aspect of the community and endangers the individual rights and freedoms of the sentenced person because the system may seize or control them only based on a prediction about the repetition of a crime by them after releasing. Nevertheless, thereis another viewpoint that believes in the possibility of removing their danger by careful planning and correction of offenders. In this regard, offenders would be act as useful elements in order to improve the performance of community. This is achievable only through careful planning and regulation of effective laws for preventing them to return to dangerous status. This article concentrates on the effectiveness of social, cultural, and economic factors as well as family and immigration in special surveillance on dangerous offenders after release from prison Research Background In his thesis about the supportive strategies after the release in Iranian criminal law, Tahmasebi (2008) states that the supportive activities after the release are a set of measures that are carried out to support and monitor released prisoners. These measures contain a wide range of material, spiritualand social supports. The supportive activities do not begin from the release of prisoners, but it is a process beginning in prison and continues long after the release. The importance of supportive activities after the release attributes to the fact that it prevents crime repetition by offenders. The thesis aims to review and analyze laws and regulations governing the supportive strategies in Iran penal code; it seeks to explain the available supportive strategies and process in Iran penal code. Ajee Pisheh (1996) has investigated delay or suspension of penal provisions execution in Iran law and states that court and condemned have some duties in the issuance and survival of suspension. The sentence will be carried out primarily in the delay execution of the sentence, but in suspension, penalty is enforced only in case of the condemned violation of supportive orders or committing new crime. Characteristics of Dangerous Criminals Proficiency Proficiency is the first affective and behavioral characteristic of dangerous criminals. Dangerous criminals have to be professional in his work because lack of appropriate expertise leads to his defeat in an offense, although risk of failure is always coupled with a crime. Therefore, a dangerous criminal is psychologically forced to enhance his knowledge and information. Dangerous criminals’s expert differs according to their place of living; it differs whether they are living in traditional or industrial societies. As much as a society moves toward industrialization, the
Zahra Zand and Mohammad Reza Rahmat
Indian Journal Of Natural Sciences www.tnsroindia.org. © IJONS
Vol.5 / Issue 28/ February 2015 International Bimonthly ISSN: 0976 – 0997
2545
dangerous criminals’ experts are developed. Tools of an American dangerous criminal differ significantly from tools of an Afghan dangerous criminal. If their methods are the same, they are not similar (Paula, 2013). Exorbitant Expenditure A dangerous offender is very wasteful. He wastes the properties resulted form criminal activities; he spends his money much faster than his income. A dangerous criminal is in a hasty, reckless and restless in his expenses and very rarely think of his future. Saving is not in his manner. Sometimes, dangerous offenders they hide a part of their money or give their close friends on loan. Revenge The third moral and behavioral characteristic of professional offenders is revenge. Criminals are usually very strict in forgiving the sins of those who have committed a fault and are considered as guilty; rarely are they forgiven someone. Threatening Dangerous criminals will always have a habit of resorting to threats to defend themselves or prevent actual or potential risk. They are threatening people and forms of threat are different. If caught by the police or the justice system or imprisoned, their threatening is usually verbally or in forms of protest, quarrel, or real or unreal report of agencies to officials. In this regard, they employ methods like counterfeiting lies, imaginary and unreal stories, and conspiracy against the officer or the person who endanger them. The Desire to Show off Some crimes are associated with telling many lies. Many offenders tend to tell stories, fictions, and extraordinary stories about themselves to show off. These types of people are from two groups; a group suffers from mythomane (propensity for fantasizing, lying, or exaggerating) and the second group is not ill. Desire to show off causes an offender to fail control his behavior; it leads him to utter some words due to the overcome of flaunt sense over sense of privacy and overcome of ambitiousness over caution and foresight. Flaunty behaviors can occur in two forms: telling friends criminal activities in which he has participated is a form of flaunty behavior. Narrating exaggerated events to journalists for being reported by details in press is another aspect of their behavior. Young people have a tendency to boast and show off more than old people they are likely to be introduced as a hero of criminal incidents. The psychological status of desire to flaunt and show off can be used by criminal Investigators. Police forces should collect carefully materials, news, speeches, and printed quotations, find their relation to cases under the action and status of offenders who are spending sentence, or even are free, and use them. Imitation Instinct Gabriel Tardy, the new French scholar of criminal science, knows imitation as the basic element of offense. Imitative testify is a hysterical illness in which the ill person testify a lie against innocent persons, and even himself, to undermine the foundations of optimism and justice. Imitation of offense is different from imitation of hoe to commit crime; the first, a subject in criminology and the second is a discussion in crime detection. In the first one, imitation is the source of criminal activity, but in the second issue, the foundations of criminal activity have been created and the offenders only imitates in how to offend.
Zahra Zand and Mohammad Reza Rahmat
Indian Journal Of Natural Sciences www.tnsroindia.org. © IJONS
Vol.5 / Issue 28/ February 2015 International Bimonthly ISSN: 0976 – 0997
2546
Need to Gathering Dangerous offender does not like the solitary life. He wants to be among people and loneliness is difficult for him. He is restless and eager to seek fellow. A favorable fellow has an indescribable value for a professional criminal. It seems this characteristic of friend seeking results from his mental weakness and insecurity leading him to participate in communities and accept active roles in a group. Each criminal group is a small social unit consisting of two or more persons and is created because of a sturdy connection to each other, harmony and cooperation within group; it has the power and efficiency. Fake Titles and Names A dangerous offender has not only one name, but he has some or many names and titles; all these titles and names are fake and unreal. In particular, the rooks, forgers and thieves choose more fake titles, names, and identities in comparison with other offenders (Ismaeli, 2008). Electronic monitoring for dangerous criminals Electronic monitoring system is closely related to the practice of offenders. This means that due to the high percent of crime in such offenders, this model is not satisfied lawyers. The judge can cancel electronic surveillance due to the following items: 1. Non-compliance with obligations. 2. Not following supplementary measures. 3. The new sentences. 4. The refusal of the requested changes. 5. If the condemned request to cancel the action and return to the prison. In addition, if the offender commits new offense during surveillance, he will certainly be returned to closed prison and be punished for the new crime. If the condemned decides to escape, dodge and neutralize the performance of appointed agencies, or disrupt these systems, it is considered as escape, and he is behaved as an escaped convict according to Article 29-434 of Criminal Code. If the condemned commit a guilty caused damage or loss to a third party, Prisons Organization is officially responsible for the loss. In this case, prison officials are allowed to meet him at his home in accordance with the judge’s decision. The condemned permission for entrance to his house is necessary. If the condemned refuse to allow them, it is considered as absence and violation; thus he may be returned to closed prison. With these lines, it is eligible to select this method for dangerous criminals on drugs (Rayejan Asli, 2001). Recurrent Article 48 Concerning Monitoring Experienced Criminals According to Article 48 of islamic Penal Code, “Every person who has two or more criminal records for committing intentional offences, and if he or she commits a further deliberate offence, then he or she may be sentenced by the court when issuing the judgment of conviction, in proportion to the backgrounds and mental and moral considerations and personalities of the offenders and the reasons of commission of the crime, to carry out one or more orders mentioned in Article 29 of this Code for a period not exceeding two years. Note 1 -The court may assign the execution of the orders, accordingly, to the Welfare Organization or Prisons and Security and Corrective Measures Organization or the Police. Note 2 -If the convict, without a plausible excuse, breaches the order of the court, in the first occasion, the term of the order shall be extended up to six months, and if repeated, the remaining term of the period shall be replaced with imprisonment. Note 3 -Protestability of the order of the court depends on protestability of the main judgment.”
Zahra Zand and Mohammad Reza Rahmat
Indian Journal Of Natural Sciences www.tnsroindia.org. © IJONS
Vol.5 / Issue 28/ February 2015 International Bimonthly ISSN: 0976 – 0997
2547
Crime repetition is one of the reasons for intensification of punishing an offender whose records prove the existence of the same punishment. Such condemned has violated the criminal codes again and showed that the previous punishment as useless for him; thus, he has the characteristics of a dangerous offender. In Iran the criminal law, different criteria have been accepted for a repeated offense. Accordingly, the definition of crime repetition in Iran is a subject of applicable criminal laws. In this manner, according to Article 24 of Public Penal Code 1304, the criterion for evaluation of crime repetition was committing a crime after issuance of definite sentence. In Article 29 of the Penal Code in 1352, it was stipulated that a person would be included in the provisions of crime repetition when he committed another crime from the time of definite sentence to the time of rehabilitated or time inclusion. With the start of the new legislative period in 1361, according to Article 19 of the Islamic Penal Code, crime repetition is limited to ta’ziri punishments on condition that the person repeats the same crime again. The mentioned criteria were enacted with little change in the Islamic Penal Code adopted in 1370 as well. According to Article 48 of this Code, “Any person, who is sentenced by the court to ta'zir or deterrent punishments, if, after the execution of the sentence, commits a further ta’zir offence, the court may aggravate the ta'zir or deterrent punishment.” According to this Article, crime repetition is the status of a guilty who commits a ta’ziri crime after enduring for a ta’ziri or deterrent punishment. The condition for crime repetition in Islamic penal Code is the execution of ta’ziri or deterrent punishment. The purpose of ‘execution of the sentence’ in Article 48 of Islamic Penal Code is the full execution of punishment (Noor Baha, 2009). Some law scholars believe in this regard, “If an offender commits a new crime after or during the execution of the sentence, he will be subject to the rules of repetition, such as crimes committed within prison” (Ardabili, 1381). The next condition for crime repetition is doing new ta’ziri crime or qualification for new deterrent punishment after the execution of previous ta’ziri or deterrent punishment. The legislator has regarded committing ta’ziri crime as the reason for inclusion in repetition crimes; he does not mention the causes of deterrent punishments. It seems omission of crimes included in deterrent punishments as the secondary conditon for inclusion of crime punishment in Article 48 of Islamic Penal Code was not intentionally. It is inadvertently because deterrent penalties are also predicted in the latter part of Article 48 of the Islamic Penal Code. In crime repetition, court can intensifies ta’ziri or deterrent punishments if necessary according to Article 48 of Islamic Penal Code. However, given the uniformity of opinion No. 606 - 27/04/75, which considers penalty exceeded the legal knowledge as no legal basis, the court cannot issue a sentence more than the predicted items in the law. In addition, the Article accepts permanent crime repetition. It means that the implementation of repetition rule and its conditions do not depend on the limitations of time and place. Since passing criminal time of criminal affairs is acceptable only in deterrent penalties according to Article 173 of the formation law of public and revolutionary courts, it is possible to aggravate punishments due to the principle of crime repetition in incessantly ta’zirat disregarding the interval between committing previous and present crimes (Gholami, 2003). Subject in the New Islamic Penal Code In the new Islamic penal Code, the legislators have tried to carry out effective efforts in the surveillance of offenders by categorizing creatively punishments and executing new rules like suspension of sentence. This section reviews these efforts. Alternatives and Surveillance Activities in New Islamic Penal Code Article 79 of the new Penal Code prescribed that if the observance of court sentence by condemned indicates his behavior correction, the court can reduce once the punishment up to half with the proposal of the judge. Articles 82 and 83 describe in detail the surveillance period and its inclustions, free public services and its exact points. In Articles 84 and 85, different types of monetary punishment replacing detention are stated in Rials. The legislator have stipulated exact principles in terms of children crimes and punishments including alternative punishments particularly in the tenth part of General aspects of Islamic Penal Code, or Articles 87 to 94. These rules need
Zahra Zand and Mohammad Reza Rahmat
Indian Journal Of Natural Sciences www.tnsroindia.org. © IJONS
Vol.5 / Issue 28/ February 2015 International Bimonthly ISSN: 0976 – 0997
2548
explanation and expansion. This issue has been discussed fully in chapter 9, under Articles 63 to 86 titled ‘alternatives for prison.’ Article 63 says that alternative punishments for prison are surveillance prison, free public services, daily fines, and deprivation of civil rights. They can be reduced in the case of plaintiff’s forgiveness with respect to crime type, quality, results, age, skill, condition, personality, historical records, and other circumstances. In the note of this Article, judge cannot define more than two types of punishments. It is stated in Article 64 that those who are guilty of intentional crimes, which maximum statutory penalty is imprisonment for 3 months, can be condemned to an alternative punishment instead of punishment. Article 67 stipulates that perpetrators of inadvertent offenses are punish by prison alternative punishments unless the legal punishment for the crime is more than two years of imprisonment; in the latter case, custodial sentence is optional. Article 68 stipulates that perpetrators whose punishment is not determined in ta’ziri laws will be punished by non- custodial sentence. In Article 70, execution of alternative punishments has been banned for crimes against internal or external security of the country. Article 73 says that the provisions of this chapter are not implemented about definite sentences that have been issued before the issuance of this rule. In Article 76 of social worker and surveillance official along with enforcement judge, non- custodial sentences have been predicted. Article 78 claims that different public services and public and state agencies and organizations that accept condemned, and their cooperation with the enforcement judge will be determined according to the regulation that is going to be presented by Ministries of Justice and Interior Affairs within three months from the date of entry into force. It should be adopted by the Cabinet with the approval of the Head of the Judiciary System. Population, Sample Size and Sampling Method Target Population The population in this study consists of all prisoners in Adel Abad prison in Shiraz.Validity and Reliability of Measurement Instruments,With respect to the tools used in the study, in order to validate the measurement instruments, reliability and validity were evaluated as follows: Data Analysis This section aims to analyze data and test hypotheses according to obtained results. First hypothesis: it seems that social and economic changes impact on the effectiveness of special surveillances after release from prison in dangerous prisoners. According to the table 1, the weighted average of results obtained from questions regarding factor of social and economic changes in assault and battery prisoners is 25.7949; it is 2.7949 higher than the empirical assumption (23). T = 4.466 and Freedom degree = 38 indicate a significant difference at the level of 0.000. In addition, the results of questions distributed among repeated criminals show that the weighted average is 20.2917; therefore, it is -2.70833 lower than the empirical assumption (23). T = -5.730 and Freedom degree = 47 indicate a significant difference at the level of 0.000. Thus, it can be concluded that social and economic changes influence on the effectiveness of special surveillance after release in dangerous offenders. In this regard, the first research hypothesis, social and economic changes impact on the effectiveness of special surveillances after release from prison in dangerous prisoners, is confirmed. Second hypothesis: it seems that addiction influences on the effectiveness of special surveillances after release from prison in dangerous prisoners. According to the table 2, the weighted average of results obtained from questions regarding factor of addiction in assault and battery prisoners is 6.56; it is -0.1859 lower than the empirical assumption (6.75). T = -0.927 and Freedom
Zahra Zand and Mohammad Reza Rahmat
Indian Journal Of Natural Sciences www.tnsroindia.org. © IJONS
Vol.5 / Issue 28/ February 2015 International Bimonthly ISSN: 0976 – 0997
2549
degree = 38 indicate no significant difference at the level of 0.360. In addition, the results of questions distributed among repeated criminals show that the weighted average is 6.91; therefore, it is -0.1666 higher than the empirical assumption (6.75). T = 1.061 and Freedom degree = 47 indicate no significant difference at the level of 0.294. Thus, it can be concluded that addiction does not influence on the effectiveness of special surveillance after release in dangerous offenders. In this regard, the second research hypothesis, addiction has no influence on the effectiveness of special surveillances after release from prison in dangerous prisoners, is rejected. Third hypothesis: it seems that immigration influences on the effectiveness of special surveillances after release from prison in dangerous prisoners. According to the table 3, the weighted average of results obtained from questions regarding factor of immigration in assault and battery prisoners is 10.6053; it is 0.80526 higher than the empirical assumption (9.8). T = 1.212 and Freedom degree = 38 indicate no significant difference at the level of less than 0.233. In addition, the results of questions distributed among repeated criminals show that the weighted average is 9.3542; therefore, it is -0.44583 lower than the empirical assumption (908). T = -0.774 and Freedom degree = 47 indicate no significant difference at the level of less than 0.443. Thus, it can be concluded that immigration does not influence on the effectiveness of special surveillance after release in dangerous offenders. In this regard, the second research hypothesis, immigration has no influence on the effectiveness of special surveillances after release from prison in dangerous prisoners, is rejected. Fourth hypothesis: it seems that family influences on the effectiveness of special surveillances after release from prison in dangerous prisoners. According to the table 4, the weighted average of results obtained from questions regarding factor of family in assault and battery prisoners is 17.15; it is 0.45385 higher than the empirical assumption (16.7). T = 1.232 and Freedom degree = 38 indicate no significant difference at the level of less than 0.225. In addition, the results of questions distributed among repeated criminals show that the weighted average is 16.43; therefore, it is -0.26250 lower than the empirical assumption (16.7). T = -1.012 and Freedom degree = 47 indicate a significant difference at the level less than 0.317. Thus, it can be concluded that family has no influence on the effectiveness of special surveillance after release in dangerous offenders. In this regard, the first research hypothesis, family impacts on the effectiveness of special surveillances after release from prison in dangerous prisoners, is rejected.
CONCLUSION Some schools, such as the classic, focus only on crime and disregards physical and mental aspects of offenders; in this manner, justice is exposed to violence. In new classicism, punishment is considered to comply with the degree of moral responsibility, to be useful for society, and to prevent crime repetition. Positivism denies free will and regards criminal activities as the result of internal and external factors. This school pays attention to people’s dangerous status and implement supportive actions even for individuals who have never commit a crime, but its is possible for them. In the new social defense school, prevention of offenders fall and his rehabilitation is concerned. The effect of different criminal schools in is seen in the laws of many countries like Iran. For instance, the recurrent Article 48 of Islamic Penal Code predicts that intentional crimes, regardless of the type of punishments, by individuals who have two effective criminal records pave the way for execution of monitoring strategies by judicial authority. Meanwhile, the legislator does not stipulate any intervals between the previous effective crime and present crime; it concentrates on the permanent repetition of crimes. Thus committing a new intentional crime is included in the subjects of the Article even with the passage a long time. Moreover, the legislator has not determined how to execute commands by Social Welfare Organization, the Organization of Prisons and Security and Corrective Measures and Police; it does not specify the reference of crime confirmation in Article 29 of Islamic Penal Code. It considers surveillance activities
Zahra Zand and Mohammad Reza Rahmat
Indian Journal Of Natural Sciences www.tnsroindia.org. © IJONS
Vol.5 / Issue 28/ February 2015 International Bimonthly ISSN: 0976 – 0997
2550
more to support society, rather than repeated offenders. In this regard, it limits a released person’s rights and freedoms by implementation of monitoring his behavior outside the prison after enduring a period of punishment. Therefore, we can see that the concept of offender has changed significantly in the course of history. Since all people are respectful in Islam and one cannot insult them without a reason, prisoners and condemned persons should be behaved in such a way to help them to recognize their real personality and human value; it prevents them to avoid repetition of their indecent and immoral actions. Unfortunately, the progress of societies does not decrease crime rates, but statistics show that it has increased the rate. Family, public, juridical system and police play important roles in the surveillance and training people in order to prevent criminal behavior. Respect for the personality of individual, relying on spiritual qualities and positive points and avoiding stigmatization of offenders can be factors of rehabilitation and return to society. The statistics of this research will be changed due to the location of the city, and whether it is a high crime place or not. This study has tried to analyze data with respect to a specific statistical society and more common variables. Recommendations 1. Surveillance after the release should be performed by studying the personality of the convicted person. This is performed in most of developed countries by personality filing as well as file charges. Unfortunately, the absence of personality filing is prominent in Iran while the personality of offender is one of the main criteria in determining the level of penalty in ta’ziri punishments. In the absence of such a file, we expect the judge of the court as a lawyer to do the tasks of professionals in educational sciences, psychology and sociology, besides its main task. This expectation is quite irrelevant and the duty is not consistent with authorities. It is outside the competency and ability of judge. Accordingly, their personal views cause fragmentation and conflict in precedent. This problem will be solved easily due to the multitude of graduate of listed fields in the community. This strategy will solved the professional problems of society and the problem of filing personality records. 2. Based on the statistics, one can realize that Iran criminal population has been increased. It relates mainly to the issuance of prison punishment for offenders. Hence, one can hope that some special criminals do not enter prison. Nevertheless, some lawyers believe that the new law has increased crimes topics and it causes the increase in the population of prisons. Suspension and delay of sentences, and similar rules, provides an opportunity for correction of offenders. Thus, one cannot hope to observe reduction of prison population with the adoption and implementation of these laws.
REFERENCES 1.Akhondi, Mahmood. Code of Criminal Procedure, Volume II, Fifth Edition, printed and published by the Ministry of Culture and Islamic Guidance. 2.Ashoori, Muhammad. Alternatives to prison or intermediate punishment. Gerayesh Publishing. 2003. Aghaee, Majid. Criminal schools. First edition, Tehran. 2007. 3.Ibrahimi, Shahram. Five-year Congress on Crime Prevention and Criminal Justice: Achievements and Perspectives, Journal of Law and Justice, No. 52 and 53, autumn and winter. 2005. 4.Stephen, Gastu, George Luasour, and Bernard Bulk. General criminal law. Translation: Hassan Dadban, First edition, Tehran, Allameh Tabatabai University Press, vol. 1, 1998. 5.Ismaili, Reza. Civil rights in the Islamic Republic constitution; Journal of Isfahan Culture, 2008. 6.Babaee, Muhammad Ali. Assessment of criminal personality aiming at the prevention of crime. Proceedings of the First National Conference on the Prevention of Crime, First Edition, 2008. 7.Hosseini, Seyed Muhammad, Zahra Saedi, Azadeh Sadeqi. Looking at the evolution of the concept and function of modern penology. Legal Journal of Justice, No. 79. 2012.
Zahra Zand and Mohammad Reza Rahmat
Indian Journal Of Natural Sciences www.tnsroindia.org. © IJONS
Vol.5 / Issue 28/ February 2015 International Bimonthly ISSN: 0976 – 0997
2551
8.Khaghani Isfahani, Mahdi. Treatment of post-traumatic stress disorder in victims of crime in light of the restorative justice approach of crime. Proceedings of the National Conference on Health Humanities. University of Medical Sciences 2007. 9.Khaleqi, Abolfath. Legal and practical status and denial of civil rights and public services as an alternative to punishment depriving liberty. Doctorate dissertation, Tarbiat Modarres University, Faculty of Humanities. 2001. 10.Danesh, Taj Zaman. Who is offender? What is Criminology? Ninth edition, Tehran, Keyhan. 2002. 11.Durkheim, Emile. The rules of sociological method. Translation: Ali Mohammad Kardan, Institute of Tehran University Press, Tehran 1994. 12.Dadban, Hasan. General criminal law: Ph.D. lessons. Faculty of law and political science at Tehran University. 2010. 13.Rahami, Mohsen. Security and Corrective Measures. Tehran, the Mizan publication, first edition, 2002. Rabani, Ali and Masood Kian Pour. Scientific school and theoretical perspectives on civil rights: elected papers from civil rights conference. Tehran, Judiciary Center for Media and Publishing. 2007. 14.Rayejan Asli, Mehrdad. House and jail sentences for drug treatment, Journal of legal and judicial Justice, fall, 2001. 15.Zera’t Abbas. Description of the Penal Code, First Edition, Tehran, Qoqnus. 2000. 16.Shiri Abbas. Critical Review of the Prevention of Crime Act. Tehran, Crime Prevention Studies, No. II, 2007. 17.Sanei, Parviz. General criminal law, First Edition, Tehran, New Deal. 2003. 18.Sedqi, Mansour. Parole and comparative study of the law of Iran and France, MA thesis, supervised by Ashuri, Islamic Azad University. 2009. 19.Toghrangar, Hasan. International Centre for Reform of Criminal Law and Policy. Vancouver, international document of improving the guards system, Rah Tarbiat Press. 2004. 20.Taheri Nasab, Seyed yazdaleh. Crime repetition in criminal law. Tehran, Daneshvar Press, First Edition, 2002. 21.Abdi, Abbas, Samira Kalhor. Crime, punishment and offender, first edition, Elm publication. First edition. 2009. 22.Gholami, Hossein. Legal- criminological analysis of crime repetition. Tehran, Mizan publication, first edition, 2003. 23.Ghafori Ghoravi, Seyed Hasan. Motive of the crime, first edition, Tehran, Iran National University, 1980. 24.Mohseni, Morteza. Overview of Criminal Law, Second Edition, Tehran, Treasure of Knowledge, Vol I. 1996. 25.Muhammad Nezhad, Parviz. The Correction and Rehabilitation of court appointments. 2011. 26.Mirzaee, Ahmad. Effective criminal condemnation in Iran law. Bushehr. Dastgheibi publications. First edition. 2008. 27.Najafi Abarand Abadi, Ali Hossein. Criminology and rehabilitation of offenders. Ph.D. courses of in Criminal Justice and Criminology. University of Tarbiat of Madras, First Semester, 2007. 28.Niaz Pour, Amir Hasan. The habit of offending: from etiology to prevention. Tehran, Fekr Sazan, first edition, 2008. 29.Najafi Abarand Abadi, Ali Hossein and Hamid Hashem Beigi. Encyclopedia of Criminology, Shahid Beheshti University Press 1998. 30.Noor Bahar, Reza. Context of criminal law, Tehran, treasure of knowledge, Sixth Edition, 2009. 31.Najafi Abarand Abadi, Ali Hossein. New Punishments – New criminology: Introduction to risk-oriented managerial criminal Policy. New findings in Criminal Science (Proceedings). Tehran, Mizan publications, first edition, 2009. 32.Hughes, Gordon. Crime prevention. Translation: Alireza Kaladi and Muhammad taghi Jaghatai. Tehran. Publications of Welfare Organization and University of Social Welfare and Rehabilitation, first edition. 2001. 33.Bonta, J “Electronic Monitoring In Canada”. Ottawa: Center for Public Works and Government Services.1999 34.Del Carmen, R. and Vaughn, J “Legal Issues in the Use of Electronic Surveillance in Probation”. Canadian Center for Federal Probation,1986 35.Mainprize, S. “Electronic Monitoring in Corrections: Assessing Cost-effectiveness and the Potential for Widening the Net of Social Control”. Canadian Journal of Criminology. No. 34,1992, 36.Petersilia, J. “A Man’s Home Is His Prison”, Criminal Justice Review. No. 2, 1998 37.Theoryof Social Defense. Available from: http://encyclopedia2.thefreedictionary.com /Social+Defense,+Theory+of 2013
Zahra Zand and Mohammad Reza Rahmat
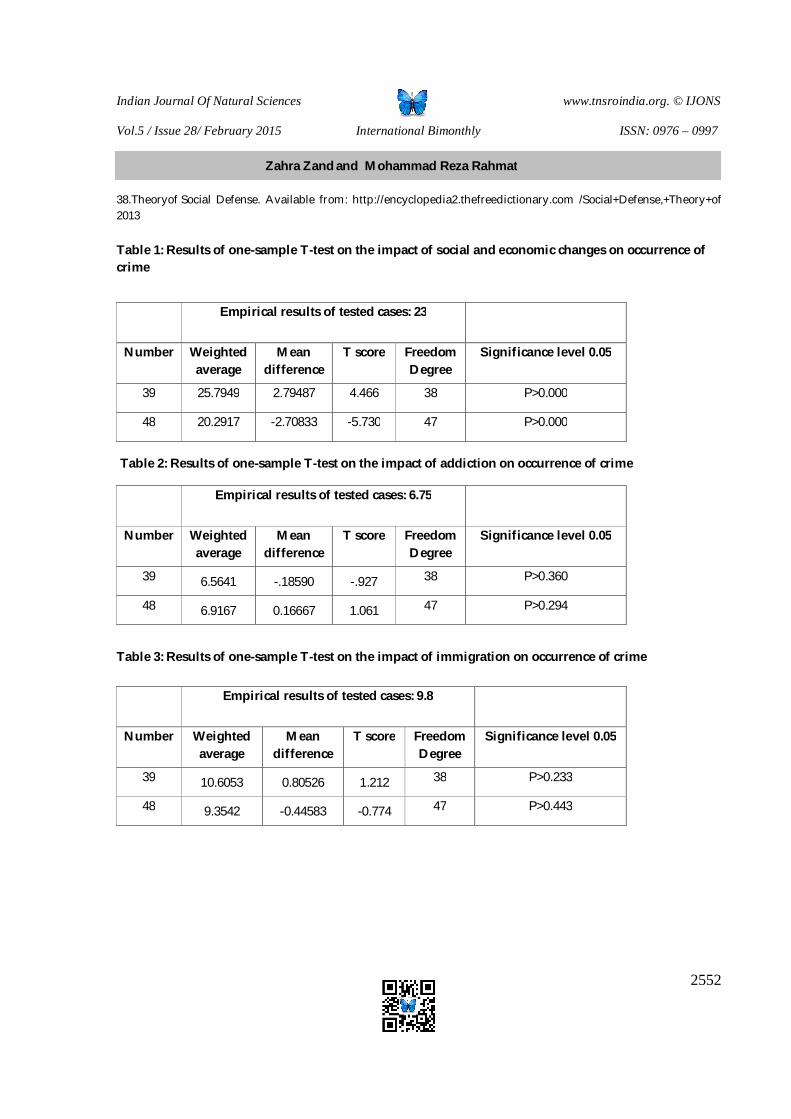
Indian Journal Of Natural Sciences www.tnsroindia.org. © IJONS
Vol.5 / Issue 28/ February 2015 International Bimonthly ISSN: 0976 – 0997
2552
38.Theoryof Social Defense. Available from: http://encyclopedia2.thefreedictionary.com /Social+Defense,+Theory+of 2013 Table 1: Results of one-sample T-test on the impact of social and economic changes on occurrence of crime
Table 2: Results of one-sample T-test on the impact of addiction on occurrence of crime
Table 3: Results of one-sample T-test on the impact of immigration on occurrence of crime
Empirical results of tested cases: 23
Significance level 0.05 Freedom Degree
T score Mean difference
Weighted average
Number
P>0.000 38 4.466 2.79487 25.7949 39
P>0.000 47 -5.730 -2.70833 20.2917 48
Empirical results of tested cases: 6.75
Significance level 0.05 Freedom Degree
T score Mean difference
Weighted average
Number
P>0.360 38 -.927 -.18590 6.5641 39
P>0.294 47 1.061 0.16667 6.9167 48
Empirical results of tested cases: 9.8
Significance level 0.05 Freedom Degree
T score Mean difference
Weighted average
Number
P>0.233 38 1.212 0.80526 10.6053 39
P>0.443 47 -0.774 -0.44583 9.3542 48
Zahra Zand and Mohammad Reza Rahmat
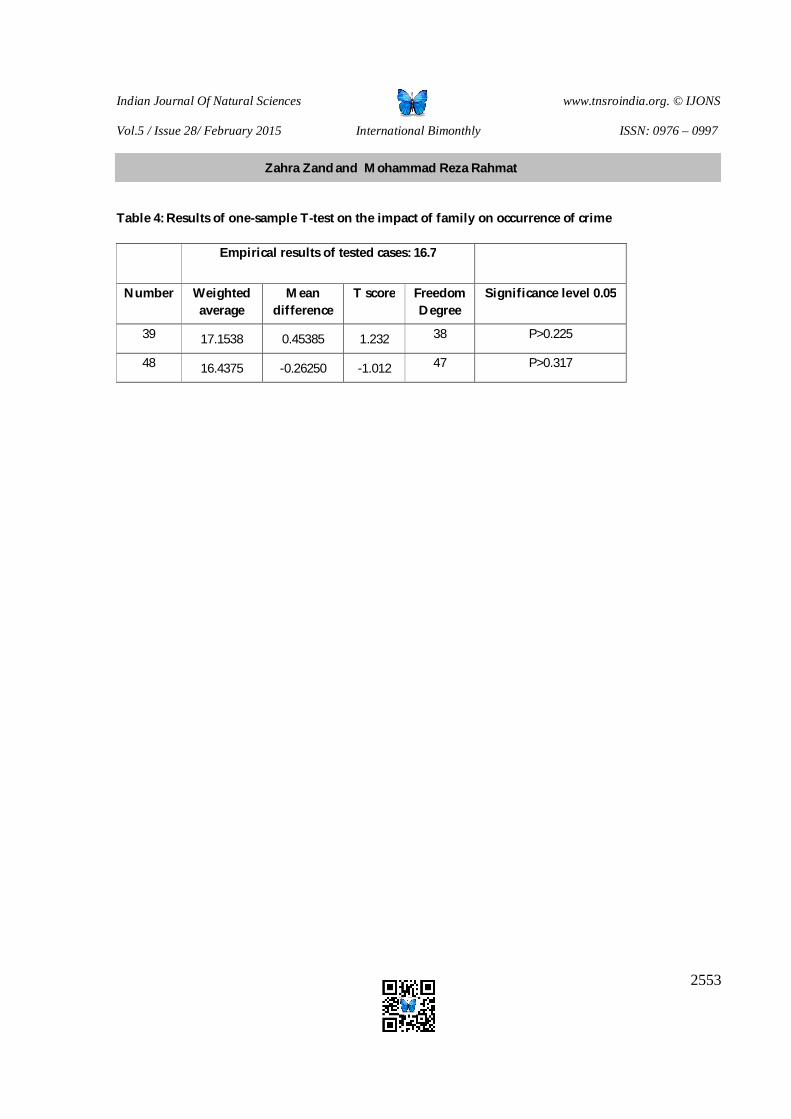
Indian Journal Of Natural Sciences www.tnsroindia.org. © IJONS
Vol.5 / Issue 28/ February 2015 International Bimonthly ISSN: 0976 – 0997
2553
Table 4: Results of one-sample T-test on the impact of family on occurrence of crime
Empirical results of tested cases: 16.7
Significance level 0.05 Freedom Degree
T score Mean difference
Weighted average
Number
P>0.225 38 1.232 0.45385 17.1538 39
P>0.317 47 -1.012 -0.26250 16.4375 48
Zahra Zand and Mohammad Reza Rahmat
Indian Journal Of Natural Sciences www.tnsroindia.org. © IJONS
Vol.5 / Issue 28/ February 2015 International Bimonthly ISSN: 0976 – 0997
2554
Increasing Volumetric Efficiency of Peugeot Engine xu7jp/L3 via Optimization of Air Flow System
Omid Minoofar1*, Cyrus Aghanajafi2 and Reza Azarafza3
1Department of Mechanical Engineering, Science and Research Branch, Islamic Azad University, Kurdistan, Iran. 2Department of Mechanical Engineering, K. N. Toosi University, Tehran, Iran. 3Department of Mechanical Engineering, Malek-Ashtar University of Technology, Tehran, Iran. Received: 10 Nov 2014 Revised: 23 Nov 2014 Accepted:18 Dec 2014 *Address for correspondence Omid Minoofar Department of Mechanical Engineering, Science and Research Branch, Islamic Azad University, Kurdistan, Iran E.Mail: [email protected]
This is an Open Access Journal / article distributed under the terms of the Creative Commons Attribution License (CC BY-NC-ND 3.0) which permits unrestricted use, distribution, and reproduction in any medium, provided the original work is properly cited. All rights reserved. The present study aimed to improve total efficiency via volumetric efficiency as the best and economical method of increasing internal combustion engines efficiency is increasing volumetric efficiency. The design of intake manifold and throttle is the important factor in volumetric efficiency of engine. To simulate fluid flow air system in intake manifold, this engine is evaluated by Comsol software as 3-dimensional. After determining the model geometry, various parameters as flow speed in intake manifold and volumetric efficiency of engine in different engines speed were calculated for different geometries of Manifold. The optimal manifold was selected in terms of geometry, runners’ length, runners’ diameter, and throttle diameter and surge tank volume by comparing the results of simulation. Finally, after installation of optimized air flow system on engine, the empirical results of engine test are used for validation of this simulation. The results of empirical test showed that at average and low speed of engine, by improving geometry parameters of manifold, we can increase volumetric efficiency and engine power and torque considerably and also we can reduce fuel consumption and exhaust pollutants. Key words: : Internal combustion engine, Intake Manifold, Volumetric efficiency.
ABSTRACT
RESEARCH ARTICLE
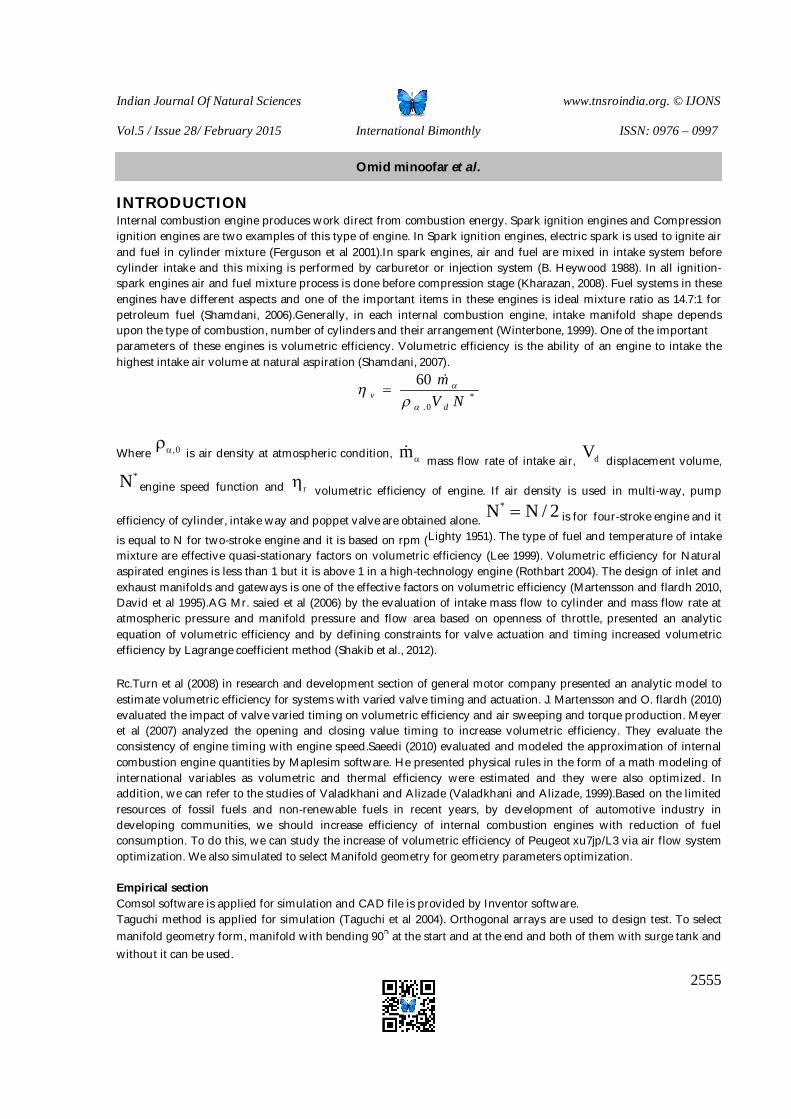
Indian Journal Of Natural Sciences www.tnsroindia.org. © IJONS
Vol.5 / Issue 28/ February 2015 International Bimonthly ISSN: 0976 – 0997
2555
INTRODUCTION Internal combustion engine produces work direct from combustion energy. Spark ignition engines and Compression ignition engines are two examples of this type of engine. In Spark ignition engines, electric spark is used to ignite air and fuel in cylinder mixture (Ferguson et al 2001).In spark engines, air and fuel are mixed in intake system before cylinder intake and this mixing is performed by carburetor or injection system (B. Heywood 1988). In all ignition-spark engines air and fuel mixture process is done before compression stage (Kharazan, 2008). Fuel systems in these engines have different aspects and one of the important items in these engines is ideal mixture ratio as 14.7:1 for petroleum fuel (Shamdani, 2006).Generally, in each internal combustion engine, intake manifold shape depends upon the type of combustion, number of cylinders and their arrangement (Winterbone, 1999). One of the important parameters of these engines is volumetric efficiency. Volumetric efficiency is the ability of an engine to intake the highest intake air volume at natural aspiration (Shamdani, 2007).
*0.
60NV
md
v
Where 0, is air density at atmospheric condition, m mass flow rate of intake air, dV displacement volume, *N engine speed function and r volumetric efficiency of engine. If air density is used in multi-way, pump
efficiency of cylinder, intake way and poppet valve are obtained alone. 2/NN* is for four-stroke engine and it
is equal to N for two-stroke engine and it is based on rpm (Lighty 1951). The type of fuel and temperature of intake mixture are effective quasi-stationary factors on volumetric efficiency (Lee 1999). Volumetric efficiency for Natural aspirated engines is less than 1 but it is above 1 in a high-technology engine (Rothbart 2004). The design of inlet and exhaust manifolds and gateways is one of the effective factors on volumetric efficiency (Martensson and flardh 2010, David et al 1995).AG Mr. saied et al (2006) by the evaluation of intake mass flow to cylinder and mass flow rate at atmospheric pressure and manifold pressure and flow area based on openness of throttle, presented an analytic equation of volumetric efficiency and by defining constraints for valve actuation and timing increased volumetric efficiency by Lagrange coefficient method (Shakib et al., 2012).
Rc.Turn et al (2008) in research and development section of general motor company presented an analytic model to estimate volumetric efficiency for systems with varied valve timing and actuation. J. Martensson and O. flardh (2010) evaluated the impact of valve varied timing on volumetric efficiency and air sweeping and torque production. Meyer et al (2007) analyzed the opening and closing value timing to increase volumetric efficiency. They evaluate the consistency of engine timing with engine speed.Saeedi (2010) evaluated and modeled the approximation of internal combustion engine quantities by Maplesim software. He presented physical rules in the form of a math modeling of international variables as volumetric and thermal efficiency were estimated and they were also optimized. In addition, we can refer to the studies of Valadkhani and Alizade (Valadkhani and Alizade, 1999).Based on the limited resources of fossil fuels and non-renewable fuels in recent years, by development of automotive industry in developing communities, we should increase efficiency of internal combustion engines with reduction of fuel consumption. To do this, we can study the increase of volumetric efficiency of Peugeot xu7jp/L3 via air flow system optimization. We also simulated to select Manifold geometry for geometry parameters optimization. Empirical section Comsol software is applied for simulation and CAD file is provided by Inventor software. Taguchi method is applied for simulation (Taguchi et al 2004). Orthogonal arrays are used to design test. To select manifold geometry form, manifold with bending 90 at the start and at the end and both of them with surge tank and without it can be used.
Omid minoofar et al. et al.

Indian Journal Of Natural Sciences www.tnsroindia.org. © IJONS
Vol.5 / Issue 28/ February 2015 International Bimonthly ISSN: 0976 – 0997
2556
Measuring air pressure in inlet and exhaust manifold was simulated by finite element method. Inlet and exhaust ways for each of simulation stages of two cases:throttle100% open at 6000rpm, throttle 50% open at 3000rpm can be considered. To determine manifold geometry parameters for 3 parameters of runners’ length, runners diameter and throttle diameter, 5 stages of changes are considered. Three stages of changes are considered for surge tank.
DISCUSSION Table 1 shows the investigated parameters of simulation.The results of air pressure measurement in inlet and exhaust manifold are investigated for four manifolds in which at 6000 rpm has the highest exhaust value in inch-Hg. Exhaust Manifold pressure by pressure gauge can measure vacuum pressures.The results of simulation for 4 various models of intake manifold of air with different geometry forms are shown in Table 2. Air velocity in runners’ exhaust and volumetric efficiency in two stages of 6000 rpm with fully open throttle and engine speed at 3000 rpm with semi-open throttle can be reported as the test result in final column. It can be said the highest air speed at exhaustrunners and volumetric efficiency is dedicated to simulation NO.2 but based on two reasons, this manifold geometry form is not suitable. In Figure 1, vertical axle indicates flow velocity in exhaust manifold and horizontal axle indicates the changes of manifold geometry. In Chart 2, vertical axle indicates volumetric efficiency and horizontal axle indicates the changes of manifold geometry form. The results of speed changes contour in intake manifold for simulation of 4 various manifold models in two cases of 6000 rpm speed with fully open throttle and engine speed 3000 rpm with semi-open throttle are shown in Figure 3.Figure 3- The contour of speed changes for manifold with bending 90 at a) start, b) start and end, c) end at engine speed 6000 rpm, d) engine speed 3000rpm and without bending (without surge tank), e) at engine speed 6000rpm and f)without bending (without surge tank) at engine speed 3000rpm. The effect of runner length changes stages on air velocity in manifold exhaust is shown in Figure 4. By the increase of runner length, air velocity in exhaust manifold is reduced. The reduction is more rapid at engine speed 6000rpm.Figure 5 represents the effect of runners’ length changes on volumetric efficiency. By the increase of runners’ length, volumetric efficiency is reduced. This decreasing is rapid at engine speed 6000rpm.Figure 6 indicates the changes of air velocity at exhaust manifold to the runner diameter changes. The chart indicates that the increase of runner diameter has increasing impact on air velocity at exhaust manifold and this impact is very effective. Figure 7 shows the changes of volumetric output to runner diameter change. It can be said by increasing runner diameter, volumetric efficiency is increased due to the increase of air velocity at exhaust manifold and exhaust flow rate is increased and this impact is very strong. Figure 8 indicates the air velocity changes at exhaust manifold to throttle diameter. As it is shown, at engine speed 6000rpm, by increasing throttle to 54mm, air velocity at exhaust manifold is increased. As shown, this trend is decreasing in the throttle diameters bigger than 54mm. At engine speed 3000 rpm, by increasing throttle diameter to 48mm, the air velocity change at exhaust manifold is increased. As shown in Figure 8, by increasing throttle diameter to 54mm, the air velocity change at exhaust manifold is reduced and by increasing the throttle diameter bigger than 54mm, the air velocity change at exhaust manifold is increased again.Figure 9 shows the volumetric efficiency changes to throttle diameter. As shown, the volumetric efficiency change to throttle diameter is similar to the air velocity change at exhaust manifold to throttle diameter.Figure 10 shows the impact of surge tank volume changes on air speed at exhaust manifold and by increasing surge tank volume; air speed at exhaust manifold is increased. Figure 11 shows volumetric efficiency changes to surge tank volume. The chart shows that by increasing surge tank volume, the volumetric efficiency is increased.
Omid minoofar et al. et al.
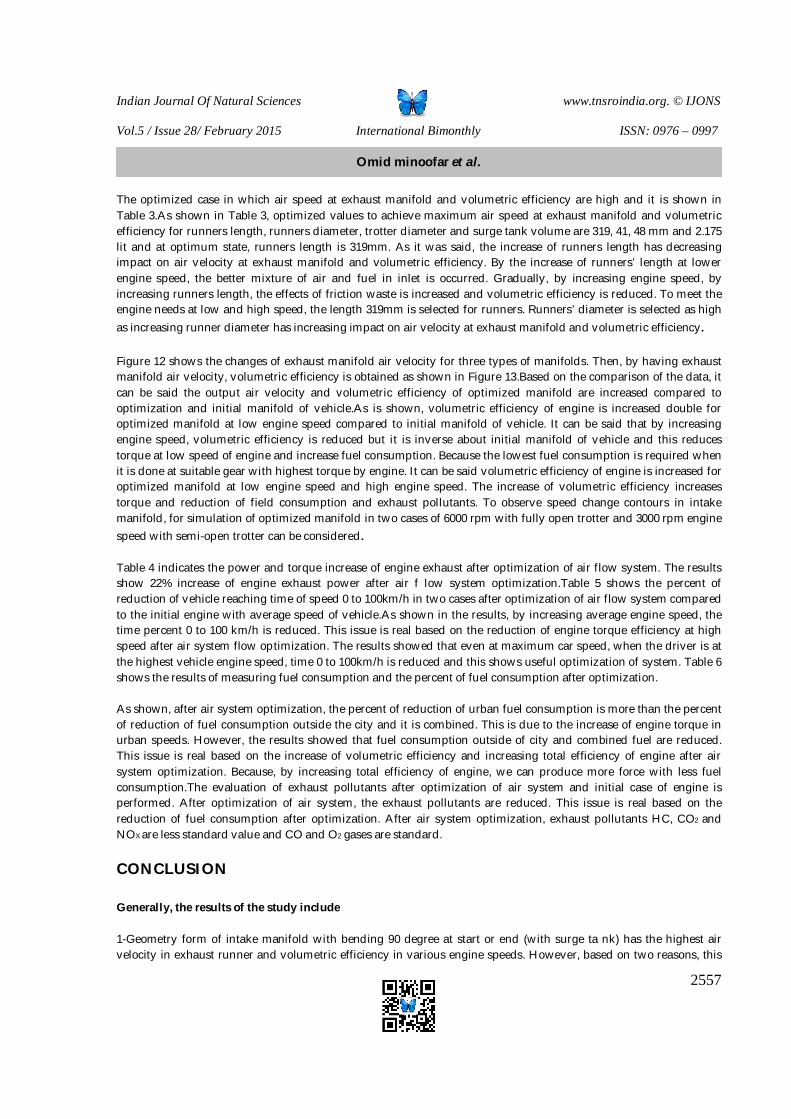
Indian Journal Of Natural Sciences www.tnsroindia.org. © IJONS
Vol.5 / Issue 28/ February 2015 International Bimonthly ISSN: 0976 – 0997
2557
The optimized case in which air speed at exhaust manifold and volumetric efficiency are high and it is shown in Table 3.As shown in Table 3, optimized values to achieve maximum air speed at exhaust manifold and volumetric efficiency for runners length, runners diameter, trotter diameter and surge tank volume are 319, 41, 48 mm and 2.175 lit and at optimum state, runners length is 319mm. As it was said, the increase of runners length has decreasing impact on air velocity at exhaust manifold and volumetric efficiency. By the increase of runners’ length at lower engine speed, the better mixture of air and fuel in inlet is occurred. Gradually, by increasing engine speed, by increasing runners length, the effects of friction waste is increased and volumetric efficiency is reduced. To meet the engine needs at low and high speed, the length 319mm is selected for runners. Runners’ diameter is selected as high as increasing runner diameter has increasing impact on air velocity at exhaust manifold and volumetric efficiency. Figure 12 shows the changes of exhaust manifold air velocity for three types of manifolds. Then, by having exhaust manifold air velocity, volumetric efficiency is obtained as shown in Figure 13.Based on the comparison of the data, it can be said the output air velocity and volumetric efficiency of optimized manifold are increased compared to optimization and initial manifold of vehicle.As is shown, volumetric efficiency of engine is increased double for optimized manifold at low engine speed compared to initial manifold of vehicle. It can be said that by increasing engine speed, volumetric efficiency is reduced but it is inverse about initial manifold of vehicle and this reduces torque at low speed of engine and increase fuel consumption. Because the lowest fuel consumption is required when it is done at suitable gear with highest torque by engine. It can be said volumetric efficiency of engine is increased for optimized manifold at low engine speed and high engine speed. The increase of volumetric efficiency increases torque and reduction of field consumption and exhaust pollutants. To observe speed change contours in intake manifold, for simulation of optimized manifold in two cases of 6000 rpm with fully open trotter and 3000 rpm engine speed with semi-open trotter can be considered. Table 4 indicates the power and torque increase of engine exhaust after optimization of air flow system. The results show 22% increase of engine exhaust power after air f low system optimization.Table 5 shows the percent of reduction of vehicle reaching time of speed 0 to 100km/h in two cases after optimization of air flow system compared to the initial engine with average speed of vehicle.As shown in the results, by increasing average engine speed, the time percent 0 to 100 km/h is reduced. This issue is real based on the reduction of engine torque efficiency at high speed after air system flow optimization. The results showed that even at maximum car speed, when the driver is at the highest vehicle engine speed, time 0 to 100km/h is reduced and this shows useful optimization of system. Table 6 shows the results of measuring fuel consumption and the percent of fuel consumption after optimization. As shown, after air system optimization, the percent of reduction of urban fuel consumption is more than the percent of reduction of fuel consumption outside the city and it is combined. This is due to the increase of engine torque in urban speeds. However, the results showed that fuel consumption outside of city and combined fuel are reduced. This issue is real based on the increase of volumetric efficiency and increasing total efficiency of engine after air system optimization. Because, by increasing total efficiency of engine, we can produce more force with less fuel consumption.The evaluation of exhaust pollutants after optimization of air system and initial case of engine is performed. After optimization of air system, the exhaust pollutants are reduced. This issue is real based on the reduction of fuel consumption after optimization. After air system optimization, exhaust pollutants HC, CO2 and NOX are less standard value and CO and O2 gases are standard.
CONCLUSION Generally, the results of the study include 1-Geometry form of intake manifold with bending 90 degree at start or end (with surge ta nk) has the highest air velocity in exhaust runner and volumetric efficiency in various engine speeds. However, based on two reasons, this
Omid minoofar et al. et al.

Indian Journal Of Natural Sciences www.tnsroindia.org. © IJONS
Vol.5 / Issue 28/ February 2015 International Bimonthly ISSN: 0976 – 0997
2558
geometry form of intake manifold is not suitable. First, to install it, we can apply some changes on basic engine and they are inconsistent with the project goal. Second, due to the trotter location, there is not uniform exhaust in all runners. As shown in the results of simulation No.1, intake manifold with bending 90 degree at the start (with surge tank) is selected.
2-The impact of runners’ length on air velocity in exhaust manifold and volumetric efficiency in various engine speeds is reduced. By increase runners’ length, air velocity at manifold exhaust and volumetric efficiency can be reduced. This impact is increased at high engine speed.
3-The impact of runner diameter on air velocity at exhaust manifold and volumetric efficiency at various engine speeds is reported as increased. By the increase of runners diameter, air velocity at manifold exhaust and volumetric efficiency can be increased but this impact is increased at high engine speed.
4-The impact of increasing trotter to 54 mm on air velocity of exhaust manifold and volumetric efficiency at high engine speed can be increased and by continuing the increase of trotter diameter, this effect is reduced. However, at low engine speed by increasing trotter diameter to 48mm, the air velocity change is increased at exhaust manifold and volumetric efficiency and by increasing trotter diameter to 54 mm, this trend is reduced and by continuing the increase of trotter for the values bigger than 54 mm, the air velocity change is increased at exhaust manifold and volumetric efficiency is also increased.
5-The impact of surge tank volume on air velocity at exhaust manifold and volumetric efficiency at various engine speeds is increased. By increasing surge tank volume, air velocity at exhaust manifold and volumetric efficiency can be increased but this effect is not great at volumes greater than 1.9 lit.
6-Optimal conditions in the case in which air velocity at exhaust manifold and volumetric efficiency are increased and this is occurred when the runners length, runners diameter, trotter diameter and surge tank volume are 319, 41, 48 mm and 2.175 lit, respectively.
7-By increasing air velocity at exhaust manifold, volumetric efficiency and total efficiency are increased and this increase is less at high engine speed.
8-The exhaust power and torque of engine after optimization of air system at all engine speeds is increased compared to the initial state. The highest engine exhaust power is increased of 73.63 kw equal to 100 Horsepower at speed 157 km/h to 89.83 kw equal to 122 Horsepower at speed 157km/h and this indicates the increase 22% of engine exhaust power after air system optimization.
Also, the highest exhaust torque is increased from 150N/m AT SPEED 86 KM/H TO 168 N/m at speed 86 km/h and this indicates the increase 12% of exhaust torque of engine after air system optimization.
9-The time of vehicle achieving speed 0 to 100 km/h after optimization of air system is reduced in all gear change strategies. At maximum vehicle acceleration, when the driver has at the highest engine speed of vehicle, time 0 to 100 km/h is reduced from 11.8 s to 10 s and this indicates the reduction of 15.25% of vehicle reaching time from speed 0 to 100 km/h.
10-The percent of reduction of urban vehicle consumption, outside city and combined after air system optimization is equal 5.33, 4.09 and 4.65, respectively. The reduction of urban fuel consumption compared to fuel consumption outside the city and combined fuel is due to the increase of engine torque at urban speeds. Generally, after optimization of air system, volumetric efficiency and total efficiency of engine is increased and by increasing total efficiency of engine, we can produce more force with less fuel consumption.
Omid minoofar et al. et al.
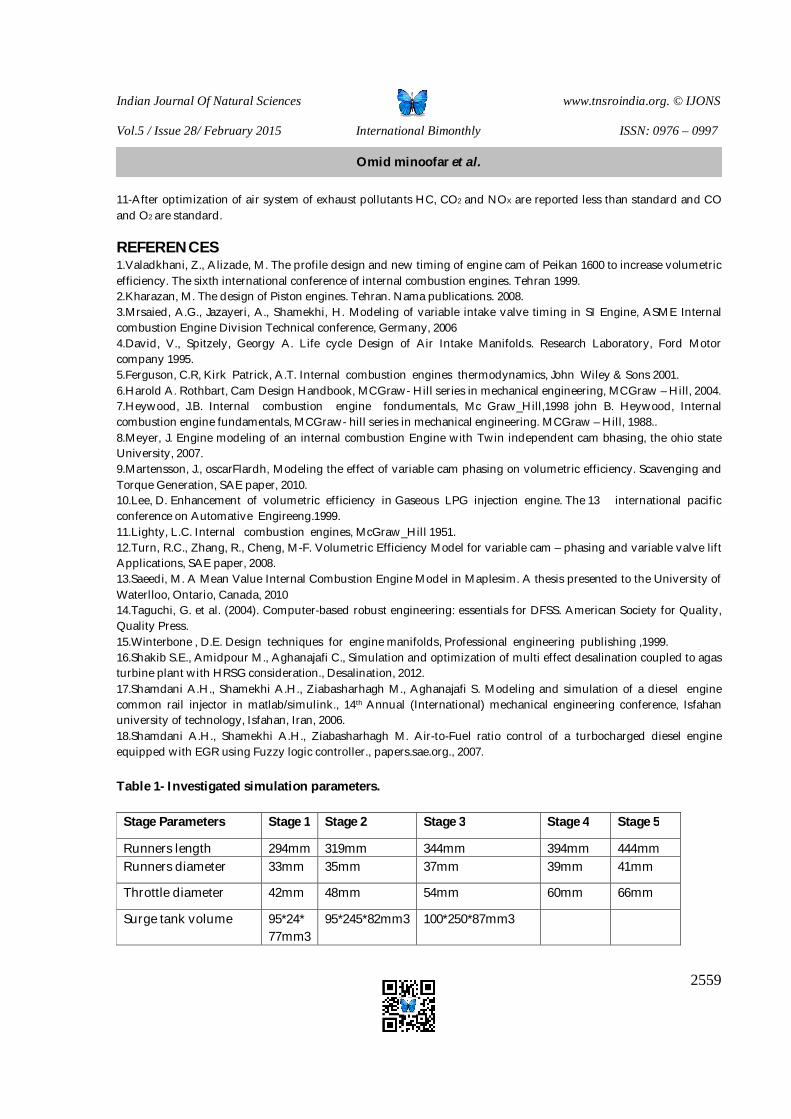
Indian Journal Of Natural Sciences www.tnsroindia.org. © IJONS
Vol.5 / Issue 28/ February 2015 International Bimonthly ISSN: 0976 – 0997
2559
11-After optimization of air system of exhaust pollutants HC, CO2 and NOX are reported less than standard and CO and O2 are standard.
REFERENCES 1.Valadkhani, Z., Alizade, M. The profile design and new timing of engine cam of Peikan 1600 to increase volumetric efficiency. The sixth international conference of internal combustion engines. Tehran 1999. 2.Kharazan, M. The design of Piston engines. Tehran. Nama publications. 2008. 3.Mrsaied, A.G., Jazayeri, A., Shamekhi, H. Modeling of variable intake valve timing in SI Engine, ASME Internal combustion Engine Division Technical conference, Germany, 2006 4.David, V., Spitzely, Georgy A. Life cycle Design of Air Intake Manifolds. Research Laboratory, Ford Motor company 1995. 5.Ferguson, C.R, Kirk Patrick, A.T. Internal combustion engines thermodynamics, John Wiley & Sons 2001. 6.Harold A. Rothbart, Cam Design Handbook, MCGraw- Hill series in mechanical engineering, MCGraw – Hill, 2004. 7.Heywood, J.B. Internal combustion engine fondumentals, Mc Graw_Hill,1998 john B. Heywood, Internal combustion engine fundamentals, MCGraw- hill series in mechanical engineering. MCGraw – Hill, 1988.. 8.Meyer, J. Engine modeling of an internal combustion Engine with Twin independent cam bhasing, the ohio state University, 2007. 9.Martensson, J., oscarFlardh, Modeling the effect of variable cam phasing on volumetric efficiency. Scavenging and Torque Generation, SAE paper, 2010. 10.Lee, D. Enhancement of volumetric efficiency in Gaseous LPG injection engine. The 13 international pacific conference on Automative Engireeng.1999. 11.Lighty, L.C. Internal combustion engines, McGraw_Hill 1951. 12.Turn, R.C., Zhang, R., Cheng, M-F. Volumetric Efficiency Model for variable cam – phasing and variable valve lift Applications, SAE paper, 2008. 13.Saeedi, M. A Mean Value Internal Combustion Engine Model in Maplesim. A thesis presented to the University of Waterlloo, Ontario, Canada, 2010 14.Taguchi, G. et al. (2004). Computer-based robust engineering: essentials for DFSS. American Society for Quality, Quality Press. 15.Winterbone , D.E. Design techniques for engine manifolds, Professional engineering publishing ,1999. 16.Shakib S.E., Amidpour M., Aghanajafi C., Simulation and optimization of multi effect desalination coupled to agas turbine plant with HRSG consideration., Desalination, 2012. 17.Shamdani A.H., Shamekhi A.H., Ziabasharhagh M., Aghanajafi S. Modeling and simulation of a diesel engine common rail injector in matlab/simulink., 14th Annual (International) mechanical engineering conference, Isfahan university of technology, Isfahan, Iran, 2006. 18.Shamdani A.H., Shamekhi A.H., Ziabasharhagh M. Air-to-Fuel ratio control of a turbocharged diesel engine equipped with EGR using Fuzzy logic controller., papers.sae.org., 2007. Table 1- Investigated simulation parameters.
Stage Parameters Stage 1 Stage 2 Stage 3 Stage 4 Stage 5
Runners length 294mm 319mm 344mm 394mm 444mm Runners diameter 33mm 35mm 37mm 39mm 41mm
Throttle diameter 42mm 48mm 54mm 60mm 66mm
Surge tank volume 95*24* 77mm3
95*245*82mm3 100*250*87mm3
Omid minoofar et al. et al.
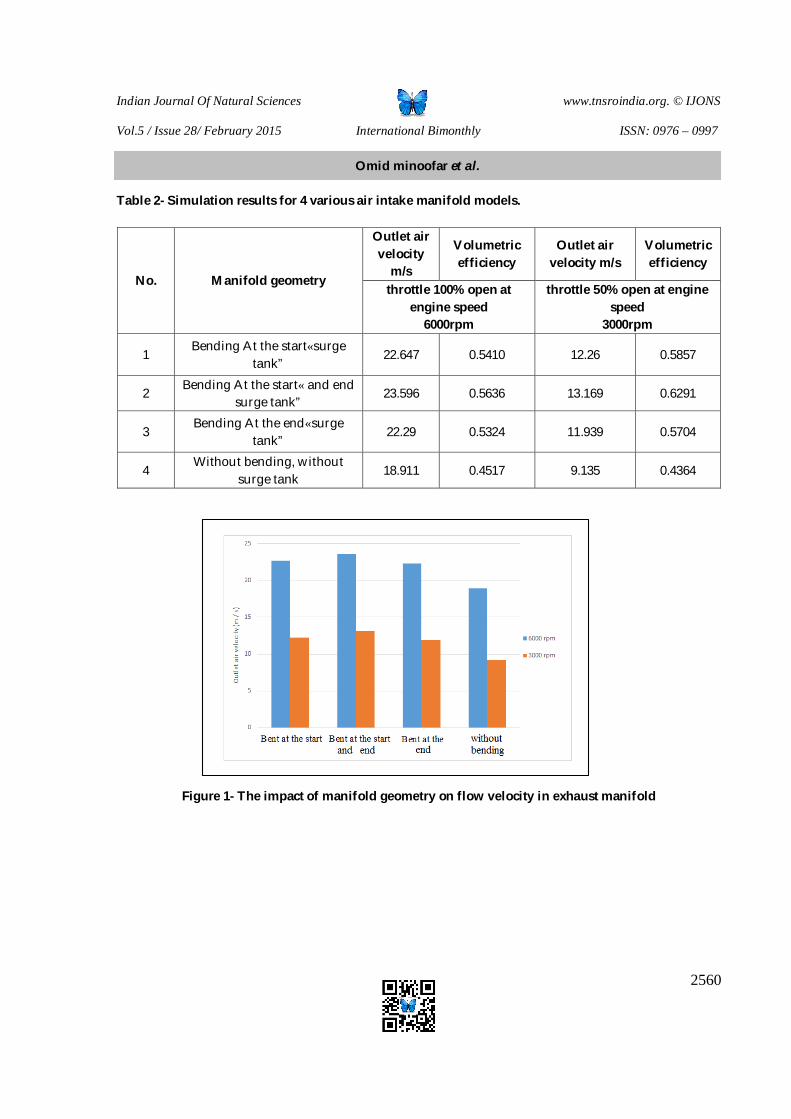
Indian Journal Of Natural Sciences www.tnsroindia.org. © IJONS
Vol.5 / Issue 28/ February 2015 International Bimonthly ISSN: 0976 – 0997
2560
Table 2- Simulation results for 4 various air intake manifold models.
Volumetric efficiency
Outlet air velocity m/s
Volumetric efficiency
Outlet air velocity
m/s Manifold geometry No.
throttle 50% open at engine speed
3000rpm
throttle 100% open at engine speed
6000rpm
0.5857 12.26 0.5410 22.647 Bending At the start«surge
tank” 1
0.6291 13.169 0.5636 23.596 Bending At the start« and end surge tank”
2
0.5704 11.939 0.5324 22.29 Bending At the end«surge
tank” 3
0.4364 9.135 0.4517 18.911 Without bending, without
surge tank 4
Figure 1- The impact of manifold geometry on flow velocity in exhaust manifold
Omid minoofar et al. et al.
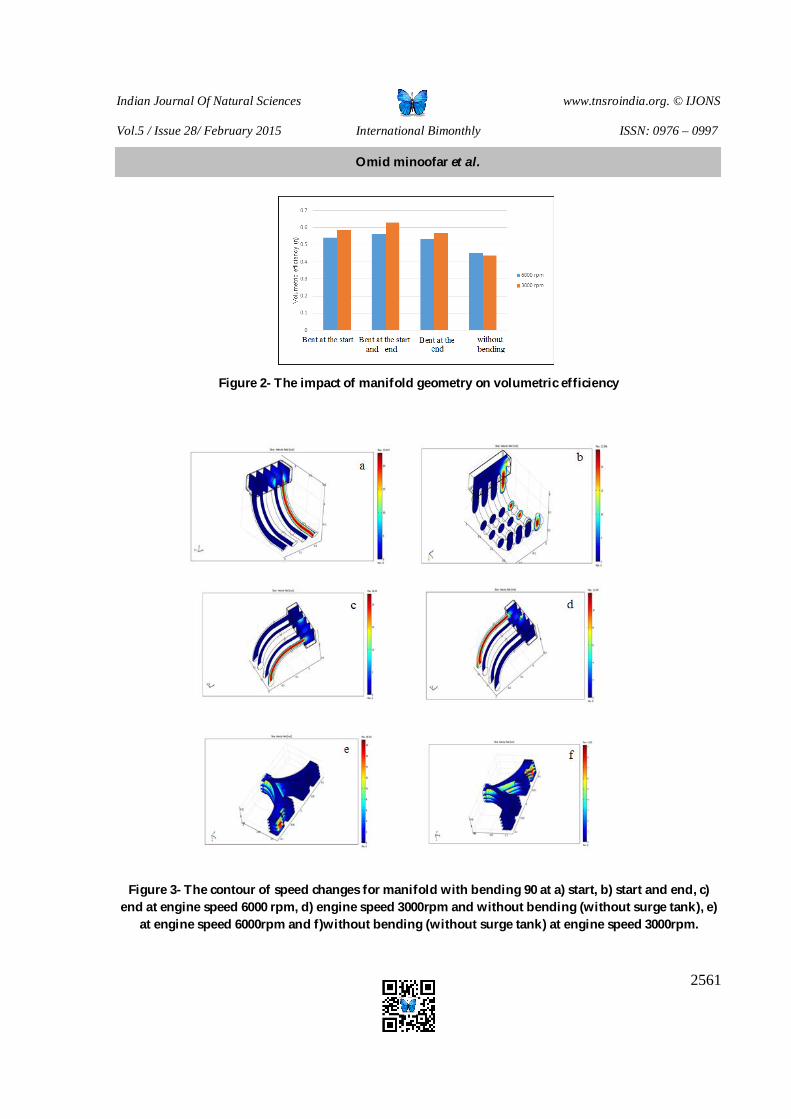
Indian Journal Of Natural Sciences www.tnsroindia.org. © IJONS
Vol.5 / Issue 28/ February 2015 International Bimonthly ISSN: 0976 – 0997
2561
Figure 2- The impact of manifold geometry on volumetric efficiency
Figure 3- The contour of speed changes for manifold with bending 90 at a) start, b) start and end, c)
end at engine speed 6000 rpm, d) engine speed 3000rpm and without bending (without surge tank), e) at engine speed 6000rpm and f)without bending (without surge tank) at engine speed 3000rpm.
Omid minoofar et al. et al.
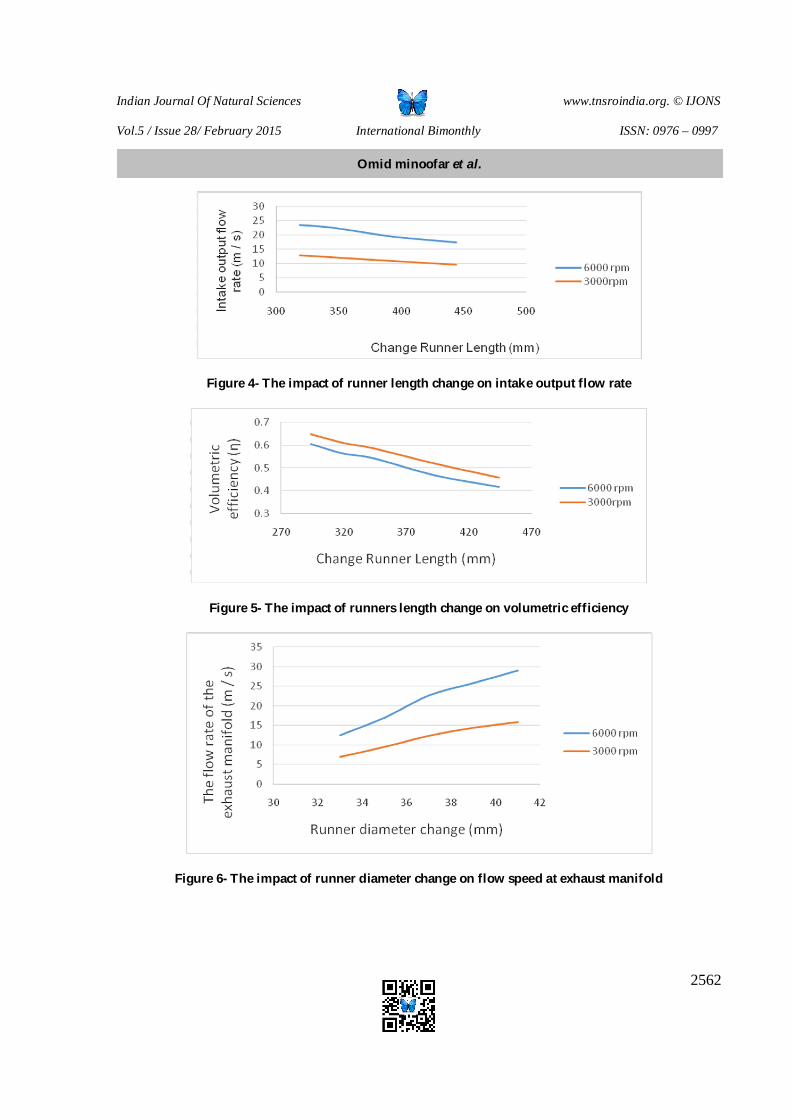
Indian Journal Of Natural Sciences www.tnsroindia.org. © IJONS
Vol.5 / Issue 28/ February 2015 International Bimonthly ISSN: 0976 – 0997
2562
Figure 4- The impact of runner length change on intake output flow rate
Figure 5- The impact of runners length change on volumetric efficiency
Figure 6- The impact of runner diameter change on flow speed at exhaust manifold
Omid minoofar et al. et al.
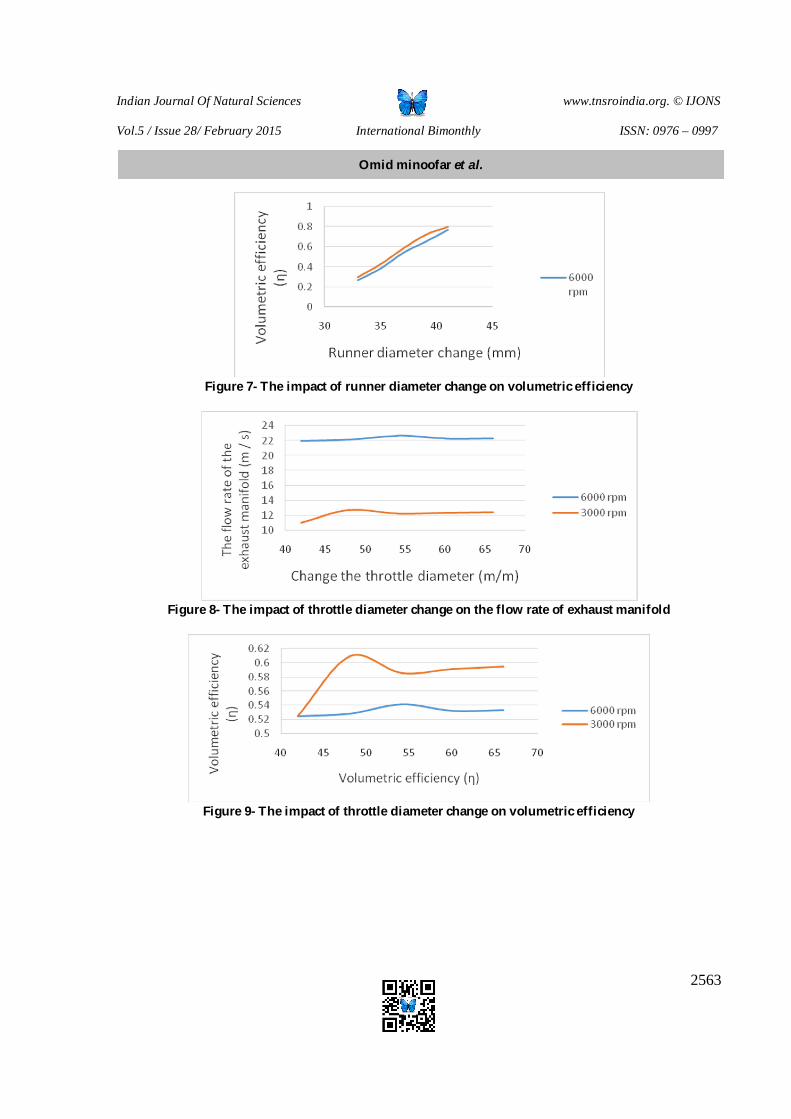
Indian Journal Of Natural Sciences www.tnsroindia.org. © IJONS
Vol.5 / Issue 28/ February 2015 International Bimonthly ISSN: 0976 – 0997
2563
Figure 7- The impact of runner diameter change on volumetric efficiency
Figure 8- The impact of throttle diameter change on the flow rate of exhaust manifold
Figure 9- The impact of throttle diameter change on volumetric efficiency
Omid minoofar et al. et al.
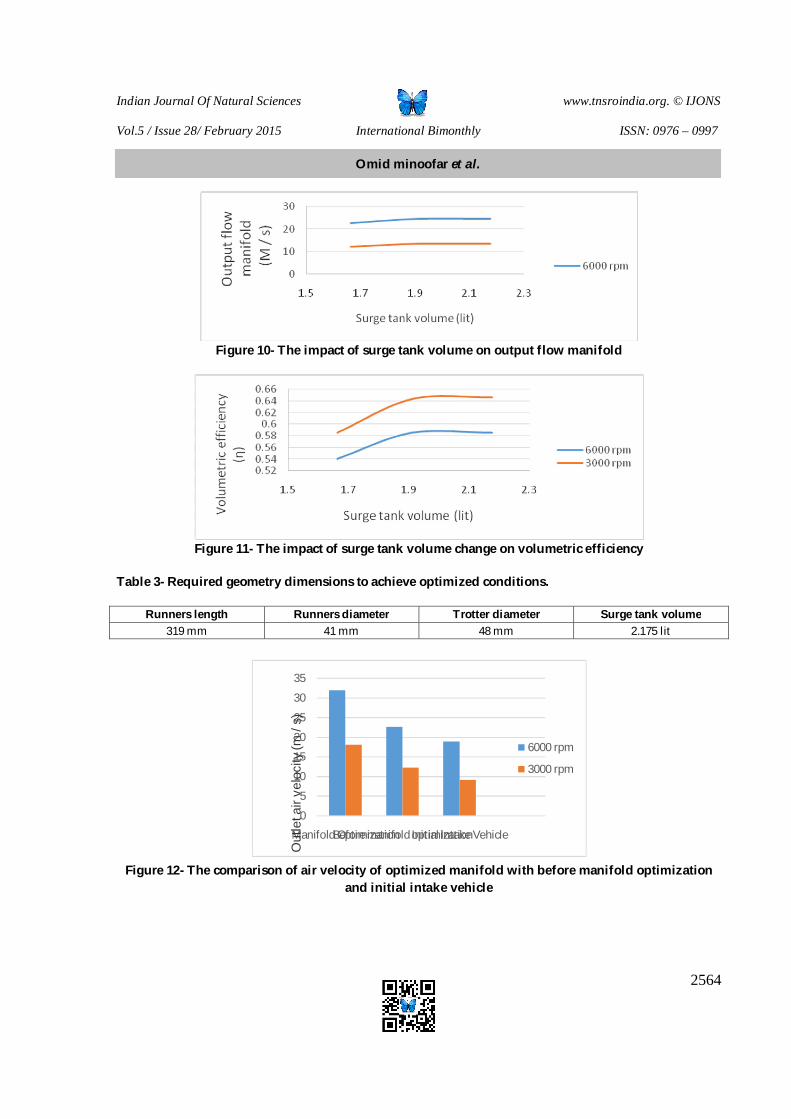
Indian Journal Of Natural Sciences www.tnsroindia.org. © IJONS
Vol.5 / Issue 28/ February 2015 International Bimonthly ISSN: 0976 – 0997
2564
Figure 10- The impact of surge tank volume on output flow manifold
Figure 11- The impact of surge tank volume change on volumetric efficiency
Table 3- Required geometry dimensions to achieve optimized conditions.
Surge tank volume Trotter diameter Runners diameter Runners length
2.175 lit 48 mm 41 mm 319 mm
0
5
10
15
20
25
30
35
Manifold OptimizationBefore manifold optimizationInitial Intake Vehicle
Out
let a
ir ve
loci
ty (m
/ s)
6000 rpm
3000 rpm
Figure 12- The comparison of air velocity of optimized manifold with before manifold optimization
and initial intake vehicle
Omid minoofar et al. et al.
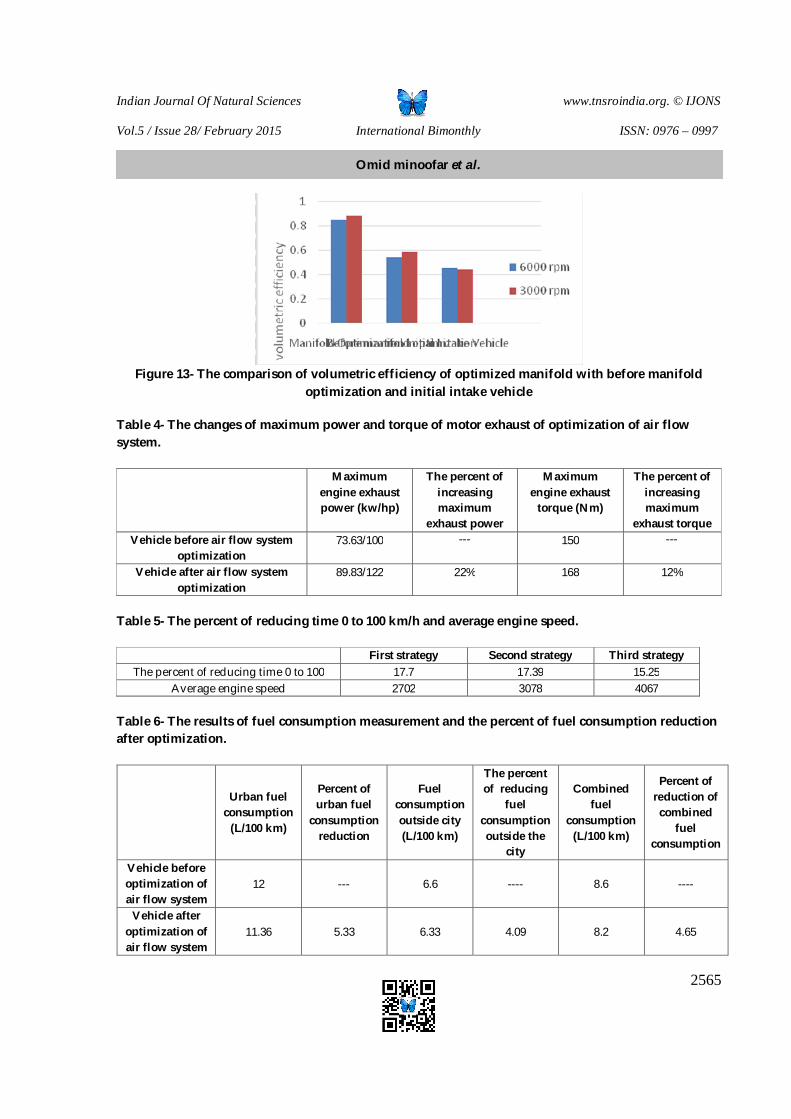
Indian Journal Of Natural Sciences www.tnsroindia.org. © IJONS
Vol.5 / Issue 28/ February 2015 International Bimonthly ISSN: 0976 – 0997
2565
Figure 13- The comparison of volumetric efficiency of optimized manifold with before manifold
optimization and initial intake vehicle
Table 4- The changes of maximum power and torque of motor exhaust of optimization of air flow system.
The percent of increasing maximum
exhaust torque
Maximum engine exhaust
torque (Nm)
The percent of increasing maximum
exhaust power
Maximum engine exhaust power (kw/hp)
--- 150 --- 73.63/100 Vehicle before air flow system optimization
12% 168 22% 89.83/122 Vehicle after air flow system optimization
Table 5- The percent of reducing time 0 to 100 km/h and average engine speed.
Third strategy Second strategy First strategy 15.25 17.39 17.7 The percent of reducing time 0 to 100 4067 3078 2702 Average engine speed
Table 6- The results of fuel consumption measurement and the percent of fuel consumption reduction after optimization.
Percent of reduction of
combined fuel
consumption
Combined fuel
consumption (L/100 km)
The percent of reducing
fuel consumption outside the
city
Fuel consumption outside city (L/100 km)
Percent of urban fuel
consumption reduction
Urban fuel consumption
(L/100 km)
---- 8.6 ---- 6.6 --- 12 Vehicle before optimization of air flow system
4.65 8.2 4.09 6.33 5.33 11.36 Vehicle after
optimization of air flow system
Omid minoofar et al. et al.

Indian Journal Of Natural Sciences www.tnsroindia.org. © IJONS
Vol.5 / Issue 28/ February 2015 International Bimonthly ISSN: 0976 – 0997
2566
Laboratory Study of CMA Impact on Skid Resistance of Road Surface
Seyed Ali Sahaf1 and Behnam Moradzadeh2*
1 Department of Civil Engineering, Engineering Faculty, Ferdowsi University of Mashhad, Mashhad, Iran 2Department of Civil Engineering, Engineering Faculty, Road and Transportation Branch, Ferdowsi University of Mashhad, Mashhad, Iran
Received: 30 Oct 2014 Revised: 15 Nov 2014 Accepted: 18 Dec 2014 *Address for correspondence Behnam Moradzadeh
Department of Civil Engineering, Engineering Faculty, Road and Transportation Branch, Ferdowsi University of Mashhad, Mashhad, Iran E.Mail: [email protected]
This is an Open Access Journal / article distributed under the terms of the Creative Commons Attribution License (CC BY-NC-ND 3.0) which permits unrestricted use, distribution, and reproduction in any medium, provided the
original work is properly cited. All rights reserved. Salt is generally used in order to prevent from freezing road surfaces, which is a cheap and established solution for defrosting. However, salt has some drawbacks which are mostly related to imposing heavy costs on road pavement and increasing road accidents in winter. Meanwhile, one appropriate material for defrosting road surface is calcium magnesium acetate (CMA) which can be used as a suitable alternative for salt. Impact of using CMA on skid resistance of road surfaces in winter is investigated and compared to the salt in this work. It is done in the form of a laboratory study conducting British Pendulum Test in accordance with Standard BS118 for samples of pavement including asphalt pavement, typical concrete pavement, self-compacting concrete and pavement with aggregate material. According to research findings, CMA increased skid resistance in all pavement samples compared to salt. To this end, CMA causes reduction in road accidents in winter by increasing skid resistance of the roads, and replacing it with salt in winter is recommended. Key words: Calcium magnesium acetate (CMA), skid resistance, salt, road pavement INTRODUCTION Pavement is considered as a national asset and considerable part of construction budget is allocated to repair and maintenance of road pavements. Negative impacts of frosting in vulnerable and mainly mountainous regions on skid resistance of the road surfaces is one of the main problems in this regards, which leads to loss of financial resources
ABSTRACT
RESEARCH ARTICLE
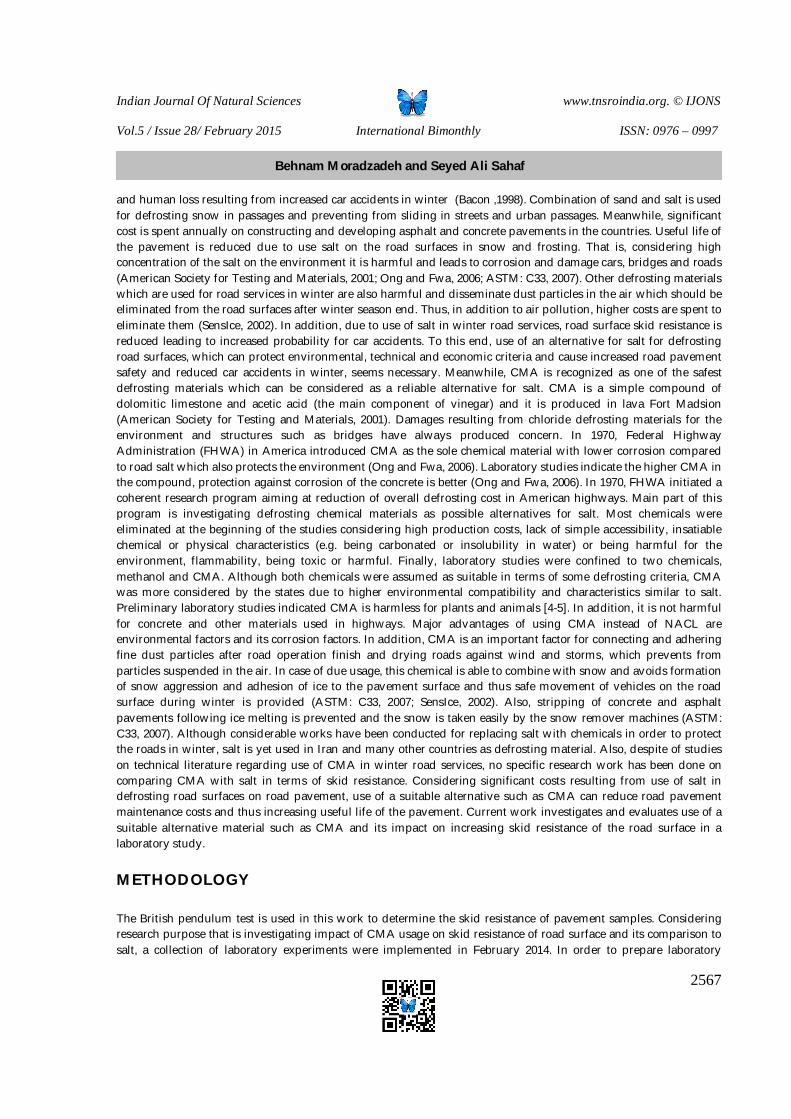
Indian Journal Of Natural Sciences www.tnsroindia.org. © IJONS
Vol.5 / Issue 28/ February 2015 International Bimonthly ISSN: 0976 – 0997
2567
and human loss resulting from increased car accidents in winter (Bacon ,1998). Combination of sand and salt is used for defrosting snow in passages and preventing from sliding in streets and urban passages. Meanwhile, significant cost is spent annually on constructing and developing asphalt and concrete pavements in the countries. Useful life of the pavement is reduced due to use salt on the road surfaces in snow and frosting. That is, considering high concentration of the salt on the environment it is harmful and leads to corrosion and damage cars, bridges and roads (American Society for Testing and Materials, 2001; Ong and Fwa, 2006; ASTM: C33, 2007). Other defrosting materials which are used for road services in winter are also harmful and disseminate dust particles in the air which should be eliminated from the road surfaces after winter season end. Thus, in addition to air pollution, higher costs are spent to eliminate them (SensIce, 2002). In addition, due to use of salt in winter road services, road surface skid resistance is reduced leading to increased probability for car accidents. To this end, use of an alternative for salt for defrosting road surfaces, which can protect environmental, technical and economic criteria and cause increased road pavement safety and reduced car accidents in winter, seems necessary. Meanwhile, CMA is recognized as one of the safest defrosting materials which can be considered as a reliable alternative for salt. CMA is a simple compound of dolomitic limestone and acetic acid (the main component of vinegar) and it is produced in lava Fort Madsion (American Society for Testing and Materials, 2001). Damages resulting from chloride defrosting materials for the environment and structures such as bridges have always produced concern. In 1970, Federal Highway Administration (FHWA) in America introduced CMA as the sole chemical material with lower corrosion compared to road salt which also protects the environment (Ong and Fwa, 2006). Laboratory studies indicate the higher CMA in the compound, protection against corrosion of the concrete is better (Ong and Fwa, 2006). In 1970, FHWA initiated a coherent research program aiming at reduction of overall defrosting cost in American highways. Main part of this program is investigating defrosting chemical materials as possible alternatives for salt. Most chemicals were eliminated at the beginning of the studies considering high production costs, lack of simple accessibility, insatiable chemical or physical characteristics (e.g. being carbonated or insolubility in water) or being harmful for the environment, flammability, being toxic or harmful. Finally, laboratory studies were confined to two chemicals, methanol and CMA. Although both chemicals were assumed as suitable in terms of some defrosting criteria, CMA was more considered by the states due to higher environmental compatibility and characteristics similar to salt. Preliminary laboratory studies indicated CMA is harmless for plants and animals [4-5]. In addition, it is not harmful for concrete and other materials used in highways. Major advantages of using CMA instead of NACL are environmental factors and its corrosion factors. In addition, CMA is an important factor for connecting and adhering fine dust particles after road operation finish and drying roads against wind and storms, which prevents from particles suspended in the air. In case of due usage, this chemical is able to combine with snow and avoids formation of snow aggression and adhesion of ice to the pavement surface and thus safe movement of vehicles on the road surface during winter is provided (ASTM: C33, 2007; SensIce, 2002). Also, stripping of concrete and asphalt pavements following ice melting is prevented and the snow is taken easily by the snow remover machines (ASTM: C33, 2007). Although considerable works have been conducted for replacing salt with chemicals in order to protect the roads in winter, salt is yet used in Iran and many other countries as defrosting material. Also, despite of studies on technical literature regarding use of CMA in winter road services, no specific research work has been done on comparing CMA with salt in terms of skid resistance. Considering significant costs resulting from use of salt in defrosting road surfaces on road pavement, use of a suitable alternative such as CMA can reduce road pavement maintenance costs and thus increasing useful life of the pavement. Current work investigates and evaluates use of a suitable alternative material such as CMA and its impact on increasing skid resistance of the road surface in a laboratory study. METHODOLOGY The British pendulum test is used in this work to determine the skid resistance of pavement samples. Considering research purpose that is investigating impact of CMA usage on skid resistance of road surface and its comparison to salt, a collection of laboratory experiments were implemented in February 2014. In order to prepare laboratory
Behnam Moradzadeh and Seyed Ali Sahaf
Indian Journal Of Natural Sciences www.tnsroindia.org. © IJONS
Vol.5 / Issue 28/ February 2015 International Bimonthly ISSN: 0976 – 0997
2568
samples for testing impact of CMA on skid resistance of the road surface, asphalt samples under road traffic load, concrete samples, self-compacting concrete samples and pavement with aggregate material samples were used. Asphalt samples were prepared from different parts of the road in width and length of the road and in arcs (Fig. 1). Asphalt samples removed from road surfaces were delivered to the stonework factory in order to cut and prepare laboratory samples. Asphalt samples were cut in 10 × 20 cm dimensions in stonework factory. Also, concrete samples were prepared in 15 × 15 cm dimensions, aggregate samples were cut in more than two aspects in 10 × 20 cm dimensions and self-compacting concrete samples were prepared in 10 × 20 cm dimensions for laboratory samples. Fig 2 indicates aggregate samples with more than two fractures and concrete samples cut in stonework factory. British pendulum device was established in laboratory according to Fig 3. Considering thickness of pavement samples, bases of the device were leveled. In order to fix the device, the bolt behind the device was fixed. The samples were placed on the ground in the place for locating samples on British pendulum device as shown in Figs 3 – 7. Device’s hoof is part of British pendulum device which is 12.6 cm in length and 7.6 cm in width. The sample is moved so that the start and end of hoof is located on the sample. It is done according to standard BS118. To this end, a ruler with fixed length of 12.6 cm is used. It should be noted effective skid length and width is obtained in the respective length and width, otherwise the values are not valid. Then a heavy metal plate is placed before the sample along with a weight on it, so that the sample is not moved horizontally when hoof passes through the sample. Indicator or the black pointer is taken to the point where the arm is fixed, and it is parallel to the arm. Following ensuring mentioned steps, firstly water is poured on the sample so that it is fully wet. The water should be left on the sample for a while. Then, toggle of the pendulum arm, placed at top and right side of device beside black indicator, is pressed and the arm passes through the sample with specific speed and black indicator is also moved along with, and moves toward dial where skid values are written. At the same time, indicator shows skid value on the dial. Of course after passing arm through the sample, the arm should be kept so that it is not returned, otherwise the black indicator is moved backward and a wrong value would be shown. These steps were conducted 5 times in two stages on each sample. Read values were written down on a table and average of the values was calculated which is skid value for the used solution. Results obtained from experiments will be analyzed in the next section. These steps were repeated for salt and skid value was obtained. Then, each sample was fully rinsed with water so that no effect of salt is left. Plastic hoof of the device was also rinsed so that no salt is left. Previous steps were repeated again using water and skid value was read and written. Then, CMA solution was poured on samples and previous steps were repeated and skid value was written. Also, placement of metal plate for lack of sample movement in hoof passage over the samples is shown. Figs 8 and 9 show pouring salt water and CMA solution on pavement samples.
RESULTS According to conducted experiments and due to utilizing larger statistical population (various pavement samples), types of pavements were used for comparison. Tables 1 – 5 give measurement of skid for asphalt concrete pavements using CMA, NACL and water. The experiment was repeated in two stages and each five steps were repeated according to standard BS118 for each defrosting material solution and water (criterion for comparison in this experiment). Values in the tables should not differ more than ±3 units; otherwise the experiment should be repeated. Possible errors may be due to low solution volume on the sample or lack of device balance or improper hoof setting on the sample. Average was calculated from each 5 values of skid and it is averaged with the average in the next step. Resulting value is recorded as skid value for asphalt sample for the respective solution. As observed in SD column in Table 1, in asphalt concrete sample from road length, the sample with CMA showed more coherent SD is obtained compared to testing sample with salt. It is because of CMA nature which prevents from separation of asphalt granules and reduction of sample’s skid resistance. Also, close results in asphalt sample with
Behnam Moradzadeh and Seyed Ali Sahaf

Indian Journal Of Natural Sciences www.tnsroindia.org. © IJONS
Vol.5 / Issue 28/ February 2015 International Bimonthly ISSN: 0976 – 0997
2569
CMA and salt is due to the fact that British pendulum device polishes all samples identically, thus in statistical analysis with comparison of their SD it is observed. Skid level is reduced by about 5 units with salt in Table 1, while CMA does not reduce skid level. It suggests negative impact of NACL solution on skid resistance of the road surfaces. In fact skid resistance of CMA is higher compared to salt. Fig 10 shows comparison of asphalt pavement’s skid resistance along road length with defrosting solutions and water using results of British pendulum test. According to Fig 10, for asphalt pavement sample from road length, it is observed that NACL reduces skid resistance of road surface, while CMA in asphalt pavement samples does not reduce skid resistance of road surface. Thus, CMA is effective in reduction car accidents on asphalt pavement in winter. According to Table 2 and Fig 11, for asphalt concrete sample in the location distant to the road similar to sample from asphalt from road length, skid resistance values resulting from British pendulum test have more coherent SDs, which is an important advantage for increasing pavement life in winter considering CMA nature. To this end, asphalt compound made of Bitumen, sand, granules of filler and some materials modifying asphalt properties such as polymers, phosphoric acid and hydrated lime will not suffer from separation of granules because of CMA solution usage in winter road services. It is an essential and general problem for asphalt pavement in the roads because of salt usage. Since asphalt pavement is vulnerable to severe humidity resulting from snow and rain in winter, granular separation from the asphalt occurs in higher speed, and salt accelerates this process. However, if CMA is used instead of salt, speed of asphalt pavement destruction is reduced and pavement life is increased. According to Fig 11, CMA increased skid resistance by 4.5 units compared to salt in asphalt pavement selected from distant road section. Fig 11. Comparison of asphalt pavement’s skid resistance along road with defrosting solution and water. Table 3 gives results of British pendulum test for concrete pavement sample. According to Table 3 for concrete pavement sample, results of British pendulum test with CMA give more coherent SD than sample with salt. Concrete pavements have higher supporting surface because of dense gradation and more continuous and contact with vehicle tires and skid resistance in these pavements is higher than asphalt pavement. Thus, CMA solution in concrete pavement sample shows better values compared to asphalt pavement in terms of skid resistance, and use of CMA is recommended in concrete pavements in winter road services.
According to Fig 12, skid resistance level is reduced by 9 units in salt sample compared to water sample, while CMA reduces skid resistance by 1.7 unit compared to water. Skid resistance of CMA is higher than salt and it shows 2.3 units of increase compared to asphalt pavements. That is, concrete pavements have higher supporting surface because of dense gradation and more continuous and contact with vehicle tires and skid resistance in these pavements is higher than asphalt pavement. Table 4 gives results of British Pendulum Test for pavements and parking lots made of self-compacting concrete. For pavement sample with Self-compacting concrete, skid resistance values reported based on British Pendulum Test show almost similar SD for salt and CMA. It can be due to structure of self-compacting concrete and its highly resistant compound against salt and CMA. Fig 13 shows comparison of skid resistance in self -compacting concrete with defrosting solutions and water. According to Fig 13, skid resistance is reduced by 8.93 units by salt compared to water, while CMA resistance skid resistance by 0.37 units compared to water. In other words, skid resistance of CMA is higher compared to salt and skid resistance of CMA is increased in self-compacting concrete compared to other pavements. Table 5 gives skid values according to British Pendulum Test results for aggregate pavement and parking lots. Skid resistance values have similar SD for pavement sample with aggregate materials and it is mainly due to different stone crushing operation following extraction of stones from mines. It should be noted that the best type of aggregate for usage in surface is square shape in terms of skid resistance. While it is clear that stones of surfaces are not similar to square, and it is due to lack of appearance similarity in samples that statistical differences are evident in aggregate pavement compared to other pavement samples. Also, Fig 14 shows comparison of aggregate pavement’s skid
Behnam Moradzadeh and Seyed Ali Sahaf
Indian Journal Of Natural Sciences www.tnsroindia.org. © IJONS
Vol.5 / Issue 28/ February 2015 International Bimonthly ISSN: 0976 – 0997
2570
resistance with defrosting solutions and water. According to Fig 14 in pavement with aggregate materials, CMA increases skid resistance by 5.7 units than salt in comparison with water.Fig 15 shows comparison of various types of pavements in terms of skid resistance with defrosting materials and water
According to Fig 15, CMA increases skid resistance in all pavement types compared to salt. The reason for increased resistance in concrete pavement compared to asphalt and aggregate pavements is dense surface in concrete pavement. In this case, tire’s supporting surface with pavement is more and skid resistance is increased. To this end, according to table results taken from British Pendulum Test for various pavement types, skid value for water and CMA is 83 units in average and it is 74 units for salt in self-compacting concrete pavement and asphalt pavement as 65 and 55. Thus, CMA had skid as drinking water, while salt reduces skid resistance by 10 units, and car accidents are increased and road safety is reduced for passengers because of skid resistance reduction. Pavement samples made of more continuous and dense granules showed better values compared to samples with discrete granules due to more supporting surface with the tire. Also, CMA solution adheres on pavement samples and stays on the sample surface, while salt lacks such property and it is suspended in air like dust. Thus, CMA can be used for defrosting roads in more frequencies and since it is not disseminated in air, it is not harmful to the environment, while dissemination of salt in the air may damage environment and cause corrosion of road related facilities.
CONCLUSION
Combination of sand and salt is used for defrosting snow in passages and preventing from sliding in streets and urban passages. Although urban environmentalexpects have frequently warned on harmful consequences of salt usage for defrosting and its impact on urban environment, salt is yet used as the major defrosting material in Iranian streets and urban passages in Iran due to higher cost of other defrosting methods which are now used in other countries. (CMA) can be used as a suitable alternative for salt. Impact of using CMA on skid resistance of road surfaces in winter is investigated and compared to the salt in this work. It is done in the form of a laboratory study conductingBritish Pendulum Test in accordance with Standard BS118 for samples of pavement including asphalt pavement, typical concrete pavement, self-compacting concrete and pavement with aggregate material. The main findings in the current work include as follows CMA increases skid resistance compared to salt in all pavements (asphalt pavement, typical concrete pavement, self-compacting concrete and pavement with aggregate material).
Use of salt in all types of pavement reduces skid resistance of road surface.
According to results of British Pendulum Test for different types of pavement, skid value for water and CMA is 83 units in average and it is 74 units for salt in self-compacting concrete pavement and asphalt pavement as 65 and 55. Thus, CMA had skid as drinking water, while salt reduces skid resistance by 10 units, and car accidents are increased and road safety is reduced for passengers because of skid resistance reduction.Pavement samples made of more continuous and dense granules showed better values compared to samples with discrete granules due to more supporting surface with the tire. To this end, considering weakness of asphalt pavements in stone axes, which often are accompanied by ruggedness, long waves and sometimes fracture concrete material as a stable and resistant pavement cause elimination of the problems and shortening repair period.CMA solution adheres on pavement samples and stays on the sample surface, while salt lacks such property and it is suspended in air like dust. Thus, CMA can be used for defrosting roads in more frequencies and since it is not disseminated in air, it is not harmful to the environment, while dissemination of salt in the air may damage environment and cause corrosion of road related facilities.
Behnam Moradzadeh and Seyed Ali Sahaf
Indian Journal Of Natural Sciences www.tnsroindia.org. © IJONS
Vol.5 / Issue 28/ February 2015 International Bimonthly ISSN: 0976 – 0997
2571
REFERENCES 1. Bacon R., (1998), “Deicing Chemical Use on the Michigan State”, Michigan Department of Transportation. ISBN:0-87371-705-8 2.American Society for Testing and Materials, (2001), E 274-97 Standard Test Method for Skid Resistance of Paved Surfaces Using a Full-Scale Tire. Annual Book of ASTM Standards, Volume 04-01. Available from: http://www.astm.org/Standards/E274.html. 3. Ong, G. P. and Fwa, T. F. (2006) "Transverse pavement grooving against hydroplaning. I:Simulation model", Journal of Transportation Engineering, Vol. 132, No. 6, pp. 441-448. Available from: http://dx.doi.org/10.1061/(ASCE)0733-947X(2006)132:6(441) 4.ASTM: C33 (2007) "Specification for concrete aggregates", Book of ASTM Standards, Vol.04.02: Concrete and Aggregates, ASTM International, West Conshohocken, United States. Available from: http://www.astm.org/Standards/C33.html. 5. Sens Ice, (2002), Sweden organization and management of road maintenance, 2/b.6638 report.
Fig 1. Asphalt samples prepared by removing Fig 2. Concrete samples cut in 5road surface stonework factory
Fig. 3 Fig. 4 Fig. 5 Fig.6 Fig 3. View of British pendulum device (swinging friction) in pavement laboratory Fig 4. Locating aggregate sample in British pendulum device Fig 5. Locating asphalt sample in British pendulum device Fig 6. Locating concrete sample in British pendulum device
Behnam Moradzadeh and Seyed Ali Sahaf

Indian Journal Of Natural Sciences www.tnsroindia.org. © IJONS
Vol.5 / Issue 28/ February 2015 International Bimonthly ISSN: 0976 – 0997
2572
Fig. 7 Fig. 8 Fig. 9
Fig 7. Locating self-compacting concrete sample in British pendulum device Fig 8. Pouring salt solution on samples Fig 9. Pouring CMA solution on samples Table 1: Results of British pendulum test for asphalt concrete sample
PN Asphalt concrete sample
from road
length distant to road
SD Total
average
Average 5
4
3
2
1
0.55 63.7
63.4 63 63 64 64 63 Water
0 64 64 64 64 64 64
0.55 59.7
59.7 60. 60 60 59 59 Salt
0.45 59.8 60 60 59 60 60
0.45 64.8
64.8 65 64 65 65 65 Water
0 65 65 65 65 65 65
0.55 64.6
64.6 65 64 65 64 65 CMA
0.55 64.6 64 64 65 65 65
0.45 64.3
64.2 64 65 64 64 64 Water
0.55 64.4 64 64 64 65 65
Behnam Moradzadeh and Seyed Ali Sahaf
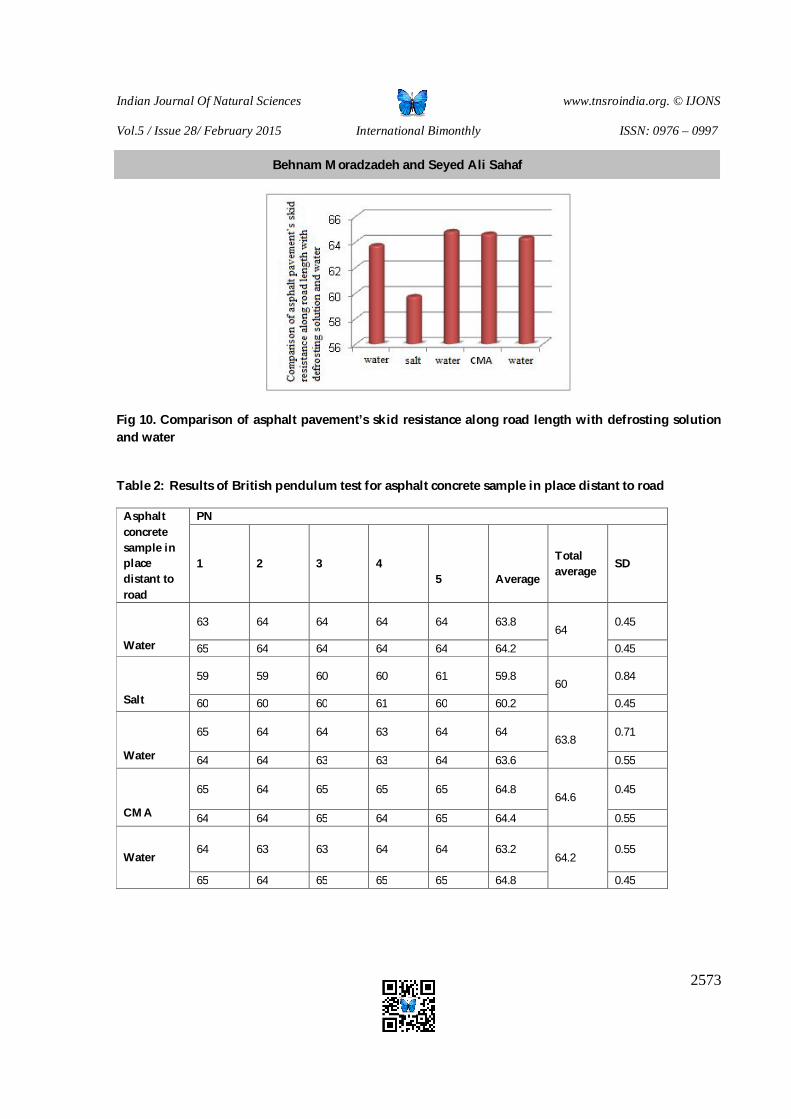
Indian Journal Of Natural Sciences www.tnsroindia.org. © IJONS
Vol.5 / Issue 28/ February 2015 International Bimonthly ISSN: 0976 – 0997
2573
Fig 10. Comparison of asphalt pavement’s skid resistance along road length with defrosting solution and water
Table 2: Results of British pendulum test for asphalt concrete sample in place distant to road
PN Asphalt concrete sample in place distant to road
SD Total average
Average
5 4 3 2 1
0.45 64
63.8 64 64 64 64 63
Water 0.45 64.2 64 64 64 64 65
0.84 60
59.8 61 60 60 59 59
Salt 0.45 60.2 60 61 60 60 60
0.71 63.8
64 64 63 64 64 65
Water 0.55 63.6 64 63 63 64 64
0.45 64.6
64.8 65 65 65 64 65
CMA 0.55 64.4 65 64 65 64 64
0.55 64.2
63.2 64 64 63 63 64 Water
0.45 64.8 65 65 65 64 65
Behnam Moradzadeh and Seyed Ali Sahaf
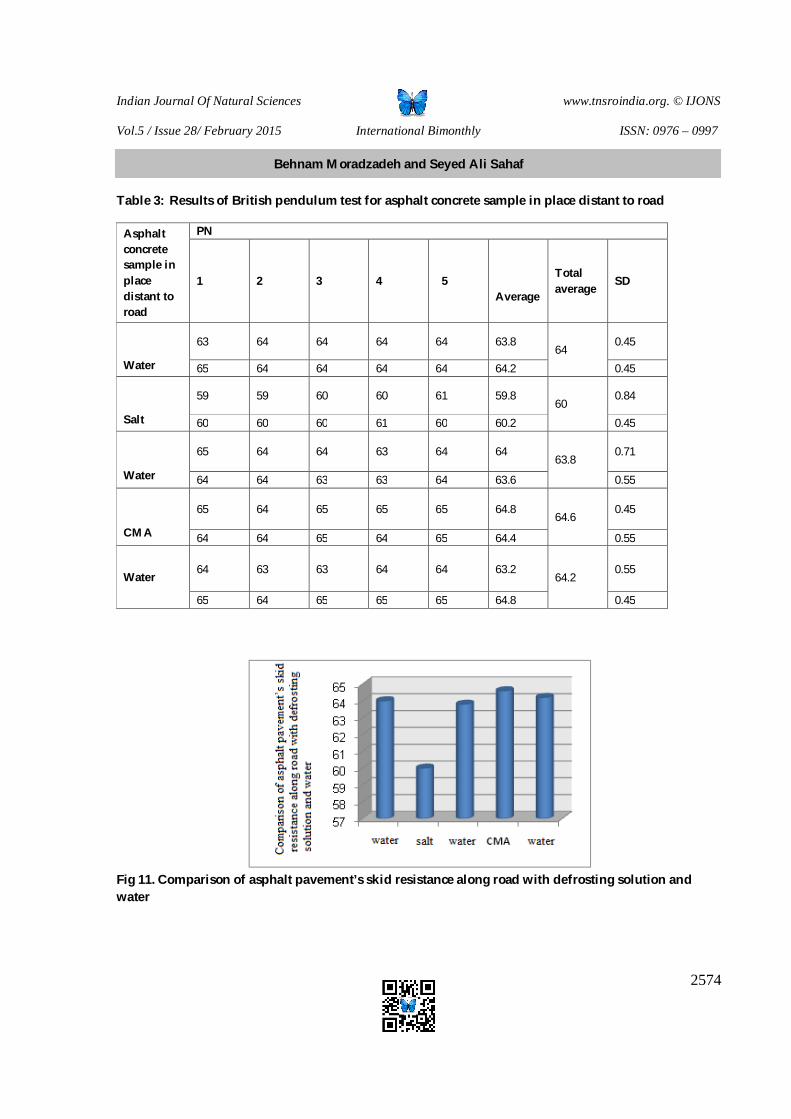
Indian Journal Of Natural Sciences www.tnsroindia.org. © IJONS
Vol.5 / Issue 28/ February 2015 International Bimonthly ISSN: 0976 – 0997
2574
Table 3: Results of British pendulum test for asphalt concrete sample in place distant to road
PN Asphalt concrete sample in place distant to road
SD Total average
Average 5 4 3 2 1
0.45 64
63.8 64 64 64 64 63
Water 0.45 64.2 64 64 64 64 65
0.84 60
59.8 61 60 60 59 59
Salt 0.45 60.2 60 61 60 60 60
0.71 63.8
64 64 63 64 64 65
Water 0.55 63.6 64 63 63 64 64
0.45 64.6
64.8 65 65 65 64 65
CMA 0.55 64.4 65 64 65 64 64
0.55 64.2
63.2 64 64 63 63 64 Water
0.45 64.8 65 65 65 64 65
Fig 11. Comparison of asphalt pavement’s skid resistance along road with defrosting solution and water
Behnam Moradzadeh and Seyed Ali Sahaf
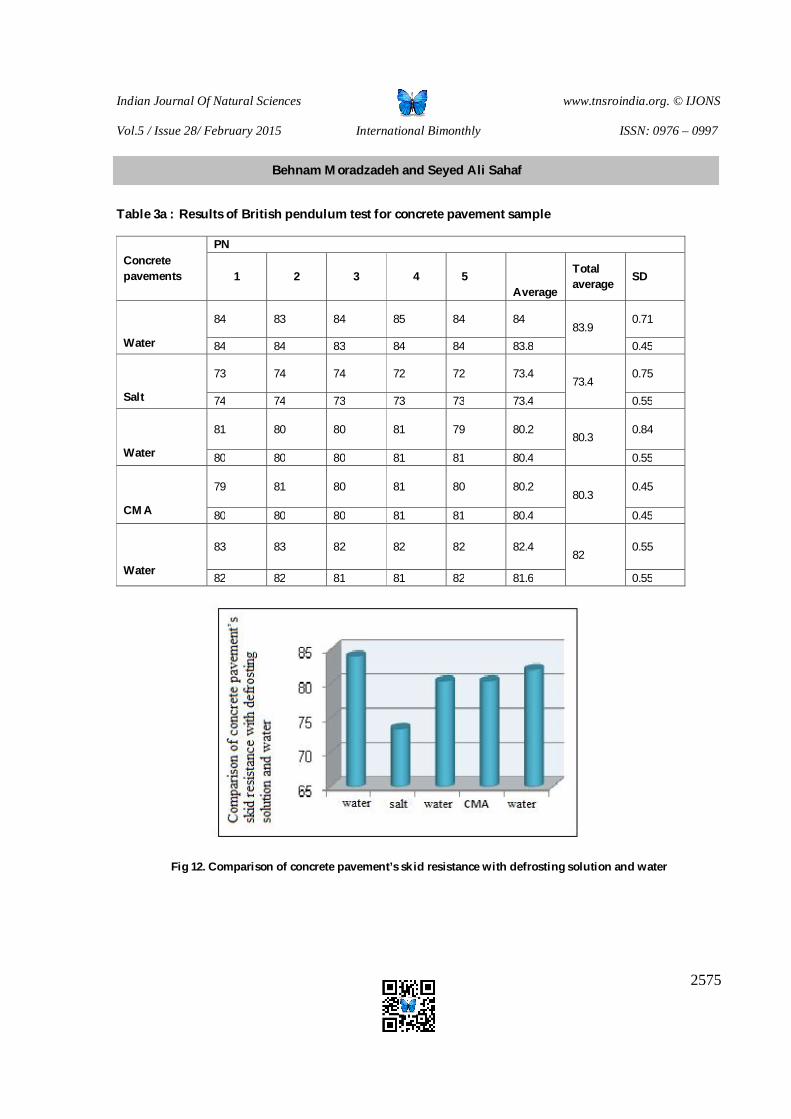
Indian Journal Of Natural Sciences www.tnsroindia.org. © IJONS
Vol.5 / Issue 28/ February 2015 International Bimonthly ISSN: 0976 – 0997
2575
Table 3a : Results of British pendulum test for concrete pavement sample
PN Concrete pavements SD
Total average
Average 5 4 3 2 1
0.71 83.9
84 84 85 84 83 84
Water 0.45 83.8 84 84 83 84 84
0.75 73.4
73.4 72 72 74 74 73
Salt 0.55 73.4 73 73 73 74 74
0.84 80.3
80.2 79 81 80 80 81
Water 0.55 80.4 81 81 80 80 80
0.45 80.3
80.2 80 81 80 81 79
CMA 0.45 80.4 81 81 80 80 80
0.55 82
82.4 82 82 82 83 83
Water 0.55 81.6 82 81 81 82 82
Fig 12. Comparison of concrete pavement’s skid resistance with defrosting solution and water
Behnam Moradzadeh and Seyed Ali Sahaf
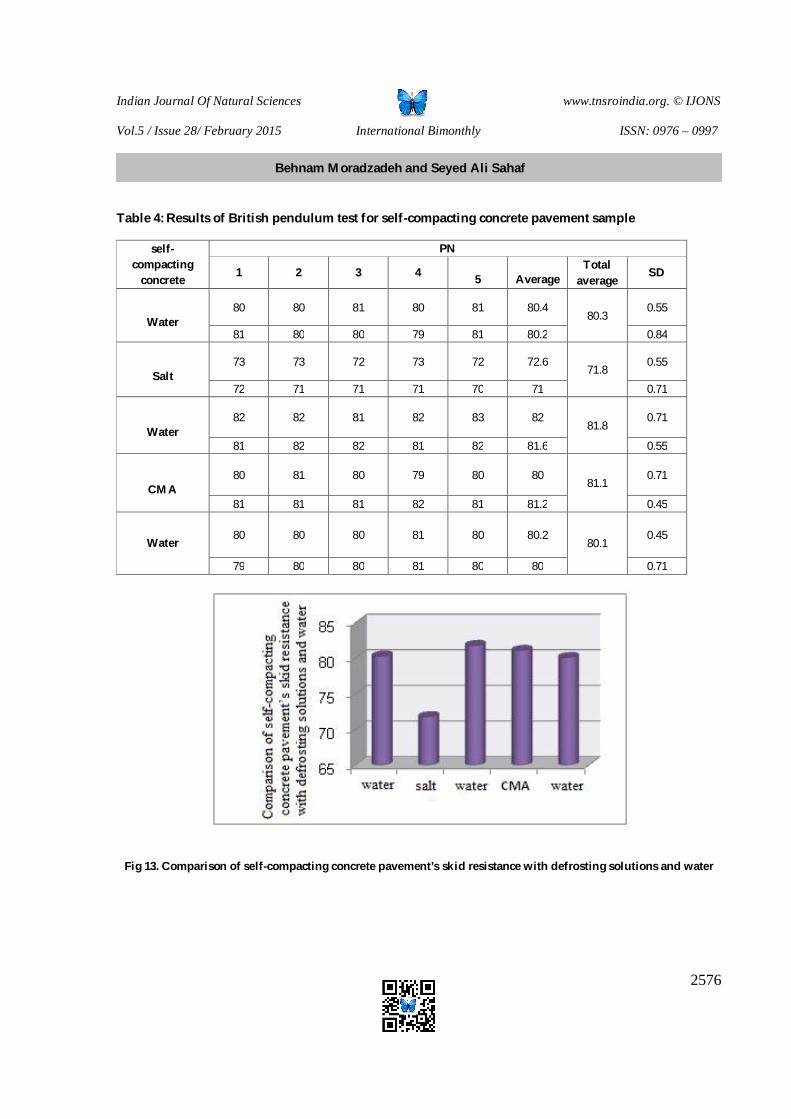
Indian Journal Of Natural Sciences www.tnsroindia.org. © IJONS
Vol.5 / Issue 28/ February 2015 International Bimonthly ISSN: 0976 – 0997
2576
Table 4: Results of British pendulum test for self-compacting concrete pavement sample
PN self-compacting
concrete SD
Total average
Average
5 4 3 2 1
0.55 80.3
80.4 81 80 81 80 80 Water
0.84 80.2 81 79 80 80 81
0.55 71.8
72.6 72 73 72 73 73 Salt
0.71 71 70 71 71 71 72
0.71 81.8
82 83 82 81 82 82 Water
0.55 81.6 82 81 82 82 81
0.71 81.1
80 80 79 80 81 80 CMA
0.45 81.2 81 82 81 81 81
0.45 80.1
80.2 80 81 80 80 80 Water
0.71 80 80 81 80 80 79
Fig 13. Comparison of self-compacting concrete pavement’s skid resistance with defrosting solutions and water
Behnam Moradzadeh and Seyed Ali Sahaf
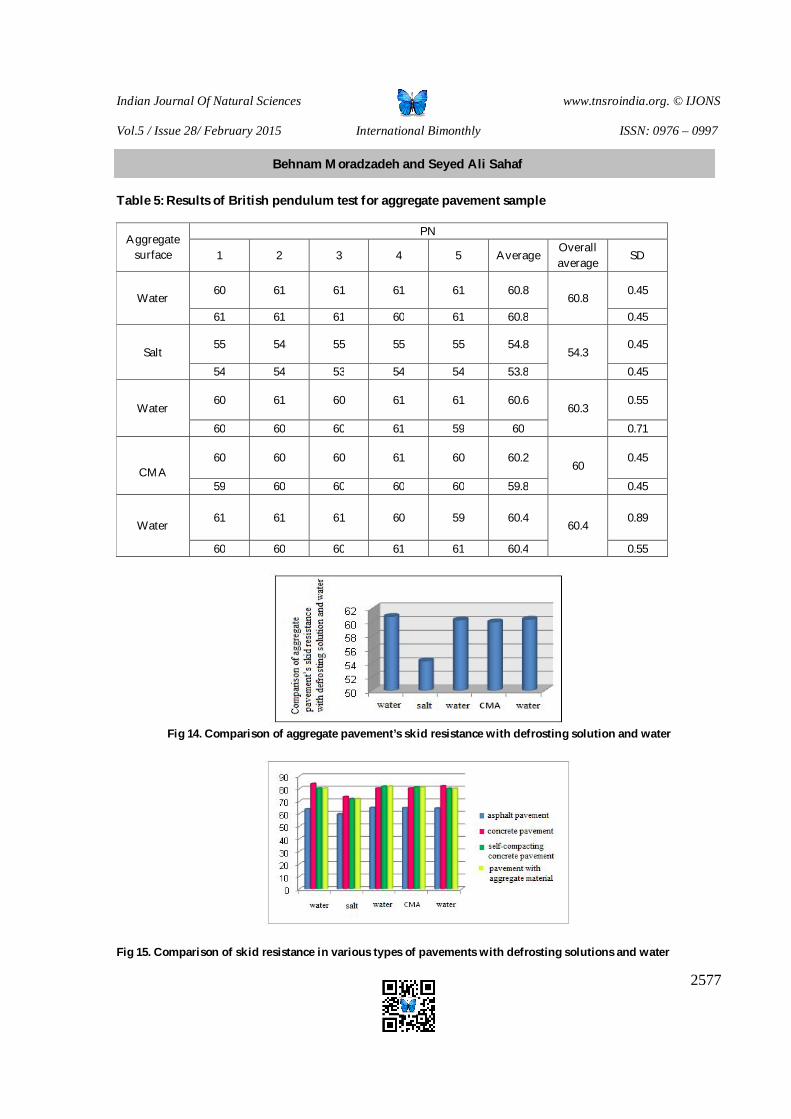
Indian Journal Of Natural Sciences www.tnsroindia.org. © IJONS
Vol.5 / Issue 28/ February 2015 International Bimonthly ISSN: 0976 – 0997
2577
Table 5: Results of British pendulum test for aggregate pavement sample
PN Aggregate
surface SD Overall average
Average 5 4 3 2 1
0.45 60.8
60.8 61 61 61 61 60 Water
0.45 60.8 61 60 61 61 61
0.45 54.3
54.8 55 55 55 54 55 Salt
0.45 53.8 54 54 53 54 54
0.55 60.3
60.6 61 61 60 61 60 Water
0.71 60 59 61 60 60 60
0.45 60
60.2 60 61 60 60 60 CMA
0.45 59.8 60 60 60 60 59
0.89 60.4
60.4 59 60 61 61 61 Water
0.55 60.4 61 61 60 60 60
Fig 14. Comparison of aggregate pavement’s skid resistance with defrosting solution and water
Fig 15. Comparison of skid resistance in various types of pavements with defrosting solutions and water
Behnam Moradzadeh and Seyed Ali Sahaf
Indian Journal Of Natural Sciences www.tnsroindia.org. © IJONS
Vol.5 / Issue 28/ February 2015 International Bimonthly ISSN: 0976 – 0997
2578
Evaluating the Situation of Street children in Turkey, India, Brazil, South Africa and Russia
Katayoun Rahvari1* and Seyed Mohammad Hashemi2
1Ph.D.Student of Public Law, Department of Public and International Law, College of Law and Political Science, Tehran Science and Research Branch, Islamic Azad University, Tehran, Iran. 2Full Professor, Department of Public and International Law, College of Law and Political Science, Tehran Science and Research Branch, Islamic Azad University, Tehran, Iran. Received:19 Nov 2014 Revised: 8 Dec 2014 Accepted:18 Dec 2014 *Address for correspondence Katayoun Rahvari
Ph.D.Student of Public Law, Department of Public and International Law, College of Law and Political Science, Tehran Science and Research Branch, Islamic Azad University, Tehran, Iran. E.Mail: [email protected]
This is an Open Access Journal / article distributed under the terms of the Creative Commons Attribution License (CC BY-NC-ND 3.0) which permits unrestricted use, distribution, and reproduction in any medium, provided the original work is properly cited. All rights reserved. Street children are social problems challenging cities, especially large cities, and modern societies with any development level; it is known as an undeniable social reality. However, there are many debates on the definition of street children and it is not possible to present a complete and accurate definition that satisfies consent and approval of all researchers and scholars. Thus, it should be noted that all definitions contain street as the key element and the main location of the Kids in which they spend most of their times. Moreover, street id the main center of their livelihood and the kids are not protected and supported properly by their parents. Their concentration on streets together in groups, teams and bands have created many improper situations resulting in undesirable or dangerous conditions. However, studying the conditions governing their life in some countries like Asian, African, European and Latin America will be important. Keywords: Disasters and Disease, Education, Poverty, Rules and Regulations, Street Children, Sexual Abuse, Trafficking.
ABSTRACT
RESEARCH ARTICLE
Indian Journal Of Natural Sciences www.tnsroindia.org. © IJONS
Vol.5 / Issue 28/ February 2015 International Bimonthly ISSN: 0976 – 0997
2579
Turkey Street children have manifested as a major social problem in Turkey. Due to their increasing number, family problems appear to be a major cause. There are nearly ten thousand street kids in the cities of Ankara and Istanbul; recent studies on the phenomenon of street children in Turkey suggest that it has been occurred due to families’ negligence in the supervision and maintenance of their children. More than 76% of the children said that they have turned to vagrancy due to mistreatment of parents who are separated by divorce and 39% of these children state their parents are addicted to drugs or alcohol (Niazi, 2008). It is clear that increasing number of street children is one driver of rising crime. Thus, it is necessary for Government of Turkey to implement necessary measures. In this regard, the increasing cases of robbery and rape by street children NGOs have prompted government officials of Turkey to pay more attention to their situation. Municipalities of Turkey, especially in Ankara and Istanbul, have attempted to build shelter for the children (Niazi, 2008). Of course, only building shelters cannot prevent committing robbery and rape. It is necessary to begin actions that are more radical. These actions seem to be contained increase awareness of family, family bonds, reforming economic structures, efforts to eradicate drug abuse and beggary, increasing access to education, prevention of uncontrolled migration, controlling population growth, prohibition of social discrimination and promoting social support. These factors reduce the number of street children and result in the reduction and control of crime.
India According to UNICEF estimates, 11 million children live on the streets in India and its embassy in England estimates that 314,700 street kids are living the subways of Bombay, Calcutta, Madras, Khanpur, Bangalore and Hyderabad. About 100,000 homeless persons are living in Delhi (Railway children). Most of the children are engaging in different dirt and unhealthy activities that may bring them all kinds of diseases and injuries. For example, the most common job in Jaipur is searching for old clothes and 6-year-old boys and girls trying to collect recyclable waste and trash. These children are usually carrying heavy loads in big bags on their shoulders. Moreover, the kids who are collecting old clothes are searching for objects alongside pigs and dogs with their own hands. Other common jobs in such places are collecting firewood, animal maintenance, street vendors, fabric painting, begging, prostitution and domestic work (The problems of street children).Children workers are not only exposed to pressure, coercion and dangerous conditions but also away from education and training that can help them getting out of poverty. There is no school or formal training in India to allow street children to take the advantages of at least a basic and essential education (ibid). In addition, unhealthy conditions and its disadvantage are fatal problems for street children in India that cause a variety of physical dangerous and deadly illnesses. For instance, half of the children in India are suffering from malnutrition, but the rate was much higher in the case of street children. They not only are underweight but also are in a bad condition in terms of physical growth. Thus, it is common to misrecognize an eight years old child with a 12 years old one (ibid).According to the above, it can be concluded that the children live and work in the garbage and trash, sewer and among stray animals. In this situation, they are exposed to all kinds of diseases without any access to medical services and treatment especially vaccination against diseases. Only 2 of 3 Indian children are vaccinated against tuberculosis, diphtheria and tetanus, polio and measles; the rate for Hepatitis B is one of ten children. Most of street children are not vaccinated against diseases. They have not ability to do this and they do not trust in doctors and medicine (ibid). Beyond, cases of sexually transmitted diseases, especially AIDS, are threatening street children in India because they are subjected to numerous physical and mental abuses; contrary to many countries, boys are challenging with these
Katayoun Rahvari and Seved Mohammad Hashemi
Indian Journal Of Natural Sciences www.tnsroindia.org. © IJONS
Vol.5 / Issue 28/ February 2015 International Bimonthly ISSN: 0976 – 0997
2580
problems more than girls. The rate of physical abuse of street children by family members, other people, or both is 66.8%. The reports across the country say that 54.62% are boy and 45.38 are girl (Kacker, 2007). According to a study conducted in India, all children responded to questions in the study have been touched forcibly in specific body organs; 17.73% were street children. Moreover, 22.77% have been raped (ibid, p. 82). Consequently, we see that the unhealthy condition in terms of health issues and sexual abuse is not just for street kids and all Indian children and adolescents are exposed to unsuitable conditions. According to a study conducted on 100 street children in Delhi subway, 86% of 14 to 18 years old boys are involved in sexual practices and few number is aware of sexual protection methods and have enough information about condom use; also, none of them has ever used a condom (Trust). Indian street children may be homeless because their families have been left homeless due to poverty or migration and they are homeless because of rejection or exclusion. In fact, it is not rare to see all a family members living sidewalks and a row of children sleeping in railway stations or other locations. According to estimates, 65.9 percent of street children are living with their parents in streets; totally, 51.84% of street kids are living in sidewalks, 17.485 in night shelters and 30.67% in other locations like under bridges, railway platforms, bus stops, parks and markets (Kacker). Therefore, it seems that street children are facing multitude inequalities; they are not sure of getting adequate food, education and medical treatment, and at high risk of drug addiction and disease. Poverty is also a very important factor that may be the primary cause of the crisis for street children. Poverty drives children to a host of problems. These problems cause not only immediate suffering but also the continuity of poverty over their whole life. In order to survive, a poor Indian child or adolescent has to be to the victim of education shortages. It is obvious that a fumbling child, adolescent, or adult will stay at the end of poverty line.It is not far to say that Indian children and adolescent are in worse situation than their counterparts in Turkey.
Brazil The estimated number of street children in Brazil is about two thousands to eight millions (Brazilian street children). The number of street children in this region of the world has been quite evident from 1970s (Inciardi and Surratt, 1997). In recent decades, Brazil has one of the highest numbers of street children compared to other countries (Street children in Brazil, 2010). However, numerous studies and investigations about the estimated number of children living on the streets have not determine the exact rate of street children because the majority of street children spend day on the street and return to their homes at night. By comparing Brazil to India and Turkey, it seems the condition in Brazil is worse because most of street children are killed before age of 18 in Brazil. In fact, Brazil has a bad name because of “Death Groups” had it has lost its credibility and reputation. The purpose of this group is to clean up the streets and ensuring public security (Shine a light, the current conditions of street life in Brazil). Contrary to the efforts carried out by Brazilian officials to support children and adolescent, the living conditions in streets are still unsafe and deteriorated; it results from the illegal activities of these death squads in order to cleanup targets. The following data represents current conditions: According to child protection agencies, more that 5 to 6 children are killed in Rio streets; less cautious statistics report 2 killed child a day. 4611 street kids were killed during 1990 to 1998 in this country. In 1993, eight children were killed in a shooting near Kndlarya Church in Rio. Children and Youth Court statistics show that more than 3000 children aged 11 to 17 were threatened by death during 1993 to 1996; most of them believe that the murders were performed by Death Groups, police or other gangs (Brazilian street children). Thus, we see that this plight is beyond predictions; lack of adhere to the law and anarchy have exacerbated the atmosphere of insecurity so that police forces are committing illegal actions alongside illegal groups. They have no fear of killing street children; this sense results from police corrupt. For example, 20% of homicides of the first
Katayoun Rahvari and Seved Mohammad Hashemi
Indian Journal Of Natural Sciences www.tnsroindia.org. © IJONS
Vol.5 / Issue 28/ February 2015 International Bimonthly ISSN: 0976 – 0997
2581
months of 1999 in Sao Paulo were carried out by police forces against street children.Furthermore, police forces are always afraid of children witnessing their criminal actions in in the drug and prostitution trade (ibid). When the body of 9-year-old Patricio Hilario da Silva was found on a main street in Ipanema in 1989, there was a handwritten note tied around around his neck that said, “I killed you because you didn't study and had no future,” the note read. “The government must not allow the streets of the city to be invaded by kids.” According to reports, the death squads earn $40 to $50 for killing a street kid (S.Brookes). Of course, it is not reported that who or which group is paying the money to death squads for such murder. The Brazilian government has failed to introduce them. An indication of the government failure in curbing crimes against street children is the continuation of killing these people in many cities. Crime pattern seems to have been changed. The pattern has been transformed from an obvious and immediate killing to a killing occurred in the nomadic places of city (Street children in Brazil, 2010). Dimensions of the problems in this country are more above expectations and incompetency of authorities is too wide. For instance, forgiveness and exonerating the murderers of children and adolescents is seen largley that indicates the failure of the identification and punishment of the perpetrators of the killings (ibid, p. 4). A reason for the growth of such crimes is ordinary people's fear of criminal groups. Therefore, the probability of witnessing Brazilian (eg, Indian) children and adolescents from poor families on the streets is more than others because the families are more vulnerable to economic crisis. Hence, they lead their children to streets to contribute to the preservation of family and earn money. The chlidren are usually engage in services like shoeshine, cargo and tour guide and.... The same as Indian cases, Brazilian street children also do not benefit from the educational system and its requirements, they often do not go to primary school and they are dismissed in the early years from school.According to Human Rights Watch, street children in detentions are basically deprived of any form of education and many prisons do not provide them proper training classes, although it is very important to them (Human Rights Watch, 2003). In addition to few governmental efforts to educate street children, some NGOs have provided semi-formal and informal trainings for them (Street children in Brazil, 2010); it has not been observed that in India. Unlimited sexual relations and promiscuity have become a serious problem in Brazil. According to a study by Ministry of Health, the high risk of sexual behavior in the socio-economic levels has been spread; it is more dangerous for individuals protecting themselves by their own (ibid). This places street children in vulnerable situations as well. In fact, health policies, as a tool in the hands of governments, should ensure that their activities present service to all people, especially those who are in dangerous situations. According to the 2006 Report on the global AIDS outbreak, the following groups are more exposed to the disease in comparison with the total population: sex workers, men who have sex with their own sex, injecting drug users, and prisoners (ibid.). In this manner, street children can be categorized as a member of each of the above groups because they are exposed to forcible sexual relations either free of charge or by charge, they are more susceptible to drug use, and they are not supported against having sex with the same sex and forcibly either in the confinement or in the streets. All of the problems arise despite the fact that Article 227 of Brazilian constitution stipulates, “It is the duty of the family, the society, and the State to guarantee to the child and adolescent, with absolute priority, the right to life, health, nutrition, education, leisure, professional training, culture, dignity, respect, liberty, and community and family living, as well as protecting them from discrimination, exploitation, cruelty, and oppression” (ibid, p. 2).With all these lines, street children phenomenon in Brazil represents negligence and failure of families, the community, state and the government of this country to ensure proper conditions of health, nutrition, education, respect, prosperity and most importantly their right to life. Moreover, the family and society in which the children are living have failed to protect them against exploitation and physical and sexual abuse, rape, discrimination, injustice and violation of their basic rights.In 1990, Brazilian government approved the law of child and adolescent that ensured”the right to life, honor and dignity as a human being” and “"the right to public space and community” for
Katayoun Rahvari and Seved Mohammad Hashemi
Indian Journal Of Natural Sciences www.tnsroindia.org. © IJONS
Vol.5 / Issue 28/ February 2015 International Bimonthly ISSN: 0976 – 0997
2582
street children (Brazilian street children). According to this law, children will be arrested only when they commit an offense (ibid.). It should be stated that this group of kids have been exposed simply to criminal abuse; and they are apparently most appropriate persons from the viewpoint of drug traffickers. However, the enactment of this law was performed for the purpose of compliance of national legislation with the Convention on the Rights of the Child; therefore, the present situation are indeed contrary to the law that is an indicator of violating the implementation of the law and violation of the rights enshrined in the constitution. Consequently, the situation of street children in Brazil is not suitable like Turkey and India, but the problems in Brazil and india are more serious.
South Africa According to the studies carried out in South Africa, street children are between 7 to 18 years old and often 13 to 16 years old (Richter, 1990). Based on estimates, about 12,000 children are homeless in this country; they have been led to streets due to poverty, overpopulation, addiction, negligence, lack of family cohesion and HIV / AIDS (Save the children, 2005). The same as Turkey, Brazil and India, most of the children have been led to the ways of corruption and wrongdoing and they have committed all kinds of crimes. Most children in this area are black and male. Most of their activities are more or less illegal including offenses such as prostitution, drug abuse and violent crimes like fighting with each other (often with stone and knife), assault and rape (Niazi, 2008, 34). The same as Brazil, actions of authorities have failed to solve problems in South Africa and even worsen it. In this regard, the activities of government and private sector to help these children have been largely unsuccessful and the children believe that correction and rehabilitation centers are tragic and horrific. In these places, Children’s heads are shaved and they must interact with bigger and more aggressive fellows (Niazi, 2008, 34-35). Consequently, poverty, economic crisis, AIDS, uncontrolled immigration and the failure of government to improve conditions seem to be the major causes of this phenomenon. Street children are not a particular manifestation of Asian, African and Latin America, but it is observed in European countries.
Russia A research conducted among experts, showed the total number of street children in St. Petersburg ranges from 10000 to 16000. About 50-70 percent of the total number of street children is under 13 and they are regarded as working children since they collect bottles and refuse (the seasonal work of picking and selling berries and mushrooms, etc. is considered as labour). Moreover, about 10 to 30 per cent are involved in criminal activities; the number of working street children under 18 involved in prostitution is estimated to be 20 per cent, although some experts believe the figure may be as high as 35 per cent. Two out of five working street children interviewed said they only worked in order to buy food (42.0%) and one child in four worked to help his or her family (22.1 percent) or brother/sister (3.5 per cent). The average duration of a street child’s working day is 5.9 hours, but street children generally have to work longer hours. Moreover, 55.5 percent said they sometimes had to work 6 to 8 hours a day; 33.8 per cent could remember a situation where their working day lasted 8 to 12 hours (33.8 per cent); and 11.8 per cent sometimes had to work more than 12 hours a day. 77.9 percent of working street children is involved in labor that is dangerous to their health (Petersburg, 2000).
Katayoun Rahvari and Seved Mohammad Hashemi
Indian Journal Of Natural Sciences www.tnsroindia.org. © IJONS
Vol.5 / Issue 28/ February 2015 International Bimonthly ISSN: 0976 – 0997
2583
CONCLUSION With respect to the contents, it should be expressed that it is difficult to estimate and determine the number of street children in countries that are faced with this problem due to different definitions. The influential factors in this regard are various socio-economic and cultural factors, natural disasters and war, mental retardation, family roles, the role of governments and their policies. Therefore, there are several problems involved in the development of this phenomenon that foster weakest group of children that are deprived of their most common rights.Finally, it should be mentioned that there would be no hope to reduce the number of street children until poverty and economic problems are not resolved, there is no adequate employment opportunities for youth and adults, appropriate facilities are not provided for rural life, irregular migrations from rural to urban areas continue, marginalization extends, families are not aware of the anomalous dimensions of the case and administrative corruption and mismanagement is not resolved.
REFERENCES 1.Brazilian stBrazilian street children, (website). Available at: http://www.abctrust.org.uk/useful_docs/Jubilee_Action_En. pdf(2011/10/25), p.3reet children, (website). Available at: http://www.abctrust.org.uk/useful_docs/Jubilee_Action_En. pdf(2011/10/25), p.3 Brookes, S. The murder of Rio’s street kids, Insight Magazine. Available at: http://www.stephenbrookes.com/international/2006/4/18/the-murder-of-rios-street kids.html(2011/10/27),p.1 2.Human Rights Watch: Cruel Confinement: Abuses Against Detained Children in Northern Brazil, (2003). B1501. Available at: http//www.unhcr.org/refworld/docid/3f4f594f6.html(2013/03/09). 3.Inciardi, J.A., and Surratt, H.L. (1997). Children in the streets of Brazil: Drug, use, crime, violence and HIV risks. Substance use and misuse. Available at: www.dreamscanbe.org/.../children%20in%20the...(2013/03/08),pp.3-4 4.Kacker, L., (2007), Study on child abuse: India, Ministry of Women and Child Development, Government of India, Available at: http://wcd.nic.in/childabuse.pdf(2011/04/14),p.62. 5.Niazi, Mohsen (2008), Street Children. Tehran, Samen Alhjj Publications, first edition, p. 32. 6.Petersburg, (2000). ILO/IPEC:In-depth Analysis of the Situation of Working Street Children in St. Available at: http://www.streetchildren.org.uk/reports/Spb.Report Eng.pdf(2009/07/26) , p.5 7.Railway children, our work in India, (website). Available at: http://www.railwaychildren.org.uk/asia.asp(2009/07/11) 8.Richter, L.M. (1990), Street children in south africa: General theoretical introduction: Society, family and childhood,Part 1 of a Paper Presented at the First National Workshop of Street-Wise, Johannesburg. 9.Save the children, (2005). Global Submission by the International Save the Children Alliance, UN Study on Violence Against Children, Available at: http://www.crin.org/docs/resources/publications/violence/Save Alliance Global Submission.pdf(2009/07/19), p.43. 10.Shine a light, the current conditions of street life in Brazil, (website). Available at: http://www.citdr.org/sal/CoyunturaBras.html,May2006. 11.Street children in Brazil, (2010), Briefing to the IPU, (website). Available at: www.streetchildren.org.uk/…/Street_Children_in_Brazil_-_Briefing…(2013/03/08),p.2 12.Street children in Brazil. Briefing to the IPU, May 2012. Available at: www.streetchildren.org.uk/…/Street_Children_in_Brazil_-_Briefing…(2013/03/08),p.2 13.Street Children Statistics, Consortium for Street Children. Available at: www.streetchildren.org.uk/.../street_children_stats_FINAL.pdf(2013/03/09),p.7. 14.Trust, S.B., Health program, Available at: http://www.salaambaalaktrust.com/health.asp(2011/04/14)
Katayoun Rahvari and Seved Mohammad Hashemi
Indian Journal Of Natural Sciences www.tnsroindia.org. © IJONS
Vol.5 / Issue 28/ February 2015 International Bimonthly ISSN: 0976 – 0997
2584
Examining Factors Influencing ICT Outsourcing Success in National Iranian South Oil Company (NISOC)
Sami Sarkhi Mousavi Department of Public Management, Shoushtsar Branch, Islamic Azad University, Shoushtar, Iran. Received: 26 Nov 2014 Revised: 10 Dec 2014 Accepted:18 Dec 2014 *Address for correspondence Sami Sarkhi Mousavi Department of Public Management, Shoushtsar Branch, Islamic Azad University, Shoushtar, Iran. E.Mail: [email protected]
This is an Open Access Journal / article distributed under the terms of the Creative Commons Attribution License (CC BY-NC-ND 3.0) which permits unrestricted use, distribution, and reproduction in any medium, provided the original work is properly cited. All rights reserved. ICT outsourcing is a good opportunity for the organizations growth and capability of focusing on main issues, but there are some risks regarding the control and supervision of vital information of organization of the competitors, the lack of information of security issues and cultural differences in other issues in this regard. In recent years, ICT outsourcing is increasingly developed to increase organization profit. Success is of great importance in ICT outsourcing activities and the previous researches had interesting results on effective factors. The researches are conducted on the relationship between participation quality and the quality of presented services and arrangement of ICT outsourcing on success in outsourcing the related activities is also investigated. The results of the present study showed that participation quality and services quality are important factors to achieve success in ICT outsourcing activities but arrangement of outsourcing contracts, namely integrity and contract duration didn’t have considerable effect on its success. Mutual trust in ICT outsourcing activities was very important. The present study attempted to identify and explain trust in ICT outsourcing and presented a framework. Keywords: : IT outsourcing, Participation quality, Services quality, Outsourcing arrangement, Mutual trust, Trust making framework, Main factors of success.
ABSTRACT
RESEARCH ARTICLE
Indian Journal Of Natural Sciences www.tnsroindia.org. © IJONS
Vol.5 / Issue 28/ February 2015 International Bimonthly ISSN: 0976 – 0997
2585
INTRODUCTION In the current dynamic world, the organizations apply outsourcing approach namely in ICT to survive and outperform other competitors. By the considerable development of Information technology (IT) and its wide applications, most organizations and governments are obliged to make wide investment on IT. Thus, effective management is dependent upon investment management on IT. This dependency is investigated from three aspects: First, most organizations due to competitive reasons are obliged to invest on IT, second various operational processes are combined with IT and third, organizations invest heavily on IT and the costs are increasingly increased (Willcocks,1999). One of the best ways to use IT is using the services of the companies with adequate experience and skill in this regard. The organizations are more inclined to apply IT outsourcing for effective response to environment. The reasons are global competition, making small, moving to the smooth organizations, increasing flexibility, conformity with the rapid technology changes and focus on important capabilities and by IT outsourcing we can achieve them (Dhar and Balakrishnan,2006).Outsourcing is transferring some of internal activities of organization and giving decision making right to the external provider in accordance to the contract. In fact, in outsourcing, not only the activities are transferred, but also production factors and decision making right are delegated (Claver, González,2002). ICT outsourcing is defined as the process of giving information technology and communication of the organizations to the external service provider. The benefits of it include reduction of costs, improving received services quality and reduction of risks in this regard. Information and communication technology outsourcing (ICTO) is widely applied on the organizations and is turned into a strategic necessity. The most important risks of the organizations in applying outsourcing are including: Supervision and controlling vital information of the organization to the other competitors. The lack of information of security issues and cultural differences Development of organization activities and management control field Resources limitation The necessity of knowledge management due to giving a part of specialized duties to an external organization The pressure of support activities irrelevant with the main mission of the organization on organization resources The effect of outsourcing process on satisfaction and morale of employees due to the risk of less duties or losing
the job The increase/decrease of organization resilience due to the probable changes in the performance of electronic
systems of the organization as the instruments of doing tasks in organization
The companies to use competitive advantages are more inclined to apply ICT based applied software (Neirotti et al, 2008). By close competition in global trade, outsourcing is turned into general and universal issue (Dhar and Balakrishnan,2006). The intense competition encouraged many great organizations to keep up with the smaller organizations and outsource their IT activities. The organizations outsource their ICT based services for some various reasons as reduction of costs, quality, work pressure of support activities or other economic factors. There are other factors including efficiency and productivity in production, improving the satisfaction of customers, organizations capability in focusing on their main activities field (production and marketing) in this regard. The studies on decision making of outsourcing showed that ICT outsourcing process has high acceptance capability based on the internal organizational factors compared to the methods considering external factors (Loh And Venkatraman,1992b). The final goal of outsourcing is reduction of costs, increasing quality or liberalization of some resources of the company to allocate them to the high priority affairs. Outsourcing helps the companies to not only tolerate the bad economic conditions but also achieve competitive advantage in the market (Sepehrirad, 2005). It can be said that the increase of effectiveness via focusing on what the organization does best, achieving the specializations, skills and technologies that were not attainable already, attaining new and innovative ideas, reduction of investment on assets and better use
Sami Sarkhi Mousavi
Indian Journal Of Natural Sciences www.tnsroindia.org. © IJONS
Vol.5 / Issue 28/ February 2015 International Bimonthly ISSN: 0976 – 0997
2586
for other goals, attaining market share and business opportunities via providers network and changing fixed costs to varied costs are the major reasons of outsourcing. Having knowledge about outsourcing is increasing as a supporting source of organization strategies and outsourcing is not considered as a factor to reduce the organization costs. Thus, the organizations are more inclined to use IT outsourcing for effective response to environment (Lee & ,Miranda2004). The most important goals of organizations in using outsourcing are including as:
Attaining competitive advantage Availability to key technologies Reduction of operational costs Reduction of risk and risk sharing Accessibility to capital resources Focus on main goals of organization
Chalus believed that an organization considers IT outsourcing when intra-organizational performance in a special field is lower than the performance of external providers. Peters et al. considered focusing on main capabilities as the main motivation of managers in outsourcing decisions. Boston consulting group in a study of 100 companies with extensive experience in outsourcing their organization operation found that most of the western companies at first do IT outsourcing for saving costs. Kakabadse by combining both views considered the main reasons of IT outsourcing saving scale and strategic position. Indeed, success in IT outsourcing is in the same level with contingency factors in the environment it is one of the most important factors (sharing and knowledge sharing). According to IDC (formal media of ICT), outsourcing in this regard in 100 great European organizations had profit more than 40.5 million dollars of America and this showed the position and importance of ICT outsourcing activities and private and state sectors both attempt for the growth of ICT outsourcing. Despite the deep and vivid perception of ICT outsourcing, its success is not very clear. The present study attempted to bridge this gap by collecting empirical evidences of effective factors on success in ICT outsourcing activities.Most of the researchers know establishing the close relation with mutual trust the result of continual improvement in informative participation arising from the increase of participation quality being identified by 5 cultural factors as profit and loss sharing, knowledge sharing, trust, conflict and commitment that are of great importance to achieve success in ICT outsourcing. Services quality is one of the main goals of outsourcing contractors. This is due to the competition between various contractors. IT services contractors to improve the quality of their services apply some standards and frameworks as Information Technology Infrastructure Library (ITIL). In addition, some of the contractors by standardization of IT processes and continual evaluation and control of these processes increase the quality of their services. Services quality is one of the success and survival factors in IT outsourcing industry and the best contractors always attempt to achieve this goal (CHASE&HAYES ,1992). Due to the main motivation of the organizations to achieve better and high quality services, success in outsourcing is measured by relying on services quality and via evaluation of presented services. Thus, a good analysis of services quality in establishing the relationship with service provider in a successful outsourcing project is necessary. The important issue here is considering the relative advantages of giver and providers (participants) (Turban,2003).Participation stage is collaboration of two or more organizations to achieve common goals that organizations can not achieve them alone. Delegating al ICT activities as integrated to an external provider company is associated with the competence of the organization. The projects are long and are followed by the organizations with the experience of small outsourcing projects (Moradi, 2012) and they are formed in the form of contract between two provider and delegating organizations (Bertolin,2004). Contract duration and contract size affect the success in IT outsourcing (Kern&Willcocks ,2000)
Sami Sarkhi Mousavi
Indian Journal Of Natural Sciences www.tnsroindia.org. © IJONS
Vol.5 / Issue 28/ February 2015 International Bimonthly ISSN: 0976 – 0997
2587
A review of literature on ICT outsourcing IT outsourcing is partial contract of providing a part or total IT duties of an organization with external provider. Outsourcing is ranging a partial section as equipment maintenance to outsourcing total IT department of an organization (Costa, 2001). Young and Hung defined Information technology outsourcing (ITO) as:” Considerable participation of an external agent in providing physical or human resources related to IT in customer organization or asset transfer by various forms human, network or hardware from customer organization to external factor as responsible for the given activities (Ali Talab, 2011). IT outsourcing is a special form of outsourcing and it was started in the early 1990 and it is a way to develop IT activities. Successful experience of Eastman Kodak in outsourcing its activities to IBM encouraged other organizations to apply this method (Pati&Desai,2005). The presence of providers with high competence in IT industry market is a reason for the growth of outsourcing in this sector (Turban, 2003). Various definitions of outsourcing in IT are presented. The present study described the definition presented by Dibbern as” Organizational arrangement to provide IT services and resources management and activities to produce these services”. IT services refer to the delivery and presenting IT productions and their performance method. Organization arrangement is defined as a formal and responsive structure during IT activities. The success in IT outsourcing is justification of researches in information systems outsourcing. Success in IT outsourcing is defined as satisfaction of the profit and benefits of outsourcing in an organization or it is defined as outsourcing strategy. Outsourcing is successful if the expected result is fulfilled. Kim and Lee (2003) defined success in outsourcing as a degree between the service provider requirements and receive services from the service provider. Yong Ki and Shin Irn (2005) raised investment cost theory proposing a method to measure the profit of transaction for each of the parties. Cheon (1995) presented a framework to analyze various choices of outsourcing and source-based analysis method was presented by him. Khalfan and Gough (2002) stated that the organizations due to the deficiencies of their main resources resort to IT outsourcing approach but they consider a combination of other reasons as economic saving, the lack of knowledge and experience, focusing on main activities of organization and view and cultural factors difference effective on ICT outsourcing decision making. New administrative management In recent decades, we observed new approach in state management. In other words, a new approach that is formed to cope with complex problems of the current era. The necessity of coping up with the challenges including technology change, globalization, information revolution and international competition obliged the governments to make great changes in their administrative management sector. The paradigm of traditional model of managing that is the dominant theory in major part of 2th century was replaced with “management based” or new administrative management and in recent years, we observed many changes compared to 20th century. The important feature of new administrative management approach is absorbing people participation in the affairs and letting them do the works. “Management-based” approach is good for the communities in which client and customers views are of great importance and human value and dignity are considered and being responsive to the society demands and their satisfaction are the main goals of the organizations (Rashidifard, 2009). New administrative management is using private sector management in state sector including the components as privatization, reduction of government size, delegating the works to contractor, outsourcing and customer-centered and etc. In new administrative management, private sector management application to increase the efficiency and productivity is emphasized (Nuri, 2011). The reports issued by world bank showed that in our country, due to the mentioned reasons, like other countries, the investment on ICT outsourcing is increased and success in this regard in National Iranian South Oil Company is of great importance as the most profitable and important organizations in the country to fulfill the goals of principle 44.
Sami Sarkhi Mousavi
Indian Journal Of Natural Sciences www.tnsroindia.org. © IJONS
Vol.5 / Issue 28/ February 2015 International Bimonthly ISSN: 0976 – 0997
2588
In recent years, by the increase of privatization trend and importance of information/communication systems and on the other hand, exclusive agreements and operational and management contracts provided good opportunities to be present in private sector in this field. As oil industry is one of the vital issues in the world, involving the private sector in this field requires special social, economic and political considerations. The contradictory findings about arrangement of ICT outsourcing and its success showed the necessity of further studies in this field. The results of finding causes in outsourcing events of this field showed that outsourcing these activities in oil industry has many problems and the researcher attempted to investigate success factors in ICT outsourcing in the mentioned company by scientific method. In the present study besides a review on probable problems, some systematic solutions to eliminate these problems are presented. The effective factors on outsourcing ICT outsourcing Lee and Kim (1999) introduced participation quality factor as the success key of ICT outsourcing. Sun (2002) investigated the effective factors on participation in outsourcing and their relation with satisfaction in ICT outsourcing and considered the change in the relations between the customer and service provider as important. He considered close relation with mutual trust as the result of continual improvment in informative participation level and arising from the increase of participation quality.Partners can create competitive advantage in sharing strategy of key and valuable information of organization. Knowledge sharing is also involved in participation process during outsourcing project in required benefits.Nonaka and Takeuchi researches (1995) emphasized knowledge sharing (explicit or tacit) as one of the study fields in IT outsourcing.Garver (1996) showed the direct effects of services quality on success of ICT outsourcing activities. His findings showed that configuring model of ICT outsourcing contracts played important role in its success and integration level of outsourcing can be divided as generally, selective and in small scales based on budget and resources of IT organization. Lacity and Wlcocks (1998) studies in USA and England and the research conducted by Gullen (2002) in Australia presented similar findings regarding that selective outsourcing is more successful. Despite the previous findings, the researches of Lee (2004) regarding the outsourcing contracts duration and the conducted tests (in South Korean organizations) didn’t support the evidences that selective outsourcing is the most successful among the other examples. It was stated that long-term and mid-term contracts are more successful than short-term contracts. The contradictory findings about arrangement of ICT outsourcing contracts and their success showed the necessity of further studies in this field. Despite the extensive success of private and state sectors in ICT outsourcing activities, no suitable studies are done in this regard and success versions in guiding outsourcing projects to profitability and success are not available.. Many researches focused on effective factors on IT outsourcing in northern America, Europe, Australia and other regions. Lee and Kim (1999) introduced quality factor as the success of IT outsourcing. Sun (2002) investigated the effective factors on participation in outsourcing and their relation with satisfaction in IT outsourcing. The change in the relations between the customer and provider is of great importance. Most of the researchers considered the close relation with mutual trust as the result of continual improvement in informative participation and arising from the increase of participation quality. The partners create competitive advantage for themselves in key information sharing strategy of organization. Knowledge sharing in participation process is involved in outsourcing project in the required benefits. According to Nonaka and Takeuchi researches (1995) knowledge sharing (explicit or tacit) is raised as one of the study fields in IT outsourcing. Due to the main motivation of the organizations to achieve the best services with high quality, success in outsourcing is measured via presented services evaluation. A good analysis of services quality in relationship with service provider in a successful outsourcing project is necessary. The small difference in service provider expectations and subjectivity of service provider can lead to deep gap in expectations and major differences in received services quality. Services quality is defined as received support services of service provider ignoring the fact that these
Sami Sarkhi Mousavi
Indian Journal Of Natural Sciences www.tnsroindia.org. © IJONS
Vol.5 / Issue 28/ February 2015 International Bimonthly ISSN: 0976 – 0997
2589
services are presented by IT office, new organization or outsourced project to external service provider. Garver (1996) showed the direct effects of services quality on success of IT outsourcing activities. Previous studies showed that configuration model of IT outsourcing contracts had important role in its success. IT outsourcing configuration combines various types arising from outsourcing arrangement. The investigated outsourcing arrangements in this study include outsourcing levels and contract duration. As it is supported by previous researchers, outsourcing integrity level can be divided as generally, selective and in small scale based on available budget and resources of IT organization. Lacity and Wlcocks (1998) studies in USA and England and the research conducted by Gullen (2002) in Australia presented similar findings regarding that selective outsourcing is more successful. Despite the previous findings, the researches of Lee (2004) and the conducted tests (in South Korean organizations) didn’t support the evidences that selective outsourcing is the most successful among the other examples. Regarding contract duration, it is shown that short-term contracts are more economical than long-term contracts. Lee (2004) stated that long-term and mid-term contracts are more successful than short-term contracts. The contradictory findings about arrangement of IT outsourcing contracts and their success showed the necessity of further studies in this field. Despite the extensive success of private and state sectors in ICT outsourcing activities, no suitable studies are done in this regard and success versions in guiding outsourcing projects to profitability and success are not available. The present study is one of the first empirical researches about success factors on IT outsourcing in the country and the following questions are evaluated:
Is there any relationship between services quality and success in ICT outsourcing activities? Is there any relationship between participation quality and success in ICT outsourcing activities? Is there any relationship between features of ICT outsourcing activities and success in it?
Study Model The main goal of the study is investigating the conditions of ICT outsourcing and identification of the factors and variables affecting its success in National Oil Company of Iran. The study is based on the relationship between participation quality, services quality and arrangement of ICT outsourcing and success in it. Participation quality is identified by five cultural factors, profit and loss sharing, knowledge sharing, trust, conflict and commitment as important in achieving success in IT outsourcing. The profit and loss sharing is referred to agreement in profit and loss among the partners during outsourcing process. Trust is defined as a degree of satisfaction and reliability among the partners of outsourcing contracts. Knowledge sharing refers to which range of measurements are used to transfer knowledge among the partners of outsourcing contracts. Commitment is also guaranteeing the durability of this participation among the partners in IT outsourcing contracts. Like previous studies that focused on consistency of received services with what is considered good by service recipient, by effective application of “distance analysis” focused on measuring the quality of receives services. The present study attempted to measure the satisfaction of IT services recipient based on five dimensions of services quality that are in the list of IT outsourcing applications. The services quality dimensions include responsiveness, tangibility and coordination. These dimensions are considered to crease positive effect on services quality and success in IT outsourcing. The studies of researches showed that there are different selections of arrangement of IT outsourcing contracts. Integration level and communication duration (contract duration) are various dimensions in this regard as the result of configuration and arrangement of an IT outsourcing contract. The present study identified two effective factors on success in IT outsourcing. These factors are integration level (minimum outsourcing, selective and general) and communication duration (short-term, mid-term and long-term).
Sami Sarkhi Mousavi
Indian Journal Of Natural Sciences www.tnsroindia.org. © IJONS
Vol.5 / Issue 28/ February 2015 International Bimonthly ISSN: 0976 – 0997
2590
The dependent variable of success in IT outsourcing includes three dimensions of strategic benefits, economic and technological and 9 arrays. The documents being published by Grover (1996) regarding the measurement of success of IT outsourcing were investigated by other researchers and underwent empirical test and these three subsets (strategic benefits, economic and technological) were supported and the correlation relation between them was supported. The researches identified success dimensions in IT outsourcing as dependent variables.
METHODOLOGY The present study investigated the effect of participation quality variables, services quality and contracts elements on success in ICT outsourcing in National Iranian South Oil Company (NISOC). The study was causal-applied and as it considered the existing condition without variables manipulation, its method was descriptive. The target responses were managers, authorities and chiefs of ICT of the companies and organizations defining IT projects in state and semi-state organizations and manage them. Totally, 220 questionnaires were provided and sent and after 2 weeks of sending the letters, follow up was done. Of which, 140 questions were returned after 4 weeks and response rate as 64% was obtained and it was adequate for statistical analysis. The normality of the sample was assumed, the statistical techniques of the study were parametric and variables evaluation level was interval and multi-variate regression was used. The above test was done by Amos 18 software (Structural Equation Modeling). Structural Equation Modeling is considered as quantitative method helping the researcher to organize his study from theoretical studies and their formulation to empirical data analysis in multi-variate form and investigates the effect of a set of variables on each other as one way, two way, direct or indirect (Ghasemi, 2009, p.4). This test was used instead of multi-variate regression test. The path analysis model (structural model) is one of the models that can be used in determining and predicting various phenomena. The path models have some features and are one of the most fundamental models in structural modeling. By plotted path diagram, besides the direct effects of independent variables on dependent variables, we can investigate the indirect effects of variables on each other. At first, the study variables are tested by descriptive statistics as frequency, mean, standard deviation and for the data analysis, inference statistics was applied. As both variables are interval, to study the hypotheses and prediction of criterion variable of one or more predictive variables, regression model is used and the correlation between the predictive variables is evaluated. The analyses are done by SPSS and LISREL software. Data collection measures To collect study data, ICT outsourcing questionnaire (based on standard questionnaire of information systems outsourcing and Narusis standard questionnaire (2002) were applied and the features of this questionnaire is briefly as followings: Profile of respondents After the data were collected of study population, the next stage is that the data are analyzed for hypothesis test. Before that, some initial steps are required that should be completed. These stages help preparation of the data for analysis and guarantees the obtained data are fit, suitable and the results interpretation is significant. The stages are shown as followings and three stages of data analysis (after preparing the data for analysis) are defined including 1- Data perception, 2- Data fitness test, 3- Hypothesis test. In this chapter, each of the stages is explained in details.
Sami Sarkhi Mousavi
Indian Journal Of Natural Sciences www.tnsroindia.org. © IJONS
Vol.5 / Issue 28/ February 2015 International Bimonthly ISSN: 0976 – 0997
2591
Descriptive statistics
First section of descriptive statistics by frequency tables and charts investigates the individual features and demographic features and investigates the sample study. The frequency is applied to study the variables distribution and summary of special variables. Frequency table shows the exact frequency of each item (Afshani and Norian, 2009, p.179). Gender The frequency column reports that there were 118men and 22 women. The frequency percentage for the male and female employees was 70.1, 29.9%, respectively.
Degree In the following table and chart, frequency and distribution of degree of those responding the questionnaires were shown. Based on the results, it can be said that there were 11.4% diploma, 20.5% associate, 45.7% BA and 19.4% MA and above. Age
The following table and chart shows the distribution and frequency of the age of people responding the questionnaire and 2.9% of respondents were 25>, 45.3% between 25 to 35 years and 31.3 between 36 to 45 and 20.5% above 45 years.
Work experience
The following table and chart shows the frequency and distribution of work experience of the employees responding the questionnaires. Based on the results, it can be said that 34.9% of people were under 10 years, 50.7% between 10 to 20, 11.2% of them between 21 to 30 years and 2.9% had work experience above 30 years.
Inference statistics
In this stage, to determine the inference statistics type, we studied the study hypotheses and other analyses. To test the normality of the data, Kolmogorov-Smirnov test was used. To reject or support the hypotheses, structural equations were used. Kolmogorov-Smirnov test In this stage of the study, to evaluate the study hypotheses and other analyses, at first the normality and non-normality of the data distribution are defined. In this study, to evaluate normality of data distribution, Kolmogorov-Smirnov test is applied. The result of this test is shown in the following table. As the obtained sig for all variables was bigger than 0.05, it can be said that data distribution of all variables is normal.Here, to evaluate the predictive role of the variables that are considered as predictive variable, study conceptual model was used.
Sami Sarkhi Mousavi
Indian Journal Of Natural Sciences www.tnsroindia.org. © IJONS
Vol.5 / Issue 28/ February 2015 International Bimonthly ISSN: 0976 – 0997
2592
Measurement model test Measurement model test in Lisrel software is confirmative analysis investigating discriminant validity. This concept refers to the fact that the observed variables or items of a questionnaire how evaluate the required structure. Confirmatory analysis of significance level in services quality The charts show significance coefficient (t) and factor loads (λ coefficient) of measurement model of services quality and all the required coefficients were significant. As the significance test of one by one of them is bigger than 1.96 and smaller than -1.96. Thus, latent variable of services quality is determined by observed variables (questionnaire items) and these variables can show the concept of latent variable dimensions. Fitting index RMSER=0.000, degree of freedom 0 and chi-square value 0.00 with significance level 0.000 showed saturated model. Other model fitting indices showed full suitability of the model. Confirmatory analysis of significance level of participation quality The significance section chart and required parameters showed measurement model of participation quality variable and all the coefficients were significant. As the significance test of one by one of them was bigger than 1.96 and smaller than -1.96. The significance of the numbers showed the significance of the model. The latent variable of participation quality is determined by observed variables (questionnaire items) and these variables can show the concept of their latent variable. Fitting index RMSER=0.116, degree of freedom 4 and Chi-square value 8.11 with significance level 0.877 are good results. Thus, this measurement model is supported. Confirmatory analysis of significance number of contracts array The significance section chart and required parameters showed measurement model of contract arrangement variable and all the coefficients were significant. As the significance test of one by one of them was bigger than 1.96 and smaller than -1.96. The significance of the numbers showed the significance of the model. The latent variable of contract arrangementis determined by observed variables (questionnaire items) and these variables can show the concept of their latent variable. Fitting index RMSER=0.176, Chi-square value 90.68 with significance level 0.000 are good results. Thus, this measurement model is supported. Hypotheses test After doing confirmatory factor analysis, in this section we do structural analyses of study hypotheses. Table 4-6 Values of coefficient and t statistics and coefficients significance Main hypotheses
The services quality had significant effect on success of ICT outsourcing in National Iranian South Oil Company.
The table of the effect of predictive variable of services quality on criterion variable of success in ICT outsourcing Based on effect coefficient γ=-.20and critical value =-2.12 t coefficient (-1.96>t>1.96) reported in the table is smaller than -1.96, services quality variable can affect ICT outsourcing success and determine it. By confidence interval 0.95, this hypothesis is supported and H0 is rejected. The participation quality had significant effect on success of ICT outsourcing in National Iranian South Oil
Company.
Sami Sarkhi Mousavi
Indian Journal Of Natural Sciences www.tnsroindia.org. © IJONS
Vol.5 / Issue 28/ February 2015 International Bimonthly ISSN: 0976 – 0997
2593
The table of the effect of predictive variable of participation quality on criterion variable of success in ICT outsourcing Based on effect coefficient γ= .50and critical value =2.24 t coefficient (-1.96>t>1.96) reported in the table is bigger than 1.96, participation quality variable can affect ICT outsourcing success and determine it. By confidence interval 0.95, this hypothesis is supported and H0 is rejected. The contract arrangement had significant effect on success of ICT outsourcing in National Iranian South Oil
Company. The table of the effect of predictive variable of contract arrangementon criterion variable of success in ICT outsourcing Based on effect coefficient γ= .09and critical value =-0.38 t coefficient (-1.96>t>1.96) reported in the table is bigger than -1.96, contract arrangement variable can affect ICT outsourcing success and determine it. By confidence interval 0.95, this hypothesis is rejected and H0 is supported. Subhypothesis The effect of observed variables of services quality on success of ICT outsourcing
H1a: Responsiveness had significant effect on success of ICT outsourcing in National Iranian South Oil Company. Based on effect coefficient γ= .47and critical value =-4.58t coefficient (-1.96>t>1.96) reported in the table is bigger than 1.96, predictive variable of responsiveness can affect ICT outsourcing success and determine it. Thus, this hypothesis is supported and H0 is rejected. H1b: Tangibility had significant effect on success of ICT outsourcing in National Iranian South Oil Company. Based on effect coefficient γ= .40and critical value =4.38 t coefficient reported in the table is bigger than 1.96, predictive variable of tangibility can affect ICT outsourcing success and determine it. Thus, this hypothesis is supported and H0 is rejected. H1c: Belonging capability had significant effect on success of ICT outsourcing in National Iranian South Oil Company. Based on effect coefficient γ=-0.67and critical value =-2.08 t coefficient reported in the table is smaller than -1.96, predictive variable of Belonging capability can predict criterion variable of ICT outsourcing and determine it. Thus, this hypothesis is supported and H0 is rejected. The effect of observed variables of participation quality on success in ICT outsourcing H2a: Profit and loss sharing had significant effect on success of ICT outsourcing in National Iranian South Oil Company.
Sami Sarkhi Mousavi

Indian Journal Of Natural Sciences www.tnsroindia.org. © IJONS
Vol.5 / Issue 28/ February 2015 International Bimonthly ISSN: 0976 – 0997
2594
Based on effect coefficient γ= -0.70and critical value =-2.06 t coefficient reported in the table is smaller than -1.96, predictive variable of profit and loss sharingcan notpredict criterion variable of ICT outsourcing and determine it. Thus, this hypothesis is supported and H0 is rejected. H2b: Mutual trust had significant effect on success of ICT outsourcing in National Iranian South Oil Company. Based on effect coefficient γ= 0.23and critical value =2.01 t coefficient reported in the table is bigger than 1.96, predictive variable of mutual trustcan predict criterion success of ICT outsourcing and determine it. Thus, this hypothesis is supported and H0 is rejected. H2c: Individual conflict had significant effect on success of ICT outsourcing in National Iranian South Oil Company.
Based on effect coefficient γ=-0.27and critical value =-2.79 t coefficient reported in the table is smaller than -1.96, predictive variable of individual conflictcan predict criterion variable of ICT outsourcing and affect itconversely. Thus, this hypothesis is supported and H0 is rejected. H2d: Knowledge sharing had significant effect on success of ICT outsourcing in National Iranian South Oil Company.
Based on effect coefficient γ=0.42and critical value =4.11 t coefficient reported in the table is bigger than 1.96, predictive variable of knowledge sharingcan predict criterion variable of ICT outsourcing. Thus, this hypothesis is supported and H0 is rejected.
H2e: Work commitment had significant effect on success of ICT outsourcing in National Iranian South Oil Company.
Based on effect coefficient γ=0.46and critical value 3.79 t coefficient reported in the table is bigger than 1.96, predictive variable of commitment to workcan predict criterion variable of ICT outsourcing. Thus, this hypothesis is supported and H0 is rejected. c. The effect of contracts arrangement was positive on success of ICT outsourcing. H3a: Integration level had significant effect on success of ICT outsourcing in National Iranian South Oil Company.
Based on effect coefficient γ= 0.36and critical value 1.52 t coefficient reported in the table is smaller than 1.96, predictive variable of integration levelcan predict criterion variable of ICT outsourcing and. Thus, this hypothesis is rejected and H0 is supported. H3b: Contract duration had significant effect on success of ICT outsourcing in National Iranian South Oil Company.
Based on effect coefficient γ= 0.57 and critical value 1.01 t coefficient reported in the table is smaller than 1.96, predictive variable of contract durationcan notpredict criterion variable of ICT outsourcing. Thus, this hypothesis is rejected and H0 is supported.
Sami Sarkhi Mousavi
Indian Journal Of Natural Sciences www.tnsroindia.org. © IJONS
Vol.5 / Issue 28/ February 2015 International Bimonthly ISSN: 0976 – 0997
2595
Trust To fulfill the expectation and achieving a good relation in outsourcing, the organization should trust in the service provider. Presenting an exact and abstract definition of trust is difficult as it is different from one concept to another but it can be considered as the result of dependent processes, decision makings of economy and social relations. Expectation is an important part of trust definitions. Trust is also observed in reliable contracts with positive expectations and avoiding risks. In the present study, it is stated that trust is achieved when sourcing is reliable and expectations are with good behavioral feelings. The sourcing is reliant and it can be fulfilled in predictable in correct way and it is called assuring. The behavioral good intentions can be observed as affective inclinations between two sides. The framework of achieve trust in IT outsourcing Trust making framework in IT outsourcing is created based on review of literature of organizational sources and success main factors can lead to organizational success are based on these factors. Thus, DahanaYaka framework (a support methodology of developing combined-based systems) to perceive the development of information systems is changed and adapted. This framework was selected as it presented some assumptions in relation to adaptation, principles and integration of life cycle of a system and is based on required concepts of success process. This framework is adapted to achieve the trust making process in IT outsourcing. The main difference is due to the lack of relationship of this paper with systems life cycle, eliminating support method and modeling. Here, the organizations focus on important aspects of the process of achieving mutual trust in IT outsourcing as The following methods:
Thinking method: It deals with outsourcing and its goals and it is creating a philosophy to achieve mutual trust in IT outsourcing.
Control method: It deals with the management method and how to achieve mutual trust in IT outsourcing and the fact that different positions required different solutions.
Method: It means structural problems being created during process and requires the relationship between the duties and final existing solutions for special condition.
The proposed framework is a structure including the main factors of success to achieve trust in IT outsourcing. The thinking method affects the work and control of an organization in achieving mutual trust in IT outsourcing. The control method and work methods determine the related factors. The change of control method needs the different work method and changing the work habits.
ACKNOWLEDGMENTS Author thank National Iranian oil company (NIOC) and National Iranian South oil company (NISOC) for their help and financial support.
REFERENCES 1. Baron, R.M. and Kenny, D.A. (1986). The moderator-mediator distinction in social psychological research:
conceptual, strategic, and statistical considerations. Journal of Personality and Social Psychology. 51(6), 2. 173-1182. 3. Bryman, A. and Cramer, D.(2002) Quantitative Data Analysis with SPSS Release 10 for Windows: A guide for
social scientists. Rouledge, New York.
Sami Sarkhi Mousavi
Indian Journal Of Natural Sciences www.tnsroindia.org. © IJONS
Vol.5 / Issue 28/ February 2015 International Bimonthly ISSN: 0976 – 0997
2596
4. Cheong, P. Malaysia Expects RM11.4 Billion ($3 Billion) from Global Outsourcing. Retrieved 5 October, 2003 fromhttp://www.pwcglobal.com
5. Choi, B. & Lee, H. (2003).An empirical investigation of KM styles and their effect on corporate performance. 6. Information & Management, 40, 403-417. 7. Cullen, S; Seddon, P.B., &Willcocks, L.P. (2002). Does Domberger’s Theory of the contracting organisation 8. explain satisfaction with IT outsourcing?. Proceedings of the 23rd International Conference on 9. Information System. 10. Cullen, S. Seddon, P, Willococks,L.(2005a). Managing Outsourcing: The Life Cycle Imperative. MIS Quarterly 11. Executive. 4(1),229-246. 12. Cullen, S. Seddon, P, Willococks,L.(2005b). IT outsourcing configuration: Research into defining and designing 13. outsourcing arrangements. Strategic Information Systems.14,358-387. 14. Dibbern, J., Goles,T., Hirschheim, R., &Jayatilaka, B. (2004). Information Systems Outsourcing: A survey and
analysis of the literature. The Data Base for Advances in Information Systems, 35(4), 6-102. 15. Gottschalk, P. and Solli-Saether,H. (2005). Critical success factors from IT outsourcing theories: an empirical
study. Industrial Management and Data Systems. 105(6), 685-702. 16. Grover, V., Cheon, M.J., Teng, J.T.C. (1996). The effect of service quality and partnership on the outsourcing of
information systems functions. Journal of Management Information Systems. 12(4), 89-116. 17. Hair,J.F., Anderson, R.E., Tatham, R.L and Black,W.C. (1998). Multivariate Data Analysis.Prentice-Hall. USA. 18. Kakabadse, N and Kakabadse, A. (2000). Critical review – Outsourcing: a paradigm shift. The Journal of 19. Management Development. 19( 8), 670-728. 20. Kern, T. and Wilcocks, L. (2000). Exploring information technology outsourcing relationships: theory and
practice. The Journal of Strategic Information Systems. 9( 4), 321-350. 21. Klepper R. and Jones W.O.(1998), Outsourcing information technology, systems, and services. Prentice Hall,
Upper Saddle River, NJ. 22. Lacity, M.C. and Hirschheim R. (1993). Implementing Information System Outsourcing: Key Issues and 23. Experiences of an Early Adpoter.Journal of General Management.19(1), 17-31. 24. Lacity, M.C., Hirschheim R., Willcocks L.(1994). Realizing Outsourcing Expectations: Incredible Expectations,
Credible Outcomes.Information Systems Management.11(4), 7-18. 25. Lacity, M.C, and Willcocks L. (1998). An Empirical Investigation of Information Technology Sourcing 26. Practices: Lessons from Experience. MIS Quarterly, 363-408. 27. Lane, M., Van der Vyver, G.L. and Hajiyev, E. (2005). IT Outsourcing Success: Revisiting the Measurement of a
Multidimensional Construct: An Australian Perspective. Proceedings of Pacific Asia Conference on Information Systems, 257-270.
28. Lee, Jae-Nam and Kim, Young-Gul. (1999). The Effect of Partnership Quality on IS Outsourcing Success: 29. Conceptual Framework and Empirical Validation. Journal of Management Information Systems, 15(4), 30. 29-61. 31. Lee, J.N. (2001). The impact of knowledge sharing, organizational capability and partnership quality on IS
outsourcing success. Information and Management, 38( 5) 323-335. 32. Lee, Jae-Nam; Huynh Minh Q.; Kwok, Chi-Wai& Pi, Shih-Ming. (2000). The evolution of outsourcing 33. research: What is the Next Issue? Proceedings of the 33rd Hawaii International Conference on System 34. Science. 35. Lee, J.N. and Kim, Y.G.(2003). Exploring a Casual Model for the Understanding of Outsourcing Partnership.
Proceedings of the 36th Hawaii International Conference on System Science, 268. 36. Lee, Jae-Nam, Miranda, S. M and Kim, Yong-Mi. (2004).IT Outsourcing Strategies: Universalistic, 37. Contingency, and Configurational Explanations of Success. Information Systems Research, 15(2), 110- 38. Lee, J.N. and Kim, Y.G. (2005). Understanding Outsourcing Partnership: A Comparison of Three Theoretical
Perspectives.IEEE Transactions on Engineering Management.52(1), 43-58. 39. Lee, Jae-Nam and Huynh Minh Q. (2005). An Integrative Model of Trust on IT Outsourcing: From the Service
Receiver’s Perspective. Proceedings of the Pacific Asia Conference of Information Systems, 767-779.
Sami Sarkhi Mousavi
Indian Journal Of Natural Sciences www.tnsroindia.org. © IJONS
Vol.5 / Issue 28/ February 2015 International Bimonthly ISSN: 0976 – 0997
2597
40. Levina, N. and Ross, J.W. (2003). From The Vendor’s Perspective: Exploring the Value Proposition in 41. Information Technology Outsourcing. MIS Quarterly, 27(3), 221-364. 42. McFarlan, F. Warren and Nolan, Richard L.(1995). How to manage an IT Outsourcing Alliance. Sloan 43. Management Review, 36, 9-23. 44. Mohr, J. and Spekman, R. (1994). Characteristics of partnership success: Partnership attributes, communication
behavior, and conflict resolution techniques. Strategic Management Journal, (15), 135-152. 45. Nonaka, I. and Takeuchi, H. (1995).The Knowledge-Creating Company, Oxford University Press, New York. 46. Probst, G.; Raub, S.; and Romhardt, K. (2000). Managing knowledge: Building blocks for success. England: John
Weily& Sons Ltd. 47. Sabherwahl, R. (1999). The Role of Trust in IS Outsourcing Development Projects. Communications of ACM,
42(2), 80-86. 48. Sengupta, K. and Zviran, M. (1997).Measuring user satisfaction in an outsourcing environment. Engineering
Management, IEEE, 44( 4), 81-103. 49. Sun, S-Y; Lin, T-C; Sun, P-C. (2002). The Factors Influencing Information Systems Outsourcing Partnership – A
Study Integrating Case Study and Survey Research Methods. Proceeding of the 35th Hawaii International Conference on System Sciences, 235.
50. Bahli, B. &Rivard, S (2005). Validating measures of information technology outsourcing risk factors. Omega, Volume 33, Issue 2, Pages 175-187.
51. Gasco, J., Gonzalez, R. &Llopis, J (2005). Information systems outsourcing success factors:a review and some results. Information Management & Computer Security, Volume 13, IssuePages: 399-418.
52. Kadiyala, S. &Samaddar, S (2005). Information systems outsourcing: Replicating anexisting framework in a different cultural context, Journal of Operations Management, In Press
53. Barthélemy, J (2003). The Hard and Soft Sides of IT Outsourcing Management. European Management Journal, Volume 21, Issue 5, Pages 539-548
54. Kern, T., Lacity, M. &Willcocks, L (2000). Risk migration in IT outsourcing strategy revisited: longitudinal case research at LISA, Journal of Strategic Information Systems,Volume 8, Issue 3, Pages: 285-314
55. Tafti, M (2005). Risks factors associated with offshore IT outsourcing, Industrial Management & Data Systems, Volume 105, Issue 5, Pages: 549-560
56. Aggestam, L. &Söderström, E. (2005). Managing Critical Success Factors in a B2B Setting, In: Karmakar&Isaías (eds.), Proceedings of the IADIS International Conference eCommerce 2005, Porto, Portugal, 15-17 December, Pages: 101-108
57. Kern, T. &Willcocks, L (2000). Exploring information technology outsourcing relationships: theory and practice, The Journal of Strategic Information Systems, Volume 9, Issue 4, Pages: 321-350.
58. Klimoski, R.J. & Webber, S.S (2004) Client-project manager engagements, trust, and loyalty, Journal of Organizational Behavior, Volume 25, Issue 8, Pages: 997-1013.
59. Ibbott, C.J. & O’Keefe, R.M (2004) Trust, planning and benefits in a global interorganizational system, Information Systems Journal, Volume 14, Issue 2, Pages: 131-152.
60. Sabherwal, R (1999). The role of trust in outsourced is development projects, Communications of the ACM, Volume 42, Issue 2., Pages: 80-86
61. Dahanayaka, A., Stojanovic, Z. & Sol, H (2001). A methodology for component-basedsystem development support, EMMSAD’2001, Sixth CaiSE/IFI8.1, Pages: XIX-1-XIX-14.
Sami Sarkhi Mousavi
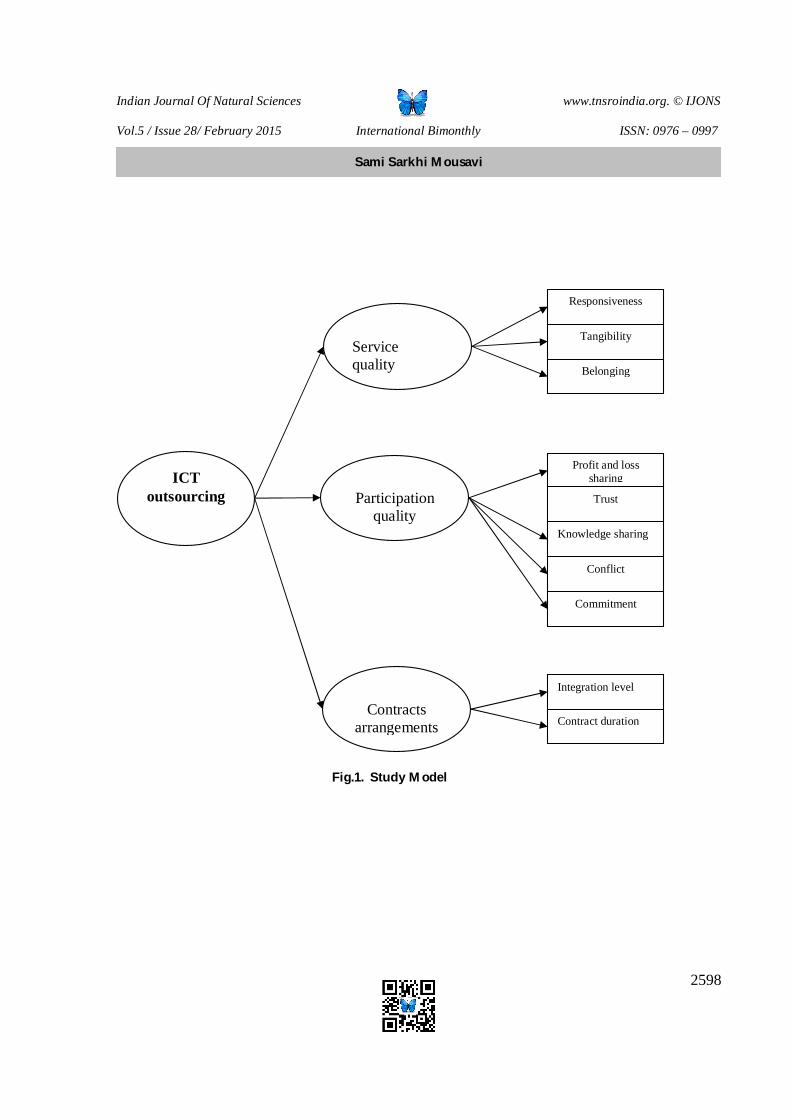
Indian Journal Of Natural Sciences www.tnsroindia.org. © IJONS
Vol.5 / Issue 28/ February 2015 International Bimonthly ISSN: 0976 – 0997
2598
Fig.1. Study Model
ICT outsourcing
Service quality
Participation
quality
Contracts
arrangements
Responsiveness
Tangibility
Belonging
Profit and loss sharing
Trust Knowledge sharing
Conflict
Commitment
Integration level
Contract duration
Sami Sarkhi Mousavi
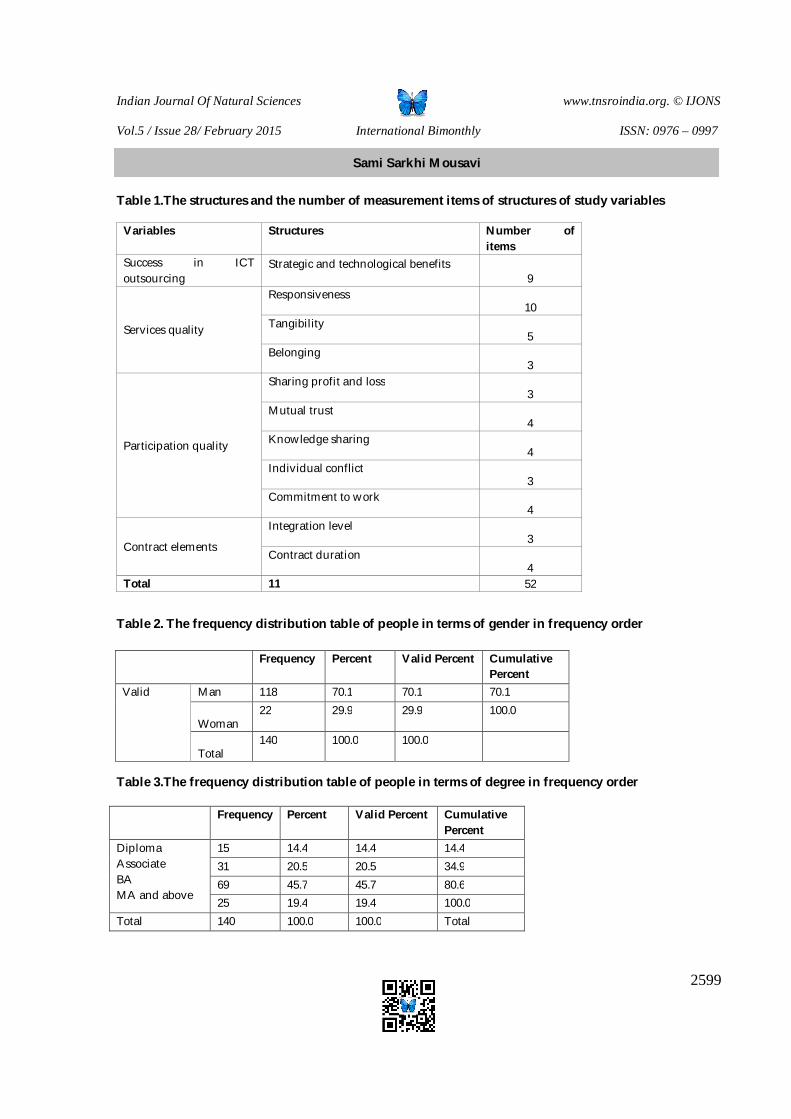
Indian Journal Of Natural Sciences www.tnsroindia.org. © IJONS
Vol.5 / Issue 28/ February 2015 International Bimonthly ISSN: 0976 – 0997
2599
Table 1.The structures and the number of measurement items of structures of study variables
Table 2. The frequency distribution table of people in terms of gender in frequency order
Table 3.The frequency distribution table of people in terms of degree in frequency order
Frequency Percent Valid Percent Cumulative Percent
Diploma Associate BA MA and above
15 14.4 14.4 14.4 31 20.5 20.5 34.9 69 45.7 45.7 80.6 25 19.4 19.4 100.0
Total 140 100.0 100.0 Total
Number of items
Structures Variables
9 Strategic and technological benefits Success in ICT
outsourcing
10 Responsiveness
Services quality 5 Tangibility
3 Belonging
3 Sharing profit and loss
Participation quality
4 Mutual trust
4 Knowledge sharing
3 Individual conflict
4 Commitment to work
3 Integration level
Contract elements
4 Contract duration
52 11 Total
Frequency Percent Valid Percent Cumulative Percent
Valid Man 118 70.1 70.1 70.1 Woman
22 29.9 29.9 100.0
Total
140 100.0 100.0
Sami Sarkhi Mousavi
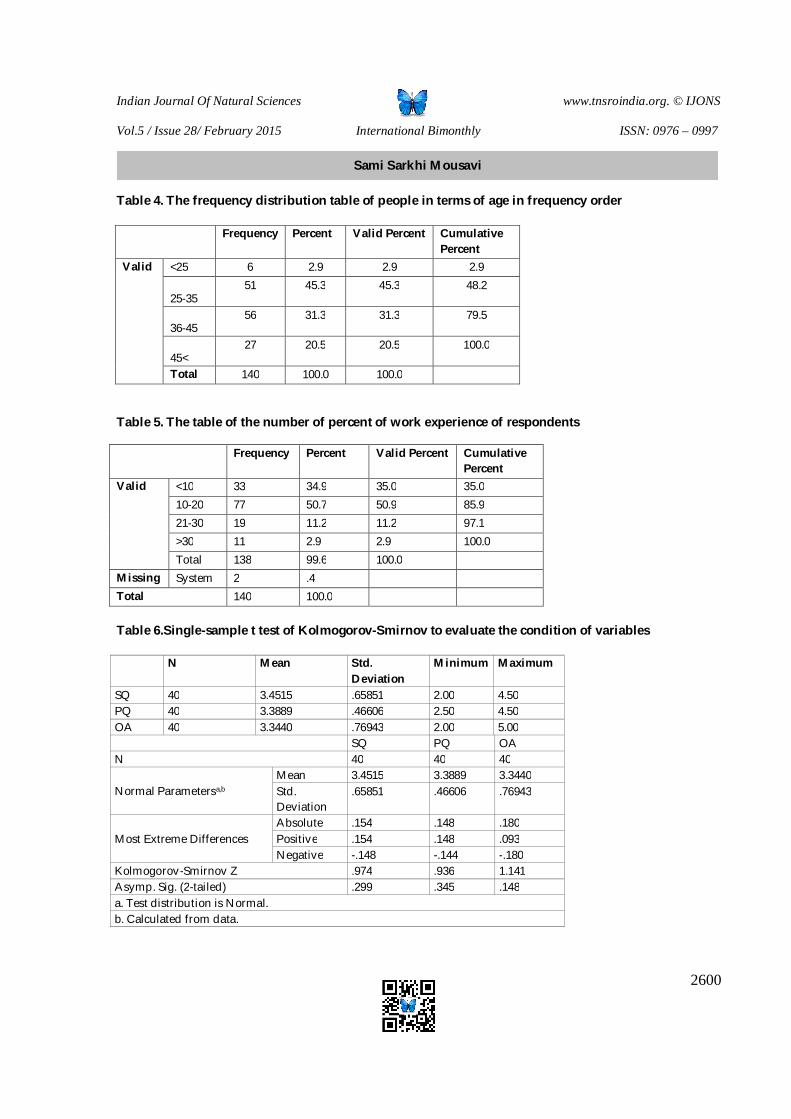
Indian Journal Of Natural Sciences www.tnsroindia.org. © IJONS
Vol.5 / Issue 28/ February 2015 International Bimonthly ISSN: 0976 – 0997
2600
Table 4. The frequency distribution table of people in terms of age in frequency order
Table 5. The table of the number of percent of work experience of respondents
Table 6.Single-sample t test of Kolmogorov-Smirnov to evaluate the condition of variables
Frequency Percent Valid Percent Cumulative Percent
Valid <25 6 2.9 2.9 2.9 25-35
51 45.3 45.3 48.2
36-45
56 31.3 31.3 79.5
45<
27 20.5 20.5 100.0
Total 140 100.0 100.0
Frequency Percent Valid Percent Cumulative Percent
Valid <10 33 34.9 35.0 35.0 10-20 77 50.7 50.9 85.9 21-30 19 11.2 11.2 97.1 >30 11 2.9 2.9 100.0 Total 138 99.6 100.0
Missing System 2 .4 Total 140 100.0
N Mean Std. Deviation
Minimum Maximum
SQ 40 3.4515 .65851 2.00 4.50 PQ 40 3.3889 .46606 2.50 4.50 OA 40 3.3440 .76943 2.00 5.00
SQ PQ OA N 40 40 40
Normal Parametersa,b Mean 3.4515 3.3889 3.3440 Std. Deviation
.65851 .46606 .76943
Most Extreme Differences Absolute .154 .148 .180 Positive .154 .148 .093 Negative -.148 -.144 -.180
Kolmogorov-Smirnov Z .974 .936 1.141 Asymp. Sig. (2-tailed) .299 .345 .148 a. Test distribution is Normal. b. Calculated from data.
Sami Sarkhi Mousavi
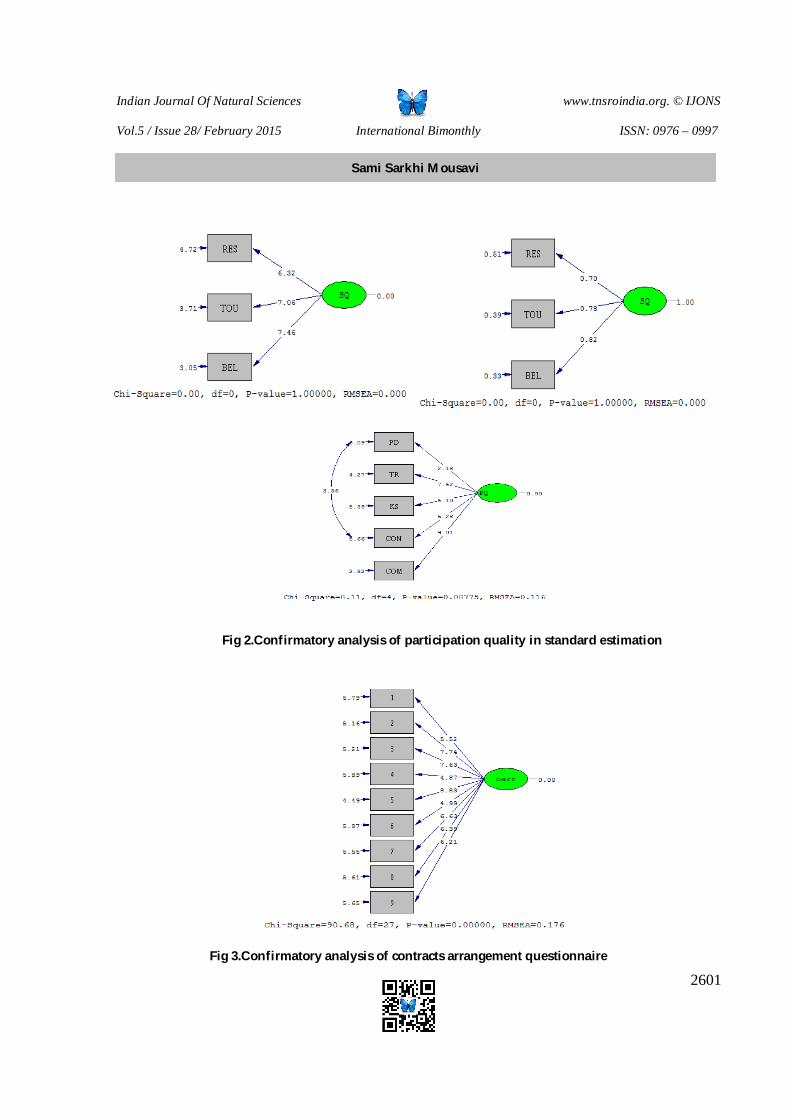
Indian Journal Of Natural Sciences www.tnsroindia.org. © IJONS
Vol.5 / Issue 28/ February 2015 International Bimonthly ISSN: 0976 – 0997
2601
Fig 2.Confirmatory analysis of participation quality in standard estimation
Fig 3.Confirmatory analysis of contracts arrangement questionnaire
Sami Sarkhi Mousavi
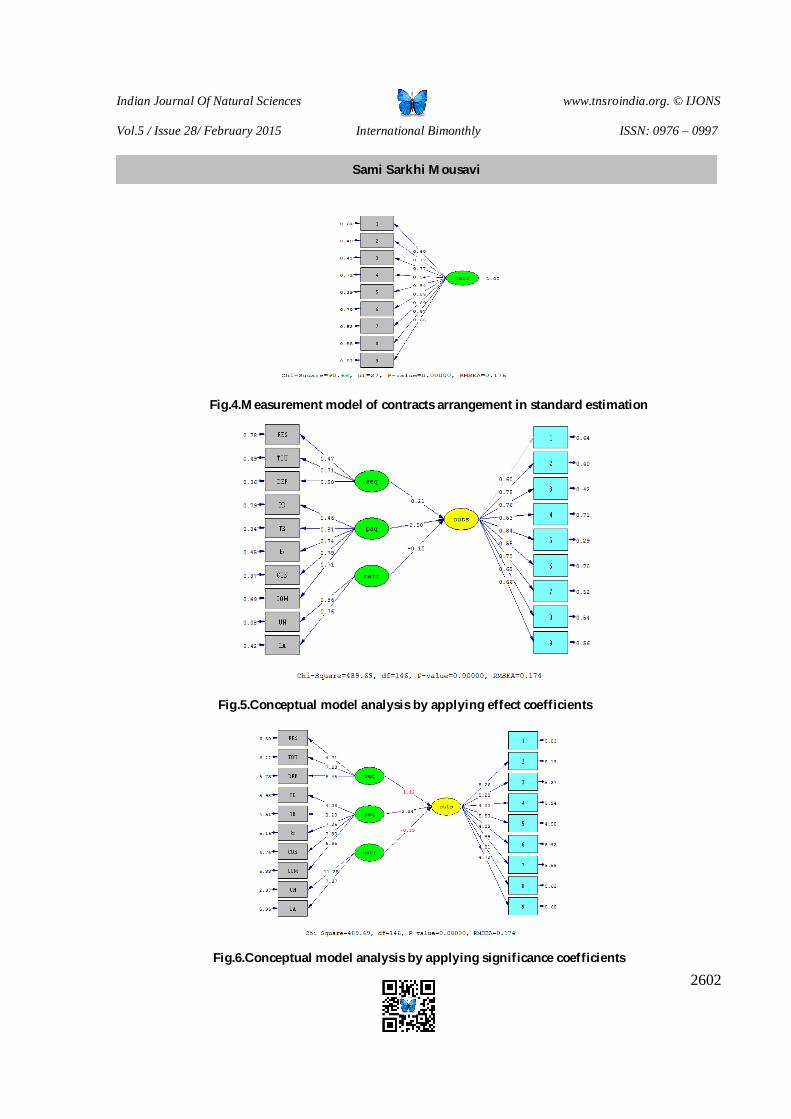
Indian Journal Of Natural Sciences www.tnsroindia.org. © IJONS
Vol.5 / Issue 28/ February 2015 International Bimonthly ISSN: 0976 – 0997
2602
Fig.4.Measurement model of contracts arrangement in standard estimation
Fig.5.Conceptual model analysis by applying effect coefficients
Fig.6.Conceptual model analysis by applying significance coefficients
Sami Sarkhi Mousavi
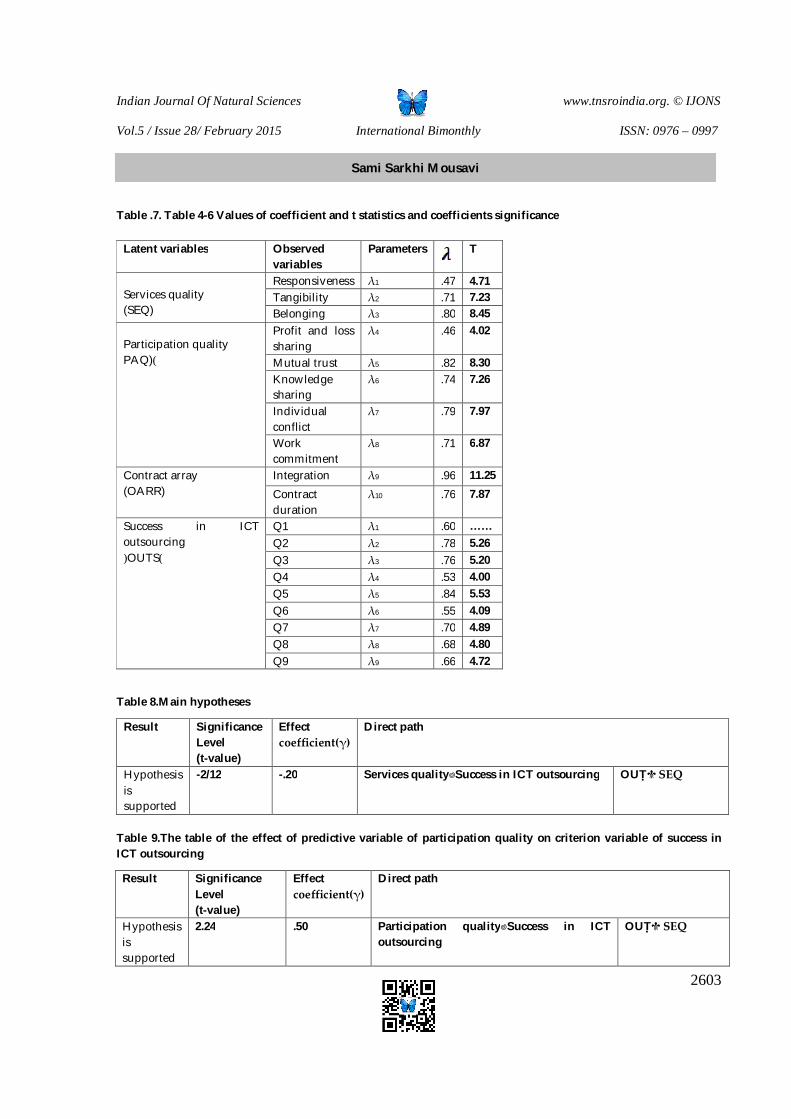
Indian Journal Of Natural Sciences www.tnsroindia.org. © IJONS
Vol.5 / Issue 28/ February 2015 International Bimonthly ISSN: 0976 – 0997
2603
Table .7. Table 4-6 Values of coefficient and t statistics and coefficients significance
Table 8.Main hypotheses
Table 9.The table of the effect of predictive variable of participation quality on criterion variable of success in ICT outsourcing
T
Parameters Observed variables
Latent variables
4.71 .47 λ1 Responsiveness Services quality (SEQ)
7.23 .71 λ2 Tangibility 8.45 .80 λ3 Belonging 4.02 .46 λ4 Profit and loss
sharing Participation quality PAQ)( 8.30 .82 λ5 Mutual trust
7.26 .74 λ6 Knowledge sharing
7.97 .79 λ7 Individual conflict
6.87 .71 λ8 Work commitment
11.25 .96 λ9 Integration Contract array (OARR) 7.87 .76 λ10 Contract
duration …… .60 λ1 Q1 Success in ICT
outsourcing )OUTS(
5.26 .78 λ2 Q2 5.20 .76 λ3 Q3 4.00 .53 λ4 Q4 5.53 .84 λ5 Q5 4.09 .55 λ6 Q6 4.89 .70 λ7 Q7 4.80 .68 λ8 Q8 4.72 .66 λ9 Q9
Direct path Effect coefficient(γ)
Significance Level (t-value)
Result
OUT SEQ Services quality Success in ICT outsourcing -.20 -2/12 Hypothesis is supported
Direct path Effect coefficient(γ)
Significance Level (t-value)
Result
OUT SEQ Participation quality Success in ICT outsourcing
.50 2.24 Hypothesis is supported
Sami Sarkhi Mousavi
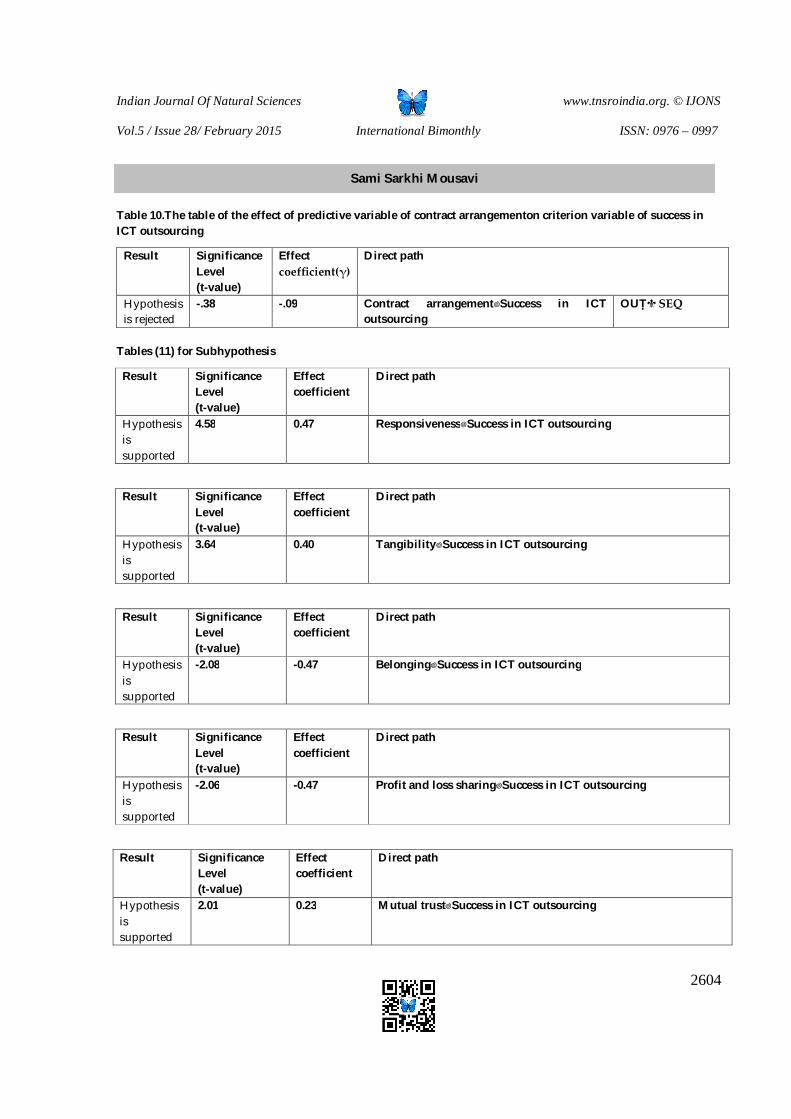
Indian Journal Of Natural Sciences www.tnsroindia.org. © IJONS
Vol.5 / Issue 28/ February 2015 International Bimonthly ISSN: 0976 – 0997
2604
Table 10.The table of the effect of predictive variable of contract arrangementon criterion variable of success in ICT outsourcing
Tables (11) for Subhypothesis
Direct path Effect coefficient(γ)
Significance Level (t-value)
Result
OUT SEQ Contract arrangement Success in ICT outsourcing
-.09 -.38 Hypothesis is rejected
Direct path Effect coefficient
Significance Level (t-value)
Result
Responsiveness Success in ICT outsourcing 0.47 4.58 Hypothesis is supported
Direct path Effect coefficient
Significance Level (t-value)
Result
Tangibility Success in ICT outsourcing 0.40 3.64 Hypothesis is supported
Direct path Effect coefficient
Significance Level (t-value)
Result
Belonging Success in ICT outsourcing -0.47 -2.08 Hypothesis is supported
Direct path Effect coefficient
Significance Level (t-value)
Result
Profit and loss sharing Success in ICT outsourcing -0.47 -2.06 Hypothesis is supported
Direct path Effect coefficient
Significance Level (t-value)
Result
Mutual trust Success in ICT outsourcing 0.23 2.01 Hypothesis is supported
Sami Sarkhi Mousavi
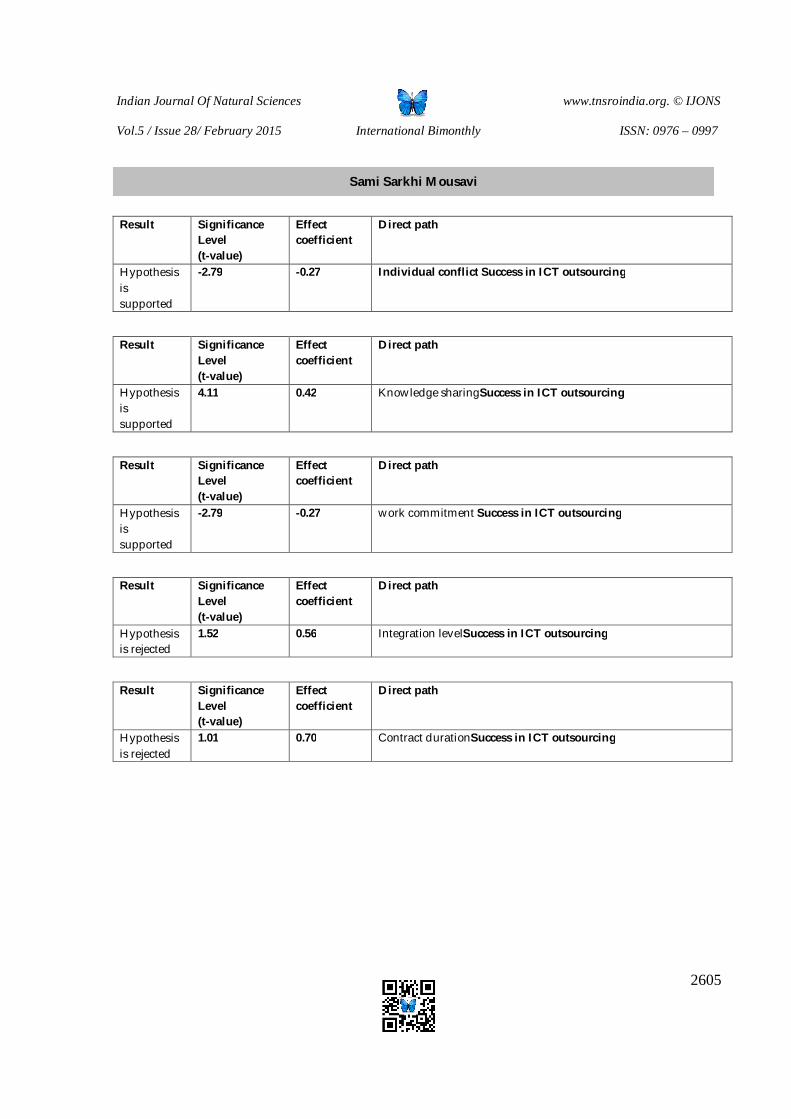
Indian Journal Of Natural Sciences www.tnsroindia.org. © IJONS
Vol.5 / Issue 28/ February 2015 International Bimonthly ISSN: 0976 – 0997
2605
Direct path Effect coefficient
Significance Level (t-value)
Result
Individual conflict Success in ICT outsourcing -0.27 -2.79 Hypothesis is supported
Direct path Effect coefficient
Significance Level (t-value)
Result
Knowledge sharingSuccess in ICT outsourcing 0.42 4.11 Hypothesis is supported
Direct path Effect coefficient
Significance Level (t-value)
Result
work commitment Success in ICT outsourcing -0.27 -2.79 Hypothesis is supported
Direct path Effect coefficient
Significance Level (t-value)
Result
Integration levelSuccess in ICT outsourcing 0.56 1.52 Hypothesis is rejected
Direct path Effect coefficient
Significance Level (t-value)
Result
Contract durationSuccess in ICT outsourcing 0.70 1.01 Hypothesis is rejected
Sami Sarkhi Mousavi
Indian Journal Of Natural Sciences www.tnsroindia.org. © IJONS
Vol.5 / Issue 28/ February 2015 International Bimonthly ISSN: 0976 – 0997
2606
Comparison of Hair Symbolizes in Hafiz and Garden Secret of Sheikh Mahmoodshabestary Bureau S.MojtabaHosseini1* and Alireza Monajati2
1Department of Persian Language and Literature, Faculty of Literature and Humanities, Bushehr branch, Islamic Azad University, Bushehr, Iran. 2Department of Persian Language and Literature, Bushehr Branch, Islamic Azad University, Bushehr, Iran. Received 1 Jan 2015 Revised:20 Jan 2015 Accepted: 25 Jan 2015 *Address for correspondence Dr.S.MojtabaHosseini Assistance Professor,Department of Persian Language and Literature, Faculty of Literature and Humanities, Bushehr branch, Islamic Azad University, Bushehr, Iran. Email: [email protected]
This is an Open Access Journal / article distributed under the terms of the Creative Commons Attribution License (CC BY-NC-ND 3.0) which permits unrestricted use, distribution, and reproduction in any medium, provided the original work is properly cited. All rights reserved. Mystics with inspired and benefiting from Quran knowword manifestation of beauty and spender of embodies the essence of god. They with benefiting of symbolic language and secret were followed to received his profound to express with metaphorical language in the little thing first a brief reference to the symbolic and secret language and its range and coextensive and then one of the secreted words, in the language of mystics mean hair and its similarities mean hair, lasso,…has been studied and in the following speech, expression and manifestation of this secret element in hafezbureau and secret golshan of sheikh Mahmoodshabestary as integrated and compare has been explored and because of the more frequent of this word in hafiz bureau in the appeals of their manifestation samples of hafiz bureau reviewed. Key words: avatar, hair, hafizbureau,secret garden of sheikh Mahmoodshabestary. INTRODUCTION Thousands narrow point than hair is here not any hair cut from hair is bell Dunn(Hafiz: 189:2008) One of the properties of mystic language is benefiting from secret elements and symbols and specific term that represent the destination and purpose of mystics. And because of this reason mystics and scholar of mysticism always written to the string many books and dissertation about this secrets .writing books such as discover of mahgoub,
ABSTRACT
RESEARCH ARTICLE
Indian Journal Of Natural Sciences www.tnsroindia.org. © IJONS
Vol.5 / Issue 28/ February 2015 International Bimonthly ISSN: 0976 – 0997
2607
ghashiriehdissertation, almam and….in ghashiriehdissertation, third chapter to interpret the words of the Sufi sects, and whatever is problem from them were assigned And writes that this tribe, words have a specific meaning and also terms that overly worn to be worn on Naahl is uncertain and their secrets is not disclose so deal with the terms.(sajjadi,268:1996). Mystic’s words can be divided into 2 parts.1-terms 2-secretsMystics terms is those words that with vocabulary words and its meaning have a close fit and with different meaning ways newer and specific expression have been found these bunch of words more inclined to mysticism asceticism and used as a Sufism and Sufi teaching that are tend to be hermits. Conditions such as extended, bills, drinking and tasteful, setter, manifestation, revelation and view and…. But mystic’s words and mystical secrets are words that while having relation to man, literally and metaphorical border slim beauty is based on the simulator relationship. Or metaphorically as a symbol of divine love and mystical manifestation have been recruited.in the language of love and mystical language, spirituality, mysticism and who are enjoying the journey of these symbols and terms are abundant .one of these secrets that many and frequently found in the language of these speakers is symbols or secrets under the field of semantic and lexical hair and words that near from meaning grasp is mentioned. Hafiz shirazi as one of the speakers and famous Iranian poet influenced by mystical literature before it used this symbolic language to express their language. other mystic and poet that with symbolic language, benefiting from mystical journey. SheikhMahmoodshabestary is composer of famous poem of secret garden.The difference between ordinary language and symbolic language Ordinarylanguage is responsible for various tasks.It’s main tasks to establish the relationship between human beings. Normal language can clearly thought that the matter belonged .at the same time clear, concise expression of emotions and experiences that go beyond the material wordis powerless.Even for a simple expression language to describe the feeling of some of the obvious things like color, taste and potency of lose. Turning on icon is one of the ways to increase language’s ability to express emotions or pure experience .indeed, symbolic language, the language of the state and outside his normal form and a new spiritual talent and capacity to give words. The scope of the lexicon and it’s meaning is beyond the language culture.in symbolic expression of Sartre’swords “the language is not a relation instrument but is a unit relation” (pour namdarian, 33:1985). From symbolic language properties is semantic features of a many-sided expression and ambiguity. Toudorof in symbolism and interpretation proven that each shape of symbolic speech has ambiguous language. Its meaning is multi-species and their language inevitably reflects this ambiguity (Ahmedi, 29:1991). Therefore, the symbol conveys a meaning much broader and deeper meaning that a normal word or even tells a literary pictures. From the perspective of symbolic language, esoteric has existence meaning, which is extra-sensory semantic and from the scope of understanding of those who in the light of material and sensitive word and interpreted its phenomena is out. Joel lobel reminder that “each object, creature, is as a reflection if divine perfection is a perceive and natural symbol from supernatural fact and salostioshas stated that world is asymbolicobject (pornamdaram, 1985). On this basis, shabestari said in the secret garden that Everything in this universe is clear like picture from the sun of that world(shabestary 86:2009).SecretsPornamdarian wrote about the meaning of secrets “secrets is sum of secret (symbol) and that is each words or combination of word and change and its sign that between native code is typical and in this definition probably examples and example is also mean code.(pornamdarian,1985). Writer in the other part about coated mysticism writes “the broadcasters when want to cover up their own purpose from people and only aware some of them, use code in their word. Thus, for describing word or letter the name of bird’s name, or wildlife or other goods or Mujam letter as a code and anyone who wants to understand the word by themselves aware them and then that word between two concepts, is mystery from others. (Same one: 0)Hafiz also in the bit points to his hiddenness:Speech in screen like flower comes out from bud that before this not more than 5 days is norouzi judgment (hafiz345:2008). Or say in the other part:It’s deemed to occurs mystery out of curtains do not hang around in the forum house no news(Same: 132)
MojtabaHosseini and Alireza Monajati
Indian Journal Of Natural Sciences www.tnsroindia.org. © IJONS
Vol.5 / Issue 28/ February 2015 International Bimonthly ISSN: 0976 – 0997
2608
Secret is Arabic word and in origin it means point to lips, to eye, to eyebrow, to hand andTongue.This word in the Persian language also like Arabic used as a different meaning such as: pointed, secret, head, minute, point, sign, symbol, pointing, hidden is special sign that understood a concept from it. Something hides between two or several persons which another body don’t aware from it and express purpose with are spoke signs and symbols (Lahiji, 2008: introduction, four). In specified definition assigned that cover up and hide express is s common features of all meaning and expressions is secret word.in holy Quran is also one time pointer to secret word” SaidLordMarksaidnoversenotmade statementspeoplefor three days, but a symbol(Al-Imran: 41). Based on these definitions, Sufi and mystic considered a certain words from appearance of secret word and thus it has been stated in encrypted in order to mysticism and Sufi understand it so that there is no way to understand for others.in meshvagh dissertation, writing of mollahasanfeizkashani, some of secret word and books for describing and meaning as follow:Cleavage is the manifestation of God’s grace as gentle and gracious character and conductor. Hair: Trait anger is a manifestation f divine glory, such as barrier and astringent and heavy (sajjadi 274:1996). Khaje hafiz shirazi is undoubted one of the brightest stars in heaven of Persian literary that with pleasing poems and bright sonnet is for centuries on the height palace of poem and Persian literary shine, Khaje express many of his ideas in symbolic language .among secrets and words which in the hafiz poem as wide for this purpose is word of hair and accessories and it’s belonging such as hair, lasso, roc and ….. Roc suitable with light and hair suits with dark and sometimes from absolute massu interpret to hair, whether hair, curtain and masks of beloved face. Each of this manifold universes, the nature of the hijab and nighab is absolutely true. (Sajjadi, 274:1996).Sajjadi in elsewhere about hair and symbol meaning said: “hair is emblematic from the general and detail, responsible and sensible souls and bodies and jewelry in brief is emblematic of the manifold (Same: 276). Sattari writes in this regard” Sofia Jamal also with see sky and ground and moon and sun and stars and mountains and seas and good faces from women and boys and meaning of saints and prophets, drunk from the Jamal and goodness and adjectives. But of the sane come to creator to see god and know God. Undoubtedly, in the opinion of the body playing with face witnesses of boy and girl with witnesses of stump and type of meaning blend because with face of cause. But the eye of spirit should to see spirit (sattari, 70:2009). Sadi write in this topic:Narrowed eyes seemed to bear fruit we giving while watching(Saadi, 315:2006). Hafiz also deserve the right and level of God is worthy for eyes that take out the appearance curtain to see beyond of them.Seen your face should see the spirit so where is the order of seeing world(Hafiz121:2008)So we need to familiar with this universe for realize these secrets:Until you don’t familiar you can hear secret from this curtain the ear if uncharacteristic is not a place for angel message(Same: 246).For thispurpose that hair is also one of the mystic symbols for spiritual expression. From this perspective we want to evaluate this symbol, manifestation and different representation from it in famous 2 opus mean hafiz bareue and garden secret. And subscriptions and manner of payment for this 2 opus pass from our see.Every hair of mine with you is thousands work Where we are and where the idle criticism(Same: 106). Hair in spiritual poetry in a batch of hair which cover near cheek and on the ear, but in general applied to hair of head.in tall lyrical Persian poetry, dark and winding and twisting crushing and especially loved the hair and multiple imagery and themes as very pleasing has been created. But the Sufi with giving mystical to romantic poetry has created a bunch of mystical secrets. From hair they said a different interpretation “what around face like a snake in the garden, curly hair of her call hair, as described for expressing delbaran.(daneshpazhooh39:1986). Lahiji also in expression garden said a secret “known that multiplicity of the hair and line, from that contrast and unified have liked to attribute the spots until hidden from the narrow perspective which according to original nature, don’t prone to accept that thing.(Lahiji,34:2008). One way to discover the mystic secrets content, to study the mystic content, study the communications and correspondence as they are did.as mystic said: who wants tostand on thesymbolsofour sheikhs, let him look atMancorrespondenceinwhichthesymbolsarenotintheir works?(Lahiji, 5:2008). Sheikh saad din Mahmoodshabestary is one of the mystics in eight century. His amous opus is MasnaviGolshanRaz which is mystical Masnavi. He works more to interpretation and describing secrets and mystical symbols. Shabestary
MojtabaHosseini and Alireza Monajati

Indian Journal Of Natural Sciences www.tnsroindia.org. © IJONS
Vol.5 / Issue 28/ February 2015 International Bimonthly ISSN: 0976 – 0997
2609
in this opus “often influenced by the Arabic and style of sheikh attar and molana and described mystical affairs and philosophical issues appropriately with analogiesandanecdotes. Mystic for describing Jamal of God and the beauty of God’s secret, benefit from secret words.one of these words is hair and it’smuch manifestation. of course, God’s Jamal in every visible of universe is showed and divine of God in all aspect of the entire universe has manifestation and life of mystic without manifestation of God don’t have desire for his being. According to hafiz saying:
Life without Jamal of darling don’t have desire to world everyone who don’t have this indeed don’t have that (Hafiz, 160:2008)As mentioned, they understand this manifestation in all universes.Near one who it’s life is the manifestation all universes is the book of God (shabestary ,125:2009) Also said:Everything that clear in the world like a picture from sun of other world(Same: 280)
Because the romantic mysticism is a kind of love and to be loved its inevitable to benefit from romantic words and symbols and this resulted that mystical poetry and specially lyric poetry has the color and flavor of romance and used word such as :smell ,face ,hair ,lasso ,eyebrow ,tattoos, the eye ,connect and this matter caused that superficial and apparent imagination that he mean the apparent and great mystics such as shabestary respond to this question this way:
Two eyes of people appear has ophthalmic that from appear don’t see except appearance . In whom whatever said from less and more has addressed to his own seen(Same: 83)
Whatever from mystics saying, all world is part of Jamal and Jalal manifestation of God and God’s manifestation understand with illumination, intuition and intellect but the Nature of God for ever hidden from our eyes and from Hafiz saying:With no one don’t see the address from midst maybe I don’t know or maybe he don’t have address (Hafiz 160:2008)One of the hair and dotted line described wine and candle and explicit witness (shabestary 54:2009)Shabestary in this bit pointed to the secrete meaning of hair and counts hair and line is one of the manifestation of God’s Jamal and address from unity of God. And know these from symbols that like other mystics that from wine and candle and witness benefited for describing God’s Jamal.in this bit hair in fact is a symbol of the plurality and in other place described the same content with other language and that in the answer of question from him. What man want meaning from expression that have eyes and tip lips.What he wants from face and hair and line and dotted someone is in authority and status(Same: 279)And mystic from there that establishment of the world is the best and full counts and said that this appearance is the manifestation from outward Jamal.Whatever is clear in the world is like a picture of sun in another world(Same: 280)And according to this excellent system, every manifestation of god’s Jamal is that from true beauty and eternal grandeur that hair in fact is the sign of his glory and face shows Jamal.This beautiful point come in romance masnvaiKgosro and Shirin and that is when Shirin intention to go to Ctesiphon andin the middle of the road goes to eyes to rinse your head and face and this glory manifestation (beauty and elegance) come into mot and sweet bit.In every side of hair combs spend on flowers have beans.If you did wrong work on her hair that it has snake in the base of every hair.Told to king hidden from parotid that lord with han in his ear(Nezami: 130)Because of this that come into secret garden:
Manifestation that Jamal and sometimes glory face and hair of that meaning are example.Attributes of God is grace and violence face and hair of idols is from two batch (shabestary280:2009).It means that manifestation of darling even Terrestrial or divine in glory of protagonist can be seen and Hafiz also in this meaning can describe well and that said in the sonnet.Although he said that task force I saw that in her hidden has visionary with my heart burned Blasphemy of her hair ran dean and her heavy heart following her torch flushed from her face(hafiz207:2008).In the above verses, hafiz count the black of her hair (darling) is to prove of his faith and with interpreting view count it as a manifestation of glory of God. Thus glory and Jamal of God with kindness or violence together and both of them in fact is the manifestation of one source.Particularlyabdolkarimjili said: every Jamal like his manifestation has intensity and come to glory.as every glory at first of manifestation on people is Jamal and from here is said that every Jamal
MojtabaHosseini and Alireza Monajati

Indian Journal Of Natural Sciences www.tnsroindia.org. © IJONS
Vol.5 / Issue 28/ February 2015 International Bimonthly ISSN: 0976 – 0997
2610
has glory and every glory has Jamal.(jili:1970) Shabestary also in the part of secret garden point to complexity and long fuel of discussion on the field of secret and hair of darling and know that is the place for mystery and secret of God.Hadith of darling’s hair is so long so why you ask from her that because it’s secret.Don’t ask from me hadith cutting chain hair don’t wiggle chains of insane(shabestary296:2009).These manifestations of God in fact sum of two contradictory that in appearance is logical and in lexicon reason is not acceptable but in love and mystic world has another logic and sum of contradictory elements is possible and wisdom bless visionary and futurist don’t go to anywhere and from randanKhwaja saying: Wisdom that said the insane of love to smell of lavender of your hair become insane(Hafiz 328:2008).And say in other place:Residing in your hair heart that see literacy and from that come suffering(Same: 220)Or in another lines the manifestation in the appearance is the opposite of jamal and glory of God that sings this species:Hafiz told slip and tips to don’t sale to friends Ah from this thanks to every kind of infected blame(Same:345)OrWith this point we can say that a heavy hearth kills us and the inspiration of Jesus Mary is with her(Same: 124)This kind of manifestation also seen in romantic bit:Meet us and avoid it’s your market and sharpen our fire (saadi289:2006)Anyway this symbolic language in land love and beyond land with pointing to appearance body of darling refers to inner glory and Jamal of God. And now(its pleaser from beloved head) to hear from another language. shabestary said particularly: Manifestation is sometimes Jamal and sometimes glory face and hair of this meaning has example.The God’s properties is kindness and violence face and hair of idols because of these(shabestary 280:2009).It means that manifestation of beloved even land or divine in the garb of Jamal and Jalal come to show and Hafiz also described this meaning well and said in the sonnet that:Even she said to me take her suffering but I see her hidden has visionary with my hearth burnt.Blasphemy of her hair takes the way of Dean and her heavy heart following the torch flushed her face(hafiz207:2008). But also told bright of God’s Jamal in the second hemistich and in the second hemistich also even remind the glory and greatness of God, but in the second hemistich and also the same kindness and eternal grace that is the manifestation of Jamal and beauty and grace of himHafiz said in another place that:I said that the smell of your hair misleading me from universe he said that if you know that your leader come(Same: 218) In this bit khaje the say the hair as a symbol from black and manifestation of God’s wrath but yet count this as a guide. Because of this the glory and Jamal of God or wrath or grace of him is together and both of them in face is the manifestations f one source.in this regard abdolkarimjiliwrote :”every Jamal like his advent has intensity, become to glory.as every glory at the first of advent to people is Jamal and from there said that every Jamal has glory and every glory has Jamal.(Jili: 1970).Shabestary also in the part of secret garden pointed to complexity and long term of discussion in land and mystery and secret of God and know that from secret of God:Hadith of darling’s hair is so long so why you ask from her that because it’s secret.Don’t ask from me hadith cutting chain hair don’t wiggle chains of insane(shabestary296:2009).These manifestations of God in fact sum of two contradictory that in appearance is logical and in lexicon reason is not acceptable but in love and mystic world has another logic and sum of contradictory elements is possible and wisdom bless visionary and futurist don’t go to anywhere and from randanKhwaja saying: Wisdom that said the insane of love to smell of lavender of your hair become insane(Hafiz 328:2008)And say in other place:Residing in your hair heart that see literacy and from that come suffering (Same: 220) Or in another lines the manifestation in the appearance is the opposite of jamal and glory of God that sings this species:Hafiz told slip and tips to don’t sale to friends Ah from this thanks to every kind of infected blame(Same:345)OrWith this point we can say that a heavy hearth kills us and the inspiration of Jesus Mary is with her(Same: 124)This kind of manifestation also seen in romantic bit:Meet us and avoid it’s your market and sharpen our fire (saadi289:2006).Anyway this symbolic language in land love and beyond land with pointing to appearance body of darling refers to inner glory and Jamal of God. And now(its pleaser from beloved head) to hear from another language. shabestary said particularly: Manifestation is sometimes Jamal and sometimes glory face and hair of this meaning has example.The God’s properties is kindness and violence face and hair of idols because of these (shabestary 280:2009).
MojtabaHosseini and Alireza Monajati

Indian Journal Of Natural Sciences www.tnsroindia.org. © IJONS
Vol.5 / Issue 28/ February 2015 International Bimonthly ISSN: 0976 – 0997
2611
Lahiji in interpretation of above verses said: any kind of mirrors your kind face occasion of light and kindness and grace similar with manifestation of Jamal and hair of witty and charming idols is similar with oppression and distress with manifestation of glory to the complete ratio and face and hair of beloved is the example and chart of Jamal and glory manifestation. But also in fact the same as Jamal and glory manifestation” (Lahiji467:2008) In fact he wants to point in this matter that speech for this matter is not easy and with beauty example described this point.as in hafiz poetry also pointed in this matter and is that place where khaje said:I said that series of idol’s hair is for what he said hafiz he protest from lovelorn heart(Hafiz 328:2008).The purpose of this poem from hafiz and sheikh Mahmoodshabestary pointed to manifestation of wrath of God in hair symbol. shabestary bring into other place that: I speak from her height and the top of her hair and she said that close your eyes.Perversity become dominant on truth and he in twisting of road come demanding(Shabestary296-297:2009).In these bits also sheikh Mahmoodshabestary describing well that hair, is the symbol of multiplicity and complexity and this affair has curvature and distortion and node in its appearance and tangible for us the symbol of tortuous way knowing or joiner to the eternal lover and dominant on truth and with beautiful poetic imagination show this snatch. All hearts is come to continuous all souls from her come to circulatory (Same:297) And hearth that caught and love to its hair captured and taken is count from God’s glory that getting ride from it is not imagine.A hundred thousand heart were suspended from every side and not one heart come out from his circle(same:297) And these all because of order and will of God and if God willing to take out multiplicity that described with hair symbol all of world is admitted to undying presence of God and understand the true Jamal of God.If he did sows the black hairs to universe one pagan is not exist(Same: 298)Shabestary n continues of this bit that is a sign of unity and multiplicity and describes the manifestation of God because of faith people and sings: Otherwise is not dwell continually one breath of faithful soul in universe (Same: 299).And his interpretation is when(the circle of charmed hair come to libel and, without any caution and consideration open the tip of hair from her body.it means when people involved in plurality and darkness god open the node of hair and cut and possible for release way.Because the intrigue bait is his tore open with joking head from his body(Same: 298).Hafiz also count the symbol of hair is the cause of virtue that bait with his beauty and good .bait that is sweet and desirable for lover.A lunar landscape face is like a new spring dotted and line is the center of kind and circuit f kind .In your full screen eyesmagic is hidden in your restless hair can find place for calm.Fish can’tTaft like you because of goodness tower cedar are not come to your height from kindness rill.Blooming from your grace is covenant mistress fortunate from your skin good time.From hair bait the nature among life grow to your cute near kindness.Around your lips violet is fresh and wet and drink life water from Kindness River.Hafiz cut greed to see like you there is no land except your face in to kindness land(Hafiz 328:2008). In fact, both of these represent a same thing but with two different words:Hair is epitome of beautyofgrace of God.From another perspective of shabestary, hair is just the symbol of Jamal and divine love and counts this as cause to restlessness and mania and flow of love to God.Our hearth has address from her hair that it's not resident in time(shabestary300:2009) Hafiz also sings from Jamal view to Eternal beloved in this bit with borrow of hair symbol:Does you com hair amber spray that perfume wind building and earth was amber boost(Hafiz 124:2008). It should be noted that the word not here meaning certainly does. Thus khaje fragrant and smells aromatic odor of marshmallow and the beauty of flower know from eternal good smell.Come To hair smell and clothes Saba to perfume shadow and flower to Gary (Same: 343).
MojtabaHosseini and Alireza Monajati

Indian Journal Of Natural Sciences www.tnsroindia.org. © IJONS
Vol.5 / Issue 28/ February 2015 International Bimonthly ISSN: 0976 – 0997
2612
Shabestary boiled the love of the man in the influence of hot and count as a divine symbol. And know the restless of human heart because the hair manifestation of beloved make him Perplexedand distressed. Hearth disturbed from her hair that has fire of his hearth because of her face(shabestary 301:2009).Different manifestation of hair symbol in hafiz bureauGreatlyricism like hafiz it is customary that in describing beloved and express Jamal manifestation of him used from terms and virtual words. Andthis affair causes somebody less familiar with mystic language. All function of this word in poetry language of hafiz to the earth belovedbut somebody has more familiar with symbolic language and secrets know well that some part of this word as a symbolic address for showing Jamal and glory of God come in hafiz's bareu .symbols such as:face,hair,line and dotted and eyebrow and…. Of course, great lyricism that empty from mysticism protection their poetry tendency to appearance and its very obvious that in wisdom and language lexicon these words has appearance meaning and all point to earth beloved.Poets such as:farokhi,rodaki,manochehry and…. Hafiz is one of the people that his personal life and wisdom world is aura of ambiguity and complexity. But the history of our literaryis not sign and cause evidence on Abahh and drinking wine and trite lyricism does not live an intellectual life and thinking, but also eminence and dignity of Hafiz from perspective of intellectual of Quran science universe and familiar with Quran science and magic word. From the other side his lyrics have deep spiritual and mystical meaning. He included delicacy and mystical moments with intelligence and perspicuity in his poems and in his own words: Hafiz poetry all is knowledge lyrics bit congratulation on winning souls and his grace(Hafiz 243:2008).One of the interpretations that found in khaje Shiraz abundant is "hair "and other words and relate symbols with it such as lasso and coma. Hair and related expression in mystic expression is the sign of multiplicity of the advent of God and names and God's attributes show in the form of Jamal and glory manifestation. Hafiz count numerous and diverse properties for hair such as Aesthetic Hair is nature has attractive and beautiful and tubs heart thus hafiz with borrowing and taking advantage from this properties in the form of symbolic language and divine names symbolic in the simile and metaphor feature like filled peacock in Garden of Eden reads:and its worthy that this Jamal in the day circle of lover of mystic and praise. Last night in our circle is the story of your hair until midnight talking about hierarchy of your hair? (hafiz206:2008).And poet describes the beauty and elegance of speaks again described candles of what he should be said.The description of the man that said about his hair is the word that thousands of expressions in it(Same: 187).And maybe can said that interpreted of the Grand Quran (Tell sea MA dada for words that Rube to run out to sea before running out of words that Rube) (Kahf: 109) And in the other place hafiz know the hair of beloved is the deceptive trap for mysticism. Of course mystic in this strap don’t see beside and don’t conflict on it.The crest is witnesses of world all is ward and deception mystics don’t conflict over this string(Same: 250).Hafiz for escape from this windiness, go to beloved hair and promise support and protect from him. As we see from every side that is trap,we don’t have refuge to protect of his hair(Same: 134).But in the hafiz idea hair is the trap of disaster and hardship, but this damage is full of grace and violence integrated and like the fire of love in firebox of mysticism is blazing and gives life.The way that I see trap from every side its better that from his hair support there is no shelter for me (Same: 134).But in hafiz idea is the trap for disaster and hardship, but in this trap is fool of grace and violence integrated and like the fire of love in firebox of mysticism heart is blazing and giving life.
MojtabaHosseini and Alireza Monajati

Indian Journal Of Natural Sciences www.tnsroindia.org. © IJONS
Vol.5 / Issue 28/ February 2015 International Bimonthly ISSN: 0976 – 0997
2613
In hidden I have a house for ishrat of welcome sanamand from the top of hair and rakhsh I have a horseshow in fire (Same: 297).And because of this that the lover of khakdan tolerates shines the darkness of world because of his enthusiasm: If my heart don’t committed to this tress that I wish you be my rest in the khakdan(Same: 338)And the happiness for someone who spend his life with the hair of his love.A man who spend your day and night with hair and face. you have an opportunity that u have a good morning and night(Same: 341). Blackness In poem's vocabulary hafiz, hair is also appointed to polarity and endless of God.in contrast the face is symbol of unity and brightness and whiteness. But because we can'tdistinguish the nature of god.And only with traits can describe the manifestation of divine. The moon of beloved face is also including the hair in night and can't see with inner cognition.in that hafiz said: Beloved when don’t take mask from his face everyone has anecdotal of why imagination(hafiz199:2008) Everyone give charming and it's not clear that his touchy heart is like whose legend(Same: 127) Describing this lack of understanding is the inherent of God however he had been shocked in understanding and get that cant except the god's traits and his manifestation from divine level and get to know something else, but do not sit down and between these two(trying to understand and disability) is wandering. In the form of spare house can't loss a subside Cameleer that this road don’t have Bound(Same: 160).Thus happy and hopeful to these manifestations:Like moon of your face in night I see your hair my night bright like day because of your face(Same: 220).In Quran also this fact with truth defined as"HablolGod"and "Buttonholethe most trustworthy".because someone don’t have glow to meet this light. Hafiz interpreted the black hair to God's providence in putting darkness of universe to the same way that moonfaced of beloved to lightening universe and organisms. Darkening of your black hair is create dark universe and your moon faced like unconformity morningAnd sweet word of hafiz probably base on this Quran verses that says: (Praise be toGod who created theheavens and the earthandmakethedarkness and light) (anaam: 1) praise god created the heavens and the earth and forged the darkness and light, and also this bright verses: (Unconformity mornings and at night) (anaam: 96) splitting the morning and evening has been a soured of comfort. And hafiz among this darkness creates from perplexity in the end of demand and friendlier with Hearts living in your hair that see good news and from that stranger bring disaster don’t have news(Same: 230). Smell good from hair is the manifestation of the God's names Smell good from hair in poetry dictionary of hafiz from inayat and manifestation of mercy and kindness of God that its perfume Sporadic in all around of universe and the perfume and good smell of the material universe is a manifestation from eternal good smell. Go to hair smell and clothes and come Saba to Gary shadow and flower to manifestation (Same: 343). The drum of flower perfume and hair of abeer spray grace of one sniff is a good smell from my attar(Same: 121) And in fact hafiz know all good smell of universe from that black.
MojtabaHosseini and Alireza Monajati

Indian Journal Of Natural Sciences www.tnsroindia.org. © IJONS
Vol.5 / Issue 28/ February 2015 International Bimonthly ISSN: 0976 – 0997
2614
REFERENCES 1. The holy Quran. 2. Ahmadi, babak(1991) structure and interpretation of text,2 volumes, central publication, Tehran. 3. Pour Namdarian,taghi (1985) secret and mystery stories, the company of cultural and scientific publication,
Tehran. 4. Jili, abdolkarim,(1991)complete human, third edition of school and printing. mostafaalbaieealhabli, Cairo. 5. Hafiz, shamso al din Mohammad (2008) dictionary of spiritual terms, second edition, published by farzan,Tehran 6. Sattari, jalal (2009) love pleasing of molana, fourth edition, central publication,Tehran. 7. Sajjadi, ziaiUddin (1996) principles of Sufism and mysticism, fifth edition, samt publication, Tehran. 8. Saadi, moslehUddin (2006) lyrics correction with gholamhosseinyousefi, first edition, speech publication, Tehran 9. Shabestary, Mahmoud (2009) secret garden, correction and explanation by behroozservatian, third edition,
international publication, Tehran. 10. Lahij,shamsUddinmohammad(2008),Mafatih Al Ajaz with introduction and correction by Mohammad
rezabarzegarkhaleghi and effatkarbasi, seventh edition, zavvar publication, Tehran. 11. NEzamialyasibnyusuf (1997) khosrow and shirin, correction by vahiddatgedu, first edition, drop publication,
Tehran.
MojtabaHosseini and Alireza Monajati
Indian Journal Of Natural Sciences www.tnsroindia.org. © IJONS
Vol.5 / Issue 28/ February 2015 International Bimonthly ISSN: 0976 – 0997
2615
Assessment of Land Use / Land Cover Change Detection and its Impact on Environment for Tiruppur Area using Remote Sensing and GIS
Abhilash P.R* and Govindaraju M.
Bio-Spatial Technology Lab,Department of Environmental Biotechnology,Bharathidasan University Tiruchirappalli 620 024, India.
Received: 20 Dec 2014 Revised: 15 Jan 2015 Accepted: 25 Jan 2015 *Address for correspondence Abhilash P.R Bio-Spatial Technology Lab, Department of Environmental Biotechnology, Bharathidasan University, Tiruchirappalli 620 024, India. E.mail: [email protected].
This is an Open Access Journal / article distributed under the terms of the Creative Commons Attribution License (CC BY-NC-ND 3.0) which permits unrestricted use, distribution, and reproduction in any medium, provided the original work is properly cited. All rights reserved. Land use / Land cover change dynamics are major elements for monitoring, earth resources. This study was involved to assess the land use / land cover changes in Tiruppur area in Tamil Nadu. To explore the purpose, multi-dated satellite images were used for analysis during past two decades (1989–2013). Different types of thematic layers were generated using ERDAS imagine and thematic maps were prepared at ArcGIS environment. Accuracy assessment was made using GPS data and ground truth verifications. Land use / land cover changes observed that the Agricultural (97.54 sq.km) ,Fallow land (18.08), forest area (69.57sq km) ,Water bodies (49.73) and waste land (35.95sq.km) were decreased, while area under settlement increased by 270.87 sq km. The main reason for fast changes of LU/LC classes are conversion of forest and Agricultural area to potential settlements, increasing population and finally lack of awareness to the farmers about natural resources. Key words: Land use and Land cover change, Tiruppur, Natural Resources, Remote Sensing and GIS. INTRODUCTION The biophysical environment on the earth surface features will changes over a period of time. Land use / cover change has become a central and important component in current strategies for managing natural resources and monitoring environmental changes [1].The human induced and natural land cover / land use changes are both critical due to their influence on global warming, biodiversity loss and impact on life of human [2, 3]. Change detection is a procedure of identifying and analyzing the difference of an object or a phenomenon through monitoring at different
ABSTRACT
RESEARCH ARTICLE
Indian Journal Of Natural Sciences www.tnsroindia.org. © IJONS
Vol.5 / Issue 28/ February 2015 International Bimonthly ISSN: 0976 – 0997
2616
times [4]. The latest information on land use change is necessary to provide update on land cover maps and planning of the available resources for effective management [5]. Land use/cover change is often influenced by various natural and human activity processes. In order to improve the economic condition of the area without further deteriorating the bio-environment, every bit of the available land has to be used in the most rational way. This requires the present and the past land use / cover data of the area [6]. Remote sensing coupled with GIS provides an efficient method for analysis of land use issues and tools for land use planning and modelling. Technologies such as geographical information systems (GIS) and remote sensing provide a cost effective and accurate alternative to understand landscape dynamics. Digital change detection techniques based on multi-temporal and multi- spectral remotely sensed data have demonstrated a great potential as a means in understanding landscape dynamics, detect, identify, map, and monitor differences in land use and land cover patterns over time, irrespective of the causal factors [7] . LU/LC Change dynamics are influenced by types of land cover involved, ecological devices of string and regeneration, physical components of the environment, socioeconomic activities together with their cultural environment, and meteorological trend or other natural disasters[8]. The present study examines Tiruppur Industrial cluster and its impact on land use/land cover changes through remote sensing and GIS and to assess the pattern of land use for a period of 24 years (1989–2013). This study is essential to understand the current environmental situation and to plan for the future conservation and sustainable development. Study Area Tiruppur located at between 11°15’ 60 N and 10° 59’ 55 N longitude and 77°14’59 E and 77° 34’ 56 E latitudes is a mid-sized industrial town located in the upper hydrological basin of the Cauvery River (Figure 1 and 2). The total geographical area of 1008.26 Km2 divided into 60 corporation wards. As per provisional reports of Census of India, population of Tiruppur in 2011 is 4,44,543; of which male and female are 227,469 and 217,074 respectively. The mean maximum and minimum temperature recorded during summer and winter varies from 35°C to 22°C degree Celsius. Tiruppur has an average annual rainfall of around 700 mm. The most predominant land use found is settlements, Fallow land, Agricultural, forest and water bodies with an aerial extent of 81 per cent of the total area.
METHODOLOGY To assess land use / land cover changes in the study area, Indian remote sensing satellite data from IRS IA (February 1989) IRS P6 (February 2009) and IRS Resource sat-2 LISS III (March 2013) and Land sat TM (February 1999) were used. The Survey of India (SOI) toposheets 58 E/8 and 12 in 1:50000 scales of 1969 were used for base map preparation as referenced spatial data. An integrated technique of 3S (RS, GIS, and GPS) was employed to detect the land use/cover change in the study area. Global Positioning System was used as bases to register the images and was geometrically corrected using ArcGIS. Based on the spatial resolution of the satellite images, the images were transformed with a standard default resolution of 23.5 and 30 m . Images are projected to polyconic coordinate system using nearest neighbourhood resampling method and are geometrically corrected using histogram equalization tool in ERDAS Imagine. The study area was extracted using subsets option in ERDAS Imagine and False Colour Composite (FCC) displayed with the band combination of 1, 2 and 3 as showed in Fig.2. Using ERDAS Imagine the different LU/LC classes are Agricultural, Fallow land, Forest cover, Water bodies, Settlement and Wasteland are classified for the year 1989,1999, 2009, and 2013. Satellite image interpretation key The visual interpretation of image elements such as colour, size, texture, pattern, association, resolution and shape was used to classify the broad cover area (Table 1). Utilizing the visual interpretation key, change in satellite image was detected to process and identify the changes in LU/LC class based on co-register multi-dated satellite data [9, 10,
Abhilash and Govindaraju
Indian Journal Of Natural Sciences www.tnsroindia.org. © IJONS
Vol.5 / Issue 28/ February 2015 International Bimonthly ISSN: 0976 – 0997
2617
and 11].The images were further visually interpreted on screen and classified based on the interpretation key prepared during ground truth verification and attributed to the corresponding LU/LC changes. Accuracy assessment The reference pixels are an important factor in determining the accuracy of the LU/LC classification. An equalized stratified random sampling approach was used in the present study to assess the accuracy of each land cover classification. The overall accuracy and Kappa analysis were used to perform classification accuracy assessment using random point’s tools. Kappa analysis is a discrete multivariate technique used for accuracy assessment [12, 13]. A number of 40 points from each class were randomly selected. The selected points were verified on the field check using hand held GPS. Accuracy of map was assessed by comparing the thematic map with ground observations point, which results in overall classification accuracy of 85%. The overall accuracy target of 85% with no class being less than 70% accuracy is acceptable for land-use land-cover mapping [14, 15].
RESULTS AND DISCUSSION
Land use / Land cover change assessment
Land use/land cover pattern of Tiruppur has been altered, since early 1989. It is observed that steady increase in settlements but declining trend in agricultural, fallow land, forest, water bodies and waste land category during the period from 1989 to 2013. Identified alterations are presented in the Table 2, and represented in the figures 3 to 6. The increasing trend in settlement (270.87 sq.km) is shown in the figure 7. The major settlements found in the study area consists of household, commercial area, industrial area, institutions etc. Urbanization process is in progress in the area. Area under agricultural (97.54 sq.km), fallow land (18.08 sq.km) , forest (69.57sq.km) ,water bodies (49.73 sq.km) and wasteland (35.95 sq.km) also slightly decreases. The increase in the settlement area has witnessed huge surge in the industrialisation during the last two decades or so which resulted in the establishment of around 6250 industrial units in the area. Out of this, there are around 1500 knitting units and 4,750 other units which are into various activities of textile processing such as dyeing, bleaching, fabric painting, garment making, embroidery etc. The main crops cultivated includes paddy, millets, pulses, cereals, oil seeds, cotton, sugarcane and coconut etc. The increase in the cultivation of agriculture is due to the availability of water bodies located in the low lying areas, which results in increase of the total population. Due to improvement of their economical condition landless peoples are migrating nearby urban areas in search of jobs and better education for their children’s. The waste land shows negative trend as compared with the above LU/LC pattern. Wasteland reduced an area of 35. 95 sq.km during the period. Conversion of waste land to settlements for developmental activities is noticed in the study area. There are many alternative methods for reclaiming wastelands. The choice of the method depends on the type of wasteland, amount of degradation, and costs and benefits involve. Afforestation has been identified as one appropriate method which must be implemented in an appropriate way depending on local physical and human environmental conditions.
CONCLUSION
The study reveals that there is an increase in the settlement and decrease in Agricultural, fallow land, forest water bodies and waste land during the study period. It is found that land cover pattern in the Tiruppur has experienced complex changes with the rapid social and economic progress. Thematic layers generated through the study can serve as a evidence for resource depletion by intensive industrial activities within the limited geographical area. So the study area needs proper land use/ land cover practices to protect the future environment.
Abhilash and Govindaraju
Indian Journal Of Natural Sciences www.tnsroindia.org. © IJONS
Vol.5 / Issue 28/ February 2015 International Bimonthly ISSN: 0976 – 0997
2618
REFERENCES 1. J.S. Rawat ., Vivekanand Biswas and Manish Kumar (2013), Changes in land use/cover using geospatial techniques: A case study of Ramnagar town area, district Nainital, Uttarakhand, India , The Egyptian Journal of Remote Sensing and Space Sciences 2013 ;16: 111–117 2. Sala, O. E., Chapin, I. F. S., Armesto, J. J., Berlow, E., Bloomfield, J., Dirzo, R., Huber Sanwald, E., Huenneke, L.F., Jackson, R.B., Kinzig, A., Leemans, R., Lodge, D.H., Mooney, H.A., Oesterheld, M., Leroy Proff, N., Sykes, M.T., Walker, B. H., Walker, M., Wall, D.H.2000. Global Biodiversity Scenarios for the year 2100. Science 287 (5459), 1770 – 1774 3. Lopez, E., Bocco, G., Mendoza, M., Duhau, E. (2001).Predicting land cover and land use change in the urban fringe a case in Morelia City, Mexico. Landscape and Urban Planning, 55, 271–285. 4. Singh, A. (1989). Digital change detection techniques using remotely sensed data. International Journal of remote sensing, 10, 989-1003 5. Alphan, H. (2003). Land use change and urbanization in Adana, Turkey. Land Degradation and Development, 14: 575–586. 6. Chaurasia, R., Closhali, D.C., Dhaliwal, S.S., Minakshi, Sharma, P.K., Kudrat, M., Tiwari, A.K., 1996. Landuse change analysis for agricultural management – a case study of Tehsil Talwandi Sabo, Punjab. J. Indian Soc. Remote Sens. 24 (2), 115–123. 7. Jensen, J.R. (1996). “Introductory digital processing”: A remote sensing perspective (2nd edition). Upper Saddle River, NJ: Prentice-Hall. 8. Gautam, N.C., Nagaraja, R., Rao, D.P., 1992. Wasteland survey and mapping in India. In: Khoshoo, T.N., Deekshatulu, B.L. (Eds.), Land and Soils. Har-Anand Publications, New Delhi 9. Shalaby, A., and Tateishi, R. (2007). Remote sensing and GIS for mapping and monitoring land cover and landuse changes in the Northwestern coastal zone of Egypt, Applied Geography, 27 (2007), 28– 41 10. Muchoney, D. M., Haack, B. (1994). Change detection for monitoring forest defoliation. Photogrammetric Engineering and Remote Sensing, 60, 1243–1251. 11. Singh, A. (1989). Digital change detection techniques using remotely sensed data. International Journal of remote sensing, 10, 989-1003 12. Hudson, W. & Ramm, C. (1987). Correct formula of the Kappa coefficient of agreement. Photogrammetric Engineering and Remote Sensing, 53, 421–422. 13. Congalton, R. G. & Green, K. (1999). Assessing of Remotely Sensed Data: Principles and Practices. Boca Rotan, FL: Lewis Publishers. pp. 34–46 14. Anderson, J. R., Hardy, E. E., Roach, J. T. & Witmer, R. E., (1976). A land use and land cover classification system for use with remote sensor data, US Geological Survey Professional Paper 964, Reston, VA, pp. 138–145 15. Thomlinson, J. R., Bolstad, P.V. & Cohen, W. B. (1999). Coordinating methodologies for scaling land cover classifications from site-specific to global: steps toward validating global map products. Remote Sensing of Environment, 70, 16–28.
Abhilash and Govindaraju
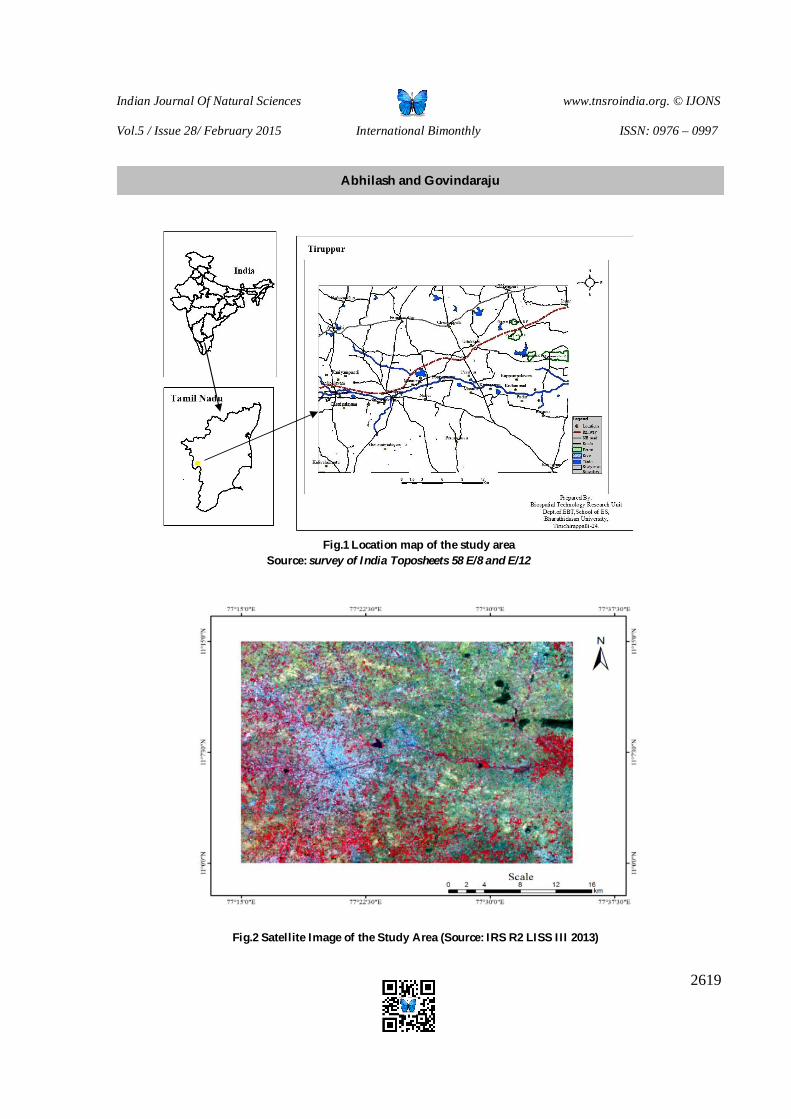
Indian Journal Of Natural Sciences www.tnsroindia.org. © IJONS
Vol.5 / Issue 28/ February 2015 International Bimonthly ISSN: 0976 – 0997
2619
Fig.1 Location map of the study area Source: survey of India Toposheets 58 E/8 and E/12 Fig.2 Satellite Image of the Study Area (Source: IRS R2 LISS III 2013)
Abhilash and Govindaraju
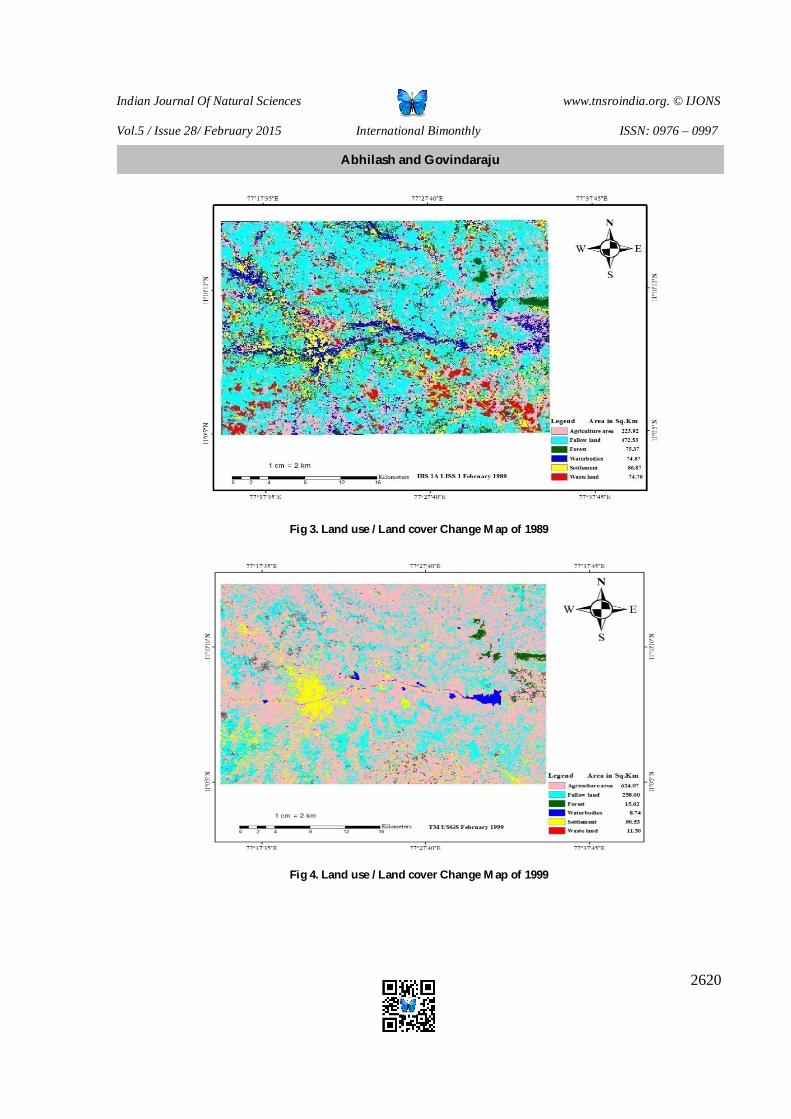
Indian Journal Of Natural Sciences www.tnsroindia.org. © IJONS
Vol.5 / Issue 28/ February 2015 International Bimonthly ISSN: 0976 – 0997
2620
Fig 3. Land use / Land cover Change Map of 1989
Fig 4. Land use / Land cover Change Map of 1999
Abhilash and Govindaraju
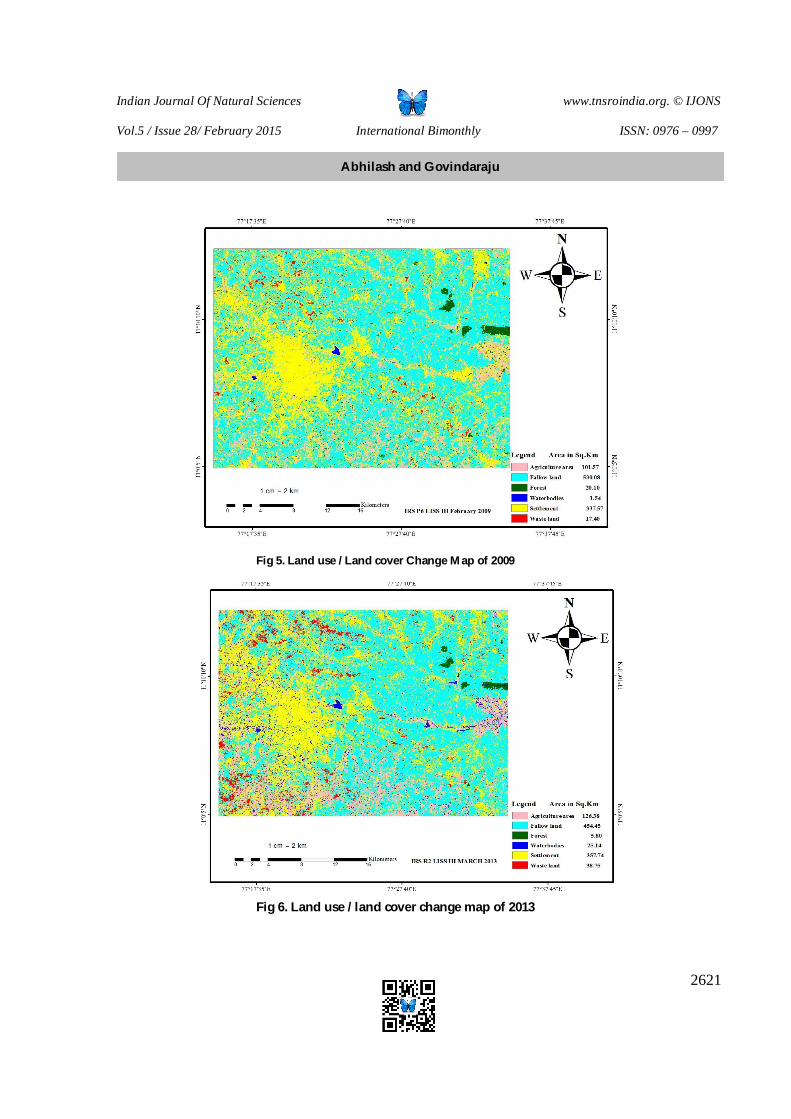
Indian Journal Of Natural Sciences www.tnsroindia.org. © IJONS
Vol.5 / Issue 28/ February 2015 International Bimonthly ISSN: 0976 – 0997
2621
Fig 5. Land use / Land cover Change Map of 2009
Fig 6. Land use / land cover change map of 2013
Abhilash and Govindaraju
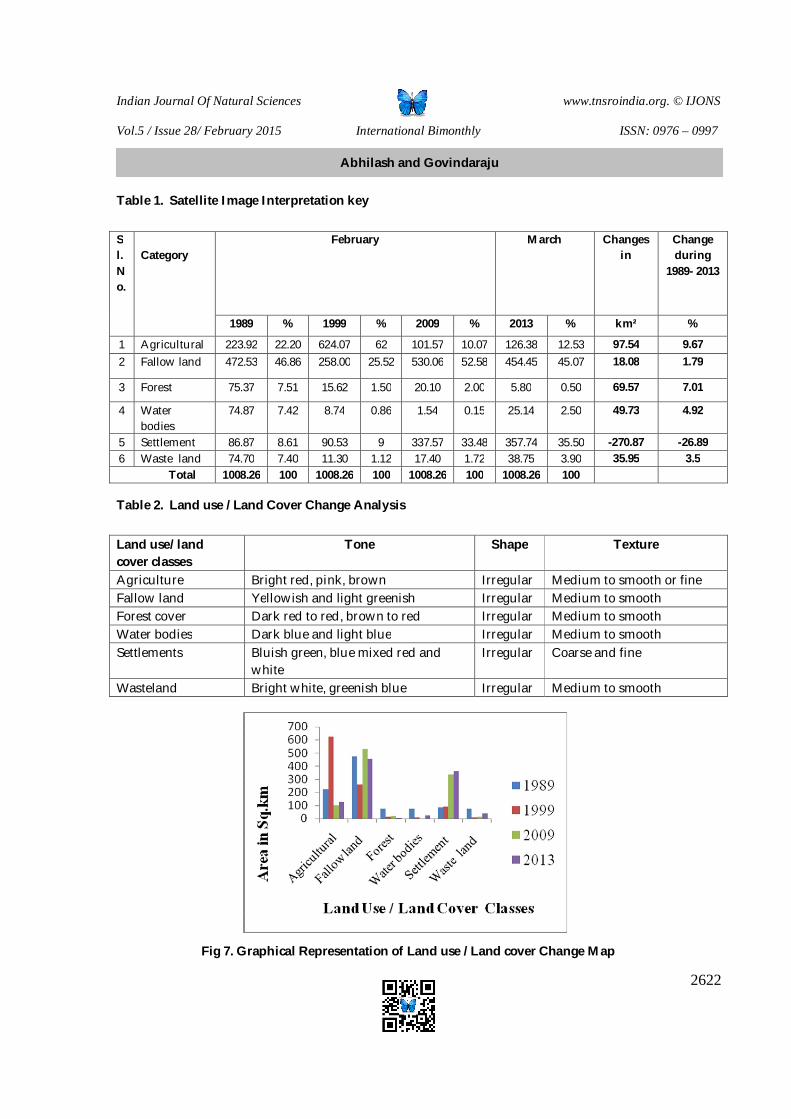
Indian Journal Of Natural Sciences www.tnsroindia.org. © IJONS
Vol.5 / Issue 28/ February 2015 International Bimonthly ISSN: 0976 – 0997
2622
Table 1. Satellite Image Interpretation key
Table 2. Land use / Land Cover Change Analysis
Fig 7. Graphical Representation of Land use / Land cover Change Map
Sl. No.
Category
February March Changes in
Change during
1989- 2013
1989 % 1999 % 2009 % 2013 % km² %
1 Agricultural 223.92 22.20 624.07 62 101.57 10.07 126.38 12.53 97.54 9.67 2 Fallow land 472.53 46.86 258.00 25.52 530.06 52.58 454.45 45.07 18.08 1.79
3 Forest 75.37 7.51 15.62 1.50 20.10 2.00 5.80 0.50 69.57 7.01
4 Water bodies
74.87 7.42 8.74 0.86 1.54 0.15 25.14 2.50 49.73 4.92
5 Settlement 86.87 8.61 90.53 9 337.57 33.48 357.74 35.50 -270.87 -26.89 6 Waste land 74.70 7.40 11.30 1.12 17.40 1.72 38.75 3.90 35.95 3.5 Total 1008.26 100 1008.26 100 1008.26 100 1008.26 100
Land use/ land cover classes
Tone Shape Texture
Agriculture Bright red, pink, brown Irregular Medium to smooth or fine Fallow land Yellowish and light greenish Irregular Medium to smooth Forest cover Dark red to red, brown to red Irregular Medium to smooth Water bodies Dark blue and light blue Irregular Medium to smooth Settlements Bluish green, blue mixed red and
white Irregular Coarse and fine
Wasteland Bright white, greenish blue Irregular Medium to smooth
Abhilash and Govindaraju
Indian Journal Of Natural Sciences www.tnsroindia.org. © IJONS
Vol.5 / Issue 28/ February 2015 International Bimonthly ISSN: 0976 – 0997
2623
Socio Psychological Determinants of Milk Productivity in Cattle among Beneficiaries of Livestock Development for Livelihood Support (LDLS) Programme Implemented in Wayanad District of Kerala,India. Chethan G.N, Senthilkumar R* and Chandramohan B Kerala Veterinary and Animal Sciences University,Pookode,Wayanad, Kerala,India. Received: 8 Oct 2014 Revised:30 Oct 2014 Accepted: 9 Dec 2014 *Address for correspondence Senthilkumar R Kerala Veterinary and Animal Sciences University, Pookode, Wayanad, Kerala,India. E.Mail: [email protected].
This is an Open Access Journal / article distributed under the terms of the Creative Commons Attribution License (CC BY-NC-ND 3.0) which permits unrestricted use, distribution, and reproduction in any medium, provided the original work is properly cited. All rights reserved. A study was conducted among 150 beneficiaries of Livestock Development for Livelihood Support (LDLS) programme in fifteen panchayats of Wayanad district in Kerala to understand the factors that determine the milk productivity. The study revealed that the average milk productivity of cross bred cattle in the study area was 2190.796 ± 570.4 Kg and it also revealed that out of nine independent variables studied, four variables viz., mass media exposure, personal cosmopolite contact, attitude towards dairying and knowledge of dairying were significantly correlated with milk productivity. The study further revealed that two independent variables namely knowledge of dairying and personal cosmopolite contact were contributing positively and significantly to the milk productivity. Key words: Dairy farmers, determinants, milk productivity, Livestock Development. Introduction Milk remains the main output of the Indian livestock sector accounting for 66.7 per cent of the total value of output; the annual growth rate of milk production was 4.4 per cent and 3.8 per cent during the last decades, respectively. Despite this average annual milk yield of Indian cattle stands at 1172 Kg which is well below the global average of 2500 Kg. The daily average milk yield of Indian animals is between 1.5 to 5.0 Kg (Report of the Working Group on Animal husbandry & Dairying, 12th five year plan, 2012). The function of milk production is not merely depends on the animal per se but on several socio, economic and psychological factors of the farmers. Hence an investigation was carried outamong the beneficiaries of Livestock Development for Livelihood Support (LDLS) programme in Wayanad district of Kerala to find out the socio psychological factors which determines the milk productivity.
RESEARCH ARTICLE
ABSTRACT
Indian Journal Of Natural Sciences www.tnsroindia.org. © IJONS
Vol.5 / Issue 28/ February 2015 International Bimonthly ISSN: 0976 – 0997
2624
METHODOLOGY
The study was conducted in the Wayanad district among 150 dairy farmer beneficiaries of Livestock Development for Livelihood Support (LDLS) programme. Beneficiaries of the study were selected by applying stratified multistage random sampling technique. There were a total of twenty five grama panchayats in Wayanad district of which five panchayats each were randomly selected from all three taluks (Vythiri, Sulthan Batheri and Mananthavady). From each grama panchayat an equal number of 10 beneficiaries were selected randomly. The data were collected with the help of a well-structured pretested interview schedule and it was pretested in a non-sampling area and necessary changes were made before its final administration.
In the present study the average milk productivity of cross-bred cattle was studied using the livestock production index (milk yield) as recommended by Yang (1980).In total, nine independent variables were studied viz., age, education, experience, land holding, mass media exposure, personal cosmopolite contact, cattle possession, attitude towards dairying and knowledge of dairying. To understand the effect of variables on milk productivity and the relationship of socio psychological characters with milk productivity, the collected data was subjected to multiple linear regression and spearmen correlation, respectively.
RESULTS AND DISCUSSION The results of the present study revealed that the average milk productivity of cross-bred cattle in the study area was 2190.796 ± 570.4 kg.The productivity observed was greater than the value (2118 ± 139.578 kg) reported byRadhika et al. (2012) and lesser than the value (2295 kg)reported by Shyju et al. (2002) in Wayanad district of Kerala.
Relationship of Antecedent characteristics of dairy farmers with milk productivity
The data presented in table.1 indicated that out of nine independent variables studied, four variables viz.,mass media exposure, personal cosmopolite contact, attitude towards dairying and knowledge of dairying were significantly (P<0.01)correlated with milk productivity. In order to assess the relative contribution of each of the independent variable, the data was subjected to step-wise multiple linear regression analysis. From the obtained results, it could be observed that two variables namely, knowledge of dairying and personal cosmopolite contact was found to be significant in explaining the variations in extent of milk productivity. The multiple regression equation fitted to the data Y = -0.1173 + 1.986 X1 + 3.546 X2. The coefficient of determination was found to be 22.5 per cent. This indicated that 22.5 per cent of the total variability in the milk productivity could be attributed to the two independent variables i.e.knowledge of dairying and personal cosmopolite contact.Milk productivity is depends on severalfactors. It is thus imperative to understand the determinants of productivity so as to develop strategies for sustaining and augmenting milk productivity through positive interventions of the determinants. Along the possession of livestock, opening to the communication channels could enhance the level of farmer’s knowledge, which would further facilitate the production performance of their animals.Extension approaches to augment the milk production must exploit these sources of communication. Hence strategies shall be formulated to use the personal cosmopolite channels like the veterinary surgeons, extension personnel of milk cooperative society, agricultural officers, etc to the fullest potency in imparting knowledge to the dairy farmers since they were usually having highest credibility among various sources.
Results of the present study indicated that education and experience were significantly and positively correlated with milk productivity.Whereas land holding was positively but non-significantly correlated with milk productivity. It indicates that traits, experience in dairy farming andeducation of farmers together plays a significant role in determining the milk productivity.The observation of Ani et al. (2004) and Fita et al. (2012)found that length of farming experience among the respondents was not an important determinant of adoption technologies. They have also observed that farmers who had lengthy experience in the business,usually older, less educated and reluctant to change than the new entrants. Among the socio-economic variables possession of heads cattle was significantly and positively correlated with the milk productivity.
The positive and significant correlation of milk productivity with mass media exposure and personal cosmopolite contact highlights the crucial role communication variables play in the adoption of dairy management practices. Fita
Senthilkumar et al.
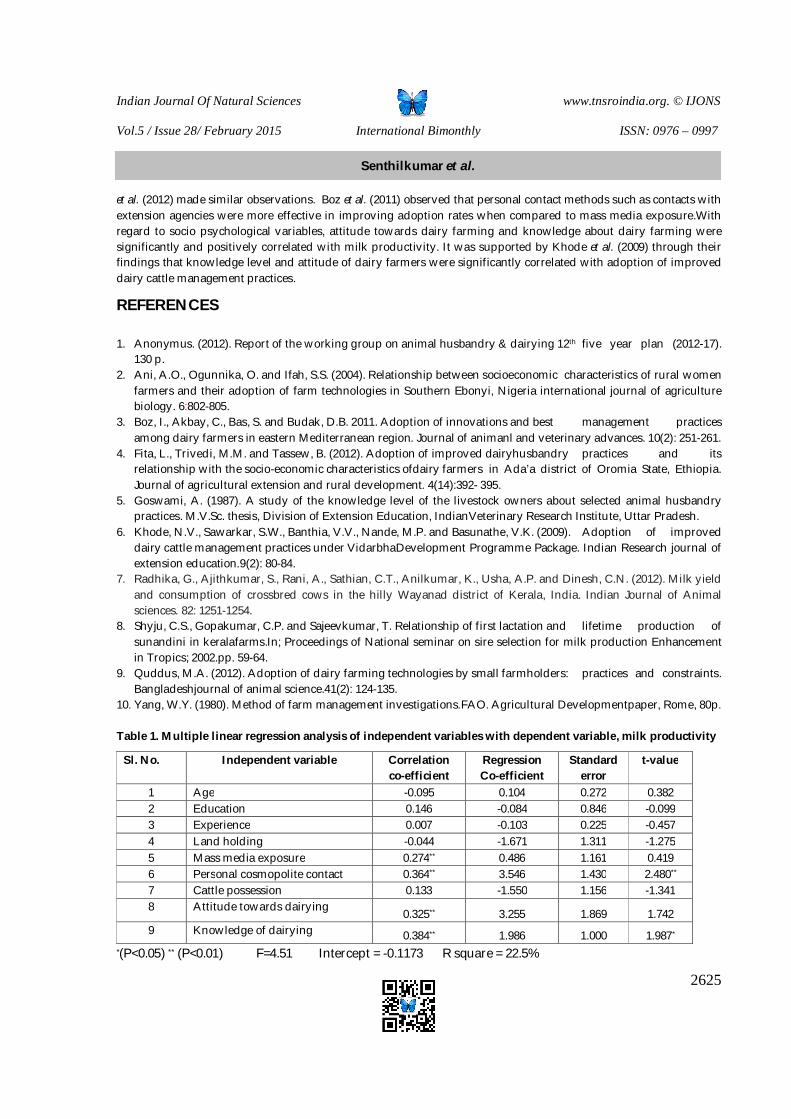
Indian Journal Of Natural Sciences www.tnsroindia.org. © IJONS
Vol.5 / Issue 28/ February 2015 International Bimonthly ISSN: 0976 – 0997
2625
et al. (2012) made similar observations. Boz et al. (2011) observed that personal contact methods such as contacts with extension agencies were more effective in improving adoption rates when compared to mass media exposure.With regard to socio psychological variables, attitude towards dairy farming and knowledge about dairy farming were significantly and positively correlated with milk productivity. It was supported by Khode et al. (2009) through their findings that knowledge level and attitude of dairy farmers were significantly correlated with adoption of improved dairy cattle management practices.
REFERENCES 1. Anonymus. (2012). Report of the working group on animal husbandry & dairying 12th five year plan (2012-17).
130 p. 2. Ani, A.O., Ogunnika, O. and Ifah, S.S. (2004). Relationship between socioeconomic characteristics of rural women
farmers and their adoption of farm technologies in Southern Ebonyi, Nigeria international journal of agriculture biology. 6:802-805.
3. Boz, I., Akbay, C., Bas, S. and Budak, D.B. 2011. Adoption of innovations and best management practices among dairy farmers in eastern Mediterranean region. Journal of animanl and veterinary advances. 10(2): 251-261.
4. Fita, L., Trivedi, M.M. and Tassew, B. (2012). Adoption of improved dairyhusbandry practices and its relationship with the socio-economic characteristics ofdairy farmers in Ada’a district of Oromia State, Ethiopia. Journal of agricultural extension and rural development. 4(14):392- 395.
5. Goswami, A. (1987). A study of the knowledge level of the livestock owners about selected animal husbandry practices. M.V.Sc. thesis, Division of Extension Education, IndianVeterinary Research Institute, Uttar Pradesh.
6. Khode, N.V., Sawarkar, S.W., Banthia, V.V., Nande, M.P. and Basunathe, V.K. (2009). Adoption of improved dairy cattle management practices under Vidarbha Development Programme Package. Indian Research journal of extension education.9(2): 80-84.
7. Radhika, G., Ajithkumar, S., Rani, A., Sathian, C.T., Anilkumar, K., Usha, A.P. and Dinesh, C.N. (2012). Milk yield and consumption of crossbred cows in the hilly Wayanad district of Kerala, India. Indian Journal of Animal sciences. 82: 1251-1254.
8. Shyju, C.S., Gopakumar, C.P. and Sajeevkumar, T. Relationship of first lactation and lifetime production of sunandini in keralafarms.In; Proceedings of National seminar on sire selection for milk production Enhancement in Tropics; 2002.pp. 59-64.
9. Quddus, M.A. (2012). Adoption of dairy farming technologies by small farmholders: practices and constraints. Bangladeshjournal of animal science.41(2): 124-135.
10. Yang, W.Y. (1980). Method of farm management investigations.FAO. Agricultural Developmentpaper, Rome, 80p. Table 1. Multiple linear regression analysis of independent variables with dependent variable, milk productivity
Sl. No. Independent variable Correlation co-efficient
Regression Co-efficient
Standard error
t-value
1 Age -0.095 0.104 0.272 0.382 2 Education 0.146 -0.084 0.846 -0.099 3 Experience 0.007 -0.103 0.225 -0.457 4 Land holding -0.044 -1.671 1.311 -1.275 5 Mass media exposure 0.274** 0.486 1.161 0.419 6 Personal cosmopolite contact 0.364** 3.546 1.430 2.480** 7 Cattle possession 0.133 -1.550 1.156 -1.341 8 Attitude towards dairying 0.325** 3.255 1.869 1.742 9 Knowledge of dairying 0.384** 1.986 1.000 1.987*
*(P<0.05) ** (P<0.01) F=4.51 Intercept = -0.1173 R square = 22.5%
Senthilkumar et al.
Indian Journal Of Natural Sciences www.tnsroindia.org. © IJONS
Vol.5 / Issue 28/ February 2015 International Bimonthly ISSN: 0976 – 0997
2626
Measuring Intellectual Capital Efficiency in the Indian Software Companies Leila Zamani1* , SamadBorzoianShirvan2 and ResiaBeegam.S1
1Department of Commerce, University of Kerala, India. 2Department of Economics, University of Mumbai,India. Received:28 Dec 2014 Revised: 12 Jan 2015 Accepted: 31 Jan 2015 *Address for correspondence Leila Zamani Department of Commerce, University of Kerala, India. E.mail: [email protected]
This is an Open Access Journal / article distributed under the terms of the Creative Commons Attribution License (CC BY-NC-ND 3.0) which permits unrestricted use, distribution, and reproduction in any medium, provided the original work is properly cited. All rights reserved. The purpose of this paper is to investigate the efficiency of Indian software companies in transforming intellectual capital into corporate values by using the data envelopment analysis methodology. The authors have used three individual components of value added intellectual coefficient as the input variables, and Tobin’s Q and return on equity as the output.A sample comprising 26 companies in financial year 2013 have been taken for the study. The findings of this study show that companies listed on the Mumbai stock exchangeinvest most of their resources in Structural Capitalas compared to Human Capitaland Physical Capital, and Mindteck (India) Ltd; Mastek Ltd; Tech Mahindra Ltd and Thinksoft Global Services Ltd are the most efficient company of all the sample companies, These show,the highest coefficient of intellectual capital super efficiency based on Anderson and Peterson model.The benchmarking analysis of this study may help the managers in software companies to benchmark and improve their efficiency in intellectual capital management.This is the first paper to examine the intellectual capital super efficiency of Indian software companies through Anderson and Peterson model.
Key words: : Intellectual capital, Data envelopment analysis, AP model, Super Efficiency, VAICTM. INTRODUCTION Software industryis a knowledge-intensive industry that is characterized by significant intellectual capital (IC). Ahangar, (2011) claims that the development of new software depends on key inputs such as human capital and structural capital, Software companies thusrely largely on intellectual capital to generate profits. According toHao (2010) technology-oriented software industry has intangible information. Software companies have to understand the
ABSTRACT
RESEARCH ARTICLE
Indian Journal Of Natural Sciences www.tnsroindia.org. © IJONS
Vol.5 / Issue 28/ February 2015 International Bimonthly ISSN: 0976 – 0997
2627
value of IC and attempt to manage it efficiently to gain competitive advantage.Some of studies conducted showthat majority of theIndian software companies have achieved competitive advantages in software quality, efficiency, software innovation, and responsiveness to customers, with focus being put on customer-needs orientation,people management, and technological emphasis. Researchers, however, also note that rapid technological development and human resources can limit the growth and development of the Indian software companies. Findings of this studysuggest that IC plays an important role in the Indian software companies’ value creation in today’s challenging business environment. It was Bornemann (1999) who suggested that there was a correlation between intellectual potential and organizational performance. The main of IC management is to gain a competitive edge where knowledge forms an important base. This competitive edge is made possible by adding value in the form of different expertise used in various areas of business operations. Human and structural capital alone is not sufficient to create efficiency. The require the added benefit of value addition to reach a benchmark.
Specifically, managing IC efficiently is the key to sustain competitive edge. According to Kujansivu (2009), IC management is about managing and transforming various intangible resources to create or maximize value. Recently, data envelopment analysis (DEA), a non-parametric approach, has become fashionable in the IC management research (e.g. Wu et al., 2006; Lu et al., 2010; Yang and Chen, 2010; Lu and Hung, 2011). In this study, the authors also employ DEA to evaluate the IC efficiency management of Indian software industry. The term “Intellectual Capital,” was first introduced by Kenneth Galbraith in 1969 (Bontis,1998). According to him intellectual action and dry skills were both needed to increase efficiency. The Indian Measuring IC efficiency software industry provides the authors with appropriate setting to examine IC efficiency management.IC efficiency management is a complex process (Lu et al., 2010), due to the identification and measurement problems (Saez et al., 2007). Therefore, traditional performance measurement method such as the uni-dimensional financial ratios analysis, is not sufficient to analyse the effect of IC on the corporate performance (Feroz et al., 2003). Alternatively, DEA allows multiple inputs and multiple outputs to be evaluated concurrently. Prior information about the relationship among multiple performance measures is not required in DEA. It allows for,interactions among various performance measures objectively (Hung et al., 2010).
The last few decades have seen a great deal of works on IC measurement. There is no consensus on IC measurement (Uziene, 2010) and they focus on single dimensional evaluation of IC. In this study, the authors used Value Added Intellectual Coefficient (VAICTM) developed by Pulic, (2000) to gauge IC value.Pulic (2000) tested the relationship between Value added Intellectual Coefficient and the market value of 30 randomly selected companies on the London FTSE 250 from 1992 to 1998. Furthermore, 70 companies listed on the Vienna stock exchange from 1994 to 1997 were examined in a separate study.these studies found a high degree of correspondence between VAIC and the market value of companies.
VAICTM has been widely applied in the IC literature (e.g. Tseng and James Goo, 2005; Ting and Lean,2009; Young et al., 2009; Laing et al., 2010; Phusavat et al., 2011; Rehman et al.,2011). Acknowledging the vast literature on the application of VAICTM as an IC indicator; unfortunately, Stahle et al. (2011) has put VAICTM in a critical analysis and conclude that VAICTM is an invalid measure of IC. Their arguments may pose considerable caveats on prior VAICTM research findings. However, VAICTM is still the most attractive IC measurement given its practical and empirical validity (Zeghal and Maaloul, 2010).
This study focuses on combining VAICTM with DEA methodology to measure the IC efficiency of Indian software companies in increasing corporate value. The authors believe that the criticism on the validity of VAICTM has minimal impact on this study because the authors treat the individual components of VAICTM, namely capital employed efficiency(CEE), human capital efficiency(HCE), and structural capital efficiency(SCE), as distinguishable DEA inputs instead of taking the whole VAICTM as a single input measure. Stahle et al. (2011) note the non-existence of correlation between VAICTMand market value. In this study, the authors address such potential bias by employing alternative output measures. Using DEA, the authors are able to identify companies that are on the efficient frontier.
Leila Zamani et al. et al.
Indian Journal Of Natural Sciences www.tnsroindia.org. © IJONS
Vol.5 / Issue 28/ February 2015 International Bimonthly ISSN: 0976 – 0997
2628
Such directions are needed because the DEA benchmarking analysis could help software managers improve their IC management. Moreover, findings of this study could serve as a reference for managers in making IC investments.
The remaining sections of this study are organized as follows. The next section reviews prior literature. The third section explains the data collection and research methodology. The fourth section presents and discusses the findings. The final section offers conclusions, limitations, and suggestions for further research.
Literature Review
Intellectual Capital(IC)
IC is a broad concept which is often split into different categories – most commonly human, relational and structural capital. ‘Intellectual capital is the group of knowledge assets that are attributed to an organisation and most significantlycontribute to an improved competitive position of this organisation by adding value to defined key stakeholders’ Marr and Schiuma (2001)
A company’s market value may be greater than its book value due to its? Intellectual Capital.According to Roos et al., (1998) express that Intellectual Capital marks the difference between the market value and book value ofa company.Edvinsson (2002) states that 1 + 1 = 11 can be realized in firm value, uncovering the hidden values of Intellectual Capital.Marr, (2007) sayes that various definitions of IC can be found and there is no single right or wrongdefinition of IC. Stewart (1991), in his writeup in Fortune Magazine, points out that IC includes patents, processes, management skills, technologies, information about customers and suppliers, and old-fashioned experience, which together strengthen a company’s competitive edge in the marketplace.
Stewart (1997) defines IC as intellectual material– knowledge, information, intellectual property, experience – that can create wealth. Edvinsson and Malone (1997) delineate IC as the possession of the knowledge, appliedexperience, organizational technology, customer relationships, and professional skills that give a company competitive edge in the market.Lynn (1998) describes IC as an intangible asset – knowledge that is transformed tosome items of value to the organization. According to the author,sustainable value added (VA) is created within a company when information is organized into knowledge, and knowledge is transformed into IC. Similarly, Bose and Thomas (2007) conceptualize IC as the knowledge capability of a firm to convert knowledge,skills, and expertise into assets that can become profitable. Hsu and Fang, (2009) summarize IC as the total capabilities, knowledge, culture, strategy, process, intellectual property, and relational networks of a company that create value orcompetitive advantages and help a company achieve its goals. Stahle et al. (2011) further explain various types of IC models that have been developed and these models are ultimately motivated by the drive to improve overall business performance in theknowledge economy.
In sum, Intellectual Capital refers to the accumulation of all the intangible assets or knowledge that include, but not exhaustive, intellectual property (like patentsand trademarks), intellectual resources (e.g. customer relationship), and intellectual capabilities and competences (for instance, employees’ professional skills). When the abovementioned knowledge is transformed efficiently, companies gain competitive advantage and are sustainable, suggesting that IC drives firm performance and valuecreation (Roos and Roos, 1997; Bontis, 1998). Thus when all the intangible intellectual accumulation of intangible assets are adding value there is distinct edge achieved and this is reflected in the performances and increased efficiencies and the achievement and creation of benchmarks.
Leila Zamani et al. et al.
Indian Journal Of Natural Sciences www.tnsroindia.org. © IJONS
Vol.5 / Issue 28/ February 2015 International Bimonthly ISSN: 0976 – 0997
2629
Intellectual CapitalMeasurement
The four main approaches for measuring intangibles (Direct Intellectual Capital Method Market, Capitalization Method, Return on Assets Methods and Scorecard Methods) have various advantages and disadvantages (http://www.orgmasz.pl/wydawnictwo/files/Intellectual.pdf).. many methods are given here you may select from this article.
Bontis, (2001) gave a comparative analysis of various IC measurement methods. His study shows that Skandia led the way in 1994by developing the first IC reportin addition to traditional financial report to convey supplementary information in measuring knowledge assets.New measurement methods (e.g. Brooking, 1996; Stewart, 1997; Roos et al., 1998; Pulic, 2000).Sveiby (2010) compiled a list of 42 methods for measuring intangibles. The researcher classifies the assorted methods into four measurement approaches, specifically: direct intellectual capital (DIC) methods like Technology Broker (Brooking, 1996), market capitalization methods (MCM) like calculated intangible (Stewart, 1997), return on assets (ROA) methods such as VAICTM (Pulic, 2000), and scorecard (SC) methods like Skandia Navigatort (Edvinsson and Malone, 1997) and IC-Index (Roos et al., 1998). Lu et al., (2010) claim that today, there is no best or consensus solution for IC measurement. Among them, VAICTM, a well- known and widely used method (Rehman et al., 2011; Young et al., 2009), is capable of evaluating IC within a firm (Young et al., 2009; Phusavat et al., 2011). VAICTM is the sum of value creation efficiency of the physical capital and IC (human capital and structural capital). One of the main advantages of VAICTM is that it highlightsweak areas requiring intervention (Pulic, 2000). Moreover, VAICTM is superior in terms of its practical validity because the model can be derived using quantitative data from audited financial statements (Clarke et al., 2011; Mehralianet al., 2012). Furthermore, Mehralian et al., (2012) state that VAICTM is an IC measurement that is characterized by less subjectivity and high objectivity. In this study, the authors employ VAICTM to estimate the value of IC.
Data Envelopment Analysis (DEA)
Several studies have utilized Data Envelopment Analysis to measure Intellectual Capital efficiency. Leitner et al. (2005) show the usefulness of DEA in fulfilling the requirements of evaluating the efficiency of IC quantitatively and comprehensively. Their results indicate that DEA reveals the necessity for IC management. Wu et al. (2006) apply DEA and Malmquist productivity index (MPI) to examine the efficiency of IC management in Taiwanese IC design companies. Using a two-stage DEA model, Lu et al. (2010) measure the capability of Taiwanese fables companies in creating tangible value and intangible value. Yang and Chen (2010) employ DEA and principal component analysis (PCA) to analyse the efficiency of IC management in Taiwanese IC design industry. Following prior studies, the authors also use DEA to measure the process of IC efficiency. This study differs from prior literature in that the authors use VAICTM to proxy for IC (see Figure 1 for the process of IC efficiency).
METHODOLOGY
Data Collection
The sample of this study is restricted to software companies listed on the Mumbai Stock Exchange of India in 2013, whose annual reports are publicly available. According to-Golany and Roll, (1989) limiting the sample to software companies satisfies the DEA requirement of ahomogeneous sample. Moreover, the results interpretation with respect to VAICTM across different sectors is problematic (Stahle et al., 2011). Thus, the industry effects are also eliminated.The original sample consists of 40 firms listed on the Mumbai Stock Exchange. Sample companies with missing input and output variables required to derive DEA scores are eliminated. From the selection criteria, the final sample consists of 26 unique companies.
Leila Zamani et al. et al.
Indian Journal Of Natural Sciences www.tnsroindia.org. © IJONS
Vol.5 / Issue 28/ February 2015 International Bimonthly ISSN: 0976 – 0997
2630
InputVariables
Figure 1 shows that the input variables are madeup of the individual components of VAICTM, namely CEE, HCE, and SCE. Specifically,CEE is an indicator of VA of capital employed. HCE indicates VA efficiency of human capital, while SCE represents VA efficiency of structural capital. Algebraically, they can be defined as follows, respectively:
CEE = VA/CA; HCE = VA/HCand SCE = SC/VA
Where, VA is the operating revenues- operating expenses; CA the book value of net assets; HC the total salaries and wages; SC = VA - HC.
Output Variables
Following Lu et al. (2010), the output variables used in this study are the intangible value and tangible value. The authors use Tobin’s Q as at year end to proxy for intangible value. Tobin’s Q is defined as the ratio of market value to the book value of total assets. Return on equity (ROE), calculated as the ratio of net income tostockholders’ equity, is used to proxy for tangible value.
Descriptive Statistics
Table.1 presents the descriptive statistics of both inputs and outputs of sample firms. On average, the SCE investment is the highest, followed by HCE and CEE investments.To further illustrate the input variables, this table shows a comparison between selected companies in Coefficient of Variation (CV) and Standard of deviation human capital (HCE)which are more than other inputs (SCE and CEE). Table.1 indicates that companies listed on the Mumbai stockexchange have higher mean, i.e.,SCE and HCE, but lower average CEE.
Research Methods
DEA, a widely used linear-programming-based composite tool, as developed by Charnes et al. (1978) and extended by Banker et al. (1984). DEA, is a mathematical technique comparing multiple inputs and outputs of decision-making units (DMUs) for measuring relative DMUs’ efficiency, allows the identification of benchmarking.Instead of using merely uni-dimensional ratios and other individual financial variables, IC indicators such as human capital and structural capital can be accommodated so that possible interactions between them can be captured to derive efficiency scores using DEA. Moreover, DEA approach provides added information (Feroz et al., 2003).
Specifically, a DEA study aims to project the inefficient DMUs onto the production frontiers, whereby a researcher can opt for either input- oriented or output-oriented direction. The former refers to the objective to proportionally reduce the input amounts with the output amounts held constant at the present level, and the reverse it is for thelatter. Since software managers have the discretion to determine the input amounts (IC and physical capital) but not the output amounts (Tobin’s Q and ROE), this study applies the input-oriented models.The CCR model proposed by Charnes et al. (1978) is the most basic DEA model. The CCR model is assumed to be under constant returns to scale (CRS) of activities. However, the CRS assumption is not appropriate if not all firms are operating at the optimal scale. The BCC model developed by Banker et al. (1984) overcomes this problem, allowing for variable returns to scale (VRS). Assume there are n DMUs (DMU1, DMU2, …,DMUn) with s different outputs and m different inputs. DMUj ( j = 1, 2, …., n) consumes amount xij (i = 1, 2, …, m) of input i to produce amount yrj (r = 1, 2, …, s) of output r. The linear programming in the envelopment form of an input-oriented BCC model to evaluate the efficiency of DMU0 is shown as follows:
Leila Zamani et al. et al.

Indian Journal Of Natural Sciences www.tnsroindia.org. © IJONS
Vol.5 / Issue 28/ February 2015 International Bimonthly ISSN: 0976 – 0997
2631
Subject to:
Where is the efficiency score for DMU0, is the weight assigned by DEA. DMU0 is considered as BCC-efficient if and only if . The CCR model differs from the BCC model in which the former iswithout the additional constraint, the convexity condition . Using the same data, the dual (multiplier) form of the BCC be used in the following form:
Subject to:
Where uris the output weight and vi is the input weight. u0is the condition in Equation (1). Using (x0,y0) as the coordinate point that corresponds to multiple inputs and outputs for DMUo on the efficiency frontier, a researcher canidentify one of the three situations for returns to scale (RTS) for the BCC model:increasing RTS (IRS) prevails at (x0, y0) if and only if uo*<0 for all optimal solutions; decreasing RTS (DRS) prevails at(x0, y0) if and only if uo*>0 for all optimal solutions; and constant RTS (CRS) prevails at (x0, y0) if and only if uo* = 0 for at least one optimal solution.
Figure.2 further provides a graphical illustration of measuring input-oriented efficiency using a single input and a single output. Assume that there are five DMUs, A, B, C, D, and E. Ray 0BC is the CRS frontier (the CCR model). The BCC model or VRS frontier consists of the line connecting A, B, C, and D. For instance, the CCR efficiency of DMU E is calculated as PQ/PE. The other four DMUs (A, B, C, and D) that lie on the frontier are considered as operating at efficiency. With respect to RTS, IRS prevails at any point on line AB, while DRS prevails at any point on line CD. Any DMU that lies on the CRS frontier is operating at CRS.
The outcome of the BCC model represents pure technical efficiency (PTE), while that of the CCR model reflects the technical efficiency (TE) of the target DMU. Dividing TE by PTE, the scale efficiency (SE) can be obtained. The SE represents the proportion of inputs that can be further reduced after pure technical inefficiency is eliminated if scale adjustments are possible (Hung and Lu, 2007; Hung et al., 2010).
Both TE and PTE values lie between 0 and 1, while SE has a value ≤1. A value of 1 for either TE or PTE means that the target DMU is efficient. If a DMU is efficient under both the CCR and BCC models, it is operating in the most productive scale size or CRS size (Cooper et al., 2006). A DMU with efficiency score <1 is considered inefficient.When the models (1) and (2) are used. Usually more than one efficient company(DMU) is obtained. For ranking efficient companies (9 in CCR model & 13 companies in BCC model), a model was introduced by Anderson and Peterson in
Leila Zamani et al. et al.
Indian Journal Of Natural Sciences www.tnsroindia.org. © IJONS
Vol.5 / Issue 28/ February 2015 International Bimonthly ISSN: 0976 – 0997
2632
1993. It should be noted, in this study that this model is applied to efficient companies are also ranked and calculated coefficient of super efficiency which is as shown below. The results will come in the next section.
Subject to:
The performance of any DMU, in DEA, is assessed by measuring the key inputs to and outputs from the process under consideration. In this study, the DMUs under assessment are the companies of software in Mumbai stock exchange. In this paper, global technical efficiency, local pure technical efficiency, super efficiency, and scale efficiency models have been employed to analysis data.
RESULTS AND DISCUTION
IC Efficiency Analysis on the Basis of Standard DEA Models
Table.2 presents the IC efficiency scores of the sample companies. The overall average values of TE (mean TE = 0.790), PTE (mean PTE = 0.936), and SE (mean SE = 0.835) suggest that managers of software companies are inefficient in scale efficiency IC due to the technical problemand not managing IC. Therefore, managers should first attempt to improve their scale efficiency, and subsequently management efficiency. The findings show that 65.4 per cent of the software companies are inefficient in transforming IC into tangible and intangible values. In addition, Table.2 shows that a total of 13 companies have (50%) an efficiency IC = 1 under pure-technical efficiency, 9 companies (34.6 %) with an efficiency of IC = 1 under scale-efficiency rate and 9 companies (34.6 %) with an efficiency = 1 under technical efficiency. Thus, under "overall" technical efficiency the estimated IC efficiency scores varied from 0.056 to 1, with a sample mean of 0.790. Of the 26 companies involved in the analysis, our results indicate that 9 companies are deemed as efficient while 17 companies are rated as inefficient.As noted earlier, this paper also examines the condition with respect to the returns to scale of the software companies. The analysis shows that all of the companies are operating at CRS technology, implying that the inefficient companies may be reduced in size so as to increase efficiency.
Table.2 presents that based on the CCR model 9 companies and BCCmodel 13 companies are relatively efficient (efficiency score = 1.000). Table.3 shows that the most frequently referred company is Sasken Communication Technologies Ltd(BSE:532663). Closely following Sasken Communication Technologies Ltd(BSE:532663) is Mindteck (India) Ltd(BSE:517344),whichhas7 times of reference.Infinite Computer Solutions India Ltd (BSE:533154); Mastek Ltd (BSE:523704) and Persistent Systems Ltd (BSE:533179) are tracking behind in sequence, respectively.
The nature of returns to scale reported by the software program WIN4DEAP are reproduced in Table.2Nine companies (Infosys Ltd; Saksoft Ltd; AcroPetal Technologies Ltd and MahaveerInfoway Ltd, etc.) show constant-returns-to-scale (CRS), 16 of them show increasing-returns-to-scale (IRS) and the remaining one show decreasing-returns-to-scale (DRS). With DRS, an increase in inputs leads to a less than proportionate increase in outputs. This implies that, company Wipro Ltd (BSE:507685) operating at DRS had grown larger than their most productive scale size and could consider downsizing, albeit by small amounts. As seen in Table.2, our results also indicate that the average "pure" technical IC efficiency score for the companies is 93.6% under the assumption of VRS, which is higher than the average score of the "overall" technical IC efficiency under the CRS assumption. On the other hand, the average pure technical efficiency score for companies is more than the average score of scale efficiency 83.5%. This implies that companies inefficiency is attributed to scale inefficiency rather than pure technical inefficiency.
Leila Zamani et al. et al.
Indian Journal Of Natural Sciences www.tnsroindia.org. © IJONS
Vol.5 / Issue 28/ February 2015 International Bimonthly ISSN: 0976 – 0997
2633
IC Efficiency Analysis on the Basis of AP-DEA Model
Since the basic DEA models (CCR, BCC) can only calculate efficiency coefficient equal to one for efficient companies, we introduced the super-efficiency model as a DEA approach particularly useful for IC evaluation and to estimate IC efficiency coefficient for all companies. In standard DEA, companies are identified as fully efficient and assigned an efficiency score of unity if they lie on the efficient frontier. Inefficient companies are assigned scores of less than unity. Further ranking of the efficient set of companies is possible by computing IC efficiency scores in excess of unity. The super-efficient score efficient companies is obtainable by calculating its distance to the new frontier whereby this ‘extra’ or ‘additional’ efficiency denotes the increment that is permissible in its inputs before it would become inefficient. The consequence of this modification is to allow the scores for efficient units to exceed unity.The results obtained presented in Table.3 conclude that IC efficiency coefficient estimated by applying the supper efficiency(AP) model and using three factors Physical Capital (CEE), Human Capital(HCE) and Structural Capital (SCE).
The results obtained from 5 out of 26 companies shows that the IC coefficient of super efficiency is less than the average IC coefficient efficiency (1.2471). Based on the average IC coefficient of efficiency calculated, the companies are classified into four groups, the first group of companies relate to IC coefficients of efficiency that are higher than the average IC efficiency. The three groups of companies relate to IC coefficients that are lower than the average IC coefficient of efficiency. Coefficient of variation (c.v) of the IC coefficient of super efficiency between companies is 60 percent. While Hinduja Global Solutions Ltd has the minimum coefficient Mindteck (India) Ltd (BSE: 517344) has the highest or the maximum IC coefficient of efficiency.
1. In the first group of companiesIC coefficients of efficiency are between 1.2471 and 5.0458. These companies, arranged in descending order of the coefficients are Mindteck (India) Ltd, Mastek Ltd, Tech Mahindra Ltd, Thinksoft Global Services Ltd and Tata Consultancy Services Ltd2.
2. In the second group of companies, IC coefficients of efficiency range between 1 and 1.2471. Eight companies fall in this group. Arranged in descending order these companies are Hinduja Ventures Ltd, Sasken Communication Technologies Ltd, Geometric Ltd, Zensar Technologies Ltd, Infinite Computer Solutions India Ltd, Persistent Systems Ltd, NIIT Technologies Ltd and HCL Technologies Ltd.
3. In the third group of companies, IC coefficient of super efficiency range between 0.8808 and 1. These companies arranged in descending order are Wipro Ltd, AcroPetal Technologies Ltd, Oracle Financial Services Software Ltd, Infosys Ltd, MahaveerInfoway Ltd and Blue Star Infotech Ltd.
4. In the fourth group of companies, IC coefficient range between less than 0.8808 and greater than 0. This group has the lowest IC coefficient of efficiency. The IC coefficients of efficiency relate to MphasiS Ltd, Financial Technologies (India) Ltd, 7Seas Entertainment Ltd, Hexaware Technologies Ltd, Saksoft Ltd, Cyient Ltd and Hinduja Global Solutions Ltd respectively.
CONCLUSIONS
This study examines the efficiency of selected Indian software companies in Intellectual Capital management. The authors use the individual components of value added intellectual coefficient (VAICTM) as the input variables and corporate values (tangible and intangible values) as the output variables. The authors employ the DEA methodology to evaluate Intellectual Capital efficiency. The findings are summarized as follows: the sample companies invest most of their resources in HCE as compared to SCE and CEE, and Mindteck (India) Ltd; Mastek Ltd; Tech Mahindra Ltd and Thinksoft Global Services Ltd are the most efficient company of all the sample companies, since they have the highest coefficient of IC efficiency based on AP model. The benchmarking analysis of this study may shed light for the managers in software companies to improve their efficiency in IC management.
Leila Zamani et al. et al.
Indian Journal Of Natural Sciences www.tnsroindia.org. © IJONS
Vol.5 / Issue 28/ February 2015 International Bimonthly ISSN: 0976 – 0997
2634
The model of this study, nevertheless, does not allow the underlying reasons that result in efficiency to be determined. Besides, the authors also cannot specify the role of managers in influencing the efficiency. Another limitation is that results of this study might not be generalized beyond knowledge-intensive industries. Moreover, this comparison is based on a relatively small sample; hence, it has to be viewed as suggestive only. The authors leave the mentioned issues to future research. The authors also caution the reader that their findings must be interpreted with due regard to their methodological DEA. Although the authors are unaware of any bias, they believe this issue may constitute a future research area.
REFERENCES
1. Ahangar, R.G. (2011), “The relationship between intellectual capital and financial performance: an empirical investigation in an Iranian company”, African Journal of Business Management, Vol. 5 No. 1, pp. 88-95.
2. Banker, R.D., Charnes, A. and Cooper, W.W. (1984), “Some models for the estimation of technical and scale inefficiencies in data envelopment analysis”, Management Science, Vol. 30 No. 9, pp. 1078-1092.
3. Bontis, N. (1998), “Intellectual capital – an exploratory study that develops measures and models”, Management Decision, Vol. 36 No. 2, pp. 63-76.
4. Bontis, N. (2001), “Assessing knowledge assets: a review of the models used to measure intellectual capital”, International Journal of Management Reviews, Vol. 3 No. 1, pp. 41-60.
5. Bose, S. and Thomas, K. (2007), “Valuation of intellectual capital in knowledge-based firms: the need for new methods in a changing economic paradigm”, Management Decision, Vol. 45 No. 9, pp. 1484-1496.
6. Brooking, A. (1996), Intellectual Capital: Core Asset for the Third Millennium Enterprise, International Thomson Business Press, London.
7. Charnes, A., Cooper, W.W. and Rhodes, E. (1978), “Measuring the efficiency of decision making units”, European Journal of Operational Research, Vol. 2 No. 6, pp. 429-444.
8. Clarke, M., Seng, D. and Whiting, R.H. (2011), “Intellectual capital and firm performance inAustralia”, Journal of Intellectual Capital, Vol. 12 No. 4, pp. 505-530.
9. Cooper, W.W., Seiford, L.M. and Tone, K. (2006), Introduction to Data Envelopment Analysis and its Uses: With DEA-Solver Software and References, Springer Science.
10. Edvinsson, L. (2002), Corporate Longitude: What You Need to Know to Navigate the Knowledge Economy, Prentice Hall.
11. Edvinsson, L. and Malone, M.S. (1997), Intellectual Capital: Realizing your Company’s True Value by Finding its Hidden Brainpower, Harper Business, New York, NY.
12. Feroz, E.H., Kim, S. and Raab, R.L. (2003), “Financial statement analysis: a data envelopment analysis approach”, The Journal of the Operational Research Society, Vol. 54 No. 1, pp. 48-58.
13. Golany, B. and Roll, Y. (1989), “An application procedure for DEA”, Omega, Vol. 17 No. 3, pp. 237-250. 14. Hao, J. (2010), “Institutional investors, intangible information, and the book-to-market effect”, Journal of
Financial Economics, Vol. 96 No. 1, pp. 98-126. 15. Hsu, Y.H. and Fang, W. (2009), “Intellectual capital and new product development performance: the
mediating role of organizational learning capability”, Technological Forecasting and Social Change, Vol. 76 No. 5, pp. 664-677.
16. Hung, S.W. and Lu, W.M. (2007), “A comparative study of the performance measurement in global telecom operators”, Total Quality Management & Business Excellence, Vol. 18 No. 10, pp. 1117-1132.
17. Hung, S.W., Lu, W.M. and Wang, T.P. (2010), “Benchmarking the operating efficiency of Asia container ports”, European Journal of Operational Research, Vol. 203 No. 3, pp. 706-713.
18. Kujansivu, P. (2009), “Is there something wrong with intellectual capital management models?”, Knowledge Management Research & Practice, Vol. 7 No. 4, pp. 300-307.
19. Laing, G., Dunn, J. and Hughes-Lucas, S. (2010), “Applying the VAICTM model to Australian hotels”, Journal of Intellectual Capital, Vol. 11 No. 3, pp. 269-283.
Leila Zamani et al. et al.
Indian Journal Of Natural Sciences www.tnsroindia.org. © IJONS
Vol.5 / Issue 28/ February 2015 International Bimonthly ISSN: 0976 – 0997
2635
20. Leitner, K.-H., Schaffhauser-Linzatti, M., Stowasser, R. and Wagner, K. (2005), “Data envelopment analysis as method for evaluating intellectual capital”, Journal of Intellectual Capital, Vol. 6 No. 4, pp. 528-543.
21. Lu, W.M. and Hung, S.W. (2011), “Exploring the operating efficiency of technology development programs by an intellectual capital perspective – a case study of Taiwan”, Technovation, Vol. 31 No. 8, pp. 374-383.
22. Lu, W.M., Wang, W.K., Tung, W.T. and Lin, F. (2010), “Capability and efficiency of intellectual capital: the case of fabless companies in Taiwan”, Expert Systems with Applications, Vol. 37 No. 1, pp. 546-555.
23. Lynn, B.E. (1998), “Performance evaluation in the new economy: bringing the measurement and evaluation of intellectual capital into the management planning and control system”, International Journal of Technology Management, Vol. 16 Nos 1-3, pp. 162-176.
24. Marr, B. (2007), “What is intellectual capital?”, in Jaia, L.A. (Ed.), Strategies for Information Technology and Intellectual Capital: Challenges and Opportunities, Information Science Reference.
25. Mehralian, G., Rajabzadeh, A., Sadeh, M.R. and Rasekh, H.R. (2012), “Intellectual capital and corporate performance in Iranian pharmaceutical industry”, Journal of Intellectual Capital, Vol. 13 No. 1, pp. 138-158.
26. Phusavat, K., Comepa, N., Sitko-Lutek, A. amdOoi, K.-B. (2011), “Interrelationships between intellectual capital and performance: empirical examination”, Industrial Management &Data Systems, Vol. 111 No. 6, pp. 810-829.
27. Pulic, A. (2000), “VAICt an accounting tool for IC management”, International Journal of Technology Management, Vol. 20 Nos 5-8, pp. 702-714.
28. Rehman, W.U., Ilyas, M. and Rehman, H.U. (2011), “Intellectual capital performance and its impact on financial returns of companies: an empirical study from insurance sector of Pakistan”, African Journal of Business Management,Vol.5No.20, pp. 8041-8049.
29. Roos, G. and Roos, J. (1997), “Measuring your company’s intellectual performance”, Long Range Planning, Vol. 30 No. 3, pp. 413-426.
30. Roos, J., Roos, G., Dragonetti, N.C. and Edvinsson, L. (1998), Intellectual Capital: Navigating the New Business Landscape, New York University Press, New York, NY.
31. Saez, P.L., Lopez, J.E.N. and Castro, G.M.D. (2007), “Intellectual capital in knowledege-intensive firms: exploring the concept and main components in Boston’s Route 128”, in Joia, L.A. (Ed.), Strategies for Information Technology and Intellectual Capital: Challenges and Opportunities, Information Science Reference.
32. Stahle, P., Stahle, S. and Aho, S. (2011), “Valued added intellectual coefficient (VAIC): a critical analysis”, Journal of Intellectual Capital, Vol. 12 No. 4, pp. 531-551.
33. Stewart, T.A (1991), “Brainpower intellectual capital is becoming corporate America’s most valuable asset and can be its sharpest competitive weapon. The challenge is to find what you have and use it”, Fortune, pp. 44-60.
34. Stewart, T.A. (1997), Intellectual Capital: The New Wealth of Organizations, Double Day,New York, NY. 35. Sveiby, K.E. (2010), “Methods for measuring intangible assets”, available at:
www.sveiby.com/articles/IntangibleMethods.htm (accessed 18 May 2012). 36. Ting, I.W.K. and Lean, H.H. (2009), “Intellectual capital performance of financial institutions in Malaysia”,
Journal of Intellectual Capital, Vol. 10 No. 4, pp. 588-599. 37. Tseng, C.Y. and James Goo, Y.J. (2005), “Intellectual capital and corporate value in an emerging economy:
empirical study of Taiwanese manufacturers”, R&D Management, Vol. 35 No. 2, pp. 187-201. 38. Uziene, L. (2010), “Model of organization’s intellectual capital measurement”,
Organizacijosintelektiniokapitalovertinimomodelis, Vol. 21 No. 2, pp. 151-159. 39. Wu, W.Y., Tsai, H.J., Cheng, K.Y. and Lai, M. (2006), “Assessment of intellectual capital management in
Taiwanese IC design companies: using DEA and the Malmquistproductivity index”, R&D Management, Vol. 36 No. 5, pp. 531-545.
40. Yang, C. and Chen, T.Y. (2010), “Evaluating the efficiency of intellectual capital management for Taiwan IC design industry”, African Journal of Business Management, Vol. 4 No. 15, pp. 3366-3373.
Leila Zamani et al. et al.
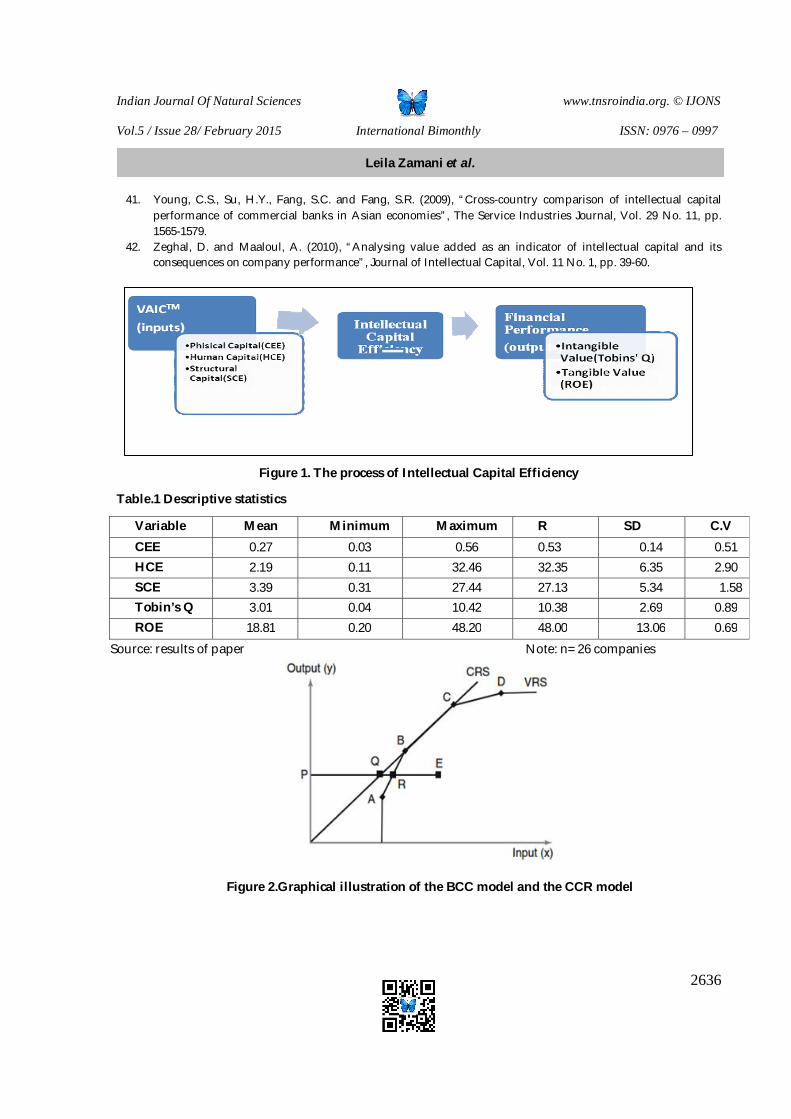
Indian Journal Of Natural Sciences www.tnsroindia.org. © IJONS
Vol.5 / Issue 28/ February 2015 International Bimonthly ISSN: 0976 – 0997
2636
41. Young, C.S., Su, H.Y., Fang, S.C. and Fang, S.R. (2009), “Cross-country comparison of intellectual capital performance of commercial banks in Asian economies”, The Service Industries Journal, Vol. 29 No. 11, pp. 1565-1579.
42. Zeghal, D. and Maaloul, A. (2010), “Analysing value added as an indicator of intellectual capital and its consequences on company performance”, Journal of Intellectual Capital, Vol. 11 No. 1, pp. 39-60.
Figure 1. The process of Intellectual Capital Efficiency
Table.1 Descriptive statistics
Variable Mean Minimum Maximum R SD C.V CEE 0.27 0.03 0.56 0.53 0.14 0.51 HCE 2.19 0.11 32.46 32.35 6.35 2.90 SCE 3.39 0.31 27.44 27.13 5.34 1.58 Tobin’s Q 3.01 0.04 10.42 10.38 2.69 0.89 ROE 18.81 0.20 48.20 48.00 13.06 0.69
Source: results of paper Note: n= 26 companies
Figure 2.Graphical illustration of the BCC model and the CCR model
Leila Zamani et al. et al.
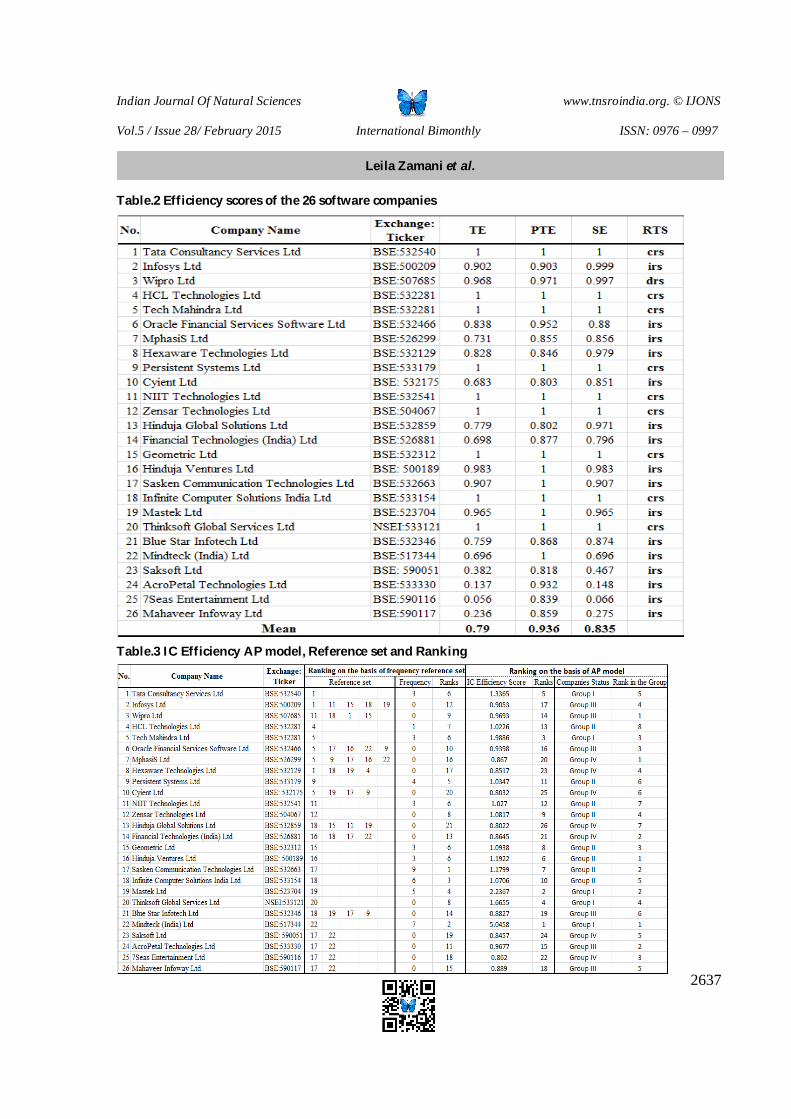
Indian Journal Of Natural Sciences www.tnsroindia.org. © IJONS
Vol.5 / Issue 28/ February 2015 International Bimonthly ISSN: 0976 – 0997
2637
Table.2 Efficiency scores of the 26 software companies
Table.3 IC Efficiency AP model, Reference set and Ranking
Leila Zamani et al. et al.
Indian Journal Of Natural Sciences www.tnsroindia.org. © IJONS
Vol.5 / Issue 28/ February 2015 International Bimonthly ISSN: 0976 – 0997
2638
Buffer Supplementation on Nutrient Utilization and Performance in Dairy Cattle -A Review
Balusami.C Assistant Professor Department of Livestock Production Management, College of Veterinary Science and Animal Science, Pookode,Wayanad District-673 576 Kerala, India. Received:28 Nov 2014 Revised: 12 Dec 2014 Accepted: 15 Jan 2015 *Address for correspondence Balusami.C Assistant Professor Department of Livestock Production Management, College of Veterinary Science and Animal Science, Pookode, Wayanad District-673 576 Kerala, India Contact no: 09445610821 E mail.:[email protected]
This is an Open Access Journal / article distributed under the terms of the Creative Commons Attribution License (CC BY-NC-ND 3.0) which permits unrestricted use, distribution, and reproduction in any medium, provided the original work is properly cited. All rights reserved. Buffer supplementation in dairy cattle is recommended to maintain a healthy rumen ecosystem for sustaining the higher levels of milk production. Buffers help to promote thriving rumen micro flora and fermentation, maintaining optimal rumen pH, increased rumen dilution rate, volatile acid production, growth rate, dry matter intake and milk yield and milk fat.Sodium bicarbonate is an ideal buffer with an equivalence point of 6.2-6.4 near optimal rumen pH and will help to resist changes in pH through its own buffering capacity. Feed grade sodium bicarbonate is an overall standard rumen-buffering supplement. It is endogenous to the cow as the largest component of saliva and effective natural buffer. Acid neutralizing capacity can vary significantly with different physical and chemical characteristics of dietary buffers and alkalizing agents. Some buffers/alkalis dissolve within minutes after entering the rumen, others dissolve so slowly that they largely pass the rumen before dissolving. Buffer addition reduces the risk of acidosis in cattle fed with starch-rich diets or acidic silages, and decreases the incidence of bloating in cattle fed spring grass/legume pastures. Key words: principles Buffers, Rumen dilution rate, VFA, Cellulose digestibility, Growth rate, Milk yield, Milk fat.
ABSTRACT
REVIEW ARTICLE
Indian Journal Of Natural Sciences www.tnsroindia.org. © IJONS
Vol.5 / Issue 28/ February 2015 International Bimonthly ISSN: 0976 – 0997
2639
INTRODUCTION Economic and climatic circumstances of a country dictate the feed components in ruminant diets. In India, land allocated for fodder crops is shrinking day by day due to competition from food crops. As more and more barren lands are brought under cultivation, grazing land for animals is gradually decreasing. This is worsening the fodder shortage already existing in this country. Scarcity of roughage and low rainfall conditions creates pricing pressure on fodders. Higher prices of feeds/fodders will adversely affect the dairy farming as the major portion of budget is spent on feed alone. To overcome this problem the alternatives left before the farmer or a dairy scientist is to formulate rations with cheaper agricultural byproducts or alternatively to achieve better digestibility and efficient utilization of limited feed/fodder given to animals. Feeding buffers to improve performance of ruminant animals is widely accepted. Since ruminant diet is largely constituted with plant material rich in cellulose, digesting the cellulose in ruminant stomach is of greater importance to animal nutritionist. So any attempt aimed at improving cellulose digestibility in the ruminants will have significant contribution in increasing the nutritional efficiency. The rumen pH and buffering capacity will influence the cellulose digestibility in ruminants and phosphate and bicarbonates are known to increase the buffering capacity of rumen liquid and increase the cellulose digestibility (Emmanuel et al., 1970). Both sodium bicarbonate and disodium hydrogen phosphate increase feed intake, rumen pH and fluid dilution rate and enhance the rate of fiber digestion. Sodium bicarbonate and disodium hydrogen phosphate feeding increase rumen fluid dilution rate and thereby increase ruminal bypass of nutrients (Rogers et al., 1979). It is established that ruminal digestion of fiber will be improved by the addition of sodium bicarbonate to the diets of cattle (Wedekindet al., 1986). It is also observed that availability of phosphorus for microbes in the rumen is important for ensuring maximum efficiency of digestion (Witt and Owens, 1983). With this background information, the present review is targeted to collate the information pertaining to feeding buffer salts to cattle for increasing the feed utilization, milk production and milk fat content. Rumen Buffering Capacity Rumen buffering capacity can be defined as the number of moles per liter of H+ required to cause a given change in pH.The rumen contents are buffered at a pH ranging from 6.5-6.9 and postprandial changes in pH may vary from 5.5. – 7.2 depending upon to the type and quantity of diet being offered to the animal. The fall in pH on depends upon the nature of diet and concentrate based diet cause a rapid fall in pH of the rumen contents. The relative ratios of carbonates, phosphate, VFA determine the extent of buffering capacity of the rumen liquor. (Kamra and Pathak, 1996). Feeding of excessive quantity of easily fermentable carbohydrates especially to the high milk producing dairy and fattening animals result in reduction of rumen pH often to a level that leads to acidosis. This may also happen on feeding large quantity of silage.The compounds commonly evaluated for buffering ability include bentonite, magnesium oxide and carbonate, bicarbonates of potassium and sodium etc. (Erdman, 1988; Tucker et al., 1992; Mondalet al., 1996; Chaudhary et al., 2000.Use of some of the buffering agents has been shown to increase the digestion of fibre, starch and protein and also to increase the synthesis of microbial protein in the rumen. (Pathak, 1999).Bicarbonate and VFA are the main components of buffering system in the rumen fluid of dairy cattle under a range of feeding conditions (Counotteet al., 1979). Dietary supplements may also be used to manipulate rumen fluid pH. Inclusion of sodium bicarbonate in diet of steers and sheep maintained on corn silage, alfalfa hay, or chardgrass hay, and concentrate mixture increased the rumen fluid pH. (Rogers and Davis, 1982a; 1982b; Kovaciket al., 1986). Addition of carbonate or phosphate buffer significantly increased the buffering capacity of the rumen, caecaldigesta and the sodium bicarbonate and sodium carbonate system played a more effective buffering role than the sodium dihydrogen orthophosphate and disodium hydrogen orthophosphate system in the rumen digesta.(Ding et al., 1997)
Balusami
Indian Journal Of Natural Sciences www.tnsroindia.org. © IJONS
Vol.5 / Issue 28/ February 2015 International Bimonthly ISSN: 0976 – 0997
2640
Cellulose Digestibility
Feeding sodium bicarbonate at a rate of 100 g. per animal per day resulted in 10.20 per cent increase in the intake of silage dry matter by cattle (Orth and Kaufmann, 1966). They opined that sodium bicarbonate infused in the rumen or added to the feed, increased the buffering capacity of the ruminal fluid and this has resulted in increased rates of cellulose digestion, which in turn allowed higher rates of feed consumption.Bicarbonate supplementation of feed in wethers increased cellulose digestibility from 39.7% to 45.6% and the addition of disodium hydrogen phosphate further increased the digestibility to 51.1% (Emmanuel et al., 1970)
Rumen Dilution Rate
An increase in rumen liquid dilution rate may improve the efficiency of ruminant production by increasing efficiency of bacterial growth and flow of a-linked glucose polymers, total amino acids to the small intestine.Buffer salts exert an osmotic action in the rumen which can increase rumen dilution rate and thereby improve the efficiency of ruminal digestion.This increased dilution rate has been attributed to the increased ruminal osmotic pressure causing an influx of water into the rumen (Rogers et al., 1976).
Volatile Fatty Acids
The short-chain volatile fatty acids viz., acetic, propionic and butyric constitute the principal sourceof energy available for metabolism by ruminant animals. The efficiency of utilization of metabolizable energy (ME) for fattening, milk yield and butter-fat percentage are influenced by the composition of the VFA in the rumen (Blaxter, 1967).Supplementation with 1:1 mixture of sodium carbonate and sodium bicarbonate and disodium hydrogen phosphate in wetherscontribute to the maintenance of a higher rumen pH while lower VFA concentrations were observed to be lower, resulting presumably due to their increased absorption (Emmanuel et al., 1970). The total VFA concentration, acetate concentration, isovalerate concentration and acetate: propionate ratio, and propionate concentration can be increased in lactating dairy cows on supplementation of diet with sodium bicarbonate (Snyder et al., 1983).
Buffer Salts on Growth Rate
Feeding a special mineral supplement composed of bicarbonate salts of calcium, sodium and potassium to calves improved feed consumption and tended to improve growth (Nicholson et al., 1960). Significant difference in average daily weight gains of lambs was achieved by mixing 0.5% sodium bicarbonate in drinking water (Lassiter et al., 1962).Inclusion of sodium bicarbonate in calf starter increased dry matter intake and average daily weight gain in Jersey calves(Wallis et al.,1992) Awadhesh Kishore et al. (1997) observed beneficial effect in kids by inclusion of sodium bicarbonate and magnesium oxide in the diet.Addition of 2% sodium bicarbonate to finishing diet of lambs significantly improved feed conversion ratio and average daily weight gain (Filiyaet al. 1998).
Effect of Buffer Salts on Dry Matter Intake
Inclusion of bicarbonate salts in the diet increased dry matter intake as well as dry matter and organic matter digestibility.Addition of sodium bicarbonate in corn silage fed to Holstein steers and heifers increased dry matter intake (Mouldet al. 1983; Shaveret al., 1985).A natural calcium buffer produced from the calcified remains of the seaweed Lithothamniumcalcareum(Calmin, Celtic Sea Minerals, Cork, Ireland) is currently available and has been reported to be a very effective buffer (Beya, 2007, Calitz, 2007). This product contains high concentrations of calcium (30%) and magnesium (5.5%) as well as other trace minerals and is slowly released in the rumen. When fed at 0.3% of the dietary DM, milk yield was increased compared with diets containing only 0.125% of DM (Cruywagenet al.,
Balusami
Indian Journal Of Natural Sciences www.tnsroindia.org. © IJONS
Vol.5 / Issue 28/ February 2015 International Bimonthly ISSN: 0976 – 0997
2641
2004). No additional gains were observed for feeding 0.6 or 0.9%. When compared with sodium bicarbonate in high concentrate diets fed to lactating dairy cows, CB increased ruminal pH compared with the control diet. Cows fed CB had higher yield of milk compared with those fed either the control diet or supplemental sodium bicarbonate (Cruywagenet al., 2007). Influence of Feeding Buffer Salts on Milk Yield and Milk Fat
Dietary buffers are frequently included in diets fed to lactating dairy cows to prevent acidosis and milk fat depression (Enemark, 2009). Supplemental buffers were justified when buffer flow from saliva is inadequate and that NaHCO3, MgO, KHCO3, and K2CO3 have been reported to increase ruminal pH, acetate to propionate ratio, and milk fat percentage when included in low forage diets. In a review of 83 experiments, supplemental NaHCO3 was found to increase DMI and fat-corrected milk yield when included in diets based on corn silage, but no response was observed for diets based on alfalfa haylage or hay crop silage (Erdman, 1988).Sodium bicarbonate and magnesium oxide incorporation in the diets of dairy cattle has been found useful in controlling the drop in milk fat percentage to a greater extent (Clark and Davis, 1980).In a study conducted by Fisher and Mackay (1983a) on the effect of sodium bicarbonate, sodium bicarbonate plus magnesium oxide bentonite on the intake of corn silage by lactating cows, it was observed that sodium bicarbonate improved milk yield in one trial and milk fat percentage in another trial but the degree of response did not warrant its routine use as a supplement to corn silage. In another study Fisher and Mackay (1983b) observed that addition of sodium bicarbonate to the silage improved milk yield and feed conversion in lactating cows.Addition of sodium bicarbonate at 1.5% to maize silage and Lucerne haylage increased milk fat in Holstein Frisian cows (Zhelevet al., 1984).Schneider et al. (1984) observed that addition of sodium bicarbonate at 1.5% to maize silage increased fat content of milk (P<0.01), fat yield and feed conversion in cows.Dietary addition of Magnesium oxide and sodium bicarbonate in lactating cows increased milk fat content and yield of total solids without affecting milk yield. (SatyaveerSingh et al., 1999).
Feeding recommendations for products used as buffer inlactating cows (Hutrens, 1998) (Table.1)
Sodium bicarbonate supplementation increased milk fat concentration, but reduced milk yield. As a result, there were no differences in milk fat yield or efficiency of energy use of diets between carbonate and sodium bicarbonate supplemented cows. Changes in milk fat concentration and milk yield were likely due to an increase in di calcium phosphate and/or rumen buffering. While there were no productive benefits of sodium bi carbonateuse, it substantially increased Na discharge, which is known to increase water and soil sodicity (Rauchaet al., 2012)
CONCLUSION It is concluded that buffer feeding technology is one of the strategies to increase acceptability of feed and better utilization of nutrients to enhance the rate of weight gain and increase the milk yield. Under Indian conditions of feed quality, there is a need for the identification of buffering agents capable of providing favorable ruminal environment for the efficient degradation of fibrous foods into available energy.
REFERENCES 1. Emmanuel B, Lawlor M.J and McAleese D 1970. The Effect of Phosphate and carbonate - bicarbonate supplements on rumen buffering systems of sheep. British J. of Nutrition .24: 653. 2.Rogers JA, Clarks BC, Davis. CL and Clark J H 1979. Alteration of rumen fermentation in steers by increasing rumen fluid dilution rate with mineral salts. Journal of Dairy Sci. 62:1599 3.Wedekind K J, Russell B, Muntifering and Barker KB 1986. Effects of diet concentrate level and sodium bicarbonate on site and extent of forage fiber digestion in the gastro intestinal tract of wethers. Journal Animal Sci. 62: 1388 – 1487.
Balusami

Indian Journal Of Natural Sciences www.tnsroindia.org. © IJONS
Vol.5 / Issue 28/ February 2015 International Bimonthly ISSN: 0976 – 0997
2642
4.Witt KE and Owens FN 1983. Phosphorus: Ruminal availability and effects on digestion. Journal of Animal Sci. 56: 930 – 937 5.Kamra DN and Pathak NN 1996. Nutritional Microbiology of Farm Animals. Vikas Publications Private Limited, New Delhi. 6.Erdrnan R A 1988 .Dietary Buffering requirement of the lactating dairy cows: a review. Journal of Dairy Sci. 7 l: 3246 - 3266. 7.Tucker W B, Hogue JF and Aslam M 1992. A buffer value index to evaluate effects of buffers on ruminalmillieu in cows fed high or low concentrate, silage, or hay diets. Journal of Dairy Sci. 75: 811-819. 8.Mondal BC, Garg AK, Kamra DN and Pathak NN 1996. Effect of feeding sodium bicarbonate on nutrient digestibility and rumen fermentation pattern in buffaloes. Indian Journal of Animal Sci. 66 (9):952-954. 9.Chaudhary LC,Kamra DN, Singh R, Agarval N and Pathak NN 2000. Effect of feeding bentonite on rumen fermentation enzyme activity and protozoal population in adult buffaloes. Buffalo Journal.1:73-79 10.Pathak NN 1999. Recent advances in the use of chemical feed additives proceedings IX Animals Nutrition conference. Hyderabad. 11.Countotte GHM,VantKloosterA, Van Der Kuilan J and Prins RA 1979. An Analysis of the buffer system in the rumen of dairy Cattle. Journal of Animal Sci. 49: 1536 12.Rogers JA and Davis CL 1982a. Rumen volatile fatty acid production and nutrient utilization in steers fed a diet supplemented with- sodium bicarbonate and monensin. Journal of Dairy Sci. 65: 944 -952. 13. Rogers JA and Davis CL 1982b. Effect of Intra ruminal infusions of mineral salts on volatile fatty acid production in steers fed high grain and high roughage diets. Journal of Dairy Sci. 65: 953. 14.Kovacik AM,Loerch SC and Dehority BA 1986. Effect of supplemental bicarbonate on nutrient digestibility and ruminal pH measured continuously. Journal of Animal Sci. 62:226 - 34. 15.Ding Z, Rorve JB, Godwin IR and Xu Y 1997. The Buffering capacity of caecaldigesta exceeds that of rumen digesta from sheep fed pasture of roughage diets. Aust. Journal of Agri.Res. 48:723-728. 16.Orth A and Kaufmann W1966. ZurWirkung Von Bicarbonate auf die FutteraufnahmebeiMilchkuben. Z Tierphysiol. Tierernhr. Futtermittelk. 21: 350-61. Cited in Journal of Agricultural Sci. 75:311-319. 17.Blaxter KL 1967. The energy metabolism of Ruminants, 2nd edition. London, Hutchinson. 18.Snyder TJ, Rogers JA and Muller LD 1983. Effect of 1.2% sodium bicarbonate with two rations of corn silage: grain on milk production, rumen fermentation and nutrient digestion by lactating dairy cows. Journal of Dairy Sci. 66:1290. 19.Nicholson J K, Loosli and Warner RG 1960. Influence of mineral supplements on the growth of calves, digestibility of the rations and intra-ruminal environment. Journal of Animal Sci. 19:1071. 20.Lassiter JW, Cuilison AEand Warren EP 1962. Effect of sodium bicarbonate on growth and nutrient digestibility in Lambs. Journal of Animal Sci. 2l: 385. 21.Wallis LB, Quigley JD and Dowlen HH 1992. Effects of sodium bicarbonate and yeast culture on growth, and intake in Jersey calves. Journal of Dairy Sci. 75 (supplement l):268. 22.AwadeshKishor. Prakash Chandra and Ogra JL l997. Protein energy and fiber utilization in lactating goats fed on buffer added diet. Indian Journal of Animal Nutrition. 15 (4): 276-279. 23.Filiya T,Mert N and Gunduz H 1998 Effect of sodium bicarbonate in lambs rations on fattening performance and some blood parameters. Bulgarian Journal of Agricultural Sci. 4(4):539-545 24.Mould F L, Orskov E R and Shirley Gauld A 1983 Associative effects of mixed feeds. II. The effect dietary addition of bicarbonate salts on the voluntary intake and digestibility of diets containing various proportions of hay and barley. Animal Feed Science and Technology l0:31-47. 25. Shaver R D, Erdman RA, Connor AMO and Vandersall JH 1985. Effect of silage pH on voluntary intake of corn silage. Journal Dairy Sci. 67: 2045. 26.Beya MM. 2007. The effect of buffering dairy cows diets with limestone, Acid Buf or sodium bicarbonate on production response and rumen metabolism. M.S. Thesis, Stellenbosch Univ., Matieland, South Africa. 28.Calitz T. 2007. The effect of Acid Buffer and combinations of Acid Buffer and sodium bicarbonate in dairy cow diets on production response and rumen parameters. M. S. Thesis. Stellenbosch Univ., Matieland, South Africa.
Balusami
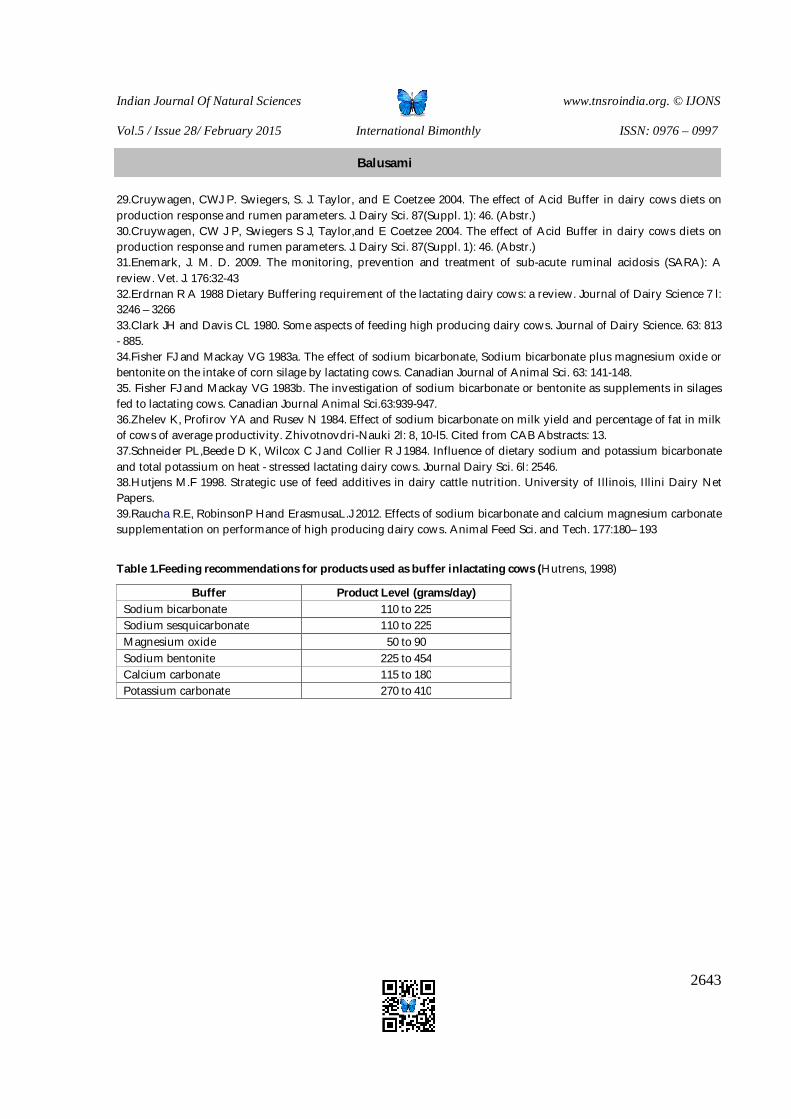
Indian Journal Of Natural Sciences www.tnsroindia.org. © IJONS
Vol.5 / Issue 28/ February 2015 International Bimonthly ISSN: 0976 – 0997
2643
29.Cruywagen, CWJ P. Swiegers, S. J. Taylor, and E Coetzee 2004. The effect of Acid Buffer in dairy cows diets on production response and rumen parameters. J. Dairy Sci. 87(Suppl. 1): 46. (Abstr.) 30.Cruywagen, CW J P, Swiegers S J, Taylor,and E Coetzee 2004. The effect of Acid Buffer in dairy cows diets on production response and rumen parameters. J. Dairy Sci. 87(Suppl. 1): 46. (Abstr.) 31.Enemark, J. M. D. 2009. The monitoring, prevention and treatment of sub-acute ruminal acidosis (SARA): A review. Vet. J. 176:32-43 32.Erdrnan R A 1988 Dietary Buffering requirement of the lactating dairy cows: a review. Journal of Dairy Science 7 l: 3246 – 3266 33.Clark JH and Davis CL 1980. Some aspects of feeding high producing dairy cows. Journal of Dairy Science. 63: 813 - 885. 34.Fisher FJ and Mackay VG 1983a. The effect of sodium bicarbonate, Sodium bicarbonate plus magnesium oxide or bentonite on the intake of corn silage by lactating cows. Canadian Journal of Animal Sci. 63: 141-148. 35. Fisher FJ and Mackay VG 1983b. The investigation of sodium bicarbonate or bentonite as supplements in silages fed to lactating cows. Canadian Journal Animal Sci.63:939-947. 36.Zhelev K, Profirov YA and Rusev N 1984. Effect of sodium bicarbonate on milk yield and percentage of fat in milk of cows of average productivity. Zhivotnovdri-Nauki 2l: 8, 10-l5. Cited from CAB Abstracts: 13. 37.Schneider PL,Beede D K, Wilcox C J and Collier R J 1984. Influence of dietary sodium and potassium bicarbonate and total potassium on heat - stressed lactating dairy cows. Journal Dairy Sci. 6l: 2546. 38.Hutjens M.F 1998. Strategic use of feed additives in dairy cattle nutrition. University of Illinois, Illini Dairy Net Papers. 39.Raucha R.E, RobinsonP Hand ErasmusaL.J 2012. Effects of sodium bicarbonate and calcium magnesium carbonate supplementation on performance of high producing dairy cows. Animal Feed Sci. and Tech. 177:180– 193
Table 1.Feeding recommendations for products used as buffer inlactating cows (Hutrens, 1998)
Buffer Product Level (grams/day) Sodium bicarbonate 110 to 225 Sodium sesquicarbonate 110 to 225 Magnesium oxide 50 to 90 Sodium bentonite 225 to 454 Calcium carbonate 115 to 180 Potassium carbonate 270 to 410
Balusami
Indian Journal Of Natural Sciences www.tnsroindia.org. © IJONS
Vol.5 / Issue 28/ February 2015 International Bimonthly ISSN: 0976 – 0997
2644
Constraints in Small Dairy Holdings in Wayanad District of Kerala – A Participatory Approach Nija George1 and Senthilkumar. R2* 1Department of Veterinary and Animal Hunbandry Extension, College of Veterinary Science and Animal Science, Mannuthy ,Kerala, India. 2Department of Veterinary and Animal Husbandry Extension, College of Veterinary Science and Animal Science, Pookode,Wayanad District-673 576 Kerala, India. Received: 10 Dec 2014 Revised: 25 Dec 2014 Accepted: 5 Jan 2015 *Address for correspondence Senthilkumar. R Assistant Professor, Department of Veterinary and Animal Husbandry Extension, College of Veterinary Science and Animal Science, Pookode,Wayanad District-673 576 Kerala, India. E.Mail: [email protected]
This is an Open Access Journal / article distributed under the terms of the Creative Commons Attribution License (CC BY-NC-ND 3.0) which permits unrestricted use, distribution, and reproduction in any medium, provided the
original work is properly cited.All rights reserved. A study was conducted to analyze the constraints in small dairy holdings of Wayanad. The measurement tool employed was focus group discussion. High cost of feed and scarcity of green fodder were perceived to be the most serious constraints in dairying. Breeding constraints were anestrum and repeat breeding. High capital investment required for dairying, low price for milk, unavailability of credit, and non-availability of good milch animals were the other constraints. Key words: small dairy holdings, constraints, focus group discussion. INTRODUCTION Milk remains the main output of the Indian livestock sector accounting for 66.7 per cent of the total value of output besides growing at a phenomenal rate from around 20 million tons in 1960s to 115 million tons in 2010-11. This translates to an annual growth rate of 4.4 per cent and 3.8 per cent during the last two decades respectively. Despite these achievements, and an increase in the per capita availability of milk from 128g/day in 1980-81 to 267 g/day in 2010-11, it still remains below the Indian Council of Medical Research recommendation of 280g. So also, the average annual milk yield of Indian cattle stands at 1172 kg which is well below the global average of 2500 kg. The daily average milk yield of Indian animals is between 1.5 Kg to 5.0 Kg. (Report of The Working Group on Animal husbandry & Dairying, 12th five year plan, 2012). These figures shed light on the fact that improving productivity of this huge population of low-producing animals is the major challenge faced by the dairy sector in India. Kerala was unique in that it was one of the pioneering states to have adopted cross breeding more than fifty years back, along
RESEARCH ARTICLE
ABSTRACT
Indian Journal Of Natural Sciences www.tnsroindia.org. © IJONS
Vol.5 / Issue 28/ February 2015 International Bimonthly ISSN: 0976 – 0997
2645
with other southern states including Tamil Nadu, Karnataka etc., However, despite having one third of the total cross bred population of the country, the contribution of the state to the total Indian milk production stands at a meager one percent. The above discussions point to the fact that there is a need to explore various factors on the small holder dairy farms which may be hampering the attainment of the production potential of the cross-bred animals. Hence the present study was conducted among the small dairy holders of Vythiri Taluk in Wayanad district with the following objective to study the constraints in sustaining and augmenting milk productivity.
MATERIALS AND METHODS For the present study a qualitative analysis of constraints to small holder dairying was done by employing the participatory method- the focus group discussion(FGD). Here small dairy holding meant farms with one or two milch animals.FGDis a rapid assessment, semi‐structured data gathering method in which a purposively selected set of participants gather to discuss issues and concerns based on a list of key themes drawn up by the researcher/facilitator (Kumar, 1987). The purpose of the interview was to gather information about a particular topic guided by a set of focused questions which yield different information than if people were interviewed individually. Eight to 12 participants took part in each FGD which were held for one to two hours and an FGD was conducted in each selected village for the purpose. It was organized with the help of thelocal veterinarian and the local milk co-operative society officials. In all six villages, namely Vengappally, Achooranam, Thrikkaipeta, Kottapady, Padinjarethara and Kaniyambetta,FGDs were held. The discussion was moderated by a subject matter specialist who was either the local veterinarian of the panchayat or expert scientist from Kerala Veterinary and Animal Sciences University. The researcher acted as facilitator in all the discussions.
RESULTS AND DISCUSSION In all six villages feeding management faced severe constraints because of the high cost of compounded cattle feed and feed ingredients besides green and dry fodder shortage. Poor quality of compounded cattle feed was another major problem. Non -availability of fodder slips and seed and scarcity of land and water for irrigation were hindering the fodder cultivation. It was also reported that the fodder storage methods like silage making could not be adopted in an area due to high humidity. To tide over the high cost of feed and non-availability of fodder many resorted to unconventional feeds like beer waste, tapioca starch waste etc.,The finding of the present study only reflects the overall feed and fodder situation of the state. The state produces only 60 per cent of its roughage requirements and the daily requirement of concentrate feed was estimated to be around 5372 MT while only 1000 MT could be produced (Department of Agriculture, Government of Kerala, 2006).These findings were nevertheless supported by many studies viz., Chaudhary and Indodia (2000), Khan et al. (2009), Rathodet al. (2011) and Kathiravan and Selvam (2011). The major factors contributing to fodder scarcity were the unavailability of land for fodder cultivation and water scarcity. In cases where land was available other high input high output cash crop or food crop alternatives have the upper hand among farmers. Further, changing landscapes and the agricultural pattern in the area from paddy cultivation to other crops have also contributed to this phenomenon. Other fodder preservative techniques such as preservation of green fodder as silage were not workable in view of the high humidity of the area under study besides feeding constraints. The last option of feed mixing on homestead was not a viable option keeping in mind the exorbitant cost of ingredients.
Breeding management is undoubtedly contributing to the profitable farm management. It is worth mentioning that constraints in breeding management were not found to be that serious in the area except for repeat breeding and anestrum. The reports of Singh and Chauhan (2006) and Thirunavukkarasu (2010) were in agreement with the present study. The health care delivery system was perceived to have satisfactorily provided both A.I and pregnancy diagnosis services. This is due to high density of veterinary insemination sub-centers in Kerala when compared to other states coupled with the ready availability of inseminators who were able to deliver effective service to the farmers’ door step. This picture is a stark contrast to that observed in other reports such as Waithaka et al. (2000) and
Nija George and Senthilkumar
Indian Journal Of Natural Sciences www.tnsroindia.org. © IJONS
Vol.5 / Issue 28/ February 2015 International Bimonthly ISSN: 0976 – 0997
2646
Kumar et al. (2011a). Waithaka et al. (2000) reported that inadequate breeding services due to lack of good dairy animals, lack of breeding bulls, ineffective A.I services, and expensive A.I services were major problems faced by farmers of Western Kenya.
Constraint analysis also evinced that mastitis and production diseases like milk fever and ketosis were major issues for concern. Increased incidence of production diseases could have been precipitated by inadequate knowledge on feeding management and the consequent reduced energy supplementation due to high cost of compounded feed. These findings are in consonance with those of Tiwari et al. (2007). High cost of treatment and unavailability of veterinary services and medicines were also faced by the farmers. Kumar et al. (2012) also reported that among health care constraints, major ones were unavailability of vaccine and medicine. This finding is in contrast to that of Kumar et al. (2011b) who reported that health care problems among dairy farmers of Bihar were associated with poor knowledge of deworming, vaccination and poor housing. Marketing, credit availability and labour management are the main areas of paramount importance in farming activities. These factors were found to be of serious concern in the study area. Major marketing constraints were reduced remuneration for milk from co-operative societies and the unsatisfactory milk pricing system. These are similar to the findings of Tassew and Seifu (2009) who reported that reduced milk production of animals and low producer price of milk of small holder production systems of north western Ethiopia were major constraints. The study further revealed that difficulties in availing credit and unavailability of good milch animals were serious problems. This was mainly because most of the financial organizations demanded collateral security which made it difficult for farmers who did not own land. Similar findings were reported by JayaVarathanet al. (2012) in their observation that marketing of milk was the major constraint for dairy farmers of Thiruvannamalai district where poor transportation facilities and mobility to sell the product was a serious problem for 71 per cent of livestock farmers. Another important finding of the study was the insufficiency of schemes to meet the required capital investment for dairying. These findings agree with those of Chinogaramombeet al., (2008) and Chawatamaet al. (2005) who reported lack of capital as one of the constraints in dairying in Ethiopia. All the small holders were depending on household labour for farm operations due to high cost of labour and unavailability of skilled labourers. Non-availability of good milch animals and heifers were some of the important problems faced by most of the farmers. That made them to depend on other states for animals where fraudulent practices by middle men were serious concern.
REFERENCES 1. Anonymous. 2006. Department of Agriculture. Government of Kerala. 2. Anonymous. 2012. Report of the working group on animal husbandry & dairying 12th five year plan (2012- 17). 130 p. 3. Chawatama, S., Mutisi, C. and Mupawaenda, A.C. 2005. The socio economic status of small holder livestock production in Zimbabwe diagnosis. Livestock Res. for Rural Dev., 17 (12). 4. Chinogaramombe, G.N.C., Muchenje, V., Mapiye, C., Ndlovu, T., Chimonyo, M. and Musemwa, L.2008. Challenges for improving small holder dairy production in the semiarid areas of Zimbabwe. Livestock Res. For Rural Dev., 20 (3). 5. Chaudhary, M. and Indodia, S.L. 2000. Constraints perceived by cattle owners in adoption of modern cattle management practices. Indian J. Anim. Res., 34(2): 116-119. 6. JayaVarathan, B., Prabu, M., Pandian, S. A., SenthilKumar, G. and SelvaKumar, K.N. 2012. Production and marketing constraints in dairy cattle rearing as perceived by women self-help group members and non- members. Tamilnadu J. Vet. Anim. Sci.,8 (2): 68-71. 7. Kathiravan, G. and Selvam, S. 2011. Analysis of Constraints to Livestock Production in Tamil Nadu. Indian J. Anim. Res.,45 (1): 56 –59.
Nija George and Senthilkumar
Indian Journal Of Natural Sciences www.tnsroindia.org. © IJONS
Vol.5 / Issue 28/ February 2015 International Bimonthly ISSN: 0976 – 0997
2647
8. Khan, M. J., Peters, K. J. and Uddin, M. M. 2009. Feeding strategy for improving dairy cattle productivity in small holder farm in Bangladesh. Bang. J. Anim. Sci.,38(1&2) : 67 – 85. 9. Kumar, K. 1987. Conducting focus group interviews in developing countries. A.I.D. Program Design and Evaluation Methodology Report No. 8. Washington, D.C., U.S. Agency for International Development 10. Kumar, S., Kumar, B., Kumar, R. and Sankhala, G. 2012. Farmers’ opinion to reduce the constraints in scientific dairy farming practices- a case study. Indian J. Anim. Sci,82 (7): 762–766. 11. Kumar, J., Kumar, B. and Kumar, S. 2011a. Constraints faced by dairy farmers in adopting improved dairy farming practices in Bettiah district of Bihar. Indian J. Dairy Sci., 64(1): 59-65. 12. Kumar, J., Kumar, B. and Kumar, S. 2011b. Constraints perceived by farmers in adopting scientific dairy farming practices in Madhum district of Bihar. Res. J. Agric. Sci., 2(1): 142-145. 13. Rathod, P.K., Landge.S. Nikam, T. R. andVajreshwari, S. 2011. Socio-personal profile and constraints of dairy farmers. Karnataka J. Agric. Sci., 24 (4): 619-621. 14. Singh, M. and Chauhan, A. 2006. Constraints faced by dairy owners in adoption of scientific dairy farming practices. Indian J. Dairy Sci., 59(1): 49 – 51. 15. Tassew, A. andSeifu, E.2009. Smallholder dairy production system and emergence of dairy cooperatives in
Bahir Dar Zuria and MechaWoredas, Northwestern Ethiopia. World J. Dairy Food Sci., 4 (2): 185-192 16. Thirunavukkarasu, M. 2010. Artificial breeding in bovines – Analysis of important constraints. Tamil Nadu J. Vet. Anim. Sci., 6(1): 34-39. 17. Tiwari, R., Sharma, M.C. and Singh, B.P. 2007. Major problems of small holder buffalo production farms in India. Indian J. Anim.Sci., 97 (10): 1050-1053. 18. Waithaka, M., Wokabi, A., Nyangaga, J., Ouma, E., Wolff, T., Biwott, J., Staal, S., Ojowi, M., Ogidi, R., Njarro, I. and Mudavadi, P. 2000. A participatory rapid appraisal (PRA) of farming systems in western Kenya. Report of PRA of dairy and crop activities in western Kenya. 42p.
Nija George and Senthilkumar
Indian Journal Of Natural Sciences www.tnsroindia.org. © IJONS
Vol.5 / Issue 28/ February 2015 International Bimonthly ISSN: 0976 – 0997
2648
A Study of Air ions Concentration in Different Trees
Jagadesan S., and M.V.Subramanian*
PG & Research Department of Physics, H.H. The Rajah’s College, Pudukkottai,TamilNadu,India.
Received:12 Nov 2014 Revised:20 Dec 2014 Accepted: 21 Jan 2015 *Address for correspondence M.V.Subramanian PG & Research Department of Physics, H.H. The Rajah’s College, Pudukkottai,TamilNadu, India. E.mail: [email protected]
This is an Open Access Journal / article distributed under the terms of the Creative Commons Attribution License (CC BY-NC-ND 3.0) which permits unrestricted use, distribution, and reproduction in any medium, provided the original work is properly cited. All rights reserved. Air ions are very important in our life, to all human bodies and growth of plants and trees. In this study we report about the air ion produced due to photosynthesis in trees in Pudukkottai at Tamilnadu, India. Trees and their leaves release positive air ions and negative air ions during photosynthesis. Both the air ions concentration was measured under the trees. Different types of trees were selected in various places. Positive air ions and negative air ions were measured using Air ions counter which can work at the temperature range -100C to 500C, at a wind speed of < 15 Km/hr (9mph). The air ions concentrations were measured daily for the month of August, September, October, November in2012 and 2013. Then the average readings were taken to draw graph and discussed through bar diagrams and line graphs. We identify the trees and their leaves which produced positive air ions and negative air ions. High concentration of positive air ions are released the trees followed as Eucalyptus obliqua, Ficus bengalensis, Tamarindus indica, Cocos nucifera. High concentration of negative air ions are released the trees followed as Mangifera indica, Azadirachta indica, Ficus religiosa, Pongamia glabra, Prosopis julifera, Artocarpus heterophylla, Citrus hystrix. The negative ions serveas vitamins to human health. The positive air ions are increase our body will fail to undergo metabolism and thus our cells become weak and we will be easily affected by illness. Key words: Trees, Positive air ions, Negative air ions.
ABSTRACT
RESEARCH ARTICLE
Indian Journal Of Natural Sciences www.tnsroindia.org. © IJONS
Vol.5 / Issue 28/ February 2015 International Bimonthly ISSN: 0976 – 0997
2649
INTRODUCTION By air ions, we mean charged particles, molecules or clusters in the atmosphere (being &brassseur 2000; Yu &turco, 2001), which are widely dispersed in natural world (Isreal, 1970; Kilpatrick, 1971). Negative air ionizers are commonly used to clean air indoors. Daniels (2002) reported that negative air ionization reduced particulates, airborne microbes, odors and volatile organic compounds in indoor air. A negative air ionizer generates the negative air ions which can affect the contaminates in the gas phase. The efficiency of removable of particulates by negative air ions is beneficial (Wu and lee, 2003). The origin of these ions in forest environments is uncertain (Suni et al., 2007), and has been attributed to vegetation (Wang et al., 2006) or radon efflux from the ground (Hirsikko et al., 2007), or both.The causes and effects of air ionization have been under investigation since first described the presence of small charges in the atmosphere. These charges are due to free electrons, to gaseous atoms with a deficit or excess of an electron or to particulate matter in the air to which such atoms have become attached (Griffin and Kernbluch, 1962). Air ions are formed when sufficient force displaces an outer electron from a molecule of one of the common gases, such as oxygen and nitrogen. Under normal conditions, there is a small difference between positive and negative ions at the lower levels of the atmosphere. As new ions are produced, others cease to exist, thereby maintaining a certain ionic balance. Any disturbance of ion balance can have direct consequence for living organisms. For example, a disturbance in ion balance can cause a significant change in the optical properties of plants that manifest physiologically as a change in photosynthesis activity (Jovanic and Jovanic, 2001). Not only can plants be affected by air ions, they can also produce various air ions, including negative air ions (NAI) under normal conditions (Nemeryuk, 1970). These NAIs are predominantly generated by leaf tips (Tikhonov et al., 2004). Thus, along with temperature, pressure, air humidity, illumination (sunlight) and concentration of minerals, the ion structure of the air is an important element of a plant’s environmental microclimate.The generation of air ions both by plants and soil is known to occur under natural conditions, for example, after a long-term collection of air condensate around the plant, the following ions were identified in the samples: Ca2+, Na+, Mg2+, K+, HCO3+, SO4+ and Cl- (Nemeryuk, 1970). The rate of NAI generation was very low and short-lived superoxide anion radicals were not detected. Under natural conditions, the level of NAI generated by plants and soil was too low to be detected by the counter.
Tikhonov et al. have shown that by electrical stimulation through soil, plants generate substantial amounts of NAI, including superoxide anion radicals (Tikhonov et al., 2004).Comparisons among five plant varieties showed that at maximum light intensity (101,900 lx), NAI concentration was 1964 ion/cm3 (12:30), 2251 ion/cm3 at 101,000 lx (11:30), and 2018 ion/cm3 at 100,300 lx (13:00), from the data it was concluded that under strong light intensity (101,900 lx), Aloe’s ability to generate NAI was still preserved.
Ions are charged particles in the air that are formed in nature when enough energy acts upon a molecule such as carbon dioxide, oxygen, water, or nitrogen to eject an electron from the molecule leaving a positively charged ion. The displaced electron attaches itself to a nearby molecule, which then becomes a negatively charged ion. It is the negative ion oxygen that affects us the most. Better air improves your health, energy, and mood. A roomful of negative ions can make you feel magically refreshed. Negative ions may be vitamins of the air positive ions, on the other hand, can lead to human distress-aching joints, wheezing, crankiness, apathy, fatigue, depression and moroseness. A barrage of positive ions prompts murder and suicide.
Jagadesan and Subramanian
Indian Journal Of Natural Sciences www.tnsroindia.org. © IJONS
Vol.5 / Issue 28/ February 2015 International Bimonthly ISSN: 0976 – 0997
2650
METHODOLGY Plan of work Plants and trees release air ions. The air ions concentration varies fromone form of leaftree to the other form of leaf tree with respect to light intensity of day and night. Air ions are both positive and negative.Air ions are measured using air ion counter at Pudukkottai.We measured air ions concentration in the following importance trees, i)Azadirachta indica, ii)Delonix regia, iii)Kigelia africana, iv)Tamarindus indica, v)Terminalia arjuna, vi)Tectona grandis, vii)Pongamia glabra, viii)Citrus hystrix, ix) Polyalthia longifolia, x) Cocos nucifera, xi)Prosopis julifera, xii) Ficus religiosa, xiii) Ficus bengalensis, xiv) Artocarpus heterophylla, xv) Bambyx malaberica, xvi) Mangifera indica, xvii) Borassus flabellifer and xviii) Eucalyptus obliqua.The trees have various types of leaves. The leaves release CO2 and O2 during photosynthesis.
Nature of Respiration
C6H12O6 + 6O2 → 6CO2 + 6H2O + 678 K cal.
Respiration might be defined simply as the cellular oxidation of foods with the release of energy. Sugars are most generally the starting point, water and carbon di oxide are commonly the end products.
C6H12O6 → 2C2H5OH + 2CO2
Green plant photosynthesis
4H2O 4(OH) + 4H
4H + CO2 → CH2O +H2O
4(OH) → 2H2O + O2
CO2 + 4H2O CH2O + 3H2O +O2
Azadirachta indica
We measured air ions daily at regular intervals from 00:00 to 24:00 hours and took average from August to November 2012 (Figure.1). The positive air ion count, at the stroke of 00:00 hour, a count of 166.8 x 10³ ions/cm3, Then at 04:00 hour, a count of 173.4 x 10³ ions/cm3, followed by 169.7 x 10³ ions/cm3 at 06:00 hour, 168.8 x 10³ ions/cm3 at 9:00 hour, 168.1 x 10³ ions/cm3 at 12:00 hour, 164.8 x 10³ ions/cm3 at 16:00 hour, 171.0 x 10³ ions/cm3 at 21:00 hour have been recorded.Similarly, in the case of negative ions at the stroke of 00:00 hours, a count of 173.4x 10³ ions/cm3 was observed. Then at 04:00 hour, a count of 171.1 x 10³ ions/cm3, followed by 162.9 x 10³ ions/cm3 at 06:00 hour, 160.3 x10³ ions/cm3 at 9:00 hour, 168.2 x 10³ ions/cm3 at 12:00 hour, 160.9 x 10³ ions/cm3 at 16:00 hour, 167.4 x 10³ ions/cm3 at 21:00 hour have been recorded.
Jagadesan and Subramanian
Indian Journal Of Natural Sciences www.tnsroindia.org. © IJONS
Vol.5 / Issue 28/ February 2015 International Bimonthly ISSN: 0976 – 0997
2651
Delonix regia The positive air ion count (Figure.2), at the stroke of 00:00 hour, a count of 160.2 x 10³ ions/cm3, Then at 04:00 hour, a count of 157.6 x 10³ ions/cm3, followed by 168.1 x 10³ ions/cm3 at 06:00 hour, 168.2 x 10³ ions/cm3 at 9:00 hour, 168.0 x 10³ ions/cm3 at 12:00 hour, 170.5 x 10³ ions/cm3 at 16:00 hour, 172.5 x 10³ ions/cm3 at 21:00 hour have been observed.Similarly, in the case of negative ions at the stroke of 00:00 hours, a count of 151.6 x 10³ ions/cm3was observed. Then at 04:00 hour, a count of 158.1 x 10³ ions/cm3, followed by 167.7 x 10³ ions/cm3 at 06:00 hour, 162.3 x10³ ions/cm3 at 9:00 hour, 174.5 x 10³ ions/cm3 at 12:00 hour, 168.3 x 10³ ions/cm3 at 16:00 hour, 167.6 x 10³ ions/cm3 at 21:00 hour have been observed. Kigelia africana
The positive air ion count (Figure.3), at the stroke of 00:00 hour, a count of 172.2 x 10³ ions/cm3, Then at 04:00 hour, a count of 168.5 x 10³ ions/cm3, followed by 165.9 x 10³ ions/cm3 at 06:00 hour, 169.5 x 10³ ions/cm3 at 9:00 hour, 171 x 103 ions/cm3 at 12:00 hour, 173.2 x 10³ ions/cm3 at 16:00 hour, 164.7 x 10³ ions/cm3 at 21:00 hour have been observed.Similarly, in the case of negative ions at the stroke of 00:00 hours, a count of 162.1 x 10³ ions/cm3 was observed. Then at 04:00 hour, a count of 168.7 x 10³ ions/cm3, followed by 166.9 x 10³ ions/cm3 at 06:00 hour, 165 x103 ions/cm3 at 9:00 hour, 170.4 x 10³ ions/cm3 at 12:00 hour, 171.2 x 10³ ions/cm3 at 16:00 hour, 170.5 x 10³ ions/cm3 at 21:00 hour have been observed.
Tamarindus indica
Here the number of air ions counted using air ion counter (both positive and negative) (Figure.4). The positive air ion count, at the stroke of 00:00 hour, a count of 169.6 x 10³ ions/cm3, Then at 04:00 hour, a count of 166.1 x 10³ ions/cm3, followed by 163.4 x 10³ ions/cm3 at 06:00 hour, 172.1 x 10³ ions/cm3 at 9:00 hour, 173.1 x 10³ ions/cm3 at 12:00 hour, 176.1 x 10³ ions/cm3 at 16:00 hour, 154.7 x 10³ ions/cm3 at 21:00 hour have been observed. Similarly, in the case of negative ions at the stroke of 00:00 hours, a count of 165.6 x 10³ ions/cm3 was observed. Then at 04:00 hour, a count of 169.8 x 10³ ions/cm3, followed by 168.7 x 10³ ions/cm3 at 06:00 hour, 168.2 x10³ ions/cm3 at 9:00 hour, 162.8 x 10³ ions/cm3 at 12:00 hour, 161.5 x 10³ ions/cm3 at 16:00 hour, 163.7 x 10³ ions/cm3 at 21:00 hour have been observed.
Terminalia arjuna
Air ions concentrations are counted (Figure.5). The positive air ion count, at the stroke of 00:00 hour, a count of 181.1 x 10³ ions/cm3, Then at 04:00 hour, a count of 162.1 x 10³ ions/cm3, followed by 163.9 x 10³ ions/cm3 at 06:00 hour, 172 x 103 ions/cm3 at 9:00 hour, 174.4 x 10³ ions/cm3 at 12:00 hour, 171.4 x 10³ ions/cm3 at 16:00 hour, 166.2 x 10³ ions/cm3 at 21:00 hour have been observed. Similarly, in the case of negative ions at the stroke of 00:00 hours, a count of 166.5 x 10³ ions/cm3 was observed. Then at 04:00 hour, a count of 165.9 x 10³ ions/cm3, followed by 169 x 103 ions/cm3 at 06:00 hour, 163.1 x10³ ions/cm3 at 9:00 hour, 152.7 x 10³ ions/cm3 at 12:00 hour, 163.2 x 10³ ions/cm3 at 16:00 hour, 168.7 x 10³ ions/cm3 at 21:00 hour have been observed.
Tectona grandis
From 00:00 hour to 24:00 hours, daily reading were taken and the monthly average was calculated (Figure.6). The positive air ions of 00:00 hour, a count of 158.8 x 10³ ions/cm3, Then at 04:00 hour, a count of 167.5 x 10³ ions/cm3, followed by 170.0 x 10³ ions/cm3 at 06:00 hour, 167.9 x 10³ ions/cm3 at 9:00 hour, 167.6 x 10³ ions/cm3 at 12:00 hour, 167.7 x 10³ ions/cm3 at 16:00 hour, 163 x 103 ions/cm3 at 21:00 hour have been observed.Similarly, in the case of negative ions at the stroke of 00:00 hours, a count of 167.0 x 10³ ions/cm3 was observed. Then at 04:00 hour, a count of
Jagadesan and Subramanian
Indian Journal Of Natural Sciences www.tnsroindia.org. © IJONS
Vol.5 / Issue 28/ February 2015 International Bimonthly ISSN: 0976 – 0997
2652
165.8 x 10³ ions/cm3, followed by 169 x 103 ions/cm3 at 06:00 hour, 161.8 x10³ ions/cm3 at 9:00 hour, 175.2 x 10³ ions/cm3 at 12:00 hour, 174.9 x 10³ ions/cm3 at 16:00 hour, 172.5 x 10³ ions/cm3 at 21:00 hour have been observed.
Pongamia glabra
From 00:00 hour to 24:00 hours, time readings were taken and the monthly average was calculated (Figure.7) on the same day at regular intervals. Average positive ions readings of 00:00 hour, a count of 172.2 x 10³ ions/cm3, Then at 04:00 hour, a count of 161.5 x 10³ ions/cm3, followed by 170.5 x 10³ ions/cm3 at 06:00 hour, 170.2 x 10³ ions/cm3 at 9:00 hour, 164.4 x 10³ ions/cm3 at 12:00 hour, 166.1 x 10³ ions/cm3 at 16:00 hour, 171.3 x 10³ ions/cm3 at 21:00 hour have been observed.Similarly, in the case of negative ions at the stroke of 00:00 hours, a count of 155.4 x 10³ ions/cm3 was observed. Then at 04:00 hour, a count of 174.6 x 10³ ions/cm3, followed by 167.2 x 10³ ions/cm3 at 06:00 hour, 167 x103 ions/cm3 at 9:00 hour, 168.8 x 10³ ions/cm3 at 12:00 hour, 165.4 x 10³ ions/cm3 at 16:00 hour, 174.9 x 10³ ions/cm3 at 21:00 hour have been observed.
Polyalthia longifolia
The positive air ion count, at the stroke of 00:00 hour (Figure.8), a count of 170.3 x 10³ ions/cm3, Then at 04:00 hour, a count of 165.8 x 10³ ions/cm3, followed by 151 x 103 ions/cm3 at 06:00 hour, 150.9 x 10³ ions/cm3 at 9:00 hour, 149 x 103 ions/cm3 at 12:00 hour, 163.7 x 10³ ions/cm3 at 16:00 hour, 174.7 x 10³ ions/cm3 at 21:00 hour have been observed.Similarly, in the case of negative ions at the stroke of 00:00 hours, a count of 166.7 x 10³ ions/cm3 was observed. Then at 04:00 hour, a count of 154.9 x 10³ ions/cm3, followed by 156.5 x 10³ ions/cm3 at 06:00 hour, 153.3 x10³ ions/cm3 at 9:00 hour, 166.2 x 10³ ions/cm3 at 12:00 hour, 171.1 x 10³ ions/cm3 at 16:00 hour, 172.7 x 10³ ions/cm3 at 21:00 hour have been observed.
Cocos nucifera
The positive air ion count (Figure.9), at the stroke of 00:00 hour, a count of 169.9 x 10³ ions/cm3, Then at 04:00 hour, a count of 166.0 x 10³ ions/cm3, followed by 168.0 x 10³ ions/cm3 at 06:00 hour, 178.2 x 10³ ions/cm3 at 9:00 hour, 175.2 x 10³ ions/cm3 at 12:00 hour, 175.5 x 10³ ions/cm3 at 16:00 hour, 173.0 x 10³ ions/cm3 at 21:00 hour have been observed.Similarly, in the case of negative ions at the stroke of 00:00 hours, a count of 169.7 x 10³ ions/cm3 was observed. Then at 04:00 hour, a count of 170.7 x 10³ ions/cm3, followed by 169.1 x 10³ ions/cm3 at 06:00 hour, 162.1 x10³ ions/cm3 at 9:00 hour, 169.8 x 10³ ions/cm3 at 12:00 hour, 171.2 x 10³ ions/cm3 at 16:00 hour, 165.5 x 10³ ions/cm3 at 21:00 hour have been observed.
Prosopis julifera
From 00:00 hour to 24:00 hours, time readings were taken and the monthly average was calculated (Figure.10). The positive air ions of 00:00 hour, a count of 178.1 x 10³ ions/cm3, Then at 04:00 hour, a count of 176.7 x 10³ ions/cm3, followed by 172.7 x 10³ ions/cm3 at 06:00 hour, 169.4 x 10³ ions/cm3 at 9:00 hour, 162.7 x 10³ ions/cm3 at 12:00 hour, 167.2 x 10³ ions/cm3 at 16:00 hour, 170.6 x 10³ ions/cm3 at 21:00 hour have been observed. Similarly, in the case of negative ions at the stroke of 00:00 hours, a count of 175.8 x 10³ ions/cm3 was observed. Then at 04:00 hour, a count of 180.1 x 10³ ions/cm3, followed by 170.6 x 10³ ions/cm3 at 06:00 hour, 179.9 x10³ ions/cm3 at 9:00 hour, 171.1 x 10³ ions/cm3 at 12:00 hour, 173.9 x 10³ ions/cm3 at 16:00 hour, 168.4 x 10³ ions/cm3 at 21:00 hour have been observed.
Jagadesan and Subramanian
Indian Journal Of Natural Sciences www.tnsroindia.org. © IJONS
Vol.5 / Issue 28/ February 2015 International Bimonthly ISSN: 0976 – 0997
2653
Ficus religiosa
The positive air ion count (Figure.11), at the stroke of 00:00 hour, a count of 181.0 x 10³ ions/cm3, Then at 04:00 hour, a count of 180.1 x 10³ ions/cm3, followed by 155.9 x 10³ ions/cm3 at 06:00 hour, 173.4 x 10³ ions/cm3 at 9:00 hour, 175.7 x 10³ ions/cm3 at 12:00 hour, 157.7 x 10³ ions/cm3 at 16:00 hour, 180.7 x 10³ ions/cm3 at 21:00 hour have been recorded.
Similarly, in the case of negative ions at the stroke of 00:00 hours, a count of 160.6 x 10³ ions/cm3 was observed. Then at 04:00 hour, a count of 184.8 x 10³ ions/cm3, followed by 171.6 x 10³ ions/cm3 at 06:00 hour, 170.4 x10³ ions/cm3 at 9:00 hour, 166.7 x 10³ ions/cm3 at 12:00 hour, 169.3 x 10³ ions/cm3 at 16:00 hour, 171.5 x 10³ ions/cm3 at 21:00 hour have been recorded.
Ficus bengalensis
The positive air ion count (Figure.12), at the stroke of 00:00 hour, a count of 148.9 x 10³ ions/cm3, Then at 04:00 hour, a count of 181.9 x 10³ ions/cm3, followed by 161.5 x 10³ ions/cm3 at 06:00 hour, 156.8 x 10³ ions/cm3 at 9:00 hour, 172.1 x 10³ ions/cm3 at 12:00 hour, 173.0 x 10³ ions/cm3 at 16:00 hour, 158.4 x 10³ ions/cm3 at 21:00 hour have been observed.Similarly, in the case of negative ions at the stroke of 00:00 hours, a count of 177.7 x 10³ ions/cm3was observed. Then at 04:00 hour, a count of 181.1 x 10³ ions/cm3, followed by 167.7 x 10³ ions/cm3 at 06:00 hour, 165.8 x10³ ions/cm3 at 9:00 hour, 177.9 x 10³ ions/cm3 at 12:00 hour, 183.2 x 10³ ions/cm3 at 16:00 hour, 165.6 x 10³ ions/cm3 at 21:00 hour have been observed.
Artocarpus heterophylla
The positive air ion count (Figure.13), at the stroke of 00:00 hour, a count of 171.7 x 10³ ions/cm3, Then at 04:00 hour, a count of 157.8 x 10³ ions/cm3, followed by 155.5 x 10³ ions/cm3 at 06:00 hour, 160.9 x 10³ ions/cm3 at 9:00 hour, 161.0 x 10³ ions/cm3 at 12:00 hour, 179.0 x 10³ ions/cm3 at 16:00 hour, 178.1 x 10³ ions/cm3 at 21:00 hour have been observed.Similarly, in the case of negative ions at the stroke of 00:00 hours, a count of 190.9 x 10³ ions/cm3 was observed. Then at 04:00 hour, a count of 171.3 x 10³ ions/cm3, followed by 179.0 x 10³ ions/cm3 at 06:00 hour, 183.8 x10³ ions/cm3 at 9:00 hour, 175.5 x 10³ ions/cm3 at 12:00 hour, 180.7 x 10³ ions/cm3 at 16:00 hour, 172.6 x 10³ ions/cm3 at 21:00 hour have been observed.
Bambyx malaberica
Here the number of air ions counted using air ion counter (both positive and negative) (Figure.14). The positive air ion count, at the stroke of 00:00 hour, a count of 160.6 x 10³ ions/cm3, Then at 04:00 hour, a count of 158.9 x 10³ ions/cm3, followed by 159.9 x 10³ ions/cm3 at 06:00 hour, 171.1 x 10³ ions/cm3 at 9:00 hour, 158.8 x 10³ ions/cm3 at 12:00 hour,179.2 x 103 ions/cm3 at 16:00 hour, 156.6 x 10³ ions/cm3 at 21:00 hour have been observed.Similarly, in the case of negative ions at the stroke of 00:00 hours, a count of 167.2 x 10³ ions/cm3 was observed. Then at 04:00 hour, a count of 180.2 x 10³ ions/cm3, followed by 161.6 x 10³ ions/cm3 at 06:00 hour, 152.6 x10³ ions/cm3 at 9:00 hour, 173.4 x 10³ ions/cm3 at 12:00 hour, 156.3 x 10³ ions/cm3 at 16:00 hour, 174.7 x 10³ ions/cm3 at 21:00 hour have been observed.
Mangifera indica
The positive air ion count, at the stroke of 00:00 hour (Figure.15), a count of 157.5 x 10³ ions/cm3, Then at 04:00 hour, a count of 178.9 x 10³ ions/cm3, followed by 166.1 x 10³ ions/cm3 at 06:00 hour, 167.0 x 10³ ions/cm3 at 9:00 hour, 172.0 x 10³ ions/cm3 at 12:00 hour, 166.6 x 10³ ions/cm3 at 16:00 hour, 158.2 x 10³ ions/cm3 at 21:00 hour have been observed.Similarly, in the case of negative ions at the stroke of 00:00 hours, a count of 160.7 x 10³ ions/cm3 was
Jagadesan and Subramanian
Indian Journal Of Natural Sciences www.tnsroindia.org. © IJONS
Vol.5 / Issue 28/ February 2015 International Bimonthly ISSN: 0976 – 0997
2654
observed. Then at 04:00 hour, a count of 163.9 x 10³ ions/cm3, followed by 182.3 x 10³ ions/cm3 at 06:00 hour, 171.9 x10³ ions/cm3 at 9:00 hour, 146.8 x 10³ ions/cm3 at 12:00 hour, 186.4 x 10³ ions/cm3 at 16:00 hour, 158.2 x 10³ ions/cm3 at 21:00 hour have been observed.
Citrus hystrix
From 00:00 hours, time readings were taken and the monthly average was calculated (Figure.16). The positive air ions of 00:00 hour, a count of 172.6 x 10³ ions/cm3, Then at 04:00 hour, a count of 167.1 x 10³ ions/cm3, followed by 161.7 x 10³ ions/cm3 at 06:00 hour, 171.5 x 10³ ions/cm3 at 9:00 hour, 178.4 x 10³ ions/cm3 at 12:00 hour, 155.1 x 10³ ions/cm3 at 16:00 hour, 179.8 x 10³ ions/cm3 at 21:00 hour have been observed.Similarly, in the case of negative ions at the stroke of 00:00 hours, a count of 167.8 x 10³ ions/cm3 was observed. Then at 04:00 hour, a count of 152.1 x 10³ ions/cm3, followed by 182.3 x 10³ ions/cm3 at 06:00 hour, 180.6 x10³ ions/cm3 at 9:00 hour, 169.6 x 10³ ions/cm3 at 12:00 hour, 160.6 x 10³ ions/cm3 at 16:00 hour, 151.7 x 10³ ions/cm3 at 21:00 hour have been observed.
Borassus flabellifer
From 00:00 hour to 24:00 hours, time readings were taken and the monthly average was calculated (Figure.17) on the same day at regular intervals. Average positive ions readings of 00:00 hour, a count of 157.5 x 10³ ions/cm3, Then at 04:00 hour, a count of 156.7 x 10³ ions/cm3, followed by 165.2 x 10³ ions/cm3 at 06:00 hour, 159.8 x 10³ ions/cm3 at 9:00 hour, 165.1 x 10³ ions/cm3 at 12:00 hour, 171.1 x 10³ ions/cm3 at 16:00 hour, 168.5 x 10³ ions/cm3 at 21:00 hour have been observed.Similarly, in the case of negative ions at the stroke of 00:00 hours, a count of 157.6 x 10³ ions/cm3 was observed. Then at 04:00 hour, a count of 149.9 x 10³ ions/cm3, followed by 168.0 x 10³ ions/cm3 at 06:00 hour, 154.4 x10³ ions/cm3 at 9:00 hour, 151.3 x 10³ ions/cm3 at 12:00 hour, 159.9 x 10³ ions/cm3 at 16:00 hour, 175.3 x 10³ ions/cm3 at 21:00 hour have been observed.
Eucalyptus obliqua
The positive air ion count (Figure.18), at the stroke of 00:00 hour, a count of 162.5 x 10³ ions/cm3, Then at 04:00 hour, a count of 152.5 x 10³ ions/cm3, followed by 159.8 x 10³ ions/cm3 at 06:00 hour, 150.3 x 10³ ions/cm3 at 9:00 hour, 192.5 x 10³ ions/cm3 at 12:00 hour,185.2 x 103 ions/cm3 at 16:00 hour, 160.1 x 10³ ions/cm3 at 21:00 hour have been observed. Similarly, in the case of negative ions at the stroke of 00:00 hours, a count of 170.0 x 10³ ions/cm3 was observed. Then at 04:00 hour, a count of 154.8 x 10³ ions/cm3, followed by 173.2 x 10³ ions/cm3 at 06:00 hour, 166.1 x10³ ions/cm3 at 9:00 hour, 173.3 x 10³ ions/cm3 at 12:00 hour, 170.8 x 10³ ions/cm3 at 16:00 hour, 162.3 x 10³ ions/cm3 at 21:00 hour have been observed.
Positive and Negative air ions
At 12:00:00 a.m positive air ions are highly concentrated in the following trees; Ficus religiosa, Azadirachta indica, Citrus hystrix, Kigelia Africana, Terminalia arjuna, Pongamia glabra and Prosopis julifera. Negative air ions are highly concentrated in Ficus bengalensis, Artocarpus heterophylla, Azadirachta indica and Prosopis julifera, At 4:00:00 a.m positive air ions are highly concentrated in Ficus religiosa, Ficus bengalensis, Mangifera indica, Azadirachta indica and Prosopis julifera. Negative air ions are highly concentrated in Ficus religiosa, Ficus bengalensis, Artocarpus heterophylla, Bambyx malaberica, Azadirachta indica, Pongamia glabra, Prosopis julifera and Citrus hystrix,
At 6:00:00 a.m positive air ions are highly concentrated in Terminalia arjuna and Prosopis julifera. Negative air ions are highly concentration in Ficus religiosa, Artocarpus heterophylla, Mangifera indica and Prosopis julifera.9:00:00 a.m positive air ions are highly concentrated in Ficus religiosa, Bambyx malaberica, Citrus hystrix, Terminalia arjuna and Citrus hystrix. Negative air ions are highly concentrated in Ficus religiosa, Artocarpus heterophylla , Mangifera indica and Citrus hystrix.
Jagadesan and Subramanian
Indian Journal Of Natural Sciences www.tnsroindia.org. © IJONS
Vol.5 / Issue 28/ February 2015 International Bimonthly ISSN: 0976 – 0997
2655
12:00:00 p.m positive air ions are highly concentrated in Ficus religiosa, Ficus bengalensis, Mangifera indica, Citrus hystrix, Eucalyptus oblique, Kigelia Africana, Tamarindus indica, Terminalia arjuna and Cocos nucifera. Negative air ions are highly concentrated in Ficus bengalensis, Artocarpus heterophylla, Bambyx malaberica, Eucalyptus oblique, Delonix regia and Tectona grandis. 16:00:00 p.m positive air ions are highly concentrated in Ficus bengalensis, Artocarpus heterophylla, Bambyx malaberica, Eucalyptus oblique, Cocos nucifera and Borassus flabellifer. Negative air ions are highly concentrated in Ficus bengalensis, Artocarpus heterophylla, Mangifera indica, Tectona grandis, Cocos nucifera, Prosopis julifera and Polyalthia longifolia.21:00:00 p.m positive air ions are highly concentrated in Ficus religiosa, Artocarpus heterophylla, Citrus hystrix, Delonix regia, Pongamia glabra, Polyalthia longifolia, Prosopis julifera and Cocos nucifera. Negative air ions are highly concentrated in Ficus religiosa, , Artocarpus heterophylla, Prosopis julifera, Bambyx malaberica, Tectona grandis, Pongamia glabra and Polyalthia longifolia.
DISCUSSION The study shows the distribution of air ions among different trees of Pudukkottai District. Using Arc Origin.6, the spatial distribution of the positive air ions and negative air ions from Azadirachta indica and Tectona grandis air ions concentration was analyzed separately. It was observed that the positive air ions increased during morning time whereas during evening and night time negative air ions were found in Tamarindus indica. In Delonix regia, air ions concentration is in huge amount increasing night. In kigelia Africana, air ions concentration is increased tremendously. During early morning time negative air ions is high and during the rest of the time, positive air ions are at a higher level. The Positive air ions are in high level except early morning at Tamarindus indica and Terminalia arjuna. Negative air ions concentration is in a very high range at all times in Polyalthia longifolia.
CONCLUSION A high concentration of positive air ions are released in the trees given in descending order as Artocarpus heterophylla, Prosopis julifera, Ficus bengalensis, Ficus religiosa, Tectona grandis, Pongamia glabra, kilegia Africana, Cocos nucifera, Mangifera indica, Eucalyptus oblique, Bombax malabaricum, Citrus hystrix, Delonix regia, Tamarindus indica , Azardirachta indica, Polyalthia longifolia, Terminalia arjuna and Borassus flabellifer.A highly concentration of negative air ions are released in the trees given in descending order as Artocarpus heterophylla, Prosopis julifera, Ficus bengalensis, Ficus religiosa, Tectona grandis, Cocos nucifera, kilegia Africana, Pongamia glabra, Eucalyptus oblique, Mangifera indica, Bombax malabaricum, Citrus hystrix, Azardirachta indica, Tamarindus indica , Delonix regia, Terminalia arjuna, Polyalthia longifolia and Borassus flabellifer. In a positive electrostatic environment, the amount of positive ions (cations) in the air is so high that the positive ions in our body also increase. As a result, our body will fail to undergo metabolism, and thus our cells become weak and we will be easily affected by illness and the aging process will accelerate. As you can see in our current modern lifestyle, our body is exposed to positive ions generated by cell phones, ultraviolet rays, acid rain, chemicals, electronic equipments and computers. The air positive ions, on the other hand, can lead to human distress---aching joints, wheezing, crankiness, apathy, fatigue, depression and moroseness. A barrage of positive ions prompts murder and suicide.Ions are charged particles in the air that are formed in nature when enough energy acts upon a molecule such as carbon dioxide, oxygen, water, or nitrogen to eject an electron from the molecule leaving a positively charged ion. The displaced electron attaches itself to a nearby molecule, which then becomes a negatively charged ion. It is the negative ion oxygen that affects us the most. Better air improves your health, energy, and mood. A roomful of negative ions can make you feel magically refreshed. Negative ions may be vitamins. Negative air ions can eliminate some cancer causing substances by producing antioxidants in humans, according to scientists.
Jagadesan and Subramanian
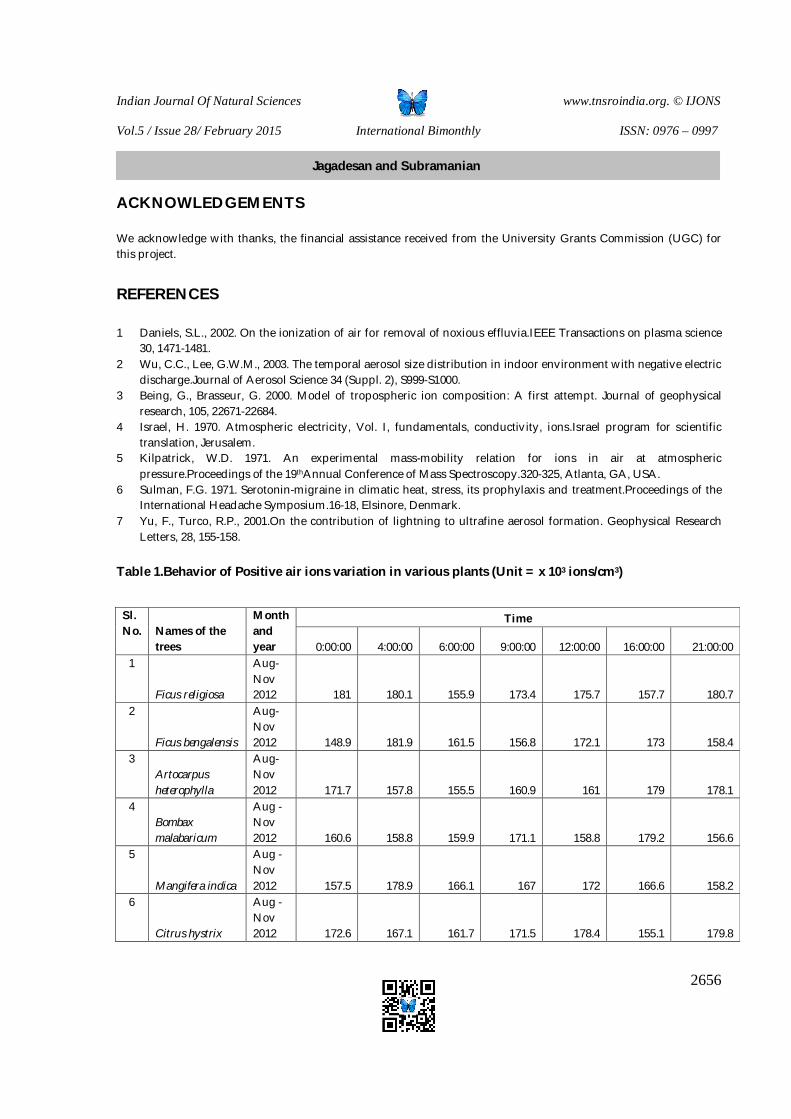
Indian Journal Of Natural Sciences www.tnsroindia.org. © IJONS
Vol.5 / Issue 28/ February 2015 International Bimonthly ISSN: 0976 – 0997
2656
ACKNOWLEDGEMENTS We acknowledge with thanks, the financial assistance received from the University Grants Commission (UGC) for this project.
REFERENCES 1 Daniels, S.L., 2002. On the ionization of air for removal of noxious effluvia.IEEE Transactions on plasma science
30, 1471-1481. 2 Wu, C.C., Lee, G.W.M., 2003. The temporal aerosol size distribution in indoor environment with negative electric
discharge.Journal of Aerosol Science 34 (Suppl. 2), S999-S1000. 3 Being, G., Brasseur, G. 2000. Model of tropospheric ion composition: A first attempt. Journal of geophysical
research, 105, 22671-22684. 4 Israel, H. 1970. Atmospheric electricity, Vol. I, fundamentals, conductivity, ions.Israel program for scientific
translation, Jerusalem. 5 Kilpatrick, W.D. 1971. An experimental mass-mobility relation for ions in air at atmospheric
pressure.Proceedings of the 19thAnnual Conference of Mass Spectroscopy.320-325, Atlanta, GA, USA. 6 Sulman, F.G. 1971. Serotonin-migraine in climatic heat, stress, its prophylaxis and treatment.Proceedings of the
International Headache Symposium.16-18, Elsinore, Denmark. 7 Yu, F., Turco, R.P., 2001.On the contribution of lightning to ultrafine aerosol formation. Geophysical Research
Letters, 28, 155-158.
Table 1.Behavior of Positive air ions variation in various plants (Unit = x 103 ions/cm3)
Sl. No.
Names of the trees
Month and year
Time
0:00:00 4:00:00 6:00:00 9:00:00 12:00:00 16:00:00 21:00:00 1
Ficus religiosa
Aug- Nov 2012 181 180.1 155.9 173.4 175.7 157.7 180.7
2
Ficus bengalensis
Aug- Nov 2012 148.9 181.9 161.5 156.8 172.1 173 158.4
3 Artocarpus heterophylla
Aug- Nov 2012 171.7 157.8 155.5 160.9 161 179 178.1
4 Bombax malabaricum
Aug - Nov 2012 160.6 158.8 159.9 171.1 158.8 179.2 156.6
5
Mangifera indica
Aug - Nov 2012 157.5 178.9 166.1 167 172 166.6 158.2
6
Citrus hystrix
Aug - Nov 2012 172.6 167.1 161.7 171.5 178.4 155.1 179.8
Jagadesan and Subramanian
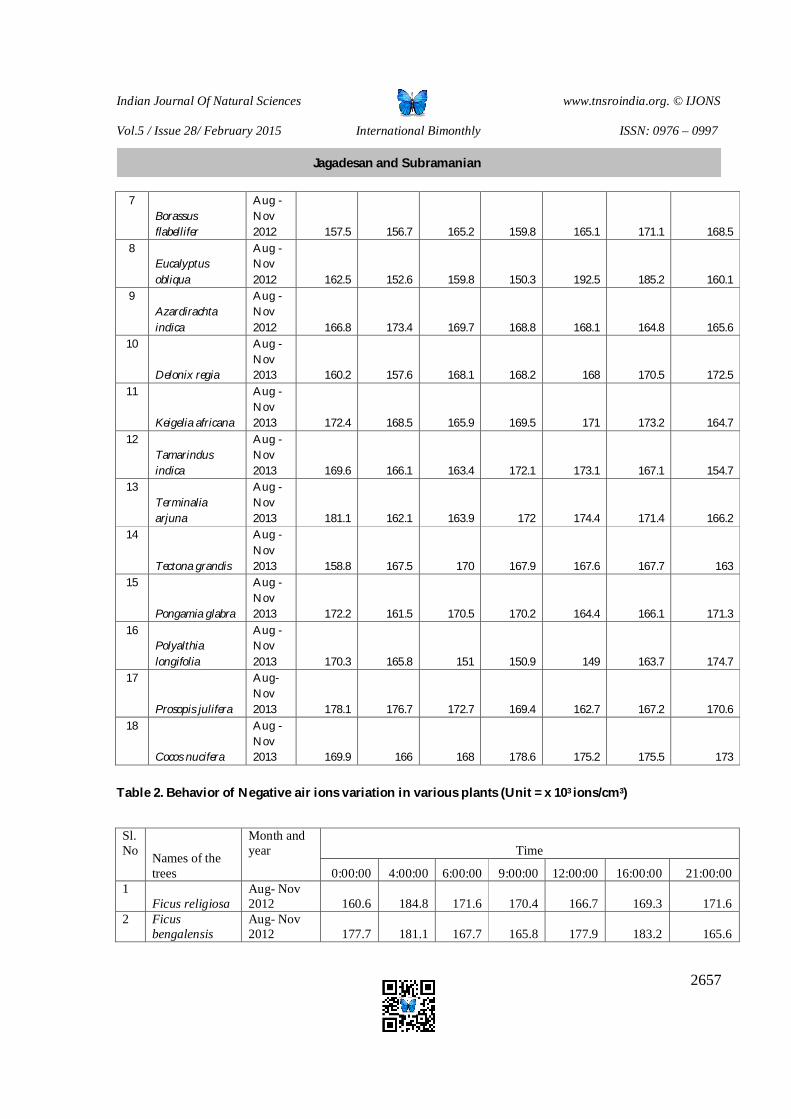
Indian Journal Of Natural Sciences www.tnsroindia.org. © IJONS
Vol.5 / Issue 28/ February 2015 International Bimonthly ISSN: 0976 – 0997
2657
7 Borassus flabellifer
Aug - Nov 2012 157.5 156.7 165.2 159.8 165.1 171.1 168.5
8 Eucalyptus obliqua
Aug - Nov 2012 162.5 152.6 159.8 150.3 192.5 185.2 160.1
9 Azardirachta indica
Aug - Nov 2012 166.8 173.4 169.7 168.8 168.1 164.8 165.6
10
Delonix regia
Aug - Nov 2013 160.2 157.6 168.1 168.2 168 170.5 172.5
11
Keigelia africana
Aug - Nov 2013 172.4 168.5 165.9 169.5 171 173.2 164.7
12 Tamarindus indica
Aug - Nov 2013 169.6 166.1 163.4 172.1 173.1 167.1 154.7
13 Terminalia arjuna
Aug - Nov 2013 181.1 162.1 163.9 172 174.4 171.4 166.2
14
Tectona grandis
Aug - Nov 2013 158.8 167.5 170 167.9 167.6 167.7 163
15
Pongamia glabra
Aug - Nov 2013 172.2 161.5 170.5 170.2 164.4 166.1 171.3
16 Polyalthia longifolia
Aug - Nov 2013 170.3 165.8 151 150.9 149 163.7 174.7
17
Prosopis julifera
Aug- Nov 2013 178.1 176.7 172.7 169.4 162.7 167.2 170.6
18
Cocos nucifera
Aug - Nov 2013 169.9 166 168 178.6 175.2 175.5 173
Table 2. Behavior of Negative air ions variation in various plants (Unit = x 103 ions/cm3)
Sl. No Names of the
trees
Month and year Time
0:00:00 4:00:00 6:00:00 9:00:00 12:00:00 16:00:00 21:00:00 1
Ficus religiosa Aug- Nov 2012 160.6 184.8 171.6 170.4 166.7 169.3 171.6
2 Ficus bengalensis
Aug- Nov 2012 177.7 181.1 167.7 165.8 177.9 183.2 165.6
Jagadesan and Subramanian
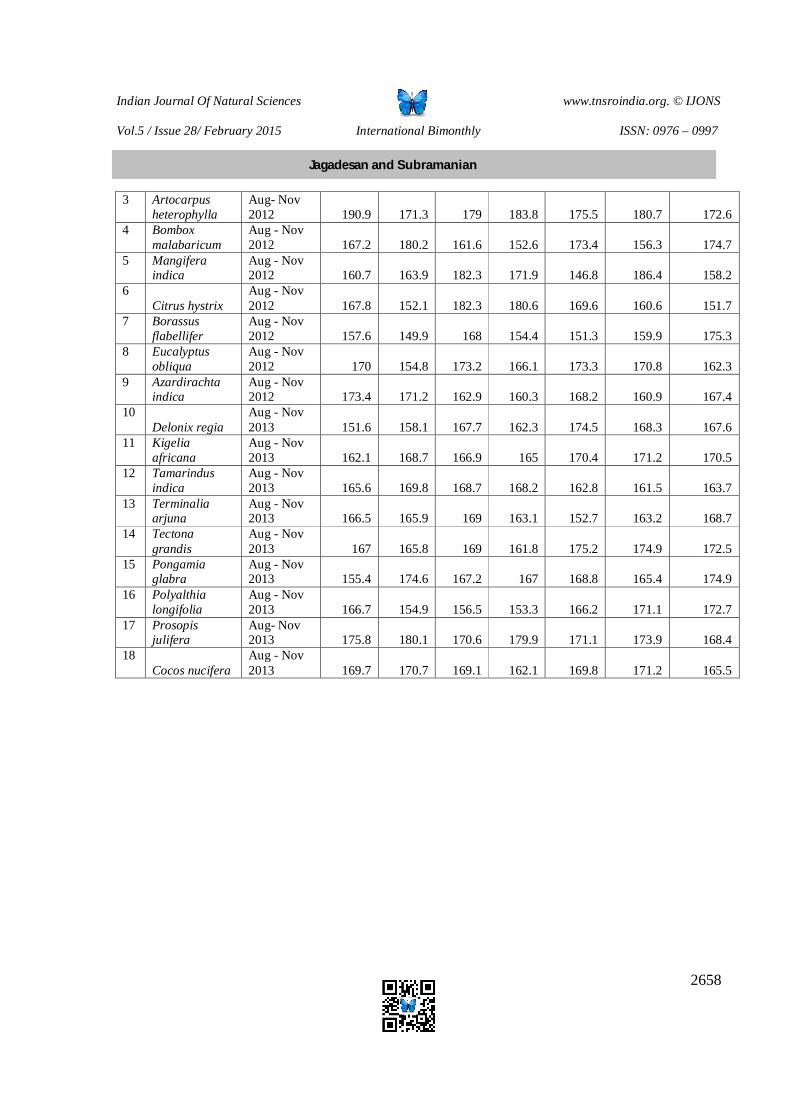
Indian Journal Of Natural Sciences www.tnsroindia.org. © IJONS
Vol.5 / Issue 28/ February 2015 International Bimonthly ISSN: 0976 – 0997
2658
3 Artocarpus heterophylla
Aug- Nov 2012 190.9 171.3 179 183.8 175.5 180.7 172.6
4 Bombox malabaricum
Aug - Nov 2012 167.2 180.2 161.6 152.6 173.4 156.3 174.7
5 Mangifera indica
Aug - Nov 2012 160.7 163.9 182.3 171.9 146.8 186.4 158.2
6 Citrus hystrix
Aug - Nov 2012 167.8 152.1 182.3 180.6 169.6 160.6 151.7
7 Borassus flabellifer
Aug - Nov 2012 157.6 149.9 168 154.4 151.3 159.9 175.3
8 Eucalyptus obliqua
Aug - Nov 2012 170 154.8 173.2 166.1 173.3 170.8 162.3
9 Azardirachta indica
Aug - Nov 2012 173.4 171.2 162.9 160.3 168.2 160.9 167.4
10 Delonix regia
Aug - Nov 2013 151.6 158.1 167.7 162.3 174.5 168.3 167.6
11 Kigelia africana
Aug - Nov 2013 162.1 168.7 166.9 165 170.4 171.2 170.5
12 Tamarindus indica
Aug - Nov 2013 165.6 169.8 168.7 168.2 162.8 161.5 163.7
13 Terminalia arjuna
Aug - Nov 2013 166.5 165.9 169 163.1 152.7 163.2 168.7
14 Tectona grandis
Aug - Nov 2013 167 165.8 169 161.8 175.2 174.9 172.5
15 Pongamia glabra
Aug - Nov 2013 155.4 174.6 167.2 167 168.8 165.4 174.9
16 Polyalthia longifolia
Aug - Nov 2013 166.7 154.9 156.5 153.3 166.2 171.1 172.7
17 Prosopis julifera
Aug- Nov 2013 175.8 180.1 170.6 179.9 171.1 173.9 168.4
18 Cocos nucifera
Aug - Nov 2013 169.7 170.7 169.1 162.1 169.8 171.2 165.5
Jagadesan and Subramanian
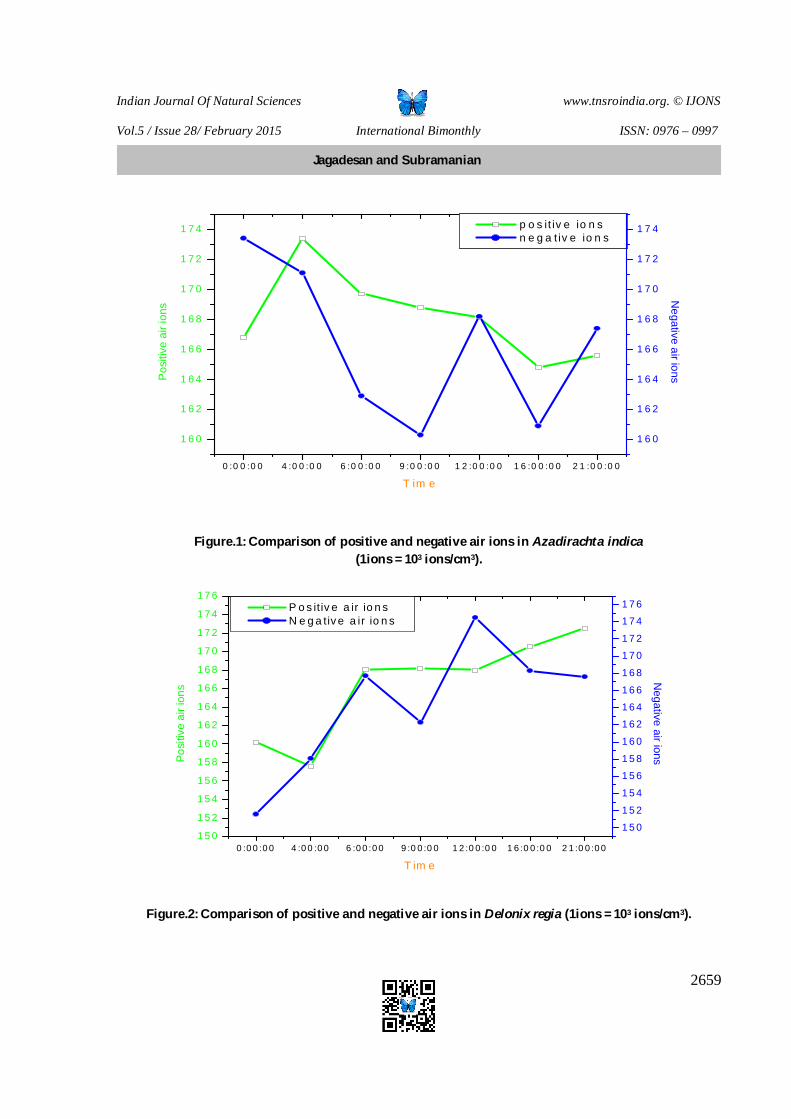
Indian Journal Of Natural Sciences www.tnsroindia.org. © IJONS
Vol.5 / Issue 28/ February 2015 International Bimonthly ISSN: 0976 – 0997
2659
0 :0 0 :0 0 4 :0 0 :0 0 6 :0 0 :0 0 9 :0 0 :0 0 1 2 :0 0 :0 0 1 6 :0 0 :0 0 2 1 :0 0 :0 0
1 6 0
1 6 2
1 6 4
1 6 6
1 6 8
1 7 0
1 7 2
1 7 4 p o s it iv e io n s n e g a t iv e io n s
T im e
Pos
itive
air
ions
1 6 0
1 6 2
1 6 4
1 6 6
1 6 8
1 7 0
1 7 2
1 7 4
Negative air ions
Figure.1: Comparison of positive and negative air ions in Azadirachta indica (1ions = 103 ions/cm3).
0 :0 0 :0 0 4 :0 0 :0 0 6 :0 0 :0 0 9 :0 0 :0 0 1 2 :0 0 :0 0 1 6 :0 0 :0 0 2 1 :0 0 :0 01 5 0
1 5 2
1 5 4
1 5 6
1 5 8
1 6 0
1 6 2
1 6 4
1 6 6
1 6 8
1 7 0
1 7 2
1 7 4
1 7 6 P o s it iv e a ir io n s N e g a tiv e a ir io n s
T im e
Posi
tive
air i
ons
1 5 0
1 5 2
1 5 4
1 5 6
1 5 8
1 6 0
1 6 2
1 6 4
1 6 6
1 6 8
1 7 0
1 7 2
1 7 4
1 7 6
Negative air ions
Figure.2: Comparison of positive and negative air ions in Delonix regia (1ions = 103 ions/cm3).
Jagadesan and Subramanian
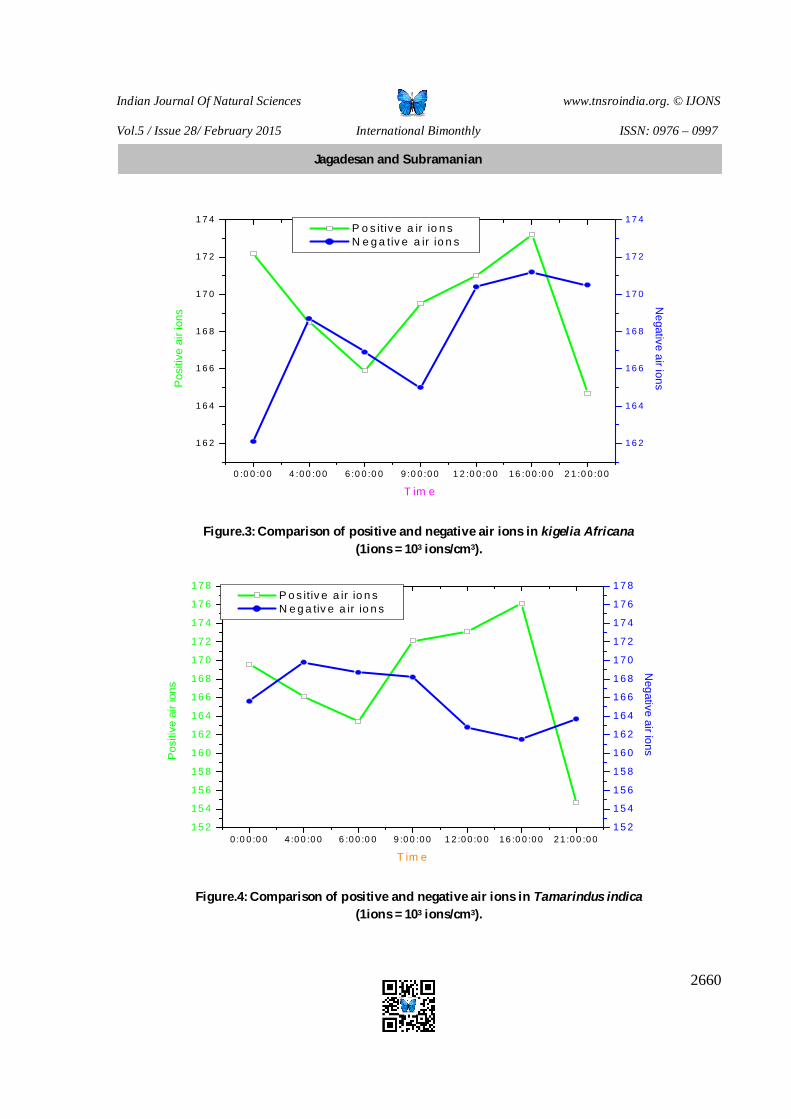
Indian Journal Of Natural Sciences www.tnsroindia.org. © IJONS
Vol.5 / Issue 28/ February 2015 International Bimonthly ISSN: 0976 – 0997
2660
0 :0 0 :0 0 4 :0 0 :0 0 6 :0 0 :0 0 9 :0 0 :0 0 1 2 :0 0 :0 0 1 6 :0 0 :0 0 2 1 :0 0 :0 0
1 6 2
1 6 4
1 6 6
1 6 8
1 7 0
1 7 2
1 7 4 P o s itiv e a ir io n s N e g a tiv e a ir io n s
T im e
Pos
itive
air
ions
1 6 2
1 6 4
1 6 6
1 6 8
1 7 0
1 7 2
1 7 4
Negative air ions
Figure.3: Comparison of positive and negative air ions in kigelia Africana
(1ions = 103 ions/cm3).
0 :0 0 :0 0 4 :0 0 :0 0 6 :0 0 :0 0 9 :0 0 :0 0 1 2 :0 0 :0 0 1 6 :0 0 :0 0 2 1 :0 0 :0 015 2
15 4
15 6
15 8
16 0
16 2
16 4
16 6
16 8
17 0
17 2
17 4
17 6
17 8 P o s itiv e a ir io n s N e g a tiv e a ir io n s
T im e
Pos
itive
air
ions
1 5 2
1 5 4
1 5 6
1 5 8
1 6 0
1 6 2
1 6 4
1 6 6
1 6 8
1 7 0
1 7 2
1 7 4
1 7 6
1 7 8
Negative air ions
Figure.4: Comparison of positive and negative air ions in Tamarindus indica
(1ions = 103 ions/cm3).
Jagadesan and Subramanian
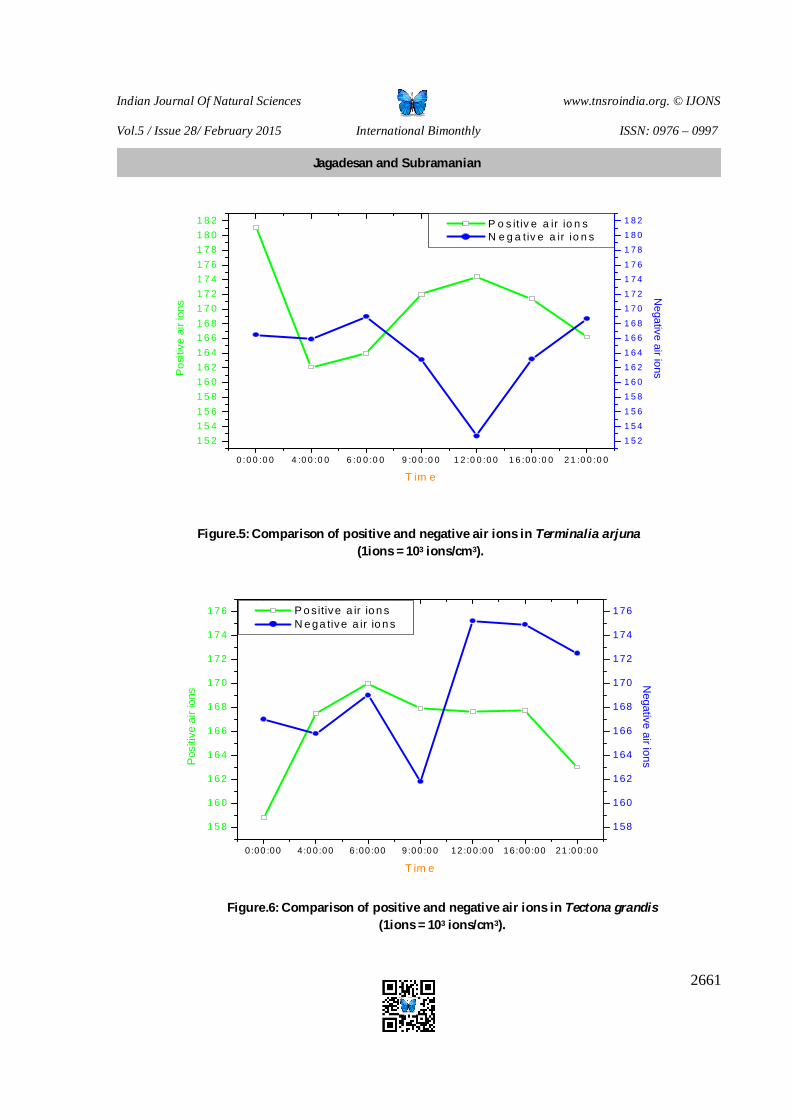
Indian Journal Of Natural Sciences www.tnsroindia.org. © IJONS
Vol.5 / Issue 28/ February 2015 International Bimonthly ISSN: 0976 – 0997
2661
0 :0 0 :0 0 4 :0 0 :0 0 6 :0 0 :0 0 9 :0 0 :0 0 1 2 :0 0 :0 0 1 6 :0 0 :0 0 2 1 :0 0 :0 0
1 5 21 5 41 5 61 5 81 6 01 6 21 6 41 6 61 6 81 7 01 7 21 7 41 7 61 7 81 8 01 8 2 P o s it iv e a ir io n s
N e g a tiv e a ir io n s
T im e
Pos
itive
air
ions
1 5 21 5 41 5 6
1 5 81 6 01 6 21 6 4
1 6 61 6 8
1 7 01 7 21 7 41 7 6
1 7 81 8 01 8 2
Negative air ions
Figure.5: Comparison of positive and negative air ions in Terminalia arjuna (1ions = 103 ions/cm3).
0:00 :00 4:0 0 :00 6:00 :00 9:00 :0 0 12 :0 0 :0 0 16:00 :00 21 :0 0 :0 0
158
160
162
164
166
168
170
172
174
176 P o sitive a ir io n s N e ga tive a ir io n s
T im e
Pos
itive
air
ions
158
160
162
164
166
168
170
172
174
176
Negative air ions
Figure.6: Comparison of positive and negative air ions in Tectona grandis
(1ions = 103 ions/cm3).
Jagadesan and Subramanian
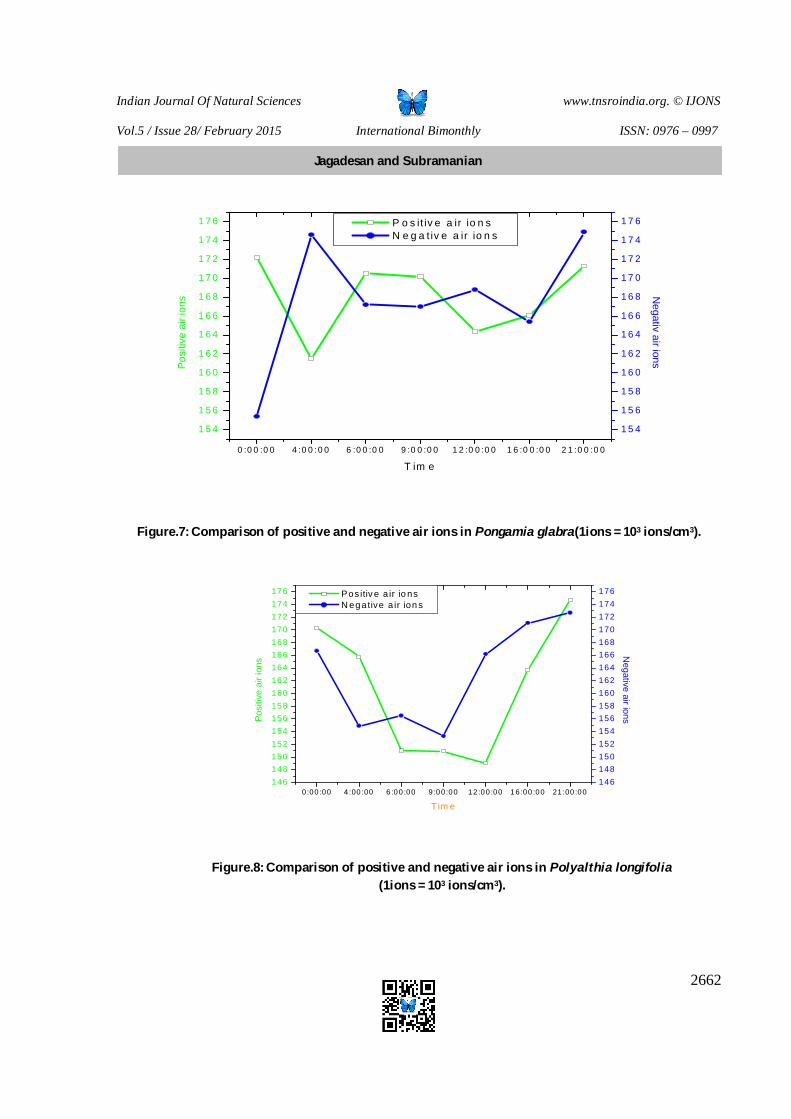
Indian Journal Of Natural Sciences www.tnsroindia.org. © IJONS
Vol.5 / Issue 28/ February 2015 International Bimonthly ISSN: 0976 – 0997
2662
0 :0 0 :0 0 4 :0 0 :0 0 6 :0 0 :0 0 9 :0 0 :0 0 1 2 :0 0 :0 0 1 6 :0 0 :0 0 2 1 :0 0 :0 0
1 5 4
1 5 6
1 5 8
1 6 0
1 6 2
1 6 4
1 6 6
1 6 8
1 7 0
1 7 2
1 7 4
1 7 6 P o s it iv e a ir io n s N e g a t iv e a ir io n s
T im e
Posi
tive
air i
ons
1 5 4
1 5 6
1 5 8
1 6 0
1 6 2
1 6 4
1 6 6
1 6 8
1 7 0
1 7 2
1 7 4
1 7 6
Negativ air ions
Figure.7: Comparison of positive and negative air ions in Pongamia glabra(1ions = 103 ions/cm3).
0:00 :00 4 :00 :00 6 :00 :00 9 :00 :00 12 :00 :00 16 :00 :00 21 :00 :00146148150152154156158160162164166168170172174176 Pos itiv e a ir io ns
N egative a ir ion s
T im e
Posi
tive
air i
ons
146148150152154156158160162164166168170172174176
Negative air ions
Figure.8: Comparison of positive and negative air ions in Polyalthia longifolia (1ions = 103 ions/cm3).
Jagadesan and Subramanian
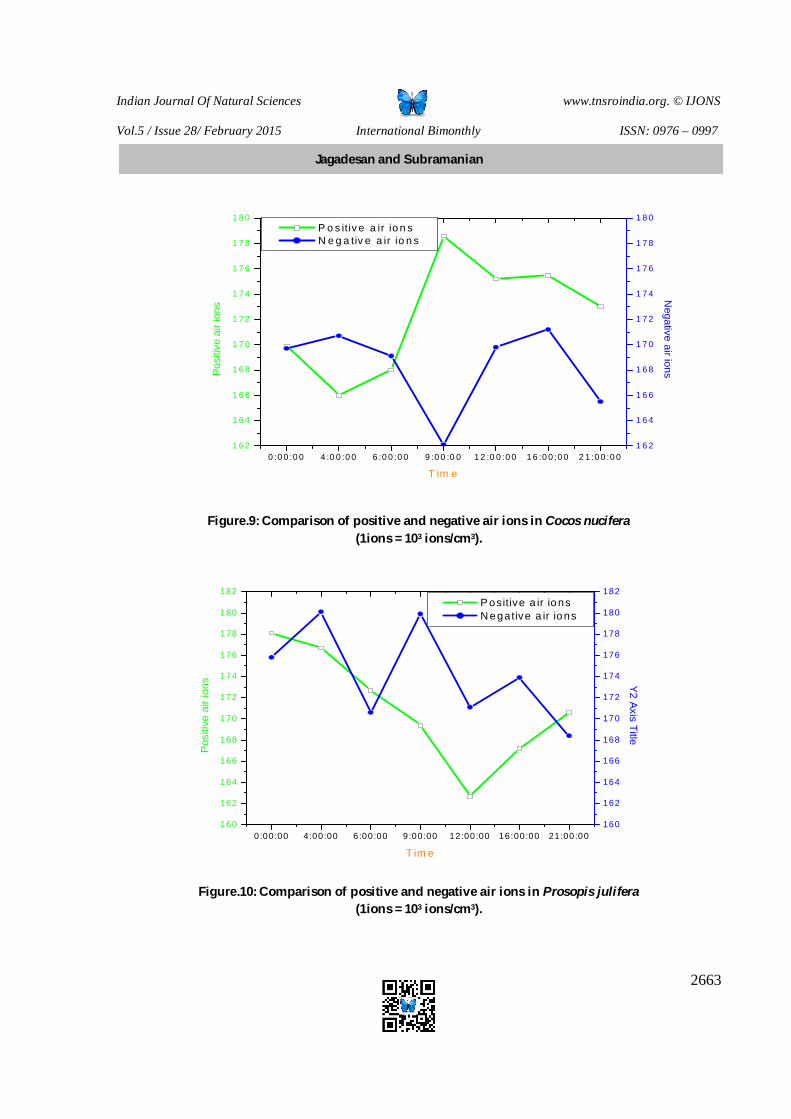
Indian Journal Of Natural Sciences www.tnsroindia.org. © IJONS
Vol.5 / Issue 28/ February 2015 International Bimonthly ISSN: 0976 – 0997
2663
0 :0 0 :0 0 4 :0 0 :0 0 6 :0 0 :0 0 9 :0 0 :0 0 1 2 :0 0 :0 0 1 6 :0 0 :0 0 2 1 :0 0 :0 01 6 2
1 6 4
1 6 6
1 6 8
1 7 0
1 7 2
1 7 4
1 7 6
1 7 8
1 8 0 P o s itiv e a ir io n s N e g a tiv e a ir io n s
T im e
Posi
tive
air i
ons
1 6 2
1 6 4
1 6 6
1 6 8
1 7 0
1 7 2
1 7 4
1 7 6
1 7 8
1 8 0
Negative air ions
Figure.9: Comparison of positive and negative air ions in Cocos nucifera
(1ions = 103 ions/cm3).
0:00:00 4:00:00 6:00:00 9:00:00 12:00:00 16:00:00 21:00:00160
162
164
166
168
170
172
174
176
178
180
182 P ositive a ir ions N egative a ir ions
T im e
Pos
itive
air
ions
160
162
164
166
168
170
172
174
176
178
180
182
Y2 Axis Title
Figure.10: Comparison of positive and negative air ions in Prosopis julifera
(1ions = 103 ions/cm3).
Jagadesan and Subramanian
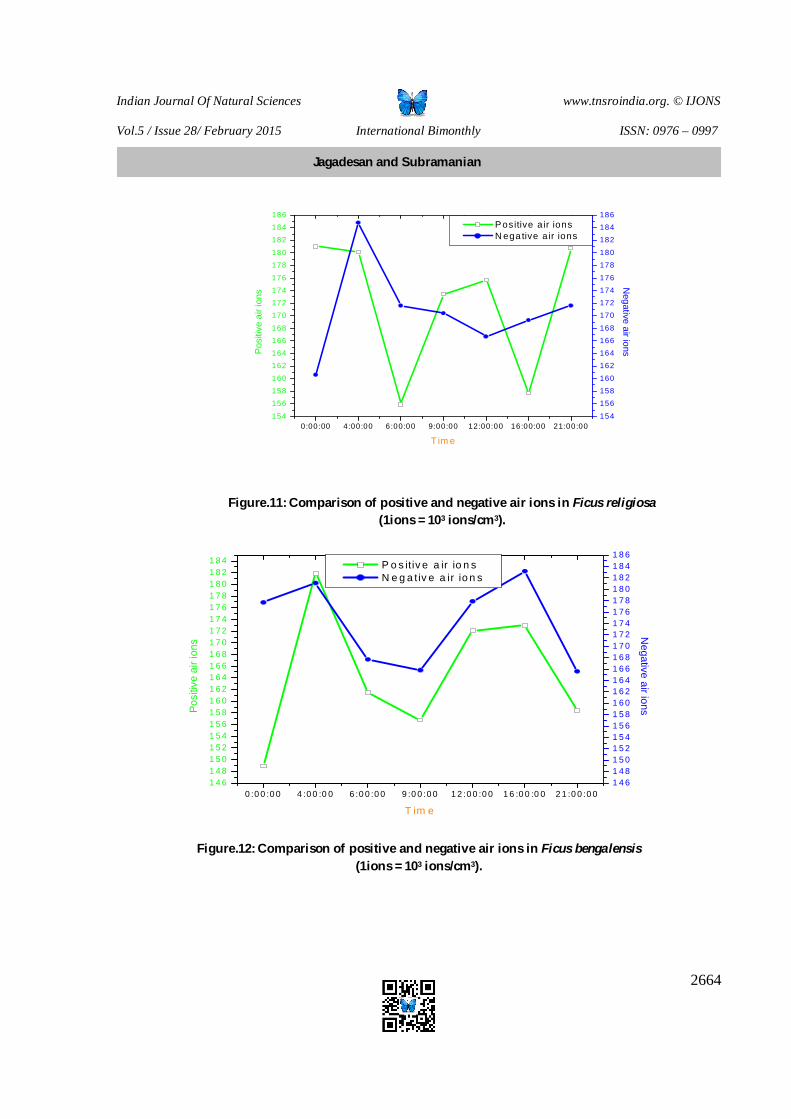
Indian Journal Of Natural Sciences www.tnsroindia.org. © IJONS
Vol.5 / Issue 28/ February 2015 International Bimonthly ISSN: 0976 – 0997
2664
0:00:00 4:00:00 6:00:00 9:00:00 12:00:00 16:00:00 21:00:00154
156158160
162164166168
170172174176
178180
182184186
Positive a ir ions N ega tive a ir ions
T im e
Posi
tive
air i
ons
154
156158160
162164166168
170172174176
178180
182184186
Negative air ions
Figure.11: Comparison of positive and negative air ions in Ficus religiosa (1ions = 103 ions/cm3).
0 :0 0 :0 0 4 :0 0 :0 0 6 :0 0 :0 0 9 :0 0 :0 0 1 2 :0 0 :0 0 1 6 :0 0 :0 0 2 1 :0 0 :0 01 4 61 4 81 5 01 5 21 5 41 5 61 5 81 6 01 6 21 6 41 6 61 6 81 7 01 7 21 7 41 7 61 7 81 8 01 8 21 8 4 P o s itiv e a ir io n s
N e g a t iv e a ir io n s
T im e
Posi
tive
air i
ons
1 4 61 4 81 5 01 5 21 5 41 5 61 5 81 6 01 6 21 6 41 6 61 6 81 7 01 7 21 7 41 7 61 7 81 8 01 8 21 8 41 8 6
Negative air ions
Figure.12: Comparison of positive and negative air ions in Ficus bengalensis
(1ions = 103 ions/cm3).
Jagadesan and Subramanian
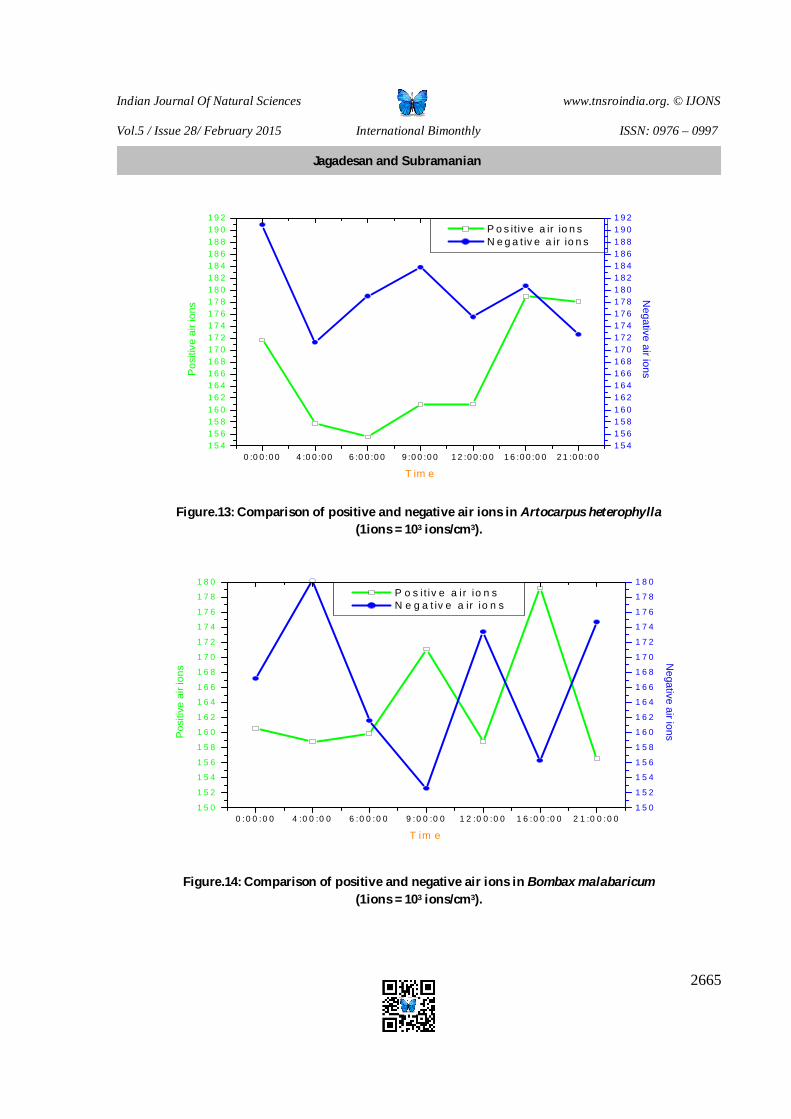
Indian Journal Of Natural Sciences www.tnsroindia.org. © IJONS
Vol.5 / Issue 28/ February 2015 International Bimonthly ISSN: 0976 – 0997
2665
0 :0 0 :0 0 4 :0 0 :0 0 6 :0 0 :0 0 9 :0 0 :0 0 1 2 :0 0 :0 0 1 6 :0 0 :0 0 2 1 :0 0 :0 01 5 41 5 61 5 81 6 01 6 21 6 41 6 61 6 81 7 01 7 21 7 41 7 61 7 81 8 01 8 21 8 41 8 61 8 81 9 01 9 2
P o s itiv e a ir io n s N e g a t iv e a ir io n s
T im e
Posi
tive
air i
ons
1 5 41 5 61 5 81 6 01 6 21 6 41 6 61 6 81 7 01 7 21 7 41 7 61 7 81 8 01 8 21 8 41 8 61 8 81 9 01 9 2
Negative air ions
Figure.13: Comparison of positive and negative air ions in Artocarpus heterophylla
(1ions = 103 ions/cm3).
0 :0 0 :0 0 4 :0 0 :0 0 6 :0 0 :0 0 9 :0 0 :0 0 1 2 :0 0 :0 0 1 6 :0 0 :0 0 2 1 :0 0 :0 01 5 0
1 5 2
1 5 4
1 5 6
1 5 8
1 6 0
1 6 2
1 6 4
1 6 6
1 6 8
1 7 0
1 7 2
1 7 4
1 7 6
1 7 8
1 8 0 P o s i t iv e a i r io n s N e g a t iv e a ir io n s
T im e
Pos
itive
air
ions
1 5 0
1 5 2
1 5 4
1 5 6
1 5 8
1 6 0
1 6 2
1 6 4
1 6 6
1 6 8
1 7 0
1 7 2
1 7 4
1 7 6
1 7 8
1 8 0
Negative air ions
Figure.14: Comparison of positive and negative air ions in Bombax malabaricum
(1ions = 103 ions/cm3).
Jagadesan and Subramanian
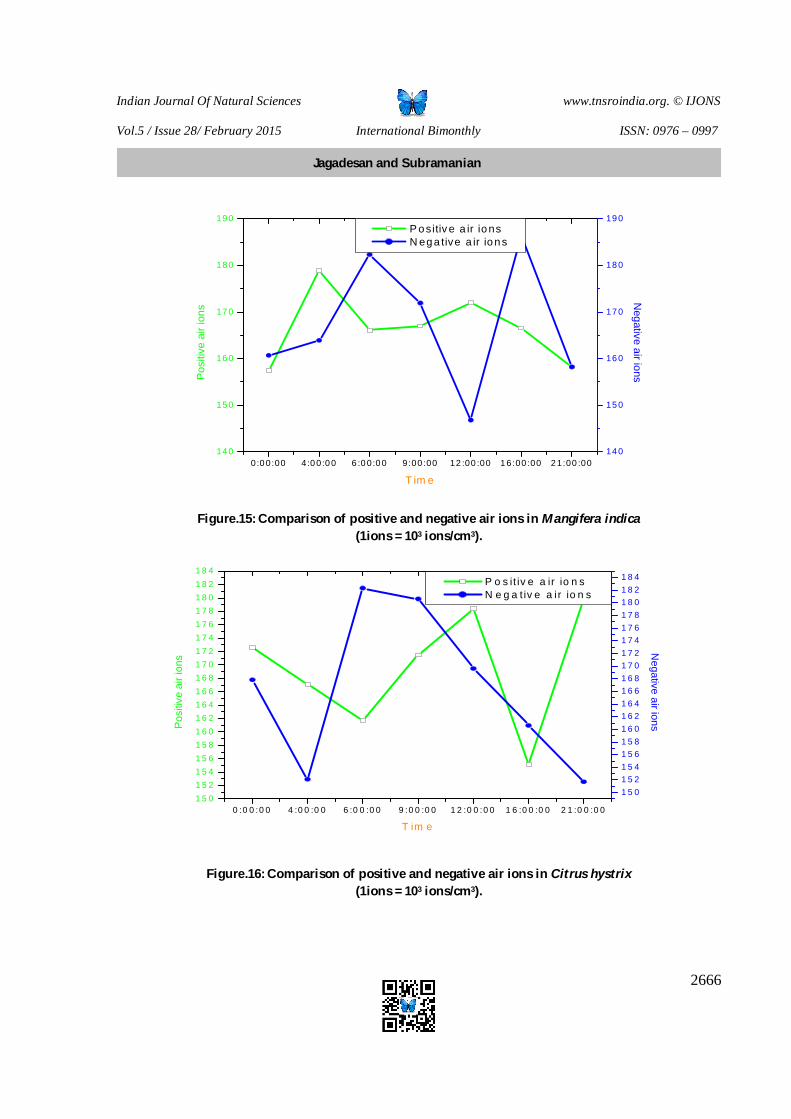
Indian Journal Of Natural Sciences www.tnsroindia.org. © IJONS
Vol.5 / Issue 28/ February 2015 International Bimonthly ISSN: 0976 – 0997
2666
0:0 0:00 4:0 0:0 0 6 :0 0:0 0 9:00 :00 12 :00 :00 1 6:00 :00 2 1:00 :0014 0
15 0
16 0
17 0
18 0
19 0 P ositiv e a ir ions N ega tive a ir ions
T im e
Pos
itive
air
ions
14 0
15 0
16 0
17 0
18 0
19 0
Negative air ions
Figure.15: Comparison of positive and negative air ions in Mangifera indica
(1ions = 103 ions/cm3).
0 :0 0 :0 0 4 :0 0 :0 0 6 :0 0 :0 0 9 :0 0 :0 0 1 2 :0 0 :0 0 1 6 :0 0 :0 0 2 1 :0 0 :0 01 5 01 5 21 5 41 5 61 5 81 6 01 6 21 6 41 6 61 6 81 7 01 7 21 7 41 7 61 7 81 8 01 8 21 8 4
P o s it iv e a ir io n s N e g a t iv e a i r io n s
T im e
Posi
tive
air i
ons
1 5 01 5 21 5 41 5 61 5 81 6 01 6 21 6 41 6 61 6 81 7 01 7 21 7 41 7 61 7 81 8 01 8 21 8 4
Negative air ions
Figure.16: Comparison of positive and negative air ions in Citrus hystrix
(1ions = 103 ions/cm3).
Jagadesan and Subramanian
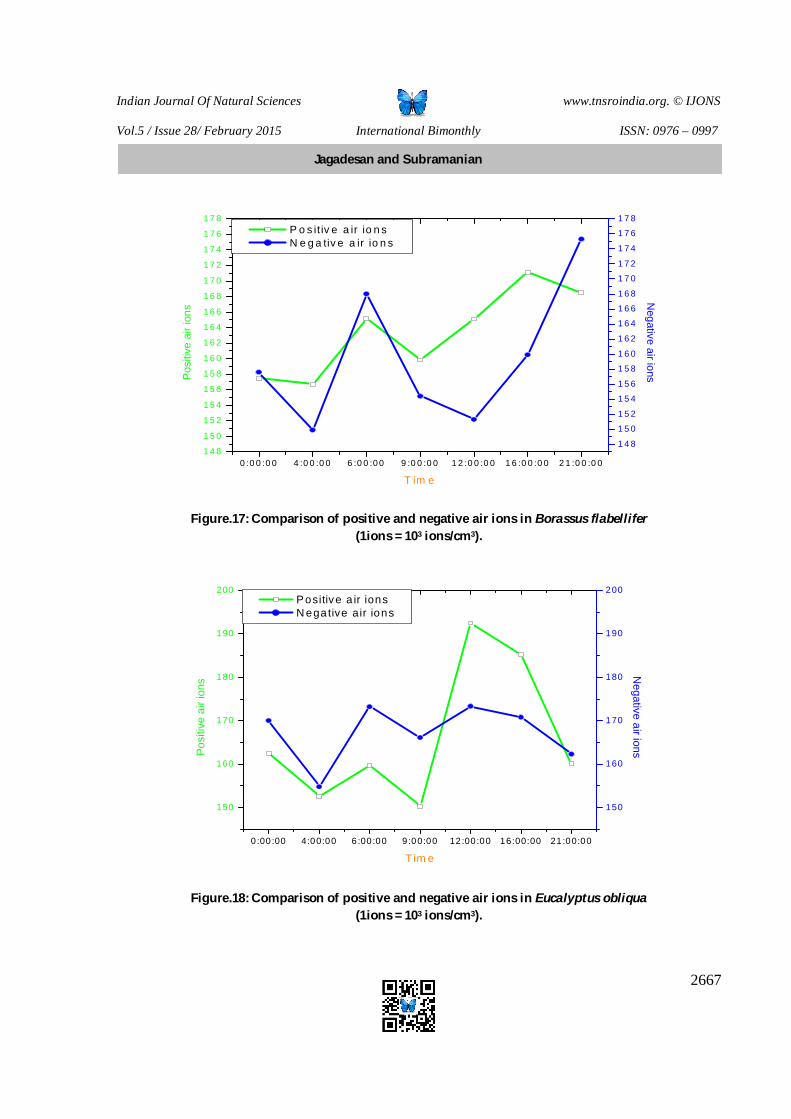
Indian Journal Of Natural Sciences www.tnsroindia.org. © IJONS
Vol.5 / Issue 28/ February 2015 International Bimonthly ISSN: 0976 – 0997
2667
0 :0 0 :0 0 4 :0 0 :0 0 6 :0 0 :0 0 9 :0 0 :0 0 1 2 :0 0 :0 0 1 6 :0 0 :0 0 2 1 :0 0 :0 01 4 8
1 5 0
1 5 2
1 5 4
1 5 6
1 5 8
1 6 0
1 6 2
1 6 4
1 6 6
1 6 8
1 7 0
1 7 2
1 7 4
1 7 6
1 7 8 P o s it iv e a ir io n s N e g a tiv e a ir io n s
T im e
Pos
itive
air
ions
1 4 8
1 5 0
1 5 2
1 5 4
1 5 6
1 5 8
1 6 0
1 6 2
1 6 4
1 6 6
1 6 8
1 7 0
1 7 2
1 7 4
1 7 6
1 7 8
Negative air ions
Figure.17: Comparison of positive and negative air ions in Borassus flabellifer
(1ions = 103 ions/cm3).
Figure.18: Comparison of positive and negative air ions in Eucalyptus obliqua (1ions = 103 ions/cm3).
0:00 :00 4:00:00 6 :00 :00 9 :00:00 12 :00 :00 16:00:00 21 :00:00
150
160
170
180
190
200 Positive a ir ions N egative air ions
Tim e
Posi
tive
air i
ons
150
160
170
180
190
200
Negative air ions
Jagadesan and Subramanian
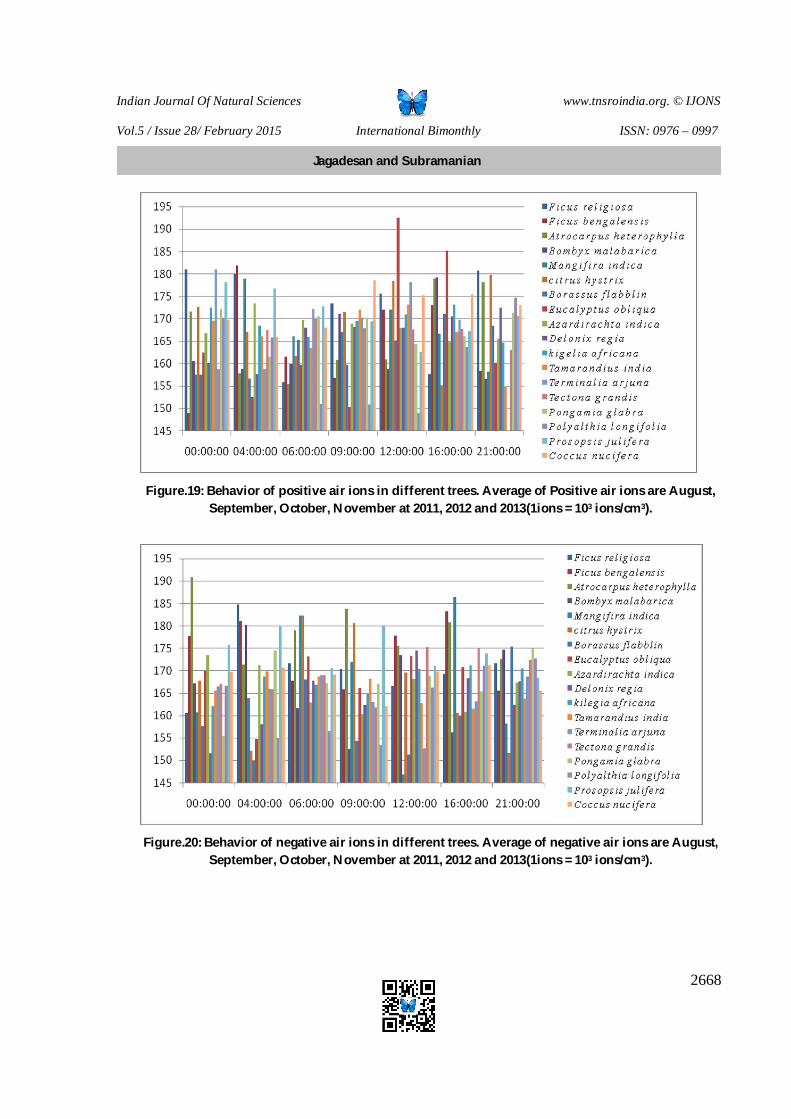
Indian Journal Of Natural Sciences www.tnsroindia.org. © IJONS
Vol.5 / Issue 28/ February 2015 International Bimonthly ISSN: 0976 – 0997
2668
Figure.19: Behavior of positive air ions in different trees. Average of Positive air ions are August,
September, October, November at 2011, 2012 and 2013(1ions = 103 ions/cm3).
Figure.20: Behavior of negative air ions in different trees. Average of negative air ions are August,
September, October, November at 2011, 2012 and 2013(1ions = 103 ions/cm3).
Jagadesan and Subramanian
Indian Journal Of Natural Sciences www.tnsroindia.org. © IJONS
Vol.5 / Issue 28/ February 2015 International Bimonthly ISSN: 0976 – 0997
2669
Studies on Some Productive Traits of Graded Murrah and Non descript Buffaloes in TamilNadu,India. Balusami.C Department of Livestock Production Management, College of Veterinary Science and Animal Science, Pookode,Wayanad District-673 576, Kerala, India. Received: 10 Dec 2014 Revised: 21 Dec 2014 Accepted: 30 Jan 2014 *Address for correspondence Balusami.C Assistant Professor, Department of Livestock Production Management, College of Veterinary Science and Animal Science, Pookode, Wayanad District-673 576, Kerala, India. E.mail: [email protected],Mobile : 09446510821
This is an Open Access Journal / article distributed under the terms of the Creative Commons Attribution License (CC BY-NC-ND 3.0) which permits unrestricted use, distribution, and reproduction in any medium, provided the original work is properly cited. All rights reserved. A study was undertaken to assess the productive performance of buffaloes maintained by the landless, small, marginal and large farmersin Northeast zone of Tamil Nadu. A total of 250 murrah graded and non-descript buffaloes were randomly selected for the study. The least squares average total lactation milk yield and total lactation length of Murrah graded buffaloes were estimated as 1140+13.87 kg and 327.56+0.85 days while the corresponding values in non-descript buffaloes were found to be 555.89+10 kg and 294.44+89 days, respectively. The production performance of Murrah grades was significantly (P≤0.01) superior than non-descript buffaloes and the performance of the animals maintained by land-owning farmers was better than the animals of landless dairy farmers. It was also noted that there was location variation in their performance. It was concluded from this study that Murrah grades were more efficient milk producers than non-descript buffaloes. Key words:Tamil Nadu, Murrah grade, Non-Descript buffaloes, Mean total lactation milk yield, Lactation length.
INTRODUCTION Dairy sector in the India has shown remarkable development in the past decade and the country has achieved the highest milk production of 127.5 MT in the year 2012-13, which has led to increase in the per capita availability of
ABSTRACT
RESEARCH ARTICLE
Indian Journal Of Natural Sciences www.tnsroindia.org. © IJONS
Vol.5 / Issue 28/ February 2015 International Bimonthly ISSN: 0976 – 0997
2670
milk up to 281 g per day (NDDB, 2012).Buffalo is one of the principal milch animals and its contribution in national milk production is about 56 per cent. According to 2012 livestock census, 108.7million buffaloes account for about half of the buffalo population of the world.Inspite of this large population the level of milk production is very low. Many works have been carried out on the productive performance of buffaloes and most of these researches were done on animals at experimental stations (government and university farms), which cannot represent the animal population in the country whole. Little information is available on the productive performance of buffaloes owned by farmers and small number at field levels under different economic and environmental conditions. Such information is of vital importance in planning schemes for improving buffalo milk production at national level as nearly 80 percent per cent of Indian buffaloes area kept in under rural conditions. Thepresent study is a close survey and information recording on some productive traits of buffaloes raised under such conditions in five districts of north east zone of Tamil Nadu.
MATERIALS AND METHODS The study was conducted in north east zone of Tamil Nadu, India comprising Chennai, Kancheepuram, Thiruvallur, Thiruvannamalai and Villupuram districts. Selection of the respondents was made using stratified random sampling technique and total of 250 respondents comprising 45 large, 51 small, 54 marginal and 100 landless farmers were selected from villages of the above districts. The total households were post stratified according to the land holding viz, landless, marginal (<2.5 acres), small (2.6-5.0 acres) and large (>5.0 acres) with a view to study some productive traits of buffalo under different socio economic situations. Totallactation milk yieldwas considered as the total milk produced in kilogram (kg) from date of calving to the date of drying up. Milk recording of the animals was taken up with in10 days of calving. The first recording was done between fourth to tenth day of calving and subsequent recording were done at on interval of 30 days. All recording were done by the milk recorder himself at the time of milking. The recordings were continued till the animal reached dry period. The calf was allowed to suckle for a short period to induce milk let-down followed by hand milking and the yield was recorded in kg in test days. Recording was done by measuring the volume of milk, with accuracy of 50ml as suggested by Kaura et al. (1983).The test day yield was multiplied by thirty and product was summed up to given estimated yield. A total of 412 daily milk records of buffaloes ranging from first to seventh parity were collected in the study area. Data on lactation length was arrived at as the interval in days from date of calving to the date of drying. Data regarding total lactation milk yield and lactation length were collected and were analyzed. The data were subjected to analysis by least squares analysis method (Harvey, 1987).The difference between means was tested by using Duncan’s multiple range tests as modified by Kramer (1957). The mean and standard errors of all production traits were estimated by statistical procedures as mentioned by Snedecor and Cochran (1994).
RESULTS The estimates of productive traits of the buffaloes for landless, small, marginal and large farmers of Chennai, Kancheepuram, Thiruvallur, Thiruvannamalai and Villupuram district of Tamil Nadu are presented as under: Total lactation milk yield The overall mean total lactation milk yield in non-descript buffaloes was estimated as 555.89±3.10kg (Table 1). The mean of total lactation milk yield in non-descript buffaloes was found to be significantly different between location (P<0.01) but no significant difference was noticed between farmer’s category(Table 1a).Similar finding were reported by Shrestha and Yazman(1988) and Chawla(1999).On contrary, Prasad(1993) and Rao et al.(2000) observed that the average total lactation milk yield of local buffaloes was 1117.32 and 1122.76 litres, respectively. The overall mean total lactation milk yield of graded Murrah buffaloes was 1140.18±13.87 kg (Table 2).The mean total lactation milk yield in graded Murrah was found to be significantly different between location (P<0.01) and between farmer’s
Balusami
Indian Journal Of Natural Sciences www.tnsroindia.org. © IJONS
Vol.5 / Issue 28/ February 2015 International Bimonthly ISSN: 0976 – 0997
2671
category(Table3). These findings were in agreement with those observed by Abeygunawardena et al. (1996).On contrary, Raoet al. (2000) recoded the total lactation milk yield in graded Murrah buffaloes as 1703.84 kg. The yield obtained in the present study was lower than that reported by Khoslaet al.(1984) and Acharya and Bhat(1988) under field conditions. However, the estimate waswell within the range reported bySankeret al. (2012).The average total lactation milk yield was highest (1325.25.18 kg) in large farmers. They are generally resource rich farmers who had more input for each of the milch animals and they were in a position to feed the animal to their requirement, leading to high milk yield as compared to other category. Lactation length The overall mean lactation length of non-descript buffaloes was 294.44+0.89 days. (Table.2) and was not significantlydifferent between location and farmers category (Table.4). Similar result wasreported by Bhat (1979) and Gopalasawmi and Radhakrishnan (1976) under field conditions. The above results were also corroborated by Handaet al. (1988) and Rohilla et al (1992). The overall mean lactation lengthin Murrah grades was 327.56=0.86 days (Table5). The least squares mean of lactation length in graded Murrah buffaloes (Table.6) was found to be significantly different between location (P<0.01) and farmer’s category (P<0.010). Similar findings were observed by Acharya andBhat, 1988) Gangwar (1988) and Singh and Lal(1992).On contrary, Rao et al. (2000) observed that the lactation length ranged between 374.77 and 378.69 days. It was within the range of 228 to 351 days as reported by Nagercenkar (1979).
CONCLUSION The performance of the animals maintained by land-owning farmers was better than the animals of landless farmers. It was concluded from the study that the graded Murrah buffaloes were efficient milk producer than non-descript buffaloes and the performance is more in resource rich farmers herd than the landless and poor farmers.
REFERENCES 1. NDDB,2012(http/www.nddb.org/English statistics/Pages/Milk Production.aspx) 2. Kaura, M.K, Dhillon, J.S and M.S.Tiwana.1983.Relative efficiency of different sampling procedures for estimating
lactation milk yield in buffaloes. Indian J.ofDairy Sci.36:269-271. 3. Harvey .W.R.1987.Least squares analysis of data with unequal sub class numbers.ARS, USDA, Washington, D.C. 4. Kramer, C.Y.1957.Extension of Multiple range test to group correlated means.Biomtrics.13:13-18 5. Snedecor, G.W and Cochran, W.G.1994.Staitical methods.8thEd.,IOWA, State University Press,Ames,USA. 6. Shrestha.N and Yazman Jim.A.1988.Performance of Murrah and Native x Murrah crossbred buffaloes in Nepal.
Proceeding of the II world buffalo congress. New Delhi 12-16 December.pp. 28-33 7. Chawla, D.S.1999.Improvement of buffaloes for milk production: method and organization. National seminar on
improvement of buffaloes for milk,meat,draught and future strategies for processing and marketing of buffalo products.pp.25-39
8. Prasad, 1993.Factors affecting the performance of buffaloes maintained by milk producers in and around Hyderabad.M.VSc thesis submitted to Andhra Pradesh Agricultural University, Hyderabad.
9. Rao.J, Rao.B.V.R and Rao.G.N.2000 Performance of crossbred cows and buffaloes under village conditions of Vishakhapatnam district of Andhra Pradesh.Indian J.ofDairy Sci.53 (3):222-226.
10. Abeygunawardena .H, Abeyyawansa.W.D. Perera.R.M.A.O and Ibrahim M.N.M 1996.A comparative study of reproduction and production characteristics of indigenous swamp and Exotic River buffaloes in Srilanka.10-15 December.
11. Khosla, S.K, Gill, S.S and P.K Malhotra.1984.Effect of non –genetic factors on lactation length and lactation yield in herd book registered Murrah buffaloes under village condtions.Indian J.Anim.sci.54:401-412.
Balusami
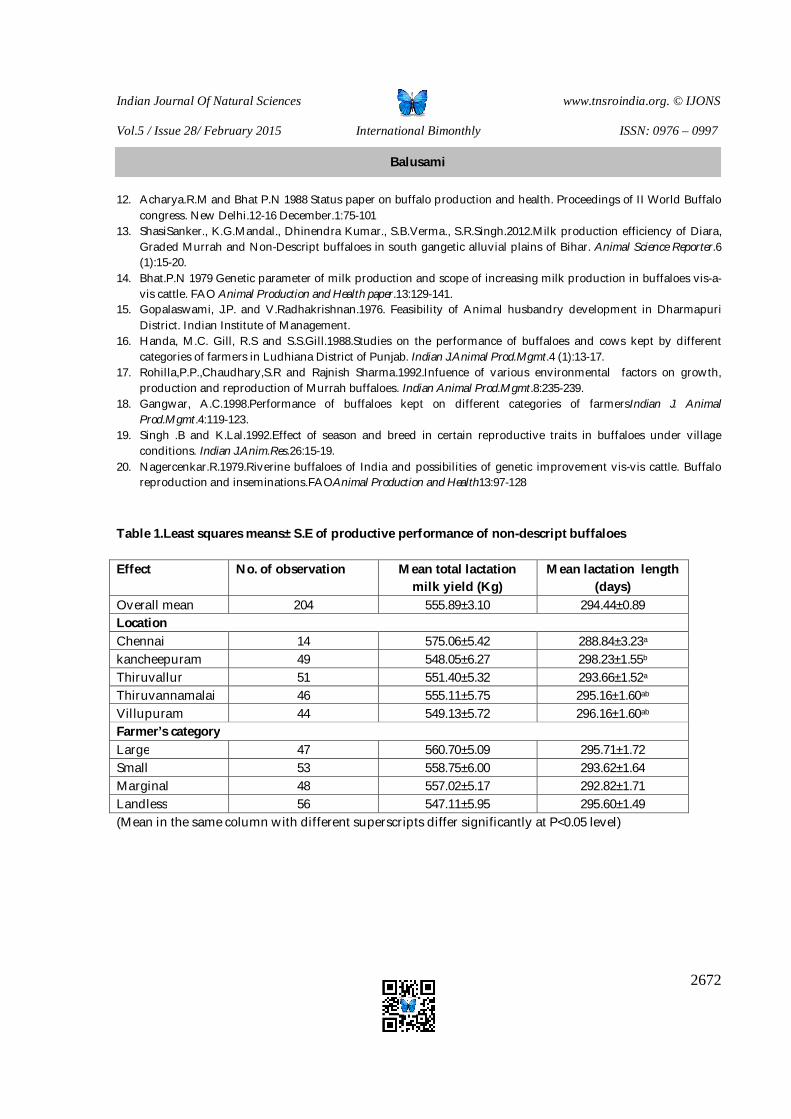
Indian Journal Of Natural Sciences www.tnsroindia.org. © IJONS
Vol.5 / Issue 28/ February 2015 International Bimonthly ISSN: 0976 – 0997
2672
12. Acharya.R.M and Bhat P.N 1988 Status paper on buffalo production and health. Proceedings of II World Buffalo congress. New Delhi.12-16 December.1:75-101
13. ShasiSanker., K.G.Mandal., Dhinendra Kumar., S.B.Verma., S.R.Singh.2012.Milk production efficiency of Diara, Graded Murrah and Non-Descript buffaloes in south gangetic alluvial plains of Bihar. Animal Science Reporter.6 (1):15-20.
14. Bhat.P.N 1979 Genetic parameter of milk production and scope of increasing milk production in buffaloes vis-a-vis cattle. FAO Animal Production and Health paper.13:129-141.
15. Gopalaswami, J.P. and V.Radhakrishnan.1976. Feasibility of Animal husbandry development in Dharmapuri District. Indian Institute of Management.
16. Handa, M.C. Gill, R.S and S.S.Gill.1988.Studies on the performance of buffaloes and cows kept by different categories of farmers in Ludhiana District of Punjab. Indian J.Animal Prod.Mgmt.4 (1):13-17.
17. Rohilla,P.P.,Chaudhary,S.R and Rajnish Sharma.1992.Infuence of various environmental factors on growth, production and reproduction of Murrah buffaloes. Indian Animal Prod.Mgmt.8:235-239.
18. Gangwar, A.C.1998.Performance of buffaloes kept on different categories of farmersIndian J. Animal Prod.Mgmt.4:119-123.
19. Singh .B and K.Lal.1992.Effect of season and breed in certain reproductive traits in buffaloes under village conditions. Indian J.Anim.Res.26:15-19.
20. Nagercenkar.R.1979.Riverine buffaloes of India and possibilities of genetic improvement vis-vis cattle. Buffalo reproduction and inseminations.FAOAnimal Production and Health13:97-128
Table 1.Least squares means± S.E of productive performance of non-descript buffaloes Effect No. of observation Mean total lactation
milk yield (Kg) Mean lactation length
(days) Overall mean 204 555.89±3.10 294.44±0.89 Location Chennai 14 575.06±5.42 288.84±3.23a kancheepuram 49 548.05±6.27 298.23±1.55b Thiruvallur 51 551.40±5.32 293.66±1.52a Thiruvannamalai 46 555.11±5.75 295.16±1.60ab Villupuram 44 549.13±5.72 296.16±1.60ab Farmer’s category Large 47 560.70±5.09 295.71±1.72 Small 53 558.75±6.00 293.62±1.64 Marginal 48 557.02±5.17 292.82±1.71 Landless 56 547.11±5.95 295.60±1.49 (Mean in the same column with different superscripts differ significantly at P<0.05 level)
Balusami
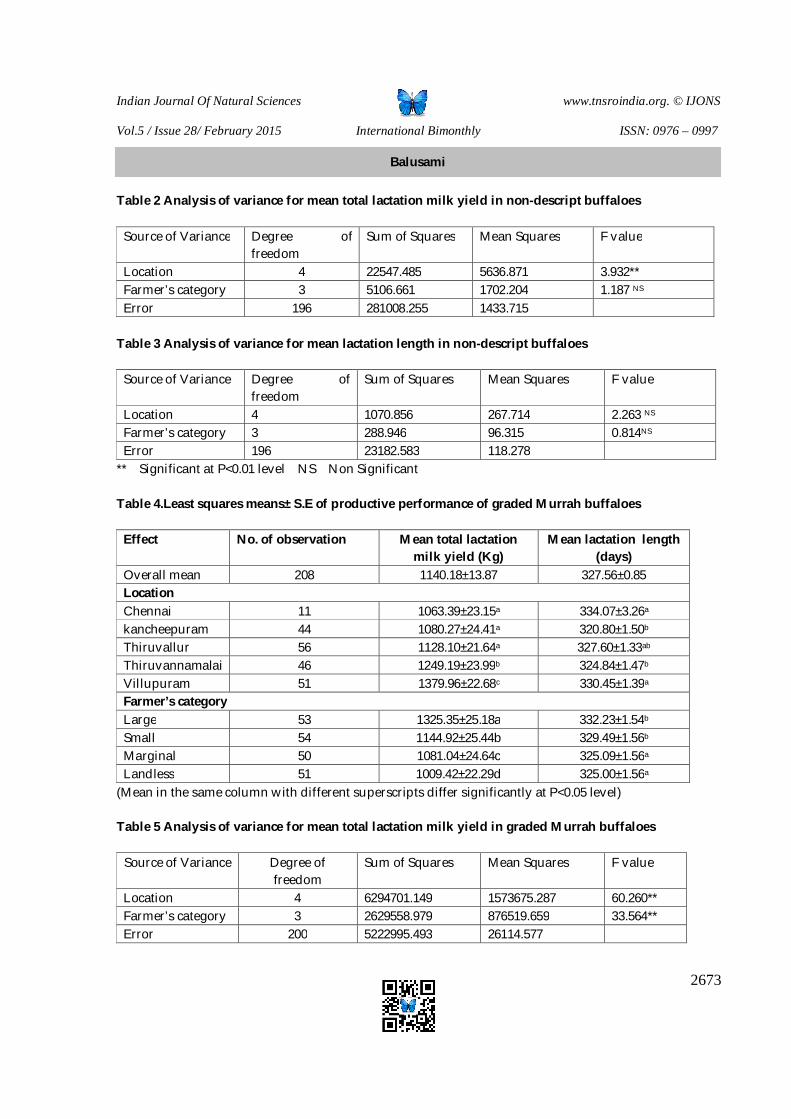
Indian Journal Of Natural Sciences www.tnsroindia.org. © IJONS
Vol.5 / Issue 28/ February 2015 International Bimonthly ISSN: 0976 – 0997
2673
Table 2 Analysis of variance for mean total lactation milk yield in non-descript buffaloes
Source of Variance Degree of freedom
Sum of Squares Mean Squares F value
Location 4 22547.485 5636.871 3.932** Farmer’s category 3 5106.661 1702.204 1.187 NS Error 196 281008.255 1433.715
Table 3 Analysis of variance for mean lactation length in non-descript buffaloes
Source of Variance Degree of freedom
Sum of Squares Mean Squares F value
Location 4 1070.856 267.714 2.263 NS Farmer’s category 3 288.946 96.315 0.814NS Error 196 23182.583 118.278
** Significant at P<0.01 level NS Non Significant Table 4.Least squares means± S.E of productive performance of graded Murrah buffaloes
Effect No. of observation Mean total lactation milk yield (Kg)
Mean lactation length (days)
Overall mean 208 1140.18±13.87 327.56±0.85 Location Chennai 11 1063.39±23.15a 334.07±3.26a kancheepuram 44 1080.27±24.41a 320.80±1.50b Thiruvallur 56 1128.10±21.64a 327.60±1.33ab Thiruvannamalai 46 1249.19±23.99b 324.84±1.47b Villupuram 51 1379.96±22.68c 330.45±1.39a Farmer’s category Large 53 1325.35±25.18a 332.23±1.54b Small 54 1144.92±25.44b 329.49±1.56b Marginal 50 1081.04±24.64c 325.09±1.56a Landless 51 1009.42±22.29d 325.00±1.56a
(Mean in the same column with different superscripts differ significantly at P<0.05 level) Table 5 Analysis of variance for mean total lactation milk yield in graded Murrah buffaloes
Source of Variance Degree of freedom
Sum of Squares Mean Squares F value
Location 4 6294701.149 1573675.287 60.260** Farmer’s category 3 2629558.979 876519.659 33.564** Error 200 5222995.493 26114.577
Balusami
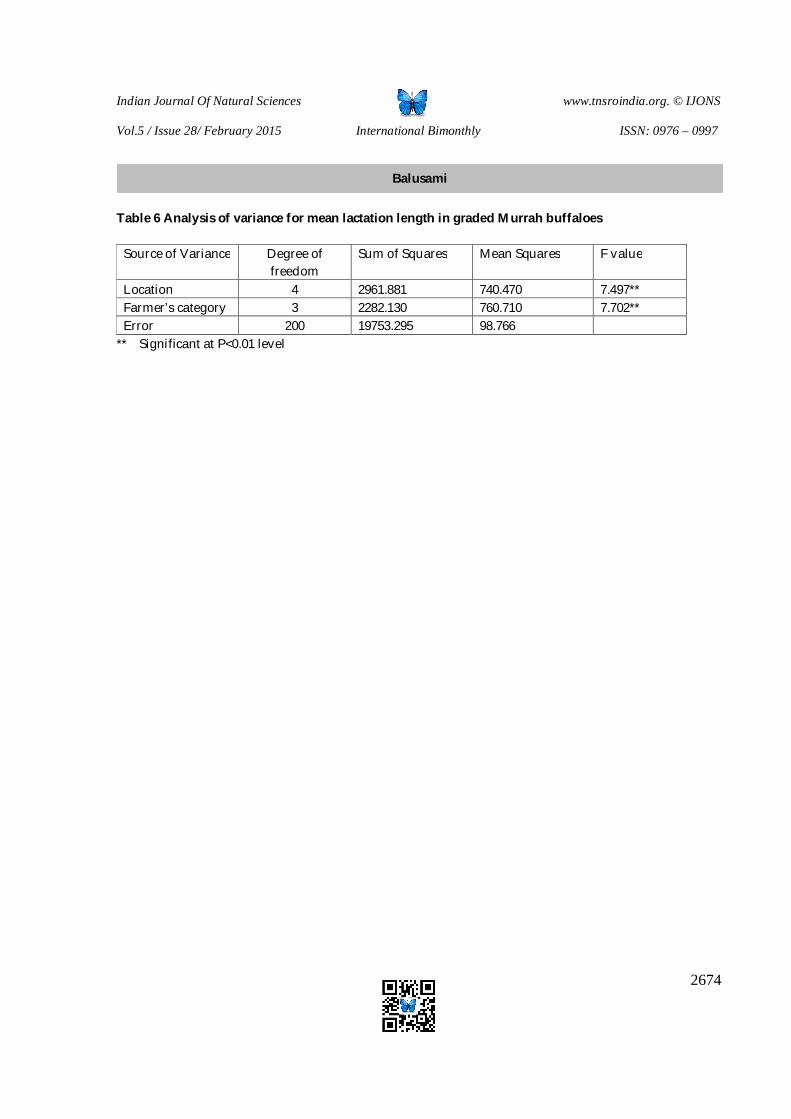
Indian Journal Of Natural Sciences www.tnsroindia.org. © IJONS
Vol.5 / Issue 28/ February 2015 International Bimonthly ISSN: 0976 – 0997
2674
Table 6 Analysis of variance for mean lactation length in graded Murrah buffaloes
Source of Variance Degree of freedom
Sum of Squares Mean Squares F value
Location 4 2961.881 740.470 7.497** Farmer’s category 3 2282.130 760.710 7.702** Error 200 19753.295 98.766
** Significant at P<0.01 level
Balusami
Indian Journal Of Natural Sciences www.tnsroindia.org. © IJONS
Vol.5 / Issue 28/ February 2015 International Bimonthly ISSN: 0976 – 0997
2675
Court Iconography of the First Qajar Period (Fath Ali Shah) Parisa Mehdipoor1, Nasrollah Taslimi2* , Gholamreza Hasani1 1Department of Art, Ali Abad Ktoul Branch, Islamic Azad University, Ali Abad Ktoul, Iran. 2Department of Art, Elm and Honar University, Yazd, Iran. Received:20 Dec 2014 Revised: 13 Jan 2015 Accepted:25 Jan 2015 *Address for correspondence Nasrollah Taslimi Department of Art, Elm and Honar University, Yazd, Iran E.Mail : [email protected]
This is an Open Access Journal / article distributed under the terms of the Creative Commons Attribution License (CC BY-NC-ND 3.0) which permits unrestricted use, distribution, and reproduction in any medium, provided the original work is properly cited. All rights reserved. Qajar art was born when the link between Iranian paintings and the past and its ideal and elegant atmosphere was breaking. The foundation of Iranian visual arts bore a huge change in the Qajar. Western painting principles replaced Iranian fine and brilliant painting and Iranian artists’ idealist mind replaced by Western three-dimensional visualization space of thought. The process established a school flowering at the authority of Fath Ali Shah Qajar; it was called Qajar School or First period of Tehran School. This article aims to pay more attention to the dramatic change in the Qajar Persian Painting, especially iconography. This transformation affected the attitude of Iranian artists and resulted in changes in the content and style of the paintings. Key words: Fath Ali Shah, Iconography, Painting, Qajar Era
INTRODUCTION Qajar art has notable features. It is a relatively clumsily, sophisticated and fully human art reflecting the spirit of his time. Pleasant features of the Qajar iconography justifies the motives to work on this subject. On the one hand, it is similar to the previous periods in terms of content and style; on the other hand, it differs from the previous periods. The continuing impact of the West on the Qajar painting established a school flowering at the authority of Fath Ali Shah Qajar; it was called Qajar School. In fact, Qajar era is one of the most amazing ages in the history of Iran; it is the junction of the last elements of old and new, political, social revolution and the beginning of serious cultural and artistic changes. Qajar painting achieved its unique luster between years 1834 to 1793. The amazing features of this
ABSTRACT
RESEARCH ARTICLE
Indian Journal Of Natural Sciences www.tnsroindia.org. © IJONS
Vol.5 / Issue 28/ February 2015 International Bimonthly ISSN: 0976 – 0997
2676
painting school are appropriateness of colors, soft brush strokes, brilliant composition, balance lines, exquisite and complex decoration, masterly mix of colors and skills in figures and iconography. This descriptive study has been carried out according to standards of library base research. The main data gathering tools are books; the researcher has used Note taking tools and visual documentation. It is conducted to answer the following questions: (1) did the government of the era and its doctrines affect the paintings (figures)? (2) Is there a thematic relationsihp in the expression of the artists in this era? In the following, the iconography in The First Qajar period and its characteristics will be explained. Political and social developments of Qajar The history of Qajar dynasty in politics dates back to the late ninth Hijri century (Zarrin Kob, 1996). Qajar heads were Ghezelbash and servant of Safavid kings; thus, they consider themselves as king after the Safavids. In the pursuit of power, they first clashed with Nader Shah Afshar and then Karim Khan Zand, but failed to achieve their aim. Aga Mohammad Khan who lived in Shiraz under the authority of Karim Khan Zand rose in 1814 after Karim Khan’s death (Pakbaz, 2005). He occupied Rasht, Gilan and Mazandaran by using the chaos of this era and established Qajar dynasty after overcoming Lotfali Khan. He was able to bring peace and security to a country declining due to civil war, famine and depopulation (Amanat, 2004). Agha Mohammad Khan was a strict and powerful commander who had no interest in royal life; there is no picture of him in his reign. Maybe, he knows his wrinkled face not proper for a perfect painting (Pakbaz, 2005). He had little interest in art, but he used Safavid visual language and royal palaces and buildings to further his political goals and objectives rom the beginning of the reign because he had two main patterns in the development of his state political organization. First, stable and sovereign government of Safavi that Aga Mohammad Khan owes to it; second, Nader Shah Afshar that had brought peace and security to turbulent boundaries of Iran and had expanded it. Hence, he ordered Agha Sadiq, Zand era painter, to add two huge wall paintings to the four wall paintings of Chehelsotoon in Isfahan. The wall paintings are scenes of Karnal Battle and Chalderan War, which inspired Agha Mohammad Khan Qajar in the development of his government (Azhand, 2007). Finally, Agha Mohammad Khan was murdered in 1833 by some of his companions. With the death of Agha Mohammad Khan, his power was transferred to his nephew, Khan Babakhan. In this manner, Babakhan, known as Fath Ali Shah became the king of Iran in 1833 and governed Iran for 36 years to 1869. Due to the efforts of Agha Mohammad Khan, situation in the country was reached relative stability and peace at this time and the ground for revitalization of the art at the court of his successor was fully prepared. Fath Ali Shah was the ruler of Fars before achieving kingship. This led to the introduction of the glorious history of Iran to the king, especially the Sassanid era; it is a major factor in attracting his attention to the grandeur of the ancient civilization in Iran. He regarded himself as the heir previous kings; he follows them in the creation of a royal system and prodigal court (Diba, 1998). Leila Diba argues that wealth remained of previous kings, particularly the richness of Nadir Shah, is a major reason for the growth and prosperity of art in this period (ibid). The wealth enabled Fath Ali Shah to give more and more glory to his court. He ordered to construct several palaces and royal mansions in Tehran and various other cities. The monuments and edifices required abundant decoration. Therefore, the Qajar king invited many most prominent artists to the capital and they began to create large oil painting screens to decorate the royal palaces (Kanbi, 1999). Fath Ali Shah had no interest in warfare and decoding of the country, but he has an artistic mood; he showed interest in painting and writing, he wrote beautifully and he had a poetic talent. He composed poetry under the pseudonym “Khaqan” and showed his talent by sending multiple copies of poems to European countries (Askarchya, 2005). He ordered to compose an epic about the history of the Qajar dynasty and at least five copies were given to European kings and high-ranking officials (Rabi, 2006). Artistic and literary talents and interests of Fath Ali Shah, the desire to
Nasrollah Taslimi et al.

Indian Journal Of Natural Sciences www.tnsroindia.org. © IJONS
Vol.5 / Issue 28/ February 2015 International Bimonthly ISSN: 0976 – 0997
2677
show off the power and the luxury manner as well as the king’s interest to preserve and restore the legacy of past Kings, especially the Sassanid era, pave the way for the creation of glorious art in Iranian paintings reflecting properly the culture of the court. Thus, human-centered school of painting, called “iconography”, emerged in the history of Iran art; the school was different from others due to emphasis on the human figure. Court Iconography Court iconography was first emerged in the thirty-year reign of Karim Khan Zand (1790-79) that Shiraz became the capital of Iran. The short-term security enabled artists and patrons to gather. Zandiyeh School was established and developed in this age (Aghdashloo, 2005). In this regard, Great painters of court of Fath Ali Shah could engage in art with peace of mind and present the painting school of Fath Ali Shah age as one of the most brilliant era of art after Safavid. In fact, Fath Ali Shah’s court painting was the result of experiences of artists such as Mohamad Zaman and the next generation. While Mohamad Zaman presented a European-Iranian consolidated school, Zandiyeh painters like Mohamad Sadeq and Mirza Baba brought it to Qajar court in a refined and noble form (Pakbaz, 2005). They create works that were new while one cannot even suspect they are Iranian. Court iconography is combination of some mental attitudes. It means that a consolidated aestheticism emerges by combining some European style with some Persian painting ways of thinking (Man-centered thinking + Taking advantage of the traditional Persian painting). The school is indeed a mediator between Iranian traditional painting and modern art. It is regarded as the transition period of Iranian art from original and traditional forms to new and modern trends. The most important feature of Court Iconography will be outlined as follows: (1) emphasis on the human figure, presenting human, decorative versions, (2) addressing old issues in new forms and a new topics, (3) combining European style with traditional elements, (4) application of the special structure (vertical, horizontal and curved elements) and (5) addressing the luxury of courtly life (Rasooli, 2006). In general, the court iconographers did not care that the image is not very similar to its owner, but they tried to draw as beautiful as possible and they sought ideal and perfect beauty in the traditions of Persian painting (Aghdashloo, 2008). In the history of Iranian art, paintings were mostly made by orders of governors in the kings’ royal courts and the reign of Fath Ali Shah is an example of this custom. The king was the main sponsor and patron of paintings; therefore, human figures were reflected by shapes of king, princes and courtiers and women dancers and musicians. Painter does not go beyond this so that he did not portray a common person and his daily life in that age. In simpler terms, the paintings in this era are fully at the service of court and they are summarized in reflecting the importance and authority of the King and boasting the glory and grandeur of the court. As said the court iconographers did not care that the image is not very similar to its owner, but they tried to draw as beautiful as possible and they sought ideal and perfect beauty in the traditions of Persian painting. The painters did not try to draw personal states and mental properties; the criterion for perfect and ideal beauty was specific and its roots were available in poetry and literature. Explanations such as ‘face like sun’s claws’, ‘cedar’s stature’, ‘ruby lips’, ‘narcissus eyes’ and ‘curved eyebrow’ are the symbols of ideal beauty in literature that can be seen in paintings, too. Movement seen less in Qajar painting; most human beings are dignified, graceful, well-established, weighty and solemn, without smile, strict, too serious and almost stern with inanimate and senseless faces like eyes (Maksob, 2000). Moreover, beauty in this age was round face, oval hangover eyes, curved unibrow, thin nose and a mouth as small as flower buds; women with this feature were beautiful (Robinson, 1972). It can be said that the patterns of painting backgrounds are also derived from the interior design of palaces and they are very courtly. In this way, male and female figures are portrayed in golden and pearl clothes, awash in jewelry, very solemn and sedate in front of niche or window with rolled up curtains containing a perspective of nature or architecture. Since the Qajar king and princes regard themselves as mythological and historical characters, drawing legendary heroes and the previous kings of Persia were also on the agenda (Pakbaz, 2011).
Nasrollah Taslimi et al.

Indian Journal Of Natural Sciences www.tnsroindia.org. © IJONS
Vol.5 / Issue 28/ February 2015 International Bimonthly ISSN: 0976 – 0997
2678
Accordingly, the portraits of Fath Ali Shah in the works painted during his 36-year reign are always young and he does not become old. He looks straight into the audience and he has full of strength and magic mood with conventional and consistent face, which may not be the same as his real face, white and inanimate face, large eyes, dark eyebrows, thick beard, mole on the corner of lip that he insisted to be drawn, big arm and chest, thin waist in highly decorate and luxurious clothes with precious gems and jewelry in a space fulled with splendid objects, carpets and curtains. In this school, the painters did not draw true and realistic picture of the king, but they portray an imaginary picture of king who was very beautiful, impressive, honorable and noble (Sodavar, 2011). The portraits of Fath Ali Shah are fully reflecting the favorable impression, and royal glory and dignity. One observes a real and ideal king that the conventional exorbitant titles of that age for addressing him seems natural the titles are ‘the center of the universe, the owner of all lands, Majesty the shadow of god on earth etc. (Robinson, 2010). During the reign of Fath Ali Shah and in order to create single figures, painters portrayed the king picture in the same specific status including formal standing or kneeling. These characteristics are more or less repeated in other paintings of the courtiers: figure is located in the center, most space is devoted to the figure and the whole structure is symmetrical. Configuration through coordination of vertical lines (such as statues, columns, doors and windows, sword, stick and gun), horizontal lines (such as margins of carpets, baseboards, decorative stripes and lines connecting the walls and floor of the Hall) and curved lines of skirt margins, curtains, cushions and musical instruments. The discrepancy between different levels is strengthened using boundary lines or dark cinctures. A little highlight and shadow work has been done on the clothing, around the eyes, edge of nose and hands. Reality and world have some symbolic and imaginary features in the paintings. Precision in drawing details such as jewelry and decorative objects and motifs on clothing has been applied in such a way that the figures are more a decorative work rather than the picture of a real man. The Impact of European Art on Qajar Illustrations The first impact of Western art on the Iranian art may be found at the time of Shah Abbas Safavi. With the opening of the doors to the West, one sees traveling by ambassadors, businesspersons, tourists, professionals, and European experts to Iran in this period. When Isfahan became the capital, the merchants, ambassadors, and envoys from the West came to Iran and they brought various works of art, especially paintings. Some artists also settled in court and trained a number of Iranian artists. The paintings brought to Iran included the figures of many European kings and princes. Close political and cultural relationship, the presence of European advisors and the modern material atmosphere created such a new situation in the Safavid period, especially Shah Abbas, that the mind of painters neither had and maintain the previous purity and capability nor was able to adapt to the new conditions. Portraits were common in the paintings of the famous artists including Reza Abasi, Agha Reza, Moein Mosavar, and Afzal Hoseini… (Hoseini, 1992). Human figure is important in these developments. Mohamad Zaman’s travel to Europe and learning European techniques of painting was an end in Iranian traditional painting and a beginning in the direct influence of Western painting as well as its material attitude and extroversion (ibid). Indeed, the exotic and non-sensual painting was replaced with worldly, sensual and humanistic painting rooted in the European art. In this regard, the themes were manifested in elements such as human face and subjects such as inanimate perspectives and nature. The impact continues in Afsharieh and Zandiyan; thus, the westernization process in this era resulted in the creation of works with topics like portraits of women, princes, equestrians and hunters, lover couples, flowers, and birds. Of course, the impacts does not reduce the vale and credit of works in this age because the European elements were combined properly with the space of Iranian painting and revive the paintings in this era. The main fine point in the paintings
Nasrollah Taslimi et al.
Indian Journal Of Natural Sciences www.tnsroindia.org. © IJONS
Vol.5 / Issue 28/ February 2015 International Bimonthly ISSN: 0976 – 0997
2679
of the twelfth century is its capability to balance the two poles of European objectivity and Iranian subjectivity by maintaining its structure through using specific elements of European objectivity (Aghdashloo, 1999). Therefore, one can say that Artists of Fath Ali Shah adapted the style of their works with global developments and communication of Iran with the West; hence, a new spirit and a new style of paintings rose in the illustration of this age. Drawing the Human Figure in Actual Size One of the most prominent manifestations of Court Iconography School is drawing the human figure in the actual and natural size. The presence of human figures had always been common before Qajar age in Iranian painting either in decoration books or in single copy or single version. The presence of large-size human figures in the paintings had emerged slowly in Zandieh era. Then, big human elements close to natural size of the model was used for the first time in Qajar age. Maybe, the king’s tendency to power, showing majesty and idealizing Sasanian samples led to the changes in human figures (Nazem Zadeh Harandi, 2009). Flourishing tradition of painting human figures in natural size and using human models on the screens is the most important achievement of Qajar art, which is regarded as a notable development in Iranian painting after Islam (Etehadiyeh, 1999). Paintings on canvas found functional and cosmetic aspect for architectural spaces at the time of Fath Ali Shah in the school of court iconography. Painters determined the cadre of his works based on architecture and location of the place on which the work was going to be installed. However, the cadres found a practical aspect and coordinated with building space. The top of most paintings of this period were zigzag to be suitable for niches and walls with the same shape (Kanbi, 1999). Thus, the size and dimensions of works were very diverse. In some cases, a place in the hall was chosen for painting at first, then, the purchased work was transformed according to the defined place; afterward, the painting was cut with respect to the place. In many cases, serious damages were imposed on the intellectual and visual structure of the work and the work lost a part of its unity. The size of paintings in this school is generally more than one meter; this specific size determines a part of composition and project shape. For instance, the standing position of men was necessary. Consequently, the cadre of qajar paintings is an aesthetic feature because to practical reasons led to establishment of new forms in the cadre of painters (Jalali Jafari, 2003). The Main Elements of Court Iconography The most important distinction between Fath Ali Shah paintings and works of previous ages can be in the use of oil paint technique, which allowed displaying of volume processing. Apart from the political, economic and social matters, expanding exchanges between Iran and Europe had great impacts in the field of culture and art, especially painting. One can point out using the technique of oil paint. Technique of oil paint, which had entered Iran about one century earlier, was established in the Qajar era (Khalili, 2005). Artists had acquired the proper skill for using it and the new items became popular among artists. In this method, the previous elegant and miniature styles were not practical; therefore, one observes new methods by the artists of the era. Coloring technique that was very helpful in the eleventh century was replaced with convenience and freedom so that the major parts were explained with a relatively intense movement of the brush. The separated and uneven lines of colors and stains replaced the smooth and polished surfaces (Aghdashloo, 2009). Understanding the qualities of different colors on the occasion of familiarity with arts, crafts, and more important than all the old carpets among artisans and artists was not strange. The colors were as follows: spectrum of red particularly purple and ochery, black, rust green, the combination of red and brown, jaspery, mauve and in general all live and sweet colors, which are pleasant for eye. There are few examples of the dead, strangled and boring colors like dark blue or gray. In the Qajar era, colorful iconography domain is limited; therefore, one cannot see a unique color variation in the work of the artists. Aidin Aghdashloo believes that depth instead of a diverse spectrum of many colors, Iranian
Nasrollah Taslimi et al.
Indian Journal Of Natural Sciences www.tnsroindia.org. © IJONS
Vol.5 / Issue 28/ February 2015 International Bimonthly ISSN: 0976 – 0997
2680
paiters of this era used even and limited that is strange and wonderful. In a looking back, the value of astonishing diversity of origin of the color of each of these paintings is fascinating (Aghdashloo, 1999). The artistic works of the Qajar were at the service of court luxury and decorative life. Decorative arts became powerful in this era. Costumes, crowns and cloaks are all embroidered with pearls, lace, brocade and inlay. Decorative figures of twelfth century are constructed by traditional arabesque and Angelica and they transform to bouquet of Damask rose, cashmere paisley and iterative small flowers (Aghdashloo, 2009). Subjects Used in Court Iconography Qajar paintings can be divided into several categories. First, paintings containing male or female figures of princes and courtiers dressed costly. Second, courtly scenes including ambassadors and political or popular representatives at king’s presence. Third, fancy court paintings such as dancing and tightrope walking carried out mostly by women and decorated the house of rich families. Epic and Political Themes Showing the grandeur and glory of ruler and Qajar dynasty was one of the main objectives of applying political themes in visual arts. Qajar kings tried more than other Iranian kings to show off their power and importance in either the country or abroad (Ekhtiar, 2002). They displayed the pictures of portraits, collective pictures with their families or foreign ambassadors’ meeting with them (Azhand, 2002). The paintings were installed on the walls of the royal mansions and palaces. Like other royal stuffs (such as honor robe of king’s decree), the paintings had a specific dignity and sanctity. They were donated to European ambassadors and political figures as valuable gifts. Images of the Russo-Iranian wars were topics for painting in this age (Joubert, 2000). Emotional and Sensual Apart from political purposes, visual arts may be used to stimulate the emotions and satisfy the aesthetic sense. They used flowers and birds in their paintings on the walls and decorate their homes with innovative and eye-catching style (tankoni, 1820). These paintings of flowers, birds, views, and non-figure motifs are seen on penner and mirror frames, etc. (ibid). Around the year 1850, a European lady called Lady Shale led to the women’s section of the Imperial Palace by Shah’s mother; she saw murals with diverse subjects. This indicates that the Harem of king was not necessarily decorated with images of women. Erotic scenes are another important subject of paintings in this era (Shale, 1856). Religious and Literary Themes While drawing human figures was condemned in Islam, painters were diligent in addressing religious subjects. Pictures of religious themes were not limited to images of religious themes, but iconic images had many customers and they were offered to people in print (Azhand, 2002). Du Vilmorne wrote that old photos were offered on cardboard for sale; they had religious subjects such as Karbala, praining true believers and the resurrection. The notable point in the paintings is white halo around the head of figures and the light of their face that covered them like a veil. They were the images of Shiite Imams that the painter was not allowed to draw them. They argue that the will be recognized by others because their names were written on the light of their face. One sees only golden written Arabic letters on the light; they say that they were Ali, Muhammad, etc. Nevertheless, the halo around the face and head were eliminated when the painting showed the young ages of the religious hero (Du Vilmorne, 1954).
Nasrollah Taslimi et al.
Indian Journal Of Natural Sciences www.tnsroindia.org. © IJONS
Vol.5 / Issue 28/ February 2015 International Bimonthly ISSN: 0976 – 0997
2681
CONCLUSION Qajar art and painting was born from the reign of Fath Ali Shah. Major works of this era are paintings in court iconography style. The style of painting was founded after much bloodshed by Aga Mohammad Khan, first Qajar king, to establish the power of king through tools of power. However, the roots of this style can be seen in the Safavid and Zand. Early Qajar paintings represent an artificial image of the glory of that era. Iranian art during Fath Ali Shah follows consciously the art of Safavid period and presents it a new way. Qajar kings had proactive role in the use of illustrations for promoting court beliefs and rituals. Returning to art, culture and literature of the past centuries, attributing Qajar kings to past honorable events in the history of Iran to justify the legitimacy of their rule, stimulating the spirit of patriotism to deal with numerous foreign military threats and covering up the military failures are the most important factors in the creation of court iconography. Large oil paintings having been flourished from the Zand period became the most important paintings of this period and they were called court iconography . Fath Ali Shah was first Qajar king supported the arts and gathered a number of artists in his atelier. Court iconographers did not care that the image is not very similar to its owner, but they tried to draw as beautiful as possible. The questions raised in the introduction will be answered in the following. (1) Did the government of the era and its doctrines affect the paintings (figures)? There are some paintings outside the court territory, away from the problems and limitations associated with the court artist and beyond the direct effect of the customer’s taste; in this works, the artist had developed and worked on the subject independently. On the other hand, there are some works reflecting clearly the customers’ taste. For instance, using art, Fath Ali Shah tried to consolidate his power both inside and outside the borders of the country. Fath Ali Shah had a passion to portray his figure decorated with lots of costly clothing and jewelry. As it is seen in the works of two mentioned artists, the desires of Shah is reflected clearly in paintings remained from him. (2) Is there a thematic relationship in the expression of the artists in this era? Characteristics of Persian traditional painting had a direct relationship with traditional community and the perspectives of Iranian artists. In case, Fath Ali Shah was the ruler of Fars before achieving kingship. This period led to king’s familiarity with the glorious history of Iran in the past, especially Sassanid era. This was an important factor in his attention to the grandeur of the ancient civilization in Iran; he considered himself heir of the previous kings, as well. Thus, he followed them in the creation of royal system and prodigal; this is one of the common and influential points for artists. On the other hand, Qajar painting was challenged directly by elements of European painters. The challenge related to the main concern of its age, or modernity and tradition. The necessity of innovative developments, which inevitably occur in any period of history, led artists to combine the two controversial subjects for overcoming the challenge. Pictures remained from the artists of the period are perfect examples of combining traditional styles with elements of Western art. The use of details and realistic elements in the paintings close the work to the artist. Furthermore, literary themes were portraying to maintain national identity in the face of Western Art. It seems the overall standards and ideas about the aim of art and its essence are the same throughout the history of Iranian art. While the history have had some fluctuations and changes, it has maintained its process in all stages and it is is clearly distinct from other countries’ art. Although foreign cultures have had some influences on Iranian culture, Iranian art has a purely national expression.
REFERENCES 1. Aghdashloo A. (1997). Agha Lotfali Soratgar Shirazi, Tehran, Iranian Cultural Heritage, first print. 2. Aghdashloo A. (2005). An Introduction to the Qajar paintings, Artist Career Quarterly, autumn.
Nasrollah Taslimi et al.
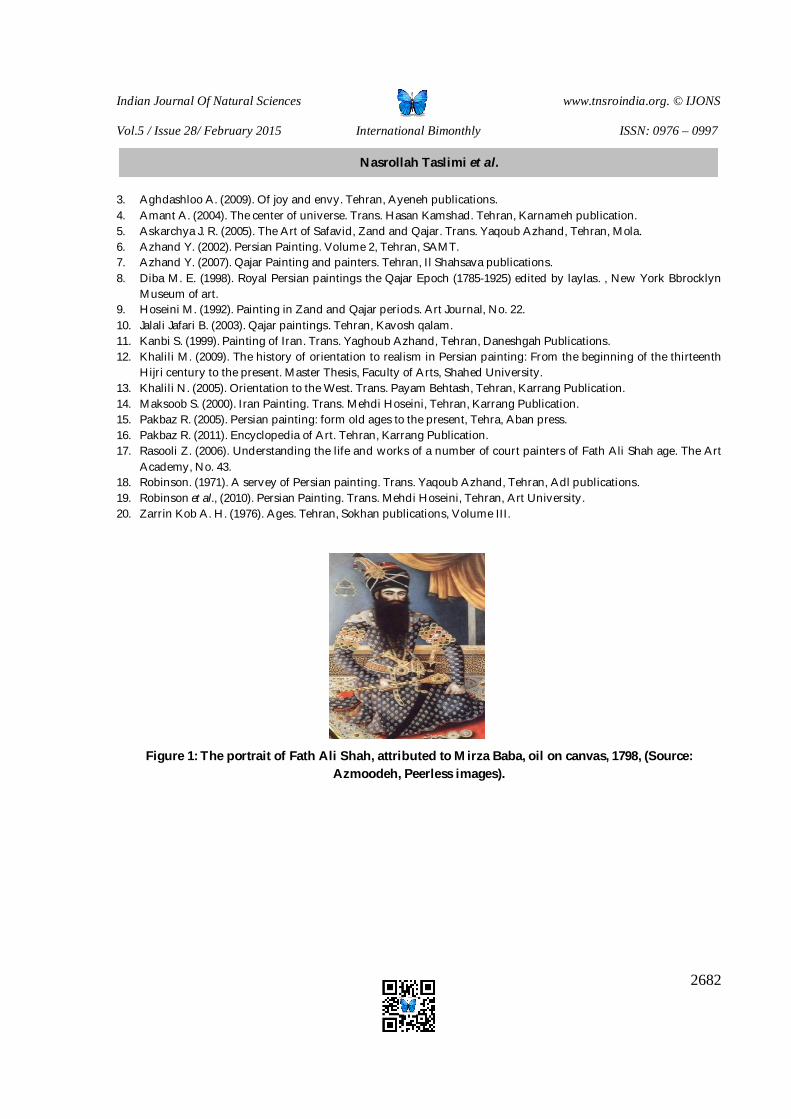
Indian Journal Of Natural Sciences www.tnsroindia.org. © IJONS
Vol.5 / Issue 28/ February 2015 International Bimonthly ISSN: 0976 – 0997
2682
3. Aghdashloo A. (2009). Of joy and envy. Tehran, Ayeneh publications. 4. Amant A. (2004). The center of universe. Trans. Hasan Kamshad. Tehran, Karnameh publication. 5. Askarchya J. R. (2005). The Art of Safavid, Zand and Qajar. Trans. Yaqoub Azhand, Tehran, Mola. 6. Azhand Y. (2002). Persian Painting. Volume 2, Tehran, SAMT. 7. Azhand Y. (2007). Qajar Painting and painters. Tehran, Il Shahsava publications. 8. Diba M. E. (1998). Royal Persian paintings the Qajar Epoch (1785-1925) edited by laylas. , New York Bbrocklyn
Museum of art. 9. Hoseini M. (1992). Painting in Zand and Qajar periods. Art Journal, No. 22. 10. Jalali Jafari B. (2003). Qajar paintings. Tehran, Kavosh qalam. 11. Kanbi S. (1999). Painting of Iran. Trans. Yaghoub Azhand, Tehran, Daneshgah Publications. 12. Khalili M. (2009). The history of orientation to realism in Persian painting: From the beginning of the thirteenth
Hijri century to the present. Master Thesis, Faculty of Arts, Shahed University. 13. Khalili N. (2005). Orientation to the West. Trans. Payam Behtash, Tehran, Karrang Publication. 14. Maksoob S. (2000). Iran Painting. Trans. Mehdi Hoseini, Tehran, Karrang Publication. 15. Pakbaz R. (2005). Persian painting: form old ages to the present, Tehra, Aban press. 16. Pakbaz R. (2011). Encyclopedia of Art. Tehran, Karrang Publication. 17. Rasooli Z. (2006). Understanding the life and works of a number of court painters of Fath Ali Shah age. The Art
Academy, No. 43. 18. Robinson. (1971). A servey of Persian painting. Trans. Yaqoub Azhand, Tehran, Adl publications. 19. Robinson et al., (2010). Persian Painting. Trans. Mehdi Hoseini, Tehran, Art University. 20. Zarrin Kob A. H. (1976). Ages. Tehran, Sokhan publications, Volume III.
Figure 1: The portrait of Fath Ali Shah, attributed to Mirza Baba, oil on canvas, 1798, (Source: Azmoodeh, Peerless images).
Nasrollah Taslimi et al.

Indian Journal Of Natural Sciences www.tnsroindia.org. © IJONS
Vol.5 / Issue 28/ February 2015 International Bimonthly ISSN: 0976 – 0997
2683
Figure 2: Princess Abas Mirza and Russian soldiers; anonymous painter; Iran about 1815-16; size 395*230 cm. Source: Armitage Museum, St. Petersburg.
Figure 3: Drunk Lady; Mirza Baba; probably Tehran; 1800-1; oil paint on canvas and sheet metal; size: 146*94 cm; Souce: the collection of Mr. Eskandar Arayeh.
Figure 4: Joseph and his father Jacob; 1835-49. Source: the collection of Hashem Khosravani Qajar.
Nasrollah Taslimi et al.
Indian Journal Of Natural Sciences www.tnsroindia.org. © IJONS
Vol.5 / Issue 28/ February 2015 International Bimonthly ISSN: 0976 – 0997
2684
Relationship between Shyness and Loneliness and Social Support among Female Gifted Students Tooba Farzadfar* and Ali Jahangiry
Department of Psychology, Faculty of Humanities, North Khorasan Science and Research Branch, Islamic Azad University, Khorasan, Iran. Received:12 Jan 2015 Revised: 18 Jan 2015 Accepted: 25 Jan 2015 *Address for correspondence Tooba Farzadfar
Department of Psychology,Faculty of Humanities, North Khorasan Science and Research Branch, Islamic Azad University, Khorasan, Iran. E.mail: [email protected]
This is an Open Access Journal / article distributed under the terms of the Creative Commons Attribution License (CC BY-NC-ND 3.0) which permits unrestricted use, distribution, and reproduction in any medium, provided the original work is properly cited. All rights reserved. Current research aims at investigating relationship between shyness and loneliness and social support among female gifted students using descriptive – survey method. To this end, shyness questionnaire of Samuee, UCLA Loneliness Scale and MOS’s social support survey were used for measuring research variables, reliability of which was obtained as 0.834, 0.781 and 0.814, respectively. Research statistical population includes all female giftedstudents in Bojnurd (n = 364) in secondary school including grade 1 (n = 89), grade 2 (n = 89), grade 3 (n = 56) and grade 4 (n = 103). Sample size was obtained as 181 using Morgan table. Pearson correlation test and regression analysis was used for data analysis. Research findings suggest parenting style is related to narcissistic personality of students. Also, parenting style is related to role conflict in students. Research findings indicate tangible support for students is negatively related to shyness and there is a negative correlation between emotional support and shyness in students. Also there is negative relationship between information support and shyness in students. There is negative relationship between social support of kindness type and shyness in students. Finally it was specified there is no significant relationship between positive social interaction and shyness in students. Tangible support is negatively related to lonelinessfeeling in students. In other words, tangible support leads to reduced loneliness in students. Also, there is negative relationship between emotional support and loneliness feeling in students and there is negative relationship between information support and loneliness feeling in students. There is no significant relationship between social support of kindness type and loneliness feeling in students. Finally, it was found there is no significant relationship between positive social interaction and loneliness feeling in students. Key words: Shyness, loneliness, social support, gifted students.
ABSTRACT
RESEARCH ARTICLE
Indian Journal Of Natural Sciences www.tnsroindia.org. © IJONS
Vol.5 / Issue 28/ February 2015 International Bimonthly ISSN: 0976 – 0997
2685
INTRODUCTION
Lu (1997) argues that social support adjusts impacts of stressful events and leads to experiencing positive affections and it is positively related to happiness and mental health. According to Atchley (2000) social support includes people to whom we can rely for providing social support, confirmation (approval), information and assistance, especially in times of crisis. Social support concept covers perceiving availability of support, behavior which occurs during support, the support which is really offered and if support is useful or not.
Metnal health of students has been recently taken into account by the experts (Cloutier et al., 2010). School is one of the most important organized and formal institutions of the society which should provide grounds for blossoming mind and body of the students by offering a healthy environment. The school should make students responsible toward themselves, the family and society. In order to realize this goal, health of the students should be provided. It is clear that a shy and unhealthy student is not able to receive happiness, security, and stability in the classroom and education environment (WHO, 1998). One of the main problems which has inhibitory impact on efficiency and dynamicity of adolescents and prevents from healthy formation of identity and blossoming talents and mental and emotional faculties is the problem in establishing social relationships in adolescents. Some people do not have ability to properly communicate (Goldfried and Davison, 2000).Although interest on academic focus on positive and negative interactions has long been developed, studying adolescents who avoid interaction has been neglected (Rubin and Coplan, 2010). One main reason is problem in communication and shyness of students. Over past 20 years, shyness has been an interesting subject for authors and various researchers have studied it (Koydemir and Demir, 2008). On the other hand, development changes from late adolescence to early adulthood influence different aspects of the life (Arnett, 2007). For considerable part of adolescents, this stage of life is accompanied by internal psychological problems. During this stage, adolescents often face choiceswhich have long term consequences on their life (Arnett, 2007). Changes which rapidly occurs in adolescence, separation from parents, attempt for identity formation, growing need for intimacy are factors which may lead to adolescent’s loneliness (Mijuskovic, 1986). Loneliness is an annoying feeling and it is created when there is gap between relationships which one tends to have and relationships which he currently has (Peplau and Perlman, 1982). Young (1998) considers it lack of perceived satisfactory social relationship (Lipetal, 2010). Wintrob (1989) believes that loneliness occurs when one has mechanical and false relationship with others, without feeling belonging and intimacy (Rezvankhah, 1997). This feeling may be result of lack of emotional relationship for some people (emotional loneliness) and for some people or may be results of lack of adequate social communication (social loneliness) (Hawkley, Browne and Jacopo, 2004). Some believeloneliness does not mean being alone, rather it means feeling of non-belonging and thus it is regarded as warn for more attempt to communicate others (Jacopo, 2009). Since loneliness feeling results from lack of emotional attachment or uncertainty and insecurity in social relations(Wright, Burt, and Strongman, 2006) both social and emotional relations should be developed to overcome it. Studies indicate enriching social and emotional relations reduces emotional and social loneliness (Hawkley, Browne and Jacopo, 2003). Studies indicate people with loneliness feeling have characteristics such as low satisfaction and happiness, low self-esteem, alienation, feelings of shame, nostalgia, feelings of emptiness, low attraction, avoidance of social communication, little friends, pessimism, inability to express themselves, other-aversion and introversion (Bruwer et al., 2008).
Social support is a collection of public and specific support behaviors which leads to adjustment of mental pressures on the person and studies indicate it influences mental, social, and physical health of people. Individuals with high social support have higher mental, physical and social health and show better compatibility against life’s tensions (Roberts and Gotlib, 1997). Considering above mentioned facts and importance of social support, current research aims at providing answer to this question: is shyness and loneliness related to social support in female gifted students in Bojnurd?
Tooba Farzadfar and Ali Jahangiry
Indian Journal Of Natural Sciences www.tnsroindia.org. © IJONS
Vol.5 / Issue 28/ February 2015 International Bimonthly ISSN: 0976 – 0997
2686
Theoretical Foundations
Cognitive dimension of loneliness has recently been more considered and it is believed loneliness does not merely mean being alone, rather it means cognitive feeling of lack of belonging and attachment, and thus it is regarded as warn for higher attempt for communicating others (Kachiopo and Patrick, 2008). Some authors consider loneliness resulting from lack of perceiving emotional attachment or even uncertainty and insecurity in social relations (Wright, Burt, and Strongman). It shows that loneliness results from cognitive perception of loneliness and external and physical factors do not involve in its development or exacerbation. Thus, two persons can be observed who live in identical environmental and relational situations and have different feelings of loneliness. In other words, cognitive factor should be taken into account in investigating loneliness: one’s perception about external and social experiences. This component not only is important in developing loneliness feeling, but also mental health is one of the main components of “social support”.
Positive social supports causes that one feels being as part of the social network which can be source of material and spiritual helps. Studies indicate social support and loneliness feeling are closely related. For example, Nicpon et al. (2007) found significant relationship between loneliness and social support. It should be noted quantitative expansion of social relations does not paly determining role in loneliness, rather one’s perception of the extent and power of the social relations in one hand, and availability of support sources on the other hand are important in this regards.
On the other hand, social support can reduce shyness. Shyness as a dangerous mental – social factor may have consequences in terms of social and academic performance and lead to damaged social ability and skill (Goldberg and Schmidt, 2001). Studies indicate students with shyness, especially female students, suffer from social isolation and academic problems (Schmidt and Fox, 1995). Also, children who remain shy ay early school years are vulnerable to anxiety a social isolation problems (Addison and Schmidt, 2001). Hence, considering importance of social support and its impact on shyness and loneliness feeling in students and since no study has been conducted on relationship between social support and loneliness and shyness in Iran, current study aims at investigating relationship between social support and loneliness and shyness in female gifted students in Bojnur.
Research Hypotheses
H1: There is relationship between shyness and social support. H2: There is relationship between loneliness and social support. H3: There is relationship between shyness and loneliness.
METHODOLOGY
Current research is an applied research in terms of purpose and it is a descriptive research of correlation type in terms of data collection and analysis. Research statistical population includes all female gifted students in Bojnurd (n = 364) in secondary school including grade 1 (n = 89), grade 2 (n = 89), grade 3 (n = 56) and grade 4 (n = 103). Sample size was obtained as 181 using Morgan table. Simple random sampling was used for sampling.
Research Tools
Shyness Questionnaire of Samuee
This test was developed by Samuee (2003) including 44 items. It is scored as follows for items with positive content: from zero to 4 (never = 0, rarely = 1, sometimes = 2, mostly = 3, always = 4) and it is scored vice versa for items with
Tooba Farzadfar and Ali Jahangiry
Indian Journal Of Natural Sciences www.tnsroindia.org. © IJONS
Vol.5 / Issue 28/ February 2015 International Bimonthly ISSN: 0976 – 0997
2687
negative content, i.e. from four to zero. Reliability of the questionnaire was calculated as 0.80 using Cronbach’s alpha. Its reliability was significant at level P < 0.0001 using split method. Items were answered as follows: the subject read to questionnaire and he finds the option most suitable to his spirit.
UCLA Loneliness Scale
UCLA Loneliness Scale was developed by Russell, Peplau and Cutrona (1980). It includes 20 items as four-choice options, 10 positive and 10 negative statements. This scale was developed for finding a way to solve problems of adolescents. In this scale, never is scored as 1, rarely as 2, sometimes as 3, and always as 4. However, score of items 20, 19, 16, 15, 10, 9, 6, 5, and 1 is vice versa. That is, never is scored as 4, rarely as 3, sometimes as 2 and always as 1. Score range is 20 (min) and 80 (max). Thus, average score is 50. Scores higher than averages suggest higher severity of loneliness. Reliability of this scale was reported as 78 percent in the revised version. Reliability of the test was reported as 89 percent by Russell (1996) using retest method. This scale was translated by Ken and Mirdrikond, and then it was used after preliminary pilot and modifications.
Social Support Survey
In order to measure social support, MOS social support survey was used which was developed by Sherborne and Stuart (1991). This scale which measures social support received by the subject includes 19 statements and 5 sub-scales. Sub-scales include: Tangible support, which measures financial and behavioral assistance, emotional support, that measures positive emotion, sympathy and encouragement to express feelings, information, which measures guidance, information or feedback, kindness, which measures love and passion and positive social interaction, that measures presence of people to engage in leisure activities. This scale is a self-report tool and the subject expresses his agreement or disagreement using five-point Likert scale (never = 1, rarely = 2, sometimes = 3, often = 4, always = 5). Lowest score is 19 and highest score is 95. In order to obtain total score, all scores are summed. High score of the subject in this scale suggests subject has optimal social support. Reliability of this test was reported as 0.74 to 0.93 using Cronbach’s alpha (Sherborne and Stuart, 1991).
Reliability of questionnaires in this research was calculated using SPSS software, version 20 and Cronbach’s alpha, which is given in Table 1.
RESULTS
H1: There is significant relationship between shyness and social support.
In order to investigate relationship between shyness and social support in students, Pearson correlation test was used, results of which are given in Table 2.
Table 2 indicates there is negative relationship between tangible support and shyness in students (r = 0.312) which is significant at level 0.01. In other words, tangible support leads to reduced shyness in students. Also, there is negative relationship between emotional support and shyness in students (r = 0.347) which is significant at level 0.01. In other words, emotional support leads to reduced shyness in students. There is negative relationship between information support and shyness in students (r = 0.246) which is significant at level 0.01. In other words, information support leads to reduced shyness in students. In addition, there is negative relationship between social support of kindness type and shyness in students (r = 0.209) which is significant at level 0.01. In other words, kindness leads to reduced shyness in students. Finally it was found there is not significant relationship between positive social interaction and shyness in students at level 0.01.
Tooba Farzadfar and Ali Jahangiry

Indian Journal Of Natural Sciences www.tnsroindia.org. © IJONS
Vol.5 / Issue 28/ February 2015 International Bimonthly ISSN: 0976 – 0997
2688
H2: There is significant relationship between loneliness and social support.
In order to investigate relationship between loneliness and social support in students, Pearson correlation test was used, results of which are given in Table 3.
Table 3 indicates there is negative relationship between tangible support and loneliness in students (r = -0.243) which is significant at level 0.01. In other words, tangible support leads to reduced loneliness in students. Also, there is negative relationship between emotional support and loneliness in students (r = -0.252) which is significant at level 0.01. In other words, emotional support leads to reduced loneliness in students. There is negative relationship between information support and loneliness in students (r = -0.159) which is significant at level 0.01. In other words, information support leads to reduced loneliness in students. There is no significant relationship between social support of kindness type and loneliness in students at level 0.05. Finally it was found there is no significant relationship between positive social interaction and loneliness in students at level 0.05.
H3: There is significant relationship between loneliness and shyness and social support.
In order to investigate relationship between loneliness and shyness and social support in students, Pearson correlation test was used, results of which are given in Table 4.
Table 4 indicates there is negative relationship between social support and loneliness in students (r = -0.231) which is significant at level 0.01. In other words, social support leads to reduced loneliness in students. Also, there is negative relationship between social support and shyness in students (r = -0.326) which is significant at level 0.01. In other words, social support leads to reduced shyness in students.
In order to investigate if loneliness and shyness can predict social support in students and determine contribution of predictive variables in predictive social support in students, regression with simultaneous entry was used. According to regression analysis (Table 5) it can be concludedloneliness and shyness as predicative variables have criterion for entry to final regression equation to explain social support changes in students (criterion variable). As observed in Tables 4 and 5, correlation coefficient of loneliness and shyness with social support is -0.371. Also, according coefficient R2, loneliness and shyness can describe 0.138 of variance of social support variable.
In addition, in order to determine contribution of loneliness and shyness in prediction of social support in students, based on regression coefficient (Beta) it can be stated contribution of loneliness and shyness is -0.231, and -0.326, respectively.
DISCUSSION AND CONCLUSION
Over last 30 years, shyness has been subject to many studies in psychology and authors have contributed to understand this phenomenon (Zimbardo, 1997; Buss, 1980; Leary, 1986; quoted in Koydemir and Demir, 2008). However, shyness is considered as a social phenomenon which is specified with anxiety in social situations, social inhibition or interpersonal behaviors resulting from worry about interpersonal evaluation. Although there are different definitions for shyness, it is generally defined as discomfort and inhibition in the absence of other(Jones, Briggs, and Smith, 1986; Zimbardo, 1977).
Findings in the current work indicate there is negative relationship between tangible support and shyness in students. In other words, tangible support leads to reduced shyness in students. Also, there is negative relationship between emotional support and shyness. In other words, emotional support leads to reduced shyness in students.
Tooba Farzadfar and Ali Jahangiry

Indian Journal Of Natural Sciences www.tnsroindia.org. © IJONS
Vol.5 / Issue 28/ February 2015 International Bimonthly ISSN: 0976 – 0997
2689
There is negative relationship between information support and shyness in students. In other words, information support leads to reduced shyness in students. In addition, there is negative relationship between social support of kindness type and shyness in students. In other words, kindness leads to reduced shyness in students. Finally it was found there is not significant relationship between positive social interaction and shyness in students. In describing these findings it can be said shy people avoid communicating others. They deny their responsibility in developing relationship with others and their anxiety is evident when they are exposed to social interactions (Gilmartine, 2004). Parents or one parent with shyness, aggressive, humiliating experiences, critical relatives, shameful issues and family problems, and impassive family are the most important causes of shyness (Smith, 1993).
Darmos (2007) argues shyness is a character and attitude feature or an inhibitory state. Findings of some studies suggest many variables are related to shyness. To this end, Robin and Croster (1986) showed low levels of social acceptability increases risk for low self-esteem. Haimel, Robin, Rowden and LeMare (1990) showed low levels of social interactions predict low self-esteem. Harter, Waters and Whitesell (1998) showed there is correlation between social acceptability and self-esteem. Ginsburg, La Greca and Silverman (1998) indicated shy people have low self-esteem and social acceptability.
The study by Spence, Donovan, and Brechman-Toussaint (1999) indicated there is significant correlation between shyness, social acceptability and low self-esteem. Fordham and Stevenson-Hinde (1999) showed there is relationship between low social acceptability and self-value. Young et al. (2000) showed shyness increases low self-esteem. In the study by Miller (2003) it was shown there is negative correlation betweenshyness and social consensus and self-esteem (quoted in Chari and Delavarpour, 2005).Deniz and Hamarta (2005) showed there is relationship between poor social skills and loneliness and poor interpersonal communication and low self-esteem. Study by Erozkan (2009) indicated shyness, social anxiety and self-esteem predict loneliness.
Findings from research indicate there is negative relationship between tangible support and loneliness in students. In other words, tangible support leads to reduced loneliness in students. Also, there is negative relationship between emotional support and loneliness in students. In other words, emotional support leads to reduced loneliness in students. There is negative relationship between information support and loneliness in students. In other words, information support leads to reduced loneliness in students. There is no significant relationship between social support of kindness type and loneliness in students. Finally it was found there is no significant relationship between positive social interaction and loneliness in students. It is consistent with findings by MotamediShamalzari et al. (2002) and Shahini et al. (2012).
MotamediShamalzari et al. (2002) studied social support role in life satisfaction, general health and loneliness in elderly people. Their findings showed social support has significant impact on loneliness, general health and life satisfaction in elderly people. Also, emotional support played more significant role than instrumental support and especially emotional support role in loneliness, general health and life satisfaction was significantly more than instrumental support in elderly women. Shahini et al. (2012) studied correlation between social support, loneliness and life satisfaction among students of Golestan University of Medical Sciences. Their findings suggested students who receive adequate social support from family and friends feel more life satisfaction and suffer less loneliness.
Research findings indicate social support is negatively related to loneliness in students. In other words, social support leads to reduction of loneliness in students. In addition, there is negative relationship between social support and shyness in students. In other words, social support leads to reducedshyness in students.According to regression analysis it can be concluded that based on coefficient R2, loneliness and shyness can describe 0.130 variance of social support variable. In addition, in order to determine contribution of loneliness and shyness in predicting social support, based on regression coefficients (Beta) it can be stated contribution of loneliness and shyness is -0.231 and -0.326, respectively.
Tooba Farzadfar and Ali Jahangiry
Indian Journal Of Natural Sciences www.tnsroindia.org. © IJONS
Vol.5 / Issue 28/ February 2015 International Bimonthly ISSN: 0976 – 0997
2690
REFERENCES
1. Addison, T. L., & Schmidt, L. A. (1999). Are women who are shy reluctant to take risks? Behavioral and psychophysiological correlates. Journal of Research in Personality, 33(3), 352–357.
2. Arnett, J. J. (2007). Emerging adulthood: What is it, and what is it good for? Journal of Child Development Perspectives, 1(2), 68-73.
3. Block, J., & Robins, R. W. (1993). A longitudinal study of consistency and change in self-esteemfrom early adolescence to early adulthood.Child Development, 64, 909- 923.
4. Bruwer B, Emsley R, Kidd M, Lochner C, Seedat S.(2008) Psychometric properties of the Multidimensional Scale of Perceived Social Support in youth. Compr Psychiatry;49(2):195-201.
5. Cloutier,P. Martin.J. Kennedy.M. ,&Muehlenkamp.J.(2010). Characteristicsand Co-occurrence of Adolescent Non-Suicidal Self - Harm and SuicidalBehaviours in Pediatric Emergency Crisis ServicesPaulaCloutier.Journal ofYouth and Adolescence,39, 259-269.
6. Deniz ,M. E., &Hamarta, E. Arı, R. (2005). An investigation of social skills and loneliness levelsof university students with respect to their attachment styles in a sample of Turkish students. Social Behavior and Personality: An international journal, 33 (1), 19-30.
7. Durmuş, E. (2007). Utangaçolanveolmayanöğrencilerinalgıları *Perceptions of shy and non-shy students]. Ankara ÜniversitesiEğitimBilimleriFakültesiDergisi, 40(1), 243-268.
8. Erozkan, Atilgan. (2009). The Predictors of Loneliness in Adolescents. Elementary Education Online, 8(3), 809-819.
9. Fordham, K., & Stevenson-Hinde, J. (1999).Shyness, friendship quality, and adjustment during middlechildhood. Journal of Child Psychology & Psychiatry & Allied Disciplines, 40, 757-768.
10. Gilmartin, B. G. (2004). Peer group antecedents of severe love-shyness in males. Journal of Personality, 55, 467–489.
11. Ginsburg, G. S., La Greca, A. M., & Silverman, W. K. (1998). Social anxiety in children with anxietydisorders: Relation with social and emotional functioning. Journal of Abnormal Child Psychology, 26, 175-185.
12. Goldberg, J. O., & Schmidt, L. A. (2001).Shyness, sociability, and social dysfunction in schizophrenia. Schizophrenia Research, 48(2), 343–349.
13. Goldfried, M., & Davison, G.C. (2000).Ctinical behavior the New York: Holt. Rineh art & Winston, 20(2): 215-220. 14. Harter, S., Waters, P., &Whitesell, N. R. (1998). Relational self-worth: Differences in perceivedworth as a person
across interpersonal contexts among adolescents. Child Development, 69,756-766. 15. Hawkley, L. C., Browne, M. W., & Jacopo, J. T. (2004). How can I ConnectWith Thee? Let Me Count the Ways,
Research article of Psychological Science. American Psychological Society, 4, 171-180. 16. Hussein Chari, M. &Delavarpour, M. (2005).Relationship between social skills and shyness and comparison
between male and female students of Shiraz University, the Third Seminar on Mental Health. 17. Hymel, S., Rubin, K. H., Rowden, L., &LeMare, L. (1990). Children’s peer relationships: Longitudinalprediction
of internalizing and externalizing problems from middle to late childhood. Child Development, 61, 2004-2021. 18. Jacopo, J. T. (2009). Epidemic of Loneliness: Loneliness is far more than asocial misfortune. Psychology Today,
4(3), 125-131. 19. Jacopo, J. T., Hawkley, L. C. &Bernston, G. G. (2003).The Anatomy ofLoneliness. Current Directions in
Psychological Science, 3(12), 72-78. 20. Jones, W. H., Briggs, S. R., & Smith, T. G. (1986).Shyness: Conceptualization and measurement. Journalof
Personality and Social Psychology, 51, 629-639. 21. Koydemir, S., &Demir, A. (2008). Shyness and Cognitions:An Examination of Turkish University Students.
TheJournal of Psychology, 142(6), 633–644. 22. Lipetal, A. (2010). Elderly Perception of Loneliness and Ways of Resolvingit.Thesis for the degree of Master of
Science, Anna-Maria University. 23. Lu L.(1997). Social Support, reciprocity, and well-being. The Journal of Social Psyhology,1997,137 (5) 618-628. 24. Mijuskovic, B. (1986). Loneliness: Counseling adolescents. Journal of Adolescence,21, 941-950.
Tooba Farzadfar and Ali Jahangiry
Indian Journal Of Natural Sciences www.tnsroindia.org. © IJONS
Vol.5 / Issue 28/ February 2015 International Bimonthly ISSN: 0976 – 0997
2691
25. Miler,S,R.(2003).Shyness,social acceptance and self –esteem in early adolescence. Unpublished . 26. MotamediShamalzari, A. Ejehee, J., Azadfalah, P. &Kiamanesh, A.R. (2002). Role of social support in life
satisfaction, general health and loneliness among the elderly over 60 years, Journal of Psychology, No. 6 (2) consecutive 22)), pp. 115-133.
27. Nicpon, M., Huser, I., Blanks, E.H., Sollenberger, S., Befort, C., &Kurpius, S.E. R. (2007). The relationship of loneliness and social support with collegefreshmen’s academic performance and persistence. Journal of CollegeStudent Retention, 8, 345-358.
28. Peplau, L. A., & Perlman, D. (1982).Perspectives on loneliness. In L. A. Peplau, & D. Perlman (Eds.), Loneliness: A sourcebook of current theory, research and therapy (pp. 1e18). New York: Wiley.
29. Rezvankhah, M. (1997). Relationship between self-concept, loneliness and family structure, Master’s Thesis, AllamehTabatabai University
30. Roberts JE, Gotlib IH. (1997) Social support and personality in depression: Implications from quantitative genetics. In: Pierce RG editor. Sourcebook of social support and personality. New York: Plenum;.p. 187-214.
31. Rubin, Kenneth. H., Coplan, Robert. J. (2010).The Development of Shyness and Social Withdrawal Publications.336 pp. (ED512326).
32. Russell D. (1996).UCLA Loneliness scale (Version3):Reliability, validity and factor structure. J Pers Ass.;66:20-40. 33. Samuee, R. (2003). Shyness Scale, Research Institute of Behavioral Sciences, Sina (Mental Equipment), 103. 34. Schmidt, L. A., & Fox, N. A. (1995). Individual differences in young adults’ shynesssociability: Personality and
health correlates. Personality and Individual Differences, 19(4), 455–462. 35. Shahini, N., Asayesh, H., Ghobadi, M. &SadeghiAleabadi, J. (2012). Correlation of social support, loneliness and
life satisfaction among students of Golestan University of Medical Sciences in 2010, Pajuhandeh, No. 17 (6) consecutive 90)), pp. 302-306.
36. Sherbourne, D., & Stewart, A.L. (1991)The MOS social supportsurvey. Sot Science Medicine, 32(6), 705-714. 37. Smith, B. (1993). Overcoming shyness conquering your social fears.Maryland :silver crest books. 38. Spence, S. H., Donovan, C., &Brechman-Toussaint, M. (1999). Social skills, social outcomes, andcognitive features
of childhood social phobia. Journal of Abnormal Psychology, 108, 211-221. 39. WHO (1998). Glossary of health promotion, Tr. by M. Poureslami, S. Ayar, & H. Sarmast (2000), Tehran: Office of
Communications and Health Education, Ministry of Health and Medical Education. 40. Wright, S. L., Burt, C. D. B., & Strongman, K. T. (2006). Loneliness in theworkplace: Construct Definition and
scale Development. New Zealand Journalof Psychology, 4(2), 173-185. 41. Young, K. S. (1998). Internet Addiction: The emergence of a new clinicaldisorder. Cyber psychology and
Behavior, 1(3), 237-244. 42. Younger, A. J., Schneider, B. H., Wadeson, R., Guirguis, M., & Bergeron, N. (2000).A behaviourbasedpeer-
nomination measure of social withdrawal in children. SocialDevelopment, 9, 544-564. 43. Zimbardo, P. O. (1977). Shyness: What it is what to do about it? Massachusetts: Addison-Wesley.
Table 1: Cronbach’s alpha for research questionnaires
Questionnaire Cronbach’s alpha Shyness 0.834 Loneliness 0.781 Social support 0.814
Tooba Farzadfar and Ali Jahangiry
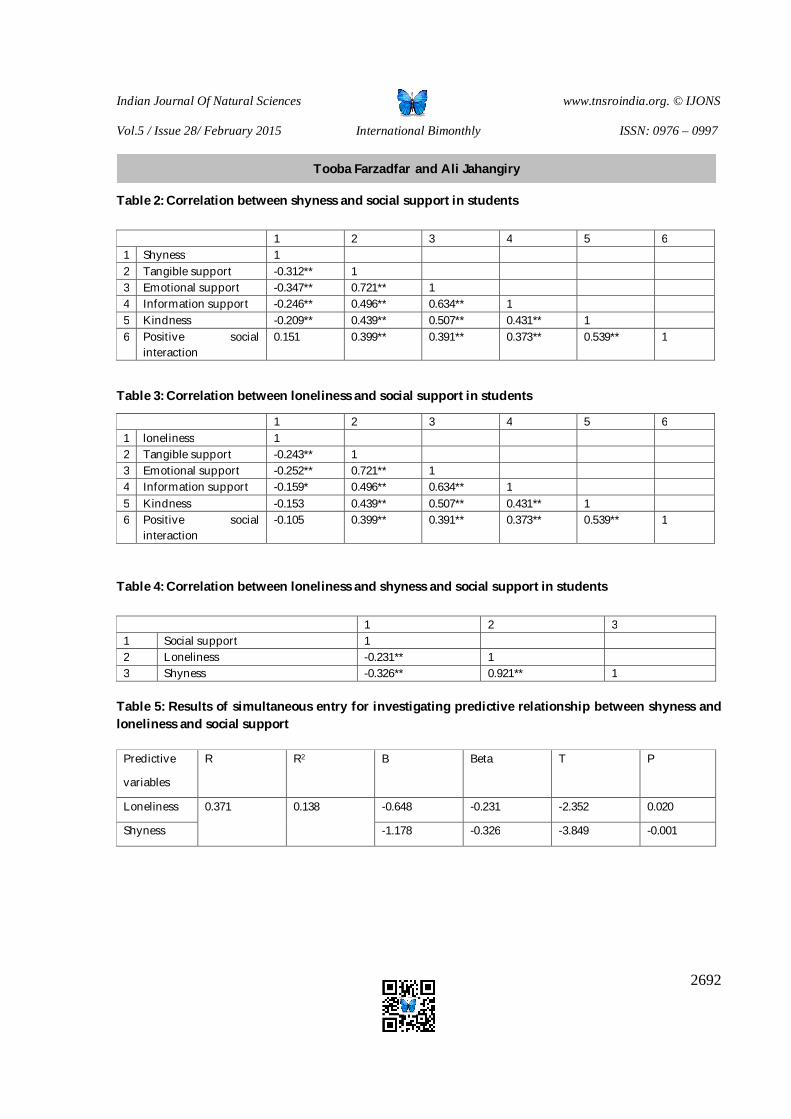
Indian Journal Of Natural Sciences www.tnsroindia.org. © IJONS
Vol.5 / Issue 28/ February 2015 International Bimonthly ISSN: 0976 – 0997
2692
Table 2: Correlation between shyness and social support in students
1 2 3 4 5 6 1 Shyness 1 2 Tangible support -0.312** 1 3 Emotional support -0.347** 0.721** 1 4 Information support -0.246** 0.496** 0.634** 1 5 Kindness -0.209** 0.439** 0.507** 0.431** 1 6 Positive social
interaction 0.151 0.399** 0.391** 0.373** 0.539** 1
Table 3: Correlation between loneliness and social support in students
1 2 3 4 5 6 1 loneliness 1 2 Tangible support -0.243** 1 3 Emotional support -0.252** 0.721** 1 4 Information support -0.159* 0.496** 0.634** 1 5 Kindness -0.153 0.439** 0.507** 0.431** 1 6 Positive social
interaction -0.105 0.399** 0.391** 0.373** 0.539** 1
Table 4: Correlation between loneliness and shyness and social support in students
1 2 3 1 Social support 1 2 Loneliness -0.231** 1 3 Shyness -0.326** 0.921** 1
Table 5: Results of simultaneous entry for investigating predictive relationship between shyness and loneliness and social support
Predictive
variables
R R2 B Beta T P
Loneliness 0.371 0.138 -0.648 -0.231 -2.352 0.020
Shyness -1.178 -0.326 -3.849 -0.001
Tooba Farzadfar and Ali Jahangiry

Indian Journal Of Natural Sciences www.tnsroindia.org. © IJONS
Vol.5 / Issue 28/ February 2015 International Bimonthly ISSN: 0976 – 0997
2693
An Introduction to Life and Thoughts of Muyiddin Ibn Arabi
Faraz Tajalli Nasr* , Seyyed Ebrahim Dibaji and Firooz Harirchi
Department of Arabic Language and Literature, Science and Research Branch, Islamic Azad University, Tehran, Iran.
Received:4 Jan 2015 Revised: 13 Jan 2015 Accepted:26 Jan 2015 *Address for correspondence Faraz Tajalli Nasr Department of Arabic Language and Literature, Science and Research Branch, Islamic Azad University, Tehran, Iran. E.mail: [email protected]
This is an Open Access Journal / article distributed under the terms of the Creative Commons Attribution License (CC BY-NC-ND 3.0) which permits unrestricted use, distribution, and reproduction in any medium, provided the original work is properly cited. All rights reserved. The truth, tenets and practices of Sufism has started by the first revelation. The great Sufis of Islam, either in the East or in the West of Islamic world, from the second century to the sixth century AD, gradually added the richness and wealth of Sufism so that by the mid-sixth century, when Ibn Arabi emerged, he was supported by a great treasure of spiritualities. Where the Shaikh was born and flourished in, the land of Andalusia, frequented by scholars, Sufis, and spiritual and effervescent cults and roaring spirituality. The advent of Ibn Arabi coincided with the announcement of a great and attractive theory both in terms of theological cosmology and in terms of psychology and anthropology, which it seemed a turning point would be arised in the Sufi tradition at the first years. Although the issues of divine wisdom had been discussed by earlier sufis like Hakim Tremez and Bayazid Bastami and theological theories is found in the works of Attar and Ibn Masarra, this study tries to focus on the ideas and commend of Muyiddin Ibn Arabi and a prominent figures in Sufism. Key words: Biography, prominent figures in Sufism, Worldview, psychology, anthropology.
ABSTRACT
RESEARCH ARTICLE
Indian Journal Of Natural Sciences www.tnsroindia.org. © IJONS
Vol.5 / Issue 28/ February 2015 International Bimonthly ISSN: 0976 – 0997
2694
BIOGRAPHY Abū Abd Allāh Muammad ibn Alī ibn Muammad ibn al-Arabī al-ātimī a-āī from the tribe of Hatim Taei1, known as Ibn Arabi was born in Murcia, Taifa of Murcia on the 17th of Ramadhan 561 AH (27th or 28 July 1165 AD); He died in Damascus in 1240 AD. The governor at that time was al-Mustanjid, the thirty second of the Abbasid Caliphate. Before a full tendency toward Sufism, Ibn Arabi had undergone several stages each of which in turn have an important contribution to his tendency toward Sufism, including his marriage to a pious and righteous women named Maryam, the daughter of Abdon Ibn AbduRahman Bajaee, who was an example of virtuous and abstemious women, the best friend of Ibn Arabi in difficulties and on of the influencing persons in his life. The other influencing person in Ib Arabi’s life was his mother; he was heavily influenced by the greatness and dignity of his mother. One inspiring factor was mysticism and piety of his uncle Abdullah Ibn Muhammad Arabi who was one of the mystics of his age. In addition, he was motivated by piety of his uncles Yahya ben Yaghan and Abu Moslim Khoulani whose greatness2 was exposed to Ibn Arabi; Yahya was the the governor of Tlemcen Province. Another thing that makes him inclined to Sufism was a sudden illness that was cured by healing prayers and reading Sura Yasin for improvement of his pains. Beyond, in his life he had met great scholars of philosophy and mysticism, especially Ibn Rushd, which motivated Ibn Arabi to describe his meeting with this Aristotelian philosopher in his late years. While he was writing The Meccan Openings, he remembered Ibn Rushd. All of the influences and motivations are landmarks in Sufism and thoughts of Ibn Arabi.3 To search the Iranian Sufism, it is useful to mention a review of his learnings and works, which he had earned from Rome to India during 25 years of his life in journey. Although Ibn Arabi claims that his works on “openings” are the divine openings, and mystical discoveries, and The Ringstones of Wisdom is donated to him by Muhammad in his dreams, he confessed that he had presented his dreams (revelations) in a rational language. His works constantly and consistently cites from Qur’an and Hadith, so if we say most of his works are the commentaries of the two traditional sources, we have not said anything as extravagant. In his works, he occasionally quotes aphorism, not long speeches, from earlier Sufis, but there is no evidence to prove that he has referred to other without documentation in his style. He was perfectly familiar with Islamic sciences, especially interpretation, jurisprudence, and the theological philosophy, but it does not seem to have read works of other philosophers, though many ideas of Ikhwan al-Safa are found in works of the authors.4 He was aware of his innovations. Most of the earlier Sufis had spoken of theoretical approaches (as opposed to practical teachings) in a manner allegorical, but Ibn Arabi’s idead broke this barrier like a huge flood that shows various implications of theories in “theology.” Despite continuous contemplation on the same main themes, he presents a higher-level discourse and leaves different perspectives in each of his readings. However, the book The Ringstones of Wisdom is the subject of many further descriptions and The Meccan Openings has considerable influence on Sufism in Iran. The later masterpiece is substantial because it includes many Shiite connotations; in other words, if a Shiite Sufi decided to comment on many of the topics in the book, he would write with no difference from what Shaikh has written on the matter. Another treatise, which has influenced on and manifested in philosophy and Literature of Sufis and philosophers, contains a description of his journeys and trips; it argues triple journey of a wayfarer seeker, a journey to Allah, a journey in Allah and a journey from Allah. It should be noted that Mulla Sadra’s masterpiece Four Journeys has been influenced by him. Tarjuman al-Ashwaq and its description is a key work for understanding and interpretation of Sufi lyrics in terms of mystical interpretation of
1 Ibn Arabi was from an ancient Arabic dynasty and if we follow his genealogy, he cames from Hatim Taei, as his name followed by Al- Hatim (Al- Fotouhat, 533/4). 2 The word of God, Ibn Arabi, Riyadh Mustafa al-Abdullah, p. 15. 3 Pilgrim at Mecca, Vil. 1, p. 352. 4 . F. Rosenthal, "Ibn 'Arabi between 'Philosophy' and 'Mysticism'," Oriens 31, 1988, pp. 1-35
Faraz Tajalli Nasr et al.

Indian Journal Of Natural Sciences www.tnsroindia.org. © IJONS
Vol.5 / Issue 28/ February 2015 International Bimonthly ISSN: 0976 – 0997
2695
love poems. In any case, the Shaikh and his students have never established new circles or a new school under the title of his name. Worldview and Ideas of Ibn Arabi The ideas of Ibn Arabi is important because the show the maturity and development of Islamic thoughts in various fields such as jurisprudence, theology, philosophy, mysticism, interpretation of Qur’an, Hadith Sciences, rhetoric, terminology, etc. On the one hand, investigation of his thoughts and teachings offers a review of Islamic thoughts in sixth and seventh Hegira (twelve and thirteen AD); on the other hand, Ibn Arabi is a bridge connecting world heritage and Islamic heritage.5 In this perspective, Ibn Arabi is an innovative and live link that connects all heritages of his age including either Christian and Jewish religious cultures, or intellectual and philosophical cultures. Ibn Arabis’ writings help the readers to understand works of Termez Hakim, Sahl al-Tustari, Mansur al-Hallaj, Ibn Masarra and Al-Niffari. To verify Ibn Arabi, researchers need to rebuild his predecessors’ thoughts to indicate how much their thoughts had an impact on thoughts of Ibn Arabi. Perhaps, one can claim that the inception of his thought was due to his journey to Konya in 1210. His thoughts was titled under the name of his student Sadr al-Din al-Qunawi (1274) who were one of the followers of his ideas in East Muslim world. Ibn Arabi’s effective range of ideas, views and thoughts was not limited to of Sufi opinions. As the result of his comprehensive contemplations, he had an impact on each of the Sufi styles of life. For instance, he is the origin of two famous Sufi dynasties, Mevlevi Order and Shadhalia Order, with his influence on Jalal al-Din Rumi in East and Abul Hasan ash-Shadhili in West.6 In any case, Ibn Arabi walks in a different path due to unknown reasons. Do his dreams has revolt the life of this pamper child? Or it was the consequence of his illness in childhood? Or the whole story was the result of a sudden stimulant in his career, when he met a great and high rank governor who worship God in his moanings and obeisance, he had promised himself to devote his life to the affairs of a God worshiped by all kings and governors. This idea is confirmed by Claude Addas and many other scholars who have studied the challenges of Ibn Arabi around 1184 that Arabi was twenty years old; but, there is no a document to prove the certainty and uncertainty of the claim. This date does not accord with the Shaikh’s report on his meeting with a Konyaian philosopher in adolescence. Did he meet Ibn Rushd at the age of fifteen? This idea is more reasonable. But the fact that his reputation had reached at such age and years to Ibn Rushd suggests that he had began to walk in the path years ago. In the report of his life, Shaikh calls “ignorance” the ages that he had not incept spirituality and inspiration and did not behaves in the manner of Sufis; the term “ignorance” is used for Arabs in pre-Islamic Arabia. The word, beyond its historical references, connotes an opposition to “Islam” because Islam has offered a lifestyle in contradiction to the earlier Arabic lifestyles. Tt seems that Ibn Arabi decided to divide his life period in two different ages by using the term: before entering the way - mysticism – that is his ignorance age and after entering the way, and acquiring knowledge through divine inspiration rather than the books, notebooks and school. Shaikh’s ignorance was expecting future, and the hadith of soul and young thoughts were the seeds of a prolific three in future. As it will be clarified, in Shaik’s philosophy nothing will comes from absurdity, and a human being in ignorance is the same person in his Islam, as it is cited from Muhammad that the best of yours in ignorance are your best in Islam. Ibn Arabi used these words frequently to announce that “goodness” has an inevitable and inseparable root in the instinct of human beings. Shaikh could uncover the secrets of security and safty from human instincts to animal instincts in various ways, but the ability was given to him after he began his first steps of mysticism, when he began to walk in the path; in other words, when he moves from the “goodness” of ignorance and unconsciousness to the “goodness” based on cognition
5 By heritage, the author means intellectual and cultural heritages; it presents to the next generations a collection of all previous works and thoughts. 6 As it is said by Ibn Arabi, Nasr Abo Zeid, p. 39.
Faraz Tajalli Nasr et al.
Indian Journal Of Natural Sciences www.tnsroindia.org. © IJONS
Vol.5 / Issue 28/ February 2015 International Bimonthly ISSN: 0976 – 0997
2696
and consciousness. The focus is not on only link and continuity between human and animal, but it is a connection resulted from the purity and titivation of human hearts and his ability to see the truth existed in nature of all phenomena of the universe including human beings, animals, plants and objects. Apart from all these items, it contains divine secrets of “expansion” and “compassion.” We know that the creation of universe began with an expression of mercy: first, mercy on all events by bringing them out from the inherent mode of non-existence to the mode of apparent existence; second, mercy on “names of God” the names that were hidden due to the magnitude of mercy, then He created the events for them to be released from limitations and reach to “expansion” and freedom.7 Ibn Arabi’s worldview turns around two elements, absolute truth and perfect human being, in an existential rise and fall. In each stage, he analyzes a body of important concepts relating to his onology and cosmology8 because the idea of the Trinity has assumed a very important role in Ibn Arabi’s thoughts. The existence of such idea with this degree of intensity is so strange in the beliefs of a Muslim Sufi. In this regard, Abul Ala Afifi asserts, “We are unable to change the facts; our fellow does revolt against what is certain and accepted by all Muslims. While he is able to make all concepts a subcategory to Unity of Existence, it seems natural to adopt Christian concepts so that he has adopted ideas from other scholars.9 Ibn Arabi is a proponent of the school of love and religion, and he cares so much about love that one may consider many of his topics as a subtitle for the concept of love. He began to explain universe based on the religion of love, in this manner he creates a coalition of different religions, which is an inconsistent idea with Western scholars who believed in the plurality of religions. Ibn Arabi’s Style in Writing The language and structure in some of his writings can uncover many features of his style. Before he moved to East in 598-99, he had written on various topics. However, it is not useful to count and comment on his numerous writings. In 632, he asserted that he had written about 289 treaties and books while Abd ar-Rahmān Jāmī has claimed in Breaths of Fellowship that he had written about 500 treaties and books. Abdul Vahab Sharani has counted his books and treaties as 400 ones. In History of Arabic Literature, Carl brockelmann believes that he has written about 250 publishes and unpublished works. In addition, the author of Multiple Deaths state, “The interpretation that is written by Ibn Arabi and known as Great Commentary includes 95 volumes.10 Ibn Arabi insists that none of his works and books is the same as books of other writers, but they are all inspirations and cognitions inseminated in his heart by God who has ordered him to announce to people. It is not surprising that he has used the style of Qur’an in arranging the chapters, sections, topics and lines, not the style of other writers; in other words, Shaikh tries to convince his readers that the order of book is not his, and more than anything, to convince that he has not written the book based on his own opinions. Ibn Arabi spreads his philosophy deliberately and intentionally all through his works so that if a scholar decides to offer a well-organized plan of his works, he will move around the lands of his ideas many times before choosing a point to start analysis. When the scholar choose a point as the base of his study, he will move from one point to another point step by step and reach the first point after passing a full circle of ideas at last. Obviousely, any researcher can choose a point to start his study on the opinions of Ibn Arabi, but he will never meet any final point for conclusion; achieving the end point is the most difficult step in studying Ibn Arabi. Arabi’s thoughts are
7 As it is said by Ibn Arabi, Nasr Abo Zeid, p. 49. 8 Sufism and Taoism. Izutsu. Trans. Muhammad Javad Gohari, p. 21. 9 Gems of Wisdom. Abul Ala Afifi, Trans. Hekmat, p. 187. 10 See Abul Ala Afifi’s introduction to Gems of Wisdom, p. 5. For more information about published and non-published works of Ibn Arabi, and translations, refer to The Great Islamic Encylopedia printed by Tehran: Markaz Da'irat al-Ma'arif al-Islamiyyat al-Kubra, 1998, Vol. 3. In addition, one can see furher information in Journal of MuhyiddinIbnArabi Society, especially issues three (1984) and four (1985).
Faraz Tajalli Nasr et al.
Indian Journal Of Natural Sciences www.tnsroindia.org. © IJONS
Vol.5 / Issue 28/ February 2015 International Bimonthly ISSN: 0976 – 0997
2697
“circular” and “becoming”. In this ‘becoming’ the joury does a start, but it will never end at a point; the circular structure of his thoughts is like the God’s manifestations, which has no start and no end. It is noteworthy that for Ibn Arabi, dream is not adoption and superiority of one style of expression to other styles; but it is only an instrument putting together various facts realities, and unifies them. The ability is the result of dream as a means for imagination and idealization. Imagination and ideas are the foundations on which basis the whole universe in structured. While the recognition of truth brings astonishment and wandering, the truth can lead in a perspective to see all creatures equally. Ibn Arabi argues that the scope of imagination is very vast and extensive. One of the effects of the expansion is the possibility of contradictory aggregation. In logics, the aggregation of contradictory elements is impossible in a single object; however, the power of imagination accepts the aggregation of contradictory elements. Another feature of imagination relates to its power to conceive abstract ideas as well as concrete objects. If one considers the world of dreams as the realm of imaginations, he will easily confess to the extent of imaginary world. The reality of imagination can be regarded as the existence of a shape in a mirror. It manifests in a way that no one can assert whether it does exist or it does not exist. In other words, one can say that imagination is an intermediate state. Ibn Arabi takes the advantages of all the skills, sciences, teachings and ideas of his predecessor thoughts including ideas of Greek and Islamic philosophers, the fatwa of Shiite and Sunni jurists, the opinions of both Mutazilite and Ashari theologians, the mystic religions of West and East, the comments of Muslim interpretators and narrators and the principles of all religions and groups. As it is said, he had been the inheritors of his predecessors’ sciences. In order to express and justify his thoughts, he had used intelligently and dexterity all of their sciences and teachings in his particular manner and taste. In this regard, all of his books and treaties are enriched with the opinion of both Muslim and Greek thinkers regarding their different sources, the beliefs of both theologians and mystics regarding their different stages and the fatwa of jurists regarding their different religions. All these contradictions are coincided with Qur’anic verses and Islamic traditions in such a way that all are justifying the principles and foundation of his mysticism, especially its most basic principle unity of existence. In spite of his discouragements for self-interpretation of Qur’an, he not only has interpreted Qur’as according to his personal beliefs but also has suggested glosses in his writings, which are discarded by most of the interpretations. However, Ibn Arabi believed that his interpretations are not self-interpretation and invalid, although they seem unreasonable, because his teacher is God and his learnings are acquired directly from God.11 Some times, he presents extremely unlikely origins for derivative expressions and words and finds new terms that are not finding in any glossary and encyclopedia, this method is discouraged by many famous scholars in the field of terminology.12 Ibn Arabi did not accept the taste of other scholars as ell as he did not pay attention to their beliefs.13 He did not follow and adhere to any person, but he tried to interpret others’ quotes and expressions in such a way to be consistent with his idea. He did not regard the efects of rational reasoning as real science because this science is the subject of doubts and uncertainty. He argues that science is a ability that will not be the subjected to doubts and uncertainty for the owner; this science is called acquired (inner) knowledge by him because acquisition and internally are two important features for scholars to recognize the truth of any real science. Therefore, for him, the real science and knowledge is induced in the heart of seeker, it is the divine light donated to special servants of God including angels, prophets, apostles and believers. The, he concludes that anyone who has not discovery, they have not knowledge; any science that does not follow the method of discovery and inner acquisition is not God’s science. While he is talking about it, he refers to Qur’an verse “14”فسئل ِبِھ خبیرًا ans claims, “Ask him about knowledge, because he knows himself among
11 Ibid, p. 26. 12 Mu yiddin Ibn Arabi, by Mohsen Jahangiri, p. 174. 13 Ibid, p. 185. 14 Al-Furqan, 59.
Faraz Tajalli Nasr et al.
Indian Journal Of Natural Sciences www.tnsroindia.org. © IJONS
Vol.5 / Issue 28/ February 2015 International Bimonthly ISSN: 0976 – 0997
2698
wise and conscious men; and says: what we have learned comes from discovery and acquisition, not from thinking and contemplation.”15 Relationship between Names of Allah and Perfect Man from the viewpoint of Ibn Arabi Before describing the perfect man by Ibn Arabi, Islamic culture contains expressions such as rational man, supreme man, truth man, first man. Before Ibn Arabi, Bayazid Bastami had used the expression ‘full completed man’ to describe a man who acquires a high place in spirituality. Later, Mansur al-Hallaj spoke of a man who had finished all of the stages of completeness, and he was the manifestation of God’s attributes, he was donated the position of “I am God.” Afer Hallaj, Nasir Khusraw al-Qubadiani talks about Ideal Adam and ideal Eve. However, the term perfect man was used by Ibn Arabi for the first time. All religions have referred to the perfect man; from Buddha to Confucius, Zoroaster, Christianity and Islam. Moreover, even scholars like Plato and Aristotle, Nietzsche and Marx and Islamic mystics have definitions for this word.16 It is called by Buddha (Arhat), by Confucius (Kevin Tsu), by Islam (Caliph of Allah), by Plato (the philosopher), by Aristotle (the great man), by Friedrich Nietzsche (Superman) and by Islamic Sufis (hub), (Shaikh) and (old of path).17 Ibn Arabi believes that the Prfect man is the most completed form of creatures.18 It is the place where all manifestations of God’s attributes and substantial realities are integrated; in fact, the whole universe is created for the perfect man.19 It is the bearer of the word “Being”, in other words, if the perfect man orders an object to exist, it exists; God has created him in the shape of Himself. Although the word “perfect man” can be found in the works of other authors, but this is the main topic of Sufism concentrated by Ibn Arabi. The perfect man, to say in brief, is a person who lives with “a nature containing God’s names and attrbutions” (Qur’an: 2:30). The names have been taught to human beings, and are similar to the God’s attribution including life, knowledge, will, power, speech, existence and justice. By realization of the names in themselves, human beings acquire the full completeness of God’s shape (attributes) and fulfil God’s intention in creating the universe.20 In some arguments, Ibn Arabi confirms Termez Hakim (Mohammad Ali Termez - the late third century) and claims, “in this issue, we are follower of Termez’s school and religion.” The perfect man and his relationship to the names of God are among these issues, and are regarded as the basic elements in Ibn Arabi’s mysticism and the theory of existence-unity; the theory was ascribed to Termez for the first time by Ibn Arabi.21 No individual of humankind can be a collection of all the Divine Names, unless he will be the manifestation of all divine attributes, and he will be talented to accept all the features.22 As it is mentioned in Qur’an that God has donated human beings from his attributes and god has all names within, man can be the mere manifestation of God and the mirror of God’s essence and attributes; all the names and attributes of God has invested in human beings to be emerged in the shape of human. Each creature is a name of God, and acquires the knowledge of God rom the name.23 Man is the appearance of all Devine Names; and, he has the knowledge of all names of God, all wisdom and all intuition, therefore, he is able to recognize God through all of his attributes. All the names and attributes of God emerge in form of human beings, and man has seen it all in him; in this case, a man’s hand is God’s hand, his blood is god’s blood and his soul is the soul of God.24 Ibn Arabi argues that Divine Names seek the existence of cosmos due to their nature. Therefore, God has created the structure and shape of cosmos like a corpse. Then, he puts the Adam, the first man, as the soul of
15 The Meccan Openings, trans. Muhammad Khajavi, p. 135. 16 The Perfect Man, Ibn Arabi, Majmood al-Ghorab, Trans. Golbaba Saidi, p. 1-21. 17 The Perfect man frm the ealier to present scholars, Abdol Karim Jeili, pp. 44, 48, 181. 18 The Meccan Openings, trans. Muhammad Khajavi, p. 260. 19 Ibid, p. 396. 20 Chitik, 1989, chapter 20. 21 The unity of Wxistence in Ibn Arabi and Eckhart’s narration. Ghasem Kakaee, p. 156. 22 Safi Interpretation. Mohsen Feiz kashani, trans. Muhammad Bagher Saedi, p. 238. 23 Comments on the Gems. Afifi, trans. Hekmat. P. 55. 24 The Verses of Beauty and Love: A Description of Lovers’ difficulties. Ahmad Ghazali. Riadhi, Vol. 2, [. 51.
Faraz Tajalli Nasr et al.
Faraz Tajalli Nasr et al.
Indian Journal Of Natural Sciences www.tnsroindia.org. © IJONS
Vol.5 / Issue 28/ February 2015 International Bimonthly ISSN: 0976 – 0997
2699
the corpse, or the cosmos. Existence of Adam has given the humanistic cosmos meaning; Devine Names have been invested as the potentiality of human beings. The result of the donated potentiality was human ability to conquer all other creatures. While having a name of an object is equal to having power to overcome the object. In any case, the perfect man is the assigned powerful creature because God is the absolute powerful, as well as the perfect man can be the assigned wise while God has the unconditional wisdom. The main purpose of God is only the perfect man because he has the appearance of all Devine Names. Consequently, the world is declined by human moving from this world to hereafter world; the movement to hereafter world will bring prosperity to hereafter world. Due to these reasons, the perfect man is the display of The Greatest Name, which includes the display of all other names.25 The name Allah encompasses all other names; if a person says Ya Allah in drowning, he refers to the name helper, assistance, etc. When he is sick and says Ya Allah, he means healing, caring and so on.26 Even Ibn Arabi believes that The Greatest name is manifested only in humankind, and claims that humankind is my head and I am the head of humankind.27
CONCLUSION All these lines proves the possible to announce that all studies on the thoughts of Ibn Arabi will not integrated in a particular point because Ibn Arabi was influenced by various factors including his teachers, his environmental conditions, connection with great figures of mysticism and occult sciences, effective education at the class of his father and several comments scattered in various books and papers. Apart from all these influencing elements, he had discovered many worlds and places to present expressions such as ‘the unity of existence,’ ‘the perfect man’ and his own worldview. His worldview was inspired by social and spiritual atmosphere of Easter Muslims (Syria, Iraq and Iran), noble mystical traditions, Greek thoughts, neo-Platonic ideas, Mu'tazilans and Ikhwan al-Safa as well as Aristotelian philosophical orientations like Mashaii and Ishraqi. Ibn Arabi went as far as to use the Christian philosophy of Trinity to justify his own theory of existence unity, and knows Trinity the same as monotheistic. To argue about his opinions on the unity of existence, one should avoid considering him as a philosopher because he concentrates on the notion of ‘perfect man’ to show his reasons. In his worldview, he displays the perfect man as a person who can attach to God’s names like creation, fulfillment and belonging to provide appropriate ground for his completeness. In Islamic traditions, he accepted some cosmological ideas of philosophy, particularly Avicenna, rather than the opinions of mystics like Hallaj, Termez Hakim, Bayazid Bastami, Ghazali and Ibn Musarra. He has often used argumentation style of theologians in his works. Moreover, one can claim that neo-Pythagorean aspirations and Ishmaelites religion are obvious in his authorship, and one can observe the most supreme meanings in his interpretation of Alexandrian Hermetic school. In his original works, he has recited Divine Names in the style of theologians and mystics in terms of arranging a kind of complexity and intricacy to utter his words. He describes a theoretical mysticism called love Sufism, or love mysticism. He can be considered among the great theoretical mystics of Islam. In any case, while we are talking about his theory, the unity of existence, we should bear in mind that traces of the theory is observable in the works of Hallaj and Abusaeid Abolkheir; the intensity of their concentration depends on the intuitive unity. Ibn Arabi’s intellectual system is summarized amidst the writings and ideas. Ibn Arabi’s language had an effect on the books in next generations; suffice it to say that the comprehension of his beliefs and ideas will be fulfilled in only the original language of the books not their translations. A short look on the version of translations shows that the translated version of the book does not represent concepts, metaphors, figurative speeches, and specific language of Ibn Arabi. It damages some of his books like Wisdom of the Prophets, which translated first to French, and then to English from the French version. His writing was influenced by some literary schools like imaginary style, Surrealism and Dadaism. All of his works are useful sources for various studies
25 Miracles of Speech: Interpretation of Sura Al-Fatiha, Sadr al Din Ghonavi. Trans. Muhammad khajavi, p. 75. 26 A treaty for Imam Razi, Ibn Arabi, etited by Heravi, p. 29. 27 Ghudia Treaty. Ibn Arabi. Trans. Hassan Gilani, p. 25.
Faraz Tajalli Nasr et al.
Indian Journal Of Natural Sciences www.tnsroindia.org. © IJONS
Vol.5 / Issue 28/ February 2015 International Bimonthly ISSN: 0976 – 0997
2700
in language and literary styles, subjects for analyzing the opinions of great scholars and philosophers. However, one should pay more attention on his expressions about the perfect man: any person can reach perfection, but through proficiency in Divine Names and the creation and fostering of the Names in his heart; despite of their geographical and time situation, one can close that the only absolute perfect is God.
REFERENCES 1. Ibn Arabi, Muyiddin. The Meccan Openings. Tans. Muhammad Khajavi, Mola Publication, Tehran, 2002. 2. Ibn Arabi, Muyiddin. As it is said by Ibn Arabi, Nasr Abo zeid, trans. Seid Muhammad Rastgoo, Nei Publication,
second print, Tehran, 2008. 3. Ibn Arabi, Muyiddin. Acollection of his books incuding Treaties on Magnitude and Beauty, The Fisrt and Al-
Ahed, The Greatness and Divine Names, Isra Shrine For Prisoners. First Press Edition, othmanian Encyclopedia of Hyderabad Deccan (ed.) 1984. Corrections by Najib Mayel Heravi, Tehran, 1988.
4. Jahangiri, Mohsen. Ibn Arabi: A leading figure in Islamic Mysticism. Tehran, Tehran University Press, 1996. 5. Izutsu, Toshihiko. Sufism and Taoism. Trans. Muhammad Javaher Gohari. Rozaneh publication, 2010. 6. Afifi, Abul Ala. Comments on the Gems: Description and Criticism of Ibn Arabi opinions. Elham publication, Tehran,
2011. 7. Feiz kashani, Mohsen. Safi Interpretation. Trans. Muhammad Bagher Saedi, Second print, alami, Beirut, 1982. 8. Ghonavi, Sadr al Din. Miracles of Speech: Interpretation of Sura Al-Fatiha. Trans. Muhammad khajavi. Mola
publication, Tehran. 9. Kashani, Ezadin Mahmod. Treasures of the Secrets and Symbols of the Freedom: A Description of the Difficulties
of Lovers. Trans. Nagovari, hossein, 2009. 10. Kakaee, Ghasem. The unity of Existence in Ibn Arabi and Eckhart’s Narration. Hermes Publication, Tehran, 2002.
Faraz Tajalli Nasr et al.
Indian Journal Of Natural Sciences www.tnsroindia.org. © IJONS
Vol.5 / Issue 28/ February 2015 International Bimonthly ISSN: 0976 – 0997
2701
Environment Rights in Iran: Foundations and Dimensions
Ahmad Azarmnia
The Head of Mehr Institution of Higher Education, Arak, Iran, Received:20 Dec 2014 Revised: 12 Jan 2015 Accepted: 31 Jan 2015 *Address for correspondence Ahmad Azarmnia The Head of Mehr Institution of Higher Education, Arak, Iran.
This is an Open Access Journal / article distributed under the terms of the Creative Commons Attribution License (CC BY-NC-ND 3.0) which permits unrestricted use, distribution, and reproduction in any medium, provided the original work is properly cited. All rights reserved.
One of the main questions about the environment issue is why despite works done about environmental resources, is often indicative of damage, destruction, un-success in conservation and sustainable management of these resources? During these recent decades, different types and forms of the objectives, policies, selection methods and strategies have been proposed. In this regard, it is appropriate that all individuals and different walks of life to solve environmental and social problems and difficulties try and save their environment from these critical situations. This paper will argue the concept of environment, environment objective, environment low and dimensions, the legal foundations of environment law, environment crimes and providing recommendations for improving current situation of environment.
Key words: Environment, right, foundations, dimensions, Iran.
INTRODUCTION
One of the main questions today about the environment issue and its rights, this question could be: Indeed, why despite works done about environmental resources, is often indicative of damage, destruction, un- success in conservation and sustainable management of these resources?
Reality is that during these recent decades, which have passed discussing of nationalization of environmental resources, different types and forms of the objectives, policies, selection methods and strategies have been proposed. Certainly this situation, was not only particular to Iran but also coupled with changing attitudes and new the scheme of things in national level or the world and affected by economic developments - social, cultural, and etc., developments also have taken place in matters of environmental resources. However, during these years, Iran like many countries word, in terms of resources and environment rights foundations with two basic processes, one threat to forest and grasslands habitats by reduction of surface and another case changes in quality biodiversity, reduction of wildlife species, congenital malformations in ecological status has faced that naturally continue the process country environmental resources will put at risk and hazard. In this regard, it is appropriate that all individuals and
ABSTRACT
RESEARCH ARTICLE
Indian Journal Of Natural Sciences www.tnsroindia.org. © IJONS
Vol.5 / Issue 28/ February 2015 International Bimonthly ISSN: 0976 – 0997
2702
different walks of life to solve environmental and social problems and difficulties try and save their environment from these critical situations (Dabiri, 2006).
The concept of environment
Environment is considered and examined in two concepts:
First, a concept that arises from the natural sciences with the human societies dealt with the ecological approach. Namely: "a set of natural phenomena and balance between competitor forces of nature that constrained the lives of a biologic group".
Second, a concept that arises from knowledge of Architecture and Urbanism in relation to interaction that between building (in a general sense) and environment in which is created, there is (Natural or synthetic). Environment experts in this field, various and other aspects of the environment have been considered and studied include: natural environment, artificial environment or man-made and social environment.
1) Natural environment
"Natural environment" as one of the main types of Environment is said to the Department of the Environment which containing a portion of Earth's surface area and is not also made by man. On this basis, mountains, plains, rivers, grasslands, forests, seas and all natural scenery are called "natural environment”. Constituent factors of natural environment can be classified into two parts, animate and inanimate factors: Animate factors included 1. Vegetation 2.wild life
2) Artificial environment or man-made environment and or humanistic environment
"Humanistic environment" is said to an environment that has made by human and is born human thinking. Humanistic environment result way of thinking and how culture of any society.
3) Social environment: Environment begins at home, including neighbors, colleagues and passers and etc.., in urban and rural communities and in other words, its scope continues up to nation and state (Sinaei, 1998).
Environment objectives
Today, all environmental objectives and policies are in order to protect and improve, so that a better life for all human beings, be possible. In fact, all environmental programs and policies have a common goal and that is to prevent or combat environmental pollution.
Therefore, in order to achieve environmental objectives, namely (To protect the environment and prevent environmental pollution and destruction of its symbols) it is essential that governments regarding development of technology and industry and new forms of pollution adopt and approve progressive rights, rules and regulations, yet useful to the process of development.
Environment Law
Environmental law is the law that evaluated the environmental legal norms and regulations. Environmental law, in fact, is one of the youngest and most important branch of public law. The importance of this field and its position is further in the sense that human life is directly connected with it. Because the environmental law, both in the domestic
Ahmad Azarmnia
Indian Journal Of Natural Sciences www.tnsroindia.org. © IJONS
Vol.5 / Issue 28/ February 2015 International Bimonthly ISSN: 0976 – 0997
2703
and in the international arena found a noble and worthy for and this development and excellence continue to expand.
Environmental Law, with respect to the world and its young, has the advantage that it can be worldwide and use legislative experiences and ideas, all of which are associated with environmental protection. Today, due to the high position and influence of environmental law and environmental protection, the international community has special attention to the Environmental Law. Undoubtedly, this particular look may have accelerated the adoption of legal rules and the consolidation of the status of environmental rights.In today's world, according to ((Environment)) and the protection and conservation, are very important. Undoubtedly, nobody can deny the destructive consequences and various issues and challenges related to environmental indifference.
Certainly, matters relating to the environment, in other words, environmental crises, like other social issues are not far from other legal issues and seek different legal aspects. In fact, from the beginning, and in establishing rules and regulations for the conservation of the environment and prosecuting the perpetrators of crimes against the environment; ((law)) plays an important role.As far as rules, ((non-compliance with Environmental Law)) and pollution and environmental degradation and destruction, in various aspects, is a crime and the offender based on the laws and regulations can be prosecuted and punished. Therefore, we find that ((law)) in general and ((criminal law)) specifically for the preservation and protection of the environment, play a major role (Office parliament, 1997).
Dimensions of Environment Law
Environmental law, like many other social issues, involved in various aspects.
Protection Aspect
Undoubtedly, all branches of the law, including environmental law, as a mechanism to achieve social control have been developed that their goal, namely to regulate the behavior and activities of individuals in society. Thus, one aspect of environmental law is the protection aspect. This means that environmental law, in order to protect the environment wants to control and regulate the community.
Aspects of awareness
One of the important goals of environmental law is protection of the environment. Accordingly, the increased awareness is achieved that our planet by multiple human infections and sometimes devastating technologies and also by harmful human activities, is at risk. Notification and alarming aspects of environmental law, indeed, influences governments and international organizations to express interest towards understanding the environmental conditions.
Criminal and penal Support aspect
Another aspect to be considered in environmental law, namely the need to protect the environment and to punish Perpetrators of criminal and criminal offenses against the environment. What is clear is that non-compliance with environmental regulations and acts that endanger the health and purity of environment, on different occasions, has the criminal aspect and based on relevant laws and regulations; the guilty is traceable, and punishable.
Attributing criminal aspect to environmental violations
Attributing criminal aspect to environmental violations and harmful activities and punish the perpetrators of these crimes activities, undoubtedly, in order to protect the environment and prevent pollution and destruction, it is not
Ahmad Azarmnia
Indian Journal Of Natural Sciences www.tnsroindia.org. © IJONS
Vol.5 / Issue 28/ February 2015 International Bimonthly ISSN: 0976 – 0997
2704
without effect. But we must also understand that today in fundamental and macro policies (true or false) environmental protection cannot have a major role (Ghasemi, 1998).
The legal foundations of environment law
The legal foundations of environmental law is usually divided into two categories as follows (Ghavam, 1996):
1. Local or national environmental law principles. 2. Principles of International Environmental Law.
A - Local or national environmental law principles
The principles of local or national environmental law, namely the existence of the competent authority within a country can regulate laws related to the environment. In other words, local or national environmental law principles: (a branch of national law which deals with existed laws and regulations on the environmental way).In today's world, a major portion of domestic environmental law, deals with regulatory, enforcement and services regulations and accordingly, in recent decades, various laws and regulations in the field of environmental issues, have approved with the relevant national authorities and finally implemented. Each country, in different ways, such decree, regulation or directive, regulate about the environment.What is clear is that all these rules have a common goal and that is to prevent or combat environmental pollution. In this regard, the evolution and changes in environmental laws of countries and amending and supplementing of them, given as an indicator of progress in the field of environmental protection.
B- Principles of international or transnational environmental law
One of the important principles of environmental law is (International Environmental Law).These rights as the newest branch of international law including the widths of international law that truly aims to protect the environment:(International Environmental Law is the set of rules, regulations and legislations of international law relating to the protection and conservation of the environment (prevention, control pollutant sources and its support).Accordingly, it should be noted that the sources of international law, are the resources that are offered in the field of international law including conventions, treaties and protocols, international customs, general principles of law, doctrine, etc.)
Environment Crimes
In the case of crimes against the environment, according to the criminal policies of different countries, some or all of the above penalties along with other punishments and supplementary tool to be used. Some of the most penalties include:
1) Prison: One of the most common punishments for criminal offenses against the environment, is prison.
Although the law of most states, regulations concerning major offenses punishable by imprisonment in the case of environmental pollution but it is not clear to what extent these provisions are actually implemented. Probably ... this punishment in the law, for psychology reasons to show the importance of the crime of pollution, are incorporated. In our country due to criminal records and justice procedure in cases of crimes against the environment ... it is seen that the sentence of prison is used rarely. Specifically crimes against the environment, especially in the case of legal entities (such as factories and manufactories) the sentence is rarely used.
2) The penalty or fine: One of the penalties is more widely applied than imprisonment and is common in almost all countries. Indeed the criminal tool is penalty or fine. (Fine is forced pay an amount of money as a penalty to the state
Ahmad Azarmnia
Indian Journal Of Natural Sciences www.tnsroindia.org. © IJONS
Vol.5 / Issue 28/ February 2015 International Bimonthly ISSN: 0976 – 0997
2705
treasury. Specialists in criminal law and penology, considered concessions for cash penalty to the punishment of prison (imprisonment, etc.)....
3) Compensation: Generally any such contamination of water, soil, air and environmental may follow degradation will be liable to pay compensation. Today, the Environmental Protection Agency to increase the pressure of this organizations to obligate the offenders to pay compensation and executive action to the reduce pollution, has done relatively effective actions.
4) Shut down or sealing: in some cases, warnings of Environmental Protection Agency, would not be effective and polluting industrial units, with strong background, dispose warnings, and continue their work process. In this case, shut down or sealing polluting units is one of the strategies that have been licensed to the Environmental Protection Agency (Ghasemi, 1998).
Recommendations
With regard to this issue, perhaps the best way out of this situation, certainly is due to law, cultural and social issues of environment. Why the management of environmental resources requires a holistic and comprehensive measures of when the realization of it is possible that each of the parties involved do its tasks with honesty, integrity and belief.
Raising public awareness about the dangers of pollution and destruction of the environment and comply with recommendations made by the custodians of environmental issues, preventing loss of vegetation and forest resources and enhance the knowledge of farmers, efficient use of factors of production such as land, water and maintain proper crop frequency and reduction in the fallow land, non- shedding materials such as pain and consumed engine oil in rivers and seas, health care facilities in the transportation and disposal of waste and proper disposal, choosing the right place to build factories and pollutant manufactories , exploitation and management of soil and water resources, preservation , restoration and principal operation of renewable resources and considering the balance of the environment, modifying production and consumption patterns, environmental standards, selection of appropriate technologies to minimize pollution and degradation, can help prevent problems and environmental hazards, population policies , inform the polluting factories and manufactories about the dangers of harmful activities against the environment, creating a true urban system - establishing green space, canalling, optimization of wastewater etc. the creation and development of forests and artificial lakes, efforts to better communicate with residents in the nearby forests and villages to their participation in the conservation, reviewing of substances of the Environmental Protection and Conservation Act due to the time requirements and socio- economic conditions which are needed to be modified and continuation of politics to reduced timber harvest.
REFERENCES 1. Dabiri, M. 2006. Environment pollution. Tehran: Etehad publication 2. Office of parliament. 1997. Laws and regulations of environment protection. Tehran: publication of environment
protection. 3. Sinaei, V. 1995. Sustainable development and tourism. Journal of political and economic information. No 11& 12. 4. Ghasemi, N. 1998. Penal support of environment. Monthly Security. Tehran: publication of ministry interior. No
5&6. 5. Ghavam, A. 1996. Penal support of environment. Tehran: publication of publication of environment protection.
Ahmad Azarmnia