Embed Size (px)
Citation preview

1 23
Arabian Journal of Geosciences ISSN 1866-7511Volume 6Number 2 Arab J Geosci (2013) 6:491-503DOI 10.1007/s12517-011-0370-z
Mineralogy, geochemistry, and reserveestimation of the Euphrates limestone forPortland cement industry at Al-Najaf area,South Iraq
Mautaz Al-Dabbas, Salih MuhammadAwadh & Ayad Abed Zaid

1 23
Your article is protected by copyright and all
rights are held exclusively by Saudi Society
for Geosciences. This e-offprint is for personal
use only and shall not be self-archived in
electronic repositories. If you wish to self-
archive your work, please use the accepted
author’s version for posting to your own
website or your institution’s repository. You
may further deposit the accepted author’s
version on a funder’s repository at a funder’s
request, provided it is not made publicly
available until 12 months after publication.

ORIGINAL PAPER
Mineralogy, geochemistry, and reserve estimationof the Euphrates limestone for Portland cement industryat Al-Najaf area, South Iraq
Mautaz Al-Dabbas & Salih Muhammad Awadh &
Ayad Abed Zaid
Received: 12 April 2011 /Accepted: 20 June 2011 /Published online: 7 July 2011# Saudi Society for Geosciences 2011
Abstract This study deals with the mineralogical andgeochemistry of the Euphrates Formation (Lower Miocene)in Bahr Al-Najaf area in order to assess the lithofacies of theEuphrates Formation for Portland cement manufacturing.Petrographic and mineralogical studies were carried out on210 core samples, collected from 21 boreholes, and showedthat calcite is the dominant mineral with few amounts ofquartz, gypsum, feldspar, and a rare amount of dolomite.Clay mineral suites (palygorskite, kaolinite, montmorillonite,and illite) formed about 5% from the total mineralcomposition. Palygorskite precipitated directly in alkalishallow water rich with Si and Mg ions. Chemicalweathering of feldspar under acidic conditions participatedin formation of Kaolinite. Geochemistry showed that there isno high variation in chemical constituents with depth, andthe average of CaO (51.5), MgO (0.83), SO3 (0.54), SiO2
(4.3), Fe2O3 (0.45), Al2O3 (0.93), L.O.I (40.7), Na2O3
(0.08), K2O (0.14), and Cl- (0.1) qualified the lithofacies ofEuphrates Formation to be raw materials suitable formanufacturing the Portland cement. Triangle Block methodis applied to estimate the reserve on square area (2×2 km2)which is computed to be 63 million tons of medium-toughlimestone as potential probable reserve.
Keywords Mineralogy . Geochemistry . Reserveestimation . Cement industry . Iraq
Introduction
The cement production in Iraq was initiated at 1949,where the first plant was established with productioncapacity of about 8,000 t per year. As a result ofeconomic and constructional progress and project devel-opment, there was an increase in demand of this materialand to serve new companies and plants to cover localmarket needs. The General Southern Company for Cementis one of three companies that were distributed to in thenorth, central, and south of Iraq. This includes eightfactories in: Al-Najaf, Al-Kufa, Karbala, Al-Sadaa, Al-Muthana, Al-Samawa, and Um-Qasir. Their conventionalproducts are two kinds of cement, normal and resistance.Industrialization of these products depended on rawmaterials such as limestone, clay, and gypsum, whichwere considered as the key to success of the cementindustry. The favorable formation for purpose of Portlandcement industry is the Euphrates Formation.
The chemical composition for the clinker of Portlandcement (mixture from 70% limestone+30% clay) dependsessentially on the chemical composition of the rawmaterials (Dabous et al. 1989).
The Euphrates Formation which has many exposuresin the Iraqi Western Desert especially along theEuphrates River and in the south of Iraq, near Al-Najaf,had been deposited in shallow marine environment(Cytroky and Karim 1969, unpublished; Youkhanna1971, unpublished).
M. Al-Dabbas : S. M. Awadh (*)Earth Sciences Department, College of Science,University of Baghdad,Baghdad, Iraqe-mail: [email protected]
A. A. ZaidAl-Kufa Cement Plant,Kufa, Iraq
Arab J Geosci (2013) 6:491–503DOI 10.1007/s12517-011-0370-z
Author's personal copy

This work aims to assess limestone rocks of the EuphratesFormation based on their geochemical characteristics ascement raw material and to estimate probable reserve.
Location and nature of the study area
Bahr Al-Najaf area is located within the tectonic SalmanZone (Fig. 1) which belongs to the stable shelf zone that isdistinct by its shallow Basement Rocks (Jassim and Goff2006). The area of study is 4,000 km2 which is accuratelydetermined by the longitudes (44º00′00″–44º30′00″) and
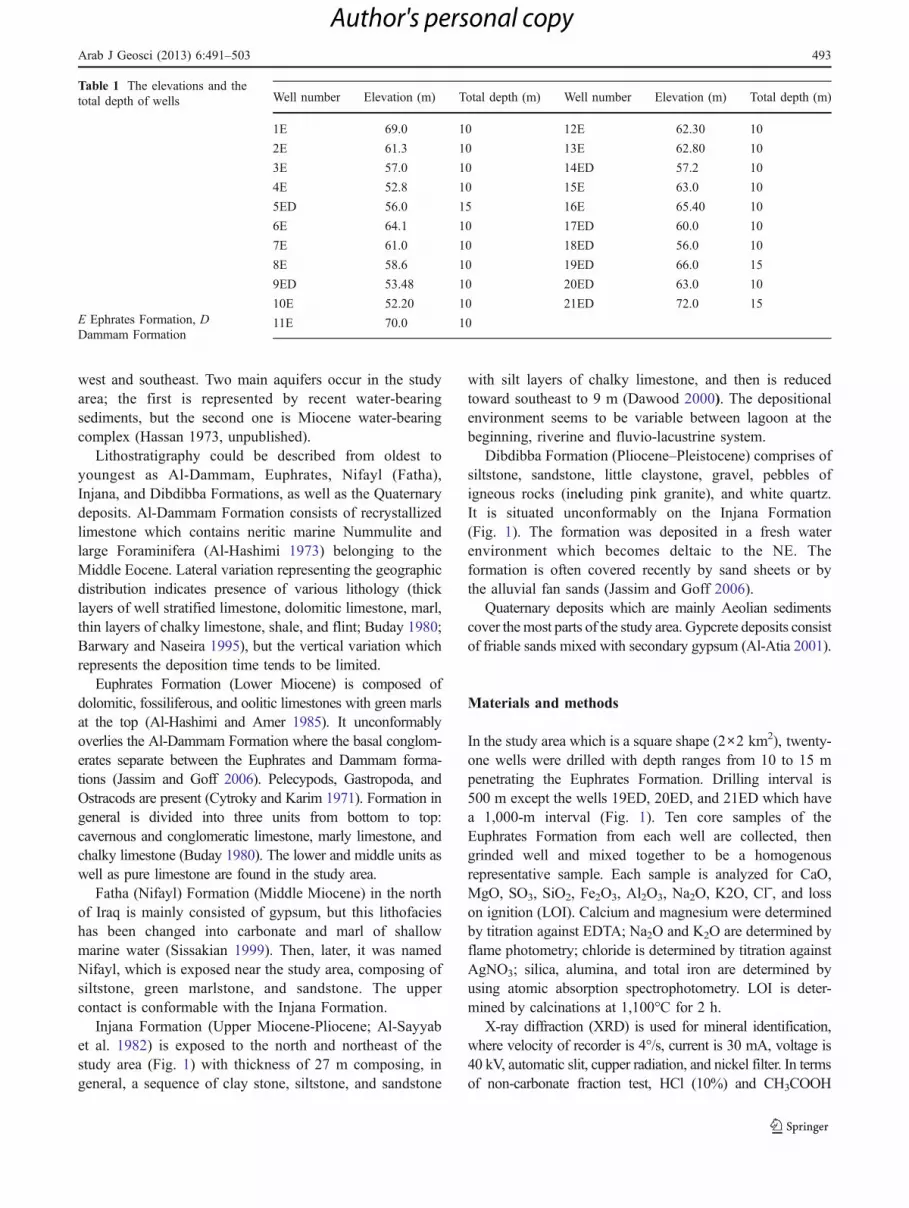
latitudes (31º30′00″–32º00′00″). It is situated on thesouthern west edge of Bahr Al-Najaf. The EuphratesFormation is exposed at the surface of the study area where21 wells were drilled in (Fig. 1). The elevation and totaldepth of each well are listed in Table 1.
General geology
The highest point at the study area has an altitude of 135 mabove the sea level at the northwest, and gradually, landdecreases to a minimum (50 m) above the sea level to the
Fig. 1 Simplified tectonic and geological map show the location of study area and borehole grid distribution
492 Arab J Geosci (2013) 6:491–503
Author's personal copy
west and southeast. Two main aquifers occur in the studyarea; the first is represented by recent water-bearingsediments, but the second one is Miocene water-bearingcomplex (Hassan 1973, unpublished).
Lithostratigraphy could be described from oldest toyoungest as Al-Dammam, Euphrates, Nifayl (Fatha),Injana, and Dibdibba Formations, as well as the Quaternarydeposits. Al-Dammam Formation consists of recrystallizedlimestone which contains neritic marine Nummulite andlarge Foraminifera (Al-Hashimi 1973) belonging to theMiddle Eocene. Lateral variation representing the geographicdistribution indicates presence of various lithology (thicklayers of well stratified limestone, dolomitic limestone, marl,thin layers of chalky limestone, shale, and flint; Buday 1980;Barwary and Naseira 1995), but the vertical variation whichrepresents the deposition time tends to be limited.
Euphrates Formation (Lower Miocene) is composed ofdolomitic, fossiliferous, and oolitic limestones with green marlsat the top (Al-Hashimi and Amer 1985). It unconformablyoverlies the Al-Dammam Formation where the basal conglom-erates separate between the Euphrates and Dammam forma-tions (Jassim and Goff 2006). Pelecypods, Gastropoda, andOstracods are present (Cytroky and Karim 1971). Formation ingeneral is divided into three units from bottom to top:cavernous and conglomeratic limestone, marly limestone, andchalky limestone (Buday 1980). The lower and middle units aswell as pure limestone are found in the study area.
Fatha (Nifayl) Formation (Middle Miocene) in the northof Iraq is mainly consisted of gypsum, but this lithofacieshas been changed into carbonate and marl of shallowmarine water (Sissakian 1999). Then, later, it was namedNifayl, which is exposed near the study area, composing ofsiltstone, green marlstone, and sandstone. The uppercontact is conformable with the Injana Formation.
Injana Formation (Upper Miocene-Pliocene; Al-Sayyabet al. 1982) is exposed to the north and northeast of thestudy area (Fig. 1) with thickness of 27 m composing, ingeneral, a sequence of clay stone, siltstone, and sandstone
with silt layers of chalky limestone, and then is reducedtoward southeast to 9 m (Dawood 2000). The depositionalenvironment seems to be variable between lagoon at thebeginning, riverine and fluvio-lacustrine system.
Dibdibba Formation (Pliocene–Pleistocene) comprises ofsiltstone, sandstone, little claystone, gravel, pebbles ofigneous rocks (including pink granite), and white quartz.It is situated unconformably on the Injana Formation(Fig. 1). The formation was deposited in a fresh waterenvironment which becomes deltaic to the NE. Theformation is often covered recently by sand sheets or bythe alluvial fan sands (Jassim and Goff 2006).
Quaternary deposits which are mainly Aeolian sedimentscover themost parts of the study area. Gypcrete deposits consistof friable sands mixed with secondary gypsum (Al-Atia 2001).
Materials and methods
In the study area which is a square shape (2×2 km2), twenty-one wells were drilled with depth ranges from 10 to 15 mpenetrating the Euphrates Formation. Drilling interval is500 m except the wells 19ED, 20ED, and 21ED which havea 1,000-m interval (Fig. 1). Ten core samples of theEuphrates Formation from each well are collected, thengrinded well and mixed together to be a homogenousrepresentative sample. Each sample is analyzed for CaO,MgO, SO3, SiO2, Fe2O3, Al2O3, Na2O, K2O, Clˉ, and losson ignition (LOI). Calcium and magnesium were determinedby titration against EDTA; Na2O and K2O are determined byflame photometry; chloride is determined by titration againstAgNO3; silica, alumina, and total iron are determined byusing atomic absorption spectrophotometry. LOI is deter-mined by calcinations at 1,100°C for 2 h.
X-ray diffraction (XRD) is used for mineral identification,where velocity of recorder is 4°/s, current is 30 mA, voltage is40 kV, automatic slit, cupper radiation, and nickel filter. In termsof non-carbonate fraction test, HCl (10%) and CH3COOH
Well number Elevation (m) Total depth (m) Well number Elevation (m) Total depth (m)
1E 69.0 10 12E 62.30 10
2E 61.3 10 13E 62.80 10
3E 57.0 10 14ED 57.2 10
4E 52.8 10 15E 63.0 10
5ED 56.0 15 16E 65.40 10
6E 64.1 10 17ED 60.0 10
7E 61.0 10 18ED 56.0 10
8E 58.6 10 19ED 66.0 15
9ED 53.48 10 20ED 63.0 10
10E 52.20 10 21ED 72.0 15
11E 70.0 10
Table 1 The elevations and thetotal depth of wells
E Ephrates Formation, DDammam Formation
Arab J Geosci (2013) 6:491–503 493
Author's personal copy

(5%) added to bulk carbonate samples to remove carbonates;then clay minerals, feldspar, and quartz are identified easily byusing XRD. Bulk density and compressive strength are testedin ten core samples collected from ten selected wells. Allprocedures above are achieved at the State Company ofGeological Survey and Mining in Baghdad. For reserveestimation, the Triangle Blocks method is applied.
Results and discussion
Mineralogy
Non-clay minerals are represented by calcite, dolomite,quartz, feldspar, and gypsum, where calcite appears to bethe predominant and participated more than 90% of thetotal constituents (Figs. 2 and 3). Dolomite is noticed undermicroscope in scarce quantity with fine subhedral grainscharacterized by rhombohedral cleavage and symmetricalextinction, whereas it was undetectable by XRD due to itsscarcity. Quartz has heterogeneous distribution whereversilicification has happened but, in general, existed in smallquantities. Feldspar and gypsum are also existed as traces.Gypsum has scarce and heterogeneous distribution (Fig. 3).
Figure 4 illustrated the clay minerals as well as quartz andfeldspar in a sample that has been treated with 10% HCl and
5% CH3COOH acids for removing carbonates. Most of clayminerals are formed as a result of the physical and chemicalweathering process which happened on various rocks duringthe digenetic processes or direct precipitation. Small quan-tities of kaolinite, montmorillonite, illite, and palygorskiteare detected by XRD. Kaolinite primarily formed due toweathering of feldspars under acidic conditions. Palygorskiteappear to be formed directly in shallow marine of alkali pH.This mineral requires alkaline conditions and high silicon andmagnesium activities for stability (Singer 1989). Al-Bassam(2000) and Kadhim (2009) mentioned that this mineralformed in different environments range from marine tocontinental environments. Montmorillonite is very rare. Theorigin of illite is preferred to be potash feldspar. Illite isrecognized by the weathering of silicates (primarily feldspar)through the alteration of other clay minerals.
Geochemistry
Table 2 displays the result of chemical analyses of cementraw materials which are compared with results of Duda1985, who determined the acceptable limits of rawmaterials for cement industry.
Portland cement consists mainly of lime (CaO), silica(SiO2), alumina (Al2O3), and ferric oxide (Fe2O3) com-pounds which constitute the bulk of the raw mix. The
Fig. 2 X-ray diffractograph shows minerals in carbonate sample
494 Arab J Geosci (2013) 6:491–503
Author's personal copy

Fig. 3 X-ray diffractograph shows minerals in carbonate sample
Fig. 4 X-ray diffractograph shows minerals treated with acids
Arab J Geosci (2013) 6:491–503 495
Author's personal copy

Tab
le2
Resultsof
chem
ical
analyses
oftheEup
hrates
Formationraw
materials
Wellnu
mber
CaO
%MgO
%SO3%
SiO
2%
Fe 2O3%
Al 2O3%
LOI%
Na 2O%
K2O%
Cl%
Total%
1E54
.60
0.43
<.07
1.09
0.10
0.16
43.39
0.05
0.03
0.10
99.95
2E50
.86
0.75
0.23
5.39
0.58
1.24
40.60
0.04
0.26
0.12
100.07
3E.
51.38
0.85
<.07
5.02
050
0.82
41.08
0.04
0.14
0.14
99.97
4E45
.40
1.50
0.27
10.42
1.36
3.86
36.0
0.13
0.35
0.14
99.43
5ED
54.30
0.47
<.07
1.21
0.19
0.32
43.08
0.20
0.03
0.18
99.03
6E49
.84
0.80
2.51
4.98
0.56
1.10
39.07
0.10
0.20
0.12
99.27
7E54
.42
0.49
0.32
3.29
0.10
0.17
40.93
0.09
0.04
0.09
99.94
8E48
.58
2.00
<.07
6.19
0.60
1.39
39.66
0.20
0.23
0.18
99.03
9ED
53.06
0.58
0.47
2.89
0.27
0.53
42.02
0.04
0.09
0.09
100.04
10E
54.60
0.48
<.07
0.90
0.22
0.43
42.98
0.06
0.08
0.09
99.84
11E
49.88
0.90
1.47
6.5
0.81
1.65
38.0
0.09
0.33
0.13
99.76
12E
47.28
1.15
0.26
8.7
1.12
2.39
38.11
0.07
0.52
0.12
99.72
13E
51.24
0.95
<.07
5.03
0.44
0.92
41.02
0.09
0.11
0.11
100.01
14ED
49.84
0.43
<.07
8.79
0.12
0.23
39.79
0.05
0.14
0.14
99.42
15E
54.78
0.37
0.57
0.71
0.08
0.14
43.05
0.04
0.02
0.14
99.9
16E
49.1
1.0
<.07
6.5
1.06
1.27
39.9
0.05
0.15
0.12
99.15
17ED
50.92
0.8
0.3
5.36
0.53
0.98
40.67
0.12
0.13
0.12
100.09
18ED
52.36
0.75
<.07
3.67
0.19
0.53
41.83
0.03
0.03
0.12
99.51
19ED
53.9
0.65
<.07
1.53
0.14
0.22
43.18
0.03
0.02
0.09
99.76
20ED
52.12
1.50
2.1
1.9
0.42
0.97
40.69
0.06
0.04
0.09
99.89
21ED
52.82
0.65
2.09
2.41
0.13
0.20
41.02
0.16
0.03
0.11
99.62
Range
45.4–5
4.7
0.37–2
.0<.07–
2.5
0.71–1
0.42
0.10–1
.36
0.14–3
.86
35.66–
43.39
0.03–0
.20
0.02–0
.35
0.09–0
.18
99.03–
100.09
Average
51.40
0.83
0.52
4.3
0.45
0.93
40.72
0.08
0.14
0.1
99.70
Dud
a19
85≥4
5.0
≤2.0
≤1.5
≤6.75
≤0.66
≤2.0
≥38.0
≤0.28
≤0.2
≤0.1
496 Arab J Geosci (2013) 6:491–503
Author's personal copy
combined content of these four oxides (major constituents)is approximately 90% of the cement weight. The remaining(minor constituents) 10% consists of magnesia (MgO),alkalis (Na2O and K2O), chloride (Clˉ), and SO3. A fewpercent of gypsum usually added during grinding forregulating the setting time of the cement (Lea 1970; Soroka1979; Kohlhaas 1983; Duda 1985).
The concentration of CaO ranges from 45.5% to 54.7%with an average of 51.5%. LOI produced by decompositionof carbonate minerals as CO2, ranges from 35.6% to 43.4%with an average of 40.7%. The domination of calcite withlack of dolomite reflected in the content of the MgO whichranged from 0.37% to 2.0% with average of (0.83%).
Silica (SiO2) and alumina (Al2O3) are originated from claymineral suites but part of silica also belongs to quartz. SiO2
ranges from 0.71% to 10.42% with an average 4.3%.Sometime silica exists as lenses in some of the studiedsamples as in well 4E in depth 5 m. Al2O3 ranges from 0.14%to 3.86% with average 0.93% are derived totally from clayminerals.
Fe2O3 ranges from 0.1% to 1.36% with an average 0.52%;some of ferrous (Fe2+) could replace Mg2+ in dolomite(Rankama and Sahama 1950). In addition to dolomite, thisoxide may be originated from many sources such as clayminerals and limestone even these exist as traces.
SO3 participated in less quantity of the total LOI; it isranged from 0.07% to 2.5% with average 0.52%. It isyielded from gypsum lenses that are presence within theEuphrates Formation. Sulfur content in the final product of
cement may be higher. Generally, the sulfur source in theproduced cement attributed to the raw materials, the addedgypsum to the clinker, and the used water in clinker mixtureas well as the used fuel (black oil). Duda (1977) andSchafer (1987) mentioned that the sulfur content in cementbelongs to the raw materials and the used fuel.
Alkalis appear to have low content; Na2O ranges from0.03% to 0.2% with average of 0.08%, whereas K2O rangesfrom 0.02% to 0.35% with average of 0.14%.
Chloride (Clˉ) may be originated from the ground wateror from halite during evaporation of sea water; it rangesfrom 0.09% to 0.18% with average of 0.1%. Major oxidesand minor constituents appear to be qualified for cementindustry in comparison with standard results of Duda 1985.
Reserve estimation
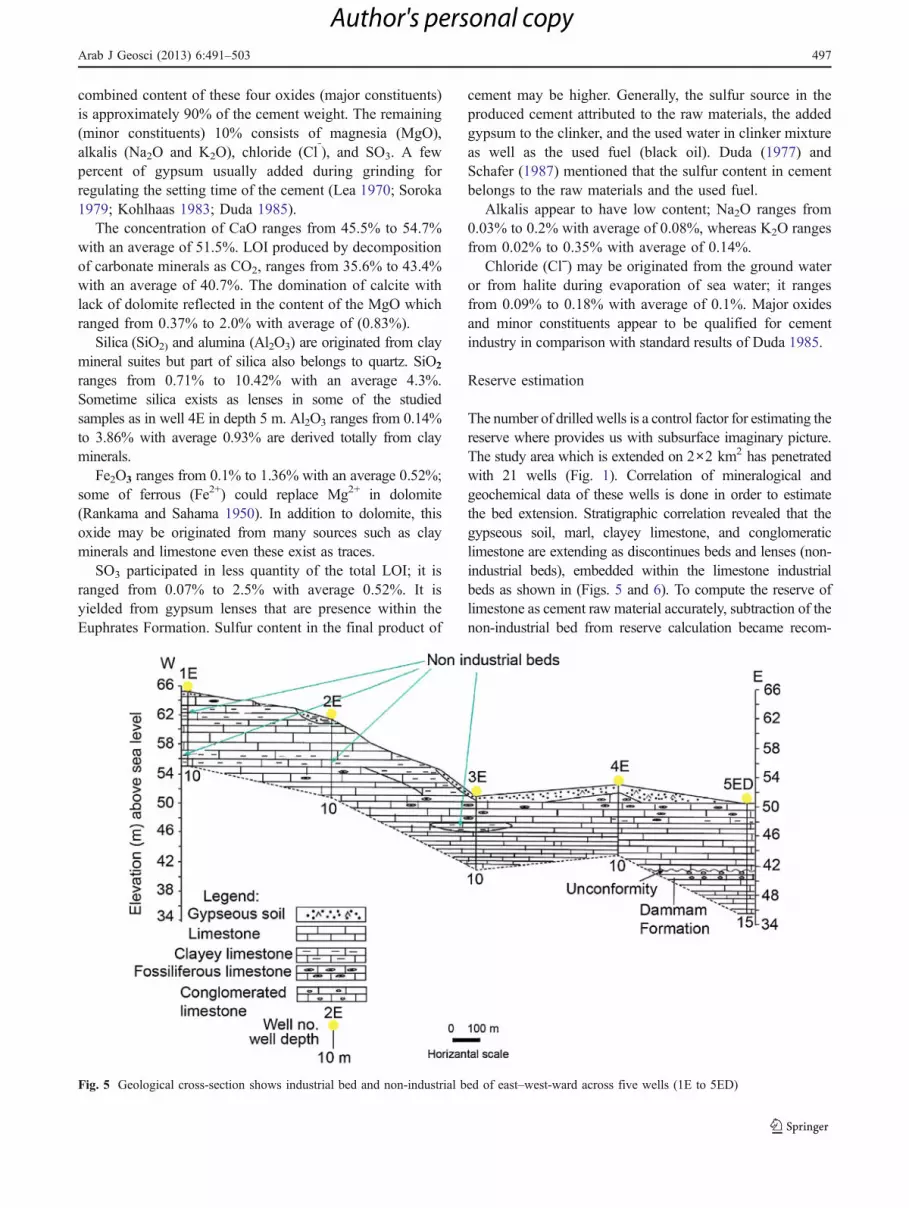
The number of drilled wells is a control factor for estimating thereserve where provides us with subsurface imaginary picture.The study area which is extended on 2×2 km2 has penetratedwith 21 wells (Fig. 1). Correlation of mineralogical andgeochemical data of these wells is done in order to estimatethe bed extension. Stratigraphic correlation revealed that thegypseous soil, marl, clayey limestone, and conglomeraticlimestone are extending as discontinues beds and lenses (non-industrial beds), embedded within the limestone industrialbeds as shown in (Figs. 5 and 6). To compute the reserve oflimestone as cement raw material accurately, subtraction of thenon-industrial bed from reserve calculation became recom-
Fig. 5 Geological cross-section shows industrial bed and non-industrial bed of east–west-ward across five wells (1E to 5ED)
Arab J Geosci (2013) 6:491–503 497
Author's personal copy
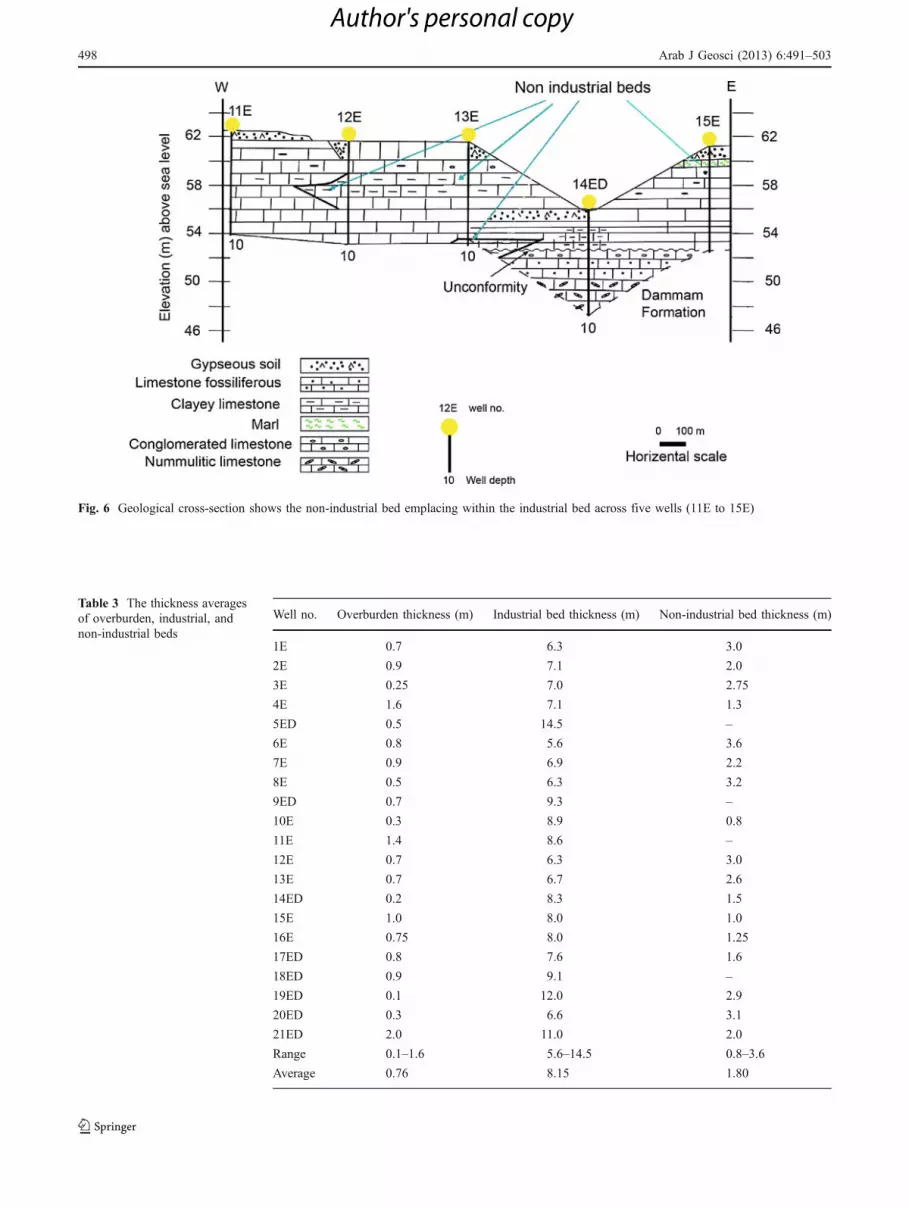
Well no. Overburden thickness (m) Industrial bed thickness (m) Non-industrial bed thickness (m)
1E 0.7 6.3 3.0
2E 0.9 7.1 2.0
3E 0.25 7.0 2.75
4E 1.6 7.1 1.3
5ED 0.5 14.5 –
6E 0.8 5.6 3.6
7E 0.9 6.9 2.2
8E 0.5 6.3 3.2
9ED 0.7 9.3 –
10E 0.3 8.9 0.8
11E 1.4 8.6 –
12E 0.7 6.3 3.0
13E 0.7 6.7 2.6
14ED 0.2 8.3 1.5
15E 1.0 8.0 1.0
16E 0.75 8.0 1.25
17ED 0.8 7.6 1.6
18ED 0.9 9.1 –
19ED 0.1 12.0 2.9
20ED 0.3 6.6 3.1
21ED 2.0 11.0 2.0
Range 0.1–1.6 5.6–14.5 0.8–3.6
Average 0.76 8.15 1.80
Table 3 The thickness averagesof overburden, industrial, andnon-industrial beds
Fig. 6 Geological cross-section shows the non-industrial bed emplacing within the industrial bed across five wells (11E to 15E)
498 Arab J Geosci (2013) 6:491–503
Author's personal copy

mended. The thickness of each of overburden, industrial bed,and non-industrial bed is measured during digging processes.Overburden thickness ranges between 0.1 and 1.6 m withaverage 0.76 m (Table 3; Fig. 7). Thickness of the industrialbed ranges between 5.6 m at the well 6E and 14.5 m at thewell 5ED with average 8.15 m (Table 3; Fig. 8). Thickness ofnon-industrial bed ranged between 0.8 and 3.6 mwith average1.8 m (Table 3) which is canceled from limestone reserveestimation. Physical properties (bulk density and compressivestrength) are measured in ten samples selected from ten wells(Table 4). The bulk density is used for estimating the reservevolume. The compressive strength is used for classifying therock hardness which is considered as medium-tough.
The stripping index which is an arithmetic ratio betweenvolume of the overburden and volume of the industrial bed(Al-Atia 2001) is applied as follows:
SI ¼ OV=IV
Where:
SI is the stripping indexOV is the volume of the overburden bed (m³)
IV is the volume of the industrial bed (m³).
OV ¼ A� TO
A is the total area which equals 2,000×2,000=4,000,000 m2.
TO is an average thickness of the overburden.
OV ¼ 4;000; 000m2 � 0:76m
¼ 3;040; 000m3
IV ¼ A� TI
TI is the average thickness of industrial bed.
IV ¼ 4;000; 000m2 � 8:15m
¼ 32; 600; 000m3
SI ¼ 3040000m3=32600000m3
¼ 0:1
Manymethods could be used for reserve estimation, but, incase of the current study, the Triangle Block Method is
0 0.5 1 1.5 2 2.5 3 3.5 40
0.5
1
1.5
2
2.5
3
3.5
41E 2E 3E 4E 5ED
6E 7E 8E 9ED 10E
11E 12E 13E 14ED 15E
16E 17ED 18ED
19ED 20ED 21ED00.10.20.30.40.50.60.70.80.911.11.21.31.41.51.61.71.81.922.1
0 0. 5 1 1 .5
km
Fig. 7 Isopach map displays thedistribution of the overburdenthickness
Arab J Geosci (2013) 6:491–503 499
Author's personal copy

preferable. Accordingly, it is chosen and applied tocalculate the reserve of limestone. Square area has 2×2 km2 is divided into 25 triangles (Fig. 9), where eachtriangle represents three wells. Because of the unequal
sides of the triangle, the correction factor is recommendedand applied (Table 5).
Correction factor C:F:ð Þ ¼ Angle of the triangle peak=60
5.566.577.58
8.599.51010.51111.512
12.51313.51414.515
0
0.5
1
1.5
2
2.5
3
3.5
41E 2E 3E 4E 5ED
6E 7E 8E 9ED 10E
11E 12E 13E 14ED 15E
16E 17ED 18ED
19ED 20ED 21ED
0 0.5 1 1.5 2 2.5 3 3.5 4
0 0.5 1 1.5
km
Fig. 8 Isopach map displays thedistribution of the industrial bedthickness
Table 4 Bulk density and compressive strength of selected samples
Well number Sample number Interval depth (m) Thickness of sample core (m) Bulk density (g/cm³) Compressive strength (mega N/m²)
From To
3E 1 5.20 5.40 0.20 1.87 4.9
5ED 2 7.80 7.90 0.10 2.4 23.4
6E 3 6.40 6.50 0.10 2.2 48.24
8E 4 5.60 5.70 0.10 1.90 0.3
11E 5 2.40 2.50 0.10 1.66 27.56
15E 6 3.00 3.20 0.20 1.94 0.23
16E 7 1.00 1.10 0.10 1.65 0.22
18ED 8 7.60 7.70 0.10 2.5 23.2
19ED 9 6.80 6.90 0.10 2.5 23.9
20ED 10 1.50 1.65 0.15 1.78 41.35
Average 2.04 19.3
500 Arab J Geosci (2013) 6:491–503
Author's personal copy

Fig. 9 Network of the TriangleBlock method of the study area
Table 5 Calculations of reserve estimation by using the Triangle Block method
Trianglenumber
Wellnumber
Thicknessof bed (T), m
Correctionfactor (CF)
CT(T×CF)
Average CT(A×CT)
Area, m² BD, Gm/cm3 Reserve(ACT×A×BD), ton
1 10E 8.9 90/60=1.5 13.35 10.39 125,000 2.04 2,649,4509 ED 9.3 45/60=0.75 6.97
5ED 14.5 45/60=0.75 10.87
2 4E 7.1 90/60=1.5 10.65 9.49 125,000 2.04 2,419,9505ED 14.5 45/60=0.75 10.87
9ED 9.3 45/60=0.75 6.97
3 4E 7.1 90/60=1.5 10.65 7.62 125,000 2.04 1,943,1009ED 9.3 45/60=0.75 6.97
3E 7.0 45/60=0.75 5.25
4 8E 6.3 90/60=1.5 9.45 7.22 125,000 2.04 1,841,1009ED 9.3 45/60=0.75 6.97
3E 7.0 45/60=0.75 5.25
5 3E 7.0 90/60=1.5 10.5 6.84 125,000 2.04 1,744,2008E 6.3 45/60=0.75 4.72
2E 7.1 45/60=0.75 5.32
6 7E 6.9 90/60=1.5 10.35 6.79 125,000 2.04 1,731,4508E 6.3 45/60=0.75 4.72
2E 7.1 45/60=0.75 5.32
7 7E 6.9 90/60=1.5 10.35 6.62 125,000 2.04 1,688,1006E 5.6 45/60=0.75 4.20
2E 7.1 45/60=0.75 5.32
8 1E 6.3 90/60=1.5 9.45 6.32 125,000 2.04 1,611,6006E 5.6 45/60=0.75 4.20
2E 7.1 45/60=0.75 5.32
9 10E 8.9 90/60=1.5 8.9×1.5 8.02 125,000 2.04 2,045,100
Arab J Geosci (2013) 6:491–503 501
Author's personal copy

Table 5 (continued)
Trianglenumber
Wellnumber
Thicknessof bed (T), m
Correctionfactor (CF)
CT(T×CF)
Average CT(A×CT)
Area, m² BD, Gm/cm3 Reserve(ACT×A×BD), ton
8E 6.3 45/60=0.75 4.72
15E 8.0 45/60=0.75 6.0
10 14ED 8.3 90/60=1.5 12.45 8.47 125000 2.04 2,159,85015E 8.0 45/60=0.75 6.0
9ED 9.3 45/60=0.75 6.97
11 9ED 9.3 90/60=1.5 13.95 8.29 125,000 2.04 2,113,95014ED 8.3 45/60=0.75 6.22
8E 6.3 45/60=0.75 4.72
12 13E 6.7 90/60=1.5 10.05 6.99 125,000 2.04 1,782,45014ED 8.3 45/60=0.75 6.22
8E 6.3 45/60=0.75 4.72
13 8E 6.3 90/60=1.5 9.45 6.54 125,000 2.04 1,667,70013E 6.7 45/60=0.75 5.02
7E 6.9 45/60=0.75 5.17
14 12E 6.3 90/60=1.5 6.54 6.54 125,000 2.04 1,667,70013E 6.7 45/60=0.75 5.02
7E 6.9 45/60=0.75 5.17
15 12E 6.3 90/60=1.5 9.45 7.02 125,000 2.04 1,790,10011E 8.6 45/60=0.75 6.45
7E 6.9 45/60=0.75 5.17
16 6E 5.6 90/60=1.5 8.4 6.67 125,000 2.04 1,700,85011E 8.6 45/60=0.75 6.45
7E 6.9 45/60=0.75 5.17
17 13E 6.7 90/60=1.5 10.05 7.0 500,000 2.04 7,140,00020ED 6.6 45/60=0.75 4.95
15E 8.0 45/60=0.75 6.0
18 18ED 9.1 90/60=1.5 13.65 8.12 125,000 2.04 2,070,60017ED 7.6 45/60=0.75 5.7
13E 6.7 45/60=0.75 5.02
19 12ED 6.3 90/60=1.5 9.45 6.72 125,000 2.04 1,713,60017ED 7.6 45/60=0.75 5.7
13E 6.7 45/60=0.75 5.02
20 12ED 6.3 90/60=1.5 9.45 7.20 125,000 2.04 1,836,00017ED 7.6 45/60=0.75 5.7
11E 8.6 45/60=0.75 6.45
21 16E 8.0 90/60=1.5 12.0 8.05 125,000 2.04 2,052,75017ED 7.6 45/60=0.75 5.7
11E 8.6 45/60=0.75 6.45
22 18ED 9.1 90/60=1.5 13.65 6.54 125,000 2.04 1,667,70017ED 7.6 45/60=0.75 5.7
20ED 6.6 45/60=0.75 4.95
23 17ED 7.6 90/60=1.5 11.4 8.45 250,000 2.04 4,309,50017ED 7.6 45/60=0.75 5.7
19ED 12.0 45/60=0.75 9.0
24 16E 8.0 90/60=1.5 12.0 8.90 125,000 2.04 2,269,50017ED 7.6 45/60=0.75 5.7
19ED 12.0 45/60=0.75 9.0
25 21ED 11.0 90/60=1.5 16.5 9.15 500,000 2.04 9,333,00020ED 6.6 45/60=0.75 4.95
15ED 8.0 45/60=0.75 6.0
Total 63 million tons
T thickness, CF correction factor, CT corrected thickness, BD bulk density
502 Arab J Geosci (2013) 6:491–503
Author's personal copy

Conclusions
Mineral constituents participated in supplying the necessaryoxides that are used as cement raw materials. The averageof chemical composition of limestone of the EuphratesFormation: CaO (51.5), MgO (0.83), SO3 (0.54), SiO2
(4.3), Fe2O3 (0.45), Al2O3 (0.93), L.O.I (40.7), Na2O3
(0.08), K2O (0.14), and Cl- (0.1) proved that the limestoneis within the standard limits for cement raw materials andappears to be qualified for cement industry according toDuda 1985. Sixty-three million tons are determined andexpressed as a new potential quarry, according to the Britishsystem classification; this reserve could be classified as aprobable reserve which will be a supplying source for thelimestone raw material for both Al-Najaf and Al-Kufacement plants. This reserve will be sufficient for the next25 years for operating the Al-Najaf and Al-Kufa cementplants according to the current designed capacities. Therock hardness is medium-tough according to the scale ofrock hardness. During digging processes, the water table ofground water appears to be under the bottom of theEuphrates Formation. Mining conditions (rock hardness,topography, and ground water) are suitable for mining.
References
Al-Atia MJ (2001) Evaluation of Mineral Deposits, Practices inEconomic Geology. GEOSURV, Iraq, 157P
Al-Bassam KS (2000) The Iraqi Palygorskite: Geology, Mineralogy,Geochemistry, Genesis and Industrial Uses. GEOSURV, Baghdad,237P
Al-Hashimi HA (1973) The sedimentary facies and depositionalenvironment of the Eocene Dammam and Rus formations, J.Geol. Soc. Iraq; 6:1–18
Al-Hashimi HA, Amer RM (1985) Tertiary Microfacies of Iraq.Geological Survey and Mineral Investigation, Baghdad, 56P
Al-Sayyab A, Al-Ansari N, Al-Rawi D, Al-Jassim JA, Al-Omari F,Al-Sheikh Z (1982) Geology of Iraq. Mosul University Printing,Mosul, Iraq, 277
Barwary AM and Naseira AS (1995) The Geology of Al-NajafQuadrangle, State Establishment of Geological Survey andMining (Internal Report) pp 20–23
Buday T (1980) The Regional Geology of Iraq. Stratigraphy andPaleogeography Publication of GEOSURV, Baghdad, 1:445
Cytroky P and Karim S A (1971) Stratigraphy and Paleontology of theOligocene and Miocene strata near Anah, Euphrates Valley.NIMCO Report No. CZ 140, SOM Library, Baghdad.
Dawood RM (2000) Mineralogy, origin of celestite and the factorscontrolling its distribution in Tar Al-Najaf, Najaf Plateau. Msc.Thesis, Baghdad University, Iraq.
Dabous AA, Awadalla H, El-Kammer AM, Selim SR (1989)Geochemical specification of some lower tertiary limestonesand shales from Upper- Egypt as raw materials for Portlandcement industry. Alexandria University, Egypt, pp 313–325
DudaWH (1977) “Cement-Data-Book” International Process Engineeringin the Cement Industry, 2nd edn. Bauveriag, GmbH, Wiesbaden andBerlin, 539P
DudaWH (1985) “Cement-Data-Book” International Process Engineeringin the Cement Industry, 3rd edn. Bauveriag, GmbH, Wiesbaden andBerlin, 636P
Jassim SZ, Goff JC (eds) (2006) Geology of Iraq. Dolin, Prague andMoravian Museum, Brno, p 341
Kadhim MA (2009) Geochemistry and mineralogy of palygorskite-richclays in Gercus Formation in Dohuk governorate, north of Iraq. M.Sc. Thesis, University of Baghdad, 115 P.
Kohlhaas B (1983) Cement Engineer’s Handbook 4th English ed.Bauverlag GMBH, Wiesbaden and Berlin, p 800
Lea FM (1970) The Chemistry of Cement and Concrete, 3rd edn.Chemical Publishing Company, Inc., New York, NY, p 727
Rankama K, Sahama TG (1950) Geochemistry Report No. 2496.University of Chicago. Chicago, IL, Baghdad, p 912
Schafer HU (1987) Assessment of raw materials for the industry,reprinted from the journal “World Cement” no.7, pp 273–283,Cement and Concrete Association, London.
Singer A (1989) Palygorskite and Sepiolite Group Minerals. In: DixonJB, Weed SB (eds) Minerals in soil environment, 2nd edn. SoilScience Society of America, Madison, WI, pp 829–872
Sissakian V-Kh (1999) The Nfayil Formation. GEOSURV InternalReport, Baghdad, Iraq
Soroka I (1979) Portland cement paste and concrete. MacMillan PressLtd., London, UK p, 338
Arab J Geosci (2013) 6:491–503 503
Author's personal copy


